UNITED STATES
SECURITIES AND EXCHANGE COMMISSION
Washington, D.C. 20549
FORM 10-K
[X] ANNUAL REPORT PURSUANT TO SECTION 13 OR 15(d) OF THE SECURITIES EXCHANGE ACT OF 1934 For the fiscal year ended December 31, 2007.
or
[ ] TRANSITION REPORT PURSUANT TO SECTION 13 OR 15(d) OF THE SECURITIES EXCHANGE ACT OF 1934. For the transition period from _______________________ to ______________________________________
Commission file number 001-11549
BLOUNT INTERNATIONAL, INC.
(Exact name of registrant as specified in its charter)
| | Delaware
(State of
Incorporation) | | 63 0780521
(I.R.S. Employer
Identification No.) | |
|
| | 4909 SE International Way,
Portland, Oregon
(Address of principal executive offices) | |
97222-4679
(Zip Code) | |
|
Registrant's telephone number, including area code: (503) 653-8881
Securities registered pursuant to Section 12(b) of the Act:
| |
Title of each class
Common Stock, $.01 par value | | Name of each exchange
on which registered
New York Stock Exchange | |
|
Securities registered pursuant to Section 12(g) of the Act: None
Indicate by check mark if the registrant is a well-known seasoned issuer, as defined in Rule 405 of the Securities Act. [ ] Yes [X] No
Indicate by check mark if the registrant is not required to file reports pursuant to Section 13 or 15(d) of the Act. [ ] Yes [X] No
Indicate by check mark whether the registrant (1) has filed all reports required to be filed by Section 13 or 15(d) of the Securities Exchange Act of 1934 during the preceding 12 months (or for such shorter period that the registrant was required to file such reports), and (2) has been subject to such filing requirements for the past 90 days. [X] Yes [ ] No
Indicate by check mark if disclosure of delinquent filers pursuant to Item 405 of Regulation S-K is not contained herein, and will not be contained, to the best of the Registrant's knowledge, in definitive proxy or information statements incorporated by reference in Part III of this Form 10-K, or any amendment to this Form 10-K. [ ]
Indicate by check mark whether the registrant is a large accelerated filer, an accelerated filer or a non-accelerated filer (as defined in Rule 12b-2 of the Act).
| Large accelerated filer [ ] | | Accelerated filer [X] | | Non-accelerated filer [ ] | | Smaller reporting company [ ] | |
|
Indicate by check mark whether the registrant is a shell company (as defined in Rule 12b-2 of the Act). [ ] Yes [X] No
At June 30, 2007, the aggregate market value of the voting and non-voting common stock held by non-affiliates, computed by reference to the last sales price ($13.08) as reported by the New York Stock Exchange, was $495,411,945.
The number of shares outstanding of $0.01 par value common stock as of March 6, 2008 was 47,305,647 shares.
Documents Incorporated By Reference
Portions of the Proxy Statement for the Annual Meeting of stockholders to be held on May 22, 2008, are incorporated by reference in Part III.
BLOUNT INTERNATIONAL, INC. AND SUBSIDIARIES
| Table of Contents | | | | Page | |
| PART I | |
|
| Item 1. | | Business | | | 3 | | |
|
| Item 1A. | | Risk Factors | | | 5 | | |
|
| Item 2. | | Properties | | | 9 | | |
|
| Item 3. | | Legal Proceedings | | | 10 | | |
|
| Item 4. | | Submission of Matters to a Vote of Security Holders | | | 10 | | |
|
| PART II | |
|
| Item 5. | | Market for Registrant's Common Equity, Related Stockholder Matters and Issuer Purchases of Equity Securities | | | 11 | | |
|
| Item 6. | | Selected Consolidated Financial Data | | | 12 | | |
|
| Item 7. | | Management's Discussion and Analysis of Financial Condition and Results of Operations | | | 13 | | |
|
| Item 7A. | | Quantitative and Qualitative Disclosures about Market Risk | | | 27 | | |
|
| Item 8. | | Financial Statements and Supplementary Data | | | 28 | | |
|
| Item 9. | | Changes in and Disagreements with Accountants on Accounting and Financial Disclosure | | | 57 | | |
|
| Item 9A. | | Controls and Procedures | | | 57 | | |
|
| Item 9B. | | Other Information | | | 57 | | |
|
| PART III | |
|
| Item 10. | | Directors and Executive Officers of the Registrant | | | 58 | | |
|
| Item 11. | | Executive Compensation | | | 58 | | |
|
| Item 12. | | Security Ownership of Certain Beneficial Owners and Management and Related Stockholder Matters | | | 58 | | |
|
| Item 13. | | Certain Relationships and Related Transactions | | | 58 | | |
|
| Item 14. | | Principal Accounting Fees and Services | | | 58 | | |
|
| PART IV | |
|
| Item 15. | | Exhibits and Financial Statement Schedules | | | 59 | | |
|
| Signatures | | | | | 62 | | |
|
BLOUNT INTERNATIONAL, INC.
2
PART I
ITEM 1. BUSINESS
Blount International, Inc. ("Blount" or the "Company") is an international industrial company with one business segment: Outdoor Products. We also wholly-own and operate a manufacturer of gear-related products. During 2007, we sold our Forestry Division, which constituted the majority of our other business segment at the time. Our products are sold in over 100 countries and approximately 64% of our 2007 sales were made outside the United States of America ("U.S."). Our Company is headquartered in Portland, Oregon. We have manufacturing operations in the U.S., Canada, Brazil and the People's Republic of China ("China"). Additionally, we operate marketing, sales and distribution centers in other parts of the world.
Oregon, Windsor, Power-Match, INTENZ, Jet-Fit, ICS, Redzaw, PRK, SealPro and SpeedHook are registered or pending trademarks of Blount and its subsidiaries. Some forms of Windsor are used under license from affiliates of Snap-On, Inc.
Outdoor Products Segment
Overview. Our Outdoor Products Segment, accounted for 94% of our sales from continuing operations in 2007. This segment manufactures and markets cutting chain, guide bars, sprockets and accessories for chainsaw use, concrete-cutting equipment and accessories and lawnmower blades. This segment also markets branded parts and accessories for the lawn and garden equipment market. The segment's products are sold to original equipment manufacturers ("OEMs") for use on new chainsaws and yard care equipment, and to the retail replacement market through distributors, dealers and mass merchants. Oregon brand chainsaw cutting chain, guide bars and other items are currently sold to most of the chainsaw OEMs, and many of these products are privately branded for our OEM customers. During 2007, approximately 27% of the segment's sales were to OEMs, with the remainde r sold into the replacement market. Approximately 68% of the segment's sales were outside of the U.S. in 2007.
The segment headquarters is in Portland, Oregon. Marketing personnel are located throughout the U.S. and in a number of foreign countries. We manufacture our products in Portland, Oregon; Milan, Tennessee; Kansas City, Missouri; Guelph, Ontario, Canada; Curitiba, Parana, Brazil; and in Fuzhou, Fujian Province, China. A portion of our accessories and spare parts, as well as our concrete-cutting saws, are sourced from vendors in various locations around the world.
Oregon® Products. The Oregon® product line includes a broad range of cutting chain, chainsaw guide bars, cutting chain drive sprockets and maintenance tools used primarily on portable gasoline and electric chainsaws and mechanical timber harvesting equipment. The Oregon product line also includes various cutting attachments and spare parts to service the lawn and garden industry. These lawn and garden equipment parts include lawnmower blades to fit a variety of machines and cutting conditions, as well as replacement parts that meet product specifications of OEMs.
Windsor Products. The Windsor product line includes cutting chain, chainsaw guide bars and cutting chain drive sprockets, as well as products to support mechanical harvesting equipment.
ICS Products. The ICS branded product lines provide specialized concrete-cutting equipment for construction markets. The principal product in the ICS line-up is a proprietary diamond-segmented chain, which is used on gasoline and hydraulic powered saws and equipment. ICS also markets and distributes branded gasoline and hydraulic powered concrete-cutting chainsaws and circular saws to its customers. These saws are manufactured through an agreement with a third party.
Industry Overview. We believe we are the world leader in the production of cutting chain. Oregon and Windsor branded cutting chain and related products are used primarily by professional loggers, farmers, arborists and homeowners. Additionally, the Oregon line of lawnmower-related parts and accessories are used by commercial landscape companies and homeowners. Our ICS products are used by tool rental companies, contractors and concrete-cutting specialists.
Due to the high level of technical expertise and capital investment required to manufacture cutting chain and guide bars, we believe that we are able to produce durable, high-quality cutting chain and guide bars more efficiently than most of our competitors. We also work with our OEM customers to improve the design and specifications of cutting chain and bars used as original equipment on their chainsaws.
Weather and natural disasters influence our sales cycle. For example, severe weather patterns and events, such as hurricanes, tornadoes and storms, generally result in greater chainsaw use and, therefore, stronger sales of saw chain and guide bars. Seasonal rainfall plays a role in demand for our lawnmower blades and yard care-related products. Above-average rainfall drives greater demand for products in this category, while drought conditions tend to reduce demand for these products.
The Outdoor Products Segment's principal raw material, cold-rolled strip steel, is purchased from multiple intermediate steel processors and can be obtained from other sources. Changes in the price of steel can have a significant effect on the manufactured cost of our products and on the gross margin we earn from the sale of these products.
The segment's profitability is also affected by changes in currency exchange rates, changes in economic and political conditions in the various markets in which we
BLOUNT INTERNATIONAL, INC.
3
operate and changes in the regulatory environment in various jurisdictions.
The segment's competitors include Stihl, Carlton, G&B, Tri-Link, Rotary, Stens, and most major outdoor power equipment manufacturers such as Briggs & Stratton, MTD and John Deere. In addition, new and existing competitors are expanding capacity or contracting with suppliers in China and other low cost manufacturing locations. We also supply products or components to some of our competitors.
Gear Components
Our wholly-owned subsidiary, Gear Products, Inc. ("Gear Products"), was formerly included in our discontinued Industrial and Power Equipment Segment. Our primary gear-related products are rotation bearings, worm gear reducers, hydraulic pump drives, swing drives and winches. These products are used by heavy equipment OEMs for the forestry, construction and utility industries, and produced 6% of our consolidated 2007 sales. We also sell these products in the replacement parts market in addition to our sales to OEMs. For 2007, approximately 93% of Gear Products' sales were to OEMs and approximately 3% of sales were outside the U.S.
Discontinued Forestry Equipment Division
On November 5, 2007, we sold our Forestry Division, which constituted the majority of our Industrial and Power Equipment segment, to Caterpillar Forest Products Inc., a subsidiary of Caterpillar Inc. ("Caterpillar"), for gross proceeds of $79.1 million. We recognized a pretax gain of $26.0 million net of related transaction expenses on the sale in 2007. This division accounted for 32% of our 2005 consolidated sales, 26% of our 2006 consolidated sales and 21% of our consolidated sales for the first nine months of 2007. The Forestry Division is reported as discontinued operations for all periods presented. This division was headquartered in Zebulon, North Carolina and manufactured and marketed timber harvesting and handling equipment and industrial tractors and loaders. The division had manufacturing facilities in Owatonna, Minnesota; Prentice, Wisconsin; and Söderhamn, Sweden. We retained certain liabilities related to the b usiness, as well as a dormant manufacturing facility located in Menominee, Michigan. In December 2007, we sold the land and building in Menominee, Michigan for net cash proceeds of $0.5 million.
Discontinued Lawnmower Segment
On July 27, 2006, we sold our wholly-owned subsidiary Dixon Industries, Inc. ("Dixon"), which constituted our entire Lawnmower segment, to Husqvarna Professional Outdoor Products Inc. ("Husqvarna Professional Outdoor Products") for gross proceeds of $33.1 million. We recognized a pretax gain of $17.4 million net of related transaction expenses on the sale in 2006. This segment accounted for 7% of our sales in each of 2004, 2005 and the first six months of 2006. The Lawnmower Segment is reported as discontinued operations for all periods presented. Dixon was located in Coffeyville, Kansas, and manufactured zero-turn radius lawnmowers and related attachments. We retained certain liabilities and assets of the business, including land and buildings in Coffeyville, Kansas, following the sale. In September 2007, we sold the land and buildings in Coffeyville, Kansas for net cash proceeds of $1.5 million.
Capacity Utilization
Based on a five-day, three-shift work week, capacity utilization for the year ended December 31, 2007 was as follows:
| | | % of Capacity | |
| Outdoor Products segment | | | 100 | % | |
| Gear components | | | 76 | % | |
Capacity for the Outdoor Products Segment has been expanded with our manufacturing plant in Fuzhou, Fujian Province, China, as well as investments in new machinery and equipment for the manufacturing plants in Portland, Oregon; Kansas City, Missouri; Guelph, Ontario Canada; and Curitiba, Parana, Brazil. To meet the fluctuation in demand for its products, this segment operates on an expanded work week basis from time to time at certain locations.
Backlog
The backlog for our continuing operations was as follows:
| | | December 31, | |
| (Amounts in thousands) | | 2007 | | 2006 | | 2005 | |
| Outdoor Products Segment | | $ | 63,289 | | | $ | 54,785 | | | $ | 82,523 | | |
| Gear components | | | 6,029 | | | | 6,524 | | | | 7,955 | | |
| Total backlog | | $ | 69,318 | | | $ | 61,309 | | | $ | 90,478 | | |
The total backlog as of December 31, 2007 is expected to be completed and shipped within twelve months.
Employees
At December 31, 2007, we employed approximately 3,200 individuals. None of our domestic employees belongs to a union. The number of foreign employees who belong to unions is not significant. We believe our relations with our employees are satisfactory, and we have not experienced any significant labor-related work stoppages in the last three years with the exception of a one week period in June, 2007 at our Curitiba, Parana, Brazil location.
Environmental Matters
The Company's operations are subject to comprehensive U.S. and foreign laws and regulations relating to the protection of the environment, including those governing discharges of pollutants into the air and water, the management
BLOUNT INTERNATIONAL, INC.
4
and disposal of hazardous substances and the cleanup of contaminated sites. Permits and environmental controls are required for certain of those operations, including those required to prevent or reduce air and water pollution, and our permits are subject to modification, renewal and revocation by issuing authorities.
On an ongoing basis, we incur capital and operating costs to comply with environmental laws and regulations. In 2007, we spent approximately $1.3 million for environmental compliance, including approximately $0.2 million in capital expenditures. We expect to spend approximately $1.7 million to $2.5 million per year in capital and operating costs in years 2008 through 2010 for environmental compliance. The actual cost to comply with environmental laws and regulations may be greater than these estimated amounts.
Some of our current and former manufacturing facilities are located on properties with a long history of industrial use, including the use of hazardous substances. For certain of our former facilities, we retained responsibility for past environmental matters under the terms of the agreements by which we sold the properties to third party purchasers. We have identified soil and groundwater contamination from these historical activities at certain of our current and former facilities, which we are currently investigating, monitoring or remediating. Management believes that costs incurred to investigate, monitor and remediate known contamination at these sites will not have a material adverse effect on our business, financial condition, results of operations or cash flow. We cannot be sure, however, that we have identified all existing contamination on our current and former properties or that our operations will not cause contami nation in the future. As a result, we could incur material future costs to clean up contamination.
From time to time we may be identified as a potentially responsible party under the U.S. Comprehensive Environmental Response, Compensation and Liability Act (commonly known as the Superfund law) or similar state statutes with respect to sites at which we may have disposed of wastes. The U.S. Environmental Protection Agency (or an equivalent state agency) can either (a) allow such parties to conduct and pay for a remedial investigation and feasibility study and remedial action or (b) conduct the remedial investigation and action on its own and then seek reimbursement from the parties. Each party can be held liable for all of the costs, but the parties can then bring contribution actions against each other or potentially responsible third parties. As a result, we may be required to expend amounts on such remedial investigations and actions, which amounts cannot be determined at the present time, but which may ultimately prove to be material to the consolidated financial statements.
For additional information regarding certain environmental matters, see Note 11 of Notes to Consolidated Financial Statements.
Financial Information about Industry Segments and Foreign and Domestic Operations
For financial information about industry segments and foreign and domestic operations, see "Management's Discussion and Analysis of Results of Operations and Financial Condition" in Item 7 and Note 14 of Notes to Consolidated Financial Statements.
Seasonality
The Company's operations are somewhat seasonal in nature. Year-to-year and quarter-to-quarter operating results are impacted by economic and business trends within the respective industries in which we compete, as well as seasonal weather patterns. See further discussion within the business descriptions above.
Available Information
Our website address is www.blount.com. You may obtain free electronic copies of our annual reports on Form 10-K, quarterly reports on Form 10-Q, current reports on Form 8-K, all amendments to those reports and other SEC filings by accessing the Investor Relations section of the Company's website under the heading "SEC Filings". These reports are available on our Investor Relations website as soon as reasonably practicable after we electronically file them with the Securities and Exchange Commission ("SEC").
Once filed with the SEC, such documents may be read and/or copied at the SEC's Public Reference Room at 450 Fifth Street, N.W. Washington, D.C. 20549. Information regarding the operation of the Public Reference Room may be obtained by calling the SEC at 1-800-SEC-0330. In addition, the SEC maintains an internet site at www.sec.gov that contains reports, proxy and information statements, and other information regarding issuers, including Blount, who file electronically with the SEC.
ITEM 1A. RISK FACTORS
Substantial Leverage—Due to our substantial leverage, we may have difficulty operating our business and satisfying our debt obligations.
As of December 31, 2007, we have $466.1 million of total liabilities, $297.0 million of total debt and a stockholders' deficit of $54.1 million. While we have reduced our total debt from $494.2 million at the end of 2004, our debt remains significant. This substantial leverage may have important consequences for us, including the following:
< Our ability to obtain additional financing for working capital, capital expenditures or other purposes may be
BLOUNT INTERNATIONAL, INC.
5
impaired, or such financing may not be available on terms favorable to us.
< A significant portion of our cash flow from operations is dedicated to the payment of interest expense, which reduces the funds that would otherwise be available to us for operations and future business opportunities.
< A substantial decrease in net operating income and cash flows or an increase in expenses may make it difficult for us to meet our debt service requirements or force us to modify our operations.
< Our substantial leverage may make us more vulnerable to economic downturns and competitive pressures.
The agreements governing our senior credit facilities and the indenture for our 87/8% senior subordinated notes due 2012 contain restrictions that affect our operations, including our and certain of our subsidiaries' ability to incur indebtedness or make acquisitions or capital expenditures. However, these restrictions do not fully prohibit us or our subsidiaries from incurring additional indebtedness or making certain types of acquisitions. In addition, we have available borrowing capacity under the revolving portion of our existing senior credit facilities of $140.9 million as of December 31, 2007. If we or any of our subs idiaries incur additional indebtedness, the risks outlined above could worsen.
Our ability to make payments on our indebtedness and to fund planned capital expenditures and research and product development efforts will depend on our ability to generate cash in the future. Our ability to generate cash, to a certain extent, is subject to general economic, financial, competitive, legislative, regulatory and other factors that are beyond our control.
Our historical financial results have been, and we anticipate that our future financial results will be, subject to fluctuations. Our business may not be able to generate sufficient cash flow from our operations or future borrowings may not be available to us in an amount sufficient to enable us to service our indebtedness or to fund our other liquidity needs. Our inability to pay our debts would require us to pursue one or more alternative strategies, such as selling assets, refinancing or restructuring our indebtedness or selling equity capital. However, alternative strategies may not be feasible at the time or may not prove adequate, which could cause us to default on our obligations and would impair our liquidity. Also, some alternative strategies would require the prior consent of our secured lenders, which we may not be able to obtain. See also "Management's Discussion and Analysis of Financial Condition and Results of Ope rations."
Restrictive Covenants—The terms of our indebtedness contain a number of restrictive covenants, the breach of which could result in acceleration of payment of our senior credit facilities and our 87/8% senior subordinated notes.
The terms of our indebtedness contain a number of restrictive covenants, the breach of which could result in acceleration of our obligations to repay amounts owed under our senior credit facilities and our 87/8% senior subordinated notes. An acceleration of our repayment obligation under our senior credit facilities could result in a payment or distribution of substantially all of our assets to our secured lenders, which would materially impair our ability to operate our business as a going concern. The indenture and our senior credit facilities, among other things, restrict and/or limit our and certain of our subsidiaries' ability to:
< borrow money and issue preferred stock;
< guarantee indebtedness of others;
< pay dividends on our stock;
< purchase our stock or the stock of our "restricted subsidiaries", a defined term;
< make certain types of investments;
< use assets as security in other transactions;
< sell certain assets or merge with or into other companies;
< enter into sale and leaseback transactions;
< enter into certain types of transactions with affiliates;
< enter into new businesses; and
< make certain payments in respect of subordinated indebtedness.
The senior credit facilities also restrict our ability to prepay principal in respect of the 87/8% senior subordinated notes and restrict our ability to engage in any business or operations other than those that are incidental to our ownership of the capital stock of Blount, Inc., our wholly-owned operating subsidiary. In addition, the senior credit facilities require us to maintain certain financial ratios and satisfy certain financial condition tests, which may require that we take actions to reduce debt or to act in a manner contrary to our business objectives. Our ability to meet those financial ratios and tests could be affected by events beyond our control, and there can be no assurance that we will meet those ratios and tests. A breach of any of these covenants could, if uncured, constitute an event of default or a default under the notes or the senior credit facilities. Upon the occurrence of an event of default under the senior credit facilities, the lenders could elect to declare all amounts outstanding under the senior credit facilities, together with any accrued interest and commitment fees, to be immediately due and payable. If we and certain of our subsidiaries were unable to repay those amounts, the lenders under the senior credit facilities could enforce the guarantees from the guarantors and proceed against the
BLOUNT INTERNATIONAL, INC.
6
collateral securing the senior credit facilities. The assets of the applicable guarantors could be insufficient to repay in full that indebtedness and our other indebtedness.
Assets Pledged as Security on Credit Facilities—The majority of our assets and the capital stock of Blount, Inc. are pledged to secure obligations under our senior credit facilities.
The Company and all of its domestic subsidiaries other than Blount, Inc. guarantee Blount, Inc.'s obligations under the senior credit facilities. The obligations under the senior credit facilities are collateralized by a first priority security interest in substantially all of the assets of Blount, Inc. and its domestic subsidiaries, as well as a pledge of all of Blount, Inc.'s capital stock held by Blount International, Inc. and all of the stock of domestic subsidiaries held by Blount, Inc. Blount, Inc. has also pledged 65% of the stock of its non-domestic subsidiaries as additional collateral.
Further, our senior credit facilities provide that payments on the 87/8% notes and the guarantees thereof will be blocked in the event of a default under the senior credit facilities. In addition, upon any distribution to Blount, Inc.'s creditors or the creditors of the guarantors in a bankruptcy, liquidation, receivership, administration for the benefit of creditors or reorganization or similar proceeding relating to the property that constitutes security for the senior credit facilities, the lenders under the senior credit facilities will be entitled to be paid in full in cash before any payment may be made with respect to such notes or the guarantees.
While Blount International, Inc. and all of Blount, Inc.'s existing domestic subsidiaries guarantee the 87/8% senior subordinated notes, none of Blount, Inc.'s existing foreign subsidiaries guarantees these notes. We will not permit any of our non-guarantor restricted subsidiaries to guarantee or pledge any assets to secure the payment of our senior credit facilities, unless that subsidiary is a guarantor of those notes or that subsidiary becomes a guarantor. Any existing or future non-guarantor subsidiary of Blount International, Inc. that we properly designate as an unrestricted subsidiary or a receivables subsidiary will not guarantee those notes.
Competition—Competition may result in decreased sales, operating income and cash flow.
The markets in which we operate are competitive. We believe that design features, product quality, customer service and price are the principal factors considered by our customers. Some of our competitors may have greater financial resources, lower costs, superior technology or more favorable operating conditions than we do. For example, our competitors are expanding capacity or contracting with suppliers located in China and other low cost manufacturing locations as a means to lower costs. Although we have also established a manufacturing facility in China, international competition from emerging economies may nevertheless be formidable and negatively affect our business. We may not be able to compete successfully with our existing or any new competitors, and the competitive pressures we face may result in decreased sales, operating income and cash flows. Competitors could also obtain knowledge of our proprietary manufacturing techniques and processes and reduce our competitive advantage by copying such techniques and processes.
Key Customers—Loss of one or more key customers would substantially decrease our sales.
In 2007, $71.6 million (14%) of our sales were to one customer (Husqvarna AB) and our top five customers accounted for $115.4 million (22%) of our sales. Aside from our top customer, no other customer individually accounted for more than 3% of our sales. While we expect these business relationships to continue, the loss of any of these customers, or a substantial portion of their business, would most likely significantly decrease our sales, operating income and cash flows.
Key Suppliers and Raw Materials Costs—A loss of a few key suppliers or increases in raw materials costs could substantially decrease our sales or increase our costs.
We purchase important materials and parts from a limited number of suppliers that meet certain quality criteria. We generally do not operate under long-term written supply contracts with our suppliers. Although alternative sources of supply are available, the sudden elimination of certain suppliers could result in manufacturing delays, an increase in costs, a reduction in product quality and a possible loss of sales in the near term. In 2007, we purchased approximately $10.0 million of raw material from our largest supplier.
Some of these raw materials, in particular cold-rolled strip steel, are subject to price volatility over periods of time. We have not hedged against the price volatility of any raw materials within our operating segments. It has been our experience that such raw material price increases are difficult to recover from our customers in the short term through increased pricing. For example, we estimate that a 10% change in the price of steel would have affected 2007 income from continuing operations before taxes by an estimated $6.3 million.
Key Employees—The loss of key employees could adversely affect our manufacturing efficiency.
Many of our manufacturing processes require a high level of expertise. For example, we build our own complex dies for use in cutting and shaping steel into components for our products. The design and manufacture of such dies are highly dependent on the expertise of key employees. We have also developed numerous proprietary manufacturing techniques that rely on the expertise of key employees. Our manufacturing efficiency and cost could be adversely affected if we are unable to retain such key employees or continue to train them and their replacements.
BLOUNT INTERNATIONAL, INC.
7
Foreign Sales and Operations—We have substantial foreign sales and operations, which could be adversely affected as a result of changes in local economic or political conditions, fluctuations in currency exchange rates, unexpected changes in regulatory environments or potentially adverse tax consequences.
In 2007, approximately 64% of our sales by country of destination occurred outside of the U.S. International sales are subject to inherent risks, including changes in local economic or political conditions, the imposition of currency exchange restrictions, unexpected changes in regulatory environments and potentially adverse tax consequences. Under some circumstances, these factors could result in significant declines in international sales. Some of our sales and expenses are denominated in local currencies that can be affected by fluctuations in currency exchange rates in relation to the U.S. Dollar. Historically, our principal exposures have been related to local currency manufacturing costs and expenses in Canada and Brazil, and local currency sales and expenses in Europe. From time to time, we manage some of our exposure to currency exchange rate fluctuations through derivative products. Any change in the exchange rates of c urrencies of jurisdictions into which we sell products or incur expenses could result in a significant decrease in reported sales and operating income. For example, we estimate that a 10% stronger Canadian Dollar in relation to the U.S. Dollar would have reduced our operating income by $6.0 million in 2007 and a 10% weaker Euro in relation to the U.S. Dollar would have reduced our sales by $4.3 million in 2007.
In addition, we own substantial manufacturing facilities outside the U.S. As of December 31, 2007, 639,730 square feet, or 51% of the total square feet of our owned facilities, were located outside of the U.S. Also, 32% of our leased square footage is located outside the U.S. This foreign-based property, plant and equipment is subject to inherent risks for the reasons cited above. Loss of these facilities or restrictions on our ability to use them would have an adverse effect on our manufacturing capabilities, and would result in reduced sales, operating income and cash flows.
Weather—Sales of many of our products are affected by weather patterns and the occurrence of natural disasters.
Sales of many of our products, such as yard care parts and accessories, including lawnmower blades, are influenced by weather patterns that are clearly outside our control. For example, drought conditions tend to reduce the demand for yard care products. Natural disasters such as hurricanes, typhoons, and ice and wind storms can stimulate demand for our chainsaw-related products. Conversely, a relative lack of severe weather and natural disasters can result in reduced demand for these same products.
General Economic Factors—We are subject to general economic factors that are largely out of our control, any of which could, among other things, result in a decrease in sales and net income and an increase in our interest expense.
Our business is subject to a number of general economic factors, many of which are largely out of our control, that may, among other things, result in a decrease in sales and net income and an increase in our interest expense. These include recessionary economic cycles and downturns in customers' business cycles, as well as downturns in the principal regional economies where our operations are located. Our senior credit facilities permit us to make borrowings at interest rates that are variable. Increases in interest rates could increase our interest expense payable under the senior credit facilities to levels in excess of what we currently expect. We estimate a one hundred basis point higher average level of interest rates on our variable rate debt would have increased our interest expense in 2007 by $1.8 million. Economic conditions may adversely affect our customers' business levels and the amount of products that they need. Furthermore, customers encountering adverse economic conditions may have difficulty in paying for our products and actual bad debts may exceed our allowances. Finally, terrorist activities, anti-terrorist efforts, war or other armed conflicts involving the U.S. or its interests abroad may result in a downturn in the U.S. and global economies and exacerbate the risks to our business described in this paragraph.
Litigation—We may have litigation liabilities that could result in significant costs to us.
Our historical and current business operations, including discontinued operations, have resulted in a number of litigation matters, including litigation involving personal injury or death, as a result of alleged design or manufacturing defects of our products. Some of these product liability suits seek significant or unspecified damages for serious personal injuries for which there are retentions or deductible amounts under our insurance policies. In the future, we may face additional lawsuits, and it is difficult to predict the amount and type of litigation that we may face. Litigation, insurance and other related costs could result in future liabilities that are significant and that could significantly reduce our cash flows and cash balances. See "Business—Legal Proceedings."
Environmental Matters—We face potential exposure to environmental liabilities and costs.
We are subject to various U.S. and foreign environmental laws and regulations relating to the protection of the environment, including those governing discharges of pollutants into the air and water, the management and disposal of hazardous substances and the cleanup of contaminated sites. Violations of, or liabilities incurred under, these laws and regulations could result in an assessment of significant costs to us, including civil or criminal penalties, claims by third parties for personal injury or property damage,
BLOUNT INTERNATIONAL, INC.
8
requirements to investigate and remediate contamination and the imposition of natural resource damages. Furthermore, under certain environmental laws, current and former owners and operators of contaminated property or parties who sent waste to the contaminated site can be held liable for cleanup, regardless of fault or the lawfulness of the disposal activity at the time it was performed. This potential exposure to environmental liabilities and costs can apply to both our current and former operating facilities.
Future events, such as the discovery of additional contamination or other information concerning past releases of hazardous substances at our or others' sites, changes in existing environmental laws or their interpretation and more rigorous enforcement by regulatory authorities may require additional expenditures by us to modify operations, install pollution control equipment, clean contaminated sites or curtail our operations. These expenditures could significantly reduce our net income and cash balances. See "Business—Environmental Matters" and "Business—Legal Proceedings."
Dividends—We may not pay dividends on our common stock in the future.
We have not paid dividends on our common stock since 1999. We intend to retain future earnings for debt service and for funding growth; therefore, we do not expect to pay any dividends in the near term. In addition, our senior credit facilities and the terms of the 87/8% senior subordinated notes limit our ability to pay dividends. See "Item 5, Market for Registrant's Common Equity, Related Stockholder Matters and Issuer Purchases of Equity Securities."
Common Stock Sales—Future sales of our common stock in the public market could lower our stock price.
We may sell additional shares of common stock in subsequent public offerings, or our former majority owner, Lehman Brothers Merchant Banking Partners II, L.P. and its affiliates ("Lehman Brothers"), may sell a substantial number of the 8.9 million shares they own in a secondary stock offering or distribute some or all of their shares to investors in one or more of the investment funds they manage. Other stockholders with significant holdings of our common stock may also sell large amounts of shares they own in a secondary or open market stock offering. We may also issue additional shares of common stock to finance future transactions. We cannot predict the size of future issuances of our common stock or the effect, if any, that future issuances and sales of shares of our common stock will have on the market price of our common stock. Sales of substantial amounts of Blount International, Inc.'s common stock (including shares issu ed in connection with an acquisition or shares sold by existing stockholders), or the perception that such sales could occur, may adversely affect the prevailing market price of Blount International, Inc.'s common stock.
Common Stock Price—The price of our common stock may fluctuate significantly, and stockholders could lose all or part of their investment.
Volatility in the market price of our common stock may prevent stockholders from being able to sell their shares at or above the price paid for the shares. The market price of our common stock could fluctuate significantly for various reasons that include:
< our quarterly or annual earnings or those of other companies in our industries;
< the public's reaction to events and results contained in our press releases, our other public announcements and our filings with the SEC;
< changes in earnings estimates or recommendations by research analysts who track our common stock or the stock of other comparable companies;
< changes in general conditions in the U.S. and global economies, financial markets or forestry industry, including those resulting from war, incidents of terrorism or responses to such events;
< sales of common stock by our largest stockholders, directors and executive officers; and
< the other factors described in these "Risk Factors."
In addition, in recent years, the stock market has experienced extreme price and volume fluctuations. This volatility has had a significant impact on the market price of securities issued by many companies, including companies in our industries. The changes in prices frequently appear to occur without regard to the operating performance of these companies. For example, over the two preceding calendar years, our highest closing stock price has exceeded our lowest by 33% in 2007 and by 91% in 2006. The price of our common stock could fluctuate based upon factors that have little or nothing to do with our company, and these fluctuations could materially reduce our stock price.
ITEM 2. PROPERTIES
Our corporate headquarters occupy executive offices at 4909 SE International Way, Portland, Oregon 97222-4679. The other principal properties of the Company and its subsidiaries are as follows:
Cutting chain and accessories manufacturing plants are located in Portland, Oregon; Milan, Tennessee; Guelph, Ontario Canada; Curitiba, Parana, Brazil; and Fuzhou, Fujian Province, China. Sales offices and distribution centers are located in Kansas City, Missouri, Europe, Japan, Australia and Russia. Rotation bearings, worm gear reducers, hydraulic pump drives and swing drives are manufactured in Tulsa, Oklahoma.
All of these facilities are in good condition, are currently in normal operation and are generally suitable and adequate for the business activity conducted therein. The
BLOUNT INTERNATIONAL, INC.
9
approximate square footage of facilities located at the principal properties by business unit is as follows:
| | | Area in Square Feet | |
| | | Owned | | Leased | |
| Outdoor Products Segment | | | 1,162,251 | | | | 242,536 | | |
| Gear components | | | 98,500 | | | | – | | |
| Corporate | | | 5,000 | | | | – | | |
| Total | | | 1,265,751 | | | | 242,536 | | |
ITEM 3. LEGAL PROCEEDINGS
For information regarding legal proceedings see Note 11 of Notes to Consolidated Financial Statements.
ITEM 4. SUBMISSION OF MATTERS TO A VOTE OF SECURITY HOLDERS
No matters were submitted to a vote of our stockholders during the quarter ended December 31, 2007.
BLOUNT INTERNATIONAL, INC.
10
PART II
ITEM 5. MARKET FOR REGISTRANT'S COMMON EQUITY, RELATED STOCKHOLDER MATTERS AND ISSUER PURCHASES OF EQUITY SECURITIES
The Company's common stock is traded on the New York Stock Exchange (ticker "BLT"). The following table presents the quarterly high and low closing prices for the Company's common stock for the last two years. Cash dividends have not been declared for the Company's common stock since 1999. The Company's senior credit facility and 87/8% senior subordinated note agreements limit our ability to pay dividends. See Item 7, "Management's Discussion and Analysis of Financial Condition and Results of Operations," for further discussion. The Company had approximately 10,000 stockholders of record as of December 31, 2007.
| | | Common Stock | |
| | | High | | Low | |
| Year Ended December 31, 2007: | |
| First quarter | | $ | 13.50 | | | $ | 11.36 | | |
| Second quarter | | | 14.30 | | | | 12.58 | | |
| Third quarter | | | 14.00 | | | | 11.36 | | |
| Fourth quarter | | | 13.19 | | | | 10.76 | | |
| Year Ended December 31, 2006: | |
| First quarter | | $ | 17.10 | | | $ | 15.27 | | |
| Second quarter | | | 16.45 | | | | 11.82 | | |
| Third quarter | | | 12.28 | | | | 8.96 | | |
| Fourth quarter | | | 13.60 | | | | 9.89 | | |
On June 28, 2005, in conjunction with a public offering of our common stock, the Company purchased 382,380 shares of our common stock from a selling stockholder. These shares are held as treasury stock and we have accounted for this treasury stock as constructively retired in the consolidated financial statements.
| Period | | Total Number
of Shares
Purchased | | Average
Price Paid
per Share | | Total Number of
Shares Purchased
as Part of Publicly
Announced Plans
or Programs | | Maximum
Number of Shares
that May Yet Be
Purchased Under
existing Plans or
Programs | |
| June 28, 2005 | | | 382,380 | | | $ | 16.05 | | | | 382,380 | | | | 0 | | |
BLOUNT INTERNATIONAL, INC.
11
ITEM 6. SELECTED CONSOLIDATED FINANCIAL DATA
| | | Year Ended December 31, | |
| (Amounts in thousands except per share data) | | 2007 | | 2006 | | 2005 | | 2004 | | 2003 | |
| Statement of Income Data: | | | | | | | | | | | (1 | ) | | | (2 | ) | | | (3 | ) | |
| Sales | | $ | 515,535 | | | $ | 487,494 | | | $ | 478,829 | | | $ | 445,340 | | | $ | 375,082 | | |
| Operating income | | | 80,700 | | | | 80,460 | | | | 91,628 | | | | 89,265 | | | | 72,853 | | |
| Interest expense, net of interest income | | | 31,706 | | | | 35,404 | | | | 36,707 | | | | 59,019 | | | | 65,406 | | |
| Income (loss) from continuing operations before taxes | | | 48,173 | | | | 46,391 | | | | 53,958 | | | | (13,399 | ) | | | 3,877 | | |
| Income (loss) from continuing operations | | | 32,143 | | | | 32,645 | | | | 88,214 | | | | (11,533 | ) | | | (36,676 | ) | |
| Income from discontinued operations | | | 10,714 | | | | 9,901 | | | | 18,401 | | | | 17,802 | | | | 6,626 | | |
| Net income (loss) | | | 42,857 | | | | 42,546 | | | | 106,615 | | | | 6,269 | | | | (30,050 | ) | |
| Earnings per share: | |
| Basic income (loss) per share: | |
| Continuing operations | | | 0.68 | | | | 0.69 | | | | 1.91 | | | | (0.32 | ) | | | (1.19 | ) | |
| Discontinued operations | | | 0.23 | | | | 0.21 | | | | 0.40 | | | | 0.49 | | | | 0.21 | | |
| Net income (loss) | | | 0.91 | | | | 0.90 | | | | 2.31 | | | | 0.17 | | | | (0.98 | ) | |
| Diluted income (loss) per share: | |
| Continuing operations | | | 0.67 | | | | 0.68 | | | | 1.86 | | | | (0.30 | ) | | | (1.19 | ) | |
| Discontinued operations | | | 0.22 | | | | 0.21 | | | | 0.38 | | | | 0.46 | | | | 0.21 | | |
| Net income (loss) | | | 0.89 | | | | 0.89 | | | | 2.24 | | | | 0.16 | | | | (0.98 | ) | |
| Shares used in earnings per share computations (in thousands): | |
| Basic | | | 47,280 | | | | 47,145 | | | | 46,094 | | | | 36,413 | | | | 30,809 | | |
| Diluted | | | 48,078 | | | | 47,868 | | | | 47,535 | | | | 38,474 | | | | 30,809 | | |
| Balance Sheet Data: | |
| Cash and cash equivalents | | $ | 57,589 | | | $ | 27,636 | | | $ | 12,937 | | | $ | 48,570 | | | $ | 35,194 | | |
| Working capital | | | 128,588 | | | | 117,862 | | | | 112,214 | | | | 97,986 | | | | 86,924 | | |
| Property, plant and equipment, net | | | 89,729 | | | | 99,665 | | | | 101,538 | | | | 97,929 | | | | 91,991 | | |
| Total assets | | | 411,949 | | | | 430,466 | | | | 455,192 | | | | 424,742 | | | | 404,039 | | |
| Long-term debt | | | 295,758 | | | | 349,375 | | | | 405,363 | | | | 491,012 | | | | 603,871 | | |
| Total debt | | | 297,000 | | | | 350,875 | | | | 407,723 | | | | 494,211 | | | | 610,496 | | |
| Stockholders' deficit | | | (54,146 | ) | | | (105,291 | ) | | | (145,187 | ) | | | (256,154 | ) | | | (393,740 | ) | |
The table above gives effect to the sale of the Company's Forestry Division on November 5, 2007 and the sale of the Company's Lawnmower segment on July 27, 2006 and their treatment as discontinued operations for all periods presented.
(1) Income from continuing operations in 2005 includes a $55.5 million tax benefit from the reversal of a valuation allowance against deferred tax assets related to U.S. federal NOL carryforwards.
(2) Loss from continuing operations before taxes in 2004 includes charges totaling $47.0 million related to refinancing transactions.
(3) Loss from continuing operations in 2003 includes a tax provision of $47.2 million to establish a valuation allowance against deferred tax assets related to U.S. federal NOL carryforwards.
BLOUNT INTERNATIONAL, INC.
12
ITEM 7. MANAGEMENT'S DISCUSSION AND ANALYSIS OF FINANCIAL CONDITION AND RESULTS OF OPERATIONS
The following discussion and analysis should be read in conjunction with our consolidated financial statements included elsewhere in this report, as well as the information in Item 6, "Selected Consolidated Financial Data".
Overview
We are an international industrial company that manufactures and markets branded products to OEMs and consumers. Our products are sold in over 100 countries. We believe we are a global leader in the sale of cutting chain, guide bars and accessories for chainsaws.
We have one operating and reporting segment, Outdoor Products, which accounted for 94% of our revenue in 2007. This segment manufactures and markets forestry-related cutting chain, guide bars, sprockets and accessories for chainsaw use, concrete-cutting equipment and accessories, and outdoor equipment parts that include lawnmower blades and other replacement parts and accessories. The segment's products are sold to OEMs for use on new chainsaws and landscaping equipment and to the retail replacement market through distributors, dealers and mass merchants. During 2007, approximately 27% of the segment's sales were to OEMs, with the remainder sold into the replacement market. Approximately 68% of the segment's sales were outside of the U.S. in 2007, up from 65% in 2006 and 64% in 2005. The Outdoor Products segment's performance can be impacted by trends in the forestry industry, weather patterns and natural disasters, including wi nd and ice storms, foreign currency fluctuations and general economic conditions. The segment faces price pressure from competitors on a worldwide basis. The maintenance of competitive selling prices is dependent on the segment's ability to efficiently manufacture its products and successfully market newly developed products, such as our replacement chain and bars and concrete-cutting saws. This segment operates three manufacturing plants in the U.S., one in Canada, one in Brazil and one in China, all of which are focused on continuous cost improvement. The Chinese facility was constructed in 2004, and manufacturing at this facility commenced in 2005. Production capacity for the Chinese facility was increased throughout 2005, 2006 and 2007, with further expansion expected in 2008. Timely capital investment into this segment's manufacturing plants for added capacity and cost reductions, as well as effectively sourcing critical raw materials at favorable prices, is required for us to remain competitive.
We also own and operate a gear components business specializing in the manufacture of mobile equipment rotation bearings, worm gear reducers, hydraulic pump drives and swing drives. Sales in this business accounted for 6% of our total sales in 2007. In 2007, 93% of these sales were made to OEMs, and 97% of sales were to customers in the U.S. This business's customers supply equipment primarily to the utility, construction and forestry markets. The performance of this unit is closely aligned with general economic trends and more specifically with business conditions for these three industries in North America.
We maintain a centralized administrative staff at our headquarters in Portland, Oregon. This centralized administrative staff provides the accounting, finance and information technology functions, administers various health and welfare plans and supervises the Company's capital structure and regulatory, compliance and legal matters.
In November 2007, we sold our Forestry Division to Caterpillar. The Forestry Division constituted the majority of the operations comprising our former Industrial and Power Equipment Segment. The Forestry Division manufactured timber harvesting equipment and industrial tractors and loaders and is reported as discontinued operations for all periods presented.
In July 2006, we sold our Lawnmower segment business, consisting of our Dixon subsidiary, to Husqvarna Professional Outdoor Products. The Lawnmower segment manufactured zero-turning radius riding lawnmowers and is reported as discontinued operations for all periods presented.
Our capital structure has experienced significant changes over the past three years. We began 2005 with $494.2 million in total debt and Lehman Brothers owning 33.4% of our common stock. In 2005, as a result of secondary public offerings of our stock, Lehman Brothers reduced its holdings to its current level of approximately 19% of our outstanding common stock. In 2005, 2006 and 2007, we made significant reductions in outstanding debt by utilizing cash generated from operations and the proceeds from the sale of our discontinued businesses. Debt outstanding at the end of 2007 was $297.0 million, representing a reduction of $197.2 million over the three-year period.
BLOUNT INTERNATIONAL, INC.
13
Operating Results
Year ended December 31, 2007 compared to year ended December 31, 2006
The table below provides a summary of results and the primary contributing factors to the year over year change.
| (Amounts in millions) | | 2007 | | 2006 | | Change | | Contributing Factor | |
| Sales | | $ | 515.5 | | | $ | 487.5 | | | $ | 28.0 | | | | | | |
| | | | | | | | | | | | | | | $10.0 | | Sales volume | |
| | | | | | | | | | | | | | | 10.0 | | Price and mix | |
| | | | | | | | | | | | | | | 8.0 | | Foreign currency translation | |
| Gross profit | | | 175.0 | | | | 173.7 | | | | 1.3 | | | | | | |
| Gross margin | | | 33.9 | % | | | 35.6 | % | | | | | | 6.3 | | Sales volume | |
| | | | | | | | | | | | | | | 10.0 | | Selling price and mix | |
| | | | | | | | | | | | | | | (13.2) | | Product cost and mix | |
| | | | | | | | | | | | | | | (1.1) | | Warehouse consolidation expenses | |
| | | | | | | | | | | | | | | (0.7) | | Foreign currency translation | |
Selling, general and administrative
Expenses ("SG&A") | | | 94.3 | | | | 89.5 | | | | 4.8 | | | | | | |
| | | | | | | | | | | | | | | 2.0 | | Cash compensation expense | |
| | | | | | | | | | | | | | | 0.7 | | Stock compensation expense | |
| | | | | | | | | | | | | | | 0.8 | | Professional services | |
| | | | | | | | | | | | | | | (1.2) | | Retirement benefits expense | |
| | | | | | | | | | | | | | | 2.6 | | Foreign currency translation | |
| | | | | | | | | | | | | | | (0.1) | | Other, net | |
| Operating income | | | 80.7 | | | | 80.5 | | | | 0.2 | | | | | | |
| Operating margin | | | 15.7 | % | | | 16.5 | % | | | | | | 1.3 | | Increase in gross profit | |
| | | | | | | | | | | | | | | (4.8) | | Increase in SG&A | |
| | | | | | | | | | | | | | | 3.7 | | 2006 retirement plan redesign | |
| Income from continuing operations | | | 32.1 | | | | 32.6 | | | | (0.5 | ) | | | | | |
| | | | | | | | | | | | | | | 0.2 | | Increase in operating income | |
| | | | | | | | | | | | | | | 3.7 | | Decrease in net interest expense | |
| | | | | | | | | | | | | | | (2.1) | | Change in other income/expense | |
| | | | | | | | | | | | | | | (2.3) | | Increase in income tax provision | |
| Income from discontinued operations | | | 10.7 | | | | 9.9 | | | | 0.8 | | | | | | |
| | | | | | | | | | | | | | | 8.6 | | Increase in gain on sale of net assets | |
| | | | | | | | | | | | | | | (2.9) | | Decrease in operating results | |
| | | | | | | | | | | | | | | (4.9) | | Increase in income tax provision | |
| Net income | | $ | 42.9 | | | $ | 42.5 | | | $ | 0.4 | | | | | | |
Sales in 2007 increased $28.0 million (6%) from 2006, due to higher sales volume, price and mix improvements, and the favorable effect of translation of foreign currency denominated sales transactions, given the weaker U.S. Dollar in comparison to 2006, particularly in relation to the Euro. The Outdoor Products segment experienced a $31.7 million (7%) increase in sales during 2007 compared to 2006, while sales of our gear-related products decreased $3.7 million (11%) from 2006 to 2007. International sales increased $34.6 million (12%), but domestic sales declined $6.3 million (3%). Included in the international increase is the $8.0 million favorable impact from movement in foreign currency exchange rates compared to 2006. The decline in U.S. sales is attributed to weaker market conditions in the lawn care, forestry and construction industries. By product line, sales of saw chain, bars, sprockets and accessories increased 6% and sales of outdoor equipment parts were up 15%. Sales of concrete-cutting products increased 3% from 2006 to 2007, lead by strength in Europe.
Consolidated order backlog for continuing operations at December 31, 2007 was $69.3 million compared to $61.3 million at December 31, 2006. The year-over-year increase primarily occurred in the Outdoor Products segment.
Gross profit increased $1.3 million (1%) from 2006 to 2007. Gross margin in 2007 was 33.9% of sales compared to 35.6% in 2006. Higher sales volume and improved price and product mix were largely offset by increases in product costs, including higher freight and distribution costs, and $1.1 million incurred to consolidate our North American distribution centers. The increases in product costs include the effects of higher energy costs for utilities, annual wage increases to our manufacturing employees, $1.0 million in higher steel costs and the effects of inflation on other cost elements.
BLOUNT INTERNATIONAL, INC.
14
Fluctuations in currency exchange rates decreased our gross profit in 2007 compared to 2006 by $0.7 million on a consolidated basis. The translation of stronger foreign currencies into a weaker U.S. Dollar resulted in higher manufacturing costs in Brazil and Canada, where local currencies strengthened compared to the U.S. Dollar, which were only partially offset by higher sales in Europe.
SG&A was $94.3 million in 2007 compared to $89.5 million in 2006, representing a year-over-year increase of $4.8 million (5%). As a percent of sales, SG&A remained at 18.3% in both 2007 and 2006. Cash-based compensation increased by $2.0 million year-over-year, reflecting annual merit increases for our employees and higher variable compensation expenses. Stock-based compensation expense increased $0.7 million in 2007 as we continued to expense stock compensation granted in 2006 over the three year vesting periods, as well as recognizing expense on 2007 grants. We expect stock compensation expense to increase again in 2008. Future levels of stock-based compensation expense will depend on many factors, including the quantity, type and vesting schedule of future grants, the price of our stock, the volatility of our stock and risk-free interest rates. Professional services expense increased $0.8 million, primarily due to hig her legal costs. Employee benefits expenses decreased $1.2 million primarily due to the redesign of the Company's U.S. retirement plans effective January 1, 2007. International operating expenses increased $2.6 million from the prior year due to the weaker U.S. Dollar and its effect on the translation of foreign expenses.
We maintain defined benefit pension plans for substantially all employees and retirees in the U.S., Canada and Belgium. In addition, we maintain post-retirement medical and other benefit plans covering most of our employees and retirees in the U.S. The costs of these benefit plans are included in cost of goods sold and SG&A. The accounting effects and funding requirements for these plans are subject to actuarial estimates, actual plan experience and the assumptions we make regarding future trends and expectations. See further discussion below of these key assumptions and estimates under "Critical Accounting Policies and Estimates". Total expense recognized for these pension and other post-retirement plans was $5.8 million and $14.3 million for the years ended December 31, 2007 and 2006, respectively. These amounts, which include amounts charged to both continuing and discontinued operations, also include pension curtailment charges of $0.2 million in 2007 related to our discontinued Forestry Division, and $3.6 million in 2006 to reflect the freezing of our U.S. defined benefit pension plan effective December 31, 2006. At December 31, 2007, we have $41.2 million of accumulated other comprehensive losses, related to our domestic and foreign pension and other post-employment benefit plans, that will be amortized to expense over future years, including $1.9 million to be expensed in 2008.
Operating income increased slightly by $0.2 million from 2006 to 2007, resulting in an operating margin for 2007 of 15.7% of sales compared to 16.5% for 2006. The increase was due to higher gross profit and the non-recurrence of a $3.7 million charge to continuing operations in 2006 for the redesign of our U.S. retirement plans, partially offset by higher SG&A expenses in 2007.
Interest expense of $33.1 million in 2007 compared to $35.8 million in 2006.The decrease was largely due to lower average outstanding debt balances. Interest income increased by $1.0 million from 2006 to 2007, reflecting higher average balances of cash and cash equivalents.
Other expense of $0.8 million in 2007 compared to other income of $1.3 million in 2006. The net expense in 2007 reflects losses on the sale of idle real estate, as well as the write-off of deferred financing costs from the prepayment of principal on our term loans. The income in 2006 is largely due to proceeds from insurance settlements.
The following table summarizes our income tax provision for continuing operations in 2007 and 2006:
| | | Year Ended December 31, | |
| (Amounts in thousands) | | 2007 | | 2006 | |
Income from continuing
operations before income taxes | | $ | 48,173 | | | $ | 46,391 | | |
| Provision for income taxes | | | 16,030 | | | | 13,746 | | |
| Income from continuing operations | | $ | 32,143 | | | $ | 32,645 | | |
| Effective tax rate | | | 33.3 | % | | | 29.6 | % | |
The increase in the effective tax rate from 2006 to 2007 is largely due to the discontinuation of a special deduction for U.S. export sales, partially offset by the phase-in of a new deduction for domestic production activities.
Our U.S. federal Net Operating Loss ("NOL") carryforward was fully utilized during 2007. We estimate our state NOL carryforwards are $30.3 million as of December 31, 2007. These carryforwards expire at various dates from 2008 through 2024. Additionally, we have a foreign tax credit carryforward of approximately $1.7 million that expires in 2010. We also have state tax credit carryforwards of approximately $0.2 million that expire at various dates from 2008 through 2021. Our federal research credits and alternative minimum tax credits are fully utilized as of December 31, 2007. The state NOL and other carryforwards are available to reduce cash taxes on future domestic taxable income, although a portion of the state NOL carryforwards are reduced by a valuation allowance reflecting the expectation that the carryforward period will expire before they can all be fully utilized.
Income from continuing operations in 2007 was $32.1 million, or $0.67 per diluted share, compared to $32.6 million, or $0.68 per diluted share, in 2006.
Income from discontinued operations in 2007 was $10.7 million, or $0.22 per diluted share, compared to $9.9 million, or $0.21 per diluted share in 2006. The 2007 results
BLOUNT INTERNATIONAL, INC.
15
consisted solely of our discontinued Forestry Division through the disposition date of November 5, 2007. Results for 2006 include both the full year of activity of our Forestry Division and activity of our discontinued Lawnmower segment through July 26, 2006. The Lawnmower segment, consisting of our former wholly-owned subsidiary, Dixon, was sold on July 27, 2006.
Discontinued operations are summarized as follows:
| | | Year Ended December 31, | |
| (Amounts in millions) | | 2007 | | 2006 | |
| Sales | | $ | 111.9 | | | $ | 196.8 | | |
| Operating income (loss) | | | (0.2 | ) | | | 2.7 | | |
| Gain on disposition of net assets | | | 26.0 | | | | 17.4 | | |
Income before taxes from
discontinued operations | | | 25.8 | | | | 20.1 | | |
| Income tax provision | | | 15.1 | | | | 10.2 | | |
| Income from discontinued operations | | $ | 10.7 | | | $ | 9.9 | | |
Sales by the Forestry Division were $111.9 million in 2007 and $167.3 million in 2006. The Forestry Division incurred a net loss of $0.2 million in 2007 and contributed $8.5 million to operating income in 2006. The decline in year-over-year sales and earnings was primarily due to a deepening of the cyclical downturn in the North American forest products equipment market in 2007, as well as charges of $4.5 million incurred in 2007 for employee severance, employee benefits, transition and closure costs. Included in operating income from the Forestry Division in 2006 is a charge of $1.2 million for costs to shut down one of the Forestry Division's three manufacturing plants. The 2007 results reflect the $26.0 million pretax gain on the disposal of the Forestry Division's net assets. The net cash proceeds received in 2007 from the sale of the Forestry Division were approximately $68.3 million and were used to reduce outstanding debt . We expect to incur cash expenditures of approximately $15.0 million in 2008 for the payment of income taxes on the gain, as well as other liabilities associated with the discontinued business.
Sales by the Lawnmower segment for the partial 2006 year were $29.5 million. The Lawnmower segment recognized a loss from operations in 2006 of $5.3 million. The 2006 loss from operations was primarily due to expenses necessary to finalize the closure of the facility, including the termination of the majority of the Lawnmower segment employees, and to facilitate the transfer of assets sold to the buyer. These results included compensation, severance and benefits costs, a charge to write down assets we retained (primarily the land and building) and other expenses. The 2006 results reflect the $17.4 million pretax gain on the disposal of the segment's net assets. The net cash proceeds from the sale of the Lawnmower segment were approximately $32.4 million and were used to reduce outstanding debt.
Segment Results. The following table reflects segment sales and operating income for 2007 and 2006:
| | | Year Ended December 31, | |
| (Amounts in thousands) | | 2007 | | 2006 | | 2007 as
% of 2006 | |
| Sales: | |
| Outdoor Products | | $ | 486,739 | | | $ | 455,009 | | | | 107 | % | |
| Corporate and other | | | 28,796 | | | | 32,485 | | | | 89 | % | |
| Total sales | | $ | 515,535 | | | $ | 487,494 | | | | 106 | % | |
| Operating income | |
| Outdoor Products | | $ | 95,932 | | | $ | 97,805 | | | | 98 | % | |
| Corporate and other | | | (15,232 | ) | | | (13,598 | ) | | | 112 | % | |
| Retirement plan redesign | | | – | | | | (3,747 | ) | | | – | | |
| Operating income | | $ | 80,700 | | | $ | 80,460 | | | | 100 | % | |
Outdoor Products Segment. Sales for the Outdoor Products segment increased $31.7 million (7%) in 2007 compared to 2006. Of this increase, $15.7 million was due to additional sales volume, primarily from an increase in sales of wood-cutting saw chain and outdoor equipment parts and, to a lesser extent, concrete-cutting saw chain. Improved price and product mix also contributed $7.9 million to the year-over-year sales increase. Fluctuations in foreign currency exchange rates added another $8.0 million to segment sales in 2007 compared to 2006. International sales grew nearly 12% year over year, while domestic sales decreased about 2%. Sales to OEMs increased by 4% ,while replacement sales increased 5%. Sales of concrete-cutting products increased $0.8 million (3%). Order backlog increased by $8.5 million to $63.3 million at December 31, 2007.
Segment contribution to operating income decreased $1.9 million (2%) in 2007 compared to 2006. The favorable effects of increased sales volume ($7.9 million) and improved price and mix ($7.9 million) were offset by higher product cost and mix ($12.4 million), higher SG&A expenses ($2.0 million) and the net unfavorable effect of fluctuations in foreign currency translation rates ($3.3 million). The higher product cost and mix, excluding the foreign currency exchange effect, includes inflationary pressures of higher wages and other conversion costs, higher freight and shipping costs, $1.1 million incurred to
BLOUNT INTERNATIONAL, INC.
16
consolidate the North American distribution center and $0.5 million in higher steel costs. The operating margin of 19.7% in 2007 compares to 21.5% in 2006.
Corporate and Other. The corporate and other category includes the activity of our gear components business, as well as the costs of certain centralized management and administrative functions. Sales of gear-related products decreased 11% from 2006 to 2007, with lower volume of $5.7 million partially offset by improved price and mix of $2.0 million. Weak market conditions in the construction and forestry equipment markets in the U.S. were partially offset by increased business in the utility equipment market. The contribution to operating income from our gear components business decreased $1.7 million (45%) year over year due to lower sales revenue. Corporate expense was flat year over year, with higher stock compensation costs ($0.7 million) and merit wage increases off-set by reduced legal and compliance costs.
Year ended December 31, 2006 compared to year ended December 31, 2005
The table below provides a summary of results and the primary contributing factors to the year over year change.
| (Amounts in millions) | | 2006 | | 2005 | | Change | | Contributing Factor | |
| Sales | | $ | 487.5 | | | $ | 478.8 | | | $ | 8.7 | | | | | | |
| | | | | | | | | | | | | | | $7.2 | | Sales volume | |
| | | | | | | | | | | | | | | 0.9 | | Price and mix | |
| | | | | | | | | | | | | | | 0.6 | | Foreign currency translation | |
| Gross profit | | | 173.7 | | | | 181.1 | | | | (7.4 | ) | | | | | |
| Gross margin | | | 35.6 | % | | | 37.8 | % | | | | | | 3.3 | | Sales volume | |
| | | | | | | | | | | | | | | 0.9 | | Selling price and mix | |
| | | | | | | | | | | | | | | (7.4) | | Product cost and mix | |
| | | | | | | | | | | | | | | (4.2) | | Foreign currency translation | |
| SG&A | | | 89.5 | | | | 89.5 | | | | 0.0 | | | | | | |
| | | | | | | | | | | | | | | 2.5 | | Stock compensation expense | |
| | | | | | | | | | | | | | | (2.1) | | Cash compensation expense | |
| | | | | | | | | | | | | | | (1.6) | | Legal and compliance costs | |
| | | | | | | | | | | | | | | 0.5 | | Depreciation and advertising | |
| | | | | | | | | | | | | | | 0.5 | | Foreign currency translation | |
| | | | | | | | | | | | | | | 0.2 | | Other, net | |
| Operating income | | | 80.5 | | | | 91.6 | | | | (11.1 | ) | | | | | |
| Operating margin | | | 16.5 | % | | | 19.1 | % | | | | | | (7.4) | | Decrease in gross profit | |
| | | | | | | | | | | | | | | (3.7) | | Retirement plan redesign | |
| Income from continuing operations | | | 32.6 | | | | 88.2 | | | | (55.6 | ) | | | | | |
| | | | | | | | | | | | | | | (11.1) | | Decrease in operating income | |
| | | | | | | | | | | | | | | 1.3 | | Decrease in net interest expense | |
| | | | | | | | | | | | | | | 2.3 | | Change in other income/expense | |
| | | | | | | | | | | | | | | (48.0) | | Change in income tax provision | |
| | | | | | | | | | | | | | | (0.1) | | Other, net | |
| Income from discontinued operations | | | 9.9 | | | | 18.4 | | | | (8.5 | ) | | | | | |
| | | | | | | | | | | | | | | 17.4 | | Gain on sale of net assets | |
| | | | | | | | | | | | | | | (26.7) | | Decrease in operating results | |
| | | | | | | | | | | | | | | 0.8 | | Decrease in income tax expense | |
| Net income | | $ | 42.5 | | | $ | 106.6 | | | $ | (64.1 | ) | | | | | |
Sales in 2006 increased $8.7 million (2%) from 2005, primarily due to higher sales volume. The Outdoor Products segment experienced a $2.7 million (1%) increase in sales during 2006 compared to 2005. Sales of our gear-related products increased $6.0 million (23%) from 2005 to 2006. International sales increased $6.9 million (2%) and domestic sales increased $2.2 million (1%). Included in the international sales increase is a $0.6 million favorable impact from movement in foreign currency exchange rates compared to 2005, primarily from the stronger Canadian Dollar. The relatively flat U.S. sales growth is attributed to weaker market conditions in the lawn care and forestry industries, offset by stronger sales of our gear-related products. Sales of concrete-cutting products increased 10% from 2005 to 2006, lead by new product introductions and improved market penetration.
Consolidated order backlog for continuing operations at December 31, 2006 was $61.3 million compared to $90.5 million at December 31, 2005. The year-over-year decline is primarily due to improved production capacity and related responsiveness to customer orders in our Outdoor Products segment, which lead to shorter lead times on
BLOUNT INTERNATIONAL, INC.
17
product delivery. We believe that prior to 2006, customers were ordering more than their short term needs to ensure product delivery.
Gross profit decreased $7.4 million (4%) from 2005 to 2006. Gross margin in 2006 was 35.6% of sales compared to 37.8% in 2005. Average selling prices increased slightly in 2006, primarily from shifts in product mix and price increases on selected products. The decrease related to product cost and mix includes the effect of higher energy costs for utilities, annual wage increases to our manufacturing employees and inflation on other cost elements. These product cost increases were partially offset by a decrease in steel costs estimated at $1.0 million compared to the previous year. Fluctuations in currency exchange rates decreased our gross profit in 2006 compared to 2005 by $4.2 million. The largest effects were in our plants in Canada and Brazil, which were impacted by higher manufacturing costs resulting from translation to the weaker U.S. Dollar estimated at $4.8 million. These higher translated costs were partially offset by a modest increase in sales, estimated at $0.6 million, due to currency exchange rates.
SG&A was $89.5 million in 2006 and in 2005. As a percent of sales, SG&A decreased slightly to 18.4% in 2006 compared to 18.7% in 2005. Stock-based compensation expense increased $2.5 million in 2006 following the adoption of a new accounting standard. Cash-based compensation decreased by $2.1 million year over year, reflecting lower incentive compensation cost and selected adjustments to work force levels partially offset by annual merit increases. Compliance-related and legal professional services decreased $1.6 million year-over-year. Depreciation and advertising expenses increased $0.5 million, primarily due to additional investments in infrastructure and administrative systems. International operating expenses increased $0.5 million from the prior year due to the weaker U.S. Dollar and its effect on the translation of foreign expenses.
Total expense recognized for our pension and other post-retirement plans was $14.3 million and $12.8 million for the years ended December 31, 2006 and 2005, respectively. These amounts, which include amounts charged to both continuing and discontinued operations, also include a pension curtailment charge of $3.6 million in 2006 to reflect the freezing of our U.S. defined benefit pension plan effective December 31, 2006 and the related write-off of unamortized prior service cost for plan participants. We also recognized an additional charge of $0.5 million for related fees and costs associated with the changes to our retirement plans.
Operating income decreased by $11.1 million (12%) from 2005 to 2006, resulting in an operating margin for 2006 of 16.5% of sales compared to 19.1% for 2005. The decrease was primarily due to lower gross profit and charges related to the redesign of our U.S. retirement plans.
Interest expense of $35.8 million in 2006 compares to $37.3 million in 2005. The decrease was largely due to lower average outstanding debt balances, partially offset by higher variable interest rates. The weighted average interest rate on our revolver and term loans increased by 42 basis points from December 31, 2005 to December 31, 2006. Interest income declined to $0.4 million for 2006 compared to $0.6 million in 2005, primarily due to a decline in average balances of cash and cash equivalents.
Other income of $1.3 million in 2006 compared to other expense of $1.0 million in 2005. The $2.3 million difference was largely due to the $3.0 million write-off of deferred financing costs in 2005 resulting from prepayment of principal on our term debt. Excluding this expense, other income for both periods was primarily related to proceeds from insurance settlements.
The following table summarizes our income tax provision for continuing operations in 2006 and 2005:
| | | Year Ended December 31, | |
| (Amounts in thousands) | | 2006 | | 2005 | |
Income from continuing
operations before income taxes | | $ | 46,391 | | | $ | 53,958 | | |
| Provision (benefit) for income taxes | | | 13,746 | | | | (34,256 | ) | |
| Income from continuing operations | | $ | 32,645 | | | $ | 88,214 | | |
| Effective tax rate | | | 29.6 | % | | | (63.5 | )% | |
The $48.0 million year-over-year change in income taxes is largely due to the 2005 reversal of most of the valuation allowance established on our U.S. deferred income tax assets. The valuation allowance was originally established in the third quarter of 2003. Our domestic net operating loss carryforwards and other deferred tax assets were fully reserved with a valuation allowance until the reversal of the valuation allowance on December 31, 2005. Accordingly, we recognized minimal net federal domestic tax expense on our domestic income during 2005, except for incremental taxes on the repatriation of foreign earnings. Our remaining U.S. NOL carryforward of approximately $20.2 million as of December 31, 2006 was fully utilized during 2007.
Income from continuing operations for 2006 was $32.6 million, or $0.68 per diluted share, compared to income from continuing operations of $88.2 million, or $1.86 per diluted share, in 2005.
Income from discontinued operations of $9.9 million, or $0.21 per diluted share in 2006, compared to $18.4 million, or $0.38 per diluted share in 2005. These results consisted of both our discontinued Forestry Division, formerly making up the majority of our discontinued Industrial and Power Equipment segment, and our discontinued Lawnmower segment. Our Forestry Division was sold in November 2007. The Lawnmower segment, consisting of our former wholly-owned subsidiary, Dixon, was sold in
BLOUNT INTERNATIONAL, INC.
18
July 2006. Accordingly, both businesses are reported as discontinued operations for all periods presented.
Discontinued operations are summarized as follows:
| | | Year Ended December 31, | |
| (Amounts in millions) | | 2006 | | 2005 | |
| Sales | | $ | 196.8 | | | $ | 281.9 | | |
| Operating income | | | 2.7 | | | | 29.3 | | |
| Gain on disposition of net assets | | | 17.4 | | | | – | | |
Income before taxes from
discontinued operations | | | 20.1 | | | | 29.3 | | |
| Income tax provision | | | 10.2 | | | | 10.9 | | |
| Income from discontinued operations | | $ | 9.9 | | | $ | 18.4 | | |
Full-year results for our Forestry Division are included in both 2005 and 2006 above. Sales by the Forestry Division were $167.3 million in 2006 and $227.5 million in 2005. The Forestry Division contributed $8.5 million to operating income in 2006, and $26.2 million to operating income in 2005. The decline in year-over-year sales and earnings was primarily due to a cyclical downturn in the North American forest products equipment market. Included in operating income for 2006 is a charge of $1.2 million for costs to shut down one of the Forestry Division's three manufacturing plants.
We operated the Lawnmower segment through July 26, 2006. Full year results for the Lawnmower segment are included in 2005 above, but only partial year results are included for 2006. Sales by the Lawnmower segment were $54.4 million in 2005 and for the partial 2006 year were $29.5 million. The Lawnmower segment contributed $3.1 million to operating income in 2005 but recognized a loss from operations in 2006 of $5.3 million. The 2006 loss from operations was primarily due to expenses necessary to finalize the closure of the facility, including the termination of the majority of the Lawnmower segment employees, and to facilitate the transfer of assets sold to the buyer. These results included compensation, severance and benefits costs, a charge to write down assets we retained (primarily the land and building) and other expenses. The 2006 results reflect the $17.4 million pretax gain on the disposal of the segment's net assets.
Segment Results. The following table reflects segment sales and operating income for 2006 and 2005:
| | | Year Ended December 31, | |
| (Amounts in thousands) | | 2006 | | 2005 | | 2006 as
% of 2005 | |
| Sales: | |
| Outdoor Products | | $ | 455,009 | | | $ | 452,334 | | | | 101 | % | |
| Corporate and other | | | 32,485 | | | | 26,495 | | | | 123 | % | |
| Total sales | | $ | 487,494 | | | $ | 478,829 | | | | 102 | % | |
| Operating income | |
| Outdoor Products | | $ | 97,805 | | | $ | 105,536 | | | | 93 | % | |
| Corporate and other | | | (13,598 | ) | | | (13,908 | ) | | | 98 | % | |
| Retirement plan redesign | | | (3,747 | ) | | | – | | | | – | | |
| Operating income | | $ | 80,460 | | | $ | 91,628 | | | | 88 | % | |
Outdoor Products Segment. Sales for the Outdoor Products Segment increased $2.7 million (1%) in 2006 compared to 2005. Of this increase, $2.6 million was due to additional sales volume, coming primarily from an increase in sales of chainsaw guide bars and accessories outside the U.S. and from our concrete-cutting products and accessories. Price increases were realized in certain markets; however, the combination of selling prices and product mix resulted in a net decrease of $0.5 million compared to 2005. The net effect of foreign currency translation on sales was an increase of $0.6 million. Order backlog decreased to $54.8 million at December 31, 2006, compared to $82.5 million at December 31, 2005, a 34% decrease. The decrease in backlog compared to the prior year was partially due to increases in capacity and to improved delivery to customers, bot h of which have resulted in reduced order lead-times.
Sales of chainsaw guide-bars increased 11%, which was made possible by increased production capacity and continued strong demand. Unit sales of chainsaw parts and accessories used for forestry or wood-cutting applications increased a modest 1%. A decrease in chainsaw chain volume partially offset the gains in guide bars, parts and accessories. Sales of outdoor equipment parts, including lawnmower blades and other accessories for lawn and garden use, decreased 4%, largely due to adverse weather conditions in U.S. markets. Geographically, the weaker U.S. Dollar during 2006 provided an incremental advantage for our selling prices, contributing to a 2% increase in international sales on top of 12% growth in 2005 and 20% growth in 2004. Sales to OEMs increased by 3%, while replacement sales were flat on a year-over-year basis. Sales of concrete-cutting products increased $2.8 million, primarily from higher unit volume.
Segment contribution to operating income decreased $7.7 million (7%) in 2006 compared to 2005. The favorable effect of increased sales volume on contribution was
BLOUNT INTERNATIONAL, INC.
19
approximately $2.1 million. This increase was offset by the net unfavorable effect of foreign currency translation, estimated at $4.7 million, driven primarily by the effect that stronger Canadian and Brazilian currencies had on our manufacturing costs and SG&A expenses. These higher costs were partially offset by the favorable net effect of a weaker U.S. Dollar on sales. Excluding the effects of currency exchange rates, the net unfavorable effect of cost and mix was $4.0 million. This net effect includes inflationary pressures of higher wages and other conversion costs, partially offset by an estimated $1.5 million year-over-year reduction in steel costs, and $1.0 million related to reductions in staffing levels. The operating margin of 21.5% in 2006 compares to 23.3% in 2005.
Corporate and Other. The corporate and other category above includes the activity of our gear components business, as well as the costs of certain centralized administrative functions. Sales of gear-related products increased 23% from 2005 to 2006, with 5% attributable to price and product mix, and 18% due to higher volume. Improvements in manufacturing efficiency lead to improved customer service and increased market share. Contribution to operating income from the gear components business increased $1.8 million from 2005 to 2006. Corporate expense increased $1.5 million (9%) in 2006 compared to 2005. This increase included a $2.5 million increase in stock-based compensation expense related to the adoption of a new accounting standard. Stock-based compensation expense is expected to increase gradually over the next several years as a result of the ef fects of additional stock compensation grants. The combination of wages and incentive compensation increased $0.5 million. These increases were partially offset by a $1.6 million decrease in legal and other compliance-related costs.
Financial Condition, Liquidity and Capital Resources
During the last three years we have significantly reduced our debt and related interest expense using cash flow from operations and the net proceeds from the sale of our Lawnmower Segment in 2006 and the sale of our Forestry Division in 2007. Total debt was $297.0 million at December 31, 2007 and $350.9 million at December 31, 2006, representing a reduction of $53.9 million during 2007. Outstanding debt as of December 31, 2007 consisted of a term loan balance of $122.0 million and 87/8% senior subordinated notes of $175.0 million. We had no principal outstanding on our revolving credit facility as of December 31, 2007.
87/8% Senior Subordinated Notes. We have one registered debt security, the 87/8% senior subordinated notes. The interest rate on these notes is fixed until their maturity on August 1, 2012. These notes are issued by Blount, Inc. and are fully and unconditionally, jointly and severally, guaranteed by the Company and all of its domestic subsidiaries ("guarantor subsidiaries") other than Blount, Inc. All guarantor subsidiaries of these 87/8% senior subordinated notes are 100% owned, directly or indirectly, by the Company. While the Company and all of its domestic subsidiaries guarantee these 87/8% senior subordina ted notes, none of our existing foreign subsidiaries ("non-guarantor subsidiaries") guarantee these notes.
Senior Credit Facilities. The Company, through its wholly-owned subsidiary, Blount, Inc., first entered into a credit agreement with General Electric Capital Corporation as Agent on May 15, 2003. The agreement was amended and restated on August 9, 2004, and has had several subsequent amendments. The senior credit facilities consist of a term loan facility and a revolving credit facility.
2006 Amendment to Credit Facilities. On March 23, 2006, we amended certain terms of the senior credit facilities. This amendment included the following changes:
< Maximum availability under the revolving credit facility was increased from $100.0 million to $150.0 million.
< Interest rates were reduced by 0.75% for the term loans and by 1.00% for the revolving credit facility.
< Certain financial covenants were modified, including increases to the amounts that may be paid for acquisitions, dividends and repurchase of Company stock, as well as modifications to certain financial ratio requirements.
< The Company incurred fees and third party costs of $0.7 million related to the amendment.
Immediately following the amendment, we completed the following transactions:
< $82.1 million was borrowed under the revolving credit facility.
< The total principal balance of $4.6 million was paid off on a Canadian term loan, and that loan was cancelled.
< $77.5 million in principal was paid against the term loans, leaving a balance of $150.0 million outstanding.
2007 Amendment to Credit Facilities. On November 5, 2007, we amended certain terms of the senior credit facilities. No changes were made to the interest rates, principal amounts, maturity dates or payment schedules of the debt or to the availability of credit under the agreement. This amendment included the following changes:
< The agreement was modified to allow the Company to sell our Forestry Division on the same day as the effective date of the amendment.
< Certain covenants, terms and conditions were modified in the credit agreement, including an increased allowance for acquisitions, reduced reporting requirements and a reduction in the required senior leverage ratio.
< The Company incurred fees and third party costs of $0.7 million related to the amendment.
BLOUNT INTERNATIONAL, INC.
20
The revolving credit facility provides for total available borrowings up to $150.0 million, reduced by outstanding letters of credit and further restricted by a specific leverage ratio and first lien credit facilities leverage ratio. As of December 31, 2007, the Company had the ability to borrow an additional $140.9 million under the terms of the revolving credit agreement. The revolving credit facility bears interest at the LIBOR rate plus 1.75%, or at the prime rate, depending on the type of loan, and matures on August 9, 2009. Interest is payable monthly in arrears on any prime rate borrowing and at individual maturity dates for any LIBOR-based borrowing. Any outstanding principal is due in its entirety on the maturity date.
The term loan facility bears interest at the LIBOR rate plus 1.75%, or at the prime rate, depending on the type of loan, and matures on August 9, 2010. The term loan facility requires quarterly payments of $0.3 million, with a final payment of $118.6 million due on the maturity date. Once repaid, principal under the term loan facility may not be re-borrowed by the Company.
The amended and restated senior credit facilities contain financial covenant calculations relating to maximum capital expenditures, minimum fixed charge coverage ratio, maximum leverage ratio and maximum first lien credit facilities leverage ratio. In addition, there are covenants relating, among other categories, to investments, loans and advances, indebtedness, and the sale of stock or assets. We were in compliance with all debt covenants as of December 31, 2007. Non-compliance with these covenants, if it were to become an event of default under the terms of the credit agreement, could result in severe limitations to our overall liquidity, and the term loan lenders could require actions for immediate repayment of outstanding amounts, potentially requiring sale of our assets. Our debt is not subject to any triggers that would require early payment of debt due to any adverse change in our credit rating.
The amended and restated senior credit facilities may be prepaid at any time. There can also be additional mandatory repayment requirements related to the sale of Company assets, the issuance of stock under certain circumstances or upon the Company's annual generation of excess cash flow, as determined under the credit agreement.
Blount International, Inc. and all of its domestic subsidiaries other than Blount, Inc. guarantee Blount, Inc.'s obligations under the senior credit facilities. The obligations under the senior credit facilities are collateralized by a first priority security interest in substantially all of the assets of Blount, Inc. and its domestic subsidiaries, as well as a pledge of all of Blount, Inc.'s capital stock held by Blount International, Inc. and all of the stock of domestic subsidiaries held by Blount, Inc. Blount, Inc. has also pledged 65% of the stock of its non-domestic subsidiaries as additional collateral.
Interest expense has been reduced in each of the last three years primarily by the reduction in the principal amount of long term debt. The effects of these principal reductions have been further affected by changes in interest rates on our variable rate debt. The variable interest rates decreased by 11 basis points during 2007, but increased by a net amount of 42 basis points during 2006 after increasing by 161 basis points during 2005. Our annual interest expense may continue to vary in the future because the senior credit facility interest rates are not fixed. The weighted average interest rate on all our outstanding debt as of December 31, 2007 was 8.11%, compared with 7.99% as of December 31, 2006. Cash interest paid was $31.3 million in 2007, $33.0 million in 2006 and $31.3 million in 2005.
Our debt continues to be significant, and future debt service payments continue to represent substantial obligations. This degree of leverage may adversely affect our operations and could have important consequences. See Item 1A, Risk Factors, "Substantial Leverage" for further discussion. Over the longer term, we expect to meet our financial and capital needs, including payment of debt obligations, through a combination of cash flow from operations and amounts available under existing credit facilities, as well as the potential issuance of new debt, sale of additional shares of stock or establishment of new credit facilities. While there can be no assurance, management believes we will comply with all financial performance covenants during the next twelve months. Should we not comply wi th the covenants, additional significant actions may be required. These actions may include, among others, an attempt to renegotiate our debt facilities, sales of assets, restructuring and reductions in capital expenditures.
We intend to fund working capital, capital expenditures and debt service requirements for the next twelve months through expected cash flows generated from operations and the amounts available under our revolving credit agreement. Interest on our debt is payable in arrears according to varying interest rates and periods. We expect our financial resources will be sufficient to cover any additional increases in working capital and capital expenditures. There can be no assurance, however, that these resources will be sufficient to meet our needs. We may also consider other options available to us in connection with future liquidity needs.
Cash and cash equivalents at December 31, 2007 were $57.6 million compared to $27.6 million at December 31, 2006.
BLOUNT INTERNATIONAL, INC.
21
Cash provided by operating activities is summarized as follows:
| | | Year Ended December 31, | |
| (Amounts in thousands) | | 2007 | | 2006 | | 2005 | |
Income from
continuing operations | | $ | 32,143 | | | $ | 32,645 | | | $ | 88,214 | | |
Non-cash items included
in net income | | | 37,060 | | | | 36,099 | | | | (15,901 | ) | |
| Subtotal | | | 69,203 | | | | 68,744 | | | | 72,313 | | |
Changes in assets and
liabilities, net | | | (32,653 | ) | | | (13,073 | ) | | | (42,491 | ) | |
| Discontinued operations | | | (5,209 | ) | | | 4,345 | | | | 35,290 | | |
Cash provided by
operating activities | | $ | 31,341 | | | $ | 60,016 | | | $ | 65,112 | | |
Non-cash items consist of expense from the early extinguishment of debt, depreciation of property, plant and equipment, amortization and other non-cash charges, deferred income taxes and (gain) loss on disposal of property, plant and equipment. Changes in assets and liabilities, net, consists of those changes in assets and liabilities included in the cash flows from operating activities section of the Consolidated Statements of Cash Flows.
2007 cash provided by operating activities of $31.3 million reflected the following significant items:
< Income from continuing operations of $32.1 million;
< Addition of non-cash items of $37.1 million, which included the following:
0 Depreciation expense of $17.6 million;
0 Amortization and write-off of deferred financing costs of $4.6 million;
0 Stock compensation costs of $3.2 million;
0 A deferred income tax provision of $11.1 million; and
0 A net loss of $0.7 million related to the disposal of property, plant and equipment.
< Changes in assets and liabilities reduced cash flow from operations by $32.7 million, including the following items:
0 A decrease in accounts receivable of $3.6 million and an increase in accounts payable of $4.7 million;
0 An increase in inventories of $13.3 million;
0 An increase in other assets of $3.6 million;
0 A reduction in accrued expenses of $7.4 million; and
0 A reduction in other liabilities of $16.6 million, primarily related to pension funding in excess of the amount charged to expense.
0 Discontinued operations used $5.2 million, primarily for transition costs incurred in selling the Forestry Division.
2006 cash provided by operating activities of $60.0 million reflected the following significant items:
< Income from continuing operations of $32.6 million;
< Addition of non-cash items of $36.1 million, which included the following:
0 Depreciation expense of $15.1 million;
0 Amortization of deferred financing costs of $3.7 million;
0 Pension curtailment charge of $3.2 million;
0 Stock compensation costs of $2.6 million;
0 A deferred income tax provision of $13.0 million; and
0 A net gain of $0.8 million related to the disposal of property, plant and equipment.
< Changes in assets and liabilities reduced cash flow from operations by $13.1 million, including the following items:
0 Decreases in accounts receivable of $1.5 million and inventory of $2.9 million;
0 An increase in other assets of $3.7 million;
0 An increase in accounts payable of $2.6 million;
0 A reduction in accrued expenses of $7.0 million; and
0 A reduction in other liabilities of $9.4 million, primarily related to pension funding in excess of the amount charged to expense.
< Discontinued operations provided $4.3 million, primarily due to the full-year operating activities of our Forestry Division partially offset by transition costs incurred in selling the Lawnmower segment.
2005 cash provided by operating activities of $65.1 million, reflected the following significant items:
< Net income from continuing operations of $88.2 million.
< Reduction for non-cash items of $15.9 million, which included the following:
0 Depreciation expense of $13.2 million;
0 Amortization and write-off of deferred financing costs of $6.5 million;
0 A deferred income tax benefit recognized of $35.3 million, including the reversal of a valuation allowance on deferred tax assets; and
0 A net gain of $0.4 million related to the disposal of property, plant and equipment.
< Changes in assets and liabilities used $42.5 million of net cash, including the following items:
0 An increase in accounts receivable of $17.3 million, primarily related to delayed collections from certain of our larger OEM customers at the end of 2005. These OEM customer receivables were collected in early 2006;
0 An increase in inventories of $4.7 million;
0 An increase in other assets of $4.9 million;
0 An increase in accounts payable of $1.1 million;
0 A decrease in accrued expenses of $10.3 million; and
0 A decrease in other liabilities of $6.5 million.
< Discontinued operations provided $35.3 million, representing the Forestry Division and Lawnmower segment's cash flows from operating activities.
BLOUNT INTERNATIONAL, INC.
22
Cash contributions for all pension and post-retirement benefit plans were $22.9 million for 2007, $20.8 million for 2006 and $12.4 million for 2005. Funding requirements for post-retirement benefit plans fluctuate significantly from year to year. See further discussion following under "Critical Accounting Policies and Estimates." The Company intends to make contributions to our funded pension plans in 2008 of approximately $3.0 million to $4.0 million. The obligations under our other post-retirement benefit plans are made on a pay-as-you-go basis. We also make cash contributions to our U.S. 401(k) plan. In 2007, we contributed $2.6 million, and expect to contribute between $5.4 million and $5.6 million in 2008. The higher level of expected contributions in 2008 reflects the additional contribution implemented as part of our U.S. retirement plan restructuring and the freeze of our U.S. defined benefit pension plan undertaken in 2 006.
The American Jobs Creation Act of 2004 (the "Act"), signed into law October 22, 2004, included a one-time election to deduct 85% of certain foreign earnings that are repatriated, as defined in the Act. Any repatriation of foreign earnings was required to be completed by December 31, 2005. During the fourth quarter of 2005, we repatriated $24.9 million of our undistributed earnings of foreign subsidiaries. Management's intention is to reinvest remaining undistributed foreign earnings indefinitely.
Net cash income tax payments were $20.8 million in 2007, $9.9 million in 2006 and $14.3 million in 2005. Income tax payments prior to 2007 have been primarily the result of our foreign tax liability, with a portion also for state and local taxes and alternative minimum tax. In addition, incremental cash taxes on the repatriation of foreign earnings of $1.4 million were paid in 2005. In the years prior to 2007, U.S. taxable income has been offset by our domestic net operating loss carryforwards. As expected, we began paying cash income taxes in the U.S. in 2007.
Cash flows from investing activities are summarized as follows:
| | | Year Ended December 31, | |
| (Amounts in thousands) | | 2007 | | 2006 | | 2005 | |
Proceeds from sale of property,
plant and equipment | | $ | 2,309 | | | $ | 1,244 | | | $ | 382 | | |
Purchases of property, plant
and equipment | | | (18,517 | ) | | | (21,653 | ) | | | (17,307 | ) | |
| Discontinued operations | | | 69,071 | | | | 30,900 | | | | (2,022 | ) | |
Cash provided by (used in)
investing activities | | $ | 52,863 | | | $ | 10,491 | | | $ | (18,947 | ) | |
In 2007 we generated $52.9 million of cash from investing activities, inclusive of $69.1 million of net activity from discontinued operations. Discontinued operations in 2007 included net proceeds from the sale of our Forestry Division, reduced by amounts held in escrow and capital expenditures made by the Forestry Division prior to the sale on November 5, 2007. In 2006, we generated $10.5 million from investing activities, inclusive of $30.9 million of net activity from discontinued operations. Discontinued operations in 2006 included net proceeds from the sale of our Lawnmower segment, reduced by capital expenditures of our Forestry Division. In 2005 we used $18.9 million in investing activities, reflecting capital expenditures of $17.3 million for our continuing operations and capital expenditures of $2.0 million in our discontinued operations. Purchases of property, plant and equipment for all three years presented are prima rily for productivity improvements, expanded manufacturing capacity and replacement of consumable tooling. In the three year period we have invested $18.1 million for construction and equipment at our facility in China, with $5.4 million of the total expended in 2007. In 2008, we expect to increase purchases of property, plant and equipment to between $25 million and $30 million, primarily for ongoing productivity and cost improvements in our manufacturing processes and routine replacement of machinery and equipment, including tooling that is consumed in the production process, as well as incremental capacity expansion.
Cash flows from financing activities are summarized as follows:
| | | Year Ended December 31, | |
| (Amounts in thousands) | | 2007 | | 2006 | | 2005 | |
| Net reduction of debt | | $ | (53,875 | ) | | $ | (56,848 | ) | | $ | (86,488 | ) | |
Issuance, modification
and redemption costs | | | (700 | ) | | | (700 | ) | | | (3,979 | ) | |
Proceeds from the exercise
of stock options and warrants | | | 324 | | | | 1,740 | | | | 8,669 | | |
Cash used by
financing activities | | $ | (54,251 | ) | | $ | (55,808 | ) | | $ | (81,798 | ) | |
2007 activity included the following:
< Net debt reduction of $53.9 million, primarily funded with proceeds from the sale of our Forestry Division;
< Expenditures of $0.7 million incurred with the November, 2007 amendment to our senior credit facilities; and
< $0.2 million of proceeds from the exercise of stock options and a related $0.1 million tax benefit that is recognized as a financing activity under FAS No. 123(R).
2006 activity included the following:
< Net debt reduction of $56.8 million, partially funded with proceeds from the sale of our Lawnmower segment, as well as cash flows from operations;
< Expenditures of $0.7 million incurred with the March, 2006 amendment to our senior credit facilities; and
BLOUNT INTERNATIONAL, INC.
23
< $1.0 million of proceeds from the exercise of stock options and a related $0.7 million tax benefit.
2005 activity included the following:
< Net debt reduction of $86.5 million, funded with cash flows from operations and the repatriation of cash from foreign subsidiaries;
< Payment of previously recorded debt issuance costs of $2.6 million, and previously recorded stock issuance costs of $1.4 million, related to several 2004 refinancing transactions;
< Proceeds from the issuance of stock that were in turn used for the purchase of treasury stock, each at $6.1 million and netting to zero; and
< Proceeds from exercise of stock options and warrants of $8.7 million.
In June 2005, we and certain of our shareholders sold 7.5 million shares of our common stock in a public offering. We received cumulative net proceeds of $10 thousand for the following transactions:
< Lehman Brothers sold 6,117,620 shares of our common stock, reducing its ownership to approximately 8.9 million shares, or approximately 19% of our outstanding common stock. We did not receive any proceeds from this sale;
< We issued 382,380 shares of common stock and received net proceeds of $6.1 million;
< We purchased 382,380 shares of common stock from certain stockholders for $6.1 million. These shares are held as treasury stock and we have accounted for this treasury stock as constructively retired in the consolidated financial statements; and
< Warrants for 1,000,000 shares of common stock at $0.01 a share were exercised with net proceeds of $10 thousand received by the Company.
Of the amounts disbursed for debt and equity issuance costs in 2005, $3.2 million was paid to Lehman Brothers, which prior to December 2004 controlled more than 50% of our outstanding common stock.
Certain customers of the discontinued Lawnmower segment financed their purchases through third party financing companies. Under the terms of these financing arrangements, the Company may be required to repurchase certain equipment from the finance companies, or reimburse them for any financial loss incurred, should a customer default on payment. Since we discontinued the business, no new obligations have arisen, and the remaining outstanding commitment has decreased significantly. The aggregate repurchase or reimbursement obligation outstanding under the agreements as of December 31, 2007 was $0.8 million. These arrangements have not had a material adverse effect on the Company's operating results or cash flows in the past. The Company does not expect to incur any material charges related to these agreements in future periods based on past experience and because any repurchased equipment would most likely be resold for approxima tely the same value.
As of December 31, 2007, our contractual and estimated obligations are as follows (in thousands):
| (Amounts in thousands) | | Total | | 2008 | | 2009-2010 | | 2011-2012 | | Thereafter | |
| Debt obligations (1) | | $ | 297,000 | | | $ | 1,242 | | | $ | 120,758 | | | $ | 175,000 | | | | – | | |
| Estimated interest payments (2) | | | 100,635 | | | | 23,897 | | | | 45,676 | | | | 31,062 | | | | – | | |
| Purchase commitments (3) | | | 125 | | | | 125 | | | | – | | | | – | | | | – | | |
| Operating lease obligations (4) | | | 5,156 | | | | 1,079 | | | | 1,841 | | | | 755 | | | $ | 1,481 | | |
| Defined benefit pension obligations (5) | | | 3,099 | | | | 3,099 | | | | – | | | | – | | | | – | | |
| Other post-retirement obligations (6) | | | 16,097 | | | | 1,660 | | | | 2,499 | | | | 2,028 | | | | 9,910 | | |
| Other long term liabilities (7) | | | 425 | | | | 25 | | | | 200 | | | | 200 | | | | – | | |
| Total contractual obligations | | $ | 422,537 | | | $ | 31,127 | | | $ | 170,974 | | | $ | 209,045 | | | $ | 11,391 | | |
(1) Scheduled minimum principal payments on debt. Additional voluntary prepayments may also be made from time to time. Additional mandatory principal payments are required under certain circumstances.
(2) Estimated future interest payments based on existing debt balances, timing of scheduled minimum principal payments and estimated variable interest rates.
(3) Does not include amounts recorded as current liabilities on the balance sheet.
(4) See also Note 11 to Consolidated Financial Statements.
(5) Current minimum funding requirements for defined benefit pension plans. Does not include estimated future funding requirements for defined benefit pension plans of approximately $8.3 million in 2009 and each year thereafter. Actual funding requirements may vary significantly from these estimates based on actual return on assets, changes in assumptions, plan modifications and actuarial gains and losses. See additional discussion of these key assumptions and estimates under "Critical Accounting Policies and Estimates" below. Additional voluntary funding payments may also be made.
(6) Estimated payments for various non-qualified retirement benefits. The Company also has benefit payment obligations due under its post-retirement medical plan that are not required to be funded in advance, but are pay-as-you-go, and are not included herein. See Note 10 to Consolidated Financial Statements for additional discussion.
(7) Advisory and consulting fees for certain current and former officers and directors of the Company.
BLOUNT INTERNATIONAL, INC.
24
As of December 31, 2007, our recorded liability for uncertain tax positions was $28.0 million. Due to the high degree of uncertainty regarding the timing of potential future cash flows associated with uncertain tax positions, we are unable to make a reasonable estimate of the amounts and periods in which these remaining liabilities might be paid. It is reasonably possible that the estimate of uncertain tax positions could change materially in the near term.
Off Balance Sheet Arrangements
At December 31, 2007 and 2006, we did not have any relationships with unconsolidated entities or financial partnerships, such as entities often referred to as structured finance or special purpose entities, which would have been established for the purpose of facilitating off-balance sheet arrangements or for other contractually narrow or limited purposes. As such, we are not exposed to any financing, liquidity, market or credit risk that could arise if we had engaged in such relationships.
Critical Accounting Policies and Estimates
Management's discussion and analysis of our financial condition and results of operations is based on the Company's consolidated financial statements that have been prepared in accordance with accounting principles generally accepted in the United States of America.
The preparation of these financial statements requires us to make estimates and judgments that affect the reported amounts of assets, liabilities, equity components, revenues and expenses. We base our estimates on historical experience and various other assumptions that are believed to be reasonable and consistent with industry practice. Actual results may differ from these estimates under different assumptions or conditions. We believe the following critical accounting policies affect our more significant judgments and estimates in the preparation of our consolidated financial statements.
We record reductions to selling prices as products are shipped. These reductions are based on competitive and market conditions, in addition to specific customer contracts in some instances. These reductions are estimated and recorded at the time of shipment either through a reduction to the invoice total or the establishment of an accrual for payment at a later date. The amount accrued may increase or decrease prior to payment due to customer performance and market conditions.
We maintain an allowance for doubtful accounts for estimated losses against our recorded accounts receivable. Such allowance is based on an ongoing review of customer payments against terms and a review of customers' financial statements and conditions through monitoring services. Based on these reviews, additional allowances may be required and are recorded in the appropriate period.
Specific industry market conditions can significantly increase or decrease the level of inventory on hand in any of our business units. We adjust for changes in demand by reducing or increasing production levels. We estimate the required inventory reserves for excess or obsolete inventory by assessing inventory turns and market selling prices on a product by product basis. We maintain such reserves until a product is sold or market conditions require a change in the reserves.
We perform an annual review for impairment of goodwill at the reporting unit level. We also perform an impairment analysis of goodwill whenever circumstances indicate that impairment may have occurred. The impairment tests are performed by determining the fair values of the reporting units using a discounted projected cash flow model and comparing those fair values to the carrying values of the reporting units, including goodwill. If the carrying amount of the reporting unit's goodwill exceeds the implied fair value of that goodwill, an impairment loss is recognized in an amount equal to that excess. Events or changes in circumstances may occur that could create underperformance relative to projected future cash flows, which could create future impairments.
We offer certain warranties with the sale of our products. The warranty obligation is recorded at the point of revenue recognition as a charge to cost of goods sold and as a liability on the balance sheet, and is estimated based upon historic customer claims, supplier performance and new product reliability analysis. Should a change in trend occur in customer claims, an increase or decrease in the warranty liability may be necessary.
We incur expenses in connection with product liability claims as a result of alleged product malfunctions or defects. We maintain insurance for a portion of this exposure and record a liability for our non-insured obligations. We estimate our product liability obligations on a case by case basis, in addition to a review of product performance trends. These estimated obligations may be increased or decreased as more information on specific cases becomes available or performance trends change.
In 2006, we implemented FAS No. 123 (R) under the modified prospective approach. We expect to continue to incur significant stock compensation expense in future periods. Prior to 2006, we accounted for stock-based compensation under FAS No. 123 and provided pro-forma disclosure, but did not expense the majority of our stock-based compensation. Under the modified prospective application method, the results for prior periods have not been restated. None of our outstanding stock awards were modified in anticipation of the adoption of FAS No. 123 (R). We determine the fair value of stock based awards using the Black-Scholes model. We use the simplified method described in SEC Staff Accounting Bulletin No. 107 ("SAB 107") for estimated lives of stock options
BLOUNT INTERNATIONAL, INC.
25
and SARs. Assumptions for the risk-free interest rate, expected volatility and dividend yield are based on historical information and management estimates.
We determine our post-retirement obligations on an actuarial basis that requires management to make certain assumptions. These assumptions include the long-term rate of return on plan assets, the discount rate to be used in calculating the applicable benefit obligation and the anticipated trend in health care costs. These assumptions are reviewed on an annual basis and consideration is given to market conditions, as well as to the requirements of FAS No. 158. The weighted average assumed rate of return on plan assets was 8.5% for 2007, and we anticipate using a lower assumed rate of return in 2008 and beyond, as we have shifted our weighting of investments slightly to a higher proportion of fixed securities and a lower proportion of equities. We believe this assumed rate of return is reasonable, given the asset composition and long-term historic trends. A weighted average discount rate assumption of 5.7% was used to determine ou r plan liabilities at December 31, 2007. We believe this discount rate is reasonable, given comparable rates for high quality corporate bonds with terms comparable to the projected cash flows for our respective plans. We have assumed that health care costs will increase by 10% in 2008, then decline by 1% per year until 5% is reached. Our annual post-retirement expenses can be impacted by changes in these assumptions. A 1% change in the return on assets assumption would change annual pension expense by $1.8 million in 2008. A 1% decrease in the discount rate would increase pension expense by $3.0 million in 2008, and a 1% increase in the discount rate would decrease pension expense by $1.4 million in 2008. A 1% increase in the health care cost trend assumption for 2008 and beyond would increase annual post-retirement medical costs by approximately $0.3 million per year and a 1% decrease in the health care cost trend assumption for 2008 and beyond would decrease annual post-retirement medical costs by approxim ately $0.2 million a year.
Effective January 1, 2007, we account for uncertain tax positions in accordance with FIN No. 48, which clarifies the accounting for uncertainty in income taxes recognized in an enterprise's financial statements in accordance with FASB Statement No. 109, "Accounting for Income Taxes." The application of income tax law is inherently complex. Laws and regulations in this area are voluminous and are often ambiguous. As such, we are required to make many assumptions and judgments regarding our income tax exposures. Interpretations of income tax laws and regulations and guidance surrounding them change over time. Changes in our assumptions and judgments can materially affect amounts recognized in the consolidated financial statements. See Note 8 to the consolidated financial statements for additional information on our uncertain tax positions and the impact of adopting FIN No. 48.
Deferred tax assets and liabilities are recognized for the future tax consequences attributable to differences between the financial statement carrying amounts of assets and liabilities and their respective tax bases. Deferred tax assets and liabilities are measured using enacted tax rates expected to apply to taxable income in the years in which those temporary differences are expected to be recovered or settled. Included in recorded tax liabilities are estimated amounts related to uncertain tax positions. Actual tax liabilities may differ materially from these estimates. The effect on deferred tax assets and liabilities of a change in tax rates is recognized in income in the period that includes the enactment date. Valuation allowances are established when necessary to reduce deferred tax assets to the amounts expected to be realized. As of December 31, 2007, we have a deferred tax asset valuation allowance of $2.3 million, pr imarily related to state tax net operating loss carryforwards.
Recent Accounting Pronouncements
In September 2006, the FASB issued FAS No. 157, "Fair Value Measurements" ("FAS No. 157"). FAS No. 157 defines fair value, establishes a framework for measuring fair value in accordance with accounting principles generally accepted in the U.S., and expands disclosures about fair value measurements. The provisions of FAS No. 157 are effective for the Company's fiscal year beginning January 1, 2008. We are currently evaluating the impact of the provisions of FAS No. 157.
In February 2007, the FASB issued FAS No. 159, "Fair Value Option for Financial Assets and Financial Liabilities—Including an amendment of FASB Statement No. 115" ("FAS No. 159"). FAS No. 159 permits entities to choose to measure many financial instruments and certain other items at fair value. The provisions of FAS No. 159 are effective for us on January 1, 2008. We are currently evaluating the impact of the provisions of FAS No. 159.
In December 2007, the FASB issued FAS No. 141(R), "Business Combinations" ("FAS No. 141(R)"). FAS No. 141(R) replaces FSAS No. 141, Business Combinations and improves the relevance, representational faithfulness and comparability of the information that a reporting entity provides in its financial reports about a business combination and its effects. The provisions of FAS No. 141(R) are effective for us on January 1, 2009. The impact of adopting FAS No. 141(R) will depend on the nature, terms and size of business combinations completed after the effective date.
In December 2007, the FASB issued FAS No. 160, "Noncontrolling Interests in Consolidated Financial Statements" ("FAS No. 160"). FAS No 160 amends Accounting Research Bulletin No. 51, Consolidated Financial Statements, and improves the relevance, comparability, and transparency of the financial information that a reporting entity provides in its consolidated financial statements for those entities that have an outstanding noncontrolling interest in one or more subsidiaries or that deconsolidate a subsidiary. The provisions of FAS No. 160 are effective for us on
BLOUNT INTERNATIONAL, INC.
26
January 1, 2009. Earlier adoption is prohibited. The adoption of FAS No. 160 is not anticipated to have a material impact on our financial position and results of operations.
In December 2007, the SEC issued Staff Accounting Bulletin No. 110 ("SAB 110") which extended the continued use of the simplified method for estimating lives of stock options and SARs. We are continuing to use the simplified method in accounting for our stock-based compensation costs.
Related Party Transactions
In March 2005, we paid $3.2 million to Lehman Brothers, which previously controlled more than 50% of our outstanding common stock, for previously accrued advisory fees relating to the 2004 Refinancing Transactions. In May 2005, Lehman Brothers paid $0.3 million for previously accrued costs we incurred in conjunction with the secondary public offering that occurred in December 2004. In June 2005, as part of a secondary stock offering, we incurred $0.1 million in expenses that were reimbursed by Lehman Brothers in October 2005.
Forward Looking Statements
"Forward looking statements," as defined by the Private Securities Litigation Reform Act of 1995, used in this report, including without limitation our "outlook," "guidance," expectations," "beliefs," "plans," "indications," "estimates," "anticipations," and their variants, are based upon available information and upon assumptions that the Company believes are reasonable; however, these forward looking statements involve certain risks and uncertainties, including those set forth in Item 1A, "Risk Factors", and should not be considered indicative of actual results that the Company may achieve in the future. Specifically, issues concerning foreign currency exchange rates, the cost to the Company of commodities in general, and of steel in particular, the anticipated level of applicable interest rates, tax rates, discount rates and rates of return and the anticipated effects of discontinued operations involve estimates and assumptio ns. To the extent that these, or any other such assumptions, are not realized going forward, or other unforeseen factors arise, actual results for the periods subsequent to the date of this report may differ materially.
ITEM 7A. QUANTITATIVE AND QUALITATIVE DISCLOSURES ABOUT MARKET RISK
Market Risk
We are exposed to market risk from changes in interest rates, foreign currency exchange rates and commodity prices. We manage our exposure to these market risks through our regular operating and financing activities, and, when deemed appropriate, through the use of derivatives. When utilized, derivatives are used as risk management tools and not for trading or speculative purposes. See "Interest Rate Risk and Commodity Price Risk" below for discussion of our expectations regarding future use of interest rate and commodity price derivatives.
Interest Rate Risk. We manage our ratio of fixed to variable rate debt with the objective of achieving a mix that management believes is appropriate. We have, on occasion, entered into interest rate swap agreements to exchange fixed and variable interest rates based on agreed upon notional amounts and we have entered into interest rate lock contracts to hedge the interest rate of an anticipated debt issue. A hypothetical 10% increase in interest rates would decrease the fair value of our fixed rate long-term debt outstanding by $5.6 million. A hypothetical 100 basis point increase in the interest rates on our variable rate long-term debt for the duration of one year would have increased interest expense by approximately $1.8 million in 2007. At December 31, 2007 and 2006, no derivative financial instruments were outstanding to hedge interest rate risk on debt. Additionally, the interest rates available in certain jurisdictions in which we hold excess cash may vary, thereby affecting the return we earn on cash equivalent investments. At December 31, 2007 we had derivative financial instruments outstanding representing variable-to-fixed interest rate swaps on cash equivalents in Brazil to protect the return on those investments. These contracts were not designated as hedging instruments. At December 31, 2006 no derivative financial instruments were outstanding related to interest rate risk on investments.
Foreign Currency Exchange Risk. Approximately 35% of our sales and 50% of our operating costs and expenses were transacted in foreign currencies in 2007. As a result, fluctuations in exchange rates impact the amount of our reported sales and operating income. Historically, our principal exposures have been related to local currency operating costs and expenses in Canada and Brazil, and local currency sales and expenses in Europe. In 2007, we used derivative instruments to protect the U.S. Dollar value of cash equivalents held in Brazil. At December 31, 2007 we had contracts outstanding to protect those investments from fluctuations in foreign currency. We may, in the future, decide to manage some of our exposure to currency exchange rate fluctuations through derivative products. The table below illustrates the estimated effect of a hypothetical immedi ate 10% change in major currencies (defined for us as the Euro, Canadian Dollar and Brazilian Real):
| | | Effect of 10% Weaker U.S. Dollar | |
| (Amounts in thousands) | | Sales | | Cost of
Sales | | Operating
Income | |
| Euro | | $ | 4,311 | | | $ | (1,592 | ) | | $ | 1,728 | | |
| Canadian Dollar | | | 1,313 | | | | (6,936 | ) | | | (5,988 | ) | |
| Brazilian Real | | | – | | | | (1,946 | ) | | | (2,310 | ) | |
BLOUNT INTERNATIONAL, INC.
27
Commodity Price Risk. We secure raw materials through purchasing functions at each of our manufacturing locations. These functions are staffed by professionals who determine the sourcing of materials by assessing quality, availability, price and service of potential vendors. When possible, multiple vendors are utilized to ensure competitive prices and to minimize risk of lack of availability of materials. Some of these raw materials are subject to price volatility over time. We have not hedged against the price volatility of any raw materials by using any derivative instruments during 2007, 2006 or 2005.
Raw material price volatility has not had a significant impact on our results in recent years, with the exception of steel pricing, where prices rose sharply in 2004 and 2005, declined somewhat in 2006 and rose somewhat in 2007. We purchased approximately $63.4 million of steel in 2007, our largest sourced commodity. A hypothetical immediate 10% change in the price of steel would have had an estimated $6.3 million effect on pre-tax income in 2007. We utilize multiple suppliers to purchase steel. We estimate the impact of price changes on our cost of purchased steel would have been a decrease of $1.3 million from 2005 to 2006, followed by an increase of $1.0 million from 2006 to 2007. Partially to offset the net cost increase, some selling prices to our customers have been increased. We source many of our outdoor care products from Asia through brokers, and we anticipate expanding this practice in the future. For example, we beli eve that we can source certain components for gear-related products at a lower cost from international locations. Historically, we have not incurred any significant issues in sourcing internationally, in part due to the fact that there are multiple suppliers for each of the products we purchase.
ITEM 8. FINANCIAL STATEMENTS AND SUPPLEMENTARY DATA
Management of Blount International, Inc. is responsible for the information and representations contained in this report. The financial statements have been prepared in conformity with generally accepted accounting principles. Reasonable judgments and estimates have been made where necessary. Other financial information in this report is consistent with these financial statements.
Our accounting systems include controls designed to reasonably assure that assets are safeguarded from unauthorized use or disposition and that provide for the preparation of financial statements in conformity with generally accepted accounting principles. These systems are supplemented by the selection and training of qualified financial personnel and an organizational structure providing for appropriate segregation of duties.
Four directors of the Company, who are not members of management, serve as the Audit Committee of the Board of Directors and are the principal means through which the Board discharges its financial reporting responsibility. The Audit Committee is responsible for the appointment of the independent registered public accounting firm and reviews with the independent registered public accounting firm, management and the internal auditors, the scope and the results of the annual audit, the effectiveness of our internal controls over financial reporting, disclosure controls and procedures and other matters relating to financial reporting and the financial affairs of Blount International, Inc. as they deem appropriate. The independent registered public accounting firm and the internal auditors have full access to the Committee, with and without the presence of management, to discuss any appropriate matters.
BLOUNT INTERNATIONAL, INC.
28
Management's Report on Internal Controls Over Financial Reporting
Management is responsible for establishing and maintaining adequate internal control over financial reporting, as such term is defined in Securities Exchange Act Rules 13a -15(f). Under the supervision and with the participation of our Chief Executive Officer and Chief Financial Officer, our management conducted an evaluation of the effectiveness of our internal control over financial reporting based upon the criteria set forth in Internal Control—Integrated Framework issued by the Committee of Sponsoring Organizations of the Treadway Commission. Based on that evaluation, our management concluded that our internal control over financial reporting was effective as of December 31, 2007.
Internal control over financial reporting cannot provide absolute assurance of achieving financial reporting objectives because of their inherent limitations. Internal control over financial reporting is a process that involves human diligence and compliance and is subject to lapses in judgment and breakdowns resulting from human failures. Internal control over financial reporting also can be circumvented by collusion or improper management override. Because of such limitations, there is a risk that material misstatements may not be prevented or detected on a timely basis by internal control over financial reporting. However, these inherent limitations are known features of the financial reporting process. Therefore, it is possible to design into the process safeguards to reduce, though not eliminate, this risk.
PricewaterhouseCoopers LLP, an independent registered public accounting firm that has audited the consolidated financial statements, has also audited the effectiveness of our internal control over financial reporting as of December 31, 2007 as stated in their report which appears herein.
/s/ James S. Osterman
Chairman and
Chief Executive Officer | | /s/ Calvin E. Jenness
Senior Vice President and
Chief Financial Officer | |
|
BLOUNT INTERNATIONAL, INC.
29
REPORT OF INDEPENDENT REGISTERED PUBLIC ACCOUNTING FIRM
To the Board of Directors and Stockholders of Blount International, Inc.:
In our opinion, the consolidated financial statements listed in the index appearing under Item 15(a)(1) present fairly, in all material respects, the financial position of Blount International Inc. and its subsidiaries at December 31, 2007 and December 31, 2006, and the results of their operations and their cash flows for each of the three years in the period ended December 31, 2007 in conformity with accounting principles generally accepted in the United States of America. In addition, in our opinion, the financial statement schedules listed in the index appearing under Item 15(a)(2) present fairly, in all material respects, the information set forth therein when read in conjunction with the related consolidated financial statements. Also in our opinion, the Company maintained, in all m aterial respects, effective internal control over financial reporting as of December 31, 2007, based on criteria established in Internal Control—Integrated Framework issued by the Committee of Sponsoring Organizations of the Treadway Commission (COSO). The Company's management is responsible for these financial statements and financial statement schedules, for maintaining effective internal control over financial reporting and for its assessment of the effectiveness of internal control over financial reporting, included in the accompanying Management's Report on Internal Control over Financial Reporting. Our responsibility is to express opinions on these financial statements, on the financial statement schedules, and on the Company's internal control over financial reporting based on our integrated audits. We conducted our audits in accordance with the st andards of the Public Company Accounting Oversight Board (United States). Those standards require that we plan and perform the audits to obtain reasonable assurance about whether the financial statements are free of material misstatement and whether effective internal control over financial reporting was maintained in all material respects. Our audits of the financial statements included examining, on a test basis, evidence supporting the amounts and disclosures in the financial statements, assessing the accounting principles used and significant estimates made by management, and evaluating the overall financial statement presentation. Our audit of internal control over financial reporting included obtaining an understanding of internal control over financial reporting, assessing the risk that a material weakness exists, and testing and evaluating the design and operating effectiveness of internal control based on the assessed risk. Our audits also included performing such other procedures as we considered n ecessary in the circumstances. We believe that our audits provide a reasonable basis for our opinions.
As discussed in Note 13 to the consolidated financial statements, the Company changed the manner in which it accounts for stock-based compensation in 2006. As discussed in Notes 9 and 10 to the consolidated financial statements, the Company changed the manner in which it accounts for defined benefit pension and other post-retirement benefit plans as of December 31, 2006. As discussed in Note 1 to the consolidated financial statements, the Company changed the manner in which it accounts for uncertain tax positions as of January 1, 2007.
A company's internal control over financial reporting is a process designed to provide reasonable assurance regarding the reliability of financial reporting and the preparation of financial statements for external purposes in accordance with generally accepted accounting principles. A company's internal control over financial reporting includes those policies and procedures that (i) pertain to the maintenance of records that, in reasonable detail, accurately and fairly reflect the transactions and dispositions of the assets of the company; (ii) provide reasonable assurance that transactions are recorded as necessary to permit preparation of financial statements in accordance with generally accepted accounting principles, and that receipts and expenditures of the company are being made only in accordance with authorizations of management and directors of the company; and (iii) provide reasonable assurance regarding prevention or timely detection of unauthorized acquisition, use, or disposition of the company's assets that could have a material effect on the financial statements.
Because of its inherent limitations, internal control over financial reporting may not prevent or detect misstatements. Also, projections of any evaluation of effectiveness to future periods are subject to the risk that controls may become inadequate because of changes in conditions, or that the degree of compliance with the policies or procedures may deteriorate.
/s/ PricewaterhouseCoopers LLP
Portland, Oregon
March 12, 2008
BLOUNT INTERNATIONAL, INC.
30
CONSOLIDATED STATEMENTS OF INCOME
Blount International, Inc. and Subsidiaries
| | | Year Ended December 31, | |
| (Amounts in thousands, except per share data) | | 2007 | | 2006 | | 2005 | |
| Sales | | $ | 515,535 | | | $ | 487,494 | | | $ | 478,829 | | |
| Cost of sales | | | 340,578 | | | | 313,815 | | | | 297,747 | | |
| Gross profit | | | 174,957 | | | | 173,679 | | | | 181,082 | | |
| Selling, general and administrative expenses | | | 94,257 | | | | 89,472 | | | | 89,454 | | |
| Retirement plan redesign | | | – | | | | 3,747 | | | | – | | |
| Operating income | | | 80,700 | | | | 80,460 | | | | 91,628 | | |
| Interest income | | | 1,360 | | | | 378 | | | | 622 | | |
| Interest expense | | | (33,066 | ) | | | (35,782 | ) | | | (37,329 | ) | |
| Other income (expense), net | | | (821 | ) | | | 1,335 | | | | (963 | ) | |
| Income from continuing operations before income taxes | | | 48,173 | | | | 46,391 | | | | 53,958 | | |
| Provision (benefit) for income taxes | | | 16,030 | | | | 13,746 | | | | (34,256 | ) | |
| Income from continuing operations | | | 32,143 | | | | 32,645 | | | | 88,214 | | |
| Discontinued operations: | |
| Income before taxes from discontinued operations | | | 25,794 | | | | 20,055 | | | | 29,319 | | |
| Income tax provision | | | 15,080 | | | | 10,154 | | | | 10,918 | | |
| Income from discontinued operations | | | 10,714 | | | | 9,901 | | | | 18,401 | | |
| Net income | | $ | 42,857 | | | $ | 42,546 | | | $ | 106,615 | | |
| Basic income per share: | |
| Continuing operations | | $ | 0.68 | | | $ | 0.69 | | | $ | 1.91 | | |
| Discontinued operations | | | 0.23 | | | | 0.21 | | | | 0.40 | | |
| Net income | | $ | 0.91 | | | $ | 0.90 | | | $ | 2.31 | | |
| Diluted income per share: | |
| Continuing operations | | $ | 0.67 | | | $ | 0.68 | | | $ | 1.86 | | |
| Discontinued operations | | | 0.22 | | | | 0.21 | | | | 0.38 | | |
| Net income | | $ | 0.89 | | | $ | 0.89 | | | $ | 2.24 | | |
| Weighted average shares used in per share calculation: | |
| Basic | | | 47,280 | | | | 47,145 | | | | 46,094 | | |
| Diluted | | | 48,078 | | | | 47,868 | | | | 47,535 | | |
The accompanying notes are an integral part of these consolidated financial statements.
BLOUNT INTERNATIONAL, INC.
31
CONSOLIDATED BALANCE SHEETS
Blount International, Inc. and Subsidiaries
| | | December 31, | |
| (Amounts in thousands, except share and per share data) | | 2007 | | 2006 | |
| Assets | |
| Current assets: | |
| Cash and cash equivalents | | $ | 57,589 | | | $ | 27,636 | | |
| Accounts receivable, net of allowance for doubtful accounts of $2,181 and $2,545 respectively | | | 67,818 | | | | 82,748 | | |
| Inventories, net | | | 70,273 | | | | 77,833 | | |
| Deferred income taxes | | | 5,536 | | | | 20,122 | | |
| Other current assets | | | 16,393 | | | | 8,342 | | |
| Total current assets | | | 217,609 | | | | 216,681 | | |
| Property, plant and equipment, net | | | 89,729 | | | | 99,665 | | |
| Goodwill | | | 48,984 | | | | 71,892 | | |
| Deferred financing costs | | | 10,698 | | | | 14,574 | | |
| Deferred income taxes | | | 14,849 | | | | 17,318 | | |
| Assets held for sale | | | – | | | | 2,700 | | |
| Other assets | | | 30,080 | | | | 7,636 | | |
| Total Assets | | $ | 411,949 | | | $ | 430,466 | | |
| Liabilities and Stockholders' Deficit | |
| Current liabilities: | |
| Current maturities of long-term debt | | $ | 1,242 | | | $ | 1,500 | | |
| Accounts payable | | | 29,799 | | | | 34,982 | | |
| Accrued expenses | | | 57,447 | | | | 62,140 | | |
| Deferred income taxes | | | 533 | | | | 197 | | |
| Total current liabilities | | | 89,021 | | | | 98,819 | | |
| Long-term debt, excluding current maturities | | | 295,758 | | | | 349,375 | | |
| Deferred income taxes | | | – | | | | 791 | | |
| Employee benefit obligations | | | 48,948 | | | | 71,724 | | |
| Other liabilities | | | 32,368 | | | | 15,048 | | |
| Total liabilities | | | 466,095 | | | | 535,757 | | |
| Commitments and contingent liabilities | |
| Stockholders' equity (deficit): | |
Common stock: par value $0.01 per share, 100,000,000 shares authorized,
47,291,647 and 47,242,925 outstanding, respectively | | | 473 | | | | 472 | | |
| Capital in excess of par value of stock | | | 575,595 | | | | 571,683 | | |
| Accumulated deficit | | | (618,147 | ) | | | (661,004 | ) | |
| Accumulated other comprehensive loss | | | (12,067 | ) | | | (16,442 | ) | |
| Total stockholders' (deficit) | | | (54,146 | ) | | | (105,291 | ) | |
| Total Liabilities and Stockholders' Deficit | | $ | 411,949 | | | $ | 430,466 | | |
The accompanying notes are an integral part of these consolidated financial statements.
BLOUNT INTERNATIONAL, INC.
32
CONSOLIDATED STATEMENTS OF CASH FLOWS
Blount International, Inc. and Subsidiaries
| | | Year Ended December 31, | |
| (Amounts in thousands) | | 2007 | | 2006 | | 2005 | |
| Cash flows from operating activities: | |
| Income from continuing operations | | $ | 32,143 | | | $ | 32,645 | | | $ | 88,214 | | |
Adjustments to reconcile income from continuing operations to net
cash provided by operating activities: | |
| Early extinguishment of debt | | | 625 | | | | 1 | | | | 2,994 | | |
| Depreciation of property, plant and equipment | | | 17,641 | | | | 15,058 | | | | 13,184 | | |
| Amortization, stock compensation and other non-cash charges | | | 7,174 | | | | 9,536 | | | | 3,527 | | |
| Excess tax benefit from share-based compensation | | | (114 | ) | | | (747 | ) | | | – | | |
| Deferred income taxes | | | 11,059 | | | | 13,025 | | | | (35,254 | ) | |
| Loss (gain) on disposal of property, plant, and equipment | | | 675 | | | | (774 | ) | | | (352 | ) | |
| Changes in assets and liabilities: | |
| (Increase) decrease in accounts receivable | | | 3,621 | | | | 1,526 | | | | (17,247 | ) | |
| (Increase) decrease in inventories | | | (13,331 | ) | | | 2,940 | | | | (4,713 | ) | |
| (Increase) decrease in other assets | | | (3,635 | ) | | | (3,720 | ) | | | (4,861 | ) | |
| Increase (decrease) in accounts payable | | | 4,696 | | | | 2,637 | | | | 1,074 | | |
| Increase (decrease) in accrued expenses | | | (7,445 | ) | | | (7,022 | ) | | | (10,293 | ) | |
| Increase (decrease) in other liabilities | | | (16,559 | ) | | | (9,434 | ) | | | (6,451 | ) | |
| Discontinued operations | | | (5,209 | ) | | | 4,345 | | | | 35,290 | | |
| Net cash provided by operating activities | | | 31,341 | | | | 60,016 | | | | 65,112 | | |
| Cash flows from investing activities: | |
| Proceeds from sale of property, plant and equipment | | | 2,309 | | | | 1,244 | | | | 382 | | |
| Purchases of property, plant and equipment | | | (18,517 | ) | | | (21,653 | ) | | | (17,307 | ) | |
| Discontinued operations | | | 69,071 | | | | 30,900 | | | | (2,022 | ) | |
| Net cash provided by (used in) investing activities | | | 52,863 | | | | 10,491 | | | | (18,947 | ) | |
| Cash flows from financing activities: | |
| Net borrowings (repayments) under revolving credit facility | | | (27,000 | ) | | | 27,000 | | | | – | | |
| Repayment of term debt principal | | | (26,875 | ) | | | (83,848 | ) | | | (86,488 | ) | |
| Issuance costs related to debt | | | (700 | ) | | | (700 | ) | | | (2,554 | ) | |
| Issuance costs related to stock | | | – | | | | – | | | | (1,425 | ) | |
| Proceeds from issuance of stock | | | – | | | | – | | | | 6,123 | | |
| Purchase of treasury stock | | | – | | | | – | | | | (6,123 | ) | |
| Excess tax benefit from share-based compensation | | | 114 | | | | 747 | | | | – | | |
| Proceeds from exercise of stock options and warrants | | | 210 | | | | 993 | | | | 8,669 | | |
| Net cash used in financing activities | | | (54,251 | ) | | | (55,808 | ) | | | (81,798 | ) | |
| Net increase (decrease) in cash and cash equivalents | | | 29,953 | | | | 14,699 | | | | (35,633 | ) | |
| Cash and cash equivalents at beginning of year | | | 27,636 | | | | 12,937 | | | | 48,570 | | |
| Cash and cash equivalents at end of year | | $ | 57,589 | | | $ | 27,636 | | | $ | 12,937 | | |
The accompanying notes are an integral part of these consolidated financial statements.
BLOUNT INTERNATIONAL, INC.
33
CONSOLIDATED STATEMENTS OF CHANGES IN STOCKHOLDERS' EQUITY (DEFICIT)
Blount International, Inc. and Subsidiaries
| (Amounts in thousands) | | Shares
(in 000's) | | Common
Stock | | Capital in
Excess
of Par | | Accumulated
Deficit | | Accumulated
Other
Comprehensive
Income (Loss) | | Total | |
| Balance December 31, 2004 | | | 44,970 | | | $ | 450 | | | $ | 553,640 | | | $ | (810,165 | ) | | $ | (79 | ) | | $ | (256,154 | ) | |
| Net income | | | – | | | | – | | | | – | | | | 106,615 | | | | – | | | | 106,615 | | |
| Other comprehensive income (loss): | |
| Foreign currency translation adjustment | | | – | | | | – | | | | – | | | | – | | | | (2,609 | ) | | | (2,609 | ) | |
| Unrealized losses | | | – | | | | – | | | | – | | | | – | | | | (70 | ) | | | (70 | ) | |
| Minimum pension liability adjustment | | | – | | | | – | | | | – | | | | – | | | | (6,041 | ) | | | (6,041 | ) | |
| Comprehensive income, net | | | – | | | | – | | | | – | | | | – | | | | – | | | | 97,895 | | |
| Issuance of common stock | | | 382 | | | | 4 | | | | 6,119 | | | | – | | | | – | | | | 6,123 | | |
| Purchase of treasury stock | | | (382 | ) | | | (4 | ) | | | (6,119 | ) | | | – | | | | – | | | | (6,123 | ) | |
| Exercise of stock options | | | 1,034 | | | | 10 | | | | 12,984 | | | | – | | | | – | | | | 12,994 | | |
| Exercise of stock warrants | | | 1,000 | | | | 10 | | | | – | | | | – | | | | – | | | | 10 | | |
| Stock compensation expense | | | – | | | | – | | | | 68 | | | | – | | | | – | | | | 68 | | |
| Balance December 31, 2005 | | | 47,004 | | | | 470 | | | | 566,692 | | | | (703,550 | ) | | | (8,799 | ) | | | (145,187 | ) | |
| Net income | | | – | | | | – | | | | – | | | | 42,546 | | | | – | | | | 42,546 | | |
| Other comprehensive income (loss): | |
| Foreign currency translation adjustment | | | – | | | | – | | | | – | | | | – | | | | 1,682 | | | | 1,682 | | |
| Unrealized losses | | | – | | | | – | | | | – | | | | – | | | | (27 | ) | | | (27 | ) | |
| Minimum pension liability adjustment | | | – | | | | – | | | | – | | | | – | | | | 2,957 | | | | 2,957 | | |
| Comprehensive income, net | | | – | | | | – | | | | – | | | | – | | | | – | | | | 47,158 | | |
| Cumulative effect of adopting FAS No. 158 | | | – | | | | – | | | | – | | | | – | | | | (12,255 | ) | | | (12,255 | ) | |
| Exercise of stock options | | | 239 | | | | 2 | | | | 1,738 | | | | – | | | | – | | | | 1,740 | | |
| Stock compensation expense | | | – | | | | – | | | | 3,253 | | | | – | | | | – | | | | 3,253 | | |
| Balance December 31, 2006 | | | 47,243 | | | | 472 | | | | 571,683 | | | | (661,004 | ) | | | (16,442 | ) | | | (105,291 | ) | |
| Net income | | | – | | | | – | | | | – | | | | 42,857 | | | | – | | | | 42,857 | | |
| Other comprehensive income (loss): | |
| Foreign currency translation adjustment | | | – | | | | – | | | | – | | | | – | | | | 1,718 | | | | 1,718 | | |
| Unrealized gains | | | – | | | | – | | | | – | | | | – | | | | 1,315 | | | | 1,315 | | |
| Pension liability adjustment | | | – | | | | – | | | | – | | | | – | | | | 1,342 | | | | 1,342 | | |
| Comprehensive income, net | | | – | | | | – | | | | – | | | | – | | | | – | | | | 47,232 | | |
| Exercise of stock options | | | 49 | | | | 1 | | | | 323 | | | | – | | | | – | | | | 324 | | |
| Stock compensation expense | | | – | | | | – | | | | 3,589 | | | | – | | | | – | | | | 3,589 | | |
| Balance December 31, 2007 | | | 47,292 | | | $ | 473 | | | $ | 575,595 | | | $ | (618,147 | ) | | $ | (12,067 | ) | | $ | (54,146 | ) | |
The accompanying notes are an integral part of these consolidated financial statements.
BLOUNT INTERNATIONAL, INC.
34
NOTES TO CONSOLIDATED FINANCIAL STATEMENTS
Blount International, Inc. and Subsidiaries
NOTE 1: BUSINESS AND SUMMARY OF SIGNIFICANT ACCOUNTING POLICIES
Business. Headquartered in Portland, Oregon, Blount International, Inc. and its subsidiaries (the "Company") is a manufacturer of equipment, accessories and replacement parts to the global forestry, yard care and general contractor industries. The Company manufactures and markets branded products in focused end markets, serving professional loggers, construction workers, homeowners, equipment dealers and distributors and original equipment manufacturers ("OEMs"). The Company's products include cutting chain, guide bars, sprockets and accessories for chainsaws, accessories for lawn and garden equipment, concrete-cutting equipment and accessories, mobile equipment rotational bearings, worm gear reducers and swing drives. The Company maintains manufacturing facilities in the U.S., Canada, Brazil and The People's Republic of China.
Basis of Presentation. In the opinion of management, the consolidated financial statements contain all adjustments (consisting of only normal recurring adjustments) necessary to present fairly the financial position at December 31, 2007 and 2006, and the results of operations and cash flows for each of the three years in the period ended December 31, 2007.
Consolidation. The consolidated financial statements include the accounts of the Company and its subsidiaries and are prepared in conformity with accounting principles generally accepted in the United States of America. All significant intercompany balances and transactions have been eliminated.
Foreign Currency. For foreign subsidiaries whose operations are principally conducted in U.S. Dollars, monetary assets and liabilities are translated into U.S. Dollars at the current exchange rate, while other assets (principally property, plant and equipment and inventories) and related costs and expenses are generally translated at historic exchange rates. Sales and other costs and expenses are translated at the average exchange rate for the period and the resulting foreign exchange adjustments are recognized in income. Assets and liabilities of the remaining foreign operations are translated to U.S. Dollars at the current exchange rate and their statements of income are translated at the average exchange rate for the period. Gains and losses resulting from translation of the financial statements of these operations are reflected as "other comprehen sive income" in stockholders' equity (deficit). Foreign exchange adjustments to pretax income were not material in 2007, 2006 and 2005.
Use of Estimates. The preparation of financial statements in conformity with generally accepted accounting principles requires management to make estimates and assumptions that affect the reported amounts of assets, liabilities and the components of equity and the disclosure of contingent assets and liabilities at the dates of the financial statements, as well as the reported amounts of revenues and expenses during the reporting periods. Estimates are used when accounting for the allowance for doubtful accounts, inventory obsolescence, goodwill and other long-lived assets, product warranties, casualty insurance costs, product liability reserves and related expenses, other legal proceedings, employee benefit plans, income taxes and deferred tax assets and liabilities, discontinued operations and contingencies. It is reasonably possible that actual resu lts could differ materially from those estimates and assumptions and significant changes to estimates could occur in the near term.
Cash and Cash Equivalents. The Company considers cash equivalents to be all highly liquid temporary cash investments that are readily convertible to known amounts of cash and present minimal risk of changes in value because of changes in interest rates.
Inventories. Inventories are valued at the lower of cost or market. The Company determines the cost of most raw materials, work in process and finished goods inventories by the first in, first out ("FIFO") or average cost methods. The Company writes down its inventories for estimated obsolete or unmarketable inventory equal to the difference between the cost of inventory and the estimated market value based upon assumptions about future demand and market conditions.
Property, Plant and Equipment. Property, plant and equipment is stated at cost and is depreciated on the straight-line method over the estimated useful lives of the individual assets. The principal ranges of estimated useful lives for depreciation purposes are as follows: buildings and improvements: 10 to 45 years; machinery and equipment: 3 to 10 years; furniture, fixtures and office equipment: 3 to 10 years; software: 3 to 5 years; and transportation equipment: 3 to 15 years. Gains or losses on disposal are reflected in income. Property, plant and equipment under capital lease is capitalized with the related obligations stated at the principal portion of future lease payments.
Interest cost incurred during the period of construction of plant and equipment is capitalized. No material amounts of interest were capitalized on plant and equipment during the three years ended December 31, 2007.
Goodwill. The Company accounts for goodwill under Statement of Financial Accounting Standards ("FAS") No. 142, "Goodwill and other Intangible Assets" ("FAS No. 142"). Under the provisions of FAS No. 142, the Company performs an annual review for impairment at the
BLOUNT INTERNATIONAL, INC.
35
reporting unit level. The Company also performs an impairment analysis whenever circumstances indicate that an impairment may have occurred. The impairment tests are performed by determining the fair values of the reporting units using a discounted cash flow model and comparing those fair values to the carrying values of the reporting units, including goodwill. If the fair value of a reporting unit is less than its carrying value, the Company then allocates the fair value of the unit to all the assets and liabilities of that unit, including any unrecognized intangible assets, as if the reporting unit's fair value was the price to acquire the reporting unit. The excess of the fair value of the reporting unit over the amounts assigned to its assets and liabilities is the implied fair value of the goodwill. If the carrying amount of the reporting unit's goodwill exceeds the implied fair value of that goodwill, an impairment loss is recognized in an amount equal to that excess. Events or changes in circumstances may occur that could create underperformance relative to projected future cash flows that would create future impairments. No goodwill impairments have been recognized in 2007, 2006 or 2005.
Deferred Financing Costs. The Company capitalizes costs incurred in connection with borrowings or establishment of credit facilities. These costs are amortized as an adjustment to interest expense over the life of the borrowing or life of the credit facility using the straight line method. In the case of early debt principal repayments, the Company adjusts the value of the corresponding deferred financing costs with a charge to other expense, and similarly adjusts the future amortization expense.
Impairment of Long-Lived Assets. The Company evaluates the carrying value of long-lived assets to be held and used, including finite lived intangible assets, whenever events or changes in circumstances indicate that the carrying value may not be recoverable. The carrying value of a long-lived asset is considered impaired when the total projected undiscounted cash flows from such asset are separately identifiable and are less than its carrying value. In that event, a loss is recognized based on the amount by which the carrying value exceeds the fair value of the long-lived asset. Fair value is determined primarily using the projected cash flows discounted at a rate commensurate with the risk involved. Losses on long-lived assets to be disposed of are determined in a similar manner, except that fair values are reduced for disposal costs. During 2006, th e Company recognized an impairment charge of $1.5 million on property, plant and equipment formerly used by its discontinued Lawnmower segment. Also in 2006, the Company recognized an impairment charge of $0.8 million on property, plant and equipment in Menominee, Michigan formerly used by its Industrial and Power Equipment Segment.
Income Taxes. In accordance with FAS No. 109, deferred tax assets and liabilities are recognized for the future tax consequences attributable to differences between the financial statement carrying amounts of assets and liabilities and their respective tax bases. Included in recorded tax liabilities are estimated amounts related to uncertain tax positions. Actual tax liabilities may differ materially from these estimates. Deferred tax assets and liabilities are measured using enacted tax rates expected to apply to taxable income in the years in which those temporary differences are expected to be recovered or settled. The effect on deferred tax assets and liabilities of a change in tax rates is recognized in income in the period that includes the enactment date. Valuation allowances are established when necessary to reduce deferred tax assets to the a mounts expected to be realized. The American Jobs Creation Act of 2004 includes a deduction of up to 9 percent (when fully phased-in) of "qualified production activities income," as defined in the new law and subject to certain limitations. The benefit of this new deduction, if any, will be accounted for as a special deduction when realized in accordance with Financial Accounting Standards Board ("FASB") Staff Position No. 109-1.
Effective January 1, 2007, the Company adopted Financial Accounting Standards Board ("FASB") Interpretation No. 48, "Accounting for Uncertainty in Income Taxes" ("FIN No. 48"). There was no material adjustment to the net liability for uncertain tax positions as a result of the adoption of FIN No. 48 on January 1, 2007. However, uncertain tax positions that were previously netted on the balance sheet are reported separately since January 1, 2007. The Company recognizes interest and penalties related to uncertain tax positions as income tax expense. FIN No. 48 prescribes a recognition threshold and measurement attribute for the financial statement recognition and measurement of a tax position taken or expected to be taken in a tax return. It also provides guidance on de-recognition, classification, interest and penalties, accounting in interim periods, disclosure and transition.
Product Liability. The Company monitors claims that relate to the alleged malfunction or defects of its products that may result in an injury to the equipment operator or others. The Company records an accrued liability and charge to cost of sales for its estimated obligation as claims are incurred and evaluated. The accrual may increase or decrease as additional information regarding claims is developed.
Insurance Accruals. It is the Company's policy to retain a portion of expected losses related to general and product liability, workers' compensation and vehicle liability losses through retentions or deductibles under its risk management and insurance programs. Provisions for losses expected under these programs are recorded based
BLOUNT INTERNATIONAL, INC.
36
on estimates of the undiscounted aggregate liabilities for claims incurred.
Warranty. The Company offers certain warranties with the sale of its products. An estimate of warranty costs is recognized at the time the related revenue is recognized and the warranty obligation is recorded as a charge to cost of sales and as a liability on the balance sheet. Warranty cost is estimated using historical customer claims, supplier performance and new product performance. Should a change in trend occur in customer claims or supplier and new product performance, an increase or decrease in the warranty liability may be necessary.
Guarantees. The Company accounts for the initial recognition and measurement of guarantees in accordance with FASB Interpretation No. 45 "Guarantor's Accounting and Disclosure Requirements for Guarantees, Including Indirect Guarantees of Indebtedness of Others" ("FIN 45"). Under the provisions of FIN 45, at the time a guarantee is issued, the Company recognizes an initial liability for the fair value or market value of the obligation it assumes.
Derivative Financial Instruments. The Company accounts for derivative financial instruments in accordance with FAS No. 133, as amended by FAS 138 and FAS 149, "Accounting for Derivative Instruments and Hedging Activities". The Company's earnings and cash flows are subject to fluctuations due to changes in foreign currency exchange rates, interest rates and commodity prices. The Company's risk management policy allows for the use of derivative financial instruments to manage foreign currency exchange rate, interest rate, and commodity price exposures prudently. The policy specifies that derivatives are not to be used for speculative purposes. Derivatives that are used are primarily foreign currency and interest rate swaps. All derivatives are recognized on the Consolidated Balance Sheets at their fair value. All derivative contracts held at December 31 , 2007 were non-hedging instruments (see also Note 17). There were no material derivative contracts held as of December 31, 2006. Changes in the fair value of non-hedging derivative instruments are reported in current earnings. Cash flows from non-hedging derivative financial instruments are included in the investing category on the Consolidated Statement of Cash Flows.
Revenue Recognition. Revenue is recognized when persuasive evidence that a sales arrangement exists, title and risk of loss have passed, the price to the customer is fixed or determinable and collectibility is reasonably assured, which has historically been upon the date of shipment of product for the majority of the Company's sales transactions. There are an insignificant amount of shipments with FOB destination terms, for which revenue is not recognized until delivery has occurred.
Shipping and Handling Costs. The Company incurs expenses for the shipment of goods to customers. These expenses are recognized in the period in which they occur and are classified as gross revenues if billed and cost of goods sold if incurred by the Company in accordance with the Emerging Issues Task Force's Issue (EITF) 00-10, "Accounting for Shipping and Handling Fees and Costs".
Sales Incentives. The Company provides various sales incentives to customers in the form of coupons, rebates, discounts, free product and advertising allowances. The estimated cost of such expenses is recorded at the time of revenue recognition and recorded as a reduction to revenue, with the exception that free product is recorded as cost of sales, in accordance with Emerging Issues Task Force ("EITF") 01-9, "Accounting for Consideration Given by a Vendor to a Customer".
Advertising. Advertising costs are expensed as incurred, except for cooperative advertising, which is accrued over the period the revenues are recognized, and sales materials, such as brochures and catalogs, which are accounted for as prepaid supplies and expensed over the period used. Advertising costs from continuing operations were $5.0 million, $4.7 million and $4.5 million for 2007, 2006 and 2005, respectively.
Research and Development. Expenditures for research and development are expensed as incurred and include costs of direct labor, indirect labor, materials and outside services. These costs were $6.5 million, $6.6 million and $6.2 million for 2007, 2006, and 2005, respectively.
Reclassifications. Certain amounts in the prior years' financial statements have been reclassified to conform to the current year presentation. Such reclassifications had no impact on previously reported net income or net stockholders' equity (deficit).
NOTE 2: DISCONTINUED OPERATIONS
Discontinued Forestry Division. On November 5, 2007, we sold our Forestry Division, which constituted the majority of our Industrial and Power Equipment segment, to Caterpillar Forest Products Inc., a subsidiary of Caterpillar Inc., for gross proceeds of $79.1 million. Under the terms of the related purchase agreement, $8.8 million of the gross proceeds are initially held in escrow for up to three years from the transaction date. We recognized a pretax gain of $26.0 million net of related transaction expenses on the sale in 2007. This division accounted for 32% of our 2005 consolidated sales, 26% of our 2006 consolidated sales and 21% of our consolidated sales for the first nine months of 2007. The Forestry Division is reported as discontinued operations for all periods presented. This division was headquartered in Zebulon, North Carolina and manufact ured and marketed timber harvesting and handling equipment and industrial tractors and loaders. The division had manufacturing facilities in Owatonna, Minnesota; Prentice, Wisconsin; and Söderhamn, Sweden. The sale included the
BLOUNT INTERNATIONAL, INC.
37
disposition of the Forestry Division's recorded goodwill in the amount of $22.9 million. The Company retained certain liabilities related to the business, as well as an idle manufacturing facility located in Menominee, Michigan. In December 2007, the land and building in Menominee, Michigan were sold for net cash proceeds of $0.5 million.
Discontinued Lawnmower Segment. On July 27, 2006, the Company sold certain of the assets and liabilities of Dixon Industries, Inc. ("Dixon") to Husqvarna Professional Outdoor Products, Inc. ("Husqvarna"), a wholly-owned subsidiary of Husqvarna AB (Sweden). Dixon had previously been reported as the Company's Lawnmower Segment. The Company received gross proceeds of $33.1 million and recognized a pretax gain of $17.4 million net of related transaction expenses on the sale in 2006. The Lawnmower Segment is reported as discontinued operations for all periods presented. Dixon was located in Coffeyville, Kansas, and manufactured zero-turn radius riding lawnmowers and related attachments. The sale included the disposition of Dixon's recorded goodwill in the amount of $5.0 million. Certain liabilities of Dixon, as well as the land, building, building improvem ents, certain machinery and equipment and various other assets related to its Coffeyville, Kansas facility, were retained by the Company by merger of Dixon with and into 4520 Corp. Inc., an indirect wholly-owned subsidiary of the Company. The net property, plant and equipment associated with the discontinued operations of Dixon were carried at their estimated fair value and included in assets held for sale in the consolidated balance sheet as of December 31, 2006. The land and building were sold in September 2007 for net cash proceeds of $1.5 million.
Discontinued operations are summarized as follows:
| | | December 31, | |
| (Amounts in thousands) | | 2007 | | 2006 | | 2005 | |
| Sales | | $ | 111,934 | | | $ | 196,826 | | | $ | 281,868 | | |
| Operating income (loss) | | | (195 | ) | | | 2,689 | | | | 29,319 | | |
Gain on disposition of
net assets | | | 25,989 | | | | 17,366 | | | | – | | |
Income before taxes from
discontinued operations | | | 25,794 | | | | 20,055 | | | | 29,319 | | |
| Income tax provision | | | 15,080 | | | | 10,154 | | | | 10,918 | | |
Income from discontinued
operations | | $ | 10,714 | | | $ | 9,901 | | | $ | 18,401 | | |
Included in the operating loss for 2007 are charges totaling $4.5 million for employee severance, employee benefits, transition and closure costs. Included in the operating income for 2006 are charges totaling $8.0 million for employee severance and benefits costs, impairment of assets and closure costs.
NOTE 3: INVENTORIES
Inventories consisted of the following:
| | | December 31, | |
| (Amounts in thousands) | | 2007 | | 2006 | |
| Raw materials and supplies | | $ | 9,297 | | | $ | 24,213 | | |
| Work in progress | | | 14,701 | | | | 14,034 | | |
| Finished Goods | | | 46,275 | | | | 39,586 | | |
| Total inventories | | $ | 70,273 | | | $ | 77,833 | | |
As discussed in Note 2, the Company sold its Forestry Division business, including all related inventory, on November 5, 2007. The December 31, 2006 amounts in the preceding table include $20.9 million of inventories related to this discontinued operation.
NOTE 4: PROPERTY, PLANT AND EQUIPMENT
Property, plant and equipment consisted of the following:
| | | December 31, | |
| (Amounts in thousands) | | 2007 | | 2006 | |
| Land | | $ | 4,882 | | | $ | 5,399 | | |
| Buildings and improvements | | | 51,251 | | | | 62,090 | | |
| Machinery and equipment | | | 186,076 | | | | 187,735 | | |
Furniture, fixtures and office
equipment | | | 28,419 | | | | 35,412 | | |
| Transportation equipment | | | 662 | | | | 816 | | |
| Construction in progress | | | 5,491 | | | | 13,900 | | |
| Accumulated depreciation | | | (187,052 | ) | | | (205,687 | ) | |
Total property, plant and
equipment, net | | $ | 89,729 | | | $ | 99,665 | | |
As discussed in Note 2, the Company sold its Forestry Division business, including all related property, plant and equipment, on November 5, 2007. The December 31, 2006 amounts in the preceding table include $10.6 million of property, plant and equipment, net, related to this discontinued operation.
NOTE 5: DEFERRED FINANCING COSTS
Deferred financing costs represent costs incurred in conjunction with the Company's debt financing activities and are amortized over the term of the related debt instruments. Deferred financing costs and the related amortization expense are adjusted when any pre-payments of principal are made to the related outstanding term loan. During the year ended December 31, 2007, the following occurred (see also note 7):
| (Amounts in thousands) | |
| Balance at December 31, 2006 | | $14,574 | |
| Financing costs deferred | | 700 | |
Write off during period due to prepayments
of principal | | (625) | |
| Amortization during period | | (3,951) | |
| Balance at December 31, 2007 | | $10,698 | |
BLOUNT INTERNATIONAL, INC.
38
Scheduled amortization, assuming no further prepayments of principal, is as follows:
| (Amounts in thousands) | | Estimated
Annual
Amortization | |
| 2008 | | $ | 4,019 | | |
| 2009 | | | 3,262 | | |
| 2010 | | | 1,729 | | |
| 2011 | | | 1,067 | | |
| 2012 and beyond | | | 621 | | |
| Total amortization | | $ | 10,698 | | |
NOTE 6: ACCRUED EXPENSES
Accrued expenses consisted of the following:
| | | December 31, | |
| (Amounts in thousands) | | 2007 | | 2006 | |
| Salaries, wages and related withholdings | | $ | 26,455 | | | $ | 20,604 | | |
| Accrued interest | | | 7,205 | | | | 8,539 | | |
| Employee benefits | | | 4,467 | | | | 4,535 | | |
| Product liability | | | 3,506 | | | | 3,116 | | |
| Accrued customer incentives | | | 2,277 | | | | 7,166 | | |
| Accrued taxes | | | 1,550 | | | | 2,877 | | |
| Warranty reserve | | | 160 | | | | 3,269 | | |
| Other | | | 11,827 | | | | 12,034 | | |
| Total accrued expenses | | $ | 57,447 | | | $ | 62,140 | | |
NOTE 7: DEBT AND FINANCING AGREEMENTS
Long-term debt consisted of the following:
| | | December 31, | |
| (Amounts in thousands) | | 2007 | | 2006 | |
| Revolving credit facility borrowings | | | – | | | $ | 27,000 | | |
| Term loans | | $ | 122,000 | | | | 148,875 | | |
| 87/8% Senior subordinated notes | | | 175,000 | | | | 175,000 | | |
| Total debt | | | 297,000 | | | | 350,875 | | |
| Less current maturities | | | (1,242 | ) | | | (1,500 | ) | |
| Total long-term debt | | $ | 295,758 | | | $ | 349,375 | | |
Minimum principal payments required are as follows:
| (Amounts in thousands) | | Payments | | | |
| 2008 | | $ | 1,242 | | | | |
| 2009 | | | 1,242 | | | | |
| 2010 | | | 119,516 | | | | |
| 2011 | | | – | | | | |
| 2012 | | | 175,000 | | | | |
| Total debt | | $ | 297,000 | | | | |
The weighted average interest rate on outstanding debt as of December 31, 2007 was 8.11%. As of December 31, 2007 the Company did not have any material capital leases.
87/8% Senior Subordinated Notes. The Company has one registered debt security, the 87/8% senior subordinated notes. The interest rate on these notes is fixed until their maturity on August 1, 2012. These notes are i ssued by Blount, Inc. and are fully and unconditionally, jointly and severally, guaranteed by the Company and all of its domestic subsidiaries ("guarantor subsidiaries") other than Blount, Inc. All guarantor subsidiaries of these 87/8% senior subordinated notes are 100% owned, directly or indirectly, by the Company. While the Company and all of its domestic subsidiaries guarantee these 87/8% senior s ubordinated notes, none of Blount's existing foreign subsidiaries ("non-guarantor subsidiaries") guarantee these notes. See also Note 17.
Senior Credit Facilities. The Company, through its wholly-owned subsidiary, Blount, Inc., first entered into a credit agreement with General Electric Capital Corporation as Agent on May 15, 2003. The agreement was amended and restated on August 9, 2004, and has had several subsequent amendments. The senior credit facilities consist of a term loan facility and a revolving credit facility.
2006 Amendment to Credit Facilities. On March 23, 2006, the Company amended certain terms of the senior credit facilities. This amendment included the following changes:
< Maximum availability under the revolving credit facility was increased from $100.0 million to $150.0 million;
< Interest rates were reduced by 0.75% for the term loans and 1.00% for the revolving credit facility;
< Certain financial covenants were modified, including increases to the amounts that may be paid for acquisitions, dividends and repurchase of Company stock, as well as modifications to certain financial ratio requirements; and
< The Company incurred fees and third party costs of $0.7 million related to the amendment.
Immediately following the amendment, the Company completed the following transactions:
< $82.1 million was borrowed under the revolving credit facility;
< The total principal balance of $4.6 million was paid off on a Canadian term loan, and that loan was cancelled; and
< $77.5 million in principal was paid against the term loans, leaving a balance of $150.0 million outstanding.
2007 Amendment to Credit Facilities. On November 5, 2007, the Company amended certain terms of the senior credit facilities. No changes were made to the interest rates, principal amounts, maturity dates or payment schedules of the debt or to the availability of credit under the agreement. This amendment included the following changes:
< The agreement was modified to allow the Company to sell its Forestry Division on the same day as the effective date of the amendment;
BLOUNT INTERNATIONAL, INC.
39
< Certain covenants, terms and conditions were modified in the credit agreement, including an increased allowance for acquisitions, reduced reporting requirements and a reduction in the required senior leverage ratio; and
< The Company incurred fees and third party costs of $0.7 million related to the amendment.
The revolving credit facility provides for total available borrowings up to $150.0 million, reduced by outstanding letters of credit and further restricted by a specific leverage ratio and first lien credit facilities leverage ratio. As of December 31, 2007, the Company had the ability to borrow an additional $140.9 million under the terms of the revolving credit agreement. The revolving credit facility bears interest at the LIBOR rate plus 1.75%, or at the prime rate, depending on the type of loan, and matures on August 9, 2009. Interest is payable monthly in arrears on any prime rate borrowing and at the individual maturity dates for any LIBOR-based borrowing. Any outstanding principal is due in its entirety on the maturity date.
The term loan facility bears interest at the LIBOR rate plus 1.75%, or at the prime rate, depending on the type of loan, and matures on August 9, 2010. The term loan facility requires quarterly payments of $0.3 million, with a final payment of $118.6 million due on the maturity date. Once repaid, principal under the term loan facility may not be re-borrowed by the Company.
The amended and restated senior credit facilities contain financial covenant calculations relating to maximum capital expenditures, minimum fixed charge coverage ratio, maximum leverage ratio and maximum first lien credit facilities leverage ratio. In addition, there are covenants relating, among other categories, to investments, loans and advances, indebtedness, and the sale of stock or assets. The Company was in compliance with all debt covenants as of December 31, 2007.
The amended and restated senior credit facilities may be prepaid at any time. There can also be additional mandatory repayment requirements related to the sale of Company assets, the issuance of stock under certain circumstances or upon the Company's annual generation of excess cash flow, as determined under the credit agreement.
Blount International, Inc. and all of its domestic subsidiaries other than Blount, Inc. guarantee Blount, Inc.'s obligations under the senior credit facilities. The obligations under the senior credit facilities are collateralized by a first priority security interest in substantially all of the assets of Blount, Inc. and its domestic subsidiaries, as well as a pledge of all of Blount, Inc.'s capital stock held by Blount International, Inc. and all of the stock of domestic subsidiaries held by Blount, Inc. Blount, Inc. has also pledged 65% of the stock of its non-domestic subsidiaries as additional collateral.
NOTE 8: INCOME TAXES
The provision (benefit) for income taxes was as follows:
| | | Year Ended December 31, | |
| (Amounts in thousands) | | 2007 | | 2006 | | 2005 | |
| Current | |
| Federal | | $ | 15,155 | | | $ | 1,609 | | | $ | 3,478 | | |
| State | | | 1,436 | | | | 1,747 | | | | (2,671 | ) | |
| Foreign | | | 1,511 | | | | 7,520 | | | | 11,109 | | |
| Deferred | |
| Federal | | | 11,711 | | | | 10,100 | | | | (30,622 | ) | |
| State | | | 1,891 | | | | 1,844 | | | | (5,653 | ) | |
| Foreign | | | (594 | ) | | | 1,080 | | | | 1,021 | | |
Provision (benefit)
for income taxes | | | 31,110 | | | | 23,900 | | | | (23,338 | ) | |
| The provision (benefit) is reported as follows: | |
| Continuing operations | | | 16,030 | | | | 13,746 | | | | (34,256 | ) | |
| Discontinued operations | | | 15,080 | | | | 10,154 | | | | 10,918 | | |
Provision (benefit)
for income taxes | | $ | 31,110 | | | $ | 23,900 | | | $ | (23,338 | ) | |
The Company also recorded the following deferred tax amounts directly to stockholders' equity (deficit):
| | | Year Ended December 31, | |
| (Amounts in thousands) | | 2007 | | 2006 | | 2005 | |
Pension liability
adjustment | | $ | (2,896 | ) | | $ | 9,319 | | | $ | 1,338 | | |
Change in unrealized
losses/gains | | | 785 | | | | 91 | | | | 101 | | |
| Stock options exercised | | | 114 | | | | 747 | | | | 4,335 | | |
Income from continuing operations before income taxes was as follows:
| | | Year Ended December 31, | |
| (Amounts in thousands) | | 2007 | | 2006 | | 2005 | |
| Income before income taxes: | |
| Domestic | | $ | 33,943 | | | $ | 13,481 | | | $ | 19,750 | | |
| Foreign | | | 14,230 | | | | 32,910 | | | | 34,208 | | |
| Total | | $ | 48,173 | | | $ | 46,391 | | | $ | 53,958 | | |
A reconciliation of the provision (benefit) for income taxes from continuing operations to the amount computed by applying the statutory federal income tax rate to income
BLOUNT INTERNATIONAL, INC.
40
from continuing operations before income taxes was as follows:
| | | % of income (loss) before tax | |
| | | 2007 | | 2006 | | 2005 | |
| Statutory tax rate | | | 35.0 | % | | | 35.0 | % | | | 35.0 | % | |
Impact of earnings of
foreign operations | | | (8.4 | ) | | | (6.1 | ) | | | (1.5 | ) | |
| Repatriation of foreign earnings | | | 1.3 | | | | 1.4 | | | | 8.3 | | |
| Federal and state research tax credits | | | (0.2 | ) | | | (0.3 | ) | | | (4.1 | ) | |
State income taxes, net of
federal tax benefit | | | 3.8 | | | | 4.2 | | | | 1.4 | | |
| Permanent differences | | | (0.9 | ) | | | (10.6 | ) | | | – | | |
| Change in estimated contingencies | | | 2.3 | | | | 7.6 | | | | 0.4 | | |
| Other | | | 1.1 | | | | (0.5 | ) | | | (0.3 | ) | |
Effective income tax rate
before valuation allowance | | | 34.0 | | | | 30.7 | | | | 39.2 | | |
| Valuation allowance | | | (0.7 | ) | | | (1.1 | ) | | | (102.7 | ) | |
Effective income tax rate after
valuation allowance | | | 33.3 | % | | | 29.6 | % | | | (63.5 | )% | |
The effective income tax rate increased in 2007 to 33.3%, from 29.6% in 2006, primarily due to the discontinued special deduction for U.S. export sales, partially offset by the domestic activities production deduction. The effective income tax rate increased in 2006 to 29.6%, from a negative 63.5% in 2005, primarily as a result of the reversal of a deferred tax asset valuation allowance in 2005, partially offset by additional tax expense recognized on repatriation of foreign earnings.
The components of deferred income tax assets (liabilities) applicable to temporary differences at December 31, 2007 and 2006 are as follows:
| | | December 31, | |
| (Amounts in thousands) | | 2007 | | 2006 | |
| Deferred tax assets: | |
| Employee benefits and compensation | | $ | 22,547 | | | $ | 27,608 | | |
| Other accrued expenses | | | 4,282 | | | | 10,673 | | |
Net operating loss, capital loss
and credit carryforwards | | | 3,158 | | | | 13,776 | | |
| Foreign | | | 2,138 | | | | 291 | | |
| Gross deferred tax assets | | | 32,125 | | | | 52,348 | | |
| Less valuation allowance | | | (2,318 | ) | | | (2,667 | ) | |
Deferred tax assets net of
valuation allowance | | | 29,807 | | | | 49,681 | | |
| Deferred tax liabilities: | |
Property, plant and equipment
and intangible asset basis differences | | | (8,603 | ) | | | (13,067 | ) | |
| Foreign | | | (533 | ) | | | (131 | ) | |
| Other | | | (819 | ) | | | (31 | ) | |
| Total deferred tax liabilities | | | (9,955 | ) | | | (13,229 | ) | |
| Net deferred tax asset | | $ | 19,852 | | | $ | 36,452 | | |
In 2003, the Company recorded a valuation allowance against its deferred tax assets in the U.S. In 2005, the Company concluded that, except for a few specific deferred tax assets, it was more likely than not that the Company would realize the majority of these deferred tax assets. Factors supporting this change in expectations included:
< The decrease in debt and interest expense resulting from refinancing transactions completed in 2004,
< The 2005 early retirement of outstanding debt principal resulting in further reductions in expected interest expense,
< Estimated use of a significant amount of deferred tax assets during 2005 resulting from increased U.S. taxable income, and
< Expectations for continued U.S. taxable income over the next several years.
Therefore, the Company reversed the majority of the valuation allowance as of December 31, 2005. The remaining valuation allowances of $2.3 million and $2.7 million as of December 31, 2007 and 2006, respectively, pertain to certain tax credit and state NOL carryforwards, which are not expected to be realized before they expire.
As of December 31, 2007, the Company had no remaining U.S. NOL carryforwards but had state NOL carryforwards estimated at $30.3 million that expire at various dates from 2008 through 2024. Additionally, the Company has a foreign tax credit carryforward of approximately $1.7 million that expires in 2010. The Company also has state research and other tax credit carryforwards of approximately $0.2 million that expire at various dates from 2008 through 2021.
U.S. income taxes have not been provided on undistributed earnings of international subsidiaries. Management's intention is to reinvest these earnings indefinitely. As of December 31, 2007, undistributed earnings of international subsidiaries were $118.2 million. The American Jobs Creation Act of 2004, signed into law October 22, 2004 (the "Jobs Creation Act"), included a one-time election to deduct 85 percent of certain foreign earnings that are repatriated, as defined in the act. The Company repatriated $24.9 million of its undistributed earnings of foreign subsidiaries in 2005, under the provision of the Jobs Creation Act, and recorded incremental income taxes of $2.0 million on the dividend income recognized. Repatriation of foreign earnings in 2007 and 2006 pertained to current earnings of one foreign subsidiary.
The periods from 2001 through 2006 remain open for review by the Internal Revenue Service. In 2005, the Company entered into a Bilateral Advance Pricing Agreement (BAPA) negotiation with the Canada Revenue Agency ("CRA") and the Internal Revenue Service. This negotiation, now expected to take an additional six to twelve months to complete, is intended to eliminate taxation of the same profits by both governments. The Company is
BLOUNT INTERNATIONAL, INC.
41
pursuing the BAPA in order to bring certainty with respect to transfer pricing between the U.S. and Canada. The BAPA agreement will cover the years 2003 through 2008. For this reason, the Company released its reserve for contingency related to this matter in 2004.
A reconciliation of the beginning and ending amount of unrecognized tax benefits are as follows:
| (Amounts in thousands) | |
| Balance at January 1, 2007 | | $27,264 | |
| Decreases for tax positions taken during a prior period | | (1,890) | |
Increases for tax positions taken during the
current period | | 2,650 | |
| Settlements | | – | |
| Statute of limitations expirations | | – | |
| Balance at December 31, 2007 | | $28,024 | |
Unrecognized tax benefits are included in other assets and other liabilities on the consolidated balance sheets.
The Company recognizes interest and penalties related to uncertain tax positions in income tax expense. As of January 1, 2007 and December 31, 2007, the Company had recorded $2.8 million and $2.5 million of accrued interest and penalties related to uncertain tax positions, respectively.
The total amount of unrecognized tax benefits that would affect the Company's effective tax rate if recognized is $12.0 million as of December 31, 2007 and $11.2 million as of January 1, 2007. It is reasonably possible that unrecognized tax benefits could change significantly during 2008. The Company estimates that up to $0.8 million of unrecognized tax benefits could reverse during 2008.
NOTE 9: RETIREMENT PLANS
Funded Defined Benefit Pension Plans
The Company sponsors defined benefit pension plans covering substantially all of its employees in the U.S., Canada and Belgium. The changes in benefit obligations, plan assets and funded status of these plans for the years ended December 31, 2007 and 2006 were as follows:
| | | Pension Benefits | |
| (Amounts in thousands) | | 2007 | | 2006 | |
| Change in benefit obligations: | |
Projected benefit obligations at
beginning of year | | $ | (177,699 | ) | | $ | (184,910 | ) | |
| Service cost | | | (3,694 | ) | | | (6,545 | ) | |
| Interest cost | | | (10,085 | ) | | | (10,017 | ) | |
| Actuarial gains (losses) | | | (1,764 | ) | | | 683 | | |
| Benefits and plan expenses paid | | | 9,424 | | | | 8,033 | | |
| Effect of amendment to U.S. plan | | | – | | | | 13,876 | | |
| Divestitures | | | (206 | ) | | | 1,181 | | |
Projected benefit obligations at
end of year | | | (184,024 | ) | | | (177,699 | ) | |
| Change in plan assets: | |
Fair value of plan assets at
beginning of year | | | 148,177 | | | | 121,485 | | |
| Actual return on plan assets | | | 18,478 | | | | 16,310 | | |
| Company contributions | | | 19,618 | | | | 18,415 | | |
| Benefits and plan expenses paid | | | (9,424 | ) | | | (8,033 | ) | |
Fair value of plan assets at
end of year | | | 176,849 | | | | 148,177 | | |
| Net funded status at end of year | | $ | (7,175 | ) | | $ | (29,522 | ) | |
| Amounts recognized in the consolidated balance sheets: | |
| Non-current assets | | $ | 2,284 | | | | – | | |
| Current liabilities | | | – | | | | – | | |
| Non-current liabilities | | | (9,459 | ) | | $ | (29,522 | ) | |
Net liability recognized in
consolidated balance sheets | | $ | (7,175 | ) | | $ | (29,522 | ) | |
The accumulated benefit obligations for the above defined benefit pension plans at December 31, 2007 and 2006 totaled $163.4 million and $161.2 million, respectively.
The projected benefit payments for these plans over the next ten years are estimated as follows:
| (Amounts in thousands) | | Estimated
Benefit
Payments | |
| 2008 | | $ | 8,872 | | |
| 2009 | | | 8,321 | | |
| 2010 | | | 8,978 | | |
| 2011 | | | 10,790 | | |
| 2012 | | | 10,373 | | |
| 2013 – 2017 | | | 62,573 | | |
| Total estimated benefit payments | | $ | 109,907 | | |
The Company expects to contribute approximately $3 million to $4 million to its funded pension plans in 2008.
Domestic Benefit Plans
The Company recorded pension curtailment charges of $0.2 million and $0.3 million, respectively, in discontinued operations in 2007 and 2006, representing the portion of unamortized prior service cost related to the former employees of the discontinued operations.
As of December 31, 2006, the Company implemented a redesign of its U.S. defined benefit pension plan and the associated nonqualified plan. As of January 1, 2007, employees who currently participate in the plans ceased accruing benefits and new employees are not eligible to participate. All retirement benefits accrued up to the time of the freeze were preserved.
Accordingly, the Company recorded a pension curtailment charge of $3.2 million in 2006 that represented the immediate recognition of the unamortized prior service cost for U.S. employees. The Company also incurred a total of approximately $0.5 million for related fees and costs associated with the changes to its retirement plans.
BLOUNT INTERNATIONAL, INC.
42
Unfunded Supplemental Non-Qualified Plans
The Company sponsors various supplemental non-qualified pension plans covering certain employees and former employees in the U.S. A rabbi trust, whose assets are not included in the table below, has been established to fund a portion of these non-qualified benefits, as well as certain other executive benefits. At December 31, 2007 and 2006, approximately $0.3 million and $1.1 million, respectively, were held in this trust, and this amount is included in other assets in the Consolidated Balance Sheets. The changes in benefit obligations, plan assets and funded status of these plans for the years ended December 31, 2007 and 2006 were as follows:
| | | Unfunded
Retirement Plans | |
| (Amounts in thousands) | | 2007 | | 2006 | |
| Change in Benefit Obligations: | |
Projected benefit obligations at
beginning of year | | $ | (5,448 | ) | | $ | (6,655 | ) | |
| Service cost | | | (67 | ) | | | (84 | ) | |
| Interest cost | | | (310 | ) | | | (298 | ) | |
| Actuarial gains (losses) | | | 47 | | | | 917 | | |
| Benefits and plan expenses paid | | | 464 | | | | 464 | | |
| Effect of amendment to U.S. plan | | | – | | | | 208 | | |
Projected benefit obligations at
end of year | | | (5,314 | ) | | | (5,448 | ) | |
| Net funded status at end of year | | $ | (5,314 | ) | | $ | (5,448 | ) | |
| Amounts recognized in the consolidated balance sheets: | |
| Current liabilities | | $ | (450 | ) | | $ | (451 | ) | |
| Non-current liabilities | | | (4,864 | ) | | | (4,997 | ) | |
Net liability recognized in
consolidated balance sheets | | $ | (5,314 | ) | | $ | (5,448 | ) | |
The Company accounts for its defined benefit pension plans in accordance with FAS No. 87, "Employers' Accounting for Pensions ("FAS No. 87") and FAS No. 158, "Employers Accounting for Defined Benefit Pension and Other Postretirement Plans" ("FAS No. 158"). FAS No. 158 was effective December 31, 2006 and requires the recognition of the funded status of the pension benefit plans in the Company's statement of financial position. The implementation of FAS No. 158 on December 31, 2006 resulted in an $8.5 million charge to accumulated other comprehensive income. As of December 31, 2007 and 2006, the net obligation for the Company's pension plans is included in employee benefit obligations on the consolidated balance sheets.
Periodic Benefit Costs and Other Comprehensive Income
The components of net periodic benefit cost and other comprehensive income and the weighted average assumptions used in accounting for funded and unfunded pension benefits follow:
| | | Pension Benefits
Year Ended December 31, | |
| (Amounts in thousands) | | 2007 | | 2006 | | 2005 | |
| Components of net periodic benefit cost: | |
| Service cost | | $ | 3,761 | | | $ | 6,629 | | | $ | 5,812 | | |
| Interest cost | | | 10,395 | | | | 10,315 | | | | 9,540 | | |
| Expected return on plan assets | | | (13,297 | ) | | | (11,776 | ) | | | (9,580 | ) | |
| Amortization of actuarial losses | | | 1,411 | | | | 2,398 | | | | 2,587 | | |
Amortization of prior
service cost | | | (10 | ) | | | 195 | | | | 373 | | |
Net curtailment loss, including
discontinued operations | | | 206 | | | | 3,570 | | | | – | | |
Total net periodic
benefit cost | | $ | 2,466 | | | $ | 11,331 | | | $ | 8,732 | | |
Other changes in benefit obligations recognized in
other comprehensive income: | |
| Actuarial gains (losses) | | | n/a | | | | n/a | | | | 7,428 | | |
Total net periodic benefit
cost and other
comprehensive income | | | n/a | | | | n/a | | | $ | 16,160 | | |
Amount recognized in accumulated other
comprehensive income: | |
| Actuarial (gains) losses | | $ | (5,909 | ) | | $ | 34,613 | | | | n/a | | |
| Prior service cost | | | 10 | | | | (46 | ) | | | n/a | | |
Total recognized in
accumulated other
comprehensive income | | $ | (5,899 | ) | | $ | 34,567 | | | | n/a | | |
| Weighted average assumptions: | |
Discount rate used to
determine net periodic
benefit cost | | | 5.7 | % | | | 5.5 | % | | | 5.9 | % | |
Discount rate used to
determine year end
benefit obligations | | | 6.0 | % | | | 5.7 | % | | | 5.5 | % | |
| Expected return on plan assets | | | 8.5 | % | | | 8.9 | % | | | 8.9 | % | |
| Rate of compensation increase | | | 3.5 | % | | | 3.5 | % | | | 3.5 | % | |
The Company annually evaluates and selects the discount rates to be used for its pension plans. Consideration is given to relevant indices for high quality fixed rate debt securities, as well as comparable rates for high quality corporate bonds with terms comparable to the projected cash flows for our respective plans, as of the measurement date. The expected long-term rate of return on these assets was chosen from the range of likely results of compound average annual returns based on the current investment policies. The expected return and volatility for each asset class was based on historical equity, bond and cash returns over a twenty year time horizon. While this approach gives appropriate consideration to recent fund performance and historical returns, the assumption is primarily a long-term, prospective rate.
BLOUNT INTERNATIONAL, INC.
43
The Company maintains target allocation percentages among various asset classes based on investment policies established for these plans. The target allocation is designed to achieve long term objectives of return, while mitigating against downside risk and considering expected cash flows. The weighted-average target allocation for 2007 is equity securities 62%, debt securities 37% and other 1%. The weighted-average allocation for both 2006 and 2005 was as follows: equity securities 64%, debt securities 35% and other 1%.
The amounts in accumulated other comprehensive income expected to be recognized as components of net periodic benefit cost in 2007 are actuarial losses of $1.0 million and prior service costs of $6 thousand.
Defined Contribution Plan
The Company also sponsors a defined contribution 401(k) plan covering substantially all U.S. employees and matches a portion of employee contributions. The expense for the match was $2.6 million, $2.7 million and $2.7 million in 2007, 2006 and 2005, respectively.
The Company's defined contribution 401(k) plan was amended in August, 2006 to provide an additional annual Company contribution, effective January 1, 2007, of 3%, 4% or 5% of base compensation, depending upon the participant's years of service. The new contribution will be made whether or not the employee contributes to the plan. The first annual contribution, totaling $2.8 million, was made in early 2008.
NOTE 10: OTHER POST-RETIREMENT BENEFIT PLANS
The Company sponsors various unfunded supplemental retirement and post-retirement medical programs covering many of its current and former employees. The changes in benefit obligations, plan assets and funded status of these plans for the years ended December 31, 2007 and 2006, were as follows:
| | | Other Post-Retirement
Benefits | |
| (Amounts in thousands) | | 2007 | | 2006 | |
| Change in benefit obligations: | |
Projected benefit obligations at
beginning of year | | $ | (33,805 | ) | | $ | (42,750 | ) | |
| Service cost | | | (358 | ) | | | (376 | ) | |
| Interest cost | | | (2,082 | ) | | | (1,840 | ) | |
| Participant contributions | | | (1,295 | ) | | | (1,436 | ) | |
| Actuarial gains (losses) | | | (5,019 | ) | | | 9,036 | | |
| Benefits and plan expenses paid | | | 4,184 | | | | 3,561 | | |
| Divestitures | | | 2,399 | | | | – | | |
Projected benefit obligations at
end of year | | | (35,976 | ) | | | (33,805 | ) | |
| Change in plan assets: | |
Fair value of plan assets at
beginning of year | | | 111 | | | | 309 | | |
| Actual return on plan assets | | | 1 | | | | 8 | | |
| Company contributions | | | 2,776 | | | | 1,919 | | |
| Participant contributions | | | 1,295 | | | | 1,436 | | |
| Benefits and plan expenses paid | | | (4,183 | ) | | | (3,561 | ) | |
Fair value of plan assets at
end of year | | | – | | | | 111 | | |
| Net funded status at end of year | | $ | (35,976 | ) | | $ | (33,694 | ) | |
| Amounts recognized in the consolidated balance sheets: | |
| Current liabilities | | $ | (2,779 | ) | | $ | (2,225 | ) | |
| Non-current liabilities | | | (33,197 | ) | | | (31,469 | ) | |
Net liability recognized in
consolidated balance sheets | | $ | (35,976 | ) | | $ | (33,694 | ) | |
The projected benefit payments for these plans, net of the estimated Medicare Part D subsidy expected to be received by the Company, over the next ten years are estimated as follows:
| (Amounts in thousands) | | Estimated
Gross
Benefit
Payments | | Estimated
Medicare
Part D
Subsidy | | Estimated
Net Benefit
Payments | |
| 2008 | | $ | 3,150 | | | $ | 286 | | | $ | 2,864 | | |
| 2009 | | | 3,106 | | | | 312 | | | | 2,794 | | |
| 2010 | | | 3,161 | | | | 333 | | | | 2,828 | | |
| 2011 | | | 3,177 | | | | 353 | | | | 2,824 | | |
| 2012 | | | 3,172 | | | | 370 | | | | 2,802 | | |
| 2013 – 2017 | | | 15,490 | | | | 1,977 | | | | 13,513 | | |
Total estimated
benefit payments | | $ | 31,256 | | | $ | 3,631 | | | $ | 27,625 | | |
The Company expects to meet funding requirements for its post-retirement medical plans on a pay-as-you-go basis during 2008.
The Company accounts for post-retirement medical plans in accordance with FAS No. 106, "Employers' Accounting for Postretirement Benefits Other Than Pensions" ("FAS No. 106") and FAS No. 158. The Company adopted FAS No. 158 effective December 31, 2006. FAS No. 158 requires the recognition of the funded status of other post-retirement benefit plans in the Company's statement of financial position. The implementation of FAS No. 158 on December 31, 2006 resulted in a $3.8 million charge to accumulated other comprehensive income. As of December 31, 2007 and 2006, the obligation for the other postretirement benefit plans has been reported in employee benefit obligations in the consolidated balance sheets.
Periodic Benefit Costs and Other Comprehensive Income
The components of net periodic benefit cost and other comprehensive income and the weighted average
BLOUNT INTERNATIONAL, INC.
44
assumptions used in accounting for other post-retirement benefits follow:
| | | Other Post-Retirement Benefits
Year Ended December 31, | |
| (Amounts in thousands) | | 2007 | | 2006 | | 2005 | |
| Components of net periodic benefit cost: | |
| Service cost | | $ | 358 | | | $ | 376 | | | $ | 449 | | |
| Interest cost | | | 2,082 | | | | 1,840 | | | | 2,287 | | |
| Expected return on plan assets | | | – | | | | (16 | ) | | | (44 | ) | |
| Amortization of actuarial losses | | | 932 | | | | 742 | | | | 1,327 | | |
Amortization of prior
service cost | | | 8 | | | | 9 | | | | 9 | | |
| Curtailment cost | | | 3 | | | | – | | | | – | | |
Total net periodic
benefit cost | | $ | 3,383 | | | $ | 2,951 | | | $ | 4,028 | | |
Amount recognized in accumulated other
comprehensive income: | |
| Actuarial losses | | $ | 1,675 | | | $ | 10,843 | | | | – | | |
| Prior service cost | | | – | | | | 18 | | | | – | | |
Total recognized in
accumulated other
comprehensive income | | $ | 1,675 | | | $ | 10,861 | | | | n/a | | |
| Weighted average assumptions: | |
Discount rate used to
determine net periodic
benefit cost | | | 5.8 | % | | | 5.5 | % | | | 5.8 | % | |
Discount rate used to
determine year end
benefit obligations | | | 6.3 | % | | | 5.8 | % | | | 5.5 | % | |
| Expected return on plan assets | | | 2.0 | % | | | 9.0 | % | | | 9.0 | % | |
The amounts in accumulated other comprehensive income expected to be recognized as components of net periodic benefit cost in 2007 are actuarial losses of $0.9 million and prior service costs of $6 thousand.
The Company annually evaluates and selects the discount rates to be used for these plans. Consideration is given to relevant indices for high quality fixed rate debt securities, and to specific debt securities with maturity dates similar to the expected timing of cash outflows for the plans as of the measurement date. The annual rate of increase in the cost of health care benefits was assumed to be 9% in 2005, 8% in 2006 and 10% in 2007, declining by 1.0% per year until 5.0% is reached. A 1% change in assumed health care cost trend rates would have had the following effects for 2007:
| (Amounts in thousands) | | 1% Increase | | 1% Decrease | |
Effect on service and
interest cost components | | $ | 336 | | | $ | (199 | ) | |
Effect on other post-retirement
benefit obligations | | | 3,233 | | | | (2,679 | ) | |
NOTE 11: COMMITMENTS AND CONTINGENT LIABILITIES
The Company leases office space and equipment under operating leases expiring in one to 13 years. Most leases include renewal options and some contain purchase options and escalation clauses. Future minimum rental commitments required under operating leases having initial or remaining non-cancelable lease terms in excess of one year as of December 31, 2007, are as follows: 2008: $1.1 million; 2009: $0.9 million; 2010: $0.9 million; 2011: $0.5 million; 2012 $0.3 million; 2013 and beyond: $1.5 million. Rentals charged to costs and expenses for continuing operations under cancelable and non-cancelable lease arrangements were $2.0 million, $2.5 million and $2.0 million in 2007, 2006 and 2005, respectively.
Certain customers of the discontinued operations financed their purchases through third party financing companies. Under the terms of these financing arrangements, the Company may be required to repurchase certain equipment from the finance companies, or reimburse them for any financial loss incurred, should a customer default on payment. The aggregate remaining repurchase or reimbursement obligation outstanding under the agreements as of December 31, 2007 is $0.8 million. These arrangements have not had a material adverse effect on the Company's operating results or cash flows in the past. The Company does not expect to incur any material charges related to these agreements in future periods based on past experience and the assumption that any repurchased equipment would most likely be resold for approximately the same value.
Guarantees and other commercial commitments are as follows:
| (Amounts in thousands) | | December 31, 2007 | |
| Product warranty | | $ | 160 | | |
| Letters of credit outstanding | | | 4,800 | | |
Total guarantees and
other commercial commitments
from continuing operations | | | 4,960 | | |
Third party financing projections
of discontinued operations (1) | | | 804 | | |
Total guarantees and
other commercial commitments | | $ | 5,764 | | |
(1) Applicable to the third party financing agreements for customer equipment purchases.
In addition to these amounts, Blount International also guarantees certain debt of its subsidiaries (see Notes 7 and 18).
BLOUNT INTERNATIONAL, INC.
45
Changes in the warranty reserve were as follows:
| | | Year Ended December 31, | |
| (Amounts in thousands) | | 2007 | | 2006 | | 2005 | |
| Balance at beginning of period | | $ | 3,269 | | | $ | 4,888 | | | $ | 4,926 | | |
Warranty reserve related to
discontinued operations | | | (2,496 | ) | | | (976 | ) | | | – | | |
| Accrued warranty expense | | | 1,536 | | | | 2,778 | | | | 4,125 | | |
Payments made (in cash or
in-kind) | | | (2,149 | ) | | | (3,421 | ) | | | (4,163 | ) | |
| Balance at end of period | | $ | 160 | | | $ | 3,269 | | | $ | 4,888 | | |
The warranty reserve is included in accrued expenses on the consolidated balance sheet. The warranty reserve related to discontinued operations in 2007 was assumed by Caterpillar as part of the sale of the Forestry Division, and in 2006 was assumed by Husqvarna as part of the sale of Dixon Industries (see Note 2).
Other guarantees and claims arise during the ordinary course of business from relationships with suppliers and customers when we undertake an obligation to guarantee the performance of others if specified triggering events occur. Nonperformance of a contract could trigger an obligation of the Company. In addition, certain guarantees relate to contractual indemnification provisions in connection with transactions involving the purchase or sale of stock or assets. These claims include actions based upon intellectual property, environmental, product liability and other indemnification matters. The ultimate effect on future financial results is not subject to reasonable estimation because considerable uncertainty exists as to the occurrence or, if triggered, final outcome of these claims. However, while the ultimate liabilities resulting from such claims may be potentially significant to results of operations in the period recognize d, management does not anticipate they will have a material adverse effect on the Company's consolidated financial position or liquidity.
The Company reserves for product liability, environmental remediation and other legal matters as management becomes aware of such matters. A portion of these claims or lawsuits may be covered by insurance policies that generally contain both deductible and coverage limits. Management monitors the progress of each legal matter to ensure that the appropriate reserve for its obligation has been recognized and disclosed in the financial statements. Management also monitors trends in case types to determine if there are any specific issues that relate to the Company that may result in additional future exposure on an aggregate basis. As of December 31, 2007 and December 31, 2006, management believes the Company has appropriately recorded and disclosed all material costs for its obligations in regard to known matters. Management believes that the recoverability of the costs of claims from insurance companies will continue in the futur e. Management periodically assesses these insurance companies to monitor their ability to pay such claims.
The Company was named a potentially liable person ("PLP") by the Washington State Department of Ecology ("WDOE") in connection with the Pasco Sanitary Landfill Site ("Site"). This Site has been monitored by WDOE since 1988. From available records, the Company believes that it sent 26 drums of chromic hydroxide sludge in a non-toxic, trivalent state to the Site. The Company further believes that the Site contains more than 50,000 drums in total and millions of gallons of additional wastes, some potentially highly toxic in nature. Accordingly, based both on volume and on the nature of the waste, the Company believes that it is a de minimis contributor.
The current on-site monitoring program is being conducted and funded by certain PLPs, excluding the Company and several other PLPs, under the supervision of WDOE. During 2007, WDOE requested that the participating PLPs conduct further study and prepare a new "scope of work." It is likely that such new scope of work, once proposed by the participating PLPs and approved by WDOE, will result in additional work and costs in the future. The Company may or may not be required to contribute to the cost of this new or any subsequent studies or remediation, if any. The Company is unable to estimate such costs, or the likelihood of being assessed any portion thereof. As of December 31, 2007 and 2006, the Company had accrued $0.1 million for the potential costs of any clean-up at the Site. The Company incurred no costs during the years ended December 31, 2007, 2006 and 2005 in connection with the remediation efforts at the Site.
On September 12, 2003, the Company received a General Notice Letter as a Potentially Responsible De Minimis Party from Region IX of the EPA regarding the Operating Industries, Inc. Superfund Site in Monterey Park, California. The notice stated that the EPA would submit an offer to settle and an explanation as to why it believes the Company or a predecessor unit is a de minimis participant at the site. The Company was subsequently informed by the EPA that its report would be delayed, and on September 17, 2004, was notified of further delay in the process. The EPA has indicated that its de minimis settlement offer will be based on volume of waste at a uniform per gallon price among all de minimis parties. The site was operated as a landfill from 1948 to 1984, and received wastes from over 4,000 generators. At the present time, the Company has no knowledge as to which of its units, if any, was involved at the site, or the amounts, if any, that were sent there. However, based upon its current knowledge of the site, and its alleged status as a Potentially Responsible De Minimis Party, the Company does not believe that any settlement or participation in any remediation will have a materially adverse effect on its consolidated financial position, operating results or cash flows. The Company has received no further notice or explanation from Region IX of the EPA as of December 31, 2007.
BLOUNT INTERNATIONAL, INC.
46
On June 30, 2005, the Company was served with a "notice of meeting" on behalf of Williams Control, Inc. ("WCI") in connection with WCI's agreement with the State of Oregon Department of Environmental Quality ("DEQ") to enter into the voluntary cleanup program (the "Program") relating to WCI's facility located near Portland, Oregon (the "WCI Site"). The notice alleged that Blount, Inc. was responsible for some portion of any required cleanup or remediation related to the Program as a successor in interest to Omark Industries, Inc. ("Omark") through Omark's alleged operations at the WCI Site from 1968 through 1973. The Company is aware that other prior operators of the business, including the entity from which WCI purchased the business, Dana Corporation ("Dana"), and the landowner of the WCI Site, were also served with the notice. WCI alleged that a plume of chlorinated solvents, primarily TCE, is contained in groundwater at the Site and has migrated onto neighboring properties.
In late 2007, the Company, WCI and Dana reached a settlement apportioning the estimated costs of remediation among the three parties. The bankruptcy court with jurisdiction over Dana's estate approved the settlement and, in consideration of a release from WCI and other consideration, the Company reached final settlement by payment of an amount that was, after taking into account the reserve established for this matter, not material. Subsequently, the Company was reimbursed by insurance for much of this settlement amount and the related fees.
The Company is a defendant in a number of product liability lawsuits, some of which seek significant or unspecified damages, involving serious personal injuries for which there are retentions or deductible amounts under the Company's insurance policies. In addition, the Company is a party to a number of other suits arising out of the normal course of its business, including suits concerning commercial contracts, employee matters and intellectual property rights. In some instances the Company is the plaintiff, and is seeking recovery of damages. In others, the Company is a defendant against whom damages are being sought. While there can be no assurance as to their ultimate outcome, management does not believe these lawsuits will have a material adverse effect on the Company's consolidated financial position, operating results or cash flows. The Company recognized $0.7 million and $2.3 million of other income related to legal sett lements in 2006 and 2005, respectively.
The Company accrues, by a charge to income, an amount representing management's best estimate of the undiscounted probable loss related to any matter deemed by management and its counsel as a reasonably probable loss contingency in light of all of the then known circumstances. The Company does not accrue a charge to income for a matter deemed by management and its counsel to be a reasonably possible loss contingency in light of all of the current circumstances.
NOTE 12: CAPITAL STOCK AND EARNINGS PER SHARE DATA
The number of shares used in the denominators of the basic and diluted income per share computations was as follows:
| Weighted Average Common Shares | | Year Ended December 31, | |
| (In thousands) | | 2007 | | 2006 | | 2005 | |
Shares for basic income
per share computation –
weighted average common
shares outstanding | | | 47,280 | | | | 47,145 | | | | 46,094 | | |
Dilutive effect of stock
options, stock appreciation
rights and warrants | | | 798 | | | | 723 | | | | 1,441 | | |
Shares for diluted income
per share computation | | | 48,078 | | | | 47,868 | | | | 47,535 | | |
Options and stock appreciation
rights excluded from
computation as anti-dilutive | | | 1,676 | | | | 1,687 | | | | 13 | | |
No adjustment was required to reported amounts for inclusion in the numerators of the per share computations.
In June 2005, the Company and certain of its stockholders sold 7,500,000 shares of the Company's common stock in a public offering. The Company retained cumulative net proceeds of $10 thousand for the following transactions:
< Lehman Brothers and certain affiliates sold 6,117,620 shares of the Company's common stock. The Company did not receive any proceeds from this sale. As of December 31, 2007, Lehman Brothers held 8,918,999 shares of the Company's common stock.
< The Company issued 382,380 shares of common stock and received net proceeds of $6.1 million.
< The Company purchased 382,380 shares of common stock from certain stockholders for $6.1 million. These shares are held as treasury stock. The Company has accounted for the treasury stock as constructively retired in the consolidated financial statements.
< Warrants for 1,000,000 shares of common stock were exercised at $0.01 a share with net proceeds of $10 thousand received by the Company.
NOTE 13: STOCK-BASED COMPENSATION
Effective January 1, 2006, the Company adopted FAS No. 123(R), "Share-Based Payment" ("FAS No. 123(R)"). FAS No. 123(R) requires all share-based compensation to employees, directors and others who perform services for the Company to be valued at fair value on the date of grant and to be expensed over the applicable service period. Under FAS No. 123(R), pro forma disclosure of the income statement effects of share-based compensation is no longer an alternative to expense recognition. The adoption of FAS No. 123(R) resulted in a reduction in income before taxes of $3.3 million and a reduction in income from continuing operations and net income of $2.1 million in the year ended December 31, 2006. The adoption of FAS 123(R)
BLOUNT INTERNATIONAL, INC.
47
reduced basic and diluted earnings per share by $0.04 for the year ended December 31, 2006. Under the modified prospective application method, the results for prior periods have not been restated.
Under the Company's 1999 Stock Incentive Plan and 2000 Stock Incentive Plan, options to purchase the Company's common stock, and, by amendment, stock appreciation rights ("SARs") could be granted to employees, directors and other persons who perform services for the Company. Such options could be either incentive stock options or non-qualified stock options. Options and SARs generally vested in equal installments over a three year period and expire ten years from the date of grant. The number of shares that could have been issued under these two plans could not exceed an aggregate of 5,875,000 shares.
On April 25, 2006, the Company's stockholders approved the Blount International, Inc. 2006 Equity Incentive Plan (the "2006 Plan") and the 1999 and 2000 plans were replaced at that time. The 2006 Plan provides for substantially similar terms and conditions of stock-based awards to the predecessor plans, but also provides for the use of restricted stock awards, restricted stock unit grants and other forms of equity instruments. The maximum number of shares that may be awarded under the 2006 Plan is 4,236,919, of which 736,919 represent shares that remained unused under the 1999 and 2000 plans that were transferred to the 2006 Plan. The maximum number of incentive stock options that may be issued under the 2006 Plan is 1,750,000. Outstanding stock-based awards issued under the 1999 and 2000 plans remain unaffected by the adoption of the 2006 Plan.
The fair value of options and SARs was estimated on their respective grant dates using the Black-Scholes option valuation model. The estimated average life of SARs granted in 2006 and 2007 was derived from the "simplified" method described in SEC Staff Accounting Bulletin No. 107 ("SAB 107"). The expected average life for options granted in 2005 was based on historical data and management estimate. The risk-free interest rate is based on the implied yield available on U.S. Treasury zero-coupon issues with the remaining term equal to the average life. The expected volatility factors used are based on the historical volatility of the Company's stock. The expected dividend yield is based on historical information and management estimate. Beginning in 2006, the expense recognized for each stock award is reduced by an estimated forfeiture rate of 5.6%. The estimated forfeiture rate is based on the historical forfeiture rate, and will be adjusted to the actual forfeiture rate over the life of the stock awards accounted for under FAS No. 123(R).
The following assumptions were used to estimate fair value of stock options and SARs:
| | | Year Ended December 31, | |
| | | 2007 | | 2006 | | 2005 | |
| Estimated average lives | | | 6 years | | | | 6 years | | | | 5 years | | |
| Risk-free interest rate | | | 4.5 | % | | | 4.6 | % | | | 3.8 | % | |
| Expected volatility | | | 29.1 | %-29.5% | | | 26.7 | % | | | 43.0 | %-43.9% | |
| Weighted average volatility | | | 29.3 | % | | | 26.7 | % | | | 43.3 | % | |
| Dividend yield | | | 0.0 | % | | | 0.0 | % | | | 0.0 | % | |
| Weighted average grant date fair value | | $ | 4.50 | | | $ | 6.09 | | | $ | 7.22 | | |
A summary of stock option and stock-settled SARs activity for the year December 31, 2007 is presented in the following table:
| | | Year Ended December 31, 2007 | |
| | | Shares
(in '000's) | |
Weighted
Average
Exercise Price | | Weighted
Average
Contractual
Life | | Aggregate
Intrinsic
Value
(in '000's) | |
| Outstanding options and SARs at beginning of period | | | 3,146 | | | $ | 11.00 | | | | – | | | | – | | |
| SARs granted | | | 380 | | | | 11.82 | | | | – | | | | – | | |
| Options exercised | | | (49 | ) | | | 4.31 | | | | – | | | | – | | |
| Options forfeited | | | (31 | ) | | | 15.40 | | | | – | | | | – | | |
| SARs forfeited | | | (124 | ) | | | 14.57 | | | | – | | | | – | | |
| Outstanding options and SARs at end of period | | | 3,322 | | | | 11.01 | | | | 5.4 | | | $ | 10,569 | | |
| Outstanding options at end of period | | | 2,455 | | | | 9.64 | | | | 4.2 | | | | 10,408 | | |
| Outstanding SARs at end of period | | | 867 | | | | 14.91 | | | | 8.5 | | | | 161 | | |
| Options exercisable at end of period | | | 2,451 | | | | 9.63 | | | | 4.2 | | | | 10,408 | | |
| SARs exercisable at end of period | | | 193 | | | | 16.76 | | | | 8.1 | | | | – | | |
BLOUNT INTERNATIONAL, INC.
48
| | | Year Ended December 31, | |
| (Amounts in thousands) | | 2007 | | 2006 | | 2005 | |
| Intrinsic value of options exercised | | $ | 436 | | | $ | 2,410 | | | $ | 2,123 | | |
| Estimated fair value of options and SARs that vested | | | 2,310 | | | | 1,357 | | | | 1,200 | | |
| Share-based compensation cost recognized in income | | | 3,589 | | | | 3,253 | | | | 67 | | |
| Total tax benefit related to share-based compensation recognized | | | 1,168 | | | | 1,179 | | | | 11 | | |
| Total amount of cash received from options exercised | | | 210 | | | | 993 | | | | 12,994 | | |
| Tax benefit realized from options exercised | | | 114 | | | | 747 | | | | – | | |
| Cash used to settle equity instruments | | | – | | | | – | | | | – | | |
As of December 31, 2007, the total compensation cost related to awards not yet recognized was $1.7 million. The weighted-average period over which this expense is expected to be recognized is one year. The Company's policy upon the exercise of options or SARs has been to issue new shares into the market place.
Under certain conditions, stock options, SARs, restricted stock and restricted stock units ("RSUs") granted by the Company are eligible for continued vesting upon a qualified retirement of the employee. FAS No. 123(R) clarifies that the fair value of such stock-based compensation should be expensed based on an accelerated service period, or immediately, rather than ratably over the vesting period stated in the grant, for employees who are eligible for a qualified retirement prior to the completion of the vesting period. Prior to the adoption of FAS No. 123(R), the Company's pro forma disclosure reflected the expense of such options ratably over the stated vesting period. The SEC has recently clarified that companies should continue to follow the expense amortization method that they have been using for pro forma disclosure prior to adoption of FAS No. 123(R), and then apply the accelerated amortization schedule to all subsequent grants to those employees that became eligible for a qualified retirement within the vesting period. Had the Company been accounting for such stock options using the accelerated amortization schedule for those employees that were eligible for such a retirement or became eligible for such a retirement within the vesting period, the effect on stock-based compensation expense in the pro forma disclosure for the year ended December 31, 2005 would not have been material. The effect of applying accelerated amortization of expense recognized for those employees who were eligible or became eligible for a qualified retirement within the vesting period during the year ended December 31, 2006 was an increase of $0.8 million and an increase of $0.3 million during the year ended December 31, 2007.
The following table shows the effect on net earnings and earnings per share had compensation cost been recognized based upon the fair value at the grant dates in accordance with FAS No. 123 and FAS No. 148 "Accounting for Stock-Based Compensation—Transition and Disclosure—an Amendment of FASB Statement No. 123."
| (Amounts in thousands, except per share amounts) | | Year Ended December 31, 2005 | |
| Net income as reported | | $ | 106,615 | | |
Add: stock-based employee compensation cost, net of tax,
included in the reported results | | | 56 | | |
Deduct: total stock-based employee compensation cost, net of tax,
that would have been included in net income under fair value method | | | (776 | ) | |
| Pro forma net income | | $ | 105,895 | | |
| Basic earnings per share as reported | | $ | 2.31 | | |
| Pro forma basic earnings per share | | | 2.30 | | |
| Diluted earnings per share as reported | | | 2.24 | | |
| Pro forma diluted earnings per share | | | 2.23 | | |
Restricted Stock Awards. On August 24, 2006, the Company awarded 35,256 shares of restricted stock to an executive officer. The restricted stock had a fair value of $0.3 million on the grant date and vests two thirds after two years and one third after three years from the grant date. This award resulted in the immediate recognition of $0.3 million in compensation expense on the grant date because the executive officer was eligible for a qualified retirement on the grant date.
On March 1, 2007, the Company awarded 45,000 shares of restricted stock and 136,000 RSUs under its 2006 equity compensation plan. The restricted stock and RSUs had a fair value of $2.1 million on the grant date and generally vest over a three year period. The Company recognized $1.7 million of expense related to these stock awards in 2007. The effect of applying accelerated amortization of expense on these stock awards for those employees that were retirement eligible or become retirement eligible prior to the completion of the vesting period was an increase of $1.1 million in 2007.
Tax Benefits. The Company has elected to use the transition short-cut method to determine its pool of windfall tax
BLOUNT INTERNATIONAL, INC.
49
benefits in accordance with FAS No. 123(R). Tax attributes are determined under the tax law ordering method.
NOTE 14: SEGMENT INFORMATION
The Company identifies operating segments primarily based on management responsibility. The Company has one operating and reportable segment: Outdoor Products. The corporate and other category includes centralized administrative functions and a gear components manufacturing business. See also Note 2 regarding the disposition of the primary operating unit making up the Company's former Industrial and Power Equipment segment, and the disposition of the former Lawnmower segment. Outdoor Products manufactures and markets cutting chain, bars, sprockets and accessories for chainsaw use, concrete-cutting equipment, lawnmower blades and accessories for yard care equipment.
The accounting policies of the segment are the same as those described in the summary of significant accounting policies.
| | | Year Ended December 31, | |
| (Amounts in thousands) | | 2007 | | 2006 | | 2005 | |
| Sales: | |
| Outdoor Products | | $ | 486,739 | | | $ | 455,009 | | | $ | 452,334 | | |
| Corporate and other | | | 28,796 | | | | 32,485 | | | | 26,495 | | |
| Total sales | | $ | 515,535 | | | $ | 487,494 | | | $ | 478,829 | | |
| Operating income (expense): | |
| Outdoor Products | | $ | 95,932 | | | $ | 97,805 | | | $ | 105,536 | | |
| Corporate and other | | | (15,232 | ) | | | (17,345 | ) | | | (13,908 | ) | |
| Total operating income | | $ | 80,700 | | | $ | 80,460 | | | $ | 91,628 | | |
| Depreciation and amortization: | |
| Outdoor Products | | $ | 16,796 | | | $ | 14,212 | | | $ | 12,459 | | |
| Corporate and other | | | 4,796 | | | | 4,575 | | | | 4,185 | | |
| Total depreciation and amortization | | | 21,592 | | | | 18,787 | | | | 16,644 | | |
| Other non-cash charges | | | 3,223 | | | | 5,807 | | | | 67 | | |
| Total depreciation, amortization and other non-cash charges | | $ | 24,815 | | | $ | 24,594 | | | $ | 16,711 | | |
| Capital expenditures: | |
| Outdoor Products | | $ | 17,155 | | | $ | 20,630 | | | $ | 16,423 | | |
| Corporate and other | | | 1,362 | | | | 1,023 | | | | 884 | | |
| Total capital expenditures | | $ | 18,517 | | | $ | 21,653 | | | $ | 17,307 | | |
| Sales by major product line: | |
| Chainsaw components and accessories | | $ | 381,839 | | | $ | 360,332 | | | $ | 357,318 | | |
| Outdoor equipment parts and accessories | | | 74,276 | | | | 64,856 | | | | 67,995 | | |
| All others, less than 10% each | | | 59,420 | | | | 62,306 | | | | 53,516 | | |
| Total sales | | $ | 515,535 | | | $ | 487,494 | | | $ | 478,829 | | |
| Sales by geographic region: | |
| United States | | $ | 185,793 | | | $ | 186,512 | | | $ | 188,731 | | |
| European Union | | | 160,375 | | | | 143,838 | | | | 137,569 | | |
| Brazil | | | 24,735 | | | | 20,659 | | | | 22,383 | | |
| Russian Federation | | | 18,426 | | | | 14,403 | | | | 14,349 | | |
| Canada | | | 17,526 | | | | 18,199 | | | | 20,946 | | |
| All others, less than 3% each | | | 108,680 | | | | 103,883 | | | | 94,851 | | |
| Total sales | | $ | 515,535 | | | $ | 487,494 | | | $ | 478,829 | | |
The geographic sales information is by country of destination. One customer, Husqvarna AB, accounted for approximately 14% of sales in 2007, 2006 and 2005. While we expect this business relationship to continue, the loss of this customer could significantly affect our operations.
BLOUNT INTERNATIONAL, INC.
50
| | | December 31, | |
| (Amounts in thousands) | | 2007 | | 2006 | |
| Identifiable assets: | |
| Outdoor Products | | $ | 316,834 | | | $ | 285,917 | | |
| Corporate and other | | | 84,163 | | | | 77,267 | | |
| Total assets from continuing operations | | | 400,997 | | | | 363,184 | | |
| Discontinued operations | | | 10,952 | | | | 67,282 | | |
| Total assets | | $ | 411,949 | | | $ | 430,466 | | |
| Goodwill: | |
| Outdoor Products | | $ | 43,819 | | | $ | 43,819 | | |
| Corporate and other | | | 5,165 | | | | 5,165 | | |
| Discontinued operations | | | – | | | | 22,908 | | |
| Total goodwill | | $ | 48,984 | | | $ | 71,892 | | |
| Property, plant and equipment, net: | |
| United States | | $ | 41,673 | | | $ | 51,805 | | |
| Canada | | | 18,240 | | | | 21,446 | | |
| China | | | 15,310 | | | | 11,507 | | |
| Brazil | | | 11,201 | | | | 11,951 | | |
| European Union | | | 2,970 | | | | 2,685 | | |
| All others, less than 1% each | | | 335 | | | | 271 | | |
| Total property, plant and equipment, net | | $ | 89,729 | | | $ | 99,665 | | |
Property, plant and equipment is shown net of accumulated depreciation. Each of our business units purchases certain important materials from a limited number of suppliers that meet quality criteria. Although alternative sources of supply are available, the sudden elimination of certain suppliers could result in manufacturing delays, a reduction in product quality and a possible loss of sales in the near term.
NOTE 15: RELATED PARTY TRANSACTIONS
Lehman Brothers and its affiliates maintained a controlling ownership interest in the Company until December 2004. Following a public offering of the Company's stock by the Company in August 2004, a secondary public offering of the Company's stock by Lehman Brothers in December 2004, and a secondary public offering of the Company's stock by Lehman Brothers in June 2005, Lehman Brothers and its affiliates owned approximately 19% of the Company's outstanding common stock as of December 31, 2007 and 2006.
In March 2005, $3.2 million was paid to Lehman Brothers for previously accrued advisory fees relating to the 2004 Refinancing Transactions. In May 2005, Lehman Brothers paid $0.3 million for previously accrued costs incurred by the Company in conjunction with the secondary public offering that occurred in December 2004. In June 2005, as part of a secondary stock offering, the Company incurred $0.1 million in expenses, which were reimbursed by Lehman Brothers in October 2005.
NOTE 16: SUPPLEMENTAL CASH FLOW INFORMATION
| | | Year Ended December 31, | |
| (Amounts in thousands) | | 2007 | | 2006 | | 2005 | |
| Interest paid | | $ | 31,264 | | | $ | 33,044 | | | $ | 31,337 | | |
| Income taxes paid, net | | | 20,753 | | | | 9,873 | | | | 14,255 | | |
NOTE 17: FINANCIAL INSTRUMENTS AND CREDIT RISK CONCENTRATION
The Company has manufacturing or distribution operations in Australia, Brazil, Canada, China, Europe, Japan, Russia and the U.S. The Company sells to customers in these locations and other countries throughout the world. At December 31, 2007, approximately 32.8% of trade accounts receivable were from customers within the U.S. One customer accounted for 10.3% and 10.8% at December 31, 2007 and 2006, respectively, of the accounts receivable balance. No other customers accounted for 3% or more of accounts receivable at December 31, 2007 or 2006. Accounts receivable are principally from service and dealer groups, distributors, mass merchants, chainsaw manufacturers and other OEMs, and are normally not collateralized.
The carrying amount of cash and cash equivalents approximates fair value because of the short term maturity of those instruments. The carrying amount of accounts receivable approximates fair value because the maturity period is short and the Company has reduced the carrying amount to the estimated net realizable value with an allowance for doubtful accounts. The carrying amounts of the revolving credit facility and term debt approximate fair value because the interest rates are variable and the maturity periods for individual term borrowings are relatively
BLOUNT INTERNATIONAL, INC.
51
short. The fair market value of the fixed rate 87/8% senior subordinated notes is determined by reference to quoted market prices. The carrying amount of other financial instruments approximates fair value because of the short term maturity periods and variable interest rates associated with the instruments.
The estimated fair values of the 87/8% senior subordinated notes at December 31, 2007 and 2006 are as follows:
| | | 2007 | | 2006 | |
| (Amounts in thousands) | | Carrying
Amount | | Fair Value | | Carrying
Amount | | Fair Value | |
| 87/8% senior subordinated notes (see Note 7) | | $ | 175,000 | | | $ | 175,438 | | | $ | 175,000 | | | $ | 178,500 | | |
Foreign currency exchange rate movements create a degree of risk by affecting the U.S. dollar value of certain balance sheet positions denominated in foreign currencies. Additionally, the interest rates available in certain jurisdictions in which the Company holds cash may vary, thereby affecting the return on cash equivalent investments. The Company's practice is to use foreign currency and interest rate swap agreements to manage exposure to foreign currency and interest rate changes. The objective is to minimize earnings volatility resulting from conversion and the re-measurement of foreign currency balance sheet positions to U.S. Dollars. Changes in the fair value of non-derivative instruments are reported in current earnings as a component of interest income and were $0.1 million in 2007. There were no such instruments used in 2006 and 2005.
NOTE 18: CONSOLIDATING FINANCIAL INFORMATION
See Note 7 for a discussion of the Company's guarantor subsidiaries. The following consolidating financial information sets forth condensed consolidating statements of operations, balance sheets and cash flows of Blount International, Inc., Blount, Inc., the guarantor subsidiaries and the non-guarantor subsidiaries.
Condensed Consolidating Statement of Operations Information
| (Amounts in thousands) | | Blount
International,
Inc. | | Blount,
Inc. | | Guarantor
Subsidiaries | | Non-
Guarantor
Subsidiaries | | Eliminations | | Consolidated | |
| For the Year Ended December 31, 2007 | |
| Sales | | | – | | | $ | 375,561 | | | $ | 45,258 | | | $ | 327,975 | | | $ | (233,259 | ) | | $ | 515,535 | | |
| Cost of sales | | | – | | | | 252,856 | | | | 37,734 | | | | 283,052 | | | | (233,064 | ) | | | 340,578 | | |
| Gross profit | | | – | | | | 122,705 | | | | 7,524 | | | | 44,923 | | | | (195 | ) | | | 174,957 | | |
| Operating expenses | | | – | | | | 57,912 | | | | 3,947 | | | | 32,398 | | | | – | | | | 94,257 | | |
| Operating income | | | – | | | | 64,793 | | | | 3,577 | | | | 12,525 | | | | (195 | ) | | | 80,700 | | |
| Other, net | | $ | (23,015 | ) | | | (10,202 | ) | | | (729 | ) | | | 1,419 | | | | – | | | | (32,527 | ) | |
Income (loss) from continuing
operations before income taxes | | | (23,015 | ) | | | 54,591 | | | | 2,848 | | | | 13,944 | | | | (195 | ) | | | 48,173 | | |
| Provision (benefit) for income taxes | | | (7,634 | ) | | | 21,478 | | | | 1,267 | | | | 919 | | | | – | | | | 16,030 | | |
| Income (loss) from continuing operations | | | (15,381 | ) | | | 33,113 | | | | 1,581 | | | | 13,025 | | | | (195 | ) | | | 32,143 | | |
| Income (loss) from discontinued operations | | | – | | | | 11,477 | | | | (70 | ) | | | (693 | ) | | | – | | | | 10,714 | | |
| Equity in earnings of affiliated companies | | | 58,238 | | | | 13,648 | | | | 320 | | | | – | | | | (72,206 | ) | | | – | | |
| Net income | | $ | 42,857 | | | $ | 58,238 | | | $ | 1,831 | | | $ | 12,332 | | | $ | (72,401 | ) | | $ | 42,857 | | |
| For the Year Ended December 31, 2006 | |
| Sales | | | – | | | $ | 347,982 | | | $ | 49,088 | | | $ | 284,634 | | | $ | (194,210 | ) | | $ | 487,494 | | |
| Cost of sales | | | – | | | | 245,617 | | | | 40,478 | | | | 220,565 | | | | (192,845 | ) | | | 313,815 | | |
| Gross profit | | | – | | | | 102,365 | | | | 8,610 | | | | 64,069 | | | | (1,365 | ) | | | 173,679 | | |
| Operating expenses | | | – | | | | 60,400 | | | | 3,653 | | | | 29,166 | | | | – | | | | 93,219 | | |
| Operating income | | | – | | | | 41,965 | | | | 4,957 | | | | 34,903 | | | | (1,365 | ) | | | 80,460 | | |
| Other, net | | $ | (22,818 | ) | | | (10,703 | ) | | | (525 | ) | | | (23 | ) | | | – | | | | (34,069 | ) | |
Income (loss) from continuing
operations before income taxes | | | (22,818 | ) | | | 31,262 | | | | 4,432 | | | | 34,880 | | | | (1,365 | ) | | | 46,391 | | |
| Provision (benefit) for income taxes | | | (8,671 | ) | | | 11,880 | | | | 1,666 | | | | 8,871 | | | | – | | | | 13,746 | | |
| Income (loss) from continuing operations | | | (14,147 | ) | | | 19,382 | | | | 2,766 | | | | 26,009 | | | | (1,365 | ) | | | 32,645 | | |
| Income (loss) from discontinued operations | | | – | | | | 5,829 | | | | 4,479 | | | | (407 | ) | | | – | | | | 9,901 | | |
| Equity in earnings of affiliated companies | | | 56,693 | | | | 31,482 | | | | 209 | | | | – | | | | (88,384 | ) | | | – | | |
| Net income | | $ | 42,546 | | | $ | 56,693 | | | $ | 7,454 | | | $ | 25,602 | | | $ | (89,749 | ) | | $ | 42,546 | | |
BLOUNT INTERNATIONAL, INC.
52
Condensed Consolidating Statement of Operations Information
| (Amounts in thousands) | | Blount
International,
Inc. | | Blount,
Inc. | | Guarantor
Subsidiaries | | Non-
Guarantor
Subsidiaries | | Eliminations | | Consolidated | |
| For the Year Ended December 31, 2005 | |
| Sales | | | – | | | $ | 267,798 | | | $ | 122,583 | | | $ | 270,782 | | | $ | (182,334 | ) | | $ | 478,829 | | |
| Cost of sales | | | – | | | | 182,093 | | | | 93,677 | | | | 205,186 | | | | (183,209 | ) | | | 297,747 | | |
| Gross profit | | | – | | | | 85,705 | | | | 28,906 | | | | 65,596 | | | | 875 | | | | 181,082 | | |
| Operating expenses | | | – | | | | 46,588 | | | | 11,467 | | | | 31,399 | | | | – | | | | 89,454 | | |
| Operating income | | | – | | | | 39,117 | | | | 17,439 | | | | 34,197 | | | | 875 | | | | 91,628 | | |
| Other, net | | $ | (18,386 | ) | | | (16,296 | ) | | | (2,211 | ) | | | (777 | ) | | | – | | | | (37,670 | ) | |
Income (loss) from continuing
operations before income taxes | | | (18,386 | ) | | | 22,821 | | | | 15,228 | | | | 33,420 | | | | 875 | | | | 53,958 | | |
| Provision (benefit) for income taxes | | | (6,913 | ) | | | (39,328 | ) | | | 964 | | | | 11,021 | | | | – | | | | (34,256 | ) | |
| Income (loss) from continuing operations | | | (11,473 | ) | | | 62,149 | | | | 14,264 | | | | 22,399 | | | | 875 | | | | 88,214 | | |
| Income (loss) from discontinued operations | | | – | | | | 16,493 | | | | 1,908 | | | | – | | | | – | | | | 18,401 | | |
| Equity in earnings of affiliated companies | | | 118,088 | | | | 39,446 | | | | 335 | | | | – | | | | (157,869 | ) | | | – | | |
| Net income | | $ | 106,615 | | | $ | 118,088 | | | $ | 16,507 | | | $ | 22,399 | | | $ | (156,994 | ) | | $ | 106,615 | | |
Condensed Consolidating Balance Sheet Information
| (Amounts in thousands) | | Blount
International,
Inc. | | Blount,
Inc. | | Guarantor
Subsidiaries | | Non-
Guarantor
Subsidiaries | | Eliminations | | Consolidated | |
| December 31, 2007 | |
| Assets | |
| Cash and cash equivalents | | | – | | | $ | 10,512 | | | $ | 121 | | | $ | 46,956 | | | | – | | | $ | 57,589 | | |
| Accounts receivable, net | | | – | | | | 34,885 | | | | 4,881 | | | | 28,052 | | | | – | | | | 67,818 | | |
| Intercompany receivables | | | – | | | | 179,631 | | | | 82,438 | | | | 4,838 | | | $ | (266,907 | ) | | | – | | |
| Inventories | | | – | | | | 41,877 | | | | 6,860 | | | | 21,884 | | | | (348 | ) | | | 70,273 | | |
| Deferred income taxes | | | – | | | | 5,137 | | | | – | | | | 399 | | | | – | | | | 5,536 | | |
| Other current assets | | | – | | | | 8,706 | | | | 216 | | | | 7,471 | | | | – | | | | 16,393 | | |
| Total current assets | | | – | | | | 280,748 | | | | 94,516 | | | | 109,600 | | | | (267,255 | ) | | | 217,609 | | |
Investments in affiliated
companies | | $ | 213,950 | | | | 243,745 | | | | 852 | | | | 248 | | | | (458,795 | ) | | | – | | |
Property, plant and
equipment, net | | | – | | | | 31,345 | | | | 10,330 | | | | 48,054 | | | | – | | | | 89,729 | | |
| Goodwill and other assets | | | – | | | | 82,046 | | | | 11,893 | | | | 12,559 | | | | (1,887 | ) | | | 104,611 | | |
| Total Assets | | $ | 213,950 | | | $ | 637,884 | | | $ | 117,591 | | | $ | 170,461 | | | $ | (727,937 | ) | | $ | 411,949 | | |
| Liabilities and Stockholders' Equity (Deficit) | |
| Current maturities of long-term debt | | | – | | | $ | 1,242 | | | | – | | | | – | | | | – | | | $ | 1,242 | | |
| Accounts payable | | | – | | | | 15,835 | | | $ | 3,857 | | | $ | 10,107 | | | | – | | | | 29,799 | | |
| Intercompany payables | | $ | 266,907 | | | | – | | | | – | | | | – | | | $ | (266,907 | ) | | | – | | |
| Other current liabilities | | | – | | | | 39,264 | | | | 3,568 | | | | 15,148 | | | | – | | | | 57,980 | | |
| Total current liabilities | | | 266,907 | | | | 56,341 | | | | 7,425 | | | | 25,255 | | | | (266,907 | ) | | | 89,021 | | |
Long-term debt, excluding
current maturities | | | – | | | | 295,758 | | | | – | | | | – | | | | – | | | | 295,758 | | |
| Other liabilities | | | 1,189 | | | | 71,835 | | | | – | | | | 10,179 | | | | (1,887 | ) | | | 81,316 | | |
| Total liabilities | | | 268,096 | | | | 423,934 | | | | 7,425 | | | | 35,434 | | | | (268,794 | ) | | | 466,095 | | |
| Stockholders equity (deficit) | | | (54,146 | ) | | | 213,950 | | | | 110,166 | | | | 135,027 | | | | (459,143 | ) | | | (54,146 | ) | |
Total Liabilities and
Stockholders' Equity (Deficit) | | $ | 213,950 | | | $ | 637,884 | | | $ | 117,591 | | | $ | 170,461 | | | $ | (727,937 | ) | | $ | 411,949 | | |
BLOUNT INTERNATIONAL, INC.
53
Condensed Consolidating Balance Sheet Information
| (Amounts in thousands) | | Blount
International,
Inc. | | Blount,
Inc. | | Guarantor
Subsidiaries | | Non-
Guarantor
Subsidiaries | | Eliminations | | Consolidated | |
| December 31, 2006 | |
| Assets | |
| Cash and cash equivalents | | | – | | | | – | | | $ | 90 | | | $ | 29,398 | | | $ | (1,852 | ) | | $ | 27,636 | | |
| Accounts receivable, net | | | – | | | $ | 51,660 | | | | 5,817 | | | | 25,271 | | | | – | | | | 82,748 | | |
| Intercompany receivables | | | – | | | | 153,923 | | | | 83,240 | | | | 17,415 | | | | (254,578 | ) | | | – | | |
| Inventories | | | – | | | | 56,823 | | | | 5,519 | | | | 17,754 | | | | (2,263 | ) | | | 77,833 | | |
| Deferred income taxes | | | – | | | | 20,035 | | | | – | | | | 87 | | | | – | | | | 20,122 | | |
| Other current assets | | | – | | | | 2,926 | | | | 297 | | | | 5,119 | | | | – | | | | 8,342 | | |
| Total current assets | | | – | | | | 285,367 | | | | 94,963 | | | | 95,044 | | | | (258,693 | ) | | | 216,681 | | |
Investments in affiliated
companies | | $ | 150,652 | | | | 229,533 | | | | 532 | | | | 248 | | | | (380,965 | ) | | | – | | |
Property, plant and
equipment, net | | | – | | | | 41,370 | | | | 10,421 | | | | 47,874 | | | | – | | | | 99,665 | | |
| Goodwill and other assets | | | – | | | | 89,986 | | | | 13,089 | | | | 12,823 | | | | (1,778 | ) | | | 114,120 | | |
| Total Assets | | $ | 150,652 | | | $ | 646,256 | | | $ | 119,005 | | | $ | 155,989 | | | $ | (641,436 | ) | | $ | 430,466 | | |
| Liabilities and Stockholders' Equity (Deficit) | |
| Current maturities of long-term debt | | | – | | | $ | 1,500 | | | | – | | | | – | | | | – | | | $ | 1,500 | | |
| Accounts payable | | | – | | | | 23,319 | | | $ | 4,312 | | | $ | 9,203 | | | $ | (1,852 | ) | | | 34,982 | | |
| Intercompany payables | | $ | 254,578 | | | | – | | | | – | | | | – | | | | (254,578 | ) | | | – | | |
| Other current liabilities | | | – | | | | 41,815 | | | | 4,820 | | | | 15,702 | | | | – | | | | 62,337 | | |
| Total current liabilities | | | 254,578 | | | | 66,634 | | | | 9,132 | | | | 24,905 | | | | (256,430 | ) | | | 98,819 | | |
Long-term debt, excluding
current maturities | | | – | | | | 349,375 | | | | – | | | | – | | | | – | | | | 349,375 | | |
| Other liabilities | | | 1,365 | | | | 79,595 | | | | – | | | | 8,381 | | | | (1,778 | ) | | | 87,563 | | |
| Total liabilities | | | 255,943 | | | | 495,604 | | | | 9,132 | | | | 33,286 | | | | (258,208 | ) | | | 535,757 | | |
| Stockholders equity (deficit) | | | (105,291 | ) | | | 150,652 | | | | 109,873 | | | | 122,703 | | | | (383,228 | ) | | | (105,291 | ) | |
Total Liabilities and
Stockholders' Equity (Deficit) | | $ | 150,652 | | | $ | 646,256 | | | $ | 119,005 | | | $ | 155,989 | | | $ | (641,436 | ) | | $ | 430,466 | | |
Condensed Consolidating Cash Flows Information
| (Amounts in thousands) | | Blount
International,
Inc. | | Blount,
Inc. | | Guarantor
Subsidiaries | | Non-
Guarantor
Subsidiaries | | Eliminations | | Consolidated | |
| For the Year Ended December 31, 2007 | |
Net cash provided by
(used in) operating activities | | $ | 6,875 | | | $ | (3,145 | ) | | $ | (1,765 | ) | | $ | 27,524 | | | $ | 1,852 | | | $ | 31,341 | | |
| Proceeds from sale of property, plant & equipment | | | – | | | | 411 | | | | 1,623 | | | | 275 | | | | – | | | | 2,309 | | |
| Purchase of property, plant and equipment | | | – | | | | (10,717 | ) | | | (1,496 | ) | | | (6,304 | ) | | | – | | | | (18,517 | ) | |
| Discontinued operations | | | – | | | | 69,071 | | | | – | | | | – | | | | – | | | | 69,071 | | |
| Net cash provided by (used in) investing activities | | | – | | | | 58,765 | | | | 127 | | | | (6,029 | ) | | | – | | | | 52,863 | | |
| Net borrowings under revolving credit facility | | | – | | | | (27,000 | ) | | | – | | | | – | | | | – | | | | (27,000 | ) | |
| Repayment of long-term debt | | | – | | | | (26,875 | ) | | | – | | | | – | | | | – | | | | (26,875 | ) | |
| Advances from (to) affiliates | | | (7,199 | ) | | | 9,467 | | | | 1,669 | | | | (3,937 | ) | | | – | | | | – | | |
| Other | | | 324 | | | | (700 | ) | | | – | | | | – | | | | – | | | | (376 | ) | |
| Net cash provided by (used in) financing activities | | | (6,875 | ) | | | (45,108 | ) | | | 1,669 | | | | (3,937 | ) | | | – | | | | (54,251 | ) | |
| Net increase in cash and cash equivalents | | | – | | | | 10,512 | | | | 31 | | | | 17,558 | | | | 1,852 | | | | 29,953 | | |
| Cash and cash equivalents at beginning of period | | | – | | | | – | | | | 90 | | | | 29,398 | | | | (1,852 | ) | | | 27,636 | | |
| Cash and cash equivalents at end of period | | $ | – | | | $ | 10,512 | | | $ | 121 | | | $ | 46,956 | | | $ | – | | | $ | 57,589 | | |
BLOUNT INTERNATIONAL, INC.
54
Condensed Consolidating Cash Flows Information
| For the Year Ended December 31, 2006 | |
| (Amounts in thousands) | | Blount
International,
Inc. | | Blount,
Inc. | | Guarantor
Subsidiaries | | Non-
Guarantor
Subsidiaries | | Eliminations | | Consolidated | |
Net cash provided by
(used in) operating activities | | $6,997 | | $31,265 | | $(5,512) | | $28,281 | | $(1,015) | | $60,016 | |
Proceeds from sale of property,
plant & equipment | | – | | 41 | | 1 | | 1,202 | | – | | 1,244 | |
| Purchase of property, plant and equipment | | – | | (11,229) | | (1,104) | | (9,320) | | – | | (21,653) | |
| Discontinued operations | | – | | (919) | | 32,322 | | (503) | | – | | 30,900 | |
| Net cash provided by (used in) investing activities | | – | | (12,107) | | 31,219 | | (8,621) | | – | | 10,491 | |
| Net borrowings under revolving credit facility | | – | | 27,000 | | – | | – | | – | | 27,000 | |
| Repayment of long-term debt | | – | | (79,195) | | – | | (4,653) | | – | | (83,848) | |
| Advances from (to) affiliates | | (8,737) | | 33,694 | | (25,617) | | 660 | | – | | – | |
| Other | | 1,740 | | (700) | | – | | – | | – | | 1,040 | |
| Net cash provided by (used in) financing activities | | (6,997) | | (19,201) | | (25,617) | | (3,993) | | – | | (55,808) | |
| Net decrease in cash and cash equivalents | | – | | (43) | | 90 | | 15,667 | | (1,015) | | 14,699 | |
| Cash and cash equivalents at beginning of period | | – | | 43 | | – | | 13,731 | | (837) | | 12,937 | |
| Cash and cash equivalents at end of period | | $– | | $– | | $90 | | $29,398 | | $(1,852) | | $27,636 | |
| For the Year Ended December 31, 2005 | |
Net cash provided by
(used in) operating activities | | $6,091 | | $39,143 | | $3,008 | | $15,247 | | $1,623 | | $65,112 | |
Proceeds from sale of property,
plant & equipment | | – | | 351 | | 1 | | 30 | | – | | 382 | |
| Purchase of property, plant and equipment | | – | | (4,416) | | (2,423) | | (10,468) | | – | | (17,307) | |
| Discontinued operations | | – | | (1,436) | | (586) | | – | | – | | (2,022) | |
| Net cash provided by (used in) investing activities | | – | | (5,501) | | (3,008) | | (10,438) | | – | | (18,947) | |
| Repayment of long-term debt | | – | | (86,268) | | – | | (220) | | – | | (86,488) | |
| Advances from (to) affiliates | | (13,335) | | 13,106 | | – | | 229 | | – | | – | |
| Dividends from (to) affiliates | | – | | 24,888 | | – | | (24,888) | | – | | – | |
| Other | | 7,244 | | (2,554) | | – | | – | | – | | 4,690 | |
| Net cash provided by (used in) financing activities | | (6,091) | | (50,828) | | – | | (24,879) | | – | | (81,798) | |
| Net decrease in cash and cash equivalents | | – | | (17,186) | | – | | (20,070) | | 1,623 | | (35,633) | |
| Cash and cash equivalents at beginning of period | | – | | 17,229 | | – | | 33,801 | | (2,460) | | 48,570 | |
| Cash and cash equivalents at end of period | | $– | | $43 | | $– | | $13,731 | | $(837) | | $12,937 | |
NOTE 19: RECENT ACCOUNTING PRONOUNCEMENTS
In September 2006, the FASB issued FAS No. 157, "Fair Value Measurements" ("FAS No. 157"). FAS No. 157 defines fair value, establishes a framework for measuring fair value in accordance with accounting principles generally accepted in the U.S., and expands disclosures about fair value measurements. The provisions of FAS No. 157 are effective for the Company's fiscal year beginning January 1, 2008. The Company is currently evaluating the impact of the provisions of FAS No. 157.
In February 2007, the FASB issued FAS No. 159, "Fair Value Option for Financial Assets and Financial Liabilities—Including an amendment of FASB Statement No. 115" ("FAS No. 159"). FAS No. 159 permits entities to choose to measure many financial instruments and certain other items at fair value. The provisions of FAS No. 159 are effective for us on January 1, 2008. The Company is currently evaluating the impact of the provisions of FAS No. 159.
In December 2007, the FASB issued FAS No. 141(R), "Business Combinations" ("FAS No. 141(R)"). FAS No. 141(R) replaces FAS No. 141, Business Combinations and improves the relevance, representational faithfulness, and comparability of the information that a reporting entity provides in its financial reports about a business combination and its effects. The provisions of FAS No. 141(R) are effective for the Company on January 1, 2009. The impact of adopting FAS No. 141(R) will depend on the nature, terms and size of business combinations completed after the effective date.
BLOUNT INTERNATIONAL, INC.
55
In December 2007, the FASB issued FAS No. 160, "Noncontrolling Interests in Consolidated Financial Statements" ("FAS No. 160"). FAS No 160 amends Accounting Research Bulletin No. 51, Consolidated Financial Statements, and improves the relevance, comparability, and transparency of the financial information that a reporting entity provides in its consolidated financial statements for those entities that have an outstanding noncontrolling interest in one or more subsidiaries or that deconsolidate a subsidiary. The provisions of FAS No. 160 are effective for the Company on January 1, 2009. Earlier adoption is prohibited. The adoption of FAS No. 160 is not anticipated to have a material impact on the financial position and results of operations of the Company.
In December 2007, the SEC issued Staff Accounting Bulletin No. 110 ("SAB 110") which extended the continued use of the simplified method for estimating lives of stock options and SARs. We are continuing to use the simplified method in accounting for our stock-based compensation costs.
BLOUNT INTERNATIONAL, INC.
56
SUPPLEMENTARY DATA
QUARTERLY RESULTS OF OPERATIONS
(Unaudited)
The following tables set forth a summary of the unaudited quarterly results of operations for 2007 and 2006.
2007 results were as follows:
| (Amounts in thousands except per share data) | | 1st Quarter | | 2nd Quarter | | 3rd Quarter | | 4th Quarter | | Total 2007 | |
| Sales | | $ | 118,316 | | | $ | 135,580 | | | $ | 129,853 | | | $ | 131,786 | | | $ | 515,535 | | |
| Gross profit | | | 40,055 | | | | 46,276 | | | | 43,926 | | | | 44,700 | | | | 174,957 | | |
| Net income | | | 4,666 | | | | 11,182 | | | | 9,443 | | | | 17,566 | | | | 42,857 | | |
| Net income per share: | |
| Basic | | $ | 0.10 | | | $ | 0.24 | | | $ | 0.20 | | | $ | 0.37 | | | $ | 0.91 | | |
| Diluted | | | 0.10 | | | | 0.23 | | | | 0.20 | | | | 0.37 | | | | 0.89 | | |
The fourth quarter includes $4.5 million in severance, impairment and closure costs and a pretax gain of $26.0 million related to the sale of our Forestry Division.
2006 results were as follows:
| (Amounts in thousands except per share data) | | 1st Quarter | | 2nd Quarter | | 3rd Quarter | | 4th Quarter | | Total 2006 | |
| Sales | | $ | 121,887 | | | $ | 123,167 | | | $ | 119,754 | | | $ | 122,686 | | | $ | 487,494 | | |
| Gross profit | | | 44,336 | | | | 42,035 | | | | 41,285 | | | | 46,023 | | | | 173,679 | | |
| Net income | | | 8,957 | | | | 9,427 | | | | 15,124 | | | | 9,038 | | | | 42,546 | | |
| Net income per share: | |
| Basic | | $ | 0.19 | | | $ | 0.20 | | | $ | 0.32 | | | $ | 0.19 | | | $ | 0.90 | | |
| Diluted | | | 0.19 | | | | 0.20 | | | | 0.32 | | | | 0.19 | | | | 0.89 | | |
Net income includes pre-tax charges of $2.2 million in the second quarter and $4.7 million in the third quarter for employee severance and benefits costs, impairment of assets and transition costs related to discontinued operations. The third quarter also includes a pretax gain of $17.7 million related to the sale of net assets from discontinued operations. In addition, the third quarter includes $4.8 million in non-recurring charges related to the redesign of retirement plans and a plant closure.
ITEM 9. CHANGES IN AND DISAGREEMENTS WITH ACCOUNTANTS ON ACCOUNTING AND FINANCIAL DISCLOSURE
None.
ITEM 9A. CONTROLS AND PROCEDURES
Company management is responsible for establishing and maintaining adequate internal control over financial reporting as such term is defined under the Exchange Act rules. The Company maintains financial reporting and disclosure controls and procedures that are designed to ensure that information required to be disclosed in the Company's Exchange Act reports is recorded, processed, summarized and reported within the time periods specified in the Securities and Exchange Commission's rules and forms, and that such information is accumulated and communicated to the Company's management, including its Chief Executive Officer and Chief Financial Officer, as appropriate, to allow for timely decisions regarding required disclosure. In designing and evaluating the financial reporting and disclosure controls and procedures, management recognizes that any controls and procedures, no matter how well designed and operated, can provide only reasonable assurance of achieving the desired control objectives, and management is required to apply its judgment in evaluating the cost-benefit relationship of possible controls and procedures.
The Company, under the supervision and with the participation of the Company's management, including the Company's Chief Executive Officer and Chief Financial Officer, assessed the effectiveness of the design and operation of the Company's financial reporting and disclosure controls and procedures. The Committee of Sponsoring Organizations ("COSO") framework was applied in performing this assessment. Based on this assessment, the Company's Chief Executive Officer and Chief Financial Officer concluded that the Company's financial reporting and disclosure controls and procedures were effective at the reasonable assurance level as of the end of the period covered by this report.
Management's report on internal control over financial reporting and the related audit report of PricewaterhouseCoopers LLP are included in Item 8 of this Report.
There have been no changes in the Company's internal control over financial reporting during the Company's most recent fiscal quarter that have materially affected, or are reasonably likely to materially affect, the Company's internal control over financial reporting.
ITEM 9B. OTHER INFORMATION
None.
BLOUNT INTERNATIONAL, INC.
57
PART III
ITEM 10. DIRECTORS AND EXECUTIVE OFFICERS OF THE REGISTRANT
See the "Election of Directors", "Executive Officers", "Audit Committee Disclosure" and "Filing Disclosure" sections of our Proxy Statement for the 2008 Annual Meeting of Stockholders, which sections are incorporated herein by reference.
ITEM 11. EXECUTIVE COMPENSATION
See the "Executive Compensation", "Compensation of Directors", "Compensation Committee Interlocks and Insider Participation" and "Employment Contracts" sections of our Proxy Statement for the 2008 Annual Meeting of Stockholders, which sections are incorporated herein by reference.
ITEM 12. SECURITY OWNERSHIP OF CERTAIN BENEFICIAL OWNERS AND MANAGEMENT AND RELATED STOCKHOLDER MATTERS
See the "Principal Stockholders" and "Equity Compensation Plan Information" sections of our Proxy Statement for the 2008 Annual Meeting of Stockholders, which sections are incorporated herein by reference.
ITEM 13. CERTAIN RELATIONSHIPS AND RELATED TRANSACTIONS
See the "Certain Transactions and Other Matters" section of our Proxy Statement for the 2008 Annual Meeting of Stockholders, which section is incorporated herein by reference.
ITEM 14. PRINCIPAL ACCOUNTING FEES AND SERVICES
See the "Ratify the Appointment of Independent Auditors" section of our Proxy Statement for the 2008 Annual Meeting of Stockholders, which section is incorporated herein by reference.
BLOUNT INTERNATIONAL, INC.
58
PART IV
ITEM 15. EXHIBITS AND FINANCIAL STATEMENT SCHEDULES
(A) Certain documents filed as part of Form 10-K
(1) Financial Statements and Supplementary Data
| Report of Independent Registered Public Accounting Firm | | | 30 | | |
|
Consolidated Statements of Income for the years ended
December 31, 2007, 2006 and 2005 | | | 31 | | |
|
| Consolidated Balance Sheets as of December 31, 2007 and 2006 | | | 32 | | |
|
Consolidated Statements of Cash Flows for the years ended
December 31, 2007, 2006 and 2005 | | | 33 | | |
|
Consolidated Statements of Changes in Stockholders' Equity (Deficit) for
the years ended December 31, 2007, 2006 and 2005 | | | 34 | | |
|
| Notes to Consolidated Financial Statements | | | 35 | | |
|
| Supplementary Data | | | 57 | | |
|
(2) Financial Statement Schedules
Schedule II – Valuation and qualifying accounts for the years ended
December 31, 2007, 2006 and 2005 | | | 63 | | |
|
All other schedules have been omitted because they are not required or because the information is presented in the Notes to Consolidated Financial Statements.
(B) Exhibits required by Item 601 of Regulation S-K:
*2(a) Agreement and Plan of Merger and Recapitalization, dated as of April 18, 1999, between Blount International, Inc., and Red Dog Acquisition, Corp. (included as Appendix A to the Proxy Statement-Prospectus which forms a part of the Registration Statement) previously filed on July 15, 1999, by Blount International, Inc. (Reg. No. 333-82973).
*3(a) Post-Merger Restated Certificate of Incorporation of Blount International, Inc. (included as Exhibit A to the Agreement and Plan of Merger and Recapitalization which is Exhibit 2.1) filed as part of the Proxy Statement-Prospectus which forms a part of the Registration Statement on Form S-4 (Reg. No. 333-82973) previously filed on July 15, 1999, by Blount International, Inc.
*3(b) Post-Merger Bylaws of Blount International, Inc. (included as Exhibit B to the Agreement and Plan of Merger and Recapitalization which is Exhibit 2.1) filed as part of the Proxy Statement-Prospectus which forms a part of the Registration Statement on Form S-4 (Reg. No. 333-82973).
*4(a) Registration Rights and Stock Transfer Restriction agreement filed as part of Registration Statement on Form S-4 (Reg. No. 33-63141) of Blount International, Inc., including amendments and exhibits, which became effective on October 4, 1995 (Commission File No. 33-63141).
*4(b) Form of stock certificate of New Blount common stock filed as part of the Proxy Statement-Prospectus which forms a part of the Registration Statement on Form S-4 (Reg. No. 333-82973) filed by Blount International, Inc. on July 15, 1999.
*4(c) Registration Right Agreement by and among Blount, Inc., Blount International, Inc., BI Holdings Corp., Benjamin F. Shaw Company, BI. L.L.C., Blount Development Corp., Omark Properties, Inc., Gear Products, Inc., Dixon Industries, Inc., Frederick Manufacturing Corporation, Federal Cartridge Company, Simmons Outdoor
BLOUNT INTERNATIONAL, INC.
59
Corporation, Mocenplaza Development Corp., CTR Manufacturing, Inc., and Lehman Brothers, Inc. dated as of August 19, 1999, filed as Exhibit 4.2 to the report on Form 10-Q for the third quarter ended September 30, 1999.
*4(d) Amended and Restated Credit Agreement dated as of August 9, 2004 among Blount Inc., Dixon Industries, Inc., Fabtek Corporation, Frederick Manufacturing Corporation, Gear Products, Inc., Omark Properties, Inc., and Windsor Forestry Tools LLC, as US Borrowers, Blount Canada Ltd., as Canadian Borrower, the other credit parties signatory thereto, as Credit Parties, from time to time, as Lenders, General Electric Capital Corporation, as Administrative Agent and US Lender, and General Electric Capital Canada Inc., as Canadian Administrative Agent and Canadian Lender, GECC Capital Markets Group Inc., as Lead Arranger and Book Runner and BNP PARIBAS, as Syndication Agent, which was filed as Exhibit 99.1 to Form 10-Q for the quarter ended September 30, 2004.
*4(e) Amendment No. 1 dated as of December 1, 2004 to the Amended and Restated Senior Credit Amendment dated August 9, 2004 among Blount Inc., Dixon Industries, Inc., Fabtek Corporation, Frederick Manufacturing Corporation, Gear Products, Inc., Omark Properties, Inc., and Windsor Forestry Tools LLC, as US Borrowers, Blount Canada Ltd., as Canadian Borrower, the other credit parties signatory thereto, as Credit Parties, from time to time, as Lenders, General Electric Capital Corporation, as Administrative Agent and US Lender, and General Electric Capital Canada Inc., as Canadian Administrative Agent and Canadian Lender, GECC Capital Markets Group Inc., as Lead Arranger and Book Runner and BNP PARIBAS, as Syndication Agent, which was filed as Exhibit 99.1 to the report on Form 8-K filed by Blount International, Inc., on December 3, 2004.
*4(f) Third amendment to Amended and Restated Credit Agreement and First Amendment to Amended and Restated US Security Agreement dated as of March 23, 2006, by and among Blount Inc., Dixon Industries, Inc., Fabtek Corporation, Frederick Manufacturing Corporation, Gear Products, Inc., Omark Properties, Inc., and Windsor Forestry Tools LLC, as US Borrowers, Blount Canada Ltd., as Canadian Borrower, the other credit parties signatory thereto, as Credit Parties, from time to time, as Lenders, General Electric Capital Corporation, as Administrative Agent and US Lender, and GE CFS Canada Holding Company, as Canadian Administrative Agent and Canadian Lender, which was filed as Exhibit 1.1 to the report on Form 8-K filed by Blount International, Inc., on March 23, 2006.
*4(g) Registration Statement on Form S-1 (Reg. No. 333-114840) with respect to the 87/8% Senior Subordinated Notes of Blount, Inc. which are guaranteed by BI, LLC, Omark Properties, Inc., 4520 Corp., Inc., Gear Products, Inc., Dixon Industries, Inc., Frederick Manufacturing Corporation, Fabtek Corporation and Windsor Forestry Tools LLC and 10,000,000 shares of common stock of Blount International, Inc. including amendments and exhibits, which became effective on August 3, 2004.
*4(h) Registration Statement on Form S-3 (Reg. No. 333-132024) with respect to 9,248,218 shares of common stock of Blount International, Inc., which became effective May 2, 2006.
*9(a) Stockholder Agreement, dated as of April 18, 1999, between Red Dog Acquisition, corp., a Delaware corporation and a wholly-owned subsidiary of Lehman Brothers Merchant Banking Partners II L.P., a Delaware limited partnership, and The Blount Holding Company, L.P., a Delaware limited partnership which was filed as Exhibit 9 to the Form 8-K/A filed April 20, 1999.
*10(a) Supplemental Retirement and Disability Plan of Blount, Inc. which was filed as Exhibit 10(e) to the Annual Report of Blount, Inc., on Form 10-K for the fiscal year ended February 29, 1992 (Commission File No. 1-7002).
*10(b) Written description of the Blount International, Inc. 2006 Executive Management Annual Incentive Plan , Effective as of January 1, 2006, filed as Exhibit A to the Proxy Statement of Blount, International, Inc. for the Annual Meeting of Stockholders held April 25, 2006 (Commission File No. 001-11549).
*10(c) Supplemental Retirement Savings Plan of Blount, Inc. which was filed as Exhibit 10(i) to the Annual Report of Blount, Inc. on Form 10-K for the fiscal year ended February 29, 1992 (Commission File No. 1-7002).
*10(d) Blount, Inc. Executive Benefit Plans Trust Agreement and Amendment to and Assumption of Blount, Inc. Executive Benefit Plans Trust which were filed as Exhibits 10(x)(i) and 10(x)(ii) to the Annual Report of Blount International, Inc. on Form 10-K for the fiscal year ended February 29, 1996 (Commission File No. 001-11549).
BLOUNT INTERNATIONAL, INC.
60
*10(e) Blount, Inc. Benefits Protection Trust Agreement and Amendment To ad Assumption of Blount, Inc. Benefits Protection Trust which were filed as Exhibits 10(y)(i) and 10(y)(ii) to the Annual Report of Blount International, Inc. on Form 10-K for the fiscal year ended February 29, 1996 (Commission File No. 001-11549).
*10(f) Blount International, Inc. 2006 Equity Incentive Plan filed as Exhibit B to the Proxy Statement of Blount, International, Inc. for the Annual Meeting of Stockholders held April 25, 2006 (Commission File No. 001-11549), and the Amendment to the Blount International, Inc. 2006 Equity Incentive Plan dated as of February 23, 2007, as part of exhibits to the Registration Statement on Form S-8 (Reg. No. 333-149584), which became effective on March 6, 2008.
*10(g) 1999 Stock Incentive Plan and 2000 Stock Incentive Plan of Blount International, Inc. filed as part of Registration Statement on Form S-8 (Reg. No. 333-913-90) exhibits, which became effective June 27, 2002.
*10(h) The Blount Deferred Compensation Plan which was filed as Exhibit 10(cc) to the Annual Report of Blount International, Inc. on Form 10-K for the year ended December 31, 1998 (Commission File No. 001-11549).
*10(i) Employment Agreement, dated as of April 18, 1999, between Blount International, Inc. and Richard H. Irving, III filed as part of Registration Statement on Form S-4 (Reg. No. 333-92481) of Blount International, Inc., including amendments and exhibits, which became effective January 19, 2000.
*10(j) Employee Stockholder Agreement dated as of August 19, 1999, among Blount International, Inc., Lehman Brothers Merchant Banking Partners II L.P. and Certain Employee Stockholders.
*10(k) Amendment to Employment Agreement between Blount Inc. and Kenneth O. Saito dated August 16, 2002.
*10(l) Amendment to Employment Agreement between Blount International and Richard H. Irving, III dated February 14, 2002.
*10(m) Amendment to Employment Agreement between Blount International and Richard H. Irving, III dated August 19, 2002.
*10(n) Employment Agreement between Blount, Inc. and Kenneth O. Saito dated June 1, 1999.
*10(o) Amended and Restated Employment Agreement between Blount International, Inc. and James S. Osterman dated February 2, 2004.
*10(p) Amended and Restated Employment Agreement between Blount International, Inc. and Calvin E. Jenness dated March 1, 2004.
**10(q) Asset Purchase Agreement by and among Caterpillar Forest Products Inc., Caterpillar Inc. and the Caterpillar Subsidiaries set forth therein and Blount, Inc., Blount International, Inc. and the Blount Subsidiaries set forth therein dated November 5, 2007.
*14 Code of Ethics for Covered Officers as approved by Audit Committee on February 2, 2004.
21 A list of the significant subsidiaries of Blount International, Inc. included herein on page 64.
31.1 Certification pursuant to section 302 of the Sarbanes-Oxley Act of 2002 by James O. Osterman, Chief Executive Officer included herein on page 65.
31.2 Certification pursuant to section 302 of the Sarbanes-Oxley Act of 2002 by Calvin E. Jenness Chief Financial Officer included herein on page 66.
**32.1 Certification pursuant to section 906 of the Sarbanes-Oxley Act of 2002 by James O. Osterman, Chief Executive Officer.
**32.2 Certification pursuant to section 906 of the Sarbanes-Oxley Act of 2002 by Calvin E. Jenness Chief Financial Officer.
* Incorporated by reference
** Filed electronically herewith. Copies of such exhibits may be obtained upon written request from:
Blount International, Inc.
P.O. Box 22127
Portland, Oregon 97269-2127
BLOUNT INTERNATIONAL, INC.
61
SIGNATURES
Pursuant to the requirements of Section 13 or 15(d) of the Securities Exchange Act of 1934, the Registrant had duly caused this report to be signed on its behalf by the undersigned, thereunto duly authorized.
BLOUNT INTERNATIONAL, INC.
By: /s/ Calvin E. Jenness
Calvin E. Jenness
Senior Vice President and
Chief Financial Officer
By: /s/ Mark V. Allred
Mark V. Allred
Vice President and Controller
(Principal Accounting Officer)
Dated: March 13, 2008
Pursuant to the requirements of the Securities Exchange Act of 1934, this report is signed below by the following persons on behalf of the Registrant and in the capacities and on the dates indicated.
Dated: March 13, 2008
| /s/ | | Eliot M. Fried | | Lead Director | | | |
|
| | | Eliot M. Fried | | | | | |
|
| /s/ | | Harold E. Layman | | Director | | | |
|
| | | Harold E. Layman | | | | | |
|
| /s/ | | R. Eugene Cartledge | | Director | | | |
|
| | | R. Eugene Cartledge | | | | | |
|
| /s/ | | James S. Osterman | | Chairman and Chief Executive Officer and Director | | | |
|
| | | James S. Osterman | | | | | |
|
| /s/ | | Joshua L. Collins | | Director | | | |
|
| | | Joshua L. Collins | | | | | |
|
| /s/ | | E. Daniel James | | Director | | | |
|
| | | E. Daniel James | | | | | |
|
| /s/ | | Thomas J. Fruechtel | | Director | | | |
|
| | | Thomas J. Fruechtel | | | | | |
|
| /s/ | | Robert D. Kennedy | | Director | | | |
|
| | | Robert D. Kennedy | | | | | |
|
BLOUNT INTERNATIONAL, INC.
62
SCHEDULE II
CONSOLIDATED SCHEDULE OF VALUATION AND QUALIFYING ACCOUNTS
Blount International, Inc. and Subsidiaries
| (Dollar amounts in millions) | |
| Column A | | Column B | | Column C | | Column D | | Column E | |
| Description | | Balance at
Beginning
of Period | | Additions
Charged to
Cost and
Expenses | | Deductions | | Balance at
End of
Period | |
| Year Ended December 31, 2007: | |
| Allowance for doubtful accounts receivable | | $2,545 | | $(428) | | $64 | | $2,181 | |
| Valuation allowance for deferred tax assets | | 2,667 | | – | | (349) | | 2,318 | |
| Year Ended December 31, 2006: | |
| Allowance for doubtful accounts receivable | | 2,239 | | 245 | | 61 | | 2,545 | |
| Valuation allowance for deferred tax assets | | 2,907 | | 272 | | (512) | | 2,667 | |
| Year Ended December 31, 2005: | |
| Allowance for doubtful accounts receivable | | 2,371 | | 271 | | (403) | | 2,239 | |
| Valuation allowance for deferred tax assets | | 57,867 | | (54,033) | | (927) | | 2,907 | |
BLOUNT INTERNATIONAL, INC.
63
EXHIBIT 21
SUBSIDIARIES OF THE REGISTRANT
At December 31, 2007, consolidated, directly or indirectly, wholly-owned Significant Subsidiaries of Blount International, Inc. were deemed as follows:
| NAME OF SUBSIDIARY | | PLACE OF INCORPORATION | |
| Blount, Inc. | | Delaware | |
| Blount Canada Ltd. | | Canada | |
| Blount Europe, S.A. | | Belgium | |
| Blount Holdings Ltd. | | Canada | |
| Blount Industrial LTDA | | Brazil | |
The names of certain subsidiaries have been omitted because when considered in the aggregate or as a single subsidiary they would not constitute a "Significant Subsidiary" as of December 31, 2007.
BLOUNT INTERNATIONAL, INC.
64
EXHIBIT 31.1
CERTIFICATIONS PURSUANT TO SECTION 302 OF THE SARBANES-OXLEY ACT OF 2002
I, James S. Osterman, certify that:
1. I have reviewed this annual report on Form 10-K for the period ended December 31, 2007 of Blount International, Inc.;
2. Based on my knowledge, this annual report does not contain any untrue statement of a material fact or omit to state a material fact necessary to make the statements made, in light of the circumstances under which such statements were made, not misleading with respect to the period covered by this report;
3. Based on my knowledge, the financial statements, and other financial information included in this report, fairly present in all material respects the financial condition, results of operations and cash flows of the registrant as of, and for, the periods presented in this report;
4. The registrant's other certifying officer and I are responsible for establishing and maintaining disclosure controls and procedures (as defined in Exchange Act Rules 13a-15(e) and 15d-15(e)) and internal control over financial reporting (as defined in Exchange Act Rules 13a-15(f) and 15d-15(f)) for the registrant and we have:
(a) designed such disclosure controls and procedures, or caused such disclosure controls and procedures to be designed under our supervision, to ensure that material information relating to the registrant, including its consolidated subsidiaries, is made known to us by others within those entities, particularly during the period in which this report is being prepared;
(b) designed such internal controls over financial reporting, or caused such internal controls over financial reporting to be designed under our supervision, to provide reasonable assurance regarding the reliability of financial reporting and the preparation of financial statements for external purposes in accordance with generally accepted accounting principles;
(c) evaluated the effectiveness of the registrant's disclosure controls and procedures and presented in this report our conclusions about the effectiveness of the disclosure controls and procedures, as of the end of the period covered by this report based on such evaluation; and
(d) disclosed in this report any change in the registrant's internal control over financial reporting that occurred during the registrant's most recent fiscal quarter (the registrant's fourth fiscal quarter in the case of an annual report) that has materially affected, or is reasonably likely to materially affect, the registrant's internal control over financial reporting; and
5. The registrant's other certifying officer and I have disclosed, based on our most recent evaluation of internal control over financial reporting, to the registrant's auditors and the audit committee of the registrant's board of directors:
(a) all significant deficiencies and material weaknesses in the design or operation of internal control over financial reporting which are reasonably likely to adversely affect the registrant's ability to record, process, summarize and report financial information; and
(b) any fraud, whether or not material, that involves management or other employees who have a significant role in the registrant's internal controls.
Date: March 13, 2008
| /s/ James S. Osterman | |
|
James S. Osterman
Chairman and
Chief Executive Officer | |
|
BLOUNT INTERNATIONAL, INC.
65
EXHIBIT 31.2
CERTIFICATIONS PURSUANT TO SECTION 302 OF THE SARBANES-OXLEY ACT OF 2002
I, Calvin E. Jenness, certify that:
1. I have reviewed this annual report on Form 10-K for the period ended December 31, 2007 of Blount International, Inc.;
2. Based on my knowledge, this annual report does not contain any untrue statement of a material fact or omit to state a material fact necessary to make the statements made, in light of the circumstances under which such statements were made, not misleading with respect to the period covered by this report;
3. Based on my knowledge, the financial statements, and other financial information included in this report, fairly present in all material respects the financial condition, results of operations and cash flows of the registrant as of, and for, the periods presented in this report;
4. The registrant's other certifying officer and I are responsible for establishing and maintaining disclosure controls and procedures (as defined in Exchange Act Rules 13a-15(e) and 15d-15(e)) and internal control over financial reporting (as defined in Exchange Act Rules 13a-15(f) and 15d-15(f)) for the registrant and we have:
(a) designed such disclosure controls and procedures, or caused such disclosure controls and procedures to be designed under our supervision, to ensure that material information relating to the registrant, including its consolidated subsidiaries, is made known to us by others within those entities, particularly during the period in which this report is being prepared;
(b) designed such internal controls over financial reporting, or caused such internal controls over financial reporting to be designed under our supervision, to provide reasonable assurance regarding the reliability of financial reporting and the preparation of financial statements for external purposes in accordance with generally accepted accounting principles;
(c) evaluated the effectiveness of the registrant's disclosure controls and procedures and presented in this report our conclusions about the effectiveness of the disclosure controls and procedures, as of the end of the period covered by this report based on such evaluation; and
(d) disclosed in this report any change in the registrant's internal control over financial reporting that occurred during the registrant's most recent fiscal quarter (the registrant's fourth fiscal quarter in the case of an annual report) that has materially affected, or is reasonably likely to materially affect, the registrant's internal control over financial reporting; and
5. The registrant's other certifying officer and I have disclosed, based on our most recent evaluation of internal control over financial reporting, to the registrant's auditors and the audit committee of the registrant's board of directors:
(a) all significant deficiencies and material weaknesses in the design or operation of internal control over financial reporting which are reasonably likely to adversely affect the registrant's ability to record, process, summarize and report financial information; and
(b) any fraud, whether or not material, that involves management or other employees who have a significant role in the registrant's internal controls.
Date: March 13, 2008
| /s/ Calvin E. Jenness | |
|
Calvin E. Jenness
Senior Vice President and
Chief Financial Officer | |
|
BLOUNT INTERNATIONAL, INC.
66
Rules adopted by the SEC require that the Company include in the annual report a line graph presentation comparing the cumulative five-year shareholder return on the Company's common stock on an indexed basis with the cumulative return of a broad equity market index that includes companies whose equity securities are traded on the same exchange as the Company's and either a published industry index or an index of peer companies selected by the Company. Since the Company is not included in the Standard and Poor's 500 Stock Index and its equity securities are traded on the New York Stock Exchange, the New York Stock Exchange Composite (US) Index was selected as the broad equity market index. (As a result of a change in New York Stock Exchange procedures, its Composite (US) Index has been manually recreated for years prior to December 31, 2003.) The Company created a peer group index with which to compare its own stock performance since a relevant published industry or line-of-business index does not exist. A list of these follows the graph below.*
COMPARISON OF 5 YEAR CUMULATIVE TOTAL RETURN*
Among Blount International, Inc., The NYSE Composite Index
and a Peer Group
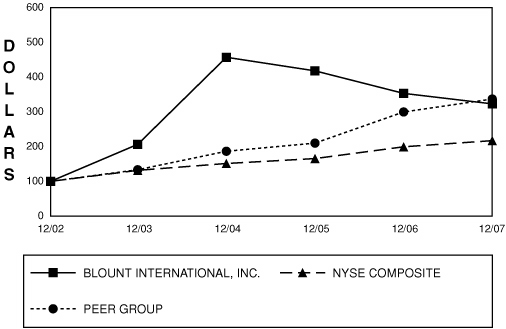
* $100 invested on 12/31/02 in stock or index-including reinvestment of dividends.
Fiscal year ending December 31.
| | | 12/02 | | 12/03 | | 12/04 | | 12/05 | | 12/06 | | 12/07 | |
| Blount International, Inc. | | | 100.00 | | | | 206.56 | | | | 457.22 | | | | 418.11 | | | | 353.28 | | | | 323.10 | | |
| NYSE Composite | | | 100.00 | | | | 131.73 | | | | 151.45 | | | | 165.62 | | | | 199.52 | | | | 217.21 | | |
| Peer Group | | | 100.00 | | | | 133.44 | | | | 186.65 | | | | 210.10 | | | | 299.76 | | | | 336.98 | | |
The stock price performance included in this graph is not necessarily indicative of future stock price performance.
*The companies in the Peer Group are Actuant Corp., Kaydon Cap, Kennametal Inc, Lincoln Electric Holdings Company, Regal Beloit Corp., Snap-On Inc, Terex Corp. and Toro Corp.
BLOUNT INTERNATIONAL, INC.
67