Exhibit 99.1
99.1 Presentation Made at Annual Shareholder’s Meeting
The following visual presentation was made by Michael J. Rugen, CEO, at the Annual Shareholder’s Meeting, October 17, 2013

Annual Shareholders MeetingOctober 17, 2013 TENGASCO, INC.

Annual Shareholders Meeting - October 17, 2013Outline of Presentation Financial ReviewCapital Spending and Drilling ResultsKansas ProductionOther Events and TransactionsChairman’s CommentsQ&A

Forward Looking StatementsExcept for the historical information contained in this review, the matters discussed in this presentation are forward-looking statements within the meaning of applicable securities laws, that are based upon current expectations. Important factors that could cause actual results to differ materially from those in the forward-looking statements include risks inherent in drilling activities, the timing and extent of changes in commodity prices, unforeseen engineering and mechanical or technological difficulties in drilling wells, availability of drilling rigs and other services, land issues, federal and state regulatory developments and other risks more fully described in the Company’s filings with the U.S. Securities and Exchange Commission(SEC).

Annual Shareholders Meeting - October 17, 2013Financial Summary – Continuing Operations($ Thousands, except per share data) 2012 2011 Change PercentRevenues 20,557 17,062 3,495 20.5%Production cost and taxes (7,182) (5,944) (1,238) (20.8)%DD&A (3,403) (2,527) (876) (34.7)%General & administrative (2,613) (2,324) (289) (12.4)%Net income from operations 7,359 6,267 1,092 17.4%Interest expense (743) (642) (101) (15.7)%Loss on derivatives (142) (407) 265 65.1%Gain on sale of assets 83 37 46 124.3%Tax expense (2,313) (289) (2,024) (700.3)%Net income from continuing operations 4,244 4,966 (722) (14.5)%Loss from discontinued operations, net of tax benefit (4,311) (286) (4,025) (1407.3)%Net income (loss) (67) 4,680 (4,747) (101.4)%Net income (loss) per share – Basic and Diluted Continuing operations 0.07 0.08 (0.01) Discontinued operations (0.07) (0.00) (0.07)

Annual Shareholders Meeting - October 17, 2013Revenue Summary – Continuing Operations($ Thousands) 2012 2011 Change PercentOil revenues – Kansas 19,383 16,371 3,012 18.4%Oil Revenues – Swan Creek 313 329 (16) (4.9)%Gas Revenue – Swan Creek 144 111 33 29.7%Methane Plant Sales – Gas 219 190 29 15.3%Methane Plant Sales – Electric 447 - 447 -Other 51 61 (10) (16.4)%Total Revenue 20,557 17,062 3,495 20.5%

Annual Shareholders Meeting - October 17, 2013Financial Summary – Continuing Operations($ Thousands, except per share data) 6 Months Ended June 30, 2013 2012 Change PercentRevenues 8,185 10,184 (1,999) (19.6)%Production cost and taxes (2,561) (3,602) 1,041 28.9%DD&A (1,537) (1,569) 32 2.0%General & administrative (979) (1,359) 380 28.0%Net income from operations 3,108 3,654 (546) (14.9)%Interest expense (240) (394) 154 39.1%Loss on derivatives - (105) 105 -Gain on sale of assets 63 67 (4) 6.0%Tax expense (1,147) (1,116) (31) (2.8)%Net income from continuing operations 1,784 2,106 (322) 15.3%Loss from discontinued operations, net of tax benefit (74) (146) 72 49.3%Net income (loss) 1,710 1,960 (250) (12.8)%Net income (loss) per share – Basic and Diluted Continuing operations 0.03 0.03 - Discontinued operations (0.00) (0.00) -

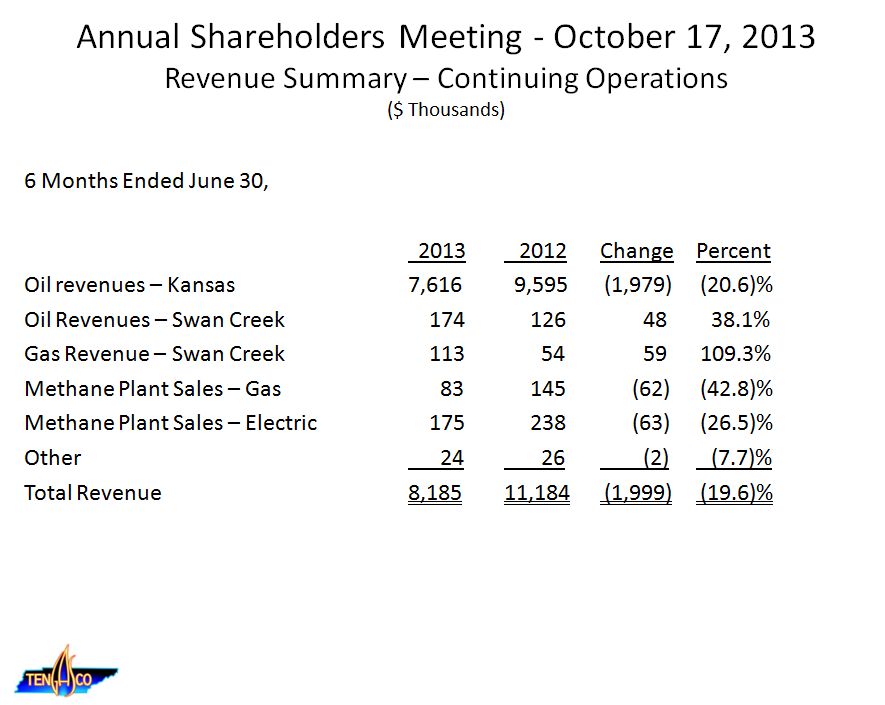
Annual Shareholders Meeting - October 17, 2013Revenue Summary – Continuing Operations($ Thousands) 6 Months Ended June 30, 2013 2012 Change PercentOil revenues – Kansas 7,616 9,595 (1,979) (20.6)%Oil Revenues – Swan Creek 174 126 48 38.1%Gas Revenue – Swan Creek 113 54 59 109.3%Methane Plant Sales – Gas 83 145 (62) (42.8)%Methane Plant Sales – Electric 175 238 (63) (26.5)%Other 24 26 (2) (7.7)%Total Revenue 8,185 11,184 (1,999) (19.6)%

Annual Shareholders Meeting - October 17, 2013Bank Borrowings – Month End Balance($ Thousands)

Annual Shareholders Meeting - October 17, 2013Capital Spending and Drilling / Polymer Results($ Thousands) Est. Remaining 2013 2012 YTD 2013 1st Half 2014Capital Spending: Drilling 5,869 930 Polymers 1,241 146 Leasehold 305 106 Seismic 30 88 MMC 443 - Other 190 160 Total Capital Spending 8,078 1,430 $3.5 - $4 millionDrilling and Polymers: Wells Drilled 20 4 8-10 Wells Completed 15 4 Polymers Performed 12 1

Annual Shareholders Meeting - October 17, 2013Annual Kansas Gross Oil Production(Barrels)

Annual Shareholders Meeting - October 17, 2013Average Daily Kansas Gross Oil Production(Barrels)

Annual Shareholders Meeting - October 17, 2013Other Events / Transactions in 2012 and YTD 2013 June 2012 – received $1 million section 1603 refund related to MMCOctober 2012 – long time director, Dr. John Clendening passed awayJune 2013 – Jeff Bailey resigned and Mike Rugen named interim CEOAugust 2013 – Rod Tremblay rejoined the Company as Exploration Manager and Senior GeologistAugust 2013 – closed sale of Swan Creek and Pipeline assets for $1.5 million

Annual Shareholders Meeting - October 17, 2013 The Company thanks our Shareholders .The Company also thanks our Employees and their families.