UNITED STATES
SECURITIES AND EXCHANGE COMMISSION
WASHINGTON, D.C. 20549
FORM 10-K
| x | ANNUAL REPORT PURSUANT TO SECTION 13 OR 15(d) OF THE SECURITIES EXCHANGE ACT OF 1934 |
FOR THE FISCAL YEAR ENDED SEPTEMBER 28, 2007
or
| ¨ | TRANSITION REPORT PURSUANT TO SECTION 13 OR 15(d) OF THE SECURITIES EXCHANGE ACT OF 1934 |
FOR THE TRANSITION PERIOD FROM TO
Commission file number: 0-27248
LEARNING TREE INTERNATIONAL, INC.
(Exact name of registrant as specified in its charter)
| | |
| DELAWARE | | 95-3133814 |
| (State or other jurisdiction of incorporation or organization) | | (I.R.S .Employer Identification No.) |
1805 Library Street,
Reston, VA 20190
(703) 709-9119
(Address, Including Zip Code and Telephone Number, Including Area Code of Registrant’s Principal Executive Offices)
Securities registered pursuant to Section 12(b) of the Act:
| | |
Title of Class | | Name of Each Exchange on Which Registered |
| Common Stock, $.0001 par value | | NASDAQ Stock Market, LLC |
Securities registered pursuant to Section 12(g) of the Act: None
Indicate by check mark if the registrant is a well-known seasoned issuer, as defined in Rule 405 of the Securities Act. Yes ¨ No x
Indicate by check mark if the registrant is not required to file reports pursuant to Section 13 or Section 15(d) of the Act. Yes ¨ No x
Indicate by check mark whether the registrant (1) has filed all reports required to be filed by Section 13 or 15(d) of the Securities Exchange Act of 1934 during the preceding 12 months (or for such shorter period that the registrant was required to file such reports), and (2) has been subject to such filing requirements for the past 90 days: Yes x No ¨
Indicate by check mark if disclosure of delinquent filers pursuant to item 405 of Regulation S-K is not contained herein, and will not be contained, to the best of registrant’s knowledge, in definitive proxy or information statements incorporated by reference in Part III of this Form 10-K or any amendment to this Form 10-K: ¨
Indicate by check mark whether the registrant is a large accelerated filer, an accelerated filer, or a non-accelerated filer. See definition of “accelerated filer and large accelerated filer” in Rule 12b-2 of the Exchange Act.
Large accelerated filer ¨ Accelerated Filer x Non-accelerated filer ¨
Indicate by check mark whether the registrant is a shell company (as defined in Rule 12b-2 of the Act). Yes ¨ No x
The aggregate market value of the common stock, $.0001 par value, held by non-affiliates of the registrant, as of March 30, 2007 was $99,727,578. (Excludes 7,607,432 shares held by directors and officers of the registrant since such persons may be deemed to be affiliates.)
The number of shares of common stock, $.0001 par value, outstanding as of December 4, 2007, was 16,556,513 shares.
DOCUMENTS INCORPORATED BY REFERENCE
Portions of the definitive Proxy Statement of the registrant to be delivered to stockholders in connection with the 2007 Annual Meeting of Stockholders are incorporated by reference into Part III, Items 10, 11, 12, 13 and 14 of this Form 10-K.
LEARNING TREE INTERNATIONAL, INC. AND SUBSIDIARIES
ANNUAL REPORT ON FORM 10-K
TABLE OF CONTENTS
2
SPECIAL NOTE REGARDING FORWARD-LOOKING STATEMENTS
This Report contains forward-looking statements within the meaning of Section 27A of the Securities Act of 1933, as amended, and Section 21E of the Securities Exchange Act of 1934, as amended. You can find many (but not all) of these statements by looking for words such as “approximates,” “believes,” “expects,” “anticipates,” “estimates,” “intends,” “plans,” “would,” “may” or other similar expressions in this Report. Our forward-looking statements relate to future events or our future performance and include, but are not limited to, statements concerning our business strategy, future commercial revenues, market growth, capital requirements, new product introductions, expansion plans and the adequacy of our funding. Other statements contained in this report that are not historical facts are also forward-looking statements.
We claim the protection of the safe harbor contained in the Private Securities Litigation Reform Act of 1995. We caution investors that any forward-looking statements presented in this Report, or which we may make orally or in writing from time to time, are based on our beliefs, assumptions made by us and information currently available to us. Such statements are based on assumptions and the actual outcome will be affected by known and unknown risks, trends, uncertainties and factors that are beyond our control or ability to predict. Although we believe that our assumptions are reasonable, they are not guarantees of future performance and some will inevitably prove to be incorrect. As a result, our actual future results can be expected to differ from our expectations, and those differences may be material. Accordingly, investors should use caution in relying on forward-looking statements, which are based on known results and trends at the time they are made, to anticipate future results or trends.
Some of the risks and uncertainties that may cause our actual results, performance or achievements to differ materially from those expressed or implied by forward-looking statements include the following:
| | • | | the timely development, introduction, and customer acceptance of our courses; |
| | • | | international operations, including currency fluctuations; |
| | • | | changing economic and market conditions; |
| | • | | technology development and new technology introduction; |
| | • | | efficient delivery and scheduling of our courses; |
| | • | | adverse weather conditions, strikes, acts of war or terrorism and other external events; and |
| | • | | attracting and retaining qualified personnel. |
For further discussion of these and other factors see “Management’s Discussion and Analysis of Financial Condition and Results of Operations” and “Risk Factors.”
This Report and all subsequent written and oral forward-looking statements attributable to us or any person acting on our behalf are expressly qualified in their entirety by the cautionary statements contained or referred to in this section. We do not undertake any obligation to release publicly any revisions to our forward-looking statements to reflect events or circumstances after the date of this Report.
PART I
Item 1. BUSINESS
Overview
Learning Tree International, Inc. is a leading worldwide vendor-independent provider of training and education to managers and information technology (“IT”) professionals working in business and government organizations. Since our founding in 1974, we have provided high-quality training to over 1.8 million managers and IT professionals. In fiscal year 2007, we provided training to 89,920 course participants from more than 11,500 organizations worldwide, including large national and multinational companies, government organizations, and small and medium-size companies.
We offer a broad proprietary library of intensive instructor-led courses from two to five days in length, comprising 162 different course titles representing 3,726 hours of training as of September 28, 2007, including 115
3
information technology course titles and 47 management course titles. Learning Tree courses provide both breadth and depth of education across a wide range of technical and management disciplines, including operating systems, databases, computer networks, computer and network security, web development, programming languages, software engineering, open source applications, project management, business skills, and leadership and professional development.
We market and present our courses through local operations in the United States, United Kingdom, France, Canada, Sweden and Japan, and generate over half of our revenues internationally. Each operating subsidiary is staffed by local personnel responsible for the sale and delivery of Learning Tree courses in that country. Our infrastructure and logistical capabilities allow us to coordinate, plan and deliver our courses at our own education centers, external hotel and conference facilities and customer sites worldwide. During fiscal year 2007, we presented courses in 40 countries.
We use a well-defined systematic approach to develop and update the Learning Tree course library so as to provide training that is immediately relevant to course participants working in a broad range of applications and industries. After assessing market need, courses are translated into French, Swedish and Japanese. Our proprietary course development process also allows us to customize our courses for delivery at our customers’ sites.
We design our own vendor-independent IT courses to provide participants an unbiased perspective regarding software and hardware products and the ability to compare and integrate multiple platforms and technologies from various vendors. All Learning Tree courses are highly interactive, and incorporate extensive hands-on exercises or case study workshops. While addressing core concepts and theory, all of our technical and management courses focus primarily on providing skills, tools, and technologies that participants can apply immediately upon returning to their jobs. To accomplish this objective, many of our RealityPlus™ management courses utilize extensive multi-media simulations to teach practical management techniques. This innovative methodology provides an environment in which RealityPlus™ course participants learn entirely by doing. Throughout these courses, they gain extensive experience applying new management skills in life-like, challenging situations, within the confines of the classroom and under the guidance of an expert instructor. As a result, RealityPlus™ course participants achieve greater mastery of effective management techniques as well as the confidence needed to apply them, and thus return to their jobs both ready and willing to immediately apply their expanded skills in their workplaces.
Business Strategy
Our long-term objective is to sustain and grow our position as a leading worldwide vendor-independent provider of training and education to managers and IT professionals and thus become the provider of choice for large and medium-sized commercial and government organizations. To achieve our objective, we focus on providing our corporate clients’ employees with the knowledge and skills they need to contribute immediately and directly to their employers’ key business objectives, and on developing and maintaining long-term relationships with our corporate customers and course participants.
During 2007, we concentrated on achieving a sustainable increase in our level of profitability, with a secondary objective of beginning to increase the rate of our revenue growth. We made progress toward both of these goals and, even with the reductions in our expenses in recent quarters, we believe that our infrastructure remains capable of handling a significantly greater volume of business activity without a proportionate increase in operating expense. Based on this belief, we are now increasing our focus on developing sustainable higher revenue growth rates, while continuing our efforts to further increase our level of profitability.
We have already begun to implement a number of growth strategies, including:
| | • | | Sales and marketing initiatives. We continue to focus on the productivity of our sales teams and the effectiveness of our marketing programs. We are developing and implementing new initiatives aimed at increasing our level of business with our current customers and attracting new course participants. |
| | • | | Product development initiatives. We plan to increase our investment in course development over the coming year which should result in an increased rate of new course introductions toward the end of fiscal year 2008. Additionally, we continue to be excited about extending our proprietary RealityPlus™ instructional technology within our management curriculum. We have also initiated a research program to explore adapting our existing courses to a blended-learning format that would combine classroom instruction and on-line learning. |
4
We will continue to investigate other ways to increase revenues by leveraging our core strengths: our instructors, our marketing and sales infrastructure, our proprietary content and course development processes, our classroom facilities and our worldwide course delivery systems. We expect to see the impact of these new priorities phase in over the course of fiscal year 2008 and beyond.
Commitment to Quality Training.For the past 33 years, we have set the highest standards of excellence in educating and training managers and IT professionals throughout the world. These high standards are important drivers of our long-term success. In fiscal year 2007, course participants rated Learning Tree instructors and courses at the highest levels in our history. These ratings reflect improvements in the classroom that include our patented MagnaLearn™ instructional enhancement system and the latest up-to-date course equipment, ongoing revision and updating of our course materials, and steady, regular improvement of instructor skills and capabilities.
High Quality Instructor Team. At September 28, 2007, we had 655 course instructors located around the world, each of whom was a practicing professional combining both expert subject knowledge and extensive “real world” experience. Learning Tree instructors teach an average of 11 course events per year on an “as-needed” basis. During the rest of the year they apply the skills that they teach, either as full-time employees for other companies or as independent consultants. This “on-demand” structure enables us to quickly schedule additional courses anywhere in the world and to respond efficiently to our customers’ needs for management and IT skills training. In addition, because Learning Tree instructors generally spend the majority of their time working in industry settings, they provide our course participants with up-to-date, practical knowledge and skills in the latest technological and management developments, and provide us with unique access to industry experts on management and IT trends throughout the world that is especially valuable in our decisions and development of new course titles.
Our success depends on our ability to attract and retain highly skilled instructors. We use a highly systemized program in each of our local operating subsidiaries to identify, engage, train, coach, and evaluate our instructor team.
Broad Proprietary Course Library. We offer a broad, proprietary library of 162 instructor-led two- to five-day course titles comprising a total of 3,726 hours of classroom instruction covering a wide range of management and IT topics. Based on their sophistication and quality, all Learning Tree courses are recommended for one to two semester hours of college credit by the American Council on Education. We are a trusted continuing professional education (CPE) provider of the International Information Systems Security Certification Consortium (ISC)2. In addition, we are on the National Association of State Boards of Accountancy National Registry of CPE sponsors and are a Registered Education Provider of the Project Management Institute (PMI).
The following table itemizes the number of Learning Tree course titles by curriculum at September 28, 2007:
| | | | |
Curriculum | | Number of
CourseTitles | | Total Hours of
Training |
Project Management | | 11 | | 240 |
Management and Leadership | | 5 | | 84 |
Communication and Time Management | | 13 | | 216 |
ITIL® Certification Training | | 5 | | 102 |
Business Analysis | | 10 | | 204 |
Visual Studio and .NET Development | | 9 | | 216 |
SQL Server | | 12 | | 306 |
Windows Systems and Exchange | | 16 | | 432 |
SharePoint, Access and Office | | 7 | | 168 |
Java, C++ and Perl Programming | | 12 | | 288 |
Web Development and XML | | 12 | | 252 |
Software Engineering | | 10 | | 228 |
RDBMS and Oracle Databases | | 7 | | 198 |
Networking, Cisco Networks and PC Support | | 15 | | 378 |
UNIX and Linux | | 7 | | 162 |
Security | | 11 | | 252 |
| | | | |
Total | | 162 | | 3,726 |
| | | | |
5
As a leading vendor-independent provider of IT training, we design our courses to provide participants an unbiased perspective of software and hardware products and the ability to compare and integrate multiple platforms and technologies from various vendors in a single course. Drawing from the expertise of our international team of instructors, each course incorporates multiple points of view concerning IT applications used throughout the world. Our IT courses are designed to be highly interactive; most involve “hands-on” training on networked state-of-the-art workstations so that participants can practice and assimilate the skills being taught. Participants spend a significant portion of each hands-on course working on computer-based exercises, participating in group workshops and class interactions. Participants receive extensive printed course materials that facilitate learning and serve as a post-course reference tool.
Our management courses, while including core concepts and theory, focus heavily on providing skills, tools, and techniques that participants can apply immediately upon returning to their jobs. Participants work extensively in group exercises designed to apply key concepts in real-world situations, so that they are fully prepared to apply their new skills in their workplace environments. We have introduced a new performance-based training platform called RealityPlus™ in many of our management courses. These RealityPlus™ courses bring the real world to life in the classroom through the use of computer-based and rich-media simulations, supplemented with substantial amounts of hands-on exercises and group activities, and facilitated by experts in their respective fields. RealityPlus™ prepares participants to apply the skills and knowledge they learn in our simulated projects, problems, and situations to the real-life management tasks they will perform in the workplace.
At September 28, 2007, we offered 47 titles in our management curriculum, representing 29% of our entire course library, compared to 43 titles, or 28% at the end of fiscal year 2006.
To assist participants in their long-term professional development, we offer 42 Learning Tree Professional Certification programs, in which participants must demonstrate mastery of subject matter by successfully completing four courses in a particular field, and passing a mastery examination for each course. Each Professional Certification Program is designed to teach all of the skills necessary to master a specific job function.
Over our 33-year history, we have developed and implemented a well-defined, systematic approach to rapidly develop, customize and update courses in the Learning Tree library and to translate our course content into multiple languages. Courses are organized into curricula that reflect general topics or disciplines. We continuously update and expand our course curriculum structure and course content and add new course titles to keep pace with the introduction of new technologies and to reflect the evolving training needs of Learning Tree customers. To identify potential new courses for development, we incorporate feedback from the worldwide Learning Tree instructor team, course participants and corporate customers, and from the development groups of leading IT vendors. In fiscal year 2007, we developed 25 new titles and retired 15 titles. We may or may not develop more titles than we retire in any period. We expect course development costs to increase in the future based on our increased efforts to expand our course library. However, there can be no assurance that we will develop courses that keep pace with the introduction of new hardware, software and networking technologies or the need for key business skills training.
International Infrastructure and Logistics Capability. We meet customer demand for scheduling flexibility by delivering course events frequently and at multiple locations throughout the world. Our sophisticated infrastructure and logistics capability allow us to coordinate, plan and deliver Learning Tree courses at our education centers, and external hotel and conference facilities worldwide. We also present standard or customized courses on demand at customer facilities whenever and wherever desired—with quality standards that are identical to those for courses presented in Learning Tree Education Centers. By using our team of 655 instructors, our course development and customization processes, our team of customer support specialists, our logistics team and our thousands of classroom computer workstations, we can rapidly and effectively deliver any Learning Tree course to any location in the world.
In fiscal year 2007, we presented 7,023 course events at Learning Tree Education Centers and at third-party and customer sites in a total of 40 countries. We have six operating segments for the design and delivery of training courses and related services. See Note 9 of “Notes to Consolidated Financial Statements” for certain financial data regarding operating segments and geographic regions. See also, the “Markets and Competition” subheading of Item 1,Business. We currently operate wholly-owned subsidiaries in the United States (since 1974), France (since 1977), the United Kingdom (since 1978), Canada (since 1985), Sweden (since 1986) and Japan (since 1989). Each subsidiary is staffed by local personnel responsible for the sale and delivery of courses in its
6
local country as well as in other designated countries. Our international operations produced over half of our revenues in fiscal year 2007 and face certain risks inherent to international businesses, such as: currency fluctuations; potential difficulties in translating course subject matter into foreign languages; varying political and economic conditions; changes in government regulation; trade barriers; difficulty in staffing foreign offices and in training and retaining foreign instructors; adverse tax consequences; and potential costs associated with expansion into new territories. There can be no assurance that such factors will not have a material adverse effect on us in the future.
On a continuous basis, we evaluate the advisability of expansion or contraction of our operations both within cities with existing Learning Tree Education Centers and in new cities or countries.
Long-Term Relationships with Global Customer Base. We have built long-standing relationships with our customer base. We focus on training the employees of large national and multinational companies and government organizations throughout the world, and seek to build continuing relationships both with our individual course participants and their employers. Learning Tree customers operate in a wide range of sectors, including the finance, computer, communications, electronics, systems integration, aerospace, government and military, manufacturing, and energy sectors, among others. In fiscal year 2007, we provided training to 89,920 course participants and over 240 of our corporate customers purchased more than $100,000 of Learning Tree training. No customer accounted for 10% or more of our revenues in fiscal years 2007 or 2006.
In fiscal year 2007, we continued our efforts to develop broader enterprise-wide relationships with a small number of large customers. In an enterprise-wide relationship, we achieve preferred supplier status and can provide training services more readily—with fewer administrative or bureaucratic requirements—to individual employees of the customer. Within these enterprise-wide provider programs, we can provide management training services for our customers in addition to training at Learning Tree Education Centers, external hotel and conference facilities, and customer sites worldwide.
Our sales backlog at the end of November 2007 was $37.1 million. This compares to a sales backlog of $33.1 million at the end of November 2006. Although there may be some cancellations, they are not expected to significantly change the amount of backlog.
Multi-Tiered Sales and Marketing Organization. We employ a multi-tiered sales and marketing organization that integrates direct mail, electronic marketing, telemarketing and field sales to market and sell our course offerings to existing customers and to attract new customers.
Since our inception, we have created and built a strong brand image for providing high-quality training for managers and IT professionals through the frequent and prominent use of our trademarks in direct marketing and course materials. We market our courses primarily through direct mail and electronic mail to our proprietary database of approximately 2.4 million technology professionals and managers who have attended, inquired about, or sent a staff member to Learning Tree courses, and also use direct mail to reach other managers and IT professionals on rented mailing lists. We also utilize targeted, personalized e-mails through our automated e-mail marketing system to advise prospective course participants of upcoming events. To further expand the direct e-mail marketing programs, we use rented e-mail address lists to augment our own database. In addition, we market our products and services over the Internet on our website (www.learningtree.com). (Information contained on our website is not part of this Annual Report on Form 10-K.)
We have a telemarketing sales team which comprised approximately 128 telemarketers and related support staff at September 28, 2007. Learning Tree telemarketers are responsible for developing and extending our business relationship with our customers by calling customer leads generated from direct mailings, e-mail marketing, website inquiries and other sales and marketing programs. In addition, our sales team follows up on inquiries from customers and potential clients, and works to identify key personnel at clients with the potential to become major customers. We use a proprietary automated system which provides our telemarketers with information that facilitates rapid response to inbound callers, provides targeted lists for outbound calling, records the results of calls and automates the sales follow-up process.
At September 28, 2007, we employed a field sales team of approximately 57 direct field sales representatives and related support staff. The direct sales force primarily focuses on selling training which is delivered at Learning Tree customer sites.
7
To remain successful, we must continue to expand our business with both existing and new customers. To encourage repeat purchases from existing customers, we offer three different multiple-course discount programs – Learning Tree “Training Passports”, Learning Tree 10-Day Passes, and Learning Tree “Training Vouchers”—and also provide Professional Certification Programs, as described earlier. We believe that in addition to generating revenues directly, these programs foster long-term relationships with participants and encourage participants to recommend Learning Tree courses to their colleagues.
Learning Tree Training Passports permit an individual Passport holder to attend up to a specified number of courses during a one to two-year period. The Passports are generally sold as three- or four-course Passports. The list price for a Passport is approximately equivalent to two individual four-day courses. Learning Tree 10-Day Passes permit an individual Pass holder to attend up to 10 days of training during a twelve-month period, and are priced slightly lower than the Passports. The Learning Tree Training Voucher program allows corporate customers to buy blocks of three or more Vouchers at a fixed discounted price, for future courses to be taken by any person in the client organization over a six- to twelve-month period.
Markets and Competition
Instructor-Led Training. The management and IT training markets include outside third-party providers of training, as well as in-house training conducted by organizations for their own employees. Third-party providers of IT training include a group of “vendor-dependent providers”, who deliver courses developed by the vendors of software and hardware technologies and who depend heavily on those vendors to market their courses. The IT training market also includes “vendor-independent providers”, such as Learning Tree, who independently develop, market and deliver proprietary courses. In addition, third-party providers of management training include non-profit associations, as well as “for-profit providers”, who provide training largely as a professional development service, and both for-profit and not-for-profit “academic providers”, who offer courses that lead to accredited undergraduate or graduate degrees.
In these markets, we are a for-profit vendor-independent provider of management education and IT training. Some competitors offer course titles and programs similar to ours at lower prices. In addition, some competitors have greater financial or other resources than we do.
Our main IT training competitors are vendor-dependent and include the IT hardware and software vendors themselves. Many hardware and software vendors supply training, sometimes bundled in the prices of their products. Other vendor-dependent providers are Authorized Technical Education Centers (“ATECs”) and Certified Technical Education Centers (“CTECs”) that deliver these vendors’ proprietary courses. Vendor-dependent providers may have, or claim, greater knowledge of upcoming developments in their products, and their certifications are widely recognized. We differentiate ourselves from vendor-dependent providers by maintaining a vendor-independent posture and providing cross-platform training solutions. By being vendor-independent, we can address both the strengths and the weaknesses of a product and teach IT professionals how to integrate one product with those of other vendors in a multi-vendor configuration. We leverage the expertise of Learning Tree instructors and authors, to ensure that we offer a level of expertise that matches or exceeds that of vendor-dependent providers while also providing a vendor-independent platform that provides meaningful product comparisons.
Our principal management education competitors include for-profit and not-for-profit post-secondary educational providers, as well as non-profit management associations and also training companies who focus—as do we—on providing continuing professional development programs to government and commercial organizations and the employees of those organizations. We differentiate ourselves from these competitors by adopting a more practical, results-oriented approach to management education than is typical in this market, as well as through our focus on performance-based learning, our patented MagnaLearn™ Instructional Enhancement Technology, and our recently introduced RealityPlus™ simulation-centric educational methodology.
We believe that the majority of third-party providers—whether in management or IT—are smaller organizations which often provide training as one of several services or product lines. We differentiate ourselves from these providers based on our experience over more than three decades, the breadth and quality of our proprietary course library, our worldwide delivery capability, and the size, quality and experience of our instructor force.
8
Internal training departments generally provide companies with the most control over the method and content of training, enabling them to tailor programs to their specific needs. However, we believe that since internal trainers find it difficult to keep pace with new technologies, lack the hands-on experience needed to teach the latest technological developments and lack the capacity to meet demand, most organizations must supplement their internal training resources with externally supplied training. This is particularly critical when dealing with new or emerging technologies. Additionally, internal training departments may not operate consistently on a worldwide basis, where we offer consistent management and IT courses, processes and quality around the globe.
E-Learning. Management and IT training are primarily delivered by classroom instructors, video, and technology-based training, including Internet-based e-learning and printed means. Based upon extensive research and use of pilot programs as well as our experience, we believe that instructor-led training will continue to fill the largest portion of the market because classroom-based instructor-led training provides the greatest foundation for participants to learn, practice and receive feedback on their mastery of new knowledge and skills. Course participants value the personalized interaction and problem solving with their instructor and fellow participants concerning their specific projects and applications. Furthermore, instructor-led classroom training insulates course participants from workplace interruptions and thus accelerates their learning of new technologies. However, the use of technology-based IT training formats, such as Internet-based e-learning, appears to have gained some acceptance in the IT training and education market. As such, we are continuing to investigate the use of alternate, technology-based training formats and how they might effectively be integrated into our training programs.
Employees
Our personnel are critical to our success. See Item 1A, “Risk Factors”. Our executive officers have extensive experience in the training and education industry with an average of nearly 14 years of experience with us and nearly 17 years of relevant industry experience.
On September 28, 2007, we had a total of 495 full-time equivalent employees, of whom 207 were employed outside the United States. We also utilized the services of 655 expert instructors to teach our courses on an “as-needed” basis. We consider our relations with our employees and our instructors to be good.
Intellectual Property Rights
“LEARNING TREE”, “LEARNING TREE INTERNATIONAL”, the Learning Tree Design logo, “LEARNING TREE INTERNATIONAL” and design, “LEARNING TREE PROFESSIONAL CERTIFICATION” and design, “EDUCATION IS OUR BUSINESS”, “EDUCATION YOU CAN TRUST”, “WE BRING EDUCATION TO LIFE”, “PRODUCTIVITY THROUGH EDUCATION”, “REALITYPLUS MANAGEMENT EDUCATION FOR THE REAL WORLD” and design, “TRAINING PASSPORT”, “TRAINING ADVANTAGE”, “ALUMNI GOLD”, “TRAINING YOU CAN TRUST”, “WE BRING LEARNING TO LIFE”, “WWW.LEARNINGTREE.COM”, “MAGNALEARN”, “VENDOR INDEPENDENT TRAINING YOU CAN TRUST”, “ON-SITE COURSES” and design, “800-LRN-TREE”, and “800-THE-TREE” are among our trademarks and service marks. In addition to the trademarks and service marks, this Annual Report on Form 10-K also contains trademarks and trade names of other companies.
We own the copyright to all course materials we develop. Our copyrighted course materials are a significant differentiator of our services from those of our competitors.
We hold U.S. Patent Nos. 7,058,891, 7,131,068, and 7,134,079 and South African Patent No. 2005/09799 for our MagnaLearn Instructional Enhancement System. Patents on this system are pending in other jurisdictions. MagnaLearn™ gives Learning Tree instructors greater flexibility to customize and pace course presentations. Attendees learn faster and retain more information with this dynamic interactive learning environment. MagnaLearn™ allows our instructors great flexibility to annotate, highlight and manipulate course materials on two independent projection screens, in real time, and to enrich the classroom experience. Feedback is also provided to course development resources allowing constant improvement of courses and the ability to consistently update courses immediately on a world-wide basis.
We cannot be certain that our means of protecting our proprietary rights will be adequate or that our competitors will not independently develop similar course titles or delivery methods. If substantial unauthorized use of our products
9
were to occur, our business and results of operations could be materially adversely impacted. We may also have to defend against claims that our current or future courses infringe on the proprietary rights of others. Defending and prosecuting these claims could have a material adverse effect on our operating results.
Regulatory Environment
We are paid directly by the employers of Learning Tree course participants and do not receive funding from any government aid or loan programs. As a result, we do not depend on government appropriations for those programs and are generally exempt from the governmental regulation of public education providers. In contrast, providers of education to the public must comply with many laws and regulations of Federal, state and international governments. However, our operations could be affected by current or future licensing or regulatory requirements.
Available Information
We make available on our website (www.learningtree.com), free of charge, our annual report on Form 10-K, quarterly reports on Form 10-Q, current reports on Form 8-K and all amendments to those reports filed or furnished pursuant to Section 13(a) or 15(d) of the Exchange Act, as soon as reasonably practicable after such material is electronically filed or furnished to the Securities and Exchange Commission. (Information contained on our website is not part of this Annual Report on Form 10-K.) Our Annual Report on Form 10-K may also be obtained free of charge by written request to the Chief Financial Officer, Learning Tree International, Inc., 1805 Library Street, Reston, VA 20190.
Item 1A. RISK FACTORS
This section contains risk factors related to Learning Tree International, Inc.’s (“Learning Tree”) business. We use the terms “we”, “our”, and “us” to refer to Learning Tree and its subsidiaries.
You should carefully consider the following discussion of various risks and uncertainties, keeping in mind that they are not the only ones that affect us. Additional risks which we do not presently consider material, or of which we are not currently aware, may also have an adverse impact on us.
Among other things, this section contains forward-looking statements that are based on certain assumptions about future risks and uncertainties. We believe that our assumptions are reasonable. Nonetheless, it is likely that at least some of these assumptions will not come true. Accordingly, our actual results will probably differ from the outcomes contained in any forward-looking statement, and those differences could be material. Factors that could cause or contribute to those differences include the ones discussed below, as well as those discussed elsewhere in this section and in our filings with the Securities and Exchange Commission.
Common Stock Price Fluctuations
Historically, Learning Tree’s common stock price has fluctuated, and we expect fluctuations to continue in the future.
General Factors. We believe some of the reasons for past fluctuations in the price of our stock have included:
| | • | | announcements of developments related to our business; |
| | • | | announcements concerning new products or enhancements by Learning Tree or our competitors; |
| | • | | developments in our relationships with our customers; |
| | • | | market perceptions of new means of delivering training; such as the Internet; |
| | • | | variations in Learning Tree’s revenues, gross margins, earnings or other financial results from investors’ expectations; |
| | • | | fluctuations in general conditions in the economy, our market, and the markets served by our customers; and |
| | • | | delays in introducing new technologies both by our customers and technology vendors. |
In addition, prices in the stock market, particularly for technology-related stocks, have been volatile in recent years. In some cases, the fluctuations have been unrelated to the operating performance of the affected companies. As a result, the price of our common stock could fluctuate in the future without regard to our operating performance.
10
Future Sales of Learning Tree Common Stock. Sales of Learning Tree’s common stock by our officers, directors and employees, and especially by our founders, could adversely and unpredictably affect the price of our shares. Additionally, the price could be affected even by the potential for sales by these persons. In addition to the 16,556,513 shares outstanding as of December 4, 2007, we are authorized to issue up to a total of 1,675,006 shares of common stock under our existing Stock Option and Equity Incentive Plan. We cannot predict the effect which any future sales of our common stock, or the potential for those sales, will have on our share price.
Fluctuations in Operating Results
Historically, Learning Tree’s operating results have fluctuated, and we expect fluctuations to continue in the future.
Fluctuations in our historical operating results have resulted from many factors, some of which are beyond our control. In the future, these or other factors could have a material adverse impact on Learning Tree’s operating results and cause our stock price to decrease. For example:
Timing of Course Development, and Sales and Marketing Expenditures. We try to adjust our expenditures for course development and sales and marketing to maintain our long-term profitability, including our assessment of the potential to influence future customer demand, market conditions, and other factors. This may mean accepting reduced margins in poor economic periods, as we must commit to much of our spending before our attendees enroll in our courses. If revenues fall short of our expectations, we may not be able to adjust our expenditures quickly enough to compensate for lower than anticipated revenues. This could compound the impact of any revenue shortfall and further affect our operating results and the price of our stock.
Course Scheduling and Marketing Activities. The timing and content of our courses and our marketing activities can affect the number of participants who attend our courses. Some of the activities that can contribute to fluctuations in our operating results include:
| | • | | the frequency of our course events; |
| | • | | the number of weeks during which our courses can be conducted in a quarter; |
| | • | | the timing, timely delivery, frequency and size of, and the response to, our direct mail marketing and advertising campaigns; |
| | • | | the timing of introduction of new course titles; |
| | • | | the average length of courses, based on the current mix of course titles, which affects the average revenue per attendee; and |
| | • | | the mix between course events held at customer locations and course events held in our education centers and hotels due to differing gross profit margins. |
Seasonal Factors. Our quarterly revenues and income fluctuate due to the seasonal spending patterns of our customers, which are affected by factors such as:
| | • | | cyclic or one-time budgetary considerations; |
| | • | | factors specific to their business or industry; and |
| | • | | weather, holiday and vacation considerations. |
Use of Accounting Estimates. The preparation of our financial statements in conformity with “Generally Accepted Accounting Principles” requires us to make estimates and assumptions in calculating our financial results. As one example, we currently offer our customers a multiple-course sales discount referred to as a Training Passport. A Training Passport allows an individual passport holder to attend up to a specified number of Learning Tree courses over a one to two-year period for a fixed price. For a Training Passport, the amount of revenue we recognize for each attendance in one of our courses is based upon the selling price of the Training Passport, the list price of the course taken, the average list price of all courses taken, and our estimate of the average number of courses a Passport holder will actually attend. After expiration of a Training Passport, we record the difference, if any, between the revenue previously recognized and the Training Passport selling price. For example, if a Passport holder attends more courses than we had estimated, we would make a negative adjustment to revenues at the expiration of that Passport. We base our estimate of the average number of course events that a Training Passport holder will attend on historical trends that may change in the future. If average Training Passport attendance rates were to increase, we would have to make negative adjustments to our revenue, which could be significant. For a summary of some of our key accounting estimates, please see our “Critical Accounting Estimates and Policies” in Management’s Discussion and Analysis.
11
Changing Regulation of Corporate Governance and Public Disclosure. Changing laws, regulations and standards relating to corporate governance and public disclosure, including the Sarbanes-Oxley Act of 2002, new SEC regulations, and new NASDAQ Stock Market rules can create uncertainty for companies such as ours. These new or changed laws, regulations and standards are subject to varying interpretations in many cases due to their lack of specificity, and as a result, their application in practice may evolve over time as new guidance is provided by regulatory and governing bodies, which could result in continuing uncertainty regarding compliance matters and higher costs necessitated by ongoing revisions to disclosure and governance practices. As a result, our efforts to comply with evolving laws, regulations and standards have resulted in, and are likely to continue to result in, increased general and administrative expenses and a diversion of management time and attention from revenue-generating activities to compliance activities. In particular, our efforts to comply with Section 404 of the Sarbanes-Oxley Act of 2002 and the related regulations regarding our required assessment of our internal controls over financial reporting require the commitment of significant financial and managerial resources. Further, our board members, chief executive officer and chief financial officer could face an increased risk of personal liability in connection with the performance of their duties. As a result, we may have difficulty attracting and retaining qualified board members and executive officers, which could harm our business. If our efforts to comply with new or changed laws, regulations and standards differ from the activities intended by regulatory or governing bodies due to ambiguities related to practice, our reputation may be harmed.
Introductions and Adoption of New Technology. Our customers tend to increase their training at times when new technology is being introduced. During periods when fewer new technologies are being introduced, demand for our training courses may decrease, which could have a material adverse effect on our operating results and stock price.
Other Factors. Other factors that may affect our operating results include:
| | • | | competitive forces within our current and anticipated future markets; |
| | • | | our ability to attract customers and meet their expectations; |
| | • | | currency fluctuations and other risks inherent in international operations; |
| | • | | general economic conditions; |
| | • | | differences in the timing of our spending on the marketing of our courses, as well as the timing of our spending on the development of our courses and other areas; and |
| | • | | excess capacity and/or unused space in our education centers and/or administrative office facilities, and our ability to sublease or find other uses for it. |
All or any of these and similar factors could cause our operating results to differ substantially from the expectations of public market analysts and investors, which would likely have a material adverse impact on our stock price.
Risks Associated with Technology Changes
If we do not adequately anticipate or respond to changes in technology, it could have a material adverse effect on our operating results and stock price.
Changes in technology can affect our business in at least two principal ways. First, we must anticipate and keep pace with the introduction of new hardware, software and other information technologies and develop courses that effectively train customers in the technologies they use now and will use in the future. Second, we must adapt to changes in the technologies by which we can deliver training to our customers’ employees. As a result of technology developments, we may have to make substantial and unanticipated expenditures to develop new course titles, buy new equipment, or invest in further course development software and processes to deliver our courses. Further, we may not adequately anticipate or respond successfully to technology changes for many reasons, including misjudging the impact of technology changes, as well as financial, technological or other constraints. A lack of adequate response on our part to changes in information technology platforms, customer preferences or software technology could have a material adverse impact on our operating results and stock price.
12
Competition
If our customers decide that they prefer training offered by new or existing competitors, it could have a material adverse effect on our operating results and stock price.
The IT and management training markets are highly fragmented, with low barriers to entry. No single competitor holds a dominant market share. We face intense competition from both established entities and new entries in the market. Our primary competitors include:
| | • | | internal training departments within our current and potential clients; |
| | • | | computer hardware and software vendors and their Authorized Training and Education Center partners; |
| | • | | independent education and training companies; |
| | • | | academic providers; and |
| | • | | software systems integrators. |
Some of our competitors offer similar course titles and programs at lower prices. In addition, some competitors have greater financial and other resources than Learning Tree. Additionally, hardware and software vendors, as well as software systems integrators, may combine IT education and training with sales of their products or other services, which could allow them to offer training at lower prices than we do. Furthermore, future consolidation of IT vendors or training companies could have a material impact on our future operations.
The risk of outsourcing of corporate IT administration and software development overseas to countries or firms not currently served by Learning Tree could have a material adverse impact on our future operations.
Although instructor-led classroom training continues to dominate the worldwide IT and management training markets, technology-based education and training formats, such as Internet-based distance learning, have gained some acceptance. Accordingly, our future results may also depend on the extent to which the market will continue to accept instructor-led IT and management training and on our ability to develop and market instructor-led courses that compete effectively against technology-based courses offered by our competitors.
Risks Associated with International Operations
If we do not adequately anticipate and respond to the risks inherent in international operations, it could have a material adverse effect on our operating results and stock price.
Over half of our annual revenues are generated by courses conducted outside the United States.
Foreign Currency Fluctuations. Our consolidated financial statements are prepared in U.S. Dollars, while the operations of our foreign subsidiaries are conducted in their respective local currencies. Consequently, changes in exchange rates can unpredictably and adversely affect our consolidated operating results, and could result in exchange losses. We do not hedge against the risks associated with fluctuations in exchange rates. Even if we were to use hedging techniques in the future, we might not be able to eliminate or reduce the effects of currency fluctuations. Thus, exchange rate fluctuations could have a material adverse impact on our operating results and stock price.
Other Risks Associated with International Operations. Additionally, our financial results may be adversely affected by other international risks, such as:
| | • | | difficulties in translating our courses into foreign languages; |
| | • | | international political and economic conditions; |
| | • | | changes in government regulation in various countries; |
| | • | | difficulty in staffing our foreign offices, and in training and retaining foreign instructors; |
| | • | | adverse income tax and transfer pricing consequences; and |
| | • | | costs associated with expansion into new territories. |
We expect that international revenues will continue to be a significant portion of our total revenues. A lack of anticipation and response to the risks associated with international operations could have a material adverse effect on our operating results and stock price.
13
Dependence on Key Personnel
If we are unable to recruit and retain qualified personnel, it could have a material adverse effect on our operating results and stock price.
Our success depends in large part on the continued services of our executive officers, our senior managers and other key personnel. The loss of these people, especially without advance notice, could have a material adverse impact on our results of operations. It is also very important that we attract and retain highly skilled personnel, including course instructors, to accommodate growth, new course titles and to replace personnel who leave. Competition for qualified personnel can be intense, especially in information technology industries and/or in certain geographic areas, and there are a limited number of people with the requisite knowledge and experience. Under these conditions, we could be unable to recruit, train and retain instructors and employees. If we cannot attract and retain qualified personnel, it could have a material adverse impact on our operating results and stock price.
Risks Associated with Intellectual Property
If substantial unauthorized use of our courses occurs or if we must defend against infringement claims, it could have a material adverse effect on our operating results and stock price.
Our success depends in part on our ability to protect our intellectual property and confidential information. Our course development process and course titles are proprietary and we rely primarily on a combination of statutory and common law copyright, trademark and trade secret laws, customer licensing agreements, employee and third-party nondisclosure agreements and other methods to protect those proprietary rights. Our course materials generally do not include any mechanisms to prohibit or prevent unauthorized use. As a result, someone could copy or otherwise obtain and use our course materials without authorization, either for educational use or to develop competing courses. In addition, we operate in countries that do not provide protection of proprietary rights to the same extent as the United States. Finally, our intellectual property rights will not prevent competitors from independently developing similar course titles or delivery methods. If substantial unauthorized use of our products were to occur, our business and results of operations could be materially adversely impacted.
We may also have to defend against claims that our current or future courses infringe on the proprietary rights of others. If such a claim succeeded, we might have to change or eliminate courses, and could be required to pay damages or royalties. In addition, litigation over intellectual property rights, whether brought by us or by someone else, could be time-consuming and expensive, even if we were ultimately to succeed. Accordingly, defending and prosecuting these claims could have a material adverse effect on our operating results and stock price.
Risks Associated with Laws and Regulations
Laws and regulations can affect our operations and may limit our ability to operate in certain states.
Providers of educational programs to the public must comply with many laws and regulations of Federal, state and international governments. Generally, we are exempt from that type of regulation because we contract with the employer of the participants in our courses, and we do not participate in any Federal or state student aid or loan programs. However, state laws and regulations targeting educational providers could affect our operations in the future and could limit our ability to obtain authorization to operate in certain states. If we were found in violation of a state’s current or future licensing or regulatory requirements, we could be subject to civil or criminal sanctions, including monetary penalties, and we could also be barred from providing educational services in that state. In addition, laws and regulatory decisions in many areas other than education could also adversely affect our operations. Complying with current or future legal requirements could have a material adverse effect on our operating results and stock price.
We are subject to tax audits by state, federal and foreign jurisdictions. Such audits are to be expected and may result in adjustments as a result of the accretion of tax jurisdiction interpretations and changes in operational practices. Any such audits may result in additional taxes being assessed or in the refund of taxes previously paid. Such changes could have a material adverse effect on our operating results and stock price.
14
Control by Management
Senior personnel have significant influence over our policies and affairs and may be in a position to determine the outcome of corporate actions.
As of December 4, 2007, our executive officers and directors collectively own approximately 46% of our outstanding shares of common stock. As of that date, Mr. Garen, our Chairman of the Board of Directors, beneficially owned approximately 20% of our outstanding shares of common stock. Dr. Collins, our Vice Chairman of the Board of Directors, beneficially owned approximately 24% of our outstanding shares of common stock as of December 4, 2007. Consequently, senior personnel, and Mr. Garen and Dr. Collins in particular, have significant influence over our policies and affairs and may be in a position to determine the outcome of corporate actions requiring stockholder approval. These may include, for example, the election of directors, the adoption of amendments to our corporate documents and the approval of mergers and sales of our assets.
Risks Associated with Possible Acquisitions and Other Strategic Transactions
If we cannot successfully implement any future acquisitions or other strategic transactions, it could have a material adverse effect on our operating results and stock price.
On occasion, we evaluate business opportunities and other strategic transactions that appear to fit within our overall business strategy. We could decide to pursue one or more of these opportunities by acquisition or internal development. Acquisitions and other strategic transactions involve many risks, including:
| | • | | the difficulty of integrating acquired technologies, operations and personnel with our existing operations; |
| | • | | the difficulty of developing and marketing new products and services; |
| | • | | the diversion of our management’s attention as a result of evaluating, negotiating and integrating acquisitions or new business ventures; |
| | • | | our exposure to unforeseen liabilities of acquired companies; and |
| | • | | the loss of key employees of an acquired operation. |
In addition, an acquisition or other strategic transactions could adversely impact cash flows and/or operating results, and dilute shareholder interests, for many reasons, including:
| | • | | charges to our income to reflect the amortization of acquired intangible assets; |
| | • | | write-offs for the impairment of the carrying value of goodwill or other intangible assets; |
| | • | | interest costs and debt service requirements for any debt incurred in connection with an acquisition or new business venture; and |
| | • | | any issuance of securities in connection with an acquisition or other strategic transactions which dilutes or lessens the rights of our current common stockholders. |
We have had no significant experience in executing and implementing acquisitions. Although we have implemented other strategic transactions, those ventures have not always been successful, and we may not succeed in the future. The risks associated with acquisitions and other strategic transactions could have a material adverse impact on our operating results and stock price.
Risks Associated with Changing Economic Conditions
General domestic and international economic conditions could have a material adverse effect on our operating results and stock price.
Domestic and/or International Economic Downturns. A significant part of our revenues comes from Fortune 1000-level companies, their international equivalents, and government organizations. During weak economic conditions, our growth rate generally slows. If the domestic and/or international economy were to weaken, the demand for our services could decline, which could have a material adverse effect on our operating results and stock price.
Industry-Specific Slowdowns. Our customers generally operate in the finance, computer, communications, electronics, systems integration, aerospace, government and military, manufacturing, and energy sectors. If one or more of these industries experiences a slowdown, it could have a material adverse effect on our operating results and stock price.
15
Globalization Issues. Our operations are concentrated in Europe and North America, which have traditionally been the centers of IT development and implementation. In recent years, there has been increasing IT activity in other parts of the world, such as China and India. If this trend adversely affects IT jobs in regions in which we have our principal operations, it could have a material adverse effect on our operating results and stock price.
Anti-Takeover Provisions
Certain provisions of our Restated Certificate of Incorporation, our Bylaws and Delaware law could adversely impact the interests of our stockholders.
Certain provisions of our Restated Certificate of Incorporation, our Bylaws and Delaware law could, together or separately, discourage, delay or prevent a third party from acquiring us, even if doing so might benefit our stockholders. These provisions may also affect the price investors would receive for their shares of our common stock. Some examples of these provisions in our Restated Certificate of Incorporation and Bylaws are:
| | • | | the division of our board of directors into three classes; |
| | • | | the right of our board of directors to issue preferred stock with rights and privileges which are senior to the common stock, without prior stockholder approval; |
| | • | | certain limitations of the rights of stockholders to call a special meeting of stockholders; and |
| | • | | the prohibition of stockholder actions by written consent. |
Natural Disasters, External Strikes, Acts of War or Terrorism and Other External Events
Since our founding in 1974, various natural disasters, external labor disruptions, acts of war or terrorism and other adverse external factors have from time to time impaired our ability to conduct our business, resulted in the loss of revenue or otherwise affected our operating results. When these or other external events occur in the future, they could have a material adverse effect on our operating results and stock price.
Natural Disasters. Natural disasters can affect our business. For example, severe weather has at times prevented our course participants from traveling to our courses. In these situations, we try to transfer the course participants to later courses, but we may still lose some potential revenue. Similarly, both weather and floods have also disrupted the printing and transportation of the catalogs we use in our direct mail campaigns. The resulting delays in our mailings may reduce or delay the revenue we realize from courses listed in those catalogs.
External Strikes. We have had to react to postal, transportation, and other strikes in the countries where we operate. Postal strikes delay or reduce the delivery of our direct mail marketing materials, which may result in reduced enrollments in upcoming course events. Transportation strikes can make it difficult for our course participants or our instructors to reach course facilities. Although we try to employ strategies to mitigate the impact of external strikes, these alternative means are rarely completely effective and generally increase our costs, which could adversely affect our operating results.
Acts of War or Terrorism. Threats or acts of war or terrorism can adversely affect our business. The terrorist attacks in the United States on September 11, 2001, the declaration of war by the United States against terrorism, and continuing hostilities in the Middle East have created significant instability and uncertainty in the world. These and future events may have a material adverse effect on world financial markets, including financial markets in the United States. In addition, threats or acts of war or terrorism can cause course participants to be reluctant regarding or prevented from traveling to our course facilities, thereby resulting in lower attendance rates. Additionally, our direct mail marketing materials may be delayed or disrupted from reaching our customers; and suppliers and service providers may be unable to provide required services or materials. These impacts could happen after we have committed to all the costs of our course, so that we would be unable to quickly adjust our cost structure to reflect the changes in revenues caused by these events, which could materially and adversely affect our operating results and stock price.
Other External Factors. Other factors outside our control can affect our operations, including those related to our suppliers and service providers. For example, disruptions of telephone networks can prevent customers from enrolling in our courses; disruptions in transportation services can prevent customers from reaching our facilities, and power outages can prevent us from delivering courses. Similarly, if commodities (for example, the paper used in the printing of our catalogs) that we or our customers need become scarce or more expensive, our operating results may be adversely affected.
16
Item 1B. UNRESOLVED STAFF COMMENTS
None.
Item 2. PROPERTIES
Our headquarters are located at 1805 Library Street, Reston, VA 20190.
We own a 38,500 square foot office facility in Reston, VA which is occupied by the sales, administrative and operations groups of our U.S. subsidiary. We lease all of our other offices and education center classroom facilities. The leases expire at various dates over the next 12 years. We also present our courses at rented hotel and conference facilities and customer sites. We typically provide all of the software, hardware and networking systems required for use in our courses.
We believe that our facilities are adequate and suitable for our needs. In general, at current attendee levels, we have some excess capacity at most of our education centers. We have been seeking to deal with excess capacity by reducing the size of some of our facilities and by renting excess classrooms.
We present our classroom courses at Learning Tree Education Centers in Atlanta, Boston, Chicago, Los Angeles, New York City, the Washington, D.C. area (three locations), Ottawa, Toronto, London, Paris, Stockholm, and Tokyo as well as in other rented facilities in those and other cities worldwide.
Learning Tree Education Center classrooms are custom-designed to accommodate the technical demands of our computer-based courses, and include our patented MagnaLearn™ Instructional Enhancement System and local area network within each classroom. The multi-modal communication techniques within the patented MagnaLearn™ System provide an enhanced learning experience for course participants by making it easier and faster for them to absorb information and grasp complex concepts.
The following table contains certain information regarding Learning Tree Education Centers and offices at September 28, 2007:
| | | | | | | |
Location (Metropolitan Area) | | Function(s) | | Number of
Classrooms | | Total Area in
Square Feet | |
Atlanta, GA | | Education Center | | 9 | | 16,903 | |
Boston, MA | | Education Center | | 6 | | 13,717 | |
Chicago, IL | | Education Center | | 5 | | 11,017 | |
Los Angeles, CA | | Education Center & Office | | 5 | | 34,374 | |
New York, NY | | Education Center | | 19 | | 41,724 | |
Washington, DC area | | Education Centers (3 sites) | | 34 | | 84,914 | |
Reston, VA | | Offices (3 sites) | | — | | 45,959 | |
Powell, OH | | Office | | — | | 400 | |
Bedford, NH | | Office | | — | | 400 | |
Kennett Square, PA | | Office | | — | | 400 | |
Paris, France | | Education Center & Office | | 20 | | 36,813 | |
London, England | | Education Center | | 34 | | 55,182 | (a) |
Leatherhead, England | | Office | | — | | 23,209 | (b) |
Ottawa, Canada | | Education Center & Office | | 6 | | 20,006 | |
Toronto, Canada | | Education Center | | 10 | | 17,207 | |
Stockholm, Sweden | | Education Center & Office | | 12 | | 27,790 | |
Tokyo, Japan | | Education Center & Office | | 2 | | 3,096 | |
| | | | | | | |
| | | | 162 | | 433,111 | |
| | | | | | | |
| (a) | Excludes 56,838 square feet which we sublease to various subtenants. Subleases end at various dates prior to the end of our prime lease. See Note 4 to the audited financial statements for details on subleases. Some subtenants may opt for early termination based on their sublease agreements. |
| (b) | Excludes 7,000 square feet which we sublease to a single subtenant. Sublease ends co-terminus with our prime lease which ends in December 2010. |
17
Item 3. LEGAL PROCEEDINGS
We are not involved in any pending or threatened legal proceedings, other than routine legal proceedings and claims incidental to our business, that we believe could reasonably be expected to have a material adverse effect on our financial condition or results of operations.
Item 4. SUBMISSION OF MATTERS TO A VOTE OF SECURITY HOLDERS
No matters were submitted to a vote of security holders during the fourth quarter of fiscal year 2007 through the solicitation of proxies or otherwise.
PART II
Item 5. MARKET FOR REGISTRANT’S COMMON EQUITY AND RELATED
STOCKHOLDER MATTERS
Price Range of Common Stock
Our Common Stock trades on the NASDAQ Stock Market under the symbol “LTRE.” The following table sets forth, for the periods indicated, the range of high and low sales prices for the Common Stock on the NASDAQ Stock Market:
| | | | | | |
| | | High | | Low |
Fiscal 2006 | | | | | | |
First Quarter | | $ | 15.87 | | $ | 12.83 |
Second Quarter | | | 13.04 | | | 11.59 |
Third Quarter | | | 12.61 | | | 8.41 |
Fourth Quarter | | | 8.86 | | | 7.39 |
| | |
Fiscal 2007 | | | | | | |
First Quarter | | $ | 9.35 | | $ | 8.03 |
Second Quarter | | | 11.39 | | | 9.05 |
Third Quarter | | | 13.80 | | | 11.20 |
Fourth Quarter | | | 17.77 | | | 13.02 |
On December 6, 2007, the number of holders of our Common Stock was approximately 4,324, consisting of 63 record holders and approximately 4,261 stockholders whose stock is held by a bank, broker or other nominee.
Dividends
To date, we have not paid any cash dividends on our Common Stock and do not anticipate doing so in the foreseeable future. The declaration and payment of dividends are subject to the discretion of our Board of Directors and to compliance with applicable laws. Any determination as to the payment of dividends in the future will depend upon, among other things, general business conditions, the effect such payment would have on our financial condition and other factors that our Board of Directors may in the future consider to be relevant.
Issuer Sales of Unregistered Securities.
During fiscal year 2007, we did not make any unregistered sales of our securities.
Issuer Purchases of Equity Securities
During fiscal year 2005 we repurchased approximately 327,000 shares of Common Stock at a total cost of approximately $4,314. During fiscal year 2006 we repurchased approximately 166,000 shares of Common Stock at a total cost of approximately $1,936. During fiscal year 2007, we did not make any repurchases of our Common Stock. All Learning Tree Common Stock repurchases were made in open-market transactions and not pursuant to any publicly traded plans. We may choose to make additional open-market purchases of our Common Stock in the future, but have no commitment to do so. Stock repurchase activities are regularly reviewed by our Board of Directors.
18
Securities Authorized for Issuance under Equity Compensation Plans
| | | | | | | |
Plan Category | | Number of Securities
to be Issued Upon
Exercise of
Outstanding Options,
Warrants and Rights | | Weighted-Average
Exercise Price of
Outstanding Options,
Warrants and Rights | | Number of Securities
Remaining Available
for Future Issuance
Under Equity
Compensation Plan
(Excluding Securities
Reflected in the first
Column) |
Equity compensation plans approved by security holders | | 800,361 | | $ | 13.94 | | 874,645 |
Equity compensation plans not approved by security holders | | — | | | — | | — |
| | | | | | | |
Total | | 800,361 | | $ | 13.94 | | 874,645 |
| | | | | | | |
For a description of the other material features of our equity compensation plan, see Note 6 of “Notes to Consolidated Financial Statements.”
COMPANY STOCK PERFORMANCE
The stock price performance graph below is required by the Securities and Exchange Commission (“SEC”) and shall not be deemed to be incorporated by reference by any general statement incorporating by reference this statement into any filing under the Securities Act of 1933 or under the Securities Exchange Act of 1934, except to the extent that Learning Tree specifically incorporates this information by reference, and shall not otherwise be deemed soliciting material or filed under such acts.
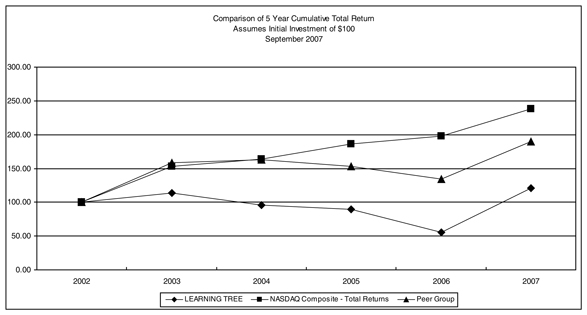
The following graph compares the cumulative total stockholder return on the Common Stock of Learning Tree from September 30, 2002 to September 28, 2007 with the cumulative total return on the NASDAQ Stock Market Composite Index and an appropriate “peer group” index (assuming the investment of $100 in Learning Tree’s Common Stock and in each of the indexes on September 30, 2002.)
| | | | | | | | | | | | | | | | | | |
| | | Fiscal Year Ended |
| | | September 30,
2002 | | September 30,
2003 | | October 1,
2004 | | September 30,
2005 | | September 29,
2006 | | September 28,
2007 |
Learning Tree International, Inc. | | | | | | | | | | | | | | | | | | |
Common Stock | | $ | 100 | | $ | 114 | | $ | 96 | | $ | 90 | | $ | 55 | | $ | 121 |
Peer Group Index (1) | | $ | 100 | | $ | 158 | | $ | 163 | | $ | 153 | | $ | 134 | | $ | 190 |
NASDAQ Stock Exchange | | | | | | | | | | | | | | | | | | |
Composite Index | | $ | 100 | | $ | 153 | | $ | 163 | | $ | 187 | | $ | 198 | | $ | 238 |
| (1) | Peer Group index includes: Apollo Group, Inc.; Skillsoft Public Limited Company; DeVry, Inc.; ITT Education Services, Inc. and New Horizons Worldwide, Inc. The returns of each issuer within the Peer Group Index have been weighted according to such issuer’s respective stock market capitalization at the beginning of the period presented. |
19
Item 6. SELECTED FINANCIAL DATA
The following selected consolidated financial data is qualified in its entirety by reference to, and should be read in conjunction with, the audited consolidated financial statements and notes thereto and other financial data included elsewhere in this Annual Report on Form 10-K. The statement of operations data set forth below for the years ended September 30, 2005, September 29, 2006 and September 28, 2007, and the balance sheet data as of September 29, 2006 and September 28, 2007, are derived from our consolidated financial statements which are included elsewhere herein. These historical results are not necessarily indicative of the results to be expected in the future. See “Management’s Discussion and Analysis of Financial Condition and Results of Operations.”
We follow a 52- or 53-week fiscal year. Our year-end and quarter-end dates are on the Friday nearest the end of the calendar quarter. Accordingly, our fiscal year 2005 ended on September 30, 2005, fiscal year 2006 ended on September 29, 2006, and fiscal year 2007 ended on September 28, 2007. Each of those years comprised 52 weeks.
| | | | | | | | | | | | | | | | | | | |
| | | Fiscal Year Ended (dollars in thousands, except per share data) |
| | | September 30,
2003 | | | October 1,
2004 * | | | September 30,
2005 | | | September 29,
2006 | | | September 28,
2007 |
SELECTED STATEMENT OF OPERATIONS DATA: | | | | | | | | | | | | | | | | | | | |
Revenues | | $ | 152,607 | | | $ | 152,058 | | | $ | 151,558 | | | $ | 154,049 | | | $ | 167,193 |
Cost of revenues | | | 72,803 | | | | 73,755 | | | | 75,966 | | | | 76,164 | | | | 72,936 |
| | | | | | | | | | | | | | | | | | | |
Gross profit | | | 79,804 | | | | 78,303 | | | | 75,592 | | | | 77,885 | | | | 94,257 |
| | | | | | | | | | | | | | | | | | | |
Operating expenses: | | | | | | | | | | | | | | | | | | | |
Course development | | | 7,897 | | | | 7,960 | | | | 7,952 | | | | 10,080 | | | | 8,613 |
Sales and marketing | | | 43,781 | | | | 47,206 | | | | 42,387 | | | | 42,503 | | | | 41,094 |
General and administrative | | | 22,791 | | | | 24,757 | | | | 27,499 | | | | 27,944 | | | | 30,041 |
| | | | | | | | | | | | | | | | | | | |
Total operating expenses | | | 74,469 | | | | 79,923 | | | | 77,838 | | | | 80,527 | | | | 79,748 |
| | | | | | | | | | | | | | | | | | | |
Income (loss) from operations | | | 5,335 | | | | (1,620 | ) | | | (2,246 | ) | | | (2,642 | ) | | | 14,509 |
Other income, net | | | 2,315 | | | | 2,049 | | | | 2,263 | | | | 3,373 | | | | 4,236 |
| | | | | | | | | | | | | | | | | | | |
Income before provision for income taxes and cumulative effect of change in accounting principle, net of tax | | | 7,650 | | | | 429 | | | | 17 | | | | 731 | | | | 18,745 |
Provision for income taxes | | | 2,663 | | | | 969 | | | | 1,713 | | | | 3,853 | | | | 1,755 |
| | | | | | | | | | | | | | | | | | | |
Income (loss) before cumulative effect of change in accounting principle | | | 4,987 | | | | (540 | ) | | | (1,696 | ) | | | (3,122 | ) | | | 16,990 |
Cumulative effect of change in accounting principle, net of tax | | | (769 | ) | | | — | | | | — | | | | — | | | | — |
| | | | | | | | | | | | | | | | | | | |
Net income (loss) | | $ | 4,218 | | | $ | (540 | ) | | $ | (1,696 | ) | | $ | (3,122 | ) | | $ | 16,990 |
| | | | | | | | | | | | | | | | | | | |
Income (loss) per common share before cumulative effect of change in accounting principle - basic | | $ | 0.28 | | | $ | (0.03 | ) | | $ | (0.10 | ) | | $ | (0.19 | ) | | $ | 1.03 |
Cumulative effect of change in accounting principle, net of tax | | | (0.04 | ) | | | — | | | | — | | | | — | | | | — |
| | | | | | | | | | | | | | | | | | | |
Income (loss) per common share - basic | | $ | 0.24 | | | $ | (0.03 | ) | | $ | (0.10 | ) | | $ | (0.19 | ) | | $ | 1.03 |
| | | | | | | | | | | | | | | | | | | |
Income (loss) per common share before cumulative effect of change in accounting principle - diluted | | $ | 0.28 | | | $ | (0.03 | ) | | $ | (0.10 | ) | | $ | (0.19 | ) | | $ | 1.03 |
Cumulative effect of change in accounting principle, net of tax | | | (0.04 | ) | | | — | | | | — | | | | — | | | | — |
| | | | | | | | | | | | | | | | | | | |
Income (loss) per common share - diluted | | $ | 0.24 | | | $ | (0.03 | ) | | $ | (0.10 | ) | | $ | (0.19 | ) | | $ | 1.03 |
| | | | | | | | | | | | | | | | | | | |
Weighted average shares outstanding - basic | | | 17,394 | | | | 17,039 | | | | 16,865 | | | | 16,583 | | | | 16,498 |
| | | | | | | | | | | | | | | | | | | |
Weighted average shares outstanding - diluted | | | 17,449 | | | | 17,039 | | | | 16,865 | | | | 16,583 | | | | 16,498 |
| | | | | | | | | | | | | | | | | | | |
| |
| | | As of (dollars in thousands) |
| | | September 30,
2003 | | | October 1,
2004 * | | | September 30,
2005 | | | September 29,
2006 | | | September 28,
2007 |
SELECTED BALANCE SHEET DATA: | | | | | | | | | | | | | | | | | | | |
Cash and cash equivalents | | $ | 86,711 | | | $ | 70,913 | | | $ | 56,736 | | | $ | 44,401 | | | $ | 49,732 |
Available for sale securities | | $ | — | | | $ | 13,000 | | | $ | 18,555 | | | $ | 27,800 | | | $ | 38,775 |
Income tax receivable | | $ | 1,810 | | | $ | 2,089 | | | $ | 682 | | | $ | 243 | | | $ | 4,224 |
Total current assets | | $ | 108,606 | | | $ | 104,403 | | | $ | 100,125 | | | $ | 98,715 | | | $ | 120,861 |
Total assets | | $ | 142,957 | | | $ | 138,044 | | | $ | 132,638 | | | $ | 137,200 | | | $ | 163,976 |
Deferred revenues | | $ | 50,082 | | | $ | 46,847 | | | $ | 44,956 | | | $ | 47,678 | | | $ | 50,216 |
Total current liabilities | | $ | 68,791 | | | $ | 65,146 | | | $ | 65,003 | | | $ | 70,005 | | | $ | 76,924 |
Total long-term liabilities | | $ | 6,434 | | | $ | 6,723 | | | $ | 7,564 | | | $ | 10,261 | | | $ | 9,844 |
Total stockholders’ equity | | $ | 67,732 | | | $ | 66,175 | | | $ | 60,071 | | | $ | 56,934 | | | $ | 77,208 |
| * | In the second quarter of fiscal year 2004, we adopted a 52- or 53-week fiscal year, by changing our year-end date from September 30 to the Friday nearest the end of the month of September. Fiscal years 2004, 2005, 2006, and 2007 each comprised 52 weeks. |
20
Item 7. MANAGEMENT’S DISCUSSION AND ANALYSIS OF FINANCIAL
CONDITION AND RESULTS OF OPERATIONS
Except for historical statements, the matters addressed in the discussion which follows are forward-looking statements. Please do not put undue reliance on these forward-looking statements, since they are based on key assumptions about future risks and uncertainties. Although we believe that our assumptions are reasonable, inevitably some will prove to be incorrect. As a result, our actual future results can be expected to differ from those in the discussion that follows, and those differences may be material. We are not undertaking any obligation to update forward-looking statements.
RISK FACTORS
In order to help the reader assess the major risks in our business, we have identified what we believe to be the most significant risks in Item 1A. Please read it carefully.
OVERVIEW
Nature of the Business. Learning Tree International is a leading worldwide vendor-independent provider of training and education to managers and information technology professionals working in business and government organizations. Since our founding in 1974, we have provided high-quality training to 1.8 million managers and IT professionals. In fiscal year 2007 we provided training to 89,920 course participants from more than 11,500 organizations worldwide, including large national and multinational companies, government organizations, and small and medium-size companies.
We offer a broad proprietary library of intensive instructor-led courses from one to five days in length, comprising 162 different course titles representing over 3,726 hours of training as of September 28, 2007. Learning Tree courses provide both breadth and depth of education across a wide range of technical and management disciplines, including operating systems, databases, computer networks, computer and network security, web development, programming languages, software engineering, open source applications, project management, business skills, and leadership and professional development.
We use a well-defined, systematic approach in developing and updating the Learning Tree course library to provide training that is immediately relevant to course participants working in a broad range of applications and industries. After assessing market need, courses are translated into French, Swedish and Japanese. Our proprietary development process also allows us to customize our courses for delivery at customer sites.
We design our own vendor-independent IT courses to provide participants an unbiased perspective of software and hardware products with the ability to compare and integrate multiple platforms and technologies from various vendors in a single course. While addressing core concepts and theory, all our technical and management courses focus primarily on providing skills, tools, and techniques which participants can apply immediately upon returning to their jobs. To accomplish this objective, our proprietary RealityPlus™ courses utilize extensive multi-media simulations to teach practical management techniques. This innovative methodology provides an environment in which RealityPlus™ course participants learn entirely by doing. Throughout these courses, they gain extensive experience applying new management skills in life-like challenging situations, within the confines of the classroom and under the guidance of an expert instructor. As a result, RealityPlus™ course participants achieve greater mastery of effective management techniques as well as the confidence needed to apply them, and thus return to their jobs both ready and willing to immediately apply their expanded skills in their workplaces.
Learning Tree courses are highly interactive. Based on their sophistication and quality, all Learning Tree courses are recommended for one or two semester hours of college credit by the American Council on Education. We are a trusted CPE provider of the ISC2. In addition, we are on the National Association of State Boards of Accountancy National Registry of CPE sponsors and are a Registered Education Provider of the PMI.
We had 655 instructors as of September 28, 2007, each of whom was a practicing professional combining expert knowledge with extensive practical experience. On average, each expert instructor teaches approximately 11 course events per year for us on an “as-needed” basis. When they are not teaching, Learning Tree instructors are using and honing their management and IT skills as either full-time employees for other companies or as independent consultants.
21
We offer our proprietary courses through wholly owned local subsidiaries in the United States, the United Kingdom, France, Canada, Sweden and Japan, and generate over half of our revenues internationally. Each operating subsidiary is staffed by local personnel responsible for the sale and delivery of our courses in that country. Our infrastructure and logistical capabilities allow us to coordinate, plan and deliver our courses at Learning Tree Education Centers, external hotel and conference facilities and customer sites worldwide. During fiscal year 2007, we presented courses in 40 countries.
We have structured our business so that the majority of our course delivery costs are variable and depend primarily upon the number of course events conducted. We schedule our course events throughout the year based on our assessment of demand. Since Learning Tree instructors typically work full-time or as consultants for other business and industry employers, or in the case of management instructors as industry consultants and facilitators, they teach our course events as needed and thus, our instructor-related costs are largely variable. However, expenses associated with our own education centers and course equipment are largely fixed.
We adjust our expenditures for sales and marketing depending on our strategic objectives, which generally include an assessment of our expectations for influencing future customer demand, market conditions and other factors. However, if our expectations regarding the results of our marketing efforts prove to be wrong, any significant revenue shortfall would have a material adverse effect on our results of operations.
Recent Trends. As we have for more than 33 years, we continue to focus on enhancing quality levels through our core strengths: our expert instructors, proprietary and innovative content library and pedagogical technique, state-of-the-art classrooms and worldwide course delivery systems. We believe that quality and customer satisfaction remain the underlying driving force for our long-term success. In fiscal year 2007, course participants continued to give our instructors and courses their highest quality ratings in our history.
Learning Tree customers have continued to respond positively to our increase in the breadth and depth of our management course offerings. At September 28, 2007, we offered 47 titles in our management curriculum representing 29% of our entire course library, compared to 43 titles, which represented 28% of the Learning Tree course library at the same point in fiscal year 2006. We intend to meet the demand for management education by continuing to develop additional management course titles, and by increasing the sales and marketing for our management course programs. In response to customer demand and the expressed need for management education that is more relevant to real-world business challenges, in fiscal year 2006 we introduced our Reality Plus™ line of management courses. We believe that these courses represent a significant advancement in providing state–of-the-art management education.
Our business continues to be influenced by world events, the economy, and corporate spending trends for IT, among other factors. We use a strong, focused, integrated marketing and sales strategy that clearly and visibly helps our customers identify specific applications of training services to improve their business performance. Accordingly, we continue to assess alternative approaches to sales and marketing with the objective of improving our performance under current market conditions. However, there is no guarantee that these approaches will be successful. See Item 1A.
We follow a 52- or 53-week fiscal year. Our year-end and quarter-end dates are on the Friday nearest the end of the calendar quarter. Accordingly, our fiscal year 2005 ended on September 30, 2005, fiscal year 2006 ended on September 29, 2006, and fiscal year 2007 ended on September 28, 2007. Each of those years comprised 52 weeks. Fiscal year 2008 will be a 53-week year, and will end on October 3, 2008.
22
RESULTS OF OPERATIONS
The following table summarizes our consolidated statements of operations for the periods indicated expressed as percentages of revenues:
| | | | | | | | | |
| | | Fiscal Year Ended | |
| | | September 30,
2005 | | | September 29,
2006 | | | September 28,
2007 | |
Revenues | | 100.0 | % | | 100.0 | % | | 100.0 | % |
Cost of revenues | | 50.1 | | | 49.4 | | | 43.6 | |
| | | | | | | | | |
Gross profit | | 49.9 | | | 50.6 | | | 56.4 | |
Operating expenses: | | | | | | | | | |
Course development | | 5.3 | | | 6.6 | | | 5.1 | |
Sales and marketing | | 28.0 | | | 27.6 | | | 24.6 | |
General and administrative | | 18.1 | | | 18.1 | | | 18.0 | |
| | | | | | | | | |
Total operating expenses | | 51.4 | | | 52.3 | | | 47.7 | |
| | | | | | | | | |
Income (loss) from operations | | (1.5 | ) | | (1.7 | ) | | 8.7 | |
Other income (expense), net | | 1.5 | | | 2.2 | | | 2.5 | |
| | | | | | | | | |
Income before provision for income taxes | | — | | | 0.5 | | | 11.2 | |
Provision for income taxes | | 1.1 | | | 2.5 | | | 1.0 | |
| | | | | | | | | |
Net Income (loss) | | (1.1 | )% | | (2.0 | )% | | 10.2 | % |
| | | | | | | | | |
FISCAL YEAR 2007 COMPARED WITH FISCAL YEAR 2006
In fiscal year 2007, our revenues were $167.2 million compared to $154.0 million in fiscal year 2006. Income from operations was $14.5 million in fiscal year 2007 compared to a loss from operations of $2.6 million in fiscal year 2006. Net income for fiscal year 2007 was $17.0 million compared to a net loss of $3.1 million in fiscal year 2006.
Revenues.Our fiscal year 2007 revenues increased by 9% compared to fiscal year 2006. This increase was the result of a 9% increase in revenue per participant which was partially offset by a 1% decrease in the number of participants for our courses. The increase in revenue per participant was primarily the result of a 4% positive effect of changes in foreign exchange rates, price increases, and lower attendance under the discounted Passport programs and higher attendance under the higher priced Regular and Voucher programs. During fiscal year 2007, we trained 89,920 course participants, a 1% decrease from the 90,511 participants that were trained during the prior fiscal year.
For fiscal year 2007, we provided 339,620 attendee-days of training versus the 346,616 attendee-days in fiscal year 2006. In our management courses during fiscal year 2007, we provided 101,960 attendee-days of training, a 13% increase over the 90,592 attendee-days in the corresponding period during fiscal year 2006. In our technology courses during fiscal year 2007, we provided 237,660 attendee-days of IT training, a 7% decrease from the 256,024 attendee-days during fiscal year 2006.
We continue to believe in the inherent strength of the IT training market, and we intend to continue to develop and deliver courses that help Learning Tree customers improve their productivity by making the most of their investment in technology products, services and people. As a result, we continue to invest in developing new IT course titles, in addition to increasing the number of course titles in our management curriculum.
Cost of Revenues. Our cost of revenues primarily includes the costs of course instructors and their travel expenses, course materials and equipment, freight, classroom facilities and refreshments.
During fiscal year 2007, we presented 7,023 events, compared to 7,453 events in fiscal year 2006. Our cost of revenues for fiscal year 2007 was $72.9 million compared to $76.2 million in fiscal year 2006. Our cost of revenues as a percentage of our revenues was 43.6% in fiscal year 2007 compared to 49.4% in fiscal year 2006. Changes in exchange rates do not materially affect our gross profit percentages since exchange rates have essentially the same impact on both revenues and cost of revenues in any time period.
The decrease in cost of revenues as a percentage of revenues in fiscal year 2007 compared to the prior year is due to an increase in average revenue per event of 15% offset slightly by an increase of 1% in average cost per event. The increase in our average revenue per event results principally from the increase in average revenue per participant discussed above, a 5% increase in average participants per event, and a slight decrease in the number of events held at customer locations, which typically have a lower average revenue per event than events held in our own education centers. The increase in average cost per event results from the effect of a 4% change in foreign exchange rates, mostly offset by reductions in education center costs and reduced instructor expenses, compared to the prior year.
23
Course Development Expenses. We maintain a disciplined process to develop new courses and update our existing courses. All costs incurred in that process, principally for internal product development staff and for subject matter experts, are expensed when incurred and are included in course development expenses.
During fiscal year 2007, course development expenses were 5.1% of revenues compared to 6.6% during the prior year. In fiscal year 2007, we decreased our overall spending on course development by 15% to $8.6 million compared with $10.1 million in fiscal year 2006. Beginning in the second quarter of fiscal year 2006, we had significantly increased our spending on course development primarily in conjunction with the development and updating of our management course curriculum. During fiscal year 2007 we converted 2 management course titles to the RealityPlus™ methodology compared to 13 management courses converted in fiscal year 2006. We introduced 9 new management course titles in fiscal year 2007 compared with 11 new management course titles introduced in fiscal year 2006. During fiscal year 2007 we introduced 16 IT courses, comparable with 2006.
At the end of fiscal year 2007, the Learning Tree library of instructor-led courses numbered 162 titles, comprising over 3,726 hours of training compared with 152 titles at the end of fiscal year 2006. The increase in the number of titles in fiscal year 2007 reflects the net effect of introducing 25 new titles and retiring 15 titles. In general, titles are retired when the profits they generate no longer justify the ongoing cost of marketing them and maintaining their content. Thus, we may or may not develop more titles than we retire in any period.
At September 28, 2007, we had 47 management titles in the Learning Tree course library, compared with 43 management titles at the same point a year earlier. Our library of IT titles numbered 115 as of September 28, 2007 compared to 109 titles at the end of fiscal year 2006.
We plan to increase our investment in course development during fiscal 2008, which should result in an increased rate of new course introductions toward the end of that year. Additionally, we continue to be excited about extending our proprietary RealityPlus™ instructional technology within our management curriculum. We have also initiated a research program to explore adapting our existing courses to a blended-learning format that would combine classroom instruction and on-line learning.
Sales and Marketing Expenses. Sales and marketing expenses include the cost of designing, producing and distributing direct mail and media advertisements, marketing e-mails and our website; compensation and travel-related costs for sales and marketing personnel; and the cost of information systems to support these activities. Our sales and marketing expense, and in particular our expenditure on course catalogs, is one of our largest expenditures. We have adjusted the market segments to which we mail our catalogs, and are presently evaluating a number of additional ways to increase the efficiency of our marketing expenditures by spending less without materially affecting the response to that marketing. At the same time, we have been increasing our sales staff in certain operating units. Based on our experience to date, in those operating units, we intend to continue expanding our sales staffing in order to implement this strategy in all operating units.
Our sales and marketing expenses were 24.6% and 27.6% of revenues in fiscal years 2007 and 2006, respectively. Sales and marketing expenses decreased to $41.1 million in fiscal year 2007 compared to $42.5 million in fiscal year 2006. This decrease was primarily the result of a $4.0 million decrease due to a reduction in the quantity of catalogs mailed, offset by a $2.1 million increase in sales compensation expense including incentive compensation, a $0.6 million increase in use taxes due on catalogs and the effects of changes in foreign exchange rates.
General and Administrative Expenses. Our general and administrative expenses in fiscal year 2007 increased by $2.1 million over the prior fiscal year, from $27.9 million to $30.0 million and represented 18.0% of revenues compared to 18.1% in fiscal year 2006. The increase in General and Administrative expenses is primarily due to the effect of changes in foreign exchange rates, a $1.1 million increase in salary expense, a $1.1 million increase in incentive compensation expense, a one-time increase of $0.3 million in personnel expense, an expense of $0.4 million associated with subleasing and facilities arrangements in our United Kingdom Education Center, offset by a decrease of $1.0 million in professional service fees.
For fiscal year 2007, total expenses associated with stock option compensation in accordance with Financial Accounting Standards Board (“FASB”) Statement No. 123 (revised 2004) –Share-Based Payment(“SFAS 123(R)”) was $1.0 million, approximately the same as in fiscal year 2006. In fiscal year 2007, $0.7 million of SFAS 123(R) expense was recorded to general and administrative expense, also about the same as in fiscal year 2006. The remainder of our SFAS 123(R) expense is apportioned among other expense categories, based on where we record the compensation costs for the individuals with whom the stock option compensation expense is associated.
24
Other Income (Expense), Net. Other income (expense), net is primarily comprised of interest income and foreign currency transaction gains and losses. During fiscal year 2007, other income, net totaled $4.2 million, compared to $3.4 million in fiscal year 2006. The increase principally relates to higher interest rates earned on higher invested balances.
Income Taxes. In fiscal year 2007, our income tax provision was $1.8 million compared to $3.9 million in fiscal year 2006. Our effective rate for fiscal year 2007 is 9% compared to 527% in fiscal year 2006. The low effective rate for fiscal year 2007 is attributable to the reversal of the valuation allowance related to our U.S. deferred tax assets (which reduced our tax provision by $2.8 million) and $3.2 million from favorable adjustments from an audit of our Canadian subsidiary. The effective tax rate in fiscal year 2006 is unusually high because of the provision related to the Canadian transfer pricing tax examination, a worldwide transfer pricing contingency reserve, and a valuation allowance for deferred tax assets for our U.S. and French operating subsidiaries.
During fiscal year 2006, our Canadian subsidiary underwent a transfer pricing tax examination by the Canada Revenue Agency (CRA) with respect to fiscal years 2002 and 2003. In September 2006, CRA proposed a preliminary assessment in the amount of $0.3 million for additional taxes and interest. In December 2006, we accepted the proposed assessment and included this amount in our tax provision for fiscal year 2006. In July 2007, we requested that CRA adjust our Canadian income taxes for fiscal years 2000, 2001, 2004, and 2005 in a manner consistent with the adjustments CRA required for tax years 2002 and 2003. In addition, we filed our Canadian income tax return for tax year 2006 consistent with that methodology. The impact of adjusting the four additional years and filing the 2006 return consistently with the adjusted years, when netted against the assessments for 2002 and 2003, resulted in a net benefit to us of approximately $3.2 million. See Note 3 of “Notes to Consolidated Financial Statements.”
During fiscal year 2006, we established valuation allowances for portions of the deferred tax assets of our U.S. entities and one entity in a foreign jurisdiction. As of the end of the fourth quarter of fiscal year 2007, we determined that it was more likely than not that certain of these deferred tax assets are recoverable, based on the improved financial performance of the U.S. entities during fiscal year 2007 and our expectations for the future. Accordingly, we released the valuation allowance for the assets of the U.S. entities, except for the assets related to foreign tax credit carryovers and the deferred tax assets for certain state jurisdictions. This release of the valuation allowance resulted in a net benefit of approximately $2.8 million recognized in the fiscal year 2007 tax provision. Our total valuation allowance decreased by $2.9 million, with the additional decrease attributable to fiscal year 2007 results from operations.
As of September 28, 2007, we continued to maintain valuation allowances in the U.S. related to the foreign tax credit carryovers and certain state deferred tax assets, and we continued to maintain a valuation allowance for our deferred tax assets in a foreign jurisdiction. We intend to maintain these valuation allowances until sufficient positive evidence exists to support their reversal. Profits or losses incurred in the U.S. and in the foreign jurisdiction will affect the ongoing amount of the valuation allowances.
We have not provided for U.S. federal income and foreign withholding taxes of international subsidiaries’ undistributed earnings as of September 28, 2007, because such earnings are intended to be reinvested indefinitely. The undistributed earnings were approximately $37.1 million as of September 28, 2007. If these earnings were distributed, we would incur approximately $0.2 million of foreign withholding taxes. Because of the availability of U.S. foreign tax credits, it is not practicable to determine the U.S. federal income tax liability that would be payable if such earnings were not reinvested.
Geographic Data. We have Learning Tree Education Centers in six countries and have historically derived approximately half of our revenues from outside the United States. The United States operations recorded revenues of $74.7 million in fiscal year 2007 compared to revenues of $71.3 million in fiscal year 2006. Revenues from our European operations were $73.5 million in fiscal year 2007 compared to $65.2 million in fiscal year 2006. Canadian operations recorded revenues of $16.3 million in fiscal year 2007 compared to revenues of $14.8 million in fiscal year 2006 and our Asian operations recorded revenues of $2.7 million in fiscal year 2007 compared to $2.7 million in fiscal year 2006. See Note 9 of “Notes to Consolidated Financial Statements” for further information on segment reporting.
25
Although our consolidated financial statements are stated in U.S. dollars, all of our subsidiaries other than in the U.S. have functional currencies other than the U.S. dollar. Gains and losses arising from the translation of the balance sheets of our subsidiaries from the functional currencies to U.S. Dollars are reported as adjustments to stockholders’ equity. Fluctuations in exchange rates may also have an effect on our results of operations. Since both revenues and expenses are generally denominated in the subsidiary’s local currency, changes in exchange rates that have an adverse effect on our foreign revenues are partially offset by a favorable effect on our foreign expenses, and vice versa. The impact of future exchange rates on our results of operations cannot be accurately predicted. To date, we have not sought to hedge the risks associated with fluctuations in exchange rates and therefore we continue to be subject to such risks. In the future, we may undertake such hedging transactions. There can be no assurance that any hedging techniques we implement would be successful in eliminating or reducing the effects of currency fluctuations. See Item 1A.
FISCAL YEAR 2006 COMPARED WITH FISCAL YEAR 2005
In fiscal year 2006, our revenues were $154.0 million compared to $151.6 million in fiscal year 2005. We reported a loss from operations of $2.6 million in fiscal year 2006 compared to a loss from operations of $2.2 million in the prior year. Net loss for fiscal year 2006 was $3.1 million compared to a net loss of $1.7 million in fiscal year 2005.
Revenues.Our fiscal year 2006 revenues increased by 2% compared to fiscal year 2005. This increase was the result of a 3% increase in the number of participants in our courses offset by a 2% decrease in revenue per participant. The decline in revenue per participant was the result of a 1% negative effect from changes in foreign exchange rates as well as an increase in the percentage of courses being held at customer locations and an increase in the percentage of participants in our management courses. Courses held at customer locations are typically sold at prices that result in lower average revenue per participant than courses held in our own Education Centers. The average management course is shorter than the average IT course, and thus generally has lower average revenue per participant. During fiscal year 2006, we trained 90,511 course participants, a 3% increase from the 87,673 participants that were trained during the prior fiscal year.
For fiscal year 2006, we provided 346,616 attendee-days of training, versus the 346,097 attendee-days in fiscal year 2005. For management courses during fiscal year 2006, we provided 90,592 attendee-days of training, a 17% increase over the 77,281 attendee-days in the corresponding period in fiscal year 2005. For technology courses for fiscal year 2006, we provided 256,024 attendee-days of IT training, a 5% decrease from the 268,816 attendee-days in fiscal year 2005.
Cost of Revenues. Our cost of revenues primarily includes the costs of course instructors and their travel expenses, course materials and equipment, freight, classroom facilities and refreshments.
During fiscal year 2006, we presented 7,453 events compared to 7,195 events conducted during fiscal year 2005. Our cost of revenues for fiscal year 2006 was $76.2 million compared to $76.0 million in fiscal year 2005. Our cost of revenues as a percentage of our revenues was 49.4% and 50.1% for fiscal years 2006 and 2005, respectively.
Excluding the effect of exchange rates, the decrease in cost of revenues as a percentage of revenues in fiscal year 2006 reflects a 3% decrease in average cost per event, which was partially offset by a 2% decrease in revenue per event. The decrease in average cost per event, excluding the effect of exchange rates, primarily reflects a slight increase in the proportion of course events held at customer locations during fiscal year 2006 as compared to fiscal year 2005 largely offset by one-time costs of $1.1 million associated with our move to our new Education Center in New York City in August 2006. The decrease in our average revenue per event, excluding the effect of exchange rates, resulted principally from an increase in the proportion of events held at customer locations, which typically have a lower average revenue per event than events held in our own education centers, partially offset by the increase in our average revenue per attendee-day (discussed above).
Changes in exchange rates do not materially affect gross profit percentages since exchange rates have essentially the same impact on both revenues and cost of revenues in any time period.
Course Development Expenses. Beginning in the second quarter of fiscal year 2006, we significantly increased our spending on course development primarily in conjunction with the development and updating of our management
26
course curriculum to incorporate our new RealityPlus™ methodology. During fiscal year 2006, course development expenses were 6.6% of revenues as compared to 5.3% during the prior year. In fiscal year 2006, we increased our overall spending on course development by 27% to $10.1 million compared with $8.0 million in fiscal year 2005.
During fiscal year 2006 we converted 13 management course titles to the RealityPlus™ methodology. Additionally, we introduced 11 new management course titles in fiscal year 2006 compared with 3 new management course titles introduced in fiscal year 2005.
At the end of fiscal year 2006, the Learning Tree library of instructor-led courses numbered 152 titles, comprising over 3,552 hours of training compared with 141 titles at the end of fiscal year 2005. The increase in the number of titles in fiscal year 2006 reflects the net effect of introducing 29 new titles and retiring 18 titles.
At September 29, 2006, we had 43 management titles in the Learning Tree course library, compared with 32 management titles at the same point a year earlier. Our library of IT titles remained unchanged, numbering 109 titles at the end of both fiscal years 2006 and 2005.
Sales and Marketing Expenses. Our sales and marketing expenses were 27.6% and 28.0% of revenues in fiscal years 2006 and 2005, respectively. Sales and marketing expenses remained relatively constant at $42.5 million and $42.4 million, respectively during fiscal years 2006 and 2005. This slight increase was a result of $1.1 million related to the addition of new sales staff offset by a reduction of $1.0 million associated with reduced catalog mailings, postage and lower fulfillment costs and the effect of changes in foreign exchange rates.
General and Administrative Expenses. Our general and administrative expenses in fiscal year 2006 increased by $0.4 million over the prior fiscal year, and represented 18.1% of revenues in both years. During fiscal year 2006 the increase in our general and administrative expenses compared to fiscal year 2005, was principally due to a $1.0 million increase in professional service fees, an increase of $0.7 million for stock compensation expense, partially offset by a reduction of $1.8 million in costs associated with lease termination costs and impairments of certain assets related to our United Kingdom Education Center in fiscal year 2005 as well as an increase of $0.3 million related to miscellaneous expenses and the effect of changes in foreign exchange rates.
Total SFAS 123(R) expense for fiscal year 2006 was $1.0 million, of which $0.7 million is recorded as general and administrative expense, as noted above. The remainder of our SFAS 123(R) expense is apportioned among other expense categories, based on where we record the compensation costs for the individuals with whom the stock option compensation expense is associated. We do not expect the distribution of SFAS 123(R) expense among expense categories to differ significantly from one year to the next. Because we adopted SFAS 123(R) effective October 1, 2005, the first day of our fiscal year 2006, we did not report stock option compensation expense in fiscal year 2005.
In fiscal year 2005, we entered into a series of subleases for new subtenants to occupy three and one-half floors of vacated space in our United Kingdom Education Facility. Based on the subleases signed at various points in fiscal year 2005, the actual terms and additional expenses of readying the space for lease were revised from the initial assumptions made in fiscal year 2004. We recorded a net change of $0.8 million in our Deferred rent facilities and other account to account for the revised assumptions. No similar liabilities were recorded in fiscal year 2006, although a nominal amount of accretion expense related to the lease termination costs was recorded as an increase in our general and administrative expenses both in fiscal year 2006 and fiscal year 2005.
Other Income (Expense), Net. Other income (expense), net is primarily comprised of interest income and foreign currency transaction gains and losses. During fiscal year 2006, other income, net totaled $3.4 million, compared to $2.3 million in fiscal year 2005. The increase principally relates to higher interest rates earned on invested balances.
Income Taxes. In fiscal year 2006 our income tax provision increased to $3.9 million from $1.7 million in fiscal year 2005. The fiscal year 2006 income tax provision was increased by $0.4 million relating to a Canadian income tax settlement, $0.5 million relating to a contingency reserve for worldwide transfer pricing and an additional $3.3 million relating to a valuation allowance for deferred tax assets for our U.S. and French operating subsidiaries. Our effective tax rate for fiscal year 2006 was 527% compared to 10,076% in fiscal year 2005. The effective tax rate in fiscal year 2006 was unusually high because of the provision related to the Canadian transfer pricing tax audit, the worldwide transfer
27
pricing contingency reserve, and the U.S. and French valuation allowances. The effective tax rate in fiscal year 2005 was extraordinarily high as a result of the impact of permanent differences, which had an extraordinary percentage impact in fiscal year 2005 when pre-tax income was near breakeven and significantly lower than in fiscal year 2006. Additionally, the fiscal year 2005 effective tax rate was impacted by a $1.1 million one-time charge relating to an unutilized fiscal year 2001 tax deduction.
Inflation. Inflation and changing prices do not have a significant impact on our net sales, revenues and income from continuing operations.
Recently Issued Accounting Pronouncements.
In July 2006, the Financial Accounting Standards Board issued Interpretation No. 48,Accounting for Uncertainty in Income Taxes (“FIN 48”). FIN 48 clarifies the accounting for income taxes by prescribing the minimum recognition threshold a tax position is required to meet before being recognized in the financial statements and applies to all tax positions related to income taxes subject to Financial Accounting Standards Board Statement No. 109,Accounting for Income Taxes, (FAS 109). FIN 48 is effective for fiscal years beginning after December 15, 2006. We will adopt FIN 48 in fiscal year 2008. We are currently assessing the potential effect of FIN 48 on our consolidated financial statements.
In September 2006, the FASB issued Statement of Financial Accounting Standards No. 157,Fair Value Measurements(“SFAS 157”). SFAS 157 provides a common definition of fair value and establishes a framework to make the measurement of fair value in generally accepted accounting principles more consistent and comparable. SFAS 157 also requires expanded disclosures to provide information about the extent to which fair value is used to measure assets and liabilities, the methods and assumptions used to measure fair value, and the effect of fair value measures on earnings. SFAS 157 is effective for our 2009 fiscal year, although early adoption is permitted. In September 2007, the FASB provided a one-year deferral for the implementation of SFAS 157 only with regard to nonfinancial assets and liabilities. We are currently assessing the potential effect of SFAS 157 on our consolidated financial statements.
In February 2007, the FASB issued SFAS No. 159,The Fair Value Option for Financial Assets and Financial Liabilities—Including an amendment of FASB Statement No. 115, (“SFAS 159”).SFAS 159 permits entities to choose to measure many financial instruments and certain other items at fair value. The objective is to improve financial reporting by providing entities with the opportunity to mitigate volatility in reported earnings caused by measuring related assets and liabilities differently without having to apply complex hedge accounting provisions. SFAS 159 is effective for our fiscal year 2009. We are currently assessing the potential effect of SFAS 159 on our consolidated financial statements, but do not believe the adoption will have a material impact on our consolidated financial statements.
28
QUARTERLY RESULTS OF OPERATIONS
The following tables set forth unaudited quarterly financial data for the eight fiscal quarters ended September 28, 2007. We believe that this information includes all adjustments necessary for a fair presentation of such quarterly information when read in conjunction with the “Notes to Consolidated Financial Statements.” The operating results for any quarter are not necessarily indicative of the results for any future period.
| | | | | | | | | | | | | | | |
| | | Q1 December 30,
2005 | | Q2 March 31,
2006 | | | Q3 June 30,
2006 | | | Q4 September 29,
2006 | |
Revenues | | $ | 39,806 | | $ | 34,282 | | | $ | 41,218 | | | $ | 38,743 | |
Cost of revenues | | | 18,936 | | | 18,253 | | | | 20,294 | | | | 18,681 | |
| | | | | | | | | | | | | | | |
Gross profit | | | 20,870 | | | 16,029 | | | | 20,924 | | | | 20,062 | |
Operating expenses: | | | | | | | | | | | | | | | |
Course development | | | 2,298 | | | 2,436 | | | | 2,854 | | | | 2,492 | |
Sales and marketing | | | 9,341 | | | 11,384 | | | | 11,515 | | | | 10,263 | |
General and administrative | | | 6,713 | | | 6,389 | | | | 6,918 | | | | 7,924 | |
| | | | | | | | | | | | | | | |
Total operating expenses | | | 18,352 | | | 20,209 | | | | 21,287 | | | | 20,679 | |
| | | | | | | | | | | | | | | |
Income (loss) from operations | | | 2,518 | | | (4,180 | ) | | | (363 | ) | | | (617 | ) |
Other income (expense), net | | | 659 | | | 843 | | | | 998 | | | | 873 | |
| | | | | | | | | | | | | | | |
Income (loss) before provision for income taxes | | | 3,177 | | | (3,337 | ) | | | 635 | | | | 256 | |
Provision for (benefit from) income taxes | | | 1,282 | | | (1,380 | ) | | | 157 | | | | 3,794 | |
| | | | | | | | | | | | | | | |
Net income (loss) | | $ | 1,895 | | $ | (1,957 | ) | | $ | 478 | | | $ | (3,538 | ) |
| | | | | | | | | | | | | | | |
Income (loss) per common share - basic | | $ | 0.11 | | $ | (0.12 | ) | | $ | 0.03 | | | $ | (0.21 | ) |
| | | | | | | | | | | | | | | |
Income (loss) per common share - diluted | | $ | 0.11 | | $ | (0.12 | ) | | $ | 0.03 | | | $ | (0.21 | ) |
| | | | | | | | | | | | | | | |
| | | | |
| | | Q1 December 29,
2006 | | Q2 March 30,
2007 | | | Q3 June 29,
2007 | | | Q4 September 28,
2007 | |
Revenues | | $ | 42,713 | | $ | 37,631 | | | $ | 42,663 | | | $ | 44,186 | |
Cost of revenues | | | 18,353 | | | 17,235 | | | | 18,297 | | | | 19,051 | |
| | | | | | | | | | | | | | | |
Gross profit | | | 24,360 | | | 20,396 | | | | 24,366 | | | | 25,135 | |
Operating expenses: | | | | | | | | | | | | | | | |
Course development | | | 1,869 | | | 1,911 | | | | 2,345 | | | | 2,488 | |
Sales and marketing | | | 9,298 | | | 9,985 | | | | 9,440 | | | | 12,371 | |
General and administrative | | | 7,097 | | | 7,456 | | | | 7,539 | | | | 7,949 | |
| | | | | | | | | | | | | | | |
Total operating expenses | | | 18,264 | | | 19,352 | | | | 19,324 | | | | 22,808 | |
| | | | | | | | | | | | | | | |
Income from operations | | | 6,096 | | | 1,044 | | | | 5,042 | | | | 2,327 | |
Other income (expense), net | | | 1,190 | | | 893 | | | | 980 | | | | 1,173 | |
| | | | | | | | | | | | | | | |
Income before provision for income taxes | | | 7,286 | | | 1,937 | | | | 6,022 | | | | 3,500 | |
Provision for (benefit from) income taxes | | | 2,980 | | | 790 | | | | 2,319 | | | | (4,334 | ) |
| | | | | | | | | | | | | | | |
Net income | | $ | 4,306 | | $ | 1,147 | | | $ | 3,703 | | | $ | 7,834 | |
| | | | | | | | | | | | | | | |
Income per common share - basic | | $ | 0.26 | | $ | 0.07 | | | $ | 0.22 | | | $ | 0.48 | |
| | | | | | | | | | | | | | | |
Income per common share - diluted | | $ | 0.26 | | $ | 0.07 | | | $ | 0.22 | | | $ | 0.48 | |
| | | | | | | | | | | | | | | |
Historically, our quarterly operating results have fluctuated, and that is expected to continue in the future. The fluctuations may be caused by many factors such as: (i) the frequency of course events; (ii) the number of weeks during which courses can be conducted in a quarter; (iii) the timing, timely delivery, frequency and size of and response to our direct mail marketing and advertising campaigns; (iv) the timing of the introduction of new course titles; (v) the mix between course events held at customer sites and course events held in our education centers and hotels due to differing gross profit margins; (vi) competitive forces within markets we serve; (vii) our ability to attract customers and meet their expectations; (viii) currency fluctuations and other risks inherent in international operations; (ix) natural disasters, external strikes, acts of war or terrorism and other external factors; and (x) general economic conditions and industry-specific slowdowns. Fluctuations in quarter-to-quarter results also occur as a result of differences in the timing of our spending on the marketing and development of our courses. See Item 1A.
In the fourth quarter of 2007, we recorded $0.6 million to sales and marketing expense for use taxes due on catalogues as well as $0.5 million of marketing expense that relates to the third quarter. Also in the fourth quarter of 2007 we recorded a reduction in tax expense associated with a transfer pricing examination by the Canada Revenue Agency and we released the deferred tax valuation allowance previously recorded for U.S. entities. See Note 3.
LIQUIDITY AND CAPITAL RESOURCES
Our primary source of liquidity is cash generated from operations, and our existing balance of cash and cash equivalents plus available for sale securities which totaled $88.5 million as of September 28, 2007.
29
Cash Flows. During fiscal year 2007, our cash and cash equivalents increased by $5.3 million to $49.7 million from $44.4 million at September 29, 2006. The increase primarily relates to $18.5 million from cash provided by operations partially offset by $16.0 million due to investing activities. Financing activities provided $0.2 million in cash. Favorable foreign exchange rate fluctuations in fiscal year 2007 increased our reported cash balance by $2.6 million.
| | | | | | | | | | | | | | | | | | | |
| | | Fiscal Year Ended | | | Net Change |
| | | September 30,
2005 | | | September 29,
2006 | | | September 28,
2007 | | | 2006 vs. 2005 | | | 2007 vs. 2006 |
Cash provided by operating activities | | $ | 2.3 | | | $ | 8.4 | | | $ | 18.5 | | | $ | 6.1 | | | $ | 10.1 |
Cash used in investing activities | | | (12.3 | ) | | | (20.6 | ) | | | (16.0 | ) | | | (8.3 | ) | | | 4.6 |
Cash provided by (used in) financing activities | | | (4.3 | ) | | | (1.9 | ) | | | 0.2 | | | | 2.4 | | | | 2.1 |
Our cash flows provided by operating activities increased by $10.1 million in fiscal year 2007. During 2007 trade accounts receivable and deferred revenues increased primarily due to higher revenues and the related increase in prepaid revenues. Income tax receivables increased significantly due to the Canadian tax examination. Asset retirement obligations declined primarily due to the fulfillment of such obligations in conjunction with subleasing the 7th and 8th floors of our United Kingdom Education Center. Other accrued liabilities increased due to accrued royalties and payroll.
Cash used in investing activities for the fiscal year ended September 28, 2007, was $16.0 million, a decrease of $4.6 million over the prior year. The decrease was primarily due to a reduction in capital expenditures of $4.4 million, a net increase of $1.7 million relating to purchases of available for sale securities, a decrease of $1.5 million in lease deposits and proceeds from liquidation of Investment in Collegis, Inc. of $0.4 million.
We did not make any repurchases of shares of our common stock in fiscal year 2007. In fiscal year 2006, we repurchased 166,000 shares of our common stock on the open market at a cost of $1.9 million.
Liquidity. At September 28, 2007, our working capital was $43.9 million, an increase of $15.2 million from September 29, 2006.
We do not have any outstanding indebtedness or open lines of credit. We anticipate we will continue to rely primarily on our balance of cash and cash equivalents, available for sale securities and cash flows from operations to finance our cash needs. We believe that these sources will be sufficient to satisfy our anticipated cash requirements for the foreseeable future.
Capital Requirements. During the year ended September 28, 2007 we made capital expenditures of $5.5 million, of which leasehold improvements accounted for $1.8 million and purchases of course and office equipment amounted to $3.7 million. We will continue to invest in our infrastructure to accommodate any increased customer demand, to continue improving the quality and effectiveness of our course delivery, and to incorporate significant changes in technology. We expect that our estimated capital expenditures in fiscal year 2008 will be approximately $5.8 million.
We have a number of operating leases for our administrative offices and education center classroom facilities located worldwide. These leases expire at various dates over the next 12 years. In addition to requiring monthly payments for rent, some of the leases contain asset retirement provisions whereby we are required to return the leased facilities back to specified conditions at the expiration of the leases.
The following table summarizes our contractual commitments at September 28, 2007:
| | | | | | | | | | | | | | | |
| | | Payments Due by Period (in thousands) |
Contractual Obligations | | Total | | Less than 1 year
(Fiscal 2008) | | 1-2 years (Fiscal
2009 and 2010) | | 3-5 years (Fiscal
2011 and 2013) | | More than 6 years
(Fiscal 2014
through 2020) |
Operating leases (i) | | $ | 114,444 | | $ | 15,456 | | $ | 30,382 | | $ | 32,284 | | $ | 36,322 |
Purchase commitments | | | 1,837 | | | 565 | | | 1,272 | | | — | | | — |
Other lease contractual obligations (ii) | | | 9,312 | | | 96 | | | — | | | 1,138 | | | 8,078 |
| | | | | | | | | | | | | | | |
Total | | $ | 125,593 | | $ | 16,117 | | $ | 31,654 | | $ | 33,422 | | $ | 44,400 |
| | | | | | | | | | | | | | | |
30
| | (i) | Amounts include future minimum sublease rental proceeds of $19.6 million due in the future under non-cancelable subleases. See Note 4 of “Notes to Consolidated Financial Statements” for further details. |
| | (ii) | Represents estimated cash flows to satisfy contractual obligations to restore leased space to specified conditions at expiry of the leases. Amounts include $0.9 million expected to be recovered from subtenants. |
OFF-BALANCE SHEET ARRANGEMENTS
We have no off-balance sheet arrangements that have or are reasonably likely to have a material current or future effect on our financial condition, changes in financial condition, revenues or expenses, results of operations, liquidity, capital expenditures or capital resources.
CRITICAL ACCOUNTING ESTIMATES AND POLICIES
Management’s discussion and analysis of our financial condition and results of operations is based upon our consolidated financial statements, which have been prepared in accordance with accounting principles generally accepted in the United States. The preparation of these financial statements requires management to make judgments, estimates and assumptions that affect the amounts reported in the financial statements and accompanying notes. Actual results could differ from those estimates. The following list of critical accounting estimates and policies is not intended to be a comprehensive list of all of our accounting policies. Our significant accounting policies are more fully described in Note 1 of “Notes to Consolidated Financial Statements.” The following represents a summary of our critical accounting estimates and policies, defined as those policies that we believe are the most important to the portrayal of our financial condition and results of operations, and/or require management’s significant judgments and estimates.
Critical Accounting Estimates
Revenue Recognition. We offer our customers a multiple-course sales discount referred to as a Learning Tree Training Passport. A Learning Tree Training Passport allows an individual Passport holder to attend up to a specified number of courses over a one- to two-year period for a fixed price. For a Training Passport, the amount of revenue recognized for each attendance in a course is based upon the selling price of the Training Passport, the list price of the course taken, the average list price of all courses taken and the estimated average number of courses Passport holders will actually attend. Upon expiration of each individual Training Passport, we record the difference, if any, between the revenues previously recognized and that specific Training Passport’s selling price. The estimated attendance rate is based upon the historical experience of the average number of course events that Training Passport holders have been attending. The actual Training Passport attendance rate is reviewed quarterly, and if the Training Passport attendance rates change, the revenue recognition rate for active Training Passports and for Training Passports sold thereafter is adjusted prospectively.
We believe it is appropriate to recognize revenues on this basis in order to most closely match revenue and related costs, as the substantial majority of our Passport holders do not attend the maximum number of course events permitted under their Training Passports. We believe that the use of recent historical data is reasonable and appropriate because of the relative stability of the average actual number of course events attended by Passport holders.
The average actual attendance rate for all expired Training Passports has closely approximated the estimated rate we utilize. Although we have seen no material changes in the historical rates as the number of course titles has changed, we monitor such potential effects. In general, determining the estimated average number of course events that will be attended by a Training Passport holder is based on historical trends that may not continue in the future. These estimates could differ in the near term from amounts used in arriving at the reported revenue. If the estimates are wrong, we would record the difference between the revenues previously recognized for that Training Passport and the Training Passport selling price upon expiration of that Training Passport. Thus, the timing of revenue recognition may be affected by an inaccurate estimation, but the inaccuracy would have no effect on the aggregate revenue recognized over the one- to two-year life of each Training Passport.
31
Allowance for Doubtful Accounts Receivable. Trade accounts receivable are reduced by an allowance for amounts that may become uncollectible in the future. We use estimates in determining the allowance for doubtful accounts receivable, based on our analysis of various factors, including our historical collection experience, current trends, specific identification of invoices which are considered doubtful and a percentage of our past due accounts receivable. Although our estimates for this reserve have in the past been reasonably accurate, these estimates could differ from actual collection experience and are subject to adjustment. Our trade accounts receivable are written off when they are deemed uncollectible.
Lease Termination Costs. We lease education center and administrative office space under various operating lease agreements. Certain of these operating leases include space that is not used and which is currently subleased. We calculate and record a liability related to those leases based on the difference between the present value of the net aggregate sublease rental income and the present value of the prime lease costs for the subleased space throughout the remaining term of the leases. Periodically, we evaluate the nature and extent of each of the individual provisions and make adjustments as appropriate, as new information becomes available or subsequent developments occur.
In 1999, we entered into a 20-year lease on a building in London to house our United Kingdom Education Center. This building has space in addition to that required for our current needs, which we attempt to sublet. When space is vacant from time to time, we must estimate the fair value of the liability for the vacant space based upon the remaining lease costs as defined by our operating lease agreement reduced by estimated future sublease rental income that could be reasonably obtained for the property based upon prevailing real estate market conditions. The computed long-term portion of such liabilities is recorded as Deferred facilities rent and other in the accompanying consolidated financial statements with the short-term portion being recorded in Other accrued liabilities. Amounts are paid under the master lease to the landlord net of subtenant monthly sublease receipts, and applied to our accrued lease liability, reducing the amount of liability recorded with an offset to General and Administrative expenses.
Asset Retirement Obligations. We have adopted SFAS No. 143,Accounting for Asset Retirement Obligations(“SFAS 143”) which requires us to record a liability equal to the fair value of the estimated future cost to retire an asset. For us, most asset retirement obligations (“ARO”) liabilities are primarily associated with education facilities leasehold improvements which, at the end of a lease, we are obligated to remove in order to restore the facility back to a condition specified in the lease agreement. At the inception of such a lease, we record the ARO as a liability and also record a leasehold improvement asset in an amount equal to the fair value of the liability. The capitalized leasehold improvement asset is then depreciated on a straight-line basis over 20 years or the term of the lease, whichever is shorter. Any difference between the actual costs incurred for the eventual retirement and the estimated liability previously recorded will be recognized as a gain or loss in our statement of operations at the termination of the lease.
The fair value of any such ARO liability is estimated in three steps: (1) the costs of leasehold restoration are estimated as if they were to be performed at the inception of the lease, (2) the cost is forecast into the future by applying an inflation rate in effect at the time of adoption together with a market-risk premium for a contractor’s risk for performing the work in the future, and (3) the present value of this future cost is computed by discounting it at our credit worthiness interest rate (determined at the inception of the lease).
The ARO liability is subsequently increased annually by interest accretion throughout the term of the lease. In future periods we may also make adjustments to the ARO liability as a result of the availability of new information, technology changes, changes in labor costs and other factors. The estimate of ARO liability is based on a number of assumptions requiring professional judgment. We cannot predict what revisions to these assumptions will be required in future periods.
The ARO liability is based on a number of assumptions requiring professional judgment. These include estimates for: (1) expected future cash flows related to contractual obligations, primarily to restore leased space back to open floor layouts as required by the lease agreements; (2) our credit-adjusted risk free rate that considers our estimated credit rating as of the date of lease inception; (3) the market risk premium that we determine based on the length of the individual leases; and (4) the relevant inflation factor in each impacted country. For the more significant AROs we obtain third-party restoration estimates specific to those leases. We cannot predict the type of revisions to these assumptions that will be required in future periods due to the availability of additional information, technology changes, the price of labor costs and other factors.
32
Critical Accounting Policies
Revenue Recognition. Learning Tree course events range from two to five days, with an average duration of approximately four days. We use a 52- or 53-week fiscal year in order to better align our external financial reporting with the way we operate our business. Under this method, each fiscal quarter ends on the Friday closest to the end of the calendar quarter. Since all courses have a duration of five days or less, and all courses begin and end within the same calendar week, under the 52- or 53-week fiscal year method all revenues and related direct costs for each course event are recognized in the week and the fiscal quarter in which the event takes place.
We offer our customers a multiple-course sales discount referred to as a Learning Tree Training Passport. A Learning Tree Training Passport allows an individual Passport holder to attend up to a specified number of courses over a one- to two-year period for a fixed price. For a Training Passport, the amount of revenue recognized for each attendance in a course is based upon the selling price of the Training Passport, the list price of the course taken, the average list price of all courses taken and the estimated average number of courses Passport holders will actually attend. Upon expiration of each individual Training Passport, we record the difference, if any, between the revenues previously recognized and that specific Training Passport’s selling price. The estimated attendance rate is based upon the historical experience of the average number of course events that Training Passport holders have been attending. The actual Training Passport attendance rate is reviewed quarterly, and if the Training Passport attendance rates change, the revenue recognition rate for active Training Passports and for Training Passports sold thereafter is adjusted prospectively.
We believe it is appropriate to recognize revenues on this basis in order to most closely match revenue and related costs, as the substantial majority of our Passport holders do not attend the maximum number of course events permitted under their Training Passports. We believe that the use of recent historical data is reasonable and appropriate because of the relative stability of the average actual number of course events attended by Passport holders.
The average actual attendance rate for all expired Training Passports has closely approximated the estimated rate we utilize. Although we have seen no material changes in the historical rates as the number of course titles has changed, we monitor such potential effects. In general, determining the estimated average number of course events that will be attended by a Training Passport holder is based on historical trends that may not continue in the future. These estimates could differ in the near term from amounts used in arriving at the reported revenue. If the estimates are wrong, we would record the difference between the revenues previously recognized for that Training Passport and the Training Passport selling price upon expiration of that Training Passport. Thus, the timing of revenue recognition may be affected by an inaccurate estimation, but the inaccuracy would have no effect on the aggregate revenue recognized over the one- to two-year life of each Training Passport.
In addition to our Learning Tree Training Passports, we also offer a multiple-course sales discount referred to as Learning Tree Training Vouchers. With Learning Tree Training Vouchers, a customer buys the right to send a specified number of attendees to Learning Tree courses over a six- to twelve-month period for a fixed price. Revenue is recognized on a pro rata basis for each attendance. If a Training Voucher has unused seats at the time of expiration of the Voucher, we record the pro rata selling price of the expired unused seat as revenue. At times we make a business decision to extend a voucher beyond the normal 12-month expiration date.
To provide additional flexibility to meet our customers’ training needs, we offer a multiple-training day sales discount referred to as Learning Tree 10-Day Passes. With Learning Tree 10-Day Passes, a customer buys the right to take up to 10 days of training over a one-year period for a fixed price. Revenue is recognized on a pro-rata basis for each attendance day. If a 10-Day Pass has unused days at expiration, we record the pro-rata value of the unused days as revenue.
33
Stock-Based Compensation. We adopted SFAS No. 123 (Revised 2004),Share-Based Payment (“SFAS 123(R)”) on the first day of our fiscal year 2006 and as a result changed our critical accounting policy regarding stock-based compensation. This change had a material effect on our results of operations as described below.
We changed the accounting for our stock option plans from the intrinsic value method used prior to October 1, 2005 to the fair value method as required by SFAS 123(R). We adopted SFAS 123(R) using the modified prospective transition method. Our consolidated financial statements for fiscal years 2006 and 2007 reflect the impact of SFAS 123(R). In accordance with the modified prospective transition method, our consolidated financial statements for prior periods have not been restated to reflect, and do not include, the impact of SFAS 123(R).
SFAS 123(R) requires companies to estimate the fair value of share-based payment awards on the date of grant using an option-pricing model. The value of the portion of the award that is ultimately expected to vest is recognized as expense over the requisite service periods in our consolidated statements of operations. Our determination of fair value of share-based payment awards on the date of grant using an option-pricing model is affected by assumptions regarding a number of highly complex and subjective variables. These variables include our expected stock price volatility, expected term, risk-free interest rates, and actual and projected employee stock option exercise behaviors.
We analyzed our historical volatility to estimate the expected volatility consistent with SFAS 123(R). The risk-free interest rate assumption is an average of the three- and five-year U.S. Treasury rates at the date of grant, which most closely resembles the four-year expected life of our options. The estimated expected life represents the weighted-average period the stock options are expected to remain outstanding and has been determined based on an analysis of historical exercise behavior.
As stock-based compensation expense recognized in the consolidated statements of operations is based on awards ultimately expected to vest, it has been reduced for estimated pre-vesting forfeitures. Forfeitures were estimated based on historical experience.
We adopted the alternative transition method detailed in FASB Staff Position No. FAS 123(R)-3,Transition Election Related to Accounting for Tax Effects of Share-Based Payment Awards, for calculating the tax effects of stock-based compensation pursuant to SFAS 123(R). The alternative transition method includes a simplified method to establish the beginning balance of the additional paid-in capital pool (APIC pool) related to the tax effects of employee stock-based compensation, which is available to absorb tax deficiencies recognized subsequent to the adoption of SFAS 123(R).
Long-Lived Assets.We periodically review the carrying value of our long-lived assets, such as equipment, property and leasehold improvements, for impairment whenever events or changes in circumstances indicate that the carrying value may not be recoverable. In making such evaluations, we compare the expected future cash flows to the carrying amount of the assets. If the total of the expected future cash flows is less than the carrying amount of the assets, we are required to make estimates of the fair value of the long-lived assets in order to calculate the impairment loss equal to the difference between the fair value and the carrying value of the assets. We make significant assumptions and estimates in this process regarding matters that are inherently uncertain, such as estimating cash flows, remaining useful lives, discount rates and growth rates. The resulting cash flows are computed over an extended period of time, which subjects those assumptions and estimates to an even larger degree of uncertainty. While we believe that our estimates are reasonable, different assumptions regarding such cash flows could materially affect the valuation of long-lived assets.
Income Taxes. We provide for income taxes under the provisions of Statement of Financial Accounting Standards No. 109 (“SFAS 109”). Deferred income taxes result from temporary differences between the tax basis of assets and liabilities and the basis reported in our consolidated financial statements. Deferred tax liabilities and assets are determined based on the difference between financial statement and tax basis of assets and liabilities using enacted rates expected to be in effect during the year in which the differences reverse. We must then also assess the likelihood that our deferred tax assets will be recovered from future taxable income, and, to the extent we believe that it is more likely than not that some portion or all of our deferred tax assets will not be realized, we must establish a valuation allowance. To the extent we establish a valuation allowance or change the allowance in a period, we must reflect the corresponding increase or decrease within the tax provision in the statement of operations.
34
In the normal course of business, we are subject to audits by federal, state and foreign tax authorities, and these authorities may challenge the amount of taxes due. While we believe our tax positions comply with applicable tax law, we evaluate exposures associated with various tax filing positions and we record reserves for uncertain tax positions. We believe these reserves are adequate. Our effective tax rate in a given period could be impacted if we were to determine the reserves are not required, or if we were to be required to pay amounts in excess of established reserves.
OUTLOOK
If foreign exchange rates as of November 30, 2007 remain constant for the remainder of our first quarter of fiscal year 2008, we expect an effect of approximately 7.0% on our revenues and costs compared with the first quarter of fiscal year 2007.
We currently anticipate that our revenues for our first quarter of fiscal year 2008 will be approximately $49.0 to $51.0 million, compared to $42.7 million in the first quarter of fiscal year 2007.
We expect that the gross profit as a percentage of revenues for our first quarter of fiscal year 2008 will be between 57.2% and 58.2% compared to 57.0% in our first quarter of fiscal year 2007. We also expect that our future gross profit percentages will continue to reflect the normal quarterly patterns which we have experienced in prior years.
We expect overall operating expenses for our first quarter of fiscal year 2008 to be between $20.0 million and $21.0 million, compared with $18.3 million in the first quarter of fiscal year 2007.
We thus expect operating income for our first quarter of fiscal year 2008 to be between $7.0 million and $9.5 million compared with $6.1 million in our first quarter of fiscal year 2007.
Our interest income reflects changes in interest rates as well as changes in our cash balance. We expect our first quarter interest income will be approximately $1.0 million compared with $0.9 million in our first quarter of fiscal year 2007.
We thus expect our pre-tax income for our first quarter of fiscal 2008 to be between $8.0 million and $10.5 million compared with $7.3 million in our first quarter of fiscal year 2007.
We estimate that our effective tax rate in the first quarter of fiscal year 2008 will be approximately 37%, compared to an effective tax rate of approximately 40% for the first quarter of fiscal year 2007.
Based on the above, we anticipate net income for the quarter ending December 28, 2007 to be between $5.0 million and $6.5 million, or earnings per share between $0.31 and $0.41 respectively, compared to net income of $4.3 million, or $0.26 per share, in the same quarter of fiscal year 2007.
Fiscal Year 2008 and Beyond. During fiscal year 2007 we concentrated on achieving a sustainable increase in our level of profitability, with a secondary focus on revenue growth. We are proud of the progress we have made toward both of these goals. Even with the reductions in our expenses, we believe that our infrastructure remains capable of handling a significantly greater volume of business activity without a proportionate increase in operating expense.
With respect to revenue, throughout fiscal 2007 we achieved year-on-year revenue growth in each quarter as a result of favorable exchange rates and increased revenue per attendee. In our fourth quarter of fiscal year 2007, as discussed above, our increased revenues additionally reflected a 4% increase in the number of attendee days of training compared to the same quarter of fiscal year 2006. During the coming year we intend to focus on achieving sustainable attendee growth. While we are currently projecting an increase in attendees during our first quarter of fiscal 2008 compared to the prior year, our enrollment rate in the last two months has been about the same as it was in the same period of the prior year, and this trend will partly influence attendance in our second quarter course events. (At the same time, because of the holiday season, attendance at course events in our second fiscal quarter typically includes more enrollments taken after the start of that quarter than do the other three quarters of the year.)
Item 7A. QUANTITATIVE AND QUALITATIVE DISCLOSURES ABOUT MARKET RISK
We are exposed to market risk from changes in interest rates and foreign currency exchange rates. For purposes of specific risk analysis, we use sensitivity analysis to determine the effects that market risk exposures may have.
Interest Rate Risk. Our cash equivalents and available for sale securities are diversified and consist primarily of investment grade securities of high-quality financial institutions and corporations. The fair value of our portfolio of marketable securities would not be significantly affected by either a 10 % increase or decrease in the rates of interest due primarily to the short-term nature of the portfolio. We do not hold or issue derivative financial instruments.
Foreign Currency Risk. We are exposed to the impact of foreign currency fluctuations. The exposure to exchange rates relates primarily to our foreign subsidiaries. Subsidiaries with material foreign currency exposure are in Canada, the United Kingdom, Sweden and France. For our foreign subsidiaries, exchange rates can have an impact on the United States Dollar value of their reported earnings as well as on the intercompany transactions with the United States and other subsidiaries.
35
Our consolidated financial statements are prepared in United States Dollars, while the operations of our foreign subsidiaries are conducted in their respective local currencies. Fluctuations in the value of foreign currencies against the United States Dollar may have a significant impact on our reported results. Revenues and expenses denominated in foreign currencies are translated monthly into United States Dollars at the weighted average exchange rate. Consequently, as the value of the Dollar strengthens or weakens relative to other currencies in our major markets the resulting translated revenues, expenses and operating profits become lower or higher respectively. A hypothetical appreciation of the Canadian Dollar, Euro and British Pound of 10% would result in a $0.7 million increase to our consolidated fiscal year 2007 results. This was estimated using a 10% appreciation factor to the average monthly exchange rates applied to the net income or loss for each of our subsidiaries in the respective period.
Fluctuations in currency exchange rates also can have an impact on the United States Dollar amount of our stockholders’ equity. The assets and liabilities of our non U.S. subsidiaries are translated into United States Dollars at the exchange rate of the Balance Sheet for the respective reporting period. The resulting translation adjustments are recorded in stockholders’ equity as accumulated other comprehensive income or loss. The Canadian Dollar, Euro and British Pound were stronger relative to other currencies, consequently the accumulated other comprehensive income component of the stockholders’ equity increased $2.2 million during fiscal year 2007.
Additionally, we are exposed to the impact of foreign currency gains or losses due to short term intercompany transactions between the United States and its consolidated subsidiaries. While these intercompany balances are eliminated in consolidation, exchange rate changes do affect consolidated earnings. These balances generated a foreign exchange gain of $0.2 million in fiscal year 2007. To perform a sensitivity analysis, we assess the risk of loss in fair values from the effect of a hypothetical 10% change in the value of foreign currencies, assuming no change in interest rates. As of September 28, 2007, the result of a uniform 10% change in the values of foreign currency exchange rates against the United States Dollar for intercompany exposures with all other variables held constant would be immaterial to our results of operations. To date, we have not sought to hedge the risks associated with fluctuations in exchange rates. In the future, we may undertake such transactions; however, any hedging techniques we might implement might not be successful in eliminating or reducing the effects of currency fluctuations. See Item 1A.
Credit Risk. Financial instruments that potentially subject us to concentrations of credit risk consist primarily of investments in available for sale securities, restricted interest bearing long-term investments and trade accounts receivable. We have policies that limit investments in investment grade securities and the amount of credit exposure to any one issuer. We do not require collateral or other security to support client receivables since most of our customers are large, well-established companies and government agencies. Our credit risk is also mitigated because our customer base is diversified both by geography and industry, and no single customer accounted for more than 10% of our consolidated revenues on an annual or quarterly basis. We maintain an allowance for doubtful accounts for any potential credit losses related to our trade receivables. We do not use foreign exchange contracts to hedge the risk in receivables denominated in foreign currencies and we do not hold or issue derivative financial instruments for trading or speculative purposes.
36
Item 8. FINANCIAL STATEMENTS AND SUPPLEMENTARY DATA
LEARNING TREE INTERNATIONAL, INC. AND SUBSIDIARIES
INDEX TO CONSOLIDATED FINANCIAL STATEMENTS
| | |
| | | Page |
Reports of Independent Registered Public Accounting Firms: | | |
— Report on the 2007 Consolidated Financial Statements – BDO Seidman, LLP | | 38 |
— Report on the 2006 and 2005 Consolidated Financial Statements – Ernst & Young LLP | | 39 |
Consolidated Balance Sheets at September 29, 2006 and September 28, 2007 | | 40 |
Consolidated Statements of Operations for fiscal years ended September 30, 2005, September 29, 2006, and September 28, 2007 | | 41 |
Consolidated Statements of Stockholders’ Equity and Other Comprehensive (Loss) Income for fiscal years ended September 30, 2005, September 29, 2006, and September 28, 2007 | | 42 |
Consolidated Statements of Cash Flows for fiscal years ended September 30, 2005, September 29, 2006, and September 28, 2007 | | 43 |
Notes to Consolidated Financial Statements | | 44 |
37
Report of Independent Registered Public Accounting Firm
Board of Directors and Stockholders
Learning Tree International, Inc.
Reston, Virginia
We have audited the accompanying consolidated balance sheet of Learning Tree International, Inc. and subsidiaries as of September 28, 2007 and the related consolidated statements of operations, stockholders’ equity and other comprehensive (loss) income, and cash flows for the year ended September 28, 2007. These financial statements are the responsibility of the Company’s management. Our responsibility is to express an opinion on these financial statements based on our audit.
We conducted our audit in accordance with the standards of the Public Company Accounting Oversight Board (United States). Those standards require that we plan and perform the audit to obtain reasonable assurance about whether the financial statements are free of material misstatement. An audit includes examining, on a test basis, evidence supporting the amounts and disclosures in the financial statements, assessing the accounting principles used and significant estimates made by management, as well as evaluating the overall financial statement presentation. We believe that our audit provides a reasonable basis for our opinion.
In our opinion, the consolidated financial statements referred to above present fairly, in all material respects, the financial position of Learning Tree International, Inc. and subsidiaries at September 28, 2007, and the results of their operations and their cash flows for the year then ended, in conformity with accounting principles generally accepted in the United States of America.
We also have audited, in accordance with the standards of the Public Company Accounting Oversight Board (United States), the effectiveness of Learning Tree International, Inc. and subsidiaries’ internal control over financial reporting as of September 28, 2007, based on criteria established inInternal Control – Integrated Frameworkissued by the Committee of Sponsoring Organizations of the Treadway Commission (COSO) and our report dated December 11, 2007 expressed an unqualified opinion thereon.
/s/ BDO Seidman LLP
Bethesda, Maryland
December 11, 2007
38
REPORT OF INDEPENDENT REGISTERED PUBLIC ACCOUNTING FIRM
The Board of Directors and Shareholders of Learning Tree International, Inc.
We have audited the accompanying consolidated balance sheet of Learning Tree International, Inc. and subsidiaries as of September 29, 2006 and the related consolidated statements of operations, stockholders’ equity and other comprehensive (loss) income, and cash flows for the years ended September 29, 2006 and September 30, 2005. These financial statements are the responsibility of the Company’s management. Our responsibility is to express an opinion on these financial statements based on our audits.
We conducted our audits in accordance with the standards of the Public Company Accounting Oversight Board (United States). Those standards require that we plan and perform the audit to obtain reasonable assurance about whether the financial statements are free of material misstatement. An audit includes examining, on a test basis, evidence supporting the amounts and disclosures in the financial statements. An audit also includes assessing the accounting principles used and significant estimates made by management, as well as evaluating the overall financial statement presentation. We believe that our audits provide a reasonable basis for our opinion.
In our opinion, the financial statements referred to above present fairly, in all material respects, the consolidated financial position of Learning Tree International, Inc. and subsidiaries at September 29, 2006 and the consolidated results of their operations and their cash flows for the years ended September 29, 2006 and September 30, 2005, in conformity with U.S. generally accepted accounting principles.
As discussed in Note 6 to the consolidated financial statements, on October 1, 2005 the Company adopted the provisions of Statement of Financial Accounting Standards No. 123(R),Share Based Payment, and changed its method of accounting for share-based payments using the modified prospective transition method.
/s/ Ernst & Young LLP
McLean, Virginia
April 23, 2007
39
LEARNING TREE INTERNATIONAL, INC. AND SUBSIDIARIES
CONSOLIDATED BALANCE SHEETS
(amounts in thousands, except share data)
| | | | | | | | |
| | | September 29,
2006 | | | September 28,
2007 | |
Assets | | | | | | | | |
Current Assets: | | | | | | | | |
Cash and cash equivalents | | $ | 44,401 | | | $ | 49,732 | |
Available for sale securities | | | 27,800 | | | | 38,775 | |
Trade accounts receivable, less allowances of $298 and $195, respectively | | | 16,116 | | | | 19,398 | |
Prepaid marketing expenses | | | 836 | | | | 473 | |
Income tax receivable | | | 243 | | | | 4,224 | |
Prepaid expenses and other | | | 9,319 | | | | 8,259 | |
| | | | | | | | |
Total current assets | | | 98,715 | | | | 120,861 | |
| | |
Depreciable assets: | | | | | | | | |
Education and office equipment | | | 44,566 | | | | 44,391 | |
Transportation equipment | | | 205 | | | | 191 | |
Property and leasehold improvements | | | 27,813 | | | | 28,593 | |
| | | | | | | | |
| | | 72,584 | | | | 73,175 | |
Less: accumulated depreciation and amortization | | | (47,885 | ) | | | (48,210 | ) |
| | | | | | | | |
| | | 24,699 | | | | 24,965 | |
Restricted interest-bearing investments | | | 10,884 | | | | 11,654 | |
Deferred income taxes | | | 1,184 | | | | 4,705 | |
Other assets | | | 1,718 | | | | 1,791 | |
| | | | | | | | |
Total assets | | $ | 137,200 | | | $ | 163,976 | |
| | | | | | | | |
| | |
Liabilities | | | | | | | | |
Current Liabilities: | | | | | | | | |
Trade accounts payable | | $ | 12,671 | | | $ | 12,785 | |
Deferred revenues | | | 47,678 | | | | 50,216 | |
Accrued payroll, benefits and related taxes | | | 3,062 | | | | 4,084 | |
Other accrued liabilities | | | 2,854 | | | | 5,237 | |
Income taxes payable | | | 2,812 | | | | 3,633 | |
Current portion of deferred facilities rent and other | | | 740 | | | | 900 | |
Deferred income taxes | | | 188 | | | | 69 | |
| | | | | | | | |
Total current liabilities | | | 70,005 | | | | 76,924 | |
Asset retirement obligations | | | 4,174 | | | | 3,523 | |
Deferred income taxes | | | 182 | | | | 247 | |
Deferred facilities rent and other | | | 5,905 | | | | 6,074 | |
| | | | | | | | |
Total liabilities | | | 80,266 | | | | 86,768 | |
| | | | | | | | |
Commitments and contingencies | | | | | | | | |
| | |
Stockholders’ Equity | | | | | | | | |
Preferred Stock, $.0001 par value; 10,000,000 shares authorized; 0 shares issued and outstanding | | | — | | | | — | |
Common Stock, $.0001 par value; 75,000,000 shares authorized; 16,495,808 and 16,534,222 shares issued and outstanding, respectively | | | 2 | | | | 2 | |
Additional paid-in capital | | | 1,042 | | | | 2,128 | |
Accumulated other comprehensive income | | | 1,424 | | | | 3,622 | |
Retained earnings | | | 54,466 | | | | 71,456 | |
| | | | | | | | |
Total stockholders’ equity | | | 56,934 | | | | 77,208 | |
| | | | | | | | |
Total liabilities and stockholders’ equity | | $ | 137,200 | | | $ | 163,976 | |
| | | | | | | | |
The accompanying notes are an integral part of these consolidated financial statements.
40
LEARNING TREE INTERNATIONAL, INC. AND SUBSIDIARIES
CONSOLIDATED STATEMENTS OF OPERATIONS
(amounts in thousands, except per share data)
| | | | | | | | | | | |
| | | Fiscal Year Ended |
| | | September 30,
2005 | | | September 29,
2006 | | | September 28,
2007 |
Revenues | | $ | 151,558 | | | $ | 154,049 | | | $ | 167,193 |
Cost of revenues | | | 75,966 | | | | 76,164 | | | | 72,936 |
| | | | | | | | | | | |
Gross profit | | | 75,592 | | | | 77,885 | | | | 94,257 |
Operating expenses: | | | | | | | | | | | |
Course development | | | 7,952 | | | | 10,080 | | | | 8,613 |
Sales and marketing | | | 42,387 | | | | 42,503 | | | | 41,094 |
General and administrative | | | 27,499 | | | | 27,944 | | | | 30,041 |
| | | | | | | | | | | |
| | | 77,838 | | | | 80,527 | | | | 79,748 |
| | | | | | | | | | | |
Income (loss) from operations | | | (2,246 | ) | | | (2,642 | ) | | | 14,509 |
| | | |
Other income (expense), net: | | | | | | | | | | | |
Interest income, net | | | 2,517 | | | | 3,361 | | | | 3,940 |
Foreign exchange gains (losses) | | | (242 | ) | | | (5 | ) | | | 196 |
Other | | | (12 | ) | | | 17 | | | | 100 |
| | | | | | | | | | | |
| | | 2,263 | | | | 3,373 | | | | 4,236 |
| | | | | | | | | | | |
Income before provision for income taxes | | | 17 | | | | 731 | | | | 18,745 |
Provision for income taxes | | | 1,713 | | | | 3,853 | | | | 1,755 |
| | | | | | | | | | | |
Net income (loss) | | $ | (1,696 | ) | | $ | (3,122 | ) | | $ | 16,990 |
| | | | | | | | | | | |
Income (loss) per common share - basic | | $ | (0.10 | ) | | $ | (0.19 | ) | | $ | 1.03 |
| | | | | | | | | | | |
Income (loss) per common share - diluted | | $ | (0.10 | ) | | $ | (0.19 | ) | | $ | 1.03 |
| | | | | | | | | | | |
Weighted average shares outstanding - basic | | | 16,865 | | | | 16,583 | | | | 16,498 |
| | | | | | | | | | | |
Weighted average shares outstanding - diluted | | | 16,865 | | | | 16,583 | | | | 16,498 |
| | | | | | | | | | | |
The accompanying notes are an integral part of these consolidated financial statements.
41
LEARNING TREE INTERNATIONAL, INC. AND SUBSIDIARIES
CONSOLIDATED STATEMENTS OF STOCKHOLDERS’ EQUITY
AND OTHER COMPREHENSIVE (LOSS) INCOME
(amounts in thousands)
| | | | | | | | | | | | | | | | | | | | | | |
| | | Common Stock | | Additional
Paid-In
Capital | | | Accumulated
Other Comprehensive
(Loss) Income | | | Retained
Earnings | | | Total
Stockholders’
Equity | |
| | | Shares
Outstanding | | | Amount | | | | |
Balance, October 1, 2004 | | 16,989 | | | $ | 2 | | $ | 9 | | | $ | 638 | | | $ | 65,526 | | | $ | 66,175 | |
Comprehensive loss: | | | | | | | | | | | | | | | | | | | | | | |
Net loss | | — | | | | — | | | — | | | | — | | | | (1,696 | ) | | | (1,696 | ) |
Foreign currency translation | | — | | | | — | | | — | | | | (100 | ) | | | — | | | | (100 | ) |
| | | | | | | | | | | | | | | | | | | | | | |
Comprehensive loss | | | | | | | | | | | | | | | | | | | | | (1,796 | ) |
Stock options issued for services | | — | | | | — | | | 6 | | | | — | | | | — | | | | 6 | |
Stock repurchases | | (327 | ) | | | — | | | (8 | ) | | | — | | | | (4,306 | ) | | | (4,314 | ) |
| | | | | | | | | | | | | | | | | | | | | | |
Balance, September 30, 2005 | | 16,662 | | | | 2 | | | 7 | | | | 538 | | | | 59,524 | | | | 60,071 | |
Comprehensive loss: | | | | | | | | | | | | | | | | | | | | | | |
Net loss | | — | | | | — | | | — | | | | — | | | | (3,122 | ) | | | (3,122 | ) |
Foreign currency translation | | — | | | | — | | | — | | | | 886 | | | | — | | | | 886 | |
| | | | | | | | | | | | | | | | | | | | | | |
Comprehensive loss | | | | | | | | | | | | | | | | | | | | | (2,236 | ) |
Share based compensation | | — | | | | — | | | 1,035 | | | | — | | | | — | | | | 1,035 | |
Stock repurchases | | (166 | ) | | | — | | | — | | | | — | | | | (1,936 | ) | | | (1,936 | ) |
| | | | | | | | | | | | | | | | | | | | | | |
Balance, September 29, 2006 | | 16,496 | | | | 2 | | | 1,042 | | | | 1,424 | | | | 54,466 | | | | 56,934 | |
Comprehensive income: | | | | | | | | | | | | | | | | | | | | | | |
Net income | | — | | | | — | | | — | | | | — | | | | 16,990 | | | | 16,990 | |
Foreign currency translation | | — | | | | — | | | — | | | | 2,198 | | | | — | | | | 2,198 | |
| | | | | | | | | | | | | | | | | | | | | | |
Comprehensive income | | | | | | | | | | | | | | | | | | | | | 19,188 | |
Stock options exercised | | 12 | | | | — | | | 155 | | | | — | | | | — | | | | 155 | |
Share based compensation | | — | | | | — | | | 967 | | | | — | | | | — | | | | 967 | |
Deferred tax option adjustment | | — | | | | — | | | (36 | ) | | | — | | | | — | | | | (36 | ) |
Restricted stock grants | | 26 | | | | — | | | — | | | | — | | | | — | | | | — | |
| | | | | | | | | | | | | | | | | | | | | | |
Balance, September 28, 2007 | | 16,534 | | | $ | 2 | | $ | 2,128 | | | $ | 3,622 | | | $ | 71,456 | | | $ | 77,208 | |
| | | | | | | | | | | | | | | | | | | | | | |
The accompanying notes are an integral part of these consolidated financial statements.
42
LEARNING TREE INTERNATIONAL, INC. AND SUBSIDIARIES
CONSOLIDATED STATEMENTS OF CASH FLOWS
(amounts in thousands)
| | | | | | | | | | | | |
| | | Fiscal Year Ended | |
| | | September 30,
2005 | | | September 29,
2006 | | | September 28,
2007 | |
Cash flows - operating activities: | | | | | | | | | | | | |
Net income (loss) | | $ | (1,696 | ) | | $ | (3,122 | ) | | $ | 16,990 | |
Adjustments to reconcile net income (loss) to net cash provided by operating activities: | | | | | | | | | | | | |
Depreciation and amortization | | | 6,295 | | | | 7,429 | | | | 6,529 | |
Share based compensation | | | — | | | | 1,035 | | | | 967 | |
Deferred income taxes | | | 102 | | | | (34 | ) | | | (3,575 | ) |
Provision for doubtful accounts | | | 57 | | | | 154 | | | | (45 | ) |
Accretion of asset retirement obligations | | | 327 | | | | 264 | | | | 326 | |
Loss (gain) on disposals of equipment and leasehold improvements | | | (19 | ) | | | 17 | | | | 304 | |
Gain on liquidation of Investment in Collegis, Inc. | | | — | | | | — | | | | (418 | ) |
Unrealized foreign exchange loss (gain) | | | 13 | | | | (44 | ) | | | (29 | ) |
Lease termination costs and other | | | 59 | | | | 976 | | | | — | |
Deferred facilities rent and other charges | | | (381 | ) | | | 1,093 | | | | 212 | |
Gain on settlement of asset retirement obligation | | | — | | | | (38 | ) | | | — | |
Impairment of leasehold improvements | | | 723 | | | | — | | | | — | |
Change in operating assets and liabilities: | | | | | | | | | | | | |
Trade accounts receivable | | | (2,787 | ) | | | (270 | ) | | | (2,118 | ) |
Prepaid marketing expenses | | | 265 | | | | (56 | ) | | | 390 | |
Prepaid expenses and other assets | | | (1,089 | ) | | | (2,391 | ) | | | 1,712 | |
Income taxes receivable / payable | | | 2,316 | | | | 2,178 | | | | (2,839 | ) |
Trade accounts payable | | | (714 | ) | | | 84 | | | | (645 | ) |
Deferred revenues | | | (1,840 | ) | | | 1,294 | | | | 278 | |
Asset retirement obligations | | | — | | | | (105 | ) | | | (1,482 | ) |
Other accrued liabilities | | | 651 | | | | (22 | ) | | | 2,003 | |
| | | | | | | | | | | | |
Net cash provided by operating activities | | | 2,282 | | | | 8,442 | | | | 18,560 | |
| | | | | | | | | | | | |
Cash flows - investing activities: | | | | | | | | | | | | |
Purchases of equipment, property and leasehold improvements | | | (6,835 | ) | | | (9,885 | ) | | | (5,466 | ) |
Purchases of available for sale securities | | | (12,050 | ) | | | (10,300 | ) | | | (16,725 | ) |
Sales of available for sale securities | | | 6,495 | | | | 1,055 | | | | 5,750 | |
Lease deposits | | | — | | | | (1,450 | ) | | | — | |
Sales of equipment and leasehold improvements | | | 112 | | | | (41 | ) | | | 34 | |
Liquidation of Investment in Collegis, Inc. | | | — | | | | — | | | | 418 | |
| | | | | | | | | | | | |
Net cash used in investing activities | | | (12,278 | ) | | | (20,621 | ) | | | (15,989 | ) |
| | | | | | | | | | | | |
Cash flows - financing activities: | | | | | | | | | | | | |
Repurchases of common stock | | | (4,314 | ) | | | (1,936 | ) | | | — | |
Proceeds from exercise of stock options | | | — | | | | — | | | | 155 | |
| | | | | | | | | | | | |
Net cash provided by (used in) financing activities | | | (4,314 | ) | | | (1,936 | ) | | | 155 | |
| | | | | | | | | | | | |
Effects of exchange rates on cash and cash equivalents | | | 133 | | | | 1,780 | | | | 2,605 | |
| | | | | | | | | | | | |
Net increase (decrease) in cash and cash equivalents | | | (14,177 | ) | | | (12,335 | ) | | | 5,331 | |
Cash and cash equivalents at the beginning of the fiscal year | | | 70,913 | | | | 56,736 | | | | 44,401 | |
| | | | | | | | | | | | |
Cash and cash equivalents at the end of the fiscal year | | $ | 56,736 | | | $ | 44,401 | | | $ | 49,732 | |
| | | | | | | | | | | | |
Supplemental disclosures: | | | | | | | | | | | | |
Income taxes paid | | $ | 676 | | | $ | 2,700 | | | $ | 5,000 | |
| | | | | | | | | | | | |
Interest paid | | $ | — | | | $ | — | | | $ | 3 | |
| | | | | | | | | | | | |
The accompanying notes are an integral part of these consolidated financial statements.
43
LEARNING TREE INTERNATIONAL, INC. AND SUBSIDIARIES
NOTES TO CONSOLIDATED FINANCIAL STATEMENTS
(amounts in thousands, except share and per share data)
| 1. | NATURE OF THE BUSINESS AND SUMMARY OF SIGNIFICANT ACCOUNTING POLICIES |
Learning Tree International, Inc. and subsidiaries develop, market and deliver a broad proprietary library of instructor-led classroom courses which are designed to meet the professional development needs of managers and information technology (“IT”) professionals worldwide. These courses are delivered primarily at our leased education centers located in the United States, the United Kingdom, Canada, France, Sweden and Japan. Such course events are also conducted in hotel and conference facilities and at customer sites throughout the world. Our courses provide both breadth and depth of education across a wide range of technical and management disciplines, including operating systems, databases, computer networks, computer and network security, web development, programming languages, software engineering, open source applications, project management, business skills, and leadership and professional development.
We follow a 52- or 53-week fiscal year-end date from September 30th to the Friday nearest the end of the month of September. Our year-end and quarter-end dates are on the Friday nearest the end of the calendar quarter. Accordingly, our fiscal year 2005 ended on September 30, 2005, fiscal year 2006 ended on September 29, 2006, and fiscal year 2007 ended on September 28, 2007. Thus, these consolidated financial statements report our consolidated financial position as of September 29, 2006, and September 28, 2007 and the related consolidated statements of operations, stockholders’ equity and other comprehensive (loss) income and cash flows for the fiscal years ended September 30, 2005, September 29, 2006 and September 28, 2007 each of which was a 52-week year. Fiscal year 2008 will be a 53-week year, and will end on October 3, 2008.
| b. | Principles of Consolidation |
The accompanying consolidated financial statements include the accounts of Learning Tree International, Inc. and our subsidiaries. All significant intercompany accounts and transactions have been eliminated. The following is a summary of our subsidiaries:
Learning Tree International USA, Inc. (U.S.)
Learning Tree International, K.K. (Japan)
Learning Tree International, Ltd. (United Kingdom)
Learning Tree Limited (United Kingdom)
Learning Tree International S.A. (France)
Learning Tree International AB (Sweden)
Learning Tree International Inc. (Canada)
Learning Tree International Ltd. (Hong Kong)
Advanced Technology Marketing, Inc. (U.S.)
| c. | Revenue Recognition and Accounts Receivable |
Our revenues are received from business entities and government agencies for the professional training of their employees. Course events range in length from two to five days, and average approximately four days. As stated above, we follow a 52- or 53-week fiscal year. This method is used in order to better align our external financial reporting with the way we operate our business. Under this method, each fiscal quarter ends on the Friday closest to the end of the calendar quarter. Since all courses have a duration of five days or less, and all courses begin and end within the same calendar week, under the 52- or 53-week fiscal year method all revenues and related direct costs for each course event are recognized in the week and the fiscal quarter in which the event takes place.
We offer our customers a multiple-course sales discount referred to as a “Learning Tree Training Passport.” A Learning Tree Training Passport allows an individual Passport holder to attend up to a specified number of Learning Tree courses over a one or two-year period for a fixed price. For a Training Passport, the amount of revenue recognized for each attendance in one of our courses is based upon the selling price of the Training Passport, the list price of the course taken, the average list price of all courses taken and the estimated average number of courses Passport holders will actually attend. After expiration of each individual Training Passport, we record the
44
LEARNING TREE INTERNATIONAL, INC. AND SUBSIDIARIES
NOTES TO CONSOLIDATED FINANCIAL STATEMENTS
(amounts in thousands, except share and per share data)
difference, if any, between the revenues previously recognized and that specific Training Passport’s selling price. The estimated attendance rate is based upon the historical experience of the average number of course events that Training Passport holders have attended. The average attendance rate for all expired Training Passports has closely approximated the estimated rate we utilize. If the Training Passport attendance rates change significantly, the revenue recognition rate for active Training Passports and for Training Passports sold thereafter is adjusted prospectively. We believe it is appropriate to recognize revenues on this basis in order to more closely match revenue and related costs, as the substantial majority of our Passport holders do not attend the maximum number of course events permitted under their Training Passport. We believe that the use of historical data is reasonable and appropriate because of the relative stability of the average actual number of course events attended by the tens of thousands of Passport holders since the inception of the program in fiscal year 1993. Although we have seen no material changes in the historical rates as the number of course titles has changed, we monitor such potential effects. In general, determining the estimated average number of course events that will be attended by a Training Passport holder is based on historical trends that may not continue in the future. These estimates could differ in the near term from amounts used in arriving at the reported revenue.
In addition to our Learning Tree Training Passports, we also offer a multiple-course sales discount referred to as Learning Tree Training Vouchers. With Learning Tree Training Vouchers, a customer buys the right to send a specified number of attendees to Learning Tree courses over a six to twelve-month period for a fixed price. Revenue is recognized on a pro rata basis for each attendance. For the majority of Training Vouchers with unused seats at the expiration of the Voucher, we record the pro rata selling price of the expired unused seats as revenue. At times we make a business decision to extend a Voucher beyond the normal twelve month expiration date. Certain Training Vouchers purchased under government rate schedules have no expiration date.
To provide additional flexibility to meet our customers’ training needs, we offer a multiple-training day sales discount referred to as Learning Tree 10-Day Passes. With Learning Tree 10-Day Passes, a customer buys the right to take up to 10 days of training over a one-year period for a fixed price. Revenue is recognized on a pro-rata basis for each attendance day. If a 10-Day Pass has unused days at expiration, we record the pro-rata value of the unused days as revenue.
Trade accounts receivable are reduced by an allowance for amounts that may become uncollectible in the future. We use estimates in determining the allowance for doubtful accounts receivable, based on our analysis of various factors, including our historical collection experience, current trends, specific identification of invoices which are considered doubtful, and a percentage of our past due accounts receivable. These estimates could differ from actual collection experience and are subject to adjustment. Our trade accounts receivable are written off when they are deemed uncollectible.
| d. | Stock-Based Compensation |
We adopted SFAS No. 123 (Revised 2004),Share-Based Payment (“SFAS 123(R)”) as of October 1, 2005, the first day of fiscal year 2006, and as a result changed our accounting policy regarding stock-based compensation. This change had a material effect on the results of operations as described below.
We changed the accounting for our stock option plans from the intrinsic value method used prior to October 1, 2005 to the fair value method as required by SFAS 123(R). We adopted SFAS 123(R) using the modified prospective transition method. In accordance with the modified prospective transition method, the consolidated financial statements for prior periods have not been restated to reflect, and do not include, the impact of SFAS 123(R). Stock-based compensation expense recognized under SFAS 123(R) for the years ended September 29, 2006 and September 28, 2007 was $1,035 and $967. There was no stock-based compensation expense related to employee stock options recognized during the year ended September 30, 2005 because the exercise price of the stock options granted to employees and directors equaled the fair market value of the underlying stock on the dates of grant.
SFAS 123(R) requires public companies to estimate the fair value of share-based payment awards on the date of grant using an option-pricing model. The value of the portion of the award that is ultimately expected to vest.
45
LEARNING TREE INTERNATIONAL, INC. AND SUBSIDIARIES
NOTES TO CONSOLIDATED FINANCIAL STATEMENTS
(amounts in thousands, except share and per share data)
is recognized as expense over the requisite service periods in the statement of operations. Our determination of fair value of share-based payment awards on the date of grant using an option-pricing model is affected by assumptions regarding a number of highly complex and subjective variables. These variables include our expected stock price volatility, expected term, risk-free interest rates, and actual and projected employee stock option exercise behaviors.
We determined that our historical volatility represents our best estimate of the expected volatility. The risk-free interest rate assumption is an average of the three- and five-year U.S. Treasury rates at the date of grant, which most closely resembles the four-year expected life of our options. The estimated expected life represents the weighted-average period the stock options are expected to remain outstanding and has been determined based on an analysis of historical exercise behavior. The expected dividend yield is 0%.
As stock-based compensation expense recognized in the consolidated statements of operations for fiscal years 2006 and 2007 is based on awards ultimately expected to vest, it has been reduced for estimated pre-vesting forfeitures. Forfeitures were estimated based on historical experience. See Note 6 for additional information.
As of September 29, 2006, we have elected to adopt the alternative transition method detailed in Financial Accounting Standards Board (FASB) Staff Position No. SFAS 123(R)-3,Transition Election Related to Accounting for Tax Effects of Share-Based Payment Awards (“SFAS 123(R)-3”), for calculating the tax effects of stock-based compensation pursuant to SFAS 123(R). The alternative transition method includes a simplified method to establish the beginning balance of the additional paid-in capital pool (APIC pool) related to the tax effects of employee stock-based compensation, which is available to absorb tax deficiencies recognized subsequent to the adoption of SFAS 123(R). Prior to adoption of SFAS 123(R), we presented all benefits of tax deductions resulting from the exercise of stock-based compensation as an operating cash flow in the consolidated statements of cash flows. As of September 29, 2006, we have changed our cash flow presentation in accordance with SFAS 123(R), which requires benefits of tax deductions in excess of the compensation cost recognized (excess tax benefits) to be classified as a financing cash inflow with a corresponding operating cash outflow. For the years ended September 29, 2006 and September 28, 2007, we did not have any excess tax benefits related to the exercise of stock options.
| e. | Course Development Costs |
Course development costs are charged to operations in the period incurred.
Advertising costs are charged to expense in the period incurred. Advertising costs totaled $359, $551 and $495 in fiscal years 2005, 2006 and 2007, respectively.
| g. | Cash and Cash Equivalents, Available for Sale Securities, and Interest-bearing Investments |
We consider highly liquid investments with remaining maturities of ninety days or less when purchased to be cash equivalents.
We classify certain of our investments in marketable securities as “available for sale” in accordance with the provisions of SFAS No. 115,Accounting for Certain Investments in Debt and Equity Securities(“SFAS 115”). We do not have any investments classified as “trading” or “held-to-maturity.” Our policy is to invest cash with issuers that have high credit ratings and to limit the amount of credit exposure to any one issuer.
Available for sale securities consist primarily of variable rate municipal debt securities and are stated at market value as of September 29, 2006 and September 28, 2007. These investments generally have a final maturity of 20 to 30 years, with interest reset dates every seven to thirty five days. These investments can be liquidated under an auction process on the interest reset dates subject to a sufficient number of bids being submitted. The cost of securities sold is based on the specific identification method. Proceeds from sales of available-for-sale securities during fiscal years 2005, 2006 and 2007 were $6,495, $1,055 and $5,750, respectively. There were no gains or losses on the sales of these securities. We earn interest income on these securities which is recorded as interest income in the consolidated statements of operations.
46
LEARNING TREE INTERNATIONAL, INC. AND SUBSIDIARIES
NOTES TO CONSOLIDATED FINANCIAL STATEMENTS
(amounts in thousands, except share and per share data)
Restricted interest-bearing investments at September 28, 2007 consist of cash deposits of $10,204 (5,000 British Pounds) and $1,450 which have been pledged to secure our obligations under leases for education center facilities located in the United Kingdom and United States, respectively. The terms of both lease arrangements require us to pledge cash deposits for the same amount as collateral for our lease obligations there under. The deposits are in our name and are in interest-bearing accounts with interest accruing to us and paid on an annual basis. Our representatives and the landlords’ representatives control the deposits (all are solicitors). They act jointly in the operation of the deposit accounts. The deposits will be released to us at the earliest of the end of the lease period or when certain financial ratios have been met.
| h. | Prepaid Marketing Expenses |
Prepaid marketing expenses primarily include the external costs associated with the design, printing, postage, list rental and handling of direct mail advertising materials to be mailed in the future. These costs are charged to expense in the month in which the advertising materials are mailed since the benefit period for such costs is short and the amount of future benefit is not practically measurable. Marketing expenses for the fiscal years ended 2005, 2006 and 2007 were $27,790, $26,661 and $22,718, respectively.
| i. | Equipment, Property and Leasehold Improvements |
Equipment, property and leasehold improvements are recorded at cost and depreciated or amortized using the straight-line method over the following estimated useful lives:
| | | | |
| Education and office equipment | | 3 to 5 years | | |
| Transportation equipment | | 4 years | | |
Accounting software | | 7 years | | |
| Leasehold improvements | | 20 years or the life of the lease, if shorter |
| Building | | 30 years | | |
Land, stated at cost, amounts to $1,342.
Software amortization amounted to $247, $237, and $421 in each of the fiscal years 2005, 2006 and 2007, respectively. Total depreciation and amortization expense amounted to $6,295, $7,429, and $6,529 in each of the fiscal years 2005, 2006, and 2007, respectively. Costs of normal maintenance and repairs and minor replacements are normally charged to expense as incurred. In those instances where we have determined we are contractually obligated to incur recurring repairs and maintenance costs related to our leased facilities, a provision is made in the financial statements at the earlier of the date the expense is incurred or the date of the obligation. The costs of assets sold or retired are eliminated from the accounts along with the related accumulated depreciation or amortization and any resulting gain or loss is included in the statements of operations.
The fair value of a liability for an asset retirement obligation is associated with our leased facilities recorded as an asset (leasehold improvements) and a liability when there is a legal obligation associated with the retirement of a long-lived asset and the amount can be reasonably estimated. See also Note 2 relating to asset retirement obligations.
We periodically review the carrying value of our long-lived assets, such as equipment, property and leasehold improvements for impairment or whenever events or changes in circumstances indicate that the carrying value may not be recoverable. In making such evaluations, we compare the expected future cash flows to the carrying amount of the assets. If the total of the expected future cash flows is less than the carrying amount of the assets, we
47
LEARNING TREE INTERNATIONAL, INC. AND SUBSIDIARIES
NOTES TO CONSOLIDATED FINANCIAL STATEMENTS
(amounts in thousands, except share and per share data)
are required to make estimates of the fair value of the long-lived assets in order to calculate the impairment loss equal to the difference between the fair value of the assets and their book value. We make significant assumptions and estimates in this process regarding matters that are inherently uncertain, such as estimating cash flows, remaining useful lives, discount rates and growth rates. The resulting cash flows are computed over an extended period of time, which subjects those assumptions and estimates to an even larger degree of uncertainty. While we believe that our estimates are reasonable, different assumptions regarding such cash flows could materially affect the valuation of long-lived assets.
Deferred revenues primarily relate to unearned revenues associated with Training Passports, Training Vouchers and advance payments received from customers for course events to be held in the future.
| l. | Comprehensive (Loss) Income |
We report comprehensive (loss) income in the Consolidated Statements of Stockholders’ Equity and Other Comprehensive (Loss) Income. Other comprehensive income represents changes in stockholders’ equity from non-owner sources and is comprised of foreign currency translation adjustments.
We provide for income taxes under the provisions of SFAS No. 109,Accounting for Income Taxes (“SFAS 109”). Deferred income taxes result from temporary differences between the tax basis of assets and liabilities and the basis reported in our consolidated financial statements. Deferred tax liabilities and assets are determined based on the difference between financial statement and tax basis of assets and liabilities using enacted rates expected to be in effect during the year in which the differences reverse. Valuation allowances are provided against assets, including net operating losses, if it is anticipated that some or the entire asset may not be realized through future taxable earnings or implementation of tax planning strategies.
We translate the financial statements of our foreign subsidiaries from the local (functional) currencies to United States dollars in accordance with SFAS No. 52,Foreign Currency Translation(“SFAS 52”). The rates of exchange at each fiscal year end are used for translating the assets and liabilities and the average monthly rates of exchange for each year are used for the statements of operations. Gains or losses arising from the translation of the foreign subsidiaries’ financial statements are included in the accompanying consolidated balance sheets as a separate component of stockholders’ equity. Gains or losses resulting from foreign currency transactions are included in the consolidated statements of operations.
To date, we have not sought to hedge the risk associated with fluctuations in currency exchange rates, and therefore we continue to be subject to such risk.
| o. | Deferred Facilities Rent |
Operating Lease Activities:
We lease education center and administrative office space under various operating lease agreements. Certain lease agreements include provisions that provide for cash incentives, graduated rent payments and other inducements. We recognize rent expense on a straight-line basis over the related terms of such leases. The value of lease incentives and/or inducements, along with the excess of the rent expense recognized over the rentals paid, is recorded as Deferred facilities rent and other in the accompanying consolidated balance sheets.
48
LEARNING TREE INTERNATIONAL, INC. AND SUBSIDIARIES
NOTES TO CONSOLIDATED FINANCIAL STATEMENTS
(amounts in thousands, except share and per share data)
Lease Termination Activities:
We record liabilities for costs that will be incurred under a contract without economic benefit at estimated fair value. We have vacated certain leased facilities space in the United Kingdom subject to operating leases and recorded the estimated liabilities associated with future rentals at the cease-use date. The fair value of the liability at the cease-use date was determined based on the remaining cash flows for lease rentals, and minimum lease payments, reduced by estimated sublease rentals and certain subtenant reimbursements that could be reasonably obtained for the property, discounted using a credit-adjusted risk-free rate. The liability is adjusted for changes, if any, resulting from revisions to estimated cash flows after the cease-use date, measured using the current credit-adjusted risk-free rate. Changes due to the passage of time are recognized as an increase in the carrying amount of the liability and as accretion expense.
The lease termination activities have historically resulted in accrued liabilities recorded in Deferred rent facilities and other. However, due to the timing of payments due to landlords and payments due from subtenants, certain lease terminations have resulted in assets included in other assets at September 29, 2006 and September 28, 2007.
| p. | Fair Value of Financial Instruments |
The carrying values of cash and cash equivalents, accounts receivable, accounts payable, and accrued liabilities approximate their fair values because of the short-term nature of these instruments. Available for sale securities are carried at market value.
The preparation of financial statements in conformity with accounting principles generally accepted in the United States requires management to make judgments, estimates and assumptions that affect the amounts reported in the financial statements and accompanying notes. Actual results could differ from those estimates.
| r. | Recently Issued Accounting Pronouncements |
In July 2006, the Financial Accounting Standards Board issued Interpretation No. 48,Accounting for Uncertainty in Income Taxes (FIN 48). FIN 48 clarifies the accounting for income taxes by prescribing the minimum recognition threshold a tax position is required to meet before being recognized in the financial statements and applies to all tax positions related to income taxes subject to Financial Accounting Standards Board Statement No. 109,Accounting for Income Taxes, (FAS 109). FIN 48 is effective for fiscal years beginning after December 15, 2006. We will adopt FIN 48 in fiscal year 2008. We are currently assessing the potential effect of FIN 48 on our consolidated financial statements.
In September 2006, the FASB issued Statement of Financial Accounting Standards No. 157,Fair Value Measurements(SFAS 157). SFAS 157 provides a common definition of fair value and establishes a framework to make the measurement of fair value in generally accepted accounting principles more consistent and comparable. SFAS 157 also requires expanded disclosures to provide information about the extent to which fair value is used to measure assets and liabilities, the methods and assumptions used to measure fair value, and the effect of fair value measures on earnings. SFAS 157 is effective for our 2009 fiscal year, although early adoption is permitted. In September 2007, the FASB provided a one-year deferral for the implementation of SFAS 157 only with regard to nonfinancial assets and liabilities. We are currently assessing the potential effect of SFAS 157 on our consolidated financial statements, but do not believe the adoption will have a material impact on our consolidated financial statements.
49
LEARNING TREE INTERNATIONAL, INC. AND SUBSIDIARIES
NOTES TO CONSOLIDATED FINANCIAL STATEMENTS
(amounts in thousands, except share and per share data)
In February 2007, the FASB issued SFAS No. 159,The Fair Value Option for Financial Assets and Financial Liabilities—Including an amendment of FASB Statement No. 115.SFAS 159 permits entities to choose to measure many financial instruments and certain other items at fair value. The objective is to improve financial reporting by providing entities with the opportunity to mitigate volatility in reported earnings caused by measuring related assets and liabilities differently without having to apply complex hedge accounting provisions. We must implement SFAS 159 starting with our fiscal year 2009. We are currently assessing the potential effect of SFAS 159 on our consolidated financial statements, but do not believe the adoption will have a material impact on our consolidated financial statements.
| 2. | ASSET RETIREMENT OBLIGATIONS |
SFAS 143,Accounting for Asset Retirement Obligations(“SFAS 143”) requires us to record a liability equal to the fair value of the estimated cost to retire an asset. The asset retirement obligation (“ARO”) liability is recorded in the period in which the obligation meets the definition of a liability, which is generally when the asset is placed in service and whereby we have contractual commitments to remove leasehold improvements and to return the leased facility back to a specified condition when the lease terminates. For a facility lease, this is typically at the inception of the lease.
When the ARO liability is initially recorded, we increase the carrying amount of the related long-lived asset (leasehold improvements) by an amount equal to the calculated liability. The liability is subsequently accreted to its present value each period, and the capitalized cost is depreciated over the useful life of the related asset, which is the lease term. The ARO liability is recorded at fair value, and accretion expense (included in general and administrative expenses) is recognized over time as the discounted liability is accreted to its expected settlement value. The fair value of the ARO liability is measured using the expected future cash outflows related to the lease and calculated by using inflation rates in effect at the time of adoption and incorporating a market-risk premium, and discounted at our credit-adjusted risk-free interest rate at the time of adoption. Any difference between costs incurred upon settlement of an asset retirement obligation and the recorded liability will be recognized as a gain or loss in our earnings.
Each ARO liability is based on a number of assumptions requiring judgment. We cannot predict the type of revisions to these assumptions that will be required in future periods due to the availability of additional information, technology changes, the price of labor costs and other factors.
The following table presents the activity for the asset retirement obligations, which primarily consist of classroom facilities at our education centers:
| | | | | | | | |
| | | Fiscal Year Ended | |
| | | September 29,
2006 | | | September 28,
2007 | |
ARO balance, beginning of year | | $ | 3,670 | | | $ | 4,174 | |
Liabilities incurred | | | 151 | | | | 275 | |
Accretion expense | | | 256 | | | | 291 | |
Liabilities satisfied | | | (105 | ) | | | (1,832 | ) |
Gain on settlement of ARO liability | | | (38 | ) | | | — | |
Revisions in expected cash flows | | | — | | | | 351 | |
Foreign currency translation | | | 240 | | | | 264 | |
| | | | | | | | |
ARO balance, end of year | | $ | 4,174 | | | $ | 3,523 | |
| | | | | | | | |
50
LEARNING TREE INTERNATIONAL, INC. AND SUBSIDIARIES
NOTES TO CONSOLIDATED FINANCIAL STATEMENTS
(amounts in thousands, except share and per share data)
We file a consolidated U.S. Federal income tax return which includes substantially all of our domestic operations. We file separate tax returns for each of our foreign subsidiaries in the countries in which they operate.
Income (loss) before provision for income taxes consists of the following:
| | | | | | | | | | | |
| | | Fiscal Year Ended |
| | | September 30,
2005 | | | September 29,
2006 | | | September 28,
2007 |
Domestic | | $ | (782 | ) | | $ | (4,802 | ) | | $ | 12,515 |
Foreign | | | 799 | | | | 5,533 | | | | 6,230 |
| | | | | | | | | | | |
Total | | $ | 17 | | | $ | 731 | | | $ | 18,745 |
| | | | | | | | | | | |
The provision for (benefit from) income taxes is comprised of the following:
| | | | | | | | | | | | |
| | | Fiscal Year Ended | |
| �� | | September 30,
2005 | | | September 29,
2006 | | | September 28,
2007 | |
Current tax provision: | | | | | | | | | | | | |
U.S. Federal | | $ | 580 | | | $ | 375 | | | $ | 5,954 | |
State | | | 26 | | | | 120 | | | | 320 | |
Foreign | | | 1,004 | | | | 3,134 | | | | (944 | ) |
| | | | | | | | | | | | |
| | | 1,610 | | | | 3,629 | | | | 5,330 | |
| | | | | | | | | | | | |
Deferred tax provision: | | | | | | | | | | | | |
U.S. Federal | | | 90 | | | | 399 | | | | (3,780 | ) |
State | | | 18 | | | | (84 | ) | | | (52 | ) |
Foreign | | | (5 | ) | | | (91 | ) | | | 257 | |
| | | | | | | | | | | | |
| | | 103 | | | | 224 | | | | (3,575 | ) |
| | | | | | | | | | | | |
Provision for income taxes | | $ | 1,713 | | | $ | 3,853 | | | $ | 1,755 | |
| | | | | | | | | | | | |
The following is a reconciliation of the provision for income taxes to the U.S. Federal statutory tax rate of 34%:
| | | | | | | | | | | | | | | | | | | | | |
| | | Fiscal Year Ended | |
| | | September 30,
2005 | | | Effective
Tax rate % | | | September 29,
2006 | | | Effective
Tax rate % | | | September 28,
2007 | | | Effective
Tax rate % | |
Income taxes at the U.S. statutory rate | | $ | 6 | | | 34 | % | | $ | 247 | | | 34 | % | | $ | 6,373 | | | 34 | % |
Permanent differences | | | (102 | ) | | (600 | ) | | | (482 | ) | | (66 | ) | | | (248 | ) | | (1 | ) |
Loss of stock option benefit | | | 1,059 | | | 6,229 | | | | — | | | — | | | | — | | | — | |
Effects of foreign taxes and tax credits | | | 734 | | | 4,318 | | | | 171 | | | 23 | | | | 310 | | | 2 | |
State income taxes (benefit) | | | (91 | ) | | (535 | ) | | | (191 | ) | | (26 | ) | | | 538 | | | 3 | |
Transfer pricing | | | — | | | — | | | | 828 | | | 113 | | | | (2,298 | ) | | (13 | ) |
Change in valuation allowance | | | 107 | | | 630 | | | | 3,280 | | | 449 | | | | (2,920 | ) | | (16 | ) |
| | | | | | | | | | | | | | | | | | | | | |
Total provision for income taxes | | $ | 1,713 | | | 10,076 | % | | $ | 3,853 | | | 527 | % | | $ | 1,755 | | | 9 | % |
| | | | | | | | | | | | | | | | | | | | | |
Permanent differences as presented above in the rate reconciliation of the provision for income taxes includes tax-exempt interest, the benefit of the extraterritorial income exclusions, reserves for uncertain tax positions, and other non-tax deductible items. The loss of a stock option benefit in the amount of $1,059 relating to the expiration of the statute of limitations in 2005 for our 2001 Federal tax return is included in the fiscal year 2005 provision.
In the normal course of business, we are subject to audits by federal, state and foreign tax authorities, and these authorities may challenge the amount of taxes due. While we believe our tax positions comply with applicable tax law, we evaluate exposures associated with various tax filing positions and record reserves for uncertain tax positions. We believe these reserves are adequate.
51
LEARNING TREE INTERNATIONAL, INC. AND SUBSIDIARIES
NOTES TO CONSOLIDATED FINANCIAL STATEMENTS
(amounts in thousands, except share and per share data)
During fiscal year 2006, our Canadian subsidiary underwent a transfer pricing tax examination by the Canada Revenue Agency (CRA) with respect to fiscal years 2002 and 2003. In September 2006, CRA proposed a preliminary assessment in the amount of $347 for additional taxes and interest. In December 2006, we accepted the proposed assessment and included this amount in our tax provision for fiscal year 2006. In July 2007, we requested that CRA adjust our Canadian income taxes for fiscal years 2000, 2001, 2004, and 2005 in a manner consistent with the adjustments CRA required for tax years 2002 and 2003. In addition, we filed our Canadian income tax return for tax year 2006 consistent with the methodology used by CRA. The impact of adjusting the four additional years and filing the 2006 return consistently with the adjusted years, when netted against the assessments for 2002 and 2003, resulted in a net benefit to us of approximately $3,224.
In accordance with SFAS No. 109,Accounting for Income Taxes (“SFAS 109”),and SFAS No. 5,Accounting for Contingencies(“SFAS 5”),we establish reserves for our global tax contingencies that reflect our best estimate of the deductions and credits that we may be unable to sustain, or that we could be willing to concede as part of a broader tax settlement. As of September 28, 2007, our recorded world-wide contingency reserves relating to transfer pricing was approximately $1,036.
Deferred income tax assets and liabilities consist of the following:
| | | | | | | | |
| | | September 29,
2006 | | | September 28,
2007 | |
Domestic operations: | | | | | | | | |
Deferred tax assets: | | | | | | | | |
Deferred facilities rent charges | | $ | 2,073 | | | $ | 1,952 | |
Foreign tax credit carryforwards | | | 79 | | | | 301 | |
State tax operating loss carryforwards | | | 366 | | | | 27 | |
Accrued vacation | | | 231 | | | | 243 | |
Equity compensation | | | 307 | | | | 567 | |
Investments | | | 188 | | | | 67 | |
Depreciation and amortization | | | 547 | | | | 1,488 | |
Other | | | 91 | | | | 56 | |
Deferred tax liabilities: | | | | | | | | |
Prepaids | | | (511 | ) | | | (368 | ) |
| | | | | | | | |
Domestic net deferred tax assets | | | 3,371 | | | | 4,333 | |
Foreign operations: | | | | | | | | |
Deferred tax assets: | | | | | | | | |
Depreciation and other | | | 1,200 | | | | 885 | |
Deferred tax liabilities: | | | | | | | | |
Deferred revenue | | | (147 | ) | | | (139 | ) |
| | | | | | | | |
Foreign net deferred tax assets | | | 1,053 | | | | 746 | |
| | | | | | | | |
Domestic and foreign deferred tax assets | | | 4,424 | | | | 5,079 | |
| | |
Valuation allowances | | | (3,610 | ) | | | (690 | ) |
| | | | | | | | |
Net deferred tax assets | | $ | 814 | | | $ | 4,389 | |
| | | | | | | | |
At September 28, 2007, we have foreign tax credit carryforwards of approximately $301, which expire, if unused, in the years 2013 to 2017. Our U.S. operating entity has net operating loss carryforwards for state income tax purposes of approximately $680, which expire, if unused, in various years through 2025.
Significant management judgment is required in determining our provision for income taxes and in determining whether any deferred tax assets will be realized in full or in part. When it is more likely than not that all or some portion of specific deferred tax assets such as net operating losses or foreign tax credit carryforwards will not be realized, a valuation allowance must be established for the amount of the deferred tax assets that cannot be realized. Realization is based on our ability to generate sufficient future taxable income.
52
LEARNING TREE INTERNATIONAL, INC. AND SUBSIDIARIES
NOTES TO CONSOLIDATED FINANCIAL STATEMENTS
(amounts in thousands, except share and per share data)
During fiscal year 2006, we established valuation allowances for portions of the deferred tax assets of our U.S. entities and one entity in a foreign jurisdiction. The valuation allowances were determined in accordance with the provisions of SFAS 109, which requires an assessment of a wide range of both positive and negative evidence when determining whether it is more likely than not that deferred tax assets are recoverable. Based on our assessment, which considered historical financial performance as well as projected future financial performance, we increased our valuation allowance by $3,312 for fiscal year 2006, including $3,046 for the U.S. entities and $266 for a foreign entity. We did not record a valuation allowance for either the U.S. entities or the foreign entity to the extent that the deferred tax assets were supported by deferred tax liabilities that would reverse within the loss carry forward period.
As of the end of the fourth quarter of fiscal year 2007, we determined that it was more likely than not that certain of these deferred tax assets are recoverable, based on the improved financial performance of the U.S. entities during fiscal year 2007 and our expectations for the future. Accordingly, we reversed the valuation allowance for the assets of the U.S. entities, except for the assets related to foreign tax credit carryovers and the deferred tax assets for certain state jurisdictions. This reversal of the valuation allowance resulted in a net benefit of approximately $2,754 recognized in the fiscal year 2007 tax provision. Our total valuation allowance decreased by $2,920, with the additional decrease attributable to fiscal year 2007 results from operations.
As of September 28, 2007, we continued to maintain valuation allowances in the U.S. related to the foreign tax credit carryovers and certain state deferred tax assets, and we continued to maintain a valuation allowance for our deferred tax assets in a foreign jurisdiction. We intend to maintain these valuation allowances until sufficient positive evidence exists to support their reversal. Profits or losses incurred in the U.S. and in the foreign jurisdiction will affect the ongoing amount of the valuation allowances.
We have not provided for U.S. federal income and foreign withholding taxes of international subsidiaries’ undistributed earnings as of September 28, 2007, because such earnings are intended to be reinvested indefinitely. The undistributed earnings were approximately $37.1 million as of September 28, 2007. If these earnings were distributed, we would incur approximately $238 of foreign withholding taxes. Because of the availability of U.S. foreign tax credits, it is not practicable to determine the U.S. federal income tax liability that would be payable if such earnings were not reinvested.
| 4. | COMMITMENTS AND CONTINGENCIES |
We have various non-cancelable operating leases for facilities that expire at various dates through 2019 and certain leases for office equipment requiring annual payments as follows:
| | | | | | | | | |
Fiscal Year Ending | | Minimum Lease
Payments | | Less
Sublease
Proceeds | | Net Lease
Commitments |
2008 | | $ | 15,456 | | $ | 3,007 | | $ | 12,449 |
2009 | | | 15,391 | | | 3,471 | | | 11,920 |
2010 | | | 14,991 | | | 3,276 | | | 11,715 |
2011 | | | 12,761 | | | 1,773 | | | 10,988 |
2012 | | | 10,200 | | | 1,763 | | | 8,437 |
2013 | | | 9,323 | | | 1,763 | | | 7,560 |
Thereafter | | | 36,322 | | | 4,499 | | | 31,823 |
| | | | | | | | | |
| | $ | 114,444 | | $ | 19,552 | | $ | 94,892 |
| | | | | | | | | |
Rental expense was $13,450, $14,749, and $14,547 for fiscal years 2005, 2006, and 2007, respectively. Sublease rental income for fiscal years 2005, 2006, and 2007 was $1,369, $1,338, and $2,230, respectively.
53
LEARNING TREE INTERNATIONAL, INC. AND SUBSIDIARIES
NOTES TO CONSOLIDATED FINANCIAL STATEMENTS
(amounts in thousands, except share and per share data)
Currently, and from time to time, we are involved in litigation incidental to the conduct of our business. We are not a party to any lawsuit or proceeding that, in the opinion of management, is likely to have a material adverse effect on our consolidated financial position or results of operations.
During fiscal year 2005 we repurchased approximately 327,000 shares of Common Stock at a total cost of approximately $4,314. During fiscal year 2006 we repurchased approximately 166,000 shares of Common Stock at a total cost of approximately $1,936. During fiscal year 2007, we did not make any repurchases of our Common Stock. All Learning Tree Common Stock repurchases were made in open-market transactions and not pursuant to any publicly traded plans. We may choose to make additional open-market purchases of our Common Stock in the future, but have no commitment to do so. Stock repurchase activities are regularly reviewed by our Board of Directors.
| 6. | STOCK-BASED COMPENSATION |
SFAS No. 123 (Revised 2004),Share Based Payment (“SFAS 123R”), is a revision of SFAS No. 123,Accounting for Stock-Based Compensation (“SFAS 123”). We adopted SFAS 123(R) as of October 1, 2005.
Effective January 23, 2007, our stockholders approved the 2007 Equity Incentive Plan (our “2007 Plan”). Our 2007 Plan is administered by the Compensation and Stock Option Committee of our Board of Directors. Our 2007 Plan permits the granting of nonqualified stock options, incentive stock options, stock appreciation rights (or SARs), restricted stock, performance units and performance shares to our employees, officers, directors and consultants to purchase up to an aggregate of 1,000 shares of Common Stock. Option awards are granted with an exercise price equal to the market price of our stock at the date of grant and generally vest over three years at one third per year subject to achieving certain financial targets in the year with respect to which they are granted and have five-year contractual terms. However, the exercise price, vesting schedule and period required for full exercisability of the options is at the discretion of the Compensation and Stock Option Committee of our Board of Directors. We recognize compensation cost for these awards on a straight-line basis over the requisite service period for the entire award, which is equal to the vesting period. We have a policy of issuing new shares of Common Stock to satisfy share option exercises.
Our 1999 Stock Option Plan and the 1995 Stock Option Plan terminated upon shareholder approval of our 2007 Plan, and no further grants of awards can be made under those plans. The termination of those plans will not affect the rights of holders of options previously granted and outstanding under those plans.
Prior to October 1, 2005, we accounted for our stock option plans under the intrinsic value recognition and measurement provisions of APB 25,Accounting for Stock Issued to Employees, as permitted by SFAS 123. Effective October 1, 2005, we adopted the fair value recognition provisions of SFAS 123(R) using the modified prospective transition method. Under that transition method, compensation cost includes (a) compensation costs for all stock options granted prior to, but not yet vested as of October 1, 2005 based on the grant-date fair value estimated in accordance with the provisions of SFAS 123, and (b) compensation costs for all stock options granted subsequent to October 1, 2005, based on the grant-date fair value estimated in accordance with the provisions of SFAS 123(R). As prescribed under the modified prospective transition method, results for prior periods have not been restated for the adoption of SFAS 123(R).
The following table illustrates the effect on net loss and loss per share as if we had applied the fair value recognition provisions of SFAS 123 to options granted under our stock option plan for the year ended September 30, 2005. For purposes of this pro forma disclosure, the value of the options was estimated using a Black-Scholes-Merton option-pricing formula and amortized to expense over the options’ vesting periods.
54
LEARNING TREE INTERNATIONAL, INC. AND SUBSIDIARIES
NOTES TO CONSOLIDATED FINANCIAL STATEMENTS
(amounts in thousands, except share and per share data)
| | | | |
| | | Year Ended
September 30, 2005 | |
Net loss, as reported | | $ | (1,696 | ) |
Less: stock-based employee compensation expense determined under fair value based method, net of related tax effects | | | (1,576 | ) |
| | | | |
Net loss, pro forma | | $ | (3,272 | ) |
| | | | |
Loss per share, basic and diluted, as reported | | $ | (0.10 | ) |
Loss per share, basic and diluted, pro forma | | $ | (0.19 | ) |
The fair value of each option award was estimated on the date of grant using a Black-Scholes-Merton option-pricing formula that uses the assumptions noted in the following table. Expected volatilities are based on the historical volatility of our stock measured over a period commensurate with the expected life of granted stock options. We used historical data to estimate option exercise and employee termination within the valuation model. The expected term of options represents the period of time that options granted are expected to be outstanding and has been determined based on an analysis of historical exercise behavior. The risk-free interest rate assumption was an average of the three- and five-year U.S. Treasury rates at the date of the grant which most closely resembles our four-year expected life of options. The expected dividend yield is 0%.
| | | | | | |
| | | Year Ended
September 30, 2005 | | Year Ended
September 29, 2006 | | Year Ended
September 28, 2007 |
Expected volatility | | 35% | | 31% | | 27% - 29% |
Expected dividends | | — | | — | | — |
Expected life (in years) | | 4 | | 4 | | 3.25 - 4.00 |
Risk-free interest rate | | 3.8% | | 4.0% | | 4.6% - 4.9% |
A summary of option activity under the 2007 Plan and previous plans as of fiscal years 2005, 2006, and 2007 is presented below:
| | | | | | | | | | | |
Options | | Shares | | | Weighted
Average
Exercise Price | | Weighted
Average
Remaining
Contractual
Term | | Aggregate
Intrinsic Value |
Outstanding at October 1, 2004 | | 1,683,000 | | | $ | 24.38 | | | | | |
Options granted | | 429,000 | | | $ | 12.93 | | | | | |
Options exercised | | — | | | $ | — | | | | | |
Options forfeited and expired | | (737,000 | ) | | $ | 29.15 | | | | | |
| | | | | | | | | | | |
Outstanding at September 30, 2005 | | 1,375,000 | | | $ | 18.24 | | | | | |
Options granted | | 110,000 | | | $ | 13.82 | | | | | |
Options exercised | | — | | | $ | — | | | | | |
Options forfeited and expired | | (367,000 | ) | | $ | 22.85 | | | | | |
| | | | | | | | | | | |
Outstanding at September 29, 2006 | | 1,118,000 | | | $ | 16.28 | | | | | |
Options granted | | 119,000 | | | $ | 12.00 | | | | | |
Options exercised | | (13,000 | ) | | $ | 12.34 | | | | | |
Options forfeited and expired | | (424,000 | ) | | $ | 20.31 | | | | | |
| | | | | | | | | | | |
Outstanding at September 28, 2007 | | 800,000 | | | $ | 13.94 | | 1.8 | | $ | 3,063 |
| | | | | | | | | | | |
Vested and expected to vest at September 28, 2007 | | 609,145 | | | $ | 12.51 | | 1.7 | | $ | 2,271 |
Exercisable at September 28, 2007 | | 442,378 | | | $ | 14.43 | | 1.2 | | $ | 1,475 |
The weighted average grant-date fair value of options granted during fiscal years 2006 and 2007 was $4.65 and $3.77, respectively. The total intrinsic value of options exercised during the year ended September 28, 2007 was $12.
We had 358,000 nonvested options as of September 28, 2007.
55
LEARNING TREE INTERNATIONAL, INC. AND SUBSIDIARIES
NOTES TO CONSOLIDATED FINANCIAL STATEMENTS
(amounts in thousands, except share and per share data)
Stock-based compensation expense related to employee stock options is included in cost of revenues and operating expenses consistent with the respective employee salary costs. These costs totaled $1,035 and $912 for the fiscal years 2006 and 2007, respectively. There was no stock-based compensation expense related to employee stock options recognized during fiscal year 2005. As stock-based compensation expense recognized in the consolidated statement of operations for fiscal year 2006 was based on awards ultimately expected to vest, it was reduced for estimated pre-vesting forfeitures as required by SFAS 123(R). In our pro forma information required under SFAS 123 for periods prior to fiscal year 2006, we accounted for pre-vesting forfeitures as they occurred.
The total income tax benefit relating to stock options and recognized in the consolidated statement of operations was $308 and $240 for fiscal years 2006 and 2007, respectively. There was no income tax benefit recognized during fiscal year 2005. As of September 28, 2007, there was $904 of total unrecognized compensation costs related to non-vested stock options granted under the 2007 Plan and previous plans. That cost is expected to be recognized over a weighted-average remaining period of 1.3 years.
Cash received from the exercise of stock options during fiscal year 2007 was $155.
Restricted Stock
As noted above, our 2007 Plan permits the granting of shares of restricted stock. Shares awarded under the plan entitle the shareholder to all rights of common stock ownership except that the shares may not be sold, transferred, pledged, exchanged or otherwise disposed of during the restriction period, and may be repurchased by us for nominal consideration if the employee ceases to be employed by us during that period. The restriction period is determined by a Compensation and Stock Option Committee of our Board of Directors.
During fiscal year 2007, we issued 25,914 shares of restricted common stock to certain employees. The vesting of these shares were subject to meeting certain financial performance targets during fiscal 2007, which were met, and consequently the shares will vest one third on December 31, 2007 and 33% annually over the next two years from that date.
The fair value of our restricted stock awards is equal to the market price of our stock on the date of grant. The following table provides a summary of restricted stock activity for the year ended September 28, 2007:
| | | | | |
| | | Shares | | Weighted
Average
Grant Date
Fair Value |
Nonvested at September 29, 2006 | | — | | | — |
Granted | | 25,914 | | $ | 12.66 |
Vested | | — | | | — |
Cancelled and forfeited | | — | | | — |
| | | | | |
Nonvested at September 28, 2007 | | 25,914 | | $ | 12.66 |
| | | | | |
As of September 28, 2007, when the financial targets for vesting of the awards were met, we recognized $55 in compensation cost. Unrecognized compensation cost related to nonvested restricted stock awards totaled approximately $273 and is expected to be recognized over a weighted-average period of 2.3 years.
56
LEARNING TREE INTERNATIONAL, INC. AND SUBSIDIARIES
NOTES TO CONSOLIDATED FINANCIAL STATEMENTS
(amounts in thousands, except share and per share data)
We have adopted a defined contribution plan for the benefit of our domestic employees who have met the eligibility requirements. The Learning Tree International 401(k) Plan (our “401(k) Plan”) is a profit-sharing plan qualifying under Section 401(k) of the Internal Revenue Code.
Qualified employees may elect to contribute up to 15% of their compensation to our 401(k) Plan on a pre-tax basis, subject to statutory limitations. We make contributions at a rate of 75% of elective contributions up to 6% of the compensation of such contributors. We contributed $628, $556, and $630 to our 401(k) Plan for the fiscal years 2005, 2006, and 2007, respectively.
We have adopted or participate in country-sponsored defined contribution plans for the benefit of our employees of all of our foreign subsidiaries. Contributions to these plans are subject to tenure and compensation level criteria, as well as certain limitations. For fiscal years ended 2005, 2006 and 2007 our cost for these plans was approximately $760, $868, and $546, respectively.
Income (loss) per share - basic is computed by dividing net income (loss) by the weighted average number of shares of Common Stock outstanding during the period. Income (loss) per share – diluted includes the dilutive effect, if any, of nonvested restricted stock grants and of all outstanding options to purchase common stock outstanding during the period, using the treasury stock method. Nonvested restricted stock grants and stock options are not included in the loss per share - diluted calculations because of their anti-dilutive effect. For fiscal years 2005, 2006, and 2007, approximately 967,000, 1,119,000, and 800,000 stock options, respectively, were anti-dilutive and excluded from the Income (loss) per share - diluted calculation. For the fiscal year 2007, nonvested restricted common stock grants of approximately 25,900 were anti-dilutive and excluded from the Income (loss) per share – diluted calculation.
The following table sets forth the calculation of basic and diluted earnings per share:
| | | | | | | | | | | |
| | | Fiscal Year Ended |
| | | September 30,
2005 | | | September 29,
2006 | | | September 28,
2007 |
Numerator: | | | | | | | | | | | |
Net income (loss) | | $ | (1,696 | ) | | $ | (3,122 | ) | | $ | 16,990 |
| | | | | | | | | | | |
Denominator: | | | | | | | | | | | |
Weighted-average shares outstanding - basic | | | 16,865 | | | | 16,583 | | | | 16,498 |
Dilutive effect of stock options | | | — | | | | — | | | | — |
| | | | | | | | | | | |
Weighted-average shares outstanding - diluted | | | 16,865 | | | | 16,583 | | | | 16,498 |
| | | | | | | | | | | |
Income (loss) Per Share: | | | | | | | | | | | |
Income (loss) per common share - basic | | $ | (0.10 | ) | | $ | (0.19 | ) | | $ | 1.03 |
| | | | | | | | | | | |
Income (loss) per common share - diluted | | $ | (0.10 | ) | | $ | (0.19 | ) | | $ | 1.03 |
| | | | | | | | | | | |
| 9. | OPERATING SEGMENT INFORMATION |
Our worldwide operations involve the design and delivery of instructor-led classroom training courses and related services to multi-national companies and government entities. The training and education we offer is presented in an identical manner in every country in which we operate. Our instructors present our courses in a virtually identical fashion worldwide, regardless of whether presented in leased classroom space or external facilities, of the content of the class being taught, the language of the presentation or the printed course materials, or of the location or method of distribution. We did not have sales to any single customer that amounted to 10% or more of our revenues in fiscal years 2005, 2006, or 2007.
57
LEARNING TREE INTERNATIONAL, INC. AND SUBSIDIARIES
NOTES TO CONSOLIDATED FINANCIAL STATEMENTS
(amounts in thousands, except share and per share data)
We conduct and manage our business globally, and our management makes financial decisions and allocates resources based on the information we receive from our internal management systems. Our reportable segments are: United States, Canada, United Kingdom, France, Sweden and Japan. As a measure of segment performance the Chief Operating Decision Maker reviews revenues and gross profit for each segment. Intersegment sales were $791, $838 and $974 in 2005, 2006 and 2007, respectively.
Summarized financial information by reportable segment for fiscal years 2005, 2006, and 2007, is as follows:
58
LEARNING TREE INTERNATIONAL, INC. AND SUBSIDIARIES
NOTES TO CONSOLIDATED FINANCIAL STATEMENTS
(amounts in thousands, except share and per share data)
| | | | | | | | | |
| | | Fiscal Year Ended |
| | | September 30,
2005 | | September 29,
2006 | | September 28,
2007 |
Revenues: | | | | | | | | | |
United States | | $ | 68,203 | | $ | 71,341 | | $ | 74,714 |
Canada | | | 13,004 | | | 14,802 | | | 16,329 |
United Kingdom | | | 43,336 | | | 39,834 | | | 44,884 |
France | | | 16,663 | | | 17,288 | | | 18,313 |
Sweden | | | 8,017 | | | 8,045 | | | 10,213 |
Japan | | | 2,335 | | | 2,739 | | | 2,740 |
| | | | | | | | | |
Total | | $ | 151,558 | | $ | 154,049 | | $ | 167,193 |
| | | | | | | | | |
Gross profit: | | | | | | | | | |
United States | | $ | 35,973 | | $ | 36,310 | | $ | 41,338 |
Canada | | | 7,211 | | | 8,632 | | | 10,457 |
United Kingdom | | | 19,273 | | | 18,532 | | | 24,844 |
France | | | 7,939 | | | 8,222 | | | 9,346 |
Sweden | | | 3,769 | | | 4,404 | | | 6,451 |
Japan | | | 1,427 | | | 1,785 | | | 1,821 |
| | | | | | | | | |
Total | | $ | 75,592 | | $ | 77,885 | | $ | 94,257 |
| | | | | | | | | |
Depreciation and amortization (as included in gross profit): | | | | | | | | | |
United States | | $ | 2,747 | | $ | 3,250 | | $ | 1,970 |
Canada | | | 366 | | | 365 | | | 294 |
United Kingdom | | | 450 | | | 1,010 | | | 1,037 |
France | | | 572 | | | 546 | | | 1,047 |
Sweden | | | 369 | | | 257 | | | 189 |
Japan | | | 41 | | | 42 | | | 24 |
| | | | | | | | | |
Total | | $ | 4,545 | | $ | 5,470 | | $ | 4,561 |
| | | | | | | | | |
Summarized financial information by reportable segment for fiscal years 2006 and 2007 is as follows:
| | | | | | |
| | | Fiscal Year Ended |
| | | September 29,
2006 | | September 28,
2007 |
Total assets: | | | | | | |
United States | | $ | 78,456 | | $ | 86,371 |
Canada | | | 10,892 | | | 19,073 |
United Kingdom | | | 33,521 | | | 39,810 |
France | | | 8,082 | | | 8,642 |
Sweden | | | 5,521 | | | 8,484 |
Japan | | | 728 | | | 1,596 |
| | | | | | |
Total | | $ | 137,200 | | $ | 163,976 |
| | | | | | |
Long-lived assets: | | | | | | |
United States | | $ | 16,678 | | $ | 16,046 |
Canada | | | 1,116 | | | 1,093 |
United Kingdom | | | 5,275 | | | 6,487 |
France | | | 2,568 | | | 2,191 |
Sweden | | | 667 | | | 869 |
Japan | | | 112 | | | 70 |
| | | | | | |
Total | | $ | 26,416 | | $ | 26,756 |
| | | | | | |
Capital expenditures: | | | | | | |
United States | | $ | 7,384 | | $ | 2,649 |
Canada | | | 350 | | | 215 |
United Kingdom | | | 1,038 | | | 2,177 |
France | | | 518 | | | 59 |
Sweden | | | 566 | | | 366 |
Japan | | | 29 | | | — |
| | | | | | |
Total | | $ | 9,885 | | $ | 5,466 |
| | | | | | |
59
LEARNING TREE INTERNATIONAL, INC. AND SUBSIDIARIES
NOTES TO CONSOLIDATED FINANCIAL STATEMENTS
(amounts in thousands, except share and per share data)
10. VALUATION AND QUALIFYING ACCOUNTS
Activity with respect to our provision for doubtful accounts is summarized as follows:
| | | | | | | | | | | | |
| | | Fiscal Year Ended | |
| | | September 30,
2005 | | | September 29,
2006 | | | September 28,
2007 | |
Beginning balance | | $ | 402 | | | $ | 350 | | | $ | 298 | |
Provision for doubtful accounts | | | 57 | | | | 154 | | | | (45 | ) |
Charges against allowance | | | (109 | ) | | | (206 | ) | | | (73 | ) |
Other | | | — | | | | — | | | | 15 | |
| | | | | | | | | | | | |
Ending balance | | $ | 350 | | | $ | 298 | | | $ | 195 | |
| | | | | | | | | | | | |
Activity with respect to our valuation allowance for deferred tax assets is summarized as follows:
| | | | | | | | | | |
| | | Fiscal Year Ended | |
| | | September 30,
2005 | | September 29,
2006 | | September 28,
2007 | |
Beginning balance | | $ | 191 | | $ | 298 | | $ | 3,610 | |
Provisions | | | 107 | | | 3,312 | | | (2,920 | ) |
Charges against allowance | | | — | | | — | | | — | |
| | | | | | | | | | |
Ending balance | | $ | 298 | | $ | 3,610 | | $ | 690 | |
| | | | | | | | | | |
11. RELATED PARTY TRANSACTIONS
Since April 2007, Eric Garen, the Chairman of our Board of Directors (“Chairman”) has been working under an employment agreement which provides for his part-time employment on a monthly basis which may be terminated by either party on three months written notice. We currently pay Mr. Garen $15,000 per month as per the terms of this agreement. From November 2003 until April 2007, Mr. Garen was working under an employment agreement which provided for his part-time employment on an hourly basis. Prior to November 2003, Mr. Garen was employed on a full-time basis as the President of Learning Tree International, Inc.
Since October 2005, Dr. David C. Collins, the Vice Chairman of our Board of Directors (“Vice Chairman”) has been employed under an arrangement which provides for his services at an aggregate annual compensation of one U.S. dollar per year. Dr. Collins serves as Vice Chairman of our Board of Directors and provides input to us on special projects as mutually agreed between Dr. Collins and Learning Tree. In addition, Dr. Collins oversees (with the concurrence of the Nominating and Governance Committee of our Board of Directors) a charitable budget of $200. In fiscal years 2006 and 2007, we donated $200 to two public charitable organizations recommended by Dr. Collins. Dr. Collins is a member of the board of both public charitable organizations. Prior to October 2005, Dr. Collins was employed on a full time basis as the Chief Executive Officer of Learning Tree International, Inc.
60
LEARNING TREE INTERNATIONAL, INC. AND SUBSIDIARIES
NOTES TO CONSOLIDATED FINANCIAL STATEMENTS
(amounts in thousands, except share and per share data)
12. QUARTERLY DATA (UNAUDITED)
| | | | | | | | | | | | | | | |
| | | Q1
December 30,
2005 | | Q2 March 31,
2006 | | | Q3 June 30,
2006 | | | Q4 September 29,
2006 | |
Revenues | | $ | 39,806 | | $ | 34,282 | | | $ | 41,218 | | | $ | 38,743 | |
Cost of revenues | | | 18,936 | | | 18,253 | | | | 20,294 | | | | 18,681 | |
| | | | | | | | | | | | | | | |
Gross profit | | | 20,870 | | | 16,029 | | | | 20,924 | | | | 20,062 | |
Operating expenses: | | | | | | | | | | | | | | | |
Course development | | | 2,298 | | | 2,436 | | | | 2,854 | | | | 2,492 | |
Sales and marketing | | | 9,341 | | | 11,384 | | | | 11,515 | | | | 10,263 | |
General and administrative | | | 6,713 | | | 6,389 | | | | 6,918 | | | | 7,924 | |
| | | | | | | | | | | | | | | |
Total operating expenses | | | 18,352 | | | 20,209 | | | | 21,287 | | | | 20,679 | |
| | | | | | | | | | | | | | | |
Income (loss) from operations | | | 2,518 | | | (4,180 | ) | | | (363 | ) | | | (617 | ) |
Other income (expense), net | | | 659 | | | 843 | | | | 998 | | | | 873 | |
| | | | | | | | | | | | | | | |
Income (loss) before provision for income taxes | | | 3,177 | | | (3,337 | ) | | | 635 | | | | 256 | |
Provision for (benefit from) income taxes | | | 1,282 | | | (1,380 | ) | | | 157 | | | | 3,794 | |
| | | | | | | | | | | | | | | |
Net income (loss) | | $ | 1,895 | | $ | (1,957 | ) | | $ | 478 | | | $ | (3,538 | ) |
| | | | | | | | | | | | | | | |
Income (loss) per common share - basic | | $ | 0.11 | | $ | (0.12 | ) | | $ | 0.03 | | | $ | (0.21 | ) |
| | | | | | | | | | | | | | | |
Income (loss) per common share - diluted | | $ | 0.11 | | $ | (0.12 | ) | | $ | 0.03 | | | $ | (0.21 | ) |
| | | | | | | | | | | | | | | |
| | | | |
| | | Q1
December 29,
2006 | | Q2
March 30,
2007 | | | Q3 June 29,
2007 | | | Q4
September 28,
2007 | |
Revenues | | $ | 42,713 | | $ | 37,631 | | | $ | 42,663 | | | $ | 44,186 | |
Cost of revenues | | | 18,353 | | | 17,235 | | | | 18,297 | | | | 19,051 | |
| | | | | | | | | | | | | | | |
Gross profit | | | 24,360 | | | 20,396 | | | | 24,366 | | | | 25,135 | |
Operating expenses: | | | | | | | | | | | | | | | |
Course development | | | 1,869 | | | 1,911 | | | | 2,345 | | | | 2,488 | |
Sales and marketing | | | 9,298 | | | 9,985 | | | | 9,440 | | | | 12,371 | |
General and administrative | | | 7,097 | | | 7,456 | | | | 7,539 | | | | 7,949 | |
| | | | | | | | | | | | | | | |
Total operating expenses | | | 18,264 | | | 19,352 | | | | 19,324 | | | | 22,808 | |
| | | | | | | | | | | | | | | |
Income from operations | | | 6,096 | | | 1,044 | | | | 5,042 | | | | 2,327 | |
Other income (expense), net | | | 1,190 | | | 893 | | | | 980 | | | | 1,173 | |
| | | | | | | | | | | | | | | |
Income before provision for income taxes | | | 7,286 | | | 1,937 | | | | 6,022 | | | | 3,500 | |
Provision for (benefit from) income taxes | | | 2,980 | | | 790 | | | | 2,319 | | | | (4,334 | ) |
| | | | | | | | | | | | | | | |
Net income | | $ | 4,306 | | $ | 1,147 | | | $ | 3,703 | | | $ | 7,834 | |
| | | | | | | | | | | | | | | |
Income per common share - basic | | $ | 0.26 | | $ | 0.07 | | | $ | 0.22 | | | $ | 0.48 | |
| | | | | | | | | | | | | | | |
Income per common share - diluted | | $ | 0.26 | | $ | 0.07 | | | $ | 0.22 | | | $ | 0.48 | |
| | | | | | | | | | | | | | | |
In the fourth quarter of 2007, we recorded $0.6 million to sales and marketing expense for use taxes due on catalogues as well as $0.5 million of marketing expense that relates to the third quarter. Also in the fourth quarter of 2007 we recorded a reduction in tax expense associated with a transfer pricing examination by the Canada Revenue Agency and we released the deferred tax valuation allowance previously recorded for U.S. entities. See Note 3.
61
Item 9. CHANGES IN AND DISAGREEMENTS WITH ACCOUNTANTS ON ACCOUNTING
AND FINANCIAL DISCLOSURE
None.
Item 9A. CONTROLS AND PROCEDURES
We maintain disclosure controls and procedures that are designed to ensure that information required to be disclosed in our reports filed or submitted under the Securities Exchange Act of 1934, as amended (the “Exchange Act”), is recorded, processed, summarized and reported within the time periods specified in the SEC’s rules and forms, and that such information is accumulated and communicated to management, including our Chief Executive Officer and Chief Financial Officer, as appropriate, to allow timely decisions regarding required disclosures.
An evaluation was carried out under the supervision and with the participation of management, including the Chief Executive Officer and Chief Financial Officer, of the effectiveness of our disclosure controls and procedures, as such term is defined in Rules 13a-15(e) and 15d-15(e) under the Exchange Act as of September 28, 2007. Based on this evaluation, our Chief Executive Officer and Chief Financial Officer concluded that our disclosure controls and procedures were effective as of September 28, 2007.
Management’s Annual Report on Internal Control over Financial Reporting
Our management is responsible for establishing and maintaining adequate internal control over financial reporting as defined in Rule 13a – 15(f) under the Exchange Act. Under Section 404 of the Sarbanes-Oxley Act of 2002, our management is required to assess the effectiveness of our internal control over financial reporting as of the end of each fiscal year and report, based on that assessment, whether our internal control over financial reporting is effective.
Our internal control over financial reporting is a process designed to provide reasonable assurance regarding the reliability of financial reporting and the preparation of our financial statements for external reporting purposes in accordance with U.S. generally accepted accounting principles. Under the supervision and with the participation of management, including our Chief Executive Officer and Chief Financial Officer, we conducted a review, evaluation, and assessment of the effectiveness of our internal control over financial reporting as of September 28, 2007, based upon the criteria set forth in Internal Control—Integrated Framework issued by the Committee of Sponsoring Organizations of the Treadway Commission.
Based on these review activities, our management concluded that our internal control over financial reporting was effective as of September 28, 2007.
Remediation of Material Weaknesses
Management is required to ensure that its finance and accounting personnel have the competence and training necessary for their assigned levels of responsibility, and that sufficient staff is present to effectively perform all processes necessary to maintaining a proper internal control environment. Management is also responsible for maintaining effective internal control processes over its financial statement close and financial reporting processes.
During management’s assessment of the effectiveness of our internal control over financial reporting as of September 29, 2006, we identified three material weaknesses in our internal control over financial reporting which resulted in errors in our historical financial statements and required a restatement of our financial statements for certain prior periods. A material weakness is a deficiency, or a combination of deficiencies, in internal control over financial reporting, such that there is a reasonable possibility that a material misstatement of the company’s annual or interim financial statements will not be prevented or detected on a timely basis. We believe that these weaknesses have been remediated in fiscal year 2007 through a number of initiatives we took, including expanded testing and personnel actions discussed below.
With respect to the material weakness relating to entity-level monitoring controls, we enhanced our finance staffing by hiring an experienced Chief Financial Officer, Corporate Controller and Corporate Assistant Controller. We made necessary adjustments to our internal processes and procedures.
With respect to the material weakness relating to the financial statement closing process, as noted above we have filled key staff positions. The additional personnel provided us with the expertise and experience necessary to
62
implement process controls related to the quarterly and annual function of closing our financial statements, specifically the accounting for leases and lease termination costs. We automated certain previously manual portions of the reporting process which could have been subject to human error. We are now current with the filing of all reports to the Securities and Exchange Commission and with the filing of all statutory accounts in the United Kingdom.
With respect to the material weakness relating to the accounting for income taxes, we have retained the use of an expert, external consultant for the preparation of tax provisions and related tax positions and the review of tax-related documentation. We have retained the services of other professional service providers that are experts in the area of international taxation.
Our audit committee and our management continue to monitor the effectiveness of our internal control over financial reporting on an ongoing basis and will take further action as appropriate.
Changes in Internal Control over Financial Reporting
In addition to the material weaknesses discussed above, during the course of our efforts to comply with Section 404 of the Sarbanes-Oxley Act of 2002, we identified and remediated a number of other control deficiencies; however, none of these deficiencies materially affected, or were considered reasonably likely to materially affect, our internal control over financial reporting.
63
Report of Independent Registered Public Accounting Firm
Board of Directors and Shareholders
Learning Tree International, Inc.
Reston, Virginia
We have audited Learning Tree International, Inc. and subsidiaries’ internal control over financial reporting as of September 28, 2007, based on criteria established inInternal Control – Integrated Framework issued by the Committee of Sponsoring Organizations of the Treadway Commission (the COSO criteria). Learning Tree International, Inc. and subsidiaries’ management is responsible for maintaining effective internal control over financial reporting and for its assessment of the effectiveness of internal control over financial reporting, included in the accompanying Item 9A, Management’s Report on Internal Control Over Financial Reporting. Our responsibility is to express an opinion on the company’s internal control over financial reporting based on our audit.
We conducted our audit in accordance with the standards of the Public Company Accounting Oversight Board (United States). Those standards require that we plan and perform the audit to obtain reasonable assurance about whether effective internal control over financial reporting was maintained in all material respects. Our audit included obtaining an understanding of internal control over financial reporting, assessing the risk that a material weakness exists, and testing and evaluating the design and operating effectiveness of internal control based on the assessed risk. Our audit also included performing such other procedures as we considered necessary in the circumstances. We believe that our audit provides a reasonable basis for our opinion.
A company’s internal control over financial reporting is a process designed to provide reasonable assurance regarding the reliability of financial reporting and the preparation of financial statements for external purposes in accordance with generally accepted accounting principles. A company’s internal control over financial reporting includes those policies and procedures that (1) pertain to the maintenance of records that, in reasonable detail, accurately and fairly reflect the transactions and dispositions of the assets of the company; (2) provide reasonable assurance that transactions are recorded as necessary to permit preparation of financial statements in accordance with generally accepted accounting principles, and that receipts and expenditures of the company are being made only in accordance with authorizations of management and directors of the company; and (3) provide reasonable assurance regarding prevention or timely detection of unauthorized acquisition, use, or disposition of the company’s assets that could have a material effect on the financial statements.
Because of its inherent limitations, internal control over financial reporting may not prevent or detect misstatements. Also, projections of any evaluation of effectiveness to future periods are subject to the risk that controls may become inadequate because of changes in conditions, or that the degree of compliance with the policies or procedures may deteriorate.
In our opinion, Learning Tree International, Inc. and subsidiaries maintained, in all material respects, effective internal control over financial reporting as of September 28, 2007, based on the COSO criteria.
We also have audited, in accordance with the standards of the Public Company Accounting Oversight Board (United States), the consolidated balance sheet of Learning Tree International, Inc. and subsidiaries as of September 28, 2007, and the related consolidated statements of operations, stockholders’ equity and other comprehensive (loss) income, and cash flows for the year then ended, and our report dated December 11, 2007 expressed an unqualified opinion thereon.
/s/ BDO Seidman LLP
Bethesda, Maryland
December 11, 2007
64
Item 9B. OTHER INFORMATION
None.
65
PART III
Item 10. DIRECTORS, EXECUTIVE AND CORPORATE GOVERNANCE
The following table provides biographical information regarding our directors and executive officers as of September 28, 2007:
| | | | |
Name | | Age | | Title |
Eric R. Garen | | 60 | | Chairman of the Board of Directors |
David C. Collins | | 66 | | Vice Chairman of the Board of Directors |
Nicholas R. Schacht | | 48 | | President, Chief Executive Officer, and Director |
Charles R. Waldron | | 57 | | Chief Financial Officer & Chief Accounting Officer |
Magnus Nylund | | 37 | | Chief Information Officer |
W. Mathew Juechter (3) (6) | | 74 | | Director |
Howard A. Bain III (2) | | 61 | | Director |
Curtis A. Hessler (1) (4) | | 63 | | Director |
Stefan Riesenfeld (4) (5) | | 59 | | Director |
George Robson (5) (6) | | 60 | | Director |
| (1) | Chairman of the Compensation and Stock Option Committee. |
| (2) | Chairman of the Audit Committee. |
| (3) | Chairman of the Nominating and Governance Committee. |
| (4) | Member of the Nominating and Governance Committee. |
| (5) | Member of the Audit Committee. |
| (6) | Member of the Compensation and Stock Option Committee. |
Mr. Garen, a co-founder of Learning Tree, has served as Chairman of Learning Tree’s Board of Directors since May 2007. From November 2003 to May 2007, Mr. Garen served as Vice Chairman of the Board. From 1991 through November 2003, Mr. Garen served as President of Learning Tree and prior to that as Executive Vice President of Learning Tree since 1974. Mr. Garen holds a Bachelor of Science degree in Electrical Engineering from the California Institute of Technology and a Masters degree in Computer Science from the University of Southern California, earning both degrees with honors.
Dr. Collins, a co-founder of Learning Tree, has been Vice Chairman of the Board since May 2007. Dr. Collins served as Chairman of the Board from August, 1974 when Learning Tree began operations until May 2007. Until his retirement on October 1, 2005, Dr. Collins also served as the Chief Executive Officer of Learning Tree for 32 years. Dr. Collins has a Bachelor of Science degree (with distinction) in Electrical Engineering from Stanford University, and Masters and Ph.D. degrees in Electrical Engineering from the University of Southern California.
Mr. Schacht has been a director of Learning Tree since November 2005 and has been President and Chief Executive Officer of Learning Tree since October 2005. He was President and Chief Operating Officer of Learning Tree from 2003 until 2005, and was Chief Operating Officer of Learning Tree from 2002 to 2003. He was President of Global Learning Systems from 1999 to 2002, Group President for the Institute for International Research from 1998 to 1999, and held a variety of positions with ESI International from 1989 to 1998, culminating as its President. From 1987 to 1989, Mr. Schacht was a Research Fellow with Logistics Management Institute, and from 1981 to 1987, he was a U.S. Naval officer. Mr. Schacht holds a B.S. degree with honors from the U.S. Naval Academy, a Master’s degree in General Administration from the University of Maryland, and a Master of Science degree from The George Washington University.
Mr. Waldron has been the Chief Financial Officer of Learning Tree since May 2007. From April 2000 until May 2007, Mr. Waldron was a partner with Tatum LLC (Tatum), a professional services provider of financial and information technology leadership. During his tenure at Tatum Mr. Waldron served as CFO of LCC International,
66
Inc., Brivo Systems, Inc., and Netcom Solutions International, Inc. He also served as consulting CFO for Star Scientific, Inc. and assisted with the initial implementation of Sarbanes Oxley at Flowserve Corporation, a $2 billion NYSE company. Prior to joining Tatum, Mr. Waldron worked for ExxonMobil Corporation in a variety of positions including Vice President Finance and Administration of Mobil Oil Canada, Chief Financial Officer for a $4 billion project in the Middle East, and as Controller of Mobil’s international exploration and production business unit. Mr. Waldron is a licensed CPA and holds BA and MBA degrees from Tulane University.
Mr. Nylund has been the Chief Information Officer of Learning Tree since October 2005. His responsibilities include the development, maintenance, and integration of all Learning Tree information systems. He was Learning Tree’s Vice President, Worldwide Information Systems from 2002 to 2005. Prior to his role as Vice President, Worldwide Information Systems, Mr. Nylund served as Director, Worldwide IS Operations. He joined Learning Tree in 1992 in Learning Tree’s Swedish Operating Unit. Mr. Nylund has a Diploma in Computer Science from the University of Gävle, Sweden.
Mr. Juechter has been a director of Learning Tree since June 1987. He is President and Chief Executive Officer of IRA, Inc., a management consulting company that works primarily in the areas of strategy, structure and executive development. From 1991 to 1999, he was Chief Executive Officer of ARC International Ltd., a management consulting and training company. From 1986 to 1991, Mr. Juechter was Managing Director of IRA, Inc. in St. Paul, Minnesota. Mr. Juechter served as President and Chief Executive Officer of Wilson Learning Corp., a multi-national training organization, from 1977 to 1986. From 1989 to 1997, he also was President of the Board of Governors of the American Society for Training and Development (ASTD). Mr. Juechter is a graduate of Boston University and Harvard Business School.
Mr. Bain has served as a director of Learning Tree since June 2001. In addition to Learning Tree, he is also a director of PGP Corporation, a global leader in enterprise data security and encryption solutions, Turin Networks, Inc., a leading supplier of communications infrastructure that connects local enterprise, residential and wireless access networks to long-haul optical networks and other private venture capital financed companies. He is an independent consultant in all aspects of corporate finance and operations and has held Chief Financial Officer positions at several public companies including: Portal Software from 2001 to 2004, Vicinity Corporation in 2000, Informix from 1999 to 2000, and Symantec Corporation from 1991 to 1999. He has additional experience in various technology companies in the areas of semiconductor devices and manufacturing equipment; laser-based large screen projection systems; and computer disk drives. He was a consultant with Arthur Andersen LLP where he was a certified public accountant. Mr. Bain holds a B.S. in Business from California Polytechnic University. Mr. Bain currently qualifies as an independent director and certified financial expert under the Sarbanes-Oxley Act of 2002.
Mr. Hessler has been a director of Learning Tree since April 2003. He was Chairman and founding Chief Executive Officer of 101communications LLC, an international publishing and educational conference company serving advanced information technology professionals from 1998-2006. From 1997 to 1998 he served as President and Chief Executive Officer of Quarterdeck Corporation, a software firm. From 1996 to 1997 he served as Chairman and Chief Executive Officer of I-Net, Inc., a network management services company. From 1991 to 1995 he served as Executive Vice President, Chief Financial Officer of the Times Mirror Company, a media company. From 1984 to 1990 he served as Vice Chairman and Chief Financial Officer of the Unisys Corporation, a computer and computer services company. From 1981 to 1983 he was a partner of Paul Weiss Rifkind Wharton and Garrison, a law firm. From 1977 to 1981 he held various positions with the Federal Government: Assistant Secretary of the U.S. Treasury for Economic Policy, Executive Director of the President’s Economic Policy Group and Associate Director of the Office of Management and Budget. Mr. Hessler is a graduate of Harvard College (BA, summa), Oxford University (Rhodes scholarship), the Yale Law School (JD), and the University of California, Berkeley (MA Economics).
Mr. Riesenfeld has been a director of Learning Tree since November 2006. From 2000 to 2003 he served as Chief Financial Officer of Asia Global Crossing. From 1999 to 2000 he served as Chief Financial Officer of Teledyne Technologies. From 1996 to 1999 he served as Finance Director (Chief Financial Officer) of ICL PLC in London, England. From 1989 to 1996 he served as Corporate Treasurer of Unisys Corporation. Mr. Riesenfeld is on the Board of Directors and is Treasurer of the Santa Barbara Symphony. He holds an MBA and an MA (economics) from Stanford University and a B.S in physics from the California Institute of Technology.
67
Mr. Robson has served as a director of Learning Tree since November 2006. He is also a director of Liberty Tax Service, a private company serving the tax preparation needs of individuals. He was the Chief Financial Officer of Unisys Corporation from 1990 until 1996, the Chief Financial Officer of H & R Block from 1996 until 1997 and the Chief Financial Officer of Dendrite International, a supplier of software and services to the pharmaceutical industry, from 1997 until 2002, and on an interim basis during 2005. Mr. Robson holds a B.S. in Economics and Finance from the Wharton School of the University of Pennsylvania and an M.S. in Management from Binghamton University.
There are no family relationships among any of the directors or executive officers of Learning Tree.
On December 4, 2002, our Board of Directors adopted the “Code of Business Conduct and Ethics” for all of our employees, including our principal executive officer, principal financial officer and principal accounting officer. A copy of the Code of Business Conduct and Ethics is publicly available on our website at www.learningtree.com. We intend to post on our website any amendments to, or waivers from, our Code of Business Conduct and Ethics within two days of any such amendment or waiver.
All of the other information required by this item is incorporated by reference to our definitive Proxy Statement to be delivered to stockholders in connection with the 2008 Annual Meeting of Stockholders.
Item 11. EXECUTIVE COMPENSATION
The information required by this item is incorporated by reference to the sections entitled “Compensation Discussion and Analysis,” “Compensation of Directors,” and “Compensation Committee Interlocks and Insider Participation,” of our definitive Proxy Statement to be delivered to stockholders in connection with the 2008 Annual Meeting of Stockholders.
Item 12. SECURITY OWNERSHIP OF CERTAIN BENEFICIAL OWNERS
AND MANAGEMENT AND RELATED STOCKHOLDER MATTERS
| | | | | | | |
Plan Category | | Number of Securities
to be Issued Upon
Exercise of
Outstanding Options, Warrants and Rights | | Weighted-Average
Exercise Price of
Outstanding Options,
Warrants and Rights | | Number of Securities
Remaining Available
for Future Issuance
Under Equity
Compensation Plan
(Excluding Securities
Reflected in the first
Column) |
Equity compensation plans approved by security holders | | 800,361 | | $ | 13.94 | | 874,645 |
Equity compensation plans not approved by security holders | | — | | | — | | — |
| | | | | | | |
Total | | 800,361 | | $ | 13.94 | | 874,645 |
| | | | | | | |
The information required by this item is incorporated by reference to the section entitled “Security Ownership of Certain Beneficial Owners and Management” of Learning Tree’s definitive Proxy Statement to be delivered to stockholders in connection with the 2008 Annual Meeting of Stockholders.
Item 13. CERTAIN RELATIONSHIPS AND RELATED TRANSACTIONS,
AND DIRECTOR INDEPENDENCE
The information required by this item is incorporated by reference to the section entitled “Certain Transactions” of our definitive Proxy Statement to be delivered to stockholders in connection with the 2008 Annual Meeting of Stockholders.
Item 14. PRINCIPAL ACCOUNTING FEES AND SERVICES
The information required by this item is incorporated by reference to the section entitled “Independent Registered Public Accounting Firm” of our definitive Proxy Statement to be delivered to stockholders in connection with the 2008 Annual Meeting of Stockholders.
68
PART IV
Item 15. EXHIBITS AND FINANCIAL STATEMENT SCHEDULES
| (a) | Financial Statements and Schedules |
The financial statements of Learning Tree International, Inc. as set forth under Item 8 are filed as part of this report.
All schedules for which provision is made in the applicable accounting regulation of the Securities and Exchange Commission are omitted because such schedules are not required under the related instructions, are not applicable or the required information is given in the financial statements.
The exhibits set forth in the Exhibit Index are filed as part of this Annual Report on Form 10-K.
69
SIGNATURES
Pursuant to the requirements of Section 13 or 15(d) of the Securities Exchange Act of 1934, as amended, the registrant, Learning Tree International, Inc., a corporation organized and existing under the laws of the State of Delaware, has duly caused this Annual Report on Form 10-K to be signed on its behalf by the undersigned, thereunto duly authorized, in the Town of Reston, Commonwealth of Virginia, on the 11th day of December 2007.
LEARNING TREE INTERNATIONAL, INC.
| | |
| By: | | /s/ NICHOLAS R. SCHACHT. |
| Name: | | Nicholas R. Schacht |
| Title: | | President and Chief Executive Officer |
Pursuant to the requirements of the Securities Exchange Act of 1934, as amended, this annual report on Form 10-K has been signed by the following persons on behalf of the registrant and in the capacities and on the dates indicated.
| | | | |
Signature | | Title | | Date |
| | |
/s/ ERIC R. GAREN Eric R. Garen | | Chairman of the Board | | December 11, 2007 |
| | |
/s/ DAVID C. COLLINS, PH.D. David C. Collins, Ph.D. | | Vice Chairman of the Board | | December 11, 2007 |
| | |
/s/ NICHOLAS R. SCHACHT Nicholas R. Schacht | | President and Chief Executive Officer and Director | | December 11, 2007 |
| | |
/s/ CHARLES R. WALDRON Charles R. Waldron | | Chief Financial Officer and Chief Accounting Officer | | December 11, 2007 |
| | |
/s/ W. MATHEW JUECHTER W. Mathew Juechter | | Director | | December 11, 2007 |
| | |
/s/ HOWARD A. BAIN III Howard A. Bain III | | Director | | December 11, 2007 |
| | |
/s/ CURTIS A. HESSLER Curtis A. Hessler | | Director | | December 11, 2007 |
| | |
/s/ STEFAN RIESENFELD Stefan Riesenfeld | | Director | | December 11, 2007 |
| | |
/s/ GEORGE ROBSON George Robson | | Director | | December 11, 2007 |
70
EXHIBIT INDEX
| | |
EXHIBIT
NUMBER. | | DESCRIPTION |
| 3.1 | | Amended and Restated Certificate of Incorporation of the Registrant (i) |
| |
| 3.2 | | By-Laws of the Registrant (i) |
| |
| 4.1 | | Specimen of Common Stock Certificate (i) |
| |
| 10.1 | | Form of Training Advantage Agreement (i) |
| |
| 10.2 | | Employment Agreement dated as of October 1, 2005, between Learning Tree International, Inc. and Nicholas R. Schacht (iii) (vi) |
| |
| 10.3 | | Employment Agreement dated October 1, 2005, between Learning Tree International, Inc. and Magnus Nylund (iii) (vi) |
| |
| 10.4 | | Employment Agreement dated as of April 30, 2007, between Learning Tree International, Inc. and Charles R. Waldron (iii) (viii) |
| |
| 10.5 | | Employment Agreement dated as of August 29, 2007, between Learning Tree International, Inc. and Charles R. Waldron (iii) (ix) |
| |
| 10.6 | | Employment Agreement dated as of October 15, 2007, between Learning Tree International, Inc. and David Booker (iii)(filed herewith) |
| |
| 10.7 | | 1999 Stock Option Plan dated as of January 29, 1999 (iii) (iv) |
| |
| 10.8 | | Learning Tree International, Inc. – 2007 Equity Incentive Plan, (iii)(xiv) |
| |
| 10.9 | | Form of Officers and Directors Indemnification Agreement (ii) (iii) |
| |
| 10.10 | | Written description of oral agreement between Dr. David C. Collins and Learning Tree International, Inc. (iii) (iv) |
| |
| 10.11 | | Learning Tree International, Inc. – Guarantee and Rent Deposit with Learning Tree International, Limited and Courtland Developments Limited (x) |
| |
| 10.12 | | Learning Tree International USA, Inc. – First amendment to Leasing Agreement with PRIM 1801 Rockville Pike, LLC (xi) |
| |
| 10.13 | | Learning Tree International Limited – Facility Sublease With Westinghouse Brake And Signal Holding Limited (xii) |
| |
| 10.14 | | Learning Tree International USA, Inc. – Facility lease agreement with Caryle-Lane-CFRI Venture II, LLC for Alexandria, VA Education Center (xiii) |
| |
| 14.1 | | Learning Tree International Code of Business Conduct and Ethics (vii) |
| |
| 21.1 | | Subsidiaries of the Registrant (ix) |
| |
| 23.1 | | Consent of BDO Seidman, LLP Independent Registered Public Accounting Firm (filed herewith) |
| |
| 23.2 | | Consent of Ernst & Young LLP, Independent Registered Public Accounting Firm (filed herewith) |
| |
| 31.1 | | Section 302 Certification of Chief Executive Officer (filed herewith) |
| |
| 31.2 | | Section 302 Certification of Chief Financial Officer (filed herewith) |
| |
| 32.1 | | Section 906 Certification of Chief Executive Officer and President (filed herewith) |
| |
| 32.2 | | Section 906 Certification of Chief Financial Officer (filed herewith) |
71
| | |
| (i) | | Incorporated by reference to the Registrant’s Registration Statement on Form S-1. File No. 33-97842. |
| |
| (ii) | | Incorporated by reference to the Registrant’s Annual Report on Form 10-K for the fiscal year ended October 1, 2004. |
| |
| (iii) | | Management compensatory arrangements required to be filed pursuant to Item 15(c). |
| |
| (iv) | | Incorporated by reference to the Registrant’s Annual Report on Form 10-K for the fiscal year ended September 30, 2005. |
| |
| (v) | | Incorporated by reference to the Registrant’s Form DEF 14A filed on January 29, 1999. |
| |
| (vi) | | Incorporated by reference to the Registrant’s Form 8-K filed on October 3, 2005. |
| |
| (vii) | | Incorporated by reference to the Registrant’s Quarterly Report on Form 10-Q for the three months ended December 30, 2005. |
| |
| (viii) | | Incorporated by reference to the Registrant’s Form 8-K filed on May 4, 2007. |
| |
| (ix) | | Incorporated by reference to the Registrant’s Form 8-K filed on August 29, 2007. |
| |
| (x) | | Incorporated herein by reference to the Registrant’s Annual Report on Form 10-K for the fiscal year ended September 29, 2006. |
| |
| (xi) | | Incorporated herein by reference to the Registrant’s Form 8-K filed on March 1, 2007. |
| |
| (xii) | | Incorporated herein by reference to the Registrant’s Form 8-K filed on March 23, 2007. |
| |
| (xiii) | | Incorporated herein by reference to the Registrant’s Form 8-K filed on May 4, 2007. |
| |
| (xiv) | | Incorporated herein by reference to the Registrant’s Form DEF 14A filed on January 29, 2007. |
72