QuickLinks -- Click here to rapidly navigate through this document
UNITED STATES
SECURITIES AND EXCHANGE COMMISSION
Washington, D.C. 20549
FORM 10-K
| ý | Annual report pursuant to Section 13 or 15(d) of the Securities Exchange Act of 1934 |
| For the fiscal year ended December 31, 2007 |
| or |
| o | Transition report pursuant to Section 13 or 15(d) of the Securities Exchange Act of 1934 |
For the transition period from to
Commission file number:0-26994
ADVENT SOFTWARE, INC.
(Exact name of registrant as specified in its charter)
| Delaware | | 94-2901952 |
(State or other jurisdiction of
incorporation or organization) | | (IRS Employer Identification Number) |
600 Townsend Street, San Francisco, California 94103
(Address of principal executive offices and zip code)
(415) 543-7696
(Registrant's telephone number, including area code)
Securities registered pursuant to Section 12(b) of the Act:
Title of Each Class
| | Name of Each Exchange on Which Registered
|
|---|
| Common Stock, par value $0.01 per share | | The NASDAQ Stock Market LLC (NASDAQ Global Select) |
Securities registered pursuant to Section 12(g) of the Act:None
Indicate by check mark if the registrant is a well-known seasoned issuer, as defined in Rule 405 of the Securities Act. Yeso Noý
Indicate by check mark if the registrant is not required to file reports pursuant to Section 13 or Section 15(d) of the Exchange Act. Yeso Noý
Indicate by check mark whether the registrant (1) has filed all reports required to be filed by Section 13 or 15(d) of the Securities Exchange Act of 1934 (the "Exchange Act") during the preceding 12 months (or for such shorter period that the registrant was required to file such reports), and (2) has been subject to such filing requirements for the past 90 days. Yesý Noo
Indicate by check mark if disclosure of delinquent filers pursuant to Item 405 of Regulation S-K is not contained herein, and will not be contained, to the best of registrant's knowledge, in definitive proxy or information statements incorporated by reference in Part III of this Form 10-K or any amendment to this Form 10-K.ý
Indicate by check mark whether the registrant is a large accelerated filer, an accelerated filer, a non-accelerated filer, or a small reporting company. See the definitions of "large accelerated filer," "accelerated filer" and "small reporting company" in Rule 12b-2 of the Exchange Act.
| Large accelerated filero | | Accelerated filerý | | Non-accelerated filero
(Do not check if a smaller reporting company) | | Smaller reporting companyo |
Indicate by check mark whether the registrant is a shell company (as defined in Rule 12b-2 of the Exchange Act). Yeso Noý
The number of shares of the registrant's common stock outstanding as of June 30, 2007 was 25,625,647. The aggregate market value of the registrant's common stock held by non-affiliates, based upon the closing price on June 30, 2007, as reported on the NASDAQ National Market System, was approximately $275 million. Shares of common stock held by each officer and director and by each person who owns 5% or more of the outstanding common stock have been excluded in that such persons may be deemed to be affiliates. This determination of affiliate status is not necessarily a conclusive determination for other purposes. As of February 29, 2008, there were 26,606,550 shares of the registrant's common stock outstanding.
DOCUMENTS INCORPORATED BY REFERENCE
Portions of the Registrants definitive Proxy Statement for the Annual Meeting of Stockholders to be held May 7, 2008 are incorporated by reference into Part III of this Annual Report on Form 10-K to the extent stated herein. Except with respect to information specifically incorporated by reference in this Form 10-K, the Proxy Statement is not deemed to be filed as part herein.
TABLE OF CONTENTS
| PART I | | |
| | Item 1. | | Business | | 4 |
| | Item 1A. | | Risk Factors | | 16 |
| | Item 1B. | | Unresolved Staff Comments | | 29 |
| | Item 2. | | Properties | | 29 |
| | Item 3. | | Legal Proceedings | | 30 |
| | Item 4. | | Submission of Matters to a Vote of Security Holders | | 30 |
PART II |
|
|
|
|
| | Item 5. | | Market for Registrant's Common Equity, Related Stockholder Matters and Issuer Purchases of Equity Securities | | 31 |
| | Item 6. | | Selected Financial Data | | 34 |
| | Item 7. | | Management's Discussion and Analysis of Financial Condition and Results of Operations | | 35 |
| | Item 7A. | | Quantitative and Qualitative Disclosures About Market Risk | | 66 |
| | Item 8. | | Financial Statements and Supplementary Data | | 68 |
| | Item 9. | | Changes in and Disagreements with Accountants on Accounting and Financial Disclosures | | 116 |
| | Item 9A. | | Controls and Procedures | | 116 |
| | Item 9B. | | Other Information | | 116 |
PART III |
|
|
|
|
| | Item 10. | | Directors, Executive Officers and Corporate Governance | | 117 |
| | Item 11. | | Executive Compensation | | 117 |
| | Item 12. | | Security Ownership of Certain Beneficial Owners and Management and Related Stockholder Matters | | 117 |
| | Item 13. | | Certain Relationships and Related Transactions, and Director Independence | | 118 |
| | Item 14. | | Principal Accounting Fees and Services | | 118 |
PART IV |
|
|
|
|
| | Item 15. | | Exhibits and Financial Statement Schedules | | 119 |
2
SPECIAL NOTE REGARDING FORWARD-LOOKING STATEMENTS
You should read the following discussion in conjunction with our consolidated financial statements and related notes. The following discussion contains forward-looking statements within the meaning of Section 27A of the Securities Act of 1933 as amended and Section 21E of the Securities Exchange Act of 1934 as amended, including, but not limited to, statements referencing our expectations relating to future revenues, expenses and operating margins. Forward-looking statements can be identified by the use of terminology such as "may," "will," "should," "expect," "plan," "anticipate," "believe," "estimate," "predict," "potential," "continue" or other similar terms and the negative of such terms regarding beliefs, plans, expectations or intentions regarding the future. Forward-looking statements include, among others, statements regarding growth in the investment management market and opportunities for us related thereto, future expansion, acquisition, divestment of or investment in other businesses, projections of revenues, future cost and expense levels, expected timing and amount of amortization expenses related to past acquisitions, the adequacy of resources to meet future cash requirements, estimates or predictions of actions by customers, suppliers, competitors or regulatory authorities, future client wins, future hiring and future product introductions. Such forward-looking statements are based on our current plans and expectations and involve known and unknown risks and uncertainties which may cause our actual results or performance to be materially different from any results or performance expressed or implied by such forward-looking statements. Such factors include, but are not limited to, the "Risk Factors" set forth in "Item 1A. Risk Factors" in this Form 10-K, as well as other risks identified from time to time in other Securities and Exchange Commission ("SEC") reports. You should not place undue reliance on our forward-looking statements, as they are not guarantees of future results, levels of activity or performance and represent our expectations only as of the date they are made.
Unless expressly stated or the context otherwise requires, the terms "we," "our," "us," the "Company" and "Advent" refer to Advent Software, Inc. and its subsidiaries.
3
PART I
Item 1. Business
Overview
Advent Software, Inc. was founded and incorporated in 1983 in California and reincorporated in Delaware in November 1995. We offer integrated software solutions for automating and integrating data and work flows across investment management organizations, as well as the information flows between the investment management organization and external parties. Our products are intended to increase operational efficiency, improve the accuracy of client information and enable better decision-making. Each solution focuses on specific mission-critical functions of the investment management organization and is tailored to meet the needs of the particular client, as determined by size, assets under management and complexity of the investment environment.
Our business is organized into two reportable segments, Advent Investment Management and MicroEdge. Advent Investment Management is our core business and derives revenues from the development, marketing and sale of software products, data interfaces and related maintenance and services that automate, integrate and support certain mission-critical functions of investment management organizations in the United States, Europe, Middle East and Africa. MicroEdge derives revenues from the sale of software and services for grant management, matching gifts and volunteer tracking for the grantmaking community in the United States and United Kingdom. For additional information regarding our reportable segments and geographic areas, see Note 13, "Segment and Geographical Information", to our consolidated financial statements.
Our principal executive offices are located at 600 Townsend Street, San Francisco, California 94103, and our telephone number is (415) 543-7696. Our internet address iswww.advent.com. On our Investor Relations web site, which is accessible throughwww.advent.com, we post the following filings as soon as reasonably practicable after they are electronically filed with or furnished to the Securities and Exchange Commission: our annual reports on Form 10-K, our quarterly reports on Form 10-Q, our current reports on Form 8-K and any amendments to those reports. All such filings on our Investor Relations web site are available free of charge. Information contained or referenced on our website is not incorporated by reference in and does not form a part of this Annual Report on Form 10-K. The SEC maintains an internet site atwww.sec.gov that contains reports, proxy and information statements, and other information regarding issuers that file electronically with the SEC. The public may also read and copy any materials we file with the SEC at the SEC's Public Reference Room at 100 F Street, NE, Washington DC, 20549. The public may obtain information on the operation of the Public Reference Room by calling the SEC at 1-800-SEC-0330.
Advent's common stock (ticker symbol: ADVS) has traded on the NASDAQ Stock Market since its initial public offering on November 15, 1995. Our fiscal year ends on December 31st.
Our Industry and Clients
Advent's core clients are institutions that manage, advise and perform recordkeeping functions on financial assets. Examples of these institutions include global and US-based asset managers, registered investment advisors, prime brokers, fund administrators, hedge funds, family offices and banks and trusts. Our MicroEdge clients include corporations, public funds, foundations, universities and non-profit organizations that perform related portfolio management functions. We have a diverse client base ranging from small clients to some of the largest institutional clients in the world. In fiscal 2007, 2006 and 2005, no single customer accounted for more than 10% of our total net revenues. Geographically, though the US continues to represent our primary market, international sales have grown by 20% and 19% in 2007 and 2006, respectively.
4
The past ten years have seen a transformation in the global investment management landscape. There have been fundamental and rapid changes that include: global wealth creation that has driven steady growth of traditional assets under management and the increase of assets managed in alternative strategies; the creation of increasingly complex securities instruments used by the hedge funds and in alternative strategies; significant increase in cross border flows and global investment activity; and the evolution and maturation of electronic markets. All of these factors have created opportunities for our investment manager clients, but they have also resulted in substantially increased complexity in their operations and processes. We believe that investment managers have clear needs that translate into demand for Advent solutions: portfolio accounting and analysis; trade order management and post-trade processing, account management and ever-increasing requirements to comply with evolving industry standards and government regulations.
As we enter 2008, we note a number of trends that we expect to affect the investment management industry:
- •
- Continued turmoil in the credit markets and volatility in financial markets;
- •
- Expanding and increasing efforts by European investment managers to comply with MiFID—The Markets in Financial Instruments Directive—which went into effect November 1, 2007 and is driving strategic technology changes to support requirements for best execution, trading transparency and other measures for investor protection;
- •
- Increased scrutiny of fees and motivation to maximize investment performance relative to common indices ("search for Alpha") forcing global investment managers to better differentiate their additional value through client service and improved performance analysis tools;
- •
- Increased demands from regulators and institutional investors for more sophisticated reporting and operational transparency; and
- •
- Steady growth of investment management firms and sovereign wealth funds in the Middle East and Asia driving demand for investment management technology and services.
These trends have increased the volume and complexity of information and data flows both within investment management organizations and between these organizations and third parties, such as brokerage firms, clients, custodians, banks, pricing services and other data providers. Consequently, in order to operate more efficiently, investment management organizations continue to automate and integrate their mission-critical and labor-intensive functions, including: (i) investment decision support; (ii) trade order management and compliance; (iii) portfolio accounting, performance measurement and report generation; (iv) client relationship management; and (v) straight through processing that includes connectivity and data integration. Investment management organizations historically have relied on internally-developed systems, third-party systems, outsourced services or spreadsheet-based systems to manage these information flows. Investment management organizations are demanding highly functional, easy-to-use, scalable, flexible and cost-effective software applications. Because the primary mission of our customers is to manage money for their own clients effectively and efficiently, we find more and more institutions that seek to streamline their operations, including decreasing the complexity that results from having multiple technology vendor relationships. We believe this streamlining of operations is a trend that will continue, meaning the marketplace will continue to recognize the value the integrated suite of products that Advent offers.
Seasonality
We experience seasonality in our licensing. We believe that this seasonality results primarily from customer budgeting cycles and the annual nature of some Assets Under Administration (AUA) contracts, and expect this seasonality to continue in the future. The fourth quarter of the year typically has more licensing activity. That can result in term license bookings and perpetual license fee revenue
5
being the highest in the fourth quarter, followed by lower bookings and perpetual license revenue in the first quarter of the following year. We expect the impact of this seasonality will continue to decrease in the future as we move more of our licenses to a term model, under which we generally recognize revenue from term licenses ratably over the period of the contract term which is typically three years.
For additional information regarding factors that affect the timing of the recognition of software license revenue, see "Management's Discussion and Analysis of Financial Condition and Results of Operations / Critical Accounting Policies and Estimates / Revenue Recognition."
Strategy
Mission
Our mission is to strengthen and grow our business as a leading provider of mission-critical products and services for the investment management industry.
Customer Focus
At December 31, 2007, we served more than 4,500 customers. Our customers, and the investment management industry as a whole, generally face a tightening regulatory environment, growth in the volume and complexity of their trading activities, an increase in alternative investment markets, and increasing globalization of the investment marketplace. We are committed to making the required investments in product development to continue delivering mission-critical solutions to our customers as their needs evolve.
We plan to strengthen our core business by:
- •
- Continuing to migrate our largest and most complex Axys customers to Advent Portfolio Exchange ("APX") or Geneva;
- •
- Enhancing our solution "footprint" to help our customers across their mission-critical business process;
- •
- Continuing our rapid product refresh cycle; and
- •
- Delivering high quality services and support that ensure our customers' satisfaction and success.
We are experiencing continued loyalty from our customers in the length of time they use our products and their license and maintenance renewals. Our customers use our products for an average of over 10 years. Our blended term license and perpetual maintenance renewal rate, which we report one quarter in arrears, was 90% for the third quarter of 2007.
We plan to grow our core business by:
- •
- Enhancing our core portfolio accounting and trade order management applications to capitalize on new market opportunities developing from growth in alternative investment and international markets;
- •
- Increasing our addressable market by delivering new solutions which will enable investment managers to automate certain aspects of compliance, performance attribution, analysis, reconciliation and billing; and
- •
- Expanding our geographic footprint and our international presence.
We believe our strategy and customer focus are driving increasing market acceptance for our products. We added 109 new APX clients and 55 new Geneva clients during fiscal 2007.
6
The current turmoil in the credit markets and volatility in financial markets may create pressure on our clients to decrease their information technology budgets, which could negatively impact our business. While we are not immune to downturns in technology spending, should our customers reduce their spending, we believe we are well positioned to maintain our competitive position in the longer term for the following reasons. First, our portfolio accounting, trade order management, and compliance software is mission critical to our customers. Second, our technology can be utilized to increase operational efficiency. Third, as a market leader in investment management technology, we expect the customers who spend money will attempt to minimize risk and therefore, look to our stability, reliability and scalability. Finally, we believe our recurring revenue model and large customer base will continue to provide longer term stability.
Business Model
We continue to transition our business to a term license model. Under this model, customers purchase a license to use our software for a fixed period of time and we recognize the license revenue ratably over the length of the contract. Conversely, under a perpetual pricing model, customers purchase a license to use our software indefinitely and we recognize all license revenue at the time of sale. Although the term license model has the effect of lowering license revenues compared to a perpetual model in its early periods, we believe the term license business model will increase the total potential value of our customer relationships because our customer focus, customer base and the market acceptance of our products results in a long customer relationship. We believe that a term license business model will ultimately provide growing and more predictable revenue streams. At December 31, 2007, we believe we are well over halfway through our four- to five-year transition to the term business model. However, our perpetual license customers continue to buy additional software, which is typically recognized as perpetual license revenue.
In addition to our term license transition, we continue to be focused on growing our recurring revenues. Total recurring revenues, which we define as term license, perpetual maintenance, and other recurring revenues, have increased from 75% of total net revenues in 2006 to 77% in 2007, and we expect them to increase in future years. These recurring revenue sources provide us with increased ability to make strategic decisions to invest in our business while remaining confident that our operating results will be predictable.
In 2008, we plan to continue to invest in client support, product development, professional services and sales and marketing in order to solidify our position as a market leader. Our investment in client support will enable us to continue to improve the services we provide to our clients in their day-to-day use of our software and build a scalable organization to support our largest and most complex customers. Our investments in product development are designed to enable us to develop new products as well as maintain our rapid enhancements and upgrades to our existing products. Our investment in professional services are intended to support the additional bookings from 2007 as well as those expected in 2008.
Overall, while we expect to continue to invest to support our growth, we plan to improve our operating margins in 2008. In the longer term, we believe that our market leadership position and our predictable term license revenue model will enable us to achieve operating margins in the 20% range.
Products and Services
Advent products are intended to automate those mission-critical functions in the investment management process that will increase operational efficiency, facilitate timely regulatory compliance, improve the accuracy of client information and enable better decision-making. Each product focuses on the specific functions of an investment management organization and pricing, for the most part, is determined by size of the implementation and assets under management.
7
We offer solutions for customers in numerous markets, which include:
- •
- Advent® for Asset Managers
- •
- Advent® for Global Asset Managers
- •
- Advent® for Hedge Fund Managers
- •
- Advent® for Fund Administrators
- •
- Advent® for Banks and Trusts
- •
- Advent® for Family Offices
- •
- Advent® for Financial Advisors
These solutions are comprised of various combinations of Advent software products, data integration tools and professional services all aimed at solving our clients' critical business needs.
Software Products
- •
- Geneva® is a global investment management platform designed to meet the real-time needs of global asset managers, hedge funds, and hedge fund service providers with complex, international accounting requirements and/or wide instrument coverage needs, including alternative investments such as exchange-traded and over-the-counter (OTC) derivatives. Clients currently include hedge funds, institutional asset managers, prime brokers, and fund administrators. Geneva offers feature-rich accounting, flexible reporting (including profit and loss reporting by strategy) and sophisticated multi-currency capabilities. Geneva delivers the industry's only "main memory" database system, offering more accurate and flexible reporting, and eliminating batch processing and time-consuming error corrections. Geneva also unifies the general ledger and portfolio sub-ledgers, for real-time reporting and seamless, automated reconciliation. Geneva features unmatched throughput for high trading volume across multiple instruments and currencies; fast, flexible, accurate reporting capabilities and real-time information access; rapid, global error correction and instant updating throughout the system; and scalability to help firms increase asset and trade volumes, without adding headcount.
- •
- Advent Portfolio Exchange® (APX) is Advent's next-generation portfolio management and reporting system that fully integrates the front-office functions of prospecting, marketing, customer relationship management and performance analytics with the back-office operations of portfolio accounting and reporting. APX is an enterprise solution that offers a migration path for Advent's Axys clients and enables firms to manage a full range of instruments including domestic and international equities, mutual funds, fixed income, equity options and derivatives, and variable rate securities. APX leverages a single SQL database to deliver client and prospect information to operations, marketing and portfolio managers through a browser-based user interface. APX also offers built-in performance analytics, which includes performance attribution, contribution and ex-post risk statistics, to provide users with the opportunity to deliver robust reporting and client service without increasing operational costs or overhead. APX supports both institutional and high-net-worth individual portfolios and separate accounts, and offers integrated multi-currency capabilities.
- •
- Axys® is a portfolio management and reporting system for investment management organizations of all sizes. Axys provides investment professionals with broad portfolio accounting functionality, timely decision support, sophisticated performance measurement and flexible reporting. Clients can record, account for and report on a variety of investment instruments, including equities, fixed income, mutual funds and cash. Axys users gain access on demand to portfolio holdings, asset allocation, realized and unrealized gains and losses, actual and projected income and other
8
valuable data. Portfolio performance can be measured for individual portfolios or related groups, and for any specified time period. In addition, clients can easily generate fully customized reports with the assistance of Report Writer Pro. Axys offers integrated multi-currency capabilities which, among other things, allow reports to be restated in any currency, tracks reclaimable foreign withholding tax and can identify components of return attributable to market prices versus currency rate fluctuations.
- •
- Advent Revenue Center® provides asset managers with a solution that automates complex billing processes, from fee creation to accounts-receivable management. This solution integrates seamlessly with Advent's proven suite and not only reduces billing errors, but improves management's insight into the firm's revenue base. It has a rules-based billing structure approach that makes it extremely flexible in handling unique billing structures, supporting complex workflows, and generating both client and audit/management reporting. With its flexible rules-based architecture, firms can deliver superior customer service, profitably, even as their businesses grow in complexity. The product is built with SQL 2005, SQL Reporting Services and .NET technology.
- •
- Moxy® automates and streamlines the trading and order management process of partial and complete executions and allows the user to send allocation results using OASYS, an external electronic allocation system, to communicate allocations to brokers electronically. Moxy also provides internet-ready electronic order routing based on the industry standard FIX messaging protocol so that Moxy users can route trades electronically to any FIX-compliant broker or crossing network that supports the internet or other TCP/IP connections. Trades are executed, processed, settled and accounted for without manual intervention. Through its streamlined integration with Advent's industry-leading portfolio management platforms (Advent Portfolio Exchange, Geneva and Axys), Moxy enables true internal and external straight through processing (STP) and brings together mission-critical functions across investment management organizations. Moxy® is built on a new multi-tiered architecture that leverages MSFT SQL 2005 and .NET technology.
- •
- Advent Partner® is a single source solution for onshore and offshore investor accounting and servicing. It integrates with Axys, APX and Geneva. This product is specifically designed for hedge funds, family offices, fund administrators, and accounting firms that face the complex and time-consuming task of consistently and accurately accounting for and reporting on investor contributions and redemptions, capital gain/loss and income allocations, and management incentive fees. In addition, Advent Partner provides comprehensive economic and tax allocation reporting and streamlines the production of US K-1 partnership tax returns.
- •
- Advent Rules Manager® is a tightly integrated solution that meets investment management firms' increasingly complex trading compliance and portfolio monitoring requirements. Advent Rules Manager is a rules-based system that enables firms to easily and accurately define their trading and portfolio policies, and automate their control and review. Automated record keeping and easy reporting save time and eliminate the cost of hiring additional resources. Firms can efficiently manage portfolios, trading, compliance workflow, and safeguard their client commitments. Putting policies into practice, firms strengthen their competitive advantages and are able to attract and retain institutional clients. Advent Rules Manager helps firms record, test and compare their compliance practices against their policies, demonstrating that their compliance program is managed proactively.
- •
- Qube® is designed to help securities professionals develop and improve client relationships by automating scheduling, tracking client communications and managing client data. Qube, whose functionality is included in APX, integrates with portfolio information in Axys and enables
9
10
Grantmaking Community and Non-profit Organizations
Our MicroEdge segment, a leading provider of information technology solutions to the grantmaking community, provides the following products:
Due to the mission-critical nature of our products, almost all of our perpetual license clients purchase support and maintenance (term license clients receive support and maintenance as part of the license offering), which entitles them to technical support through Advent's Client Services group and product upgrades as they become available. We continually upgrade and enhance our products to respond to changing market needs, evolving regulatory requirements and new technologies.
We offer a tiered support structure to meet the diverse needs of our client base. Advent's services are scalable, which means that they adapt to meet the specific needs of a firm no matter how large or small.
In November 2007, our Investment Management Group's client support organization achieved certification under the Service Capability and Performance (SCP) Support Standard for the third consecutive year. We are the only company in the financial services software industry to earn this recognition.
Professional services consist of consulting, project management, implementation and integration services, custom report writing, and training. Many of Advent's clients purchase professional services from us to support their implementations, assist in the conversion of their historical data and provide ongoing training and education. Professional services may be required for as little as a few days or up to several months for large implementations. We believe that these services facilitate a client's early success with our products, strengthen the client relationship and generate valuable feedback for our product development group.
11
Our Alliance Program is designed to benefit our clients and our partners. The program provides a means by which partners can develop, promote, and sell their products, services, and solutions in conjunction with our solutions. Advent's Alliance Program was created to further extend our product and service offerings.
Sales and Marketing
We primarily license and sell Advent products and services through four sales groups, which are organized by product and customer type and include a direct sales organization (comprised of both field sales and telesales representatives) as well as product marketing and product management groups, which are responsible for assessing market opportunities and collaborating with our product development organization on product planning and management. Product marketing coordinates our market validation process, through which we interview existing clients and sales prospects, and gather information to define scope, features and functionality of new products and product upgrades. The sales groups are as follows:
- •
- Global Accounts, selling solutions based on Geneva, Moxy, Partner and Advent Custodial Data including associated services, into the prime broker, hedge fund, fund administrator and global asset management markets;
- •
- Investment Management Group, selling solutions based on APX, Axys, Moxy, Advent Revenue Center, Advent Rules Manager, Qube, Rex and other associated products and services into asset managers, banks and trusts, hedge funds, family offices and financial advisors;
- •
- Straight Through Processing (STP) Group, selling solutions for connectivity, data integration and outsourcing based on Advent Custodial Data, Advent Corporate Actions, Advent Back Office Service (ABOS), Advent Wealth Service and other associated products and services into the asset management, banks and trusts, hedge funds, family offices and financial advisors markets; and,
- •
- Grantmaking, Community and Non-profit Organizations, selling Gifts, FIMS and FoundationPower products and associated services.
We have sales offices throughout the United States, Europe and Middle East regions, including San Francisco, New York, Boston, London, Oslo, Copenhagen, Stockholm, Amsterdam, Zurich and Dubai.
Our corporate marketing organization is responsible for providing support to the sales organization through lead generation activities, sales training, marketing materials, and the provision of marketing events, such as conferences and seminars.
Product Development
In fiscal 2007, 2006 and 2005, our product development expenses were $41.9 million, $34.9 million and $30.4 million, respectively. We also capitalized $3.3 million, $1.5 million and $1.5 million of software development costs in 2007, 2006 and 2005, respectively. Our product development organization builds product enhancements and new products, incorporates new technologies into existing products and sustains the quality of our current products. Our product development activities include the identification and validation of product specifications as well as engineering, quality assurance and documentation.
Our new products and product upgrades require varying degrees of development time, depending upon the complexity of the accounting requirements and securities regulations which they are intended to address, as well as the number and type of features incorporated. To date, we have generally relied
12
upon internal development for our products. We have in the past acquired, and may again in the future acquire, additional technologies or products from third parties. For example, in November 2007, we acquired a provider of a web-based platform to help companies manage their corporate community involvement and in December 2006, we acquired a developer of investment billing solutions to integrate their product into our software offerings. We intend to continue to support industry standard operating environments, architectures and network protocols.
Unfilled License Orders, Deferred Revenues and Backlog
Unfilled license orders represent license orders that have been received from our customers for the license of our software products but have not been shipped as of the end of the applicable fiscal period. We do not believe that unfilled license orders are a consistent or reliable indicator of future results. Our customers generally do not cancel orders for our software products. Unfilled license orders as of December 31, 2007 totaled $1.8 million, compared to $55,000 at December 31, 2006.
Total deferred revenue includes deferred perpetual license, term license, maintenance and services. Deferred perpetual license revenue is recognized when a contingency, such as a future product deliverable committed in the contract, is removed. Deferred term license revenue is generally recognized over the contact length. Deferred maintenance revenue is generally recognized over the service period, which is typically twelve months. Deferred professional services revenue is either recognized over the period the specific services are rendered, or over the related contract period when sold in conjunction with a multi-year term license.
During 2007, we continued our transition from selling mostly perpetual licenses to mostly term licenses. We believe that moving to a term license model will increase the value over the long-term of each customer relationship and improve the predictability of our revenues. We generally recognize revenue from term licenses ratably over the period of the contract term which varies from one to five years but is typically three years. For these term contracts, we invoice the customer annually in advance. As a result, the first year's contract value is included in deferred revenue while subsequent years of the contracted value are not (unless the subsequent years are prepaid by the client, which is typically not the case). During the subsequent years, annual term billing results in an increase in deferred revenues at the commencement of each annual billing period. Total deferred revenue was $120.3 million and $85.3 million at December 31, 2007 and 2006, respectively.
We define backlog as the value of multi-year term license contracts which contain a binding commitment for the full contract term, less any amounts from those contracts already invoiced. We exclude from the backlog calculation any contracts which contain annual renewal options (for example, annual maintenance or data reconciliation contracts). Our total backlog was approximately $72.8 million and $43.2 million as of December 31, 2007 and 2006.
For additional information regarding factors that affect the timing of the recognition of software license revenue, see "Management's Discussion and Analysis of Financial Condition and Results of Operations—Critical Accounting Policies and Estimates—Revenue Recognition."
Competition
The market for investment management software is characterized by the relative size of the organizations that manage and advise on investment portfolios. The market is competitive and highly fragmented. It is subject to rapid change and is sensitive to new product introductions and marketing efforts by industry participants. Competitors vary in size, scope of services offered and platforms supported. Our largest single source of competition is from proprietary systems used by our existing and potential clients, some of whom develop their own software for their particular needs and therefore may be reluctant to license software products offered by third party vendors such as Advent. We also face significant competition from other providers of software and related services as well as
13
providers of outsourced services such as Blackbaud, Charles River Development, the Checkfree APL subsidiary of Fiserv, DST International, the Eagle Investment Systems subsidiary of Mellon Financial Corporation, the Eze Castle Software subsidiary of BNY ConvergEx Group, FT Interactive Data, the IBSI division of SunGard, INDATA, Kintera, the LatentZero division of Fidessa group plc, Linedata Services, the Macgregor division of Investment Technology Group, the PORTIA division of Thomson Financial, Schwab Performance Technologies, SimCorp A/S and SS&C Technologies. Many of our largest competitors have longer operating histories and greater financial, technical, sales and marketing resources than we do, due, in part to a wave of consolidation that has occurred in our markets. In 2005, 2006 and 2007, many of our competitors were acquired, and it is possible that even larger companies will be created through additional acquisitions of companies and technologies. We believe that Advent competes effectively in terms of the most predominant competitive differentiators, which include product performance and functionality, ease of use, scalability, ability to integrate external data sources, product and company reputation, client service and price.
Intellectual Property and Other Proprietary Rights
Our success depends significantly upon our proprietary technology. We currently rely on a combination of copyright, trademark, patent and trade secret law, as well confidentiality procedures and contractual provisions to protect our proprietary rights. We have registered trademarks and copyrights for many of our products and services and will continue to evaluate the registration of additional trademarks and copyrights as appropriate. We generally enter into confidentiality agreements with our employees, customers, resellers, vendors and others. We seek to protect our software, documentation and other written materials under trade secret and copyright laws. Despite these efforts, existing intellectual property laws may afford only limited protection. In addition, it may be possible for unauthorized third parties to copy certain portions of our products or to reverse engineer or otherwise obtain and use our proprietary information. In addition, we cannot be certain that others will not develop or acquire substantially equivalent or superseding proprietary technology, equivalent or better products will not be marketed in competition with our products, or others may not design around any patent that may be issued to us or other intellectual property rights of ours, thereby substantially reducing the value of our proprietary rights. We cannot be sure that we will develop proprietary products or technologies that are patentable, that any patent, if issued, would provide us with any competitive advantages or would not be challenged by third parties, or that the patents of others will not adversely affect our ability to do business. Despite our efforts to protect our proprietary rights, unauthorized parties may attempt to copy aspects of our products or to obtain and use information that we regard as proprietary. In addition, the laws of some foreign countries do not protect proprietary rights to as great an extent as do the laws of the United States. Litigation may be necessary to protect our proprietary technology which may be time-consuming and expensive, with no assurance of success. As a result, we cannot be sure that our means of protecting our proprietary rights will be adequate.
Employees
As of December 31, 2007, we had 946 employees, including approximately 392 in client services and support, 172 in sales and marketing, 224 in product development and 158 in general and administration. Of these employees, 872 were located in the United States and 74 were based in Europe and the Middle East. We endeavor to maintain competitive compensation, benefits, equity participation and work environment policies in order to attract and retain qualified personnel. None of our employees are represented by a labor union. We have not experienced any work stoppages and we believe our employee relations are good.
14
Executive Officers of Registrant
The following sets forth certain information regarding the executive officers of the Company as of March 1, 2008:
Name
| | Age
| | Position
|
|---|
| Stephanie G. DiMarco | | 50 | | Chief Executive Officer and President |
| Lily S. Chang | | 59 | | Executive Vice President and Chief Technology Officer |
| Craig B. Collins | | 52 | | Chief Financial Officer designate |
| Peter P.F. Hess Jr. | | 37 | | Executive Vice President and General Manager |
| John P. Brennan | | 51 | | Vice President, Human Resources |
Ms. DiMarco founded Advent in June 1983. She served as Chairman of the Board from November 1995 until December 2003. Ms. DiMarco currently serves as Chief Executive Officer and President since her permanent appointment to the position in December 2003, after serving on an interim basis from May 2003. Previously, she had served as President since founding Advent until April 1997 and as Chief Executive Officer until November 1999. She is a former member of the Board of Trustees of the UC Berkeley Foundation, serves on the Advisory Board of the College of Engineering at the University of California, Berkeley, and is a San Francisco Foundation board member and Chairman of its Investment Committee and former member of the Audit Committee. Ms. DiMarco holds a B.S. in Business Administration from the University of California at Berkeley.
Ms. Chang joined Advent in May 1993 as Vice President, Technology. In April 1997, Ms. Chang was promoted to Executive Vice President, Technology and was also named Chief Technology Officer. From July 1989 to May 1993, Ms. Chang held various positions, including Vice President, Strategic Accounts and Vice President of Oracle Financial Applications, for Oracle Corporation. Ms. Chang holds a B.S. in Biochemistry from Taiwan University.
Mr. Collins joined Advent in December 2007 as Chief Financial Officer (CFO) designate. From 2005 to 2007, Mr. Collins served as Executive Vice President and CFO at IronPort Systems, an email and web security products provider acquired by Cisco Systems in 2007. Before IronPort, Mr. Collins was Executive Vice President of Corporate Development and CFO at Brio Software, a business intelligence software company, from 2002 to 2003, which was acquired by Hyperion Systems (now part of Oracle). Prior to that, Mr. Collins was Executive Vice President and CFO of CoSine Communications. Prior to that, Mr. Collins served as Vice President and CFO of Optical Coating Laboratory, which was acquired by JDS Uniphase. Mr. Collins also spent 18 years at Hills Bros. Coffee/Nestle Beverage Co., where he served as Senior Vice President of Finance, Chief Information Officer and held several other positions in finance and information technology. Mr. Collins holds a M.S. in Business Administration, Public Administration and Quantitative Methods and a B.A. in Marketing and Quantitative Methods from the University of Oregon.
Mr. Hess joined Advent in 1994. Since February 2007, Mr. Hess has been responsible for our Investment Management Group and has global responsibility for strategy, product marketing, sales, services and support of Advent solutions for asset managers, banks and trusts, hedge funds, family offices and financial advisors generally with assets under management between $100 million to $50 billion. From May 2004 to February 2007, Mr. Hess served as Executive Vice President and General Manager of our Global Accounts group. In this role, Mr. Hess had global responsibility for strategy, product marketing, sales, services, and support of Advent solutions for the asset management industry's largest firms. Mr. Hess has held a variety of other positions in the company including Vice President of Sales and Vice President of Marketing. He also has operating responsibility for Advent's Europe, Middle East and Africa ("EMEA") operations. Mr. Hess holds a B.A. from Princeton University.
15
Mr. Brennan joined Advent in March 2004 as Vice President of Human Resources and is responsible for all aspects of Human Resources. Prior to joining Advent, Mr. Brennan was Vice President of Human Resources from 1999 to 2004 for Wind River Systems, which produces embedded software for various consumer and industrial applications. Prior to Wind River, Mr. Brennan held various positions at Visa International from 1991 to 1999. Mr. Brennan began his Human Resources career with assignments at Westinghouse Electric Company and Pacific Gas and Electric. Mr. Brennan has a master's degree in Industrial and Labor Relations from Cornell University, and a bachelor's degree in English Literature and Music from Hamilton College.
Item 1A. Risk Factors
Investors should carefully consider the risks described below before making an investment decision. The trading price of our common stock could decline due to any of, but are not limited to, these risks. In assessing these risks, investors should also refer to the other information contained or incorporated by reference in this Annual Report on Form 10-K filed with the SEC, including our consolidated financial statements and related notes thereto.
Our Sales Cycle is Long and We Have Limited Ability to Forecast the Timing and Amount of Specific Sales and the Timing of Specific Implementations
The purchase of our software products often requires prospective customers to provide significant executive-level sponsorship and to make major systems architecture decisions. As a result, we must generally engage in relatively lengthy sales and contracting efforts. Sales transactions may therefore be delayed during the customer decision process because we must provide a significant level of education to prospective customers regarding the use and benefit of our products. While we have seen improved economic conditions in recent years, the outlook for 2008 is subject to uncertainties in the financial markets and customers are still cautious about capital and information technology expenditures. As a result, the sales cycle associated with the purchase of our solutions is typically between two and twelve months depending upon the size of the client, and is subject to a number of significant risks over which we have little or no control, including broader financial market volatility, customers' budgeting constraints, internal selection procedures, and changes in customer personnel, among others.
As a result of a lengthy and unpredictable sales cycle, we have limited ability to forecast the timing and amount of specific license sales. The timing of large individual license sales is especially difficult to forecast, and we may not be successful in closing large license transactions on a timely basis or at all. Customers may postpone their purchases of our existing products or product enhancements in advance of the anticipated introduction of new products or product enhancements by us or our competitors.
When a customer purchases a term license together with implementation services we do not recognize any revenue under the contract until the implementation services are substantially complete. In addition, the timing of large implementations is difficult to forecast. Customers may delay or postpone the timing of their particular projects due to the availability of resources or other customer specific priorities. If we are not able to complete an implementation project for a term license in a quarter, it will cause us to defer all of the proportionate contract revenues to a subsequent quarter. Because our expenses are relatively fixed in the near term, any shortfall from anticipated revenues could result in a significant variation in our operating results from quarter to quarter.
We Depend Heavily on Our Axys®, Geneva and APX Products
We derive over half of our net revenues from the licensing of Axys, Geneva and APX products. In addition, many of our other applications, such as Moxy, Partner and various data services have been designed to provide an integrated solution with each of these products. As a result, we believe that for the next several years a majority of our net revenues will depend upon continued market acceptance of
16
Axys, Geneva and APX, and upgrades to those products. In addition, APX, our newest portfolio accounting and reporting product, is of critical importance in providing a migration path for many of our Axys customers. Our long-term growth would be harmed if we are unable to establish APX as a leading product in the market. As a result, we may not be able to successfully migrate existing Axys clients to APX, or to attract new customers to buy APX.
Uncertain Economic and Financial Market Conditions May Continue to Affect Our Revenues
We believe that the market for large investment management software systems may be affected by a number of factors, including reductions in capital expenditures by large customers and poor performance of major financial markets. The target clients for our products include a range of financial services organizations that manage investment portfolios. In addition, in our MicroEdge business segment, we target corporations, public funds, universities and non-profit organizations, which also manage investment portfolios and have many of the same needs. The success of many of our clients is intrinsically linked to the health of the financial markets. We believe that demand for our solutions has been, and could continue to be, disproportionately affected by fluctuations, disruptions, instability or downturns in the economy and financial services industry which may cause clients and potential clients to exit the industry or delay, cancel or reduce any planned expenditures for investment management systems and software products. For example, beginning in the second half of 2007, difficulties in the mortgage and broader credit markets in the United States and elsewhere resulted in a relatively sudden and substantial decrease in the availability of credit and a corresponding increase in funding costs. The current volatility and uncertainty in the financial markets generally has also caused large losses and layoffs announced by financial institutions and could result in reduced expenditures for software and related services. Additionally, an economic downturn would also cause a decline in our clients' assets under management which would in turn cause our revenues to decrease since pricing is based on assets under management. Furthermore, competitors may respond to market conditions by lowering prices and attempting to lure away our customers and prospects to lower cost solutions. In addition, a slowdown in the formation of new investment firms, especially hedge funds, or a decline in the growth of assets under management would cause a decline in demand for our solutions. Also, consolidation of financial services firms can result in reduced technology expenditures or acquired customers using the acquirer's own proprietary software and services solutions or the solutions of another vendor. In some circumstances where both acquisition parties are customers of Advent, the combined entity may require fewer Advent products and services than each individually licensed, thus reducing our revenue.
The technology spending patterns of organizations in MicroEdge's primary markets (independent foundations, community foundations and corporations) are directly affected by economic fluctuations as foundation budgets are largely driven by endowment income. Given that endowments often contain market-exposed components, they are significantly affected by the economy and foundation spending typically decreases in an economic downturn. Community foundations are subject to similar influences, compounded by the fact that in many cases much of their ongoing funding and endowment comes from active donors who may increase or reduce their giving depending on the economic climate and the related effect on their income and wealth. Corporations typically fund charitable activities from operating budgets, and the allocation to charitable donations and supporting company charitable operations is often closely tied to a company's performance. Thus, corporate philanthropy and spending on related technology are correlated with company and overall economic performance.
We have, in the past, experienced a number of market downturns in the financial services industry and resulting declines in information technology spending, which has caused longer sales and contracting cycles, deferral or delay of information technology projects and generally reduced expenditures for software and related services, and we believe that the current volatility and uncertainty in the financial markets and the financial services sector could have a material adverse effect on our revenues and results of operations.
17
If Our Existing Customers Do Not Renew Their Term License, Perpetual Maintenance or Other Recurring Contracts, Our Business Will Suffer
In 2007, revenues recognized from recurring contracts represented 77% of total net revenues. We expect to continue to derive a significant portion of our revenue from our clients' renewal of term license, perpetual maintenance and other recurring contracts and such renewals are critical to our future success. Some factors that may affect the renewal rate of our contracts include:
- •
- The price, performance and functionality of our solutions;
- •
- The availability, price, performance and functionality of competing products and services;
- •
- The effectiveness of our maintenance and support services; and
- •
- Our ability to develop complementary products and services.
Most of our perpetual license customers renew their annual maintenance although our customers have no obligation to renew such maintenance after the first year of their license agreements. In addition, our customers may select maintenance levels less advantageous to us upon renewal, which may reduce recurring revenue from these customers.
During the third quarter of 2007, we commenced renewing term contracts signed in the third quarter of 2004. These are the first three-year term contracts to be renewed by Advent since our transition to a term pricing model began. Our customers have no obligation to renew their term contracts and given the small number of contracts renewed in the third quarter of 2007, we can not yet conclude whether customers will renew in a manner consistent with our perpetual maintenance customers. Additionally, we cannot predict whether the renewals will be less advantageous to us than the original term contract. For example, the renewal periods for our term contracts are typically shorter than our original term contract and customers may request a reduction in the number of users or products licensed, resulting in a lower annual term license fee. Further, customers may elect to not renew their term license contracts at all. Additionally, we may incur significantly more costs in securing our term license contract renewals than we incur for our perpetual maintenance renewals. If our term contract customers renew under terms less favorable to us or choose not to renew their contracts, or if it costs significantly more to secure a renewal for us, our operating results may be harmed.
We Face Competition
The market for investment management software is competitive and highly fragmented, is subject to rapid change and is sensitive to new product introductions and marketing efforts by industry participants. Our largest single source of competition is from proprietary systems used by existing and potential clients, many of whom develop their own software for their particular needs and therefore may be reluctant to license software products offered by third party vendors such as Advent. We also face significant competition from other providers of software and related services as well as providers of outsourced services. Many of our competitors have longer operating histories and greater financial, technical, sales and marketing resources than we do. In addition, consolidation has occurred among some of the competitors in our markets. Competitors vary in size, scope of services offered and platforms supported. In 2005, 2006 and 2007, many of our competitors were acquired, and it is possible that even larger companies will emerge through additional acquisitions of companies and technologies. Any further consolidation among our competitors may result in stronger competitors in our markets and may therefore either result in a loss of market share or harm our results of operations. In addition, we also face competition from potential new entrants into our market that may develop innovative technologies or business models. We cannot guarantee that we will be able to compete successfully against current and future competitors or that competitive pressure will not result in price reductions, reduced operating margins or loss of market share, any one of which could seriously harm our business.
18
We Must Continue to Introduce New Products and Product Enhancements
The market for our products is characterized by rapid technological change, changes in customer demands, evolving industry standards and new regulatory requirements. New products based on new technologies or new industry standards can render existing products obsolete and unmarketable. As a result, our future success will continue to depend upon our ability to develop new products or product enhancements that address the future needs of our target markets and respond to their changing standards and practices. For example, in 2007, we released more new products and product upgrades than any other year in our history, but it is too early to know whether these products will meet anticipated sales or that they will be broadly accepted in the market or that we will continue to introduce more products.
We may not be successful in developing, introducing, marketing and licensing our new products or product enhancements on a timely and cost effective basis, or at all, and our new products and product enhancements may not adequately meet the requirements of the marketplace or achieve market acceptance. Delays in the commencement of commercial shipments of new products or enhancements or delays in client implementations or migrations may result in client dissatisfaction and delay or loss of product revenues. Additionally, existing clients may be reluctant to go through the sometimes complex and time consuming process of migrating from our Axys to APX product, which may slow the migration of our customer base to APX. In addition, clients may delay purchases in anticipation of new products or product enhancements. Our ability to develop new products and product enhancements is also dependent upon the products of other software vendors, including certain system software vendors, such as Microsoft Corporation, Sun Microsystems, database vendors and development tool vendors. If the products of such vendors have design defects or flaws, are unexpectedly delayed in their introduction, or are unavailable on acceptable terms, our business could be seriously harmed.
Our Current Operating Results May Not Be Reflective of Our Future Financial Performance
During 2007, we recognized 77% of total net revenues from recurring sources, which we define as revenues from term license, maintenance on perpetual licenses and other recurring revenue. We generally recognize revenue from these sources ratably over the terms of these agreements, which typically range from one to three years. As a result, almost all of our revenues in any quarter are generated from contracts entered into during previous periods.
Consequently, a significant decline in new business generated in any quarter may not affect our results of operations in that quarter but will have an impact on our revenue growth rate in future quarters. Additionally, a decline in renewals of term agreements, maintenance or data contracts during a quarter will not be fully reflected in our financial performance in that quarter. For example, because we recognize revenue ratably, the non-renewal of term agreements or maintenance contracts late in a quarter may have very little impact on revenue for that quarter, but will reduce revenue in future quarters. In addition, we may be unable to adjust our costs in response to reduced revenue.
Further, solely relying on our historical operating results on a generally accepted accounting principles (GAAP) basis may not be useful in predicting our future operating results. Non-GAAP information that we report, such as our quarterly bookings and maintenance renewal rates, may assist investors in evaluating our future financial position. However, placing undue reliance upon non-GAAP or operating information is not appropriate because this information is neither standardized across companies nor subjected to the same control activities and audit procedures that produce our GAAP financial results.
Our Operating Results May Fluctuate Significantly
We are well over halfway through our transition to a predominantly term license model. Until we substantially complete our transition to a term license model, our net revenues will be affected by the
19
reduction in perpetual license revenue and by the relatively slower revenue recognition associated with the term license model, which is typically over a three-year period. Under a perpetual model, customers purchase licenses to use our software indefinitely and generally we recognize all license revenue at the time of sale; maintenance is purchased under an annual renewable contract, and recognized ratably over the contract period. Under a term model, customers purchase a license to use our software and receive maintenance for a limited period of time and we recognize the revenue ratably over the length of the contract.
During 2007, term license revenues comprised approximately 22% of term license, maintenance and other recurring revenues as compared to approximately 14% in 2006. Term license contracts are comprised of both software licenses and maintenance services. Individual perpetual software licenses vary significantly in value, and the value and timing of these transactions can therefore cause our quarterly perpetual license revenues to fluctuate.
When a customer purchases a term license together with implementation services we do not recognize any revenue under the contract until the implementation services are substantially completed. If the implementation services are still in progress as of quarter-end, we will defer all of the contract revenues to a subsequent quarter. As a result of these and other factors, our quarterly net revenues may fluctuate significantly. Our expense levels are relatively fixed in the short-term. Due to the fixed nature of these expenses, combined with the relatively high gross margin historically achieved on our products, an unanticipated decline in net revenues in any particular quarter may adversely affect our operating results. For example, during 2007, we deferred net revenues of $11.8 million and deferred directly related expenses of $4.1 million. The impact of these deferrals on our operating income for 2007 was approximately $7.7 million.
In addition, we experience seasonality in our licensing. We believe that this seasonality results primarily from customer budgeting cycles and the annual nature of some AUA contracts, and expect this seasonality to continue in the future. The fourth quarter of the year typically has more licensing activity. That can result in perpetual license fee revenue being the highest in the fourth quarter, followed by lower perpetual license revenue in the first quarter of the following year. Also, term licenses entered into during a quarter may not result in recognition of associated revenue until later quarters, as we begin recognizing revenue for such licenses when the related implementation services are substantially complete. In addition, we may see commission and bonus expenses in the period in which we enter into a license, but not recognize the associated revenue until later periods.
Because of the above factors, we believe that quarter-to-quarter comparisons of our operating results are not necessarily meaningful and that these comparisons cannot be relied upon as indicators of future performance.
We Must Retain and Recruit Key Employees
We believe that our future success is dependent on the continued employment of our senior management and our ability to identify, attract, motivate and retain qualified technical, sales and other personnel. Members of our executive management team have acquired specialized knowledge and skills with respect to Advent. We need technical resources such as our product development engineers to develop new products and enhance existing products; we rely upon sales personnel to sell our products and services and maintain healthy business relationships; we must recruit professional service consultants to support the anticipated increase in product implementations; we must hire client services personnel to provide technical support to our growing installed base of customers; and we must attract and retain financial and accounting personnel to comply with the requirements of Section 404 of the Sarbanes-Oxley Act of 2002. Therefore, we need to identify, attract, motivate and retain such employees with the requisite education, backgrounds and industry experience. However, experienced personnel in the information technology industry are in high demand and competition for their talents is intense, especially in the San Francisco Bay Area where the majority of our employees are located.
20
We have relied on our ability to grant equity compensation as one mechanism for recruiting and retaining such highly skilled personnel. Accounting regulations requiring the expensing of equity compensation impair our ability to provide these incentives without reporting significant compensation costs.
We may also choose to create additional performance and retention incentives in order to retain our employees, including the granting of additional stock options, restricted stock, restricted stock units, stock appreciation rights, performance shares or performance units to employees or issuing incentive cash bonuses. Such incentives may either dilute our existing stockholder base or result in unforeseen operating expenses which may have a material adverse effect on our operating results, which may result in our stock price falling; or may not be valued as highly by our employees which may create retention issues.
We Face Challenges in Expanding Our International Operations
We market and sell our products in the United States and, to a lesser extent, internationally. From 2001 through 2005, we acquired the subsidiaries of our independent distributor and in 2006 we opened a branch office of Advent Europe Ltd. in the United Arab Emirates. In addition, we have begun to expand our sales in relatively new jurisdictions for Advent, such as the Middle East, Eastern Europe, and continue to explore other market regions, such as Asia. To further expand our international operations, we would need to establish additional locations, continue to localize our software and acquire other businesses or enter into additional distribution relationships in other parts of the world. International operations, including further expansion and entry into new international markets, would require significant management attention and financial resources. We cannot be certain that establishing businesses in other countries will produce the desired levels of revenues, such as in the case of our Greek subsidiary, Advent Hellas, which produced less than satisfactory revenues and profitability before its sale by Advent in 2005. We currently have limited experience in developing localized versions of our products and marketing and distributing our products internationally. In addition, international operations are subject to other inherent risks, including:
- •
- The impact of recessions in economies outside the United States;
- •
- Greater difficulty in accounts receivable collection and longer collection periods;
- •
- Difficulty of enforcement of contractual provisions in local jurisdictions;
- •
- Unexpected changes in foreign laws and regulatory requirements;
- •
- US and foreign trade-protection measures and export and import requirements;
- •
- Difficulties in successfully adapting our products to the language, regulatory and technology standards of other countries;
- •
- Resistance of local cultures to foreign-based companies and difficulties establishing local partnerships or engaging local resources;
- •
- Difficulties in and costs of staffing and managing foreign operations;
- •
- Reduced protection for intellectual property rights in some countries;
- •
- Foreign tax structures and potentially adverse tax consequences;
- •
- Adverse changes in foreign currency exchange rates; and
- •
- Political and economic instability.
The revenues, expenses, assets and liabilities of our international subsidiaries are primarily denominated in local foreign currencies. We have not historically undertaken foreign exchange hedging
21
transactions to cover potential foreign currency exposure. Future fluctuations in currency exchange rates may adversely affect revenues and accounts receivable from international sales and the US dollar value of our foreign subsidiaries' revenues, expenses, assets and liabilities. Our international service revenues and certain license revenues from our European subsidiaries are generally denominated in local foreign currencies.
Difficulties in Integrating Our Acquisitions and Expanding Into New Business Areas Have Impacted and Could Continue to Adversely Impact Our Business and We Face Risks Associated with Potential Acquisitions, Investments, Divestitures and Expansion
Periodically we seek to grow through the acquisition of additional complementary businesses. From 2001 through the middle of 2003, we made five major acquisitions, including Kinexus Corporation, Techfi Corporation and Advent Outsource Data Management LLC, and also acquired all of the common stock of five of our European distributor's subsidiaries. In addition, we purchased our European distributor's remaining two subsidiaries in the United Kingdom and Switzerland in May 2004. More recently, in December 2006, we acquired East Circle Solutions, Inc., a developer of investment management billing solutions to integrate their product into our software offerings; and in November 2007, our MicroEdge subsidiary acquired Vivid Orange Limited, a United Kingdom company providing corporate community involvement and employee charitable giving technology.
The process of integrating our acquisitions has required and will continue to require significant resources, particularly in light of our relative inexperience in integrating acquisitions, potential regulatory requirements and operational demands. Integrating these acquisitions in the past has been time-consuming, expensive and disruptive to our business. This integration process has strained our managerial resources, resulting in the diversion of these resources from our core business objectives and may do so in the future. Failure to achieve the anticipated benefits of these acquisitions or to successfully integrate the operations of these entities has harmed and could potentially harm our business, results of operations and cash flows in future periods. For example, in the first quarter of 2003, we closed our Australian subsidiary because it failed to perform at a satisfactory profit level and similarly in the fourth quarter of 2005, we disposed of our Advent Hellas subsidiary because of less than satisfactory profitability. In addition, as we have expanded into new business areas and built new offerings through strategic alliances and internal development, as well as acquisitions, some of this expansion has required significant management time and resources without generating required revenues. We have had difficulty and may continue to have difficulty creating demand for such offerings. Furthermore, we may face other unanticipated costs from our acquisitions, such as disputes involving earn-out and incentive compensation amounts, similar to those we have experienced with our Kinexus and Advent Outsource acquisitions.
We may make additional acquisitions of complementary companies, products or technologies in the future. In addition, we periodically evaluate the performance of all our products and services and may sell or discontinue current products and services. Failure to achieve the anticipated benefits of any acquisition or divestiture could harm our business, results of operations and cash flows. Furthermore, we may have to incur debt, write-off investments, infrastructure costs or other assets, incur severance liabilities, write-off impaired goodwill or other intangible assets or issue equity securities to pay for any future acquisitions. The issuance of equity securities could dilute our existing stockholders' ownership. Finally, we may not identify suitable businesses to acquire or negotiate acceptable terms for future acquisitions.
Impairment of Investments Could Harm Our Results of Operations
We have made and may make future investments in privately held companies, many of which are considered in the start-up or development stages. These investments, which we classify as other assets on our consolidated balance sheets, are inherently risky, as the market for the technologies or products
22
these companies have under development is typically in the early stages and may never materialize. The value of the investment in these companies is influenced by many factors, including the operating effectiveness of these companies, the overall health of these companies' industries, the strength of the private equity markets and general market conditions. Due to these and other factors, we have previously determined, and may in the future determine, that the value of these investments is impaired, which has caused and would cause us to write down the carrying value of these investments, such as the $0.6 million write-down of one of our investments during the second quarter of 2007. Furthermore, we cannot be sure that future investment, license, fixed asset or other asset write-downs will not occur. If future write-downs do occur, they could harm our business and results of operations.
Our Stock Price May Fluctuate Significantly
Like many companies in the technology and emerging growth sector, our stock price may be subject to wide fluctuations, particularly during times of high market volatility. If net revenues or earnings in any quarter or our financial guidance for future periods fail to meet the investment community's expectations, our stock price is likely to decline. In addition, our stock price is affected by trends in the financial services sector and by broader market trends unrelated to our performance. Unfavorable or uncertain economic and market conditions, which can be caused by: outbreaks of hostilities or other geopolitical instability; declines in economic growth, business activity or investor or business confidence; limitation on the availability or increases in the cost of credit or capital; increases in inflation, interest rates, exchange rate volatility, default rates or the price of basic commodities; corporate, political or other scandals that reduce investor confidence in capital markets; natural disasters or pandemics; or a combination of these or other factors, have adversely affected, and may in the future adversely affect, our business, profitability and stock price.
If Our Relationship with Financial Times/Interactive Data Is Terminated, Our Business May Be Harmed
Many of our clients use our proprietary interface to electronically retrieve pricing and other data from Financial Times/Interactive Data ("FTID"). FTID pays us a commission based on their revenues from providing this data to our clients. Our software products have been customized to be compatible with their system and this software would need to be redesigned if their services were unavailable for any reason. Termination of our current agreement with FTID would require at least one year's notice by either us or them, or 90 days in the case of material breach. Our revenue would be adversely impacted if our relationship with FTID was terminated or their services were unavailable to our clients for any reason.
If We Are Unable to Protect Our Intellectual Property We May Be Subject to Increased Competition that Could Seriously Harm Our Business
Our success depends significantly upon our proprietary technology. We currently rely on a combination of copyright, trademark, patent and trade secret law, as well confidentiality procedures and contractual provisions to protect our proprietary rights. We have registered trademarks and copyrights for many of our products and services and will continue to evaluate the registration of additional trademarks and copyrights as appropriate. We generally enter into confidentiality agreements with our employees, customers, resellers, vendors and others. We seek to protect our software, documentation and other written materials under trade secret and copyright laws. Despite these efforts, existing intellectual property laws may afford only limited protection, In addition, it may be possible for unauthorized third parties to copy certain portions of our products or to reverse engineer or otherwise obtain and use our proprietary information. In addition, we cannot be certain that others will not develop or acquire substantially equivalent or superseding proprietary technology, equivalent or better products will not be marketed in competition with our products, or others may not design around any
23
patent that may be issued to us or other intellectual property rights of ours, thereby substantially reducing the value of our proprietary rights. We cannot be sure that we will develop proprietary products or technologies that are patentable, that any patent, if issued, would provide us with any competitive advantages or would not be challenged by third parties, or that the patents of others will not adversely affect our ability to do business. Despite our efforts to protect our proprietary rights, unauthorized parties may attempt to copy aspects of our products or to obtain and use information that we regard as proprietary. In addition, the laws of some foreign countries do not protect proprietary rights to as great an extent as do the laws of the United States. Litigation may be necessary to protect our proprietary technology which may be time-consuming and expensive, with no assurance of success. As a result, we cannot be sure that our means of protecting our proprietary rights will be adequate.
If We Infringe the Intellectual Property Rights of Others, We May Incur Additional Costs or Be Prevented from Selling Our Products and Services
We cannot be certain that our products or services do not infringe the intellectual property rights of others. As a result, we may be subject to litigation and claims, including claims of misappropriation of trade secrets or infringement of patents, copyrights and other intellectual property rights of third parties that would be time-consuming and costly to resolve and may lead to unfavorable judgments or settlements. If we discovered that our products or services violated the intellectual property rights of third parties, we may have to make substantial changes to our products or services or obtain licenses from such third parties. We might not be able to obtain such licenses on favorable terms or at all, and we may be unable to change our products successfully or in a timely or cost-effective manner. Failure to resolve an infringement matter successfully or in a timely manner would damage our reputation and force us to incur significant costs, including payment of damages, redevelopment costs, diversion of management's attention and satisfaction of indemnification obligations that we have with our clients, as well as prevent us from selling certain products or services.
Information We Provide to Investors Is Accurate Only as of the Date We Disseminate It
From time to time, we may publicly disseminate forward-looking information or guidance in compliance with Regulation FD. This information or guidance represents our outlook only as of the date we disseminate it, and we do not undertake to update such information or guidance.
Catastrophic Events Could Adversely Affect Our Business
Our operations are exposed to potential disruption by fire, earthquake, flood, power loss, telecommunications failure, security breaches, criminal acts and other events. Additionally, we are vulnerable to interruption caused by terrorist incidents. For example, our facilities in New York were temporarily closed due to the September 11, 2001 terrorist attacks. Immediately after the terrorist attacks, our clients who were located in the World Trade Center area were concentrating on disaster recovery rather than licensing additional software components, while the grounding of transportation impeded our professional services employees' ability to travel to client sites. Additionally, during the temporary closure of the US stock markets, our clients did not use our market data services. Our corporate headquarters are located in the San Francisco Bay Area, which is a region with significant seismic activity. Earthquakes such as that experienced in 1989 could disrupt our business. Such disruptions could affect our ability to sell and deliver products and services and other critical functions of our business. Further, such disruptions could cause instability in the financial markets or the spending of our clients and prospects upon which we depend.
Further, abrupt political change, terrorist acts, conflicts or wars may cause damage or disruption to the economy, financial markets and our customers. The potential for future attacks, the national and international responses to attacks or perceived threats to national security and other actual or potential conflicts or wars, including the ongoing crisis in the Middle East, have created many economic and
24
political uncertainties. Although it is impossible to predict the occurrences or consequences of any such events, they could unsettle the financial markets or result in a decline in information technology spending, which could have a material adverse effect on our revenues.
Undetected Software Errors or Failures Found in New Products May Result in Loss of or Delay in Market Acceptance of Our Products that Could Seriously Harm Our Business
Our products may contain undetected software errors or scalability limitations at any point in their lives, but particularly when first introduced or as new versions are released. Despite testing by us and by current and potential customers, errors may not be found in new products until after commencement of commercial shipments, resulting in a loss of or a delay in market acceptance, damage to our reputation, customer dissatisfaction and reductions in revenues and margins, any of which could seriously harm our business. Additionally, our agreements with customers that attempt to limit our exposure to liability claims may not be enforceable in jurisdictions where we operate.
Two of Our Principal Stockholders Have an Influence Over our Business Affairs and May Make Business Decisions with Which You Disagree and Which May Adversely Affect the Value of Your Investment
Our Chief Executive Officer and the Chairman of our board of directors beneficially own or control, indirectly or directly, a substantial number of shares of our common stock (approximately 37% as of February 29, 2008). As a result, if these persons act together, they will have the ability to exert significant influence on matters submitted to our stockholders for approval, such as the election or removal of directors, amendments to our certificate of incorporation or the approval of a business combination. These actions may be taken even if they are opposed by other stockholders or it may be difficult to approve these actions without their consent. This concentration of ownership may also have the effect of delaying or preventing a change of control of our company or discouraging others from making tender offers for our shares, which could prevent our stockholders from receiving a premium for their shares.
Changes in Securities Laws and Regulations May Increase Our Costs
The Sarbanes-Oxley Act ("the Act") of 2002 required changes in some of our corporate governance and securities disclosure and/or compliance practices. As part of the Act's requirements, the SEC has enacted new rules on a variety of subjects, and the Nasdaq Stock Market has enacted new corporate governance listing requirements. These developments have increased and may in the future increase our accounting and legal compliance costs and could also expose us to additional liability if we fail to comply with these new rules and reporting requirements. In fiscal 2007, 2006 and 2005, we incurred approximately $0.9 million, $1.3 million and $1.8 million, respectively, in Sarbanes-Oxley related expenses consisting of external consulting costs and auditor fees, and the Company anticipates similarly spending a significant amount for its 2008 compliance activities. In addition, such developments may make retention and recruitment of qualified persons to serve on our board of directors, or as executive officers, more difficult. We continue to evaluate and monitor regulatory and legislative developments and cannot reliably estimate the timing or magnitude of all costs we may incur as a result of the Act or other related legislation or regulation.
Changes in, or Interpretations of, Accounting Principles Could Result in Unfavorable Accounting Charges
We prepare our consolidated financial statements in conformity with accounting principles generally accepted in the United States of America. These principles are subject to interpretation by us, the SEC and various bodies formed to interpret and create accounting principles. A change in these principles or a change in the interpretations of these principles can have a significant effect on our
25
reported results and may even retroactively affect previously reported transactions. Some of our accounting principles that recently have been or may be affected include:
- •
- Software revenue recognition
- •
- Accounting for stock-based compensation
- •
- Accounting for income taxes
- •
- Accounting for business combinations and related goodwill
In particular, in the first quarter of 2006, we adopted SFAS 123R which requires the measurement of all stock-based compensation to employees, including grants of employee stock options, restricted stock units and stock appreciation rights, using a fair-value-based method and the recording of such expense in our consolidated statements of operations. The adoption of SFAS 123R had a significant adverse effect on our results of operations. It will continue to significantly adversely affect our results of operations and has resulted in changes to our compensation practices, such as an increased reliance on using equity vehicles such as stock-settled stock appreciation rights (SAR) and restricted stock units (RSU).
If factors change and we employ different assumptions for estimating stock-based compensation expense in future periods or if we decide to use a different valuation model, the future periods may differ significantly from what we have recorded in the current period and could materially affect our operating income, net income and net income per share.
We currently use the Black-Scholes option pricing model to determine the fair value of stock-based compensation awards and employee stock purchase plan shares. The Black-Scholes option pricing model was developed for use in estimating the fair value of traded options that have no vesting restrictions and are fully transferable, characteristics not present in our option grants and employee stock purchase plan shares. Existing valuation models, including the Black-Scholes and lattice binomial models, may not provide reliable measures of the fair values of our stock-based compensation. Consequently, there is a risk that our estimates of the fair values of our stock-based compensation awards on the grant dates may bear little resemblance to the actual values realized upon the exercise, expiration, early termination or forfeiture of those stock-based payments in the future. Certain stock-based payments, such as employee stock options, restricted stock units and stock appreciation rights, may expire worthless or otherwise result in zero intrinsic value as compared to the fair values originally estimated on the grant date and reported in our consolidated financial statements. Alternatively, value may be realized from these instruments that are significantly higher than the fair values originally estimated on the grant date and reported in our financial statements. There currently is no market-based mechanism or other practical application to verify the reliability and accuracy of the estimates stemming from these valuation models, nor is there a means to compare and adjust the estimates to actual values.
Additionally, in December 2007, the FASB issued SFAS No. 141 (revised 2007) ("SFAS 141R"), "Business Combinations". SFAS 141R establishes principles and requirements for how the acquirer of a business recognizes and measures in its financial statements the identifiable assets acquired, the liabilities assumed, and any non-controlling interest in the acquiree. SFAS 141R is effective for financial statements issued for fiscal years beginning after December 15, 2008. Accordingly, any business combinations we engage in will be recorded and disclosed following existing generally accepted accounting principles (GAAP) until January 1, 2009. The Company expects SFAS 141R will have an impact on its consolidated financial statements when effective, but the nature and magnitude of the specific effects will depend upon the nature, terms and size of the acquisitions the Company consummates after the effective date.
26
Potential Changes in Securities Laws and Regulation Governing the Investment Industry's Use of Soft Dollars May Reduce Our Revenues
As of December 31, 2007, approximately 360 or 8% of our clients utilized trading commissions ("soft dollar arrangements") to pay for software products and services. During fiscal 2007 and 2006, the total value of Advent products and services paid with soft dollars was approximately 4% and 5% of our total billings. Such soft dollar arrangements could be impacted by changes in the regulations governing those arrangements.
During the fourth quarter of 2006, we completed the wind down of the "soft dollar" business of our SEC-registered broker/dealer subsidiary, Second Street Securities, as it no longer fits with our corporate strategy. Second Street Securities' soft dollar business offered our customers the ability to pay for Advent products and other third party products and services through brokerage commissions and other fee-based arrangements. We will continue to allow clients to utilize soft dollar arrangements to pay for Advent software products and services through other independent broker/dealers.
In July 2006, the SEC published an Interpretive Release that provides guidance on money managers' use of client commissions to pay for brokerage and research services under the safe harbor set forth in Section 28(e) of the Securities Exchange Act of 1934. The Interpretive Release clarifies that money managers may use client commissions ("soft dollars") to pay only for eligible brokerage and research services. Among other matters, the Interpretive Release states that eligible brokerage includes those products and services that relate to the execution of the trade from the point at which the money manager communicates with the broker-dealer for the purpose of transmitting an order for execution, through the point at which funds or securities are delivered or credited to the advised account. In addition, for potentially "mixed-use" items (such as trade order management systems) that are partly eligible and partly ineligible, the Interpretive Release states that money managers must make a reasonable allocation of client commissions in accordance with the eligible and ineligible uses of the items. Based on this new guidance, our customers may change their method of paying all or a portion of certain Advent products or services from soft to hard dollars, and as a result reduce their usage of these products or services in order to avoid increasing expenses, which could cause our revenues to decrease.
Covenants in Our Credit Facility Agreement Could Adversely Affect our Financial Condition
In February 2007, we entered into a senior secured facility agreement which provides us with a revolving line of credit up to an aggregate amount of $75.0 million. Our continued ability to borrow under our credit facility is subject to compliance with certain financial and non-financial covenants. The financial covenant is limited to a maximum ratio of senior debt to earnings before interest, taxes, depreciation, and amortization (EBITDA), adjusted for cost capitalizations, extraordinary gains (losses) and non-cash stock compensation. Our failure to comply with such covenants could cause default under the agreement, and we may then be required to repay such debt with capital from other sources. Under those circumstances, other sources of capital may not be available to us, or be available only on unfavorable terms. In the event of default which is not remedied within the prescribed timeframe, the assets of the Company (subject to the amount borrowed) may be attached or seized by the lender. As of December 31, 2007, we had no outstanding borrowings under this credit facility and were in compliance with all covenants.
Security Risks May Harm Our Business
Maintaining the security of computers, computer networks, hosted solutions and the transmission of confidential information over public networks is essential to commerce and communications, particularly in the market in which Advent operates. Efforts of others to seek unauthorized access to Advent's or its clients' computers and networks or introduce viruses, worms and other malicious
27
software programs that disable or impair computers into our systems or those of our customers or other third parties, could disrupt or make our systems inaccessible or allow access to proprietary information and data of Advent or its clients. Advances in computer capabilities, new discoveries in the field of cryptography or other events or developments, also could result in compromises or breaches of our security systems. Our security measures may be inadequate to prevent security breaches, exposing us to a risk of data loss, financial loss, harm to reputation, business interruption, litigation and other possible liabilities, as well as possibly requiring us to expend significant capital and other resources to protect against the threat of security breaches or to alleviate problems caused by such breaches.
If We Fail to Maintain an Effective System of Internal Control, We May Not be Able to Accurately Report Our Financial Results or Our Filings May Not be Timely. As a Result, Current and Potential Stockholders Could Lose Confidence in Our Financial Reporting, Which Would Harm Our Business and the Trading Price of Our Stock
Effective internal control is necessary for us to provide reliable financial reports. If we cannot provide reliable financial reports, our business and operating results could be harmed. We have in the past discovered, and may in the future discover, areas of our internal control that need improvement including control deficiencies that may constitute material weaknesses. For example, as of December 31, 2005, the Company did not maintain effective controls over the accounting for income taxes, including the determination of deferred income tax liabilities and the related income tax provision. This control deficiency resulted in adjustments to the fourth quarter of 2004 and 2005 financial statements and a restatement of the Company's financial statements for each of the first three quarters of fiscal 2004 and 2005.
The Company also did not maintain effective controls over the accuracy, presentation and disclosure of the pro forma stock-based compensation expense in conformity with generally accepted accounting principles as of December 31, 2005. As a result of this control deficiency, the Company's disclosures of stock-based compensation expense for fiscal 2003 and 2004 and the first three quarters of 2004 and 2005 were revised.
During 2006, we implemented controls and procedures to improve our internal control over financial reporting and address the material weaknesses identified in fiscal 2004 and 2005. Management has concluded that the Company's internal control over financial reporting was effective as of December 31, 2006 and 2007.
We do not expect that our internal control over financial reporting will prevent all errors or fraud. A control system, no matter how well designed and operated, can provide only reasonable, not absolute, assurance that the control system's objectives will be met. Further, the design of a control system must reflect the fact that there are resource constraints, and the benefits of controls must be considered relative to their costs. Controls can be circumvented by individual acts of some persons, by collusion of two or more people, or by management override of the controls. Over time, controls may become inadequate because changes in conditions or deterioration in the degree of compliance with policies or procedures may occur. Because of the inherent limitations in a cost-effective control system, misstatements due to error or fraud may occur and not be detected.
Any failure to implement or maintain improvements in our internal control over financial reporting, or difficulties encountered in the implementation of these improvements in our controls, could cause significant deficiencies or material weaknesses in our internal controls and consequently cause us to fail to meet our reporting obligations. Any failure to implement or maintain required new or improved internal controls could also cause investors to lose confidence in our reported financial information, which could have a negative impact on the trading price of our stock.
28
Our Ability to Conclude that a Control Deficiency is Not a Material Weakness or that an Accounting Error Does Not Require a Restatement Can be Affected By a Number of Factors Including Our Level of Pre-Tax Income
Under the Sarbanes-Oxley Act of 2002, our management is required to assess the impact of control deficiencies based upon both quantitative and qualitative factors, and depending upon that analysis we classify such identified deficiencies as either a control deficiency, significant deficiency or a material weakness.
One element of our quantitative analysis of any control deficiency is its actual or potential financial impact, and any impact that is greater than 5% of our pre-tax income in any quarter may be more likely to result in that deficiency being determined to be a significant deficiency or a material weakness. For example, our pre-tax income for fiscal 2006 was $3.6 million and although our fiscal 2007 pre-tax income increased to $16.8 million, our assessment of a control deficiency as a significant deficiency or material weakness remains dependent in part on our level of profitability during a particular quarter. If our quarterly or fiscal year pre-tax income were to decrease to levels similar to those in fiscal 2006, this will make it statistically less likely for us and our independent registered public accounting firm to determine that a control deficiency is not a material weakness.
In addition, if management or our independent registered public accountants identify errors in our interim or annual financial statements, it is statistically more likely that such errors may meet the quantitative threshold established under Staff Accounting Bulletin No. 99, "Materiality", that could, depending upon the complete qualitative and quantitative analysis, result in our having to restate previously issued financial statements.
Item 1B. Unresolved Staff Comments
None.
Item 2. Properties
Our principal executive offices are located in San Francisco, California. The table below summarizes the principal properties that we leased as of December 31, 2007:
| |
| | Segment
| | Use of Property
|
|---|
Location
| | Approx.
Square
Footage
| | Advent
Investment
Management
| | MicroEdge
| | Sales
and
Support
| | Marketing
| | Product
Development
| | Administrative
|
|---|
| United States: | | | | | | | | | | | | | | |
| San Francisco, CA (3 properties)* | | 263,463 | | X | | | | X | | X | | X | | X |
| New York, NY (3 properties)* | | 80,990 | | X | | X | | X | | X | | X | | X |
| New Rochelle, NY | | 5,795 | | X | | | | X | | X | | | | |
| Boston, MA | | 8,061 | | X | | | | X | | X | | | | |
| Concord, NH (2 properties) | | 7,395 | | | | X | | X | | X | | X | | X |
| Middlebury, CT | | 2,996 | | | | X | | X | | X | | X | | |
| Excelsior, MN | | 2,407 | | | | X | | X | | X | | | | X |
| Europe and Middle East: | | | | | | | | | | | | | | |
| Copenhagen, Denmark | | 3,475 | | X | | | | X | | | | | | |
| Zurich, Switzerland | | 1,830 | | X | | | | X | | | | | | |
| Oslo, Norway | | 1,108 | | X | | | | X | | X | | | | |
| London, United Kingdom | | 4,785 | | X | | X | | X | | X | | | | X |
| Stockholm, Sweden | | 2,400 | | X | | | | X | | X | | | | X |
| Dubai, United Arab Emirates | | 180 | | X | | | | X | | | | | | |
| | |
| | | | | | | | | | | | |
| | Total leased square footage | | 384,885 | | | | | | | | | | | | |
| | |
| | | | | | | | | | | | |
- *
- As part of our restructuring activities, we vacated properties in New York, New York and San Francisco, California. Approximately 119,000 square feet of New York and California property has been subleased as of December 31, 2007. In 2005, we entered into sub-lease agreements for certain New York properties. In 2006, we entered into sub-lease agreements for certain San Francisco properties.
29
We continue to assess our needs with respect to office space and may in the future vacate or add additional facilities.
Item 3. Legal Proceedings
On March 8, 2005, certain of the former shareholders of Kinexus and the shareholders' representative filed suit against Advent in the Delaware Chancery Court. The complaint alleges that Advent breached the Agreement and Plan of Merger dated as of December 31, 2001 pursuant to which Advent acquired all of the outstanding shares of Kinexus due principally to the fact that no amount was paid by Advent on an earn-out of up to $115 million. The earn-out, which was payable in cash or stock at the election of Advent, was based upon Kinexus meeting certain revenue targets in both 2002 and 2003. The complaint seeks unspecified compensatory damages, an accounting and restitution for unjust enrichment. Advent advised the shareholders' representative in January 2003 that the earn-out terms had not been met in 2002 and accordingly no earn-out was payable for 2002 and would not be payable for 2003. Discovery is continuing between the parties. Advent disputes the plaintiffs' claims and believes that it has meritorious defenses and intends to vigorously defend this action. Management believes that any potential loss associated with this litigation is neither probable nor reasonably estimable at this time and accordingly has not accrued any amounts for any potential loss.
From time to time, we are involved in claims and legal proceedings that arise in the ordinary course of business. Based on currently available information, management does not believe that the ultimate outcome of these unresolved matters, individually and in the aggregate, is likely to have a material adverse effect on the Company's financial position or results of operations. However, litigation is subject to inherent uncertainties and our view of these matters may change in the future. Were an unfavorable outcome to occur, there exists the possibility of a material adverse impact on our financial position and results of operations for the period in which the unfavorable outcome occurs, and potentially in future periods.
Item 4. Submission of Matters to a Vote of Security Holders
None.
30
PART II
Item 5. Market for Registrant's Common Equity, Related Stockholder Matters and Issuer Purchases of Equity Securities
Market Information for Common Stock
Our common stock is listed on the NASDAQ Stock Market under the symbol "ADVS." The closing price of our common stock on February 29, 2008 was $44.94. The table below summarizes the range of high and low reported sales prices on the NASDAQ Stock Market for our common stock for the periods indicated.
| | Price Range
|
|---|
| | High
| | Low
|
|---|
| Fiscal 2007 | | | | | | |
| First quarter | | $ | 37.82 | | $ | 32.74 |
| Second quarter | | $ | 36.71 | | $ | 32.29 |
| Third quarter | | $ | 48.35 | | $ | 32.41 |
| Fourth quarter | | $ | 58.27 | | $ | 45.82 |
Fiscal 2006 |
|
|
|
|
|
|
| First quarter | | $ | 30.50 | | $ | 25.90 |
| Second quarter | | $ | 36.43 | | $ | 27.32 |
| Third quarter | | $ | 37.56 | | $ | 26.96 |
| Fourth quarter | | $ | 38.45 | | $ | 34.65 |
Stockholders
As of February 29, 2008, there were approximately 174 holders of record of our common stock. However, because many of our shares of common stock are held by brokers and other institutions on behalf of stockholders, we are unable to estimate with any level of accuracy the total number of stockholders represented by these record holders.
Dividends
We have never declared or paid any cash dividends on our common stock. We currently anticipate that we will retain future earnings to fund development and growth of our business and to repurchase our common stock, and do not anticipate paying cash dividends in the foreseeable future.
Recent Sales of Unregistered Securities
None.
Purchases of Equity Securities by the Issuer and Affiliated Purchasers
Our Board of Directors (the "Board") has approved common stock repurchase programs authorizing management to repurchase shares of the Company's common stock in the open market. The timing and actual number of shares subject to repurchase are at the discretion of management and are contingent on a number of factors, including the price of our stock, general market conditions and alternative investment opportunities. The purchases are funded from available working capital or debt.
31
The following is a summary of the repurchase programs authorized by the Board since 2005 (in thousands):
Date of Authorization
| | Number
of Shares
Authorized
|
|---|
| February 2005 | | 1,800 |
| May 2005 | | 1,000 |
| April 2006 | | 2,300 |
| July 2006 | | 1,500 |
| February 2007 | | 2,250 |
| | |
|
| | Total | | 8,850 |
| | |
|
The following is a summary of the Company's repurchase activity since 2005 (in thousands, except per share data):
Fiscal Year
| | Total
Number
of Shares
Repurchased
| | Cost
| | Average
Price
Paid Per
Share
|
|---|
| 2005 | | 2,835 | | $ | 52,584 | | $ | 18.55 |
| 2006 | | 4,691 | | $ | 148,602 | | $ | 31.68 |
| 2007 | | 2,580 | | $ | 91,157 | | $ | 35.33 |
| | |
| |
| |
|
| | Total | | 10,106 | | $ | 292,343 | | $ | 28.93 |
| | |
| |
| |
|
At January 1, 2005, there remained 1,256,000 shares authorized by the Board for repurchase.
There were no repurchase activities during the fourth quarter of 2007. As of December 31, 2007, there were no shares available to be repurchased.
Securities Authorized for Issuance Under Equity Compensation Plans
Information regarding securities authorized for issuance under equity compensation plans is incorporated by reference from our Proxy Statement to be filed for our May 2008 Annual Meeting of Stockholders.
32
Performance Graph
COMPARISON OF 5 YEAR CUMULATIVE TOTAL RETURN*
Among Advent Software, Inc., The S&P 500 Index
And The NASDAQ Computer & Data Processing Index
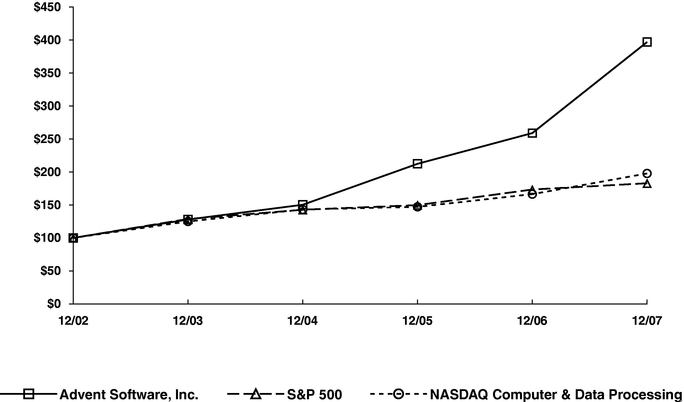
- *
- $100 invested on 12/31/02 in stock or index—including reinvestment of dividends. Fiscal year ending December 31.
33
Item 6. Selected Financial Data
The following selected financial data are derived from our consolidated financial statements. This data should be read in conjunction with the consolidated financial statements and notes thereto, and "Item 7, Management's Discussion and Analysis of Financial Condition and Results of Operations".
| | Fiscal Years
| |
|---|
| | 2007(1)(2)
| | 2006(3)(4)(5)
| | 2005(6)(7)
| | 2004(8)(9)(10)
| | 2003(11)
| |
|---|
| | (in thousands, except per share data)
| |
|---|
| STATEMENT OF OPERATIONS | | | | | | | | | | | | | | | | |
| Net revenues | | $ | 215,303 | | $ | 184,093 | | $ | 168,701 | | $ | 149,990 | | $ | 137,159 | |
| Gross margin | | $ | 147,413 | | $ | 125,291 | | $ | 116,904 | | $ | 97,035 | | $ | 80,135 | |
| Income (loss) from operations | | $ | 12,329 | | $ | (282 | ) | $ | 6,336 | | $ | (18,064 | ) | $ | (39,659 | ) |
| Net income (loss) | | $ | 12,631 | | $ | 82,602 | | $ | 14,135 | | $ | (16,179 | ) | $ | (92,933 | ) |
| Basic net income (loss) per share | | $ | 0.48 | | $ | 2.85 | | $ | 0.46 | | $ | (0.49 | ) | $ | (2.86 | ) |
| Diluted net income (loss) per share | | $ | 0.45 | | $ | 2.70 | | $ | 0.44 | | $ | (0.49 | ) | $ | (2.86 | ) |
BALANCE SHEET |
|
|
|
|
|
|
|
|
|
|
|
|
|
|
|
|
| Cash, cash equivalents and marketable securties | | $ | 49,589 | | $ | 55,068 | | $ | 163,432 | | $ | 165,529 | | $ | 160,072 | |
| Working capital | | $ | (23,166 | ) | $ | 1,000 | | $ | 115,844 | | $ | 127,886 | | $ | 133,545 | |
| Total assets | | $ | 352,329 | | $ | 339,647 | | $ | 340,575 | | $ | 354,642 | | $ | 346,503 | |
| Long-term liabilities | | $ | 22,289 | | $ | 14,838 | | $ | 6,374 | | $ | 8,066 | | $ | 6,294 | |
| Stockholders' equity | | $ | 179,846 | | $ | 209,627 | | $ | 241,979 | | $ | 265,740 | | $ | 283,069 | |
- (1)
- Certain selected financial data for 2007 differs from those reported in the Company's Current Report on Form 8-K filed on February 5, 2008 with the Securities and Exchange Commission. Subsequent to the Company's filing of this Form 8-K, the Company recorded adjustments to its consolidated financial statements for the fourth quarter of fiscal 2007. See further discussion in the "Supplementary Quarterly Financial Data (unaudited)" section for further details.
- (2)
- Our results of operations for 2007 included stock-based compensation expense of $13.4 million, restructuring charges of $1.0 million, acquired in-process research and development expense of $0.2 million and a net gain on sale of private equity investments of $3.7 million.
- (3)
- We had historically classified all amounts for deferred revenues and direct costs associated with our term service deferral as current on the consolidated balance sheets. During 2007, the Company reclassified certain of the deferred revenues and direct costs associated with its term service deferral from current to long-term. As of December 31, 2006, directs costs associated with the term service deferral of $857,000 were classified as "other assets" within non-current assets on the consolidated balance sheets. As of December 31, 2006, deferred revenues associated with term service deferral of $2.1 million were classified as "deferred revenues, long-term". This does not affect total assets or total liabilities for any period presented.
- (4)
- Our results of operations for 2006 included a benefit from income taxes of $79.0 million as a result of releasing the valuation allowance against our deferred tax assets originally recorded in fiscal 2003, stock-based employee compensation expense of $13.6 million and restructuring charges of $3.7 million.
- (5)
- Effective January 1, 2006, we adopted SFAS 123R, "Share-Based Payment", which requires the recognition of the fair value of stock-based compensation in net income.
- (6)
- We had historically classified all amounts accrued for prepaid sales commissions as "prepaid expenses and other" on the consolidated balance sheets. Effective January 1, 2005, certain prepaid sales commissions that are to be recognized in excess of a year from the balance sheet date are
34
classified as "other assets" within non-current assets on the consolidated balance sheets. As of December 31, 2005, prepaid sales commissions of $1.2 million were classified as "other assets". This does not affect total assets for any period presented.
- (7)
- Our results of operations for 2005 included restructuring charges of $2.0 million and a gain on sale of investments of $3.6 million.
- (8)
- Effective January 1, 2004, commission revenues received from "soft dollar" transactions for products and services not related to Advent products and services, are recorded as other revenues on a net basis as we are not the primary obligor in these transactions. This does not affect gross margin, operating loss, or net income (loss) for any period presented.
- (9)
- Our results of operations for 2004 included intangible asset impairments of $5.4 million, restructuring charges of $5.1 million and the operating results of Advent United Kingdom and Switzerland, subsequent to their acquisition in the second quarter of 2004.
- (10)
- We had historically classified all amounts accrued for deferred rent as "other long-term liabilities" on the consolidated balance sheets. Effective January 1, 2004, certain deferred rent liabilities that are to be recognized within a year of the balance sheet date are classified as "accrued liabilities" on the consolidated balance sheets. This does not affect total liabilities for any period presented.
- (11)
- Our results of operations for 2003 included a provision for income taxes of $54.8 million as a result of recording a full valuation allowance against our deferred tax assets in the United States, restructuring charges of $9.1 million and an impairment charge of $0.9 million related to the write-off of developed technology acquired.
Item 7. Management's Discussion and Analysis of Financial Condition and Results of Operations
SPECIAL NOTE REGARDING FORWARD-LOOKING STATEMENTS
You should read the following discussion in conjunction with our consolidated financial statements and related notes. The following discussion contains forward-looking statements within the meaning of Section 27A of the Securities Act of 1933 as amended and Section 21E of the Securities Exchange Act of 1934 as amended, including, but not limited to statements referencing our expectations relating to future revenues, expenses and operating margins. Forward-looking statements can be identified by the use of terminology such as "may," "will," "should," "expect," "plan" "anticipate," "believe," "estimate," "predict," "potential," "continue" or other similar terms and the negative of such terms regarding beliefs, plans, expectations or intentions regarding the future. Forward-looking statements include, among others, statements regarding growth in the investment management market and opportunities for us related thereto, future expansion, acquisition, divestment of or investment in other businesses, projections of revenues, future cost and expense levels, expected timing and amount of amortization expenses related to past acquisitions, the adequacy of resources to meet future cash requirements, estimates or predictions of actions by customers, suppliers, competitors or regulatory authorities, future client wins, future hiring and future product introductions. Such forward-looking statements are based on our current plans and expectations and involve known and unknown risks and uncertainties which may cause our actual results or performance to be materially different from any results or performance expressed or implied by such forward-looking statements. Such factors include, but are not limited to the "Risk Factors" set forth in "Item 1A. Risk Factors" in this Form 10-K, as well as other risks identified from time to time in other Securities and Exchange Commission ("SEC") reports. You should not place undue reliance on our forward-looking statements, as they are not guarantees of future results, levels of activity or performance and represent our expectations only as of the date they are made.
35
Unless expressly stated or the context otherwise requires, the terms "we", "our", "us", the "Company" and "Advent" refer to Advent Software, Inc. and its subsidiaries.
Overview
We offer integrated software solutions for automating and integrating data and work flows across the investment management organization, as well as the information flows between the investment management organization and external parties. Our products are intended to increase operational efficiency, improve the accuracy of client information and enable better decision-making. Each solution focuses on specific mission-critical functions of the front, middle and back offices of investment management organizations and is designed to meet the needs of the particular client, as determined by size, assets under management and complexity of the investment environment.
Our software solutions also support the grant management, matching gifts and volunteer tracking for the grant making community.
Operating Overview
During fiscal 2007, we:
- •
- Expanded customer relationships and acceptance of our product offerings. We experienced continued strong demand for both our newest and largest portfolio management and accounting platforms: Advent Portfolio Exchange ("APX") and Geneva, respectively. We sold 109 APX licenses, bringing the total number of licenses sold globally to 193. We also achieved a significant milestone with Geneva as we added 55 new Geneva clients during fiscal 2007 compared to 34 new customers during 2006 and 17 new customers in 2005, bringing the total number of Geneva licenses sold to 157 as of December 31, 2007.
- •
- Renewed our focus on our trading and order management products.
- •
- Released several new products and product upgrades.
- •
- Released APX 2.0 with enhanced fixed income functionality and new performance analytics functionality which includes performance attribution, contribution and ex-post risk statistics. We believe this added functionality will provide our clients the tools to deliver more robust reporting and client service without increasing operational costs or overhead.
- •
- Released Geneva 7.0 which provides a completely new user interface, data browser, data access, workflow improvements and reporting infrastructure to provide timely, accurate integrated critical information.
- •
- Launched Advent Revenue Center, an automated billing and revenue management solution. Advent Revenue Center automates and improves a client's operational efficiency by simplifying the costly and lengthy billing process from managing multiple and diverse billing structures. This product integrates with both APX and Axys.
- •
- Released Moxy 6.0, the latest version of our trade order management system, which features a more scalable .NET architecture, as well as improved workflow and a new user interface.
- •
- Launched Advent Rules Manager, our new solution for pre- and post-trade compliance, which brings our trading and compliance offerings to the next level. This product extends the footprint of our suite with a solution that helps our clients manage their compliance practices.
- •
- Increased term contract value. We achieved record bookings with term contract value of $81.3 million, and an average term of 3.4 years, which translates to annual contract value for the full year of approximately $24.1 million. In 2006, we achieved term contract value of
36
Financial Overview
We recognized revenues of $215.3 million during 2007, as compared to $184.1 million in fiscal 2006 and $168.7 million in 2005. The year-over-year increase in 2007 reflects significant growth in term licenses. Term license revenue increased 97% to $37.4 million in 2007 from $18.9 million in 2006. Maintenance and other recurring revenues were up $10.0 million or 8% year-over-year, and professional services posted strong gains of 18% to $22.3 million in 2007. In addition, despite our transition from a perpetual model, perpetual license fees in 2007 were flat compared to 2006. We have grown net revenue year-over-year for several reasons, including the following:
- •
- Our product innovation helped drive acquisition of new customers, resulting in incremental term license contract value and professional services billings.
- •
- Our completion of term license implementations resulted in incremental term license and professional services revenues.
- •
- We have a large installed base of customers who continue to upgrade and expand their usage of our products resulting in higher maintenance and recurring revenues.
- •
- Our existing term licenses provide a consistent, recurring revenue stream.
Total recurring revenues, which we define as term license, perpetual maintenance, and other recurring revenues, have increased to 77% of total net revenues during 2007, as compared to 75% during 2006. In addition, international revenue increased $4.4 million or 20% during 2007.
Total expenses, including cost of revenues, were $203.0 million in fiscal 2007, compared with $184.4 million in 2006 and $162.4 million in 2005. Our expenses increased in 2007 from 2006 largely as a result increased payroll, variable compensation and benefit expenses resulting from increases in headcount and our strong performance.
During 2007, we incurred only $1.0 million of restructuring charges compared to $3.7 million in 2006 primarily relating to the exit of our previous headquarters facility. In November 2006, we incurred facility and exit costs of $3.4 million related to the 301 Brannan facility that will continue to be incurred without economic benefit to us.
Our income from operations in 2007 was $12.3 million compared to a loss from operations in 2006 of $0.3 million.
During 2007, we recognized $4.2 million of income tax expense compared to a benefit from income taxes in 2006 of $79.0 million due primarily to the release, in 2006, of the valuation allowance
37
against deferred tax assets originally established in the fourth quarter of 2003 as we now believe that our deferred tax assets are more likely than not to be realized.
We earned net income of $12.6 million, resulting in diluted earnings per share of $0.45 for 2007.
We generated $62.4 million in cash from operations in 2007 compared to $46.8 million in 2006, primarily as a result of revenue growth and collections of resulting customer receivables.
During 2007, we repurchased 2.6 million shares under our share repurchase plan, for a total cash outlay of $91.2 million and an average price of $35.33.
Term License and Term License Deferral
We are continuing the process of converting the Company's license revenues from a perpetual model to a predominantly term model. Under a perpetual pricing model, customers purchase a license to use our software indefinitely and generally we recognize all license revenue at the time of sale; maintenance is purchased under an annual renewable contract, and recognized ratably over the contract period. Under a term pricing model, customers purchase a license to use our software and receive maintenance for a limited period of time and we recognize all of the revenue ratably over the length of the contract. This has the effect of lowering revenues in the early stages of the transition, but increasing the total potential value of the customer relationship. Moving new customer sales in the Advent Investment Management (AIM) segment from a perpetual to a term licensing model has had the effect of lowering our reported revenue growth rates over the past two years and may, depending on our new term license bookings, continue to have an impact through 2008. However, because our products are used by customers for an average of approximately ten years, we believe this change to our business model is significant for the long-term growth and value of the business as we expect total revenues from a customer to increase over time. For example, over a ten-year period, a customer may enter into two or more contracts for the same software product and services under a term license model.
When a customer purchases a term license together with implementation services, we do not recognize any revenue under the contract until the implementation services are complete and the remaining services are substantially complete. If the implementation services are still in progress as of quarter-end, we will defer all of the contract revenues to a subsequent quarter. At the point professional services are substantially completed, we recognize a pro-rata amount of the term license revenue, professional services fees earned and related expenses, based on the elapsed time from the start of the term license to the substantial completion of professional services. Term license revenue for the remaining contract years and the remaining deferred professional services revenue and related expenses are recognized ratably over the remaining contract length.
During 2007, we deferred net revenues of $11.8 million and directly-related expenses of $4.1 million associated with our term licensing model. The impact of these deferrals on our operating income was approximately $7.7 million. The $11.8 million net deferral of revenue is composed of a net deferral of $9.5 million of professional services revenue and a net deferral of $2.3 million of term license revenue. Professional services and term license revenue deferrals continued to increase as the deferral for current projects exceeded the amount recognized from completed past projects. We expect that the term license component of the deferred revenue balance will increase or decrease in the future depending on the amount of new bookings relative to the number of implementations that reach substantial completion in a particular quarter. We currently expect that the professional services component of the deferred revenue balance will continue to increase through at least 2008.
38
Amounts of revenues and directly-related expenses deferred as of December 31, 2007 and 2006 associated with our term licensing deferral were as follows (in millions):
| | December 31
2007
| | December 31
2006
|
|---|
| Deferred revenues | | | | | | |
| Short-term | | $ | 17.9 | | $ | 7.2 |
| Long-term | | | 3.3 | | | 2.1 |
| | |
| |
|
| | Total | | $ | 21.2 | | $ | 9.3 |
| | |
| |
|
| Directly-related expenses | | | | | | |
| Short-term | | $ | 5.7 | | $ | 2.0 |
| Long-term | | | 1.3 | | | 0.9 |
| | |
| |
|
| | Total | | $ | 7.0 | | $ | 2.9 |
| | |
| |
|
Deferred net revenues and directly-related expenses are classified as "Deferred revenues" (short-term and long-term), and "Prepaid expenses and other," and "Other assets, net," respectively, on the consolidated balance sheets.
The transition to a term model also has the effect of decreasing operating cash flows in the early stages of the transition. Under perpetual pricing, the entire license fee and the first year of maintenance is generally billed and collected at the commencement of the arrangement. Under term pricing, a typical contract term is three years. We generally bill and collect term license fee installments in advance of each annual period. The amount of the annual term billing is less than the perpetual billing, resulting in lower cash flows in the initial annual term license period. Annual term billing results in an increase in deferred revenues and an increase in operating cash flows at the commencement of each annual billing period.
Recurring Revenue Model and Revenue Presentation
During 2007, we recognized approximately 77% of total net revenue from recurring sources, which we define as revenues from term license, maintenance on perpetual licenses and other recurring. This high proportion of recurring revenues allows us to take a long-term view and invest in our business while remaining confident that our operating results will be reasonably predictable.
During the first quarter of 2007, we changed our presentation of revenue and associated cost of revenues to more clearly show the nature and components of our revenues under a term licensing model and the predominance of revenue from recurring sources. We believe the current presentation more clearly reflects our business as well as the principal underlying factors impacting our long-term growth and predictability. We currently categorize our revenues as follows: "Term license, maintenance and other recurring," "Perpetual license fees" and "Professional services and other." Please refer to Note 1, "Summary of Significant Accounting Policies," to our consolidated financial statements for a complete description of the changes.
Term License Contract Value
The following table (unaudited) summarizes the Company's term license bookings excluding Advent Axys clients who migrate to Advent's APX product: term contract value (in thousands),
39
associated average term (in years) and annual contract value (in thousands) by quarter for fiscal 2007, 2006 and 2005:
| | First Quarter
| | Second Quarter
| | Third Quarter
| | Fourth Quarter
| | Total
|
|---|
| 2007 | | | | | | | | | | | | | | | |
| Term Contract Value(1) | | $ | 9,848 | | $ | 17,009 | | $ | 18,329 | | $ | 36,069 | | $ | 81,255 |
| Average Term(2) | | | 3.4 | | | 3.0 | | | 3.6 | | | 3.5 | | | 3.4 |
| Annual Contract Value(3) | | $ | 2,871 | | $ | 5,741 | | $ | 5,090 | | $ | 10,364 | | $ | 24,066 |
2006 |
|
|
|
|
|
|
|
|
|
|
|
|
|
|
|
| Term Contract Value(1) | | $ | 7,864 | | $ | 12,872 | | $ | 10,600 | | $ | 17,474 | | $ | 48,810 |
| Average Term(2) | | | 2.5 | | | 3.1 | | | 2.9 | | | 3.2 | | | 3.0 |
| Annual Contract Value(3) | | $ | 3,099 | | $ | 4,139 | | $ | 3,601 | | $ | 5,539 | | $ | 16,378 |
2005 |
|
|
|
|
|
|
|
|
|
|
|
|
|
|
|
| Term Contract Value(1) | | $ | 6,378 | | $ | 3,967 | | $ | 4,924 | | $ | 7,464 | | $ | 22,733 |
| Average Term(2) | | | 4.7 | | | 2.9 | | | 3.3 | | | 2.7 | | | 3.2 |
| Annual Contract Value(3) | | $ | 1,367 | | $ | 1,355 | | $ | 1,496 | | $ | 2,797 | | $ | 7,015 |
- (1)
- Term contract values reflect the total value of all new term licenses signed by clients in the period.
- (2)
- Average term is weighted by contract value for all new term licenses signed in the period.
- (3)
- Annual contract value is the mathematical result of dividing Term Contract Value by Average Term.
Critical Accounting Policies and Estimates
Management's discussion and analysis of our financial condition and results of operations are based upon our consolidated financial statements and related notes, which have been prepared in accordance with accounting principles generally accepted in the United States of America. We review the accounting policies used in reporting our financial results on a regular basis. The preparation of these financial statements requires us to make estimates and judgments that affect the reported amounts of assets, liabilities, revenues and expenses, and related disclosure of contingent liabilities.
On an ongoing basis, we evaluate the process we use to develop estimates. We base our estimates on historical experience and on other information that we believe are reasonable for making judgments at the time the estimates are made. Actual results may differ from our estimates due to actual outcomes being different from those on which we based our assumptions.
We believe the following accounting policies contain the more significant judgments and estimates used in the preparation of our consolidated financial statements:
- •
- Revenue recognition and deferred revenues;
- •
- Income taxes;
- •
- Stock-based compensation;
- •
- Restructuring charges and related accruals;
- •
- Business combinations;
- •
- Goodwill;
- •
- Impairment of long-lived assets;
- •
- Legal contingencies; and
40
- •
- Sales returns and accounts receivable allowances.
Revenue recognition. Our revenue recognition policies contain our most significant judgments and estimates. Our revenue policy is further described in Note 1, "Summary of Significant Accounting Policies" to the consolidated financial statements.
We recognize revenue from term license, maintenance and other recurring; perpetual license fees, and professional services and other. We offer a wide variety of products and services to a large number of financially sophisticated customers. While many of our lower-priced license transactions, maintenance contracts, subscription-based transactions and professional services projects conform to a standard structure, many of our larger transactions are complex and may require significant review and judgment in our application of generally accepted accounting principles.
Software licenses. We recognize revenue from the licensing of software when persuasive evidence of an arrangement exists, the product has been delivered, the fee is fixed or determinable and collection of the resulting receivable is probable. We generally use a signed license agreement as evidence of an arrangement. Sales through our distributors are evidenced by a master agreement governing the relationship together with binding order forms and signed contracts from the distributor's customers. Revenue is recognized once shipment to the distributor's customer has taken place and when all other revenue recognition criteria have been met. Delivery occurs when a product is delivered to a common carrier F.O.B shipping point or upon notification that software is available for electronic download through our fulfillment vendor. Some of our arrangements include acceptance provisions, and if such acceptance provisions are present, delivery is deemed to occur upon acceptance. We assess whether the fee is fixed or determinable based on the payment terms associated with the transaction. We assess whether the collectibility of the resulting receivable is probable based on a number of factors, including the credit worthiness of the customer determined through review of credit reports, our transaction history with the customer, other available information and pertinent country risk if the customer is located outside the United States. Our standard payment terms are due at 180 days or less, but payment terms may vary based on the country in which the agreement is executed. Software licenses are sold with maintenance and, frequently, professional services.
We typically license our products on a per server, per user basis with the price per customer varying based on the selection of the products licensed, the assets under administration, the number of site installations and the number of authorized users. We have continued our transition from selling mostly perpetual licenses to selling a mix of term and perpetual licenses, and we expect term license revenue to increase as a proportion of total recurring revenues (which we define as term license, maintenance and other recurring revenues) in the future. Term license revenue comprised approximately 22% and 14% of total recurring revenues in 2007 and 2006, respectively. Revenue recognition for software licensed under term and perpetual license models differs depending on which type of contract a customer signs:
- •
- Term licenses
Term license contract prices include fees for both the software license and maintenance. We offer multi-year term licenses by which a customer makes a binding commitment that typically spans three years. For multi-year term licenses, we have not established vendor specific objective evidence, or VSOE of fair value for the software license and maintenance components and, as a result, in situations where we are also performing related professional services, we defer all revenue and directly related expenses under the arrangement until the implementation services are complete and the remaining services are substantially complete. At the point professional services are substantially completed, we recognize a pro-rata amount of the term license revenue, professional services fees earned and related expenses, based on the elapsed time from the start of the term license to the substantial completion of professional services. We determine whether services are substantially complete by consulting with the professional services group
41
and applying management judgment. Term license revenue for the remaining contract years and the remaining deferred professional services revenue and related expenses are recognized ratably over the remaining contract length. When multi-year term licenses are sold and do not include related professional services, we recognize the entire term license revenue ratably over the period of the contract term from the effective date of the license agreement assuming all other revenue recognition criteria have been met. Revenues from term licenses are included in "Term license, maintenance and other recurring" revenues on the consolidated statement of operations.
- •
- Perpetual licenses
We allocate revenue to delivered components, normally the license component of the arrangement, using the residual method, based on VSOE of fair value of the undelivered elements (generally the maintenance and professional services components), which is specific to us. We determine the fair value of the undelivered elements based on the historical evidence of the Company's stand-alone sales of these elements to third parties and renewal rates. If VSOE of fair value does not exist for any undelivered elements, then the entire arrangement fee is deferred until delivery of that element has occurred except post customer support. Revenues from perpetual licenses are included in "Perpetual license fees" revenue on the consolidated statement of operations.
Certain of our perpetual and term license contracts include asset-based fee structures that provide additional revenues based on the assets that the client manages using our software ("Assets Under Administration" or "AUA"). Contracts containing an AUA fee structure have a defined measurement period which requires the client to self-report actual AUA in arrears of the specified period. AUA fees above the stated minimum fee for the same period are considered incremental fees. Because incremental fees are not determinable until the conclusion of the measurement period, they are both earned and recognized in arrears, on a quarterly or annual basis. Incremental fees from perpetual AUA contracts are included in "Perpetual license fees" on the consolidated statement of operations. Incremental fees from term AUA contracts are included in "Term license, maintenance and other recurring" revenue on the consolidated statement of operations.
For certain term AUA contracts signed in 2006, which will be entering the second year of the arrangement in 2007, we began accruing the minimum AUA component of the fees in the applicable period during the first quarter of 2007 rather than in arrears as was the treatment for earlier contracts. We have gained more experience in working with these types of arrangements and are able to conclude that the minimum fees are fixed and determinable. The change in the first quarter of 2007 to our revenue recognition practice to start to accrue for minimum fees is based on an overall affirmative experience with our existing AUA-based arrangements where our historical experience has shown that we have received the AUA report, invoiced the client for both the minimum and incremental amounts, and received payment. Therefore, beginning in the first quarter of 2007, we are recognizing AUA contract minimum fees in the period to which they are applicable, whereas we continue to recognize incremental fees in arrears once our clients contractually report them to us, because the incremental fees are not determinable until reported. The impact of this change for 2007 was an increase to term license revenue of approximately $117,000.
For existing term license arrangements signed prior to 2006 which are in their second or third year where we had previously begun billing in arrears of the measurement period, we will continue to recognize revenue for the minimum (and incremental) value of the AUA fees upon receipt of the customer's AUA report.
If a customer purchased our software and chose to enter into a soft dollar arrangement through a third-party broker/dealer, the original payment terms apply, regardless of the arrangement with the third-party broker/dealer. The option to soft dollar a transaction does not alter the underlying revenue recognition for the transaction; all the revenue recognition criteria listed in the "Software licenses" section above must be assessed in determining how the revenue will be recognized.
42
Maintenance and other recurring revenues. We offer annual maintenance programs on perpetual licenses that provide for technical support and updates to our software products. Maintenance fees are bundled with perpetual license fees in the initial licensing year and charged separately for renewals of annual maintenance in subsequent years. Fair value for maintenance is based upon either renewal rates stated in the contracts or separate sales of renewals to customers. Generally, we recognize maintenance revenue ratably over the contract term.
We offer other recurring revenue services that are either subscription-based or transaction-based, and primarily include the provision of software interfaces to, and the capability to download securities information from, third party data providers. We recognize revenue from recurring revenue transactions either ratably over the subscription period or as the transactions occur based on the terms of the arrangement.
Professional services and other revenues. We offer a variety of professional services that include project management, implementation, data conversion, integration, custom report writing and training. We base fair value for professional services upon separate sales of these services to customers. Our professional services are generally billed based on hourly rates together with reimbursement for travel and accommodation expenses. We recognize revenue as professional services are performed, except in the case of multi-year term license contracts which are described in the "term licenses" section above. Certain professional services arrangements involve acceptance criteria and in these cases, revenue and related expenses are recognized upon acceptance. Professional services and other revenues also include revenue from our user conferences.
Directly related expenses. When we defer service revenues, we also defer the direct costs incurred in the delivery of those services to the extent those costs are recoverable through the future revenues on non-cancelable contracts as prepaid contract expense. We recognize those deferred costs as costs of professional services revenues proportionally and over the same period that the deferred revenue is recognized as service revenue. When we defer license revenue, we defer the direct incremental costs incurred as a result of selling the contract (i.e. sales commissions earned by the salesforce as a part of their overall compensation) because those costs would not have been incurred but for the acquisition of that contract. We recognize those costs as sales and marketing expense proportionally and over the same period as the license revenues.
Income taxes. We account for worldwide income taxes under an asset and liability approach that requires the expected future tax consequences of temporary differences between book and tax bases of assets and liabilities to be recognized as deferred tax assets and liabilities. Significant judgment is required to determine our worldwide income tax provision. In the ordinary course of business, there are many transactions and calculations where the ultimate tax outcome is uncertain. Many of these uncertainties arise as a consequence of cost reimbursement arrangements among related entities, the process of identifying items of revenue and expense that have differing or preferential tax treatment and segregation of foreign and domestic income and expense to the appropriate taxing jurisdictions to reasonably allocate earnings. Additionally, the projections of pre-tax income for the year by legal entity can vary significantly from quarter-to-quarter which can have a significant impact on our projected effective tax rate. Although we believe that our judgments and estimates are reasonable, the final outcome could be different from that which is reflected in our income tax provision and accruals.
A valuation allowance is recorded to reduce the net deferred tax assets to an amount that will more likely than not be realized. In order for us to realize our deferred tax assets, we must be able to generate sufficient taxable income in the jurisdiction where the tax asset is located. We consider forecasted earnings, future taxable income and prudent and reasonable tax planning strategies in determining the need for a valuation allowance.
43
We calculate our current and deferred tax provision based on estimates and assumptions that could differ from the actual results reflected in income tax returns filed during the subsequent year. Adjustments based on filed returns are generally recorded in the period when the return is filed and the tax implication is known.
We are subject to audits by state, federal and foreign tax authorities. Our estimates for the potential outcome of any uncertain tax matter are judgmental. We believe we have adequately provided for any reasonably foreseeable outcome related to these matters. However, our future results may include adjustments to our estimated tax liabilities.
Stock-based compensation. The adoption of SFAS 123R on January 1, 2006 had a material adverse impact on our consolidated financial position and results of operations. See Note 10, "Stock-Based Compensation", to the consolidated financial statements for additional discussion regarding our stock-based compensation including pro forma disclosures for prior periods as if we had recorded stock-based compensation expense. The calculation of stock-based compensation requires reliance on significant assumptions, judgments and estimates.
Management judgment was required in the initial selection and implementation of policies to conform with the requirements of SFAS 123R. Management elected to adopt the standard using the modified prospective method, to utilize the Black-Scholes option pricing model to determine the fair value of expense and to recognize the stock-based compensation expense on a straight-line basis over the service period. Had management selected other implementation, valuation or recognition methodologies, the presented results could vary significantly.
We currently use the Black-Scholes option pricing model to determine the fair value of stock options, stock appreciation rights ("SAR") and employee stock purchase plan shares. The fair value of our restricted stock units is calculated based on the fair market value of our stock on the date of grant. The determination of the fair value of stock-based payment awards on the date of grant using an option-pricing model is affected by our stock price as well as assumptions regarding a number of complex and subjective variables. These variables include our expected stock price volatility over the term of the awards, actual and projected employee exercise behavior, the risk-free interest rate and expected dividends. We use an external service provider to assist us in making reasonable estimates.
We estimate the volatility of our common stock based on an equally weighted average of historical and implied volatility of the Company's common stock. We determined that a blend of historical and implied volatility is more reflective of the market conditions and a better indicator of expected volatility than using purely historical volatility. We estimate the expected life of options and SARs granted based on historical experience of similar awards, giving consideration to the contractual terms of the stock-based awards, vesting schedules and expectations of future employee behavior. We base the risk-free interest rate on the US Treasury yield curve in effect at the time of grant for periods corresponding with the expected life of the option and SAR. We do not anticipate paying any cash dividends in the foreseeable future and therefore use an expected dividend yield of zero in the option pricing model.
These variables are sensitive and change on a daily basis. As a result, the financial result from issuing the same number of options or SARs can vary significantly over time. The following table
44
reflects the change in the fair value of a hypothetical option or SAR as a result of a hypothetical change in one of the underlying assumptions:
Assumption
| | Base Case
| | Assumption Change
| | Value Change
| | Assumption Change
| | Value Change
| |
|---|
| Grant and stock price | | $ | 50.00 | | +$1 | | $ | 0.30 | | -$1 | | $ | (0.30 | ) |
| Risk-free interest rate | | | 3.7 | % | +0.5% | | $ | 0.34 | | -0.5% | | $ | (0.34 | ) |
| Volatility | | | 39.7 | % | +5% | | $ | 1.65 | | -5% | | $ | (1.69 | ) |
| Expected life (years) | | | 4.6 | | +1 year | | $ | 0.98 | | -1 year | | $ | (1.26 | ) |
| Expected dividend yield | | | 3.0 | % | +1% | | $ | (1.30 | ) | -1% | | $ | 1.40 | |
Base Option Value |
|
$ |
14.78 |
|
|
|
|
|
|
|
|
|
|
|
Our SAR and stock option awards granted to employees cliff vest 20% after one year and monthly thereafter over the next 48 months. Our restricted stock unit ("RSU") awards cliff vest 50% after two years and 50% after four years. SFAS 123R requires forfeitures to be estimated at the time of grant and revised, if necessary, in subsequent periods if actual forfeitures differ from those estimates. Forfeitures are estimated based on our annual forfeiture rate. The annual forfeiture rate is based on our historical forfeiture experience over the last ten years. We use an external service provider to assist us in making reasonable estimates of the annual forfeiture rate. During the third quarter of 2007, we modified our forfeiture calculation for RSU awards to better reflect both the recent experience with RSU forfeitures and to reflect the longer cliff vesting periods. The effect of these modifications was to reduce stock-based compensation expense by $307,000 during 2007.
Restructuring charges and related accruals. Since 2003, we have developed and implemented formalized plans for restructuring our business to better align our resources to market conditions and recorded significant charges. In connection with these plans, we recorded estimated expenses for severance and benefits, lease cancellations, asset write-offs and other restructuring costs. Given the significance of, and the timing of the execution of such activities, this process is complex and involves periodic reassessments of estimates made at the time the original decisions were made, including evaluating real estate market conditions for expected vacancy periods and sub-lease rents. We continually evaluate the adequacy of the remaining liabilities under our restructuring initiatives. Although we believe that these estimates accurately reflect the costs of our restructuring plans, actual results may differ, thereby requiring us to record additional provisions or reverse a portion of such provisions.
Business combinations. When we acquire businesses, we allocate the purchase price to tangible assets and liabilities and identifiable intangible assets acquired. Any residual purchase price is recorded as goodwill. The allocation of the purchase price requires management to make significant estimates in determining the fair values of assets acquired and liabilities assumed, especially with respect to intangible assets. These estimates are based on historical experience and information obtained from the management of the acquired companies. These estimates can include, but are not limited to, the cash flows that an asset is expected to generate in the future, the appropriate weighted-average cost of capital, and the cost savings expected to be derived from acquiring an asset. These estimates are inherently uncertain and unpredictable. In addition, unanticipated events and circumstances may occur which may affect the accuracy or validity of such estimates.
Goodwill. We review our goodwill for impairment annually during the fourth quarter of our fiscal year (as of November 1) and more frequently if an event or circumstance indicates that an impairment loss has occurred. We are required to test our goodwill for impairment at the reporting unit level. We have determined that we had three reporting units as of November 1, 2007. The test for goodwill impairment is a two-step process.
45
The first step compares the fair value of each reporting unit with its respective carrying amount, including goodwill. If the fair value of the reporting unit exceeds its carrying amount, goodwill of our reporting unit is considered not impaired, thus the second step of the impairment test is unnecessary.
The second step, used to measure the amount of impairment loss, compares the implied fair value of each reporting unit's goodwill with the respective carrying amount of that goodwill. If the carrying amount of the reporting unit goodwill exceeds the implied fair value of that goodwill, an impairment loss shall be recognized in an amount equal to that excess.
Determining the fair value of a reporting unit is subjective and requires judgment at many points during the test including the development of future revenue and expense forecasts used to calculate future cash flows, the selection of risk-adjusted discount rates, and determination of market comparable entities. During the fourth quarter of 2007, we completed our annual impairment test which did not indicate impairment for any of our reporting units.
Impairment of long-lived assets. We review our other long-lived assets including property and equipment and other intangibles for impairment whenever events or changes in circumstances indicate that the carrying amount of these assets may not be recoverable. Determining whether an impairment trigger has occurred is subjective and requires judgment. Our recoverability test compares the assets' carrying amount to their expected future undiscounted net cash flows. We estimate future revenue and expense amounts to calculate future cash flows. We believe our forecast revenue and expense amounts are reasonable but forecast amounts are inherently uncertain and unpredictable.
Legal contingencies. From time to time, Advent is involved in claims and legal proceedings that arise in the ordinary course of business. We use our judgment to assess both the likelihood and potential amount of a contingency. We periodically review our assessment whenever there is a change in the facts and circumstances of these proceedings. Litigation is subject to inherent uncertainties and our view of these matters may change in the future. Were an unfavorable outcome to occur, there exists the possibility of a material adverse impact on our financial position and results of operations for the period in which the unfavorable outcome occurs, and potentially in future periods.
Sales returns and accounts receivable allowances. Our standard practice is to enforce our contract terms and not allow our customers to return software. We have, however, allowed customers to return software on a limited case-by-case basis and have recorded sales returns provisions as offsets to revenue in the period the sales return becomes probable. We use our judgment in estimating our sales returns. We analyze customer demand, acceptance of products and historical returns when evaluating the adequacy of the allowance for sales returns, which are not generally provided to customers. Beginning in 2004, we used an algorithm to supplement our judgment for calculating the value of reserves that considered the last 18 months of experience into account. Beginning in the second quarter of 2007, we changed our algorithm to include the last 12 months of return experience.
Our ability to estimate returns is based on our long history of experience with relatively homogenous transactions and the fact that the return period is short. The estimates for returns are adjusted periodically based upon changes in historical rates of returns and other related factors. We have recorded a sales returns provision (benefit) to decrease (increase) revenue for these situations based on our historical experience of $0.1 million, $(0.8) million and $2.2 million in fiscal 2007, 2006 and 2005, respectively.
We use our judgment in estimating our allowance for doubtful accounts. In order to estimate our allowance for doubtful accounts, we analyze specific accounts receivables, historical bad debts, customer concentrations, customer credit-worthiness, current economic trends and changes in customer payment terms. We have recorded a provision for (reduction of) bad debt of $0.1 million, $1.0 million and $(0.4) million in fiscal 2007, 2006 and 2005, respectively.
46
Reclassifications
Certain prior period amounts have been reclassified to conform to the current period presentation to better reflect our view of the current business. These reclassifications do not affect total net revenues, net income, cash flows, or stockholders' equity. Please refer to Note 1, "Summary of Significant Accounting Policies," to our consolidated financial statements for a complete description of the reclassifications.
Results of Operations for Fiscal Years 2007, 2006 and 2005
The following table summarizes, for the periods indicated, certain items in the consolidated statements of operations as a percentage of net revenues. The financial information and the ensuing discussion should be read in conjunction with the accompanying consolidated financial statements and notes thereto.
| | Fiscal Years
| |
|---|
| | 2007
| | 2006
| | 2005
| |
|---|
| Net revenues: | | | | | | | |
| Term license, maintenance and other recurring | | 77 | % | 75 | % | 66 | % |
| Perpetual license fees | | 12 | | 15 | | 21 | |
| Professional services and other | | 10 | | 10 | | 13 | |
| | |
| |
| |
| |
| | Total net revenues | | 100 | | 100 | | 100 | |
Cost of revenues: |
|
|
|
|
|
|
|
| Term license, maintenance and other recurring | | 18 | | 18 | | 18 | |
| Perpetual license fees | | * | | * | | 1 | |
| Professional services and other | | 13 | | 13 | | 11 | |
| Amortization of developed technology | | 1 | | 1 | | 2 | |
| | |
| |
| |
| |
| | Total cost of revenues | | 32 | | 32 | | 31 | |
| | |
| |
| |
| |
| | Gross margin | | 68 | | 68 | | 69 | |
Operating expenses: |
|
|
|
|
|
|
|
| Sales and marketing | | 26 | | 27 | | 24 | |
| Product development | | 19 | | 19 | | 18 | |
| General and administrative | | 16 | | 18 | | 20 | |
| Amortization of other intangibles | | 1 | | 2 | | 2 | |
| Acquired in-process research and development | | * | | * | | * | |
| Restructuring charges | | * | | 2 | | 1 | |
| | |
| |
| |
| |
| | Total operating expenses | | 63 | | 68 | | 66 | |
| | |
| |
| |
| |
| Income (loss) from operations | | 6 | | * | | 4 | |
Interest expense |
|
(1 |
) |
* |
|
* |
|
| Interest income and other, net | | 1 | | 2 | | 3 | |
| Gain on sale of equity investments | | 2 | | * | | 2 | |
| | |
| |
| |
| |
| Income before income taxes | | 8 | | 2 | | 9 | |
| Provision for (benefit from) income taxes | | 2 | | (43 | ) | * | |
| | |
| |
| |
| |
| | Net income | | 6 | % | 45 | % | 8 | % |
| | |
| |
| |
| |
- *
- Less than 1%
47
NET REVENUES
| | 2007
| | 2006
| | 2005
|
|---|
| | (in thousands, except percentages)
|
|---|
| Total net revenues | | $ | 215,303 | | $ | 184,093 | | $ | 168,701 |
| Change over prior year | | $ | 31,210 | | $ | 15,392 | | | |
| Percent change over prior year | | | 17 | % | | 9 | % | | |
Our net revenues are made up of three components: term license, maintenance and other recurring revenue; perpetual license fees; and professional services and other revenue. Term license fees include both the software license fees and maintenance fees recorded under a time based contract. Maintenance revenues are derived from maintenance fees charged for perpetual license arrangements and recurring revenues are derived from our subscription-based or transaction-based services. Perpetual license revenues are derived from the licensing of software products under a perpetual arrangement. Professional services and other revenues include fees for consulting, training services, commission revenues from "soft dollaring" of third-party products and services and our client conferences. Sales returns, which we generally do not provide to customers, are accounted for as deductions to these three revenue categories based on our historical experience.
Each of the major revenue categories has historically varied as a percentage of net revenues, and we expect this variability to continue in the near term. This variability is primarily due to the introduction of new products and subscription services, the relative size and timing of individual perpetual software license sales, as well as the size and timing of completion of term license implementations. As we continue to transition the substantial majority of our license agreements to term, we expect our revenue from recurring sources to continue to increase as a percentage of net revenues. When the transition is substantially complete, we expect less variability between our major categories of revenues because the variation from large perpetual license deals will decrease.
Net revenues increased in 2007 and 2006 due to growing information technology spending by our customers, as well as a general increase in customer adoption for many of our products and services, including principally substantial increases in sales of our APX and Geneva products. During 2007, we sold 109 APX licenses and added 55 new Geneva clients The year-over-year growth in net revenues included large increases in term license, maintenance and recurring revenues, as well as a 20% increase in revenue from international sales.
International sales, which are based on the location to which the product is shipped, also contributed to our growth in 2007 and 2006 and were $26.6 million, $22.2 million and $18.7 million in 2007, 2006 and 2005, respectively. We plan to continue expanding our international growth, both in our current markets and elsewhere, and we expect revenue growth in EMEA in 2008 to be consistent with our overall revenue growth. The revenues from customers in any single international country did not exceed 10% of total net revenues.
Going forward, we expect normal seasonal weakness to impact revenues and bookings in the first quarter of 2008, followed by modest growth as the year progresses resulting in expected net revenues to be in the range of $248 million to $254 million for the fiscal year 2008.
48
Term License, Maintenance and Other Recurring Revenues
| | 2007
| | 2006
| | 2005
| |
|---|
| | (in thousands, except percentages)
| |
|---|
| Term license revenues | | $ | 37,378 | | $ | 18,938 | | $ | 6,520 | |
| Maintenance revenues | | | 85,473 | | | 80,934 | | | 70,351 | |
| Other recurring revenues | | | 43,689 | | | 38,232 | | | 34,051 | |
| | |
| |
| |
| |
| Total term license, maintenance and other recurring revenues | | $ | 166,540 | | $ | 138,104 | | $ | 110,922 | |
| Percent of total net revenues | | | 77 | % | | 75 | % | | 66 | % |
| Change over prior year | | $ | 28,436 | | $ | 27,182 | | | | |
| Percent change over prior year | | | 21 | % | | 25 | % | | | |
Term license revenues, which include software license and maintenance fees for term licenses, grew 97% in 2007 from 2006 and represented 22% of total term license, maintenance and other recurring revenues in 2007, up from 14% in 2006 and 6% in 2005. We began our transition to a term licensing model in 2004 which has resulted in the subsequent growth of term license revenues as we sign more contracts on a term basis. The increases reflected the continued market acceptance of our Geneva, APX, Partner and Moxy products.
Maintenance revenues increased by $4.5 million and $10.6 million during 2007 and 2006, respectively. These increases were attributable to the impact of price increases on annual perpetual maintenance renewals purchased by our installed customer base, up-selling to higher value maintenance plans and, to a lesser extent, an increase in new perpetual maintenance support contracts, partially offset by maintenance de-activations and downgrades, and perpetual license customers migrating to term licenses. We disclose our maintenance renewal rate one quarter in arrears in order to include substantially all payments received against the maintenance invoices for that quarter. Our maintenance renewal rate has been in the range of 90% to 94% over the previous four quarters and was 90% for the third quarter of 2007.
Other recurring revenues increased $5.5 million and $4.2 million during 2007 and 2006, respectively, mainly as a result of growth in our subscription, data management revenue streams and outsourced services including Advent Back Office Service (ABOS) and Advent Custodial Data (ACD).
As a percentage of total net revenues, total term license, maintenance and other recurring revenues increased to 77% during 2007 from 75% and 66% in 2006 and 2005, respectively. These increases as a percentage of total net revenues were attributable to the continued emphasis in term license sales relative to perpetual license sales.
We expect term license, maintenance and other recurring revenues to be up significantly in amount and as a percentage of total net revenues in 2007 as we have reached the turning point in our transition to a term model and expect to grow license revenues compared to 2006 due principally to continued bookings of both term and some perpetual licenses and recognition of term license revenue deferred in prior years. As we sell more products on a term license model, we defer a greater portion of license revenue over the term of the contract, instead of recognizing the license revenue up front. The net effect, assuming most customers renew their contracts upon expiration of the initial term, is to build a long-term license and maintenance stream and also enhance predictability of license revenues.
49
Perpetual License Fees
| | 2007
| | 2006
| | 2005
| |
|---|
| | (in thousands, except percentages)
| |
|---|
| Perpetual license fees | | $ | 26,504 | | $ | 27,098 | | $ | 35,564 | |
| Percent of total net revenues | | | 12 | % | | 15 | % | | 21 | % |
| Change over prior year | | $ | (594 | ) | $ | (8,466 | ) | | | |
| Percent change over prior year | | | (2 | )% | | (24 | )% | | | |
Perpetual license fees decreased $0.6 million or 2% in 2007 compared to 2006 and decreased $8.5 million or 24% in 2006 compared to 2005. As a percent of total net revenues, perpetual license fees decreased to 12% in 2007, from 15% and 21% in 2006 and 2005, respectively. Consistent with our transition to term licensing, perpetual license fees continue to account for a smaller percentage of total net revenues. Offsetting the reduction in perpetual license fees, incremental AUA fees from perpetual licenses included in the "Perpetual license fees" caption were $8.6 million, $7.7 million and $6.0 million in 2007, 2006 and 2005, respectively, representing increases of 11% and 27% during 2007 and 2006, respectively. In addition, our MicroEdge subsidiary, which continues to sell a majority of its products under a perpetual license model, recorded perpetual license fees of $7.4 million, an increase of $0.9 million or 14% over 2006 and reflecting strong growth of its core product Gifts.
We expect perpetual license fees will decrease in 2008 as compared to 2007, primarily as a result of our continued transition to term licensing.
Professional Services and Other Revenues
| | 2007
| | 2006
| | 2005
| |
|---|
| | (in thousands, except percentages)
| |
|---|
| Professional services and other revenues | | $ | 22,259 | | $ | 18,891 | | $ | 22,215 | |
| Percent of total net revenues | | | 10 | % | | 10 | % | | 13 | % |
| Change over prior year | | $ | 3,368 | | $ | (3,324 | ) | | | |
| Percent change over prior year | | | 18 | % | | (15 | )% | | | |
Professional services and other revenues include consulting, project management, custom integration, training and soft dollar transactions for products and services not related to Advent product or services. Professional services projects related to Axys, Moxy and Partner products generally can be completed in a two-to six-month time period, while services related to Geneva and APX products may require a four- to nine-month implementation period.
Professional services recorded 2007 revenue of $22.3 million, an 18% increase over 2006. The increase was a reflection of growth in our consulting, project management, data conversion and custom reporting revenues associated with implementations of our APX and Geneva products.
The increase was partially offset by a 66% increase in the net deferral of professional services revenue for services performed on term license implementations. When services are performed with term license implementations, service revenue is deferred until the implementation is complete. Then service revenues are recognized over the remaining license term. We have experienced an increase in implementation services after the launch of our APX product and the sales success of our Geneva product, which are both sold under a term license model. We deferred net professional services revenue of $9.5 million in 2007, compared to the revenue deferral of $5.7 million in 2006.
The decrease in professional services and other revenues of $3.3 million in 2006 from 2005 was primarily attributable to the net deferral of professional services revenue for services performed on term license implementations. There were more term license implementation projects in progress as of December 31, 2006 compared with the prior year, and as a result there was a significant increase in the
50
deferral of professional services revenue. We deferred net professional services revenues of approximately $5.7 million in 2006 as compared to $1.0 million in 2005. In addition, revenues earned from third-party products paid for through soft dollar transactions decreased due to fewer transactions as we completed the wind down of the soft dollar component of Second Street Securities in the fourth quarter of 2006.
We expect that professional services and other revenues will increase in 2008 as we expect to add more billable headcount to support project implementation growth, and we expect to recognize revenue from term deals signed in 2007 upon their completion of implementation during 2008.
Revenues by Segment
| | 2007
| | 2006
| | 2005
|
|---|
| | (in thousands)
|
|---|
| Advent Investment Management | | $ | 191,490 | | $ | 162,609 | | $ | 145,897 |
| MicroEdge | | | 23,733 | | | 21,182 | | | 20,026 |
| Other | | | 80 | | | 302 | | | 2,778 |
| | |
| |
| |
|
| | Total | | $ | 215,303 | | $ | 184,093 | | $ | 168,701 |
| | |
| |
| |
|
We have two reportable segments: Advent Investment Management ("AIM") and MicroEdge. AIM derives revenues from the development, marketing and sale of software products, data interfaces and related maintenance and services that automate, integrate and support certain mission-critical functions of investment management organizations. MicroEdge derives revenues from the sale of software and services for grant management, gifts matching and volunteer tracking for the grant-making community. See Note 13, "Segment and Geographical Information", to our consolidated financial statements.
The 18% and 11% increases in AIM's revenues in fiscal 2007 and 2006, respectively, reflected the improved economic conditions and growth in the financial markets, increased international sales as well as the continued market acceptance of our Axys, APX, Moxy, Partner and Geneva products. AIM's revenue increases in 2007 and 2006 also reflected an increase in new maintenance support contracts as a result of new license deals, up-selling existing customers to higher value maintenance plans and price increases for maintenance contracts from our installed customer base, partially offset by attrition from within our existing installed customer base. We also had growth in international sales in in 2007 and 2006. Our assets under administration revenues increased by $0.9 million and $1.6 million in 2007 and 2006, respectively, as a result of the growth in assets under administration for our fund administration clients.
The technology spending patterns of organizations in MicroEdge's primary markets (independent foundations, community foundations and corporations) are directly affected by economic fluctuations as foundation budgets are largely driven by endowment income. Given that endowments often contain market-exposed components, they are significantly affected by the economy and foundation spending typically decreases in an economic downturn. Community foundations are subject to similar influences, compounded by the fact that in many cases much of their ongoing funding and endowment comes from active donors who may increase or reduce their giving depending on the economic climate and the related effect on their income and wealth. Corporations typically fund charitable activities from operating budgets, and the allocation to charitable donations and supporting company charitable operations is often closely tied to a company's performance. Thus, corporate philanthropy and spending on related technology are correlated with company and overall economic performance. The 12% and 6% increases in MicroEdge revenues in fiscal 2007 and 2006, respectively, primarily reflected an increase in perpetual license sales in MicroEdge's core product Gifts and to a lesser extent maintenance revenues due to price increases and continued strong customer retention.
51
The revenue decrease in our Other segment in fiscal 2007 and 2006 primarily resulted from the winding down of the soft dollar component of our broker/dealer subsidiary.
COST OF REVENUES
| | 2007
| | 2006
| | 2005
| |
|---|
| | (in thousands, except percentages)
| |
|---|
| Total cost of revenues | | $ | 67,890 | | $ | 58,802 | | $ | 51,797 | |
| Percent of total net revenues | | | 32 | % | | 32 | % | | 31 | % |
| Change over prior year | | $ | 9,088 | | $ | 7,005 | | | | |
| Percent change over prior year | | | 15 | % | | 14 | % | | | |
Our cost of revenues is made up of four components: cost of term license, maintenance and other revenues; cost of perpetual license fees; cost of professional services and other; and amortization of developed technology.
Cost of Term License, Maintenance and Other Recurring
| | 2007
| | 2006
| | 2005
| |
|---|
| | (in thousands, except percentages)
| |
|---|
| Cost of term license, maintenance and other recurring | | $ | 38,008 | | $ | 32,968 | | $ | 29,938 | |
| Percent of total term license, maintenance and other recurring revenues | | | 23 | % | | 24 | % | | 27 | % |
| Change over prior year | | $ | 5,040 | | $ | 3,030 | | | | |
| Percent change over prior year | | | 15 | % | | 10 | % | | | |
Cost of term license fees consists primarily of royalties and other fees paid to third parties, the fixed direct labor and third-party costs involved in producing and distributing our software, and cost of product media including duplication, manuals and packaging materials. Cost of maintenance and other recurring revenues is primarily comprised of the direct costs of providing technical support services under maintenance agreements and other services for recurring revenues, and royalties paid to third party subscription-based and transaction-based vendors.
Cost of term license, maintenance and other recurring fluctuated due to the following (in thousands):
| | Change From 2006 to 2007
| | Change From 2005 to 2006
| |
|---|
| Increased payroll and related | | $ | 4,487 | | $ | 2,609 | |
| Increased travel and entertainment | | | 133 | | | 395 | |
| Increased computers and telecom | | | 162 | | | 78 | |
| Various other items | | | 258 | | | (52 | ) |
| | |
| |
| |
| | Total change | | $ | 5,040 | | $ | 3,030 | |
| | |
| |
| |
The increases in 2007 and 2006 were due primarily to an increase in compensation and related costs resulting from increases in salary costs and headcount (248 heads at December 31, 2007 as compared to 206 heads at December 31, 2006) which enables us to deliver the services we provide to our growing number of clients in their day-to-day use of our software.
We expect cost of term license, maintenance and other recurring revenue to increase in dollar amount but not as a percentage of revenue in 2008 as compared to 2007 due to the continued hiring of personnel to support additional bookings from 2007 as well as those expected in 2008.
52
Cost of Perpetual License Fees
| | 2007
| | 2006
| | 2005
| |
|---|
| | (in thousands, except percentages)
| |
|---|
| Cost of perpetual license fees | | $ | 851 | | $ | 817 | | $ | 961 | |
| Percent of total perpetual license revenues | | | 3 | % | | 3 | % | | 3 | % |
| Change over prior year | | $ | 34 | | $ | (144 | ) | | | |
| Percent change over prior year | | | 4 | % | | (15 | )% | | | |
Cost of perpetual license fees consists primarily of royalties and other fees paid to third parties, the fixed direct labor and third party costs involved in producing and distributing our software, and cost of product media including duplication, manuals and packaging materials. The cost of perpetual license fees has remained consistent with the prior years and we expect these fees to decrease slightly in 2008 as a result of our continuing transition away from perpetual licensing.
Cost of Professional Services and Other
| | 2007
| | 2006
| | 2005
| |
|---|
| | (in thousands, except percentages)
| |
|---|
| Cost of professional services and other | | $ | 27,464 | | $ | 23,817 | | $ | 18,323 | |
| Percent of total professional services revenues | | | 123 | % | | 126 | % | | 82 | % |
| Change over prior year | | $ | 3,647 | | $ | 5,494 | | | | |
| Percent change over prior year | | | 15 | % | | 30 | % | | | |
Cost of professional services and other revenue consists primarily of personnel related costs associated with the client services organization in providing consulting, custom report writing and conversions of data from clients' previous systems. Also included are direct costs associated with third-party consultants and travel expenses. Additionally, we defer direct professional services costs until we have completed the term license implementation services.
Cost of professional services and other fluctuated due to the following (in thousands):
| | Change From 2006 to 2007
| | Change From 2005 to 2006
| |
|---|
| Increased payroll and related | | $ | 3,016 | | $ | 4,722 | |
| Increased outside services | | | 710 | | | 420 | |
| Increased travel and entertainment | | | 573 | | | 1,125 | |
| Increased recruiting | | | 333 | | | 396 | |
| Increased (decreased) marketing | | | 294 | | | (104 | ) |
| Increased service cost deferral related to term implementations | | | (1,505 | ) | | (1,904 | ) |
| Various other items | | | 226 | | | 839 | |
| | |
| |
| |
| | Total change | | $ | 3,647 | | $ | 5,494 | |
| | |
| |
| |
The increases in 2007 and 2006 primarily reflects the higher costs from payroll and related expenses, higher utilization of outside services, recruiting expenses, and travel costs. Payroll related expenses increased as a result of an increase in headcount. As a result of the increases in our license transactions and customer base in 2006, we have increased headcount in our client services and consulting groups to 140 at December 31, 2007 from 125 at December 31, 2006, and 96 at December 31, 2005. The increase in 2006 also reflected an increase in stock-based compensation expense of $0.8 million due to the adoption of SFAS 123R on January 1, 2006. Higher utilization of outside services, including third parties to assist in our professional service projects, also contributed to
53
the overall cost increase during 2007 and 2006. In addition, travel expenses increased due to travel associated with more professional service projects. Consistent with the increase in headcount, recruiting costs increased during fiscal 2007 and 2006.
We have experienced an increase in implementation services with the launch of our APX product and sales of our Geneva product, which are both sold under the term license model. As there were more term license implementation projects, primarily Geneva-related, in progress as of December 31, 2007 compared to the previous two years, we have experienced an increase in the deferral of professional service costs during the past two years. We deferred net professional service costs of $3.8 million during 2007 compared to $2.3 million and $0.4 million during 2006 and 2005, respectively.
Gross margins for professional services in 2007 and 2006 continue to be negative as a result of the significant deferral of professional services revenues and costs associated with our term license implementation. We defer only the direct costs associated with services performed on these arrangements. Indirect costs such as management and other overhead expenses are recognized in the period in which they are incurred, with no revenue to offset them. In addition, we have added headcount in our consulting group. Since these new employees undergo a training period, typically of six months, before becoming fully billable, their associated costs have a near-term negative impact on gross margins.
We expect cost of professional services and other in 2008 to increase in dollar amount but not as a percentage of revenue as compared to 2007, primarily as we expect to add more billable headcount to support project implementation growth.
Amortization of Developed Technology
| | 2007
| | 2006
| | 2005
| |
|---|
| | (in thousands, except percentages)
| |
|---|
| Amortization of developed techology | | $ | 1,567 | | $ | 1,200 | | $ | 2,575 | |
| Percent of total net revenues | | | 1 | % | | 1 | % | | 2 | % |
| Change over prior year | | $ | 367 | | $ | (1,375 | ) | | | |
| Percent change over prior year | | | 31 | % | | (53 | )% | | | |
Amortization and impairment of developed technology represents amortization and impairment of acquisition-related intangible assets, and amortization of capitalized software development costs. The increase in amortization of developed technology in fiscal 2007 reflected increased amortization from software development costs capitalized under SFAS 86. The decrease in amortization of developed technology in fiscal 2006 reflected technology related intangible assets from prior acquisitions becoming fully amortized during fiscal 2005 and 2006.
We expect amortization of developed technology to be approximately $2.8 million in 2008 due to additional amortization expense from capitalized software developments costs and technology-related intangible assets acquired in 2007.
OPERATING EXPENSES
Sales and Marketing
| | 2007
| | 2006
| | 2005
| |
|---|
| | (in thousands, except percentages)
| |
|---|
| Sales and marketing | | $ | 55,422 | | $ | 50,177 | | $ | 40,269 | |
| Percent of total net revenues | | | 26 | % | | 27 | % | | 24 | % |
| Change over prior year | | $ | 5,245 | | $ | 9,908 | | | | |
| Percent change over prior year | | | 10 | % | | 25 | % | | | |
54
Sales and marketing expenses consist primarily of the costs of personnel involved in the sales and marketing process, sales commissions, advertising and promotional materials, sales facilities expense, trade shows, and seminars.
Sales and marketing expense fluctuated due to the following (in thousands):
| | Change From 2006 to 2007
| | Change From 2005 to 2006
| |
|---|
| Increased payroll and related | | $ | 3,986 | | $ | 5,722 | |
| Increased travel and entertainment | | | 1,212 | | | 963 | |
| Increased marketing | | | 551 | | | 866 | |
| Increased (decreased) outside services | | | 462 | | | (417 | ) |
| Increased (decreased) bad debt and broker fees | | | (1,479 | ) | | 700 | |
| Increased allocation of corporate expenses | | | 462 | | | 2,141 | |
| Various other items | | | 51 | | | (67 | ) |
| | |
| |
| |
| | Total change | | $ | 5,245 | | $ | 9,908 | |
| | |
| |
| |
The increase in expense for 2007 and 2006 reflected the growth of our business, while the decrease of expense as a percentage of revenue during 2007 reflected our achievement of improved efficiency. The increases in payroll and related expense were a result of an increase in headcount to 172 at December 31, 2007 from 162 and 149 at December 31, 2006 and 2005, respectively, and increases in variable compensation paid to these individuals as a result of higher bookings. We believe this investment in personnel will accelerate the momentum in our Geneva and APX product sales and increase customer satisfaction for all of our products. Additionally, an increase in stock-based compensation expense of $4.8 million contributed to the increase in payroll and related increase in 2006 as we adopted FAS 123R on January 1, 2006. Travel expenses increased due to more employees attending our annual Advent client conference resulting in higher travel and lodging costs. Marketing and outside services expense increased due to increased advertising initiatives to market our significant number of product releases for 2007. The fluctuations in broker fees and bad debt expense during fiscal 2007 and 2006 were primarily associated with the winding down of our soft dollar business in fiscal 2006.
In 2008, we expect sales and marketing expenses to increase in dollar amount but remain relatively flat as a percentage of total net revenues compared with 2007, as we increase our marketing activities in support of planned product launches and additions to the sales force.
Product Development
| | 2007
| | 2006
| | 2005
| |
|---|
| | (in thousands, except percentages)
| |
|---|
| Product development | | $ | 41,869 | | $ | 34,859 | | $ | 30,446 | �� |
| Percent of total net revenues | | | 19 | % | | 19 | % | | 18 | % |
| Change over prior year | | $ | 7,010 | | $ | 4,413 | | | | |
| Percent change over prior year | | | 20 | % | | 14 | % | | | |
Product development expenses consist primarily of salary and benefits for our development staff as well as contractors' fees and other costs associated with the enhancements of existing products and services and development of new products and services. We account for product development costs in accordance with SFAS 2, "Accounting for Research and Development Costs", and SFAS 86, "Accounting for Costs of Computer Software to be Sold, Leased, or Otherwise Marketed", which specifies that costs incurred to develop computer software products should be charged to expense as incurred until technological feasibility is reached for the products. Once technological feasibility is
55
reached, all software costs should be capitalized until the product is made available for general release to customers. The capitalized costs will be amortized using the greater of the ratio of the product's current gross revenues to the total of current expected gross revenues or on a straight-line basis over the software's estimated economic life of approximately three years.
Product developments expenses fluctuated due to the following (in thousands):
| | Change From 2006 to 2007
| | Change From 2005 to 2006
| |
|---|
| Increased payroll and related | | $ | 7,039 | | $ | 4,689 | |
| (Increased) decreased capitalization of product development | | | (1,798 | ) | | 21 | |
| Increased outside services | | | 557 | | | (144 | ) |
| Increased recruiting | | | 144 | | | 163 | |
| Increased (decreased) travel and entertainment | | | 214 | | | (33 | ) |
| Increased computers and telecommunications | | | 170 | | | 202 | |
| Increased (decreased) infrastructure expenses | | | 601 | | | (658 | ) |
| Various other items | | | 83 | | | 173 | |
| | |
| |
| |
| | Total change | | $ | 7,010 | | $ | 4,413 | |
| | |
| |
| |
The increase in product development expense during fiscal 2007 and 2006 was primarily due to increases in payroll and other related costs resulting from the increase in headcount to help us meet our expanded product delivery schedules for fiscal 2007. Headcount increased to 224 at December 31, 2007 from 191 and 167 at December 31, 2006 and 2005, respectively. Additionally, we experienced an increase of $3.1 million in stock-based compensation expense during 2006 due to the adoption of SFAS 123R which contributed to the increase in payroll and related during 2006. As a result of the increase in headcount, our product development group incurred additional costs from infrastructure expense (information technology and facilities) as well as increased recruiting fees to identify product development engineers to assist in developing our new products and enhancing existing products.
We expect product development expenses to increase in dollar amount in 2008 but to remain relatively flat as a percentage of revenues as we make investments in headcount to support new product development.
General and Administrative
| | 2007
| | 2006
| | 2005
| |
|---|
| | (in thousands, except percentages)
| |
|---|
| General and administrative | | $ | 34,799 | | $ | 32,936 | | $ | 33,773 | |
| Percent of total net revenues | | | 16 | % | | 18 | % | | 20 | % |
| Change over prior year | | $ | 1,863 | | $ | (837 | ) | | | |
| Percent change over prior year | | | 6 | % | | (2 | )% | | | |
General and administrative expenses consist primarily of personnel costs for information technology, finance, administration, operations and general management, as well as legal and accounting expenses.
56
General and administrative expenses fluctuated due to the following (in thousands):
| | Change From 2006 to 2007
| | Change From 2005 to 2006
| |
|---|
| Increased payroll and related | | $ | 5,609 | | $ | 3,854 | |
| Increased (decreased) facilities | | | (2,243 | ) | | 1,575 | |
| Increased (decreased) recruiting | | | 538 | | | (438 | ) |
| Increased (decreased) loss on disposal of assets | | | 416 | | | (8 | ) |
| Decreased legal and professional | | | (901 | ) | | (2,619 | ) |
| Decreased outside services | | | (1,500 | ) | | (902 | ) |
| Decreased depreciation | | | (246 | ) | | (846 | ) |
| Various other items | | | 190 | | | (1,453 | ) |
| | |
| |
| |
| | Total change | | $ | 1,863 | | $ | (837 | ) |
| | |
| |
| |
The increase in expenses during 2007 is primarily due to payroll and other related costs being higher as a result of an increase in headcount and annual merit increases. The headcount increase to 158 at December 31, 2007 from 135 at December 31, 2006 reflected our investment in information technology infrastructure to assist in automating key business processes to support the Company's growth. As a result of the increase in headcount, general and administrative incurred additional costs from recruiting costs. Additionally, our loss on disposal of assets during 2007 increased primarily from the write-off of construction-in-progress assets at our 303 Second Street facility in San Francisco, California, as a result of our decision to cease improvement on the facility and relocate this data center. These increases in expense were offset by a decrease in facilities and depreciation expense as we are no longer incurring rent and depreciation expenses related to our prior San Francisco headquarters facility located at 301 Brannan Street, which we exited in October 2006. We entered into a definitive lease agreement in January 2006 for our new headquarters facility located at 600 Townsend Street in San Francisco, California resulting in rent expense at both 600 Townsend and our prior headquarters facility causing higher rent expense for the first nine months of 2006. Outside service costs decreased by $1.5 million in 2007 as fewer external consultants were used during the current year. Lower legal fees and professional fees resulted from decreased services provided by Sarbanes-Oxley compliance consultants, and external legal and accounting firms.
During 2006, we allocated payroll and related costs for certain IT personnel to sales and marketing expense and cost of professional services as these IT employees were working on projects specifically relating to these functions. The overall fluctuations were also attributable to a decrease in legal fees of in 2006 as compared to fiscal 2005 which included costs for various legal disputes. A decrease in depreciation expense of $0.8 million for 2006 also contributed to the overall decrease in general and administrative expense which primarily resulted from assets being fully depreciated in 2005. Outside service costs decreased by $0.9 million in 2006 as fewer external consultants were used during 2006. These decreases were offset by an increase in payroll and related costs primarily due to stock-based compensation expense of $4.0 million (or 2.2% of total net revenues) during 2006, and an increase in rent expense of approximately $1.1 million. We entered into a definitive lease agreement in January 2006 for our new headquarters facility located at 600 Townsend Street in San Francisco, California and since then we incurred rent expense at both 600 Townsend and our prior headquarters facility located at 301 Brannan Street for the majority of fiscal 2006 which resulted in higher rent expense for 2006. Various other items represent allocations of corporate expenses such as information technology and facilities out of general and administrative to other departments based on headcount.
We expect general and administrative expenses to increase in dollar amount but to decrease as a percentage of total net revenues in 2008 compared with 2007.
57
Amortization of Other Intangibles
| | 2007
| | 2006
| | 2005
| |
|---|
| | (in thousands, except percentages)
| |
|---|
| Amortization of other intangibles | | $ | 1,879 | | $ | 3,866 | | $ | 4,041 | |
| Percent of total net revenues | | | 1 | % | | 2 | % | | 2 | % |
| Change over prior year | | $ | (1,987 | ) | $ | (175 | ) | | | |
| Percent change over prior year | | | (51 | )% | | (4 | )% | | | |
Amortization of other intangibles represents amortization of non-technology related intangible assets. The decreases in amortization of other intangibles in the 2007 and 2006 periods were attributed to assets from prior acquisitions becoming fully amortized during fiscal 2006 and 2007.
We expect amortization of other intangibles to be approximately $1.0 million in 2008.
Acquired In-Process Research and Development ("IPR&D")
| | 2007
| | 2006
| | 2005
| |
|---|
| | (in thousands, except percentages)
| |
|---|
| Acquired in-process research and development | | $ | 150 | | $ | — | | $ | — | |
| Percent of total net revenues | | | 0 | % | | 0 | % | | 0 | % |
| Change over prior year | | $ | 150 | | $ | — | | | | |
During 2007, we expensed acquired IPR&D costs of $150,000 in connection with our acquisition of Vivid Orange Limited based in the United Kingdom. IPR&D was expensed because the acquired technology had not reached technological feasibility and had no alternative uses. Technological feasibility is defined as being equivalent to completion of a beta-phase working prototype in which there is no remaining risk relating to the development.
We do not expect to incur any IPR&D costs in 2008.
Restructuring Charges
| | 2007
| | 2006
| | 2005
| |
|---|
| | (in thousands, except percentages)
| |
|---|
| Restructuring charges | | $ | 965 | | $ | 3,735 | | $ | 2,039 | |
| Percent of total net revenues | | | 0 | % | | 2 | % | | 1 | % |
| Change over prior year | | $ | (2,770 | ) | $ | 1,696 | | | | |
| Percent change over prior year | | | (74 | )% | | 83 | % | | | |
Restructuring initiatives have been implemented in our AIM and Other operating segments to reduce costs and improve operating efficiencies by better aligning our resources to near-term revenue opportunities. These initiatives have resulted in restructuring charges comprised primarily of costs related to properties abandoned in connection with facilities consolidation, related write-down of leasehold improvements and severance and associated employee termination costs related to headcount reductions. Our restructuring charges included accruals for estimated losses on facility costs based on our contractual obligations net of estimated sublease income. We reassess this liability periodically based on market conditions.
During 2007, we recorded aggregate restructuring charges of $965,000 which related to the modification of certain sub-lease assumptions for our prior San Francisco headquarters facility located at 301 Brannan Street, and to the accretion of interest on our existing obligations.
For fiscal 2006, we recorded total restructuring charges of $3.7 million which primarily related to facility and exit costs associated with the relocation of our corporate headquarters facility in San
58
Francisco during the fourth quarter of 2006. Restructuring charges in 2006 also included costs associated with exiting a portion of our facility in New Rochelle, New York, and our entire facility in Summit, New Jersey, and adjustments to original estimates for facilities in San Francisco, California and New York, New York.
For fiscal 2005, we recorded total restructuring charges of $2.0 million consisting of facility and exit costs of $1.5 million related to the sub-leasing of one floor of the Company's office in New York, New York and additional charges of $567,000 during 2005 primarily to adjust original estimates of facility maintenance expenses and real estate taxes of vacated facilities.
The following table sets forth an analysis of the components of the restructuring charges and the payments and non-cash charges made against the accrual during fiscal 2005, 2006 and 2007 (in thousands):
| | Facility Exit Costs
| | Severance and Benefits
| | Total
| |
|---|
| Balance of restructuring accrual at December 31, 2004 | | $ | 4,157 | | $ | 12 | | $ | 4,169 | |
| | Restructuring charges | | | 1,472 | | | — | | | 1,472 | |
| | Reversal of deferred rent related to facilities exited | | | 703 | | | — | | | 703 | |
| | Cash payments | | | (2,351 | ) | | — | | | (2,351 | ) |
| | Adjustment of prior restructuring costs | | | 572 | | | (5 | ) | | 567 | |
| | |
| |
| |
| |
| Balance of restructuring accrual at December 31, 2005 | | $ | 4,553 | | $ | 7 | | $ | 4,560 | |
| | Restructuring charges | | | 3,549 | | | — | | | 3,549 | |
| | Reversal of deferred rent related to facilities exited | | | 666 | | | — | | | 666 | |
| | Cash payments | | | (2,370 | ) | | — | | | (2,370 | ) |
| | Adjustment of prior restructuring costs | | | 189 | | | (3 | ) | | 186 | |
| | |
| |
| |
| |
| Balance of restructuring accrual at December 31, 2006 | | $ | 6,587 | | $ | 4 | | $ | 6,591 | |
| | Restructuring charges | | | 687 | | | — | | | 687 | |
| | Cash payments | | | (3,287 | ) | | (4 | ) | | (3,291 | ) |
| | Adjustment of prior restructuring costs | | | 278 | | | — | | | 278 | |
| | |
| |
| |
| |
| Balance of restructuring accrual at December 31, 2007 | | $ | 4,265 | | $ | — | | $ | 4,265 | |
| | |
| |
| |
| |
Of the remaining restructuring accrual of $4.3 million at December 31, 2007, $2.6 million and $1.7 million are included in accrued liabilities and other long-term liabilities, respectively. The accrued excess facility costs of $4.3 million are stated at estimated fair value, net of estimated sub-lease income of $8.8 million. We expect to pay the remaining obligations in connection with vacated facilities over the remaining lease terms, which will expire on various dates through 2012. We anticipate incurring significant restructuring charges in 2008 as we cease using and vacate our current San Francisco data center.
59
Operating Income (Loss) by Segment
| | 2007
| | 2006
| | 2005
| |
|---|
| | (in thousands)
| |
|---|
| Advent Investment Management | | $ | 23,610 | | $ | 14,921 | | $ | 9,599 | |
| MicroEdge | | | 5,631 | | | 5,361 | | | 2,979 | |
| Other | | | 80 | | | (1,902 | ) | | 374 | |
| Unallocated corporate operating costs and expenses: | | | | | | | | | | |
| | Stock-based compensation | | | (13,396 | ) | | (13,596 | ) | | — | |
| | Amortization of developed technology | | | (1,567 | ) | | (1,200 | ) | | (2,575 | ) |
| | Amortization of other intangibles | | | (1,879 | ) | | (3,866 | ) | | (4,041 | ) |
| | Acquired in-process research and development | | | (150 | ) | | — | | | — | |
| | |
| |
| |
| |
| | | Total | | $ | 12,329 | | $ | (282 | ) | $ | 6,336 | |
| | |
| |
| |
| |
Our AIM segment improved its operating income by $8.7 million to $23.6 million in 2007. This improvement reflects an increase in AIM revenue of $28.9 million or 18% partially offset by an increase in expenses of $20.2 million or 14% during 2007. The increase in expense was due to the increase in AIM headcount to 837 employees at December 31, 2007 from 735 employees at December 31, 2006. Our AIM segment improved its operating income to $14.9 million in 2006 from $9.6 million in 2005. This improvement reflects an increase in AIM revenues of $16.7 million offset by an increase in payroll and related costs due to the increase in headcount from 651 employees at December 31, 2005 to 735 employees at December 31, 2006.
MicroEdge's operating income increased by $0.3 million in 2007 primarily due to sales of its Gifts products. MicroEdge's operating income increased by $2.4 million in 2006 due to decreased marketing costs and outside services cost associated with lower utilization of outside contractors.
The fluctuations in operating income (loss) for our Other segment were due to the winding down of our soft dollar component in 2006.
See Note 13, "Segment and Geographical Information", to the consolidated financial statements for additional information regarding our segments.
Interest Expense
| | 2007
| | 2006
| | 2005
| |
|---|
| | (in thousands, except percentages)
| |
|---|
| Interest expense | | $ | (1,181 | ) | $ | (90 | ) | $ | (24 | ) |
| Percent of total net revenues | | | (1 | )% | | 0 | % | | 0 | % |
| Change over prior year | | $ | (1,091 | ) | $ | (66 | ) | | | |
| Percent change over prior year | | | 1,212 | % | | 275 | % | | | |
The increase in interest expense of $1.1 million during 2007 resulted from the draw down of $25.0 million on our credit facility in June 2007, which was fully repaid in December 2007.
Interest Income and Other, net
| | 2007
| | 2006
| | 2005
| |
|---|
| | (in thousands, except percentages)
| |
|---|
| Interest income and other, net | | $ | 1,966 | | $ | 3,943 | | $ | 4,620 | |
| Percent of total net revenues | | | 1 | % | | 2 | % | | 3 | % |
| Change over prior year | | $ | (1,977 | ) | $ | (677 | ) | | | |
| Percent change over prior year | | | (50 | )% | | (15 | )% | | | |
60
Interest income and other, net consists of interest income, realized gains and losses on investments and foreign currency gains and losses.
Interest income and other, net fluctuated due to the following (in thousands):
| | Change From 2006 to 2007
| | Change From 2005 to 2006
| |
|---|
| Decrease in interest income | | $ | (2,059 | ) | $ | (460 | ) |
| Various other items | | | 82 | | | (217 | ) |
| | |
| |
| |
| | Total change | | $ | (1,977 | ) | $ | (677 | ) |
| | |
| |
| |
The decreases in income during 2007 and 2006 was due to our lower level of cash, cash equivalents and marketable securities balances, as we liquidated part of our portfolio to fund our significant stock repurchases in fiscal 2006 and the first half of 2007.
Gain on Sale of Equity Investments
| | 2007
| | 2006
| | 2005
| |
|---|
| | (in thousands, except percentages)
| |
|---|
| Gain on sale of equity investments | | $ | 3,680 | | $ | — | | $ | 3,608 | |
| Percent of total net revenues | | | 2 | % | | 0 | % | | 2 | % |
| Change over prior year | | $ | 3,680 | | $ | (3,608 | ) | | | |
Gain on sale of equity investments includes realized gains on sale and impairment losses of our investments in privately held companies. The increase in 2007 reflects an aggregate gain of $4.2 million from the sale of two private equity investments, including our investment in LatentZero Limited, partially offset by an impairment loss of $585,000 for a third private equity investment. The gain on sale of $3.6 million in fiscal 2005 reflects a gain on sale of a private equity investment.
Provision For (Benefit From) Income Taxes
| | 2007
| | 2006
| | 2005
| |
|---|
| | (in thousands, except percentages)
| |
|---|
| Provision for (benefit from) income taxes | | $ | 4,163 | | $ | (79,031 | ) | $ | 405 | |
| Effective tax rate | | | 25 | % | | (2,213 | )% | | 3 | % |
During 2003, we established a full valuation allowance against our deferred tax assets in the United States because we determined at the time that it was more likely than not that these deferred tax assets would not be realized. As a result of having a full valuation allowance, the provision for income taxes for fiscal 2005 in the amount of $405,000 was primarily based on our current income taxes owed.
In the fourth quarter of 2006, we determined that $83.6 million of our deferred tax assets, including $1.1 million related to goodwill, that had previously been offset with a valuation allowance would more likely than not be realized in the foreseeable future. The $82.5 million reduction to our valuation allowance that generated an income tax benefit was partially offset by income tax accruals of $3.5 million and resulted in a net benefit from income taxes of $79.0 million in 2006.
Our 2007 effective tax rate differs from the statutory rate due to the favorable effects of federal and state research credits and the release of valuation allowance relating to capital loss carryovers that were utilized in 2007 to offset unanticipated capital gains. These favorable effects were partially offset by the unfavorable impact of stock compensation expense relating to incentive stock options and the Company's employee stock purchase plan. We continue to maintain a valuation allowance against deferred tax assets relating to capital loss carryovers and investment reserves and assorted state net
61
operating losses because the likelihood of their realization is not more likely than not. We expect our effective tax rate for fiscal 2008 to be in the range of 35% to 40% of profit before taxes. However, our cash payments for income taxes will continue to be nominal over the next few years as we have significant net operating losses, capital losses and tax credit carryforwards to utilize against current income taxes.
Liquidity and Capital Resources
Our aggregate cash, cash equivalents and marketable securities at December 31, 2007 were $49.6 million, compared with $55.1 million at December 31, 2006. Cash equivalents are comprised of highly liquid investments purchased with an original or remaining maturity of 90 days or less at the date of purchase.
The table below, for the periods indicated, provides selected consolidated cash flow information (in thousands):
| | Fiscal Years
| |
|---|
| | 2007
| | 2006
| | 2005
| |
|---|
| Net cash provided by operating activities | | $ | 62,376 | | $ | 46,776 | | $ | 36,703 | |
| Net cash provided by investing activities | | $ | 16,024 | | $ | 46,021 | | $ | 45,194 | |
| Net cash used in financing activities | | $ | (59,281 | ) | $ | (133,712 | ) | $ | (32,012 | ) |
Our cash flows from operating activities represent the most significant source of funding for our operations. The major uses of our operating cash include funding payroll (salaries, commissions, bonuses and benefits), general operating expenses (marketing, travel, computer and telecommunications, legal and professional expenses, and office rent) and cost of revenues. Operating activities provided $62.4 million, $46.8 million, and $36.7 million in 2007, 2006 and 2005, respectively. Our cash provided by operating activities generally follows the trend in our net revenues and operating results.
Cash provided by operating activities of $62.4 million during fiscal 2007 was primarily the result of our net income of $12.6 million, increase in deferred revenues of $35.0 million, and non-cash expenses including stock-based compensation of $13.4 million and depreciation and amortization of $11.2 million, partially offset by a net gain from equity investment activity of $3.7 million. The increase in deferred revenue primarily reflected our continued transition to the term license model. Under the term license model, we generally bill and collect for a term agreement in installments in advance of each annual period. These amounts are deferred at billing and recognized over the annual term period. This has the effect of increasing deferred revenue when compared to a perpetual license model where no license revenue is deferred. See further discussion of the effects of our transition to a term model in the "Overview" section.
Cash provided by operating activities of $46.8 million during fiscal 2006 primarily consisted of our income before tax of $3.6 million and adjustments to reconcile net income to cash flow from operating activities driven by non-cash charges including stock-based compensation of $13.6 million, and depreciation and amortization of $12.8 million. Cash flows resulting from changes in assets and liabilities included increases in deferred revenue of $20.2 million, accrued liabilities of $8.8 million and income taxes payable of $2.2 million. The increase in accrued liabilities primarily reflected increases in accrued bonuses and restructuring expenses relating to the relocation of our corporate headquarters. Other adjustments to cash flows resulting from changes in assets and liabilities included an increase in deferred taxes of $83.4 million primarily due to the release of a valuation allowance in the fourth quarter of 2006.
62
Cash provided by operating activities of $36.7 million during fiscal 2005 primarily consisted of our net income of $14.1 million and non-cash charges including depreciation and amortization of $15.3 million. Cash flows resulting from changes in assets and liabilities included increases in accrued liabilities of $4.6 million and deferred revenues of $6.3 million. The increase in accrued liabilities primarily reflected increases in accrued bonuses and accrued legal fees. The increase in deferred revenues reflected new maintenance contracts, existing maintenance contracts renewed at higher prices, and more contracts signed on a term model. These sources of cash were offset by net non-operating gains on investments of $3.3 million primarily resulting from a gain on sale of a private equity investment of $3.6 million and decreases in deferred income taxes of $1.1 million and income taxes payable of $1.2 million. The decrease in deferred income taxes reflected the amortization of foreign deferred tax liabilities. The decrease in income taxes payable reflected the payment of a tax settlement. Other major uses of our operating cash including funding payroll (salaries, bonuses and benefits) and general operating expenses (marketing, travel, computer and telecommunications, legal and professional expenses, and office rent).
We expect that cash provided by operating activities may fluctuate in future periods as a result of a number of factors including fluctuations in our net revenues and operating results, the amount of revenue deferred resulting from our shift to a term license model, collection of accounts receivable, and timing of payments.
We expect operating cash flow to be between $68 million to $71 million for fiscal 2008.
Net cash provided by investing activities in 2007 of $16.0 million is primarily from proceeds of $24.9 million from the sale of short term investments and from the proceeds of $11.6 million from the sale of two private equity investments, including our stake in LatentZero Limited. This was partially offset by capital expenditures of $8.9 million, cash used for the acquisitions of Vivid Orange and East Circle Solutions totaling $8.2 million, capitalized software development costs of $3.0 million and a change in restricted cash of $0.4 million to increase the bank letter of credit associated with lease amendments for our headquarters facility in San Francisco, California. In the event we default under the terms of this agreement, the letter of credit may be drawn upon by Toda. Also, see Note 3, "Acquisitions" to the consolidated financial statements for additional information regarding the Company's acquisitions.
Net cash provided by investing activities in 2006 of $46.0 million consisted primarily of net sales and maturities of marketable securities of $67.9 million. We liquidated investments to provide the cash required to repurchase our common stock. These cash proceeds were offset by capital expenditures of $19.2 million primarily relating to the completion of our new corporate headquarters facility build-out, an increase in restricted cash of $1.3 million to secure a bank line of credit associated with the lease of our headquarters facility, and capitalized software development costs of $1.4 million.
63
Net cash provided by investing activities in 2005 of $45.2 million consisted of net sales and maturities of marketable securities of $50.4 million and proceeds from the sale of a private equity investment of $3.8 million, offset by capital expenditures of $6.4 million, capitalized software development costs of $1.5 million and acquisition related costs of $1.0 million.
We expect our capital expenditures to increase in 2008, as we have several capital investments to make in 2008 to support our current and future growth. We plan to build out additional space in our headquarters facility in San Francisco and make information technology investments. We expect capital expenditures to be in the range of $15 million to $18 million.
Net cash used in financing activities in 2007 of $59.3 million reflected the repurchase of 2.6 million shares of our common stock for $91.2 million and the repayment of $25.0 million on our credit facility. These cash outlays were partially offset by the draw-down of $25.0 million against our credit facility and proceeds from the issuance of our common stock of $31.3 million under our employee stock option and purchase plans.
Net cash used in financing activities in 2006 of $133.7 million reflected the repurchase of 4.7 million shares of our common stock for $148.6 million, partially offset by proceeds received from the issuance of common stock of $14.5 million.
Net cash used in financing activities in 2005 of $32.0 million reflected the repurchase of 2.8 million shares of our common stock for $52.6 million, partially offset by proceeds received from the issuance of common stock related to stock options and our employee stock purchase plan totaling $20.6 million.
Advent's Board has approved common stock repurchase programs authorizing management to repurchase shares of the Company's common stock. The timing and actual number of shares subject to repurchase are at the discretion of Advent's management and are contingent on a number of factors and limitations, including the price of Advent's stock, corporate and regulatory requirements, alternative investment opportunities and other market conditions. The stock repurchase programs specify a maximum number of shares subject to repurchase, do not have an expiration date and may be limited or terminated at any time without prior notice. Repurchased shares are returned to the status of authorized and unissued shares of common stock. The purchases are funded from available working capital.
The purchase price for the shares of our common stock repurchased was reflected as a reduction to stockholders' equity. In accordance with Accounting Principles Board Opinion No. 6, "Status of Accounting Research Bulletins," we are required to allocate the purchase price of the repurchased shares as (i) an increase to accumulated deficit and (ii) a reduction of common stock and additional paid-in capital. Issuance of common stock and the tax benefit related to employee stock option plans are recorded as an increase to common stock and additional paid-in capital. As a result of future repurchases, we may continue to report an accumulated deficit included in stockholders' equity in our consolidated balance sheets.
64
The following is a summary of the repurchase programs authorized by the Board since fiscal 2005 (in thousands):
Date of Authorization
| | Number of Shares Authorized
|
|---|
| February 2005 | | 1,800 |
| May 2005 | | 1,000 |
| April 2006 | | 2,300 |
| July 2006 | | 1,500 |
| February 2007 | | 2,250 |
| | |
|
| | Total | | 8,850 |
| | |
|
The following is a summary of the Company's repurchase activity since fiscal 2005 (in thousands, except per share data):
Fiscal Year
| | Total Number of Shares Repurchased
| | Cost
| | Average Price Paid Per Share
|
|---|
| 2005 | | 2,835 | | $ | 52,584 | | $ | 18.55 |
| 2006 | | 4,691 | | $ | 148,602 | | $ | 31.68 |
| 2007 | | 2,580 | | $ | 91,157 | | $ | 35.33 |
| | |
| |
| |
|
| | Total | | 10,106 | | $ | 292,343 | | $ | 28.93 |
| | |
| |
| |
|
At January 1, 2005, there remained 1,256,000 share authorized by the Board for repurchase. As of December 31, 2007, there were no shares available to be repurchased.
Our liquidity and capital resources in any period could be affected by the exercise of outstanding stock options and SARs, and issuance of common stock under our employee stock purchase plan. The resulting increase in the number of outstanding shares from this and from the issuance of common stock from our RSUs could also affect our per share results of operations. However, we cannot predict the timing or amount of proceeds from the exercise of these securities, or whether they will be exercised at all.
At December 31, 2007, we had negative working capital of $(23.2) million, down from working capital of $1.0 million at December 31, 2006, primarily as a result of our common stock repurchases totaling $91.2 million during 2007, and to a lesser extent deferred revenue growth as we continue to transition the substantial majority of our license agreements to term.
In February 2007, Advent Software, Inc. and certain of our domestic subsidiaries entered into a senior secured credit facility agreement (the "Credit Facility") with Wells Fargo Foothill, Inc. (the "Lender"). Under the Credit Facility, the Lender will provide the Company with a revolving line of credit up to an aggregate amount of $75 million, subject to a borrowing base formula, to provide backup liquidity for general corporate purposes, including stock repurchases, or investment opportunities for a period of three years.
We expect that for the next year our operating expenses will continue to constitute a significant use of cash. In addition, we may use cash to fund acquisitions, repurchase common stock, or invest in other businesses, when opportunities arise. Based upon the predominance of our revenues from recurring sources, bookings performance and current expectations, we believe that our cash and cash equivalents, cash generated from operations and availability under our Credit Facility will be sufficient to satisfy our working capital needs, capital expenditures, investment requirements, stock repurchases and financing activities for the next year.
65
Off-Balance Sheet Arrangements and Contractual Obligations
We currently have no significant capital commitments other than commitments under our operating leases, which increased from $49.0 million at December 31, 2006 to $52.7 million at December 31, 2007, primarily as a result of several amendments executed to the lease agreement for our 600 Townsend Street headquarters facility whereby the Company leased additional facility space of 50,000 square feet during 2007.
The following table summarizes our contractual cash obligations as of December 31, 2007 (in thousands):
| | Fiscal Years
| |
| |
|
|---|
| | 2008
| | 2009
| | 2010
| | 2011
| | 2012
| | Thereafter
| | Total
|
|---|
Operating lease obligations, net of
sub-lease income | | $ | 7,979 | | $ | 6,145 | | $ | 5,741 | | $ | 5,387 | | $ | 4,948 | | $ | 22,506 | | $ | 52,706 |
| | |
| |
| |
| |
| |
| |
| |
|
At December 31, 2007, we had a gross liability of $5.9 million for uncertain tax positions associated with the adoption of FIN 48. Since almost all of this liability relates to reserves against deferred tax assets that we do not expect to utilize in the short term, we cannot estimate the timing of potential future cash settlements and have not included any estimates in the table of contractual cash obligations above. Additionally, our cash payments for income taxes will continue to be nominal over the next few years as we have significant net operating losses, capital losses and tax credit carryforwards to utilize.
At December 31, 2007 and 2006, we did not have any relationships with unconsolidated entities or financial partnerships, such as entities often referred to as structured finance or special purpose entities, which would have been established for the purpose of facilitating off-balance sheet arrangements or other contractually narrow or limited purposes. As such, we are not materially exposed to any financing, liquidity, market or credit risk that could arise if we had engaged in such relationships.
Recent Accounting Pronouncements
Refer to Note 1, "Summary of Significant Accounting Policies", to the consolidated financial statements for a discussion of recent accounting standards and pronouncements.
Item 7A. Quantitative and Qualitative Disclosures About Market Risk
We are exposed to financial market risks, including changes in foreign currency exchange rates and interest rates. Historically, much of our revenues and capital spending was transacted in US dollars. However, since the acquisitions of Advent Denmark, Advent Norway, Advent Sweden, Advent Netherlands, and Advent Europe's remaining distributors in the United Kingdom and Switzerland, whose service and certain license revenues and capital spending, are transacted in local country currencies, we have greater exposure to foreign currency fluctuations. Additionally as of December 31, 2007, $47.3 million and $3.4 million of goodwill and intangibles from the acquisition of these entities are denominated in foreign currency. Therefore a hypothetical change of 10% could increase or decrease our assets and equity by $5 million. We do not believe that a hypothetical 10% change in foreign currency exchange rates would have a material adverse effect on our consolidated results of operations or cash flows.
Our interest rate risk relates primarily to our investment portfolio, which consisted of $37.3 million in cash equivalents as of December 31, 2007. These cash equivalent securities were comprised of US government debt securities which would not be materially affected by an immediate sharp increase or decrease in interest rates. As of December 31, 2007, Advent did not hold any auction rate securities
66
and does not plan to hold them in the near future. During 2007, we liquidated our marketable securities portfolio to fund our stock repurchase program resulting in a zero balance at December 31, 2007.
Effective February 2007, we also have interest rate risk relating to debt under our credit facility which is indexed to LIBOR or a Wells Fargo prime rate. However, as of December 31, 2007, we essentially have no exposure for market risk for changes in interest rates associated with our Facility, as we have a zero balance of debt at December 31, 2007.
We have also invested in several privately-held companies. These non-marketable investments are classified as other assets on our consolidated balance sheets. Our investments in privately-held companies could be affected by an adverse movement in the financial markets for publicly-traded equity securities, although the impact cannot be directly quantified. These investments are inherently risky as the market for the technologies or products these privately-held companies have under development are typically in the early stages and may never materialize. It is our policy to review investments in privately held companies on a regular basis to evaluate the carrying amount and economic viability of these companies. This policy includes, but is not limited to, reviewing each of the companies' cash position, financing needs, earnings/revenue outlook, operational performance, management/ownership changes and competition. The evaluation process is based on information that we request from these privately held companies. This information is not subject to the same disclosure regulations as US publicly traded companies, and as such, the basis for these evaluations is subject to timing and the accuracy of the data received from these companies.
Our investments in privately held companies are assessed for impairment when a review of the investee's operations indicates that a decline in value of the investment is other than temporary. Such indicators include, but are not limited to, limited capital resources, limited prospects of receiving additional financing, and prospects for liquidity of the related securities. Impaired investments in privately held companies are written down to estimated fair value. We estimate fair value using a variety of valuation methodologies. Such methodologies include comparing the private company with publicly traded companies in similar lines of business, applying revenue and price/earnings multiples to estimated future operating results for the private company and estimating discounted cash flows for that company. We could lose our entire investment in these companies. During the second quarter of 2007, we sold two of our investments, including our investment in LatentZero Limited, and impaired another. At December 31, 2007, our net investments in privately-held companies totaled $0.5 million. See Note 4, "Balance Sheet Detail", to our consolidated financial statements for further discussion.
67
Item 8. Financial Statements and Supplementary Data
MANAGEMENT'S REPORT ON INTERNAL CONTROL OVER FINANCIAL REPORTING
Management of the Company is responsible for establishing and maintaining adequate internal control over financial reporting as defined in Rules 13a-15(f) and 15d-15(f) under the Securities Exchange Act of 1934. The Company's internal control over financial reporting is a process designed to provide reasonable assurance regarding the reliability of financial reporting and the preparation of financial statements for external purposes in accordance with generally accepted accounting principles. Internal control over financial reporting includes those policies and procedures that (i) pertain to the maintenance of records that, in reasonable detail, accurately and fairly reflect the transactions and dispositions of assets of the Company; (ii) provide reasonable assurance that transactions are recorded as necessary to permit preparation of financial statements in accordance with generally accepted accounting principles, and that receipts and expenditures of the Company are being made only in accordance with authorizations of management and directors of the Company; and (iii) provide reasonable assurance regarding prevention or timely detection of unauthorized acquisition, use or disposition of the Company's assets that could have a material effect on the financial statements.
Because of its inherent limitations, internal control over financial reporting may not prevent or detect misstatements. Also, projections of any evaluation of effectiveness to future periods are subject to the risk that controls may become inadequate because of changes in conditions or that the degree of compliance with the policies or procedures may deteriorate.
The Company's management assessed the effectiveness of the Company's internal control over financial reporting as of December 31, 2007. In making this assessment, management used the criteria set forth by the Committee of Sponsoring Organizations of the Treadway Commission (COSO) inInternal Control—Integrated Framework. Based on management's assessment using the COSO criteria, management has concluded that the Company maintained effective internal control over financial reporting as of December 31, 2007.
The effectiveness of the Company's internal control over financial reporting as of December 31, 2007 has been audited by PricewaterhouseCoopers LLP, an independent registered public accounting firm, as stated in its report which is included herein.
/s/STEPHANIE G. DIMARCO
Stephanie G. DiMarco
President and Chief Executive Officer
Principal Executive Officer and
Principal Financial and Accounting Officer | | |
68
REPORT OF INDEPENDENT REGISTERED PUBLIC ACCOUNTING FIRM
To the Board of Directors and Stockholders of Advent Software, Inc.:
In our opinion, the consolidated financial statements listed in the accompanying index appearing under item 15(a)(1) present fairly, in all material respects, the financial position of Advent Software, Inc. at December 31, 2007 and December 31, 2006, and the results of their operations and their cash flows for each of the three years in the period ended December 31, 2007 in conformity with accounting principles generally accepted in the United States of America. In addition, in our opinion, the financial statement schedule listed in the accompanying index appearing under item 15(a)(2) present fairly, in all material respects, the information set forth therein when read in conjunction with the related consolidated financial statements. Also in our opinion, the Company maintained, in all material respects, effective internal control over financial reporting as of December 31, 2007 based on criteria established inInternal Control—Integrated Framework issued by the Committee of Sponsoring Organizations of the Treadway Commission (COSO). The Company's management is responsible for these financial statements and financial statement schedule, for maintaining effective internal control over financial reporting and for its assessment of the effectiveness of internal control over financial reporting, included in Management's Report on Internal Control over Financial Reporting. Our responsibility is to express opinions on these financial statements, on the financial statement schedule, and on the Company's internal control over financial reporting based on our integrated audits. We conducted our audits in accordance with the standards of the Public Company Accounting Oversight Board (United States). Those standards require that we plan and perform the audits to obtain reasonable assurance about whether the financial statements are free of material misstatement and whether effective internal control over financial reporting was maintained in all material respects. Our audits of the financial statements included examining, on a test basis, evidence supporting the amounts and disclosures in the financial statements, assessing the accounting principles used and significant estimates made by management, and evaluating the overall financial statement presentation. Our audit of internal control over financial reporting included obtaining an understanding of internal control over financial reporting, assessing the risk that a material weakness exists, and testing and evaluating the design and operating effectiveness of internal control based on the assessed risk. Our audits also included performing such other procedures as we considered necessary in the circumstances. We believe that our audits provide a reasonable basis for our opinions.
As discussed in Note 1 to the consolidated financial statements, effective January 1, 2006, the Company changed its method of accounting for stock-based compensation in accordance with Statement of Financial Accounting Standards No. 123 (revised 2004), "Share-Based Payment". In addition, as discussed in Note 8 to the consolidated financial statements, effective January 1, 2007, the Company adopted the provisions of FASB Interpretation No. 48, "Accounting for Uncertainty of Income Taxes".
A company's internal control over financial reporting is a process designed to provide reasonable assurance regarding the reliability of financial reporting and the preparation of financial statements for external purposes in accordance with generally accepted accounting principles. A company's internal control over financial reporting includes those policies and procedures that (i) pertain to the maintenance of records that, in reasonable detail, accurately and fairly reflect the transactions and dispositions of the assets of the company; (ii) provide reasonable assurance that transactions are recorded as necessary to permit preparation of financial statements in accordance with generally accepted accounting principles, and that receipts and expenditures of the company are being made only in accordance with authorizations of management and directors of the company; and (iii) provide reasonable assurance regarding prevention or timely detection of unauthorized acquisition, use, or disposition of the company's assets that could have a material effect on the financial statements.
69
Because of its inherent limitations, internal control over financial reporting may not prevent or detect misstatements. Also, projections of any evaluation of effectiveness to future periods are subject to the risk that controls may become inadequate because of changes in conditions, or that the degree of compliance with the policies or procedures may deteriorate.
/s/ PricewaterhouseCoopers LLP
PricewaterhouseCoopers LLP
San Jose, California
March 13, 2008
70
ADVENT SOFTWARE, INC.
CONSOLIDATED BALANCE SHEETS
(In thousands, except per share amounts)
| | December 31
| |
|---|
| | 2007
| | 2006
| |
|---|
| ASSETS | | | | | | | |
| Current assets: | | | | | | | |
| | Cash and cash equivalents | | $ | 49,589 | | $ | 30,187 | |
| | Marketable securities | | | — | | | 24,881 | |
| | Accounts receivable, net of allowance for doubtful accounts of $181 and $270, respectively | | | 47,574 | | | 41,336 | |
| | Deferred taxes, current | | | 10,288 | | | 7,950 | |
| | Prepaid expenses and other | | | 19,577 | | | 11,828 | |
| | |
| |
| |
| | | | Total current assets | | | 127,028 | | | 116,182 | |
| Property and equipment, net | | | 27,779 | | | 27,338 | |
| Goodwill | | | 106,520 | | | 98,382 | |
| Other intangibles, net | | | 9,376 | | | 6,294 | |
| Deferred taxes, long-term | | | 70,981 | | | 75,594 | |
| Other assets, net | | | 10,645 | | | 15,857 | |
| | |
| |
| |
| | | | Total assets | | $ | 352,329 | | $ | 339,647 | |
| | |
| |
| |
LIABILITIES AND STOCKHOLDERS' EQUITY |
|
|
|
|
|
|
|
| Current liabilities: | | | | | | | |
| | Accounts payable | | $ | 4,382 | | $ | 5,083 | |
| | Accrued liabilities | | | 29,328 | | | 22,992 | |
| | Deferred revenues | | | 115,398 | | | 82,118 | |
| | Income taxes payable | | | 1,086 | | | 4,989 | |
| | |
| |
| |
| | | | Total current liabilities | | | 150,194 | | | 115,182 | |
| Deferred income taxes | | | 998 | | | 225 | |
| Deferred revenues, long-term | | | 4,939 | | | 3,195 | |
| Other long-term liabilities | | | 16,352 | | | 11,418 | |
| | |
| |
| |
| | | | Total liabilities | | | 172,483 | | | 130,020 | |
| | |
| |
| |
| Commitments and contingencies (See Note 9) | | | | | | | |
Stockholders' equity: |
|
|
|
|
|
|
|
| | Preferred stock; $0.01 par value: 2,000 shares authorized; none issued | | | — | | | — | |
| | Common stock; $0.01 par value: 120,000 shares authorized; 26,497 and 27,231 shares issued and outstanding | | | 265 | | | 272 | |
| | Additional paid-in capital | | | 326,964 | | | 309,993 | |
| | Accumulated deficit | | | (161,685 | ) | | (111,387 | ) |
| | Accumulated other comprehensive income | | | 14,302 | | | 10,749 | |
| | |
| |
| |
| | | | Total stockholders' equity | | | 179,846 | | | 209,627 | |
| | |
| |
| |
| | | | Total liabilities and stockholders' equity | | $ | 352,329 | | $ | 339,647 | |
| | |
| |
| |
The accompanying notes are an integral part of these consolidated financial statements.
71
ADVENT SOFTWARE, INC.
CONSOLIDATED STATEMENTS OF OPERATIONS
(In thousands, except per share data)
| | Years Ended December 31
| |
|---|
| | 2007
| | 2006
| | 2005
| |
|---|
| Net revenues: | | | | | | | | | | |
| Term license, maintenance and other recurring | | $ | 166,540 | | $ | 138,104 | | $ | 110,922 | |
| Perpetual license fees | | | 26,504 | | | 27,098 | | | 35,564 | |
| Professional services and other | | | 22,259 | | | 18,891 | | | 22,215 | |
| | |
| |
| |
| |
| | Total net revenues | | | 215,303 | | | 184,093 | | | 168,701 | |
Cost of revenues: |
|
|
|
|
|
|
|
|
|
|
| Term license, maintenance and other recurring | | | 38,008 | | | 32,968 | | | 29,938 | |
| Perpetual license fees | | | 851 | | | 817 | | | 961 | |
| Professional services and other | | | 27,464 | | | 23,817 | | | 18,323 | |
| Amortization of developed technology | | | 1,567 | | | 1,200 | | | 2,575 | |
| | |
| |
| |
| |
| | Total cost of revenues | | | 67,890 | | | 58,802 | | | 51,797 | |
| | |
| |
| |
| |
| | Gross margin | | | 147,413 | | | 125,291 | | | 116,904 | |
Operating expenses: |
|
|
|
|
|
|
|
|
|
|
| Sales and marketing | | | 55,422 | | | 50,177 | | | 40,269 | |
| Product development | | | 41,869 | | | 34,859 | | | 30,446 | |
| General and administrative | | | 34,799 | | | 32,936 | | | 33,773 | |
| Amortization of other intangibles | | | 1,879 | | | 3,866 | | | 4,041 | |
| Acquired in-process research and development | | | 150 | | | — | | | — | |
| Restructuring charges | | | 965 | | | 3,735 | | | 2,039 | |
| | |
| |
| |
| |
| | Total operating expenses | | | 135,084 | | | 125,573 | | | 110,568 | |
| | |
| |
| |
| |
| Income (loss) from operations | | | 12,329 | | | (282 | ) | | 6,336 | |
Interest expense |
|
|
(1,181 |
) |
|
(90 |
) |
|
(24 |
) |
| Interest income and other, net | | | 1,966 | | | 3,943 | | | 4,620 | |
| Gain on sale of equity investments, net | | | 3,680 | | | — | | | 3,608 | |
| | |
| |
| |
| |
| Income before income taxes | | | 16,794 | | | 3,571 | | | 14,540 | |
| Provision for (benefit from) income taxes | | | 4,163 | | | (79,031 | ) | | 405 | |
| | |
| |
| |
| |
| | Net income | | $ | 12,631 | | $ | 82,602 | | $ | 14,135 | |
| | |
| |
| |
| |
| Net income per share: | | | | | | | | | | |
| | Basic | | $ | 0.48 | | $ | 2.85 | | $ | 0.46 | |
| | Diluted | | $ | 0.45 | | $ | 2.70 | | $ | 0.44 | |
Weighted average shares used to compute basic and diluted net income per share |
|
|
|
|
|
|
|
|
|
|
| | Basic | | | 26,495 | | | 29,003 | | | 31,031 | |
| | Diluted | | | 28,067 | | | 30,537 | | | 32,474 | |
The accompanying notes are an integral part of these consolidated financial statements.
72
ADVENT SOFTWARE, INC.
CONSOLIDATED STATEMENTS OF STOCKHOLDERS' EQUITY
AND COMPREHENSIVE INCOME
(In thousands)
| |
| | Common Stock
| |
| |
| | Accumulated
Other
Comprehensive
Income
| |
| |
|---|
| | Comprehensive
Income
| | Additional
Paid-In
Capital
| | Accumulated
Deficit
| | Total
Stockholders'
Equity
| |
|---|
| | Shares
| | Amount
| |
|---|
| Balances, December 31, 2004 | | | | | 32,733 | | $ | 327 | | $ | 339,995 | | $ | (86,856 | ) | $ | 12,274 | | $ | 265,740 | |
| Exercise of stock options | | $ | — | | 1,099 | | | 11 | | | 18,043 | | | — | | | — | | | 18,054 | |
| Common stock repurchased and retired | | | — | | (2,834 | ) | | (28 | ) | | (29,449 | ) | | (23,107 | ) | | — | | | (52,584 | ) |
| Common stock issued under employee stock purchase plan | | | — | | 149 | | | 1 | | | 2,517 | | | — | | | — | | | 2,518 | |
| Tax benefit from exercise of stock options | | | — | | — | | | — | | | 424 | | | — | | | — | | | 424 | |
| Net income | | | 14,135 | | — | | | — | | | — | | | 14,135 | | | — | | | 14,135 | |
| Unrealized loss on marketable securities | | | (184 | ) | — | | | — | | | — | | | — | | | (184 | ) | | (184 | ) |
| Foreign currency translation adjustments | | | (6,124 | ) | — | | | — | | | — | | | — | | | (6,124 | ) | | (6,124 | ) |
| | |
| | | | | | | | | | | | | | | | | | |
| Comprehensive income for fiscal 2005 | | $ | 7,827 | | | | | | | | | | | | | | | | | | |
| | |
| |
| |
| |
| |
| |
| |
| |
| Balances, December 31, 2005 | | | | | 31,147 | | $ | 311 | | $ | 331,530 | | $ | (95,828 | ) | $ | 5,966 | | $ | 241,979 | |
| Exercise of stock options | | $ | — | | 665 | | | 7 | | | 11,505 | | | — | | | — | | | 11,512 | |
| Common stock repurchased and retired | | | — | | (4,692 | ) | | (47 | ) | | (50,394 | ) | | (98,161 | ) | | — | | | (148,602 | ) |
| Common stock issued under employee stock purchase plan | | | — | | 111 | | | 1 | | | 3,020 | | | — | | | — | | | 3,021 | |
| Stock-based compensation | | | — | | — | | | — | | | 13,768 | | | — | | | | | | 13,768 | |
| Tax benefit from exercise of stock options | | | — | | — | | | — | | | 564 | | | — | | | — | | | 564 | |
| Net income | | | 82,602 | | — | | | — | | | — | | | 82,602 | | | — | | | 82,602 | |
| Unrealized gain on marketable securities | | | 578 | | — | | | — | | | — | | | — | | | 578 | | | 578 | |
| Foreign currency translation adjustments | | | 4,205 | | — | | | — | | | — | | | — | | | 4,205 | | | 4,205 | |
| | |
| | | | | | | | | | | | | | | | | | |
| Comprehensive income for fiscal 2006 | | $ | 87,385 | | | | | | | | | | | | | | | | | | |
| | |
| |
| |
| |
| |
| |
| |
| |
| Balances, December 31, 2006 | | | | | 27,231 | | $ | 272 | | $ | 309,993 | | $ | (111,387 | ) | $ | 10,749 | | $ | 209,627 | |
| Exercise of stock options and stock appreciation rights | | $ | — | | 1,719 | | | 18 | | | 27,457 | | | — | | | — | | | 27,475 | |
| Common stock repurchased and retired | | | — | | (2,580 | ) | | (26 | ) | | (28,202 | ) | | (62,929 | ) | | — | | | (91,157 | ) |
| Common stock issued under employee stock purchase plan | | | — | | 127 | | | 1 | | | 3,912 | | | — | | | — | | | 3,913 | |
| Tax withholding on vesting of restricted stock units | | | — | | — | | | — | | | (14 | ) | | — | | | — | | | (14 | ) |
| Tax withholding on exercise of stock appreciation rights | | | — | | — | | | — | | | (105 | ) | | — | | | — | | | (105 | ) |
| Stock-based compensation | | | — | | — | | | — | | | 13,765 | | | — | | | — | | | 13,765 | |
| Tax benefit from exercise of stock options | | | — | | — | | | — | | | 158 | | | — | | | — | | | 158 | |
| Net income | | | 12,631 | | — | | | — | | | — | | | 12,631 | | | — | | | 12,631 | |
| Unrealized gain on marketable securities | | | 8 | | — | | | — | | | — | | | — | | | 8 | | | 8 | |
| Foreign currency translation adjustments | | | 3,545 | | — | | | — | | | — | | | — | | | 3,545 | | | 3,545 | |
| | |
| | | | | | | | | | | | | | | | | | |
| Comprehensive income for fiscal 2007 | | $ | 16,184 | | | | | | | | | | | | | | | | | | |
| | |
| |
| |
| |
| |
| |
| |
| |
| Balances, December 31, 2007 | | | | | 26,497 | | $ | 265 | | $ | 326,964 | | $ | (161,685 | ) | $ | 14,302 | | $ | 179,846 | |
| | | | | |
| |
| |
| |
| |
| |
| |
The accompanying notes are an integral part of these consolidated financial statements.
73
ADVENT SOFTWARE, INC.
CONSOLIDATED STATEMENTS OF CASH FLOWS
(In thousands)
| | Years Ended December 31
| |
|---|
| | 2007
| | 2006
| | 2005
| |
|---|
| Cash flows from operating activities: | | | | | | | | | | |
| | Net income | | $ | 12,631 | | $ | 82,602 | | $ | 14,135 | |
| | Adjustments to reconcile net income to net cash provided by operating activities: | | | | | | | | | | |
| | | Tax benefit from exercise of stock options | | | — | | | — | | | 424 | |
| | | Stock-based compensation | | | 13,396 | | | 13,596 | | | — | |
| | | Depreciation and amortization | | | 11,185 | | | 12,764 | | | 15,300 | |
| | | Acquired in-process research and development | | | 150 | | | — | | | — | |
| | | Provision for (reduction of) doubtful accounts | | | 79 | | | 988 | | | (436 | ) |
| | | Provision for (reduction of) sales returns | | | (135 | ) | | (776 | ) | | 2,182 | |
| | | Loss on disposition of fixed assets | | | 651 | | | 205 | | | — | |
| | | (Gain) loss on investments | | | (4,265 | ) | | 219 | | | (3,333 | ) |
| | | Other than temporary loss on private equity investment | | | 585 | | | — | | | — | |
| | | Deferred income taxes | | | 2,285 | | | (83,380 | ) | | (1,128 | ) |
| | | Other | | | 494 | | | (146 | ) | | (1,010 | ) |
| | | Changes in operating assets and liabilities, net of effect of acquisitions: | | | | | | | | | | |
| | | | Accounts receivable | | | (6,280 | ) | | (8,782 | ) | | (293 | ) |
| | | | Prepaid and other assets | | | (10,019 | ) | | (1,809 | ) | | 93 | |
| | | | Accounts payable | | | 189 | | | 63 | | | 1,120 | |
| | | | Accrued liabilities | | | 6,156 | | | 8,847 | | | 4,570 | |
| | | | Deferred revenues | | | 35,038 | | | 20,197 | | | 6,315 | |
| | | | Income taxes payable | | | 236 | | | 2,188 | | | (1,236 | ) |
| | |
| |
| |
| |
| Net cash provided by operating activities | | | 62,376 | | | 46,776 | | | 36,703 | |
| | |
| |
| |
| |
| Cash flows from investing activities: | | | | | | | | | | |
| | Cash used in acquisitions, net of cash acquired | | | (8,211 | ) | | (97 | ) | | (1,028 | ) |
| | Purchases of property and equipment | | | (8,902 | ) | | (19,155 | ) | | (6,440 | ) |
| | Capitalized software development costs | | | (3,033 | ) | | (1,352 | ) | | (1,511 | ) |
| | Proceeds from sales of investments | | | 11,621 | | | — | | | 3,791 | |
| | Purchases of marketable securities | | | — | | | (47,882 | ) | | (123,652 | ) |
| | Sales and maturities of marketable securities | | | 24,921 | | | 115,763 | | | 174,030 | |
| | Change in restricted cash | | | (372 | ) | | (1,256 | ) | | — | |
| | Other | | | — | | | — | | | 4 | |
| | |
| |
| |
| |
| Net cash provided by investing activities | | | 16,024 | | | 46,021 | | | 45,194 | |
| | |
| |
| |
| |
| Cash flows from financing activities: | | | | | | | | | | |
| | Proceeds from exercises of stock options | | | 27,356 | | | 11,512 | | | 18,054 | |
| | Common stock repurchased and retired | | | (91,157 | ) | | (148,602 | ) | | (52,584 | ) |
| | Proceeds from common stock issued under the employee stock purchase plan | | | 3,913 | | | 3,021 | | | 2,518 | |
| | Proceeds from long-term borrowing | | | 25,000 | | | — | | | — | |
| | Repayment of long-term borrowing | | | (25,000 | ) | | — | | | — | |
| | Excess tax benefits from stock-based compensation | | | 607 | | | 357 | | | — | |
| | |
| |
| |
| |
| Net cash used in financing activities | | | (59,281 | ) | | (133,712 | ) | | (32,012 | ) |
| | |
| |
| |
| |
| Effect of exchange rate changes on cash and cash equivalents | | | 283 | | | 161 | | | (121 | ) |
| Net increase (decrease) in cash and cash equivalents | | | 19,402 | | | (40,754 | ) | | 49,764 | |
| Cash and cash equivalents at beginning of period | | | 30,187 | | | 70,941 | | | 21,177 | |
| | |
| |
| |
| |
| Cash and cash equivalents at end of period | | $ | 49,589 | | $ | 30,187 | | $ | 70,941 | |
| | |
| |
| |
| |
| Supplemental disclosure of cash flow information: | | | | | | | | | | |
| Cash paid for income taxes, net of refunds | | $ | 779 | | $ | 1,932 | | $ | 2,010 | |
| Cash paid for interest | | $ | 920 | | $ | 88 | | $ | 24 | |
The accompanying notes are an integral part of these consolidated financial statements
74
ADVENT SOFTWARE, INC.
NOTES TO CONSOLIDATED FINANCIAL STATEMENTS
Note 1—Summary of Significant Accounting Policies
Business description: Advent Software, Inc. ("Advent" or "the Company") provides stand-alone and client/server software products, data and data interfaces and related maintenance and services that automate, integrate and support certain mission-critical functions of the front, middle and back offices of investment management organizations. Advent's clients vary significantly in size and assets under management and include investment advisors, brokerage firms, banks, hedge funds, corporations, public funds, foundations, universities and non-profit organizations.
Basis of presentation: The consolidated financial statements include the accounts of Advent and its wholly-owned subsidiaries. All intercompany transactions and amounts have been eliminated under US generally accepted accounting principles (GAAP).
Year End: Advent's fiscal year ends on December 31st.
Foreign currency translation: The functional currency of the Company's foreign subsidiaries is their local currencies. All assets and liabilities denominated in foreign functional currencies are translated into US dollars at the exchange rate on the balance sheet date. Revenues, costs and expenses in foreign functional currencies are translated at the average rate of exchange during the period.
Foreign currency measurement: Asset and liabilities denominated in currencies other than the functional currencies are re-measured into the functional currency with gains or losses recorded in "interest income and other, net" on the consolidated statement of operations.
Use of estimates: The preparation of financial statements in conformity with accounting principles generally accepted in the United States of America requires management to make estimates and assumptions that affect the reported amounts of assets and liabilities, the disclosure of contingent assets and liabilities at the date of the financial statements and the reported amounts of revenues and expenses during the reporting period. These estimates are based on information available as of the date of the financial statements. Actual results could differ from those estimates. Advent believes the following critical accounting policies affect its more significant judgments and estimates used in the preparation of its consolidated financial statements: Business Combinations; Goodwill; Revenue Recognition; Income Taxes; Restructuring Charges and Related Accruals; Impairment of Long-Lived Assets; Legal Contingencies; Sales Returns and Accounts Receivable Allowances; and Stock-Based Compensation.
Fair value of financial instruments: The amounts reported for cash equivalents, marketable securities, receivables, and accounts payable are considered to approximate their market values based on comparable market information available at the respective balance sheet dates and their short-term nature.
Cash and cash equivalents: Cash equivalents are comprised of highly liquid investments purchased with an original or remaining maturity of 90 days or less at the date of purchase.
Marketable securities: All of Advent's marketable securities are classified as available-for-sale and are carried at fair value. The unrealized gains and losses, net of any related tax effect, are reported in accumulated comprehensive income in stockholders' equity in the accompanying consolidated financial statements, with the exception of Advent's broker/dealer subsidiary, which reports unrealized gains and losses in "interest income and other expense, net" on the consolidated statement of operations.
75
ADVENT SOFTWARE, INC.
NOTES TO CONSOLIDATED FINANCIAL STATEMENTS (Continued)
Note 1—Summary of Significant Accounting Policies (Continued)
Realized gains and losses and declines in value judged to be other-than-temporary on available-for-sale securities are also included in "interest income and other, net".
Investments: Investments are recorded at the lower of cost or fair value and included in "other assets, net" on the consolidated balance sheets and consist of non-marketable investments in privately held companies, most of which can be considered in the start-up or development stages. It is Advent's policy to review investments in privately held companies on a regular basis to evaluate the carrying amount and economic viability of these companies. This policy includes, but is not limited to, reviewing each of the companies cash position, financing needs, earnings/revenue outlook, operational performance, management/ownership changes and competition. The evaluation process is based on information that Advent requests from these privately held companies. This information is not subject to the same disclosure regulations as US publicly traded companies, and as such, the basis for these evaluations is subject to timing and the accuracy of the data received from these companies.
The Company's investments in privately held companies are assessed for impairment when a review of the investee's operations indicates that a decline in value of the investment is other than temporary. Such indicators include, but are not limited to, limited capital resources, limited prospects of receiving additional financing, and prospects for liquidity of the related securities. Impaired investments in privately held companies are written down to estimated fair value. The Company estimates fair value using a variety of valuation methodologies. Such methodologies include comparing the private company with publicly traded companies in similar lines of business, applying revenue multiples to estimated future operating results for the private company and estimating discounted cash flows for that company.
Product development: Product development expenses consist primarily of salary, benefits and stock-based compensation for the Company's development and technical support staff, contractors' fees and other costs associated with the enhancements of existing products and services and development of new products and services. Costs incurred for software development prior to technological feasibility are expensed as product development costs in the period incurred. Once the point of technological feasibility is reached, which is generally the completion of a working prototype that has no critical bugs and is a release candidate, development costs are capitalized until the product is ready for general release and are classified "other intangible assets, net" on the consolidated balance sheets. The Company amortizes capitalized software development costs using the greater of the ratio of the products' current gross revenues to the total of current expected gross revenues or on a straight-line basis over the estimated economic life of the related product, which is typically three years.
Capitalization of internal use software: Certain costs related to computer software developed or obtained for internal use are capitalized in accordance with American Institute of Certified Public Accountants Statement of Position No. 98-1, "Accounting for the Costs of Computer Software Developed or Obtained for Internal Use." The Company amortizes internal use software costs over their estimated useful lives, which typically range from two to five years. Costs of $2.2 million, $2.8 million and $1.2 million related to the development of internal use software were capitalized in 2007, 2006 and 2005, respectively, and are included in "property and equipment, net" on the consolidated balance sheets.
Additionally, Advent capitalizes certain costs incurred for web site design and development in accordance with Emerging Issue Task Force No. 00-2, "Accounting for Web Site Development costs."
76
ADVENT SOFTWARE, INC.
NOTES TO CONSOLIDATED FINANCIAL STATEMENTS (Continued)
Note 1—Summary of Significant Accounting Policies (Continued)
These costs are amortized over their estimated useful lives, which typically range from two to five years. Web site design and development costs of $221,000 were capitalized in 2005. There were no website development costs capitalized in 2007 or 2006.
Property and equipment: Property and equipment are stated at cost, less accumulated depreciation and amortization. Advent calculates depreciation and amortization using the straight-line method over the assets' estimated useful lives. Amortization of leasehold improvements is computed using the straight-line method over the shorter of the estimated useful life of the assets or the remaining lease term. The cost and related accumulated depreciation applicable to property and equipment sold or no longer in service are eliminated from the accounts and any gains or losses are generally included in operating expenses. Useful lives by principal classifications are as follows:
| Computer equipment and software | | 1 to 6 years |
| Leasehold improvements | | 2 years to end of lease term |
| Furniture and fixtures | | 3 to 5 years |
| Telephone system | | 1 to 10 years |
Repairs and maintenance expenditures, which are not considered improvements and do not extend the useful life of the property and equipment, are expensed as incurred.
Business combinations: When Advent acquires businesses, the Company allocates the purchase price to tangible assets and liabilities and identifiable intangible assets acquired. Any residual purchase price is recorded as goodwill.
Accounting for long-lived assets: Advent reviews goodwill for impairment annually during the fourth quarter of the fiscal year (as of November 1) and more frequently if an event or circumstance indicates that an impairment loss has occurred. Advent is required to test goodwill for impairment at the reporting unit level. Advent has determined that its operations were organized into three reporting units as of November 1, 2007. The test for goodwill impairment is a two-step process:
The first step compares the fair value of each reporting unit with its respective carrying amount, including goodwill. If the fair value of the reporting unit exceeds its carrying amount, goodwill of the reporting unit is considered not impaired, thus the second step of the impairment test is unnecessary.
The second step, used to measure the amount of impairment loss, compares the implied fair value of each reporting unit's goodwill with the respective carrying amount of that goodwill. If the carrying amount of the reporting unit goodwill exceeds the implied fair value of that goodwill, an impairment loss shall be recognized in an amount equal to that excess.
The process for evaluating the potential impairment of goodwill is subjective and requires judgment at many points during the test including future revenue forecasts, discount rates and various reporting unit allocations. During the fourth quarter of 2007, Advent completed the first step of its annual impairment test which did not indicate impairment. Therefore, the second step of the impairment test was not necessary to perform.
Advent also reviews its other long-lived assets including property and equipment and other intangibles for impairment whenever events or changes in circumstances indicate that the carrying
77
ADVENT SOFTWARE, INC.
NOTES TO CONSOLIDATED FINANCIAL STATEMENTS (Continued)
Note 1—Summary of Significant Accounting Policies (Continued)
amount of these assets may not be recoverable. Factors the Company considers important which could trigger an impairment review include the following:
- •
- Significant underperformance relative to expected historical or projected future operating results;
- •
- Significant changes in the manner or use of the acquired assets or the strategy for the overall business;
- •
- Significant negative market or economic trends;
- •
- Significant decline in the Company's stock price for a sustained period; and
- •
- Market capitalization relative to net book value.
Recoverability is measured by a comparison of the assets' carrying amount to their expected future undiscounted net cash flows. If such assets are considered to be impaired, the impairment to be recognized is measured based on the amount by which the carrying amount of the asset exceeds its fair value.
Other intangible assets mainly represent completed technology, distributor licenses, customer lists, trade names acquired in business combinations, and capitalized software development costs. Identifiable intangibles are amortized on a straight line basis over their estimated useful lives as follows:
| Software development costs | | 3 years |
| Purchased technology | | 3 to 7 years |
| Customer relationships | | 4 to 7 years |
Revenue recognition: Advent recognizes revenue from term license, maintenance, other recurring; perpetual license fees; and professional services and other. Additionally, in 2005 and 2006, Advent earned commissions from customers who used the Company's broker/dealer, Second Street Securities, to soft dollar the purchase of Advent and non-Advent products and services with soft dollars. Soft dollaring enables the customers to use the commissions earned on trades to pay all or part of the fees owed to the Company for non-Advent products or services, which are initially paid for by Second Street Securities. The commission revenues earned from soft dollar purchases of non-Advent products or services were recorded as other revenues in "professional services and other" revenues on the Company's consolidated statements of operations.
Advent offers a wide variety of products and services to a large number of financially sophisticated customers. While many of the Company's lower-priced license transactions, maintenance contracts, subscription-based transactions and professional services projects conform to a standard structure, many of Advent's larger transactions are complex and may require significant review and judgment in Advent's application of generally accepted accounting principles.
Software license fees. Advent recognizes revenue from the licensing of software when persuasive evidence of an arrangement exists, the product has been delivered, the fee is fixed or determinable and collection of the resulting receivable is probable. Advent generally uses a signed license agreement as evidence of an arrangement. Sales through the Company's distributors are evidenced by a master agreement governing the relationship together with binding order forms and signed contracts from the distributor's customers. Revenue is recognized once shipment to the distributor's customer has taken place and when all other revenue recognition criteria have been met. Delivery occurs when a product is
78
ADVENT SOFTWARE, INC.
NOTES TO CONSOLIDATED FINANCIAL STATEMENTS (Continued)
Note 1—Summary of Significant Accounting Policies (Continued)
delivered to a common carrier F.O.B shipping point or upon notification that software is available for electronic download through the Company's fulfillment vendor. Some of Advent's arrangements include acceptance provisions, and if such acceptance provisions are present, delivery is deemed to occur upon acceptance. Advent assesses whether the fee is fixed or determinable based on the payment terms associated with the transaction. The Company assesses whether the collectibility of the resulting receivable is probable based on a number of factors, including the credit worthiness of the customer determined through review of credit reports, Advent's transaction history with the customer, other available information and pertinent country risk if the customer is located outside the United States. Advent's standard payment terms are due at 180 days or less but payment terms may vary based on the country in which the agreement is executed. Software licenses are sold with maintenance and, frequently, professional services.
Advent typically licenses its products on a per server, per user basis with the price per customer varying based on the selection of the products licensed, the assets under administration, the number of site installations and the number of authorized users. Advent has continued its transition from selling mostly perpetual licenses to selling a mix of term and perpetual licenses, and the Company expects term license revenue to increase as a proportion of total recurring revenues (which Advent defines as term license, maintenance and other recurring revenues) in the future. Term license revenue comprised approximately 22% and 14% of total recurring revenues in 2007 and 2006, respectively. Revenue recognition for software licensed under term and perpetual license models differs depending on which type of contract a customer signs:
Term license contract prices include fees for both the software license and maintenance. Advent offers multi-year term licenses by which a customer makes a binding commitment that typically spans three years. For multi-year term licenses, Advent has not established vendor specific objective evidence, or VSOE, of fair value for the software license and maintenance components and, as a result, in situations where the Company is also performing related professional services, it defers all revenue and directly related expenses under the arrangement until the implementation services are complete and the remaining services are substantially complete. At the point professional services are substantially completed, Advent recognizes a pro-rata amount of the term license revenue, professional services fees earned and related expenses, based on the elapsed time from the start of the term license to the substantial completion of professional services. We determine whether services are substantially complete by consulting with the professional services group and applying management judgment. Term license revenue for the remaining contract years and the remaining deferred professional services revenue and related expenses are recognized ratably over the remaining contract length. When multi-year term licenses are sold and do not include related professional services, Advent recognizes the entire term license revenue ratably over the period of the contract term from the effective date of the license agreement assuming all other revenue recognition criteria have been met. Revenues from term licenses are included in "Term license, maintenance and other recurring" revenues on the consolidated statement of operations.
- •
- Perpetual licenses
Advent allocates revenue to delivered components, normally the license component of the arrangement, using the residual method, based on VSOE of fair value of the undelivered
79
ADVENT SOFTWARE, INC.
NOTES TO CONSOLIDATED FINANCIAL STATEMENTS (Continued)
Note 1—Summary of Significant Accounting Policies (Continued)
elements (generally the maintenance and professional services components), which is specific to the Company. Advent determines the fair value of the undelivered elements based on the historical evidence of the Company's stand-alone sales of these elements to third parties and renewal rates. If VSOE of fair value does not exist for any undelivered elements, then the entire arrangement fee is deferred until delivery of that element has occurred except post customer support. Revenues from perpetual licenses are included in "Perpetual license fees" revenue on the consolidated statement of operations.
Certain of Advent's perpetual and term license contracts include asset-based fee structures that provide additional revenues based on the assets that the client manages using the Company's software ("Assets Under Administration" or "AUA"). Contracts containing an AUA fee structure have a defined measurement period which requires the client to self-report actual AUA in arrears of the specified period. AUA fees above the stated minimum fee for the same period are considered incremental fees. Because incremental fees are not determinable until the conclusion of the measurement period, they are both earned and recognized in arrears, on a quarterly or annual basis. Incremental fees from perpetual AUA contracts are included in "Perpetual license fees" on the consolidated statement of operations. Incremental fees from term AUA contracts are included in "Term license, maintenance and other recurring" revenue on the consolidated statement of operations.
For certain term AUA contracts signed in 2006, which will be entering the second year of the arrangement in 2007, Advent began accruing the minimum AUA component of the fees in the applicable period during the first quarter of 2007 rather than in arrears as was the treatment for earlier contracts. The Company has gained more experience in working with these types of arrangements and is able to conclude that the minimum fees are fixed and determinable. The change in the first quarter of 2007 to the Company's revenue recognition practice to start to accrue for minimum fees is based on an overall affirmative experience with the Company's existing AUA-based arrangements where historical experience has shown that Advent has received the AUA report, invoiced the client for both the minimum and incremental amounts, and received payment. Therefore, beginning in the first quarter of 2007, Advent recognizes AUA contract minimum fees in the period to which they are applicable, whereas Advent continues to recognize incremental fees in arrears once clients contractually report them to the Company, because the incremental fees are not determinable until reported. The impact of this change for 2007 was an increase to term license revenue of approximately $117,000.
For existing term license arrangements signed prior to 2006 which are in their second or third year, where the Company had previously begun billing in arrears of the measurement period, Advent will continue to recognize revenue for the minimum (and incremental) value of the AUA fees upon receipt of the customer's AUA report.
If a customer purchased Advent's software and chose to enter into a soft dollar arrangement through the Company's in-house broker/dealer subsidiary, Second Street Securities, the soft dollar arrangement did not change or modify the original fixed or determinable fee in the written contract. The customer is required to pay the original fee for the Company's software within one year. If insufficient trading volume is generated to pay the entire original fee within one year, the customer is still required to render payment within one year. In 2006, Advent completed the wind down of its soft dollar business. However, customers may continue to enter into a soft dollar arrangement through a third-party broker/dealer to purchase Advent's software. The original payment terms apply, regardless of the arrangement with the third-party broker/dealer. The option to soft dollar a transaction does not
80
ADVENT SOFTWARE, INC.
NOTES TO CONSOLIDATED FINANCIAL STATEMENTS (Continued)
Note 1—Summary of Significant Accounting Policies (Continued)
alter the underlying revenue recognition for the transaction; all the revenue recognition criteria listed in the "Software licenses" section above must be assessed in determining how the revenue will be recognized.
Maintenance and other recurring revenues. Advent offers annual maintenance programs on perpetual licenses that provide for technical support and updates to the Company's software products. Maintenance fees are bundled with perpetual license fees in the initial licensing year and charged separately for renewals of annual maintenance in subsequent years. Fair value for maintenance is based upon either renewal rates stated in the contracts or separate sales of renewals to customers. Generally, Advent recognizes maintenance revenue ratably over the contract term.
Advent offers other recurring revenue services that are either subscription-based or transaction-based, and primarily include the provision of software interfaces to, and the capability to download securities information from, third party data providers. The Company recognizes revenue from recurring revenue transactions either ratably over the subscription period or as the transactions occur based on the terms of the arrangement.
Professional services and other revenues. Advent offers a variety of professional services that include project management, implementation, data conversion, integration, custom report writing and training. Fair value for professional services is based upon separate sales of these services by the Company to customers. Advent's professional services are generally billed based on hourly rates together with reimbursement for travel and accommodation expenses. Advent generally recognizes revenue as these professional services are performed, except in the case of multi-year term license contracts which are described in the "term licenses" section above. Certain professional services arrangements involve acceptance criteria. In these cases, revenue and related expenses are recognized upon acceptance. Advent's professional services and other revenue also include revenue from the Company's annual user conferences.
Commission revenues received from "soft dollar" transactions for products and services not related to the Company's products and services are recorded as other revenues on a net basis as Advent is not the primary obligor in these transactions. Revenues from these "soft dollar" transactions are recognized on a trade-date basis as securities transactions occur.
Directly related expenses. When Advent defers service revenues, it also defers the direct costs incurred in the delivery of those services to the extent those costs are recoverable through the future revenues on non-cancellable contracts as prepaid contract expense. Advent recognizes those deferred costs as costs of professional services revenues proportionally and over the same period that the deferred revenue is recognized as service revenue. When Advent defers license revenue, the Company defers the direct incremental costs incurred as a result of selling the contract (i.e. sales commissions earned by the salesforce as a part of their overall compensation) because those costs would not have been incurred but for the acquisition of that contract. Advent recognizes those costs as sales and marketing expense proportionally and over the same period as the license revenues.
Allowance for doubtful accounts and sales returns: Advent analyzes specific accounts receivable, historical bad debts, customer concentrations, customer credit-worthiness, current economic trends and changes in its customer payment terms when evaluating the adequacy of the allowance for doubtful
81
ADVENT SOFTWARE, INC.
NOTES TO CONSOLIDATED FINANCIAL STATEMENTS (Continued)
Note 1—Summary of Significant Accounting Policies (Continued)
accounts. Advent has recorded a provision for (reduction of) bad debt of $0.1 million, $1.0 million and $(0.4) million in fiscal 2007, 2006 and 2005, respectively.
Advent also analyzes customer demand and acceptance of product and historical returns when evaluating the adequacy of the allowance for sales returns, which are not generally provided to customers. Allowances for sales returns are accounted for as deductions to net revenues and increases to reserves within deferred revenues. Advent's standard practice is to enforce its contract terms and not allow its customers to return software. The Company has, however, allowed customers to return software on a limited case-by-case basis. There are two situations where it provides a contractual limited right of return to end-user customers only: in shrink-wrap license agreements for Advent products, and certain MicroEdge products. The shrink-wrap license agreement for Advent products provides for a right of return within seven days of delivery of the software. Certain MicroEdge software license agreements allow for either a thirty-day money back guarantee or a seven-day right of return.
Advent has the ability to estimate returns based on a long history of experience with relatively homogenous transactions and the fact that the return period is short. The Company has recorded sales returns provisions as offsets to revenue in the period the sales return becomes probable, in accordance with FASB Statement No. 48, "Revenue Recognition when Right of Return Exists". The estimates for returns are adjusted periodically based upon historical rates of returns and other related factors. Advent has an algorithm for calculating the value of reserves that takes the previous 12 months of experience into account. Advent has recorded a sales returns provision (benefit) to decrease (increase) revenue for these situations based on the Company's historical experience of $0.1 million, $(0.8) million and $2.2 million in fiscal 2007, 2006 and 2005, respectively.
Advertising costs: The Company expenses advertising costs as incurred and classifies these costs under sales and marketing expense. Total advertising expenses were $922,000, $656,000, and $465,000 for fiscal 2007, 2006 and 2005, respectively.
Stock-based compensation: Effective January 1, 2006, Advent adopted the provisions of, and accounts for stock-based compensation in accordance with, the Financial Accounting Standards Board's ("FASB") Statement of Financial Accounting Standards No. 123—revised 2004 ("SFAS 123R"), "Share-Based Payment" which replaced Statement of Financial Accounting Standards No. 123 ("SFAS 123"), "Accounting for Stock-Based Compensation" and supersedes APB Opinion No. 25 ("APB 25"), "Accounting for Stock Issued to Employees."
Under the fair value recognition provisions of this statement, stock-based compensation cost is measured at the grant date based on the fair value of the award and is recognized as expense on a straight-line basis over the requisite service period, which is the vesting period. The Company elected to implement this statement using the modified-prospective method, under which prior periods are not restated for comparative purposes. Under the modified prospective method, the valuation provisions of SFAS 123R apply to new grants and to grants that were outstanding as of the effective date. Estimated compensation expense for grants that were outstanding as of the effective date will be recognized over the remaining service period using the compensation cost estimated for the SFAS 123 pro forma disclosures. Advent makes quarterly assessments of the adequacy of the Company's tax credit pool to determine if there are any deficiencies which require recognition in the Company's consolidated statements of operations.
82
ADVENT SOFTWARE, INC.
NOTES TO CONSOLIDATED FINANCIAL STATEMENTS (Continued)
Note 1—Summary of Significant Accounting Policies (Continued)
Advent uses the Black-Scholes option pricing model to determine the fair value of stock options, stock appreciation rights ("SAR") and employee stock purchase plan shares. The fair value of the Company's restricted stock units is calculated based on the fair market value of Advent's stock on the date of grant. The determination of the fair value of stock-based payment awards on the date of grant using an option-pricing model is affected by Advent's stock price as well as assumptions regarding a number of complex and subjective variables. These variables include Advent's expected stock price volatility over the term of the awards, actual and projected employee exercise behaviors, risk-free interest rate and expected dividends.
Advent estimates the volatility of the Company's common stock based on an equally weighted average of historical and implied volatility of the Company's common stock. Advent determined that a blend of historical and implied volatility is more reflective of the market conditions and a better indicator of expected volatility than using purely historical volatility. The Company estimates the expected life of options and SARs granted based on historical experience of similar awards, giving consideration to the contractual terms of the stock-based awards, vesting schedules and expectations of future employee behavior. The Company bases the risk-free interest rate on the US Treasury yield curve in effect at the time of grant for periods corresponding with the expected life of the option and SAR. The Company does not anticipate paying any cash dividends in the foreseeable future and therefore use an expected dividend yield of zero in the option pricing model. SFAS 123R requires forfeitures to be estimated at the time of grant and revised, if necessary, in subsequent periods if actual forfeitures differ from those estimates. Forfeitures were estimated based on the Company's historical experience over the last ten years. Prior to the adoption of SFAS 123R, the Company accounted for forfeitures as they occurred.
The adoption of SFAS 123R had a material impact on Advent's consolidated financial position and results of operations. See Note 10, "Stock Based Compensation", for further information regarding Advent's stock-based compensation assumptions and expense, including pro forma disclosures for prior periods as if the Company had recorded stock-based compensation expense.
Restructuring charges and related accruals: Since 2003, Advent has developed and implemented formalized plans for restructuring the business to better align its resources to market conditions and recorded significant charges. In connection with these plans, Advent has recorded estimated expenses for severance and benefits, lease cancellations, asset write-offs and other restructuring costs. Given the significance of, and the timing of the execution of such activities, this process is complex and involves periodic reassessments of estimates made at the time the original decisions were made, including evaluating real estate market conditions for expected vacancy periods and sub-lease rental income. Advent continually evaluates the adequacy of the remaining liabilities under its restructuring initiatives. Although the Company believes that these estimates accurately reflect the costs of its restructuring plans, actual results may differ, thereby requiring Advent to record additional provisions or reverse a portion of such provisions.
Income taxes: Advent accounts for worldwide income taxes under an asset and liability approach that requires the expected future tax consequences of temporary differences between book and tax bases of assets and liabilities be recognized as deferred tax assets and liabilities. A valuation allowance is recorded to reduce the net deferred tax assets to an amount that is more likely than not to be realized.
83
ADVENT SOFTWARE, INC.
NOTES TO CONSOLIDATED FINANCIAL STATEMENTS (Continued)
Note 1—Summary of Significant Accounting Policies (Continued)
The Company has elected to use the "with and without" approach as described in EITF Topic No. D-32 in determining the order in which tax attributes are utilized. As a result, the Company will only recognize a tax benefit from stock-based awards in additional paid-in capital if an incremental tax benefit is realized after all other tax attributes currently available to the Company have been utilized. In addition, the Company has elected to account for the impact of stock-based awards on other tax attributes, such as the research tax credit, through the consolidated statement of operations.
During the fourth quarter of 2006, Advent determined that there was sufficient positive evidence to support a significant decrease in the Company's valuation allowance. As a result of this release of a majority of its valuation allowance and recognition of deferred tax assets, Advent's financial statements for fiscal 2006 reflect an increase in assets on its balance sheet, a decrease in goodwill relating to the recognition of acquired deferred tax assets that were offset by a valuation allowance in purchase accounting and a tax benefit to the Company's statement of operations in the amount of the reversal.
Net income per share: Basic net income per share is computed by dividing net income by the weighted average number of common shares outstanding for that period. Diluted net income per share is computed giving effect to all dilutive potential common shares that were outstanding during the period. Dilutive potential shares consist of incremental common shares issuable upon exercise of stock options and stock appreciation rights, vesting of restricted stock units and conversion of preferred stock (none outstanding) for all periods, except in situations where inclusion is anti-dilutive.
Comprehensive income: Comprehensive income consists of net income, net unrealized foreign currency translation adjustments and net unrealized gains or losses on available-for-sale marketable securities and is presented in the consolidated statements of stockholders' equity and comprehensive income.
Segment information: The Company has determined that it has the following two reportable segments: 1) Advent Investment Management, and 2) MicroEdge. Advent Investment Management derives revenues from the development, marketing and sale of software products, data interfaces and related maintenance and services that automate, integrate and support certain mission-critical functions of investment management organizations. MicroEdge derives revenues from the sale of software and services for grant management, matching gifts and volunteer tracking for the grantmaking community.
International sales, which are based on the location to which the product is shipped or services are delivered, represented 12%, 12%, and 11% of the Company's net revenues for fiscal 2007, 2006 and 2005, respectively. No single customer accounted for more than 10% of net revenues for fiscal 2007, 2006 or 2005.
Certain risks and concentrations: Product revenues are concentrated in the investment management software industry, which is highly competitive and rapidly changing. Significant technological changes in the industry or customer requirements, or the emergence of competitive products with new capabilities or technologies could adversely affect operating results. Additionally, Advent derives a significant portion of its revenues from its Axys, Geneva and Advent Portfolio Exchange applications and ancillary products and services, and therefore their market acceptance is essential to the Company's success.
Financial instruments that potentially subject the Company to concentrations of credit risks comprise, principally, cash, short-term marketable securities, and trade accounts receivable. Advent
84
ADVENT SOFTWARE, INC.
NOTES TO CONSOLIDATED FINANCIAL STATEMENTS (Continued)
Note 1—Summary of Significant Accounting Policies (Continued)
invests excess cash through banks, mutual funds, and brokerage houses primarily in highly liquid securities and has investment policies and procedures that minimize credit risk. Advent's marketable securities consist of diversified investment grade securities traded in the United States of America. The Company believes no significant concentration of credit risk exists with respect to these securities.
With respect to accounts receivable, Advent performs ongoing credit evaluations of its customers and generally does not require collateral. The Company maintains reserves for potential credit losses on customer accounts when deemed necessary. At December 31, 2007 and 2006, no single customer accounted for more than 10% of accounts receivable.
Common Stock Repurchases: Advent accounts for common stock repurchases by allocating the cash paid in excess of par value to additional paid-in capital and accumulated deficit. The Company calculates the average additional paid-in capital per outstanding share at the beginning of each monthly period in which stock was repurchased and records the difference between the repurchase price per share and the sum of the par value and average paid-in capital per share as an increase to accumulated deficit.
Reclassifications: Certain prior year amounts have been reclassified to conform to the current presentation. These reclassifications do not affect total net revenues, net income or stockholders' equity. Specifically, the Company changed its presentation of revenues and associated cost of revenues during the first quarter of 2007 to more clearly show the nature and components of the Company's revenues under a term licensing model and the predominance of revenue from recurring sources. Historically, the Company separated term license arrangement fees between license and maintenance revenues and allocated those revenues on a 55%/45% basis, respectively. As a result of the increasing significance of term license revenues for the Company, Advent discontinued this practice during the first quarter of 2007, and now classifies all term license revenues, along with perpetual maintenance and other recurring revenues, in the caption "Term license, maintenance and other recurring" revenues.
Advent currently categorizes its revenues as follows: "Term license, maintenance and other recurring," "Perpetual license fees" and "Professional services and other." Prior period amounts have been reclassified to conform to this current presentation.
Additionally, the Company reclassified certain of the deferred revenues and direct costs associated with its term service deferral from current to long-term during the third quarter of 2007. With the evolution of the term service deferral model, Advent is able to isolate amounts that will be recognized as revenue over 12 months from the balance sheet date. Advent has reclassified those deferred revenues and prepaid expense amounts that will be recognized more than 12 months from the balance sheet date from current to long term on the balance sheets. Prior period amounts, previously deemed not significant, have been reclassified to conform to the current presentation as follows (in thousands):
| | December 31, 2006
|
|---|
| | As Previously Reported
| | Reclassification Adjustment
| | As Reclassified
|
|---|
| Prepaid expenses and other | | $ | 12,685 | | $ | (857 | ) | $ | 11,828 |
| Other assets, net | | $ | 15,000 | | $ | 857 | | $ | 15,857 |
| Deferred revenues | | $ | 84,260 | | $ | (2,142 | ) | $ | 82,118 |
| Deferred revenues, long-term | | $ | 1,053 | | $ | 2,142 | | $ | 3,195 |
85
ADVENT SOFTWARE, INC.
NOTES TO CONSOLIDATED FINANCIAL STATEMENTS (Continued)
Note 1—Summary of Significant Accounting Policies (Continued)
Recent Accounting Pronouncements: In September 2006, the FASB issued Statement of Financial Accounting Standards No. 157, "Fair Value Measurements" ("SFAS 157"). SFAS 157 defines fair value, establishes a framework for measuring fair value in accordance with generally accepted accounting principles, and expands disclosures about fair value measurements. The provisions of SFAS 157 will be effective in the first quarter of 2008. The Company does not expect the provisions of SFAS 157 to have a material impact on its future consolidated financial statements.
In February 2007, the FASB issued SFAS No. 159, "The Fair Value Option for Financial Assets and Financial Liabilities—Including an Amendment of FASB Statement No. 115," ("SFAS 159"). This standard permits an entity to choose to measure many financial instruments and certain other items at fair value. Most of the provisions in SFAS 159 are elective; however, the amendment to FASB Statement No. 115, "Accounting for Certain Investments in Debt and Equity Securities," applies to all entities with available-for-sale and trading securities. The fair value option established by SFAS 159 permits all entities to choose to measure eligible items at fair value at specified election dates. A business entity will report unrealized gains and losses on items for which the fair value option has been elected in earnings at each subsequent reporting date. The fair value option (a) may be applied instrument by instrument, with a few exceptions, such as investments otherwise accounted for by the equity method, (b) is irrevocable (unless a new election date occurs), and (c) is applied only to entire arrangements and not to portions of instruments. SFAS 159 is effective as of the beginning of an entity's first fiscal year that begins after November 15, 2007. The Company does not expect the provisions of SFAS 159 to have a material impact on its future consolidated financial statements.
In December 2007, the FASB issued SFAS No. 141 (revised 2007) ("SFAS 141R"), "Business Combinations". SFAS 141R establishes principles and requirements for how the acquirer of a business recognized and measures in its financial statements the identifiable assets acquired, the liabilities assumed, and any non-controlling interest in the acquiree. The statement also provides guidance for recognizing and measuring the goodwill acquired in the business combination and determines what information to disclose to enable users of the financial statement to evaluate the nature and financial effects of the business combination. SFAS 141R is effective for financial statements issued for fiscal years beginning after December 15, 2008. Accordingly, any business combinations Advent engages in will be recorded and disclosed following existing generally accepted accounting principles (GAAP) until January 1, 2009. The Company expects SFAS 141R will have an impact on its consolidated financial statements when effective, but the nature and magnitude of the specific effects will depend upon the nature, terms and size of the acquisitions the Company consummates after the effective date. Advent is still assessing the impact of SFAS 141R on its future consolidated financial statements.
Note 2—Cash Equivalents and Marketable Securities
At December 31, 2007, marketable securities, which were all included as cash equivalents, were summarized as follows (in thousands):
| | Amortized Cost
| | Gross Unrealized Gains
| | Gross Unrealized Losses
| | Aggregate Fair Value
|
|---|
| U.S. government debt securities | | $ | 37,289 | | $ | — | | $ | — | | $ | 37,289 |
86
ADVENT SOFTWARE, INC.
NOTES TO CONSOLIDATED FINANCIAL STATEMENTS (Continued)
Note 2—Cash Equivalents and Marketable Securities (Continued)
At December 31, 2006, marketable securities were summarized as follows (in thousands):
| | Amortized Cost
| | Gross Unrealized Gains
| | Gross Unrealized Losses
| | Aggregate Fair Value
|
|---|
| Corporate debt securities and commercial paper | | $ | 40,626 | | $ | 40 | | $ | (44 | ) | $ | 40,622 |
| U.S. government debt securities | | | 4,427 | | | 12 | | | (16 | ) | | 4,423 |
| | |
| |
| |
| |
|
| | Total | | $ | 45,053 | | $ | 52 | | $ | (60 | ) | $ | 45,045 |
| | |
| |
| |
| |
|
| Reported as: | | | | | | | | | | | | |
| Cash and cash equivalents | | | | | | | | | | | $ | 20,164 |
| Short-term marketable securities | | | | | | | | | | | | 24,881 |
| | | | | | | | | | | |
|
| | Total | | | | | | | | | | | $ | 45,045 |
| | | | | | | | | | | |
|
As of December 31, 2007, there were no unrealized losses associated with the Company's marketable securities. The following table summarizes marketable securities with unrealized losses by contractual maturity dates at December 31, 2006 (in thousands):
| | Less than 12 months
| | Greater than 12 months
| | Total
| |
|---|
| | Fair Value
| | Gross Unrealized Losses
| | Fair Value
| | Gross Unrealized Losses
| | Fair Value
| | Gross Unrealized Losses
| |
|---|
| Commercial debt securities and commercial paper | | $ | 10,292 | | $ | (15 | ) | $ | 5,551 | | $ | (29 | ) | $ | 15,843 | | $ | (44 | ) |
| U.S. government debt securities | | | 469 | | | — | | | 2,293 | | | (16 | ) | | 2,762 | | | (16 | ) |
| | |
| |
| |
| |
| |
| |
| |
| | Total | | $ | 10,761 | | $ | (15 | ) | $ | 7,844 | | $ | (45 | ) | $ | 18,605 | | $ | (60 | ) |
| | |
| |
| |
| |
| |
| |
| |
The gross unrealized losses related to investments are primarily due to a decrease in the fair value of debt securities as a result of an increase in interest rates during fiscal 2006. Advent has determined that the gross unrealized losses on its investments at December 31, 2006 are temporary in nature. Advent regularly reviews its investment portfolio to identify and evaluate investments that have indications of possible impairment. Factors considered in determining whether a loss is temporary include the length of time and extent to which fair value has been less than the cost basis, the financial condition, credit quality and near-term prospects of the investee, and Advent's ability to hold the investment for a period of time sufficient to allow for any anticipated recovery in market value.
Advent's marketable securities are classified as available-for-sale. Management has the ability and intent, if necessary, to liquidate any of these investments in order to meet the Company's liquidity needs within the normal operating cycle. Accordingly, all marketable securities are classified as current assets.
87
ADVENT SOFTWARE, INC.
NOTES TO CONSOLIDATED FINANCIAL STATEMENTS (Continued)
Note 2—Cash Equivalents and Marketable Securities (Continued)
The following table summarizes gross realized gains and losses related to the Company's investments (in thousands):
| | Fiscal Years
| |
|---|
| | 2007
| | 2006
| | 2005
| |
|---|
| Gross realized gains | | $ | 22 | | $ | 239 | | $ | 23 | |
| Gross realized losses | | | (4 | ) | | (458 | ) | | (286 | ) |
| | |
| |
| |
| |
| | Net realized gains (losses) | | $ | 18 | | $ | (219 | ) | $ | (263 | ) |
| | |
| |
| |
| |
Note 3—Acquisitions
On November 23, 2007, the Company's MicroEdge subsidiary acquired the entire share capital of United Kingdom-based Vivid Orange Limited ("Vivid Orange"), which provides hosted solutions for the corporate marketplace in the areas of corporate giving and social responsibility.
Purchase price allocation
In accordance with SFAS No. 141, the total purchase price was allocated to Advent's net tangible and intangible assets based on their estimated fair values as of November 23, 2007. The excess purchase price over the value of the net tangible and identifiable assets was recorded as goodwill. The following represents the preliminary allocation of the purchase price to the acquired net assets of Advent and the associated estimated useful lives:
| | Estimated Useful Life (Years)
| | Purchase Price Allocation (in thousands)
| |
|---|
| Identifiable intangible assets: | | | | | | |
| | Existing technology | | 5 | | $ | 2,430 | |
| | Core Technology | | 5 | | | 640 | |
| | Customer relationships | | 7 | | | 120 | |
| | Trademark | | 7 | | | 100 | |
| Goodwill | | | | | 4,891 | |
| In-process research and development | | | | | 150 | |
| Deferred tax asset | | | | | 322 | |
| Tangible assets | | | | | 56 | |
| Current liabilities | | | | | (599 | ) |
| Deferred tax liability | | | | | (921 | ) |
| | | | |
| |
| | Total purchase price, net of cash acquired | | | | $ | 7,189 | |
| | | | |
| |
The purchase price of $7.2 million was paid in November 2007. Additionally, the purchase price may be increased by $1.2 million and $2.1 million in cash if certain sales targets are met by November 2008 and 2009, respectively. Any increase in the purchase consideration would be recorded when the amounts become payable and result in a corresponding increase in goodwill.
88
ADVENT SOFTWARE, INC.
NOTES TO CONSOLIDATED FINANCIAL STATEMENTS (Continued)
Note 3—Acquisitions (Continued)
Tangible assets and current liabilities
Vivid Orange's tangible assets and liabilities as of November 23, 2007 were reviewed and adjusted to their fair value as necessary. Current liabilities include accounts payable of $111,000, accrued liabilities of $367,000 and deferred revenues of $121,000. In connection with the acquisition of Vivid Orange, Advent assumed Vivid Orange's contractual obligations related to its deferred revenue. Vivid Orange's deferred revenue was derived from hosting, subscription, and consulting services. As a result, Advent recorded an adjustment to reduce the carrying value of deferred revenue by $41,000 to $120,000, which represents the Company's estimate of the fair value of the contractual obligations assumed.
Identifiable intangible assets
Existing technology relates to Vivid Orange's SmartChange product modules that have reached technological feasibility. Core technology represent a combination of Vivid Orange's processes and trade secrets developed through years of experience in design and development of their products. Advent is amortizing the fair value of these assets to cost of revenues on a straight-line basis over their estimated lives of 5 years.
Customer relationships represent existing contracts and the underlying customer relationships. Advent is amortizing the fair value of these assets to operating expenses in the consolidated statement of operations on a straight-line basis over an average estimated life of 7 years.
Trademarks related to the SmartChange product names that will continue in use. Advent is amortizing the fair values of these assets to operating expenses in the consolidated statement of operations on a straight-line basis over an estimated life of 7 years.
Goodwill
Approximately $4.9 million of the purchase price has been allocated to goodwill. Goodwill represents the excess of the purchase price over the fair value of the underlying net tangible and intangible assets. The goodwill was attributed to the premium paid for the opportunity to better serve the current MicroEdge market and achieve greater long-term growth opportunities.
In accordance with SFAS No. 142, goodwill will not be amortized but instead will be tested for impairment at least annually or more frequently if certain indicators are present. In the event that management determines that the fair value of goodwill has become impaired, the Company would incur an accounting charge for the amount of impairment during the fiscal quarter in which the determination is made.
In-process research and development ("IPR&D")
During fiscal 2007, Advent wrote-off acquired IPR&D of $150,000 in connection with its acquisition of Vivid Orange. The IPR&D was written off because the acquired technologies had not reached technological feasibility and had no alternative uses. Technological feasibility is defined as being equivalent to completion of a working prototype in which there is no remaining risk relating to the development. At the time of the acquisition, Vivid Orange was developing a new module, SmartWorld, that qualified as IPR&D. At the time of acquisition, it was estimated that these IPR&D efforts would be completed over the following 6 months at an estimated total cost of $64,000.
89
ADVENT SOFTWARE, INC.
NOTES TO CONSOLIDATED FINANCIAL STATEMENTS (Continued)
Note 3—Acquisitions (Continued)
The value assigned to IPR&D was determined by estimating costs to develop the purchased IPR&D into commercially viable products, estimating the resulting net cash flow from the projects when completed, and discounting the net cash flows to their present value. The revenue estimates used in the cash flow forecasts were based on estimates of relevant market sizes and growth factors, expected trends in technology, and the nature and expected timing of new product introductions by Vivid Orange and its competitors.
The rate utilized to discount the net cash flows to their present value was based on Vivid Orange's weighted average cost of capital. The weighted average cost of capital was adjusted to reflect the difficulties and uncertainties in completing each project and thereby achieving technological feasibility, the percentage of completion of each project, anticipated market acceptance and penetration, market growth rates, and risks related to the impact of potential changes in future target markets. Based on these factors, a discount rate of 25% was deemed appropriate for valuing the IPR&D.
The estimates used in valuing IPR&D were based upon assumptions believed to be reasonable but which are inherently uncertain and unpredictable. Assumptions may be incomplete or inaccurate, and unanticipated events and circumstances may occur.
Pro forma results
The following supplemental unaudited pro forma information presents selected financial information as though the purchases of Vivid Orange had been completed at the beginning of each period presented after giving effect to purchase accounting adjustments. The pro forma financial information is presented for informational purposes only and is not indicative of the results of operations that would have been achieved if the acquisition had taken place on January 1, 2006 or of results that may occur in the future. The pro forma consolidated net income and net income per share amounts include certain pro forma adjustments, primarily the amortization of identifiable intangible assets and the elimination of interest income on cash used in the acquisition (in thousands, except per share data):
| | Fiscal Year
2007
| | Fiscal Year
2006
|
|---|
| Net revenues | | $ | 216,114 | | $ | 184,804 |
| Net income | | $ | 11,679 | | $ | 81,653 |
| Net income per share: | | | | | | |
| | Basic | | $ | 0.44 | | $ | 2.82 |
| | Diluted | | $ | 0.42 | | $ | 2.67 |
90
ADVENT SOFTWARE, INC.
NOTES TO CONSOLIDATED FINANCIAL STATEMENTS (Continued)
Note 4—Balance Sheet Detail
Prepaid expenses and other
The following is a summary of prepaid expenses and other assets (in thousands):
| | December 31
|
|---|
| | 2007
| | 2006
|
|---|
| Prepaid commission | | $ | 5,364 | | $ | 3,121 |
| Prepaid royalty | | | 2,624 | | | 2,027 |
| Prepaid contract expense | | | 5,353 | | | 1,847 |
| Other | | | 6,236 | | | 4,833 |
| | �� |
| |
|
| | Total prepaid expenses and other | | $ | 19,577 | | $ | 11,828 |
| | |
| |
|
Property and equipment, net
The following is a summary of property and equipment (in thousands):
| | December 31
| |
|---|
| | 2007
| | 2006
| |
|---|
| Computer equipment and software | | $ | 35,948 | | $ | 29,779 | |
| Leasehold improvements | | | 20,374 | | | 20,664 | |
| Furniture and fixtures | | | 4,921 | | | 2,197 | |
| Telephone system | | | 778 | | | 720 | |
| Construction in process | | | 1,310 | | | 2,529 | |
| | |
| |
| |
| | Property and equipment, gross | | $ | 63,331 | | $ | 55,889 | |
| Accumulated depreciation | | | (35,552 | ) | | (28,551 | ) |
| | |
| |
| |
| | Property and equipment, net | | $ | 27,779 | | $ | 27,338 | |
| | |
| |
| |
Depreciation expense was $7.7 million, $7.7 million and $8.7 million for fiscal 2007, 2006 and 2005, respectively. In January 2006, Advent entered into a definitive lease agreement with Toda Development, Inc. ("Toda") whereby the Company leases approximately 105,000 square feet of office space at 600 Townsend Street in San Francisco, California. In October 2006, Advent moved its headquarters into the 600 Townsend facility. During 2007, the Company executed several amendments to the lease agreement for the 600 Townsend facility whereby the Company leased additional facility space of 50,000 square feet.
91
ADVENT SOFTWARE, INC.
NOTES TO CONSOLIDATED FINANCIAL STATEMENTS (Continued)
Note 4—Balance Sheet Detail (Continued)
Goodwill
The changes in the carrying value of goodwill by segment for fiscal 2007 and 2006 were as follows (in thousands):
| | Advent
Investment
Management
| | MicroEdge
| | Total
| |
|---|
| Balance at December 31, 2005 | | $ | 91,199 | | $ | 3,136 | | $ | 94,335 | |
| Additions | | | 1,212 | | | — | | | 1,212 | |
| Translation adjustments | | | 3,896 | | | — | | | 3,896 | |
| Recognition of deferred tax asset | | | (1,061 | ) | | — | | | (1,061 | ) |
| | |
| |
| |
| |
| Balance at December 31, 2006 | | $ | 95,246 | | $ | 3,136 | | $ | 98,382 | |
Additions |
|
|
22 |
|
|
4,891 |
|
|
4,913 |
|
| Translation adjustments | | | 3,412 | | | (187 | ) | | 3,225 | |
| | |
| |
| |
| |
| Balance at December 31, 2007 | | $ | 98,680 | | $ | 7,840 | | $ | 106,520 | |
| | |
| |
| |
| |
Additions to goodwill by the MicroEdge segment of $4.9 million in 2007 related to the acquisition of Vivid Orange in November 2007. Additions to goodwill by the Advent Investment Management segment of $22,000 in 2007 reflected an additional payment related to the acquisition of East Circle. Foreign currency translation adjustments totaling $3.2 million reflect the general weakening of the US dollar versus European currencies during fiscal 2007.
Additions to goodwill of $1.2 million in 2006 related to the acquisition of East Circle in December 2006. Translation adjustments of $3.9 million represent the weakening of the US dollar against European currencies during fiscal 2006. During the fourth quarter of 2006, the Company recognized $1.1 million of previously unrecognized state deferred tax assets purchased with the Kinexus acquisition in 2003. Upon recognition of this deferred tax asset, the original goodwill from the purchase was reduced.
Other intangibles, net
The following is a summary of intangible assets (in thousands, except weighted average amortization period):
| | Average
Amortization
Period
(Years)
| | Other
Intangibles,
Gross
| | Accumulated
Amortization
| | Other
Intangibles,
Net
|
|---|
| Purchased technologies | | 4.9 | | $ | 16,529 | | $ | (13,001 | ) | $ | 3,528 |
| Product development costs | | 3.0 | | | 6,290 | | | (2,081 | ) | | 4,209 |
| | | | |
| |
| |
|
| | Developed technology sub-total | | | | | 22,819 | | | (15,082 | ) | | 7,737 |
| Customer relationships | | 5.5 | | | 22,673 | | | (21,130 | ) | | 1,543 |
| Other intangibles | | 3.6 | | | 404 | | | (308 | ) | | 96 |
| | | | |
| |
| |
|
| | Other intangibles sub-total | | | | | 23,077 | | | (21,438 | ) | | 1,639 |
| | | | |
| |
| |
|
| | Balance at December 31, 2007 | | | | $ | 45,896 | | $ | (36,520 | ) | $ | 9,376 |
| | | | |
| |
| |
|
92
ADVENT SOFTWARE, INC.
NOTES TO CONSOLIDATED FINANCIAL STATEMENTS (Continued)
Note 4—Balance Sheet Detail (Continued)
| | Averagef
Amortization
Period
(Years)
| | Other
Intangibles,
Gross
| | Accumulated
Amortization
| | Other
Intangibles,
Net
|
|---|
| Purchased technologies | | 4.9 | | $ | 13,556 | | $ | (12,665 | ) | $ | 891 |
| Product development costs | | 3.0 | | | 3,001 | | | (847 | ) | | 2,154 |
| | | | |
| |
| |
|
| | Developed technology sub-total | | | | | 16,557 | | | (13,512 | ) | | 3,045 |
Customer relationships |
|
5.6 |
|
|
22,175 |
|
|
(18,952 |
) |
|
3,223 |
| Other intangibles | | 2.5 | | | 307 | | | (281 | ) | | 26 |
| | | | |
| |
| |
|
| | Other intangibles sub-total | | | | | 22,482 | | | (19,233 | ) | | 3,249 |
| | | | |
| |
| |
|
| | Balance at December 31, 2006 | | | | $ | 39,039 | | $ | (32,745 | ) | $ | 6,294 |
| | | | |
| |
| |
|
The changes in the carrying value of intangible assets for fiscal 2007 and 2006 were as follows (in thousands):
| | Gross
| | Accumulated
Amortization
| | Net
| |
|---|
| Balance at December 31, 2005 | | $ | 35,075 | | $ | (26,317 | ) | $ | 8,758 | |
| Additions | | | 2,212 | | | — | | | 2,212 | |
| Stock-based compensation additions | | | 138 | | | (25 | ) | | 113 | |
| Amortization | | | — | | | (5,041 | ) | | (5,041 | ) |
| Translation adjustments | | | 1,614 | | | (1,362 | ) | | 252 | |
| | |
| |
| |
| |
| Balance at December 31, 2006 | | $ | 39,039 | | $ | (32,745 | ) | $ | 6,294 | |
Additions |
|
|
6,323 |
|
|
— |
|
|
6,323 |
|
| Stock-based compensation additions | | | 256 | | | (64 | ) | | 192 | |
| Amortization | | | — | | | (3,382 | ) | | (3,382 | ) |
| Translation adjustments | | | 277 | | | (328 | ) | | (51 | ) |
| | |
| |
| |
| |
| Balance at December 31, 2007 | | $ | 45,895 | | $ | (36,519 | ) | $ | 9,376 | |
| | |
| |
| |
| |
Additions to intangible assets of $6.3 million in 2007 include capitalized product development costs of approximately $3.0 million and intangible asset additions of $3.3 million from the acquisition of Vivid Orange. Net stock-based compensation additions of $0.2 million in 2007 reflected capitalized costs related to software development projects under FAS 86, partially offset by amortization.
Additions to intangible assets of $2.2 million in 2006 include capitalized product development costs of approximately $1.5 million and intangible asset additions of $860,000 from the acquisition of East Circle.
Net translation adjustments of $(0.1) million and $0.3 million in fiscal 2007 and 2006, respectively, represent translation adjustments as the US dollar weakened (strengthened) relative to certain European currencies during 2007 and 2006, respectively.
93
ADVENT SOFTWARE, INC.
NOTES TO CONSOLIDATED FINANCIAL STATEMENTS (Continued)
Note 4—Balance Sheet Detail (Continued)
The following is a summary of amortization and impairment of the Company's developed technology and other intangible assets for the periods presented (in thousands):
| | Fiscal Years
|
|---|
| | 2007
| | 2006
| | 2005
|
|---|
| Developed technology: | | | | | | | | | |
| Amortization—purchased technologies | | $ | 334 | | $ | 497 | | $ | 2,439 |
| Amortization—product development costs | | | 1,233 | | | 703 | | | 136 |
| | |
| |
| |
|
| | Amortization of developed technology | | $ | 1,567 | | $ | 1,200 | | $ | 2,575 |
| Other intangibles: | | | | | | | | | |
| Amortization—customer relationships | | | 1,852 | | | 3,789 | | | 3,964 |
| Amortization—other intangibles | | | 27 | | | 77 | | | 77 |
| | |
| |
| |
|
| | Amortization other intangibles | | $ | 1,879 | | $ | 3,866 | | $ | 4,041 |
| | |
| |
| |
|
| | | Total amortization | | $ | 3,446 | | $ | 5,066 | | $ | 6,616 |
| | |
| |
| |
|
Based on the carrying amount of intangible assets as of December 31, 2007, the estimated future amortization is as follows (in thousands):
| | Fiscal Years
| |
| |
|
|---|
| | 2008
| | 2009
| | 2010
| | 2011
| | 2012
| | Thereafter
| | Total
|
|---|
| Estimated future amortization of: | | | | | | | | | | | | | | | | | | | | | |
| Developed technology | | $ | 2,770 | | $ | 2,192 | | $ | 1,659 | | $ | 602 | | $ | 515 | | $ | — | | $ | 7,738 |
| Other intangibles | | | 1,004 | | | 479 | | | 37 | | | 31 | | | 31 | | | 56 | | | 1,638 |
| | |
| |
| |
| |
| |
| |
| |
|
| | Total | | $ | 3,774 | | $ | 2,671 | | $ | 1,696 | | $ | 633 | | $ | 546 | | $ | 56 | | $ | 9,376 |
| | |
| |
| |
| |
| |
| |
| |
|
Other assets, net
The following is a summary of other assets (in thousands):
| | December 31
|
|---|
| | 2007
| | 2006
|
|---|
| Long-term investments, net | | $ | 500 | | $ | 8,459 |
| Long-term prepaid commissions | | | 5,368 | | | 3,013 |
| Deposits | | | 2,628 | | | 2,443 |
| Prepaid contract expense, long-term | | | 1,838 | | | 857 |
| Other | | | 311 | | | 1,085 |
| | |
| |
|
| | Total other assets, net | | $ | 10,645 | | $ | 15,857 |
| | |
| |
|
Long-term investments include equity investments in several privately held companies. These equity investments are carried at the lower of cost or fair value at December 31, 2007 and 2006.
On April 30, 2007, the Company, together with other LatentZero Limited ("LatentZero") shareholders, sold their ownership in LatentZero to royalblue group plc. The maximum possible consideration due to the Company from the sale of its ownership interest in LatentZero is
94
ADVENT SOFTWARE, INC.
NOTES TO CONSOLIDATED FINANCIAL STATEMENTS (Continued)
Note 4—Balance Sheet Detail (Continued)
approximately $17 million, which is comprised of initial consideration of $10 million, paid at completion of the sale transaction and up to an aggregate $7 million of deferred contingent consideration for fiscal years 2007 and 2008. For fiscal 2007 and 2008, the payment of the deferred contingent consideration is dependent on LatentZero achieving certain performance objectives related to revenue and operating profit. Consideration is denominated in Pounds Sterling (GBP) and the actual amounts of consideration in US dollars to be received by the Company may differ depending on foreign exchange rates at the time of payment. At the time of sale, the carrying value of Advent's investment in LatentZero was $6.6 million resulting in a gain on sale of $3.4 million during 2007.
Another privately held company, Investment Scorecard Inc. ("Scorecard"), was sold during the second quarter of 2007. Advent received proceeds of $1.6 million from the sale of its interest in Scorecard, resulting in a gain of $0.9 million. Additionally, Advent determined that the carrying value of its investment in another privately held company was fully impaired, resulting in an impairment loss of $585,000 during the second quarter of 2007. The Company's review of this investee's operations during the second quarter of 2007 indicated a decline in value that is other-than-temporary.
Accrued liabilities
The following is a summary of accrued liabilities (in thousands):
| | December 31
|
|---|
| | 2007
| | 2006
|
|---|
| Salaries and benefits payable | | $ | 18,696 | | $ | 13,624 |
| Accrued restructuring, current portion | | | 2,531 | | | 2,650 |
| Other | | | 8,101 | | | 6,718 |
| | |
| |
|
| | Total accrued liabilities | | $ | 29,328 | | $ | 22,992 |
| | |
| |
|
Other long-term liabilities
The following is a summary of other long-term liabilities (in thousands):
| | December 31
|
|---|
| | 2007
| | 2006
|
|---|
| Deferred rent | | $ | 8,902 | | $ | 6,451 |
| Accrued restructuring, long-term portion | | | 1,734 | | | 3,941 |
| Reserve for uncertain tax positions | | | 4,746 | | | — |
| Other | | | 970 | | | 1,026 |
| | |
| |
|
| | Total other long-term liabilities | | $ | 16,352 | | $ | 11,418 |
| | |
| |
|
95
ADVENT SOFTWARE, INC.
NOTES TO CONSOLIDATED FINANCIAL STATEMENTS (Continued)
Note 5—Accumulated Other Comprehensive Income
The components of accumulated other comprehensive income were as follows (in thousands):
| | December 31
| |
|---|
| | 2007
| | 2006
| |
|---|
| Accumulated net unrealized loss on marketable securities | | $ | — | | $ | (8 | ) |
| Accumulated foreign currency translation adjustments | | | 14,302 | | | 10,757 | |
| | |
| |
| |
| | Accumulated other comprehensive income | | $ | 14,302 | | $ | 10,749 | |
| | |
| |
| |
Note 6—Restructuring Charges
Restructuring initiatives have been implemented in the Company's Advent Investment Management and Other operating segments to reduce costs and improve operating efficiencies by better aligning the Company's resources to its near-term revenue opportunities. These initiatives have resulted in restructuring charges comprised primarily of costs related to properties abandoned in connection with facilities consolidation, related write-down of leasehold improvements and severance and associated employee termination costs related to headcount reductions. Advent's restructuring charges included accruals for estimated losses on facility costs based on the Company's contractual obligations net of estimated sublease income. Advent reassesses this liability periodically based on market conditions.
During 2007, Advent recorded aggregate restructuring charges of $965,000 which primarily related to the modification of certain sub-lease assumptions for its prior San Francisco headquarters facility located at 301 Brannan Street, which the Company exited in October 2006.
For fiscal 2006, Advent recorded total restructuring charges of $3.7 million which primarily related to facility and exit costs associated with the relocation of its corporate headquarters facility in San Francisco during the fourth quarter of 2006. Restructuring charges in 2006 also included costs associated with exiting a portion of the Company's facility in New Rochelle, New York, and an entire facility in Summit, New Jersey, and adjustments to original estimates for facilities in San Francisco, California and New York, New York.
For fiscal 2005, Advent recorded total restructuring charges of $2.0 million consisting of facility and exit costs of $1.5 million related to the sub-leasing of one floor of the Company's office in New York, New York and additional charges of $567,000 during 2005 primarily to adjust original estimates of facility maintenance expenses and real estate taxes of vacated facilities.
96
ADVENT SOFTWARE, INC.
NOTES TO CONSOLIDATED FINANCIAL STATEMENTS (Continued)
Note 6—Restructuring Charges (Continued)
The following table sets forth an analysis of the components of the restructuring charges and the payments and non-cash charges made against the accrual during fiscal 2005, 2006 and 2007 (in thousands):
| | Facility Exit Costs
| | Severance and Benefits
| | Total
| |
|---|
| Balance of restructuring accrual at December 31, 2004 | | $ | 4,157 | | $ | 12 | | $ | 4,169 | |
| | Restructuring charges | | | 1,472 | | | — | | | 1,472 | |
| | Reversal of deferred rent related to facilities exited | | | 703 | | | — | | | 703 | |
| | Cash payments | | | (2,351 | ) | | — | | | (2,351 | ) |
| | Adjustment of prior restructuring costs | | | 572 | | | (5 | ) | | 567 | |
| | |
| |
| |
| |
| Balance of restructuring accrual at December 31, 2005 | | $ | 4,553 | | $ | 7 | | $ | 4,560 | |
| | Restructuring charges | | | 3,549 | | | — | | | 3,549 | |
| | Reversal of deferred rent related to facilities exited | | | 666 | | | — | | | 666 | |
| | Cash payments | | | (2,370 | ) | | — | | | (2,370 | ) |
| | Adjustment of prior restructuring costs | | | 189 | | | (3 | ) | | 186 | |
| | |
| |
| |
| |
| Balance of restructuring accrual at December 31, 2006 | | $ | 6,587 | | $ | 4 | | $ | 6,591 | |
| | Restructuring charges | | | 687 | | | — | | | 687 | |
| | Cash payments | | | (3,287 | ) | | (4 | ) | | (3,291 | ) |
| | Adjustment of prior restructuring costs | | | 278 | | | — | | | 278 | |
| | |
| |
| |
| |
| Balance of restructuring accrual at December 31, 2007 | | $ | 4,265 | | $ | — | | $ | 4,265 | |
| | |
| |
| |
| |
The accrued excess facility costs of $4.3 million are stated at estimated fair value, net of estimated sub-lease income of $5.8 million. Advent expects to pay the remaining obligations in connection with vacated facilities over the remaining lease terms, which will expire on various dates through 2012.
Note 7—Debt
On February 14, 2007, Advent and certain of its subsidiaries entered into a senior secured credit facility agreement (the "Facility") with Wells Fargo Foothill, Inc. (the "Lender") for a term of three years. Under the Facility, the Lender will provide the Company with a revolving line of credit up to an aggregate amount of $75.0 million to fund the repurchase of outstanding common stock, capital expenditures and general corporate requirements. The Company has the option of selecting an interest rate for any drawdown under the Facility equal to either: (a) the Base Rate (Wells Fargo prime rate); or (b) the then applicable LIBOR Rate plus 1.50% per annum. The loan is secured by the Company's property and assets and is subject to a financial covenant. The financial covenant in the Facility is limited to a maximum ratio of senior debt to earnings before interest, taxes, depreciation, and amortization (EBITDA), adjusted for cost capitalizations, extraordinary gains (losses) and non-cash stock-based employee compensation. Covenant testing will commence upon either the occurrence of an event of default or when excess availability, defined as the Facility line of $75.0 million less amounts drawn, plus qualified cash and cash equivalents is less than $50.0 million.
In June 2007, the Company drew down $25.0 million against this Facility which bears interest at an aggregate rate of 6.86%, consisting of a three month LIBOR contract rate of 5.36% and an applicable margin of 1.5%. In September 2007, the LIBOR contract expired and the Company paid down the
97
ADVENT SOFTWARE, INC.
NOTES TO CONSOLIDATED FINANCIAL STATEMENTS (Continued)
Note 7—Debt (Continued)
credit facility by $5.0 million. Advent re-entered into another LIBOR rate contract on the remaining $20.0 million which bears a three month LIBOR contract rate of 5.58% and an applicable margin of 1.5% for an aggregate rate of 7.08%. In December 2007, the LIBOR contract expired and the Company paid down the credit facility by $20.0 million resulting in a zero balance as of December 31, 2007. As of December 31, 2007, Advent was in compliance with all associated covenants.
Note 8—Income Taxes
The components of income (loss) before income taxes were as follows (in thousands):
| | Fiscal Years
| |
|---|
| | 2007
| | 2006
| | 2005
| |
|---|
| U.S. | | $ | 16,887 | | $ | 5,906 | | $ | 17,375 | |
| Foreign | | | (93 | ) | | (2,335 | ) | | (2,835 | ) |
| | |
| |
| |
| |
| | Total | | $ | 16,794 | | $ | 3,571 | | $ | 14,540 | |
| | |
| |
| |
| |
The components of the provision for (benefit from) income taxes included (in thousands):
| | Fiscal Years
| |
|---|
| | 2007
| | 2006
| | 2005
| |
|---|
| Current: | | | | | | | | | | |
| | Federal | | $ | 845 | | $ | 2,314 | | $ | 203 | |
| | State | | | 731 | | | 1,569 | | | 808 | |
| | Foreign | | | 556 | | | 380 | | | 347 | |
| Deferred: | | | | | | | | | | |
| | Federal | | | 2,624 | | | (68,187 | ) | | — | |
| | State | | | (266 | ) | | (14,296 | ) | | — | |
| | Foreign | | | (327 | ) | | (811 | ) | | (953 | ) |
| | |
| |
| |
| |
| | | Total | | $ | 4,163 | | $ | (79,031 | ) | $ | 405 | |
| | |
| |
| |
| |
98
ADVENT SOFTWARE, INC.
NOTES TO CONSOLIDATED FINANCIAL STATEMENTS (Continued)
Note 8—Income Taxes (Continued)
The effective income tax rate on earnings differed from the United States statutory tax rate as follows:
| | Fiscal Years
| |
|---|
| | 2007
| | 2006
| | 2005
| |
|---|
| Statutory federal rate | | 35.0 | % | 35.0 | % | 35.0 | % |
| State taxes | | 8.5 | | 4.6 | | 5.5 | |
| Stock compensation relating to incentive stock options and employee stock purchase plans | | 4.4 | | 75.1 | | — | |
| Research and development tax credits | | (17.7 | ) | (61.4 | ) | (6.8 | ) |
| Change in valuation allowance | | (8.9 | ) | (2,248.1 | ) | (35.7 | ) |
| California audit adjustment | | — | | (14.6 | ) | — | |
| Reserve adjustment due to statute closing | | — | | (17.8 | ) | — | |
| Foreign taxes | | 1.5 | | 10.8 | | 2.7 | |
| Other, net | | 2.0 | | 3.3 | | 2.1 | |
| | |
| |
| |
| |
| | Total | | 24.8 | % | (2,213.1 | )% | 2.8 | % |
| | |
| |
| |
| |
As of December 31, 2007, Advent made no provision for a cumulative total of $3.6 million of undistributed earnings for certain non-US subsidiaries, which are deemed to be permanently reinvested.
The tax effects of temporary differences that gave rise to significant portions of the deferred tax assets and liabilities were as follows (in thousands):
| | December 31
| |
|---|
| | 2007
| | 2006
| |
|---|
| Current deferred tax assets: | | | | | | | |
| | Deferred revenue | | $ | 2,034 | | $ | 440 | |
| | Other accrued liabilities and reserves | | | 4,374 | | | 5,117 | |
| | Other | | | 3,880 | | | 2,393 | |
| | |
| |
| |
| | | Total current | | | 10,288 | | | 7,950 | |
| | |
| |
| |
| Non-current deferred tax assets: | | | | | | | |
| | Depreciation and amortization | | | 13,699 | | | 15,403 | |
| | Net operating losses, capital losses and credit carryforwards | | | 58,897 | | | 68,796 | |
| | Other | | | 4,422 | | | 2,971 | |
| | Valuation allowance | | | (6,037 | ) | | (11,576 | ) |
| | |
| |
| |
| | | Total non-current | | | 70,981 | | | 75,594 | |
| | |
| |
| |
| Deferred tax assets | | | 81,269 | | | 83,544 | |
| Deferred tax liabilities | | | (998 | ) | | (225 | ) |
| | |
| |
| |
| | | | Net deferred tax assets | | $ | 80,271 | | $ | 83,319 | |
| | |
| |
| |
The Company maintains a valuation allowance against its deferred tax assets relating to capital losses and investment reserves of $5.3 million and certain state net operating losses of $734,000 as it believes that based upon the available evidence, it is not more than likely not that these assets will be
99
ADVENT SOFTWARE, INC.
NOTES TO CONSOLIDATED FINANCIAL STATEMENTS (Continued)
Note 8—Income Taxes (Continued)
realized. The capital loss carryforwards expire between 2009 and 2011. If it is determined in the future that it is more likely than not that these deferred tax assets will be realized, the valuation allowance will be further reduced.
During the fourth quarter of 2006, management determined that $83.6 million of deferred tax assets that had previously been offset by a valuation allowance would more likely than not be realized in future periods. This assessment was based on the Company's consistently positive financial results over the previous eight quarters and a positive income outlook that is supported by recurring revenue streams. Therefore, the valuation allowance was decreased by $83.6 million in the fourth quarter of 2006.
At December 31, 2007, Advent had federal net operating loss carryforwards of approximately $126 million, which includes stock-based compensation deductions of $56 million. Utilization of these loss carryforwards, including losses obtained from acquisitions, is subject to certain limitations under the federal income tax laws. These net operating loss carryforwards expire between 2010 and 2025. Also at December 31, 2007, Advent had state net operating loss carryforwards in various states in which it files tax returns.
Advent also had federal research credits of $14.9 million which expire between 2019 and 2027 and California research credits of $11.8 million which do not expire.
On January 1, 2007, Advent adopted the provisions of Financial Accounting Standards Board Interpretation No. 48, "Accounting for Uncertainty in Income Taxes" ("FIN 48"). As of January 1, 2007, Advent had accrued $4.9 million of unrecognized tax benefits. In addition, Advent reclassified certain tax liabilities for unrecognized tax benefits from current liabilities to long-term liabilities. The adoption of FIN 48 resulted in no significant cumulative impact to accumulated deficit.
The following table summarizes the activity relating to the Company's unrecognized tax benefits during 2007 (in thousands):
| | Total
| |
|---|
| Balance at January 1, 2007 | | $ | 4,930 | |
| | Gross increases related to tax positions in prior period | | | 66 | |
| | Gross increases related to current period tax positions | | | 926 | |
| | Settlements with taxing authorities | | | (23 | ) |
| | |
| |
| Balance at December 31, 2007 | | $ | 5,899 | |
| | |
| |
If recognized, the portion of unrecognized tax benefits at December 31, 2007 that would decrease Advent's tax provision and increase net income is $4.9 million. The impact on net income reflects the liabilities for unrecognized tax benefits net of the federal tax benefit of state income tax items. Advent recognizes interest and penalties accrued on unrecognized tax benefits as well as interest received from favorable settlements within "Provision for (benefit from) income taxes" on the consolidated statement of operations.
Advent is subject to taxation in the US and various states and foreign jurisdictions. Advent is not under examination in any income tax jurisdiction at the present time and does not anticipate the total amount of its unrecognized tax benefits to significantly change over the next 12 months. The material
100
ADVENT SOFTWARE, INC.
NOTES TO CONSOLIDATED FINANCIAL STATEMENTS (Continued)
Note 8—Income Taxes (Continued)
jurisdictions that are subject to examination by tax authorities include California for tax years after 2002 and the US and New York for tax years after 2003.
Note 9—Commitments and Contingencies
Advent leases office space and equipment under non-cancelable operating lease agreements, which expire at various dates through December 2018. Some operating leases contain escalation provisions for adjustments in the consumer price index. Advent is responsible for maintenance, insurance, and property taxes. In January 2006, Advent entered into a lease agreement for the Company's facilities located at 600 Townsend in San Francisco, California, and in October 2006, Advent extended its lease agreement for its facilities located at 619 West 54th Street in New York, New York. During 2007, the Company executed several amendments to the lease agreement for its 600 Townsend facility whereby the Company will lease additional facility space of 50,000 square feet.
Future minimum payments and receipts under the non-cancelable operating leases consisted of the following at December 31, 2007 (in thousands):
| | Future
|
|---|
| | Lease Payments
| | Sub-lease Income
| | Net Lease Payments
|
|---|
| 2008 | | $ | 10,434 | | $ | 2,455 | | $ | 7,979 |
| 2009 | | | 8,090 | | | 1,945 | | | 6,145 |
| 2010 | | | 7,095 | | | 1,354 | | | 5,741 |
| 2011 | | | 6,188 | | | 801 | | | 5,387 |
| 2012 | | | 5,258 | | | 310 | | | 4,948 |
| Thereafter | | | 22,506 | | | — | | | 22,506 |
| | |
| |
| |
|
| | Total | | $ | 59,571 | | $ | 6,865 | | $ | 52,706 |
| | |
| |
| |
|
Rent expense for fiscal 2007, 2006 and 2005 was $5.6 million, $7.4 million, and $6.7 million, respectively, net of sub-lease income from non-restructured facilities of $123,000, $108,000, and $97,000 in fiscal 2007, 2006 and 2005, respectively.
As permitted or required under Delaware law and to the maximum extent allowable under that law, Advent has certain obligations to indemnify its current and former officers and directors for certain events or occurrences while the officer or director is, or was serving, at Advent's request in such capacity. These indemnification obligations are valid as long as the director or officer acted in good faith and in a manner the person reasonably believed to be in or not opposed to the best interests of the corporation, and, with respect to any criminal action or proceeding, had no reasonable cause to believe his or her conduct was unlawful. The maximum potential amount of future payments Advent could be required to make under these indemnification obligations is unlimited; however, Advent has a director and officer insurance policy that mitigates Advent's exposure and enables Advent to recover a portion of any future amounts paid. The Company believes the estimated fair value of these indemnification obligations is minimal.
101
ADVENT SOFTWARE, INC.
NOTES TO CONSOLIDATED FINANCIAL STATEMENTS (Continued)
Note 9—Commitments and Contingencies (Continued)
From time to time, Advent is involved in claims and legal proceedings that arise in the ordinary course of business. Based on currently available information, management does not believe that the ultimate outcome of these unresolved matters, individually and in the aggregate, is likely to have a material adverse effect on Advent's financial position or results of operations. However, litigation is subject to inherent uncertainties and Advent's view of these matters may change in the future. Were an unfavorable outcome to occur, there exists the possibility of a material adverse impact on Advent's financial position and results of operations for the period in which the unfavorable outcome occurs, and potentially in future periods.
On March 8, 2005, certain of the former shareholders of Kinexus and the shareholders' representative filed suit against Advent in the Delaware Chancery Court. The complaint alleges that Advent breached the Agreement and Plan of Merger dated as of December 31, 2001 pursuant to which Advent acquired all of the outstanding shares of Kinexus due principally to the fact that no amount was paid by Advent on an earn-out of up to $115 million. The earn-out, which was payable in cash or stock at the election of Advent, was based upon Kinexus meeting certain revenue targets in both 2002 and 2003. The complaint seeks unspecified compensatory damages, an accounting and restitution for unjust enrichment. Advent advised the shareholders' representative in January 2003 that the earn-out terms had not been met in 2002 and accordingly no earn-out was payable for 2002 and would not be payable for 2003. Discovery is continuing between the parties. Advent disputes the plaintiffs' claims and believes that it has meritorious defenses and intends to vigorously defend this action. Management believes that any potential loss associated with this litigation is neither probable nor reasonably estimable at this time and accordingly has not accrued any amounts for any potential loss.
Note 10—Stock-Based Compensation
Stock-Based Compensation Expense in Fiscal 2007 and 2006
Since the adoption of SFAS 123R, there have been no changes to the Company's equity plans or modifications to outstanding stock-based awards.
As the stock-based compensation expense recognized on the consolidated statements of operations for fiscal 2007 and 2006 is based on awards ultimately expected to vest, such amount has been reduced for estimated forfeitures. SFAS 123R requires forfeitures to be estimated at the time of grant and revised, if necessary, in subsequent periods if actual forfeitures differ from those estimates. Forfeitures were estimated based on the Company's historical experience over the last ten years. Previously, under SFAS 123, the Company recorded forfeitures as they occurred.
Prior to adoption of SFAS 123R, benefits of tax deductions in excess of recognized compensation costs were reported as operating cash flows. SFAS 123R requires that cash flows resulting from excess tax benefits to be reported as a financing cash inflow rather than as a reduction of taxes paid within cash flow from operations.
102
ADVENT SOFTWARE, INC.
NOTES TO CONSOLIDATED FINANCIAL STATEMENTS (Continued)
Note 10—Stock-Based Compensation (Continued)
Stock-based compensation expense related to stock options, SARs, ESPP and RSUs was recognized on Advent's consolidated statement of operations for fiscal 2007 and 2006 as follows (in thousands, except per share data):
| | Fiscal Years
| |
|---|
| | 2007
| | 2006
| |
|---|
| | Options, SARs ESPP(1)
| | RSUs(2)
| | Total
| | Options, SARs ESPP(1)
| | RSUs(2)
| | Total
| |
|---|
| Statement of operations classification | | | | | | | | | | | | | | | | | | | |
| Cost of term license, maintenance and other recurring revenues | | $ | 810 | | $ | 346 | | $ | 1,156 | | $ | 919 | | $ | 63 | | $ | 982 | |
| Cost of professional services and other revenues | | | 499 | | | 270 | | | 769 | | | 746 | | | 42 | | | 788 | |
| | |
| |
| |
| |
| |
| |
| |
| | Total cost of revenues | | | 1,309 | | | 616 | | | 1,925 | | | 1,665 | | | 105 | | | 1,770 | |
Sales and marketing |
|
|
3,250 |
|
|
905 |
|
|
4,155 |
|
|
4,605 |
|
|
187 |
|
|
4,792 |
|
| Product development | | | 2,122 | | | 1,074 | | | 3,196 | | | 2,906 | | | 152 | | | 3,058 | |
| General and administrative | | | 3,411 | | | 709 | | | 4,120 | | | 3,824 | | | 152 | | | 3,976 | |
| | |
| |
| |
| |
| |
| |
| |
| | Total operating expenses | | | 8,783 | | | 2,688 | | | 11,471 | | | 11,335 | | | 491 | | | 11,826 | |
| | |
| |
| |
| |
| |
| |
| |
Total stock-based employee compensation expense |
|
$ |
10,092 |
|
$ |
3,304 |
|
$ |
13,396 |
|
$ |
13,000 |
|
$ |
596 |
|
$ |
13,596 |
|
| | |
| |
| |
| |
| |
| |
| |
| |
Tax effect on stock-based employee compensation |
|
|
(3,650 |
) |
|
(1,437 |
) |
|
(5,087 |
) |
|
(2,298 |
) |
|
(236 |
) |
|
(2,534 |
) |
| | |
| |
| |
| |
| |
| |
| |
Net effect on net income |
|
$ |
6,442 |
|
$ |
1,867 |
|
$ |
8,309 |
|
$ |
10,702 |
|
$ |
360 |
|
$ |
11,062 |
|
| | |
| |
| |
| |
| |
| |
| |
Effect on net income per share: |
|
|
|
|
|
|
|
|
|
|
|
|
|
|
|
|
|
|
|
| | Basic | | $ | 0.24 | | $ | 0.07 | | $ | 0.31 | | $ | 0.37 | | $ | 0.01 | | $ | 0.38 | |
| | |
| |
| |
| |
| |
| |
| |
| | Diluted | | $ | 0.23 | | $ | 0.07 | | $ | 0.30 | | $ | 0.35 | | $ | 0.01 | | $ | 0.36 | |
| | |
| |
| |
| |
| |
| |
| |
- (1)
- Represents the stock-based compensation expense impact of adopting SFAS 123R on January 1, 2006.
- (2)
- Represents the stock-based compensation expense impact from RSUs. During 2006, the Company changed its employee equity compensation instruments from stock options to primarily a mix of SARs and RSUs to minimize the dilutive effect from the Company's equity plans on the Company's common shares outstanding. As a result, the Company recorded stock-based compensation expense from RSUs during 2006 and 2007 which would have been recognized under APB 25, regardless of the Company's adoption of SFAS 123R on January 1, 2006.
103
ADVENT SOFTWARE, INC.
NOTES TO CONSOLIDATED FINANCIAL STATEMENTS (Continued)
Note 10—Stock-Based Compensation (Continued)
Advent capitalized stock-based compensation expense of $369,000 and $173,000 during fiscal 2007 and 2006, respectively, associated with the Company's software development, internal-use software and professional services implementation projects.
As of December 31, 2007, total unrecognized compensation cost related to unvested awards not yet recognized under all equity compensation plans, adjusted for estimated forfeitures, was $26.4 million and is expected to be recognized through the remaining vesting period of each grant. As of December 31, 2007, the weighted average remaining period was 2.9 years.
Stock-Based Compensation Expense in Fiscal Periods Prior to the Adoption of SFAS 123R
Prior to the adoption of SFAS 123R, Advent used the intrinsic value-based method, as prescribed in APB 25, to account for all stock-based compensation plans, and the Company had adopted the disclosure-only alternative of SFAS 123, "Accounting for Stock-Based Compensation," as amended by SFAS No. 148, "Accounting for Stock-Based Compensation—Transition and Disclosure.
The pro forma information for the year ended December 31, 2005 would have been as follows (in thousands, except per share data):
| | 2005
| |
|---|
| Net income—as reported | | $ | 14,135 | |
| Total stock-based employee compensation expense determined under fair value based method for all options, net of tax(1) | | | (15,913 | ) |
| | |
| |
| Net loss—pro forma | | $ | (1,778 | ) |
| | |
| |
| Net income (loss) per share: | | | | |
| Basic—as reported | | $ | 0.46 | |
| | |
| |
| Diluted—as reported | | $ | 0.44 | |
| | |
| |
| Basic and diluted—pro forma | | $ | (0.06 | ) |
| | |
| |
- (1)
- Amounts are shown net of tax expense for fiscal 2005.
Valuation Assumptions
Advent uses the Black-Scholes option pricing model to determine the fair value of equity compensation awards (stock options, restricted stock units ("RSUs") and stock appreciation rights ("SARs")) and employee stock purchase plan shares, consistent with the provisions of SFAS 123R and SEC Staff Accounting Bulletin No. 107 ("SAB 107").
104
ADVENT SOFTWARE, INC.
NOTES TO CONSOLIDATED FINANCIAL STATEMENTS (Continued)
Note 10—Stock-Based Compensation (Continued)
The fair value of each equity award grant is estimated on the date of grant using the Black-Scholes option valuation model and the straight-line attribution approach with the following assumptions:
| | Fiscal Years
|
|---|
| | 2007
| | 2006
| | 2005
|
|---|
| Stock Options/Stock Appreciation Rights | | | | | | |
| Risk-free interest rate | | 3.7% - 5.2% | | 4.3% - 5.1% | | 3.96% |
| Volatility | | 32.9% - 39.7% | | 42.7% - 48.5% | | 60.5% |
| Expected life | | 5 years | | 5 years | | 5 years |
| Expected dividends | | None | | None | | None |
Employee Stock Purchase Plan* |
|
|
|
|
|
|
| Risk-free interest rate | | 3.4% - 5.0% | | 3.7% - 4.2% | | 3.2% |
| Volatility | | 35.5% - 43.8% | | 34.4% - 36.5% | | 30.6% |
| Expected life | | 6 months | | 6 months | | 6 months |
| Expected dividends | | None | | None | | None |
- *
- The ESPP periods begin every six months in the second and fourth quarter of each year.
Prior to the adoption of SFAS 123R, the Company used historical volatility in deriving its expected volatility assumption. The expected stock price volatility for fiscal 2007 and 2006 was determined based on an equally weighted average of historical and implied volatility of the Company's common stock. Advent determined that a blend of implied volatility and historical volatility is more reflective of the market conditions and a better indicator of expected volatility than using purely historical volatility. The expected life for fiscal 2007, 2006 and 2005 was determined based on historical experience of similar awards, giving consideration to the contractual terms of the stock-based awards, vesting schedules and expectations of future employee behavior. The risk-free interest rate is based on the US Treasury yield curve in effect at the time of grant for periods corresponding with the expected life of the option or SAR. The dividend yield assumption is based on the Company's history of not paying dividends and the resultant future expectation of zero dividend payouts.
The fair value of RSUs on the date of grant is the Advent share price.
105
ADVENT SOFTWARE, INC.
NOTES TO CONSOLIDATED FINANCIAL STATEMENTS (Continued)
Note 10—Stock-Based Compensation (Continued)
Equity Award Activity
A summary of the status of the Company's stock option, SAR and warrant activity for the period presented is as follows (in thousands except weighted average exercise price):
| | 2007
| | 2006
| | 2005
|
|---|
| | Number of
Shares
| | Weighted
Average
Exercise
Price
| | Number of
Shares
| | Weighted
Average
Exercise
Price
| | Number of
Shares
| | Weighted
Average
Exercise
Price
|
|---|
| Outstanding at beginning of year | | 5,292 | | $ | 20.08 | | 5,489 | | $ | 19.26 | | 5,710 | | $ | 18.69 |
| Options and SARs granted | | 731 | | $ | 37.79 | | 877 | | $ | 29.00 | | 1,403 | | $ | 19.81 |
| Options and SARs exercised | | (1,735 | ) | $ | 16.19 | | (665 | ) | $ | 17.31 | | (1,099 | ) | $ | 16.42 |
| Options, SARs and warrants canceled | | (470 | ) | $ | 25.16 | | (409 | ) | $ | 32.67 | | (525 | ) | $ | 20.47 |
| | |
| |
| |
| |
| |
| |
|
| Outstanding at end of year | | 3,818 | | $ | 24.61 | | 5,292 | | $ | 20.08 | | 5,489 | | $ | 19.26 |
| | |
| |
| |
| |
| |
| |
|
| Exercisable at end of year | | 2,044 | | $ | 21.19 | | 2,990 | | $ | 18.22 | | 2,685 | | $ | 19.32 |
| | |
| |
| |
| |
| |
| |
|
The aggregate intrinsic value of options and SARs outstanding and exercisable as of December 31, 2007 was $112.6 million and $67.3 million, respectively. The intrinsic value is calculated as the difference between the Company's closing stock price of $54.10 as of December 31, 2007 and the exercise price of the underlying awards for options or SARs that were in-the-money as of that date.
The weighted average grant date fair value of options and SARs, as determined under SFAS 123R, granted during fiscal 2007 was $13.49 per share. The total intrinsic value of options exercised during fiscal 2007 was $43.8 million. The total cash received from employees as a result of employee stock option and SAR exercises during fiscal 2007 was approximately $27.4 million.
The weighted average grant date fair value of options and SARs, as determined under SFAS 123R, granted during fiscal 2006 was $13.96 per share. The total intrinsic value of options and SARs exercised during fiscal 2006 was $10.2 million. The total cash received from employees as a result of employee stock option exercises during fiscal 2006 was approximately $11.5 million. No SARs were exercised during fiscal 2006.
106
ADVENT SOFTWARE, INC.
NOTES TO CONSOLIDATED FINANCIAL STATEMENTS (Continued)
Note 10—Stock-Based Compensation (Continued)
The options outstanding and currently exercisable by exercise price at December 31, 2007 were as follows:
| | Options Outstanding
| | Options Exercisable
|
|---|
Exercise Price
| | Number
Outstanding
(in thousands)
| | Weighted
Average
Remaining
Contractual
Life (in years)
| | Weighted
Average
Exercise
Price
| | Number
Exercisable
(in thousands)
| | Weighted
Average
Exercise
Price
|
|---|
| $9.167 - $17.54 | | 460 | | 4.69 | | $ | 14.86 | | 296 | | $ | 13.53 |
| $17.56 - $17.95 | | 389 | | 6.81 | | $ | 17.86 | | 203 | | $ | 17.83 |
| $18.06 - $18.25 | | 471 | | 6.54 | | $ | 18.17 | | 334 | | $ | 18.18 |
| $18.70 - $18.96 | | 478 | | 4.18 | | $ | 18.88 | | 439 | | $ | 18.88 |
| $19.76 - $21.375 | | 431 | | 5.41 | | $ | 20.70 | | 299 | | $ | 20.80 |
| $24.44 - $28.18 | | 602 | | 7.28 | | $ | 27.51 | | 245 | | $ | 27.15 |
| $28.31 - $37.14 | | 732 | | 8.80 | | $ | 34.75 | | 111 | | $ | 31.23 |
| $37.80 - $55.80 | | 253 | | 6.79 | | $ | 45.81 | | 115 | | $ | 42.62 |
| $56.875 - $56.875 | | 1 | | 2.61 | | $ | 56.88 | | 1 | | $ | 56.88 |
| $60.375 - $60.375 | | 1 | | 2.87 | | $ | 60.38 | | 1 | | $ | 60.38 |
| | |
| |
| |
| |
| |
|
| | | 3,818 | | 6.49 | | $ | 24.61 | | 2,044 | | $ | 21.19 |
| | |
| |
| |
| |
| |
|
The equity awards available for grant for the periods presented were as follows (in thousands):
| | Fiscal Years
| |
|---|
| | 2007
| | 2006
| | 2005
| |
|---|
| Beginning balance | | 2,138 | | 3,068 | | 2,509 | |
| Options authorized | | — | | — | | 1,582 | |
| Options and SARs granted | | (730 | ) | (877 | ) | (1,403 | ) |
| Options and SARs canceled | | 467 | | 409 | | 525 | |
| Options expired | | (80 | ) | (4 | ) | (145 | ) |
| SARs exercised, settled for taxes or proceeds, and returned to plan | | 17 | | — | | — | |
| RSUs granted | | (356 | ) | (279 | ) | — | |
| RSUs vested, settled for taxes and returned to plan | | 1 | | — | | — | |
| RSUs canceled | | 50 | | 13 | | — | |
| Warrants expired | | — | | (192 | ) | — | |
| | |
| |
| |
| |
| Ending balance | | 1,507 | | 2,138 | | 3,068 | |
| | |
| |
| |
| |
107
ADVENT SOFTWARE, INC.
NOTES TO CONSOLIDATED FINANCIAL STATEMENTS (Continued)
Note 10—Stock-Based Compensation (Continued)
During fiscal 2007 and 2006, the Company granted RSUs under its 2002 Stock Plan. A summary of RSU activity during 2007 and 2006 is as follows:
| | 2007
| | 2006
|
|---|
| | Number of
Shares
| | Weighted
Average
Grant Date
Fair Value
| | Number of
Shares
| | Weighted
Average
Grant Date
Fair Value
|
|---|
| | (in thousands)
| |
| | (in thousands)
| |
|
|---|
| Outstanding and unvested at beginning of period | | 266 | | $ | 29.81 | | — | | $ | — |
| RSUs granted | | 356 | | $ | 37.92 | | 279 | | $ | 29.81 |
| RSUs vested | | (1 | ) | $ | 28.18 | | — | | $ | — |
| RSUs canceled | | (50 | ) | $ | 32.78 | | (13 | ) | $ | 29.75 |
| | |
| |
| |
| |
|
| Outstanding and unvested at end of period | | 571 | | $ | 34.62 | | 266 | | $ | 29.81 |
| | |
| |
| |
| |
|
The weighted average grant date fair value was determined based on the closing market price of the Company's common stock on the date of the award. Aggregate intrinsic value of RSUs outstanding at December 31, 2007 was $30.9 million, based on the closing price of $54.10 per share as of December 31, 2007.
Description of Plans
Advent has equity awards outstanding under three stock option plans, the 2002 Stock Plan (the "Plan"), the 1998 Non-statutory Stock Option Plan (the "Non-statutory Plan") and the 1995 Director Option Plan (the "Director Plan").
The Plan. On May 18, 2005, the Company's stockholders approved the amendment and restatement of Advent's 2002 Stock Plan, originally approved by the Board of Directors (the "Board") and stockholders in February and May, respectively, of 2002. Under the Plan, the Company may grant options to purchase common stock to employees, consultants and directors. Options granted may be incentive stock options or non-statutory stock options and shall be granted at a price not less than fair market value on the date of grant. Fair market value (as defined in the Plan) and the vesting of these options shall be determined by the Board. The options generally vest over 5 years and expire no later than 10 years from the date of grant. The Company settles employee stock option exercises with newly issued common shares. The Plan permits the award of restricted stock, RSUs, SARs, performance shares, and performance units under the Plan.
During 2006 and 2007, Advent granted RSUs and stock-settled SARs. The RSUs are awards of restricted stock units that generally vest over four years in two equal installments on the second and fourth anniversaries of the date of grant. Upon vesting, the RSUs will convert into an equivalent number of shares of common stock. The value of the RSUs is based on the closing market price of the Company's common stock on the date of grant and is amortized on a straight-line basis over the four-year requisite service period. A SAR is the right to receive the appreciation in fair market value of common stock between the exercise date and the date of grant and generally vests over 5 years. Upon exercise, SARs will be settled in shares of Advent common stock. Unvested RSUs and SARs on termination of employee employment are canceled and returned to the Plan.
108
ADVENT SOFTWARE, INC.
NOTES TO CONSOLIDATED FINANCIAL STATEMENTS (Continued)
Note 10—Stock-Based Compensation (Continued)
Non-employee directors were eligible to receive option grants under the Director Plan, which terminated in November 2005. Effective April 1, 2005, each non-employee director became eligible to receive awards under the 2002 Plan:
| Initial option grant upon joining the Board(1) | | 30,000 shares |
| Annual option grant upon re-election to the Board(2) | | 12,000 shares |
- (1)
- Vests over four years with 25% of the shares vesting after one year of service and the remainder vesting in equal monthly installments over the ensuing three years.
- (2)
- Vests in twelve equal monthly installments.
On February 26, 2007, the Board, upon recommendation by the Corporate Governance and Nominating Committee, approved the form and amount of revised equity awards automatically granted to non-employee directors. Effective February 26, 2007, each non-employee director became eligible to receive the following awards of SARs and restricted stock units RSUs under the 2002 Plan:
| Initial SAR grant upon joining the Board(1) | | 21,000 shares |
| Initial RSU grant upon joining the Board(2) | | 4,500 shares |
Annual SAR grant upon re-election to the Board(3) |
|
8,400 shares |
| Annual RSU grant upon re-election to the Board(3) | | 1,800 shares |
- (1)
- Vests over four years with 25% of the shares vesting one year after the date of grant and the remainder vesting in equal monthly installments over the ensuing three years.
- (2)
- Vests over four years with 50% of the shares vesting two years after the date of grant and 50% vesting four years after the date of grant.
- (3)
- Vests 100% one year after the date of grant.
In the event of a merger with or into another corporation, or other change in control, each non-employee director shall fully vest in and have the right to exercise all of his or her outstanding equity compensation (including outstanding stock options, SARs, RSUs, or performance shares). Upon a director's retirement from the Board, the director's unvested options, SARs and RSUs are canceled and returned to the Plan.
Non-Statutory Plan. In November 1998, the Board approved the 1998 Non-statutory Stock Option Plan and reserved 300,000 shares of common stock for issuance thereunder. Under the Company's 1998 Non-statutory Plan, Advent may grant options to purchase common stock to employees and consultants, excluding persons who are executive officers and directors. Options granted are non-statutory stock options and shall be granted at a price not less than fair market value on the date of grant. Fair market value (as defined in the Non-statutory Plan) and the vesting of these options shall be determined by the Board. The options generally vest over 5 years and expire no later than 10 years from the date of grant. Unvested options on termination of employment are canceled and returned to the Non-statutory Plan. On February 26, 2007, the Board terminated the Non-statutory Plan.
109
ADVENT SOFTWARE, INC.
NOTES TO CONSOLIDATED FINANCIAL STATEMENTS (Continued)
Note 10—Stock-Based Compensation (Continued)
Director Plan. Advent's Director Plan, which expired on November 16, 2005, provided for the grant of non-statutory stock options to the Company's non-employee directors ("outside directors"). As noted above, effective April 1, 2005, option grants to outside directors are issued under the 2002 Stock Plan.
In March 2001, the Company issued a fully vested non-forfeitable stock purchase warrant to purchase a total of 191,644 shares of Advent common stock to a customer from whom Advent had revenue of approximately $70,000 and $8,000 in 2006 and 2005, respectively. The warrant was issued for cash consideration of $5 million, which was the estimated Black-Scholes fair value. The warrant had an exercise price of $45.375 per share, was immediately exercisable, and expired unexercised in March 2006.
All individuals employed by Advent are eligible to participate in the ESPP if Advent employs them for at least 20 hours per week and at least five months per year. The ESPP permits eligible employees to purchase Advent common stock through payroll deductions at a price equal to 85% of the lower of the closing sale price for the Company's common stock reported on the NASDAQ National Market at the beginning or the end of each six-month offering period. In any calendar year, eligible employees can withhold up to 10% of their salary and certain variable compensation.
In the second quarter of 2003, Advent's shareholders approved an amendment to the 1995 ESPP to increase the number of shares of common stock reserved for issuance by 600,000. Through October 5, 2005 when the plan expired, 1,245,289 shares had been issued out of a total of 1,500,000 shares of common stock reserved for issuance under the 1995 ESPP. The Company issued approximately 76,744 shares under the 1995 ESPP at an average price of $17.00 in 2005.
On May 18, 2005, Advent's shareholders approved the 2005 ESPP with 2,000,000 shares of common stock reserved for issuance. The following table summarizes the Company's issuance of common stock under the 2005 ESPP:
| | Fiscal Years
|
|---|
| | 2007
| | 2006
| | 2005
|
|---|
| Common shares issued | | | 126,978 | | | 110,932 | | | 72,017 |
| Weighted average price | | $ | 30.81 | | $ | 27.18 | | $ | 16.86 |
As of December 31, 2007, common shares of 1,690,073 were reserved for future issuance under the 2005 ESPP.
110
ADVENT SOFTWARE, INC.
NOTES TO CONSOLIDATED FINANCIAL STATEMENTS (Continued)
Note 10—Stock-Based Compensation (Continued)
Advent sponsors a 401(k) Plan to provide retirement benefits for its US employees. This Plan provides for tax-deferred salary deductions for eligible employees. Employees may contribute between 1% and 70% of their compensation to this Plan, limited by an annual maximum amount as determined by the Internal Revenue Service. The Company also makes a 50% matching contribution of up to 6% of employee compensation. The Company's matching contributions to this plan totaled $2.6 million, $1.8 million, and $1.8 million for fiscal 2007, 2006 and 2005, respectively. In addition to the employer matching contribution, Advent may make profit sharing contributions at the discretion of the Board of Directors. Advent did not make any profit sharing contributions in fiscal 2007, 2006 or 2005.
Note 11—Net Income per Share
The following table sets forth the computation of basic and diluted net income per share (in thousands, except per share data):
| | Fiscal Years
|
|---|
| | 2007
| | 2006
| | 2005
|
|---|
| Numerator: | | | | | | | | | |
| Net income | | $ | 12,631 | | $ | 82,602 | | $ | 14,135 |
| | |
| |
| |
|
| Denominator: | | | | | | | | | |
| Denominator for basic net income per share-weighted average shares outstanding | | | 26,495 | | | 29,003 | | | 31,031 |
| Dilutive common equivalent shares: | | | | | | | | | |
| | Employee stock options and other | | | 1,572 | | | 1,534 | | | 1,443 |
| | |
| |
| |
|
| Denominator for diluted net income per share-weighted average shares outstanding, assuming exercise of potential dilutive common shares | | | 28,067 | | | 30,537 | | | 32,474 |
| | |
| |
| |
|
| Basic net income per share | | $ | 0.48 | | $ | 2.85 | | $ | 0.46 |
| Diluted net income per share | | $ | 0.45 | | $ | 2.70 | | $ | 0.44 |
Weighted average stock options, SARs and RSUs of approximately 0.7 million, 1.0 million and 0.6 million were excluded from the computation of diluted net income per share for fiscal 2007, 2006 and 2005, respectively, because their inclusion would have been anti-dilutive.
Note 12—Common Stock Repurchase Programs
Advent's Board has approved common stock repurchase programs authorizing management to repurchase shares of the Company's common stock. The timing and actual number of shares subject to repurchase have been made at the discretion of Advent's management and are contingent on a number of factors and limitations, including the price of Advent's stock, corporate and regulatory requirements, alternative investment opportunities and other market conditions. The stock repurchase programs specify a maximum number of shares subject to repurchase, do not have an expiration date and may be limited or terminated at any time without prior notice. Repurchased shares are returned to the status of authorized and un-issued shares of common stock.
111
ADVENT SOFTWARE, INC.
NOTES TO CONSOLIDATED FINANCIAL STATEMENTS (Continued)
Note 12—Common Stock Repurchase Programs (Continued)
The following is a summary of the repurchase programs authorized by Advent's Board since fiscal 2005 (in thousands):
Date of Authorization
| | Number
of Shares
Authorized
|
|---|
| February 2005 | | 1,800 |
| May 2005 | | 1,000 |
| April 2006 | | 2,300 |
| July 2006 | | 1,500 |
| February 2007 | | 2,250 |
| | |
|
| | Total | | 8,850 |
| | |
|
The following is a summary of the Company's repurchase activity by year since fiscal 2005 (in thousands, except per share data):
Fiscal Year
| | Total
Number
of Shares
Repurchased
| | Cost
| | Average
Price
Paid Per
Share
|
|---|
| 2005 | | 2,834 | | $ | 52,584 | | $ | 18.55 |
| 2006 | | 4,692 | | $ | 148,602 | | $ | 31.67 |
| 2007 | | 2,580 | | $ | 91,157 | | $ | 35.33 |
| | |
| |
| |
|
| | Total | | 10,106 | | $ | 292,343 | | $ | 28.93 |
| | |
| |
| |
|
At January 1, 2005, there remained 1,256,000 shares authorized by the Board for repurchase. As of December 31, 2007, there were no shares available to be repurchased.
Note 13—Segment and Geographical Information
Operating segments are defined as components of an enterprise about which separate financial information is available that is evaluated regularly by the chief operating decision maker ("CODM"), or decision making group, in deciding how to allocate resources and in assessing performance. Advent's CODM is the Chief Executive Officer.
Advent's organizational structure is based on a number of factors that the CODM uses to evaluate, view and run its business operations which include, but are not limited to, customer base, homogeneity of products and technology. Advent's operating segments are based on this organizational structure and information reviewed by Advent's CODM to evaluate the operating segment results. Advent has determined that its operations are organized into two reportable segments: 1) Advent Investment Management; and 2) MicroEdge. Future changes to this organizational structure may result in changes to the business segments disclosed.
Advent Investment Management is the Company's core business and derives revenues from the development, marketing and sale of software products, data interfaces and related maintenance and services that automate, integrate and support certain mission-critical functions of investment
112
ADVENT SOFTWARE, INC.
NOTES TO CONSOLIDATED FINANCIAL STATEMENTS (Continued)
Note 13—Segment and Geographical Information (Continued)
management organizations. MicroEdge derives revenues from the sale of software and services for grant management, matching gifts and volunteer tracking for the grant-making community.
The results of the operating segments are derived directly from Advent's internal management reporting system. The accounting policies used to derive operating segment results are substantially the same as those used by the consolidated company. Management measures the performance of each operating segment based on several metrics, including income (loss) from operations. These results are used, in part, to evaluate the performance of, and to assign resources to, each of the operating segments. Certain operating expenses, including stock-based compensation and amortization and impairment of developed technology and other intangibles, which Advent manages separately at the corporate level, are not allocated to the operating segments. Advent does not separately accumulate and review asset information by segment.
Segment information for the periods presented is as follows (in thousands):
| | Fiscal Years
| |
|---|
| | 2007
| | 2006
| | 2005
| |
|---|
| Net revenues: | | | | | | | | | | |
| | Advent Investment Management | | $ | 191,490 | | $ | 162,609 | | $ | 145,897 | |
| | MicroEdge | | | 23,733 | | | 21,182 | | | 20,026 | |
| | Other | | | 80 | | | 302 | | | 2,778 | |
| | |
| |
| |
| |
| | | Total net revenues | | $ | 215,303 | | $ | 184,093 | | $ | 168,701 | |
| | |
| |
| |
| |
| Income (loss) from operations: | | | | | | | | | | |
| | Advent Investment Management | | $ | 23,610 | | $ | 14,921 | | $ | 9,599 | |
| | MicroEdge | | | 5,631 | | | 5,361 | | | 2,979 | |
| | Other | | | 80 | | | (1,902 | ) | | 374 | |
| Unallocated corporate operating costs and expenses: | | | | | | | | | | |
| | Stock-based compensation | | | (13,396 | ) | | (13,596 | ) | | — | |
| | Amortization of developed technology | | | (1,567 | ) | | (1,200 | ) | | (2,575 | ) |
| | Amortization of other intangibles | | | (1,879 | ) | | (3,866 | ) | | (4,041 | ) |
| | Acquired in-process research and development | | | (150 | ) | | — | | | — | |
| | |
| |
| |
| |
| | | Total income (loss) from operations | | $ | 12,329 | | $ | (282 | ) | $ | 6,336 | |
| | |
| |
| |
| |
| Depreciation expense: | | | | | | | | | | |
| | Advent Investment Management | | $ | 7,171 | | $ | 7,026 | | $ | 7,977 | |
| | MicroEdge | | | 568 | | | 637 | | | 668 | |
| | Other | | | — | | | 35 | | | 39 | |
| | |
| |
| |
| |
| | | Total depreciation expense | | $ | 7,739 | | $ | 7,698 | | $ | 8,684 | |
| | |
| |
| |
| |
No single customer represented 10% or more of Advent's total net revenues in any fiscal year presented.
113
ADVENT SOFTWARE, INC.
NOTES TO CONSOLIDATED FINANCIAL STATEMENTS (Continued)
Note 13—Segment and Geographical Information (Continued)
Geographical information as of and for the periods presented is as follows (in thousands):
| | December 31
|
|---|
| | 2007
| | 2006
|
|---|
| Long-lived assets(1): | | | | | | |
| | United States | | $ | 36,428 | | $ | 33,770 |
| | International | | | 1,496 | | | 965 |
| | |
| |
|
| | | Total long-lived assets | | $ | 37,924 | | $ | 34,735 |
| | |
| |
|
| | Fiscal Years
|
|---|
| | 2007
| | 2006
| | 2005
|
|---|
| Geographic net sales(2): | | | | | | | | | |
| | United States | | $ | 188,680 | | $ | 161,861 | | $ | 150,051 |
| | International | | | 26,623 | | | 22,232 | | | 18,650 |
| | |
| |
| |
|
| | | Total net sales | | $ | 215,303 | | $ | 184,093 | | $ | 168,701 |
| | |
| |
| |
|
- (1)
- Long-lived assets exclude goodwill, intangible assets, private equity investments and deferred tax assets.
- (2)
- Geographic net sales are based on the location to which the product is shipped.
Note 14—Related Party Transactions
As of December 31, 2006, Legg Mason owned approximately 17% of the voting stock of Advent. Advent recognized revenue of approximately $0.5 million from Legg Mason during fiscal 2006. The Company's accounts receivable from Legg Mason was $10,000 as of December 31, 2006.
In addition, Advent acts as trustee for the company's short-term disability plan—Advent Software California Voluntary Disability Plan ("VDI"). Fiscal 2007 employee withholding and disbursements totaled $0.3 million, respectively. Fiscal 2006 employee withholdings and disbursements totaled $0.3 million, respectively. As of December 31, 2007 and 2006, cash held by Advent related to the VDI was $0.2 million and $0.3 million, respectively, which are included in "other assets" on the consolidated balance sheets.
On November 6, 2007, Robert A. Ettl was appointed to the Company's Board. Mr. Ettl currently serves as managing director of Allianz Global Investors ("Allianz"). Advent recognized revenue of $1.0 million from Allianz during fiscal 2007. The Company's account receivable from Allianz was $77,000 as of December 31, 2007.
114
ADVENT SOFTWARE, INC.
NOTES TO CONSOLIDATED FINANCIAL STATEMENTS (Continued)
Supplementary Quarterly Financial Data (Unaudited)
| | First
Quarter
| | Second
Quarter
| | Third
Quarter
| | Fourth
Quarter
| |
|---|
| | (in thousands, except per share data)
| |
|---|
| 2007(1)(2)(3): | | | | | | | | | | | | | |
| Net revenues | | $ | 47,979 | | $ | 52,376 | | $ | 55,549 | | $ | 59,399 | |
| Gross margin | | $ | 32,515 | | $ | 36,372 | | $ | 37,580 | | $ | 40,946 | |
| Income (loss) from operations | | $ | (50 | ) | $ | 3,041 | | $ | 5,795 | | $ | 3,543 | |
| Net income | | $ | 439 | | $ | 5,095 | | $ | 3,296 | | $ | 3,801 | |
| Net income per share—basic | | $ | 0.02 | | $ | 0.19 | | $ | 0.13 | | $ | 0.14 | |
| Net income per share—diluted | | $ | 0.02 | | $ | 0.18 | | $ | 0.12 | | $ | 0.13 | |
2006(4): |
|
|
|
|
|
|
|
|
|
|
|
|
|
| Net revenues | | $ | 43,656 | | $ | 44,360 | | $ | 45,877 | | $ | 50,200 | |
| Gross margin | | $ | 30,192 | | $ | 30,367 | | $ | 30,636 | | $ | 34,095 | |
| Income (loss) from operations | | $ | 1,049 | | $ | 497 | | $ | 328 | | $ | (2,156 | ) |
| Net income | | $ | 3,402 | | $ | 1,603 | | $ | 952 | | $ | 76,645 | |
| Net income per share—basic | | $ | 0.11 | | $ | 0.05 | | $ | 0.03 | | $ | 2.79 | |
| Net income per share—diluted | | $ | 0.11 | | $ | 0.05 | | $ | 0.03 | | $ | 2.62 | |
- (1)
- In the second quarter of 2007, Advent recorded a net gain on sale of its equity investments of $3.7 million.
- (2)
- In the fourth quarter of 2007, Advent recorded acquired in-process research and development expense of $0.2 million associated with its acquisition of Vivid Orange Limited based in the United Kingdom.
- (3)
- The Company's results of operations for the fourth quarter of 2007 differ from those results reported in the Company's Current Report on Form 8-K filed on February 5, 2008 with the Securities and Exchange Commission. Subsequent to the Company's filing of this Form 8-K, the Company recorded adjustments to its fourth quarter of 2007 results as follows (in thousands, except per share data):
| | As Previously
Reported
| | Adjustments
| | As Currently
Reported
|
|---|
| Net revenues | | $ | 59,564 | | $ | (165 | ) | $ | 59,399 |
| Gross margin | | $ | 41,111 | | $ | (165 | ) | $ | 40,946 |
| Income from operations | | $ | 3,748 | | $ | (205 | ) | $ | 3,543 |
| Net income | | $ | 3,961 | | $ | (160 | ) | $ | 3,801 |
| Net income per share—basic | | $ | 0.15 | | $ | (0.01 | ) | $ | 0.14 |
| Net income per share—diluted | | $ | 0.14 | | $ | (0.01 | ) | $ | 0.13 |
- (4)
- The Company's results of operations for the fourth quarter of 2006 included a benefit from income taxes of $78.0 million primarily as a result of releasing the valuation allowance against its deferred tax assets originally recorded in the fourth quarter of 2003. Additionally, Advent recorded a net restructuring charge of $3.4 million during the fourth quarter of 2006 primarily consisting of facility and exit costs related to exiting its former corporate facilities at 301 Brannan Street in San Francisco, California.
115
Item 9. Changes in and Disagreements with Accountants on Accounting and Financial Disclosure
None.
Item 9A. Controls and Procedures
Evaluation of disclosure controls and procedures
The Company maintains disclosure controls and procedures (as defined in Rules 13a-15(e) and 15d-15(e) under the Securities Exchange Act of 1934, as amended (the "Exchange Act")) that are designed to ensure that information required to be disclosed in the Company's reports under the Exchange Act is recorded, processed, summarized and reported within the time periods specified in the SEC's rules and forms, and that such information is accumulated and communicated to management, including the Company's Principal Executive and Financial Officer, as appropriate, to allow timely decisions regarding required disclosure. The Company's management evaluated, with the participation of the Principal Executive and Financial Officer, the effectiveness of the Company's disclosure controls and procedures as of the end of the period covered by this Annual Report on Form 10-K. Based on this evaluation, the Principal Executive and Financial Officer has concluded that our disclosure controls and procedures were effective as of December 31, 2007.
Management's annual report on internal control over financial reporting
See "Management's Report on Internal Control over Financial Reporting" on page 68.
Changes in internal control over financial reporting
There were no changes in our internal control over financial reporting which were identified in connection with the evaluation required by Rule 13a-15(e) of the Exchange Act that occurred during the fourth quarter ended December 31, 2007 that has materially affected, or is reasonably likely to materially affect, Advent's internal control over financial reporting.
Item 9B. Other Information
None.
116
PART III
Item 10. Directors, Executive Officers and Corporate Governance
The information on Directors appearing under the heading "Corporate Governance" and "Proposal No. 1: Election of Directors" in the Notice of the 2008 Annual Meeting of Stockholders and 2008 Proxy Statement, to be filed pursuant to Rule 14a-6(b) under the Securities and Exchange Act of 1934 (the "Exchange Act"), in connection with the Company's 2008 Annual Meeting of Stockholders (the "2008 Proxy Statement"), is incorporated by reference in this Annual Report on Form 10-K. Information required by this Item related to the executive officers can be found in the section captioned "Executive Officers of the Registrant" under Part I, "Item 1. Business" of this Annual Report on Form 10-K, and is also incorporated herein by reference. Information required by this Item regarding any material changes to the process by which security holders may recommend nominees to the Board of Directors appears under the heading "Procedural Matters" in our 2008 Proxy Statement and is incorporated herein by reference.
The information contained under the heading "Compliance with Section 16(a) of the Exchange Act" in the 2008 Proxy Statement are incorporated by reference in this Annual Report on Form 10-K.
The current members of the audit committee are A. George Battle, James D. Kirsner and Wendell Van Auken (Chair), each of whom is "independent" as defined by current Nasdaq listing standards. The Board has determined that all members of the audit committee are financial experts as defined by Item 401(h) of Regulation S-K of the Exchange Act.
The Company has a code of business ethics and conduct that applies to all of the Company's employees, including its Principal Executive Officer, Principal Financial and Accounting Officer and its Board of Directors. A copy of this code, "Code of Business Ethics and Conduct", is available on the Company's website atwww.advent.com and may be found as follows:
- 1.
- From our main web page, first click on "About Advent";
- 2.
- Next, click on "Investor Relations";
- 3.
- Next, click on "Corp Governance";
- 4.
- Next, click on "Conduct"; and
- 5.
- Finally, click on "Advent's Code of Business Ethics and Conduct."
The Company intends to disclose any changes in or waivers from its code of ethics by posting such information on its website.
Item 11. Executive Compensation
Information required by this Item is incorporated by reference to our Proxy Statement for our 2008 Annual Meeting of Stockholders, where it is included under the caption "Compensation Committee Matters."
Item 12. Security Ownership of Certain Beneficial Owners and Management and Related Stockholder Matters
Information required by this Item is incorporated by reference to our Proxy Statement for our 2008 Annual Meeting of Stockholders, where it is included under the captions "Beneficial Security Ownership of Management and Certain Beneficial Owners," and "Equity Compensation Plan Information."
117
Item 13. Certain Relationships and Related Transactions, and Director Independence
Information required by this Item is incorporated by reference to our Proxy Statement for our 2008 Annual Meeting of Stockholders, where it is included under the caption "Certain Relationships and Related Transactions" and "Corporate Governance."
Item 14. Principal Accounting Fees and Services
Information required by this Item is incorporated by reference to our Proxy Statement for our 2008 Annual Meeting of Stockholders, where it is included under the caption "Fees to Independent Registered Public Accounting Firm."
118
PART IV
Item 15. Exhibits and Financial Statement Schedules
- (a)
- The following documents are filed as part of this Report
- 1.
- Financial Statements
| | Page
|
|---|
| Management's Report on Internal Control Over Financial Reporting | | 68 |
| Report of Independent Registered Public Accounting Firm | | 69 |
| Consolidated Balance Sheets as of December 31, 2007 and 2006 | | 71 |
| Consolidated Statements of Operations for the years ended December 31, 2007, 2006, and 2005 | | 72 |
| Consolidated Statements of Stockholders' Equity and Comprehensive Income for the years ended December 31, 2007, 2006, and 2005 | | 73 |
| Consolidated Statements of Cash Flows for the years ended December 31, 2007, 2006, and 2005 | | 74 |
| Notes to Consolidated Financial Statements | | 75 |
- 2.
- Financial Statement Schedules
The following financial statement schedule for the years ended December 31, 2007, 2006 and 2005 should be read in conjunction with the consolidated financial statements of Advent Software, Inc. filed as part of this Annual Report on Form 10-K:
Schedule II
ADVENT SOFTWARE, INC
VALUATION AND QUALIFYING ACCOUNTS
For the years ended December 31, 2007, 2006 and 2005
| | Balance at
Beginning
of Period
| | Additions
(Reductions)
Charged
to Expense
| | Write-offs
| | Balance at
End
of Period
|
|---|
| | (in thousands)
|
|---|
| Allowance for doubtful accounts: | | | | | | | | | | | | |
| | 2005 | | $ | 611 | | $ | (436 | ) | $ | 29 | | $ | 146 |
| | 2006 | | $ | 146 | | $ | 988 | | $ | 864 | | $ | 270 |
| | 2007 | | $ | 270 | | $ | 79 | | $ | 168 | | $ | 181 |
Allowance for sales returns: |
|
|
|
|
|
|
|
|
|
|
|
|
| | 2005 | | $ | 3,341 | | $ | 2,182 | | $ | 2,470 | | $ | 3,053 |
| | 2006 | | $ | 3,053 | | $ | (776 | ) | $ | 142 | | $ | 2,135 |
| | 2007 | | $ | 2,135 | | $ | 118 | | $ | 168 | | $ | 2,085 |
Deferred tax asset valuation allowance: |
|
|
|
|
|
|
|
|
|
|
|
|
| | 2005 | | $ | 101,357 | | $ | 2,369 | | $ | — | | $ | 103,726 |
| | 2006 | | $ | 103,726 | | $ | (92,150 | ) | $ | — | | $ | 11,576 |
| | 2007 | | $ | 11,576 | | $ | (3,065 | ) | $ | 2,474 | | $ | 6,037 |
Reserve for uncertain tax position |
|
|
|
|
|
|
|
|
|
|
|
|
| | 2007 | | $ | 4,124 | | $ | 842 | | $ | 23 | | $ | 4,943 |
119
Schedules other than those listed above have been omitted since they are either not required, not applicable, or because the information required is included in the consolidated financial statements or the notes thereto.
The following exhibits are filed as a part of, or incorporated by reference into this Form 10-K:
| |
| | Incorporated by Reference
| |
|
|---|
Exhibit
Number
| |
| | Filed Herewith
|
|---|
| | Exhibit Description
| | Form
| | Date
| | Number
|
|---|
| 2.1 | | Agreement and Plan of Merger by and among Advent Softare, Inc. ("Advent"), Kayak Acquisition Corp., and Kinexus Corporation dated as of December 31, 2001 | | 8-K | | 3/1/2002 | | 2.1 | | |
3.1 |
|
Second Amended and Restated Certificate of Incorporation of Registrant |
|
10-K |
|
3/12/2001 |
|
3.1 |
|
|
3.2 |
|
Amended and Restated Bylaws of Registrant |
|
8-K |
|
11/8/2007 |
|
3.1 |
|
|
4.1 |
|
Specimen Common Stock Certificate of Registrant |
|
SB-2 |
|
11/15/1995 |
|
*** |
|
|
10.1 |
|
Form of Indemnification Agreement for Executive Officers and Directors* |
|
SB-2 |
|
11/15/1995 |
|
*** |
|
|
10.2 |
|
1992 Stock Plan, as amended* |
|
S-8 |
|
5/28/1999 |
|
4.1 |
|
|
10.3 |
|
1993 Profit Sharing & Employee Savings Plan, as amended* |
|
SB-2 |
|
11/15/1995 |
|
*** |
|
|
10.4 |
|
1995 Employee Stock Purchase Plan* |
|
SB-2 |
|
11/15/1995 |
|
*** |
|
|
10.5 |
|
1995 Director Option Plan* |
|
S-8 |
|
8/11/2000 |
|
4.1 |
|
|
10.6 |
|
2002 Stock Option Plan, as amended* |
|
DEF 14A |
|
4/22/2005 |
|
Appendix B |
|
|
10.7 |
|
Severance Agreement between Advent and Peter M. Caswell dated December 10, 1993* |
|
SB-2 |
|
11/15/1995 |
|
*** |
|
|
10.8 |
|
Agreement between Advent and Interactive Data Corporation dated January 1, 1995** |
|
SB-2 |
|
11/15/1995 |
|
*** |
|
|
10.9 |
|
Office Lease dated August 1, 1998, between SOMA Partners, L.P. and Advent for facilities located at 301 Brannan in San Francisco, California |
|
10-K |
|
3/26/1999 |
|
10.14 |
|
|
10.10 |
|
Office Lease dated July 22, 1999, between 405 Lexington, L.L.C. and Advent for facilities located at 666 Third Avenue in New York, New York |
|
10-K |
|
3/17/2000 |
|
10.15 |
|
|
10.11 |
|
2005 Employee Stock Purchase Plan* |
|
DEF 14A |
|
4/22/2005 |
|
Appendix A |
|
|
10.12 |
|
Office Lease dated January 6, 2006, between Toda Development, Inc. and Advent for facilities located at 600 Townsend Street in San Francisco, California. |
|
8-K |
|
1/12/2006 |
|
10.1 |
|
|
10.13 |
|
Executive Severance Plan dated March 14, 2006* |
|
10-K |
|
3/31/2006 |
|
10.13 |
|
|
120
10.14 |
|
Credit Facility |
|
10-K |
|
3/16/2007 |
|
10.14 |
|
|
10.15 |
|
Summary of Plan Terms for 2007 Executive Short-Term Incentive Plan |
|
8-K |
|
7/5/2007 |
|
10.1 |
|
|
10.16 |
|
Summary of Plan Terms for 2008 Executive Short-Term Incentive Plan |
|
8-K |
|
2/5/2008 |
|
10.1 |
|
|
21.1 |
|
Subsidiaries of Advent |
|
|
|
|
|
|
|
X |
23.1 |
|
Consent of PricewaterhouseCoopers LLP, Independent Registered Public Accounting Firm |
|
|
|
|
|
|
|
X |
24.1 |
|
Power of Attorney (included on page 122 of this Form 10-K) |
|
|
|
|
|
|
|
X |
31.1 |
|
Certification of Principal Executive and Financial Officer under Section 302 of the Sarbanes-Oxley Act of 2002 |
|
|
|
|
|
|
|
X |
32.1 |
|
Certification of Principal Executive and Financial Officer under Section 906 of the Sarbanes-Oxley Act of 2002 |
|
|
|
|
|
|
|
X |
- *
- Denotes management contract or compensatory plan or arrangement required to be filed as an Exhibit to this Form 10-K.
- **
- Confidential treatment requested as to certain portions of this exhibit.
- ***
- Incorporated by reference to the exhibit filed with Advent's registration statement filed on Form SB-2 (commission file number 33-97912-LA), declared effective on November 15, 1995.
121
SIGNATURES
Pursuant to the requirements of Section 13 or 15(d) of the Securities Exchange Act of 1934, the registrant has duly caused this report to be signed on its behalf by the undersigned thereunto duly authorized, on this 13th day of March, 2008.
| | | ADVENT SOFTWARE, INC. |
|
|
By: |
/s/ STEPHANIE G. DIMARCO
Stephanie G. DiMarco
Executive President,
Chief Executive Officer and President
(Principal Executive Officer and
Principal Financial Officer) |
POWER OF ATTORNEY
KNOW ALL PERSONS BY THESE PRESENTS, that each person whose signature appears below constitutes and appoints Stephanie G. DiMarco and Jaime A. Villagomez his or her attorney-in-fact, with full power of substitution, for him in any and all capacities, to sign any amendments to this Report on Form 10-K and to file the same, with exhibits thereto and other documents in connection therewith, with the Securities and Exchange Commission, hereby ratifying and confirming all that each of said attorneys-in-fact, or his substitute or substitutes, may do or cause to be done by virtue hereof.
Pursuant to the requirements of the Securities Exchange Act of 1934, this report has been signed below by the following persons on behalf of the registrant and in the capacities and on the dates indicated.
Signature
| | Title
| | Date
|
|---|
|
|
|
|
|
/s/ STEPHANIE G. DIMARCO
Stephanie G. DiMarco | | Chief Executive Officer and President (Principal Executive Officer and
Principal Financial and Accounting Officer) | | March 13, 2008 |
/s/ A. GEORGE BATTLE
A. George Battle |
|
Director |
|
March 13, 2008 |
/s/ ROBERT A. ETTL
Robert A. Ettl |
|
Director |
|
March 13, 2008 |
/s/ JAMES D. KIRSNER
James D. Kirsner |
|
Director |
|
March 13, 2008 |
/s/ JAMES P. ROEMER
James P. Roemer |
|
Director |
|
March 13, 2008 |
/s/ JOHN H. SCULLY
John H. Scully |
|
Chairman of the Board |
|
March 13, 2008 |
/s/ WENDELL G. VAN AUKEN
Wendell G. Van Auken |
|
Director |
|
March 13, 2008 |
122
QuickLinks
TABLE OF CONTENTSSPECIAL NOTE REGARDING FORWARD-LOOKING STATEMENTSPART IExecutive Officers of RegistrantPART IICOMPARISON OF 5 YEAR CUMULATIVE TOTAL RETURN* Among Advent Software, Inc., The S&P 500 Index And The NASDAQ Computer & Data Processing IndexSPECIAL NOTE REGARDING FORWARD-LOOKING STATEMENTSMANAGEMENT'S REPORT ON INTERNAL CONTROL OVER FINANCIAL REPORTINGREPORT OF INDEPENDENT REGISTERED PUBLIC ACCOUNTING FIRMADVENT SOFTWARE, INC. CONSOLIDATED BALANCE SHEETS (In thousands, except per share amounts)ADVENT SOFTWARE, INC. CONSOLIDATED STATEMENTS OF OPERATIONS (In thousands, except per share data)ADVENT SOFTWARE, INC. CONSOLIDATED STATEMENTS OF STOCKHOLDERS' EQUITY AND COMPREHENSIVE INCOME (In thousands)ADVENT SOFTWARE, INC. CONSOLIDATED STATEMENTS OF CASH FLOWS (In thousands)ADVENT SOFTWARE, INC. NOTES TO CONSOLIDATED FINANCIAL STATEMENTSPART IIIPART IVSIGNATURESPOWER OF ATTORNEY