Use these links to rapidly review the document
TABLE OF CONTENTS
Item 8. Financial Statements and Supplementary Data
PART IV
Table of Contents
UNITED STATES
SECURITIES AND EXCHANGE COMMISSION
Washington, D.C. 20549
FORM 10-K
| | |
ý | | Annual report pursuant to Section 13 or 15(d) of the Securities Exchange Act of 1934 |
For the fiscal year ended December 31, 2014 |
or |
o | | Transition report pursuant to Section 13 or 15(d) of the Securities Exchange Act of 1934 |
For the transition period from to
|
Commission file number: 0-26994

ADVENT SOFTWARE, INC.
(Exact name of registrant as specified in its charter)
| | |
Delaware
(State or other jurisdiction of
incorporation or organization) | | 94-2901952
(IRS Employer
Identification Number) |
600 Townsend Street, San Francisco, California 94103
(Address of principal executive offices and zip code)
(415) 543-7696
(Registrant's telephone number, including area code)
Securities registered pursuant to Section 12(b) of the Act:
| | |
| Title of Each Class | | Name of Each Exchange on Which Registered |
|---|
Common Stock, par value $0.01 per share | | The NASDAQ Stock Market LLC (NASDAQ Global Select) |
Securities registered pursuant to Section 12(g) of the Act:None
Indicate by check mark if the registrant is a well-known seasoned issuer, as defined in Rule 405 of the Securities Act. Yes ý No o
Indicate by check mark if the registrant is not required to file reports pursuant to Section 13 or Section 15(d) of the Exchange Act. Yes o No ý
Indicate by check mark whether the registrant (1) has filed all reports required to be filed by Section 13 or 15(d) of the Securities Exchange Act of 1934 (the "Exchange Act") during the preceding 12 months (or for such shorter period that the registrant was required to file such reports), and (2) has been subject to such filing requirements for the past 90 days. Yes ý No o
Indicate by check mark whether the registrant has submitted electronically and posted on its corporate Web site, if any, every Interactive Data File required to be submitted and posted pursuant to Rule 405 of Regulation S-T (§232.405 of this chapter) during the preceding 12 months (or for such shorter period that the registrant was required to submit and post such files). Yes ý No o
Indicate by check mark if disclosure of delinquent filers pursuant to Item 405 of Regulation S-K is not contained herein, and will not be contained, to the best of registrant's knowledge, in definitive proxy or information statements incorporated by reference in Part III of this Form 10-K or any amendment to this Form 10-K. ý
Indicate by check mark whether the registrant is a large accelerated filer, an accelerated filer, a non-accelerated filer, or a small reporting company. See the definitions of "large accelerated filer," "accelerated filer" and "small reporting company" in Rule 12b-2 of the Exchange Act.
| | | | | | |
| Large accelerated filer ý | | Accelerated filer o | | Non-accelerated filer o
(Do not check if a
smaller reporting company) | | Smaller reporting company o |
Indicate by check mark whether the registrant is a shell company (as defined in Rule 12b-2 of the Exchange Act). Yes o No ý
The number of shares of the registrant's common stock outstanding as of June 30, 2014 was 51,484,730. The aggregate market value of the registrant's common stock held by non-affiliates, based upon the closing price on June 30, 2014, as reported on the NASDAQ National Market System, was approximately $677 million. Shares of common stock held by each officer and director and by each person who owns 5% or more of the outstanding common stock have been excluded in that such persons may be deemed to be affiliates. This determination of affiliate status is not necessarily a conclusive determination for other purposes. As of January 31, 2015, there were 52,350,363 shares of the registrant's common stock outstanding.
DOCUMENTS INCORPORATED BY REFERENCE
Portions of the registrant's Proxy Statement for the registrant's fiscal 2015 Annual Meeting of Stockholders are incorporated by reference into Part III of the Form 10-K to the extent stated herein. The Proxy Statement or an amended report on Form 10-K will be filed within 120 days of the registrant's fiscal year ended December 31, 2014. Except with respect to information specifically incorporated by reference in this Form 10-K, the Proxy Statement is not deemed to be filed as part herein.
Table of Contents
TABLE OF CONTENTS
| | | | | | |
PART I | | | | |
Item 1. | | Business | | | 3 | |
Item 1A. | | Risk Factors | | | 15 | |
Item 1B. | | Unresolved Staff Comments | | | 34 | |
Item 2. | | Properties | | | 34 | |
Item 3. | | Legal Proceedings | | | 34 | |
Item 4. | | Mine Safety Disclosures | | | 35 | |
PART II
|
|
|
|
|
Item 5. | | Market for Registrant's Common Equity, Related Stockholder Matters and Issuer Purchases of Equity Securities | | | 36 | |
Item 6. | | Selected Financial Data | | | 39 | |
Item 7. | | Management's Discussion and Analysis of Financial Condition and Results of Operations | | | 40 | |
Item 7A. | | Quantitative and Qualitative Disclosures About Market Risk | | | 73 | |
Item 8. | | Financial Statements and Supplementary Data | | | 75 | |
Item 9. | | Changes in and Disagreements with Accountants on Accounting and Financial Disclosure | | | 125 | |
Item 9A. | | Controls and Procedures | | | 125 | |
Item 9B. | | Other Information | | | 125 | |
PART III
|
|
|
|
|
Item 10. | | Directors, Executive Officers and Corporate Governance | | | 126 | |
Item 11. | | Executive Compensation | | | 126 | |
Item 12. | | Security Ownership of Certain Beneficial Owners and Management and Related Stockholder Matters | | | 126 | |
Item 13. | | Certain Relationships and Related Transactions, and Director Independence | | | 126 | |
Item 14. | | Principal Accountant Fees and Services | | | 126 | |
PART IV
|
|
|
|
|
Item 15. | | Exhibits, Financial Statement Schedules | | | 127 | |
Table of Contents
SPECIAL NOTE REGARDING FORWARD-LOOKING STATEMENTS
The following discussion and analysis of our financial condition and results of operations should be read in conjunction with our consolidated financial statements and related notes included under Item 8 of this Annual Report on Form 10-K. The following discussion contains forward-looking statements within the meaning of Section 27A of the Securities Act of 1933 as amended and Section 21E of the Securities Exchange Act of 1934 as amended. Forward-looking statements can be identified by the use of terminology such as "may," "will," "could," "should," "expect," "plan," "anticipate," "believe," "estimate," "predict," "potential," "continue," "intends," or other similar terms and the negative of such terms regarding beliefs, plans, expectations or intentions regarding the future. Forward-looking statements include, among others, statements relating to our pending acquisition by SS&C Holdings Technologies, Inc. ("SS&C"), future revenues, expenses and operating margins, product releases, the future of the investment management market and opportunities for us related thereto, future expansion, acquisition, divestment of or investment in other businesses, projections of revenues, future cost and expense levels, expected timing and amount of amortization expenses related to past acquisitions, future effective tax rates, future exchange rates, the adequacy of resources to meet future cash requirements, renewal rates, expected cash flow, capital expenditures, future financing activities, future dividends, estimates or predictions of actions by customers, suppliers, competitors or regulatory authorities, future client wins, future hiring and future product introductions and acceptance. Such forward-looking statements are based on our current plans and expectations and involve known and unknown risks and uncertainties which may cause our actual results or performance to be materially different from any results or performance expressed or implied by such forward-looking statements. Such factors include, but are not limited to the "Risk Factors" set forth in "Item 1A. Risk Factors" in this Form 10-K, as well as other risks identified from time to time in other U.S. Securities and Exchange Commission ("SEC") reports. You should not place undue reliance on our forward-looking statements, as they are not guarantees of future results, levels of activity or performance and represent our expectations only as of the date they are made.
Unless expressly stated or the context otherwise requires, the terms "we", "our", "us", the "Company" and "Advent" refer to Advent Software, Inc. and its subsidiaries.
PART I
Item 1. Business
Overview
Advent Software, Inc. was founded and incorporated in 1983 in California and reincorporated in Delaware in November 1995. We offer software products and services for automating and integrating data and work flows across the investment management organization, as well as between the investment management organization and external parties. Our products are intended to increase operational efficiency, improve the accuracy of client information and enable better decision-making. Each solution focuses on specific mission-critical functions of the investment management organization (portfolio accounting and reporting; trade order management and post-trade processing; research management; account management; and custodial reconciliation) and is tailored to meet the needs of a particular market segment of the investment management industry, as determined by size, assets under management and complexity of the investment process.
Our business derives revenues from the development, marketing and sale of software products, Software-as-a-Service ("SaaS") hosting services, data interfaces and related maintenance and services that automate, integrate and support certain mission-critical functions of investment management organizations around the world. We completed the sale of our MicroEdge subsidiary in October 2009. The results of MicroEdge have been reclassified as a discontinued operation for all periods presented. Unless otherwise noted, discussion in this document pertains to our continuing operations.
3
Table of Contents
Our principal executive offices are located at 600 Townsend Street, San Francisco, California 94103, and our telephone number is (415) 543-7696. Our internet address iswww.advent.com. On our Investor Relations web site, which is accessible throughwww.advent.com, we post the following filings as soon as reasonably practicable after they are electronically filed with or furnished to the U.S. Securities and Exchange Commission ("SEC"): our annual reports on Form 10-K, our quarterly reports on Form 10-Q, our current reports on Form 8-K and any amendments to those reports. All such filings on our Investor Relations web site are available free of charge. Information contained or referenced on our website is not incorporated by reference in and does not form a part of this Annual Report on Form 10-K. The SEC maintains an internet site atwww.sec.gov that contains reports, proxy and information statements, and other information regarding issuers that file electronically with the SEC. The public may also read and copy any materials we file with the SEC at the SEC's Public Reference Room at 100 F Street, NE, Washington DC, 20549. The public may obtain information on the operation of the Public Reference Room by calling the SEC at 1-800-SEC-0330.
Advent's common stock (ticker symbol: ADVS) has traded on the NASDAQ Stock Market since its initial public offering on November 15, 1995. Our fiscal year ends on December 31st.
Recent Developments
On February 2, 2015, we entered into an Agreement and Plan of Merger (the "Merger Agreement") with SS&C Technologies Holdings, Inc. ("Parent" or "SS&C") and Arbor Acquisition Company, Inc., a wholly owned subsidiary of Parent ("Merger Sub"), pursuant to which, subject to the satisfaction or waiver of certain conditions therein, Merger Sub will merge with and into Advent. As a result of the merger, Merger Sub will cease to exist, and Advent will survive as a wholly owned subsidiary of SS&C.
Upon the consummation of the merger, subject to the terms of the Merger Agreement, which has been unanimously approved by our Board of Directors, each share of Advent common stock outstanding immediately prior to the effective time of the merger (the "Effective Time"), subject to certain exceptions, will be converted into the right to receive $44.25 in cash, without interest.
The completion of the merger is subject to customary conditions, including without limitation, approval of the merger by our stockholders and expiration or termination of the applicable waiting periods under the Hart-Scott-Rodino Antitrust Improvements Act of 1976, as amended.
The Merger Agreement contains certain termination rights for both Advent and Parent, and provides that, upon termination of the Merger Agreement under specified circumstances, including, but not limited to, if we accept a superior acquisition proposal, we may be required to pay Parent a termination fee of $80.0 million. We may also be required to reimburse Parent for up to $12.5 million of its out-of-pocket expenses in connection with the transaction under certain circumstances.
A description of the Merger Agreement is contained in our Current Report on Form 8-K filed with the SEC on February 3, 2015, and a copy of the Merger Agreement is attached thereto as Exhibit 2.1. See also Note 17, "Subsequent Events" to our consolidated financial statement in Item 8 of this Annual Report on Form 10-K for further information.
Clients
Advent's clients are investment management and advisory firms and service providers that manage, advise and perform recordkeeping functions on financial assets. These firms have clear needs that translate into demand for Advent solutions: portfolio accounting and reporting; trade order management and post-trade processing; research management; account management; and custodial reconciliation. Examples of these institutions include global and U.S.-based asset managers, wealth managers, registered investment advisors, prime brokers, fund administrators, hedge funds, family
4
Table of Contents
offices, broker dealers, foundations, pension funds, endowments, and funds of funds. We have a diverse client base ranging from small firms to some of the largest institutional investment firms in the world. In fiscal 2014, 2013 and 2012, no single customer accounted for more than 10% of our total net revenues. Geographically, the U.S. continues to represent our primary market, with international sales representing 19%, 18% and 17% of total net revenues in fiscal 2014, 2013 and 2012, respectively.
Market Trends
The demand for our products and services comes from: new firm formation, new business lines and combinations of business lines created in existing client firms, replacement of legacy and competitor systems, and expansion of our existing client relationships. Supporting these demand drivers are the underlying trends we see in the industry including:
- •
- Globalization and growth of wealth. Many firms we work with have chosen to grow by investing overseas, or by taking on clients from different countries as developed nations and developing nations build wealth that needs to be managed professionally. Global expansion creates operational, regulatory and cultural challenges that we are uniquely positioned to support given our domain expertise, the scale of our client base, and our global reach.
- •
- Increased demands for transparency, efficiency and risk management. Firms continue to focus on operational risk, resulting from discoveries of fraud and mismanagement during the 2008-2012 U.S. financial crisis and concerns regarding transparency and counterparty exposure. This continued focus leads investment management firms to "shadow" their custodian's books to ensure their accuracy, drives investor demand for institutional-grade operations, and has led many firms to automate the documentation of their investment process through research management software. On the wealth management and advisory sides of our business, we see this change manifest in the evolving relationship between the end client and a firm, with investors demanding greater transparency and a more customized client experience. Wealth managers will need to become familiar with their clients' preferences for account access and communication and cater to them, whether that means client portals, mobile devices or other digital platforms, and Advent offers tools to facilitate that. Finally, institutional and individual investors alike, faced with an increasingly competitive low-fee, automated options, are pushing investment managers across the spectrum for greater efficiencies and lower fees.
- •
- Regulatory changes. Our clients must comply with rules, regulations, directives, and standards from governmental and self-regulating organizations, among others. Well after the passage of Dodd-Frank, EMIR, AIFMD, FATCA, UCITS V and a host of more localized reforms, many of the rules are still being defined and sorted out. In an international survey of wealth management operations managers commissioned by Advent, fulfilling current and anticipated compliance and regulatory requirements was deemed the biggest operations and technology challenge wealth managers currently face. We develop, configure, and market products and services to assist customers in meeting those requirements. We expect these types of changes to increase the number of firms in our addressable market and motivate more firms to develop their systems infrastructure and research management processes to mitigate exposure.
- •
- Technological paradigm shift. Our clients experience increased demand for software delivery options including cloud-based services, social collaboration, and information access through mobile devices. Cloud solutions allow firms to use a broader range of capabilities without incurring implementation or maintenance costs, and software can be upgraded with virtually no disruption to cloud-based solutions. Accessibility and demands for collaboration (or "social") is also a key driver of cloud adoption. For an increasingly mobile profession, anytime, anywhere access to portfolio and client data as well as the ability to communicate and collaborate within
5
Table of Contents
In this climate, our clients need to operate more efficiently, enhance investor confidence and ensure compliance. As a result, our clients leverage Advent to automate and integrate their mission-critical and labor-intensive functions, including:
- •
- Portfolio accounting, performance measurement and report generation;
- •
- Investment decision support;
- •
- Trade order management and compliance;
- •
- Client relationship management;
- •
- Straight-through-processing that includes connectivity and data integration;
- •
- Margin and finance management; and
- •
- Research management.
Seasonality
We experience seasonality in our bookings. We believe that this seasonality in our bookings results from customer budgeting cycles and expect this seasonality to continue in the future. We typically have our strongest bookings in the fourth quarter of the year, followed by lower bookings in the first quarter of the following year; however, this was not the case in 2013.
We also experience seasonality in our operating cash flows and expect this seasonality to continue in the future. We experience lower operating cash flows in the first quarter of the year as we make payments on our year-end liabilities including payables, bonuses, commissions and payroll taxes. Conversely, we experience relatively stronger operating cash flows in the fourth quarter of the year because we traditionally experience higher licensing and renewal activity in that quarter which we bill typically annually in advance. This results in higher collections activity during the fourth quarter.
Strategy
Purpose
We exist to help our clients, employees and investors thrive and transform the investment management industry.
Today, we are focused on eliminating the borders between systems, information and people. To realize our purpose, we must be the best at what our clients expect from us. We expect to maintain and extend our leadership by innovating the design and delivery of our solutions to make them easier to implement, adopt and own, and by being attentive and responsive to our clients' varied lines of business, user profiles, geographies and size.
6
Table of Contents
Customer Focus
At December 31, 2014, we served over 4,300 customers in more than 50 countries. The needs of our customers, and the investment management industry as a whole, continue to evolve. We are committed to making the required investments in product development, client services and support to continue delivering mission-critical solutions to our customers as their needs change. We believe our strategy and customer focus are driving increasing market acceptance for our products.
Business Model
We offer a wide variety of products and services to a large number of financially sophisticated customers. Under our term license model which we instituted in 2005, customers purchase a license to use our software for a fixed period of time and we recognize the license revenue ratably over the length of the contract. We believe that a term license business model ultimately results in a long-term customer relationship and provides more predictable revenue streams.
We continue to focus on growing our recurring revenues. Effective with the first quarter of 2011, we changed our presentation of the components of net revenues to recurring and non-recurring to reflect the nature of our sources of revenue. Recurring revenues are comprised of term license, maintenance from perpetual license arrangements, and other recurring revenues. Non-recurring revenues are comprised of professional services and other revenues which include perpetual license fees.
Total recurring revenues have become our predominant source of revenues, comprising 92%, 91% and 90%, of total net revenues in 2014, 2013 and 2012, respectively, and we expect to continue to derive a significant portion of our revenues from new business, client renewals of term license, perpetual maintenance and other recurring revenue contracts. These recurring revenue sources provide us with an increased ability to make strategic decisions to invest in our business while remaining confident that our operating results will be reasonably predictable.
We are organized and operate in a single segment. See Note 15, "Segment, Significant Customer and Geographic Information" to our consolidated financial Statements in Item 8 of this Annual Report on Form 10-K.
Products and Services
Advent products are intended to automate those mission-critical functions in the investment management process that will increase operational efficiency, improve client relationships, facilitate timely regulatory compliance, enhance client reporting and enable better decision-making. For the most part, pricing is determined by the products purchased, the size of the implementation, and the customer's assets under management.
These solutions are comprised of various combinations of Advent software products delivered on premise and, more recently, also through the cloud in a Software-as-a-Service (SaaS) model, data integration tools, and professional services. Our product revenues are derived principally from products delivered on premise. Our SaaS-based product offerings currently include Advent OnDemand, which includes our product offerings delivered over the web and hosted either by Advent or by a third party, and Black Diamond, which is web-based and hosted by Advent. Additionally, in late 2013, we introduced Advent Direct, a new cloud platform on which we deliver new, workflow-based solutions tailored to different users within a firm. Advent Direct solutions complement and augment the value of our traditional products, and the first solution, Advent Direct Investment Management, was delivered to a limited number of firms through our charter client program (on a beta release program) in 2014.
- •
- Geneva® is a global portfolio management platform designed to meet the real-time needs of global asset managers, hedge funds, prime brokers, fund administrators, private equity firms and
7
Table of Contents
family offices worldwide. Geneva integrates all phases of the investment management process—portfolio management, accounting and reporting, client investor management, reconciliation and light trade capture and risk capabilities. Its "main memory" database offers more accurate and flexible reporting, and eliminates batch processing and time-consuming error corrections. Geneva enables firms to grow into new markets, deliver greater operational efficiencies, enhance investor service, process high trade volumes across multiple securities, improve compliance and security, and lower operating costs and risks.
- •
- Advent Portfolio Exchange® (APX) is a comprehensive portfolio management solution for asset managers and wealth managers worldwide which integrates the front-office functions of prospecting, marketing, customer relationship management and internal business management with the back-office operations of portfolio accounting, performance measurement and reporting. It allows firms to manage both high-net-worth and institutional clients through a comprehensive range of capabilities, including customized reporting, automated report packaging, and performance analytics. APX provides easy access to critical data and enables firms to grow their business, retain assets and deliver superior client service. APX can be deployed locally as well as in the cloud.
- •
- Black Diamond® offers independent advisors and wealth managers an innovative and dynamic portfolio management and reporting solution delivered through an easy-to-use, feature-rich web-based application. As a cloud-based product offering, advisors can access Black Diamond's customizable portfolio management and reporting online from anywhere, anytime without the need to maintain costly technology infrastructures. Black Diamond also provides outsourced daily reconciliation and data management services so firms can focus their efforts on servicing clients and growing their business rather than managing complex back office functions.
- •
- Axys® is a turnkey portfolio management and reporting system for small to mid-size investment management organizations. Axys provides investment professionals with broad portfolio accounting functionality on a variety of investment instruments, including equities, fixed income, mutual funds and cash. By using Axys, clients have a timely decision support tool with immediate access to portfolio holdings, asset allocation, realized and unrealized gains and losses, actual and projected income and other valuable data including sophisticated performance measurement and flexible reporting.
- •
- Moxy® automates and streamlines the portfolio construction, trading and order management process for the investment management community. Moxy also provides internet-ready electronic order routing based on the industry standard FIX messaging protocol so that users can route trades electronically to any FIX-compliant broker, crossing networks, and various dark pools of liquidity that supports the internet or other TCP/IP connections. Trades are executed, processed, settled and accounted for without manual intervention. Through its streamlined integration with Advent's industry-leading portfolio management platforms, Moxy enables true internal and external straight-through-processing through various post trade interfaces and brings together mission-critical functions across investment management organizations.
- •
- Advent Rules Manager® is a tightly integrated solution that meets investment management firms' increasingly complex trading compliance and portfolio monitoring requirements. Advent Rules Manager is a rules-based system that enables firms to define their trading and portfolio policies easily and accurately, and automates their control and review. Firms can efficiently manage portfolios, trading, compliance workflow, and safeguard their client commitments. Advent Rules Manager helps firms to record, test and compare their compliance practices against their policies, to help them demonstrate that their compliance programs are managed proactively.
- •
- Advent Revenue Center® provides asset managers with a solution that automates complex billing processes, from fee creation to accounts-receivable management. This solution integrates
8
Table of Contents
9
Table of Contents
Data and Data Integration Services
- •
- Advent Custodial Data® (ACD) enables firms to retrieve and reconcile accounts efficiently through a single, standard, Advent-supported solution. ACD uses hundreds of direct-feed interfaces to consolidate account level information from more than 1,000 custodial sources. The data can then be used for reconciliation and posting into Advent's portfolio management, accounting and reporting systems, APX, Geneva and Axys. With efficient reconciliation, firms can maintain accurate cash and securities balances, reduce settlement risk, produce client statements earlier and ensure compliant trading. In addition, the flexibility of ACD makes it easy to add new accounts and/or to establish relationships with new custodians, allowing firms to grow their business more cost effectively.
- •
- Advent Corporate Actions® (ACA) is a straight-through-processing service that delivers customized, position-level corporate action reports for a broad range of action and security types, along with market effective transactions for mandatory U.S. and Canadian equity and ADR events, including tax compliant details. Using ACA, firms can track actions from announcement through effective date, receive alerts containing revisions and processing tips and gain access to a dedicated team of corporate action specialists who assist advisory staff with processing details and the interpretation and confirmation of complex tax opinions.
- •
- Advent® Index Data is our subscription-based and transaction-based service and allows clients to download pricing, corporate actions and other data from third party vendors such as Financial Times/Interactive Data ("FTID").
Maintenance and Support Services
Term license customers receive support and maintenance services as part of the term license offering. Existing and new perpetual license customers purchase maintenance and support services, which entitle them to technical support and product upgrades as they become available. We frequently upgrade and enhance our products to respond to changing market needs, evolving regulatory requirements and new technologies.
Professional Services
Professional services consist of consulting, project management, implementation and integration services, custom report writing, and training. Many of Advent's clients purchase professional services from us to support their implementations, assist in the conversion of their historical data and provide ongoing training and education. Professional services may be required for as little as a few days or up to several months for large implementations. We believe that these services facilitate a client's early success with our products, strengthen the client relationship and generate valuable feedback for our product development group.
Alliance Program
Our Alliance Program is designed to benefit our clients and participants in the program. The program provides a means by which participants can develop, promote, and sell their products, services, and solutions in conjunction with our solutions. Advent's Alliance Program was created to further extend our product and service offerings by integrating, with, and offering, others' complementary services and products as well as making our offerings available through others.
Sales and Marketing
Our sales group includes a direct sales organization (comprised of both field sales and tele-sales representatives) as well as product management groups, which are responsible for assessing market
10
Table of Contents
opportunities and collaborating with our solutions development organization on product planning and management. We have sales and support offices throughout the world, including San Francisco, New York, Boston, Jacksonville, Toronto, London, Oslo, Copenhagen, Stockholm, Amsterdam, Zurich, Dubai, Hong Kong and Singapore.
Our marketing organization is responsible for providing support to the Company through lead generation activities, brand awareness and support, the creation of sales tools and marketing materials, and the execution of marketing events, such as conferences and seminars.
Product Development
In fiscal 2014, 2013 and 2012, our product development expenses were $69.5 million, $69.7 million and $67.0 million, respectively. We also capitalized $7.2 million, $3.7 million and $2.2 million of software development costs in 2014, 2013 and 2012, respectively. Our product development organization builds product enhancements and new products, incorporates new technologies into existing products and sustains the quality of our current products. Our product development activities include the identification and validation of product specifications as well as engineering, quality assurance and documentation.
Our new products and product upgrades require varying degrees of development time, depending upon the complexity of the accounting requirements and securities regulations which they are intended to address, as well as the number and type of features incorporated. To date, we have primarily relied upon internal development and, to a lesser extent, acquisitions for our products. We have in the past acquired, and may in the future acquire, additional technologies or products from third parties. For example, during 2011, we acquired Syncova, a UK-based company that provides margin management and financing software to hedge funds and prime brokers, and Black Diamond Performance Reporting, a provider of web-based, outsourced portfolio management and reporting platforms for independent advisors. We intend to continue to support industry standard operating environments, architectures and network protocols.
Deferred Revenues and Backlog
Total deferred revenue includes term license, maintenance, outsourcing, data services, professional services and deferred perpetual license. Deferred term license revenue is generally recognized over the contract length. Deferred maintenance revenue is generally recognized over the service period, which is typically twelve months. Deferred professional services revenue is either recognized over the period the specific services are rendered, or over the related contract period once completed, when sold in conjunction with a multi-year term license. Deferred perpetual license revenue is recognized when a contingency, such as a future product deliverable committed in the contract, is removed.
We generally recognize revenue from term licenses ratably over the period of the contract term which varies from one to five years but is typically three years. For these term contracts, we invoice the customer annually in advance. As a result, the first year's contract value is included in deferred revenue while subsequent years of the contracted value are not (unless the subsequent years are prepaid by the client, which is typically not the case). During the subsequent years, annual term billing results in an increase in deferred revenues at the commencement of each annual billing period. Total deferred revenues were $204.1 million and $193.9 million at December 31, 2014 and 2013, respectively. The increase during 2014 is primarily due to the increase in deferred revenues from term licenses and to a lesser degree ongoing term implementations.
We define backlog as the value of multi-year term license, outsourcing and data service contracts which contain a binding commitment for the full contract term, less any amounts from those contracts already invoiced. We exclude annual contracts from the backlog calculation since they contain annual renewal options (for example, annual term licenses, annual maintenance or data reconciliation contracts). Our total backlog was approximately $157.4 million and $165.4 million as of December 31, 2014 and 2013, respectively.
11
Table of Contents
For additional information regarding factors that affect the timing of the recognition of software license revenue, see "Management's Discussion and Analysis of Financial Condition and Results of Operations—Critical Accounting Policies and Estimates—Revenue Recognition and Deferred Revenues."
Competition
The market for investment management software is characterized by the relative size of the organizations that manage and advise on investment portfolios. The market is competitive and highly fragmented. It is subject to rapid change and is sensitive to new product introductions and marketing efforts by industry participants. We face competition from providers of software and related services as well as providers of outsourced services.
Competitive firms can vary in size and scope of offering, platforms supported, and, in general, tend to be more narrowly focused by segment or workflow while Advent, in contrast, offers solutions and services that meet a broad and diverse spectrum of investment management firms and their needs. Our competitors include Addepar, Backstop, BlackRock Solutions, Broadridge Financial Solutions, Charles River Development, Code Red, DST International, the Eagle Investment Systems subsidiary of Bank of New York/Mellon Financial Corporation, Enfusion, Envestnet, Eze Software Group, FactSet Research Systems, FiTek, FT Interactive Data, INDATA, the LatentZero division of Fidessa group plc, Linedata Services, the Macgregor division of Investment Technology Group, MackeyRMS, Markit, Morningstar, Multifonds, Orion, Schwab Performance Technologies, SEI Investments Company, SimCorp A/S, SS&C Technologies Inc., State Street Corporation, SunGard, and TKS Solutions, among others. An additional source of competition is from proprietary systems used by our existing and potential clients, some of whom develop their own software for their particular needs and therefore may be reluctant to license software products offered by third party vendors such as Advent.
Some of our largest competitors have longer operating histories and greater financial, technical, sales and marketing resources, due in part to the on-going consolidation in our markets. Since 2005, many of our competitors have been acquired by larger enterprises, and it is possible that even larger competitors will be created through additional acquisitions of companies and technologies.
We believe that Advent competes effectively in terms of the most predominant competitive differentiators, which include product performance and functionality, ease of use, scalability, ability to integrate external data sources, product and company reputation, client service and price.
Intellectual Property and Other Proprietary Rights
Our success depends significantly upon our proprietary technology. We currently rely on a combination of copyright, trademark, patent and trade secret law, as well as confidentiality procedures and contractual provisions to protect our proprietary rights. We have registered trademarks and copyrights for many of our products and services and will continue to evaluate the registration of additional trademarks and copyrights as appropriate. We generally enter into confidentiality agreements with our employees, customers, resellers, vendors and others. We seek to protect our software, documentation and other written materials under trade secret and copyright laws. We also have six issued patents. While we do not believe we are dependent on any one of our intellectual property rights, we do rely on the combination of intellectual property rights and other measures to protect our proprietary rights. Despite these efforts, existing intellectual property laws may afford only limited protection. In addition, it may be possible for unauthorized third parties to copy certain portions of our products or to reverse engineer or otherwise obtain and use our proprietary information. In addition, we cannot be certain that others will not develop or acquire substantially equivalent or superseding proprietary technology, equivalent or better products will not be marketed in competition with our products, or others may not design around any patent that we have or that may be issued to us or
12
Table of Contents
other intellectual property rights of ours, thereby substantially reducing the value of our proprietary rights. We cannot be sure that we will develop proprietary products or technologies that are patentable, that any patent, if issued, would provide us with any competitive advantages or would not be challenged by third parties, or that the patents of others will not adversely affect our ability to do business. Despite our efforts to protect our proprietary rights, unauthorized parties may attempt to copy aspects of our products or to obtain and use information that we regard as proprietary. In addition, the laws of some countries do not protect proprietary rights to as great an extent as do the laws of the United States. Litigation may be necessary to protect our proprietary technology which may be time-consuming and expensive, with no assurance of success. As a result, we cannot be sure that our means of protecting our proprietary rights will be adequate.
Employees
As of December 31, 2014, we had 1,209 employees, including approximately 457 in client services and support, 178 in sales and marketing, 386 in product development and 188 in general and administration. Of these employees, 906 were located in the United States and 303 were based outside the United States. We endeavor to maintain competitive compensation, benefits, equity participation and work environment policies in order to attract and retain qualified personnel. None of our employees are subject to a union collective bargaining agreement. We have not experienced any work stoppages and we believe our employee relations are good.
Executive Officers of Registrant
The following sets forth certain information regarding the executive officers of the Company as of January 31, 2015:
| | | | |
Name | | Age | | Position |
|---|
David Peter F. Hess Jr. | | 44 | | Chief Executive Officer, President and Director |
James S. Cox | | 43 | | Executive Vice President and Chief Financial Officer |
Todd J. Gottula | | 41 | | Executive Vice President, Global Solutions Development and Chief Technology Officer |
Chris J. Momsen | | 44 | | Executive Vice President, Global Sales and Solutions |
Anthony E. Sperling | | 46 | | Executive Vice President, Global Client Experience |
Mr. Hess joined Advent in 1994 and currently serves as Chief Executive Officer and President of Advent. Mr. Hess is responsible for defining Advent's vision, setting strategy and overseeing execution across the global business. Mr. Hess has served as Chief Executive Officer of Advent since June 2012, and as President of Advent since December 2008. From February 2007 to December 2008, Mr. Hess served as Executive Vice President and General Manager of Advent's Investment Management Group. From May 2004 to February 2007, Mr. Hess served as Executive Vice President and General Manager of our Global Accounts group. In this role, Mr. Hess had global responsibility for strategy, product marketing, sales, services, and support of Advent solutions for the asset management industry's largest firms. Mr. Hess has held a variety of other positions in the company including Vice President of Sales and Vice President of Marketing. Mr. Hess holds a B.A. from Princeton University.
Mr. Cox joined Advent in June 2006 and currently serves as Executive Vice President and Chief Financial Officer. Mr. Cox is responsible for the oversight of the Company's financial functions. Mr. Cox has served as Executive Vice President and Chief Financial Officer since November 2012. From September 2009 to November 2012, Mr. Cox served as Senior Vice President and Chief Financial Officer of Advent. From July 2008 to September 2009, Mr. Cox served as Vice President and Principal Accounting Officer, and served as Corporate Controller from June 2006 to July 2008. Prior to joining Advent, Mr. Cox served as Assistant Controller of UTStarcom from 2004 to 2006. From 1994 to 2004,
13
Table of Contents
Mr. Cox held various positions at PricewaterhouseCoopers, LLP. Mr. Cox holds a B.A. in Economics from Ohio University.
Mr. Gottula joined Advent in January 2002 and currently serves as Executive Vice President and Chief Technology Officer of Global Solutions Development. Mr. Gottula is responsible for global solutions delivery and the Company's information technology infrastructure. From 2007 to 2012, Mr. Gottula served as Co-Head of Advent's Global Accounts, and beginning in 2011 the Tamale group, where he held global responsibility for product design, delivery, implementation and support of Advent's solutions for the alternative asset management industry, including the Geneva platform. From 2002 to 2007, Mr. Gottula held a variety of other positions in the Company including leadership roles in product development and client services. Prior to joining Advent, from 1997 to 2001, Mr. Gottula held development and services leadership positions with TenFold Corporation, an enterprise solution and technology provider, and from 1995 to 1997 Mr. Gottula held process engineering and design positions at Ultramar Diamond Shamrock (now Valero) Refining and Technology. Mr. Gottula holds a B.S. in Chemical Engineering from the California Institute of Technology.
Mr. Momsen joined Advent in September 1997 and currently serves as Executive Vice President of Global Sales and Solutions. Mr. Momsen is responsible the Company's global solutions strategy and sales efforts. From 2007 to 2012, Mr. Momsen served as Co-Head of Advent's Global Accounts, and beginning in 2011 the Tamale group, where he had global responsibility for strategy, product marketing and sales of Advent's solutions for the alternative asset management industry, including the Geneva platform. From 2005 to 2007, Mr. Momsen served as Vice President of Sales, Global Accounts and directed global strategy and sales and marketing for Advent's Tamale research management solution. Mr. Momsen has held a variety of other positions in the Company including Senior Sales Executive and Marketing Manager. Prior to joining Advent, from 1996 to 1997, Mr. Momsen held positions at Wells Fargo in its Real Estate Capital Markets division and in 1995 as an options trader on the floor of the Pacific Exchange. Mr. Momsen holds a B.A. in History with a Business Minor from the University of California at Los Angeles, and an MBA from New York University.
Mr. Sperling joined Advent in June 1993 and currently serves as Executive Vice President of Global Client Experience. Mr. Sperling is responsible for ensuring client success through our global services, support, account management and renewals organization. From 2009 to 2012, Mr. Sperling served as Senior Vice President, Co-Head and General Manager of Advent's Asset Management Group, where he was responsible for strategy, product marketing, sales, services, and support of Advent's solutions for the asset management industry. Mr. Sperling has held a variety of other positions in the Company including Senior Vice President of Services and Vice President of Client Sales, and Director of Product Marketing. He has also had sales and services responsibilities in Advent's European operations. Prior to joining Advent, from 1990 to 1993, Mr. Sperling held positions at Lawrence Johnson & Associates and Harris Bretall Sullivan & Smith. Mr. Sperling holds a B.S. in Business Administration from the University of Wisconsin at River Falls.
14
Table of Contents
Item 1A. Risk Factors
Investors should carefully consider the risks described below before making an investment decision. The trading price of our common stock could decline due to any of, but are not limited to, these risks. In assessing these risks, investors should also refer to the other information contained or incorporated by reference in this Annual Report on Form 10-K filed with the SEC, including our consolidated financial statements and related notes thereto.
The pendency of our agreement to be acquired by SS&C or our failure to complete the merger could have an adverse effect on our business.
Completion of the Merger is subject to the satisfaction of various conditions, including the receipt of approvals from our stockholders and from government or regulatory agencies. There is no assurance that all of the various conditions will be satisfied, or that the Merger will be completed on the proposed terms, within the expected timeframe, or at all.
The Merger gives rise to inherent risks that include:
- •
- The inability to complete the Merger due to the failure to obtain stockholder approval or failure to satisfy the other conditions to the completion of the Merger, including receipt of the required regulatory approval;
- •
- Pending and potential future stockholder litigation that could prevent or delay the Merger or otherwise negatively impact our business and operations;
- •
- If the Merger is not completed, the price of our common stock will change to the extent that the current market price of our stock reflects an assumption that the Merger will be completed;
- •
- The amount of cash to be paid under the agreement governing the Merger is fixed and will not be adjusted for changes in our business, assets, liabilities, prospects, outlook, financial condition or results of operations, including any potential long-term value of the successful execution of our current strategy as an independent company or in the event of any change in the market price of, analyst estimates of, or projections relating to, our common stock;
- •
- Legal or regulatory proceedings, including regulatory approvals from various domestic and foreign governmental entities (including any conditions, limitations or restrictions placed on these approvals) and the risk that one or more governmental entities may delay or deny approval, or other matters that affect the timing or ability to complete the transaction as contemplated;
- •
- The ability of SS&C Technologies Holdings, Inc. to obtain the necessary funds to complete the Merger;
- •
- The possibility of disruption to our business, including increased costs and diversion of management time and resources;
- •
- Difficulties maintaining business and operational relationships, including relationships with customers, suppliers, and other business partners;
- •
- The possibility of slowing new license sales and renewals by clients;
- •
- The inability to attract and retain key personnel pending consummation of the Merger;
- •
- The inability to pursue alternative business opportunities, including acquisitions, or make changes to our business pending the completion of the Merger, and other restrictions on our ability to conduct our business, including restrictions on our ability to declare dividends;
15
Table of Contents
- •
- The requirement to pay a termination fee of $80 million or reimburse expenses of up to $12.5 million if the agreement governing the Merger is terminated under certain circumstances;
- •
- The fact that under the terms of the Merger Agreement, we are unable to solicit other acquisitions proposals during the pendency of the Merger;
- •
- The amount of the costs, fees, expenses and charges related to the Merger Agreement or the merger;
- •
- Developments beyond our control including, but not limited to, changes in domestic or global economic conditions that may affect the timing or success of the Merger; and
- •
- The risk that if the Merger is not completed, the market price of our common stock could decline, investor confidence could decline, shareholder litigation could be brought against us, relationships with customers, suppliers and other business partners may be adversely impacted, we may be unable to retain key personnel, and profitability may be adversely impacted due to costs incurred in connection with the proposed Merger.
If our existing customers do not renew their term license, other recurring or perpetual maintenance contracts, our business will suffer.
Total recurring revenues, which we define as term license, other recurring revenue, maintenance from perpetual arrangements and Asset Under Administration (AUA) fees for certain perpetual arrangements, represented 92%, 91% and 90% of total net revenues during 2014, 2013 and 2012, respectively. We expect to continue to derive a significant portion of our revenue from our clients' renewal of term license, other recurring and perpetual maintenance contracts and such renewals are critical to our future success, although we expect revenues from perpetual maintenance arrangements to continue their downward trend. Some factors that may affect the renewal rate of our contracts include:
- •
- The impact of the economic environment and market volatility on our clients and prospects;
- •
- The impact of customers consolidating or going out of business;
- •
- The price, performance and functionality of our solutions;
- •
- The availability, price, performance and functionality of competing products and services;
- •
- The effectiveness of our maintenance and support services;
- •
- The legacy nature of our perpetual maintenance revenues;
- •
- Our ability to develop complementary products and services;
- •
- Our ability to offer the diversity of business process outsourcing services demanded by our clients and prospects; and
- •
- Potential client reaction to the pending acquisition by SS&C.
We have experience with renewals of our term license contracts only since approximately 2008 and we have even less experience with renewals of certain other recurring contracts, such as our SaaS-based offerings, Advent OnDemand and Black Diamond. Our customers have no obligation to renew their term license or other recurring contracts and given the relatively limited number of years in which we have experience renewing term license and other recurring contracts and fluctuations in term license renewal rates, it is difficult to predict expected renewal rates. Additionally, we cannot predict whether the renewals will be less advantageous to us than the original term or other recurring contract. For example, the renewal periods for our term license contracts are typically shorter than our original term license contract and customers may request a reduction in the number of users or products licensed,
16
Table of Contents
resulting in lower annual term license fees. Further, customers may elect to not renew their term license or other recurring contracts at all. We may incur significantly more costs in securing our term license or other recurring contract renewals than we incur for our perpetual maintenance renewals. If our term license or other recurring contract customers renew under terms less favorable to us or choose not to renew their contracts, or if it costs significantly more to secure a renewal for us, our operating results may be harmed.
Most of our base of perpetual license customers have historically renewed their annual maintenance although our customers have no obligation to renew such maintenance after the first year of their license agreements. Our perpetual license maintenance revenues have been trending downward and decreased 2%, 2% and 5% during fiscal 2014, 2013 and 2012, respectively. In addition, market downturns, such as the downturn beginning in the fall of 2008 and subsequent market fluctuations, and other factors have caused, and may in the future cause, some clients not to renew their maintenance; reduce their level of maintenance; not renew their term license contracts; or renew such term licenses for fewer products or users, all of which adversely affects our renewal rates and revenue from these customers. Our renewal rates are based on cash collections and are disclosed one quarter in arrears. Our reported quarterly renewal rate for perpetual maintenance and term license renewals may fluctuate. Decreases in renewal rates reflect reduced maintenance expenditures, reduced term license renewals, customer attrition, and reductions in products licensed or number of users by clients, as well as from slower payments received from renewal clients.
Our sales cycle is long and we have limited ability to forecast the timing and amount of specific sales and the timing of specific implementations.
The licensing of our software products and services often requires prospective customers to provide significant executive-level sponsorship and to make major systems architecture decisions. As a result, we must generally engage in relatively lengthy sales and contracting efforts. Sales transactions may therefore be delayed during the customer decision process because we must provide a significant level of education to prospective customers regarding the use and benefit of our products. Our business and prospects are subject to uncertainties in the financial markets that can cause customers to remain cautious about capital and information technology expenditures, particularly in uncertain economic environments, or to decrease their information technology budgets as an expense reduction measure. The sales cycle associated with the purchase of our solutions is typically between two and twelve months depending upon the size of the client, and is subject to a number of significant risks that have impacted our sales and over which we have little or no control, including broader financial market volatility, adverse economic conditions, customers' budgeting constraints, internal selection procedures, competitive products, and changes in customer personnel, among others.
As a result of a lengthy and unpredictable sales cycle, we have limited ability to forecast the timing and amount of specific perpetual license sales, as well as term license, Advent OnDemand and Black Diamond sales, which we report quarterly as annual contract value (ACV) bookings and also include as part of our Annualized Recurring Run Rate metric. The timing of large individual license sales is especially difficult to forecast, and we may not be successful in closing large license transactions on a timely basis or at all. Customers may postpone their purchases of our existing products or product enhancements in advance of the anticipated introduction of new products or product enhancements by us or our competitors, such as we have experienced with our recently introduced Advent Direct cloud platform that we have begun to make more broadly available to selected clients. Accordingly, our level of ACV bookings and Annualized Recurring Run Rate in any particular period is subject to significant fluctuation. For example, during 2014, 2013 and 2012, our ACV bookings decreased 4%, 5% and 3%, respectively, compared to previous periods, which is indicative of the competitive environment in which we sell, especially against competitors with more robust hosted and business process outsourcing offerings. ACV from 2012-2014 affected our Annualized Recurring Run Rate. Our Annualized
17
Table of Contents
Recurring Run Rate, which is a broader metric than ACV that includes all of our contracted recurring revenue streams at the end of a particular quarter, increased 7% as of December 31, 2014 compared to December 31, 2013.
When a customer purchases a term license together with implementation services, we do not recognize any revenue under the contract until the implementation services are substantially complete. The timing of large implementations is difficult to forecast. Customers may delay or postpone the timing of their particular projects due to the availability of resources or other customer specific priorities. If we are not able to complete an implementation project for a term license in a quarter, it will cause us to defer all of the contract revenues to a subsequent quarter. Because our expenses are relatively fixed in the near term, any shortfall from anticipated revenues could result in a significant variation in our operating results from quarter to quarter.
Our current operating results may not be reflective of our future financial performance.
We derive most of our revenue from recurring sources. During 2014, 2013 and 2012, we recognized 92%, 91% and 90%, respectively, of total net revenues from recurring sources. We generally recognize revenue from these sources ratably over the terms of these agreements, which typically range from one to three years. As a result, almost all of our revenues in any quarter are generated from contracts entered into during previous periods.
Consequently, a significant decline in new business generated in any quarter may not materially affect our results of operations in that quarter but will have an impact on our revenue growth rate in future quarters. We also experience fluctuations and seasonality in our new business generated each quarter. ACV for fiscal 2014 and 2013 decreased 4% and 5%, respectively, over the prior year; and ACV in 2012 decreased by 3% over 2011. Also, the type of recurring revenue may vary and our Annualized Recurring Run Rate, which includes all of our contracted recurring revenue streams, not just ACV, may fluctuate as well. For example, our Annualized Recurring Run Rate increased as of December 31, 2014, compared to December 31, 2013, but our September 30, 2013 Annualized Recurring Run Rate decreased 1% compared to June 30, 2013.
Additionally, a decline in renewals of term agreements, maintenance or data and other subscription contracts during a quarter will not be fully reflected in our financial performance in that quarter. For example, because we recognize revenue ratably, the non-renewal of term agreements or maintenance contracts late in a quarter may have very little impact on revenue for that quarter, but will reduce revenue in future quarters. In addition, we may be unable to adjust our costs in response to reduced revenue.
Further, because of the large percentage of revenue from recurring sources in our term license business model, our historical operating results on a U.S. generally accepted accounting principles (GAAP) basis will not necessarily be the sole or most relevant factor in predicting our future operating results. Accordingly, we report certain non-GAAP or operational information, including our quarterly bookings metrics (expressed as ACV), maintenance and term license renewal rates and Annualized Recurring Run Rate, that is intended to provide investors with certain of the information that management uses as a basis for planning and forecasting of future periods. However, we believe that undue reliance should not be placed upon non-GAAP or operating information because this information is neither standardized across companies nor subjected to the same control activities and audit procedures that produce our GAAP financial results.
Uncertain economic and financial market conditions adversely affect our business.
The market for investment management software systems has been and may in the future be negatively affected by a number of factors, including reductions in capital expenditures by customers and volatile performance of major financial markets. For example, U.S. and European economies
18
Table of Contents
showed signs of weakening during periods in 2012 due to uncertainty about the fate of the eurozone and continued weakness in U.S. labor markets. With this volatile environment and general uncertainty as a backdrop, our customers became cautious and slowed buying decisions which elongated some sales and cash collection cycles. Also, our new contract bookings were lower than expected during 2013. Market conditions have also impacted our performance in the past. For example, macroeconomic concerns in 2011 and again in 2012, such as the European default risk and U.S. debt ceiling debate, resulted in a cautious buying environment and elongated sales cycles in some instances. Also, during the fall of 2008 through 2010, we experienced some clients and prospects delaying or cancelling additional license purchases, while others went out of business, reduced personnel, or were acquired. The target clients for our products include a range of financial services organizations that manage investment portfolios. The success of many of our clients is intrinsically linked to the health of the financial markets. The demand for our solutions has been and continues to be disproportionately affected by fluctuations, disruptions, instability and downturns in the economy and financial services industry, which may cause clients and potential clients to exit the industry or delay, cancel or reduce any planned expenditures for investment management systems and software products.
In addition, the failure of existing investment firms or the slowdown in the formation of new investment firms could cause a decline in demand for our solutions. Consolidation of financial services firms and other clients will result in reduced technology expenditures or acquired customers using the acquirer's own proprietary software and services solutions or the solutions of another vendor. In some circumstances where both acquisition parties are customers of Advent, the combined entity may require fewer Advent products and services than each individually licensed prior to becoming a combined entity, thus reducing our revenue. Challenging economic conditions may also cause our customers to experience difficulty with gaining timely access to sufficient credit or our customers may become unable to pay for the products or services they have purchased, which could result in their inability to fulfill or make timely payments to us. If that were to occur, our ability to collect receivables would be negatively affected, and our reserves for doubtful accounts and write-offs of accounts receivable may increase.
We have in the past experienced a number of market downturns in the financial services industry and resulting declines in information technology spending, which has caused longer sales and contracting cycles, deferral or delay of information technology projects and generally reduced expenditures for software and related services. The severity of market downturns and volatility and uncertainty in financial markets and the financial services sector that we have experienced in the past and may experience again also makes it difficult for us to forecast operating results and may result in a material adverse effect on our revenues and results of operations in the longer term. In addition, other events such as the federal government's struggles to reach agreement on the federal budget and debt ceiling have contributed, and may in the future contribute, to macroeconomic problems that result in a cautious buying environment with elongated sales cycles with our clients.
Market downturns may cause clients not to renew their term licenses or perpetual license maintenance. Also, significant declines in market value of our clients affect their Assets Under Administration (AUA) or Assets Under Management (AUM). Consequently, we may also experience a decline in the ACV of bookings and Annualized Recurring Run Rate since the pricing of some of our products is based upon our client's AUA or AUM. Furthermore, we have some contracts for which clients pay us fees based on the greater of a negotiated annual minimum fee or a calculated fee that is determined by the client's AUA or AUM. If a client previously paid us based on the calculated fee, rather than the annual minimum fee, we would experience a decline in revenue as a result of any decline in those clients' AUA or AUM.
19
Table of Contents
We operate in a highly competitive industry.
The market for investment management software is competitive and highly fragmented, is subject to rapid change and is sensitive to new product introductions and marketing efforts by industry participants. Our largest single source of competition is from proprietary systems used by existing and potential clients, many of whom develop their own software for their particular needs and therefore may be reluctant to license software products offered by third party vendors such as Advent. We also face significant competition from other providers of software and related services as well as providers of outsourced services. Many of our competitors have longer operating histories and greater financial, technical, sales and marketing resources than we do. In addition, consolidation has occurred among some of the competitors in our markets. Competitors vary in size, scope of services offered and platforms supported. Many of our competitors have merged with each other or with other larger third parties, and it is possible that even larger companies will emerge through additional acquisitions of companies and technologies. Consolidation among our competitors may result in stronger competitors in our markets and may therefore either result in a loss of market share or harm our results of operations. In addition, we also face competition from potential new entrants into our markets that may develop innovative technologies or business models, particularly for SaaS businesses where barriers to entry are relatively lower. Furthermore, competitors may respond to weak market conditions by lowering prices, offering better contractual terms and attempting to lure away our customers and prospects with lower cost solutions. We cannot guarantee that we will be able to compete successfully against current and future competitors or that competitive pressure will not result in price reductions, reduced operating margins or loss of market share, any one of which could seriously harm our business.
We may not be successful in introducing new and enhanced products.
We also must continue to introduce new products and product enhancements. The market for our products is characterized by rapid technological change, changes in customer demands, evolving industry standards and new regulatory requirements. New products based on recent technologies or new industry standards can render existing products obsolete and unmarketable. As a result, our future success will continue to depend upon our ability to develop or acquire new products and product enhancements that address the needs of our target markets and respond to their changing standards and practices. We continue to release numerous products and product upgrades and we believe our future success depends on continuing such releases. In October 2008, we acquired Tamale Software which enabled us to offer a new product in the nascent research management field and in March 2010, Advent Norway AS acquired Goya AS to allow us to provide transfer agency-related solutions to mutual fund managers and mutual fund distributors. In February 2011, Advent Software, Inc. acquired Syncova Solutions, Ltd., a United Kingdom-based company that provides margin management and debt finance reconciliation and optimization software and in June 2011, we acquired Black Diamond, a Florida-based company that provides a web-based, outsourced portfolio management and reporting platforms for investment advisors. In late 2013, we introduced Advent Direct, our new cloud platform, on a beta release basis, and we have begun to make Advent Direct more broadly available to select clients. In order to ensure Advent Direct is successful in the mid- to long-term, we have slowed roll out to enable the addition of key new features. This slowdown means we will not be ramping up sales significantly in the first half of 2015 and now expect to ramp up sales in the first half of 2016. However, it may take longer than we expect to make Advent Direct broadly available or develop related solutions, and we cannot be certain whether new products and enhancements will meet anticipated sales projections or will be broadly accepted in the market, whether a market will develop as expected for new products and enhancements or whether we will be able to continue to introduce more products and enhancements.
We may not be successful in developing, introducing, marketing and licensing our new products or product enhancements on a timely and cost effective basis, or at all, and our new products and product enhancements may not adequately meet the requirements of the marketplace or achieve market
20
Table of Contents
acceptance. Delays in the availability of new products or enhancements or delays in client implementations or migrations may result in client dissatisfaction and delay or loss of product revenues. Additionally, existing clients have shown some reluctance to go through the process of migrating from our Axys product to our Advent Portfolio Exchange (APX) or Geneva products, or our Black Diamond platform, which has slowed the migration of our customer base to APX. In addition, clients may delay purchases in anticipation of new products or product enhancements, such as we have experienced and continue to experience with our recently introduced, but not yet broadly available, Advent Direct cloud platform. Our ability to develop new products and product enhancements is also dependent upon the products of other software and service vendors, including certain system software vendors, such as Microsoft Corporation, database vendors, Software-as-a-Service ("SaaS") providers, hosting and authentication services, and development tool vendors. If the products of such vendors have design defects or flaws, are unexpectedly delayed in their introduction, are unavailable on acceptable terms, or the vendors exit the business, our business could be seriously harmed.
Our stock price may fluctuate significantly.
Like many other companies, our stock price has been subject to wide fluctuations in recent quarters as a result of market volatility. If ACV bookings, Annualized Recurring Run Rate net revenues or earnings in any quarter or our financial guidance for future periods fail to meet the investment community's expectations, our stock price is likely to decline. Even if our ACV bookings, Annualized Recurring Run Rate, revenues or earnings meet or exceed expectations, our stock price is subject to decline in periods of high market volatility because our stock price is affected by trends in the financial services sector and by broader market trends unrelated to our performance. Unfavorable or uncertain economic and market conditions, which can be caused by many factors, including declines in economic growth, business activity or investor or business confidence; limitation on the availability or increases in the cost of credit or capital; increases in inflation, interest rates, exchange rate volatility, default rates or the price of basic commodities; corporate, political or other scandals that reduce investor confidence in capital markets; outbreaks of hostilities or other geopolitical instability; natural disasters or pandemics; or a combination of these or other factors, have adversely affected, and may in the future adversely affect, our business, profitability and stock price.
In addition, the Company initiated a quarterly dividend in April 2014 and periodically repurchases shares of its stock (each subject to authorization by its Board), but is under no obligation to continue either action or to do so in certain amounts. Also, our debt repayment and other financial obligations may limit or prevent our ability to issue dividends or repurchase shares of our common stock. In the Merger Agreement with SS&C signed on February 2, 2015, the Company is prohibited from declaring a dividend or repurchasing shares of its common stock during the pendency of the agreement. If the Company reduces the expected value of future dividends or ceases to issue dividends, which are subject to declaration by its Board of Directors, or fails to meet expectations related to future dividends or share repurchases, investors may lose confidence or we may not attract the same type of investors and our stock price may decline significantly.
We depend heavily on our Geneva®, Advent Portfolio Exchange®, Axys® and Moxy® products, and our Black Diamond platform.
We derive a majority of our net revenues from the license and maintenance revenues from our Geneva, Advent Portfolio Exchange (APX), Axys and Moxy products and our Black Diamond platform. In addition, Moxy and many of our applications, such as Partner and various data services, have been designed to provide an integrated solution with Geneva, APX and Axys. As a result, we believe that for the foreseeable future a majority of our net revenues will depend upon continued market acceptance of Geneva, APX, Axys, Moxy and Black Diamond, and related upgrades.
21
Table of Contents
Our operating results may fluctuate significantly.
Most of our revenue comes from recurring sources, which grew to 92% in 2014, from 91% in 2013 and 90% in 2012. During fiscal 2014, term license revenues comprised approximately 53% of recurring revenues as compared to approximately 52% and 49% in fiscal years 2013 and 2012, respectively.
When a customer purchases a term license together with implementation services, we do not recognize any revenue under the contract until the implementation services are substantially completed and then we recognize revenue ratably over the remaining term of the contract. If the implementation services are still in progress as of quarter-end, we will defer all of the contract revenues to a subsequent quarter. At the point professional services are substantially completed, we recognize the professional services fees earned and related expenses, and a pro-rata amount of the term license revenue based on the elapsed time from the start of the term license to the substantial completion of professional services. For example, we deferred net revenues of $1.4 million in 2014. During 2013, the revenue deferred from projects in the process of being implemented exceeded revenue recognized from completed implementations, resulting in a net deferral of $3.9 million for fiscal 2013.
In future periods, our revenues related to completed implementations may vary depending on the number of projects that reach substantial completion during the quarter. Term license revenue for the remaining contract years and the remaining deferred professional services revenue and related expenses are recognized ratably over the remaining contract term. The term license component of the deferred revenue balance will increase or decrease in the future depending on the amount of new term license bookings relative to the number of implementations that reach substantial completion in a particular quarter. Although our substantial revenue from recurring sources under our term license model provides us with longer term stability and more visibility in the short term, our quarterly net revenues and operating results may still fluctuate significantly depending on these and other factors. Our expense levels are relatively fixed in the short-term. Due to the fixed nature of these expenses, combined with the relatively high gross margin historically achieved on our products, an unanticipated decline in net revenues in any particular quarter may adversely affect our operating results.
In addition, we experience seasonality in our licensing. We believe that this seasonality results primarily from customer budgeting cycles and expect this seasonality to continue in the future. The fourth quarter of the year typically has more licensing activity; however, this was not the case in the fourth quarter of 2013, although it was higher in the fourth quarter of 2014. That can result in ACV bookings and perpetual license fee revenue being the highest in the fourth quarter, followed by lower term license bookings and perpetual license revenue in the first quarter of the following year, and which also may result in larger quarterly increases in Annualized Recurring Run Rate for the fourth quarter than in other quarters, although changes in other recurring revenue sources during a quarter may decrease or increase such run rate as well. This seasonality has been, and may be in the future, adversely affected by market downturns and uncertain economic conditions. Also, term licenses entered into during a quarter may not result in recognition of associated revenue until later quarters, as we begin recognizing revenue for such licenses when the related implementation services are substantially complete.
Because of the above factors, we believe that quarter-to-quarter comparisons of our operating results are not necessarily reliable indicators of future performance.
Our increased emphasis on delivering our products as SaaS may give rise to risks that could harm our business.
Currently, we offer our suite of products to our customers on premise and over the web on an Advent-hosted or third party-hosted basis. Advent OnDemand and Black Diamond are delivered over the web as our current SaaS product offerings. In addition, we introduced Advent Direct, our new cloud platform, on a beta release basis, and we have begun to make Advent Direct more broadly
22
Table of Contents
available to selected customers. We plan to continue to expand our current and future SaaS product offerings, including availability on mobile devices, and we believe that over time our SaaS-based product offerings will comprise an increasing share of our total recurring revenues as more customers adopt SaaS as their preferred solution. Our SaaS-based delivery models may vary from the way we price and deliver our products to customers on premise under term licenses or amongst our various SaaS offerings. The SaaS-based model will require continued investment in product development and SaaS operations, and may give rise to a number of risks, including the following:
- •
- Increased competition from current or new SaaS-based solutions providers that offer lower priced or more advanced solutions;
- •
- Concerns among our installed, term license customer base about our increased focus on SaaS-based products;
- •
- Increased price competition with current or new competitors, resulting in eroding profit margins;
- •
- Customers postponing their purchases of our existing products or product enhancements in anticipation of the introduction of new SaaS-based offerings; and
- •
- Incurring higher operating costs and customer information security risks associated with hosting and processing large quantities of customer information.
In addition, our reliance upon third-party service providers as part of our SaaS and data services may expose us to risks arising from disruptions to, or failures in, the facilities and systems operated by such third parties. We currently serve customers from third-party-operated data center facilities located in the United States and other countries. We do not control, or in some cases have limited control over, the operation of the data center facilities we use, and they are vulnerable to damage or interruption from earthquakes, floods, fires, power loss, telecommunications failures and similar events. They may also be subject to break-ins, sabotage, intentional acts of vandalism and similar misconduct, and to adverse events caused by operator error. We cannot rapidly switch to new data centers or move customers from one data center to another in the event of any adverse event. Despite precautions taken at these facilities, natural disasters, acts of terrorism or misconduct, closure of facilities without adequate notice or other unanticipated problems at these facilities could result in lengthy interruptions in our service and the loss of customer data. Our disaster recovery procedures may not be adequate and our service could be interrupted.
Any damage to, or failure of, the systems in any data center (whether operated by us or by a third-party service provider) could result in impairment of, or interruptions in, our service. Impairment of or interruptions in our service may reduce our revenues, cause clients to request credits or penalties from us, subject us to claims and litigation, cause our customers to terminate their subscriptions and adversely affect our renewal rates and our ability to attract new customers and retain existing customers. Even with respect to data centers that are operated for us by third-party service providers, we may not be able to negotiate service contracts with these service providers that will fully protect us from these risks. Our business will also be harmed if our customers and potential customers believe our service is unreliable.
Our outsourcing, data and other services are subject to risks that may harm our business.
Our clients rely on our outsourcing data and other services to meet their operational needs, including account aggregation and reconciliation. Our services involve the storage and transmission of customer and other information. The amount and type of client-related data hosted by Advent is substantially increasing, and we are providing outsourcing, data and other services in more jurisdictions outside the U.S. Furthermore, our business is becoming increasingly reliant on providing outsourcing, data and other services. This exposes the Company to many risks. Our security measures and those of third parties upon whom we rely could be breached, whether as part of cyber-attacks or other attempts
23
Table of Contents
at unauthorized access, resulting in unauthorized access to our information or our clients' information. Furthermore, due to the complexity of our services and because we also utilize third-party data and other vendors, our services and those of our third-party vendors may have previously-undetected errors or defects, service disruptions, delays, or incomplete or incorrect data that could result in unanticipated downtime for our customers, misrouted or unauthorized access to data, failure to meet service levels and service disruptions. Such potential errors, defects, delays, disruptions, performance problems and security breaches may damage our clients' business, harm our reputation, result in the loss of future sales, require us to undertake expensive remediation steps, cause clients to withhold payment or terminate or not renew their agreements with us, and subject us to litigation, regulatory fines and penalties, indemnity obligations, contractual obligations and liabilities and other possible liabilities.
Security breaches, computer viruses and computer hacking attacks could harm our business and results of operations.
We collect, store and transmit customer data and other proprietary information of, or on behalf of, our customers. We take steps to protect the security, integrity and confidentiality of the information we collect, store or transmit, including our own proprietary and confidential information and that of our customers, their end users, and other third parties, but there is no guarantee that inadvertent or unauthorized use or disclosure will not occur or that third parties will not gain unauthorized access to this information despite our efforts. Security breaches, computer malware and computer hacking attacks have become more prevalent in our industry and may occur on our systems or those of our information technology vendors in the future. Any security breach caused by hacking, which involves efforts to gain unauthorized access to information or systems, or to cause intentional malfunctions or loss or corruption of data, software, hardware or other computer equipment, or the inadvertent transmission of computer viruses, worms or other harmful software code could result in unauthorized disclosure, misuse, or loss of information, legal claims and litigation, indemnity obligations, regulatory fines and penalties, contractual obligations and liabilities, and other liabilities. In addition, if our security measures, or those of our vendors, are breached or unauthorized access to consumer data otherwise occurs, our solutions may be perceived as not being secure and our customers may reduce the use of or stop using our solutions.
While we have security measures in place with respect to our systems, networks and SaaS solutions, these systems, networks and solutions are subject to ongoing threats and, therefore, these security measures may be breached as a result of employee error, failure to implement appropriate processes and procedures, malfeasance, third-party action, including cyber-attacks or other intentional misconduct by computer hackers or otherwise. This could result in one or more third parties obtaining unauthorized access to our customers' data or our data, including personally identifiable information or other end user data, intellectual property and other confidential business information. Third parties may also attempt to fraudulently induce employees into disclosing sensitive information such as user names, passwords or other information in order to gain access to our customers' data or our data, including intellectual property and other confidential business information.
Because techniques used to obtain unauthorized access or sabotage systems change frequently and generally are not identified until they are launched against a target, we and our vendors may be unable to anticipate these techniques or to implement adequate preventative or mitigation measures. Though it is difficult to determine what harm may directly result from any specific interruption or breach, any failure to maintain performance, reliability, security and availability of our network infrastructure or otherwise to maintain the confidentiality, security, and integrity of data that we store or otherwise maintain may harm our reputation and our ability to retain existing clients and attract new clients. Additionally, we may be required to expend significant capital and other resources to protect against the threat of interruptions and security breaches or to alleviate problems they may cause. Any of these could harm our business, financial condition and results of operations.
24
Table of Contents
Because our platform could be used to collect and store personal information of our customers' employees or customers, privacy concerns could result in additional cost and liability to us or inhibit use of our platform.
Personal privacy has become a significant issue in the United States and in many other countries where we offer our solutions or may offer them in the future. The regulatory framework for privacy issues worldwide is currently evolving, is not uniform and is likely to remain uncertain for the foreseeable future. Many federal, state and foreign government bodies and agencies have adopted or are considering adopting laws and regulations regarding the collection, use, disclosure, control, security and deletion of personal information. In the United States, these include, without limitation, laws and regulations promulgated by states, as well as rules and regulations promulgated under the authority of the Federal Trade Commission and federal financial regulatory bodies. Internationally, most of the jurisdictions in which we operate have established their own data security and privacy legal frameworks, many of which are broader in scope, more restrictive and impose greater obligations on us and our customers. Many of these obligations are updated frequently and require ongoing monitoring. In addition to government regulation, privacy advocacy and industry groups may propose new and different self-regulatory standards that either legally or contractually apply to us.
As a result of uncertainty regarding the interpretation and application of privacy and data protection-related laws, regulations, and self-regulatory requirements, it is possible that these laws, regulations, and requirements may be interpreted and applied in a manner that is inconsistent with our existing data handling practices or the technological features of our solutions. If so, in addition to the possibility of fines, lawsuits and other claims, we could be required to fundamentally change our business activities and practices or modify our solutions, which could have an adverse effect on our business. Any inability to adequately address privacy or data protection-related concerns, even if unfounded, or comply with applicable privacy or data protection-related laws, regulations and policies, could result in additional cost and liability to us, damage our reputation, inhibit sales and harm our business. Furthermore, the costs of compliance with, and other burdens imposed by, the laws, regulations, standards and policies that are applicable to the businesses of our customers may limit the use and adoption of, and reduce the overall demand for, our solutions. Also, privacy concerns, whether valid or not valid, may inhibit market adoption of our solutions, particularly in foreign countries.
If our large subscription-based clients or if our revenue sharing relationships are terminated, our business may be harmed.
In recent years, Advent has periodically entered into contracts relating to our subscription, data management revenue streams and outsourced services with contract values that are substantially larger than we have customarily entered into in the past. We do not know whether we will be able to continue to sign large recurring revenue contracts of this nature or if such clients will renew their contracts at similar rates and terms, if at all. For example, we renewed our agreement with TIAA-CREF in the second quarter of 2013, but at lower annual fees than the original agreement, which has resulted in a decrease in revenues associated with that agreement. In addition, some of these types of agreements are subject to milestones, acceptance and penalties and there is no assurance that these agreements will be fully implemented. We also have revenue sharing agreements with other companies that provide revenue to Advent for our clients' use of those companies' services and products. Our operating results could be adversely impacted if these agreements are not fully implemented, terminated or not renewed, or if we are unable to continue to generate similar opportunities and enter similar or larger sized contracts in the future.
If our relationship with Financial Times/Interactive Data is terminated, our business may be harmed.
Many of our clients use our proprietary interface to retrieve pricing and other data electronically from Financial Times/Interactive Data ("FTID"). FTID pays us a royalty which we classify as other
25
Table of Contents
recurring revenues. The royalty is based on FTID's revenues from providing this data to our clients. Our software products have been customized to be compatible with their system and our software would need to be redesigned to operate with additional alternative data vendors if FTID's services were unavailable for any reason. Non-renewal of our current agreement with FTID would require at least two years' prior notice by either party and the agreement may be terminated upon 90 days' advance notice for an uncured material breach of the other party. While we have contracts with other data vendors for substantially similar financial data with which our products can be used, if our relationship with FTID was terminated or their services were unavailable to clients for any reason, we cannot be certain that we could enter into contracts with additional alternative data providers, or that other relationships would provide similar commission rates to us or if the amount of data used by our clients would remain the same, and our operating results could suffer or our resources could be constrained from the costs of redesigning our software.
We must recruit, retain and provide adequate facilities for key employees, including facilities in high cost areas such as our San Francisco-based corporate headquarters.
We believe that our future success is dependent on the continued employment of our senior management and our ability to identify, attract, motivate and retain qualified technical, sales and other personnel. Members of our executive management team have acquired specialized knowledge and skills with respect to Advent. We need technical resources such as our product development engineers to develop new products and enhance existing products; we rely upon sales personnel to sell our products and services and maintain healthy business relationships; we must recruit professional service consultants to support our implementations; we must hire client services personnel to provide technical support to our growing installed base of customers; and we must attract and retain financial and accounting personnel to comply with our public company reporting requirements. We need to identify, attract, motivate and retain such employees with the requisite education, backgrounds and industry experience. However, experienced high quality personnel in the information technology industry continue to be in high demand and competition for their talents remains intense, especially in San Francisco where the largest number of our employees are located. In addition, from time to time, we may reorganize our business or reduce our workforce, as we did in late 2012, which may result in increased difficulty in hiring and retaining qualified personnel. Furthermore, the announcement of our pending acquisition by SS&C may affect employee retention and cause some employees to depart the company. Such reorganizations, reductions or other departures may distract our management and employees and may negatively impact our near-term financial results.
We also have begun a strategy to move certain functions from high cost areas like San Francisco, New York City and Boston, to lower cost areas such as Jacksonville and Beijing to reduce our overall costs of operations. While we believe this strategy will have significant benefits, we may not be able to recruit and retain qualified personnel in such lower cost areas. Additionally, such a strategy may negatively impact our ability to retain and hire in our other office locations. Also, our operating results may be adversely impacted by changes in our lease commitments as a result of increasing real estate costs in certain markets in which we operate such as San Francisco where we intend to maintain our corporate headquarters. As a result, we may renew or enter into lease agreements at relatively higher cost, reduce our office space needs, or consolidate or exit some of our real estate locations, which in most cases require a modification of an existing lease agreement and could have a significant adverse effect on our financial results. For example, in January 2015 we renewed our San Francisco office lease for an additional 10 years at a significant increase in annual rent which will result in total operating lease payments and rent expense of approximately $71 million over the extension term.
We have relied on our ability to grant equity compensation as one mechanism for recruiting and retaining such highly skilled personnel. In making employment decisions, particularly in the high-technology industries and San Francisco Bay Area, job candidates often consider the value of the
26
Table of Contents
equity awards they are to receive in connection with their employment and market downturns may result in our equity incentives becoming less valuable.
We may also choose to create additional performance and retention incentives in order to retain our employees, including the granting of additional stock options, restricted stock, restricted stock units, stock appreciation rights, performance shares or performance units to employees or issuing incentive cash bonuses. Such incentives may either dilute our existing stockholder base or result in unforeseen operating expenses, which may have a material adverse effect on our operating results, could result in our stock price falling or may not be valued as highly by our employees which may create retention issues.
We face challenges in expanding our operations outside the United States.
We market and sell our products in the United States and, to a growing extent, outside the U.S. Revenues derived from sales outside the U.S. comprised 19%, 18% and 17% of our total revenues in 2014 and fiscal years 2013 and 2012, respectively. We have international subsidiaries in Canada, China, Denmark, England, Hong Kong, Ireland, Netherlands, Norway, Singapore, Sweden, Switzerland and the United Arab Emirates.
We cannot be certain that establishing businesses or seeking sales in other countries will produce the desired levels of revenues. If we are not successful in international market expansion, our overall future growth prospects may be limited. Also, worldwide and regional political instability and volatility in financial markets may disrupt our sales efforts in overseas markets. We have relatively limited experience in developing localized versions of our products and marketing and distributing our products outside the U.S. In other instances, we may rely on the efforts and abilities of business partners in such markets. For example, we previously outsourced certain engineering activities to a business partner located in China until we transitioned those contract developers to become employees of our Beijing office. In addition, our operations are subject to other inherent risks, including:
- •
- The impact of recessions and market fluctuations in economies both within and outside the United States;
- •
- Adverse changes in foreign currency exchange rates;
- •
- Greater difficulty in accounts receivable collection and longer collection periods;
- •
- Difficulty of enforcement of contractual provisions in local jurisdictions;
- •
- Compliance with multiple, conflicting and changing governmental laws and regulations, including employment, tax, privacy and data protection laws and regulations;
- •
- Trade and intellectual property protection measures and export and import requirements;
- •
- Difficulties in successfully adapting our products to language, regulatory and technology standards;
- •
- Cultural resistance to expansion into other countries and difficulties establishing local partnerships or engaging local resources;
- •
- Difficulties in and costs of staffing and managing geographically dispersed operations;
- •
- Different or lesser levels of intellectual property right protections;
- •
- Sovereign debt issues;
- •
- Tax structures and potentially adverse tax consequences; and
- •
- Political and economic instability.
27
Table of Contents
The revenues, expenses, assets and liabilities of our subsidiaries outside the United States are primarily denominated in their respective local currencies. Future fluctuations in currency exchange rates may adversely affect revenues and accounts receivable recognized by these subsidiaries and the U.S. dollar value of related revenues, expenses, assets and liabilities reported by Advent. Our service revenues and certain license revenues from our European subsidiaries are generally denominated in their respective local currencies.
Difficulties in integrating our acquisitions and expanding into new business areas have impacted and could continue to impact our business adversely and we face risks associated with potential acquisitions, investments, divestitures and expansion.
Periodically we seek to grow through the acquisition of additional complementary businesses. For example, in February 2011, we acquired Syncova Solutions, Ltd., a United Kingdom-based company that provides margin management and debt finance reconciliation and optimization software and in June 2011, we acquired Black Diamond, a Florida-based company that provides web-based, outsourced portfolio management and reporting platforms for independent advisors.
The process of integrating our acquisitions has required and will continue to require significant resources, particularly in light of our relative inexperience in integrating acquisitions, potential regulatory requirements and operational demands. In particular, our 2008 acquisition of Tamale Software, Inc. was an entry into the research management software market, where we had no prior experience. Integrating these acquisitions in the past has been time-consuming, expensive and disruptive to our business. We have faced difficulties in integrating new personnel and in maintaining relationships with customers and partners of acquired businesses, as well as in incorporating acquired technology and rights into our solutions and maintaining quality standards consistent with our brand. Integration also has required us to implement additional controls, policies, and procedures. This integration process has strained our managerial resources, resulting in the diversion of these resources from our core business objectives, and may do so in the future. Failure to achieve the anticipated benefits of these acquisitions or to integrate the operations of these entities successfully has harmed and could potentially harm our business, results of operations and cash flows in future periods. The assumptions we made in determining the value and relative risks of these acquisitions could be erroneous. In addition, as we have expanded into new business areas and built new offerings through strategic alliances and internal development, as well as acquisitions, some of this expansion has required significant management time and resources without generating required revenues. We have had difficulty and may continue to have difficulty creating demand for such offerings. Furthermore, we may face other unanticipated costs from our acquisitions, such as disputes involving earn-out and incentive compensation amounts.
We may make additional acquisitions of complementary companies, products or technologies in the future. In addition, we periodically evaluate the performance of all our products and services and may sell or discontinue current products, product lines or services, particularly as we focus on ways to streamline our operations. Failure to achieve the anticipated benefits of any acquisition or divestiture could harm our business, results of operations and cash flows. Furthermore, we may have to incur debt, write-off investments, infrastructure costs or other assets, incur severance liabilities, write-off impaired goodwill or other intangible assets or issue equity securities to pay for any future acquisitions. Sufficient financing may not be available to us on sufficiently advantageous terms, or at all, and if our existing credit facility is inadequate to meet our needs, its existence may make it significantly more difficult to acquire any additional debt. The issuance of equity securities could dilute our existing stockholders' ownership. Finally, we may not identify suitable businesses to acquire or negotiate acceptable terms for future acquisitions.
28
Table of Contents
If we are unable to protect our intellectual property, we may be subject to increased competition that could seriously harm our business.
Our success depends significantly upon our proprietary technology. We currently rely on a combination of copyright, trademark, patent and trade secret law, as well as confidentiality procedures and contractual provisions to protect our proprietary rights. We have registered trademarks and copyrights for many of our products and services and will continue to evaluate the registration of additional trademarks and copyrights as appropriate. We generally enter into confidentiality agreements with our employees, customers, resellers, vendors and others. We seek to protect our software, documentation and other written materials under trade secret and copyright laws. We also have seven issued patents. Despite our efforts, existing intellectual property laws may afford only limited protection. It may be possible for unauthorized third parties to copy certain portions of our products or to reverse engineer or otherwise obtain and use our proprietary information. In addition, we cannot be certain that others will not develop or acquire substantially equivalent or superseding proprietary technology, equivalent or better products will not be marketed in competition with our products, or others may not design around any patent that we have or that may be issued to us or other intellectual property rights of ours, thereby substantially reducing the value of our proprietary rights. We cannot be sure that we will develop proprietary products or technologies that are patentable, that any patent, if issued, would operate to cover the differentiating features of our products and services, provide us with any competitive advantages or would not be challenged by third parties, or that the patents of others will not adversely affect our ability to do business. Despite our efforts to protect our proprietary rights, unauthorized parties may copy aspects of our products or to obtain and use information that we regard as proprietary and we may not have any effective practical remedy against such parties. In addition, the laws of some countries do not protect proprietary rights to as great an extent as do the laws of the United States and so our expansion into markets outside the U.S. may expose our proprietary rights to increased risks. Litigation may be necessary to protect our proprietary technology which may be time-consuming and expensive, with no assurance of success. As a result, we cannot be sure that our means of protecting our proprietary rights will be adequate.
If we infringe the intellectual property rights of others, we may incur additional costs or be prevented from selling our products and services.
We cannot be certain that our products or services do not infringe the intellectual property rights of others, and from time to time we receive notices alleging infringement or other intellectual property-related claims. As a result, we may be subject to litigation and claims, including claims of misappropriation of trade secrets or infringement of patents, copyrights and other intellectual property rights of third parties that would be time-consuming and costly to resolve and may lead to unfavorable judgments or settlements. If such infringement or misappropriation claims are made against our customers because of our products and services, we may also be contractually required to indemnify such customers from and against such claims and resulting liabilities. If we discovered that our products or services violated the intellectual property rights of third parties, we may have to make substantial changes to our products or services or obtain licenses from such third parties. We might not be able to obtain such licenses on favorable terms or at all, and we may be unable to change our products successfully or in a timely or cost-effective manner. Failure to resolve an infringement matter successfully or in a timely manner would damage our reputation and force us to incur significant costs, including payment of damages, redevelopment costs, diversion of management's attention and satisfaction of indemnification obligations that we have with our clients, as well as prevent us from selling certain products or services.
Catastrophic events could adversely affect our business.
We are a highly automated business and rely on our network infrastructure and enterprise applications, internal and outsourced technology systems and our website for our development,
29
Table of Contents
marketing, operational, support, and sales activities. A disruption or failure of these systems in the event of major earthquake, fire, telecommunications failure, cyber-attack, terrorist attack, misconduct or other catastrophic event could cause system interruptions, reputational harm, delays in our product development and loss of critical data and could affect our ability to sell and deliver products and services and other critical functions of our business. Our corporate headquarters, a significant portion of our research and development activities, our data centers and certain other critical business operations are located in the San Francisco Bay Area, which is a region of seismic activity. We have developed certain disaster recovery plans and certain backup systems to reduce the potentially adverse effect of such events, but a catastrophic event that results in the destruction or disruption of any of our data centers or our critical business or information technology systems, or any data centers or systems of our vendors used to support our business, could severely affect our ability to conduct normal business operations and, as a result, our future operating results could be adversely affected. Further, such disruptions could cause further instability in the financial markets or the spending of our clients and prospects upon which we depend.
In addition to the severe market conditions in recent years, other catastrophic events such as abrupt political change, terrorist acts, conflicts or wars may cause damage or disruption to the economy, financial markets and our customers. The potential for future attacks, the responses to attacks or perceived threats to national security and other actual or potential conflicts, wars or political unrest have created many economic and political uncertainties in various countries and regions in which we operate. Although it is impossible to predict the occurrences or consequences of any such events, they could unsettle the financial markets or result in a decline in information technology spending, which could have a material adverse effect on our revenues.
Undetected errors or failures found in our products and services may result in loss of or delay in market acceptance of our products and services that could seriously harm our business.
Our products and services may contain undetected errors or scalability limitations at any point in their lives, but particularly when first introduced or as new versions are released. We frequently release new versions of our products, such as during 2014, when we released new versions of APX, Axys, Geneva, Moxy, Syncova and Tamale RMS, Advent Direct Investor Management among others. We also recently introduced Advent Direct, our new cloud platform and different aspects of the platform and related solutions are in various stages of development. Despite testing by us and by current and potential customers, errors may not be found in new products and services until after commencement of commercial availability or use, resulting in a loss of or a delay in market acceptance, damage to our reputation, customer dissatisfaction and reductions in revenues and margins, any of which could seriously harm our business. Additionally, our agreements with customers that attempt to limit our exposure to liability claims may not be enforceable in jurisdictions where we operate, particularly as we expand into new markets outside the U.S.
Borrowings under our credit agreement could limit our available working capital, adversely affect our financial results and ability to operate our business and must be repaid in full if we fail to comply with certain covenants.
In June 2013, we entered into the Restated Credit Agreement which provides us (i) a $225 million term loan facility and (ii) a $200 million revolving credit facility, with a $25 million letter of credit sublimit and a $10 million swingline loan sublimit. We have in the past, and may in the future, borrow under the Restated Credit Agreement in order to fund working capital requirements, make share repurchases of our common stock, pay dividends or fund acquisitions. In addition, if our anticipated cash flow from our recurring sources of revenue is materially impaired due to customer defaults or failure to renew term licenses, other recurring agreements or maintenance contracts, our ability to meet our debt service payment obligations or continue to meet the contractual covenants may be impaired, and our ability to make further borrowings may be compromised.
30
Table of Contents
In order to fund the special dividend paid in July 2013 and to repurchase Advent common stock, we incurred substantial debt and at December 31, 2013 we had total debt outstanding of $305 million and a stockholders' deficit of $(111.8) million. As of December 31, 2014, approximately $220 million of debt was outstanding and stockholders' deficit was $(64.8) million. As a result of our debt borrowing, we are obligated to make periodic principal and interest payments on the debt of approximately $26 million annually. This amount will fluctuate due to changes in interest rates, future borrowings and repayments. Our ability to make payments on our indebtedness and to fund planned working capital requirements will depend on our ability to generate cash flow in the future. In addition, the existence of this indebtedness could have adverse consequences. For example, it could:
- •
- Require us to dedicate a substantial portion of our cash flow from operations to payments on our indebtedness, thereby reducing the availability of our cash flow to fund acquisitions, working capital, capital expenditures, research and development efforts and other general corporate purposes;
- •
- Increase our vulnerability to and limit our flexibility in planning for, or reacting to, change in our business and the industry in which we operate;
- •
- Expose us to the risk of increased interest rates as borrowings under our Restated Credit Agreement are subject to variable rates of interest;
- •
- Place us at a competitive disadvantage compared to our competitors that have less debt; and
- •
- Limit our ability to borrow additional funds.
Our continued ability to borrow under our credit agreement is subject to compliance with certain financial and non-financial covenants. The financial covenants require us to maintain compliance with a consolidated leverage ratio and a consolidated interest coverage ratio. Our failure to comply with such covenants could cause default under the agreement, and we may then be required to repay such debt with capital from other sources. Under those circumstances, other sources of capital may not be available to us, or be available only on unfavorable terms. In the event of a default which is not remedied within the prescribed timeframe, the assets of the Company (subject to the amount borrowed) may be attached or seized by the lender.
Changes in securities laws and regulations may increase our costs or may harm demand.
Most of our customers operate within a highly regulated environment. Congress and regulators have increased their focus on the regulation of the financial services industry in recent years. The information provided by, or resident in, the software or services we provide to our customers could be deemed relevant to a regulatory investigation or other governmental or private legal proceeding involving our customers, which could result in requests for information from us that could be expensive and time consuming for us. In addition, clients subject to investigations or legal proceedings may be adversely impacted, possibly leading to their liquidation, bankruptcy, receivership, reductions in Assets Under Management or Assets Under Administration, or diminished operations that would adversely affect our revenues and collection of receivables.
Our customers must comply with governmental, self-regulatory organization and other rules, regulations, directives and standards. New legislation or changes in such rules, regulations, directives or standards may reduce demand for our services or increase our expenses. We develop, configure and market products and services to assist customers in meeting these requirements. New legislation, or a significant change in rules, regulations, directives or standards, could cause our services to become obsolete, reduce demand for our services or increase our expenses in order to continue providing services to clients.
The Dodd-Frank Wall Street Reform and Protection Act of 2010 ("Dodd-Frank Act") represents a comprehensive overhaul of the financial services industry within the United States, established the new
31
Table of Contents
federal Consumer Financial Protection Bureau (the "CFPB"), and required the CFPB and other federal agencies to implement many new rules. While the general framework of the reforms is set forth in the Dodd-Frank Act, it provides for numerous studies and reports and the adoption and implementation of rules and regulations by regulatory agencies, which are ongoing.
We believe that it is too early to know the precise long-term impact on our business of the increased regulation of financial institutions. While it could lead to increased demand for Advent's products and services, demand could be negatively impacted by the deferral of purchase decisions by our customers until the new regulations have been fully adopted and the full impact and expense of the new regulatory environment is more clearly understood. The Dodd-Frank Act contains numerous other provisions affecting financial institutions of all types, many of which may have an impact on our operating environment in substantial and unpredictable ways.
Additionally, as a publicly-traded company, we are subject to significant regulations including those under the Dodd-Frank Act and the Sarbanes-Oxley Act of 2002 ("the Sarbanes-Oxley Act"). These regulations increase our accounting, operating and legal compliance costs and could also expose us to additional liability if we fail to comply with these or other new rules and reporting requirements. There are also significant corporate governance and executive compensation-related provisions in the Dodd-Frank Act that require the SEC to adopt additional rules and regulations in these areas, which may further increase our costs.
Changes in, or interpretations of, accounting principles could significantly impact our reported financial information and operational processes.
We prepare our consolidated financial statements in conformity with accounting principles generally accepted in the United States of America ("GAAP"). These principles are subject to interpretation by us, the SEC and various bodies formed to interpret and create accounting principles and guidance. A change in these principles or a change in the interpretations of these principles can have a significant effect on our reported results and may even retroactively affect previously reported transactions. Additionally, proposed accounting standards could have a significant impact on our operational processes, revenues and expenses, and could cause unexpected financial reporting fluctuations. Some of our accounting principles that have been or may be affected include:
- •
- Software revenue recognition;
- •
- Accounting for stock-based compensation;
- •
- Accounting for income taxes; and
- •
- Accounting for business combinations and related goodwill.
For example, the U.S.-based Financial Accounting Standards Board ("FASB") is currently working together with the International Accounting Standards Board ("IASB") on several projects intended to further align accounting principles and facilitate more comparable financial reporting between companies who are required to follow GAAP under SEC regulations and those who are required to follow International Financial Reporting Standards ("IFRS"). These efforts by the FASB and IASB may result in different accounting principles under GAAP that may result in different financial results for us in areas including, but not limited to, principles for recognizing revenue, lease accounting and financial statement presentation. A change in accounting principles may have a material impact on our financial statements and may retroactively adversely affect previously reported transactions.
In May 2014, the FASB issued ASU No. 2014-09,"Revenue from Contracts with Customers (Topic 606)," which is a new revenue recognition model that requires additional disclosure about the nature, amount, timing and uncertainty of revenue and cash flows arising from customer contracts, including significant judgments and changes in judgments and assets recognized from costs incurred to obtain or fulfill a contract. ASU 2014-09 will replace most existing revenue recognition guidance in U.S.
32
Table of Contents
Generally Accepted Accounting Principles when it becomes effective for Advent for our fiscal year beginning January 1, 2017, and early adoption of ASU 2014-09 is not permitted. Under ASU 2014-09, companies may use either a full retrospective or a modified retrospective approach to adopt ASU 2014-09. Advent is evaluating the impact of the adoption of ASU 2014-09 on its consolidated financial statements, which could materially change the timing of revenue recognition.
Changes in, or interpretations of, tax rules and regulations may adversely affect our effective tax rates.
We are a U.S.-based multinational company subject to tax in multiple U.S. and non-U.S. tax jurisdictions. Changes in our tax rates could adversely affect our future results of operations. Our future effective tax rates could be unfavorably affected by changes in, or interpretation of, tax rules and regulations in the jurisdictions in which we do business, by unanticipated decreases in the amount of revenue or earnings in countries with low statutory tax rates, by changes in state apportionment, by lapses of the availability of the U.S. research and development tax credit, or by changes in the valuation of our deferred tax assets and liabilities.
In addition, we could be subject to examination of our income tax returns by state tax authorities, the U.S. Internal Revenue Service and other tax authorities outside the U.S. For example, we are currently undergoing a State of California franchise tax examination for the 2006 and 2007 tax years and a state of New York examination for 2011, 2012 and 2013 tax years. Examinations generally focus on areas where considerable judgment is exercised by the Company. We regularly assess the likelihood of outcomes resulting from an examination to determine the adequacy of our provision for income taxes and have reserved for potential adjustments that may result from an examination. We believe such estimates to be reasonable; however, there can be no assurance that the final determination of any of these examinations will not have an adverse effect on our operating results and financial position.
If we fail to maintain an effective system of internal control, we may not be able to report our financial results accurately or our filings may not be timely. As a result, current and potential stockholders could lose confidence in our financial reporting, which would harm our business and the trading price of our stock.
Effective internal control is necessary for us to provide reliable financial reports. If we cannot provide reliable financial reports, our business and operating results could be harmed. Although we have not historically discovered any material weaknesses, we have in the past discovered, and may in the future discover, areas of our internal control that need improvement including control deficiencies that may constitute material weaknesses.
We do not expect that our internal control over financial reporting will prevent all errors or fraud. A control system, no matter how well designed and operated, can provide only reasonable, not absolute, assurance that the control system's objectives will be met. Further, the design of a control system must reflect the fact that there are resource constraints, and the benefits of controls must be considered relative to their costs. Controls can be circumvented by individual acts of some persons, by collusion of two or more people, or by management override of the controls. Over time, controls may become inadequate because changes in conditions or deterioration in the degree of compliance with policies or procedures may occur. Because of the inherent limitations in a cost-effective control system, misstatements due to error or fraud may occur and not be detected.
Any failure to implement or maintain improvements in our internal control over financial reporting, or difficulties encountered in the implementation of these improvements in our controls, could cause significant deficiencies or material weaknesses in our internal controls and consequently cause us to fail to meet our reporting obligations. Any failure to implement or maintain required new or improved internal controls could also cause investors to lose confidence in our reported financial information, which could have a negative impact on the trading price of our stock.
33
Table of Contents
Item 1B. Unresolved Staff Comments
None.
Item 2. Properties
Our principal executive offices are located in San Francisco, California. We continue to assess our needs with respect to office space and may, in the future, vacate or add additional facilities. We believe that our current facilities are adequate and suitable for our needs in the immediate and foreseeable future. The table below summarizes the principal properties that we were leasing as of December 31, 2014:
| | | | | | | | | | | |
| |
| | Use of Property |
|---|
Location | | Approximate
Square
Footage | | Sales and
Support | | Marketing | | Product
Development | | Administrative |
|---|
United States: | | | | | | | | | | | |
San Francisco, CA(1)(2) | | | 158,264 | | X | | X | | X | | X |
New York, NY | | | 31,286 | | X | | X | | X | | X |
Jacksonville, FL | | | 29,897 | | X | | X | | X | | X |
Boston, MA(1) | | | 24,597 | | X | | X | | X | | X |
New Rochelle, NY | | | 10,541 | | X | | X | | | | |
Other | | | 255 | | X | | | | | | |
Europe and Middle East: | | |
| | | | | | | | |
London, United Kingdom | | | 16,018 | | X | | X | | X | | X |
Stockholm, Sweden | | | 7,944 | | X | | | | X | | X |
Copenhagen, Denmark | | | 3,475 | | X | | | | X | | X |
Oslo, Norway | | | 2,626 | | X | | X | | X | | |
Dubai, United Arab Emirates | | | 1,939 | | X | | | | | | X |
Zurich, Switzerland | | | 1,830 | | X | | | | | | |
Bracknell, United Kingdom | | | 936 | | | | | | | | X |
Asia: | | |
| | | | | | | | |
Beijing, People's Republic of China | | | 27,171 | | X | | | | X | | X |
Singapore | | | 797 | | X | | X | | | | |
Hong Kong, People's Republic of China | | | 750 | | X | | X | | | | X |
| | | | | | | | | | | | |
Total leased square footage | | | 318,326 | | | | | | | | |
| | | | | | | | | | | | |
| | | | | | | | | | | | |
| | | | | | | | | | | | |
- (1)
- The Company exited approximately 31,000 and 9,000 square feet of office space under lease in San Francisco and Boston, respectively, in the third quarter of 2014 as part of a restructuring plan to consolidate facilities and reduce costs.
- (2)
- On January 28, 2015, the Company entered into a definitive amendment to its San Francisco headquarters lease whereby the term of the lease has been extended for an additional ten years commencing on November 1, 2016 and ending October 31, 2026 and whereby the Company's total leased space will be reduced from approximately 158,000 square feet to approximately 129,000 square feet by November 1, 2016.
Item 3. Legal Proceedings
From time to time, in the course of its operations, the Company is a party to litigation matters and claims, including claims related to employee relations, business practices and other matters not specifically identified, but that the Company does not consider to be material either individually or in
34
Table of Contents
the aggregate at this time. Litigation can be expensive and disruptive to normal business operations. Moreover, the results of complex legal proceedings are difficult to predict and the Company's view of these matters may change in the future as the litigation and events related thereto unfold. An unfavorable outcome in any legal matter, if material, could have a material adverse effect on the Company's financial position, liquidity or results of operations in the period in which the unfavorable outcome occurs and potentially in future periods.
Legal Proceedings Regarding the Merger
As of February 20, 2015, three putative class action lawsuits challenging the transactions contemplated by the Merger Agreement have been filed by purported Advent stockholders in the Court of Chancery of the State of Delaware against Advent, Advent's Board of Directors, SS&C, and Merger Sub. These actions are captioned Chitwood v. Advent Software, Inc., et al., Case No. 10623-VCL, City of Atlanta Firefighters' Pension Fund v. David Peter F. Hess, Jr., et al., Case No. 10633-VCL, and Klein v. Advent Software, Inc., et al., Case No. 10670-VCL. The actions generally allege, among other things, that the Board of Directors breached its fiduciary duties to Advent's stockholders by engaging in a flawed sales process, agreeing to a transaction price that does not adequately compensate Advent stockholders, and agreeing to certain deal protection terms in the Merger Agreement that allegedly preclude a potential competing bid. The actions also allege that the other defendants aided and abetted the Board of Directors' breaches of fiduciary duties. The actions seek various remedies including to enjoin or rescind the merger, damages, and costs.
Management believes that any potential losses associated with the legal proceedings regarding the merger are neither probable nor reasonably estimable at this time and accordingly has not accrued any amounts for any potential loss.
Item 4. Mine Safety Disclosures
Not applicable.
35
Table of Contents
PART II
Item 5. Market for Registrant's Common Equity, Related Stockholder Matters and Issuer Purchases of Equity Securities
Market Information for Common Stock
Our common stock is listed on the NASDAQ Stock Market under the symbol "ADVS." The closing price of our common stock on January 31, 2015 was $41.85. The table below summarizes the range of high and low reported sales prices on the NASDAQ Stock Market for our common stock for the periods indicated.
| | | | | | | |
| | Price Range | |
|---|
| | High | | Low | |
|---|
Fiscal 2013 | | | | | | | |
First quarter | | $ | 29.88 | | $ | 21.50 | |
Second quarter | | $ | 35.40 | | $ | 25.70 | |
Third quarter | | $ | 36.21 | | $ | 26.10 | |
Fourth quarter | | $ | 36.11 | | $ | 29.90 | |
Fiscal 2014 | | |
| | |
| |
First quarter | | $ | 35.73 | | $ | 26.00 | |
Second quarter | | $ | 33.56 | | $ | 25.42 | |
Third quarter | | $ | 34.74 | | $ | 30.38 | |
Fourth quarter | | $ | 35.17 | | $ | 28.78 | |
Stockholders
As of January 31, 2015, there were approximately 55 holders of record of our common stock. However, because many of our shares of common stock are held by brokers and other institutions on behalf of stockholders, we are unable to accurately estimate the total number of stockholders represented by these record holders.
Dividends
Prior to July 2013, the Company had a history of not paying dividends. In July 2013, Advent paid a $9.00 per share one-time special cash dividend to its shareholders in connection with a recapitalization. In April, September and December of 2014, our Board of Directors (the "Board") declared quarterly cash dividends of $0.13 per common share. In the Merger Agreement with SS&C signed on February 2, 2015, the Company is prohibited from declaring a dividend during the pendency of the agreement.
Recent Sales of Unregistered Securities
None.
Purchases of Equity Securities by the Issuer and Affiliated Purchasers
Our Board has approved common stock repurchase programs authorizing management to repurchase shares of the Company's common stock in the open market. The timing and actual number of shares subject to repurchase are at the discretion of management and are contingent on a number of factors, including the price of our stock, general market conditions and alternative investment opportunities. The purchases are funded from available working capital or debt. At December 31, 2013 there were approximately 0.4 million shares authorized by our Board for repurchase. In May 2014 our Board authorized an additional 1.0 million shares of the Company's common stock for repurchase. At December 31, 2014, there remained approximately 0.9 million shares authorized by the Board for
36
Table of Contents
repurchase, however, in the Merger Agreement with SS&C, signed on February 2, 2015, the Company is prohibited from repurchasing shares of its common stock during the pendency of the agreement. The following table provides a summary of the monthly repurchase activity during the three months ended December 31, 2014 under the stock repurchase program approved by our Board (in thousands, except per share data):
| | | | | | | | | | |
Month | | Total
Number
of Shares
Purchased | | Average
Price Paid
Per Share | | Maximum
Number of Shares That
May Yet Be Purchased
Under Our Share
Repurchase Programs | |
|---|
October | | | 41 | | $ | 30.90 | | | 913 | |
November | | | — | | $ | — | | | 912 | |
December | | | 33 | | $ | 30.63 | | | 879 | |
| | | | | | | | | | | |
Total | | | 74 | | $ | 30.78 | | | 879 | |
| | | | | | | | | | | |
| | | | | | | | | | | |
| | | | | | | | | | | |
We withheld shares through net share settlements (a feature where the Company provides the award holder shares equivalent to the gains, net of tax, on the awards that have vested or are exercised) during the three months ended December 31, 2014. The following table provides a month-to-month summary of the purchase activity upon the employee vesting of restricted stock units and the exercise of stock-settled stock appreciation rights under our equity compensation plan to satisfy tax and exercise withholding obligations during the three months ended December 31, 2014 (in thousands, except per share data):
| | | | | | | | | | |
Month | | Total
Number
of Shares
Purchased(1) | | Average
Price Per
Share | | Maximum
Number of Shares That
May Yet Be Purchased
Under the Plan | |
|---|
October | | | 6 | | $ | 31.59 | | | — | |
November | | | 18 | | $ | 32.04 | | | — | |
December | | | 7 | | $ | 30.26 | | | — | |
| | | | | | | | | | | |
Total | | | 31 | | $ | 31.58 | | | — | |
| | | | | | | | | | | |
| | | | | | | | | | | |
| | | | | | | | | | | |
- (1)
- These purchases represent shares cancelled when surrendered in lieu of cash payments for tax and exercise obligations due from employees. These shares were not purchased as part of a publicly announced program to purchase shares.
Securities Authorized for Issuance Under Equity Compensation Plans
Information regarding securities authorized for issuance under equity compensation plans is incorporated by reference from our Proxy Statement to be filed for our 2015 Annual Meeting of Stockholders.
37
Table of Contents
Performance Graph
COMPARISON OF 5 YEAR CUMULATIVE TOTAL RETURN*
Among Advent Software, Inc., the S&P 500 Index and the NASDAQ Computer and
Data Processing Index
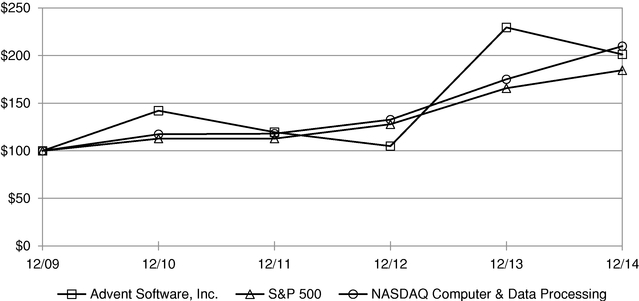
- *
- $100 invested on 12/31/09 in stock or index, including reinvestment of dividends.
Fiscal year ended December 31.
38
Table of Contents
Item 6. Selected Financial Data
The following selected financial data are derived from our consolidated financial statements. This data should be read in conjunction with the consolidated financial statements and notes thereto, and "Item 7. Management's Discussion and Analysis of Financial Condition and Results of Operations".
| | | | | | | | | | | | | | | | |
| | Fiscal Years(1) | |
|---|
| | 2014(2)(3) | | 2013(3) | | 2012(4) | | 2011(5)(6) | | 2010(6)(7) | |
|---|
| | (in thousands, except per share data)
| |
|---|
STATEMENT OF OPERATIONS | | | | | | | | | | | | | | | | |
Net revenues | | $ | 396,820 | | $ | 382,959 | | $ | 358,819 | | $ | 326,248 | | $ | 283,501 | |
Gross margin | | $ | 279,299 | | $ | 263,238 | | $ | 236,103 | | $ | 215,476 | | $ | 196,691 | |
Income from continuing operations | | $ | 83,742 | | $ | 46,132 | | $ | 49,179 | | $ | 42,565 | | $ | 36,305 | |
Net income from continuing operations | | $ | 50,263 | | $ | 28,752 | | $ | 30,231 | | $ | 28,331 | | $ | 24,319 | |
Net income (loss) from discontinued operation | | $ | (51 | ) | $ | 50 | | $ | 184 | | $ | 1,839 | | $ | (166 | ) |
Net income | | $ | 50,212 | | $ | 28,802 | | $ | 30,415 | | $ | 30,170 | | $ | 24,153 | |
Basic net income per share: | | | | | | | | | | | | | | | | |
Continuing operations | | $ | 0.98 | | $ | 0.56 | | $ | 0.60 | | $ | 0.55 | | $ | 0.47 | |
Discontinued operation | | $ | — | | $ | — | | $ | — | | $ | 0.04 | | $ | — | |
Total operations | | $ | 0.97 | | $ | 0.56 | | $ | 0.60 | | $ | 0.58 | | $ | 0.47 | |
Diluted net income per share: | | | | | | | | | | | | | | | | |
Continuing operations | | $ | 0.94 | | $ | 0.54 | | $ | 0.58 | | $ | 0.52 | | $ | 0.45 | |
Discontinued operation | | $ | — | | $ | — | | $ | — | | $ | 0.03 | | $ | — | |
Total operations | | $ | 0.94 | | $ | 0.54 | | $ | 0.58 | | $ | 0.56 | | $ | 0.44 | |
Cash dividends declared per common share | | $ | 0.39 | | $ | 9.00 | | $ | — | | $ | — | | $ | — | |
BALANCE SHEET | | |
| | |
| | |
| | |
| | |
| |
Cash, cash equivalents and short-term marketable securities | | $ | 36,082 | | $ | 33,828 | | $ | 169,409 | | $ | 135,433 | | $ | 152,023 | |
(Negative) working capital | | $ | (121,397 | ) | $ | (105,523 | ) | $ | 43,013 | | $ | 12,008 | | $ | 45,801 | |
Total assets of discontinued operation | | $ | 1,093 | | $ | 1,437 | | $ | 1,697 | | $ | 2,006 | | $ | 2,095 | |
Total assets | | $ | 433,776 | | $ | 454,857 | | $ | 656,756 | | $ | 581,550 | | $ | 488,731 | |
Long-term liabilities | | $ | 224,306 | | $ | 311,647 | | $ | 112,261 | | $ | 69,870 | | $ | 21,181 | |
Stockholders' (deficit) equity including discontinued operation | | $ | (64,787 | ) | $ | (111,815 | ) | $ | 309,859 | | $ | 283,061 | | $ | 273,848 | |
Net income per share is based on actual calculated values and totals may not sum due to rounding.
| |
- (1)
- Our MicroEdge segment was divested on October 1, 2009. Accordingly, the results of MicroEdge have been reclassified as a discontinued operation for all periods presented. Unless otherwise noted, selected financial data in the above table pertain to our continuing operations.
- (2)
- Our results of operations for 2014 included stock-based compensation expense of $29.4 million, of which approximately $6.2 million was incremental stock-based compensation expense related to the 2013 equity award modification, and restructuring charges of $4.6 million.
- (3)
- Our results of operations for 2013 include $48.2 million of stock-based compensation expense, of which $26.7 million was incremental stock-based compensation expense related to the 2013 equity award modification, $6.0 million of recapitalization costs and restructuring charges of $3.8 million. Our cash and cash equivalents balance decreased to $33.8 million and our debt balance increased to $305.0 million, primarily to fund the payment of the $470.1 million Special Dividend in July 2013 and to repurchase $41.3 million of Advent's common stock. Payment of the Special Dividend resulted in negative working capital and a stockholders' deficit in 2013 and 2014.
39
Table of Contents
- (4)
- Our results of operations for 2012 included stock-based compensation expense of $20.8 million and restructuring charges of $3.6 million.
- (5)
- Our results of operations for 2011 included stock-based compensation expense of $19.1 million, restructuring charges of $0.7 million, non-cash impairment loss on a private equity investment of $0.5 million, acquisition-related costs of $0.9 million and the operating results of Syncova and Black Diamond, subsequent to their acquisition in the first and second quarters of 2011, respectively.
- (6)
- On December 13, 2010, the Company announced that our Board of Directors declared a two-for-one stock split effected in the form of a 100% stock dividend that was distributed on January 18, 2011. Our per-share information has been retroactively adjusted to reflect the two-for-one stock split.
- (7)
- Our results of operations for 2010 included stock-based compensation expense of $18.4 million, restructuring charges of $0.8 million, and the operating results of Goya AS, subsequent to their acquisition in the first quarter of 2010.
Item 7. Management's Discussion and Analysis of Financial Condition and Results of Operations
SPECIAL NOTE REGARDING FORWARD-LOOKING STATEMENTS
You should read the following discussion and analysis of our financial condition and results of operations in conjunction with our consolidated financial statements and related notes included under Item 8 of this Annual Report on Form 10-K. The following discussion contains forward-looking statements within the meaning of Section 27A of the Securities Act of 1933 as amended and Section 21E of the Securities Exchange Act of 1934 as amended, including, but not limited to statements referencing our expectations relating to future revenues, expenses and operating margins. Forward-looking statements can be identified by the use of terminology such as "may," "will," "could," "should," "expect," "plan," "anticipate," "believe," "estimate," "predict," "potential," "continue," "intends" or other similar terms and the negative of such terms regarding beliefs, plans, expectations or intentions regarding the future. Forward-looking statements include, among others, statements referencing our expectations relating to our pending acquisition by SS&C, future revenues, expenses and operating margins, product releases, the future of the investment management market and opportunities for us related thereto, future expansion, acquisition, divestment of or investment in other businesses, projections of revenues, future cost and expense levels, expected timing and amount of amortization expenses related to past acquisitions, future effective tax rates, future exchange rates, the adequacy of resources to meet future cash requirements, renewal rates, expected cash flow, capital expenditures, future financing activities, future dividends, estimates or predictions of actions by customers, suppliers, competitors or regulatory authorities, future client wins, future hiring and future product introductions and acceptance. Such forward-looking statements are based on our current plans and expectations and involve known and unknown risks and uncertainties which may cause our actual results or performance to be materially different from any results or performance expressed or implied by such forward-looking statements. Such factors include, but are not limited to the "Risk Factors" set forth in "Item 1A. Risk Factors" in this Form 10-K, as well as other risks identified from time to time in other U.S. Securities and Exchange Commission ("SEC") reports. You should not place undue reliance on our forward-looking statements, as they are not guarantees of future results, levels of activity or performance and represent our expectations only as of the date they are made.
Unless expressly stated or the context otherwise requires, the terms "we", "our", "us", the "Company" and "Advent" refer to Advent Software, Inc. and its subsidiaries.
40
Table of Contents
Overview
We offer software products and services for automating and integrating data and work flows across the investment management organization, as well as between the investment management organization and external parties. Our products are intended to increase operational efficiency, improve the accuracy of client information and enable better decision-making. Each solution focuses on specific mission-critical functions of the investment management organization (portfolio accounting and reporting; trade order management and post-trade processing; research management; account management; and custodial reconciliation) and is tailored to meet the needs of the particular market segment of the investment management industry, as determined by size, assets under management and complexity of the investment process.
Recent Developments
On February 2, 2015, we entered into a definitive agreement under which SS&C will acquire all of our common stock, through a merger, for $44.25 per share in cash and we will become a wholly owned subsidiary of SS&C. The completion of the acquisition is subject to customary conditions, including without limitation, (i) the approval of the acquisition by Advent's stockholders; and (ii) expiration or termination of the applicable waiting periods under the Hart-Scott-Rodino Antitrust Improvements Act of 1976, as amended. The definitive agreement provides that under specified circumstances, including our acceptance of a superior acquisition proposal, we may be required to pay SS&C a termination fee of $80.0 million. We may also be required to reimburse SS&C for up to $12.5 million of its out-of-pocket expenses in connection with the transaction under certain circumstances.
Operating Overview
Operating highlights of 2014 include:
- •
- Annualized recurring run rate growth. Annualized recurring run rate was $383.4 million as of December 31, 2014, an increase of 7% over the prior year.
- •
- New and incremental bookings. The term license, Advent OnDemand and Black Diamond contracts signed in 2014 will contribute approximately $30.1 million in annual revenue ("annual contract value" or "ACV") once they are fully implemented.
- •
- Continued strong renewal rates. Renewal rates are based on cash collections and therefore reported one quarter in arrears. Our initially disclosed renewal rates for the first three quarters of 2014 ranged from 93% to 95%.
- •
- Professional services profitability. Gross margin for non-recurring revenues improved to 4% in 2014 from (21)% in 2013 due to higher billable utilization of our professional services consultants.
- •
- Operating cash flows. Cash flows from operations were $115.2 million which represents an increase of 17% compared with $98.6 million last year.
- •
- Advent Direct solution release. In 2014, we introduced Advent Direct Investor Management, the first solution to be released to selected clients on the Advent Direct cloud platform.
- •
- Secondary security offering. During 2014, 3.75 million shares of our common stock were sold through a secondary offering by a selling stockholder.
41
Table of Contents
Financial Overview
Financial highlights of 2014 and 2013, and associated dollar and percentage/margin changes were as follows (in thousands, except per share amounts, percentages and margin changes):
| | | | | | | | | | |
| |
Fiscal Years | |
| |
|---|
| | Percentage /
Margin
Change | |
|---|
| | 2014 | | 2013 | |
|---|
Net revenues | | $ | 396,820 | | $ | 382,959 | | | 4 | % |
Gross margin | | $ | 279,299 | | $ | 263,238 | | | 6 | % |
Gross margin percentage | | | 70.4 | % | | 68.7 | % | | 1.7 | % |
Operating income | | $ | 83,742 | | $ | 46,132 | | | 82 | % |
Operating margin percentage | | | 21.1 | % | | 12.0 | % | | 9.1 | % |
Net income from continuing operations | | $ | 50,263 | | $ | 28,752 | | | 75 | % |
Net income from continuing operations per diluted share | | $ | 0.94 | | $ | 0.54 | | | 74 | % |
Operating cash flows | | $ | 115,158 | | $ | 98,564 | | | 17 | % |
Gross margin grew faster than revenues primarily due to improvement in our professional services practice from higher billable utilization. Net income grew faster than gross margin due to improved operating leverage in our business and the lack of recapitalization transaction costs during 2014.
Term License and Term License Deferral
Term license revenues comprise substantially all of our license revenues. When a customer purchases a term license together with implementation services, we do not recognize any revenue under the contract until the implementation services are substantially complete. If the implementation services are still in progress as of quarter-end, we defer all of the contract revenues to a subsequent quarter. When professional services are substantially completed, we recognize a pro-rata amount of the term license revenue, professional services fees earned and related expenses, based on the elapsed time from the start of the term license to the substantial completion of professional services. Term license revenue for the remaining contract years and the remaining deferred professional services revenue and related expenses are recognized ratably over the remaining contract term.
The term license component of the deferred revenue balance related to implementations in process will increase or decrease in the future depending on the amount of new term license bookings relative to the number of implementations that reach completion in a particular quarter. During 2014 and 2013, changes in the net term license implementation component of deferred revenues increased (decreased) the Company's revenues, costs and operating income as follows (in thousands):
| | | | | | | | | | |
| | Fiscal Years | |
| |
|---|
| | 2014 | | 2013 | | Change | |
|---|
Term license revenues | | $ | (2,328 | ) | $ | (1,692 | ) | $ | (636 | ) |
Professional services and other | | | 959 | | | (2,190 | ) | | 3,149 | |
| | | | | | | | | | | |
Total net revenues | | $ | (1,369 | ) | $ | (3,882 | ) | $ | 2,513 | |
Professional services costs | |
$ |
995 | |
$ |
(1,082 |
) |
$ |
2,077 | |
Sales commissions costs | | | (137 | ) | | (55 | ) | | (82 | ) |
| | | | | | | | | | | |
Total net costs | | $ | 858 | | $ | (1,137 | ) | $ | 1,995 | |
| | | | | | | | | | | |
Operating income | | $ | (2,227 | ) | $ | (2,745 | ) | $ | 518 | |
| | | | | | | | | | | |
| | | | | | | | | | | |
| | | | | | | | | | | |
42
Table of Contents
As of December 31, 2014 and 2013, deferred revenue and directly-related expenses balances associated with our term licensing deferral were as follows (in thousands):
| | | | | | | |
| | December 31 | |
|---|
| | 2014 | | 2013 | |
|---|
Deferred revenues | | | | | | | |
Short-term | | $ | 35,739 | | $ | 33,505 | |
Long-term | | | 5,893 | | | 6,758 | |
| | | | | | | | |
Total | | $ | 41,632 | | $ | 40,263 | |
| | | | | | | | |
| | | | | | | | |
| | | | | | | | |
Directly-related expenses | | | | | | | |
Short-term | | $ | 10,894 | | $ | 11,055 | |
Long-term | | | 3,770 | | | 4,467 | |
| | | | | | | | |
Total | | $ | 14,664 | | $ | 15,522 | |
| | | | | | | | |
| | | | | | | | |
| | | | | | | | |
Deferred net revenues are classified as "Deferred revenues" (short-term and long-term), and directly-related expenses are classified as "Prepaid expenses and other," and "Other assets," respectively, in the consolidated balance sheets.
Non-GAAP Financial Measures and Other Operational Data
We consider certain operating measures, such as the annual contract value ("ACV") of term license, Black Diamond and Advent OnDemand contracts and renewal rates, annualized recurring run rate and certain financial measures that are not prepared in accordance with accounting principles generally accepted in the United States ("GAAP"), including non-GAAP net income, non-GAAP net income per share and free cash flow, in measuring the performance of our business. The non-GAAP measures are not based on any standardized methodology prescribed by GAAP and are not necessarily comparable to similar measures presented by other companies. However, we believe that this non-GAAP information is useful as an additional means for investors to evaluate our operating performance, when reviewed in conjunction with our GAAP financial statements. Therefore, these measures should not be considered in isolation or as a substitute for measures prepared in accordance with GAAP, and because these amounts are not determined in accordance with GAAP, they should not be used exclusively in evaluating our business and operations. In addition, undue reliance should not be placed upon non-GAAP or operating information because this information is neither standardized across companies nor subjected to the same control activities and audit procedures that produce our GAAP financial results.
43
Table of Contents
Bookings
The following table summarizes the Company's quarterly term license, Black Diamond and Advent OnDemand bookings (operational information) signed during the period and the associated average term (in thousands):
| | | | | | | | | | | | | | | | |
| | First
Quarter | | Second
Quarter | | Third
Quarter | | Fourth
Quarter | | Total | |
|---|
2014 | | | | | | | | | | | | | | | | |
Annual contract value(1) | | $ | 5,125 | | $ | 7,666 | | $ | 7,192 | | $ | 10,096 | | $ | 30,079 | |
Average term(2) | | | 2.5 | | | 2.5 | | | 2.5 | | | 2.9 | | | 2.6 | |
2013 | | |
| | |
| | |
| | |
| | |
| |
Annual contract value(1) | | $ | 8,664 | | $ | 6,659 | | $ | 7,103 | | $ | 8,762 | | $ | 31,188 | |
Average term(2) | | | 3.4 | | | 2.8 | | | 2.6 | | | 3.0 | | | 3.0 | |
2012 | | |
| | |
| | |
| | |
| | |
| |
Annual contract value(1) | | $ | 7,406 | | $ | 7,185 | | $ | 7,122 | | $ | 11,131 | | $ | 32,844 | |
Average term(2) | | | 3.3 | | | 2.6 | | | 2.9 | | | 2.9 | | | 2.9 | |
- (1)
- Annual contract value represents the annual contribution to revenue, once they are fully implemented, from term license, Black Diamond and Advent OnDemand contracts signed.
- (2)
- Average term is weighted by contract value for all new term licenses, Black Diamond and Advent OnDemand contracts signed in the period.
Annual contract value has decreased annually from 2012 to 2014 primarily due to consolidation and outsourcing trends in the investment management industry, slowdown of Axys migrations as customers waited for the broader introduction of Advent Direct, and lower client migrations from Axys to APX and Black Diamond.
Renewal Rates
Our renewal rates are based on cash collections and are disclosed one quarter in arrears. We disclose our renewal rates one quarter in arrears in order to include substantially all payments received against the invoices for that quarter. We also update our renewal rates from the initially disclosed rates to include all cash collections subsequent to the initial disclosure. We experience seasonality in our bookings and renewals. We believe that this seasonality results from customer budgeting cycles and expect it will continue in the future. As a result, the fourth quarter of the year typically has more
44
Table of Contents
bookings and renewal activity, followed by lower activity in the first quarter of the following year. The following table summarizes our initial and updated renewal rates (operational metric) since 2012:
| | | | | | | | |
Renewal Rates | | First
Quarter | | Second
Quarter | | Third
Quarter | | Fourth
Quarter |
|---|
Based on cash collections relative to prior year collections | | | | |
2014 | | | | | | | | |
Initially disclosed renewal rate(1) | | 94% | | 95% | | 93% | | (2) |
Updated disclosed renewal rate(3) | | 99% | | 97% | | n/a | | n/a |
2013 | | | | | | | | |
Initially disclosed renewal rate(1) | | 94% | | 92% | | 97% | | 95% |
Updated disclosed renewal rate(3) | | 99% | | 95% | | 100% | | 101% |
2012 | | | | | | | | |
Initially disclosed renewal rate(1) | | 91% | | 87% | | 94% | | 91% |
Updated disclosed renewal rate(3) | | 96% | | 92% | | 98% | | 96% |
- (1)
- "Initially Disclosed Renewal Rate" is based on cash collections and reported one quarter in arrears
- (2)
- The initially disclosed renewal rate for the fourth quarter of 2014 is not currently available as it is disclosed one quarter in arrears in order to include substantially all payments against invoices for this quarter
- (3)
- "Updated Disclosed Renewal Rate" reflects initially disclosed rate updated for subsequent cash collections and reported two quarters in arrears
Initially disclosed renewal rates have remained consistently in the 90% range historically except for the second quarter of 2012 which was negatively impacted by 3 points due to three EMEA customers ceasing business, deactivating or reducing use of our products. Updated renewal rates have historically been in the 90% range.
Annualized Recurring Run Rate
Currently, we offer our suite of products to our customers on premise and in the cloud on an Advent-hosted or third party-hosted basis. Advent OnDemand and Black Diamond are delivered in the cloud as our current SaaS product offerings. In addition, we made certain products from our new cloud platform, Advent Direct, available during 2014, and we expect to make more Advent Direct products broadly available to selected clients. We plan to continue to expand our current and future SaaS product offerings, including availability on mobile devices, and we believe that over time our SaaS-based product offerings will comprise an increasing share of our total recurring revenues as more customers adopt SaaS as their preferred solution.
To assist with the understanding of this transition, the related shift in revenue and changes within our recurring revenue streams, we are using certain performance metrics to assess the health and trajectory of our recurring revenues. This metric is the annualized run rate of all of our contracted recurring revenue streams as of a point in time and is calculated as of the end of each quarter by multiplying the last month of the quarter's contracted recurring revenues by twelve. The metric includes the combined effects of annual contract value, renewals and the existing run rate of recurring revenues in a single metric that is expressed as annualized recurring run rate. Annualized recurring run rate should be viewed independently of revenue, deferred revenue and unbilled deferred revenue as it is a performance metric and is not intended to be combined with any of these items. Annualized recurring run rate is not a forecast and does not include non-recurring revenues.
45
Table of Contents
The following table summarizes the Company's annualized recurring run rate as of the dates presented (in millions):
| | | | | | | | | | | | | |
| | March 31 | | June 30 | | September 30 | | December 31 | |
|---|
2014 | | | | | | | | | | | | | |
Annualized recurring run rate | | $ | 375.8 | | $ | 366.1 | | $ | 375.5 | | $ | 383.4 | |
Increase over prior year | | | 6 | % | | 3 | % | | 6 | % | | 7 | % |
2013 | | |
| | |
| | |
| | |
| |
Annualized recurring run rate | | $ | 352.9 | | $ | 356.6 | | $ | 353.9 | | $ | 359.2 | |
Increase over prior year | | | 9 | % | | 11 | % | | 4 | % | | 5 | % |
2012 | | |
| | |
| | |
| | |
| |
Annualized recurring run rate | | $ | 324.0 | | $ | 322.2 | | $ | 341.8 | | $ | 341.7 | |
Non-GAAP Net Income and Non-GAAP Net Income Per Share
Non-GAAP net income is calculated by adjusting GAAP net income for the provision for income taxes, stock-based compensation expense, amortization of acquired intangibles, restructuring charges, recapitalization costs and other non-recurring items. Non-GAAP net income per share is calculated by dividing non-GAAP net income by the weighted average number of diluted shares outstanding for the period. Non-GAAP net income and non-GAAP net income per share, and reconciliation to its most directly comparable GAAP financial measures, for fiscal 2014, 2013 and 2012 were as follows (in thousands, except per share amounts):
| | | | | | | | | | | | | | | | | | | |
| | Fiscal Years | |
|---|
| | 2014 | | 2013 | | 2012 | |
|---|
GAAP net income / net income per share from continuing operations | | $ | 50,263 | | $ | 0.94 | | $ | 28,752 | | $ | 0.54 | | $ | 30,231 | | $ | 0.58 | |
Amortization of acquired intangibles | | | 8,033 | | | 0.15 | | | 10,616 | | | 0.20 | | | 11,424 | | | 0.22 | |
Stock-based compensation | | | 29,371 | | | 0.55 | | | 48,179 | | | 0.90 | | | 20,801 | | | 0.40 | |
Restructuring charges | | | 4,628 | | | 0.09 | | | 3,770 | | | 0.07 | | | 3,634 | | | 0.07 | |
Recapitalization costs | | | — | | | — | | | 6,692 | | | 0.13 | | | — | | | — | |
Transaction related fees | | | — | | | — | | | 565 | | | 0.01 | | | — | | | — | |
Income tax adjustment(1) | | | (15,067 | ) | | (0.29 | ) | | (27,892 | ) | | (0.52 | ) | | (11,868 | ) | | (0.23 | ) |
| | | | | | | | | | | | | | | | | | | | |
Non-GAAP net income / net income per share | | $ | 77,228 | | $ | 1.44 | | $ | 70,682 | | $ | 1.32 | | $ | 54,222 | | $ | 1.03 | |
| | | | | | | | | | | | | | | | | | | | |
| | | | | | | | | | | | | | | | | | | | |
| | | | | | | | | | | | | | | | | | | | |
GAAP and Non-GAAP diluted weighted average shares | | | 53,608 | | | | | | 53,378 | | | | | | 52,425 | | | | |
- (1)
- The estimated non-GAAP effective tax rate was 35% and has been used to adjust the provision for income taxes for non-GAAP purposes.
The growth in non-GAAP net income and net income per share since 2012 reflects improved operating leverage in our business, as we have grown revenues at a faster pace than our variable costs, and the benefits from our recent re-organization plans implemented during the past several years.
Free Cash Flow
Free cash flow is defined as cash flow from operations less cash used for purchases of property and equipment, and capitalized software development costs. Free cash flow, and a reconciliation to its
46
Table of Contents
most directly comparable GAAP measure of operating cash flow, for fiscal 2014, 2013 and 2012 was as follows (in thousands):
| | | | | | | | | | |
| | Fiscal Years | |
|---|
| | 2014 | | 2013 | | 2012 | |
|---|
Cash provided by operating activities | | $ | 115,158 | | $ | 98,564 | | $ | 86,620 | |
Purchases of property and equipment | | | (8,973 | ) | | (5,616 | ) | | (6,369 | ) |
Capitalized software development costs | | | (1,873 | ) | | (1,995 | ) | | (2,137 | ) |
| | | | | | | | | | | |
Free cash flow | | $ | 104,312 | | $ | 90,953 | | $ | 78,114 | |
| | | | | | | | | | | |
| | | | | | | | | | | |
| | | | | | | | | | | |
The increase in free cash flow during 2014 reflects an improvement in operating cash flow from an improvement in operating margin and an increase in deferred income taxes, partially offset by capital expenditures associated with Advent Direct and the further build-out of our Beijing and Jacksonville offices, and a decrease in accrued liabilities. Growth in 2013 primarily reflects operating cash flow growth from strong accounts receivable collections, and less capital expenditure activity. We built-out our new office facilities in Jacksonville, Florida in 2012, which increased purchases of property and equipment in 2012.
Critical Accounting Policies and Estimates
Management's discussion and analysis of our financial condition and results of operations are based upon our consolidated financial statements and related notes, which have been prepared in accordance with accounting principles generally accepted in the United States of America. We review the accounting policies used in reporting our financial results on a regular basis. The preparation of these financial statements requires us to make estimates and judgments that affect the reported amounts of assets, liabilities, revenues and expenses, and related disclosure of contingent liabilities.
On an ongoing basis, we evaluate the process we use to develop estimates. We base our estimates on historical experience and on other information that we believe is reasonable for making judgments at the time the estimates are made. Actual results may differ from our estimates due to actual outcomes being different from those on which we based our assumptions.
We believe the following accounting policies contain the more significant judgments and estimates used in the preparation of our consolidated financial statements:
- •
- Revenue recognition and deferred revenues;
- •
- Income taxes;
- •
- Stock-based compensation;
- •
- Restructuring charges and related accruals;
- •
- Business combinations;
- •
- Goodwill impairment;
- •
- Impairment of long-lived assets;
- •
- Legal contingencies; and
- •
- Sales returns and accounts receivable allowances.
Revenue recognition and deferred revenues. We recognize revenue from term license, maintenance and other recurring revenues; perpetual license fees, professional services and other revenues. We offer a wide variety of products and services to a large number of financially sophisticated customers. While many of our license transactions, maintenance contracts,
47
Table of Contents
subscription-based transactions and professional services projects conform to a standard structure, many of our larger transactions are complex and may require significant review and judgment in our application of generally accepted accounting principles.
Software license fees. We recognize revenue from the licensing of software when persuasive evidence of an arrangement exists, the product has been delivered, the fee is fixed or determinable and collection of the resulting receivable is probable. We generally use a signed license agreement as evidence of an arrangement. Sales through our distributors are evidenced by a master agreement governing the relationship together with binding order forms and signed contracts from the distributor's customers. Revenue is recognized once delivery to the distributor's customer has taken place and when all other revenue recognition criteria have been met. Delivery occurs upon notification that software is available for electronic download through our fulfillment vendor, or when a product is delivered to a common carrier F.O.B shipping point, or upon confirmation that product delivered F.O.B shipping destination has been received. Some of our arrangements include acceptance provisions; if such acceptance provisions are present, delivery is deemed to occur upon acceptance. We assess whether the fee is fixed or determinable based on the payment terms associated with the transaction. We assess whether the collectability of the resulting receivable is probable based on a number of factors, including the credit worthiness of the customer determined through a credit review process, including credit reporting agency reports, publicly available customer information, financial statements and other available information and pertinent country risk if the customer is located outside the United States. Our standard payment terms are due at 180 days or less, but payment terms may vary based on the country in which the agreement is executed. Software licenses are sold with maintenance, and often professional services.
We typically license our products on a per server, per user basis with the price per customer varying based on the selection of the products licensed, the assets under administration, the number of site installations and the number of authorized users.
We categorize our revenues into two reporting elements—recurring and non-recurring revenues:
Recurring Revenues:
- •
- Term licenses
Term license contracts include both the software license and maintenance. We offer multi-year term licenses by which a customer makes a binding commitment that typically spans three years. For multi-year term licenses, we have not established vendor specific objective evidence ("VSOE") of fair value for the software license and maintenance components and, as a result, in situations where we are also performing related professional services, we defer all revenue and directly-related expenses under the arrangement until the implementation services are complete and the remaining services are substantially complete. At the point professional services are substantially completed, we recognize a pro-rata amount of the term license revenue, professional services fees earned and related expenses, based on the elapsed time from the start of the term license to the substantial completion of professional services. We determine whether services are substantially complete by consulting with our professional services group and applying management judgment. Term license revenue for the remaining contract years, the remaining deferred professional services revenue and related expenses are recognized ratably over the remaining contract length. When multi-year term licenses are sold and do not include related professional services, we recognize the entire term license revenue ratably over the period of the contract term from the effective date of the license agreement assuming all other revenue recognition criteria have been met.
48
Table of Contents
Assets Under Administration Revenues
Certain of our perpetual and term license contracts include asset-based fee structures that provide additional revenues based on the assets that the client administers using the Company's software, referred to as assets under administration or ("AUA"). Contracts containing an AUA fee structure have a defined measurement period (quarterly or annually) which requires the client to self-report actual AUA in arrears of the specified period. The Company recognizes term AUA contract minimum fees over the period of service. AUA fees above the stated minimum fee for the same period are considered incremental fees. Because incremental fees are neither determinable nor due and payable until the conclusion of the measurement period and reported, they are both earned and recognized upon completion of the measurement period and receipt of the report, on a quarterly or annual basis. Incremental fees from both term AUA and perpetual AUA contracts are included in "Recurring revenues" in our consolidated statements of operations.
- •
- Maintenance
We offer annual maintenance programs on perpetual licenses that provide for technical support and updates to our software products. Maintenance fees are bundled with perpetual license fees in the initial licensing period and charged separately for renewals of annual maintenance in subsequent years. Fair value for maintenance is based upon either renewal rates stated in the contracts or separate sales of renewals to customers. Revenue is recognized ratably, or daily, over the term of the maintenance period, typically one year.
- •
- Other Recurring Revenues
Other recurring revenues include revenues from our Software-as-a-Service ("SaaS") services, data services and other recurring revenue transactions. Our SaaS services include Advent OnDemand, Advent OnDemand with Data Management, and Black Diamond. Advent OnDemand is the hosting and SaaS delivery of our suite of investment management solutions. We recognize revenue ratably over the period of service which is generally one year. Advent OnDemand with Data Management services include access to our software on a SaaS basis as well as full account aggregation, daily portfolio reconciliation, corporate actions processing and reference data management. We price this comprehensive service offering based on the number of accounts managed for each customer. We measure the number of accounts quarterly in arrears and we recognize revenue for these services as they are performed. Black Diamond offers a platform that provides outsourced daily reconciliation and data management services as well as portfolio management and reporting delivered through an online web-based application. We price Black Diamond services based on the number of customers' accounts and the daily average of the assets under management ("AUM") within those accounts. We measure the number of accounts and AUM within customer accounts monthly in arrears and we recognize revenues for these services as they are performed.
Our data services include Advent Custodial Data, Advent Corporate Actions and Advent Index Data. We recognize revenue from data services either ratably over the subscription period or as the transactions occur within the subscription, based on the terms of the arrangement.
The Company recognizes revenue from other recurring revenue transactions either ratably over the subscription period or as the transactions occur based on the terms of the arrangement.
Non-Recurring Revenues:
- •
- Professional services and other revenues
We offer a variety of professional services that include project management, implementation, data conversion, integration, custom report writing and training. We establish VSOE of fair value for
49
Table of Contents
professional services upon separate sales of these services to customers. Our professional services are generally billed on a time and materials basis using hourly rates together with reimbursement for travel and accommodation expenses. We recognize revenue as these professional services are performed except in the case of multi-year term license contracts which are described in the "Term licenses" section above. Certain professional services arrangements involve acceptance criteria. In these cases, revenue and related expenses are recognized upon acceptance. Occasionally, professional services are performed under a fixed fee arrangement. For these arrangements, we defer revenue and related expenses until the services are complete. Professional services and other revenues also include revenue from our user conferences which is recognized upon completion of the conference.
- •
- Perpetual licenses
We allocate revenue to delivered elements, normally the license component of the arrangement, using the residual method, based on VSOE of fair value of the undelivered elements (generally the maintenance and professional services elements), which is specific to us. We determine the fair value of the undelivered elements based on the historical evidence of the Company's stand-alone sales of these elements to third parties and/or renewal rates. If VSOE of fair value does not exist for any undelivered elements, then the entire arrangement fee is deferred until delivery of that element has occurred unless the only undelivered element is maintenance. Revenues from perpetual licenses are included in "Non-recurring revenues" in the consolidated statements of operations.
Deferred revenues. Deferred revenue consists of billings or payments received in advance of revenue recognition and is recognized as the revenue recognition criteria are met. We generally invoice our customers annually or in monthly or quarterly installments and deferred revenues can be influenced by seasonality and timing of renewals. Deferred revenue that will be recognized during the succeeding 12-month periods is recorded as current deferred revenue, and the remaining portion is recorded as non-current deferred revenue.
Directly related expenses. When we defer service revenues, we also defer the direct costs incurred in the delivery of those services to the extent those costs are recoverable through future revenues, on non-cancelable contracts, as prepaid contract expense. We recognize those deferred costs as costs of professional services revenues proportionally and over the same period that the deferred revenue is recognized as service revenue. When we defer license revenue, we defer the direct incremental costs incurred as a result of selling the contract (i.e. sales commissions earned by the sales force as a part of their overall compensation) because those costs would not have been incurred but for the acquisition of that contract. We recognize those costs as sales and marketing expense proportionally and over the same period as the license revenues.
Income taxes. We account for worldwide income taxes under an asset and liability approach that requires the expected future tax consequences of temporary differences between book and tax bases of assets and liabilities to be recognized as deferred tax assets and liabilities. Significant judgment is required to determine our worldwide income tax provision. In the ordinary course of business, there are many transactions and calculations where the ultimate tax outcome is uncertain. Many of these uncertainties arise as a consequence of cost reimbursement arrangements among related entities, the process of identifying items of revenue and expense that have differing or preferential tax treatment and segregation of foreign and domestic income and expense to the appropriate taxing jurisdictions to reasonably allocate earnings. Although we believe that our judgments and estimates are reasonable, the final outcome could be different from that which is reflected in our income tax provision and accruals.
A valuation allowance is recorded to reduce the recognized net deferred tax assets to an amount that will more likely than not be realized. In order for us to realize our deferred tax assets, we must be
50
Table of Contents
able to generate sufficient future taxable income in the jurisdiction where the tax asset is located. We consider forecasted earnings, identified future taxable income and prudent and reasonable tax planning strategies in assessing the need for a valuation allowance.
We calculate our current and deferred tax provision based on estimates and assumptions that could differ from the actual results reflected in income tax returns filed during the subsequent year. Adjustments based on filed returns are generally recorded in the period when the return is filed and the tax implication is known.
We are subject to audits by state, federal and foreign tax authorities. Our estimates for the potential outcome of any uncertain tax matter are judgmental. We believe we have adequately provided for any reasonably foreseeable outcome related to these matters. However, our future results may include adjustments to our estimated tax liabilities.
Stock-based compensation. We currently use the Black-Scholes option pricing model to determine the fair value of stock options, stock appreciation rights ("SARs") and employee stock purchase plan ("ESPP") shares. The fair value of our restricted stock units is calculated based on the fair market value of our stock on the date of grant. The determination of the fair value of stock-based payment awards on the date of grant using an option-pricing model is affected by our stock price as well as assumptions regarding a number of complex and subjective variables. These variables include our expected stock price volatility over the term of the awards, actual and projected employee exercise behavior, the risk-free interest rate and expected dividends.
We estimate the volatility of our common stock based on an equally weighted average of historical and implied volatility of the Company's common stock as we believe this blended calculation of volatility is the most appropriate indicator of expected volatility and best reflects expected market conditions. We estimate the expected life of options and SARs granted based on historical experience of similar awards, giving consideration to the contractual terms or offering periods of the stock-based awards, vesting schedules and expectations of future employee behavior. We base the risk-free interest rate on the U.S. Treasury yield curve in effect at the date of grant for periods corresponding with the expected life of the options, SARs and ESPP shares. The expected dividend yield for each grant was determined by annualizing the most recent dividend declared and dividing the result by the Company's closing stock price on the date of grant. The dividend yield assumption for grants prior to April 28, 2014 was 0% based on the Company's history of not paying regular dividends and the future expectation of no recurring dividend payouts at the time of grant.
These variables are sensitive and change often. As a result, the financial impact from fair valuing shares granted can vary significantly from one period to the next. The following table reflects the change in the fair value of a hypothetical option or SAR as a result of a hypothetical change in one of the underlying assumptions:
| | | | | | | | | | | | | | |
Assumption | | Base Case | | Assumption
Change | | Value
Change | | Assumption
Change | | Value
Change | |
|---|
Grant and stock price | | $ | 32.00 | | +$1 | | $ | 0.26 | | –$1 | | $ | (0.26 | ) |
Risk-free interest rate | | | 1 | % | +0.5% | | $ | 0.22 | | –0.5% | | $ | (0.22 | ) |
Volatility | | | 35 | % | +5% | | $ | 1.14 | | –5% | | $ | (1.16 | ) |
Expected life (years) | | | 4 | | +1 year | | $ | 0.85 | | –1 year | | $ | (1.02 | ) |
Expected dividend yield | | | 1 | % | +1% | | $ | (0.75 | ) | –1% | | $ | 0.81 | |
Base Option Value | | $ | 8.41 | | | | | | | | | | | |
SARs and stock option awards granted to employees cliff vest 25% after one year and monthly thereafter over the next 36 months. Our restricted stock unit ("RSU") awards generally cliff vest 50% on the second anniversary and 50% on the fourth anniversary of the date of grant. ASC 718, "Compensation—Stock Compensation", requires forfeitures to be estimated at the time of grant and
51
Table of Contents
revised, if necessary, in subsequent periods if actual forfeitures differ from those estimates. Forfeitures are estimated based on our annual forfeiture rate, which is based on our historical forfeiture experience over the last ten years. Adjustments for actual forfeitures are recorded on the date of forfeiture.
Although we believe the assumptions and estimates we have made in the past have been reasonable and appropriate, different assumptions and estimates could materially impact our reported financial results. A decrease in our annual forfeiture rate assumption would increase stock-based compensation expense. The estimated impact of a hypothetical 500 basis point decrease in the annual forfeiture rate on stock-based compensation expense for 2014 and unamortized stock-based compensation expense at December 31, 2014 would have been increases of approximately $0.6 million and $3.9 million, respectively.
Restructuring charges and related accruals. We have developed and implemented formalized plans for restructuring our business to better align our resources to market conditions and recorded significant charges. In connection with these plans, we recorded estimated expenses for severance and benefits, lease cancellations, asset write-offs and other restructuring costs. Given the significance of, and the timing of the execution of such activities, this process is complex and involves periodic reassessments of estimates made at the time the original decisions were made, including evaluating real estate market conditions for expected vacancy periods and sub-lease rents. We continually evaluate the adequacy of the remaining liabilities under our restructuring initiatives. Although we believe that these estimates accurately reflect the costs of our restructuring plans, actual results may differ, thereby requiring us to record additional provisions or reverse a portion of such provisions.
Business combinations. When we acquire businesses, we allocate the purchase price to tangible assets and liabilities, and identifiable intangible assets acquired. Any residual purchase price is recorded as goodwill. The allocation of the purchase price requires management to make significant estimates in determining the fair values of assets acquired and liabilities assumed, especially with respect to intangible assets. These estimates are based on historical experience and information obtained from the management of the acquired companies. These estimates can include, but are not limited to, the cash flows that an asset is expected to generate in the future, the appropriate weighted-average cost of capital, and the cost savings expected to be derived from acquiring an asset. These estimates are inherently uncertain and unpredictable. In addition, unanticipated events and circumstances may occur which may affect the accuracy or validity of such estimates.
Goodwill impairment. We review our goodwill for impairment annually during the fourth quarter of our fiscal year, as of November 1, and more frequently if an event or circumstance indicates that an impairment loss has occurred. We are required to test our goodwill for impairment at the reporting unit level.
Our test for goodwill impairment starts with a qualitative assessment to determine whether it is necessary to perform the quantitative goodwill impairment test. If we determine, based on the qualitative factors, that the fair value of the reporting unit is more likely than not less than the carrying amount, then a quantitative goodwill impairment test is required.
The quantitative test for goodwill impairment is a two-step process. The first step compares the fair value of each reporting unit with its respective carrying amount, including goodwill. If the fair value of the reporting unit exceeds its carrying amount, goodwill of our reporting unit is considered not impaired, thus the second step of the impairment test is unnecessary. The second step, used to measure the amount of impairment loss, compares the implied fair value of each reporting unit's goodwill with the respective carrying amount of that goodwill. If the carrying amount of the reporting unit goodwill exceeds the implied fair value of that goodwill, an impairment loss shall be recognized in an amount equal to that excess.
52
Table of Contents
Determining the fair value of a reporting unit is subjective and requires judgment at many points during the test including the development of future revenue and expense forecasts used to calculate future cash flows, the selection of risk-adjusted discount rates, and determination of market comparable entities.
Refer to Note 6 "Goodwill" to our consolidated financial statements, included under Item 8 of this Annual Report on Form 10-K, for information about our annual goodwill testing.
Impairment of long-lived assets. We review our long-lived assets including property and equipment and finite-lived intangible assets for impairment whenever events or changes in circumstances indicate that the carrying amount of these assets may not be recoverable. Determining whether an impairment trigger has occurred is subjective and requires judgment. Our recoverability test compares the assets' carrying amount to their expected future undiscounted net cash flows. We estimate future revenue and expense amounts over the asset's useful life to calculate future cash flows. We believe our forecast revenue and expense amounts are reasonable but forecasts are inherently uncertain and unpredictable.
Legal contingencies. From time to time, Advent is involved in claims and legal proceedings that arise in the ordinary course of business. We use our judgment to assess both the likelihood and potential amount of a contingency. We periodically review our assessment whenever there is a change in the facts and circumstances of these proceedings. Litigation is subject to inherent uncertainties and our view of these matters may change in the future. Were an unfavorable outcome to occur, there exists the possibility of a material adverse impact on our financial position and results of operations for the period in which the unfavorable outcome occurs, and potentially in future periods.
Sales returns and accounts receivable allowances. Our standard practice is to enforce our contract terms and not allow our customers to return software. We have, however, allowed customers to return software on a limited case-by-case basis and have recorded sales returns provisions as offsets to revenue in the period the sales return becomes probable. We use our judgment in estimating our sales returns. We analyze customer demand, acceptance of products and historical returns when evaluating the adequacy of the allowance for sales returns, which are not generally provided. In certain instances, we also make adjustments to receivable balances for concessions, and product or seat downgrades. Those adjustments are analyzed under the same methodology as performed for the sales returns and included in the reserve balance.
Our ability to estimate returns is based on our long history of experience with relatively homogenous transactions and the fact that the return period is short. The estimates for returns are adjusted periodically based upon changes in historical rates of returns and other related factors. We had allowances for sales returns for these situations based on our historical experience of $2.1 million, $2.7 million and $3.0 million as of December 31, 2014, 2013 and 2012, respectively.
We use our judgment in estimating our allowance for doubtful accounts. In order to estimate our allowance for doubtful accounts, we analyze specific accounts receivables, historical bad debts, customer concentrations, customer credit-worthiness, current economic trends and changes in customer payment terms. We had allowances for doubtful accounts of $36,000, $0.2 million and $0.1 million as of December 31, 2014, 2013 and 2012.
53
Table of Contents
Results of Operations for Fiscal Years 2014, 2013 and 2012
The following table summarizes, for the periods indicated, certain items in the consolidated statements of operations as a percentage of net revenues. The financial information and the ensuing discussion should be read in conjunction with the accompanying consolidated financial statements and notes thereto.
| | | | | | | | | | |
| | Fiscal Years | |
|---|
| | 2014 | | 2013 | | 2012 | |
|---|
Net revenues: | | | | | | | | | | |
Recurring revenues | | | 92 | % | | 91 | % | | 90 | % |
Non-recurring revenues | | | 8 | | | 9 | | | 10 | |
| | | | | | | | | | | |
Total net revenues | | | 100 | | | 100 | | | 100 | |
Cost of revenues: | | |
| | |
| | |
| |
Recurring revenues | | | 20 | | | 18 | | | 19 | |
Non-recurring revenues | | | 8 | | | 10 | | | 12 | |
Amortization of developed technology | | | 2 | | | 2 | | | 3 | |
| | | | | | | | | | | |
Total cost of revenues | | | 30 | | | 31 | | | 34 | |
| | | | | | | | | | | |
Gross margin | | | 70 | | | 69 | | | 66 | |
Operating expenses: | | |
| | |
| | |
| |
Sales and marketing | | | 19 | | | 21 | | | 21 | |
Product development | | | 18 | | | 18 | | | 19 | |
General and administrative | | | 11 | | | 14 | | | 11 | |
Amortization of other intangibles | | | 1 | | | 1 | | | 1 | |
Recapitalization costs | | | * | | | 2 | | | * | |
Restructuring charges | | | 1 | | | 1 | | | 1 | |
| | | | | | | | | | | |
Total operating expenses | | | 49 | | | 57 | | | 52 | |
| | | | | | | | | | | |
Income from continuing operations | | | 21 | | | 12 | | | 14 | |
Interest expense | | |
(2 |
) | |
(2 |
) | |
(1 |
) |
Interest income and other expense, net | | | * | | | * | | | * | |
| | | | | | | | | | | |
Income from continuing operations before income taxes | | | 19 | | | 10 | | | 13 | |
Provision for income taxes | | | 7 | | | 3 | | | 5 | |
| | | | | | | | | | | |
Net income from continuing operations | | | 13 | | | 8 | | | 8 | |
Discontinued operation: | | |
| | |
| | |
| |
Net (loss) income from discontinued operation | | | * | | | * | | | * | |
| | | | | | | | | | | |
Net income | | | 13 | % | | 8 | % | | 8 | % |
| | | | | | | | | | | |
| | | | | | | | | | | |
| | | | | | | | | | | |
Percentages are based on actual values. Totals may not sum due to rounding.
| |
54
Table of Contents
NET REVENUES
| | | | | | | | | | |
| | Fiscal Years | |
|---|
| | 2014 | | 2013 | | 2012 | |
|---|
| | (in thousands, except percentages)
| |
|---|
Total net revenues | | $ | 396,820 | | $ | 382,959 | | $ | 358,819 | |
Change over prior year | | $ | 13,861 | | $ | 24,140 | | | | |
Percent change over prior year | | | 4 | % | | 7 | % | | | |
We derive our revenues from two sources: recurring revenues and non-recurring revenues. Recurring revenues are comprised of term license, perpetual maintenance arrangements and other recurring revenues (which includes revenues from Black Diamond, Advent OnDemand and incremental Assets Under Administration ("AUA") fees from perpetual licenses). The revenues from a term license, which includes both software license and maintenance services, are earned under a time based contract. Maintenance revenues are derived from maintenance fees on perpetual license arrangements. Other recurring revenues are derived from our subscription services and transaction-based services as well as AUA fees for certain perpetual arrangements. Non-recurring revenues consist of professional services and other revenue and perpetual license fees. Professional services and other revenues include fees for consulting, fees from training, project management services and our client conferences. Perpetual license revenues are derived from the licensing of software products under a perpetual arrangement. Sales returns, which we generally do not provide to customers, are accounted for as deductions to these two revenue categories based on our historical experience.
Revenues from recurring and non-recurring sources, as a percentage of total net revenues for the periods presented, were as follows:
| | | | | | | | | | |
As a percentage of net revenues | | 2014 | | 2013 | | 2012 | |
|---|
Revenues from recurring sources | | | 92 | % | | 91 | % | | 90 | % |
Revenues from non-recurring sources | | | 8 | % | | 9 | % | | 10 | % |
Revenues derived from sales outside the U.S. were 19%, 18% and 17% of total net revenues in 2014, 2013 and 2012, respectively. The increase during 2014 primarily reflects higher average billings to customers outside the U.S. Except for the U.S., the revenues from customers in any single country did not exceed 10% of total net revenues.
Recurring Revenues
| | | | | | | | | | |
| | Fiscal Years | |
|---|
| | 2014 | | 2013 | | 2012 | |
|---|
| | (in thousands, except percentages)
| |
|---|
Term license revenues | | $ | 194,169 | | $ | 180,479 | | $ | 159,940 | |
Perpetual maintenance revenues | | | 64,100 | | | 65,412 | | | 67,063 | |
Other recurring revenues | | | 107,021 | | | 103,990 | | | 97,624 | |
| | | | | | | | | | | |
Total recurring revenues | | $ | 365,290 | | $ | 349,881 | | $ | 324,627 | |
Percent of total net revenues | | | 92 | % | | 91 | % | | 90 | % |
Change over prior year | | $ | 15,409 | | $ | 25,254 | | | | |
Percent change over prior year | | | 4 | % | | 8 | % | | | |
Revenues from term licenses, which include both the software license and maintenance services for term licenses, increased $13.7 million, or 8%, in 2014, and $20.5 million, or 13%, in 2013. This growth of term license revenues reflects strong renewals, the continued layering of incremental annual contract value ("ACV") of term licenses sold in previous periods into our term revenue and the continued market acceptance of our products. Our bookings in 2014, 2013 and 2012 will contribute approximately
55
Table of Contents
$30.1 million, $31.2 million and $32.8 million, respectively, in annual revenue once they are fully implemented. Additionally, adding to the increase in term license revenues was an increase in incremental AUA fees for term licenses of $1.4 million in 2014.
For our term licenses, we defer all revenue on new bookings until our implementation services are complete. The change in our term license implementation deferral increased/(decreased) term license revenues as follows (in thousands):
| | | | | | | | | | |
| | Fiscal Years | |
|---|
| | 2014 | | 2013 | | 2012 | |
|---|
Term license revenues | | $ | (2,328 | ) | $ | (1,692 | ) | $ | 1,060 | |
Change over prior year | | $ | (636 | ) | $ | (2,752 | ) | | | |
The net deferral of term license revenues for 2014 and 2013 was primarily due to the dollar value associated with projects that commenced the implementation phase exceeded the dollar value of projects that completed the implementation phase. This contributed to decreases in term license revenues of $0.6 million and $2.7 million in 2014 and 2013, respectively.
Generally, we sell very few perpetual licenses to new customers. Maintenance revenues from perpetual licenses decreased by $1.3 million and $1.7 million during 2014 and 2013, respectively. These decreases were due to maintenance de-activations from customer attrition, maintenance level downgrades, reductions in products licensed or number of users by clients, perpetual license customers migrating to term licenses, and a decrease in new perpetual license customers, partially offset by the impact of price increases. We expect the downward trend in maintenance revenues from perpetual licenses to continue as we continue sell principally term licenses.
Other recurring revenues, which primarily include revenues from incremental assets under administration ("AUA") fees from perpetual licenses, data services, outsourced services, Advent OnDemand, web-based services and Black Diamond, increased $3.0 million and $6.4 million during 2014 and 2013, respectively. These increases were primarily due to growth in revenues from our Black Diamond product, which was acquired in June 2011, of $7.1 million in 2014 and $6.2 million in 2013; and to a lesser extent, growth in revenues from data services, outsourced services, and web-based services.
Non-Recurring Revenues
| | | | | | | | | | |
| | Fiscal Years | |
|---|
| | 2014 | | 2013 | | 2012 | |
|---|
| | (in thousands, except percentages)
| |
|---|
Professional services and other revenues | | $ | 29,623 | | $ | 30,866 | | $ | 31,280 | |
Perpetual license fees | | | 1,907 | | | 2,212 | | | 2,912 | |
| | | | | | | | | | | |
Total non-recurring revenues | | $ | 31,530 | | $ | 33,078 | | $ | 34,192 | |
Percent of total net revenues | | | 8 | % | | 9 | % | | 10 | % |
Change over prior year | | $ | (1,548 | ) | $ | (1,114 | ) | | | |
Percent change over prior year | | | (5 | )% | | (3 | )% | | | |
Non-recurring revenues consists of professional services and other revenues, and perpetual license fees. Professional services and other revenues include fees for consulting, project management, custom implementation and integration, custom report writing, training and our client conference. Perpetual license revenues are derived from the licensing of software products under a perpetual arrangement.
Professional services projects related to Axys, Moxy and Partner products generally can be completed in a two- to six-month time period, while services related to Geneva and APX products may require four-to nine-months. We defer professional services revenue for services performed on term
56
Table of Contents
license implementations that are not considered substantially complete. Service revenue is deferred until the implementation is complete and remaining services are substantially completed. Upon substantial completion, we recognize a pro-rata amount of professional services fees earned based on the elapsed time from the start of the term license to the substantial completion of professional services. The remaining deferred professional services revenue is recognized ratably over the remaining contract term.
Professional services and other revenues changed due to the following (in thousands):
| | | | | | | |
| | Change From
2013 to 2014 | | Change From
2012 to 2013 | |
|---|
Decreased consulting services | | $ | (991 | ) | $ | (5,121 | ) |
Increased (decreased) revenue related to term license implementation deferral | | | 3,149 | | | (2,141 | ) |
(Decreased) increased data conversion | | | (842 | ) | | 3,522 | |
(Decreased) increased training | | | (854 | ) | | 2,085 | |
(Decreased) increased project management | | | (884 | ) | | 1,050 | |
(Decreased) increased custom report services | | | (729 | ) | | 967 | |
Other items | | | (92 | ) | | (776 | ) |
| | | | | | | | |
Total change | | $ | (1,243 | ) | $ | (414 | ) |
| | | | | | | | |
| | | | | | | | |
| | | | | | | | |
The decrease in professional services and other revenues during 2014 was primarily due to decreased demand from new client implementations during 2014. These decreases in 2014 were partially offset by the release of deferred professional services revenues (and associated costs) as more projects were completed in 2014 compared to 2013.
On January 1, 2013, we began reporting professional service revenues on a more granular level. As a result, professional services revenue, which was previously classified as consulting services in 2012, has been subsequently classified as data conversion, training and customer reports revenue which is reflected in the decrease in consulting services revenues and the increases in data conversion training and custom report services revenues in 2013 compared to 2012. The overall decrease in professional services and other revenues in 2013 primarily reflected a reduction in professional services activity as well as a reduction in the use of third party vendors.
The term license implementation deferral increased and decreased professional services and other revenues for the following periods presented as follows (in thousands):
| | | | | | | | | | |
| | Fiscal Years | |
|---|
| | 2014 | | 2013 | | 2012 | |
|---|
Professional services and other | | $ | 959 | | $ | (2,190 | ) | $ | (49 | ) |
Change over prior year | | $ | 3,149 | | $ | (2,141 | ) | | | |
During 2014, the term license deferral increased professional services and other revenue by $3.1 million compared to the prior year due to a term license implementation revenue release of $1.0 million (relatively more projects completed than were in the implementation stage) during 2014 versus a revenue deferral of $2.2 million (relatively more projects were in the implementation stage than completed) in 2013. The net deferral of $2.2 million during 2013 was primarily due to relatively more projects in the implementation phase as a result of strong bookings in the latter half of 2012 and first half of 2013.
In 2014 and 2013, total perpetual license fees decreased $0.3 million and $0.7 million, respectively, primarily due to a decrease in sales of perpetual seat licenses and modules to our existing perpetual client base.
57
Table of Contents
COST OF REVENUES
| | | | | | | | | | | | | | | | |
| | Fiscal Years | |
|---|
| | 2014 | | Change | | 2013 | | Change | | 2012 | |
|---|
| | (in thousands, except percentages)
| |
|---|
Stock-based compensation expense | | $ | 4,585 | | $ | (2,159 | ) | $ | 6,744 | | $ | 3,103 | | $ | 3,641 | |
All other cost of revenues | | $ | 112,936 | | $ | (41 | ) | $ | 112,977 | | $ | (6,098 | ) | $ | 119,075 | |
Percent of total net revenues | | | 28 | % | | | | | 30 | % | | | | | 33 | % |
Total cost of revenues | |
$ |
117,521 | |
$ |
(2,200 |
) |
$ |
119,721 | |
$ |
(2,995 |
) |
$ |
122,716 | |
Percent of total net revenues | | | 30 | % | | | | | 31 | % | | | | | 34 | % |
Cost of revenues is made up of three components: cost of recurring revenues, cost of non-recurring revenues and amortization of developed technology.
The decrease in total cost of revenues in 2014 was primarily due to lower stock-based compensation expense. The decrease in total cost of revenues in 2013 was primarily due to lower costs as a result of the re-organization plan that was approved in October 2012, partially offset by stock-based compensation expense associated with the equity award modification in 2013.
Gross margin improved to 70% in 2014 from 69% in 2013 due to higher billable utilization of professional services consultants, improved efficiency in our global support organization and less amortization expense as certain technology-related intangibles became fully amortized. The impact of these factors were partially offset by investments to support our recurring revenues. Gross margin improved to 69% in 2013 from 66% in 2012 as we expanded both our recurring and non-recurring revenue gross margins from our improved efficiency in our global support organization and higher billable utilization of professional services consultants. Gross margin for 2013 also included the impact of increased stock-based compensation expense associated with the equity award modification in 2013.
Cost of Recurring Revenues
| | | | | | | | | | | | | | | | |
| | Fiscal Years | |
|---|
| | 2014 | | Change | | 2013 | | Change | | 2012 | |
|---|
| | (in thousands, except percentages)
| |
|---|
Stock-based compensation expense | | $ | 3,250 | | $ | (241 | ) | $ | 3,491 | | $ | 1,086 | | $ | 2,405 | |
All other cost of recurring revenues | | $ | 77,119 | | $ | 10,020 | | $ | 67,099 | | $ | 551 | | $ | 66,548 | |
Percent of total recurring revenues | | | 21 | % | | | | | 19 | % | | | | | 20 | % |
Total cost of recurring revenues | |
$ |
80,369 | |
$ |
9,779 | |
$ |
70,590 | |
$ |
1,637 | |
$ |
68,953 | |
Percent of total recurring revenues | | | 22 | % | | | | | 20 | % | | | | | 21 | % |
Cost of recurring revenues consists of the direct costs related to providing and supporting our outsourced services, providing technical support services under maintenance and term license agreements and other services for recurring revenues, and royalties paid to third party vendors. Gross margins for recurring revenues were 78%, 80% and 79% during 2014, 2013 and 2012, respectively.
58
Table of Contents
Cost of recurring revenues changed due to the following (in thousands):
| | | | | | | |
| | Change From
2013 to 2014 | | Change From
2012 to 2013 | |
|---|
Increased outside services | | $ | 4,535 | | $ | 1,147 | |
Increased (decreased) payroll and related | | | 2,998 | | | (1,230 | ) |
Increased allocation-in of facility and infrastructure expenses | | | 1,445 | | | 1,446 | |
Increased (decreased) travel and entertainment | | | 649 | | | (773 | ) |
Increased (decreased) depreciation | | | 276 | | | (430 | ) |
(Decreased) increased stock-based compensation | | | (241 | ) | | 1,086 | |
Other items | | | 117 | | | 391 | |
| | | | | | | | |
Total change | | $ | 9,779 | | $ | 1,637 | |
| | | | | | | | |
| | | | | | | | |
| | | | | | | | |
The increase in cost of recurring revenues in 2014 was primarily due to increased outside services resulting from IT infrastructure services and client support services. The increase in outside services costs reflects increased utilization of third-party contractors related to our new cloud platform, Advent Direct. Additionally, increases in payroll and related costs due to increased headcount, allocation-in of facility and infrastructure expenses, travel and entertainment and depreciation related to capitalized internal-use software costs contributed to the overall increase in 2014, which was partially offset by decreased stock-based compensation expense. Headcount in our client support group increased to 363 at December 31, 2014 from 341 at December 31, 2013.
The increase in cost of recurring revenues in 2013 was primarily due to an increase in allocation-in of facility and infrastructure expenses as infrastructure costs increased in 2013, increased outside services and the increase in stock-based compensation expense associated with our equity award modification in 2013. These increases were partially offset by the decreases in payroll and related costs which reflects lower salary and benefits expenses as a result of less headcount from the re-organization plan that was approved in October 2012 and decreased travel and entertainment costs due to less travel associated with providing technical support services.
Cost of Non-Recurring Revenues
| | | | | | | | | | | | | | | | |
| | Fiscal Years | |
|---|
| | 2014 | | Change | | 2013 | | Change | | 2012 | |
|---|
| | (in thousands, except percentages)
| |
|---|
Stock-based compensation expense | | $ | 1,335 | | $ | (1,918 | ) | $ | 3,253 | | $ | 2,017 | | $ | 1,236 | |
All other cost of non-recurring revenues | | $ | 29,045 | | $ | (7,746 | ) | $ | 36,791 | | $ | (5,478 | ) | $ | 42,269 | |
Percent of total non-recurring revenues | | | 92 | % | | | | | 111 | % | | | | | 124 | % |
Total cost of non-recurring revenues | |
$ |
30,380 | |
$ |
(9,664 |
) |
$ |
40,044 | |
$ |
(3,461 |
) |
$ |
43,505 | |
Percent of total non-recurring revenues | | | 96 | % | | | | | 121 | % | | | | | 127 | % |
Cost of non-recurring revenues consists of expenses associated with professional services and other fees, and perpetual license fees. Costs associated with professional services and other revenue consists primarily of personnel related costs associated with the professional services organization in providing consulting, custom report writing and data conversion from clients' previous systems. Costs associated with perpetual license fees consists primarily of royalties and other fees paid to third parties, the fixed direct labor and third party costs involved in producing and distributing our software, and cost of product media including duplication, manuals and packaging materials. Also included are direct costs associated with third-party consultants.
59
Table of Contents
At the point professional services are substantially completed, we recognize a pro-rata amount of the related expenses based on the elapsed time from the start of the term license to the substantial completion of professional services. The remainder of the related expenses are recognized ratably over the remaining contract term. Indirect costs such as management and other overhead expenses are recognized in the period in which they are incurred.
Cost of non-recurring revenues changed due to the following (in thousands):
| | | | | | | |
| | Change From
2013 to 2014 | | Change From
2012 to 2013 | |
|---|
Decreased payroll and related | | $ | (3,981 | ) | $ | (2,393 | ) |
Decreased outside services and contractors | | | (3,820 | ) | | (1,548 | ) |
(Decreased) increased stock-based compensation | | | (1,918 | ) | | 2,017 | |
(Decreased) increased allocation-in of facility and infrastructure expenses | | | (1,346 | ) | | 126 | |
Decreased travel and entertainment | | | (429 | ) | | (1,248 | ) |
(Decreased) increased marketing | | | (246 | ) | | 370 | |
Increased (decreased) cost related to term license implementations deferral | | | 2,077 | | | (256 | ) |
Other items | | | (1 | ) | | (529 | ) |
| | | | | | | | |
Total change | | $ | (9,664 | ) | $ | (3,461 | ) |
| | | | | | | | |
| | | | | | | | |
| | | | | | | | |
The decrease in 2014 is primarily due to decreased payroll and related (primarily lower salary and bonus expense), lower stock-based compensation expense from less headcount, and decreased outside contractor costs as the Company has focused on reducing costs and improving margins for the professional services practice. Headcount in professional services decreased to 93 at December 31, 2014 compared to 117 at December 31, 2013. Additionally, there was a decrease in allocation-in of facility and infrastructure expenses as headcount decreased relative to other departments within the Company. These decreases in 2014 were partially offset by the release of deferred professional services costs (and associated revenue) as more projects were completed in 2014 compared to 2013.
The decrease in 2013 primarily reflects a decrease in payroll and related costs which reflects lower salary and bonus expenses from less headcount as a result of the 2012 re-organization plan, decreased utilization of third-party contractors, decreased travel and entertainment costs due to less travel activity by consultants, changes in deferred professional service costs as projects are started and completed, and classification of certain costs of our professional services team into cost of recurring and product development. Certain professional services resources were redeployed to our cost of recurring or product development groups in 2013 and, as a result, their associated costs are now classified in cost of recurring or product development effective January 1, 2013. These decreases were partially offset by an increase in stock-based compensation expense associated with the equity award modification and increases in marketing costs for our annual client conference, which was held in San Francisco in 2013.
The term license deferral increased/(decreased) professional services costs for the following periods presented as follows (in thousands):
| | | | | | | | | | |
| | Fiscal Years | |
|---|
| | 2014 | | 2013 | | 2012 | |
|---|
Professional services costs | | $ | 995 | | $ | (1,082 | ) | $ | (826 | ) |
Change over prior year | | $ | 2,077 | | $ | (256 | ) | | | |
In 2014, fewer projects were ongoing compared to 2013, resulting in a net term license implementation release associated with in-process term license implementations. In 2013, relatively
60
Table of Contents
more projects were ongoing as compared to 2012, resulting in the increase in net term license implementation deferral associated with in-process term license implementations.
Gross margins for non-recurring revenues were 4%, (21)% and (27)% during 2014, 2013 and 2012, respectively. The improvement in gross margin during 2014 and 2013 was primarily due to higher billable utilization of professional services consultants. The improvement in 2013 was also due to higher billable utilization but was partially offset by incremental stock-based compensation expense associated with our modification of outstanding equity awards in 2013.
Amortization of Developed Technology
| | | | | | | | | | |
| | Fiscal Years | |
|---|
| | 2014 | | 2013 | | 2012 | |
|---|
| | (in thousands, except percentages)
| |
|---|
Amortization of developed technology | | $ | 6,772 | | $ | 9,087 | | $ | 10,258 | |
Percent of total net revenues | | | 2 | % | | 2 | % | | 3 | % |
Change over prior year | | $ | (2,315 | ) | $ | (1,171 | ) | | | |
Percent change over prior year | | | (25 | )% | | (11 | )% | | | |
Amortization of developed technology represents amortization of acquisition-related intangibles and amortization of capitalized software development costs. The decrease in 2014 and 2013 was primarily due to decreased amortization from certain developed technology assets that fully amortized during these years including those associated with Tamale Software, Inc. (acquired in 2008) and Syncova Solutions Ltd. (acquired in 2011), partially offset by additional amortization from software development costs capitalized during 2014 and 2013.
OPERATING EXPENSES
Sales and Marketing
| | | | | | | | | | | | | | | | |
| | Fiscal Years | |
|---|
| | 2014 | | Change | | 2013 | | Change | | 2012 | |
|---|
| | (in thousands, except percentages)
| |
|---|
Stock-based compensation expense | | $ | 10,026 | | $ | (3,239 | ) | $ | 13,265 | | $ | 6,100 | | $ | 7,165 | |
All other sales and marketing | | $ | 64,970 | | $ | (830 | ) | $ | 65,800 | | $ | (1,723 | ) | $ | 67,523 | |
Percent of total net revenues | | | 16 | % | | | | | 17 | % | | | | | 19 | % |
Sales and marketing | |
$ |
74,996 | |
$ |
(4,069 |
) |
$ |
79,065 | |
$ |
4,377 | |
$ |
74,688 | |
Percent of total net revenues | | | 19 | % | | | | | 21 | % | | | | | 21 | % |
Sales and marketing expenses consist primarily of the costs of personnel involved in the sales and marketing process, sales commissions, advertising and promotional materials, sales facilities expense, trade shows, and seminars.
61
Table of Contents
Sales and marketing expense changed due to the following (in thousands):
| | | | | | | |
| | Change From
2013 to 2014 | | Change From
2012 to 2013 | |
|---|
(Decreased) increased stock-based compensation | | $ | (3,239 | ) | $ | 6,100 | |
Decreased payroll and related | | | (952 | ) | | (3,048 | ) |
(Decreased) increased computers and telecom | | | (532 | ) | | 17 | |
(Decreased) increased marketing | | | (237 | ) | | 555 | |
Increased allocation-in of facility and infrastructure expenses | | | 451 | | | 342 | |
Increased travel and entertainment | | | 181 | | | 341 | |
Other items | | | 259 | | | 70 | |
| | | | | | | | |
Total change | | $ | (4,069 | ) | $ | 4,377 | |
| | | | | | | | |
| | | | | | | | |
| | | | | | | | |
The decrease in sales and marketing expenses of $4.1 million in 2014 was primarily due to less stock-based compensation expense related to the equity award modification that took place in 2013, lower payroll and related expenses due to less commission and payroll tax costs associated with decreased headcount to 178 at December 31, 2014 from 187 at December 31, 2013 and lower computer and telecom expense. These decreases were partially offset by increased allocation-in of facility and infrastructure expenses.
The increase in total sales and marketing expenses in absolute dollars in 2013 was primarily due to the increase in stock-based compensation expense associated with the equity award modification and, to a lesser extent, higher marketing expenses as a result of our rebranding in 2013. These increases were partially offset by lower payroll and related expenses resulting from reduced headcount due to the re-organization plan that was approved in 2012. Headcount decreased to 187 at December 31, 2013 from 211 at December 31, 2012.
Product Development
| | | | | | | | | | | | | | | | |
| | Fiscal Years | |
|---|
| | 2014 | | Change | | 2013 | | Change | | 2012 | |
|---|
| | (in thousands, except percentages)
| |
|---|
Stock-based compensation expense | | $ | 7,735 | | $ | (1,128 | ) | $ | 8,863 | | $ | 3,042 | | $ | 5,821 | |
All other product development | | $ | 61,797 | | $ | 942 | | $ | 60,855 | | $ | (338 | ) | $ | 61,193 | |
Percent of total net revenues | | | 16 | % | | | | | 16 | % | | | | | 17 | % |
Product development | |
$ |
69,532 | |
$ |
(186 |
) |
$ |
69,718 | |
$ |
2,704 | |
$ |
67,014 | |
Percent of total net revenues | | | 18 | % | | | | | 18 | % | | | | | 19 | % |
Product development expenses consist primarily of salary and benefits for our development staff as well as contractors' fees and other costs associated with the enhancements of existing products and services and development of new products and services.
62
Table of Contents
We invested 18%, 18% and 19% of our revenues in product development during 2014, 2013 and 2012, respectively. Product development expenses changed due to the following (in thousands):
| | | | | | | |
| | Change From
2013 to 2014 | | Change From
2012 to 2013 | |
|---|
Increased capitalization of internal use software | | $ | (3,717 | ) | $ | (1,461 | ) |
(Decreased) increased stock-based compensation | | | (1,128 | ) | | 3,042 | |
(Decreased) increased computers and telecom | | | (374 | ) | | 25 | |
Increased outside services and contractors | | | 2,866 | | | 1,195 | |
Increased (decreased) travel and entertainment | | | 891 | | | (184 | ) |
Increased allocation-in of facility and infrastructure expenses | | | 689 | | | 865 | |
Increased (decreased) payroll and related | | | 571 | | | (1,231 | ) |
Other items | | | 16 | | | 453 | |
| | | | | | | | |
Total change | | $ | (186 | ) | $ | 2,704 | |
| | | | | | | | |
| | | | | | | | |
| | | | | | | | |
The decrease in product development expenses in 2014 compared to 2013 was primarily due to increased capitalization of internal-use software costs related to our cloud platform (Advent Direct), and less stock-based compensation expense related to the equity award modification that took place in 2013. These decreases were partially offset by increased costs from higher utilization of third-party contractors on product development activities primarily related to Advent Direct, higher travel and entertainment costs related to our EMEA user conference and offsites, and increased allocation-in of facility and infrastructure expenses.
The increase in total product development expenses in 2013 compared to 2012 was primarily due to an increase in stock-based compensation costs associated with our equity award modification in 2013 and an increase in outside services and contractor costs. Additionally, we allocate facility and infrastructure expenses based on headcount and, in 2013 we allocated more of these costs to our product development department as relative headcount in other departments decreased more than product development headcount decreased. These increases were partially offset by an increase in capitalized costs associated with the timing of our product releases resulting in more costs being capitalized during fiscal 2013 and decrease in payroll and related costs due to less headcount from the October 2012 re-organization plan.
General and Administrative
| | | | | | | | | | | | | | | | |
| | Fiscal Years | |
|---|
| | 2014 | | Change | | 2013 | | Change | | 2012 | |
|---|
| | (in thousands, except percentages)
| |
|---|
Stock-based compensation expense | | $ | 7,025 | | $ | (12,282 | ) | $ | 19,307 | | $ | 15,133 | | $ | 4,174 | |
All other general and administrative expense | | $ | 35,985 | | $ | 555 | | $ | 35,430 | | $ | 1,841 | | $ | 33,589 | |
Percent of total net revenues | | | 9 | % | | | | | 9 | % | | | | | 9 | % |
General and administrative | |
$ |
43,010 | |
$ |
(11,727 |
) |
$ |
54,737 | |
$ |
16,974 | |
$ |
37,763 | |
Percent of total net revenues | | | 11 | % | | | | | 14 | % | | | | | 11 | % |
General and administrative expenses consist primarily of personnel costs for information technology, finance, administration, operations and general management, as well as legal and accounting expenses.
63
Table of Contents
General and administrative expenses changed due to the following (in thousands):
| | | | | | | |
| | Change From
2013 to 2014 | | Change From
2012 to 2013 | |
|---|
(Decreased) increased stock-based compensation | | $ | (12,282 | ) | $ | 15,133 | |
(Decreased) increased payroll and related | | | (1,321 | ) | | 1,234 | |
Increased allocation-out of facility and infrastructure expenses | | | (1,213 | ) | | (2,798 | ) |
(Decreased) increased transaction-related | | | (565 | ) | | 565 | |
Increased computers and telecom | | | 2,036 | | | 1,448 | |
Increased outside services and contractors | | | 1,704 | | | 1,716 | |
Other items | | | (86 | ) | | (324 | ) |
| | | | | | | | |
Total change | | $ | (11,727 | ) | $ | 16,974 | |
| | | | | | | | |
| | | | | | | | |
| | | | | | | | |
General and administrative expenses decreased in 2014 compared to 2013 primarily due to less stock-based compensation expense related to the equity award modification that took place in 2013, decreased payroll and related expenses primarily due to more capitalization of internal-use software costs and less bonus expense of $0.8 million, increased allocation-out of facility and infrastructure expenses and no transaction-related costs in 2014. Corporate expenses, such as facility and information costs, are initially recognized in our general and administrative department and then allocated out to other departments based on relative headcount. As our facility costs increased and headcount in our other departments grew at a higher rate than our general and administrative department, we allocated-out more facility and information technology costs to our general and administrative department in 2014. These decreases were partially offset by increased computer and telecom expense for refresh of employee laptops, and increased outside contractor/services expense related to the outsourcing of administrative IT functions.
The increase in total general and administrative expenses in 2013 compared to 2012 was primarily due to increased stock-based compensation expense resulting from the equity award modification in 2013. As the compensation of our directors and several of our executive management team members are included in general and administrative expenses, approximately 40%, or $19.3 million, of the total $48.2 million of stock compensation expense incurred in 2013 was included in general and administrative. The increase was also due to an increase in computers and telecom in 2013 due to more maintenance contracts and costs, increased payroll and related expenses resulting from higher bonuses, increased outside services and contractor costs and to a lesser extent, increased transaction related fees of $0.6 million associated with the secondary offering of our common stock by a selling shareholder in 2013. These increases were partially offset by an increase in the allocation-out of corporate expenses to other departments.
Amortization of Other Intangibles
| | | | | | | | | | |
| | Fiscal Years | |
|---|
| | 2014 | | 2013 | | 2012 | |
|---|
| | (in thousands, except percentages)
| |
|---|
Amortization of other intangibles | | $ | 3,391 | | $ | 3,775 | | $ | 3,825 | |
Percent of total net revenues | | | 1 | % | | 1 | % | | 1 | % |
Change over prior year | | $ | (384 | ) | $ | (50 | ) | | | |
Percent change over prior year | | | (10 | )% | | (1 | )% | | | |
64
Table of Contents
Other intangibles represent amortization of acquired intangible assets (non-technology). The decreases in 2014 and 2013 was primarily due to decreased amortization from certain intangible assets that fully amortized during these years including those associated with Tamale Software, Inc. (acquired in 2008), Black Diamond Performance Reporting LLC (acquired in 2011) and Syncova Solutions Ltd. (acquired in 2011).
Recapitalization costs
| | | | | | | | | | |
| | Fiscal Years | |
|---|
| | 2014 | | 2013 | | 2012 | |
|---|
| | (in thousands, except percentages)
| |
|---|
Recapitalization costs | | $ | — | | $ | 6,041 | | $ | — | |
Percent of total net revenues | | | 0 | % | | 2 | % | | 0 | % |
Change over prior year | | $ | (6,041 | ) | $ | 6,041 | | | | |
During 2013, in conjunction with the dividend recapitalization, we incurred a total of $6.0 million in operating expenses related to financial advisory, legal, and valuation fees. No similar charges were incurred in 2014 and 2012.
Restructuring Charges
| | | | | | | | | | |
| | Fiscal Years | |
|---|
| | 2014 | | 2013 | | 2012 | |
|---|
| | (in thousands, except percentages)
| |
|---|
Restructuring charges | | $ | 4,628 | | $ | 3,770 | | $ | 3,634 | |
Percent of total net revenues | | | 1 | % | | 1 | % | | 1 | % |
Change over prior year | | $ | 858 | | $ | 136 | | | | |
Percent change over prior year | | | 23 | % | | 4 | % | | | |
During the past several years, we have initiated various restructuring initiatives to reduce costs and improve operating efficiencies by better aligning our resources to near-term revenue opportunities. These initiatives resulted in restructuring charges comprised primarily of costs related to headcount reductions and costs related to properties exited in connection with facilities consolidation and related write-down of leasehold improvements.
In October 2012, we approved a re-organization plan to align strategy and function, reduce operating costs and improve profitability. As a result, we recorded restructuring charges of $3.6 million in both 2013 and 2012, or $7.2 million in total recognized costs for employee termination benefits associated with this workforce reduction. This restructuring plan was substantially complete as of December 31, 2013.
In 2014, we approved another re-organization plan to reduce operating costs and improve profitability. In our continuous efforts to expand operating margins, we replaced approximately 32 functional roles with lower cost resources or moved them to lower costs regions, and have vacated approximately 40,000 square feet of office space in high cost areas. As a result, we recorded restructuring charges of $4.6 million in 2014 for employee termination benefits associated with this workforce reduction and exit costs to consolidate facilities in San Francisco and Boston. As a result of these restructuring activities, we expect annual operating expense run rate savings of approximately $5 million which will be used to fund investments in other areas of our business to improve productivity, efficiency and client experience. This restructuring plan was substantially complete as of December 31, 2014.
65
Table of Contents
For additional analysis of the components of the payments and charges made against the restructuring accrual in fiscal 2014, 2013, and 2012, see Note 8, "Restructuring Charges" to our consolidated financial statements in Item 8 of this Annual Report on Form 10-K.
Interest Expense
| | | | | | | | | | |
| | Fiscal Years | |
|---|
| | 2014 | | 2013 | | 2012 | |
|---|
| | (in thousands, except percentages)
| |
|---|
Interest expense | | $ | (7,320 | ) | $ | (7,285 | ) | $ | (1,973 | ) |
Percent of total net revenues | | | (2 | )% | | (2 | )% | | (1 | )% |
Change over prior year | | $ | (35 | ) | $ | (5,312 | ) | | | |
Percent change over prior year | | | 0 | % | | 269 | % | | | |
Interest expense primarily reflects interest accrued on our outstanding long-term debt during the course of the year and varies depending on the timing and amount of borrowings and repayments during the year as well as fluctuations in interest rates.
In 2014, we incurred $7.3 million of interest expense primarily resulting from an average debt balance of approximately $283 million and a full year of debt issuance cost amortization associated with our credit agreement last amended in June 2013. Interest expense in 2014 was flat compared to prior year which reflected lower interest rates offset by a higher average debt balance during 2014.
In 2013, we also incurred $7.3 million of interest expense which resulted primarily from an average debt balance of approximately $211 million and fees of $0.7 million associated with the modification of our credit agreement associated with our recapitalization transaction.
In 2012, we incurred $2.0 million of interest expense as a result of an average debt balance of approximately $52 million.
Interest Income and Other Expense, net
| | | | | | | | | | |
| | Fiscal Years | |
|---|
| | 2014 | | 2013 | | 2012 | |
|---|
| | (in thousands, except percentages)
| |
|---|
Interest income and other expense, net | | $ | 359 | | $ | 72 | | $ | 353 | |
Percent of total net revenues | | | 0 | % | | 0 | % | | 0 | % |
Change over prior year | | $ | 287 | | $ | (281 | ) | | | |
Percent change over prior year | | | 399 | % | | (80 | )% | | | |
Interest income and other expense, net consists of interest income, realized gains and losses on investments, and foreign currency gains and losses.
Interest income and other expense, net changed due to the following (in thousands):
| | | | | | | |
| | Change From
2013 to 2014 | | Change From
2012 to 2013 | |
|---|
Impact of foreign exchange | | $ | 520 | | $ | (375 | ) |
(Decrease) increase in interest income | | | (267 | ) | | 95 | |
Various other items | | | 34 | | | (1 | ) |
| | | | | | | | |
Total change | | $ | 287 | | $ | (281 | ) |
| | | | | | | | |
| | | | | | | | |
| | | | | | | | |
66
Table of Contents
The change in impact of foreign exchange of $0.5 million in 2014 and $(0.4) million in 2013 was primarily due to net losses and gains, respectively, from the translation of non-U.S. dollar denominated balances to the U.S. dollar.
Provision For Income Taxes
| | | | | | | | | | |
| | Fiscal Years | |
|---|
| | 2014 | | 2013 | | 2012 | |
|---|
| | (in thousands, except percentages)
| |
|---|
Provision for income taxes | | $ | 26,518 | | $ | 10,167 | | $ | 17,328 | |
Effective tax rate | | | 35 | % | | 26 | % | | 36 | % |
The provision for income taxes increased in 2014 primarily due to the increase in income before taxes.
Our 2014 effective tax rate differs from the statutory rate primarily due to the favorable effects of federal and state research credits and the benefit of the Section 199 Domestic Production Activities Deduction. The increase in effective tax rate in 2014 from 2013 was primarily due to the 2014 book income being far higher than that of 2013, which results in a smaller favorable effective tax rate percentage impact for the tax credits. In addition, the tax benefit of the 2012 and 2013 federal research credits were recognized in the 2013 effective tax rate while the 2014 effective tax rate includes only the 2014 federal research credit.
We continue to maintain a valuation allowance against deferred tax assets relating to investment reserves and capital losses because the likelihood of their realization is not more likely than not.
Liquidity and Capital Resources
Cash, Cash Equivalents, Marketable Securities and Cash Flows
The following is a summary of our cash, cash equivalents and marketable securities (in thousands):
| | | | | | | |
| | December 31 | |
|---|
| | 2014 | | 2013 | |
|---|
Cash and cash equivalents | | $ | 28,784 | | $ | 33,828 | |
Short-term and long-term marketable securities | | $ | 9,172 | | $ | — | |
Cash and cash equivalents and short-term and long-term marketable securities primarily consist of money market mutual funds, U.S. government and U.S. Government Sponsored Entities (GSEs) and high credit quality corporate debt securities. Cash and cash equivalents are comprised of highly liquid investments purchased with an original or remaining maturity of 90 days or less at the date of purchase. Our short-term and long-term marketable securities were classified as available-for-sale, with long-term investments having a maturity date greater than one year from the end of the period.
67
Table of Contents
The table below, for the periods indicated, provides selected consolidated cash flow information (in thousands):
| | | | | | | | | | |
| | Fiscal Years | |
|---|
| | 2014 | | 2013 | | 2012 | |
|---|
Net cash provided by operating activities from continuing operations | | $ | 115,158 | | $ | 98,564 | | $ | 86,620 | |
Net cash (used in) provided by investing activities from continuing operations | | $ | (20,159 | ) | $ | 163,145 | | $ | (111,517 | ) |
Net cash (used in) provided by financing activities from continuing operations | | $ | (98,984 | ) | $ | (285,682 | ) | $ | 17,848 | |
Net cash used in operating activities from discontinued operation | | $ | (347 | ) | $ | (375 | ) | $ | (561 | ) |
Our cash flows from operating activities for continuing operations represent the most significant source of funding for our operations. Our cash provided by operating activities generally follows the trend in our net revenues, operating results and bookings. The major uses of our operating cash include funding payroll (salaries, commissions, bonuses and benefits), general operating expenses (marketing, travel, computer and telecom, legal and professional expenses, and office rent), cost of revenues and interest from debt service.
Our cash provided by operating activities from continuing operations of $115.2 million during fiscal 2014 was primarily the result of our net income plus non-cash charges including stock-based compensation, depreciation and amortization and deferred income taxes. Cash flows resulting from changes in assets and liabilities include increases in accounts receivable, accounts payable, deferred revenues and income taxes payable; and decreases in prepaid and other assets and accrued liabilities. Stock-based compensation decreased as there was less expense in 2014 related to the equity award modification that occurred in 2013. Depreciation and amortization decreased primarily due to certain acquired intangible assets that fully amortized during 2014 and 2013. Accounts receivable increased as a result of the timing of collections. Days' sales outstanding were 57 days during fiscal 2014 compared to 56 days in 2013. Deferred revenue increased as a result of additional billings associated with recent bookings, customer renewals and the deferral of term license revenue. Accrued liabilities increased primarily due to a quarterly dividend declared of $6.8 million in December 2014 compared to no quarterly dividends declared in 2013. Income taxes payable increased as a result of the timing of tax payments during 2014. Accounts payable increased and prepaid and other assets decreased primarily due to the timing of payments. Additionally, deferred income taxes increased during 2014.
Our cash provided by operating activities from continuing operations of $98.6 million during fiscal 2013 was primarily the result of our net income plus non-cash charges including stock-based compensation, and depreciation and amortization. Cash flows resulting from changes in assets and liabilities include an increase in deferred revenue, and decreases in accounts receivable, accrued liabilities and income taxes payable. The increase in deferred revenue reflects additional billings associated with recent bookings, customer renewals and the deferral of professional services revenue. Days' sales outstanding were 56 days during fiscal 2013 compared to 62 days in 2012. Accrued liabilities increased primarily as a result of accrued dividend equivalent payments on restricted stock units (RSUs) in connection with the equity modification associated with the Special Dividend. Income taxes payable decreased as a result of the timing of tax payments during 2013. Other changes in assets and liabilities included a decrease in accounts payable and an increase in prepaid and other assets. Additionally, we paid $5.6 million during 2013 to option, SAR and RSU holders in connection with the equity award modification.
68
Table of Contents
Our cash provided by operating activities for continuing operations of $86.6 million during fiscal 2012 was primarily the result of our net income plus non-cash charges including stock-based compensation, depreciation and amortization and deferred income taxes. Cash flows resulting from changes in assets and liabilities include an increase in income taxes payable and deferred revenues, and a decrease in accounts payable and accrued liabilities. The increase in income taxes payable was primarily due to the timing of tax payments and an increase in the Company's effective tax rate due to the expiration of certain research and development tax credits. The increase in deferred revenue reflects additional billings associated with recent bookings, customer renewals and the deferral of professional services revenue. The decrease in accrued liabilities reflects cash payments of fiscal 2011 liabilities including year-end bonuses, commissions, and payroll taxes. Accounts payable decreased primarily due to payments to vendors for amounts billed in 2011. Cash flows from accounts receivable increased in 2012 compared to 2011 due to the collection of amounts billed to customers, resulting in a decrease in days' sales outstanding to 62 days during 2012, from 70 days in 2011.
We expect that cash provided by operating activities for continuing operations may fluctuate in future periods as a result of a number of factors including fluctuations in our net revenues and operating results, new term license bookings that increase deferred revenue, collection of accounts receivable, payment of federal income taxes and timing of payments.
Net cash used in investing activities from continuing operations was $20.2 million during 2014. The decrease in investing cash flows of $183.3 million over 2013 primarily reflects net cash inflows of $170.8 million in 2013 due to the net sales and maturities of marketable securities. These proceeds were used to partially finance the Special Dividend which was paid in July 2013. In 2014 there were net cash outflows of $9.1 million due to net purchases of marketable securities.
Net cash provided by investing activities from continuing operations was $163.1 million during 2013. The increase in investing cash flows of $274.7 million over 2012 primarily reflects net sales and maturities of marketable securities of $170.8 million in 2013 compared to net purchases of $102.4 million in 2012. Proceeds from the sales and maturities of marketable securities were used to partially finance the Special Dividend of $470.1 million that was paid in July 2013.
Net cash used in investing activities for continuing operations of $111.5 million during 2012 reflects purchases of marketable securities of $221.0 million, capital expenditures of $6.4 million primarily related to purchases of computers and equipment and, to a lesser extent, the build-out of our new facilities in New Rochelle, New York and Jacksonville, Florida, capitalized software development costs of $2.1 million and the final installment payment of $0.7 million related to our acquisition of East Circle, which we acquired in December 2006. These expenditures were partially offset by proceeds received from the sale and maturity of marketable securities of $118.6 million.
Net cash used in financing activities for continuing operations during 2014 was $99.0 million. The decreased use of financing cash flows of $186.7 million over 2013 primarily reflects net payments on long-term debt of $85.0 million in 2014 compared to net borrowings in 2013 of $210.0 million and less cash used to pay dividends and repurchase shares of our common stock in 2014. Additionally we had no debt issuance costs in 2014 compared to 2013. In 2013, we refinanced our long-term debt and used net proceeds to pay a one-time Special Dividend and repurchased shares of our common stock. In 2014, we used cash generated from operating activities to pay down our long-term debt, repurchase shares of our common stock and to pay quarterly dividend payments to shareholders.
69
Table of Contents
Net cash used in financing activities for continuing operations during 2013 was $285.7 million. The increased use of financing cash flows of $303.5 million over 2012 primarily reflects the payment of the Special Dividend of $470.1 million, debt issuance costs of $5.7 million associated with our restated credit agreement and increased payments of $6.3 million to satisfy withholding taxes on equity awards that are net settled. These cash outflows were partially offset by increased cash inflows during 2013 from net debt proceeds of $165.0 million to help fund our Special Dividend and proceeds from stock option exercises and employee stock purchase plan purchases totaling $14.0 million. Additionally, we repurchased $41.3 million of our common stock in both 2013 and 2012.
Net cash provided by financing activities for continuing operations during 2012 of $17.8 million reflects proceeds from borrowings of long-term debt of $50.0 million, tax benefits relating to excess stock-based compensation deductions of $7.8 million, which represents the reduction in income taxes payable resulting from tax deductions from stock-based compensation, proceeds from the issuance of common stock under our employee stock purchase plan (ESPP) of $6.7 million and proceeds from the exercise of employee stock options of $5.2 million, partially offset by the repurchase of 1.7 million shares of our common stock for $41.3 million, $5.5 million to satisfy withholding taxes on equity awards that are net share settled and debt repayments totaling $5.0 million.
Working Capital and Stockholders' Deficit
As of December 31, 2014, our continuing operations had negative working capital of $(121.4) million, compared to a negative working capital of $(105.5) million at December 31, 2013. The decrease in our working capital of $15.9 million during 2014 was primarily due to the repayment of long-term debt of $85.0 million, repurchase of Advent common stock of $15.1 million, payment of quarterly dividends to common shareholders of $13.4 million, capital expenditures of $10.8 million and purchases of marketable securities of $9.2 million, partially offset by cash generated from operating activities of $115.2 million.
Our negative working capital at December 31, 2014 includes approximately $197.1 million of short-term deferred revenues, which represent invoiced bookings not yet recognized as revenue. Generally, deferred revenues do not require cash settlement. Instead, these represent revenue to recognize upon fulfillment of an obligation to customers. The cash costs incurred in fulfilling the obligation are a fraction of the amount of deferred revenue and are evidenced by the Company's recurring revenue gross margins of approximately 80% during 2014 and 2013. Additionally we have backlog, revenue from binding contracts not yet invoiced and not in deferred revenue, of $157.4 million at December 31, 2014. As a result, we do not believe that our negative working capital balance reflects an inability to service our obligations over the next 12 months.
As of December 31, 2014, our cash and cash equivalents totaled $28.8 million. We have additional borrowing capacity under our credit facility, as well as expected future cash flows generated by operating activities, to fund our working capital needs.
After declaring the Special Dividend of $470.1 million in June 2013, there remains a stockholders' deficit balance of $(64.8) million on our balance sheet as of December 31, 2014, compared to a stockholders' deficit of $(111.8) million at December 31, 2013. Despite the stockholders deficit balance at December 31, 2014, we believe the Company is solvent as our cash balances, cash generated from operations and availability under our debt agreement will be sufficient to satisfy our working capital needs, capital expenditures, and interest and repayment of debt principal for the next 12 to 24 months.
Term Loan and Revolving Credit Facility
On June 12, 2013, we entered into a Restated Credit Agreement. The Restated Credit Agreement amends and restates our existing Credit Agreement, dated November 30, 2011. The Restated Credit Agreement provides for (i) a $225 million term loan facility and (ii) a $200 million revolving credit
70
Table of Contents
facility, with a $25 million letter of credit sublimit and a $10 million swingline loan sublimit. We may request revolving loans, swingline loans or the issuance of letters of credit until June 12, 2018, subject to demonstrating pro forma compliance with the financial covenant requirement under the Restated Credit Agreement. We may prepay the term loans and revolving loans at any time without penalty. The Restated Credit Agreement also contains an incremental facility permitting Advent, subject to certain requirements, to arrange with the Lenders and/or new lenders for up to an aggregate of $75 million in additional commitments, which commitments may be for revolving loans or term loans. The proceeds of the revolving loans and term loans made under the Restated Credit Agreement may be used for general corporate purposes, including to finance dividends, repurchase common stock, finance acquisitions, or to finance other investments.
The following is a summary of the Company's outstanding debt balances (in thousands):
| | | | | | | |
| | December 31 | |
|---|
| | 2014 | | 2013 | |
|---|
Term loan facility | | $ | 195,000 | | $ | 215,000 | |
Revolving credit facility | | | 25,000 | | | 90,000 | |
| | | | | | | | |
Total | | $ | 220,000 | | $ | 305,000 | |
| | | | | | | | |
| | | | | | | | |
| | | | | | | | |
We were in compliance with all covenants associated with our Restated Credit Agreement as of December 31, 2014 as follows:
| | | | |
Covenant | | Covenant
Requirement | | Ratio Calculation
as of
December 31, 2014 |
|---|
Leverage ratio(1) | | Maximum 3.75x(2) | | 1.7x |
Interest coverage ratio(3) | | Minimum 2.5x | | 18.1x |
- (1)
- Calculated as the ratio of total debt to EBITDA, as defined by the Restated Credit Agreement, for the period of four consecutive fiscal quarters on the measurement date.
- (2)
- The leverage ratio covenant requirement lowers to a maximum of 3.50x on June 30, 2015 and 3.25x on June 30, 2016.
- (3)
- Calculated as the ratio of EBITDA to interest expense, as defined by the Restated Credit Agreement, for the period of four consecutive fiscal quarters on the measurement date.
Common Stock Repurchases
Refer to Note 14 "Common Stock Repurchase Programs" to our consolidated financial statements in Item 8 of this Annual Report on Form 10-K for a discussion of our common stock repurchase programs.
71
Table of Contents
Off-Balance Sheet Arrangements and Contractual Obligations
The following table summarizes our contractual cash obligations as of December 31, 2014 (in thousands):
| | | | | | | | | | | | | | | | | | | | | | |
| | Fiscal Years | |
| |
| |
|---|
| | 2015 | | 2016 | | 2017 | | 2018 | | 2019 | | Thereafter | | Total | |
|---|
Operating lease obligations, net of sub-lease income* | | $ | 10,280 | | $ | 9,300 | | $ | 4,291 | | $ | 3,290 | | $ | 3,166 | | $ | 14,322 | | $ | 44,649 | |
Debt** | | | 20,000 | | | 20,000 | | | 20,000 | | | 160,000 | | | — | | | — | | | 220,000 | |
| | | | | | | | | | | | | | | | | | | | | | | |
Total | | $ | 30,280 | | $ | 29,300 | | $ | 24,291 | | $ | 163,290 | | $ | 3,166 | | $ | 14,322 | | $ | 264,649 | |
| | | | | | | | | | | | | | | | | | | | | | | |
| | | | | | | | | | | | | | | | | | | | | | | |
| | | | | | | | | | | | | | | | | | | | | | | |
- *
- The decrease in our future operating lease obligations starting in 2016 reflects the end of the current lease term for our San Francisco headquarters in October 2016. On January 28, 2015, we extended our San Francisco lease for an additional 10 years, which will result in total operating lease obligations of $71 million over the period from November 1, 2016 through October 31, 2026, which is not reflected in the table above.
- **
- Excludes interest payments on our variable rate debt as amounts are uncertain. Refer to Note 9 "Debt" to our consolidated financial statements in Item 8 of this Annual Report on Form 10-K for information about the terms of our debt.
As of December 31, 2014, the principal outstanding balance under our Restated Credit Agreement was $220.0 million, which is due in full no later than June 12, 2018. Our Restated Credit Agreement includes covenants requiring us to maintain compliance with a consolidated leverage ratio and a consolidated interest coverage ratio. As of December 31, 2014, we were in compliance with all of our covenants. We believe maintaining compliance with these covenants will not restrict our ability to execute our business plan in the coming fiscal year.
At December 31, 2014, we had a gross liability of $16.4 million for uncertain tax positions. If recognized, the impact on our statement of operations would be to decrease our income tax expense and increase our net income by $13.5 million. The impact on net income reflects the liabilities for unrecognized tax benefits net of the federal tax benefit of state income tax items. Since almost all of this liability relates to reserves against deferred tax assets that we do not expect to utilize in the short term, we cannot estimate the timing of potential future cash settlements and have not included any estimates in the table of contractual cash obligations above.
At December 31, 2014, we did not have any relationships with unconsolidated entities or financial partnerships, such as entities often referred to as structured finance or special purpose entities, which would have been established for the purpose of facilitating off-balance sheet arrangements or other contractually narrow or limited purposes. As such, we are not materially exposed to any financing, liquidity, market or credit risk that could arise if we had engaged in such relationships.
Dividends
In December 2014, our Board of Directors (the "Board") declared a cash dividend of $0.13 per common share payable to shareholders of record as of December 31, 2014. On January 15, 2015, we paid this dividend which totaled $6.8 million. In the Merger Agreement with SS&C signed on February 2, 2015, the Company is prohibited from declaring a dividend during the pendency of the agreement.
Other Liquidity and Capital Resources Considerations
Our liquidity and capital resources in any period could also be affected by the exercise of outstanding employee stock options and stock appreciation rights, and issuance of common stock under our employee stock purchase plan. The resulting increase in the number of outstanding shares from
72
Table of Contents
this and from the issuance of common stock from our restricted stock units could also affect our per share results of operations. However, we cannot predict the timing or amount of proceeds from the exercise of these securities, or whether they will be exercised at all.
We expect that for the next two years, our debt service costs and other operating expenses will constitute a significant use of cash flow. Accordingly, we anticipate having less available cash to fund acquisitions, repurchase additional common stock, or invest in other businesses when opportunities arise. Based upon the predominance of our revenues from recurring sources, bookings performance and current expectations, we believe that our cash balances, cash generated from operations and availability under our debt agreement will be sufficient to satisfy our working capital needs, capital expenditures and interest, repayment of debt principal and share repurchases. However, we may identify opportunities that require us to raise funds, such as acquisitions or other investments in complementary businesses, products or technologies, and may raise such additional funds through public or private debt or additional borrowings under our current line of credit facility or equity financing. However, such financing may not be available at all, or if available, may not be obtainable on favorable terms, and could be dilutive.
The Company has reviewed its needs in the United States for possible repatriation of undistributed earnings or cash of its non-U.S. subsidiaries. The Company presently intends to use all earnings and cash outside of the United States of all non-U.S. subsidiaries to fund investments or meet working capital and property, plant and equipment requirements in those locations. At December 31, 2014, we had approximately $7.8 million of cash in our non-U.S. subsidiaries.
Recent Accounting Pronouncements
With the exception of the pronouncements included in Note 1, "Basis of Presentation" to the accompanying consolidated financial statements, there have been no recent accounting pronouncements or changes in accounting pronouncements during the year ended December 31, 2014, that are of significance, or potential significance, to our consolidated financial statements
Item 7A. Quantitative and Qualitative Disclosures About Market Risk
In the normal course of business, we are exposed to financial market risks, including changes in interest rates on outstanding debt and changes in foreign currency exchange rates on non-U.S. dollar denominated assets and liabilities. The Company regularly assesses these risks and has established policies and business practices to protect against the adverse effects of these and other potential exposures.
Interest Rate Risk
Interest Income Risk
Our interest rate risk relates primarily to our investment portfolio, which consisted of $38.0 million in cash and cash equivalents, and short-term and long-term marketable securities as of December 31, 2014. Our marketable securities are classified as available-for-sale and are recorded in our condensed consolidated balance sheet at fair value with unrealized gains or losses reported as a separate component of accumulated other comprehensive income. At any time, a rise in interest rates could have a material adverse impact on the fair value of our investment portfolio. Conversely, declines in interest rates could have a material impact on interest earnings of our investment portfolio. We do not currently hedge these interest rate exposures.
To provide a meaningful assessment of the interest rate risk associated with our investment portfolio, we performed a sensitivity analysis to determine the impact a change in interest rates would have on the value of the investment portfolio assuming a 100 basis point parallel shift in the yield
73
Table of Contents
curve. Based on investment positions as of December 31, 2014, a hypothetical 100 basis point increase in interest rates across all maturities would result in a $60,000 incremental decline in the fair market value of the portfolio.
Interest Expense Risk
We have interest rate risk relating to debt and associated interest expense under our Restated Credit Agreement, which is indexed to JPMorgan Chase Bank, N.A.'s prime rate, federal funds rate or LIBOR. At any time, a rise in interest rates could have a material adverse impact on our earnings and cash flows. Conversely, a decrease in interest rates could result in a material increase in earnings and cash flows. We estimate that a hypothetical plus or minus of 100 BPS would increase or decrease, respectively, our interest expense and cash flows by approximately $2.2 million on an annual basis, based on our $220.0 million debt balance at December 31, 2014.
The revolving loans and term loans bear interest, at our option, at the alternate base rate plus a margin of 0.25% to 1.25% or an adjusted LIBOR rate (based on one, two, three or six-month interest periods) plus a margin of 1.25% to 2.25%, in each case with such margin being determined based on the consolidated leverage ratio for the preceding four fiscal quarter period. The "alternate base rate" means the highest of (i) the Agent's prime rate, (ii) the federal funds rate plus a margin equal to 0.50% and (iii) the adjusted LIBOR rate for a one-month interest period plus a margin equal to 1.00%. Swingline loans accrue interest at a per annum rate based on the alternate base rate plus the applicable margin for alternate base rate loans.
74
Table of Contents
Item 8. Financial Statements and Supplementary Data
| | | | |
| | Page | |
|---|
Management's Report on Internal Control Over Financial Reporting | | | 76 | |
Report of Independent Registered Public Accounting Firm | | | 77 | |
Financial Statements: | | | | |
Consolidated Balance Sheets as of December 31, 2014 and 2013 | | | 78 | |
Consolidated Statements of Operations for the years ended December 31, 2014, 2013, and 2012 | | | 79 | |
Consolidated Statements of Comprehensive Income for the years ended December 31, 2014, 2013, and 2012 | | | 80 | |
Consolidated Statements of Stockholders' (Deficit) Equity for the years ended December 31, 2014, 2013 and 2012 | | | 81 | |
Consolidated Statements of Cash Flows for the years ended December 31, 2014, 2013 and 2012 | | | 82 | |
Notes to Consolidated Financial Statements | | | 83 | |
Unaudited Supplementary Quarterly Financial Data | | | 124 | |
75
Table of Contents
MANAGEMENT'S REPORT ON INTERNAL CONTROL OVER FINANCIAL REPORTING
Management of the Company is responsible for establishing and maintaining adequate internal control over financial reporting as defined in Rules 13a-15(f) and 15d-15(f) under the Securities Exchange Act of 1934. The Company's internal control over financial reporting is a process designed to provide reasonable assurance regarding the reliability of financial reporting and the preparation of financial statements for external purposes in accordance with generally accepted accounting principles in the United States of America. Internal control over financial reporting includes those policies and procedures that (i) pertain to the maintenance of records that, in reasonable detail, accurately and fairly reflect the transactions and dispositions of assets of the Company; (ii) provide reasonable assurance that transactions are recorded as necessary to permit preparation of financial statements in accordance with generally accepted accounting principles in the United States of America, and that receipts and expenditures of the Company are being made only in accordance with authorizations of management and directors of the Company; and (iii) provide reasonable assurance regarding prevention or timely detection of unauthorized acquisition, use or disposition of the Company's assets that could have a material effect on the financial statements.
Because of its inherent limitations, internal control over financial reporting may not prevent or detect misstatements. Also, projections of any evaluation of effectiveness to future periods are subject to the risk that controls may become inadequate because of changes in conditions or that the degree of compliance with the policies or procedures may deteriorate.
The Company's management assessed the effectiveness of the Company's internal control over financial reporting as of December 31, 2014. In making this assessment, management used the criteria set forth by the Committee of Sponsoring Organizations of the Treadway Commission (COSO) inInternal Control—Integrated Framework (2013 Framework). Based on management's assessment using the COSO criteria, management has concluded that the Company maintained effective internal control over financial reporting as of December 31, 2014.
The effectiveness of the Company's internal control over financial reporting as of December 31, 2014 has been audited by PricewaterhouseCoopers LLP, an independent registered public accounting firm, as stated in its report which is included herein.
| | |
/s/ DAVID PETER HESS
David Peter Hess
Chief Executive Officer, President and Director (Principal Executive Officer) | | /s/ JAMES S. COX
James S. Cox
Executive Vice President and Chief Financial Officer (Principal Financial and Accounting Officer) |
76
Table of Contents
REPORT OF INDEPENDENT REGISTERED PUBLIC ACCOUNTING FIRM
To the Board of Directors and Stockholders of Advent Software, Inc.,
In our opinion, the accompanying consolidated balance sheets and the related consolidated statements of operations, comprehensive income, stockholders' (deficit) equity and cash flows present fairly, in all material respects, the financial position of Advent Software, Inc. and its subsidiaries at December 31, 2014 and December 31, 2013, and the results of their operations and their cash flows for each of the three years in the period ended December 31, 2014 in conformity with accounting principles generally accepted in the United States of America. In addition, in our opinion, the financial statement schedule appearing under item 15(a)(2) presents fairly, in all material respects, the information set forth therein when read in conjunction with the related consolidated financial statements. Also in our opinion, the Company maintained, in all material respects, effective internal control over financial reporting as of December 31, 2014, based on criteria established inInternal Control—Integrated Framework (2013) issued by the Committee of Sponsoring Organizations of the Treadway Commission (COSO). The Company's management is responsible for these financial statements and financial statement schedule, for maintaining effective internal control over financial reporting and for its assessment of the effectiveness of internal control over financial reporting, included in the accompanying Management's Report on Internal Control over Financial Reporting. Our responsibility is to express opinions on these financial statements, on the financial statement schedule, and on the Company's internal control over financial reporting based on our integrated audits. We conducted our audits in accordance with the standards of the Public Company Accounting Oversight Board (United States). Those standards require that we plan and perform the audits to obtain reasonable assurance about whether the financial statements are free of material misstatement and whether effective internal control over financial reporting was maintained in all material respects. Our audits of the financial statements included examining, on a test basis, evidence supporting the amounts and disclosures in the financial statements, assessing the accounting principles used and significant estimates made by management, and evaluating the overall financial statement presentation. Our audit of internal control over financial reporting included obtaining an understanding of internal control over financial reporting, assessing the risk that a material weakness exists, and testing and evaluating the design and operating effectiveness of internal control based on the assessed risk. Our audits also included performing such other procedures as we considered necessary in the circumstances. We believe that our audits provide a reasonable basis for our opinions.
A company's internal control over financial reporting is a process designed to provide reasonable assurance regarding the reliability of financial reporting and the preparation of financial statements for external purposes in accordance with generally accepted accounting principles. A company's internal control over financial reporting includes those policies and procedures that (i) pertain to the maintenance of records that, in reasonable detail, accurately and fairly reflect the transactions and dispositions of the assets of the company; (ii) provide reasonable assurance that transactions are recorded as necessary to permit preparation of financial statements in accordance with generally accepted accounting principles, and that receipts and expenditures of the company are being made only in accordance with authorizations of management and directors of the company; and (iii) provide reasonable assurance regarding prevention or timely detection of unauthorized acquisition, use, or disposition of the company's assets that could have a material effect on the financial statements.
Because of its inherent limitations, internal control over financial reporting may not prevent or detect misstatements. Also, projections of any evaluation of effectiveness to future periods are subject to the risk that controls may become inadequate because of changes in conditions, or that the degree of compliance with the policies or procedures may deteriorate.
/s/ PricewaterhouseCoopers LLP
San Jose, California
February 24, 2015
77
Table of Contents
ADVENT SOFTWARE, INC.
CONSOLIDATED BALANCE SHEETS
(In thousands, except share amounts)
| | | | | | | |
| | December 31 | |
|---|
| | 2014 | | 2013 | |
|---|
ASSETS | | | | | | | |
Current assets: | | | | | | | |
Cash and cash equivalents | | $ | 28,784 | | $ | 33,828 | |
Short-term marketable securities | | | 7,298 | | | — | |
Accounts receivable, net of allowance for doubtful accounts of $36 and $231, respectively | | | 61,870 | | | 58,717 | |
Deferred taxes, current | | | 28,275 | | | 24,898 | |
Prepaid expenses and other | | | 24,984 | | | 30,114 | |
Current assets of discontinued operation | | | — | | | 100 | |
| | | | | | | | |
Total current assets | | | 151,211 | | | 147,657 | |
Property and equipment, net | | |
27,995 | | |
31,698 | |
Goodwill | | | 202,290 | | | 207,818 | |
Other intangibles, net | | | 18,803 | | | 27,392 | |
Long-term marketable securities | | | 1,874 | | | — | |
Deferred taxes, long-term | | | 18,358 | | | 23,020 | |
Other assets | | | 13,245 | | | 17,372 | |
Noncurrent assets of discontinued operation | | | 1,093 | | | 1,337 | |
| | | | | | | | |
Total assets | | $ | 434,869 | | $ | 456,294 | |
| | | | | | | | |
| | | | | | | | |
| | | | | | | | |
LIABILITIES AND STOCKHOLDERS' DEFICIT | | | | | | | |
Current liabilities: | | | | | | | |
Accounts payable | | $ | 12,041 | | $ | 5,348 | |
Dividends payable | | | 6,750 | | | — | |
Accrued liabilities | | | 36,541 | | | 41,625 | |
Deferred revenues | | | 197,144 | | | 186,107 | |
Income taxes payable | | | 132 | | | — | |
Current portion of long-term debt | | | 20,000 | | | 20,000 | |
Current liabilities of discontinued operation | | | 572 | | | 600 | |
| | | | | | | | |
Total current liabilities | | | 273,180 | | | 253,680 | |
Deferred revenues, long-term | | |
6,972 | | |
7,809 | |
Long-term income taxes payable | | | 9,513 | | | 7,667 | |
Long-term debt | | | 200,000 | | | 285,000 | |
Other long-term liabilities | | | 7,821 | | | 11,171 | |
Noncurrent liabilities of discontinued operation | | | 2,170 | | | 2,782 | |
| | | | | | | | |
Total liabilities | | | 499,656 | | | 568,109 | |
| | | | | | | | |
Commitments and contingencies (See Note 11) | | | | | | | |
Stockholders' deficit: | | |
| | |
| |
Preferred stock; $0.01 par value: 2,000,000 shares authorized; none issued | | | — | | | — | |
Common stock; $0.01 par value: 120,000,000 shares authorized; 51,925,915 and 51,258,005 shares issued and outstanding | | | 519 | | | 513 | |
Additional paid-in capital | | | 61,455 | | | 42,533 | |
Accumulated deficit | | | (130,234 | ) | | (165,870 | ) |
Accumulated other comprehensive income | | | 3,473 | | | 11,009 | |
| | | | | | | | |
Total stockholders' deficit | | | (64,787 | ) | | (111,815 | ) |
| | | | | | | | |
Total liabilities and stockholders' deficit | | $ | 434,869 | | $ | 456,294 | |
| | | | | | | | |
| | | | | | | | |
| | | | | | | | |
The accompanying notes are an integral part of these consolidated financial statements.
78
Table of Contents
ADVENT SOFTWARE, INC.
CONSOLIDATED STATEMENTS OF OPERATIONS
(In thousands, except per share data)
| | | | | | | | | | |
| | Years Ended December 31 | |
|---|
| | 2014 | | 2013 | | 2012 | |
|---|
Net revenues: | | | | | | | | | | |
Recurring revenues | | $ | 365,290 | | $ | 349,881 | | $ | 324,627 | |
Non-recurring revenues | | | 31,530 | | | 33,078 | | | 34,192 | |
| | | | | | | | | | | |
Total net revenues | | | 396,820 | | | 382,959 | | | 358,819 | |
Cost of revenues: | | |
| | |
| | |
| |
Recurring revenues | | | 80,369 | | | 70,590 | | | 68,953 | |
Non-recurring revenues | | | 30,380 | | | 40,044 | | | 43,505 | |
Amortization of developed technology | | | 6,772 | | | 9,087 | | | 10,258 | |
| | | | | | | | | | | |
Total cost of revenues | | | 117,521 | | | 119,721 | | | 122,716 | |
| | | | | | | | | | | |
Gross margin | | | 279,299 | | | 263,238 | | | 236,103 | |
Operating expenses: | | |
| | |
| | |
| |
Sales and marketing | | | 74,996 | | | 79,065 | | | 74,688 | |
Product development | | | 69,532 | | | 69,718 | | | 67,014 | |
General and administrative | | | 43,010 | | | 54,737 | | | 37,763 | |
Amortization of other intangibles | | | 3,391 | | | 3,775 | | | 3,825 | |
Recapitalization costs | | | — | | | 6,041 | | | — | |
Restructuring charges | | | 4,628 | | | 3,770 | | | 3,634 | |
| | | | | | | | | | | |
Total operating expenses | | | 195,557 | | | 217,106 | | | 186,924 | |
| | | | | | | | | | | |
Income from continuing operations | | | 83,742 | | | 46,132 | | | 49,179 | |
Interest expense | | | (7,320 | ) | | (7,285 | ) | | (1,973 | ) |
Interest income and other expense, net | | | 359 | | | 72 | | | 353 | |
| | | | | | | | | | | |
Income from continuing operations before income taxes | | | 76,781 | | | 38,919 | | | 47,559 | |
Provision for income taxes | | | 26,518 | | | 10,167 | | | 17,328 | |
| | | | | | | | | | | |
Net income from continuing operations | | $ | 50,263 | | $ | 28,752 | | $ | 30,231 | |
Discontinued operation: | | |
| | |
| | |
| |
Net (loss) income from discontinued operation (net of applicable taxes of $(32), $34 and $126, respectively) | | | (51 | ) | | 50 | | | 184 | |
| | | | | | | | | | | |
Net income | | $ | 50,212 | | $ | 28,802 | | $ | 30,415 | |
| | | | | | | | | | | |
| | | | | | | | | | | |
| | | | | | | | | | | |
Basic net income per share: | | | | | | | | | | |
Continuing operations | | $ | 0.98 | | $ | 0.56 | | $ | 0.60 | |
Discontinued operation | | | — | | | — | | | — | |
| | | | | | | | | | | |
Total operations | | $ | 0.97 | | $ | 0.56 | | $ | 0.60 | |
| | | | | | | | | | | |
| | | | | | | | | | | |
| | | | | | | | | | | |
Diluted net income per share: | | | | | | | | | | |
Continuing operations | | $ | 0.94 | | $ | 0.54 | | $ | 0.58 | |
Discontinued operation | | | — | | | — | | | — | |
| | | | | | | | | | | |
Total operations | | $ | 0.94 | | $ | 0.54 | | $ | 0.58 | |
| | | | | | | | | | | |
| | | | | | | | | | | |
| | | | | | | | | | | |
Weighted average shares used to compute basic and diluted net income per share | | | | | | | | | | |
Basic | | | 51,546 | | | 51,207 | | | 50,614 | |
Diluted | | | 53,608 | | | 53,378 | | | 52,425 | |
The accompanying notes are an integral part of these consolidated financial statements.
Net income per share is based on actual calculated values and totals may not sum due to rounding.
79
Table of Contents
ADVENT SOFTWARE, INC.
CONSOLIDATED STATEMENTS OF COMPREHENSIVE INCOME
(In thousands)
| | | | | | | | | | |
| | Years Ended December 31 | |
|---|
| | 2014 | | 2013 | | 2012 | |
|---|
Net income | | $ | 50,212 | | $ | 28,802 | | $ | 30,415 | |
Other comprehensive income (loss), net of taxes | | | | | | | | | | |
Foreign currency translation | | | (7,518 | ) | | 970 | | | 3,156 | |
Unrealized (loss) gain on marketable securities (net of applicable taxes of $12, $(20) and $(11), respectively) | | | (18 | ) | | 9 | | | 4 | |
| | | | | | | | | | | |
Total other comprehensive (loss) income, net of taxes | | | (7,536 | ) | | 979 | | | 3,160 | |
| | | | | | | | | | | |
Total comprehensive income | | $ | 42,676 | | $ | 29,781 | | $ | 33,575 | |
| | | | | | | | | | | |
| | | | | | | | | | | |
| | | | | | | | | | | |
The accompanying notes are an integral part of these consolidated financial statements.
80
Table of Contents
ADVENT SOFTWARE, INC.
CONSOLIDATED STATEMENTS OF STOCKHOLDERS' (DEFICIT) EQUITY
(In thousands)
| | | | | | | | | | | | | | | | | | | |
| | Common Stock | |
| |
| | Accumulated
Other
Comprehensive
Income (Loss) | |
| |
|---|
| | Additional
Paid-In
Capital | | Accumulated
Deficit | | Total
Stockholders'
Equity (Deficit) | |
|---|
| | Shares | | Amount | |
|---|
Balances, December 31, 2011 | | | 50,997 | | $ | 510 | | $ | 429,734 | | $ | (154,053 | ) | $ | 6,870 | | $ | 283,061 | |
Stock-based award activity | | | 786 | | | 8 | | | (331 | ) | | — | | | — | | | (323 | ) |
Common stock repurchased and retired | | | (1,651 | ) | | (16 | ) | | (10,636 | ) | | (30,623 | ) | | — | | | (41,275 | ) |
Common stock issued under employee stock purchase plan | | | 325 | | | 3 | | | 6,658 | | | — | | | — | | | 6,661 | |
Stock-based compensation | | | — | | | — | | | 21,047 | | | — | | | — | | | 21,047 | |
Tax shortfall from exercise of stock options | | | — | | | — | | | (672 | ) | | — | | | — | | | (672 | ) |
Tax benefit from exercise of stock options | | | — | | | — | | | 7,785 | | | — | | | — | | | 7,785 | |
Net income | | | — | | | — | | | — | | | 30,415 | | | — | | | 30,415 | |
Unrealized gain on marketable securities | | | — | | | — | | | — | | | — | | | 4 | | | 4 | |
Foreign currency translation adjustments | | | — | | | — | | | — | | | — | | | 3,156 | | | 3,156 | |
| | | | | | | | | | | | | | | | | | | | |
Balances, December 31, 2012 | | | 50,457 | | $ | 505 | | $ | 453,585 | | $ | (154,261 | ) | $ | 10,030 | | $ | 309,859 | |
| | | | | | | | | | | | | | | | | | | | |
| | | | | | | | | | | | | | | | | | | | |
| | | | | | | | | | | | | | | | | | | | |
Stock-based award activity | | | 2,118 | | | 21 | | | 7,641 | | | — | | | — | | | 7,662 | |
Common stock repurchased and retired | | | (1,600 | ) | | (16 | ) | | (829 | ) | | (40,411 | ) | | — | | | (41,256 | ) |
Common stock issued under employee stock purchase plan | | | 283 | | | 3 | | | 6,290 | | | — | | | — | | | 6,293 | |
Stock-based compensation | | | — | | | — | | | 39,624 | | | — | | | — | | | 39,624 | |
Tax shortfall from exercise of stock options | | | — | | | — | | | (1,122 | ) | | — | | | — | | | (1,122 | ) |
Tax benefit from exercise of stock options | | | — | | | — | | | 7,477 | | | — | | | — | | | 7,477 | |
Cash dividends declared on common stock | | | — | | | — | | | (470,133 | ) | | — | | | — | | | (470,133 | ) |
Net income | | | — | | | — | | | — | | | 28,802 | | | — | | | 28,802 | |
Unrealized gain on marketable securities | | | — | | | — | | | — | | | — | | | 9 | | | 9 | |
Foreign currency translation adjustments | | | — | | | — | | | — | | | — | | | 970 | | | 970 | |
| | | | | | | | | | | | | | | | | | | | |
Balances, December 31, 2013 | | | 51,258 | | $ | 513 | | $ | 42,533 | | $ | (165,870 | ) | $ | 11,009 | | $ | (111,815 | ) |
| | | | | | | | | | | | | | | | | | | | |
| | | | | | | | | | | | | | | | | | | | |
| | | | | | | | | | | | | | | | | | | | |
Stock-based award activity | | | 935 | | | 9 | | | (2,066 | ) | | — | | | — | | | (2,057 | ) |
Common stock repurchased and retired | | | (515 | ) | | (5 | ) | | (560 | ) | | (14,576 | ) | | — | | | (15,141 | ) |
Common stock issued under employee stock purchase plan | | | 248 | | | 2 | | | 6,360 | | | — | | | — | | | 6,362 | |
Stock-based compensation | | | — | | | — | | | 25,904 | | | — | | | — | | | 25,904 | |
Tax shortfall from exercise of stock options | | | — | | | — | | | (818 | ) | | — | | | — | | | (818 | ) |
Tax benefit from exercise of stock options | | | — | | | — | | | 10,257 | | | — | | | — | | | 10,257 | |
Cash dividends declared on common stock | | | — | | | — | | | (20,155 | ) | | — | | | — | | | (20,155 | ) |
Net income | | | — | | | — | | | — | | | 50,212 | | | — | | | 50,212 | |
Unrealized loss on marketable securities | | | — | | | — | | | — | | | — | | | (18 | ) | | (18 | ) |
Foreign currency translation adjustments | | | — | | | — | | | — | | | — | | | (7,518 | ) | | (7,518 | ) |
| | | | | | | | | | | | | | | | | | | | |
Balances, December 31, 2014 | | | 51,926 | | $ | 519 | | $ | 61,455 | | $ | (130,234 | ) | $ | 3,473 | | $ | (64,787 | ) |
| | | | | | | | | | | | | | | | | | | | |
| | | | | | | | | | | | | | | | | | | | |
| | | | | | | | | | | | | | | | | | | | |
The accompanying notes are an integral part of these consolidated financial statements.
81
Table of Contents
ADVENT SOFTWARE, INC.
CONSOLIDATED STATEMENTS OF CASH FLOWS
(In thousands)
| | | | | | | | | | |
| | Years Ended December 31 | |
|---|
| | 2014 | | 2013 | | 2012 | |
|---|
Cash flows from operating activities: | | | | | | | | | | |
Net income | | $ | 50,212 | | $ | 28,802 | | $ | 30,415 | |
Adjustment to net income for discontinued operation net income | | | 51 | | | (50 | ) | | (184 | ) |
| | | | | | | | | | | |
Net income from continuing operations | | | 50,263 | | | 28,752 | | | 30,231 | |
Adjustments to reconcile net income to net cash provided by operating activities from continuing operations: | | |
| | |
| | |
| |
Stock-based compensation | | | 29,371 | | | 48,179 | | | 20,801 | |
Excess tax benefit from stock-based compensation | | | (10,257 | ) | | (7,477 | ) | | (7,785 | ) |
Depreciation and amortization | | | 21,201 | | | 24,393 | | | 25,879 | |
Amortization of debt issuance costs | | | 1,446 | | | 947 | | | 381 | |
(Reduction of) provision for doubtful accounts | | | (30 | ) | | 278 | | | 403 | |
(Reduction of) provision for sales return reserves | | | (521 | ) | | (306 | ) | | 1,154 | |
Loss on disposal of fixed assets | | | 2,786 | | | — | | | — | |
Deferred income taxes | | | 11,439 | | | 4,589 | | | 5,230 | |
Other | | | (1,226 | ) | | 29 | | | (252 | ) |
Changes in operating assets and liabilities, net of effect of acquisitions: | | | | | | | | | | �� |
Accounts receivable | | | (3,123 | ) | | 2,074 | | | 575 | |
Prepaid and other assets | | | 7,910 | | | (1,762 | ) | | 822 | |
Accounts payable | | | 5,938 | | | 27 | | | (5,368 | ) |
Accrued liabilities | | | (11,492 | ) | | (6,089 | ) | | (2,055 | ) |
Deferred revenues | | | 10,720 | | | 11,047 | | | 7,151 | |
Income taxes payable | | | 733 | | | (6,117 | ) | | 9,453 | |
| | | | | | | | | | | |
Net cash provided by operating activities from continuing operations | | | 115,158 | | | 98,564 | | | 86,620 | |
| | | | | | | | | | | |
Cash flows from investing activities: | | | | | | | | | | |
Cash used in acquisitions, net of cash acquired | | | — | | | — | | | (700 | ) |
Purchases of property and equipment | | | (8,973 | ) | | (5,616 | ) | | (6,369 | ) |
Capitalized software development costs | | | (1,873 | ) | | (1,995 | ) | | (2,137 | ) |
Purchases of marketable securities | | | (9,240 | ) | | (57,863 | ) | | (220,994 | ) |
Sales and maturities of marketable securities | | | 100 | | | 228,619 | | | 118,588 | |
Change in restricted cash | | | (173 | ) | | — | | | 95 | |
| | | | | | | | | | | |
Net cash (used in) provided by investing activities from continuing operations | | | (20,159 | ) | | 163,145 | | | (111,517 | ) |
| | | | | | | | | | | |
Cash flows from financing activities: | | | | | | | | | | |
Proceeds from common stock issued from exercises of stock options | | | 4,562 | | | 19,495 | | | 5,173 | |
Proceeds from common stock issued under the employee stock purchase plan | | | 6,362 | | | 6,293 | | | 6,661 | |
Excess tax benefits from stock-based compensation | | | 10,257 | | | 7,477 | | | 7,785 | |
Withholding taxes related to equity award net share settlement | | | (6,619 | ) | | (11,833 | ) | | (5,496 | ) |
Proceeds from debt | | | — | | | 375,000 | | | 50,000 | |
Repayment of debt | | | (85,000 | ) | | (165,000 | ) | | (5,000 | ) |
Debt issuance costs | | | — | | | (5,725 | ) | | — | |
Common stock repurchased and retired | | | (15,141 | ) | | (41,256 | ) | | (41,275 | ) |
Payment of cash dividend | | | (13,405 | ) | | (470,133 | ) | | — | |
| | | | | | | | | | | |
Net cash (used in) provided by financing activities from continuing operations | | | (98,984 | ) | | (285,682 | ) | | 17,848 | |
| | | | | | | | | | | |
Net cash transferred to discontinued operation | | | (347 | ) | | (375 | ) | | (561 | ) |
Effect of exchange rate changes on cash and cash equivalents | | |
(712 |
) | |
(41 |
) | |
302 | |
Net change in cash and cash equivalents from continuing operations | | | (5,044 | ) | | (24,389 | ) | | (7,308 | ) |
Cash and cash equivalents of continuing operations at beginning of period | | | 33,828 | | | 58,217 | | | 65,525 | |
| | | | | | | | | | | |
Cash and cash equivalents of continuing operations at end of period | | $ | 28,784 | | $ | 33,828 | | $ | 58,217 | |
| | | | | | | | | | | |
| | | | | | | | | | | |
| | | | | | | | | | | |
Supplemental disclosure of cash flow information: | | | | | | | | | | |
Cash paid for income taxes, net of refunds | | $ | 11,370 | | $ | 14,083 | | $ | 2,988 | |
Cash paid for interest | | $ | 5,882 | | $ | 5,665 | | $ | 1,737 | |
Cash flow from discontinued operation: | | |
| | |
| | |
| |
Net cash used in operating activities | | $ | (347 | ) | $ | (375 | ) | $ | (561 | ) |
Net cash transferred from continuing operations | | $ | 347 | | $ | 375 | | $ | 561 | |
The accompanying notes are an integral part of these consolidated financial statements.
82
Table of Contents
ADVENT SOFTWARE, INC.
NOTES TO CONSOLIDATED FINANCIAL STATEMENTS
Note 1—Summary of Significant Accounting Policies
Business description: Advent Software, Inc. and its subsidiaries (collectively "Advent" or the "Company") provide software products, Software-as-a-Service ("SaaS"), data and data interfaces and related maintenance and services that automate, integrate and support certain mission-critical functions of the front, middle and back offices of investment management organizations. Advent's clients vary significantly in size and assets under management and include investment advisors, asset managers, brokerage firms, hedge funds, foundations and endowments and banks.
Basis of presentation: The consolidated financial statements include the accounts of Advent and its subsidiaries after elimination of all intercompany transactions and amounts. The Company has prepared the accompanying consolidated financial statements in accordance with accounting principles generally accepted in the United States of America ("GAAP") and pursuant to the rules and regulations of the U.S. Securities and Exchange Commission ("SEC").
Divestiture of the MicroEdge segment and discontinued operation reclassification: On October 1, 2009, Advent completed the sale of MicroEdge, Inc. ("MicroEdge") a wholly-owned subsidiary of the Company. The assets, liabilities and results of MicroEdge have been reclassified as a discontinued operation in the consolidated financial statements for all periods presented. The results of operations and the related charges for the discontinued operation are classified as "Net income (loss) from discontinued operation, net of applicable taxes" in the accompanying consolidated statements of operations. Refer to Note 3 "Discontinued Operation" to these Notes to Consolidated Financial Statements for additional information on the Microedge discontinued operation.
Year End: Advent's fiscal year begins on January 1 and ends on December 31.
Foreign currency translation: The functional currencies of the Company's foreign subsidiaries are their local currencies. All assets and liabilities denominated in foreign functional currencies are translated into U.S. dollars at the closing exchange rate on the balance sheet date and equity balances are translated at historical rates. Revenues, costs and expenses in foreign functional currencies are translated at the average rate of exchange during the period.
Foreign currency measurement: Assets and liabilities denominated in a currency other than the functional currency are re-measured into the functional currency using the closing exchange rate on the balance sheet date, with gains and losses recorded in "Interest income and other expense, net" in the consolidated statement of operations.
Use of estimates: The preparation of financial statements in conformity with GAAP requires management to make estimates and assumptions that affect the reported amounts of assets and liabilities, the disclosure of contingent assets and liabilities at the date of the financial statements and the reported amounts of revenues and expenses during the reporting period. These estimates are based on information available as of the date of the financial statements and actual results could differ from those estimates. Advent believes the following critical accounting policies affect its more significant judgments and estimates used in the preparation of its consolidated financial statements: Business combinations; Goodwill impairment; Revenue recognition and Deferred revenues; Income taxes; Restructuring charges and related accruals; Impairment of long-lived assets; Legal contingencies; Sales returns and accounts receivable allowances; and Stock-based compensation.
83
Table of Contents
ADVENT SOFTWARE, INC.
NOTES TO CONSOLIDATED FINANCIAL STATEMENTS (Continued)
Note 1—Summary of Significant Accounting Policies (Continued)
Cash equivalents: Cash equivalents are comprised of highly liquid investments purchased with an original or remaining maturity of 90 days or less at the date of purchase.
Marketable securities: Marketable securities consist primarily of U.S. government and U.S. Government Sponsored Entities (GSEs) securities and high credit quality corporate debt securities not otherwise classified as cash equivalents. All marketable securities are considered available-for-sale and are carried at fair value on the Company's consolidated balance sheets. Short-term marketable securities mature twelve months or less from the date of the balance sheet and long-term marketable securities mature greater than twelve months from the date of the balance sheet.
Advent periodically reviews the realizability of each short-term and long-term marketable security when impairment indicators exist with respect to the security. If an other-than-temporary impairment of value of the security exists, the carrying value of the security is written down to its estimated fair value. Factors considered in determining whether a loss is temporary include the length of time and extent to which fair value has been less than the cost basis, the financial condition, credit quality and near-term prospects of the investee, and Advent's ability and intention to hold the securities for a period of time sufficient to allow for any anticipated recovery in market value.
Product development: Product development expenses consist primarily of salary, benefits and stock-based compensation for the Company's development and technical support staff, contractors' fees and other costs associated with the enhancements of existing products and services and development of new products and services. Costs incurred for software development prior to technological feasibility are expensed as product development costs in the period incurred. Once the point of technological feasibility is reached, which is generally the completion of a working prototype that has no critical bugs and is a release candidate, development costs are capitalized until the product is ready for general release and are classified within "Other intangibles, net" in the accompanying consolidated balance sheets. The Company amortizes capitalized software development costs using the greater of the ratio of the products' current gross revenues to the total of current gross revenues and expected gross revenues or on a straight-line basis over the estimated economic life of the related product, which is typically three years.
Capitalization of internal use software: Certain costs related to computer software developed or obtained for internal use (including for use in providing SaaS) are capitalized and classified within "Property and equipment, net" in the accompanying consolidated balance sheets. The Company capitalizes costs associated with customized internal-use software systems that have reached the application development stage. Such capitalized costs included external direct costs utilized in developing or obtaining the applications and payroll and payroll-related expenses for employees, who are directly associated with the development of the applications. Capitalization of such costs begins when the preliminary project stage is complete and ceases at the point in which the project is substantially complete and is ready for its intended purpose. Costs related to preliminary project activities and post implementation activities are expensed as incurred. The Company also capitalizes costs related to specific upgrades and enhancements when it is probable the expenditures will result in additional functionality. The Company depreciates internal use software costs on a straight-line basis over the assets' estimated useful lives, which typically range from three to seven years. Management evaluates the useful lives of these assets on an annual basis and tests for impairment whenever events or changes in circumstances occur that could impact the recoverability of these assets.
84
Table of Contents
ADVENT SOFTWARE, INC.
NOTES TO CONSOLIDATED FINANCIAL STATEMENTS (Continued)
Note 1—Summary of Significant Accounting Policies (Continued)
Property and equipment: Property and equipment are stated at cost, less accumulated depreciation and amortization in the Company's consolidated balance sheets. Advent calculates depreciation and amortization using the straight-line method over the assets' estimated useful lives. Amortization of leasehold improvements is computed using the straight-line method over the shorter of the estimated useful life of the assets or the remaining lease term. The cost and related accumulated depreciation applicable to property and equipment sold or no longer in service are eliminated from the accounts and any gains or losses are included in operating expenses. Useful lives by principal classifications are as follows:
| | |
| Computer equipment and software | | 3 to 7 years |
| Leasehold improvements | | Shorter of useful life or remaining lease term |
| Furniture and fixtures | | 3 to 5 years |
| Telephone system | | 3 to 5 years |
Repairs and maintenance expenditures, which are not considered improvements and do not extend the useful life of the property and equipment, are expensed as incurred.
Goodwill impairment: Advent reviews its goodwill for impairment annually as of November 1, and more frequently if an event or circumstance indicates that an impairment loss has occurred. Goodwill is tested for impairment at the reporting unit level. Advent determined that it has one reporting unit for the goodwill impairment testing performed as of November 1, 2014 and 2013.
Advent's test for goodwill impairment starts with a qualitative assessment to determine whether it is necessary to perform the quantitative goodwill impairment test. If Advent determines, based on the qualitative factors, that the fair value of the reporting unit is not more likely than not greater than the carrying amount, then the quantitative goodwill impairment test is required and is performed.
The quantitative test for goodwill impairment is a two-step process. The first step compares the fair value of each reporting unit with its respective carrying amount, including goodwill. If the fair value of the reporting unit exceeds its carrying amount, goodwill of the reporting unit is considered not impaired, thus the second step of the impairment test is unnecessary. The second step, used to measure the amount of impairment loss, compares the implied fair value of each reporting unit's goodwill with the respective carrying amount of that goodwill. If the carrying amount of the reporting unit's goodwill exceeds its implied fair value, an impairment loss is recognized in an amount equal to the excess.
Determining the fair value of a reporting unit is subjective and requires judgment at many points during the test including the development of future revenue and expense forecasts used to calculate future cash flows, the selection of risk-adjusted discount rates, and determination of market comparable entities.
Accounting for long-lived assets: Advent reviews its long-lived assets, including property and equipment and finite-lived intangible assets, for impairment whenever events or changes in circumstances indicate that the carrying amount of these assets may not be recoverable.
Recoverability is measured by comparing the carrying amount of the assets to the expected future undiscounted net cash flows to be generated by those assets. If such assets are considered to be impaired, the impairment to be recognized is measured based on the amount by which the carrying amount of the asset exceeds its fair value.
85
Table of Contents
ADVENT SOFTWARE, INC.
NOTES TO CONSOLIDATED FINANCIAL STATEMENTS (Continued)
Note 1—Summary of Significant Accounting Policies (Continued)
Finite-lived intangible assets mainly represent completed technology, distributor licenses, customer lists, trademark/tradenames and non-compete agreements acquired in business combinations. These assets are amortized on a straight-line basis over their estimated useful lives as follows:
| | |
| Purchased technology | | 4 to 6 years |
| Customer relationships | | 4 to 8 years |
| Other intangibles | | 3 to 7 years |
Revenue recognition and deferred revenues: Advent recognizes revenue from term license, maintenance and other recurring revenues; perpetual license fees, professional services and other. Advent offers a wide variety of products and services to a large number of financially sophisticated customers. While many of the Company's license transactions, maintenance contracts, subscription-based transactions and professional services projects conform to a standard structure, many of the larger transactions are complex and may require significant review and judgment in the application of GAAP.
Software license fees. Advent recognizes revenue from the licensing of software when persuasive evidence of an arrangement exists, the product has been delivered, the fee is fixed or determinable and collection of the resulting receivable is probable. Advent generally uses a signed license agreement as evidence of an arrangement. Sales through the Company's distributors are evidenced by a master agreement governing the relationship together with binding order forms and signed contracts from the distributor's customers. Revenue is recognized once delivery to the distributor's customer has taken place and when all other revenue recognition criteria have been met. Delivery occurs upon notification that software is available for electronic download through a fulfillment vendor, or when a product is delivered to a common carrier F.O.B shipping point, or upon confirmation that product delivered F.O.B shipping destination has been received. Some of the Company's arrangements include acceptance provisions; if such acceptance provisions are present, delivery is deemed to occur upon acceptance. Advent assesses whether the fee is fixed or determinable based on the payment terms associated with the transaction. Advent assesses whether the collectability of the resulting receivable is probable based on a number of factors, including the credit worthiness of the customer determined through a credit review process, including credit reporting agency reports, publicly available customer information, financial statements and other available information and pertinent country risk if the customer is located outside the United States. The Company's standard payment terms are due at 180 days or less, but payment terms may vary based on the country in which the agreement is executed. Software licenses are sold with maintenance, and often professional services.
Advent typically licenses its products on a per server, per user basis with the price per customer varying based on the selection of the products licensed, the assets under administration, the number of site installations and the number of authorized users.
Advent categorizes revenues in its consolidated statements of operations as recurring revenues and non-recurring revenues. Recurring revenues are comprised of term license, perpetual maintenance arrangements and other recurring revenue (which includes revenues from Black Diamond, Advent OnDemand and incremental Assets Under Administration fees from perpetual licenses). Non-recurring revenues are comprised of perpetual license fees, professional services and other revenue.
86
Table of Contents
ADVENT SOFTWARE, INC.
NOTES TO CONSOLIDATED FINANCIAL STATEMENTS (Continued)
Note 1—Summary of Significant Accounting Policies (Continued)
Recurring product revenues for fiscal 2014, 2013 and 2012 were as follows (in thousands):
| | | | | | | | | | |
| | Fiscal Years | |
|---|
| | 2014 | | 2013 | | 2012 | |
|---|
Term license revenues | | $ | 194,169 | | $ | 180,479 | | $ | 159,940 | |
Perpetual maintenance revenues | | | 64,100 | | | 65,412 | | | 67,063 | |
Other recurring revenues | | | 107,021 | | | 103,990 | | | 97,624 | |
| | | | | | | | | | | |
Total recurring revenues | | $ | 365,290 | | $ | 349,881 | | $ | 324,627 | |
| | | | | | | | | | | |
| | | | | | | | | | | |
| | | | | | | | | | | |
Term license contracts include both the software license and maintenance. Advent offers multi-year term licenses by which a customer makes a binding commitment that typically spans three years. For multi-year term licenses, Advent has not established vendor specific objective evidence ("VSOE") of fair value for the software license and maintenance components and, as a result, in situations where the Company is also performing related professional services, it defers all revenue and directly-related expenses under the arrangement until the implementation services and the remaining services are substantially complete. At the point professional services are substantially completed, Advent recognizes a pro-rata amount of the term license revenue, professional services fees earned and related expenses, based on the elapsed time from the start of the term license to the substantial completion of professional services. Advent determines this by applying management judgment. Term license revenue for the remaining contract years, the remaining deferred professional services revenue and related expenses are recognized ratably over the remaining contract length. When multi-year term licenses are sold and do not include related professional services, Advent recognizes the entire term license revenue ratably over the period of the contract term from the effective date of the license agreement assuming all other revenue recognition criteria have been met.
- •
- Assets Under Administration Revenues
Certain of Advent's perpetual and term license contracts include asset-based fee structures that provide additional revenues based on the assets that the client administers using the Company's software, referred to as assets under administration ("AUA"). Contracts containing an AUA fee structure have a defined measurement period (quarterly or annually) which requires the client to self-report actual AUA in arrears of the specified period. The Company recognizes term AUA contract minimum fees over the period of service. AUA fees above the stated minimum fee for the same period are considered incremental fees. Because incremental fees are neither determinable nor due and payable until the conclusion of the measurement period and reported, they are both earned and recognized upon completion of the measurement period and receipt of the report, on a quarterly or annual basis. Incremental fees from both term AUA and perpetual AUA contracts are included in "Recurring revenues" in the consolidated statements of operations.
87
Table of Contents
ADVENT SOFTWARE, INC.
NOTES TO CONSOLIDATED FINANCIAL STATEMENTS (Continued)
Note 1—Summary of Significant Accounting Policies (Continued)
Advent offers annual maintenance programs on perpetual licenses that provide for technical support and updates to the Company's software products. Maintenance fees are bundled with perpetual license fees in the initial licensing period and charged separately for renewals of annual maintenance in subsequent years. Fair value for maintenance is based upon either renewal rates stated in the contracts or separate sales of renewals to customers. Revenue is recognized ratably, or daily, over the term of the maintenance period, which is typically one year. Other Recurring Revenues
- •
- Other Recurring Revenues
Other recurring revenues include revenues from the Company's SaaS services, data services and other recurring revenue transactions.
SaaS services include Advent OnDemand, Advent OnDemand with Data Management, and Black Diamond. Advent OnDemand is the hosting and SaaS delivery of the Company's suite of investment management solutions. Advent recognizes revenue ratably over the period of service which is generally one year. Advent OnDemand with Data Management services include access to software on a SaaS basis as well as full account aggregation, daily portfolio reconciliation, corporate actions processing and reference data management. The Company prices this comprehensive service offering based on the number of accounts managed for each customer. Advent measures the number of accounts quarterly in arrears and recognizes revenue for these services as they are performed. Black Diamond offers a platform that provides outsourced daily reconciliation and data management services as well as portfolio management and reporting delivered through an online web-based application. The Company prices Black Diamond services based on the number of customer's accounts and the daily average of the assets under management ("AUM") within those accounts. The Company measures the number of accounts and AUM within customer accounts monthly in arrears and recognizes revenues for these services as they are performed.
Advent's data services revenues include Advent Custodial Data, Advent Corporate Actions and Advent Index Data. The Company recognizes revenue from data services either ratably over the subscription period or as the transactions occur within the subscription, based on the terms of the arrangement.
The Company recognizes revenue from other recurring revenue transactions either ratably over the subscription period or as the transactions occur, based on the terms of the arrangement. The Company's SaaS-based products are included in "Recurring revenues" in the Company's consolidated statements of operations.
Non-Recurring Revenues:
Non-recurring services revenues for fiscal 2014, 2013 and 2012 were as follows (in thousands):
| | | | | | | | | | |
| | Fiscal Years | |
|---|
| | 2014 | | 2013 | | 2012 | |
|---|
Professional services and other revenues | | $ | 29,623 | | $ | 30,866 | | $ | 31,280 | |
Perpetual license fees | | | 1,907 | | | 2,212 | | | 2,912 | |
| | | | | | | | | | | |
Total non-recurring revenues | | $ | 31,530 | | $ | 33,078 | | $ | 34,192 | |
| | | | | | | | | | | |
| | | | | | | | | | | |
| | | | | | | | | | | |
88
Table of Contents
ADVENT SOFTWARE, INC.
NOTES TO CONSOLIDATED FINANCIAL STATEMENTS (Continued)
Note 1—Summary of Significant Accounting Policies (Continued)
- •
- Professional services and other revenues
Advent offers a variety of professional services that include project management, implementation, data conversion, integration, custom report writing and training. The Company establishes VSOE of fair value for professional services upon separate sales of these services to customers. Professional services are generally billed on a time and materials basis using hourly rates together with reimbursement for travel and accommodation expenses. The Company recognizes revenue as these professional services are performed except in the case of multi-year term license contracts which are described in the "Term licenses" section above. Certain professional services arrangements involve acceptance criteria. In these cases, revenue and related expenses are recognized upon acceptance. Occasionally, professional services are performed under a fixed fee arrangement. For these arrangements, the Company defers revenue and related expenses until the services are complete. Professional services and other revenues also include revenue from the Company's user conferences which is recognized upon completion of the conference.
- •
- Perpetual licenses
Advent allocates revenue to delivered elements, normally the license component of the arrangement, using the residual method, based on VSOE of fair value of the undelivered elements (generally the maintenance and professional services elements), which is specific to the Company. Advent determines the fair value of the undelivered elements based on the historical evidence of the Company's stand-alone sales of these elements to third parties and/or renewal rates. If VSOE of fair value does not exist for any undelivered elements, then the entire arrangement fee is deferred until delivery of that element has occurred unless the only undelivered element is maintenance. Revenues from perpetual licenses are included in "Non-recurring revenues" in the Company's consolidated statements of operations.
Deferred revenues: Deferred revenue consists of billings or payments received in advance of revenue recognition and is recognized as the revenue recognition criteria are met. The Company generally invoices its customers annually or in monthly or quarterly installments and deferred revenues can be influenced by seasonality and timing of renewals. Deferred revenue that will be recognized during the succeeding 12-month periods is recorded as current deferred revenue, and the remaining portion is recorded as non-current deferred revenue.
The following table sets forth the composition of deferred revenues (in thousands):
| | | | | | | |
| | December 31 | |
|---|
| | 2014 | | 2013 | |
|---|
Term license deferred revenue | | $ | 107,814 | | $ | 99,473 | |
Term implementations deferred revenue | | | 41,632 | | | 40,221 | |
Perpetual license/maintenance deferred revenue | | | 28,883 | | | 32,657 | |
Other recurring deferred revenue | | | 25,787 | | | 21,565 | |
| | | | | | | | |
Total | | $ | 204,116 | | $ | 193,916 | |
| | | | | | | | |
| | | | | | | | |
| | | | | | | | |
89
Table of Contents
ADVENT SOFTWARE, INC.
NOTES TO CONSOLIDATED FINANCIAL STATEMENTS (Continued)
Note 1—Summary of Significant Accounting Policies (Continued)
Directly related expenses: When Advent defers service revenues, it also defers the direct costs incurred in the delivery of those services to the extent those costs are recoverable through future revenues, on non-cancelable contracts, as prepaid contract expense. Advent recognizes those deferred costs as costs of professional services revenues proportionally and over the same period that the deferred revenue is recognized as service revenue. When Advent defers license revenue, the Company defers the direct incremental costs incurred as a result of selling the contract (i.e. sales commissions earned by the sales force as a part of their overall compensation) because those costs would not have been incurred but for the acquisition of that contract. Advent recognizes those costs as sales and marketing expense proportionally and over the same period as the license revenues.
Allowance for doubtful accounts and sales returns: Advent analyzes specific accounts receivable, historical bad debts, customer concentrations, customer credit-worthiness, current economic trends and changes in its customer payment terms when evaluating the adequacy of the allowance for doubtful accounts. Advent had allowances for doubtful accounts of $36,000, $0.2 million and $0.1 million as of December 31, 2014, 2013 and 2012, respectively.
Advent also analyzes customer demand and acceptance of product and historical returns when evaluating the adequacy of the allowance for sales returns, which are not generally provided to customers. Allowances for sales returns are accounted for as reductions to net revenues and increases to reserves within deferred revenues. Advent's standard practice is to enforce its contract terms and not allow its customers to return software. The Company has, however, allowed customers to return software on a limited case-by-case basis. The Company generally only provides a contractual limited right of return to the end-user customer under the Company's shrink-wrap and click-through licenses. Those agreements provide for a right of return within seven days of delivery or availability of the software.
Advent has the ability to estimate returns based on a long history of experience with relatively homogenous transactions and the fact that the return period is short. The Company has recorded sales return provisions as offsets to revenue in the period the sales return becomes probable. The estimates for returns are adjusted periodically based upon historical rates of returns, terminations and cancellations. Advent has a methodology for calculating the value of reserves that takes the previous 12 months of experience into account. Advent had allowances for sales returns of $2.1 million, $2.7 million and $3.0 million as of December 31, 2014, 2013 and 2012, respectively.
Advertising costs: The Company expenses advertising costs as incurred and classifies these costs as sales and marketing expense. Total advertising expenses were $0.5 million, $0.8 million and $0.6 million for fiscal 2014, 2013 and 2012, respectively.
Stock-based compensation: Stock-based compensation cost is measured at the grant date based on the fair value of the award and is recognized as expense on a straight-line basis over the requisite service period, which is the vesting period.
Advent uses the Black-Scholes option pricing model to determine the fair value of stock options, stock appreciation rights ("SARs") and employee stock purchase plan shares. The fair value of the Company's restricted stock units is calculated based on the fair market value of Advent's stock on the date of grant. The determination of the fair value of stock-based payment awards on the date of grant using an option-pricing model is affected by Advent's stock price as well as assumptions regarding a number of complex and subjective variables. These variables include Advent's expected stock price
90
Table of Contents
ADVENT SOFTWARE, INC.
NOTES TO CONSOLIDATED FINANCIAL STATEMENTS (Continued)
Note 1—Summary of Significant Accounting Policies (Continued)
volatility over the term of the awards, actual and projected employee exercise behaviors, risk-free interest rate and expected dividends.
As the stock-based compensation expense recognized on the consolidated statements of operations for fiscal 2014, 2013 and 2012 is based on awards ultimately expected to vest, such amount has been reduced for estimated forfeitures at the time of grant and is revised, if necessary, in subsequent periods if actual forfeitures differ from those estimates. Forfeitures were estimated based on the Company's historical experience over the last five years.
Advent assesses on a quarterly basis the adequacy of the Company's pool of windfall tax benefits to determine if there are any deficiencies which require recognition in the Company's consolidated statements of operations.
Restructuring charges and related accruals: Advent has developed and implemented formalized plans for restructuring the business to better align its resources to market conditions and recorded charges resulting from the restructuring plans. In connection with the restructuring plans, Advent has recorded estimated expenses for severance and benefits, lease cancellations, asset write-offs and other restructuring costs. Given the significance and timing of the execution of such activities, this process is complex and involves periodic reassessments of estimates made at the time the original decisions were made, including evaluating real estate market conditions for expected vacancy periods and sub-lease rental income. Advent continually evaluates the adequacy of the remaining liabilities under the restructuring initiatives. Although the Company believes that these estimates accurately reflect the costs of the restructuring plans, actual results may differ, thereby requiring Advent to record additional provisions or reverse a portion of such provisions.
Recapitalization costs: In conjunction with the Special Dividend declared in June 2013, debt modification and equity award modification, Advent incurred costs related to advisory fees from third parties including financial advisory, legal and valuation fees. Advent expenses recapitalization costs as incurred and are reported as a separate line item on the Company's consolidated statements of operations. Refer to Note 4 "Special Dividend" to these Notes to Consolidated Financial Statements for additional information.
Income taxes: Advent accounts for worldwide income taxes under an asset and liability approach that requires the expected future tax consequences of temporary differences between book and tax bases of assets and liabilities be recognized as deferred tax assets and liabilities. A valuation allowance is recorded to reduce the net deferred tax assets to an amount that is more likely than not to be realized.
The Company has elected to use the "with and without" approach in determining the order in which tax attributes are utilized. As a result, the Company will only recognize a tax benefit from stock-based awards in additional paid-in capital if an incremental tax benefit is realized after all other tax attributes currently available to the Company have been utilized. In addition, the Company has elected to account for the impact of stock-based awards on other tax attributes, such as the research tax credit, through the consolidated statements of operations.
Net income per share: Basic net income per share is computed by dividing net income by the weighted average number of common shares outstanding for that period. Diluted net income per share is computed giving effect to all dilutive potential common shares that were outstanding during the
91
Table of Contents
ADVENT SOFTWARE, INC.
NOTES TO CONSOLIDATED FINANCIAL STATEMENTS (Continued)
Note 1—Summary of Significant Accounting Policies (Continued)
period. Dilutive potential shares consist of incremental common shares issuable upon exercise of stock options and stock appreciation rights, vesting of restricted stock units and conversion of preferred stock (none outstanding) for all periods, except in situations where their inclusion would be anti-dilutive.
Comprehensive income: Comprehensive income consists of net income, foreign currency translation and unrealized gains or losses on available-for-sale marketable securities, net of tax, and is presented in the Company's consolidated statements of comprehensive income.
Segment information: The Company operates under a single reportable segment: Advent Investment Management. Refer to Note 15 "Segment, Significant Customer and Geographic Information" to these Notes to Consolidated Financial Statements, for additional information about the segment.
Sales outside the U.S., which are based on the location to which the product is shipped or services are delivered, represented 19%, 18%, and 17% of the Company's net revenues for fiscal 2014, 2013 and 2012, respectively. No single customer accounted for more than 10% of net revenues for fiscal 2014, 2013 and 2012.
Certain risks and concentrations: Product revenues are concentrated in the investment management software industry, which is highly competitive and rapidly changing. Significant technological changes in the industry or customer requirements, or the emergence of competitive products with new capabilities or technologies could adversely affect operating results. Additionally, Advent derives a significant portion of its revenues from its Geneva, APX, Axys and Moxy applications and ancillary products and services, and therefore their market acceptance is essential to the Company's success.
Financial instruments that potentially subject the Company to concentrations of credit risks comprise, principally, cash, cash equivalents, trade accounts receivable and debt. Advent invests excess cash through banks, mutual funds, and brokerage houses primarily in highly liquid securities and has investment policies and procedures that attempt to minimize credit risk.
With respect to accounts receivable, Advent performs ongoing credit evaluations of its customers and does not require collateral. The Company maintains reserves for potential credit losses on customer accounts when deemed necessary. At December 31, 2014 and 2013, no single customer accounted for more than 10% of accounts receivable.
Common stock repurchases: Advent accounts for common stock repurchases by allocating the cash paid in excess of par value to additional paid-in capital and accumulated deficit. The Company calculates the average additional paid-in capital per outstanding share at the beginning of each monthly period in which stock was repurchased and records the difference between the repurchase price per share and the sum of the par value and average paid-in capital per share as an increase to accumulated deficit.
Fair value measurements: Advent measures its cash and cash equivalents, marketable securities, accounts receivable, accounts payable, accrued liabilities and debt at fair value. Additional disclosures regarding the Company's fair value measurements are included in Note 16 "Fair Value Measurements".
Recent accounting pronouncements: With the exception of the below, there have been no recent accounting pronouncements or changes in accounting pronouncements during year ended December 31,
92
Table of Contents
ADVENT SOFTWARE, INC.
NOTES TO CONSOLIDATED FINANCIAL STATEMENTS (Continued)
Note 1—Summary of Significant Accounting Policies (Continued)
2014 that are of significance, or potential significance, to the Company's consolidated financial statements.
In April 2014 the Financial Accounting Standards Board (FASB) issued Accounting Standards Update (ASU) No. 2014-08,"Presentation of Financial Statements (Topic 205) and Property, Plant, and Equipment (Topic 360): Reporting Discontinued Operations and Disclosures of Disposals of Components of an Entity." This update raises the threshold for a disposal to qualify as a discontinued operation and requires new disclosures for discontinued operations and disposals that do not meet the definition of a discontinued operation. ASU 2014-08 is effective prospectively for fiscal years, and interim periods within those years, beginning after December 15, 2014, which means that it will be effective for Advent's fiscal year beginning January 1, 2015. Early adoption of ASU 2014-08 is permitted, but only for disposals or assets held for sale that have not been reported in previously issued (or available to be issued) financial statements. Advent has not early adopted the provisions of ASU 2014-08. Advent expects to adopt this new standard in the first quarter of fiscal year 2015 and does not expect the adoption to have a material impact on the Company's consolidated financial statements.
In May 2014, the FASB issued ASU No. 2014-09,"Revenue from Contracts with Customers (Topic 606)." ASU 2014-09 is a comprehensive new revenue recognition model that requires a company to recognize revenue to depict the transfer of goods or services to a customer at an amount that reflects the consideration it expects to receive in exchange for those goods or services. ASU 2014-09 also requires additional disclosure about the nature, amount, timing and uncertainty of revenue and cash flows arising from customer contracts, including significant judgments and changes in judgments and assets recognized from costs incurred to obtain or fulfill a contract. ASU 2014-09 will replace most existing revenue recognition guidance in U.S. Generally Accepted Accounting Principles when it becomes effective. ASU 2014-09 is effective for annual reporting periods, and interim periods within those years, beginning after December 15, 2016, which means that it will be effective for Advent's fiscal year beginning January 1, 2017. Companies may use either a full retrospective or a modified retrospective approach to adopt the standard and early adoption is not permitted. The Company is evaluating the impact of the adoption of ASU 2014-09 on its consolidated financial statements.
In June 2014, the FASB issued ASU No. 2014-12,"Accounting for Share-Based Payments When the Terms of an Award Provide that a Performance Target Could be Achieved after the Requisite Service Period." ASU 2014-12 requires that a performance target that affects vesting, and that could be achieved after the requisite service period, be treated as a performance condition. ASU 2014-12 is effective for annual reporting periods, and interim periods within those years, beginning after December 15, 2015, which means that it will be effective for Advent's fiscal year beginning January 1, 2016. Early adoption of ASU 2014-12 is permitted. The Company will adopt ASU 2014-12 effective January 1, 2016 and does not expect the adoption to have a material impact on the Company's consolidated financial statements.
In August 2014, the FASB issued ASU No. 2014-15,"Disclosure of Uncertainties about an Entity's Ability to Continue as a Going Concern." ASU 2014-15 requires management to evaluate, at each annual and interim reporting period, whether there are conditions or events that raise substantial doubt about the entity's ability to continue as a going concern within one year after the date the financial statements are issued and provide related disclosures. ASU 2014-15 is effective for the annual reporting period ending after December 15, 2016, and for annual and interim periods thereafter, which means that it will be effective for Advent's fiscal year beginning January 1, 2017. Early adoption of
93
Table of Contents
ADVENT SOFTWARE, INC.
NOTES TO CONSOLIDATED FINANCIAL STATEMENTS (Continued)
Note 1—Summary of Significant Accounting Policies (Continued)
ASU 2014-15 is permitted. The Company will adopt ASU 2014-15 effective January 1, 2017 and does not expect the adoption to have a material impact on the Company's consolidated financial statements.
Note 2—Cash Equivalents and Marketable Securities
Cash, cash equivalents and marketable securities primarily consist of money market mutual funds, U.S. government and U.S. Government Sponsored Entities (GSEs) securities, foreign government debt securities and high credit quality corporate debt securities. All marketable securities were considered available-for-sale and were carried at fair value on the Company's consolidated balance sheet. Short-term marketable securities mature twelve months or less, and long-term marketable securities mature greater than twelve months, from the date of the consolidated balance sheet.
At December 31, 2013, the Company had no marketable securities. Marketable securities at December 31, 2014 are summarized as follows (in thousands):
| | | | | | | | | | | | | | | | |
Balance at December 31, 2014 | | Amortized
Cost | | Gross
Unrealized
Gains | | Gross
Unrealized
Losses
Less than
12 Months | | Gross
Unrealized
Losses
12 Months
or Longer | | Aggregate
Fair Value | |
|---|
Corporate debt securities | | $ | 7,184 | | $ | — | | $ | — | | $ | (22 | ) | $ | 7,162 | |
U.S. government debt securities | | | 1,347 | | | — | | | — | | | (6 | ) | | 1,341 | |
Municipal bonds | | | 671 | | | — | | | — | | | (2 | ) | | 669 | |
| | | | | | | | | | | | | | | | | |
Total | | $ | 9,202 | | $ | — | | $ | — | | $ | (30 | ) | $ | 9,172 | |
| | | | | | | | | | | | | | | | | |
| | | | | | | | | | | | | | | | | |
| | | | | | | | | | | | | | | | | |
The following table summarizes the contractual maturities of marketable securities at December 31, 2014 (in thousands):
| | | | | | | |
| | Amortized
Cost | | Aggregate
Fair Value | |
|---|
Matures in less than one year | | $ | 7,320 | | $ | 7,298 | |
Matures in one to three years | | | 1,882 | | | 1,874 | |
| | | | | | | | |
Total | | $ | 9,202 | | $ | 9,172 | |
| | | | | | | | |
| | | | | | | | |
| | | | | | | | |
The following table summarizes marketable securities with unrealized losses by contractual maturity dates at December 31, 2014 (in thousands):
| | | | | | | | | | | | | | | | | | | |
| | Less than 12 Months | | 12 Months or Longer | | Total | |
|---|
| | Fair
Value | | Gross
Unrealized
Losses | | Fair
Value | | Gross
Unrealized
Losses | | Fair
Value | | Gross
Unrealized
Losses | |
|---|
Corporate debt securities | | $ | 6,762 | | $ | (22 | ) | $ | — | | $ | — | | $ | 6,762 | | $ | (22 | ) |
US government debt securities | | | 1,342 | | | (6 | ) | | — | | | — | | | 1,342 | | | (6 | ) |
Municipal bonds | | | 669 | | | (2 | ) | | — | | | — | | | 669 | | | (2 | ) |
| | | | | | | | | | | | | | | | | | | | |
Total | | $ | 8,773 | | $ | (30 | ) | $ | — | | $ | — | | $ | 8,773 | | $ | (30 | ) |
| | | | | | | | | | | | | | | | | | | | |
| | | | | | | | | | | | | | | | | | | | |
| | | | | | | | | | | | | | | | | | | | |
94
Table of Contents
ADVENT SOFTWARE, INC.
NOTES TO CONSOLIDATED FINANCIAL STATEMENTS (Continued)
Note 2—Cash Equivalents and Marketable Securities (Continued)
Advent regularly reviews its investment portfolio to identify and evaluate investments that have indications of possible impairment. Factors considered in determining whether a loss is temporary include the length of time and extent to which fair value has been less than the cost basis, the financial condition, credit quality and near-term prospects of the investee, and Advent's ability to hold the investment for a period of time sufficient to allow for any anticipated recovery in market value.
For fixed income securities that have unrealized losses as of December 31, 2014, the Company has determined that (i) it does not have the intent to sell any of these investments while in a loss position and (ii) it is not more likely than not that it will be required to sell any of these investments before recovery of the entire amortized cost basis. In addition, the Company has evaluated these fixed income securities and has determined that no credit losses exist. As of December 31, 2014, all securities in an unrealized loss position have been in an unrealized loss position for less than one year. The Company's management has determined that the unrealized losses on its fixed income securities as of December 31, 2014 were temporary in nature. Unrealized gains and losses are a component of "Accumulated other comprehensive income" in the accompanying consolidated balance sheet as of December 31, 2014.
During fiscal 2014, 2013 and 2012, $0.1 million, $228.6 million and $118.6 million, respectively, of marketable securities were sold or matured, which did not have any associated material gross realized gains or losses.
Note 3—Discontinued Operation
During 2009, the Company discontinued the operations of its wholly-owned subsidiary, MicroEdge, Inc. ("MicroEdge"). In connection with the sale of MicroEdge, the Company vacated its MicroEdge facilities in New York and entered into a sub-lease agreement with the purchaser, whereby the purchaser contracted to sub-lease the premises through the end of the amended lease term in November 2018.
The following table sets forth an analysis of the components of the restructuring charges related to the Company's discontinued operation and the payments and non-cash charges made against the accrual during fiscal 2014 and 2013 (in thousands):
| | | | |
| | Facility Exit
Costs | |
|---|
Balance of restructuring accrual at December 31, 2012 | | $ | 4,030 | |
Restructuring charges | | | (197 | ) |
Cash payments | | | (598 | ) |
Adjustment of prior restructuring costs | | | 116 | |
| | | | | |
Balance of restructuring accrual at December 31, 2013 | | $ | 3,351 | |
Restructuring charges | | | 20 | |
Cash payments | | | (724 | ) |
Adjustment of prior restructuring costs | | | 95 | |
| | | | | |
Balance of restructuring accrual at December 31, 2014 | | $ | 2,742 | |
| | | | | |
| | | | | |
| | | | | |
Of the remaining restructuring accrual of $2.7 million at December 31, 2014, $0.7 million is included in "Current liabilities of discontinued operation" in the accompanying consolidated balance sheet. The facility exit costs related to the discontinued operation will be paid over the remaining lease term through November 2018.
95
Table of Contents
ADVENT SOFTWARE, INC.
NOTES TO CONSOLIDATED FINANCIAL STATEMENTS (Continued)
Note 3—Discontinued Operation (Continued)
Net revenues and income from the Company's discontinued operation were as follows for the periods presented (in thousands):
| | | | | | | | | | |
| | Fiscal Years | |
|---|
| | 2014 | | 2013 | | 2012 | |
|---|
Net revenues | | $ | — | | $ | — | | $ | — | |
| | | | | | | | | | | |
| | | | | | | | | | | |
| | | | | | | | | | | |
Income from operation of discontinued operation (net of applicable taxes of ($32), $34 and $126, respectively) | | $ | (51 | ) | $ | 50 | | $ | 184 | |
| | | | | | | | | | | |
| | | | | | | | | | | |
| | | | | | | | | | | |
The following table sets forth the assets and liabilities of the MicroEdge discontinued operation included in the consolidated balance sheets of the Company (in thousands):
| | | | | | | |
| | December 31 | |
|---|
| | 2014 | | 2013 | |
|---|
Assets: | | | | | | | |
Prepaid rent | | $ | — | | $ | 100 | |
| | | | | | | | |
Total current assets of discontinued operation | | $ | — | | $ | 100 | |
| | | | | | | | |
| | | | | | | | |
| | | | | | | | |
Deferred taxes, long-term | | $ | 1,093 | | $ | 1,337 | |
| | | | | | | | |
Total noncurrent assets of discontinued operation | | $ | 1,093 | | $ | 1,337 | |
| | | | | | | | |
| | | | | | | | |
| | | | | | | | |
Liabilities: | | | | | | | |
Accrued expenses and taxes | | $ | 572 | | $ | 600 | |
| | | | | | | | |
Total current liabilities of discontinued operation | | $ | 572 | | $ | 600 | |
| | | | | | | | |
| | | | | | | | |
| | | | | | | | |
Accrued restructuring, long-term portion | | $ | 2,170 | | $ | 2,782 | |
| | | | | | | | |
Total noncurrent liabilities of discontinued operation | | $ | 2,170 | | $ | 2,782 | |
| | | | | | | | |
| | | | | | | | |
| | | | | | | | |
Note 4—Special Dividend
On June 13, 2013, the Company's Board of Directors declared a one-time special cash dividend (the "Special Dividend") of $9.00 per share payable on each Common Share to stockholders of record at the close of business on July 1, 2013 (the "Dividend Record Date"). Based on the 52,237,055 shares of common stock outstanding on the Dividend Record Date, the dividend totaled $470.1 million and was paid to stockholders on July 9, 2013. The dividend reduced additional paid-in capital as the Company did not have retained earnings.
The Company financed the Special Dividend with cash, cash equivalents and marketable securities as well as borrowings under its Restated Credit Agreement. Refer to Note 9, "Debt" for additional information about the Company's Restated Credit Agreement.
96
Table of Contents
ADVENT SOFTWARE, INC.
NOTES TO CONSOLIDATED FINANCIAL STATEMENTS (Continued)
Note 5—Balance Sheet Detail
Prepaid expenses and other
The following is a summary of prepaid expenses and other assets (in thousands):
| | | | | | | |
| | December 31 | |
|---|
| | 2014 | | 2013 | |
|---|
Prepaid contract expense | | $ | 9,766 | | $ | 10,139 | |
Deferred commissions | | | 6,665 | | | 6,552 | |
Prepaid income tax | | | — | | | 2,659 | |
Debt issuance costs | | | 1,438 | | | 1,417 | |
Other | | | 7,115 | | | 9,347 | |
| | | | | | | | |
Total prepaid expenses and other | | $ | 24,984 | | $ | 30,114 | |
| | | | | | | | |
| | | | | | | | |
| | | | | | | | |
Property and equipment, net
The following is a summary of property and equipment, net (in thousands):
| | | | | | | |
| | December 31 | |
|---|
| | 2014 | | 2013 | |
|---|
Computer systems | | $ | 29,426 | | $ | 30,016 | |
Computer software | | | 39,293 | | | 31,515 | |
Leasehold improvements | | | 29,549 | | | 35,978 | |
Furniture and fixtures | | | 8,266 | | | 9,779 | |
Construction in process | | | 1,955 | | | 1,359 | |
| | | | | | | | |
Property and equipment, gross | | $ | 108,489 | | $ | 108,647 | |
Accumulated depreciation | | | (80,494 | ) | | (76,949 | ) |
| | | | | | | | |
Property and equipment, net | | $ | 27,995 | | $ | 31,698 | |
| | | | | | | | |
| | | | | | | | |
| | | | | | | | |
Depreciation expense was $11.0 million, $11.5 million and $11.8 million for fiscal 2014, 2013 and 2012, respectively. Costs of $8.0 million, $3.5 million and $1.6 million related to the development of internal use software were capitalized in 2014, 2013 and 2012, respectively, and are included in "Computer software" in the table above.
97
Table of Contents
ADVENT SOFTWARE, INC.
NOTES TO CONSOLIDATED FINANCIAL STATEMENTS (Continued)
Note 5—Balance Sheet Detail (Continued)
Other assets
The following is a summary of other assets (in thousands):
| | | | | | | |
| | December 31 | |
|---|
| | 2014 | | 2013 | |
|---|
Prepaid contract expense, long-term | | $ | 3,770 | | $ | 4,466 | |
Debt issuance costs | | | 3,483 | | | 4,899 | |
Long-term deferred commissions | | | 2,919 | | | 4,098 | |
Deposits | | | 2,915 | | | 2,608 | |
Other | | | 158 | | | 1,301 | |
| | | | | | | | |
Total other assets | | $ | 13,245 | | $ | 17,372 | |
| | | | | | | | |
| | | | | | | | |
| | | | | | | | |
Deposits include a restricted cash balance of $1.5 million and $1.3 million at December 31, 2014 and 2013, respectively, related to the Company's San Francisco headquarters, and facilities in Boston and New York. Refer to Note 11 "Commitments and Contingencies" to these Notes to Consolidated Financial Statements, for additional information.
Dividends Payable
In December 2014, Advent's Board of Directors (the "Board") declared a cash dividend of $0.13 per common share payable to shareholders of record as of December 31, 2014. On January 15, 2015, the Company paid this dividend which totaled $6.8 million. Any future dividends are subject to the approval of the Board, and restricted by the terms of the Merger Agreement.
Accrued liabilities
The following is a summary of accrued liabilities (in thousands):
| | | | | | | |
| | December 31 | |
|---|
| | 2014 | | 2013 | |
|---|
Salaries and benefits payable | | $ | 21,381 | | $ | 26,425 | |
Accrued dividend equivalents on restricted stock units | | | 3,404 | | | 3,171 | |
Deferred rent, current portion | | | 1,998 | | | 2,138 | |
Accrued restructuring, current portion | | | 61 | | | 998 | |
Other | | | 9,697 | | | 8,893 | |
| | | | | | | | |
Total accrued liabilities | | $ | 36,541 | | $ | 41,625 | |
| | | | | | | | |
| | | | | | | | |
| | | | | | | | |
As part of the modification of equity awards in 2013 as further described in Note 12, "Stock-based compensation", holders of certain restricted stock units (RSUs) have the right to receive $9.00 per RSU upon vesting.
98
Table of Contents
ADVENT SOFTWARE, INC.
NOTES TO CONSOLIDATED FINANCIAL STATEMENTS (Continued)
Note 5—Balance Sheet Detail (Continued)
Other long-term liabilities
The following is a summary of other long-term liabilities (in thousands):
| | | | | | | |
| | December 31 | |
|---|
| | 2014 | | 2013 | |
|---|
Deferred rent | | $ | 5,814 | | $ | 8,677 | |
Long-term deferred tax liability | | | 1,442 | | | 1,982 | |
Other | | | 565 | | | 512 | |
| | | | | | | | |
Total other long-term liabilities | | $ | 7,821 | | $ | 11,171 | |
| | | | | | | | |
| | | | | | | | |
| | | | | | | | |
Accumulated Other Comprehensive Income
The components of accumulated other comprehensive income, net of related taxes, were as follows (in thousands):
| | | | | | | |
| | December 31 | |
|---|
| | 2014 | | 2013 | |
|---|
Accumulated foreign currency translation adjustments | | $ | 3,491 | | $ | 11,009 | |
Accumulated net unrealized loss on marketable securities | | | (18 | ) | | — | |
| | | | | | | | |
Accumulated other comprehensive income, net of taxes | | $ | 3,473 | | $ | 11,009 | |
| | | | | | | | |
| | | | | | | | |
| | | | | | | | |
Note 6—Goodwill
The changes in the carrying value of goodwill for fiscal 2014 and 2013 were as follows (in thousands):
| | | | |
| | Goodwill | |
|---|
Balance at December 31, 2012 | | $ | 206,932 | |
Translation adjustments | | | 886 | |
| | | | | |
Balance at December 31, 2013 | | $ | 207,818 | |
Translation adjustments | | | (5,528 | ) |
| | | | | |
Balance at December 31, 2014 | | $ | 202,290 | |
| | | | | |
| | | | | |
| | | | | |
Translation adjustments reflect the impact of translating goodwill balances denominated in various foreign currencies to the U.S. Dollar. In 2014, the U.S. Dollar strengthened versus other currencies resulting in translation adjustments of $(5.5) million translation. In 2013, the U.S. Dollar weakened versus other currencies resulting in translation adjustments of $0.9 million.
During the fourth quarter of 2014, Advent completed the qualitative goodwill impairment test utilizing step zero, which involved assessing financial factors, including Advent's market capitalization and profitability and deviations from projected results, as well as other business factors, including assessing the current business environment, changes in the operation of its reporting unit and the results of the prior year goodwill impairment test. Based on the results of this qualitative assessment, Advent determined that the fair value of the reporting unit exceeds its carrying amount by a significant margin and, as a result, a quantitative analysis is not needed. The Company has not historically recognized any impairment charges to its goodwill and does not believe goodwill impairment charges are reasonably likely to occur for its reporting unit.
99
Table of Contents
ADVENT SOFTWARE, INC.
NOTES TO CONSOLIDATED FINANCIAL STATEMENTS (Continued)
Note 7—Other Intangibles, Net
The following is a summary of other intangible assets (in thousands, except weighted average amortization period):
| | | | | | | | | | | | |
| | Weighted
Average
Amortization
Period
(Years) | | Gross | | Accumulated
Amortization | | Net | |
|---|
Purchased technologies | | 5.1 | | $ | 50,152 | | $ | (43,195 | ) | $ | 6,957 | |
Product development costs | | 3.0 | | | 22,423 | | | (19,314 | ) | | 3,109 | |
| | | | | | | | | | | | | |
Developed technology sub-total | | | | | 72,575 | | | (62,509 | ) | | 10,066 | |
Customer relationships | | 6.4 | | |
40,783 | | |
(32,577 |
) | |
8,206 | |
Other intangibles | | 4.1 | | | 4,629 | | | (4,098 | ) | | 531 | |
| | | | | | | | | | | | | |
Other intangibles sub-total | | | | | 45,412 | | | (36,675 | ) | | 8,737 | |
| | | | | | | | | | | | | |
Balance at December 31, 2014 | | | | $ | 117,987 | | $ | (99,184 | ) | $ | 18,803 | |
| | | | | | | | | | | | | |
| | | | | | | | | | | | | |
| | | | | | | | | | | | | |
| | | | | | | | | | | | |
| | Weighted
Average
Amortization
Period
(Years) | | Gross | | Accumulated
Amortization | | Net | |
|---|
Purchased technologies | | 5.1 | | $ | 50,711 | | $ | (38,877 | ) | $ | 11,834 | |
Product development costs | | 3.0 | | | 20,524 | | | (17,183 | ) | | 3,341 | |
| | | | | | | | | | | | | |
Developed technology sub-total | | | | | 71,235 | | | (56,060 | ) | | 15,175 | |
Customer relationships | | 6.4 | | |
40,936 | | |
(29,786 |
) | |
11,150 | |
Other intangibles | | 4.1 | | | 4,645 | | | (3,578 | ) | | 1,067 | |
| | | | | | | | | | | | | |
Other intangibles sub-total | | | | | 45,581 | | | (33,364 | ) | | 12,217 | |
| | | | | | | | | | | | | |
Balance at December 31, 2013 | | | | $ | 116,816 | | $ | (89,424 | ) | $ | 27,392 | |
| | | | | | | | | | | | | |
| | | | | | | | | | | | | |
| | | | | | | | | | | | | |
100
Table of Contents
ADVENT SOFTWARE, INC.
NOTES TO CONSOLIDATED FINANCIAL STATEMENTS (Continued)
Note 7—Other Intangibles, Net (Continued)
The changes in the carrying value of intangible assets for fiscal 2014 and 2013 were as follows (in thousands):
| | | | | | | | | | |
| | Gross | | Accumulated
Amortization | | Net | |
|---|
Balance at December 31, 2011 | | $ | 112,422 | | $ | (62,901 | ) | $ | 49,521 | |
Additions | | |
2,137 | | |
— | | |
2,137 | |
Stock-based compensation additions | | | 92 | | | — | | | 92 | |
Amortization | | | — | | | (14,083 | ) | | (14,083 | ) |
Translation adjustments | | | (9 | ) | | 547 | | | 538 | |
| | | | | | | | | | | |
Balance at December 31, 2012 | | $ | 114,642 | | $ | (76,437 | ) | $ | 38,205 | |
Additions | | |
1,995 | | |
— | | |
1,995 | |
Stock-based compensation additions | | | 98 | | | — | | | 98 | |
Amortization | | | — | | | (12,862 | ) | | (12,862 | ) |
Translation adjustments | | | 81 | | | (125 | ) | | (44 | ) |
| | | | | | | | | | | |
Balance at December 31, 2013 | | $ | 116,816 | | $ | (89,424 | ) | $ | 27,392 | |
Additions | | |
1,780 | | |
— | | |
1,780 | |
Stock-based compensation additions | | | 119 | | | — | | | 119 | |
Amortization | | | — | | | (10,163 | ) | | (10,163 | ) |
Translation adjustments | | | (728 | ) | | 403 | | | (325 | ) |
| | | | | | | | | | | |
Balance at December 31, 2014 | | $ | 117,987 | | $ | (99,184 | ) | $ | 18,803 | |
| | | | | | | | | | | |
| | | | | | | | | | | |
| | | | | | | | | | | |
Total additions to intangible assets, inclusive of capitalized stock-based compensation expense, of $1.9 million in 2014 and $2.1 million in 2013 were associated with capitalized software development costs.
The following is a summary of amortization of the Company's developed technology and other intangible assets for the periods presented (in thousands):
| | | | | | | | | | |
| | Fiscal Years | |
|---|
| | 2014 | | 2013 | | 2012 | |
|---|
Developed technology: | | | | | | | | | | |
Amortization—purchased technologies | | $ | 4,642 | | $ | 6,841 | | $ | 7,599 | |
Amortization—product development costs | | | 2,130 | | | 2,246 | | | 2,659 | |
| | | | | | | | | | | |
Amortization of developed technology | | | 6,772 | | | 9,087 | | | 10,258 | |
Other intangibles: | | |
| | |
| | |
| |
Amortization—customer relationships | | | 2,858 | | | 2,850 | | | 2,854 | |
Amortization—other | | | 533 | | | 925 | | | 971 | |
| | | | | | | | | | | |
Amortization of other intangibles | | | 3,391 | | | 3,775 | | | 3,825 | |
| | | | | | | | | | | |
Total amortization | | $ | 10,163 | | $ | 12,862 | | $ | 14,083 | |
| | | | | | | | | | | |
| | | | | | | | | | | |
| | | | | | | | | | | |
101
Table of Contents
ADVENT SOFTWARE, INC.
NOTES TO CONSOLIDATED FINANCIAL STATEMENTS (Continued)
Note 7—Other Intangibles, Net (Continued)
Based on the carrying amount of intangible assets as of December 31, 2014, the estimated future amortization is as follows (in thousands):
| | | | | | | | | | | | | | | | | | | | | | |
| | Fiscal Years | |
| |
| |
|---|
| | 2015 | | 2016 | | 2017 | | 2018 | | 2019 | | Thereafter | | Total | |
|---|
Developed technology | | $ | 5,951 | | $ | 3,550 | | $ | 565 | | $ | — | | $ | — | | $ | — | | $ | 10,066 | |
Other intangibles | | | 3,202 | | | 2,700 | | | 1,867 | | | 925 | | | 43 | | | — | | | 8,737 | |
| | | | | | | | | | | | | | | | | | | | | | | |
Total | | $ | 9,153 | | $ | 6,250 | | $ | 2,432 | | $ | 925 | | $ | 43 | | $ | — | | $ | 18,803 | |
| | | | | | | | | | | | | | | | | | | | | | | |
| | | | | | | | | | | | | | | | | | | | | | | |
| | | | | | | | | | | | | | | | | | | | | | | |
Note 8—Restructuring Charges
Advent recorded restructuring charges of $4.6 million in 2014, which included employee termination benefits associated with the re-organization plan approved in April 2014 and exit costs associated with the consolidation of facilities in San Francisco and Boston in the third quarter of 2014. The total recognized cost for these plans was approximately $4.6 million and was substantially complete as of December 31, 2014.
Advent recorded restructuring charges of $3.8 million in 2013 and $3.6 million in 2012, which included severance and benefits costs associated with a re-organization plan approved in October 2012 of $3.6 million in each of 2013 and 2012, bringing the total recognized cost for the plan to approximately $7.2 million. This restructuring plan was substantially complete as of December 31, 2013. Restructuring charges in 2013 and 2012 also included $0.2 million and $76,000 in facility exit costs, respectively.
The following table sets forth an analysis of the changes in the restructuring accrual during the periods presented (in thousands):
| | | | | | | | | | |
| | Facility
Exit Costs | | Severance
and Benefits | | Total | |
|---|
Balance of restructuring accrual at December 31, 2011 | | $ | 448 | | $ | 602 | | $ | 1,050 | |
Restructuring charges | | |
76 | | |
3,554 | | |
3,630 | |
Cash payments | | | (524 | ) | | (1,018 | ) | | (1,542 | ) |
Accretion of prior restructuring costs | | | 4 | | | — | | | 4 | |
| | | | | | | | | | | |
Balance of restructuring accrual at December 31, 2012 | | $ | 4 | | $ | 3,138 | | $ | 3,142 | |
Restructuring charges | | |
181 | | |
3,589 | | |
3,770 | |
Cash payments | | | — | | | (5,914 | ) | | (5,914 | ) |
| | | | | | | | | | | |
Balance of restructuring accrual at December 31, 2013 | | $ | 185 | | $ | 813 | | $ | 998 | |
Restructuring charges | | |
2,909 | | |
1,719 | | |
4,628 | |
Non-cash write-off of leasehold improvements | | | (2,786 | ) | | — | | | (2,786 | ) |
Reversal of deferred rent related to facilities exited | | | 1,113 | | | — | | | 1,113 | |
Cash payments | | | (1,361 | ) | | (2,532 | ) | | (3,893 | ) |
| | | | | | | | | | | |
Balance of restructuring accrual at December 31, 2014 | | $ | 60 | | $ | — | | $ | 60 | |
| | | | | | | | | | | |
| | | | | | | | | | | |
| | | | | | | | | | | |
102
Table of Contents
ADVENT SOFTWARE, INC.
NOTES TO CONSOLIDATED FINANCIAL STATEMENTS (Continued)
Note 8—Restructuring Charges (Continued)
The remaining restructuring accrual of $60,000 at December 31, 2014 is included in "Accrued liabilities" in the accompanying consolidated balance sheet.
Note 9—Debt
On June 12, 2013, Advent entered into an Amended and Restated Credit Agreement (the "Restated Credit Agreement"). The Restated Credit Agreement amended and restated Advent's prior Credit Agreement, dated November 30, 2011. The Restated Credit Agreement provides for (i) a $200 million revolving credit facility, with a $25 million letter of credit sublimit and a $10 million swingline loan sublimit and (ii) a $225 million term loan facility. Advent may request revolving loans, swingline loans or the issuance of letters of credit until June 12, 2018, subject to demonstrating pro forma compliance with the financial covenant requirement under the Restated Credit Agreement. The Restated Credit Agreement also contains an incremental facility permitting Advent, subject to certain requirements, to arrange with the Lenders and/or new lenders for up to an aggregate of $75 million in additional commitments in the form of revolving loans or term loans. The proceeds of the revolving loans and term loans under the Restated Credit Agreement may be used for general purposes, including to finance dividends, repurchase common shares, finance acquisitions, or to finance other investments.
Minimum principal payments with respect to the term loans are due in 20 equal consecutive quarterly principal installments of $5.0 million, commencing on September 13, 2013, with the remaining outstanding principal balance and all accrued and unpaid interest due on June 12, 2018. Principal payments with respect to the revolving loans, together with all accrued and unpaid interest, are due on June 12, 2018. Advent may prepay the term loans and revolving loans at any time without penalty.
The revolving loans and term loans bear interest, at Advent's option, at the alternate base rate plus a margin of 0.25% to 1.25% or an adjusted LIBOR rate (based on one, two, three or six-month interest periods) plus a margin of 1.25% to 2.25%, in each case with such margin being determined based on the consolidated leverage ratio for the preceding four fiscal quarter period. The "alternate base rate" means the highest of (i) the Agent's prime rate, (ii) the federal funds rate plus a margin equal to 0.50% and (iii) the adjusted LIBOR rate for a one-month interest period plus a margin equal to 1.00%. Swingline loans accrue interest at a per annum rate based on the alternate base rate plus the applicable margin for alternate base rate loans. Advent is also obligated to pay other customary closing fees, arrangement fees, administration fees, commitment fees and letter of credit fees for a credit facility of this size and type.
The obligations under the Restated Credit Agreement are guaranteed by Advent's present and future domestic subsidiaries, subject to certain exceptions. The loan is secured by substantially all of the assets of Advent and the guarantors party thereto, including all of the capital stock of Advent's domestic subsidiaries and 66% of the capital stock of Advent's or a guarantor's first-tier foreign subsidiaries.
The Restated Credit Agreement contains customary affirmative and negative covenants, including covenants that limit or restrict Advent and its subsidiaries' ability to, among other things, incur indebtedness, grant liens, merge or consolidate, dispose of assets, pay dividends or make distributions, make investments, make acquisitions, prepay certain indebtedness, enter into certain transactions with affiliates, enter into sale and leaseback transactions, enter into swap agreements and enter into restrictive agreements, in each case subject to customary exceptions for a credit facility of this size and type. Advent is also required to maintain compliance with a consolidated leverage ratio and a consolidated interest coverage ratio.
103
Table of Contents
ADVENT SOFTWARE, INC.
NOTES TO CONSOLIDATED FINANCIAL STATEMENTS (Continued)
Note 9—Debt (Continued)
The following is a summary of the Company's outstanding debt balances (in thousands):
| | | | | | | |
| | December 31 | |
|---|
| | 2014 | | 2013 | |
|---|
Term loan facility | | $ | 195,000 | | $ | 215,000 | |
Revolving credit facility | | | 25,000 | | | 90,000 | |
| | | | | | | | |
Total | | $ | 220,000 | | $ | 305,000 | |
| | | | | | | | |
| | | | | | | | |
| | | | | | | | |
Advent was in compliance with all associated covenants as of December 31, 2014 as follows:
| | | | | | |
Covenant | | Covenant
Requirement | | Ratio
Calculation
as of
December 31,
2014 | |
|---|
Leverage ratio(1) | | Maximum 3.75x(2) | | | 1.7x | |
Interest coverage ratio(3) | | Minimum 2.5x | | | 18.1x | |
- (1)
- Calculated as the ratio of total debt to EBITDA, as defined by the Restated Credit Agreement, for the period of four consecutive fiscal quarters on the measurement date.
- (2)
- The leverage ratio covenant requirement lowers to a maximum of 3.50x on June 30, 2015 and 3.25x on June 30, 2016.
- (3)
- Calculated as the ratio of EBITDA to interest expense, as defined by the Restated Credit Agreement, for the period of four consecutive fiscal quarters on the measurement date.
The Restated Credit Agreement includes customary events of default that include, among other things, non-payment defaults, defaults due to the inaccuracy of representations and warranties, covenant defaults, cross default to material indebtedness, bankruptcy and insolvency defaults, material judgment defaults, defaults due to an unenforceability of the security documents or guarantees, and a change of control default. The occurrence of an event of default could result in the acceleration of the obligations under the Restated Credit Agreement. A default interest rate will apply on all obligations during the existence of a payment event of default under the Restated Credit Agreement at a per annum rate equal to 2.00% above the otherwise applicable interest rate.
Note 10—Income Taxes
The components of income from continuing operations before income taxes were as follows (in thousands):
| | | | | | | | | | |
| | Fiscal Years | |
|---|
| | 2014 | | 2013 | | 2012 | |
|---|
US | | $ | 76,608 | | $ | 37,864 | | $ | 48,552 | |
Foreign | | | 173 | | | 1,055 | | | (993 | ) |
| | | | | | | | | | | |
Total | | $ | 76,781 | | $ | 38,919 | | $ | 47,559 | |
| | | | | | | | | | | |
| | | | | | | | | | | |
| | | | | | | | | | | |
104
Table of Contents
ADVENT SOFTWARE, INC.
NOTES TO CONSOLIDATED FINANCIAL STATEMENTS (Continued)
Note 10—Income Taxes (Continued)
The components of the provision for income taxes included (in thousands):
| | | | | | | | | | |
| | Fiscal Years | |
|---|
| | 2014 | | 2013 | | 2012 | |
|---|
Current: | | | | | | | | | | |
Federal | | $ | 19,238 | | $ | 11,740 | | $ | 12,845 | |
State | | | 5,131 | | | 3,034 | | | 1,653 | |
Foreign | | | 2,132 | | | 1,121 | | | 774 | |
Deferred: | | | | | | | | | | |
Federal | | | 2,272 | | | (4,000 | ) | | 3,502 | |
State | | | (452 | ) | | (1,102 | ) | | (576 | ) |
Foreign | | | (1,803 | ) | | (626 | ) | | (870 | ) |
| | | | | | | | | | | |
Total | | $ | 26,518 | | $ | 10,167 | | $ | 17,328 | |
| | | | | | | | | | | |
| | | | | | | | | | | |
| | | | | | | | | | | |
The effective income tax rate on earnings differed from the statutory federal tax rate as follows:
| | | | | | | | | | |
| | Fiscal Years | |
|---|
| | 2014 | | 2013 | | 2012 | |
|---|
Statutory federal rate | | | 35.0 | % | | 35.0 | % | | 35.0 | % |
State taxes | | | 4.7 | | | 4.4 | | | 4.3 | |
Stock compensation relating to incentive stock options and employee stock purchase plans | | | 0.5 | | | 0.1 | | | 0.6 | |
Research and development and other state tax credits | | | (3.7 | ) | | (12.0 | ) | | (2.8 | ) |
Change in valuation allowance | | | — | | | (0.1 | ) | | (0.1 | ) |
Change in state contingency reserve | | | 0.1 | | | — | | | (0.2 | ) |
Foreign taxes | | | 0.4 | | | 0.6 | | | 0.8 | |
Impact of state tax rate changes on net deferred tax assets | | | — | | | — | | | (0.2 | ) |
Domestic production activities deduction | | | (2.2 | ) | | (1.7 | ) | | — | |
Other, net | | | (0.3 | ) | | (0.2 | ) | | (1.0 | ) |
| | | | | | | | | | | |
Effective income tax rate | | | 34.5 | % | | 26.1 | % | | 36.4 | % |
| | | | | | | | | | | |
| | | | | | | | | | | |
| | | | | | | | | | | |
Advent has not provided U.S. income taxes and foreign withholding taxes on the undistributed earnings of foreign subsidiaries as of December 31, 2014 because the Company intends to permanently reinvest such earnings outside the U.S. If these foreign earnings were to be repatriated in the future, the related U.S. tax liability may be reduced by any foreign income taxes previously paid on these earnings. As of December 31, 2014, the cumulative amount of earnings upon which U.S. income taxes have not been provided is approximately $23.8 million. Determination of the amount of unrecognized deferred tax liability related to these earnings is not practicable.
105
Table of Contents
ADVENT SOFTWARE, INC.
NOTES TO CONSOLIDATED FINANCIAL STATEMENTS (Continued)
Note 10—Income Taxes (Continued)
The tax effects of temporary differences that gave rise to significant portions of the deferred tax assets and liabilities were as follows (in thousands):
| | | | | | | |
| | December 31 | |
|---|
| | 2014 | | 2013 | |
|---|
Deferred tax assets, current: | | | | | | | |
Deferred revenue | | $ | 2,779 | | $ | 3,117 | |
Other accrued liabilities and reserves | | | 5,914 | | | 6,378 | |
Stock compensation | | | 19,520 | | | 15,363 | |
Other | | | 62 | | | 40 | |
| | | | | | | | |
Total deferred tax assets, current | | | 28,275 | | | 24,898 | |
| | | | | | | | |
Non-current deferred tax assets: | | | | | | | |
Depreciation and amortization | | | — | | | 45 | |
Net operating losses, capital losses and credit carryforwards | | | 16,149 | | | 19,536 | |
Other | | | 3,006 | | | 4,265 | |
Valuation allowance | | | (797 | ) | | (826 | ) |
| | | | | | | | |
Total deferred tax assets, non-current | | | 18,358 | | | 23,020 | |
| | | | | | | | |
Deferred tax assets | | | 46,633 | | | 47,918 | |
Depreciation and amortization | | | (188 | ) | | — | |
Other deferred tax liabilities | | | (1,254 | ) | | (1,982 | ) |
| | | | | | | | |
Deferred tax liabilities | | | (1,442 | ) | | (1,982 | ) |
| | | | | | | | |
Net deferred tax assets | | $ | 45,191 | | $ | 45,936 | |
| | | | | | | | |
| | | | | | | | |
| | | | | | | | |
The Company maintains a valuation allowance against its deferred tax assets relating to capital losses and investment reserves of $797,000 at December 31, 2014 as it believes that based upon the available evidence, it is more likely than not that these assets will not be realized. If it is determined in the future that it is more likely than not that these deferred tax assets will be realized, the valuation allowance will be reduced.
At December 31, 2014, Advent had federal net operating loss carryforwards of approximately $2.4 million. Utilization of these loss carryforwards, including losses obtained from acquisitions, is subject to certain limitations under the federal income tax laws. These net operating loss carryforwards expire between 2021 and 2027. Also at December 31, 2014, Advent had state net operating loss carryforwards in various states in which it files tax returns.
Advent had federal research credits of $13.9 million which expire between 2029 and 2034. Advent also had California research credits of $25.2 million which do not expire, and California enterprise zone credits of $7.3 million which expire in 2023.
106
Table of Contents
ADVENT SOFTWARE, INC.
NOTES TO CONSOLIDATED FINANCIAL STATEMENTS (Continued)
Note 10—Income Taxes (Continued)
The following table summarizes the activity relating to the Company's unrecognized tax benefits during the periods presented (in thousands):
| | | | |
| | Total | |
|---|
Balance at December 31, 2011 | | $ | 11,144 | |
Gross increases related to tax positions in prior period | | | 12 | |
Gross increases related to current period tax positions | | | 992 | |
| | | | | |
Balance at December 31, 2012 | | $ | 12,148 | |
Gross increases related to tax positions in prior period | | | 10 | |
Gross increases related to current period tax positions | | | 2,520 | |
| | | | | |
Balance at December 31, 2013 | | $ | 14,678 | |
Gross increases related to tax positions in prior period | | | 10 | |
Gross increases related to current period tax positions | | | 1,699 | |
| | | | | |
Balance at December 31, 2014 | | $ | 16,387 | |
| | | | | |
| | | | | |
| | | | | |
If recognized, the portion of unrecognized tax benefits at December 31, 2014 that would decrease Advent's tax provision and increase net income is $13.5 million. The impact on net income reflects the liabilities for unrecognized tax benefits net of the federal tax benefit of state income tax items. Advent recognizes interest and penalties accrued on unrecognized tax benefits as well as interest received from favorable settlements within "Provision for income taxes" in the consolidated statement of operations. As of December 31, 2014, Advent has accrued a nominal amount of interest and penalties for specific exposures in two states. Advent has not accrued any interest or penalties for its federal and other state reserves, as any reversal of uncertain tax positions would not result in the assessment of penalties or interest due to the Company's surplus of deferred tax assets that would offset any additional tax.
Advent is subject to taxation in the U.S. and various states and jurisdictions outside the U.S. Advent is currently undergoing a State of California franchise tax examination for the 2006 and 2007 tax years and State of New York for the 2011, 2012 and 2013 tax years. Advent is not under examination in any other income tax jurisdiction at the present time and does not anticipate the total amount of its unrecognized tax benefits to significantly change over the next 12 months. The material jurisdictions that are subject to examination by tax authorities include federal for tax years after 2010 and California for tax years after 2005.
Note 11—Commitments and Contingencies
Advent leases office space and equipment under non-cancelable operating lease agreements, which expire at various dates through June 2025. Some operating leases contain escalation provisions for adjustments in the consumer price index. Advent is responsible for maintenance, insurance, and property taxes.
On October 1, 2009, Advent completed the sale of the Company's MicroEdge subsidiary. At December 31, 2014, the gross operating lease commitments and sub-lease income related to this discontinued operation facility totaled $5.1 million and $2.3 million, respectively. With the exception of the MicroEdge facilities in New York City, the lease obligations related to MicroEdge have been
107
Table of Contents
ADVENT SOFTWARE, INC.
NOTES TO CONSOLIDATED FINANCIAL STATEMENTS (Continued)
Note 11—Commitments and Contingencies (Continued)
transferred to the Purchaser. Refer to Note 3 "Discontinued Operation" to these Notes to Consolidated Financial Statements, for additional information on the MicroEdge discontinued operation.
Future minimum payments under non-cancelable operating leases consisted of the following at December 31, 2014 (in thousands):
| | | | | | | | | | |
| | Future | |
|---|
Fiscal Years | | Lease
Payments* | | Sub-lease
Income | | Net Lease
Payments | |
|---|
2015 | | $ | 10,822 | | $ | 542 | | $ | 10,280 | |
2016 | | | 9,897 | | | 598 | | | 9,299 | |
2017 | | | 4,889 | | | 598 | | | 4,291 | |
2018 | | | 3,890 | | | 599 | | | 3,291 | |
2019 | | | 3,773 | | | 607 | | | 3,166 | |
Thereafter | | | 15,156 | | | 834 | | | 14,322 | |
| | | | | | | | | | | |
Total | | $ | 48,427 | | $ | 3,778 | | $ | 44,649 | |
| | | | | | | | | | | |
| | | | | | | | | | | |
| | | | | | | | | | | |
- *
- The decrease in future operating lease payments starting in 2016 reflects the end of the current lease term for the Company's San Francisco headquarters in October 2016. On January 28, 2015, Advent extended the San Francisco lease for an additional 10 years, which will result in total operating lease payments of approximately $71 million from November 1, 2016 through October 31, 2026, which is not reflected in the table above.
Rent expense for fiscal 2014, 2013 and 2012 was $8.0 million, $8.7 million and $8.5 million, respectively, net of sub-lease income from non-restructured facilities of $236,000, $45,000 and $0, respectively.
Indemnification Obligations
As permitted or required under Delaware law and to the maximum extent allowable under that law, Advent has certain obligations to indemnify its current and former officers and directors for certain events or occurrences while the officer or director is, or was serving, at Advent's request in such capacity. These indemnification obligations are valid as long as the director or officer acted in good faith and in a manner the person reasonably believed to be in or not opposed to the best interests of the corporation, and, with respect to any criminal action or proceeding, had no reasonable cause to believe his or her conduct was unlawful. The maximum potential amount of future payments Advent could be required to make under these indemnification obligations is unlimited; however, Advent has a director and officer insurance policy that mitigates Advent's exposure and enables Advent to recover a portion of any future amounts paid. The Company believes the estimated fair value of these indemnification obligations is minimal.
Legal Contingencies
From time to time, in the course of its operations, the Company is a party to litigation matters and claims, including claims related to employee relations, business practices and other matters other than
108
Table of Contents
ADVENT SOFTWARE, INC.
NOTES TO CONSOLIDATED FINANCIAL STATEMENTS (Continued)
Note 11—Commitments and Contingencies (Continued)
those that may be specified herein, but does not consider these matters to be material either individually or in the aggregate at this time. Litigation can be expensive and disruptive to normal business operations. Moreover, the results of complex legal proceedings are difficult to predict and the Company's view of these matters may change in the future as the litigation and related events unfold. An unfavorable outcome in any legal matter, if material, could have a material adverse effect on the Company's financial position, liquidity or results of operations in the period in which the unfavorable outcome occurs and potentially in future periods.
Advent reviews the status of each litigation matter or other claim and records a provision for a liability when it is considered both probable that a liability has been incurred and the amount of the loss can be reasonably estimated. These provisions are reviewed quarterly and adjusted as additional information becomes available. If either or both of the criteria are not met, the Company reassesses whether there is at least a reasonable possibility that a loss, or additional losses, may be incurred. If there is a reasonable possibility that a loss may be incurred, the Company discloses the estimate of the amount of loss or range of loss, discloses that the amount is immaterial (if true), or discloses that an estimate of loss cannot be made. In assessing potential loss contingencies, the Company considers a number of factors, including those listed in the Financial Accounting Standards Board's Accounting Standards Codification ("ASC") 450-20, Contingencies—Loss Contingencies, regarding assessing the probability of a loss occurring and assessing whether a loss is reasonably estimable. The Company expenses legal fees as incurred.
As of February 20, 2015, three putative class action lawsuits challenging the transactions contemplated by the Merger Agreement have been filed by purported Advent stockholders in the Court of Chancery of the State of Delaware against Advent, Advent's Board of Directors, SS&C, and Merger Sub. These actions are captioned Chitwood v. Advent Software, Inc., et al., Case No. 10623-VCL, City of Atlanta Firefighters' Pension Fund v. David Peter F. Hess, Jr., et al., Case No. 10633-VCL, and Klein v. Advent Software, Inc., et al., Case No. 10670-VCL. The actions generally allege, among other things, that the Board of Directors breached its fiduciary duties to Advent's stockholders by engaging in a flawed sales process, agreeing to a transaction price that does not adequately compensate Advent stockholders, and agreeing to certain deal protection terms in the Merger Agreement that allegedly preclude a potential competing bid. The actions also allege that the other defendants aided and abetted the Board of Directors' breaches of fiduciary duties. The actions seek various remedies including to enjoin or rescind the merger, damages, and costs.
Management believes that any potential losses associated with the legal proceedings regarding the merger are neither probable nor reasonably estimable at this time and accordingly has not accrued any amounts for any potential loss.
Based on currently available information, the Company's management does not believe that the ultimate outcome of unresolved matters, individually and in the aggregate, is likely to have a material adverse effect on the Company's financial position, results of operations or cash flows.
109
Table of Contents
ADVENT SOFTWARE, INC.
NOTES TO CONSOLIDATED FINANCIAL STATEMENTS (Continued)
Note 12—Stock-Based Compensation
Description of Plans
Advent has stock options and awards outstanding under its 2002 Stock Plan (the "Plan"). On May 7, 2014, the Company's stockholders approved the amendment and restatement of Advent's 2002 Stock Plan, originally approved by the Board of Directors (the "Board") and stockholders in February and May, respectively, of 2002. Under the Plan, the Company may grant stock options (or "Options") to purchase the Company's common stock to employees, consultants and directors. The Plan also permits the award of restricted stock, restricted stock units (or "RSUs"), stock appreciation rights (or "SARs"), performance shares, and performance units. Advent also has two stock plans that have no outstanding awards as of December 31, 2014: the 1998 Non-statutory Stock Option Plan and the 1995 Director Option Plan.
Options granted may be incentive stock options or non-statutory stock options and shall be granted at a price not less than fair market value on the date of grant. Fair market value (as defined in the Plan) and the vesting of these options shall be determined by the Board. The options generally vest over 4 years and expire no later than 10 years from the date of grant.
RSUs are awards of restricted stock units that generally vest over four years with half earned on the second anniversary of the date of grant and the remaining half earned at the end of the fourth anniversary of the date of grant. Upon vesting, RSUs will convert into an equivalent number of shares of common stock. The value of the RSUs is based on the closing market price of the Company's common stock on the date of grant and is amortized on a straight-line basis over the four-year requisite service period.
SARs are the right to receive the appreciation in fair market value of common stock between the exercise date and the date of grant. SARs generally vest over 4 years, and expire no later than 10 years from the date of grant. Upon exercise, SARs will be settled in shares of Advent common stock.
Unvested RSUs, stock options and SARs are generally canceled on termination of employment and returned to the Plan.
Non-employee directors are eligible to receive awards of SARs and RSUs under the 2002 Stock Plan as follows:
- •
- Upon joining the Board, awards totaling $300,000 in value with approximately 70% of the value awarded in SARs and 30% awarded in RSUs.
- •
- Upon re-election to the Board, awards totaling $150,000 in value with approximately 70% of the value awarded in SARs and 30% awarded in RSUs.
In the event of a merger with or into another corporation, or other change in control, each non-employee director shall fully vest in and have the right to exercise all of his or her outstanding equity compensation (including outstanding stock options, SARs, RSUs, or performance shares). Upon a director's retirement from the Board, the director's unvested options, SARs and RSUs are canceled and returned to the Plan. Additionally, certain executives and other key employees will receive accelerated vesting benefits for termination due to a change-in-control.
110
Table of Contents
ADVENT SOFTWARE, INC.
NOTES TO CONSOLIDATED FINANCIAL STATEMENTS (Continued)
Note 12—Stock-Based Compensation (Continued)
All Advent U.S. employees are eligible to participate in the employee stock purchase plan ("ESPP") if they are employed by Advent for at least 20 hours per week and at least five months per year. The ESPP permits eligible employees to purchase Advent's common stock through payroll deductions at a price equal to 85% of the lower of the closing sale price for the Company's common stock reported on the NASDAQ National Market at the beginning or the end of each six-month offering period. In any calendar year, eligible employees can withhold up to 10% of their salary and certain variable compensation.
On May 18, 2005, Advent's shareholders approved the 2005 ESPP with 4,000,000 shares of common stock reserved for issuance. The following table summarizes the Company's issuance of common stock for the total Company under the 2005 ESPP:
| | | | | | | | | | |
| | Fiscal Years | |
|---|
| | 2014 | | 2013 | | 2012 | |
|---|
Common shares issued | | | 248,246 | | | 283,267 | | | 325,270 | |
Average price | | $ | 25.63 | | $ | 22.21 | | $ | 20.48 | |
As of December 31, 2014, common shares of 960,358 were reserved for future issuance under the 2005 ESPP.
Advent sponsors a 401(k) Plan to provide retirement benefits for its U.S. employees. This Plan provides for tax-deferred salary deductions for eligible employees. Employees may contribute between 1% and 70% of their compensation to this Plan, limited by an annual maximum amount as determined by the Internal Revenue Service. The Company also makes a 50% matching contribution of up to 6% of employee compensation. The Company's matching contributions to this plan totaled $3.8 million, $3.8 million and $4.0 million for fiscal 2014, 2013 and 2012, respectively. In addition to the employer matching contribution, Advent may make profit sharing contributions at the discretion of its Board of Directors. Advent did not make any profit sharing contributions in fiscal 2014, 2013 and 2012.
Equity Award Modification
On June 12, 2013, the Company's Board of Directors approved a one-time special cash dividend (the "Special Dividend") of $9.00 per share payable on each Common Share. In connection with the declaration of the Special Dividend, equity award modifications affecting approximately 900 employees and non-employee directors were made on June 12, 2013 (the "Modification Date") for awards outstanding as of July 9, 2013 in a manner that was intended to preserve the pre-cash dividend economic value of these awards granted under the 2002 Stock Plan, 1998 non-statutory Stock Option Plan and 1995 Director Option Plan.
The Company recalculated the Black-Scholes fair values of its eligible outstanding options and SARs on the Modification Date, reflecting the reduction in their exercise prices of up to $9.00 per share, to determine the non-cash incremental stock-based compensation expense. For holders of
111
Table of Contents
ADVENT SOFTWARE, INC.
NOTES TO CONSOLIDATED FINANCIAL STATEMENTS (Continued)
Note 12—Stock-Based Compensation (Continued)
outstanding stock options and SARs for which there otherwise could be a negative tax consequence, the exercise price was reduced only to the extent that there would be no tax consequence; and Advent made a cash payment of $5.4 million in July 2013 to the option and SAR holders for the difference between $9.00 and the exercise price reduction of the award. Additionally, Advent modified eligible outstanding RSUs to allow for a cash payment of an amount equivalent to $9.00 per share of the Company's common stock underlying the unvested RSUs upon vesting.
The following table summarizes the Black-Scholes inputs used in calculating the fair value and incremental expense to be recognized in connection with the equity award modification that occurred in June 2013:
| | | | |
Stock Options & SARs | | Pre-Modification | | Post-Modification |
|---|
Market price of Advent stock | | $26.10 | | $26.10 |
Exercise price | | $8.28 - $32.85 | | $7.84 - $23.85 |
Risk-free interest rate | | 0.04% - 1.49% | | 0.04% - 1.23% |
Volatility | | 31.33% - 37.45% | | 31.33% - 37.40% |
Expected life (in years) | | 0.26 - 6.40 | | 0.26 - 5.38 |
Expected dividends | | None | | None |
The following table sets forth the financial impact of the equity award modification that occurred in fiscal 2013 (in millions):
| | | | | | | | | | | | |
| | Cash
or
Non-Cash | | Total
Incremental
Stock-Based
Compensation
Expense | | Stock-Based
Compensation
Expense
Recognized During
Fiscal 2013 | | Unamortized
Stock-Based
Compensation
Expense as of
December 31, 2013 | |
|---|
Modification of options and SARs | | Non-cash | | $ | 24.8 | | $ | 17.9 | | $ | 6.9 | |
Modification of options and SARs | | Cash | | | 5.4 | | | 5.4 | | | — | |
Modification of RSUs | | Cash | | | 10.6 | | | 3.8 | | | 6.8 | |
| | | | | | | | | | | | | |
Total excluding estimated forfeitures | | | | $ | 40.8 | | $ | 27.1 | | $ | 13.7 | |
| | | | | | | | | | | | | |
| | | | | | | | | | | | | |
| | | | | | | | | | | | | |
Total including estimated forfeitures | | | | $ | 38.2 | | $ | 26.7 | | $ | 11.5 | |
| | | | | | | | | | | | | |
| | | | | | | | | | | | | |
| | | | | | | | | | | | | |
Incremental stock-based compensation expense was recognized during 2014 and 2013 for awards that were modified in the second quarter of 2013. Of the total incremental charge, approximately $6.2 million and $26.7 million of expense was recognized in fiscal 2014 and fiscal 2013, respectively. The vested portion of each award was determined on a grant-by-grant basis, based on the extent to which the award was vested as of the Modification Date. The remaining unamortized stock-based compensation expense, including estimated forfeitures, of approximately $11.5 million at December 31, 2013 is being recognized over the original remaining vesting periods of the awards ranging from 1 to 41 months.
112
Table of Contents
ADVENT SOFTWARE, INC.
NOTES TO CONSOLIDATED FINANCIAL STATEMENTS (Continued)
Note 12—Stock-Based Compensation (Continued)
Stock-Based Compensation Expense
Stock-based compensation expense related to stock options, SARs, ESPP shares, and RSUs was recognized in Advent's consolidated statements of operations for the periods presented as follows (in thousands):
| | | | | | | | | | | | | | | | | | | | | | | | | | | | |
| | Fiscal Years | |
|---|
| | 2014 | | 2013 | | 2012 | |
|---|
| | Options,
SARs &
ESPP | | RSUs | | Total | | Options,
SARs &
ESPP | | RSUs | | Total | | Options,
SARs &
ESPP | | RSUs | | Total | |
|---|
Statement of operations classification | | | | | | | | | | | | | | | | | | | | | | | | | | | | |
Cost of recurring revenues | | $ | 1,671 | | $ | 1,579 | | $ | 3,250 | | $ | 2,057 | | $ | 1,434 | | $ | 3,491 | | $ | 1,432 | | $ | 973 | | $ | 2,405 | |
Cost of non-recurring revenues | | | 788 | | | 547 | | | 1,335 | | | 2,449 | | | 804 | | | 3,253 | | | 642 | | | 594 | | | 1,236 | |
| | | | | | | | | | | | | | | | | | | | | | | | | | | | | |
Total cost of revenues | | | 2,459 | | | 2,126 | | | 4,585 | | | 4,506 | | | 2,238 | | | 6,744 | | | 2,074 | | | 1,567 | | | 3,641 | |
Sales and marketing | | |
6,173 | | |
3,853 | | |
10,026 | | |
10,122 | | |
3,143 | | |
13,265 | | |
4,881 | | |
2,284 | | |
7,165 | |
Product development | | | 3,500 | | | 4,235 | | | 7,735 | | | 5,053 | | | 3,810 | | | 8,863 | | | 2,952 | | | 2,869 | | | 5,821 | |
General and administrative | | | 4,041 | | | 2,984 | | | 7,025 | | | 16,377 | | | 2,930 | | | 19,307 | | | 2,437 | | | 1,737 | | | 4,174 | |
| | | | | | | | | | | | | | | | | | | | | | | | | | | | | |
Total operating expenses | | | 13,714 | | | 11,072 | | | 24,786 | | | 31,552 | | | 9,883 | | | 41,435 | | | 10,270 | | | 6,890 | | | 17,160 | |
| | | | | | | | | | | | | | | | | | | | | | | | | | | | | |
Total stock-based employee compensation expense | | $ | 16,173 | | $ | 13,198 | | $ | 29,371 | | $ | 36,058 | | $ | 12,121 | | $ | 48,179 | | $ | 12,344 | | $ | 8,457 | | $ | 20,801 | |
| | | | | | | | | | | | | | | | | | | | | | | | | | | | | |
| | | | | | | | | | | | | | | | | | | | | | | | | | | | | |
| | | | | | | | | | | | | | | | | | | | | | | | | | | | | |
Tax effect on stock-based employee compensation | | | (6,060 | ) | | (4,941 | ) | | (11,001 | ) | | (14,427 | ) | | (4,619 | ) | | (19,046 | ) | | (4,763 | ) | | (3,324 | ) | | (8,087 | ) |
| | | | | | | | | | | | | | | | | | | | | | | | | | | | | |
Effect on net income from continuing operations, net of tax | | $ | 10,113 | | $ | 8,257 | | $ | 18,370 | | $ | 21,631 | | $ | 7,502 | | $ | 29,133 | | $ | 7,581 | | $ | 5,133 | | $ | 12,714 | |
| | | | | | | | | | | | | | | | | | | | | | | | | | | | | |
| | | | | | | | | | | | | | | | | | | | | | | | | | | | | |
| | | | | | | | | | | | | | | | | | | | | | | | | | | | | |
Advent capitalized stock-based compensation expense of $132,000, $273,000 and $198,000 during fiscal 2014, 2013 and 2012, respectively, associated with the Company's software development, internal-use software and professional services implementation projects.
As of December 31, 2014, total compensation cost related to unvested awards not yet recognized under all equity compensation plans and including the impact of the equity award modification, adjusted for estimated forfeitures, was $44.8 million and is expected to be recognized through the remaining vesting period of each grant, with a weighted average remaining period of 2.3 years.
Valuation Assumptions
Advent uses the Black-Scholes option pricing model and the straight-line attribution approach to determine the grant date fair value of stock options, SARs and the ESPP. The fair value of RSUs is equal to the Company's closing stock price on the date of grant.
113
Table of Contents
ADVENT SOFTWARE, INC.
NOTES TO CONSOLIDATED FINANCIAL STATEMENTS (Continued)
Note 12—Stock-Based Compensation (Continued)
The following Black-Scholes option pricing model assumptions were used:
| | | | | | |
| | Fiscal Years |
|---|
| | 2014 | | 2013 | | 2012 |
|---|
Stock Options and SARs | | | | | | |
Risk-free interest rate | | 1.2% - 1.9% | | 0.5% - 1.8% | | 0.6% - 1.2% |
Volatility | | 32.4% - 35.1% | | 33.4% - 38.8% | | 38.4% - 42.9% |
Expected life (in years) | | 3.69 - 4.85 | | 3.94 - 5.06 | | 4.02 - 5.50 |
Expected dividend yield | | 0% - 1.8% | | None | | None |
Employee Stock Purchase Plan* | | | | | | |
Risk-free interest rate | | 0.1% | | 0.1% | | 0.1% |
Volatility | | 31.4% - 32.1% | | 31.7% - 31.8% | | 31.0% - 48.3% |
Expected life (in years) | | 0.5 | | 0.5 | | 0.5 |
Expected dividend yield | | 1.7% | | None | | None |
- *
- The ESPP periods begin every six months on December 1 and June 1 of each year.
Volatility for the years presented was calculated using an equally weighted average of the Company's historical and implied volatility of its common stock. The Company believes that this blended calculation of volatility is the most appropriate indicator of expected volatility and best reflects expected market conditions.
Expected life for the years presented was determined based on the Company's historical experience of similar awards, giving consideration to the contractual terms or offering periods, vesting schedules and expectations of future employee behavior.
Risk-free interest rate for the years presented was based on the U.S. Treasury yield curve in effect at the date of grant, or beginning of the offering period for the ESPP, for periods corresponding with the expected life.
The expected dividend yield for each grant was determined by annualizing the most recent dividend declared and dividing the result by the Company's closing stock price on the date of grant. The dividend yield assumption for grants prior to April 28, 2014 was 0% based on the Company's history of not paying regular dividends and the future expectation of no recurring dividend payouts at the time of grant.
114
Table of Contents
ADVENT SOFTWARE, INC.
NOTES TO CONSOLIDATED FINANCIAL STATEMENTS (Continued)
Note 12—Stock-Based Compensation (Continued)
Equity Award Activity
The Company's stock option and SAR activity for the periods presented is as follows (in thousands, except weighted average exercise price):
| | | | | | | | | | | | | | | | | | | |
| | Fiscal Years | |
|---|
| | 2014 | | 2013 | | 2012 | |
|---|
| | Number of
Shares | | Weighted
Average
Exercise
Price | | Number of
Shares | | Weighted
Average
Exercise
Price(1) | | Number of
Shares | | Weighted
Average
Exercise
Price | |
|---|
Outstanding at beginning of year | | | 5,590 | | $ | 15.05 | | | 7,668 | | $ | 14.22 | | | 7,029 | | $ | 18.01 | |
Options and SARs granted | | | 825 | | $ | 29.38 | | | 1,220 | | $ | 22.01 | | | 1,895 | | $ | 24.92 | |
Options and SARs exercised | | | (1,146 | ) | $ | 14.04 | | | (2,951 | ) | $ | 14.79 | | | (972 | ) | $ | 15.60 | |
Options and SARs canceled | | | (193 | ) | $ | 20.88 | | | (347 | ) | $ | 23.40 | | | (284 | ) | $ | 23.63 | |
| | | | | | | | | | | | | | | | | | | | |
Outstanding at end of year | | | 5,076 | | $ | 17.38 | | | 5,590 | | $ | 15.05 | | | 7,668 | | $ | 19.82 | |
| | | | | | | | | | | | | | | | | | | | |
| | | | | | | | | | | | | | | | | | | | |
| | | | | | | | | | | | | | | | | | | | |
Exercisable at end of year | | | 2,906 | | $ | 13.50 | | | 2,720 | | $ | 11.67 | | | 4,575 | | $ | 16.55 | |
| | | | | | | | | | | | | | | | | | | | |
| | | | | | | | | | | | | | | | | | | | |
| | | | | | | | | | | | | | | | | | | | |
- (1)
- The weighted average exercise prices have been adjusted to reflect the impact of the 2013 equity award modification.
The aggregate intrinsic value of options and SARs outstanding was $67.5 million and exercisable was $49.8 million as of December 31, 2014. The intrinsic value is calculated as the difference between the Company's closing stock price of $30.64 on December 31, 2014 and the exercise price of the underlying awards that were in-the-money as of that date.
The weighted average grant date fair value of options and SARs granted for the total Company, total intrinsic value of options and SARs exercised and cash received from options exercised during the periods presented were as follows (in thousands, except weighted average grant date fair value):
| | | | | | | | | | |
| | Fiscal Years | |
|---|
| | 2014 | | 2013 | | 2012 | |
|---|
Options and SARs | | | | | | | | | | |
Weighted average grant date fair value | | $ | 7.71 | | $ | 10.47 | | $ | 8.88 | |
Total intrinsic value of awards exercised | | $ | 20,327 | | $ | 43,514 | | $ | 10,086 | |
Options | | |
| | |
| | |
| |
Cash received from exercises | | $ | 4,562 | | $ | 19,495 | | $ | 5,173 | |
115
Table of Contents
ADVENT SOFTWARE, INC.
NOTES TO CONSOLIDATED FINANCIAL STATEMENTS (Continued)
Note 12—Stock-Based Compensation (Continued)
The options and SARs outstanding and currently exercisable by exercise price at December 31, 2014 were as follows:
| | | | | | | | | | | | | | | | |
| | Options and SARs Outstanding | | Options and
SARs Exercisable | |
|---|
Exercise Price | | Number of
Shares
(in thousands) | | Weighted
Average
Remaining
Contractual
Life (in years) | | Weighted
Average
Exercise
Price | | Number of
Shares
(in thousands) | | Weighted
Average
Exercise
Price | |
|---|
$7.84 | | | 860 | | | 1.80 | | $ | 7.84 | | | 860 | | $ | 7.84 | |
$7.92 - $12.10 | | | 816 | | | 5.72 | | $ | 11.36 | | | 548 | | $ | 10.93 | |
$12.12 - $17.73 | | | 558 | | | 5.76 | | $ | 14.37 | | | 474 | | $ | 14.18 | |
$17.80 | | | 607 | | | 7.36 | | $ | 17.80 | | | 323 | | $ | 17.80 | |
$17.85 - $21.06 | | | 515 | | | 6.71 | | $ | 18.27 | | | 394 | | $ | 18.33 | |
$21.15 | | | 1 | | | 6.04 | | $ | 21.15 | | | 1 | | $ | 21.15 | |
$21.67 | | | 864 | | | 8.38 | | $ | 21.67 | | | 292 | | $ | 21.67 | |
$23.85 - $28.67 | | | 27 | | | 8.92 | | $ | 27.34 | | | 2 | | $ | 27.10 | |
$28.79 | | | 518 | | | 9.37 | | $ | 28.79 | | | — | | $ | — | |
$28.89 - $35.14 | | | 310 | | | 9.42 | | $ | 30.86 | | | 12 | | $ | 31.73 | |
| | | | | | | | | | | | | | | | | |
As of December 31, 2014 | | | 5,076 | | | 6.42 | | $ | 17.38 | | | 2,906 | | $ | 13.50 | |
| | | | | | | | | | | | | | | | | |
| | | | | | | | | | | | | | | | | |
| | | | | | | | | | | | | | | | | |
Expected to vest at December 31, 2014 | | | 4,938 | | | 6.35 | | $ | 17.14 | | | | | | | |
| | | | | | | | | | | | | | | | | |
| | | | | | | | | | | | | | | | | |
| | | | | | | | | | | | | | | | | |
The aggregate intrinsic value of options and SARs expected to vest at December 31, 2014 was $66.8 million.
The equity awards available for grant for the periods presented were as follows (in thousands):
| | | | | | | | | | |
| | Fiscal Years | |
|---|
| | 2014 | | 2013 | | 2012 | |
|---|
Available at beginning of year | | | 2,736 | | | 4,155 | | | 4,545 | |
Awards authorized | | | 4,750 | | | — | | | 1,915 | |
Options and SARs granted | | | (825 | ) | | (1,220 | ) | | (1,895 | ) |
Options and SARs canceled | | | 193 | | | 347 | | | 284 | |
RSUs granted | | | (801 | ) | | (393 | ) | | (520 | ) |
RSUs canceled | | | 105 | | | 152 | | | 98 | |
RSU adjustment(1) | | | (602 | ) | | (305 | ) | | (272 | ) |
| | | | | | | | | | | |
Available at end of year | | | 5,556 | | | 2,736 | | | 4,155 | |
| | | | | | | | | | | |
| | | | | | | | | | | |
| | | | | | | | | | | |
- (1)
- Effective with our 2002 Stock Plan amended on April 1, 2012, awards of restricted stock, restricted stock units, performance shares or performance units reduce the number of shares available under the Plan by 1.79 shares through Q114 and 1.92 shares as of Q214 for each share covered by such awards, as compared to 1.99 shares for awards in 2012 prior to the amendment.
116
Table of Contents
ADVENT SOFTWARE, INC.
NOTES TO CONSOLIDATED FINANCIAL STATEMENTS (Continued)
Note 12—Stock-Based Compensation (Continued)
During fiscal 2014, 2013 and 2012, the Company granted RSUs under its 2002 Stock Plan. The Company's RSU activity during the periods presented is as follows:
| | | | | | | | | | | | | | | | | | | |
| | Fiscal Years | |
|---|
| | 2014 | | 2013 | | 2012 | |
|---|
| | Number of
Shares
(in thousands) | | Weighted
Average
Grant Date
Fair Value | | Number of
Shares
(in thousands) | | Weighted
Average
Grant Date
Fair Value | | Number of
Shares
(in thousands) | | Weighted
Average
Grant Date
Fair Value | |
|---|
Outstanding and unvested at beginning of year | | | 1,159 | | $ | 20.16 | | | 1,273 | | $ | 18.16 | | | 1,253 | | $ | 16.51 | |
RSUs granted | | | 801 | | $ | 30.22 | | | 393 | | $ | 30.57 | | | 520 | | $ | 25.69 | |
RSUs vested | | | (374 | ) | $ | 29.41 | | | (355 | ) | $ | 22.31 | | | (402 | ) | $ | 21.36 | |
RSUs canceled | | | (105 | ) | $ | 27.93 | | | (152 | ) | $ | 25.30 | | | (98 | ) | $ | 23.82 | |
| | | | | | | | | | | | | | | | | | | | |
Outstanding and unvested at end of year | | | 1,481 | | $ | 22.71 | | | 1,159 | | $ | 20.16 | | | 1,273 | | $ | 18.16 | |
| | | | | | | | | | | | | | | | | | | | |
| | | | | | | | | | | | | | | | | | | | |
| | | | | | | | | | | | | | | | | | | | |
The weighted average grant date fair value of RSUs was determined based on the closing market price of the Company's common stock on the date of the award. The aggregate intrinsic value of RSUs outstanding at December 31, 2014 was $45.4 million based on the Company's closing price of $30.64 per share on that date. Additionally, at December 31, 2014, certain unvested RSUs outstanding had a right to a total of $6.1 million of cash payments upon vesting related to the equity award modification in June 2013.
117
Table of Contents
ADVENT SOFTWARE, INC.
NOTES TO CONSOLIDATED FINANCIAL STATEMENTS (Continued)
Note 13—Net Income Per Share
The following table sets forth the computation of basic and diluted net income per share (in thousands, except per share data):
| | | | | | | | | | |
| | Fiscal Years | |
|---|
| | 2014 | | 2013 | | 2012 | |
|---|
Numerator: | | | | | | | | | | |
Net income: | | | | | | | | | | |
Continuing operations | | $ | 50,263 | | $ | 28,752 | | $ | 30,231 | |
Discontinued operation | | | (51 | ) | | 50 | | | 184 | |
| | | | | | | | | | | |
Total operations | | $ | 50,212 | | $ | 28,802 | | $ | 30,415 | |
| | | | | | | | | | | |
| | | | | | | | | | | |
| | | | | | | | | | | |
Denominator: | | | | | | | | | | |
Denominator for basic net income per share-weighted average shares outstanding | | | 51,546 | | | 51,207 | | | 50,614 | |
Dilutive common equivalent shares: | | | | | | | | | | |
Employee stock options and other | | | 2,062 | | | 2,171 | | | 1,811 | |
| | | | | | | | | | | |
Denominator for diluted net income per share-weighted average shares outstanding, assuming exercise of potential dilutive common shares | | | 53,608 | | | 53,378 | | | 52,425 | |
| | | | | | | | | | | |
| | | | | | | | | | | |
| | | | | | | | | | | |
Net income per share(1): | | | | | | | | | | |
Basic: | | | | | | | | | | |
Continuing operations | | $ | 0.98 | | $ | 0.56 | | $ | 0.60 | |
Discontinued operation | | | — | | | — | | | — | |
| | | | | | | | | | | |
Total operations | | $ | 0.97 | | $ | 0.56 | | $ | 0.60 | |
| | | | | | | | | | | |
| | | | | | | | | | | |
| | | | | | | | | | | |
Diluted: | | | | | | | | | | |
Continuing operations | | $ | 0.94 | | $ | 0.54 | | $ | 0.58 | |
Discontinued operation | | | — | | | — | | | — | |
| | | | | | | | | | | |
Total operations | | $ | 0.94 | | $ | 0.54 | | $ | 0.58 | |
| | | | | | | | | | | |
| | | | | | | | | | | |
| | | | | | | | | | | |
- (1)
- Net income per share is based on actual calculated values and totals may not sum due to rounding.
Weighted average stock options, SARs and RSUs of approximately 1.9 million, 1.9 million and 3.2 million were excluded from the computation of diluted net income per share for fiscal 2014, 2013 and 2012, respectively, because their inclusion would have been anti-dilutive.
Note 14—Common Stock Repurchase Programs
Advent's Board of Directors (the "Board") has approved common stock repurchase programs authorizing management to repurchase shares of the Company's common stock. The timing and actual number of shares subject to repurchase are at the discretion of Advent's management and are contingent on a number of factors, including the price of Advent's stock, Advent's cash balances and working capital needs, general business and market conditions, regulatory requirements and alternative investment opportunities. Repurchased shares are returned to the status of authorized and unissued shares of common stock.
118
Table of Contents
ADVENT SOFTWARE, INC.
NOTES TO CONSOLIDATED FINANCIAL STATEMENTS (Continued)
Note 14—Common Stock Repurchase Programs (Continued)
The purchase price for the shares of our common stock repurchased is reflected as a reduction to stockholders' equity. In accordance with ASC 505-30, "Treasury Stock", we are required to allocate the purchase price of the repurchased shares as (i) an increase to accumulated deficit and (ii) a reduction of common stock and additional paid-in capital. Issuance of common stock and the tax benefit related to employee stock option plans are recorded as an increase to common stock and additional paid-in capital. As a result of future repurchases, we may continue to report an accumulated deficit included in "Stockholders' deficit" in the Company's consolidated balance sheets.
At December 31, 2013 there were approximately 0.4 million shares authorized by our Board for repurchase. In May 2014 our Board authorized an additional 1.0 million shares of the Company's common stock for repurchase. At December 31, 2014, there remained approximately 0.9 million shares authorized by the Board for repurchase, however, in the Merger Agreement with SS&C, signed on February 2, 2015, the Company is prohibited from repurchasing shares of its common stock during the pendency of the agreement.
The following table provides a summary of recent repurchase activity under the stock repurchase programs approved by the Board (in thousands, except per share data):
| | | | | | | | | | |
Fiscal Year | | Total
Number
of Shares
Repurchased | | Cost | | Average
Price
Paid Per
Share | |
|---|
2012 | | | 1,651 | | $ | 41,275 | | $ | 25.00 | |
2013 | | | 1,600 | | $ | 41,256 | | $ | 25.79 | |
2014 | | | 515 | | $ | 15,141 | | $ | 29.41 | |
| | | | | | | | | | | |
Total | | | 3,766 | | $ | 97,672 | | $ | 25.94 | |
| | | | | | | | | | | |
| | | | | | | | | | | |
| | | | | | | | | | | |
In addition, Advent has withheld shares through net share settlements upon the vesting of restricted stock units and the exercise of stock-settled stock appreciation rights under its equity compensation plan to satisfy tax withholding obligations. At December 31, 2014, there remained approximately 0.9 million shares authorized by the Board remaining for repurchase.
Note 15—Segment, Significant Customer and Geographic Information
ASC 280, "Segment Reporting" establishes standards for reporting information about operating segments in a company's financial statements. While the Company's management considers function, products, market and geography to allocate resources, the Company believes its chief operating decision maker (CODM) is the Company's Chief Executive Officer. Accordingly, the Company has determined its CODM makes decisions and allocates resources based on the Company as a whole and that it operates as one operating segment, Advent Investment Management.
No single customer represented 10% or more of Advent's total net revenues in any fiscal year presented.
119
Table of Contents
ADVENT SOFTWARE, INC.
NOTES TO CONSOLIDATED FINANCIAL STATEMENTS (Continued)
Note 15—Segment, Significant Customer and Geographic Information (Continued)
Geographic information as of and for the periods presented is as follows (in thousands):
| | | | | | | |
| | December 31 | |
|---|
| | 2014 | | 2013 | |
|---|
Long-lived assets(1): | | | | | | | |
United States | | $ | 35,488 | | $ | 45,299 | |
International | | | 2,752 | | | 3,771 | |
| | | | | | | | |
Total long-lived assets | | $ | 38,240 | | $ | 49,070 | |
| | | | | | | | |
| | | | | | | | |
| | | | | | | | |
| | | | | | | | | | |
| | Fiscal Years | |
|---|
| | 2014 | | 2013 | | 2012 | |
|---|
Geographic net sales(2): | | | | | | | | | | |
United States | | $ | 322,360 | | $ | 312,683 | | $ | 299,018 | |
International | | | 74,460 | | | 70,276 | | | 59,801 | |
| | | | | | | | | | | |
Total net sales | | $ | 396,820 | | $ | 382,959 | | $ | 358,819 | |
| | | | | | | | | | | |
| | | | | | | | | | | |
| | | | | | | | | | | |
- (1)
- Long-lived assets exclude securities, goodwill, intangible assets and deferred tax assets.
- (2)
- Geographic net sales are based on the location to which the product is shipped.
Note 16—Fair Value Measurements
The accounting guidance for fair value measurements establishes a three-tier hierarchy, which prioritizes the inputs used in the valuation methodologies in measuring fair value as follows:
| | |
Level Input | | Input Definition |
|---|
| Level 1 | | Observable inputs that reflect quoted prices (unadjusted) for identical assets or liabilities in active markets. |
Level 2 |
|
Inputs other than quoted prices included within Level 1 that are observable for the asset or liability through corroboration with market data at the measurement date. |
Level 3 |
|
Unobservable inputs that reflect management's best estimate of what market participants would use in pricing the asset or liability at the measurement date. |
In general, and where applicable, the Company uses quoted prices in active markets for identical assets or liabilities to determine fair value. The Company applied this valuation technique to measure the fair value of the Company's Level 1 investments, such as treasury obligation money market mutual funds and U.S. and foreign government debt securities. Money market funds consist of cash equivalents with remaining maturities of three months or less at the date of purchase and are composed primarily of U.S. government debt securities and treasury obligation money market mutual funds. Advent's U.S. government debt securities are securities sponsored by the federal government of the United States.
120
Table of Contents
ADVENT SOFTWARE, INC.
NOTES TO CONSOLIDATED FINANCIAL STATEMENTS (Continued)
Note 16—Fair Value Measurements (Continued)
If quoted prices in active markets for identical assets or liabilities are not available to determine fair value, then the Company uses quoted prices for similar assets and liabilities or inputs other than the quoted prices that are observable either directly or indirectly. The Company obtains the fair value of Level 2 financial instruments from its custody bank, which uses various professional pricing services to gather pricing data which may include quoted market prices for identical or comparable instruments, or inputs other than quoted prices that are observable either directly or indirectly. The custody bank then analyzes gathered pricing inputs and applies proprietary valuation techniques, such as consensus pricing, weighted average pricing, distribution-curve-based algorithms, or pricing models such as discounted cash flow techniques to provide the Company with a fair valuation of each security. The Company's procedures include controls to ensure that appropriate fair values are recorded such as comparing prices obtained to independent sources. Advent reviews the internal controls in place at the custodian bank on an annual basis.
The Company measures certain financial assets and liabilities at fair value on a recurring basis, including available-for-sale securities. The fair value of these certain financial assets was determined using the following inputs as of December 31, 2014 and December 31, 2013 (in thousands):
| | | | | | | | | | | | | |
| | Fair Value
as of
December 31, 2014 | | Level 1 | | Level 2 | | Level 3 | |
|---|
Financial Assets: | | | | | | | | | | | | | |
Money Market Funds(1) | | $ | 5,013 | | $ | 5,013 | | $ | — | | $ | — | |
U.S. government debt securities(2) | | | 1,341 | | | | | | 1,341 | | | — | |
Corporate debt securities(3) | | | 7,970 | | | — | | | 7,970 | | | — | |
Municipal bonds(4) | | | 669 | | | — | | | 669 | | | | |
Financial Liabilities: | | |
| | |
| | |
| | |
| |
Debt(5) | | $ | 220,000 | | $ | — | | $ | 220,000 | | $ | — | |
| | | | | | | | | | | | | |
| | Fair Value
as of
December 31, 2013 | | Level 1 | | Level 2 | | Level 3 | |
|---|
Financial Liabilities: | | | | | | | | | | | | | |
Debt(5) | | $ | 305,000 | | $ | — | | $ | 305,000 | | $ | — | |
- (1)
- Included in cash and cash equivalents on the Company's consoldiated balance sheet.
- (2)
- Included in short-term marketable securities on the Company's consolidated balance sheet.
- (3)
- Included in cash and cash equivalents and short and long-term marketable securities on the Company's consolidated balance sheet.
- (4)
- Included in short and long-term marketable securities on the Company's consolidated balance sheet.
- (5)
- Included in current portion of long-term debt and long-term debt on the Company's consolidated balance sheet.
There were no transfers between Level 1 and Level 2 assets in fiscal 2014 and Advent does not have any significant assets or liabilities that utilize unobservable or Level 3 inputs.
121
Table of Contents
ADVENT SOFTWARE, INC.
NOTES TO CONSOLIDATED FINANCIAL STATEMENTS (Continued)
Note 16—Fair Value Measurements (Continued)
The carrying amounts of cash and cash equivalents, marketable securities, accounts receivable, accounts payable, dividends payable and accrued liabilities approximate fair value based on the short-term maturities of these instruments.
The carrying amount of debt approximates fair value as the underlying variable interest rate approximates current market rates and the Company's credit risk has not changed significantly since the date of issuance.
Note 17—Subsequent Events
San Francisco Headquarters Lease Amendment
On January 28, 2015, Advent entered into a definitive amendment to its lease at 600 Townsend Street in San Francisco, California with Toda America, Inc. (the "Landlord") whereby the term of such lease has been extended for an additional ten (10) years commencing on November 1, 2016 and ending October 31, 2026 and whereby the Company's total leased space will be reduced from approximately 158,000 square feet to approximately 129,000 square feet by November 1, 2016. The Company's contractual operating lease obligation under this agreement with respect to the renewal term is approximately $70.5 million commencing on November 1, 2016, payable over the ten-year renewal term. As this amendment is considered a lease modification, the adjusted rent expense will commence effective January 28, 2015. Additionally, the Company anticipates approximately $6 million of leasehold improvements, of which $1.3 million will be funded by the Landlord and approximately $5 million will be paid directly by the Company.
Merger Agreement
On February 2, 2015, Advent entered into an Agreement and Plan of Merger (the "Merger Agreement") with SS&C Technologies Holdings, Inc. ("Parent" or "SS&C") and Arbor Acquisition Company, Inc., a wholly owned subsidiary of Parent ("Merger Sub"), pursuant to which, subject to the satisfaction or waiver of certain conditions therein, Merger Sub will merge with and into Advent. As a result of the merger, Merger Sub will cease to exist, and Advent will survive as a wholly owned subsidiary of SS&C.
Upon the consummation of the merger, subject to the terms of the Merger Agreement, which has been unanimously approved by our Board of Directors, each share of Advent common stock outstanding immediately prior to the effective time of the merger (the "Effective Time"), subject to certain exceptions, will be converted into the right to receive $44.25 in cash, without interest.
The completion of the merger is subject to customary conditions, including without limitation, approval of the merger by our stockholders and expiration or termination of the applicable waiting periods under the Hart-Scott-Rodino Antitrust Improvements Act of 1976, as amended.
The Merger Agreement contains certain termination rights for both Advent and Parent, and provides that, upon termination of the Merger Agreement under specified circumstances, including, but not limited to, if we accept a superior acquisition proposal, we may be required to pay Parent a termination fee of $80.0 million. We may also be required to reimburse Parent for up to $12.5 million of its out-of-pocket expenses in connection with the transaction under certain circumstances.
122
Table of Contents
ADVENT SOFTWARE, INC.
NOTES TO CONSOLIDATED FINANCIAL STATEMENTS (Continued)
Note 17—Subsequent Events (Continued)
A description of the Merger Agreement is contained in our Current Report on Form 8-K filed with the SEC on February 3, 2015, and a copy of the Merger Agreement is attached thereto as Exhibit 2.1.
Shareholder Lawsuits
In connection with the Merger Agreement and the transactions contemplated thereby, three putative class action lawsuits challenging the transactions contemplated by the Merger Agreement have been filed by purported Advent stockholders in the Court of Chancery of the State of Delaware against Advent, Advent's Board of Directors, SS&C, and Merger Sub. These actions are captioned Chitwood v. Advent Software, Inc., et al., Case No. 10623-VCL, City of Atlanta Firefighters' Pension Fund v. David Peter F. Hess, Jr., et al., Case No. 10633-VCL, and Klein v. Advent Software, Inc., et al., Case No. 10670-VCL. The actions generally allege, among other things, that the Board of Directors breached its fiduciary duties to Advent's stockholders by engaging in a flawed sales process, agreeing to a transaction price that does not adequately compensate Advent stockholders, and agreeing to certain deal protection terms in the Merger Agreement that allegedly preclude a potential competing bid. The actions also allege that the other defendants aided and abetted the Board of Directors' breaches of fiduciary duties. The actions seek various remedies including to enjoin or rescind the merger, damages, and costs.
123
Table of Contents
ADVENT SOFTWARE, INC.
SUPPLEMENTARY QUARTERLY FINANCIAL DATA (UNAUDITED)
| | | | | | | | | | | | | |
| | First
Quarter(2) | | Second
Quarter(3) | | Third
Quarter(4) | | Fourth
Quarter(5) | |
|---|
| | (in thousands, except per share data)
| |
|---|
2014(1): | | | | | | | | | | | | | |
Net revenues | | $ | 96,804 | | $ | 100,370 | | $ | 98,982 | | $ | 100,664 | |
Gross margin | | $ | 69,098 | | $ | 70,579 | | $ | 69,098 | | $ | 71,300 | |
Income from continuing operations | | $ | 19,313 | | $ | 21,753 | | $ | 20,244 | | $ | 22,432 | |
Net income from continuing operations | | $ | 10,907 | | $ | 12,655 | | $ | 12,003 | | $ | 14,698 | |
Net (loss) income from discontinued operation | | $ | (21 | ) | $ | (16 | ) | $ | (20 | ) | $ | 5 | |
Net income | | $ | 10,886 | | $ | 12,639 | | $ | 11,983 | | $ | 14,703 | |
Basic net income (loss) per share: | | | | | | | | | | | | | |
Continuing operations | | $ | 0.21 | | $ | 0.25 | | $ | 0.23 | | $ | 0.28 | |
Discontinued operation | | $ | — | | $ | — | | $ | — | | $ | — | |
Total operations | | $ | 0.21 | | $ | 0.25 | | $ | 0.23 | | $ | 0.28 | |
Diluted net income (loss) per share: | | | | | | | | | | | | | |
Continuing operations | | $ | 0.20 | | $ | 0.24 | | $ | 0.22 | | $ | 0.27 | |
Discontinued operation | | $ | — | | $ | — | | $ | — | | $ | — | |
Total operations | | $ | 0.20 | | $ | 0.24 | | $ | 0.22 | | $ | 0.27 | |
2013(1): | | |
| | |
| | |
| | |
| |
Net revenues | | $ | 92,490 | | $ | 96,123 | | $ | 96,767 | | $ | 97,579 | |
Gross margin | | $ | 64,011 | | $ | 65,727 | | $ | 64,976 | | $ | 68,524 | |
Income from continuing operations | | $ | 16,213 | | $ | (5,849 | ) | $ | 17,371 | | $ | 18,397 | |
Net income from continuing operations | | $ | 12,057 | | $ | (4,155 | ) | $ | 9,833 | | $ | 11,017 | |
Net (loss) income from discontinued operation | | $ | (22 | ) | $ | 110 | | $ | (20 | ) | $ | (18 | ) |
Net income | | $ | 12,035 | | $ | (4,045 | ) | $ | 9,813 | | $ | 10,999 | |
Basic net income per share: | | | | | | | | | | | | | |
Continuing operations | | $ | 0.24 | | $ | (0.08 | ) | $ | 0.19 | | $ | 0.22 | |
Discontinued operation | | $ | — | | $ | — | | $ | — | | $ | — | |
Total operations | | $ | 0.24 | | $ | (0.08 | ) | $ | 0.19 | | $ | 0.22 | |
Diluted net income per share: | | | | | | | | | | | | | |
Continuing operations | | $ | 0.23 | | $ | (0.08 | ) | $ | 0.18 | | $ | 0.20 | |
Discontinued operation | | $ | — | | $ | — | | $ | — | | $ | — | |
Total operations | | $ | 0.23 | | $ | (0.08 | ) | $ | 0.18 | | $ | 0.20 | |
- (1)
- Net income (loss) per share is based on actual calculated values and totals may not sum due to rounding.
- (2)
- The Company's results of operations for the first quarter of 2014 include $0.2 million in restructuring charges. The Company's results of operations for the first quarter of 2013 include restructuring charges of $2.3 million.
- (3)
- The Company's results of operations for the second quarter of 2014 include $1.7 million in restructuring charges. The Company's results of operations for the second quarter of 2013 include $21.9 million of stock-based compensation expense related to the equity award modification, $6.0 million for advisory fees related to the dividend recapitalization (debt modification, Special Dividend and equity award modification), and $0.8 million in restructuring charges.
- (4)
- The Company's results of operations for the third quarter of 2014 include $2.6 million in restructuring charges. The Company's results of operations for the third quarter of 2013 include $2.5 million of stock-based compensation expense related to the equity award modification, and a restructuring benefit of $(0.2) million.
- (5)
- The Company's results of operations for the fourth quarter of 2014 include $0.1 million in restructuring charges. The Company's results of operations for the fourth quarter of 2013 include $2.3 million of stock-based compensation expense related to the equity award modification and $0.8 million in restructuring charges.
124
Table of Contents
Item 9. Changes in and Disagreements with Accountants on Accounting and Financial Disclosure
None.
Item 9A. Controls and Procedures
Evaluation of disclosure controls and procedures
The Company maintains disclosure controls and procedures (as defined in Rules 13a-15(e) and 15d-15(e) under the Securities Exchange Act of 1934, as amended (the "Exchange Act") that are designed to ensure that information required to be disclosed in the Company's reports under the Exchange Act is recorded, processed, summarized and reported within the time periods specified in the SEC's rules and forms, and that such information is accumulated and communicated to management, including the Company's Principal Executive Officer and Principal Financial Officer, as appropriate, to allow timely decisions regarding required disclosure. The Company's management evaluated, with the participation of the Principal Executive Officer and Principal Financial Officer, the effectiveness of the Company's disclosure controls and procedures as of the end of the period covered by this Annual Report on Form 10-K. Based on this evaluation, the Principal Executive Officer and Principal Financial Officer have concluded that our disclosure controls and procedures were effective as of December 31, 2014.
Management's annual report on internal control over financial reporting
See "Management's Report on Internal Control over Financial Reporting" on page 76.
Changes in internal control over financial reporting
There were no changes in our internal control over financial reporting which were identified in connection with the evaluation required by Rules 13a-15(f) and 15d-15(f) of the Exchange Act that occurred during the fourth quarter ended December 31, 2014 that has materially affected, or is reasonably likely to materially affect, Advent's internal control over financial reporting.
Item 9B. Other Information
None.
125
Table of Contents
PART III
Item 10. Directors, Executive Officers and Corporate Governance
The information on Directors appearing under the heading "Corporate Governance", "Corporate Governance and Nominating Committee Matters" and "Proposal No. 1: Election of Directors" in the Notice of the 2015 Annual Meeting of Stockholders and 2015 Proxy Statement, to be filed pursuant to Rule 14a-6(b) under the Securities and Exchange Act of 1934 (the "Exchange Act"), in connection with Advent Software Inc.'s (the "Company's") 2015 Annual Meeting of Stockholders (the "2015 Proxy Statement"), is incorporated by reference in this Annual Report on Form 10-K. Information required by this Item related to the executive officers can be found in the section captioned "Executive Officers of the Registrant" under Part I, "Item 1. Business" of this Annual Report on Form 10-K, and is also incorporated herein by reference. Information required by this Item regarding any material changes to the process by which security holders may recommend nominees to the Company's Board of Directors appears under the heading "Procedural Matters" in our 2015 Proxy Statement and is incorporated herein by reference.
The information contained under the heading "Beneficial Ownership Reporting Compliance Section 16(a)" in the Company's 2015 Proxy Statement are incorporated by reference in this Annual Report on Form 10-K.
The current members of the audit committee are James D. Kirsner (Chair), Asiff S. Hirji and Wendell Van Auken, each of whom is "independent" as defined by current Nasdaq listing standards. Advent's Board of Directors has determined that all members of the Company's Audit Committee are financial experts as defined by Item 401(h) of Regulation S-K of the Exchange Act.
The Company has a code of business ethics and conduct that applies to all of its employees, including its Principal Executive Officer, Principal Financial Officer and its Board of Directors. A copy of this code, "Code of Business Ethics and Conduct", is available on our website athttp://investor.advent.com/phoenix.zhtml?c=96626&p=irol-govHighlights.
The Company intends to disclose any changes in or waivers from its code of ethics by posting such information on our website.
Item 11. Executive Compensation
Information required by this Item is incorporated by reference to our Proxy Statement for our 2015 Annual Meeting of Stockholders, where it is included under the caption "Compensation Committee Matters."
Item 12. Security Ownership of Certain Beneficial Owners and Management and Related Stockholder Matters
Information required by this Item is incorporated by reference to our Proxy Statement for our 2015 Annual Meeting of Stockholders, where it is included under the captions "Beneficial Security Ownership of Management and Certain Beneficial Owners," and "Equity Compensation Plan Information."
Item 13. Certain Relationships and Related Transactions, and Director Independence
Information required by this Item is incorporated by reference to our Proxy Statement for our 2015 Annual Meeting of Stockholders, where it is included under the caption "Certain Relationships and Related Transactions" and "Corporate Governance."
Item 14. Principal Accountant Fees and Services
Information required by this Item is incorporated by reference to our Proxy Statement for our 2015 Annual Meeting of Stockholders, where it is included under the caption "Fees to Independent Registered Public Accounting Firm."
126
Table of Contents
PART IV
Item 15. Exhibits, Financial Statement Schedules
- (a)
- The following documents are filed as part of this Report
The following are included in Item 8:
| | | | |
| | Page | |
|---|
Report of Independent Registered Public Accounting Firm | | | 77 | |
Consolidated Balance Sheets as of December 31, 2014 and 2013 | | | 78 | |
Consolidated Statements of Operations for the years ended December 31, 2014, 2013, and 2012 | | | 79 | |
Consolidated Statements of Comprehensive Income for the years ended December 31, 2014, 2013, and 2012 | | | 80 | |
Consolidated Statements of Stockholders' (Deficit) Equity for the years ended December 31, 2014, 2013 and 2012 | | | 81 | |
Consolidated Statements of Cash Flows for the years ended December 31, 2014, 2013 and 2012 | | | 82 | |
Notes to Consolidated Financial Statements | | | 83 | |
The following financial statement schedule for the years ended December 31, 2014, 2013 and 2012 should be read in conjunction with the consolidated financial statements of Advent Software, Inc. filed as part of this Annual Report on Form 10-K:
Schedule II
ADVENT SOFTWARE, INC
VALUATION AND QUALIFYING ACCOUNTS
For the years ended December 31, 2014, 2013 and 2012
| | | | | | | | | | | | | |
| | Balance at
Beginning
of Period | | Additions
(Reductions)
Charged
to Expense | | Write-offs /
Adjustments | | Balance at
End
of Period | |
|---|
| | (in thousands)
| |
|---|
Allowance for doubtful accounts: | | | | | | | | | | | | | |
2012 | | $ | 106 | | $ | 403 | | $ | (399 | ) | $ | 110 | |
2013 | | $ | 110 | | $ | 278 | | $ | (157 | ) | $ | 231 | |
2014 | | $ | 231 | | $ | 30 | | $ | (225 | ) | $ | 36 | |
Allowance for sales returns: | | |
| | |
| | |
| | |
| |
2012 | | $ | 1,816 | | $ | 1,154 | | $ | — | | $ | 2,970 | |
2013 | | $ | 2,970 | | $ | (306 | ) | $ | — | | $ | 2,664 | |
2014 | | $ | 2,664 | | $ | (521 | ) | $ | — | | $ | 2,143 | |
Deferred tax asset valuation allowance: | | |
| | |
| | |
| | |
| |
2012 | | $ | 892 | | $ | (35 | ) | $ | 5 | | $ | 862 | |
2013 | | $ | 862 | | $ | (36 | ) | $ | — | | $ | 826 | |
2014 | | $ | 826 | | $ | (29 | ) | $ | — | | $ | 797 | |
Schedules other than those listed above have been omitted since they are either not required, not applicable, or because the information required is included in the consolidated financial statements or the notes thereto.
127
Table of Contents
Index to exhibits
The following exhibits are filed as a part of, or incorporated by reference into this Form 10-K:
| | | | | | | | | | | | |
| |
| | Incorporated by Reference | |
|
|---|
Exhibit
Number | |
| | Filed
Herewith |
|---|
| | Exhibit Description | | Form | | Date | | Number |
|---|
| | 1.1 | | Underwriting Agreement, dated August 13, 2014 between a stockholder of Advent Software, Inc. and UBS Securities LLC, the underwriter thereto | | 8-K | | 8/15/2014 | | | 1.1 | | |
|
2.1 |
|
Agreement and Plan of Merger, dated as of February 2, 2015, by and among SS&C Technologies Holdings, Inc., Arbor Acquisition Company, Inc. and Advent Software, Inc. |
|
8-K |
|
2/3/2015 |
|
|
2.1 |
|
|
|
3.1 |
|
Third Amended and Restated Certificate of Incorporation of Registrant |
|
8-K |
|
6/8/2010 |
|
|
3.1 |
|
|
|
3.2 |
|
Amended and Restated Bylaws of Registrant |
|
8-K |
|
2/3/2015 |
|
|
3.1 |
|
|
|
4.1 |
|
Specimen Common Stock Certificate of Registrant |
|
SB-2 |
|
11/15/1995 |
|
|
|
** |
|
|
10.1 |
|
Form of Indemnification Agreement for Executive Officers and Directors* |
|
SB-2 |
|
11/15/1995 |
|
|
|
** |
|
|
10.2 |
|
1993 Profit Sharing & Employee Savings Plan, as amended* |
|
SB-2 |
|
11/15/1995 |
|
|
|
** |
|
|
10.3 |
|
2005 Employee Stock Purchase Plan* |
|
DEF 14A |
|
4/22/2005 |
|
|
Appendix A |
|
|
|
10.4 |
|
Office Lease dated January 6, 2006, between Toda Development, Inc. and Advent for facilities located at 600 Townsend Street in San Francisco, California. |
|
8-K |
|
1/12/2006 |
|
|
10.1 |
|
|
|
10.5 |
|
Executive Severance Plan dated March 14, 2006* |
|
10-K |
|
3/31/2006 |
|
|
10.13 |
|
|
|
10.6 |
|
Summary of Plan Terms for 2008 Executive Short-Term Incentive Plan* |
|
8-K |
|
2/5/2008 |
|
|
10.1 |
|
|
|
10.7 |
|
2002 Stock Plan, as amended* |
|
DEF 14A |
|
4/4/2008 |
|
|
Appendix A |
|
|
|
10.8 |
|
Summary of Plan Terms for 2009 Executive Short-Term Incentive Plan* |
|
8-K |
|
1/26/2009 |
|
|
10.1 |
|
|
128
Table of Contents
| | | | | | | | | | | | |
| |
| | Incorporated by Reference | |
|
|---|
Exhibit
Number | |
| | Filed
Herewith |
|---|
| | Exhibit Description | | Form | | Date | | Number |
|---|
| | 10.9 | | Office Lease dated September 30, 2009 between 1114 6th Avenue Co. LLC and Advent for facilities located at 1114 Avenue of the Americas in New York, New York. | | 8-K | | 10/6/2009 | | | 10.1 | | |
|
10.10 |
|
2002 Stock Plan, as amended* |
|
DEF 14A |
|
4/1/2009 |
|
|
Appendix A |
|
|
|
10.11 |
|
Summary of Plan Terms for 2010 Executive Short-Term Incentive Plan* |
|
8-K |
|
2/18/2010 |
|
|
10.1 |
|
|
|
10.12 |
|
Description of Director Compensation |
|
10-K |
|
3/12/2010 |
|
|
10.16 |
|
|
|
10.13 |
|
2002 Stock Plan, as amended* |
|
8-K |
|
6/8/2010 |
|
|
10.1 |
|
|
|
10.14 |
|
Summary of Plan Terms for 2011 Executive Short-Term Incentive Plan* |
|
8-K |
|
5/16/2011 |
|
|
10.1 |
|
|
|
10.15 |
|
Summary of Plan Terms for 2012 Executive Short-Term Incentive Plan* |
|
8-K |
|
2/13/2012 |
|
|
n/a |
|
|
|
10.16 |
|
2002 Stock Plan, as amended* |
|
DEF 14A |
|
3/30/2012 |
|
|
Appendix A |
|
|
|
10.17 |
|
Executive Severance Plan dated March 14, 2006, as amended* |
|
10-Q |
|
11/8/2012 |
|
|
10.1 |
|
|
|
10.18 |
|
Amended and Restated Credit Agreement |
|
8-K |
|
6/13/2013 |
|
|
10.1 |
|
|
|
10.19 |
|
Amended and Restated Guarantee and Collateral Agreement |
|
8-K |
|
6/13/2013 |
|
|
10.2 |
|
|
|
10.20 |
|
1995 Director Option Plan, as amended* |
|
10-Q |
|
8/5/2013 |
|
|
10.3 |
|
|
|
10.21 |
|
1998 Nonstatutory Stock Option Plan, as amended* |
|
10-Q |
|
8/5/2013 |
|
|
10.4 |
|
|
|
10.22 |
|
2002 Stock Option Plan, as amended* |
|
10-Q |
|
8/5/2013 |
|
|
10.5 |
|
|
|
10.23 |
|
2002 Stock Plan, as amended* |
|
10-Q |
|
8/5/2013 |
|
|
10.5 |
|
|
|
10.24 |
|
Stock Repurchase Agreement, dated August 8, 2013, by and between Advent Software, Inc. and representatives for several underwriters under the Underwriting Agreement |
|
10-Q |
|
11/8/2013 |
|
|
10.4 |
|
|
|
10.25 |
|
Description of Director Compensation |
|
10-K |
|
2/25/2014 |
|
|
10.24 |
|
|
|
10.26 |
|
Chief Executive Officer Severance Plan* |
|
10-Q |
|
3/20/2014 |
|
|
10.1 |
|
|
|
10.27 |
|
Executive Severance Plan dated March 14, 2006, as amended* |
|
10-Q |
|
3/20/2014 |
|
|
10.2 |
|
|
129
Table of Contents
| | | | | | | | | | | | |
| |
| | Incorporated by Reference | |
|
|---|
Exhibit
Number | |
| | Filed
Herewith |
|---|
| | Exhibit Description | | Form | | Date | | Number |
|---|
| | 10.28 | | Lease amendment dated January 28, 2015 between Toda America, Inc. and Advent Software, Inc. for facilities located at 600 Townsend Street in San Francisco, California | | 8-K | | 2/2/2015 | | | 10.1 | | |
|
10.29 |
|
2002 Stock Plan, as amended |
|
8-K |
|
5/13/2014 |
|
|
10.1 |
|
|
|
21.1 |
|
Subsidiaries of Advent |
|
|
|
|
|
|
|
|
X |
|
23.1 |
|
Consent of PricewaterhouseCoopers LLP, Independent Registered Public Accounting Firm |
|
|
|
|
|
|
|
|
X |
|
24.1 |
|
Power of Attorney (included on page 132 of this Form 10-K) |
|
|
|
|
|
|
|
|
X |
|
31.1 |
|
Certification of Principal Executive Officer under Section 302 of the Sarbanes-Oxley Act of 2002 |
|
|
|
|
|
|
|
|
X |
|
31.2 |
|
Certification of Principal Financial Officer under Section 302 of the Sarbanes-Oxley Act of 2002 |
|
|
|
|
|
|
|
|
X |
|
32.1 |
|
Certification of Principal Executive Officer under Section 906 of the Sarbanes-Oxley Act of 2002 |
|
|
|
|
|
|
|
|
X |
|
32.2 |
|
Certification of Principal Financial Officer under Section 906 of the Sarbanes-Oxley Act of 2002 |
|
|
|
|
|
|
|
|
X |
|
101.INS |
|
XBRL Instance |
|
|
|
|
|
|
|
|
X |
|
101.SCH |
|
XBRL Taxonomy Extension Schema |
|
|
|
|
|
|
|
|
X |
|
101.CAL |
|
XBRL Taxonomy Extension Calculation |
|
|
|
|
|
|
|
|
X |
|
101.LAB |
|
XBRL Taxonomy Extension Labels |
|
|
|
|
|
|
|
|
X |
|
101.PRE |
|
XBRL Extension Presentation |
|
|
|
|
|
|
|
|
X |
|
101.DEF |
|
XBRL Taxonomy Extension Definition |
|
|
|
|
|
|
|
|
X |
- *
- Denotes management contract or compensatory plan or arrangement required to be filed as an Exhibit to this Form 10-K.
- **
- Incorporated by reference to the exhibit filed with Advent's registration statement filed on Form SB-2 (commission file number 33-97912-LA), declared effective on November 15, 1995.
130
Table of Contents
SIGNATURES
Pursuant to the requirements of Section 13 or 15(d) of the Securities Exchange Act of 1934, the registrant has duly caused this report to be signed on its behalf by the undersigned thereunto duly authorized, on this 24th day of February, 2015.
| | | | |
| | ADVENT SOFTWARE, INC. |
| | By: | | /s/ JAMES S. COX
James S. Cox
Executive Vice President and
Chief Financial Officer
(Principal Financial and Accounting Officer) |
131
Table of Contents
POWER OF ATTORNEY
KNOW ALL PERSONS BY THESE PRESENTS, that each person whose signature appears below constitutes and appoints David P. Hess and James S. Cox his or her attorney-in-fact, with full power of substitution, for him or her in any and all capacities, to sign any amendments to this Report on Form 10-K and to file the same, with exhibits thereto and other documents in connection therewith, with the Securities and Exchange Commission, hereby ratifying and confirming all that each of said attorneys-in-fact, or his or her substitute or substitutes, may do or cause to be done by virtue hereof.
Pursuant to the requirements of the Securities Exchange Act of 1934, this report has been signed below by the following persons on behalf of the registrant and in the capacities and on the dates indicated.
| | | | |
Signature | | Title | | Date |
|---|
|
|
|
|
|
/s/ DAVID PETER HESS
David Peter Hess | | Chief Executive Officer, President and Director (Principal Executive Officer) | | February 24, 2015 |
/s/ JAMES S. COX
James S. Cox |
|
Executive Vice President and Chief Financial Officer (Principal Financial and Accounting Officer) |
|
February 24, 2015 |
/s/ STEPHANIE G. DIMARCO
Stephanie G. DiMarco |
|
Chair of the Board |
|
February 24, 2015 |
/s/ MICHAEL L. FRANDSEN
Michael L. Frandsen |
|
Director |
|
February 24, 2015 |
/s/ ASIFF S. HIRJI
Asiff S. Hirji |
|
Director |
|
February 24, 2015 |
/s/ JAMES D. KIRSNER
James D. Kirsner |
|
Director |
|
February 24, 2015 |
/s/ ROBERT M. TARKOFF
Robert M. Tarkoff |
|
Director |
|
February 24, 2015 |
/s/ WENDELL G. VAN AUKEN
Wendell G. Van Auken |
|
Lead Independent Director |
|
February 24, 2015 |
132