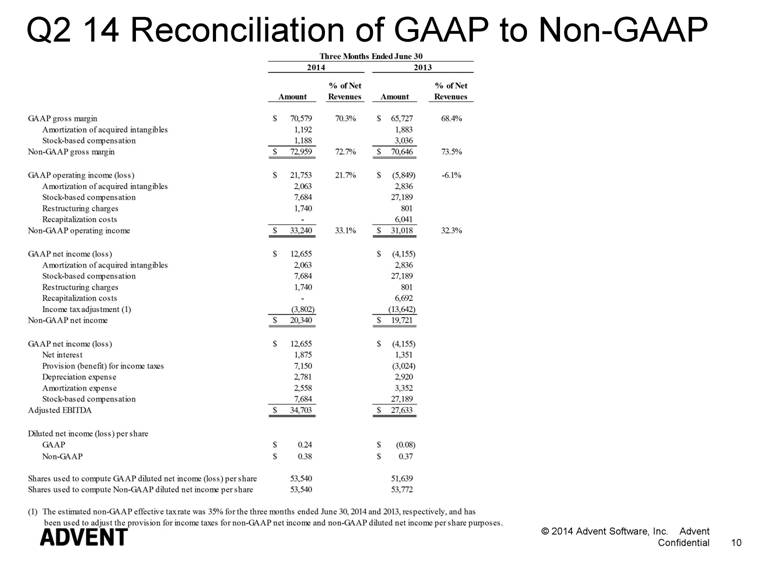
| Q2 14 Reconciliation of GAAP to Non-GAAP 10 Amount % of Net Revenues Amount % of Net Revenues GAAP gross margin 70,579 $ 70.3% 65,727 $ 68.4% Amortization of acquired intangibles 1,192 1,883 Stock-based compensation 1,188 3,036 Non-GAAP gross margin 72,959 $ 72.7% 70,646 $ 73.5% GAAP operating income (loss) 21,753 $ 21.7% (5,849) $ -6.1% Amortization of acquired intangibles 2,063 2,836 Stock-based compensation 7,684 27,189 Restructuring charges 1,740 801 Recapitalization costs - 6,041 Non-GAAP operating income 33,240 $ 33.1% 31,018 $ 32.3% GAAP net income (loss) 12,655 $ (4,155) $ Amortization of acquired intangibles 2,063 2,836 Stock-based compensation 7,684 27,189 Restructuring charges 1,740 801 Recapitalization costs - 6,692 Income tax adjustment (1) (3,802) (13,642) Non-GAAP net income 20,340 $ 19,721 $ GAAP net income (loss) 12,655 $ (4,155) $ Net interest 1,875 1,351 Provision (benefit) for income taxes 7,150 (3,024) Depreciation expense 2,781 2,920 Amortization expense 2,558 3,352 Stock-based compensation 7,684 27,189 Adjusted EBITDA 34,703 $ 27,633 $ Diluted net income (loss) per share GAAP 0.24 $ (0.08) $ Non-GAAP 0.38 $ 0.37 $ Shares used to compute GAAP diluted net income (loss) per share 53,540 51,639 Shares used to compute Non-GAAP diluted net income per share 53,540 53,772 (1) The estimated non-GAAP effective tax rate was 35% for the three months ended June 30, 2014 and 2013, respectively, and has been used to adjust the provision for income taxes for non-GAAP net income and non-GAAP diluted net income per share purposes. 2014 2013 Three Months Ended June 30 |