Table of Contents
SECURITIES AND EXCHANGE COMMISSION
Washington, D.C. 20549
Form 6-K
REPORT OF FOREIGN ISSUER
Pursuant to Rule 13a-16 or 15d-16 of
the Securities Exchange Act of 1934
For the month of May 2013
Eni S.p.A.
(Exact name of Registrant as specified in its charter)
Piazzale Enrico Mattei 1 - 00144 Rome, Italy
(Address of principal executive offices)
(Indicate by check mark whether the registrant files or will file annual reports under cover of Form 20-F or Form 40-F.)
Form 20-F x Form 40-F o
(Indicate by check mark whether the registrant by furnishing the information contained in this Form is also thereby furnishing the information to the Commission pursuant to Rule 12g3-2b under the Securities Exchange Act of 1934.)
Yes o No x
(If “Yes” is marked, indicate below the file number assigned to the registrant in connection with Rule 12g3-2(b): )
Table of Contents
Press Release dated May 10, 2013
Ordinary Shareholders’ Meeting Resolutions
Press Release dated May 28, 2013
Press Release dated May 30, 2013
Table of Contents
SIGNATURES
Pursuant to the requirements of the Securities Exchange Act of 1934, the registrant has duly caused this report to be signed on its behalf by the undersigned, hereunto duly authorised.
| Eni S.p.A. | ||||
| Name: Antonio Cristodoro | ||||
| Title: | Head of Corporate Secretary's Staff Office | |||
Date: May 31, 2013
Table of Contents
Contents
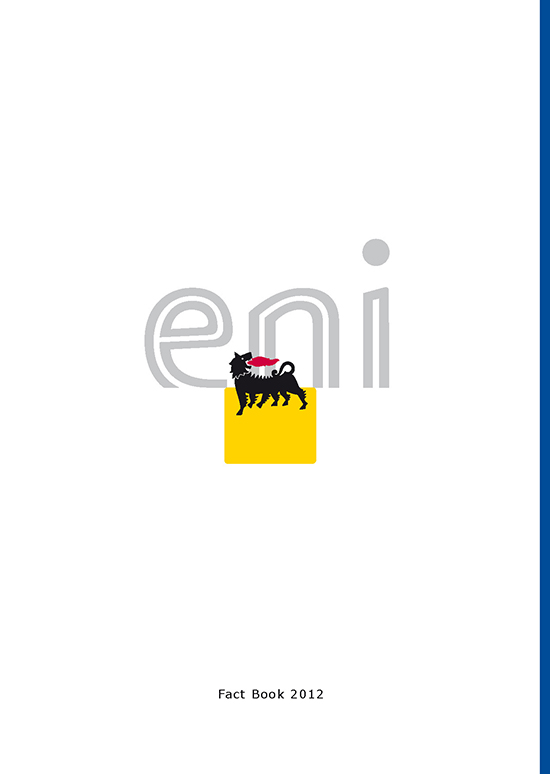
Table of Contents
Contents

Table of Contents
Contents

Table of Contents
| I Fact Book 2012 | ||||||
| Contents | Eni’s Fact Book is a supplement to Eni’s 2012 Annual Report and is designed to provide supplemental financial and operating information. It contains certain forward-looking statements in particular under the section "Outlook" regarding capital expenditure, development and management of oil and gas resources, dividends, allocation of future cash flow from operations, future operating performance, gearing, targets of production and sale growth, new markets, and the progress and timing of projects. By their nature, forward-looking statements involve risks and uncertainties because they relate to events and depend on circumstances that will or may occur in the future. Actual results may differ from those expressed in such statements, depending on a variety of factors, including the timing of bringing new fields on stream; management’s ability in carrying out industrial plans and in succeeding in commercial transactions; future levels of industry product supply; demand and pricing; operational problems; general economic conditions; political stability and economic growth in relevant areas of the world; changes in laws and governmental regulations; development and use of new technology; changes in public expectations and other changes in business conditions; the actions of competitors and other factors discussed elsewhere in this document. | |||||
| 4 | Eni in 2012 | |||||
| 5 | Eni’s strategy | |||||
| 10 | Eni business model | |||||
| 14 | Exploration & Production | |||||
| 42 | Gas & Power | |||||
| 51 | Refining & Marketing | |||||
| 61 | Chemicals | |||||
| 65 | Engineering & Construction | |||||
| Tables | ||||||
| 71 | Financial Data | |||||
| 85 | Employees | |||||
| 86 | Supplemental oil and gas information | |||||
| 105 | Quarterly information I | |||||
Contents
Eni Fact Book Eni
![]()
| Eni is an integrated company engaged in the energy chain. Eni’s strong presence in the gas market, our operations in LNG, our skills in the power generation and refinery activities, strengthened by world class skills in engineering and project management, allow us to catch opportunities in the market and to realize integrated projects. In 2012 adjusted net profit was euro 7.13 billion, up by 2.7% from a year ago. It was up by 7.6% when excluding Snam’s results included in the continuing operations1. These results were driven by an excellent performance reported by the Exploration & Production Division on the back of a recovery in Libyan production. Net cash generated by operating activities from continuing operations amounted to euro 12.36 billion and together with the robust proceeds from divestments enabled the Company to finance capital expenditure and other investments of euro 13.33 billion and to pay dividends to Eni’s shareholders and other minorities for euro 4.38 billion, while reducing net borrowings by euro 12.52 billion. Leverage decreased to 0.25 at December 31, 2012 from 0.46 at December 31, 2011. The Board of Directors proposed to the Shareholders’ Meeting the distribution of a dividend of euro 1.08 per share representing a 4% increase from 2011. In 2012, Eni continued its commitment in incident prevention also by means of training programs on safety and emergency prevention. For the seventh consecutive year the injury frequency rate relating to employees and contractors decreased by 12.3% and 21.1% respectively, compared to 2011. In 2012, the Exploration & Production Division reported adjusted net profit amounting to euro 7.43 billion (up 8.2% from 2011) driven by improved operating performance. Oil and natural gas production for the full year was 1,701 kboe/day (up 7% from 2011) sustained by the recovery of activities in Libya, | the start-up/ramp-up of fields, particularly in Russia and Australia, and higher production in Iraq. Net proved reserves at December 31, 2012 was an eight-year record at 7.17 bboe based on a reference Brent price of $111 per barrel. The organic reserves replacement ratio was 147% with a reserves life index of 11.5 years (12.3 years in 2011). All sources reserves replacement ratio was 107%. The Gas & Power Division reported adjusted net profit of euro 473 million, almost doubled from 2011 due to the benefits associated with the renegotiations of the supply contracts and the full recovery of Libyan supplies. Worldwide gas sales, net of Galp sales, maintained their levels supported by a strong presence in the Italian residential market and presence in strategic European markets of France and Germany/Austria in addition to increasing international sales of LNG. In a scenario weighted down by a steep fall in fuel demand in Italy, the Refining & Marketing Division managed to reduce adjusted operating loss by euro 85 million from 2011 (down euro 179 million). This result reflects the better operating performances and improved efficiency and performance of refineries. Results posted by the Marketing activity were impacted by falling demand for fuel, high competitive pressure and increased expenses associated with certain marketing initiatives including a special discount on prices at the pump during the summer week-ends. The average market share in Italy was 31.2%, up 0.7 percentage points from 2011. The Engineering & Construction sector reported adjusted net profit amounting to euro 1,109 million reflecting the robust operating performance recorded mainly in the Drilling businesses, while the Engineering & Construction business reported a decline. The Chemical sector reported a significant increase in adjusted net loss (euro 395 million, down euro 189 million) from 2011, due to a weak trend in demand for commodities reflecting the economic downturn and a fall in unit margins. |

(1) The Snam contribution excluded is the result of Snam transactions with Eni included in the continuing operations according to IFRS 5. Adjusted operating profit and adjusted net profit are not provided by IFRS.
- 4 -
Contents
Eni Fact Book Eni
![]()
| The energy market has become even more challenging on the back of the uncertainty of the macro-economic scenario, mainly in Europe, recent trends in demand even more hinged on emerging Countries and discoveries of high potential basins for hydrocarbon production. Against this backdrop, Eni’s strategy for the 2013-2016 four-year period confirms the priorities of profitably growing oil and gas production, recovering profitability in the downstream gas sector, improving efficiency in the downstream oil and in the chemical sector. Eni believes that a sustainable business conduct contributes to both the achievement of industrial performance, and the mitigation of political, financial and operational risks. This strengthens Eni’s role as a trustworthy and reliable partner, who is ready to capture new opportunities in the marketplace and able to manage the complexities of the environment. Following the divestment of Snam and other portfolio operations, Eni has strengthened its financial structure reaching a leverage of 0.25. Net cash generated by operating activities and portfolio management will enable Eni to finance the planned relevant capital expenditure to fuel long-term growth (euro 56.8 billion) and to remunerate Eni’s shareholders.
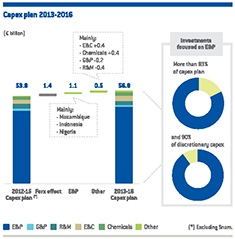
Business strategies and targets In Exploration & Production, Eni confirms its strategy of organic growth focused on exploration and reserve replacement as major drivers for value creation. Growth will be fuelled by new production | additions in Eni’s core areas (North and Sub-Saharan Africa, Venezuela, Barents Sea, Yamal Peninsula, Kazakhstan, Iraq and the Far East) leveraging Eni’s vast knowledge of reservoirs and geological basins, technical and producing synergies, as well as established partnerships with producing Countries. Average production growth is expected at a rate of more than 4% in the 2013-2016 period, supported by the development of core areas (Sub-Saharan Africa, and in particular Mozambique, Venezuela, Barents Sea, Yamal Peninsula in Russia, Kazakhstan, Iraq and Indonesia). Growth will be associated to increased profitability and risk management reducing time to market (more than 90% of the discoveries made in 2008-2012 will reach production within 8 years from their discovery) and retaining large volumes of operated production, in order to directly manage schedules and budget costs of development projects. Technological innovation and the application of proprietary technologies will allow to reach cost efficiency and acquire key competences for supporting increasing production and recovery rates, developing drilling techniques to be applied in complex environments, marginal areas and deep and ultra-deep waters. This growth strategy will be supported by the mitigation of operational, political, Country and environmental risks.
Eni confirms its commitment to improving the safety of employees and contractors, strengthening the tools for management, training and control, and ensuring asset integrity and process security. Environmental impact targets include the containment of accidental oil spills from 2.9 boe/mmboe to 2.4 boe/mmboe by 2016, an over 30% reduction in GHG emission rates in the E&P segment for each thousand of toe of gross operated production by 2015 as compared to 2010 deploying flaring down policies especially in Africa and energy efficiency programs. Projects for production water reinjection will lead to a rate of reinjection of 65% of total water produced by 2016. |
- 5 -
Contents
Eni Fact Book Eni
| In the Gas & Power Division, Eni intends to recover profitability leveraging on (i) a competitive and flexible cost position thanks to contract renegotiation; (ii) an expansion in gas sales in Italy through its sales force, diversified offer of innovative products and best-in-class services, mainly to the retail segment; (iii) a selective development in activities outside Italy, focusing on more profitable segments and increasing LNG sales in profitable markets outside Europe. In the 2013-2016 period Eni intends to preserve its market share in Italy and abroad taking account of the expected increase in supply and logistics costs implementing efficient marketing initiatives.
Management intends to reach a greater integration of trading and commodity price risk management with the supply activities and the non-retail commercial sales of gas and LNG to fully centralize and optimize Eni’s commodity risk exposure in markets characterized by more and more evolved counterparties. In Refining & Marketing, Eni expects to gradually recover profitability throughout the plan period leveraging on optimization of industrial plants and of logistics operations by means of higher flexibility, process integration and efficiency; selective investments targeting to upgrade conversion capacity and asset integrity; the conversion of the Venice plant into a "bio-refinery" to produce bio-fuels; cost reduction programs.
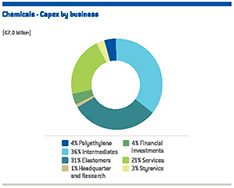
| In Chemical segment Eni confirms its strategy of progressively reducing the exposure to loss-making commodity chemicals while at the same time developing innovative and niche productions which are expected to yield better returns such as elastomers and the expansion of the specialties segment. Eni intends to grow the green-chemistry business leveraging on the ongoing project of converting its Porto Torres site in a modern plant for the manufacture of eco-compatible chemical products. The recent strategic alliances in Asia, supported by our technological know-how and the enhancement of Eni’s proprietary technology platform confirm a greater internationalization of our business, projecting it towards markets characterized by high-growth demand rates.
In the Engineering & Construction segment, Eni confirms its target of consolidating the global competitive position achieved in the offshore and onshore businesses and its role as high-quality niche player in the deepwater drilling business. Saipem will leverage on the enhancement of the EPC(I)-oriented business model, its world-class technology, engineering and delivering skills, its strong local presence and established relationships with oil Majors and National Oil Companies. |

- 6 -
Contents
Eni Fact Book Eni
Main data
Key financial data (a) | 2003 (*) | 2004 | 2005 | 2006 | 2007 | 2008 | 2009 | 2010 | 2011 | 2012 |
| Net sales from operations | 51,487 | 57,498 | 73,692 | 86,071 | 87,204 | 108,082 | 83,227 | 98,523 | 109,589 | 128,592 | |||||||||||||||||||||
| of which: continuing operations | 106,978 | 81,932 | 96,617 | 107,690 | 127,220 | ||||||||||||||||||||||||||
| Group operating profit | 9,517 | 12,399 | 16,664 | 19,336 | 18,739 | 18,517 | 12,055 | 16,111 | 17,435 | 15,914 | |||||||||||||||||||||
| Special items | (448 | ) | (1,210 | ) | 88 | (620 | ) | 2,034 | 1,295 | 2,290 | 1,567 | 4,795 | |||||||||||||||||||
| Profit (loss) on stock | 631 | 1,942 | 1,059 | 885 | 936 | (345 | ) | (881 | ) | (1,113 | ) | (17 | ) | ||||||||||||||||||
| Group adjusted operating profit | 9,958 | 12,582 | 17,396 | 20,483 | 19,004 | 21,487 | 13,005 | 17,520 | 17,889 | 20,692 | |||||||||||||||||||||
| Adjusted operating profit - continuing operations | 21,322 | 12,722 | 16,845 | 17,230 | 19,753 | ||||||||||||||||||||||||||
| Exploration & Production | 5,973 | 8,202 | 12,649 | 15,521 | 13,770 | 17,166 | 9,489 | 13,898 | 16,075 | 18,518 | |||||||||||||||||||||
| Gas & Power | 3,661 | 3,448 | 3,783 | 4,117 | 4,414 | 1,778 | 2,022 | 1,268 | (247 | ) | 354 | ||||||||||||||||||||
| Refining & Marketing | 584 | 923 | 1,210 | 794 | 292 | 555 | (381 | ) | (181 | ) | (539 | ) | (328 | ) | |||||||||||||||||
| Chemicals | (54 | ) | 263 | 261 | 219 | 116 | (382 | ) | (441 | ) | (96 | ) | (273 | ) | (485 | ) | |||||||||||||||
| Engineering & Construction | 311 | 215 | 314 | 508 | 840 | 1,041 | 1,120 | 1,326 | 1,443 | 1,465 | |||||||||||||||||||||
| Other activities | (236 | ) | (223 | ) | (296 | ) | (299 | ) | (207 | ) | (244 | ) | (258 | ) | (205 | ) | (226 | ) | (224 | ) | |||||||||||
| Corporate and financial companies | (281 | ) | (187 | ) | (384 | ) | (244 | ) | (195 | ) | (282 | ) | (342 | ) | (265 | ) | (266 | ) | (329 | ) | |||||||||||
| Impact of unrealized intragroup profit elimination and consolidation adjustments | (59 | ) | (141 | ) | (133 | ) | (26 | ) | 1,690 | 1,513 | 1,100 | 1,263 | 782 | ||||||||||||||||||
| Adjusted operating profit - discontinued operations | 165 | 283 | 675 | 659 | 939 | ||||||||||||||||||||||||||
| Group net profit | 5,585 | 7,059 | 8,788 | 9,217 | 10,011 | 8,825 | 4,367 | 6,318 | 6,860 | 7,788 | |||||||||||||||||||||
| of which: continuing operations | 8,996 | 4,488 | 6,252 | 6,902 | 4,198 | ||||||||||||||||||||||||||
| of which: discontinued operations | (171 | ) | (121 | ) | 66 | (42 | ) | 3,590 | |||||||||||||||||||||||
| Group adjusted net profit | 5,096 | 6,645 | 9,251 | 10,401 | 9,569 | 10,164 | 5,207 | 6,869 | 6,969 | 7,323 | |||||||||||||||||||||
| of which: continuing operations | 10,315 | 5,321 | 6,770 | 6,938 | 7,128 | ||||||||||||||||||||||||||
| of which: discontinued operations | (151 | ) | (114 | ) | 99 | 31 | 195 | ||||||||||||||||||||||||
| Net cash provided by operating activities | 10,827 | 12,500 | 14,936 | 17,001 | 15,517 | 21,801 | 11,136 | 14,694 | 14,382 | 12,371 | |||||||||||||||||||||
| of which: continuing operations | 21,506 | 10,755 | 14,140 | 13,763 | 12,356 | ||||||||||||||||||||||||||
| of which: discontinued operations | 295 | 381 | 554 | 619 | 15 | ||||||||||||||||||||||||||
| Capital expenditure | 8,802 | 7,499 | 7,414 | 7,833 | 10,593 | 14,562 | 13,695 | 13,870 | 13,438 | 13,517 | |||||||||||||||||||||
| of which: continuing operations | 12,935 | 12,216 | 12,450 | 11,909 | 12,761 | ||||||||||||||||||||||||||
| of which: discontinued operations | 1,627 | 1,479 | 1,420 | 1,529 | 756 | ||||||||||||||||||||||||||
| Shareholders’ equity including non-controlling interest | 28,318 | 35,540 | 39,217 | 41,199 | 42,867 | 48,510 | 50,051 | 55,728 | 60,393 | 62,713 | |||||||||||||||||||||
| Net borrowings | 13,543 | 10,443 | 10,475 | 6,767 | 16,327 | 18,376 | 23,055 | 26,119 | 28,032 | 15,511 | |||||||||||||||||||||
| Leverage | 0.48 | 0.29 | 0.27 | 0.16 | 0.38 | 0.38 | 0.46 | 0.47 | 0.46 | 0.25 | |||||||||||||||||||||
| Net capital employed | 41,861 | 45,983 | 49,692 | 47,966 | 59,194 | 66,886 | 73,106 | 81,847 | 88,425 | 78,224 | |||||||||||||||||||||
| Exploration & Production | 17,340 | 16,770 | 19,109 | 17,783 | 23,826 | 31,362 | 32,455 | 37,646 | 42,024 | 42,445 | |||||||||||||||||||||
| Gas & Power | 15,617 | 19,554 | 20,075 | 19,713 | 21,333 | 9,636 | 11,024 | 12,931 | 12,367 | 11,135 | |||||||||||||||||||||
| Snam | 11,918 | 13,730 | 14,415 | 15,393 | |||||||||||||||||||||||||||
| Refining & Marketing | 5,089 | 5,081 | 5,993 | 5,631 | 7,675 | 7,379 | 8,105 | 8,321 | 9,188 | 8,876 | |||||||||||||||||||||
| Chemicals | 1,821 | 2,076 | 2,018 | 1,953 | 2,228 | 1,915 | 1,774 | 1,978 | 2,252 | 2,569 | |||||||||||||||||||||
| Engineering & Construction | 2,119 | 2,403 | 2,844 | 3,399 | 4,313 | 5,022 | 6,566 | 7,610 | 8,217 | 10,020 | |||||||||||||||||||||
| Corporate financial companies and other activities | (125 | ) | 277 | 2 | (95 | ) | 294 | 24 | (192 | ) | (527 | ) | (393 | ) | 3,682 | ||||||||||||||||
| Impact of unrealized intragroup profit elimination | (178 | ) | (349 | ) | (418 | ) | (475 | ) | (370 | ) | (356 | ) | (527 | ) | (623 | ) | (503 | ) | |||||||||||||
(*) Financial data for 2003 were prepared in accordance to Italian Gaap.
(a) Following the divestment of Regulated Businesses in Italy, results of Snam have been accounted as "discontinued operations". Results for the 2008-2011 period have been restated accordingly.
Key market indicators | 2003 | 2004 | 2005 | 2006 | 2007 | 2008 | 2009 | 2010 | 2011 | 2012 |
| Average price of Brent dated crude oil (a) | 28.84 | 38.22 | 54.38 | 65.14 | 72.52 | 96.99 | 61.51 | 79.47 | 111.27 | 111.58 | ||||||||||||
| Average EUR/USD exchange rate (b) | 1.131 | 1.244 | 1.244 | 1.256 | 1.371 | 1.471 | 1.393 | 1.327 | 1.392 | 1.285 | ||||||||||||
| Average price in euro of Brent dated crude oil | 25.50 | 30.72 | 43.71 | 51.86 | 52.90 | 65.93 | 44.16 | 59.89 | 79.94 | 86.83 | ||||||||||||
| Average European refining margin (c) | 2.65 | 4.35 | 5.78 | 3.79 | 4.52 | 6.49 | 3.13 | 2.66 | 2.06 | 4.83 | ||||||||||||
| Average European refining margin Brent/Ural (c) | 3.40 | 7.03 | 8.33 | 6.50 | 6.45 | 8.85 | 3.56 | 3.47 | 2.90 | 4.94 | ||||||||||||
| Euribor - three-month euro rate | (%) | 2.3 | 2.1 | 2.2 | 3.1 | 4.3 | 4.6 | 1.2 | 0.8 | 1.4 | 0.6 | |||||||||||
(a) In US dollars per barrel. Source: Platt’s Oilgram.
(b) Source: ECB.
(c) In US dollars per barrel FOB Mediterranean Brent dated crude oil. Source: Eni calculations based on Platt’s Oilgram data.
- 7 -
Contents
| Eni Fact Book Eni |
Selected operating data | 2003 | 2004 | 2005 | 2006 | 2007 | 2008 | 2009 | 2010 | 2011 | 2012 |
| Corporate (a) | ||||||||||||||||||||||
| Employees at period end | (number) | 76,529 | 71,572 | 71,773 | 72,850 | 75,125 | 71,714 | 71,461 | 73,768 | 72,574 | 77,838 | |||||||||||
| of which: - women | 11,155 | 10,326 | 10,620 | 10,841 | 10,977 | 11,611 | 11,955 | 12,161 | 12,542 | 12,860 | ||||||||||||
| of which: - outside Italy | 36,678 | 32,691 | 34,036 | 35,818 | 38,634 | 41,971 | 42,633 | 45,967 | 45,516 | 51,034 | ||||||||||||
| Female managers | (%) | 10.9 | 12.5 | 12.4 | 13.5 | 14.1 | 16.3 | 17.3 | 18.0 | 18.5 | 18.9 | |||||||||||
| Employee injury frequency rate | (number of injuries/million of worked hours) | 3.79 | 3.99 | 2.74 | 2.45 | 1.93 | 1.22 | 0.84 | 0.80 | 0.65 | 0.57 | |||||||||||
| Contractor injury frequency rate | 4.12 | 7.84 | 2.59 | 1.54 | 1.45 | 1.09 | 0.97 | 0.71 | 0.57 | 0.45 | ||||||||||||
| Fatality index | (fatal injuries per one hundred million of worked hours) | 5.51 | 5.64 | 3.38 | 2.31 | 2.97 | 2.75 | 1.20 | 4.77 | 1.94 | 1.10 | |||||||||||
| Oil spills | (barrels) | 857 | 7,813 | 6,908 | 6,151 | 6,731 | 4,749 | 6,259 | 4,269 | 7,295 | 3,856 | |||||||||||
| Oil spills due to sabotage and terrorism | n.a. | n.a. | 1,810 | 7,014 | 2,608 | 2,286 | 15,288 | 18,695 | 7,657 | 8,384 | ||||||||||||
| GHG emission | (mmtonnes CO2 eq) | 52.27 | 58.34 | 61.85 | 60.72 | 67.25 | 59.59 | 55.49 | 58.26 | 49.12 | 52.49 | |||||||||||
| R&D expenditures (b) | (euro million) | 238 | 257 | 204 | 222 | 208 | 211 | 233 | 218 | 190 | 211 | |||||||||||
| Exploration & Production | ||||||||||||||||||||||
| Proved reserves of hydrocarbons at period end | (mmboe) | 7,272 | 7,218 | 6,837 | 6,436 | 6,370 | 6,600 | 6,571 | 6,843 | 7,086 | 7,166 | |||||||||||
| Reserve life index | (years) | 12.7 | 12.1 | 10.8 | 10.0 | 10.0 | 10.0 | 10.2 | 10.3 | 12.3 | 11.5 | |||||||||||
| Hydrocarbons production (c) | (kboe/d) | 1,562 | 1,624 | 1,737 | 1,770 | 1,736 | 1,797 | 1,769 | 1,815 | 1,581 | 1,701 | |||||||||||
| Gas & Power | ||||||||||||||||||||||
| Sales of consolidated companies (including own consumption) | (bcm) | 71.39 | 76.49 | 82.62 | 85.76 | 84.83 | 89.32 | 89.60 | 82.00 | 84.37 | 84.67 | |||||||||||
| Sales of Eni’s affiliates (Eni’s share) | 6.94 | 5.84 | 7.08 | 7.65 | 8.74 | 8.91 | 7.95 | 9.41 | 9.53 | 7.92 | ||||||||||||
| Total sales and own consumption (G&P) | 78.33 | 82.33 | 89.70 | 93.41 | 93.57 | 98.23 | 97.55 | 91.41 | 93.90 | 92.59 | ||||||||||||
| E&P gas sales (c) | 4.70 | 4.51 | 4.69 | 5.39 | 6.00 | 6.17 | 5.65 | 2.86 | 2.73 | |||||||||||||
| Worldwide gas sales | 78.33 | 87.03 | 94.21 | 98.10 | 98.96 | 104.23 | 103.72 | 97.06 | 96.76 | 95.32 | ||||||||||||
| Electricity sold | (TWh) | 8.65 | 16.95 | 27.56 | 31.03 | 33.19 | 29.93 | 33.96 | 39.54 | 40.28 | 42.58 | |||||||||||
| Refining & Marketing | ||||||||||||||||||||||
| Throughputs on own account | (mmtonnes) | 35.43 | 37.69 | 38.79 | 38.04 | 37.15 | 35.84 | 34.55 | 34.80 | 31.96 | 30.01 | |||||||||||
| Balanced capacity of wholly-owned refineries at period end | (kbbl/d) | 504 | 504 | 524 | 534 | 544 | 737 | 747 | 757 | 767 | 767 | |||||||||||
| Sales of refined products | (mmtonnes) | 50.43 | 53.54 | 51.63 | 51.13 | 50.15 | 49.16 | 45.59 | 46.80 | 45.02 | 48.33 | |||||||||||
| Retail sales in Europe | (mmtonnes) | 14.01 | 14.40 | 12.42 | 12.48 | 12.65 | 12.03 | 12.02 | 11.73 | 11.37 | 10.87 | |||||||||||
| Service stations at year end | (number) | 10,647 | 9,140 | 6,282 | 6,294 | 6,440 | 5,956 | 5,986 | 6,167 | 6,287 | 6,384 | |||||||||||
| Average throughput per service station | (kliters/y) | 1,771 | 1,970 | 2,479 | 2,470 | 2,486 | 2,502 | 2,477 | 2,353 | 2,206 | 2,064 | |||||||||||
| Chemicals | ||||||||||||||||||||||
| Production | (ktonnes) | 6,907 | 7,118 | 7,282 | 7,072 | 8,795 | 7,372 | 6,521 | 7,220 | 6,245 | 6,090 | |||||||||||
| of which: - Intermediates | 4,014 | 4,236 | 4,450 | 4,275 | 5,688 | 5,110 | 4,350 | 4,860 | 4,101 | 4,112 | ||||||||||||
| of which: - Polymers | 2,893 | 2,882 | 2,832 | 2,797 | 3,107 | 2,262 | 2,171 | 2,360 | 2,144 | 1,978 | ||||||||||||
| Average plant utilization rate | (%) | 71.3 | 75.2 | 78.4 | 76.4 | 80.6 | 68.6 | 65.4 | 72.9 | 65.3 | 66.7 | |||||||||||
| Engineering & Construction | ||||||||||||||||||||||
| Orders acquired | (euro million) | 5,876 | 5,784 | 8,395 | 11,172 | 11,845 | 13,860 | 9,917 | 12,935 | 12,505 | 13,391 | |||||||||||
| Order backlog at year end | 9,405 | 8,521 | 10,122 | 13,191 | 15,390 | 19,105 | 18,370 | 20,505 | 20,417 | 19,739 | ||||||||||||
| (a) Following the divestment of Regulated Businesses in Italy, data for the year 2012 do not include Snam contribution. Results for the 2008-2011 period have been restated accordingly. (b) Net of general and administrative costs. (c) From July 1, 2012, Eni has updated the natural gas conversion factor from 5,550 to 5,490 standard cubic feet of gas per barrel of oil equivalent. The effect of this update on production expressed in boe was 9 kboe/d for the full-year 2012 and on the initial reserves balance as of January 1, 2011, amounted to 40 mmboe. Other per-boe indicators were only marginally affected by the update (e.g. realization prices, costs per boe) and also negligible was the impact on depletion charges. Other oil companies use different conversion rates. |
Share data | 2003 | 2004 | 2005 | 2006 | 2007 | 2008 | 2009 | 2010 | 2011 | 2012 |
| Net profit (a) (b) | (euro) | 1.48 | 1.87 | 2.34 | 2.49 | 2.73 | 2.43 | 1.21 | 1.74 | 1.89 | 2.15 | |||||||||||
| Net profit - continuing operations (a) (b) (*) | 2.47 | 1.24 | 1.72 | 1.90 | 1.16 | |||||||||||||||||
| Dividend | 0.75 | 0.90 | 1.10 | 1.25 | 1.30 | 1.30 | 1.00 | 1.00 | 1.04 | 1.08 | ||||||||||||
| Dividend pertaining to the year (c) | (euro million) | 2,828 | 3,384 | 4,086 | 4,594 | 4,750 | 4,714 | 3,622 | 3,622 | 3,695 | 3,840 | |||||||||||
| Cash flow | (euro) | 2.87 | 3.31 | 3.97 | 4.59 | 4.23 | 5.99 | 3.07 | 4.06 | 3.97 | 3.41 | |||||||||||
| Dividend yield (d) | (%) | 5.1 | 4.9 | 4.7 | 5.0 | 5.3 | 7.6 | 5.8 | 6.1 | 6.6 | 5.9 | |||||||||||
| Net profit per ADR (e) | (US$) | 3.72 | 4.66 | 5.81 | 6.26 | 7.49 | 7.27 | 3.45 | 4.59 | 5.29 | 2.98 | |||||||||||
| Dividend per ADR (e) | 1.83 | 2.17 | 2.74 | 3.14 | 3.56 | 3.82 | 2.79 | 2.65 | 2.90 | 2.78 | ||||||||||||
| Cash flow per ADR (e) | 7.22 | 8.96 | 9.40 | 11.53 | 11.60 | 17.63 | 8.56 | 10.77 | 11.05 | 8.78 | ||||||||||||
| Dividend yield per ADR (d) | (%) | 5.0 | 5.0 | 4.7 | 5.0 | 5.3 | 7.6 | 5.8 | 6.1 | 6.6 | 5.8 | |||||||||||
| Pay-out | 51 | 48 | 46 | 50 | 47 | 53 | 81 | 57 | 55 | 50 | ||||||||||||
| Number of shares at period end representing share capital | (million shares) | 4,002.9 | 4,004.4 | 4,005.4 | 4,005.4 | 4,005.4 | 4,005.4 | 4,005.4 | 4,005.4 | 4,005.4 | 3,634.2 | |||||||||||
| Average number of share outstanding in the year (f) (fully diluted) | 3,778.4 | 3,771.7 | 3,763.4 | 3,701.3 | 3,669.2 | 3,638.9 | 3,622.4 | 3,622.5 | 3,622.7 | 3,622.8 | ||||||||||||
| TSR | (%) | 4.3 | 28.5 | 35.3 | 14.8 | 3.2 | (29.1 | ) | 13.7 | (2.2 | ) | 5.1 | 22.0 | |||||||||
| (*) Following the divestment of Regulated Businesses in Italy, results of Snam have been accounted for as "discontinued operations", based on IFRS 5. Results for the 2008-2011 period have been restated accordingly. Net profit refers to results of continuing operations as reported in Eni consolidated annual report. (a) Calculated on the average number of Eni shares outstanding during the year. (b) Pertaining to Eni’s shareholders. (c) Amounts due on the payment of the balance of 2012 dividend are estimated. (d) Ratio between dividend of the year and average share price in December. (e) One ADR represents 2 shares. Net profit, dividends and cash flow data were converted using average exchange rates. Dividends data were converted at the Noon Buying Rate of the pay-out date. (f) Calculated by excluding own shares in portfolio. |
- 8 - |
Contents
Eni Fact Book Eni
Share information | 2003 | 2004 | 2005 | 2006 | 2007 | 2008 | 2009 | 2010 | 2011 | 2012 |
| Share price - Milan Stock Exchange | ||||||||||||||||||||||
| High | (euro) | 15.75 | 18.75 | 24.96 | 25.73 | 28.33 | 26.93 | 18.35 | 18.56 | 18.42 | 18.70 | |||||||||||
| Low | 11.88 | 14.72 | 17.93 | 21.82 | 22.76 | 13.80 | 12.30 | 14.61 | 12.17 | 15.25 | ||||||||||||
| Average | 13.64 | 16.94 | 21.60 | 23.83 | 25.10 | 21.43 | 16.59 | 16.39 | 15.95 | 17.18 | ||||||||||||
| End of the period | 14.96 | 18.42 | 23.43 | 25.48 | 25.05 | 16.74 | 17.80 | 16.34 | 16.01 | 18.34 | ||||||||||||
| ADR price (a) - New York Stock Exchange | ||||||||||||||||||||||
| High | (US$) | 94.98 | 126.45 | 151.35 | 67.69 | 78.29 | 84.14 | 54.45 | 53.89 | 53.74 | 49.44 | |||||||||||
| Low | 66.15 | 92.35 | 118.50 | 54.65 | 60.22 | 37.22 | 31.07 | 35.37 | 32.98 | 36.85 | ||||||||||||
| Average | 77.44 | 105.60 | 134.02 | 59.97 | 68.80 | 63.38 | 46.36 | 43.56 | 44.41 | 44.24 | ||||||||||||
| End of the period | 94.98 | 125.84 | 139.46 | 67.28 | 72.43 | 47.82 | 50.61 | 43.74 | 41.27 | 49.14 | ||||||||||||
| Average daily exchanged shares | (million shares) | 22.0 | 20.0 | 28.5 | 26.2 | 30.5 | 28.7 | 27.9 | 20.7 | 22.9 | 15.6 | |||||||||||
| Value | (euro million) | 298.5 | 338.7 | 620.7 | 619.1 | 773.1 | 610.4 | 461.6 | 336.0 | 355.0 | 267.0 | |||||||||||
| Number of shares outstanding at period end (b) | (million shares) | 3,772.3 | 3,770.0 | 3,727.3 | 3,680.4 | 3,656.8 | 3,622.4 | 3,622.4 | 3,622.7 | 3,622.7 | 3,622.8 | |||||||||||
| Market capitalization (c) | ||||||||||||||||||||||
| EUR | (billion) | 56.4 | 69.4 | 87.3 | 93.8 | 91.6 | 60.6 | 64.5 | 59.2 | 58.0 | 66.4 | |||||||||||
| USD | 71.1 | 94.9 | 104.0 | 123.8 | 132.4 | 86.6 | 91.7 | 79.2 | 75.0 | 87.7 | ||||||||||||
(a) Effective January 10, 2006 a 5:2 stock split was made. Previous period’s prices have not been restated.
(b) Excluding treasury shares.
(c) Number of outstanding shares by reference price at period end.
Data on Eni share placement | 1995 | 1996 | 1997 | 1998 | 2001 |
| Offer price | (euro/share) | 5.42 | 7.40 | 9.90 | 11.80 | 13.60 | |||||||
| Number of share placed | (million shares) | 601.9 | 647.5 | 728.4 | 608.1 | 200.1 | |||||||
| of which: through bonus share | 1.9 | 15.0 | 24.4 | 39.6 | |||||||||
| Percentage of share capital (a) | (%) | 15.0 | 16.2 | 18.2 | 15.2 | 5.0 | |||||||
| Proceeds | (euro million) | 3,254 | 4,596 | 6,869 | 6,714 | 2,721 | |||||||
(a) Refers to share capital at December 31, 2012.

- 9 -
Contents
Eni Fact Book Eni business model
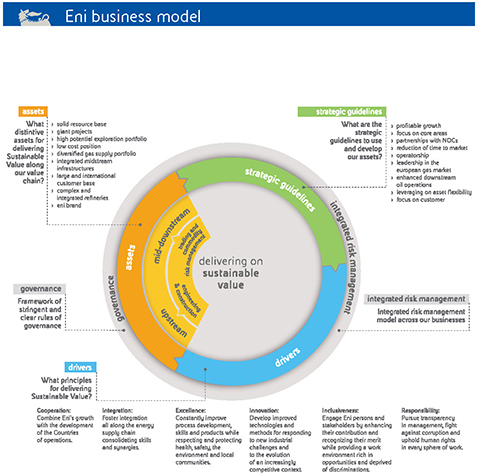
| Eni’s excellent market position and competitive advantages derive from the Company’s strategic decision-making which is consistent with the long-term nature of the business, and relies on a sustainable business model fonde on a consolidated and distinctive way of doing business, in a frame work of clear and straightforward rules of corporate governance and respectful of the highest ethical standards and rigorous risk management. Eni’s strategies, decisions in terms of resource allocation and day-by-day operations underpin sustainable value creation to shareholders and, more generally, all of our stakeholders: the host communities where we work through our contribution to socio-economic standards improvement and responsibly using resources; our people to whom we dedicate our best efforts to preserve health and safety of the workplace and to enhance each individual’s contribution and diversity; our suppliers, partners and public administrations with whom we interact by running our | operations in a transparent manner, respecting human rights and tackling with corruption; finally our clients to whom we offer competitive and up with the times commercial choices and high quality services. In 2012 Eni laid the foundations for a new growth phase of its oil and gas production tank to numerous exploration successes, the entry in new Countries and the management of activities in well established Countries of activity. These results are based on the great attention paid to the specific features of the Countries where Eni operates and thus on cooperation for their development. Starting from an assessment of their potential Eni promotes partnerships providing local people new opportunities for growth and development. This is a competitive lever in the Countries where Eni’s experience is more recent but |
- 10 -
Contents
Eni Fact Book Eni business model
| also in more established areas. In each one of them our objective is to create high quality jobs targeted at local resources on an equal opportunity basis. The culture of plurality is a distinctive feature of Eni’s strongly internationally oriented business model. The inclusion of all Eni people with their diversity merges with the protection of health and safety on the workplace, with the professional development and engagement in the company’s objectives. Eni guarantees equal treatment to its entire people defining worldwide remuneration policies and committing itself and its suppliers to the respect of the basic workers’ rights in all the Countries of operation. Responsibility is assumed as commitment to transparency and anticorruption practices while respecting human rights in all areas and promoting the development of Countries and their society. In deploying its activities, Eni activates a flow of resources that can prove crucial for economic growth. Only a strict discipline of integrity and promotion of transparency, in particular as concerns payments to producing Countries can protect from corruption and build the basis for a proper use of these resources aimed at sustainable development. The ultimate aim of sustainable growth is upheld by Eni through a way of operating based on operating excellence that leverages on best practices, quality systems, advanced and high quality technologies to guarantee full respect of communities and their environment. A safe management of plants and the mitigation of risks represent a prerequisite for a proper environmental management and for the reduction of environmental impacts. | The exploration of frontier areas and territories that are considered difficult and environmentally sensitive are the result not only of Eni’s drive to development while applying new technologies but also of a responsible and sustainable corporate strategy. Eni’s presence worldwide in the most sensitive areas was made possible by technological innovation and the application of advanced methodologies that allow work also in harsh contexts guaranteeing the protection of the environments and the conservation of sensitive ecosystems and biodiversity. Lastly, as an integrated energy company, Eni works alongside governments of producing Countries in planning and designing solutions for the development of local energy systems, cooperating with national companies in the development of energy sources and building infrastructure for their use and monetization. One of the main actions performed concerns the fight against energy poverty in particular in Sub-Saharan Africa with the support of the development of local technologies and the reduction of waste where infrastructure already exist. |
Safety | 2008 | 2009 | 2010 | 2011 | 2012 |
| Injury frequency rate | (number of injuries/million of worked hours) | 1.14 | 0.92 | 0.75 | 0.60 | 0.49 | ||||||
| - employees | 1.22 | 0.84 | 0.80 | 0.65 | 0.57 | |||||||
| - contractors | 1.09 | 0.97 | 0.71 | 0.57 | 0.45 | |||||||
| Fatality index | (fatal injuries/one hundred million of worked hours) | 2.75 | 1.20 | 4.77 | 1.94 | 1.10 | ||||||
| - employees | 2.55 | 0.89 | 6.66 | 1.19 | 0.87 | |||||||
| - contractors | 2.85 | 1.40 | 3.55 | 2.38 | 1.23 | |||||||
| Safety expenditure and investments | (euro thousand) | 407,930 | 487,660 | 260,434 | 320,117 | 370,559 | ||||||
| Professional illnesses reported | (number) | 82 | 123 | 184 | 135 | 71 | ||||||
| Health and hygiene expenditure and investments | (euro thousand) | 66,601 | 78,219 | 55,070 | 78,950 | 48,156 | ||||||
Spending for the territory | (euro million) | 2008 | 2009 | 2010 | 2011 | 2012 |
| Total spending for the territory | 85.9 | 97.7 | 107.2 | 100.9 | 90.6 | |||||||
| - of which project investments | 69.4 | 70.4 | 75.4 | 69.3 | 63.1 | |||||||
| - of which short-term investments and donations | 0.5 | 0.9 | 4.4 | 0.9 | 3.4 | |||||||
| - of which association memberships fees | 1.5 | 1.5 | 1.6 | 1.6 | 1.8 | |||||||
| - of which contributions to the Eni Foundation | - | 5.0 | 5.0 | 3.0 | - | |||||||
| - of which sponsorships for the territory | 11.4 | 16.2 | 17.1 | 22.4 | 18.6 | |||||||
| - of which contributions to the Eni Enrico Mattei Foundation | 3.2 | 3.7 | 3.7 | 3.7 | 3.7 | |||||||
- 11 -
Contents
Eni Fact Book Eni business model
Employment | 2008 | 2009 | 2010 | 2011 | 2012 |
| Employees as of December 31 | (number) | 71,714 | 71,461 | 73,768 | 72,574 | 77,838 | ||||||
| - men | 60,103 | 59,506 | 61,607 | 60,032 | 64,978 | |||||||
| - women | 11,611 | 11,955 | 12,161 | 12,542 | 12,860 | |||||||
| Employees abroad by type | 41,971 | 42,633 | 45,967 | 45,516 | 51,034 | |||||||
| - locals | 33,233 | 33,483 | 35,835 | 34,801 | 39,668 | |||||||
| - Italian expatriates | 2,769 | 2,771 | 3,123 | 3,208 | 3,867 | |||||||
| - International expatriates (including TCN) | 5,969 | 6,379 | 7,009 | 7,507 | 7,499 | |||||||
| Senior Managers employed | 1,471 | 1,437 | 1,454 | 1,468 | 1,474 | |||||||
| - of which women | 129 | 141 | 147 | 152 | 159 | |||||||
| Managers/Supervisors employed | 12,058 | 12,395 | 12,837 | 12,754 | 13,199 | |||||||
| - of which women | 2,075 | 2,258 | 2,421 | 2,477 | 2,615 | |||||||
| Employees | 33,483 | 33,931 | 34,599 | 36,019 | 38,497 | |||||||
| - of which women | 9,063 | 9,171 | 9,040 | 9,394 | 9,777 | |||||||
| Workers employed | 24,702 | 23,698 | 24,878 | 22,333 | 24,668 | |||||||
| - of which women | 344 | 385 | 553 | 519 | 309 | |||||||
| Local employees abroad by professional category | 33,233 | 33,483 | 35,835 | 34,801 | 39,668 | |||||||
| - of which senior managers | 245 | 224 | 228 | 228 | 223 | |||||||
| - of which managers/supervisors | 2,900 | 3,138 | 3,461 | 3,476 | 3,798 | |||||||
| - of which employees | 14,864 | 15,533 | 16,269 | 17,529 | 19,683 | |||||||
| - of which workers | 15,224 | 14,588 | 15,877 | 13,568 | 15,964 | |||||||
| Training hours | (thousand hours) | 2,888 | 2,930 | 2,949 | 3,127 | 3,132 | ||||||
| Procurement by geographical area 2012 | Africa | Americas | Asia | Italy | Rest of Europe | Oceania | ||||||||
| Number of suppliers used | (number) | 6,920 | 4,541 | 4,436 | 11,092 | 8,573 | 428 | |||||||
| Total procurement | (euro million) | 7,099 | 2,463 | 5,542 | 12,328 | 3,635 | 745 | |||||||
| - in goods | (%) | 11.7 | 29.1 | 11.9 | 20.0 | 17.3 | 18.9 | |||||||
| - in works | 7.3 | 21.1 | 55.5 | 16.3 | 21.8 | 15.4 | ||||||||
| - in services | 49.5 | 44.3 | 28.8 | 56.0 | 48.7 | 56.1 | ||||||||
| - of which unidentifiable | 31.5 | 5.5 | 3.8 | 7.7 | 12.2 | 9.6 | ||||||||
| Local procurement 2012 by Country | |
| % procurement on local market | Countries |
| 0 - 25% | Algeria, Croatia, Iraq, Libya, Luxembourg, Peru, Poland, Portugal, Spain, Venezuela. |
| 25 - 50% | Angola, France, Germany, Ghana, Iran, Kazakhstan, Switzerland. |
| 50 - 75% | Australia, Brazil, Ecuador, Egypt, Gabon, Norway, Pakistan, Republic of Congo, Saudi Arabia, Tunisia, United Kingdom. |
| 75 - 100% | Argentina, Canada, Hungary, India, Indonesia, Italy, Mexico, Netherlands, Nigeria, Romania, Russia, Singapore, United States. |
Relations with suppliers | 2008 | 2009 | 2010 | 2011 | 2012 |
| Procurement by macro-class | (euro million) | 28,375 | 33,084 | 31,187 | 32,586 | 31,811 | ||||||
| Supplier concentration top 20 | (%) | 23 | 24 | 18 | 20 | 15 | ||||||
| Suppliers used | (number) | 27,956 | 33,447 | 32,601 | 31,878 | 32,621 | ||||||
| Qualification cycles carried out during the year | 15,466 | 21,066 | 32,962 | 26,936 | 31,991 | |||||||
| Suppliers subjected to qualification procedures including screening on human rights | 5,772 | 7,798 | 10,096 | 11,471 | 12,471 | |||||||
| % procurement from suppliers subjected to qualification procedures including screening on human rights | (%) | 88 | 87 | 85 | 90 | 88 | ||||||
- 12 -
Contents
Eni Fact Book Eni business model
Relations with customers | 2008 | 2009 | 2010 | 2011 | 2012 |
| R&M Customer satisfaction | ||||||||||||
| Customer satisfaction index | (likert scale) | 8.14 | 7.93 | 7.84 | 7.74 | 7.90 | ||||||
| Clients involved in the survey | (number) | 22,609 | 10,711 | 30,618 | 30,524 | 30,438 | ||||||
| G&P Customer satisfaction | ||||||||||||
| Customer satisfaction index | (%) | 75.3 | 83.7 | 87.4 | 88.6 | 89.8 (b) | ||||||
| Average Panel (G&P) (a) | 84.9 | 87.0 | 87.4 | 90.8 | 90.6 | |||||||
(a) Referred to companies representing more than 50% of the gas market and totaling over 50,000 clients.
(b) 2012 figure is calculated as the average of the CSS detected by the AEEG in the first half of 2012 and the result detected by the Eni satisfaction survey in the second half of 2012.
Technological innovation | 2008 | 2009 | 2010 | 2011 | 2012 |
| R&D expenditure | (euro million) | 338 | 287 | 275 | 246 | 263 | ||||||
| - R&D expenditure net of general and administrative costs | 211 | 233 | 218 | 190 | 211 | |||||||
| Tangible value generated by R&D activities (a) | n.a. | 362 | 540 | 730 | 1,006 | |||||||
| Personnel employed in R&D activities (full time equivalent) | (number) | 1,123 | 1,019 | 1,019 | 925 | 975 | ||||||
| Existing patents | 8,040 | 7,751 | 7,998 | 8,884 | 8,931 | |||||||
(a) Figures refer to E&P, R&M and Versalis activities and had been measured since 2009, when the measurement process started.
Operating efficiency | 2008 | 2009 | 2010 | 2011 | 2012 |
| Direct GHG emissions | (tonnes CO2 eq) | 59,589,334 | 55,494,551 | 58,259,157 | 49,121,224 | 52,493,340 | ||||||
| - of which CO2 from combustion and process | (tonnes) | 36,475,270 | 35,788,121 | 37,948,625 | 35,319,845 | 36,365,220 | ||||||
| - of which CO2 equivalents from flaring | (tonnes CO2 eq) | 16,535,835 | 13,839,353 | 13,834,988 | 9,553,894 | 9,461,518 | ||||||
| - of which CO2 equivalents from CH4 (methane) | 4,187,532 | 3,684,874 | 4,135,523 | 3,214,469 | 4,470,307 | |||||||
| - of which CO2 equivalents from venting | 2,390,697 | 2,182,202 | 2,340,021 | 1,033,017 | 2,196,295 | |||||||
| CO2 eq emissions/100% net operated hydrocarbon production | (tons CO2 eq/toe) | 0.254 | 0.235 | 0.235 | 0.206 | 0.225 | ||||||
| CO2 eq emissions/kWh eq (EniPower) | (kg CO2 eq/kWh eq) | 0.402 | 0.410 | 0.407 | 0.410 | 0.399 | ||||||
| CO2 eq emissions/uEDC (R&M) | (tonnes CO2 eq/kbbl/SD) | 1,297 | 1,240 | 1,284 | 1,229 | 1,141 | ||||||
| NOx (nitrogen oxide) emissions | (tonnes NO2 eq) | 112,328 | 110,910 | 106,040 | 97,114 | 115,571 | ||||||
| SOx (sulphur oxide) emissions | (tonnes SO2 eq) | 47,160 | 45,985 | 50,085 | 37,943 | 30,137 | ||||||
| NMVOC (Non-Methane Volatile Organic Compounds) emissions | (tonnes) | 80,856 | 75,318 | 68,490 | 46,228 | 48,702 | ||||||
| TSP (Total Suspended Particulate) emissions | 4,195 | 3,936 | 3,783 | 3,297 | 3,548 | |||||||
| Energy used/net 100% operated hydrocarbon production | (GJ/toe) | 1.418 | 1.676 | 1.855 | 1.958 | 2.049 | ||||||
| Total water withdrawals | (mmcm) | 3,023.32 | 2,839.97 | 2,786.78 | 2,577.22 | 2,357.56 | ||||||
| Total production and/or process water extracted | (mmcm) | 52.93 | 59.67 | 61.15 | 58.16 | 61.17 (a) | ||||||
| - of which re-injected | 14.88 | 23.32 | 27.11 | 25.18 | 20.82 | |||||||
| Total recycled and/or reused water | (mmcm) | 460.93 | 490.22 | 544.63 | 521.76 | 521.46 | ||||||
| Total number of oil spills (b) | (number) | 382 | 308 | 330 | 418 | 771 | ||||||
| Total volume of oil spills (b) | (barrels) | 7,024 | 21,547 | 22,964 | 14,952 | 12,472 | ||||||
| - of which from sabotage and terrorism | 2,286 | 15,288 | 18,695 | 7,657 | 8,616 | |||||||
| - of which from accidents | 4,749 | 6,259 | 4,269 | 7,295 | 3,856 | |||||||
| Waste from production activities | (tonnes) | 1,186,618 | 1,078,839 | 1,400,488 | 1,309,135 | 1,378,351 | ||||||
| Hazardous waste from production activities | 479,828 | 418,120 | 489,108 | 476,552 | 365,668 | |||||||
| Non-hazardous waste from production activities | 706,790 | 660,719 | 911,380 | 832,582 | 1,012,683 | |||||||
| Waste from reclamation activities to be disposed of or recovered/recycled | (tonnes) | 9,199,934 | 10,163,403 | 11,020,439 | 13,869,509 | 16,294,882 | ||||||
| Environmental expenditure and investments | (euro thousand) | 947,605 | 1,230,503 | 916,201 | 893,421 | 743,183 | ||||||
(a) In 2012 the figure include also the amount of produced water injected into deep wells to disposal purpose, equal to 9.43 mmcm.
(b) In the 2010-2011 period only oil spills of more than one barrel are considered for the E&P sector; in 2012 the figure also includes oil spills of less than one barrel (equal to 453, corresponding to 3,684 barrels).
- 13 -
Contents
Eni Fact Book Exploration & Production
Exploration & Production |
Key performance indicators |
2008 | 2009 | 2010 | 2011 | 2012 | ||||||||
| Employees injury frequency rate | (No. of accidents per million of worked hours) | 0.84 | 0.49 | 0.72 | 0.41 | 0.28 | ||||||
| Contractors injury frequency rate | 0.93 | 0.59 | 0.48 | 0.41 | 0.36 | |||||||
| Fatality index | (No. of fatalities per 100 million of worked hours) | 3.54 | 1.77 | 7.90 | 1.83 | 0.81 | ||||||
| Net sales from operations (a) | (euro million) | 33,042 | 23,801 | 29,497 | 29,121 | 35,881 | ||||||
| Operating profit | 16,239 | 9,120 | 13,866 | 15,887 | 18,451 | |||||||
| Adjusted operating profit | 17,166 | 9,489 | 13,898 | 16,075 | 18,518 | |||||||
| Adjusted net profit | 7,862 | 3,881 | 5,609 | 6,865 | 7,425 | |||||||
| Capital expenditure | 9,281 | 9,486 | 9,690 | 9,435 | 10,307 | |||||||
| Adjusted ROACE | (%) | 29.2 | 12.3 | 16.0 | 17.2 | 17.6 | ||||||
| Profit per boe (b) | ($/boe) | 16.00 | 8.14 | 11.91 | 16.98 | 15.95 | ||||||
| Opex per boe (b) | 5.45 | 5.77 | 6.14 | 7.28 | 7.10 | |||||||
| Cash flow per boe (d) | 32.25 | 23.70 | 25.52 | 31.65 | 32.77 | |||||||
| Finding & Development cost (c) (d) | 28.79 | 28.90 | 19.32 | 18.82 | 17.37 | |||||||
| Average hydrocarbons realizations (d) | 68.13 | 46.90 | 55.60 | 72.26 | 73.39 | |||||||
| Production of hydrocarbons (d) (e) | (kboe/d) | 1,797 | 1,769 | 1,815 | 1,581 | 1,701 | ||||||
| Estimated net proved reserves of hydrocarbons (d) (e) | (mmboe) | 6,600 | 6,571 | 6,843 | 7,086 | 7,166 | ||||||
| Reserves life index (d) | (years) | 10.0 | 10.2 | 10.3 | 12.3 | 11.5 | ||||||
| Organic reserves replacement ratio net of updating the natural gas conversion factor (d) | (%) | 130 | 93 | 127 | 143 | 147 | ||||||
| Employees at year end | (units) | 10,236 | 10,271 | 10,276 | 10,425 | 11,304 | ||||||
| of which: outside Italy | 6,182 | 6,388 | 6,370 | 6,628 | 7,371 | |||||||
| Oil spills | (bbl) | 4,738 | 6,259 | 3,820 | 2,930 | 3,093 | ||||||
| Oil spills from sabotage and terrorism | 2,286 | 15,288 | 18,695 | 7,657 | 8,384 | |||||||
| Produced water re-injected | (%) | 28 | 39 | 44 | 43 | 49 | ||||||
| Direct GHG emissions | (mmtonnes CO2 eq) | 33.21 | 29.73 | 31.20 | 23.59 | 28.46 | ||||||
| of which: from flaring | 16.54 | 13.84 | 13.83 | 9.55 | 9.46 | |||||||
| Community investment | (euro million) | 65 | 67 | 72 | 62 | 59 | ||||||
| (a) Before elimination of intragroup sales. (b) Consolidated subsidiaries. (c) Three-year average. (d) Includes Eni’s share of equity-accounted entities. (e) From July 1, 2012, Eni has updated the natural gas conversion factor from 5,550 to 5,492 standard cubic feet of gas per barrel of oil equivalent. The effect of this update on production expressed in boe was 9 kboe/d for the full-year 2012 and on the initial reserves balance as of January 1, 2012 amounted to 40 mmboe. |
| Performance of the year | ||
| I In 2012 employees and contractors injury frequency rate declined by 31.7% and 12.2% compared to the previous year. - Total greenhouse gas emissions increased by 20.6% due to the recovery of activities in Libya. Greenhouse gas emissions from flaring were in line with 2011 (down 0.9%). - Oil spills increased in the full year (up 5.6% from accidents and up 9.5% from sabotage and terrorism) due to force majeure and security issues in Nigeria. - Achieved the best ever levels in re-injection of the produced water with a level of 49%. In particular, the water re-injection project at the Belayim field (Eni’s interest 100%) in Egypt reported a level equal to 99%. | - In 2012 the E&P Division reported a record performance with an adjusted net profit amounting to euro 7,425 million (up 8.2% from 2011) driven by an ongoing production recovery in Libya. - Eni reported oil and natural gas production for the full year of 1,701 kboe/day (up 7% form 2011)1 sustained by the recovery of activities in Libya, the start-up/ramp-up of fields, particularly in Russia and Australia, and higher production in Iraq. - Estimated net proved reserves at December 31, 2012 was aneight-year record at 7.17 bboe based on a reference Brent price of $111 per barrel. The organic reserves replacement ratio was 147%1 with a reserves life index of 11.5 years (12.3 years in 2011). All sources reserves replacement ratio was 107%1. |
(1) Excluding the impact of updating the natural gas conversion rate.
- 14 -
Contents
Eni Fact Book Exploration & Production
| Exploration activity I Full year 2012 was a record for exploration, adding 3.64 bboe of discovered resources, about six times production of the year, increasing Eni’s reserves to best ever levels with rapid time-to-market and cost effectiveness. Eni’s approach in the selective development initiatives, advanced technologies and knowledge management of core basins will be the key to achieve future targets. | Sustainability and portfolio developments I Signed an agreement with CNPC/Petrochina to sell 28.57% of the share capital of our subsidiary Eni East Africa, which currently owns 70% interest in Area 4 in Mozambique, for an agreed price equal to $4,210 million. The deal is subject to approval by relevant authorities. Once finalized, CNPC indirectly acquires, through its 28.57% equity investment in Eni East Africa, a 20% interest in Area 4, while Eni will retain the 50% interest through the remaining controlling stake in Eni East Africa. |
- 15 -
Contents
Eni Fact Book Exploration & Production
Activity areas
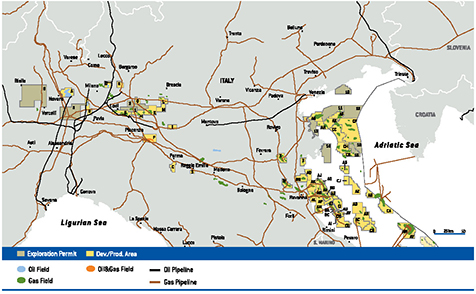
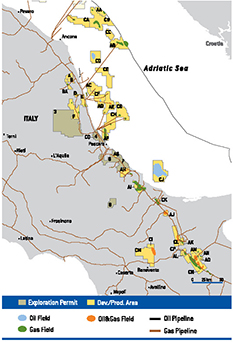
| n Italy Eni has been operating in Italy since 1926. In 2012, Eni’s oil and gas production amounted to 189 kboe/d. Eni’s activities in Italy are deployed in the Adriatic and Ionian Sea, the Central Southern Apennines, mainland and offshore Sicily and the Po Valley, on a total acreage of 22,285 square kilometers (17,556 net to Eni). Eni’s exploration and development activities in Italy are regulated by concession contracts (54 operated onshore and 61 operated offshore). Energy efficiency programs progressed with the application of innovative technologies such as: (i) Organic Rankine Cycle (ORC) technology to increase the efficiency of compression stations with a reduction in CO2 emissions that is expected to be applied to the Fano power station; (ii) the optimization of the LNG refrigeration process, patented by Eni, that increases overall efficiency. Adriatic and Ionian Sea | Development Main development activities concerned: (i) production optimization at the Antonella, Barbara, Basil, Brenda, Naomi & Pandora and Porto Corsini fields; and (ii) upgrading of compression and hydrocarbon treatment facilities at the production platform of the Barbara field. Central-Southern Apennines Sicily |
- 16 -
Contents
Eni Fact Book Exploration & Production
 accounted for approximately 10% of Eni’s production in Italy.
| n Rest of Europe Norway Norwegian Sea Norwegian section of the North Sea |

- 17 -
Contents
Eni Fact Book Exploration & Production
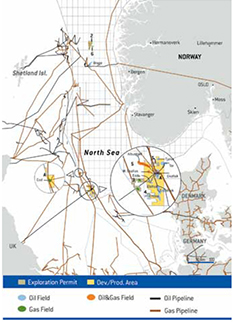 Barents Sea | by a well-advance emergency system for the management of an oil spill, especially in terms of increased resources, organizational innovation, consolidation of the contingency apparatus, as well as equipment development and investment. The Norwegian Authorities acknowledged this project as the reference standard for all future development projects in the Arctic. United Kingdom
|

- 18 -
Contents
Eni Fact Book Exploration & Production
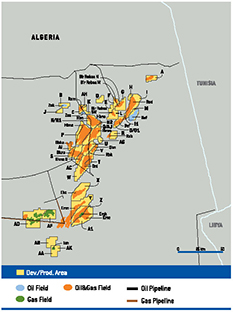
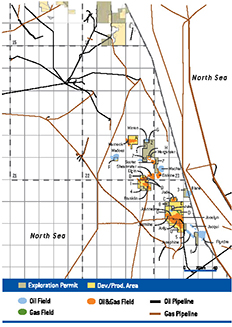 other main fields are Elgin/Franklin, West Franklin (Eni’s interest 21.87%), Liverpool Bay (Eni’s interest 53.9%), J Block Area (Eni’s interest 33%), Flotta Catchment Area (Eni’s interest 20%) and MacCulloch (Eni’s interest 40%), which in 2012 accounted for 91% of Eni’s production in the Country. n North Africa Algeria | Developed and undeveloped acreage of Eni’s interests in Algeria was 3,798 square kilometers (1,232 square kilometers net to Eni). Exploration and production activities in Algeria are regulated by Production Sharing Agreements (PSAs) and concession contracts. Blocks 403a/d and Rom North Blocks 401a/402a Block 403 Block 404
|
- 19 -
Contents
Eni Fact Book Exploration & Production
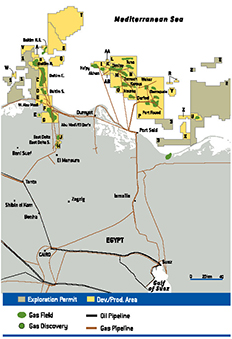
| Block 405b Production In 2013, production started at the MLE field part of the MLE-CAFC integrated project. A natural gas treatment plant started operations with a gross production and export capacity of approximately 320 mmcf/d of gas, 15 kbbl/d of oil and condensates and 12 kbbl/d of LPG. Four export pipelines link it to the national grid system. Development Activities progressed at the CAFC oil project. The project includes the construction of an oil treatment plant and synergies with the MLE production facilities. Production start-up is expected in 2015. The MLE-CAFC integrated project targets a production plateau of approximately 33 kboe/d net to Eni by 2016. Block 208 Egypt
| square kilometers net to Eni). Eni’s main producing liquid fields are located in the Gulf of Suez, primarily the Belayim field (Eni’s interest 100%) and in the Western Desert, mainly the Melehia (Eni’s interest 56%) and the Ras Qattara (Eni’s interest 75%) concessions. Gas production mainly comes from the operated or participated concession of North Port Said (Eni’s interest 100%), El Temsah (Eni’s interest 50%), Baltim (Eni’s interest 50%) and Ras el Barr (Eni’s interest 50%, non operated), located offshore the Nile Delta. In 2012, production from these large concessions accounted for approximately 94% of Eni’s production in Egypt. Exploration and production activities in Egypt are regulated by PSAs. Gulf of Suez Nile Delta Baltim Ras el Barr El Temsah |
- 20 -
Contents
Eni Fact Book Exploration & Production
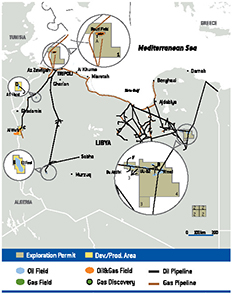
| Natural gas production of this concession is supplied to the Damietta natural gas liquefaction plant owned by Unión Fenosa Gas. Eni, together with other international oil company, have entered into an agreement to supply 310 mmcf/d for 17-year period. Development Infilling and workover activities are being performed in order to maintain the current gas production plateau. Exploration in the Nile Delta Western Desert Libya | Area A Production Located in the Eastern Libyan Desert, it includes six oil fields, started-up in 1984, which are linked to existing facilities at the nearby Bu Attifel field (Area B). In 2012 production from these fields amounted to approximately 11 kbbl/d (approximately 3 kbbl/d net to Eni). Area B Area C Area D
|
- 21 -
Contents
Eni Fact Book Exploration & Production
| oil and condensates. Offshore production is operated through the Sabratha platform located on the Bahr Essalam field where gas and liquids undergo a pre-treatment phase and are delivered via sealine to the Mellitah plant. Most of the natural gas produced is exported to Europe through the GreenStream pipeline. In 2012 volumes delivered through this pipeline were approximately 219 bcf. In addition, approximately 145 bcf were sold on the Libyan market for power generation and approximately 4 bcf to feed the GreenStream compressor station. Area E Tunisia n Sub-Saharan Africa Angola |
In the exploration and development phase, Eni operates Block 15/06 (Eni’s interest 35%). Block 0 |

- 22 -
Contents
Eni Fact Book Exploration & Production
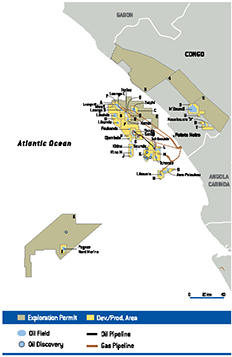
| Block 3 Production Block 3 is divided into three production offshore areas. In 2012, production from this block amounted to approximately 60 kbbl/d (approximately 5 kbbl/d net to Eni). Development Concept Definition studies are underway in the Punja and Caco-Gazela discoveries. Block 14 Block 15 | Block 15/06 Exploration activities yielded positive results with the oil Vandumbu 1 discovery, first commitment well of the second exploration period. The discoveries of Block 15/06 will be developed within two projects: the West Hub project, sanctioned in 2010, and the East Hub. The West Hub project includes the development of the Sangos, N’Goma and Cinguvu discoveries, that will be added in two additional phases of the Mpungi and Vandumbu discoveries, which increases the potential of the hub up to 200 mmbbl. First planned phase (Sangos, N’Goma and Cinguvu) concerned drilling of 14 subsea wells (8 producers and 6 injectors) and linkage to an FPSO unit with a capacity of 100 kbbl/d with start-up expected in the first half of 2014. Two additional phases provides the development of the Mpungi field with the drilling of 7 wells (4 producers and 3 injectors) connected to the FPSO and then the Vandumbu field, under study. Peak production is expected at 84 kbbl/d (25 net to Eni) in 2016. The East Hub project intends to develop the Cabaça North and South-East discoveries with potential resources estimated at more 230 mmbbl. Development activity provides for the drilling of 22 subsea wells and the installation of an FPSO unit with a capacity of 120 kbbl/d. Final investment decision is expected in 2013. Further development phases are planned to start-up nearby discoveries; in particular the significant Lira discoveries. Peak production is expected at approximately 15 kbbl/d net to Eni. The LNG business in Angola Congo |
- 23 -
Contents
Eni Fact Book Exploration & Production
| interest 65%), Kitina (Eni’s interest 35.75%), Awa Paloukou (Eni’s interest 90%), M’Boundi (Eni’s interest 83%), Kouakouala (Eni’s interest 75%), Zingali and Loufika (Eni’s interest 85%) fields, with a production of approximately 77 Kboe/d in the year. Other relevant producing areas are a 35% interest in the Pointe-Noire Grand Fond, PEX and Likouala permits (overall production of 26 kboe/d in 2012). Development Activities on the M’Boundi field moved forward with the application of Eni advanced recovery techniques and a design to monetize associated gas within the activities aimed at zero gas flaring by 2013. Gas is sold under long-term contracts to power plants in the area including the CEC Centrale Electrique du Congo (Eni’s interest 20%) with a 300 MW generation capacity. These facilities will also receive in the future gas from the offshore discoveries of the Marine XII permit. In 2012 M’Boundi contractual supplies were approximately 106 mmcf/d (approximately 17 kboe/d net to Eni). In 2012 the development project for the gas and condensates Litchendjili field in the Block Marine XII has been sanctioned. The project provides for the installation of a production platform, the construction of transport facilities and of an onshore treatment plant. Production will also feed the CEC power station. Other activities in the area concerned the optimization of producing fields of Foukanda and Mwafi by means of Eni’s enhanced recovery that allowed to increase production in both fields. Exploration In the exploration phase, Eni also holds interests in
| the Mer Très Profonde Sud deep offshore block (Eni’s interest 30%), the Noumbi onshore permit (Eni’s interest 37%) and the Marine XII offshore permit. Exploration activities yielded positive results in the offshore block Marine XII with the Nene Marine 1 gas discovery that confirmed the high mineral potential of the area. Ghana Mozambique |
- 24 -
Contents
Eni Fact Book Exploration & Production
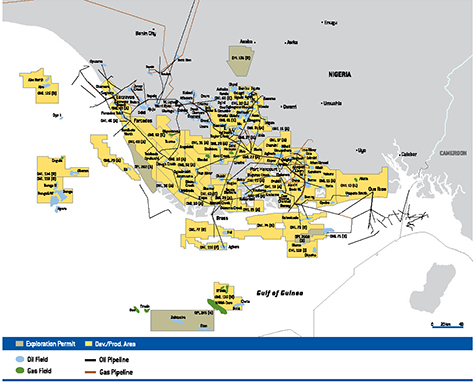
| Authorities. Once finalized, CNPC indirectly acquires, through its 28.57% equity investment in Eni East Africa, a 20% interest in Area 4, while Eni will retain the 50% interest through the remaining controlling stake in Eni East Africa. Feasibility studies are underway to promote some initiatives in the Country such as schooling, health, socio-economic development and the environment. A first program has been launched for the recruitment of 45 recent graduates of the University of Mozambique to spend two years of training in Italy. More recently, in November 2012, a second selection campaign has been launched for a further training initiative to be carried out in 2013. Nigeria | As partners of SPDC JV, the largest joint venture in the Country, Eni also holds a 5% interest in 25 onshore blocks and a 12.86% interest in 5 conventional offshore blocks. In the exploration phase Eni operates offshore Oil Prospecting Leases (OPL) 244 (Eni’s interest 60%), OML 134 (Eni’s interest 85%) and OPL 2009 (Eni’s interest 49%); and onshore OPL 282 (Eni’s interest 90%) and OPL 135 (Eni’s interest 48%). Eni also holds a 12.5% interest in OML 135. Exploration activities yielded positive results in: (i) Block OPL 282 with the Tinpa 1 well containing oil; and (ii) Block OPL 2009 with the Afiando 1 and 2 oil wells. In 2012, Eni completed the divestment of a 5% stake in blocks OMLs 30, 34 and 40 confirming Eni’s strategy of optimizing its producing asset portfolio and selective growth. Starting from March 21, the oil production of the onshore Swamp area mainly in the Bayelsa State in Nigeria has been temporarily shut down due to the increasing bunkering and sabotage acts on the oil trunk lines. Currently, the area produces from 9 fields through 4 flow stations (Ogbainbiri, Tebidaba, Clough Creek, Obama). A detailed survey of the lines affected by the bunkering is in progress in order to identify and repair the damages suffered. As a part of a few Memorandum of Understanding signed with local communities in the Niger Delta, some programs were completed |
- 25 -
Contents
Eni Fact Book Exploration & Production
| aimed at improving access to health and education services, initiatives in agriculture and construction of infrastructure for supporting local development. In particular, the following projects were completed: (i) rehabilitation of nine schools for 25 communities; (ii) eight projects allowing access to drinkable water by means of facilities installed in 13 communities; (iii) fifteen projects for electricity supply. Activities are underway to reach other 22 local communities. Exploration and production activities in Nigeria are regulated mainly by PSAs and concession contracts as well as service contracts, in two blocks, where Eni acts as contractor for the state-owned company. Blocks OMLs 60, 61, 62 and 63 Block OML 118 Block OML 119 Block OML 125 | Block OPL 245 This deep offshore block includes the largest undeveloped mineral resources potential in the Country. Eni’s commitment is for a fast track development of the Zabazaba and Etan fields. Drilling activities started up in 2012. The preliminary development scheme provides for the installation of an FPSO unit and the drilling of 8 wells (4 productive and 4 injections). FID is expected in 2014. SPDC Joint Venture (NASE) The LNG business in Nigeria n Kazakhstan Eni has been present in Kazakhstan since 1992 where the Company co-operates the Karachaganak producing field and is a partner of the consortium of the North Caspian Sea PSA to develop the Kashagan field. Kashagan |
- 26 -
Contents
Eni Fact Book Exploration & Production
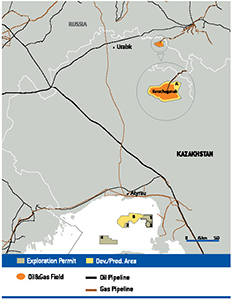 through an operating model which entails an increased role of the Kazakh partner and defines the international parties’ responsibilities in the execution of the subsequent development phases of the project. The North Caspian Operating Company (NCOC) BV, participated by the seven partners of the consortium has taken over the operatorship of the project. Subsequently development, drilling and production activities have been delegated by NCOC BV to the main partners of the Consortium: Eni has retained the responsibility for the development of Phase 1 of the project (the so-called "Experimental Program") and, when sanctioned, the onshore part of Phase 2. | capacity of 150 kbbl/d; by 2014 a second treatment train and compression facilities for gas reinjection will be completed and put online enabling to increase the production capacity up to 370 kbbl/d. The partners are planning to further increase available production capacity up to 450 kbbl/d by installing additional gas compression capacity for re-injection in the reservoir. The partners submitted the scheme of this additional phase to the relevant Kazakh Authorities and sanction is expected in 2013 to start-up with FEED phase. Eni continues its commitment in the protection of the environment and ecosystems in the Caspian area with the integrated program for the management of biodiversity in the Ural Delta (Ural River Park Project - URPP). The project is almost completed and Eni’s aim is to include it in the Man and Biosphere Program of UNESCO under the patronage of the Kazakh Minister for Environmental Protection. Karachaganak |
- 27 -
Contents
Eni Fact Book Exploration & Production
| n Rest of Asia China Indonesia | Development activities are underway at the Indonesia Deepwater Development project (Eni’s interest 20%), located in the East Kalimantan, to ensure gas supplies to the Bontang plant. The project initially provides for the linkage of the Bangka field to existing facilities, then for the integrated development of four fields through a first Hub serving the Gendalo, Gandang, Maha and a second Hub for Gehem. Iraq Pakistan |
- 28 -
Contents
Eni Fact Book Exploration & Production
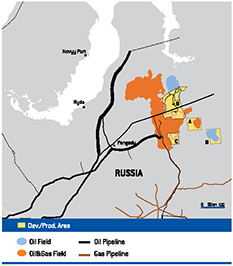
| Russia Eni has been present in Russia since 2007 following the acquisition of assets in the Yukos liquidation procedure. In 2012, Eni’s production averaged 11 kboe/d, mainly of gas. Activities are located in the onshore western Siberia, over a developed and undeveloped acreage of 4,996 square kilometers (1,469 square kilometers net to Eni). The assets in joint venture with Enel (Eni 60%; Enel 40%) are managed by the subholding OOO SeverEnergia (Eni’s interest 29.4%) and own 4 exploration/development blocks located in the Yamal Nenets Region, with significant predominantly gas resources estimated in 1.6 bboe. Production In 2012, production started-up at the Samburgskoye field located in the Yamal-Nenets area, in Siberia, by means of the first and the second train with an expected production level of 95 kboe/d (28 kboe/d net to Eni). Development activities progressed with completion expected in 2015 and production peak of 146 kboe/d (43 kboe/d net to Eni) in 2016. The gas production is sold to Gazprom under the agreement signed in September 2011 while the condensate production is sold to Novatek under the relevant agreement signed in 2012. Eni retains the right to lift its share of natural gas and sell it to any third parties in the domestic market. Development Planned activities progressed at the sanctioned Urengoiskoye field. Start-up is expected in 2014. In June 2012, Eni and the Authority of the Yamal-Nenets Autonomous District signed a Memorandum of Understanding which outlines a plan for implementing joint socio-economic and cultural projects in the area. The agreement includes training initiatives in the Oil&Gas sector, cultural programs and financial support. Exploration In April 2012, Eni and Rosneft signed an agreement related to a strategic cooperation whereby the two companies will set up joint ventures (Eni 33.33%) for the exploration and development of the Fedynsky and Tsentralno-Barentsevsky licenses, located offshore Russia in the Barents Sea, and Zapadno-Cernomorsky, located offshore Russia in the Black Sea. Finalization is expected in 2013.
| Turkmenistan Eni started its activities in Turkmenistan with the purchase of the British company Burren Energy plc in 2008. Activities are focused in the Western part of the Country over a developed area of 200 square kilometers net to Eni, splitted into four development areas. In 2012, Eni’s production averaged 11 kboe/d. Exploration and production activities in Turkmenistan are regulated by PSAs. Production Eni is operator of the Nebit Dag producing block (with a 100% interest). Production derives mainly from the Burun oil field. Oil production is shipped to the Turkmenbashi refinery plant. Eni receives, by means of a swap with the Turkmen Authorities, an equivalent amount of oil at the Okarem terminal, close to the South coast of the Caspian Sea. Eni’s entitlement is sold FOB. Associated natural gas is used for own consumption and gas lift system. The remaining amount is delivered to Turkmenneft, via national grid. n America Ecuador Trinidad & Tobago United States |
- 29 -
Contents
Eni Fact Book Exploration & Production
| Gulf of Mexico Eni holds interests in 281 exploration and production blocks in the conventional and deep-offshore in the Gulf of Mexico, of which 172 are operated by Eni. Production The main fields operated by Eni are Allegheny, Appaloosa and Morpeth (Eni’s interest 100%), Longhorn-Leo, Devils Towers and Triton (Eni’s interest 75%) as well as Pegasus (Eni’s interest 58%). Eni also holds interests in the Medusa (Eni’s interest 25%), Europa (Eni’s interest 32%) and Thunderhawk (Eni’s interest 25%) fields. Development Development activities mainly concerned: (i) drilling activities at the Allegheny, Appaloosa and Devils Towers operated fields; (ii) production optimization of the Front Runner (Eni’s interest 37.5%), Europa, Popeye (Eni’s interest 50%) and Thunderhawk fields; (iii) the start-up of drilling programs at the Hadrian South (Eni’s interest 30%) and St. Malo (Eni’s interest 1.25%) fields. Exploration Exploration outlining activity of the Heidelberg oil discovery (Eni’s interest 12.5%) in the Gulf of Mexico yielded positive results and increased recoverable resources up to approximately 200 mmbbl. Studies are underway for a fast track development. In March 2013, Eni was awarded five offshore blocks, located in Mississippi Canyon and Desoto Canyon. | Texas Production Development activity progressed at the Alliance area (Eni’s interest 27.5%), in the Fort Worth basin in Texas. This area, including gas shale reserves, was acquired following a strategic partnership between Eni and Quicksilver. In particular, 12 new wells entered in production and contributed to a total production of approximately 10 kboe/d net to Eni in the year. Alaska Venezuela |

- 30 -
Contents
Eni Fact Book Exploration & Production
| Belt, over a developed and undeveloped acreage of 2,805 square kilometers (1,066 square kilometers net to Eni). Exploration and production of oil fields are regulated by the terms of the so-called Empresa Mixta. Under the new legal framework, only a company incorporated under the law of Venezuela is entitled to conduct petroleum operations. A stake of at least 60% in the capital of such company is held by an affiliate of the Venezuela state oil company, PDVSA, preferably Corporación Venezuelana de Petróleo (CVP). Production In March 2013, production started up at the giant Junin 5 field (Eni’s interest 40%) with 35 bbbl of certified heavy oil in place, located in the Orinoco oil belt. Early production of the first phase is expected at plateau of 75 kbbl/d in 2015, targeting a long-term production plateau of 240 kbbl/d to be reached by 2018. The project provides also for the construction of a refinery with a capacity of approximately 350 kbbl/d. The drilling activity started during the year. Eni agreed to finance part of PDVSA’s development costs for the early production phase and engineering activity of refinery plant up to $1.74 billion. Eni signed a loan agreement in the fourth quarter 2012. In 2012, the start-up of the Central Production Facility (CPF) at the Corocoro field (Eni’s interest 26%) allowed to achieve a production peak of approximately 42 kbbl/d (approximately 11 kbbl/d net to Eni). Development Venezuelan relevant Authority sanctioned the development plan of the Perla gas discovery, located in the Cardón IV block (Eni’s interest 50%), in the Gulf of Venezuela. PDVSA exercised its 35% back-in right in 2012 and the completion of the stake transfer is expected in 2013. Eni retains the 32.5% joint controlled interest in the company. The early production phase includes the utilization of the already successfully drilled discovery/appraisal wells and the installation of production platforms linked by pipelines to the onshore treatment plant. Target production of approximately 300 mmcf/d is expected in 2015. The development program will continue with the drilling of additional wells and the upgrading of treatment facilities to reach a production plateau of approximately 1,200 mmcf/d. In 2012 the FIDs of the further phases were sanctioned. Exploration Exploration activity mainly concerned the Gulfo de Paria Centrale offshore oil exploration block (Eni’s interest 19.5%), where the Punta Sur oil discovery is located and the Punta Pescador and Gulfo de Paria Ovest (Eni’s interest 40%), the latter coinciding with the Corocoro oil field area. | n Australia and Oceania Australia Block JPDA 06-105 Block WA-33-L Block JPDA 03-13 |
- 31 -
Contents
Eni Fact Book Exploration & Production
| Estimated net proved hydrocarbons reserves by geographic area (a) | (mmboe) |
| (at December 31) | Italy (b) | Rest of Europe | North Africa | Sub-Saharan Africa | Kazakhstan (c) | Rest of Asia (d) | America | Australia and Oceania | Total | |||||||||
| 2008 | ||||||||||||||||||
| Estimated net proved hydrocarbons reserves | 681 | 525 | 1,939 | 1,154 | 1,336 | 579 | 254 | 132 | 6,600 | |||||||||
| Consolidated subsidiaries | 681 | 525 | 1,922 | 1,146 | 1,336 | 265 | 235 | 132 | 6,242 | |||||||||
| Equity-accounted entities | 17 | 8 | 314 | 19 | 358 | |||||||||||||
| Developed | 465 | 417 | 1,242 | 831 | 647 | 212 | 140 | 62 | 4,016 | |||||||||
| Consolidated subsidiaries | 465 | 417 | 1,229 | 827 | 647 | 168 | 133 | 62 | 3,948 | |||||||||
| Equity-accounted entities | 13 | 4 | 44 | 7 | 68 | |||||||||||||
| Undeveloped | 216 | 108 | 697 | 323 | 689 | 367 | 114 | 70 | 2,584 | |||||||||
| Consolidated subsidiaries | 216 | 108 | 693 | 319 | 689 | 97 | 102 | 70 | 2,294 | |||||||||
| Equity-accounted entities | 4 | 4 | 270 | 12 | 290 | |||||||||||||
| 2009 | ||||||||||||||||||
| Estimated net proved hydrocarbons reserves | 703 | 590 | 1,937 | 1,163 | 1,221 | 545 | 279 | 133 | 6,571 | |||||||||
| Consolidated subsidiaries | 703 | 590 | 1,922 | 1,141 | 1,221 | 236 | 263 | 133 | 6,209 | |||||||||
| Equity-accounted entities | 15 | 22 | 309 | 16 | 362 | |||||||||||||
| Developed | 490 | 432 | 1,278 | 804 | 614 | 183 | 181 | 122 | 4,104 | |||||||||
| Consolidated subsidiaries | 490 | 432 | 1,266 | 799 | 614 | 139 | 168 | 122 | 4,030 | |||||||||
| Equity-accounted entities | 12 | 5 | 44 | 13 | 74 | |||||||||||||
| Undeveloped | 213 | 158 | 659 | 359 | 607 | 362 | 98 | 11 | 2,467 | |||||||||
| Consolidated subsidiaries | 213 | 158 | 656 | 342 | 607 | 97 | 95 | 11 | 2,179 | |||||||||
| Equity-accounted entities | 3 | 17 | 265 | 3 | 288 | |||||||||||||
| 2010 | ||||||||||||||||||
| Estimated net proved hydrocarbons reserves | 724 | 601 | 2,119 | 1,161 | 1,126 | 612 | 373 | 127 | 6,843 | |||||||||
| Consolidated subsidiaries | 724 | 601 | 2,096 | 1,133 | 1,126 | 295 | 230 | 127 | 6,332 | |||||||||
| Equity-accounted entities | 23 | 28 | 317 | 143 | 511 | |||||||||||||
| Developed | 554 | 405 | 1,237 | 817 | 543 | 182 | 167 | 117 | 4,022 | |||||||||
| Consolidated subsidiaries | 554 | 405 | 1,215 | 812 | 543 | 139 | 141 | 117 | 3,926 | |||||||||
| Equity-accounted entities | 22 | 5 | 43 | 26 | 96 | |||||||||||||
| Undeveloped | 170 | 196 | 882 | 344 | 583 | 430 | 206 | 10 | 2,821 | |||||||||
| Consolidated subsidiaries | 170 | 196 | 881 | 321 | 583 | 156 | 89 | 10 | 2,406 | |||||||||
| Equity-accounted entities | 1 | 23 | 274 | 117 | 415 | |||||||||||||
| 2011 | ||||||||||||||||||
| Estimated net proved hydrocarbons reserves | 707 | 630 | 2,052 | 1,104 | 950 | 886 | 624 | 133 | 7,086 | |||||||||
| Consolidated subsidiaries | 707 | 630 | 2,031 | 1,021 | 950 | 230 | 238 | 133 | 5,940 | |||||||||
| Equity-accounted entities | 21 | 83 | 656 | 386 | 1,146 | |||||||||||||
| Developed | 540 | 374 | 1,194 | 746 | 482 | 134 | 188 | 112 | 3,770 | |||||||||
| Consolidated subsidiaries | 540 | 374 | 1,175 | 742 | 482 | 129 | 162 | 112 | 3,716 | |||||||||
| Equity-accounted entities | 19 | 4 | 5 | 26 | 54 | |||||||||||||
| Undeveloped | 167 | 256 | 858 | 358 | 468 | 752 | 436 | 21 | 3,316 | |||||||||
| Consolidated subsidiaries | 167 | 256 | 856 | 279 | 468 | 101 | 76 | 21 | 2,224 | |||||||||
| Equity-accounted entities | 2 | 79 | 651 | 360 | 1,092 | |||||||||||||
| 2012 | ||||||||||||||||||
| Estimated net proved hydrocarbons reserves | 524 | 591 | 1,935 | 1,129 | 1,041 | 852 | 966 | 128 | 7,166 | |||||||||
| Consolidated subsidiaries | 524 | 591 | 1,915 | 1,048 | 1,041 | 184 | 236 | 128 | 5,667 | |||||||||
| Equity-accounted entities | 20 | 81 | 668 | 730 | 1,499 | |||||||||||||
| Developed | 406 | 349 | 1,100 | 716 | 458 | 190 | 190 | 107 | 3,516 | |||||||||
| Consolidated subsidiaries | 406 | 349 | 1,080 | 716 | 458 | 108 | 170 | 107 | 3,394 | |||||||||
| Equity-accounted entities | 20 | 82 | 20 | 122 | ||||||||||||||
| Undeveloped | 118 | 242 | 835 | 413 | 583 | 662 | 776 | 21 | 3,650 | |||||||||
| Consolidated subsidiaries | 118 | 242 | 835 | 332 | 583 | 76 | 66 | 21 | 2,273 | |||||||||
| Equity-accounted entities | 81 | 586 | 710 | 1,377 | ||||||||||||||
(a) From July 1, 2012, Eni has updated the natural gas conversion factor from 5,550 to 5,492 standard cubic feet of gas per barrel of oil equivalent.
(b) Including approximately, 749, 746, 769, 767 and 767 billion of cubic feet of natural gas held in storage at December 31, 2007, 2008, 2009, 2010 and 2011, respectively.
(c) Eni’s proved reserves of the Karachaganak field were determined based on Eni working interest of 29.25% at December 31, 2012 and 32.5% in the previous years.
(d) Includes a 29.4% stake of the reserves of the three equity-accounted Russian companies participated by joint-venture OOO SeverEnergia, owned by Eni (60%) and its Italian partner Enel (40%) which on September 23, 2009, completed the divestment of the 51% stake in the venture to Gazprom in line with the call option arrangement.
- 32 -
Contents
Eni Fact Book Exploration & Production
| Estimated net proved liquids reserves by geographic area | (mmbbl) |
| (at December 31) | Italy | Rest of Europe | North Africa | Sub-Saharan Africa | Kazakhstan (a) | Rest of Asia (b) | America | Australia and Oceania | Total | |||||||||
| 2008 | ||||||||||||||||||
| Estimated net proved liquids reserves | 186 | 277 | 837 | 791 | 911 | 157 | 150 | 26 | 3,335 | |||||||||
| Consolidated subsidiaries | 186 | 277 | 823 | 783 | 911 | 106 | 131 | 26 | 3,243 | |||||||||
| Equity-accounted entities | 14 | 8 | 51 | 19 | 92 | |||||||||||||
| Developed | 111 | 222 | 624 | 580 | 298 | 97 | 81 | 23 | 2,036 | |||||||||
| Consolidated subsidiaries | 111 | 222 | 613 | 576 | 298 | 92 | 74 | 23 | 2,009 | |||||||||
| Equity-accounted entities | 11 | 4 | 5 | 7 | 27 | |||||||||||||
| Undeveloped | 75 | 55 | 213 | 211 | 613 | 60 | 69 | 3 | 1,299 | |||||||||
| Consolidated subsidiaries | 75 | 55 | 210 | 207 | 613 | 14 | 57 | 3 | 1,234 | |||||||||
| Equity-accounted entities | 3 | 4 | 46 | 12 | 65 | |||||||||||||
| 2009 | ||||||||||||||||||
| Estimated net proved liquids reserves | 233 | 351 | 908 | 777 | 849 | 144 | 169 | 32 | 3,463 | |||||||||
| Consolidated subsidiaries | 233 | 351 | 895 | 770 | 849 | 94 | 153 | 32 | 3,377 | |||||||||
| Equity-accounted entities | 13 | 7 | 50 | 16 | 86 | |||||||||||||
| Developed | 141 | 218 | 669 | 548 | 291 | 52 | 93 | 23 | 2,035 | |||||||||
| Consolidated subsidiaries | 141 | 218 | 659 | 544 | 291 | 45 | 80 | 23 | 2,001 | |||||||||
| Equity-accounted entities | 10 | 4 | 7 | 13 | 34 | |||||||||||||
| Undeveloped | 92 | 133 | 239 | 229 | 558 | 92 | 76 | 9 | 1,428 | |||||||||
| Consolidated subsidiaries | 92 | 133 | 236 | 226 | 558 | 49 | 73 | 9 | 1,376 | |||||||||
| Equity-accounted entities | 3 | 3 | 43 | 3 | 52 | |||||||||||||
| 2010 | ||||||||||||||||||
| Estimated net proved liquids reserves | 248 | 349 | 997 | 756 | 788 | 183 | 273 | 29 | 3,623 | |||||||||
| Consolidated subsidiaries | 248 | 349 | 978 | 750 | 788 | 139 | 134 | 29 | 3,415 | |||||||||
| Equity-accounted entities | 19 | 6 | 44 | 139 | 208 | |||||||||||||
| Developed | 183 | 207 | 674 | 537 | 251 | 44 | 87 | 20 | 2,003 | |||||||||
| Consolidated subsidiaries | 183 | 207 | 656 | 533 | 251 | 39 | 62 | 20 | 1,951 | |||||||||
| Equity-accounted entities | 18 | 4 | 5 | 25 | 52 | |||||||||||||
| Undeveloped | 65 | 142 | 323 | 219 | 537 | 139 | 186 | 9 | 1,620 | |||||||||
| Consolidated subsidiaries | 65 | 142 | 322 | 217 | 537 | 100 | 72 | 9 | 1,464 | |||||||||
| Equity-accounted entities | 1 | 2 | 39 | 114 | 156 | |||||||||||||
| 2011 | ||||||||||||||||||
| Estimated net proved liquids reserves | 259 | 372 | 934 | 692 | 653 | 216 | 283 | 25 | 3,434 | |||||||||
| Consolidated subsidiaries | 259 | 372 | 917 | 670 | 653 | 106 | 132 | 25 | 3,134 | |||||||||
| Equity-accounted entities | 17 | 22 | 110 | 151 | 300 | |||||||||||||
| Developed | 184 | 195 | 638 | 487 | 215 | 34 | 117 | 25 | 1,895 | |||||||||
| Consolidated subsidiaries | 184 | 195 | 622 | 483 | 215 | 34 | 92 | 25 | 1,850 | |||||||||
| Equity-accounted entities | 16 | 4 | 25 | 45 | ||||||||||||||
| Undeveloped | 75 | 177 | 296 | 205 | 438 | 182 | 166 | 1,539 | ||||||||||
| Consolidated subsidiaries | 75 | 177 | 295 | 187 | 438 | 72 | 40 | 1,284 | ||||||||||
| Equity-accounted entities | 1 | 18 | 110 | 126 | 255 | |||||||||||||
| 2012 | ||||||||||||||||||
| Estimated net proved liquids reserves | 227 | 351 | 921 | 688 | 670 | 196 | 273 | 24 | 3,350 | |||||||||
| Consolidated subsidiaries | 227 | 351 | 904 | 672 | 670 | 82 | 154 | 24 | 3,084 | |||||||||
| Equity-accounted entities | 17 | 16 | 114 | 119 | 266 | |||||||||||||
| Developed | 165 | 180 | 601 | 456 | 203 | 49 | 128 | 24 | 1,806 | |||||||||
| Consolidated subsidiaries | 165 | 180 | 584 | 456 | 203 | 41 | 109 | 24 | 1,762 | |||||||||
| Equity-accounted entities | 17 | 8 | 19 | 44 | ||||||||||||||
| Undeveloped | 62 | 171 | 320 | 232 | 467 | 147 | 145 | 1,544 | ||||||||||
| Consolidated subsidiaries | 62 | 171 | 320 | 216 | 467 | 41 | 45 | 1,322 | ||||||||||
| Equity-accounted entities | 16 | 106 | 100 | 222 | ||||||||||||||
(a) Eni’s proved reserves of the Karachaganak field were determined based on Eni working interest of 29.25% at December 31, 2012 and 32.5% in the previous years.
(b) Includes a 29.4% stake of the reserves of the three equity-accounted Russian companies participated by joint-venture OOO SeverEnergia, owned by Eni (60%) and its Italian partner Enel (40%) which on September 23, 2009, completed the divestment of the 51% stake in the venture to Gazprom in line with the call option arrangement.
i- 33 -
Contents
Eni Fact Book Exploration & Production
| Estimated net proved natural gas reserves by geographic area | (bcf) |
| (at December 31) | Italy (a) | Rest of Europe | North Africa | Sub-Saharan Africa | Kazakhstan (b) | Rest of Asia (c) | America | Australia and Oceania | Total | |||||||||
| 2008 | ||||||||||||||||||
| Estimated net proved natural gas reserves | 2,844 | 1,421 | 6,324 | 2,086 | 2,437 | 2,430 | 600 | 606 | 18,748 | |||||||||
| Consolidated subsidiaries | 2,844 | 1,421 | 6,311 | 2,084 | 2,437 | 911 | 600 | 606 | 17,214 | |||||||||
| Equity-accounted entities | 13 | 2 | 1,519 | 1,534 | ||||||||||||||
| Developed | 2,031 | 1,122 | 3,548 | 1,444 | 2,005 | 657 | 340 | 221 | 11,368 | |||||||||
| Consolidated subsidiaries | 2,031 | 1,122 | 3,537 | 1,443 | 2,005 | 439 | 340 | 221 | 11,138 | |||||||||
| Equity-accounted entities | 11 | 1 | 218 | 230 | ||||||||||||||
| Undeveloped | 813 | 299 | 2,776 | 642 | 432 | 1,773 | 260 | 385 | 7,380 | |||||||||
| Consolidated subsidiaries | 813 | 299 | 2,774 | 641 | 432 | 472 | 260 | 385 | 6,076 | |||||||||
| Equity-accounted entities | 2 | 1 | 1,301 | 1,304 | ||||||||||||||
| 2009 | ||||||||||||||||||
| Estimated net proved natural gas reserves | 2,704 | 1,380 | 5,908 | 2,212 | 2,139 | 2,301 | 631 | 575 | 17,850 | |||||||||
| Consolidated subsidiaries | 2,704 | 1,380 | 5,894 | 2,127 | 2,139 | 814 | 629 | 575 | 16,262 | |||||||||
| Equity-accounted entities | 14 | 85 | 1,487 | 2 | 1,588 | |||||||||||||
| Developed | 2,001 | 1,231 | 3,498 | 1,468 | 1,859 | 756 | 506 | 565 | 11,884 | |||||||||
| Consolidated subsidiaries | 2,001 | 1,231 | 3,486 | 1,463 | 1,859 | 539 | 506 | 565 | 11,650 | |||||||||
| Equity-accounted entities | 12 | 5 | 217 | 234 | ||||||||||||||
| Undeveloped | 703 | 149 | 2,410 | 744 | 280 | 1,545 | 125 | 10 | 5,966 | |||||||||
| Consolidated subsidiaries | 703 | 149 | 2,408 | 664 | 280 | 275 | 123 | 10 | 4,612 | |||||||||
| Equity-accounted entities | 2 | 80 | 1,270 | 2 | 1,354 | |||||||||||||
| 2010 | ||||||||||||||||||
| Estimated net proved natural gas reserves | 2,644 | 1,401 | 6,231 | 2,245 | 1,874 | 2,391 | 552 | 544 | 17,882 | |||||||||
| Consolidated subsidiaries | 2,644 | 1,401 | 6,207 | 2,127 | 1,874 | 871 | 530 | 544 | 16,198 | |||||||||
| Equity-accounted entities | 24 | 118 | 1,520 | 22 | 1,684 | |||||||||||||
| Developed | 2,061 | 1,103 | 3,122 | 1,554 | 1,621 | 774 | 437 | 539 | 11,211 | |||||||||
| Consolidated subsidiaries | 2,061 | 1,103 | 3,100 | 1,550 | 1,621 | 560 | 431 | 539 | 10,965 | |||||||||
| Equity-accounted entities | 22 | 4 | 214 | 6 | 246 | |||||||||||||
| Undeveloped | 583 | 298 | 3,109 | 691 | 253 | 1,617 | 115 | 5 | 6,671 | |||||||||
| Consolidated subsidiaries | 583 | 298 | 3,107 | 577 | 253 | 311 | 99 | 5 | 5,233 | |||||||||
| Equity-accounted entities | 2 | 114 | 1,306 | 16 | 1,438 | |||||||||||||
| 2011 | ||||||||||||||||||
| Estimated net proved natural gas reserves | 2,491 | 1,427 | 6,210 | 2,287 | 1,648 | 3,718 | 1,897 | 604 | 20,282 | |||||||||
| Consolidated subsidiaries | 2,491 | 1,425 | 6,190 | 1,949 | 1,648 | 685 | 590 | 604 | 15,582 | |||||||||
| Equity-accounted entities | 2 | 20 | 338 | 3,033 | 1,307 | 4,700 | ||||||||||||
| Developed | 1,977 | 995 | 3,087 | 1,441 | 1,480 | 552 | 393 | 491 | 10,416 | |||||||||
| Consolidated subsidiaries | 1,977 | 995 | 3,070 | 1,437 | 1,480 | 528 | 385 | 491 | 10,363 | |||||||||
| Equity-accounted entities | 17 | 4 | 24 | 8 | 53 | |||||||||||||
| Undeveloped | 514 | 432 | 3,123 | 846 | 168 | 3,166 | 1,504 | 113 | 9,866 | |||||||||
| Consolidated subsidiaries | 514 | 430 | 3,120 | 512 | 168 | 157 | 205 | 113 | 5,219 | |||||||||
| Equity-accounted entities | 2 | 3 | 334 | 3,009 | 1,299 | 4,647 | ||||||||||||
| 2012 | ||||||||||||||||||
| Estimated net proved natural gas reserves | 1,633 | 1,317 | 5,574 | 2,414 | 2,038 | 3,605 | 3,804 | 572 | 20,957 | |||||||||
| Consolidated subsidiaries | 1,633 | 1,317 | 5,558 | 2,061 | 2,038 | 562 | 449 | 572 | 14,190 | |||||||||
| Equity-accounted entities | 16 | 353 | 3,043 | 3,355 | 6,767 | |||||||||||||
| Developed | 1,325 | 925 | 2,736 | 1,429 | 1,401 | 774 | 340 | 459 | 9,389 | |||||||||
| Consolidated subsidiaries | 1,325 | 925 | 2,720 | 1,429 | 1,401 | 372 | 334 | 459 | 8,965 | |||||||||
| Equity-accounted entities | 16 | 402 | 6 | 424 | ||||||||||||||
| Undeveloped | 308 | 392 | 2,838 | 985 | 637 | 2,831 | 3,464 | 113 | 11,568 | |||||||||
| Consolidated subsidiaries | 308 | 392 | 2,838 | 632 | 637 | 190 | 115 | 113 | 5,225 | |||||||||
| Equity-accounted entities | 353 | 2,641 | 3,349 | 6,343 | ||||||||||||||
(a) Including approximately, 749, 746, 769, 767 and 767 billion of cubic feet of natural gas held in storage at December 31, 2007, 2008, 2009, 2010 and 2011, respectively.
(b) Eni’s proved reserves of the Karachaganak field were determined based on Eni working interest of 29.25% at December 31, 2012 and 32.5% in the previous years.
(c) Includes a 29.4% stake of the reserves of the three equity-accounted Russian companies participated by joint-venture OOO SeverEnergia, owned by Eni (60%) and its Italian partner Enel (40%) which on September 23, 2009, completed the divestment of the 51% stake in the venture to Gazprom in line with the call option arrangement.
- 34 -
Contents
Eni Fact Book Exploration & Production
Production of oil and natural gas by Country (a) (b) | (kboe/d) | 2008 | 2009 | 2010 | 2011 | 2012 |
| Italy | 199 | 169 | 183 | 186 | 189 | |||||||
| Rest of Europe | 249 | 247 | 222 | 216 | 178 | |||||||
| Croatia | 12 | 17 | 8 | 5 | 5 | |||||||
| Norway | 129 | 126 | 123 | 131 | 126 | |||||||
| United Kingdom | 108 | 104 | 91 | 80 | 47 | |||||||
| North Africa | 645 | 573 | 602 | 438 | 586 | |||||||
| Algeria | 83 | 83 | 77 | 72 | 78 | |||||||
| Egypt | 240 | 230 | 232 | 236 | 235 | |||||||
| Libya | 306 | 244 | 273 | 112 | 258 | |||||||
| Tunisia | 16 | 16 | 20 | 18 | 15 | |||||||
| Sub-Saharan Africa | 335 | 360 | 400 | 370 | 345 | |||||||
| Angola | 126 | 130 | 118 | 102 | 87 | |||||||
| Congo | 87 | 102 | 110 | 108 | 104 | |||||||
| Nigeria | 122 | 128 | 172 | 160 | 154 | |||||||
| Kazakhstan | 111 | 115 | 108 | 106 | 102 | |||||||
| Rest of Asia | 124 | 135 | 131 | 112 | 129 | |||||||
| China | 8 | 8 | 7 | 8 | 9 | |||||||
| India | 1 | 8 | 4 | 2 | ||||||||
| Indonesia | 20 | 21 | 19 | 18 | 18 | |||||||
| Iran | 28 | 35 | 21 | 6 | 3 | |||||||
| Iraq | 5 | 7 | 18 | |||||||||
| Pakistan | 56 | 58 | 59 | 58 | 57 | |||||||
| Russia | 11 | |||||||||||
| Turkmenistan | 12 | 12 | 12 | 11 | 11 | |||||||
| America | 117 | 153 | 143 | 125 | 135 | |||||||
| Brazil | 1 | 2 | ||||||||||
| Ecuador | 16 | 14 | 11 | 7 | 25 | |||||||
| Trinidad & Tobago | 9 | 12 | 12 | 10 | 11 | |||||||
| United States | 87 | 119 | 109 | 98 | 88 | |||||||
| Venezuela | 5 | 8 | 11 | 9 | 9 | |||||||
| Australia and Oceania | 17 | 17 | 26 | 28 | 37 | |||||||
| Australia | 17 | 17 | 26 | 28 | 37 | |||||||
| Total outside Italy | 1,598 | 1,600 | 1,632 | 1,395 | 1,512 | |||||||
1,797 | 1,769 | 1,815 | 1,581 | 1,701 | ||||||||
| of which equity-accounted entities | 20 | 23 | 25 | 26 | 35 | |||||||
| Angola | 3 | 3 | 3 | 4 | 2 | |||||||
| Brazil | 1 | 2 | ||||||||||
| Indonesia | 6 | 6 | 6 | 6 | 6 | |||||||
| Russia | 11 | |||||||||||
| Tunisia | 6 | 6 | 5 | 6 | 5 | |||||||
| Venezuela | 5 | 8 | 11 | 9 | 9 |
Oil and natural gas production sold (a) | (mmboe) | 2008 | 2009 | 2010 | 2011 | 2012 |
| Oil and natural gas production | 657.5 | 645.7 | 662.3 | 577.0 | 622.6 | ||||||||||||
| Change in inventories other | (7.6 | ) | (3.8 | ) | (3.4 | ) | (7.4 | ) | 1.6 | ||||||||
| Own consumption of gas | (17.9 | ) | (19.1 | ) | (20.9 | ) | (21.1 | ) | (25.5 | ) | |||||||
| Oil and natural gas production sold (c) | 632.0 | 622.8 | 638.0 | 548.5 | 598.7 | ||||||||||||
| Oil | (mmbbl) | 370.24 | 365.20 | 361.30 | 302.61 | 325.41 | |||||||||||
| - of which to R&M Division | 194.64 | 224.98 | 206.41 | 190.65 | 185.48 | ||||||||||||
| Natural gas | (bcf) | 1,503 | 1,479 | 1,536 | 1,367 | 1,501 | |||||||||||
| - of which to G&P Division | 480 | 444 | 432 | 423 | 435 | ||||||||||||
(a) From July 1, 2012, Eni has updated the natural gas conversion factor from 5,550 to 5,492 standard cubic feet of gas per barrel of oil equivalent.
(b) Includes volumes of gas consumed in operations (383, 321, 318, 300 and 281 mmcf/d, in 2012, 2011, 2010, 2009 and 2008, respectively).
(c) Includes 11.2 mmboe of equity-accounted entities production sold in 2012 (7.7, 8, 7.1 and 5.7 mmboe in 2011, 2010, 2009 and 2008, respectively).
- 35 -
Contents
Eni Fact Book Exploration & Production
Liquids production by Country | (kbbl/d) | 2008 | 2009 | 2010 | 2011 | 2012 |
| Italy | 68 | 56 | 61 | 64 | 63 | |||||||
| Rest of Europe | 140 | 133 | 121 | 120 | 95 | |||||||
| Norway | 83 | 78 | 74 | 80 | 74 | |||||||
| United Kingdom | 57 | 55 | 47 | 40 | 21 | |||||||
| North Africa | 338 | 292 | 301 | 209 | 271 | |||||||
| Algeria | 80 | 80 | 74 | 69 | 71 | |||||||
| Egypt | 98 | 91 | 96 | 91 | 88 | |||||||
| Libya | 147 | 108 | 116 | 36 | 101 | |||||||
| Tunisia | 13 | 13 | 15 | 13 | 11 | |||||||
| Sub-Saharan Africa | 289 | 312 | 321 | 278 | 247 | |||||||
| Angola | 121 | 125 | 113 | 95 | 80 | |||||||
| Congo | 84 | 97 | 98 | 87 | 82 | |||||||
| Nigeria | 84 | 90 | 110 | 96 | 85 | |||||||
| Kazakhstan | 69 | 70 | 65 | 64 | 61 | |||||||
| Rest of Asia | 49 | 57 | 48 | 34 | 44 | |||||||
| China | 6 | 7 | 6 | 7 | 8 | |||||||
| India | 1 | |||||||||||
| Indonesia | 2 | 2 | 2 | 2 | 2 | |||||||
| Iran | 28 | 35 | 21 | 6 | 3 | |||||||
| Iraq | 5 | 7 | 18 | |||||||||
| Pakistan | 1 | 1 | 1 | 1 | 1 | |||||||
| Russia | 2 | |||||||||||
| Turkmenistan | 12 | 12 | 12 | 11 | 10 | |||||||
| America | 63 | 79 | 71 | 65 | 83 | |||||||
| Brazil | 1 | 2 | ||||||||||
| Ecuador | 16 | 14 | 11 | 7 | 25 | |||||||
| United States | 42 | 57 | 49 | 48 | 47 | |||||||
| Venezuela | 5 | 8 | 11 | 9 | 9 | |||||||
| Australia and Oceania | 10 | 8 | 9 | 11 | 18 | |||||||
| Australia | 10 | 8 | 9 | 11 | 18 | |||||||
| Total outside Italy | 958 | 951 | 936 | 781 | 819 | |||||||
1,026 | 1,007 | 997 | 845 | 882 | ||||||||
| of which equity-accounted entities | 14 | 17 | 19 | 19 | 20 | |||||||
| Angola | 3 | 3 | 3 | 3 | 2 | |||||||
| Brazil | 1 | 2 | ||||||||||
| Indonesia | 1 | 1 | 1 | 1 | 1 | |||||||
| Russia | 2 | |||||||||||
| Tunisia | 5 | 5 | 4 | 5 | 4 | |||||||
| Venezuela | 5 | 8 | 11 | 9 | 9 |
Oil and natural gas production available for sale (a) (b) | (kboe/d) | 2008 | 2009 | 2010 | 2011 | 2012 |
| Italy | 195 | 165 | 178 | 181 | 184 | |||||||
| Rest of Europe | 242 | 239 | 214 | 209 | 171 | |||||||
| North Africa | 627 | 554 | 582 | 420 | 561 | |||||||
| Sub-Saharan Africa | 325 | 349 | 386 | 354 | 327 | |||||||
| Kazakhstan | 108 | 113 | 104 | 102 | 98 | |||||||
| Rest of Asia | 119 | 130 | 126 | 106 | 121 | |||||||
| America | 116 | 150 | 141 | 124 | 133 | |||||||
| Australia and Oceania | 16 | 16 | 26 | 27 | 36 | |||||||
1,748 | 1,716 | 1,757 | 1,523 | 1,631 | ||||||||
| of which equity-accounted entities | 19 | 21 | 23 | 23 | 33 | |||||||
| North Africa | 5 | 5 | 5 | 5 | 5 | |||||||
| Sub-Saharan Africa | 3 | 3 | 3 | 3 | 2 | |||||||
| Rest of Asia | 6 | 5 | 5 | 4 | 15 | |||||||
| America | 5 | 8 | 10 | 11 | 11 |
(a) From July 1, 2012, Eni has updated the natural gas conversion factor from 5,550 to 5,492 standard cubic feet of gas per barrel of oil equivalent.
(b) Do not include natural gas consumed in operation.
| - 36 - |
Contents
Eni Fact Book Exploration & Production
Natural gas production by Country (a) | (mmcf/d) | 2008 | 2009 | 2010 | 2011 | 2012 |
| Italy | 749.9 | 652.6 | 673.2 | 674.3 | 695.1 | |||||||
| Rest of Europe | 626.7 | 655.5 | 559.2 | 537.9 | 458.9 | |||||||
| Croatia | 68.7 | 95.5 | 45.3 | 29.9 | 25.4 | |||||||
| Norway | 264.8 | 273.7 | 271.6 | 284.0 | 289.6 | |||||||
| Ukraine | 0.5 | |||||||||||
| United Kingdom | 293.2 | 286.3 | 242.3 | 224.0 | 143.4 | |||||||
| North Africa | 1,761.6 | 1,614.2 | 1,673.2 | 1,271.5 | 1,733.5 | |||||||
| Algeria | 18.5 | 19.7 | 20.2 | 19.0 | 40.1 | |||||||
| Egypt | 818.4 | 793.7 | 755.1 | 800.7 | 805.9 | |||||||
| Libya | 907.6 | 780.4 | 871.1 | 423.2 | 863.5 | |||||||
| Tunisia | 17.1 | 20.4 | 26.8 | 28.6 | 24.0 | |||||||
| Sub-Saharan Africa | 260.7 | 274.3 | 441.5 | 508.0 | 538.7 | |||||||
| Angola | 28.1 | 29.3 | 31.9 | 34.7 | 39.2 | |||||||
| Congo | 12.7 | 27.3 | 67.9 | 119.1 | 120.5 | |||||||
| Nigeria | 219.9 | 217.7 | 341.7 | 354.2 | 379.0 | |||||||
| Kazakhstan | 244.7 | 259.0 | 237.0 | 231.0 | 221.7 | |||||||
| Rest of Asia | 426.2 | 444.8 | 463.9 | 430.1 | 468.5 | |||||||
| China | 10.9 | 8.2 | 6.7 | 5.0 | 4.4 | |||||||
| India | 3.7 | 36.6 | 19.6 | 10.5 | ||||||||
| Indonesia | 99.7 | 104.8 | 94.4 | 84.3 | 84.9 | |||||||
| Pakistan | 315.6 | 328.1 | 326.2 | 321.2 | 310.4 | |||||||
| Russia | 52.4 | |||||||||||
| Turkmenistan | 5.9 | |||||||||||
| America | 311.5 | 424.7 | 396.0 | 334.0 | 283.5 | |||||||
| Trinidad & Tobago | 54.6 | 67.0 | 63.6 | 56.7 | 58.5 | |||||||
| United States | 256.9 | 357.7 | 332.4 | 277.3 | 225.0 | |||||||
| Australia and Oceania | 42.2 | 48.6 | 95.7 | 97.8 | 100.8 | |||||||
| Australia | 42.2 | 48.6 | 95.7 | 97.8 | 100.8 | |||||||
| Total outside Italy | 3,673.6 | 3,721.1 | 3,866.5 | 3,410.3 | 3,805.6 | |||||||
4,423.5 | 4,373.7 | 4,539.7 | 4,084.6 | 4,500.7 | ||||||||
| of which equity-accounted entities | 35.6 | 38.3 | 35.6 | 34.0 | 88.6 | |||||||
| Angola | 0.6 | 0.7 | 0.8 | 1.9 | 4.4 | |||||||
| Indonesia | 30.5 | 32.1 | 28.9 | 25.7 | 26.0 | |||||||
| Russia | 52.4 | |||||||||||
| Tunisia | 4.5 | 5.5 | 5.9 | 6.4 | 5.3 | |||||||
| Ukraine | 0.5 |
Natural gas production available for sale (b) | (mmcf/d) | 2008 | 2009 | 2010 | 2011 | 2012 |
| Italy | 725 | 630 | 648 | 648 | 667 | |||||||
| Rest of Europe | 588 | 608 | 517 | 498 | 421 | |||||||
| North Africa | 1,661 | 1,503 | 1,559 | 1,169 | 1,592 | |||||||
| Sub-Saharan Africa | 204 | 213 | 365 | 422 | 444 | |||||||
| Kazakhstan | 227 | 241 | 221 | 212 | 202 | |||||||
| Rest of Asia | 396 | 417 | 436 | 398 | 423 | |||||||
| America | 304 | 416 | 385 | 323 | 273 | |||||||
| Australia and Oceania | 38 | 46 | 91 | 93 | 96 | |||||||
4,143 | 4,074 | 4,222 | 3,763 | 4,118 | ||||||||
| of which equity-accounted entities | 25 | 29 | 27 | 24 | 71 | |||||||
| North Africa | 1 | 3 | 3 | 4 | 3 | |||||||
| Rest of Asia | 24 | 26 | 24 | 20 | 68 |
(a) From July 1, 2012, Eni has updated the natural gas conversion factor from 5,550 to 5,492 standard cubic feet of gas per barrel of oil equivalent.
(b) Do not include natural gas consumed in operation.
| - 37 - |
Contents
Eni Fact Book Exploration & Production
| Average realizations | 2008 | 2009 | 2010 | 2011 | 2012 |
| Consolidated subsidiaries | Equity- accounted entities | Consolidated subsidiaries | Equity- accounted entities | Consolidated subsidiaries | Equity- accounted entities | Consolidated subsidiaries | Equity- accounted entities | Consolidated subsidiaries | Equity- accounted entities | |||||||||||
| Liquids | ||||||||||||||||||||
| ($/bbl) |
| Italy | 84.87 | 56.02 | 72.19 | 101.20 | 100.52 | |||||||||||||||
| Rest of Europe | 71.90 | 56.46 | 67.26 | 97.56 | 97.18 | 100.67 | 93.11 | |||||||||||||
| North Africa | 85.38 | 14.70 | 56.42 | 14.60 | 70.96 | 16.09 | 97.63 | 17.98 | 103.63 | 17.93 | ||||||||||
| Sub-Saharan Africa | 91.58 | 98.40 | 59.75 | 56.85 | 78.23 | 77.78 | 110.09 | 108.92 | 108.34 | 112.28 | ||||||||||
| Kazakhstan | 79.06 | 52.34 | 66.74 | 98.68 | 102.25 | |||||||||||||||
| Rest of Asia | 75.29 | 55.34 | 9.01 | 75.20 | 57.05 | 101.09 | 74.98 | 103.44 | 40.36 | |||||||||||
| America | 88.88 | 86.42 | 55.66 | 56.41 | 72.84 | 71.70 | 101.15 | 93.03 | 85.94 | 93.45 | ||||||||||
| Australia and Oceania | 82.80 | 50.40 | 73.00 | 98.05 | 102.06 | |||||||||||||||
| 84.31 | 56.04 | 57.02 | 44.43 | 72.95 | 58.86 | 102.47 | 84.78 | 103.06 | 77.94 | |||||||||||
| Natural gas | ||||||||||||||||||||
| ($/kcf) | ||||||||||||||||||||
| Italy | 13.06 | 9.01 | 8.71 | 11.56 | 10.68 | |||||||||||||||
| Rest of Europe | 10.55 | 7.06 | 7.40 | 9.72 | 10.65 | 10.13 | 11.64 | |||||||||||||
| North Africa | 7.15 | 5.79 | 6.87 | 5.95 | 5.39 | 8.13 | 4.91 | |||||||||||||
| Sub-Saharan Africa | 1.50 | 1.66 | 1.87 | 1.97 | 2.16 | |||||||||||||||
| Kazakhstan | 0.53 | 0.45 | 0.49 | 0.57 | 0.67 | |||||||||||||||
| Rest of Asia | 5.05 | 12.40 | 4.09 | 7.44 | 4.35 | 9.87 | 5.27 | 15.68 | 5.94 | 6.17 | ||||||||||
| America | 8.81 | 4.05 | 4.70 | 4.02 | 2.90 | |||||||||||||||
| Australia and Oceania | 9.59 | 8.14 | 7.40 | 7.38 | 7.73 | |||||||||||||||
| 7.99 | 11.91 | 5.62 | 6.81 | 6.01 | 8.73 | 6.44 | 13.89 | 7.14 | 6.16 | |||||||||||
| Hydrocarbons | ||||||||||||||||||||
| ($/boe) | ||||||||||||||||||||
| Italy | 78.46 | 53.17 | 56.60 | 77.26 | 73.24 | |||||||||||||||
| Rest of Europe | 67.15 | 49.53 | 56.00 | 79.03 | 66.14 | 80.79 | 69.05 | |||||||||||||
| North Africa | 64.91 | 13.86 | 45.47 | 13.19 | 55.06 | 13.53 | 64.85 | 20.87 | 73.06 | 19.45 | ||||||||||
| Sub-Saharan Africa | 81.77 | 98.40 | 54.61 | 56.85 | 66.35 | 77.78 | 88.02 | 108.92 | 84.93 | 112.28 | ||||||||||
| Kazakhstan | 51.30 | 33.65 | 42.24 | 62.87 | 64.92 | |||||||||||||||
| Rest of Asia | 48.85 | 69.22 | 38.21 | 41.80 | 42.45 | 55.04 | 51.51 | 85.80 | 57.98 | 34.78 | ||||||||||
| America | 70.41 | 86.42 | 39.29 | 56.32 | 47.84 | 71.70 | 60.28 | 93.03 | 54.61 | 93.45 | ||||||||||
| Australia and Oceania | 71.43 | 48.63 | 52.51 | 61.00 | 73.82 | |||||||||||||||
| 68.21 | 60.50 | 46.90 | 42.82 | 55.59 | 56.10 | 72.20 | 83.15 | 73.65 | 59.25 | |||||||||||
| ENI’s GROUP | 2008 | 2009 | 2010 | 2011 | 2012 | |||||
| Liquids ($/bbl) (a) | 84.05 | 56.95 | 72.76 | 102.11 | 102.58 | |||||
| Natural gas ($/kcf) | 8.01 | 5.62 | 6.02 | 6.48 | 7.12 | |||||
| Hydrocarbons ($/boe) | 68.13 | 46.90 | 55.60 | 72.26 | 73.39 | |||||
(a) Eni’s average liquids realizations decreased by 1.50 $/bbl in 2011 (1.33 $/bbl, 0.03 $/bbl and 4.13 $/bbl in 2010, 2009 and 2008, respectively) due to the settlement of certain commodity derivatives relating to the sale of 9 mmbbl (28.5 mmbbl, 42.2 mmbbl and 46 mmbbl in 2010, 2009 and 2008, respectively). This deal terminated a multi-year derivative transaction the Company entered into in order to hedge exposure to the variability in cash flows on the sale of a portion of the Company’s proved reserves for an original amount of approximately 125.7 mmbbl in the 2008-2011 period.
Net developed and undeveloped acreage | (square kilometers) | 2008 | 2009 | 2010 | 2011 | 2012 |
| Europe | 30,511 | 31,607 | 29,079 | 26,023 | 27,423 | |||||||
| Italy | 20,409 | 22,038 | 19,097 | 16,872 | 17,556 | |||||||
| Rest of Europe | 10,102 | 9,569 | 9,982 | 9,151 | 9,867 | |||||||
| Africa | 249,672 | 158,749 | 152,671 | 137,220 | 142,796 | |||||||
| North Africa | 31,088 | 46,011 | 44,277 | 30,532 | 21,390 | |||||||
| Sub-Saharan Africa | 218,584 | 112,738 | 108,394 | 106,688 | 121,406 | |||||||
| Asia | 93,710 | 125,641 | 112,745 | 55,284 | 58,042 | |||||||
| Kazakhstan | 880 | 880 | 880 | 880 | 869 | |||||||
| Rest of Asia | 92,830 | 124,761 | 111,865 | 54,404 | 57,173 | |||||||
| America | 12,043 | 11,523 | 11,187 | 10,209 | 9,075 | |||||||
| Australia and Oceania | 29,558 | 20,342 | 15,279 | 25,685 | 13,834 | |||||||
| Total | 415,494 | 347,862 | 320,961 | 254,421 | 251,170 | |||||||
- 38 -
Contents
Eni Fact Book Exploration & Production
| Principal oil and natural gas interests at December 31, 2012 |
Commencement of operations | Number of interests | Gross developed (a) (b) acreage | Net developed (a) (b) acreage | Gross undeveloped (a) acreage | Net undeveloped (a) acreage | Type of fields/acreage | Number of producing fields | Number of other fields | ||||||||||
| EUROPE | 288 | 17,191 | 11,150 | 27,199 | 16,273 | 135 | 99 | |||||||||||
| Italy | 1926 | 151 | 10,847 | 9,011 | 11,438 | 8,545 | Onshore/Offshore | 83 | 68 | |||||||||
| Rest of Europe | 137 | 6,344 | 2,139 | 15,761 | 7,728 | 52 | 31 | |||||||||||
| Croatia | 1996 | 2 | 1,975 | 987 | Offshore | 9 | 3 | |||||||||||
| Norway | 1965 | 52 | 2,264 | 346 | 6,226 | 2,330 | Offshore | 17 | 16 | |||||||||
| Poland | 2010 | 3 | 1,968 | 1,968 | Onshore | |||||||||||||
| Ukraine | 2011 | 12 | 50 | 30 | 3,840 | 1,911 | Onshore | 1 | ||||||||||
| United Kingdom | 1964 | 65 | 2,055 | 776 | 647 | 138 | Offshore | 25 | 12 | |||||||||
| Other Countries | 3 | 3,080 | 1,381 | Offshore | ||||||||||||||
| AFRICA | 287 | 64,075 | 19,891 | 192,079 | 122,905 | 272 | 143 | |||||||||||
| North Africa | 119 | 31,988 | 14,066 | 17,691 | 7,324 | 103 | 60 | |||||||||||
| Algeria | 1981 | 41 | 2,640 | 1,071 | 1,158 | 161 | Onshore | 32 | 11 | |||||||||
| Egypt | 1954 | 57 | 4,937 | 1,771 | 7,845 | 2,819 | Onshore/Offshore | 40 | 27 | |||||||||
| Libya | 1959 | 10 | 17,947 | 8,950 | 8,688 | 4,344 | Onshore/Offshore | 11 | 15 | |||||||||
| Tunisia | 1961 | 11 | 6,464 | 2,274 | Onshore/Offshore | 20 | 7 | |||||||||||
| Sub-Saharan Africa | 168 | 32,087 | 5,825 | 174,388 | 115,581 | 169 | 83 | |||||||||||
| Angola | 1980 | 78 | 4,804 | 636 | 20,037 | 5,443 | Onshore/Offshore | 47 | 31 | |||||||||
| Congo | 1968 | 26 | 1,835 | 1,027 | 7,681 | 4,008 | Onshore/Offshore | 24 | 6 | |||||||||
| Dem. Republic of Congo | 2010 | 1 | 478 | 263 | Onshore | |||||||||||||
| Gabon | 2008 | 6 | 7,615 | 7,615 | Onshore/Offshore | |||||||||||||
| Ghana | 2009 | 2 | 5,144 | 1,885 | Offshore | 2 | ||||||||||||
| Kenya | 2012 | 3 | 35,724 | 35,724 | Offshore | |||||||||||||
| Liberia | 2012 | 3 | 8,145 | 2,036 | Offshore | |||||||||||||
| Mozambique | 2007 | 1 | 12,956 | 9,069 | Offshore | 8 | ||||||||||||
| Nigeria | 1962 | 41 | 25,448 | 4,162 | 10,838 | 3,484 | Onshore/Offshore | 98 | 36 | |||||||||
| Togo | 2010 | 2 | 6,192 | 6,192 | Offshore | |||||||||||||
| Other Countries | 5 | 59,578 | 39,862 | Onshore | ||||||||||||||
| ASIA | 73 | 17,126 | 5,778 | 101,554 | 52,264 | 39 | 32 | |||||||||||
| Kazakhstan | 1992 | 6 | 324 | 95 | 4,609 | 774 | Onshore/Offshore | 1 | 5 | |||||||||
| Rest of Asia | 67 | 16,802 | 5,683 | 96,945 | 51,490 | 38 | 27 | |||||||||||
| China | 1984 | 11 | 200 | 39 | 10,456 | 10,456 | Offshore | 11 | ||||||||||
| India | 2005 | 11 | 206 | 109 | 16,546 | 6,099 | Onshore/Offshore | 4 | 3 | |||||||||
| Indonesia | 2001 | 13 | 1,735 | 656 | 28,490 | 19,078 | Onshore/Offshore | 7 | 15 | |||||||||
| Iran | 1957 | 4 | 1,456 | 820 | Onshore/Offshore | 2 | ||||||||||||
| Iraq | 2009 | 1 | 1,074 | 352 | Onshore | 1 | ||||||||||||
| Pakistan | 2000 | 19 | 8,430 | 2,478 | 20,210 | 8,055 | Onshore/Offshore | 10 | 1 | |||||||||
| Russia | 2007 | 4 | 3,501 | 1,029 | 1,495 | 440 | Onshore | 1 | 8 | |||||||||
| Timor Leste | 2006 | 2 | 5,148 | 4,118 | Offshore | |||||||||||||
| Turkmenistan | 2008 | 1 | 200 | 200 | Onshore | 2 | ||||||||||||
| Other Countries | 1 | 14,600 | 3,244 | Offshore | ||||||||||||||
| AMERICA | 409 | 4,571 | 3,074 | 14,180 | 6,001 | 61 | 20 | |||||||||||
| Ecuador | 1988 | 1 | 1,985 | 1,985 | Onshore | 1 | 1 | |||||||||||
| Trinidad & Tobago | 1970 | 1 | 382 | 66 | Offshore | 5 | 2 | |||||||||||
| United States | 1968 | 393 | 1,826 | 925 | 6,206 | 3,707 | Onshore/Offshore | 54 | 13 | |||||||||
| Venezuela | 1998 | 6 | 378 | 98 | 2,427 | 968 | Onshore/Offshore | 1 | 3 | |||||||||
| Other Countries | 8 | 5,547 | 1,326 | Offshore | 1 | |||||||||||||
| AUSTRALIA AND OCEANIA | 15 | 1,980 | 1,046 | 23,102 | 12,788 | 4 | 2 | |||||||||||
| Australia | 2001 | 14 | 1,980 | 1,046 | 22,338 | 12,750 | Offshore | 4 | 2 | |||||||||
| Other Countries | 1 | 764 | 38 | Offshore | ||||||||||||||
| Total | 1,072 | 104,943 | 40,939 | 358,114 | 210,231 | 511 | 296 | |||||||||||
(a) Square kilometers.
(b) Developed acreage refers to those leases in which at least a portion of the area is in production or encompasses proved developed reserves.
| - 39 - |
Contents
Eni Fact Book Exploration & Production
Capital expenditure | (euro million) | 2008 | 2009 | 2010 | 2011 | 2012 |
| Acquisition of proved and unproved properties | 836 | 697 | 754 | 43 | ||||||||
| North Africa | 626 | 351 | 57 | 14 | ||||||||
| Sub-Saharan Africa | 210 | 73 | 697 | 27 | ||||||||
| Rest of Asia | 94 | |||||||||||
| America | 179 | 2 | ||||||||||
| Exploration | 1,918 | 1,228 | 1,012 | 1,210 | 1,850 | |||||||
| Italy | 135 | 40 | 34 | 38 | 32 | |||||||
| Rest of Europe | 227 | 113 | 114 | 100 | 151 | |||||||
| North Africa | 379 | 317 | 84 | 128 | 153 | |||||||
| Sub-Saharan Africa | 485 | 284 | 406 | 482 | 1,142 | |||||||
| Kazakhstan | 16 | 20 | 6 | 6 | 3 | |||||||
| Rest of Asia | 187 | 159 | 223 | 156 | 193 | |||||||
| America | 441 | 243 | 119 | 60 | 80 | |||||||
| Australia and Oceania | 48 | 52 | 26 | 240 | 96 | |||||||
| Development | 6,429 | 7,478 | 8,578 | 7,357 | 8,304 | |||||||
| Italy | 570 | 689 | 630 | 720 | 744 | |||||||
| Rest of Europe | 598 | 673 | 863 | 1,596 | 2,008 | |||||||
| North Africa | 1,246 | 1,381 | 2,584 | 1,380 | 1,299 | |||||||
| Sub-Saharan Africa | 1,717 | 2,105 | 1,818 | 1,521 | 1,931 | |||||||
| Kazakhstan | 968 | 1,083 | 1,030 | 897 | 719 | |||||||
| Rest of Asia | 355 | 406 | 311 | 361 | 641 | |||||||
| America | 655 | 706 | 1,187 | 831 | 953 | |||||||
| Australia and Oceania | 320 | 435 | 155 | 51 | 9 | |||||||
| Other expenditure | 98 | 83 | 100 | 114 | 110 | |||||||
9,281 | 9,486 | 9,690 | 9,435 | 10,307 | ||||||||
Reserves life index (a) | (years) | 2008 | 2009 | 2010 | 2011 | 2012 |
| Italy | 9.3 | 11.4 | 10.9 | 10.4 | 7.6 | |||||||
| Rest of Europe | 5.8 | 6.6 | 7.4 | 8.0 | 9.0 | |||||||
| North Africa | 8.2 | 9.3 | 9.6 | 12.8 | 9.0 | |||||||
| Sub-Saharan Africa | 9.5 | 8.9 | 7.9 | 8.2 | 8.9 | |||||||
| Kazakhstan | 32.9 | 29.0 | 28.7 | 24.5 | 28.1 | |||||||
| Rest of Asia | 12.8 | 11.1 | 12.8 | 21.7 | 18.1 | |||||||
| America | 5.9 | 5.0 | 7.2 | 13.6 | 19.7 | |||||||
| Australia and Oceania | 21.0 | 21.5 | 13.1 | 12.8 | 9.8 | |||||||
10.0 | 10.2 | 10.3 | 12.3 | 11.5 | ||||||||
Reserves replacement ratio (a) | 2008 | 2009 | 2010 | 2011 | 2012 |
| (%) | organic | all sources | organic | all sources | organic | all sources | organic | all sources | organic | all sources | ||||||||||
| Italy | 9 | 10 | 135 | 136 | 121 | 107 | 72 | 75 | 34 | - | ||||||||||
| Rest of Europe | - | - | 173 | 174 | 103 | 102 | 140 | 136 | 37 | 37 | ||||||||||
| North Africa | 118 | 118 | 99 | 99 | 167 | 167 | 58 | 58 | 40 | 40 | ||||||||||
| Sub-Saharan Africa | 117 | 142 | 105 | 106 | 91 | 90 | 63 | 58 | 138 | 117 | ||||||||||
| Kazakhstan | 921 | 776 | - | - | - | - | - | - | 467 | 337 | ||||||||||
| Rest of Asia | 124 | 248 | 42 | - | 211 | 212 | 768 | 771 | 12 | 12 | ||||||||||
| America | 40 | 40 | 102 | 144 | 274 | 273 | 646 | 647 | 855 | 786 | ||||||||||
| Australia and Oceania | 75 | 75 | 117 | 112 | 6 | 5 | 155 | 163 | 51 | 51 | ||||||||||
| 130 | 135 | 93 | 96 | 127 | 125 | 143 | 142 | 147 | 107 | |||||||||||
(a) Includes a 29.4% stake of the reserves of the three equity-accounted Russian companies participated by joint-venture OOO SeverEnergia, owned by Eni (60%) and its Italian partner Enel (40%) which on September 23, 2009, completed the divestment of the 51% stake in the venture to Gazprom in line with the call option arrangement.
(b) Net of updating the natural gas conversion factor.
- 40 -
Contents
Eni Fact Book Exploration & Production
| Exploratory wells activity |
Net wells completed | Wells in progress at Dec. 31 (a) | |||
2010 | 2011 | 2012 | 2012 | |||||
| (units) | Productive | Dry (b) | Productive | Dry (b) | Productive | Dry (b) | Gross | Net | ||||||||
| Italy | 0.5 | 1.0 | 5.0 | 3.4 | ||||||||||||
| Rest of Europe | 1.7 | 1.1 | 0.3 | 0.7 | 1.0 | 1.0 | 19.0 | 7.2 | ||||||||
| North Africa | 9.3 | 8.1 | 6.2 | 3.4 | 6.3 | 11.3 | 17.0 | 11.7 | ||||||||
| Sub-Saharan Africa | 2.3 | 4.7 | 0.6 | 2.6 | 4.5 | 5.1 | 57.0 | 24.2 | ||||||||
| Kazakhstan | 0.8 | 8.0 | 1.4 | |||||||||||||
| Rest of Asia | 1.0 | 2.8 | 0.2 | 7.6 | 0.5 | 0.6 | 27.0 | 11.2 | ||||||||
| America | 6.3 | 2.5 | 0.1 | 10.0 | 2.4 | |||||||||||
| Australia and Oceania | 1.0 | 0.4 | 1.4 | 0.4 | 1.0 | 0.5 | ||||||||||
| 15.3 | 23.9 | 9.8 | 15.7 | 13.3 | 19.3 | 144.0 | 62.0 | |||||||||
| Development wells activity |
Net wells completed | Wells in progress at Dec. 31 (a) | |||
2010 | 2011 | 2012 | 2012 | |||||
| (units) | Productive | Dry (b) | Productive | Dry (b) | Productive | Dry (b) | Gross | Net | ||||||||
| Italy | 23.9 | 1.0 | 25.3 | 18.0 | 1.0 | 3.0 | 2.6 | |||||||||
| Rest of Europe | 2.9 | 0.2 | 3.3 | 0.3 | 2.9 | 0.6 | 9.0 | 1.8 | ||||||||
| North Africa | 44.3 | 0.3 | 55.9 | 1.1 | 46.0 | 1.6 | 19.0 | 8.1 | ||||||||
| Sub-Saharan Africa | 28.0 | 2.5 | 28.2 | 1.0 | 27.4 | 0.3 | 19.0 | 4.4 | ||||||||
| Kazakhstan | 1.8 | 1.3 | 1.4 | 16.0 | 2.9 | |||||||||||
| Rest of Asia | 41.7 | 1.8 | 39.2 | 2.5 | 41.2 | 0.1 | 36.0 | 14.2 | ||||||||
| America | 27.6 | 0.5 | 27.6 | 23.1 | 7.0 | 2.9 | ||||||||||
| Australia and Oceania | 1.5 | 0.4 | ||||||||||||||
| 171.7 | 6.3 | 181.2 | 4.9 | 160.0 | 3.6 | 109.0 | 36.9 | |||||||||
| Productive oil and gas wells (c) |
2012 | ||
Oil wells | Natural gas wells | |||
| (units) | Gross | Net | Gross | Net | ||||
| Italy | 242.0 | 196.1 | 621.0 | 536.6 | ||||
| Rest of Europe | 460.0 | 69.7 | 180.0 | 89.2 | ||||
| North Africa | 1,447.0 | 702.3 | 154.0 | 59.2 | ||||
| Sub-Saharan Africa | 2,858.0 | 542.2 | 383.0 | 27.6 | ||||
| Kazakhstan | 102.0 | 29.1 | ||||||
| Rest of Asia | 642.0 | 404.1 | 889.0 | 336.6 | ||||
| America | 169.0 | 90.5 | 344.0 | 122.8 | ||||
| Australia and Oceania | 7.0 | 3.8 | 14.0 | 3.3 | ||||
| 5,927.0 | 2,037.8 | 2,585.0 | 1,175.3 | |||||
(a) Includes temporary suspended wells pending further evaluation.
(b) A dry well is an exploratory, development, or extension well that proves to be incapable of producing either oil or gas sufficient quantities to justify completion as an oil or gas well.
(c) Includes 2,203 gross (747.7 net) multiple completion wells (more than one producing into the same well bore). Productive wells are producing wells and wells capable of production. One or more completions in the same bore hole are counted as one well.
- 41 -
Contents
Eni Fact Book Gas & Power
Gas & Power |
Key performance indicators (*) |
2008 | 2009 | 2010 | 2011 | 2012 | ||||||||
| Employees injury frequency rate | (No. of accidents per million of worked hours) | 4.72 | 3.15 | 3.97 | 2.44 | 1.84 | |||||||||||
| Contractors injury frequency rate | 3.43 | 2.32 | 4.00 | 5.22 | 3.64 | ||||||||||||
| Net sales from operations (a) | (euro million) | 36,122 | 29,272 | 27,806 | 33,093 | 36,200 | |||||||||||
| Operating profit | 2,330 | 1,914 | 896 | (326 | ) | (3,221 | ) | ||||||||||
| Adjusted operating profit | 1,778 | 2,022 | 1,268 | (247 | ) | 354 | |||||||||||
| Marketing | 1,309 | 1,721 | 923 | (657 | ) | 45 | |||||||||||
| International transport | 469 | 301 | 345 | 410 | 309 | ||||||||||||
| Adjusted net profit | 784 | 892 | 1,267 | 252 | 473 | ||||||||||||
| EBITDA pro-forma adjusted | 2,970 | 2,975 | 2,562 | 949 | 1,314 | ||||||||||||
| Marketing | 2,344 | 2,334 | 1,863 | 257 | 856 | ||||||||||||
| International transport | 626 | 641 | 699 | 692 | 458 | ||||||||||||
| Capital expenditure | 431 | 207 | 265 | 192 | 225 | ||||||||||||
| Worldwide gas sales (b) | (bcm) | 104.23 | 103.72 | 97.06 | 96.76 | 95.32 | |||||||||||
| LNG sales (c) | 12.0 | 12.9 | 15.0 | 15.7 | 14.6 | ||||||||||||
| Customers in Italy | (million) | 6.63 | 6.88 | 6.88 | 7.10 | 7.45 | |||||||||||
| Electricity sold | (TWh) | 29.93 | 33.96 | 39.54 | 40.28 | 42.58 | |||||||||||
| Employees at year end | (units) | 5,312 | 5,147 | 5,072 | 4,795 | 4,752 | |||||||||||
| Direct GHG emissions | (mmtonnes CO2 eq) | 12.18 | 12.40 | 13.41 | 12.77 | 12.70 | |||||||||||
| Customer satisfaction index (PSC) (d) | (%) | 75.3 | 83.7 | 87.4 | 88.6 | 89.8 | |||||||||||
| Water consumption/withdrawals per kWh eq produced | (cm/kW eq) | 0.015 | 0.015 | 0.013 | 0.014 | 0.012 | |||||||||||
(*) Following the divestment plan of the Regulated Businesses in Italy, results of the Gas & Power Division include Marketing and International transport activities. Reference periods have been restated accordingly.
(a) Before elimination of intragroup sales.
(b) Include volumes marketed by the Exploration & Production Division of 2.73 bcm (6.00, 6.17, 5.65 and 2.86 bcm in 2008, 2009, 2010 and 2011, respectively).
(c) Refer to LNG sales of the Gas & Power Division (included in worldwide gas sales) and the Exploration & Production Division.
(d) 2012 figure is calculated as the average of the CSS detected by the AEEG in the first half of 2012 and the result detected by the Eni satisfaction survey in the second half of 2012.
Performance of the year
| Commercial agreements in the Far East In January 2013, Eni signed a trilateral agreement with Korea Gas Corporation and Japanese company Chubu Electric Power Company for the sale of 28 loads of LNG (liquefied natural gas) corresponding to 1.7 million tonnes of LNG in the 2013-2017 period. Entry in the French and Belgian markets I In 2012, Eni’s continuous commitment and the resources dedicated to safety allowed to improve significantly the main accident frequency rates. In particular the positive trend was confirmed for employees (down 24.6% from 2011), while the rate for contractors returned to levels lower than in 2010, improving by 30% from 2011. | I With regard to sales to residentials in Italy, Eni’s customers satisfaction score (checked twice a year by the Authority for electricity and gas) reached 89.8 (basis 100) increasing by 1.2 percentage points from 2011. I In 2012, the water consumption rate of EniPower’s plants declined both in absolute value (down 11.2% from 2011) and per kWh eq produced (down 13.8%). I In 2012, adjusted net profit was euro 473 million, almost doubled from 2011 due to a better performance of the Marketing business in a scenario characterized by weak demand and rising competitive pressure. This performance offset the decline in selling prices reflecting in part the benefits associated with the renegotiations of the supply contracts, certain of which have been finalized after 2011 year-end and the improvement in the supply mix also following the full recovery of Libyan supplies. |
- 42 -
Contents
Eni Fact Book Gas & Power
| I Worldwide gas sales decreased by 1.5% to 95.32 bcm due to lower European demand and competitive pressures. Sales in Italy were in line with 2011, while they declined slightly in European markets, in particular in Benelux due to competitive pressure and in the Iberian Peninsula due to the divestment of Galp. | I Electricity sales of 42.58 TWh increased by 2.30 TWh from 2011, up 5.7%. I Capital expenditure of euro 225 million concerned essentially flexibility and upgrading of combined cycle power stations (euro 131 million) and initiatives in gas marketing (euro 81 million). |

| Eni’s Gas & Power segment engages in all phases of the natural gas value chain: supply, trading and marketing of natural gas and LNG. This segment also includes power generation and marketing of electricity. Eni’s leading position in the European gas market is ensured by a set of competitive advantages, including our multi-Country approach, long-term gas availability, access to infrastructures, market knowledge and a strong customer base, in addition to long-term relations with producing Countries. Furthermore, integration with our upstream operations provides valuable growth options whereby the Company targets to monetize its large gas reserves. 1. Marketing 1.1 Natural gas Supply |
of 18 Countries, where Eni also holds upstream activities and by access to European spot markets. |
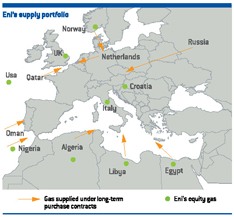
- 43 -
Contents
Eni Fact Book Gas & Power
| Supplies in Italy (7.55 bcm) increased slightly from 2011 also due to higher domestic production that offset the decline of mature fields. In 2012, main gas volumes from equity production derived from: (i) Italian gas fields (6.7 bcm); (ii) certain Eni fields located in the British and Norwegian sections of the North Sea (1.9 bcm); (iii) Libyan fields (1.8 bcm) increasing by almost 1.2 bcm due to the effect of force majeure recorded in 2011; (iv) the United States (1.6 bcm); (v) other European areas (Croatia with 0.2 bcm). Considering also direct sales of the Exploration & Production Division and LNG supplied from the Bonny liquefaction plant in Nigeria, supplied gas volumes from equity production were approximately 18 bcm representing 18% of total volumes available for sale. Marketing in Italy | linked to the national and regional natural gas network. Wholesalers mainly include local selling companies that resell natural gas to residential customers through low pressure distribution networks as well as distributors of natural gas for automotive use. Residential customers include households (also referred to as the retail market), the tertiary sector (mainly commercial outlets, hospitals, schools and local administrations) and small businesses (also referred to as the middle market) located in large metropolitan areas and urban centers. Overall, Eni supplies approximately 2,600 clients including large businesses, power generation utilities, wholesalers and distributors of natural gas for automotive use. Residential users are 7.45 million and include households, professionals, small and medium sized enterprises, and public bodies located all over Italy. Despite a 4% decline in natural gas demand, sales volumes on the Italian market were substantially stable at 34.78 bcm (up 0.10 bcm, or 0.3% from 2011). Lower sales to the power generation segment (down 1.76 bcm), industrial customers (down 0.51 bcm) and wholesalers (down 0.28 bcm), due to the negative scenario and increasing competitive pressure, were offset by higher sales on the Italian exchange for gas and spot markets (up 2.28 bcm) and, at a lower extent, to the residential segment (up 0.22 bcm) reflecting efficient commercial initiatives. Sales to shippers were down 0.51 bcm, or 15.7%, due to the discontinuance of certain supply contracts despite the recovery of Libyan supplies. |
| Sales and market shares on the Italian gas market | (bcm) | 2011 | 2012 |
| Volumes sold | Market share (%) | Volumes sold | Market share (%) | % Ch. 2012 vs 2011 |
| Italy to third parties | 28.47 | 36.5 | 28.35 | 37.8 | (0.4 | ) | |||||
| Wholesalers | 5.16 | 4.65 | (9.9 | ) | |||||||
| Italian gas exchange and spot markets | 5.24 | 7.52 | 43.5 | ||||||||
| Industries | 7.21 | 6.93 | (3.9 | ) | |||||||
| Medium-sized enterprises and services | 0.88 | 0.81 | (8.0 | ) | |||||||
| Power generation | 4.31 | 2.55 | (40.8 | ) | |||||||
| Residential | 5.67 | 5.89 | 3.9 | ||||||||
| Own consumption | 6.21 | 6.43 | 3.5 | ||||||||
| TOTAL SALES IN ITALY | 34.68 | 44.5 | 34.78 | 46.4 | 0.3 | ||||||
| Gas demand (a) | 77.92 | 74.91 | (3.9 | ) | |||||||
(a) Source: Italian Ministry of Economic Development.
- 44 -
Contents
Eni Fact Book Gas & Power
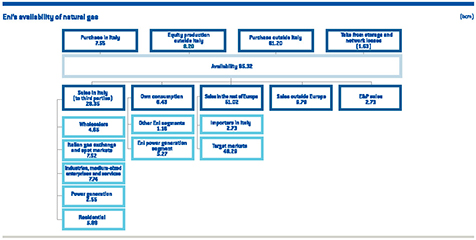
| Marketing outside Italy Despite a challenging market scenario and rising competitive pressures, Eni intends to organically grow in particular in certain European key market such as Germany/Austria and Benelux, leveraging on our brand awareness, our multi-Country approach and on a pan-European commercial platform as well as delivering innovative and tailor-made offering structures to best suit customers’ needs by providing complex pricing formulas with flexibility on volumes and different ways to manage pricing. In 2012, sales of natural gas were 95.32 bcm, down 1.44 bcm or 1.5% from 2011. Sales included Eni’s own consumption, Eni’s share of sales made by equity-accounted entities and Exploration | & Production sales in Europe and in the Gulf of Mexico. Sales on target markets in Europe of 48.29 bcm showed a slight decline from 2011 (down 2.9%). This decline was mainly due to a decline in sales in Benelux (down 3.53 bcm) due to rising competitive pressure and in the Iberian Peninsula (down 1.19 bcm) due to the exclusion of Galp sales after the loss of control offset only in part by increases recorded in France (up 1.35 bcm) and Germany/Austria (up 1.31 bcm) due to commercial initiatives performed. Sales to markets outside Europe increased by 0.55 bcm due to higher LNG sales in the Far East, in particular in Japan. Exploration & Production sales in Northern Europe and in the United States (2.73 bcm) declined by 0.13 bcm due to lower sales in the North Sea. |
Gas sales by market | (bcm) | 2008 | 2009 | 2010 | 2011 | 2012 |
| ITALY | 52.87 | 40.04 | 34.29 | 34.68 | 34.78 | |||||||
| Wholesalers | 7.52 | 5.92 | 4.84 | 5.16 | 4.65 | |||||||
| Gas release | 3.28 | 1.30 | 0.68 | |||||||||
| Italian gas exchange and spot markets | 1.89 | 2.37 | 4.65 | 5.24 | 7.52 | |||||||
| Industries | 9.59 | 7.58 | 6.41 | 7.21 | 6.93 | |||||||
| Medium-sized enterprises and services | 1.05 | 1.08 | 1.09 | 0.88 | 0.81 | |||||||
| Power generation | 17.69 | 9.68 | 4.04 | 4.31 | 2.55 | |||||||
| Residential | 6.22 | 6.30 | 6.39 | 5.67 | 5.89 | |||||||
| Own consumption | 5.63 | 5.81 | 6.19 | 6.21 | 6.43 | |||||||
| INTERNATIONAL SALES | 51.36 | 63.68 | 62.77 | 62.08 | 60.54 | |||||||
| Rest of Europe | 43.03 | 55.45 | 54.52 | 52.98 | 51.02 | |||||||
| Importers in Italy | 11.25 | 10.48 | 8.44 | 3.24 | 2.73 | |||||||
| European markets | 31.78 | 44.97 | 46.08 | 49.74 | 48.29 | |||||||
| Iberian Peninsula | 7.44 | 6.81 | 7.11 | 7.48 | 6.29 | |||||||
| Germany/Austria | 5.29 | 5.36 | 5.67 | 6.47 | 7.78 | |||||||
| Benelux | 4.77 | 15.72 | 15.64 | 13.84 | 10.31 | |||||||
| Hungary | 2.82 | 2.58 | 2.36 | 2.24 | 2.02 | |||||||
| UK/Northern Europe | 3.21 | 4.31 | 4.45 | 4.21 | 4.75 | |||||||
| Turkey | 4.93 | 4.79 | 3.95 | 6.86 | 7.22 | |||||||
| France | 2.66 | 4.91 | 6.09 | 7.01 | 8.36 | |||||||
| Other | 0.66 | 0.49 | 0.81 | 1.63 | 1.56 | |||||||
| Extra European markets | 2.33 | 2.06 | 2.60 | 6.24 | 6.79 | |||||||
| E&P in Europe and in the Gulf of Mexico | 6.00 | 6.17 | 5.65 | 2.86 | 2.73 | |||||||
| WORLDWIDE GAS SALES | 104.23 | 103.72 | 97.06 | 96.76 | 95.32 | |||||||
- 45 -
Contents
Eni Fact Book Gas & Power
A review of Eni’s presence in key European markets is presented below.
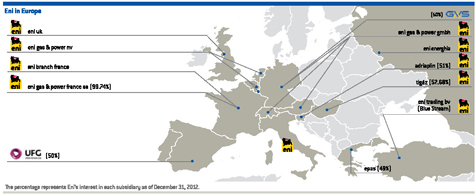
| Benelux Through a direct presence and the integration with its affiliate Eni Gas & Power NV, Eni holds a key position in the Benelux Countries (Belgium, the Netherlands and Luxembourg), in particular in Belgium, which are a strategic hub of the continental gas spot market in Western Europe, thanks to their central position and high level of interconnectivity with the gas transit networks of Central and Northern Europe. In 2012, sales in Benelux were mainly directed to industrial companies, wholesalers and power generation and amounted to 10.31 bcm, down by 3.53 bcm, or 25.5%, due to rising competitive pressure, in particular in the wholesalers segment. In October 2012, Eni launched its brand in the retail gas and power market in Belgium. The Eni brand substituted the local operators ones acquired in the past few years with the aim of becoming one of the major retail operators in the Country while consolidating its leadership on the Belgian business market. France Germany/Austria | Spain Eni operates in the Spanish gas market through a direct marketing structure that markets its portfolio of LNG and Unión Fenosa Gas (UFG) (Eni’s interest 50%) which mainly supplies natural gas to industrial clients, wholesalers and power generation utilities. In 2012, UFG gas sales in Europe amounted to 4.82 bcm (2.41 bcm Eni’s share). UFG holds an 80% interest in the Damietta liquefaction plant, on the Egyptian coast (see below), and a 7.36% interest in a liquefaction plant in Oman. In addition, it holds interests in the Sagunto (Valencia) and El Ferrol (Galicia) re-gasification plants (42.5% and 18.9%, respectively). In 2012, Eni sales in Spain amounted to 5.24 bcm representing a slight decrease from a year ago. In 2012, total sales in the region amounted to 6.29 bcm, a decrease of 1.19 bcm, or 15.9% from a year ago. Turkey UK Deborah Gas Storage Project in the Hewett area, UK |
- 46 -
Contents
Eni Fact Book Gas & Power
| 1.2 LNG Eni is present in all phases of the LNG business: liquefaction, shipping, re-gasification and sale through operated activities or interests in joint ventures and associates. Eni’s presence in the business is tied to the Company’s plans to develop its large gas reserve base in Africa and elsewhere in the world. The LNG business has been deeply impacted by the economic downturn and oversupply affecting the European gas market, as well as by structural modifications in the US market where large availability of gas from unconventional sources has reduced the Country’s dependence on gas imports via LNG. In expansion the activity on Far East premium markets. Eni’s main assets and projects in the LNG business are described below. Qatar Egypt Spain United States | a share of re-gasification capacity of the Cameron terminal. The new agreement provides that Eni will be entitled to a daily send-out of 572,000 mmbtu (approximately 5.7 bcm/y) and a dedicated storage capacity of 160 kcm, giving Eni more flexibility in managing seasonal swings in gas demand. Furthermore, keeping account of the current oversupply of the US gas market, the Brass project (West Africa) for developing gas reserves to fuel the Cameron plant has been rescheduled with start-up in 2017. Pascagoula. This project is part of an upstream development project related to the construction of an LNG plant in Angola designed to produce 5.2 mmtonnes of LNG (approximately 7.3 bcm/y) destined to the North American market in order to monetize part of the Company’s gas reserves. As part of the downstream leg of the project, Eni signed a 20 year contract with Gulf LNG to buy 5.8 bcm/y of the re-gasification capacity of the plant near Pascagoula in Mississippi. The start-up of the re-gasification facility commenced in the fourth quarter of 2012. 1.3 Power generation |
- 47 -
Contents
Eni Fact Book Gas & Power
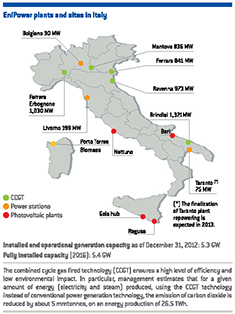 2. International transport | Eni owns capacity entitlements in an extensive network of international high pressure pipelines enabling the Company to import natural gas produced in Russia, Algeria, the North Sea, including the Netherlands and Norway, and Libya to Italy. The Company participates to both entities which operate the pipelines and entities which manage transport rights. A description of the main international pipelines currently participated or operated by Eni is provided below: - the TTPC pipeline, 740-kilometer long, made up of two lines that are each 370-kilometer long with a transport capacity of 33.2 bcm/y and five compression stations. This pipeline transports natural gas from Algeria across Tunisia from Oued Saf Saf at the Algerian border to Cap Bon on the Mediterranean coast where it links with the TMPC pipeline. In 2009 the pipeline was upgraded by increasing compression capacity in order to enable transportation of an additional 6.5 bcm/y; - the TMPC pipeline for the import of Algerian gas is 775-kilometer long and consists of five lines that are each 155-kilometer long with a transport capacity of 33.5 bcm/y. It crosses the underwater Sicily Channel from Cap Bon to Mazara del Vallo in Sicily, the point of entry into the Italian natural gas transport system; - the GreenStream pipeline, jointly-owned with the Libyan National Oil Company, started operations in October 2004 for the import of Libyan gas produced at Eni operated fields Bahr Essalam and Wafa. It is 520-kilometer long with a transport capacity of 8 bcm/y (expandable to 11 bcm/y) and crosses underwater in the Mediterranean Sea from Mellitah on the Libyan coast to Gela in Sicily, the point of entry into the Italian natural gas transport system; - Eni holds a 50% interest in the Blue Stream underwater pipeline (water depth greater than 2,150 meters) linking the Russian coast to the Turkish coast of the Black Sea. This pipeline is 774-kilometer long on two lines and has transport capacity of 16 bcm/y. It is part of a joint venture to sell gas produced in Russia on the Turkish market. |

- 48 -
Contents
Eni Fact Book Gas & Power
Supply of natural gas | (bcm) | 2008 | 2009 | 2010 | 2011 | 2012 |
| Italy | 8.00 | 6.86 | 7.29 | 7.22 | 7.55 | ||||||||||||
| Outside Italy | |||||||||||||||||
| Russia | 22.91 | 22.02 | 14.29 | 21.00 | 19.83 | ||||||||||||
| Algeria (including LNG) | 19.22 | 13.82 | 16.23 | 13.94 | 14.45 | ||||||||||||
| Libya | 9.87 | 9.14 | 9.36 | 2.32 | 6.55 | ||||||||||||
| Netherlands | 9.83 | 11.73 | 10.16 | 11.02 | 11.97 | ||||||||||||
| Norway | 6.97 | 12.65 | 11.48 | 12.30 | 12.13 | ||||||||||||
| United Kingdom | 3.12 | 3.06 | 4.14 | 3.57 | 3.20 | ||||||||||||
| Hungary | 2.84 | 0.63 | 0.66 | 0.61 | 0.61 | ||||||||||||
| Qatar (LNG) | 0.71 | 2.91 | 2.90 | 2.90 | 2.88 | ||||||||||||
| Other supplies of natural gas | 4.07 | 4.49 | 4.42 | 6.16 | 5.43 | ||||||||||||
| Other supplies of LNG | 2.11 | 1.34 | 1.56 | 2.34 | 2.14 | ||||||||||||
| 81.65 | 81.79 | 75.20 | 76.16 | 79.19 | |||||||||||||
| Total supplies of Eni’s own companies | 89.65 | 88.65 | 82.49 | 83.38 | 86.74 | ||||||||||||
| Offtake from (input to) storage | (0.08 | ) | 1.25 | (0.20 | ) | 1.79 | (1.35 | ) | |||||||||
| Network losses, measurement differences and other changes | (0.25 | ) | (0.30 | ) | (0.11 | ) | (0.21 | ) | (0.28 | ) | |||||||
| AVAILABLE FOR SALE ENI’S CONSOLIDATES SUBSIDIARIES | 89.32 | 89.60 | 82.18 | 84.96 | 85.11 | ||||||||||||
| Available for sale of Eni’s affiliates | 8.91 | 7.95 | 9.23 | 8.94 | 7.48 | ||||||||||||
| E&P volumes in Europe and Gulf of Mexico | 6.00 | 6.17 | 5.65 | 2.86 | 2.73 | ||||||||||||
| GAS VOLUMES AVAILABLE FOR SALE | 104.23 | 103.72 | 97.06 | 96.76 | 95.32 | ||||||||||||
Gas sales by entity | (bcm) | 2008 | 2009 | 2010 | 2011 | 2012 |
| Sales of consolidated companies | 89.32 | 89.60 | 82.00 | 84.37 | 84.67 | |||||||
| Italy (including own consumption) | 52.82 | 40.04 | 34.23 | 34.60 | 34.66 | |||||||
| Rest of Europe | 35.61 | 48.65 | 46.74 | 45.16 | 44.94 | |||||||
| Outside Europe | 0.89 | 0.91 | 1.03 | 4.61 | 5.07 | |||||||
| Sales of Eni’s affiliates (net to Eni) | 8.91 | 7.95 | 9.41 | 9.53 | 7.92 | |||||||
| Italy | 0.05 | 0.06 | 0.08 | 0.12 | ||||||||
| Rest of Europe | 7.42 | 6.80 | 7.78 | 7.82 | 6.08 | |||||||
| Outside Europe | 1.44 | 1.15 | 1.57 | 1.63 | 1.72 | |||||||
| E&P in Europe and in the Gulf of Mexico | 6.00 | 6.17 | 5.65 | 2.86 | 2.73 | |||||||
| Worldwide gas sales | 104.23 | 103.72 | 97.06 | 96.76 | 95.32 | |||||||
LNG sales | (bcm) | 2008 | 2009 | 2010 | 2011 | 2012 |
| G&P sales | 8.4 | 9.8 | 11.2 | 11.8 | 10.5 | |||||||
| Italy | 0.3 | 0.1 | 0.2 | |||||||||
| Rest of Europe | 7.0 | 8.9 | 9.8 | 9.8 | 7.6 | |||||||
| Extra European markets | 1.1 | 0.8 | 1.2 | 2.0 | 2.9 | |||||||
| E&P sales | 3.6 | 3.1 | 3.8 | 3.9 | 4.1 | |||||||
| Liquefaction plants: | ||||||||||||
| Bontang (Indonesia) | 0.7 | 0.8 | 0.7 | 0.6 | 0.6 | |||||||
| Point Fortin (Trinidad & Tobago) | 0.5 | 0.5 | 0.6 | 0.4 | 0.5 | |||||||
| Bonny (Nigeria) | 2.0 | 1.4 | 2.2 | 2.5 | 2.7 | |||||||
| Darwin (Australia) | 0.4 | 0.4 | 0.3 | 0.4 | 0.3 | |||||||
| Total LNG sales | 12.0 | 12.9 | 15.0 | 15.7 | 14.6 | |||||||
- 49 -
Contents
Eni Fact Book Gas & Power
Electricity sales | (TWh) | 2008 | 2009 | 2010 | 2011 | 2012 |
| Free market (a) | 23.37 | 25.07 | 27.84 | 27.25 | 31.84 | |||||||
| Italian Exchange for electricity | 3.82 | 4.70 | 7.13 | 8.67 | 6.1 | |||||||
| Industrial plants | 2.71 | 2.92 | 3.21 | 3.23 | 3.3 | |||||||
| Other (a) (b) | 0.03 | 1.27 | 1.36 | 1.13 | 1.34 | |||||||
| Power sales | 29.93 | 33.96 | 39.54 | 40.28 | 42.58 | |||||||
| Power generation | 23.33 | 24.09 | 25.63 | 25.23 | 25.67 | |||||||
| Trading of electricity (b) | 6.60 | 9.87 | 13.91 | 15.05 | 16.91 | |||||||
| (a) Network losses have been restated from the item "Other" to "Free Market". (b) Include positive and negative imbalances. |
| EniPower power stations | Installed capacity as of December 31, 2012 (a) | Full installed capacity (2016) (b) | Effective/planned start-up | Tecnology | Fuel |
| Power stations | (MW) | (GW) | ||||||||
| Brindisi | 1,321 | 1.3 | 2006 | CCGT | Gas | |||||
| Ferrera Erbognone | 1,030 | 1.0 | 2004 | CCGT | Gas/syngas | |||||
| Livorno | 199 | 0.2 | 2000 | Power Station | Gas/fuel oil | |||||
| Mantova | 836 | 0.9 | 2005 | CCGT | Gas | |||||
| Ravenna | 972 | 1.0 | 2004 | CCGT | Gas | |||||
| Taranto | 75 | 0.1 | 2000 | Power Station | Gas/fuel oil | |||||
| Ferrara | 841 | 0.8 | 2008 | CCGT | Gas | |||||
| Bolgiano | 30 | 0.1 | 2012 | Power Station | Gas | |||||
| Photovoltaic sites | 4 | 2011-2015 | Photovoltaic | Photovoltaic | ||||||
| 5,308 | 5.4 | |||||||||
| (a) Capacity available after completion of dismantling of obsolete plants. (b) Installed and operational generation capacity. |
Power generation | 2008 | 2009 | 2010 | 2011 | 2012 |
| Purchases | ||||||||||||
| Purchases of natural gas | (mmcm) | 4,530 | 4,790 | 5,154 | 5,008 | 5,206 | ||||||
| Purchases of other fuels | (ktoe) | 560 | 569 | 547 | 528 | 462 | ||||||
| - of which steam cracking | 131 | 82 | 103 | 99 | 98 | |||||||
| Production | ||||||||||||
| Power generation | (TWh) | 23.33 | 24.09 | 25.63 | 25.23 | 25.67 | ||||||
| Steam | (ktonnes) | 10,584 | 10,048 | 10,983 | 14,401 | 12,603 | ||||||
| Installed generation capacity | (GW) | 4.9 | 5.3 | 5.3 | 5.3 | 5.3 | ||||||
| Transport infrastructure |
| OUTSIDE ITALY | Lines | Length of | Diameter | Transport capacity (a) | Transport capacity (b) | Compression stations | ||||||
| TTPC (Oued Saf Saf-Cap Bon) | 2 lines of km 370 | 740 | 48 | 34.0 | 33.2 | 5 | ||||||
| TMPC (Cap Bon-Mazara del Vallo) | 5 lines of km 155 | 775 | 20/26 | 33.5 | 33.5 | |||||||
| GreenStream (Mellitah-Gela) | 1 line of km 520 | 520 | 32 | 8.0 | 8.0 | 1 | ||||||
| Blue Stream (Beregovaya-Samsun) | 2 lines of km 387 | 774 | 24 | 16.0 | 16.0 | 1 | ||||||
| (a) Includes both transit capacity and volumes of natural gas destined to local markets and withdrawn at various points along the pipeline. (b) The maximum volume of natural gas which is input at various entry points along the pipeline and transported to the next pipeline. |
Capital expenditure | (euro million) | 2008 | 2009 | 2010 | 2011 | 2012 |
| Italy | 123 | 85 | 155 | 132 | 174 | |||||||
| Outside Italy | 308 | 122 | 110 | 60 | 51 | |||||||
| 431 | 207 | 265 | 192 | 225 | ||||||||
| Market | 198 | 175 | 248 | 184 | 212 | |||||||
| Market | 91 | 102 | 133 | 97 | 81 | |||||||
| Italy | 16 | 12 | 40 | 45 | 43 | |||||||
| Outside Italy | 75 | 90 | 93 | 52 | 38 | |||||||
| Power generation | 107 | 73 | 115 | 87 | 131 | |||||||
| International transport | 233 | 32 | 17 | 8 | 13 | |||||||
| 431 | 207 | 265 | 192 | 225 | ||||||||
- 50 -
Contents
Eni Fact Book Refining & Marketing
Refining & Marketing |
Key performance indicators |
2008 | 2009 | 2010 | 2011 | 2012 | ||||||||
| Employees injury frequency rate | (No. of accidents per million of worked hours) | 2.88 | 3.18 | 1.77 | 1.96 | 1.08 | |||||||||||
| Contractors injury frequency rate | 3.45 | 4.35 | 3.59 | 3.21 | 2.32 | ||||||||||||
| Net sales from operations (a) | (euro million) | 45,017 | 31,769 | 43,190 | 51,219 | 62,656 | |||||||||||
| Operating profit | (988 | ) | (102 | ) | 149 | (273 | ) | (1,303 | ) | ||||||||
| Adjusted operating profit | 580 | (357 | ) | (181 | ) | (539 | ) | (328 | ) | ||||||||
| Adjusted net profit | 521 | (197 | ) | (56 | ) | (264 | ) | (179 | ) | ||||||||
| Capital expenditure | 965 | 635 | 711 | 866 | 842 | ||||||||||||
| Refinery throughputs on own account | (mmtonnes) | 35.84 | 34.55 | 34.80 | 31.96 | 30.01 | |||||||||||
| Conversion index | (%) | 58 | 60 | 61 | 61 | 61 | |||||||||||
| Balanced capacity of refineries | (kbbl/d) | 737 | 747 | 757 | 767 | 767 | |||||||||||
| Retail sales of petroleum products in Europe | (mmtonnes) | 12.03 | 12.02 | 11.73 | 11.37 | 10.87 | |||||||||||
| Service stations in Europe at year end | (units) | 5,956 | 5,986 | 6,167 | 6,287 | 6,384 | |||||||||||
| Average throughput per service station in Europe | (kliters) | 2,502 | 2,477 | 2,353 | 2,206 | 2,064 | |||||||||||
| Retail efficiency index | (%) | 1.56 | 1.61 | 1.53 | 1.50 | 1.48 | |||||||||||
| Employees at year end | (units) | 8,327 | 8,166 | 8,022 | 7,591 | 7,125 | |||||||||||
| Direct GHG emissions | (mmtonnes CO2 eq) | 7.74 | 7.29 | 7.76 | 7.23 | 6.03 | |||||||||||
| SOx (sulphur oxide) emissions | (ktonnes SO2 eq) | 23.18 | 21.98 | 28.05 | 23.07 | 16.99 | |||||||||||
| NOx (nitrogen oxide) emissions | (ktonnes NO2 eq) | 7.38 | 7.35 | 7.96 | 6.74 | 5.87 | |||||||||||
| Water consumption rate (refineries)/refinery throughputs | (cm/tonnes) | 36.29 | 35.99 | 28.36 | 30.98 | 25.33 | |||||||||||
| Biofuels marketed | (mmtonnes) | 9.90 | 18.15 | 17.79 | 13.26 | 14.83 | |||||||||||
| Customer satisfaction index | (likert scale) | 8.14 | 7.93 | 7.84 | 7.74 | 7.90 | |||||||||||
(a) Before elimination of intragroup sales.
Performance of the year
| I The injury frequency rates decreased from 2011(down 45% for employees and 27.7% for contractors). I In 2012 continued the declining trend of GHG, NOx and SOx emissions, benefiting from energy saving measures and increasing use of natural gas to replace fuel oil. I The 2012 scenario was weighted down by a steep fall in fuel demand in Italy and continued deteriorating fundamentals in the refining activity amidst volatile margins. Against this backdrop, Eni’s Refining & Marketing Division managed to reduce adjusted operating loss by euro 85 million from 2011 (down euro 179 million). This result reflects the better operating performances and improved efficiency and performance of refineries. Results posted by the Marketing activity were impacted by falling demand for fuel, high competitive pressure and increased expenses associated with certain marketing initiatives including a special discount on prices at the pump during the summer week-ends. | I In 2012 refining throughputs were 30.01 mmtonnes, down 6.1% from 2011. In Italy, processed volumes decreased by 7.8% due to scheduled standstills in order to mitigate the negative impact of the trading environment mainly at the Taranto and Gela refineries. Outside Italy, Eni’s refining throughputs increased by 3.2% in particular in the Czech Republic. I Retail sales in Italy of 7.83 mmtonnes decreased by 6.3% from 2011. This decline was driven by sharply lower consumption of gasoil and gasoline in Italy (down 8.3% from 2011) and increased competitive pressure. In 2012 Eni’s average retail market share was 31.2% increasing by 0.7 percentage points from 2011 benefiting from the commercial initiatives made in the third quarter of 2012. I Retail sales in the rest of Europe of 3.04 mmtonnes improved slightly from 2011 (up 1%). Volume additions in Austria and Switzerland, reflecting successful commercial initiatives were offset by lower sales in Eastern Europe due to declining demand. |
- 51 -
Contents
Eni Fact Book Refining & Marketing
| I Capital expenditure of euro 842 million related mainly to refining, supply and logistics (euro 583 million) to improve plants flexibility and yields, in particular at the Sannazzaro Refinery, and marketing for the streamlining and rebranding of the retail distribution network (euro 223 million).
| I In 2012 total expenditure in R&D in the Refining & Marketing Division amounted to approximately euro 34 million, net of general and administrative costs. In the year 7 patent applications were filed. Activities 1. Refining Eni, through its Refining & Marketing Division, is the leader operator in Italy in refining, with its five wholly owned refineries (Sannazzaro, Livorno, Porto Marghera, Taranto and Gela), and in marketing of petroleum products. In the rest of Europe Eni also holds interests in certain refining poles and is active in retail and wholesale sales in Central/Eastern European Countries. As of December 31, 2012, Eni’s refining system had total refinery capacity (balanced with conversion capacity) of approximately 38.3 mmtonnes (equal to 767 kbbl/d) and a conversion index of 61%. n Italy |
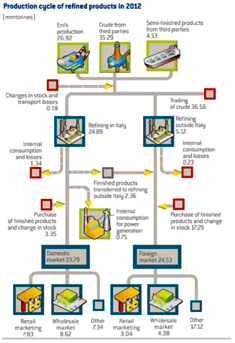
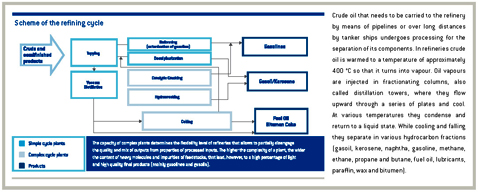
- 52 -
Contents
Eni Fact Book Refining & Marketing
| Eni refining system in 2012 |
Ownership share(%) | Distillation capacity (total)(kbbl/d) | Distillation capacity (Eni’s share)(kbbl/d) | (kbbl/d) | Conversion index(%) | Fluid catalytic cracking - FCC(kbbl/d) | Residue conversion(kbbl/d) | Go-Finer(kbbl/d) | Mild Hydro- cracking/ Hydro- cracking(kbbl/d) | Visbreaking/ Thermal Cracking(kbbl/d) | Coking(kbbl/d) | Distillation capacity utilization rate (Eni’s share)(%) | Balanced refining capacity utilization rate (Eni’s share)(%) |
| Wholly-owned refineries | 685 | 685 | 574 | 64 | 69 | 42 | 37 | 29 | 89 | 46 | 61 | 73 | ||||||||||||||
| Italy | ||||||||||||||||||||||||||
| Sannazzaro | 100 | 223 | 223 | 190 | 59 | 34 | 12 | 29 | 29 | 75 | 88 | |||||||||||||||
| Gela | 100 | 129 | 129 | 100 | 142 | 35 | 37 | 46 | 33 | 42 | ||||||||||||||||
| Taranto | 100 | 120 | 120 | 120 | 72 | 30 | 38 | 66 | 66 | |||||||||||||||||
| Livorno | 100 | 106 | 106 | 84 | 11 | 76 | 96 | |||||||||||||||||||
| Porto Marghera | 100 | 107 | 107 | 80 | 20 | 22 | 44 | 59 | ||||||||||||||||||
| Partially owned refineries (a) | 874 | 245 | 193 | 51 | 167 | 25 | 99 | 27 | 79 | 100 | ||||||||||||||||
| Italy | ||||||||||||||||||||||||||
| Milazzo | 50 | 248 | 124 | 80 | 76 | 45 | 25 | 32 | 73 | 113 | ||||||||||||||||
| Germany | ||||||||||||||||||||||||||
| Vohburg/Neustadt (Bayernoil) | 20 | 215 | 43 | 41 | 36 | 49 | 43 | 92 | 96 | |||||||||||||||||
| Schwedt | 8.33 | 231 | 19 | 19 | 42 | 49 | 27 | 101 | 104 | |||||||||||||||||
| Czech Republic | ||||||||||||||||||||||||||
| Kralupy and Litvinov (Ceská Rafinerska) | 32.4 | 180 | 58 | 53 | 30 | 24 | 24 | 75 | 83 | |||||||||||||||||
| TOTAL | 1,559 | 930 | 767 | 61 | 236 | 67 | 37 | 128 | 116 | 46 | 72 | 80 |
(a) Capacity of conversion plant is 100%.
| Sannazzaro: the refinery has balanced refining capacity of 190 kbbl/d and a conversion index of 59%. Management believes that this unit is among the most efficient refineries in Europe. Located in the Po Valley, it mainly supplies markets in North-Western Italy and Switzerland. The high degree of flexibility and conversion capacity of this refinery allows it to process a wide range of feedstock. From a logistical standpoint this refinery is located along the route of the Central Europe Pipeline, which links the Genoa terminal with French speaking Switzerland. This refinery contains two primary distillation plants and relevant facilities, including three desulphurization units. Conversion is obtained through a fluid catalytic cracker (FCC), two hydrocrackers (HdCK), which enable middle distillate conversion and a visbreaking thermal conversion unit with a gasification facility using the heavy residue from visbreaking (tar) to produce syn-gas to feed the nearby EniPower power plant at Ferrera Erbognone. Eni is developing a conversion plant employing the Eni Slurry Technology with a 23 kbbl/d capacity for the processing of extra heavy crude with high sulphur content producing high quality middle distillates, in particular gasoil, and reducing the yield of fuel oil to zero. Start-up of this facility is scheduled in 2013. In addition the Short Contact Time-Catalytic Partial Oxidation project is underway for the production of hydrogen. In addition, Eni is developing a conversion technology by means of Slurry Dual Catalyst (an evolution of EST) that is based on the combination of two nanocatalysts and could lead to a relevant breakthrough in the EST process, increasing its productivity and improving product quality, reducing expenditure and operating costs. In addition at the Sannazzaro Refinery the detailed design of a project for the production of hydrogen by means of the proprietary Hydrogen SCT-CPO (Short Contact Time-Catalytic Partial Oxidation) process is nearing completion. This reforming technology transforms gaseous and liquid hydrocarbons (also derived from biomass) into synthetic gas (carbon monoxide and hydrogen) at competitive costs. Taranto: the refinery has balanced refining capacity of 120 kbbl/d and a conversion index of 72%. This refinery can process a wide range of | crude and other feedstock. It principally produces fuels for automotive use and residential heating purposes for the Southern Italian markets. Besides its primary distillation plants and relevant facilities, including two units for the desulphurization of middle distillates, this refinery contains a two-stage thermal conversion plant (visbreaking/thermal cracking) and an RHU conversion plant for the conversion of high sulphur content residues into valuable products and catalytic cracking feedstocks. It processes most of the oil produced in Eni’s Val d’Agri fields carried to Taranto through the Monte Alpi pipeline (in 2012, a total of 2.26 mmtonnes of this oil were processed). Gela: the refinery has balanced refining capacity of 100 kbbl/d and a conversion index of 142%. This refinery is located on the southern coast of Sicily and is integrated with upstream operations as it processes heavy crude produced from Eni’s nearby offshore and onshore fields in Sicily. Its high conversion level is ensured by an FCC unit with go-finer for feedstocks upgrading and two coking plants enabling conversion of heavy residues, topping or vacuum residues. The power plant of this refinery also contains residue and exhaust fume treatment plants (so-called SNOx) which allow full compliance with the tightest environmental standards, removing almost all sulphur and nitrogen composites coming from the coke burning-process. An upgrade of the Gela refinery is underway by means of a refurbishment of its power plant, substantially renewing pet-coke boilers, aimed at increasing profitability maximizing synergies deriving from the integration of refining and power generation. Livorno: the refinery, with balanced refining capacity of 84 kbbl/d and a conversion index of 11%, manufactures mainly gasoline, fuel oil for bunkering and lubricant bases. Besides its primary distillation plants, this refinery contains two lubricant manufacturing lines. Its pipeline links with the local harbor and with the Florence storage sites by means of two pipelines and optimizes intake, handling and distribution of products. |
- 53 -
Contents
Eni Fact Book Refining & Marketing
| Porto Marghera: the refinery, with balanced refining capacity of 80 kbbl/d and a conversion index of 20%, supplies mainly markets in North-Eastern Italy and Austria. Besides its primary distillation plants, this refinery contains a two-stage thermal conversion plant (visbreaking/thermal cracking) designed to increase yields of valuable products. Eni intends to convert this plant into a bio-refinery based on an established proprietary technology (Ecofinig) for the production of bio-diesel. The conversion process is scheduled to start in the second quarter of 2013 while production is expected in early 2014 when the conversion is completed. Milazzo: jointly-owned by Eni and Kuwait Petroleum Italy, the refinery has balanced primary refining capacity of 80 kbbl/d (Eni’s share) and a conversion rate of 76%. It is located on the northern | coast of Sicily and is provided with two primary distillation plants, one unit of fluid catalytic cracking (FCC), one hydrocracking unit for the conversion of middle distillates (HdCK) and one unit devoted to the residue treatment process (LC-Finer). n Outside Italy |
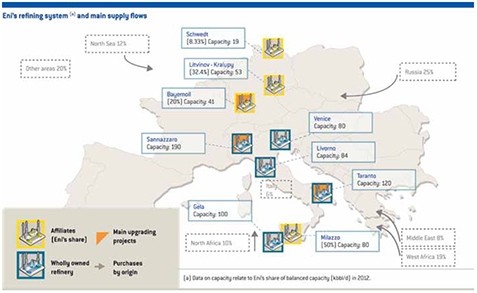
| 2. Logistics Eni is a primary operator in storage and transport of petroleum products in Italy with its logistical integrated infrastructure consisting of 20 directly managed storage sites and a network of petroleum product pipelines for the sale and storage of refined products, LPG and crude. Eni’s logistics model is organized in a hub structure including five main areas. These hubs monitor and centralize the handling of product flows aiming to drive forward more efficiency particularly in cost control of collection and delivery of orders. Eni holds interests in five joint entities established by partnering the major Italian operators. These are located in Vado Ligure-Genova (Petrolig), Arquata Scrivia (Sigemi), Venice (Petroven), Ravenna (Petra) and Trieste (DCT) and aim at reducing logistic cost and increasing efficiency. Eni operates in the transport of oil and refined products: (i) by sea through spot and long-term lease contracts of tanker ships; and | (ii) on land through the ownership of a pipeline network extending approximately 1,447 kilometers. Secondary distribution to retail and wholesale markets is effected through third parties who also own their means of transportation. 3. Marketing n Retail Italy |
- 54 -
Contents
Eni Fact Book Refining & Marketing
| by approximately 197 kliters from 2011. At December 31, 2012, Eni’s retail network in Italy consisted of 4,780 service stations, 79 more than at December 31, 2011 (4,701 service stations), resulting from the positive balance of acquisitions/releases of lease concessions (92 units), the opening of new service stations (10 units), partly offset by the closing of service stations with low throughput (23 units).
Premium fuels In 2012 Eni continued the development of innovative fuels and biofuels with proprietary additives and detergents that provide better gasoline and gasoil with a "keep clean" component. Eni also continues its activity in the area of special fuels for racing (Aprilia racing, Ducati, Moto 2, Moto 3, Superbike). Promotional actions "riparti con eni" | fuels and a relevant increase in monthly market share (along with the iperself 24h initiative on over 3,280 service stations): June was up 5.4%, July up 8.3%, August up 8.2% and September up 4.7%. Co-marketing New loyalty and payment cards Routex Multicard Non-oil n Retail rest of Europe |
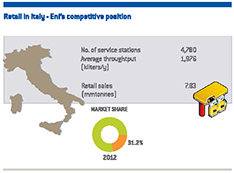
- 55 -
Contents
Eni Fact Book Refining & Marketing
| releases of lease concessions (33 units) in particular in Austria; (iii) the purchase of 11 service stations, in particular in Austria; (iv) the opening of 2 new outlets. Average throughput (2,319 kliters) increased by 20 kliters from 2011 (2,299 kliters). Eni’s strategy in the rest of Europe is focused on selectively growing its market share, particularly in Germany, Austria and Eastern Countries (e.g. Czech Republic) leveraging on the synergies ensured by the proximity of these markets to Eni’s production and logistics facilities.
4. Wholesale Business Fuels | mmtonnes increased by 3.1% from 2011 due to higher sales in Switzerland, the Czech Republic, Slovenia and France. Sales declined in Hungary, Austria and Germany. Other sales (23.20 mmtonnes) increased by 4.89 mmtonnes, or 27%, mainly due to higher sales volumes to oil companies. Eni is also active in the international market of bunkering, marketing marine fuel mainly in 106 ports, of which 72 are in Italy. In 2012, marine fuel sales were 1.75 mmtonnes of which 1.67 mmtonnes in Italy. LPG Lubricants Oxygenates |
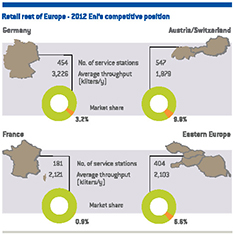
- 56 -
Contents
Eni Fact Book Refining & Marketing
Supply of oil | (mmtonnes) | 2008 | 2009 | 2010 | 2011 | 2012 |
| Equity crude oil | |||||||||||||||||
| Production outside Italy | 26.14 | 29.84 | 26.90 | 24.29 | 23.57 | ||||||||||||
| Production in Italy | 3.57 | 2.91 | 3.24 | 3.35 | 3.35 | ||||||||||||
| 29.71 | 32.75 | 30.14 | 27.64 | 26.92 | |||||||||||||
| Other crude oil | |||||||||||||||||
| Purchases on spot markets | 12.09 | 14.94 | 20.95 | 20.44 | 24.95 | ||||||||||||
| Purchases under long-term contracts | 16.11 | 19.71 | 17.16 | 10.94 | 10.34 | ||||||||||||
| 28.20 | 34.65 | 38.11 | 31.38 | 35.29 | |||||||||||||
| Total crude oil purchases | 57.91 | 67.40 | 68.25 | 59.02 | 62.21 | ||||||||||||
| Purchases of intermediate products | 3.39 | 2.92 | 3.05 | 4.26 | 4.53 | ||||||||||||
| Purchase of products | 17.42 | 13.98 | 15.28 | 15.85 | 20.52 | ||||||||||||
| TOTAL PURCHASES | 78.72 | 84.30 | 86.58 | 79.13 | 87.26 | ||||||||||||
| Consumption for power generation | (1.00 | ) | (0.96 | ) | (0.92 | ) | (0.89 | ) | (0.75 | ) | |||||||
| Other changes (a) | (1.04 | ) | (1.64 | ) | (2.69 | ) | (1.12 | ) | (1.63 | ) | |||||||
| 76.68 | 81.70 | 82.97 | 77.12 | 84.88 | |||||||||||||
| (a) Include changes in inventories, transport declines, consumption and losses. |
Refinery capacity | 2008 | 2009 | 2010 | 2011 | 2012 |
| Primary distillation capacity (a) | (kbbl/d) | 930 | 930 | 930 | 930 | 930 | ||||||
| Balanced capacity (a) | 737 | 747 | 757 | 767 | 767 | |||||||
| Refinery throughputs on own account | 717 | 480 | 514 | 455 | 417 | |||||||
| Distillation capacity utilization rate | (%) | 81 | 73 | 73 | 72 | 72 | ||||||
| (a) Eni’s share. |
Availability of refined products | (mmtonnes) | 2008 | 2009 | 2010 | 2011 | 2012 |
| ITALY | |||||||||||||||||
| At wholly-owned refineries | 25.59 | 24.02 | 25.70 | 22.75 | 20.84 | ||||||||||||
| Less input on account of third parties | (1.37 | ) | (0.49 | ) | (0.50 | ) | (0.49 | ) | (0.47 | ) | |||||||
| At affiliate refineries | 6.17 | 5.87 | 4.36 | 4.74 | 4.52 | ||||||||||||
| Refinery throughputs on own account | 30.39 | 29.40 | 29.56 | 27.00 | 24.89 | ||||||||||||
| Consumption and losses | (1.61 | ) | (1.60 | ) | (1.69 | ) | (1.55 | ) | (1.34 | ) | |||||||
| Products available for sale | 28.78 | 27.80 | 27.87 | 25.45 | 23.55 | ||||||||||||
| Purchases of refined products and change in inventories | 2.56 | 3.73 | 4.24 | 3.22 | 3.35 | ||||||||||||
| Products transferred to operations outside Italy | (1.42 | ) | (3.89 | ) | (4.18 | ) | (1.77 | ) | (2.36 | ) | |||||||
| Consumption for power generation | (1.00 | ) | (0.96 | ) | (0.92 | ) | (0.89 | ) | (0.75 | ) | |||||||
| Sales of products | 28.92 | 26.68 | 27.01 | 26.01 | 23.79 | ||||||||||||
| OUTSIDE ITALY | |||||||||||||||||
| Refinery throughputs on own account | 5.45 | 5.15 | 5.24 | 4.96 | 5.12 | ||||||||||||
| Consumption and losses | (0.25 | ) | (0.25 | ) | (0.24 | ) | (0.23 | ) | (0.23 | ) | |||||||
| Products available for sale | 5.20 | 4.90 | 5.00 | 4.73 | 4.89 | ||||||||||||
| Purchases of finished products and change in inventories | 15.14 | 10.12 | 10.61 | 12.51 | 17.29 | ||||||||||||
| Products transferred from Italian operations | 1.42 | 3.89 | 4.18 | 1.77 | 2.36 | ||||||||||||
| Sales of products | 21.76 | 18.91 | 19.79 | 19.01 | 24.54 | ||||||||||||
| Refinery throughputs on own account | 35.84 | 34.55 | 34.80 | 31.96 | 30.01 | ||||||||||||
| of which: refinery throughputs of equity crude on own account | 6.98 | 5.11 | 5.02 | 6.54 | 6.39 | ||||||||||||
| Total sales of refined products | 50.68 | 45.59 | 46.80 | 45.02 | 48.33 | ||||||||||||
| Crude oil sales | 26.00 | 36.11 | 36.17 | 32.10 | 36.56 | ||||||||||||
| TOTAL SALES | 76.68 | 81.70 | 82.97 | 77.12 | 84.89 | ||||||||||||
- 57 -
Contents
Eni Fact Book Refining & Marketing
Production and sales | (mmtonnes) | 2008 | 2009 | 2010 | 2011 | 2012 |
| Products: | ||||||||||||
| Gasoline | 8.32 | 8.43 | 7.81 | 7.24 | 6.88 | |||||||
| Gasoil | 13.44 | 13.33 | 13.63 | 12.95 | 12.24 | |||||||
| Jet fuel/kerosene | 1.54 | 1.42 | 1.46 | 1.41 | 1.35 | |||||||
| Fuel oil | 4.34 | 4.01 | 3.75 | 2.65 | 2.77 | |||||||
| LPG | 0.71 | 0.66 | 0.50 | 0.57 | 0.51 | |||||||
| Lubricants | 0.60 | 0.49 | 0.67 | 0.54 | 0.62 | |||||||
| Petrochemical feedstock | 2.16 | 2.08 | 2.59 | 2.49 | 2.06 | |||||||
| Other | 2.86 | 2.28 | 2.46 | 2.33 | 2.00 | |||||||
| Total products | 33.97 | 32.70 | 32.87 | 30.18 | 28.43 | |||||||
| Sales: | ||||||||||||
| Italy | 28.92 | 26.68 | 27.01 | 26.01 | 23.79 | |||||||
| Gasoline | 3.26 | 3.17 | 2.91 | 2.78 | 2.61 | |||||||
| Gasoil | 10.03 | 10.04 | 9.94 | 9.63 | 9.14 | |||||||
| Jet fuel/kerosene | 1.94 | 1.42 | 1.45 | 1.64 | 1.56 | |||||||
| Fuel oil | 0.85 | 0.72 | 0.44 | 0.46 | 0.33 | |||||||
| LPG | 0.57 | 0.57 | 0.59 | 0.60 | 0.61 | |||||||
| Lubricants | 0.13 | 0.09 | 0.11 | 0.10 | 0.10 | |||||||
| Petrochemical feedstock | 1.70 | 1.33 | 1.72 | 1.71 | 1.26 | |||||||
| Other | 10.44 | 9.34 | 9.85 | 9.09 | 8.18 | |||||||
| Rest of Europe | 19.63 | 16.02 | 16.66 | 15.88 | 16.08 | |||||||
| Gasoline | 2.21 | 1.89 | 1.85 | 1.79 | 1.81 | |||||||
| Gasoil | 5.11 | 3.55 | 3.95 | 3.71 | 3.96 | |||||||
| Jet fuel/kerosene | 0.47 | 0.35 | 0.38 | 0.48 | 0.44 | |||||||
| Fuel oil | 0.23 | 0.29 | 0.25 | 0.23 | 0.19 | |||||||
| LPG | 0.16 | 0.14 | 0.12 | 0.12 | 0.13 | |||||||
| Lubricants | 0.11 | 0.08 | 0.10 | 0.09 | 0.08 | |||||||
| Other | 11.34 | 9.72 | 10.01 | 9.46 | 9.47 | |||||||
| Extra Europe | 2.13 | 2.89 | 3.13 | 3.13 | 8.46 | |||||||
| Gasoline | 1.63 | 2.51 | 2.74 | 2.62 | 8.00 | |||||||
| LPG | 0.37 | 0.36 | 0.37 | 0.38 | 0.39 | |||||||
| Lubricants | 0.03 | 0.02 | 0.02 | 0.02 | 0.01 | |||||||
| Other | 0.10 | 0.00 | 0.00 | 0.11 | 0.06 | |||||||
| Worldwide | ||||||||||||
| Gasoline | 7.10 | 7.57 | 7.50 | 7.19 | 12.42 | |||||||
| Gasoil | 15.14 | 13.59 | 13.89 | 13.34 | 13.10 | |||||||
| Jet fuel/kerosene | 2.41 | 1.77 | 1.83 | 2.12 | 2.00 | |||||||
| Fuel oil | 1.08 | 1.01 | 0.69 | 0.69 | 0.52 | |||||||
| LPG | 1.10 | 1.07 | 1.08 | 1.10 | 1.13 | |||||||
| Lubricants | 0.27 | 0.19 | 0.23 | 0.21 | 0.19 | |||||||
| Petrochemical feedstock | 1.70 | 1.33 | 1.72 | 1.71 | 1.26 | |||||||
| Other | 21.88 | 19.06 | 19.86 | 18.66 | 17.71 | |||||||
| Total sales | 50.68 | 45.59 | 46.80 | 45.02 | 48.33 | |||||||
- 58 -
Contents
Eni Fact Book Refining & Marketing
Sales in Italy and outside Italy by market | (mmtonnes) | 2008 | 2009 | 2010 | 2011 | 2012 |
| Retail | 8.81 | 9.03 | 8.63 | 8.36 | 7.83 | |||||||
| Wholesale | 11.15 | 9.56 | 9.45 | 9.36 | 8.62 | |||||||
| 19.96 | 18.59 | 18.08 | 17.72 | 16.45 | ||||||||
| Petrochemicals | 1.70 | 1.33 | 1.72 | 1.71 | 1.26 | |||||||
| Other markets | 7.26 | 6.76 | 7.21 | 6.58 | 6.08 | |||||||
| Sales in Italy | 28.92 | 26.68 | 27.01 | 26.01 | 23.79 | |||||||
| Retail rest of Europe | 3.22 | 2.99 | 3.10 | 3.01 | 3.04 | |||||||
| Wholesale rest of Europe | 3.94 | 3.66 | 3.88 | 3.84 | 3.96 | |||||||
| Wholesale outside Europe | 0.56 | 0.41 | 0.42 | 0.43 | 0.42 | |||||||
| 7.72 | 7.06 | 7.40 | 7.28 | 7.42 | ||||||||
| Other markets | 12.52 | 11.85 | 12.39 | 11.73 | 17.12 | |||||||
| Sales outside Italy | 20.24 | 18.91 | 19.79 | 19.01 | 24.54 | |||||||
| Total sales | 49.16 | 45.59 | 46.80 | 45.02 | 48.33 | |||||||
Retail and wholesale sales of refined products | (mmtonnes) | 2008 | 2009 | 2010 | 2011 | 2012 |
| Italy | 19.96 | 18.59 | 18.08 | 17.72 | 16.45 | |||||||
| Retail sales | 8.81 | 9.03 | 8.63 | 8.36 | 7.83 | |||||||
| Gasoline | 3.11 | 3.05 | 2.76 | 2.60 | 2.41 | |||||||
| Gasoil | 5.50 | 5.74 | 5.58 | 5.45 | 5.08 | |||||||
| LPG | 0.19 | 0.22 | 0.26 | 0.29 | 0.31 | |||||||
| Other | 0.01 | 0.02 | 0.03 | 0.02 | 0.03 | |||||||
| Wholesale sales | 11.15 | 9.56 | 9.45 | 9.36 | 8.62 | |||||||
| Gasoil | 4.52 | 4.30 | 4.36 | 4.18 | 4.07 | |||||||
| Fuel oil | 0.85 | 0.72 | 0.44 | 0.46 | 0.33 | |||||||
| LPG | 0.38 | 0.35 | 0.33 | 0.31 | 0.30 | |||||||
| Gasoline | 0.15 | 0.12 | 0.16 | 0.19 | 0.20 | |||||||
| Lubricants | 0.12 | 0.09 | 0.10 | 0.10 | 0.09 | |||||||
| Bunker | 1.70 | 1.38 | 1.35 | 1.26 | 1.19 | |||||||
| Jet fuel | 1.94 | 1.43 | 1.46 | 1.65 | 1.56 | |||||||
| Other | 1.49 | 1.17 | 1.25 | 1.21 | 0.88 | |||||||
| Outside Italy (retail + wholesale) | 7.72 | 7.06 | 7.40 | 7.28 | 7.42 | |||||||
| Gasoline | 2.12 | 1.89 | 1.85 | 1.79 | 1.81 | |||||||
| Gasoil | 3.80 | 3.54 | 3.95 | 3.82 | 3.96 | |||||||
| Jet fuel | 0.47 | 0.35 | 0.40 | 0.49 | 0.44 | |||||||
| Fuel oil | 0.23 | 0.28 | 0.25 | 0.23 | 0.19 | |||||||
| Lubricants | 0.11 | 0.10 | 0.10 | 0.10 | 0.09 | |||||||
| LPG | 0.52 | 0.50 | 0.49 | 0.50 | 0.52 | |||||||
| Other | 0.47 | 0.40 | 0.36 | 0.35 | 0.41 | |||||||
| Total | 27.68 | 25.65 | 25.48 | 25.00 | 23.87 | |||||||
Number of service stations | (units) | 2008 | 2009 | 2010 | 2011 | 2012 |
| Italy | 4,409 | 4,474 | 4,542 | 4,701 | 4,780 | |||||||
| Ordinary stations | 4,273 | 4,344 | 4,415 | 4,574 | 4,653 | |||||||
| Highway stations | 136 | 130 | 127 | 127 | 127 | |||||||
| Outside Italy | 1,547 | 1,512 | 1,625 | 1,586 | 1,604 | |||||||
| Germany | 521 | 478 | 455 | 454 | 445 | |||||||
| France | 199 | 196 | 188 | 181 | 173 | |||||||
| Austria/Switzerland | 458 | 446 | 582 | 547 | 575 | |||||||
| Eastern Europe | 369 | 392 | 400 | 404 | 411 | |||||||
| Service stations selling Blu products | 4,445 | 4,822 | 4,994 | 5,179 | 5,226 | |||||||
| "Multi-Energy" service stations | 4 | 4 | 5 | 5 | 6 | |||||||
| Service stations selling LPG and natural gas | 537 | 690 | 657 | 864 | 1,031 | |||||||
| Non-oil sales | (euro million) | 153 | 147 | 136.9 | 156 | 159 | ||||||
- 59 -
Contents
Eni Fact Book Refining & Marketing
Average throughput | (kliters/No. of service stations) | 2008 | 2009 | 2010 | 2011 | 2012 |
| Italy | 2,470 | 2,482 | 2,322 | 2,173 | 1,976 | |||||||
| Germany | 2,868 | 3,167 | 3,360 | 3,237 | 3,226 | |||||||
| France | 2,152 | 2,193 | 2,310 | 2,209 | 2,121 | |||||||
| Iberian Peninsula (a) | 2,519 | - | - | - | - | |||||||
| Austria/Switzerland | 1,763 | 1,691 | 1,711 | 1,645 | 1,879 | |||||||
| Eastern Europe | 2,832 | 2,642 | 2,508 | 2,591 | 2,145 | |||||||
| Average throughput | 2,502 | 2,477 | 2,352 | 2,206 | 2,064 | |||||||
(a) Refers to the first nine months of 2008. In October 2008 downstream activities including 371 service stations were sold to Galp.
Market shares in Italy | (%) | 2008 | 2009 | 2010 | 2011 | 2012 |
| Retail | 30.6 | 31.5 | 30.4 | 30.5 | 31.2 | |||||||
| Gasoline | 28.5 | 29.0 | 27.9 | 27.8 | 28.8 | |||||||
| Gasoil | 32.7 | 33.8 | 32.5 | 32.6 | 33.2 | |||||||
| LPG (automotive) | 19.1 | 20.2 | 21.4 | 22.7 | 23.1 | |||||||
| Lubricants | 23.7 | 21.5 | 35.7 | 27.6 | 35.4 | |||||||
| Wholesale | 30.4 | 27.5 | 29.2 | 28.3 | 29.5 | |||||||
| Gasoil | 31.8 | 32.0 | 33.5 | 30.8 | 33.0 | |||||||
| Fuel oil | 16.3 | 17.2 | 17.8 | 25.5 | 23.3 | |||||||
| Bunker | 44.6 | 40.1 | 40.4 | 33.6 | 37.6 | |||||||
| Lubricants | 25.0 | 23.3 | 24.0 | 23.6 | 24.1 | |||||||
| Domestic market share | 31.0 | 29.3 | 29.8 | 29.3 | 30.3 | |||||||
Retail market shares outside Italy | (%) | 2008 | 2009 | 2010 | 2011 | 2012 |
| Central Europe | ||||||||||||
| Austria | 7.0 | 7.3 | 7.0 | 9.6 | 11.7 | |||||||
| Switzerland | 6.4 | 6.4 | 6.5 | 6.6 | 7.1 | |||||||
| Germany | 3.8 | 3.4 | 3.4 | 3.1 | 3.2 | |||||||
| France | 1.1 | 1.1 | 1.1 | 1.0 | 0.9 | |||||||
| Eastern Europe | ||||||||||||
| Hungary | 11.6 | 11.6 | 11.9 | 11.9 | 11.9 | |||||||
| Czech Republic | 11.4 | 11.3 | 11.8 | 11.6 | 10.8 | |||||||
| Slovakia | 10.2 | 9.2 | 9.7 | 9.8 | 9.7 | |||||||
| Slovenia | 2.1 | 2.4 | 2.3 | 2.2 | 2.2 | |||||||
| Romania | 1.2 | 1.5 | 1.7 | 1.8 | ||||||||
Capital expenditure | (euro million) | 2008 | 2009 | 2010 | 2011 | 2012 |
| Italy | 850 | 581 | 633 | 803 | 781 | |||||||
| Outside Italy | 115 | 54 | 78 | 63 | 61 | |||||||
| 965 | 635 | 711 | 866 | 842 | ||||||||
| Refining, supply and logistic | 630 | 436 | 446 | 629 | 622 | |||||||
| Italy | 630 | 436 | 444 | 626 | 618 | |||||||
| Outside Italy | 2 | 3 | 4 | |||||||||
| Marketing | 298 | 172 | 246 | 228 | 220 | |||||||
| Italy | 183 | 118 | 170 | 168 | 163 | |||||||
| Outside Italy | 115 | 54 | 76 | 60 | 57 | |||||||
| Other | 37 | 27 | 19 | 9 | ||||||||
| 965 | 635 | 711 | 866 | 842 | ||||||||
- 60 -
Contents
Eni Fact Book Chemicals
Chemicals |
Key performance indicators |
2008 | 2009 | 2010 | 2011 | 2012 | ||||||||
| Employees injury frequency rate | (No. of accidents per million of worked hours) | 2.57 | 2.34 | 1.54 | 1.47 | 0.76 | |||||||||||
| Contractors injury frequency rate | 9.95 | 8.12 | 5.94 | 4.60 | 1.66 | ||||||||||||
| Net sales from operations (a) | (euro million) | 6,303 | 4,203 | 6,141 | 6,491 | 6,418 | |||||||||||
| Intermediates | 3,060 | 1,832 | 2,833 | 2,987 | 3,110 | ||||||||||||
| Polymers | 2,961 | 2,185 | 3,126 | 3,299 | 3,128 | ||||||||||||
| Other sales | 282 | 186 | 182 | 205 | 180 | ||||||||||||
| Operating profit | (845 | ) | (675 | ) | (86 | ) | (424 | ) | (683 | ) | |||||||
| Adjusted operating profit | (398 | ) | (426 | ) | (96 | ) | (273 | ) | (485 | ) | |||||||
| Adjusted net profit | (323 | ) | (340 | ) | (73 | ) | (206 | ) | (395 | ) | |||||||
| Capital expenditure | 212 | 145 | 251 | 216 | 172 | ||||||||||||
| Production | (ktonnes) | 7,372 | 6,521 | 7,220 | 6,245 | 6,090 | |||||||||||
| Sales of petrochemical products | 4,684 | 4,265 | 4,731 | 4,040 | 3,953 | ||||||||||||
| Average plant utilization rate | (%) | 68.6 | 65.4 | 72.9 | 65.3 | 66.7 | |||||||||||
| Employees at year end | (units) | 6,274 | 6,068 | 5,972 | 5,804 | 5,668 | |||||||||||
| Direct GHG emissions | (mmtonnes CO2 eq) | 4.90 | 4.63 | 4.69 | 4.12 | 3.69 | |||||||||||
| NMVOC (Non-Methane Volatile Organic Compound) emissions | (ktonnes) | 3.61 | 3.83 | 4.71 | 4.18 | 4.40 | |||||||||||
| SOx emissions (sulphur oxide) | (ktonnes SO2 eq) | 5.12 | 4.59 | 3.30 | 3.17 | 2.19 | |||||||||||
| NOx emissions (nitrogen oxide) | (ktonnes NO2 eq) | 5.27 | 4.78 | 4.87 | 4.14 | 3.43 | |||||||||||
| Recycled/reused water | (%) | 79.6 | 81.6 | 82.7 | 81.8 | 81.5 | |||||||||||
| (a) Before elimination of intragroup sales. |
Performance of the year
| I In 2012 injury rates of employees and contractors continued to follow the positive trends of previous years (down 48.3% and 63.9%, respectively). I In 2012 emissions of greenhouse gases, NOX and SOX decreased due to lower production volumes and energy saving interventions performed in the year. NMVOC emissions increased mainly at the Dunkerque site due to the unavailability of the plant collecting NMVOC emissions from polyethylene silos. I In 2012 the sector reported a significant increase in adjusted net loss (euro 395 million, down euro 189 million) from 2011, due to weak trends in demand for commodities resulting from the economic slowdown and collapsing unit margins. I Sales of petrochemical products were 3,953 ktonnes, down 87 ktonnes, or 2.1%, from 2011 due to lower consumption. I Chemical production volumes were 6,090 ktonnes, decreasing by 155 ktonnes, down 2.48%, due to a decline in demand for chemical products in all businesses, in particular polyethylene. | I In 2012 overall expenditure in R&D amounted to approximately euro 38 million in line with the previous year. A total of 18 new patent applications were filed, one of these jointly with the Exploration & Production Division. Expansion on international markets Green Chemistry |
- 61 -
Contents
Eni Fact Book Chemicals
| to the construction of a biomass power station. Versalis will manufacture materials for consumer and medical specialty markets with hypoallergenic qualities that are expected to generate higher margins. The partnership will leverage Yulex’s core competencies including crop science and bio-rubber extraction technologies, to boost Versalis’ bio-based portfolio. The investment will include an ambitious research project to develop technologies targeting the tire industry. With its market leading position in the elastomer industry Versalis plans to expand its leading-edge technologies in | the synthetic rubber business by including guayule rubber as a supplementary business opportunity and an increased commercial offering. In June 2012, a Memorandum of Understanding has been signed with Genomatica and Novamont to establish a technological joint venture in Italy governing a four-year research project aimed at developing a new technology for the production of butadiene from renewable feedstocks. This joint venture will also hold exclusive right for the industrial application of the research results, including licensing it to third parties. |
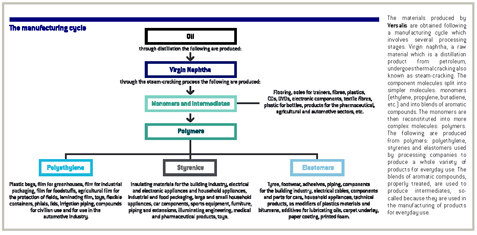
Activities
| Eni through Versalis performs activities of production and marketing of petrochemical products (basic petrochemicals and polymers), leveraging on a wide range of proprietary technologies, advanced production facilities, as well as a large and efficient retail network present in 18 European Countries. Versalis’ portfolio of proprietary technologies covers the whole field of basic petrochemicals and polymers: phenol and its derivatives, polyethylene, styrenes and elastomers as well as catalysts and specialty products. As a producer of intermediates, all types of polyethylene and a wide range of elastomers/lattices and of the complete line of styrenic products, Versalis continues in the development of its proprietary technologies supported by the experience it gained in production and R&D. This approach favored the optimization of the design of equipment and plants, of their performance, of proprietary catalysts and other products that allowed it to achieve excellence | in all technologies in the specific business areas in order to compete in markets worldwide. A key role is played by the most innovative proprietary catalysts, such as those based on zeolites developed by Versalis as building blocks of some of its most advanced technologies and available worldwide. The principal objective of basic petrochemicals is granting the adequate availability of monomers (ethylene, butadiene and benzene) covering the needs of further production processes: in particular olefins production is strictly linked with the polyethylene and elastomers business, aromatics grant the benzene availability necessary to produce intermediate products used in the production of resins, artificial fibers and polystyrene. In polymers business Versalis is one of the most relevant European producers of elastomers, where it is present in almost all the relevant sectors (in particular the automotive industry), polystyrene and polyethylene, whose most relevant use is in flexible packaging. |
- 62 -
Contents
Eni Fact Book Chemicals

Business areas
| Intermediates | ||
| Basic petrochemicals are one of the pillars of the petrochemical activities of Versalis, whose products have a range of important industrial uses, such as the production of polyethylene, polypropylene, PVC and polystyrene. They are also used in the production of petrochemical intermediates that converge, in turn, into a range of other productive processes: plastics, rubbers, fibers, solvents and lubricants. In 2012 basic petrochemicals revenues (euro 3,110 million) increased by euro 123 million from 2011 (up 4%) due to the positive performance of derivatives reflecting increased volumes (up 21%) and average unit prices (up 10%) as a result of an improved scenario and product availability. Olefin and aromatics sales volumes declined (down 2% and 4.5%, respectively) mainly due to facility downtimes at the polyethylene plants in Sicily due to low profitability and declining demand. Average unit prices of olefins were stable, while aromatics process increased (up 12%) driven by increased benzene prices (up 18.7%). Production of intermediates (4,112 ktonnes) was in line with 2011 (up 0.3%). Derivatives production increased by 12% as phenol derivatives and styrene monomer had been affected in 2011 by the planned facility downtimes in the Mantova plant. Polymers | transformation technologies. The most common applications are for industrial packaging and in the food industry, small and large electrical appliances, building isolation, electrical and electronic devices, household appliances, car components and toys; - Elastomers that are polymers characterized by high elasticity that allow them to regain their original shape even after having been subjected to extensive deformation. Versalis has a leading position in this sector and produces a wide range of products for the following sectors: tyres, footwear, adhesives, building components, pipes, electrical cables, car components and sealing, household appliances; they can be used as modifiers for plastics and bitumens, as additives for lubricating oils (solid elastomers); paper coating and saturation, carpet backing, molded foams, adhesives (synthetic latex). Versalis is one of the world’s major producers of elastomers and synthetic latex. In 2012 polymer revenues (euro 3,128 million) decreased by euro 171 million from 2011 (down 5.2%) mainly due to decreasing sales volumes (down 5.8%) due to a steep decline in demand in particular in Europe and Italy, offset in part, by a modest rise in demand in Eastern Europe. |
- 63 -
Contents
Eni Fact Book Chemicals
Product availability | (ktonnes) | 2008 | 2009 | 2010 | 2011 | 2012 |
| Intermediates | 5,110 | 4,350 | 4,860 | 4,101 | 4,112 | ||||||||||||
| Polymers | 2,262 | 2,171 | 2,360 | 2,144 | 1,978 | ||||||||||||
| Production | 7,372 | 6,521 | 7,220 | 6,245 | 6,090 | ||||||||||||
| Consumption and losses | (3,539 | ) | (2,701 | ) | (2,912 | ) | (2,631 | ) | (2,545 | ) | |||||||
| Purchases and change in inventories | 851 | 445 | 423 | 426 | 408 | ||||||||||||
| 4,684 | 4,265 | 4,731 | 4,040 | 3,953 | |||||||||||||
Revenues by geographic area | (euro million) | 2008 | 2009 | 2010 | 2011 | 2012 |
| Italy | 3,290 | 2,215 | 3,131 | 3,364 | 3,172 | |||||||
| Rest of Europe | 2,646 | 1,701 | 2,632 | 2,747 | 2,826 | |||||||
| Asia | 200 | 169 | 139 | 182 | 271 | |||||||
| Africa | 88 | 76 | 127 | 101 | 84 | |||||||
| Americas | 75 | 39 | 108 | 93 | 61 | |||||||
| Other areas | 4 | 3 | 4 | 4 | 4 | |||||||
| 6,303 | 4,203 | 6,141 | 6,491 | 6,418 | ||||||||
Revenues by product | (euro million) | 2008 | 2009 | 2010 | 2011 | 2012 |
| Olefins | 1,763 | 1,059 | 1,705 | 1,754 | 1,792 | |||||||
| Aromatics | 679 | 486 | 704 | 835 | 819 | |||||||
| Intermediates | 618 | 287 | 424 | 398 | 499 | |||||||
| Elastomers | 754 | 579 | 834 | 1,062 | 979 | |||||||
| Styrenics | 633 | 465 | 695 | 741 | 715 | |||||||
| Polyethylene | 1,574 | 1,140 | 1,597 | 1,496 | 1,434 | |||||||
| Other | 282 | 187 | 182 | 205 | 180 | |||||||
| 6,303 | 4,203 | 6,141 | 6,491 | 6,418 | ||||||||
Capital expenditure | (euro million) | 2008 | 2009 | 2010 | 2011 | 2012 |
| 212 | 145 | 251 | 216 | 172 | ||||||||
| of which: | ||||||||||||
| - upkeeping | 84 | 28 | 59 | 59 | 25 | |||||||
| - plant upgrades | 51 | 58 | 116 | 53 | 53 | |||||||
| - HSE | 41 | 28 | 29 | 46 | 38 | |||||||
| - energy recovery | 45 | 42 | 41 | |||||||||
| - maintenance and rationalization | 24 | 20 | ||||||||||
- 64 -
Contents
Eni Fact Book Engineering & Construction
Engineering & Construction |
Key performance indicators |
2008 | 2009 | 2010 | 2011 | 2012 | ||||||||
| Employees injury frequency rate | (No. of accidents per million of worked hours) | 0.70 | 0.40 | 0.45 | 0.44 | 0.54 | ||||||
| Contractors injury frequency rate | 0.38 | 0.57 | 0.33 | 0.21 | 0.17 | |||||||
| Fatality index | (No. of fatalities per 100 million of worked hours) | 2.83 | 0.86 | 2.14 | 1.82 | 0.93 | ||||||
| Net sales from operations (a) | (euro million) | 9,176 | 9,664 | 10,581 | 11,834 | 12,771 | ||||||
| Operating profit | 1,045 | 881 | 1,302 | 1,422 | 1,433 | |||||||
| Adjusted operating profit | 1,041 | 1,120 | 1,326 | 1,443 | 1,465 | |||||||
| Adjusted net profit | 784 | 892 | 994 | 1,098 | 1,109 | |||||||
| Capital expenditure | 2,027 | 1,630 | 1,552 | 1,090 | 1,011 | |||||||
| Orders acquired | (euro million) | 13,860 | 9,917 | 12,935 | 12,505 | 13,391 | ||||||
| Order backlog | 19,105 | 18,730 | 20,505 | 20,417 | 19,739 | |||||||
| Employees at year end | (units) | 35,629 | 35,969 | 38,826 | 38,561 | 43,387 | ||||||
| Employees outside Italy rate | (%) | 84.8 | 85.6 | 87.3 | 86.5 | 89.2 | ||||||
| Local managers rate | n.a | 41.1 | 45.3 | 43.0 | 42.3 | |||||||
| Local procurement rate | 35.0 | 47.0 | 61.3 | 56.4 | 51.8 | |||||||
| Healthcare expenditure | (euro thousand) | 15,436 | 25,205 | 19,506 | 32,410 | 21,236 | ||||||
| Security expenditure | 57,477 | 68,954 | 26,403 | 50,541 | 81,777 | |||||||
| Direct GHG emissions | (mmtonnes CO2 eq) | 1.36 | 1.28 | 1.11 | 1.32 | 1.54 | ||||||
| (a) Before elimination of intragroup sales. |
Performance of the year
| I The percentage of manager positions covered by local personnel is constantly higher than 40% of total managerial positions, except for Italy and France, reflecting however fluctuations due to the opening of new yards and short-term projects. I The overall amount of procurement was euro 9,584 million in 2012, of which euro 7,802 million related to operating projects, 51.8% of which was procured with local suppliers. I In 2012 the injury frequency rate for employees worsened from 2011 (by 22.7%), while it improved for contractors by 19%. Saipem continues to strive to mitigate and reduce accidents and injuries to its employees and contractors by means of training and awareness campaigns, such as the "Working at height", the dedicated HSE training portal and training courses for crane operators. I Safety and environment expenditure for individual protection equipment and medical assistance increased by 24% from 2011 (from euro 83 million to euro 103 million). | I In 2012, the Engineering & Construction sector reported adjusted net profit amounting to euro 1,109 million, in line with 2011 (up 1%). This result reflects the good operating performance recorded mainly in the drilling business deriving from the full operations of Scarabeo 9 and greater profitability from the Saipem 10000 vessel, totally offset by the decline in performance of the Engineering & Construction business due to falling demand for oilfield services and lower margins at certain works related to the general downturn especially in the second half of the year. I Capital expenditure amounted to euro 1,011 million (euro 1,090 million in 2011) and mainly regarded the upgrading of the drilling and construction fleet. I In 2012 overall expenditure in R&D amounted approximately to euro 15 million in line with 2011. A total of 13 new patent applications were filed. | |
| Engineering & Construction Offshore Saipem is well positioned in the market of large, complex projects for the development of offshore hydrocarbon fields leveraging on its technical and operational skills, supported | by a technologically-advanced fleet, the ability to operate in complex environments, and engineering and project management capabilities acquired on the marketplace over recent years (such as Bouygues Offshore). Saipem intends to consolidate its market share strengthening its EPIC oriented business model and |
- 65 -
Contents
Eni Fact Book Engineering & Construction
| leveraging on its satisfactory long-term relationships with the major oil companies and National Oil Companies. Higher levels of efficiency and flexibility are expected to be achieved by reaching the technological excellence and the highest economies of scale in its engineering hubs employing local resources in contexts where this represents a competitive advantage, integrating in its own business model the direct management of construction process through the creation of a large construction yard in South-East Asia and revamping/upgrading its construction fleet. Over the next years, Saipem will invest in the upgrading of its fleet, by building a large fabrication yard in Brazil and buying other supporting assets for drilling activity. In 2012 revenues amounted to euro 5,207 million, increasing by 5.5% from 2011, due to higher levels of activity in Middle and Far East. Orders acquired amounted to euro 7,477 million (euro 6,131 million in 2011). Among the main orders acquired were: (i) an EPCI contract with INPEX for the installation of an underwater pipeline 889-kilometer long linking the offshore Ichthys field with the onshore shut-off valves in the area of Darwin, Australia; (ii) an EPCI contract with Lukoil-Nizhnevolzhskneft in Russia for the installation of two underwater pipelines linking the offshore Vladimir Filanovsky block with the onshore facility at a maximum depth of 6 meters; (iii) an EPCI contract for Petrobras in Brazil at Sapinoa Norte and Cemambi concerning engineering, procurement, fabrication, installation and test runs of a vertical underwater riser (Steel Lazy Wave Riser) for the collection system of the Sapinoa Norte field and of the Free Standing Hybrid Risers for exporting gas from the Sapinoa Norte and Cemambi Sul fields. In 2012, Saipem continued to pursue the development of state of the art technologies for working in deep and ultra-deep waters, the design of floating liquefaction facilities, the development of new techniques for the installation and grounding of underwater pipes in extreme conditions. In particular, the main activities concerned: (i) the design of a system for the transfer of liquefied natural gas between two floating LNG units; (ii) design and development of underwater solutions for the separation of gas/liquid and liquid/liquid and the treatment of sea water and discharge water; (iii) research in innovative materials for pipes and the adjustment of techniques for laying such pipes; (iv) studies on the technologies for heating pipes; (v) studies on technologies for monitoring pipes during installation and fixing techniques and emergency interventions. In addition, during the year monitoring continued for the reduction of the environmental impact of installation and the development of renewable sources both onshore and offshore. Engineering & Construction Onshore In the Engineering & Construction Onshore construction business, Saipem is one of the largest operators on turnkey contract base at a worldwide level in the Oil & Gas segment, especially through the acquisition of Snamprogetti. Saipem operates in the construction of plants for hydrocarbon production (extraction, separation, stabilization, collection of hydrocarbons, water injection) and treatment (removal and recovery of sulphur dioxide and carbon dioxide, fractioning of gaseous liquids, recovery of condensates) and in the installation of large onshore transport systems (pipelines, compression stations, terminals). Saipem preserves its own competitiveness through its technology excellence granted by its engineering hubs, its distinctive know-how in the construction of projects in the high-tech market of LNG and the management of large parts of engineering activities in cost efficient areas. In the | medium term, underpinning upward trends in the oil service market, Saipem will be focused on taking advantage of the opportunities arising from the market in the plant and pipeline segments leveraging on its solid competitive position in the realization of complex projects in the strategic areas of Middle East, Caspian Sea, Northern and Western Africa and Russia. In 2012 revenues amounted to euro 5,745 million, increasing by 3.9% from 2011, due to higher levels of activity in the Middle East and North America. Orders acquired amounted to euro 3,972 million (euro 5,006 million in 2011), declining mainly as a result of the cancellation of the Jurassic contract in the third quarter of 2012. Among the main orders acquired were: (i) a turn-key contract for Shell concerning the SSAGS (Southern Swamp Associated Gas) project concerning the construction of four compression stations and new production facilities for the treatment of collected gas in various areas of the Delta State in Nigeria; (ii) an EPC contract for Saudi Aramco and Sumitomo Chemical for the Naphtha and Aromatics Package (RP 2) of the Rabigh II project which provides for the expansion of the integrated petrochemical and refining complex of Rabigh, a city located on the western coast of Saudi Arabia; (iii) an EPC contract for Transportadora de Gas Natural de Norte Noroeste. Transcanada in Mexico for the engineering, procurement and construction of a gas pipeline connecting El Encino (Chihuahua state) and Topolobambo (Silanoa state).
|

- 66 -
Contents
Eni Fact Book Engineering & Construction
| Offshore drilling Saipem is the only engineering and construction contractor that provides both offshore and onshore drilling services to oil companies. In the offshore drilling segment, Saipem mainly operates in West Africa, the North Sea, the Mediterranean Sea and the Middle East and boasts significant market positions in the most complex segments of deep and ultra-deep offshore, leveraging on the outstanding technical features of its drilling platforms and vessels, capable of drilling exploration and development wells at a maximum water depth of 3,600 meters. In order to better meet industry demands, Saipem is finalizing an upgrading program of its drilling fleet providing it with state-of-the-art rigs to enhance its role as high quality player capable of operating also in complex and harsh environments. In particular, in the next years, Saipem intends to complete the building of the Scarabeo 8 and 9, new generation semi-submersible platforms that have been already rented to Eni through multi-year contracts. In parallel, investments are ongoing to renew and to keep-up the production capacity of other fleet equipment (upgrade equipment to the characteristics of projects or to clients needs and purchase of support equipment). | Among the main orders acquired were: (i) the 15-month extension of the drilling contract of the Scarabeo 7 operating in Indonesian waters; (ii) the 24-month extension of the contract of the Perro Negro jack-up operating in Italian waters; (iii) for Statoil a contract for the lease of the semisubmersible drilling rig Scarabeo 5 for three years starting from the third quarter of 2014 to perform drilling activities in the Norwegian section of the North Sea. Onshore drilling Saipem operates in this area as a main contractor for the major international and national oil companies executing its activity mainly in South America, Saudi Arabia, North Africa and, at a lower extent, in Europe. In these areas Saipem can leverage its knowledge of the market, long-term relations with customers and synergies and integration with other business areas. Saipem boasts a solid track record in remote areas (in particular in the Caspian Sea), leveraging on its own operational skills and its ability to operate in complex environments. |
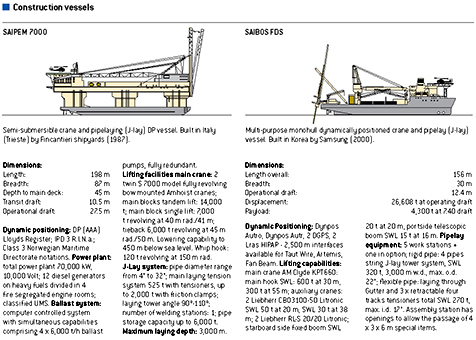
- 67 -
Contents
Eni Fact Book Engineering & Construction

- 68 -
Contents
Eni Fact Book Engineering & Construction

Main operating data | 2008 | 2009 | 2010 | 2011 | 2012 |
| Offshore pipelines laid | (km) | 815 | 1,000 | 1,365 | 1,682 | 1,435 | ||||||
| Onshore pipelines laid | (km) | 683 | 716 | 385 | 889 | 543 | ||||||
| Offshore structures installed | (t) | 24,835 | 62,333 | 46,606 | 105,033 | 122,765 | ||||||
| Onshore structures installed | (t) | 163,137 | 76,543 | 874,428 | 353,480 | 261,410 | ||||||
| Offshore drilling | (km) | 150 | 140 | 130 | 178 | 194 | ||||||
| Onshore drilling | (km) | 622 | 719 | 881 | 985 | 953 | ||||||
| Offshore wells drilled | (units) | 50 | 54 | 44 | 64 | 104 | ||||||
| Onshore wells drilled | (units) | 241 | 241 | 279 | 307 | 373 | ||||||
| Drilling vessels |
| Name | Type | Drilling plant | Maximum depth (m) | Drilling maximum (m) | Other | |||||
| Perro Negro 2 | Jack up | Oilwell E 2000 | 90 | 6,500 | Heliport provided | |||||
| Perro Negro 3 | Jack up | Ideco E 2100 | 90 | 6,000 | Heliport provided | |||||
| Perro Negro 4 | Jack up | National 110 UE | 45 | 5,000 | Heliport provided | |||||
| Perro Negro 5 | Jack up | National 1320 UE | 90 | 6,500 | Heliport provided | |||||
| Perro Negro 6 | Jack up | National SSDG 3000 | 107 | 9,150 | Heliport provided | |||||
| Perro Negro 7 | Jack up | National 1625 UE | 115 | 9,150 | Heliport provided | |||||
| Perro Negro 8 | Jack up | NOV SSDG 3000 | 107 | 9,100 | ||||||
| Scarabeo 3 | Semi-submersible drilling platform helped propulsion system | National 1625 DE | 550 | 7,600 | Heliport provided | |||||
| Scarabeo 4 | Semi-submersible drilling platform helped propulsion system | National 1625 DE | 550 | 7,600 | Heliport provided | |||||
| Scarabeo 5 | Semi-submersible drilling platform, self-propelled | Emco C 3 | 1,900 | 8,000 | Heliport provided | |||||
| Scarabeo 6 | Semi-submersible drilling platform, self-propelled | Oilwell E 3000 | 500 | 7,600 | Heliport provided | |||||
| Scarabeo 7 | Semi-submersible drilling platform, self-propelled | Wirth SH 3000 EG | 1,500 | 8,000 | Heliport provided | |||||
| Scarabeo 8 | Semi-submersible drilling platform, self-propelled | NOV AHD 500 4600 | 3,000 | 10,660 | Heliport provided | |||||
| Scarabeo 9 | Semi-submersible drilling platform, self-propelled | Aker Maritime Rem Prig | 3,650 | 11,500 | Heliport provided | |||||
| Saipem 10000 | Ultra deep waters drillship, self-propelled, dynamic positioning | Wirth GH 4500 EG | 3,000 | 9,200 | Oil storage capacity: 140,000 bbl; heliport provided | |||||
| Saipem 12000 | Ultra deep waters drillship, self-propelled, dynamic positioning | NOV SSDG 5750 | 3,650 | 10,000 | Heliport provided | |||||
| Saipem TAD | Tender assisted drilling barge | Bentec 1500 Hp | 150 | 4,877 | Heliport provided | |||||
- 69 -
Contents
Eni Fact Book Engineering & Construction
| Construction vessels |
| Name | Type | Laying technique | Transport/lifting capability (t) | Maximum laying depth (m) | Pipelaying maximum diameter (inches) | |||||
| Saipem 7000 | Semi-submersible, self-propelled pipelay and DP vessel capable of lifting structures and J-laying pipelines in deep waters | J | 14,000 | 3,000 | 32 | |||||
| Saipem FDS | Multipurpose monohull dynamically positioned crane and pipelay (J-lay) vessel utilized for the development of hydrocarbon fields in deep waters | J | 600 | 2,100 | 22 | |||||
| Saipem FDS 2 | Multipurpose monohull dynamically positioned crane and pipelay (J-lay) vessel utilized for the development of hydrocarbon fields in deep waters. The vessel is equipped with a J-lay tower | J, S | 2,000 | 3,000 | 36 | |||||
| Castoro Sei | Semi-submersible pipelay vessel capable of laying large diameter pipe | S | 300 | 1,000 | 60 | |||||
| Castoro Sette | Semi-submersible pipelay vessel capable of laying large diameter pipe | S | 1,000 | 60 | ||||||
| Castoro Otto | Crane and pipelay vessel | S | 2,200 | 600 | 60 | |||||
| Saipem 3000 | Mono hull, self-propelled DP crane ship, capable of laying flexible pipes and umbilicals in deep waters and lifting structures | Reel, J, S | 2,200 | |||||||
| Bar Protector | Dynamically positioned dive support vessel used for deep waters diving operations and works on platforms | |||||||||
| Semac 1 | Semi-submersible pipelay vessel capable of laying pipes in deep waters | S | 318 | 600 | 58 | |||||
| Castoro II | Derrick/lay barge | S | 1,000 | 60 | ||||||
| Castoro 10 | Trench/lay barge | S | 300 | 60 | ||||||
| Castoro 12 | Shallow waters pipelay barge | S | 1.4 | 40 | ||||||
| S355 | Derrick/lay barge | S | 600 | 42 | ||||||
| Crawler | Derrick/lay barge | S | 540 | 60 | ||||||
| Castoro 16 | Post-trenching and back-filling barge of pipelines operating in ultra-shallow waters | 1.4 | 40 | |||||||
| Saibos 230 | Derrick pipelay barge equipped with a mobile crane for piling, marine terminals and fixed platforms | S | 30 | |||||||
| Ersai 1 (a) | Technical pontoon equipped with two crawler cranes, capable of carrying out installations whilst grounded on the seabed | 2,100 | ||||||||
| Ersai 2 (a) | Work barge equipped with a fixed crane capable of lifting structures | 200 | ||||||||
| Ersai 3 (a) | Self-propelled workshop/storage barge used as support vessel, with storage space and office space for 50 people | |||||||||
| Ersai 4 (a) | Self-propelled workshop/storage barge used as support vessel, with storage space and office space for 150 people | |||||||||
| Ersai 400 (a) | Accommodation barge for up to 400 people, equipped with antigas shelter for H2S leaks | |||||||||
| Castoro 9 | Launching/cargo barge | 5,000 | ||||||||
| Castoro XI | Heavy duty cargo barge | 15,000 | ||||||||
| Castoro 14 | Deck cargo barge | 10,000 | ||||||||
| Castoro 15 | Deck cargo barge | 6,200 | ||||||||
| S42 | Deck cargo barge | 8,000 | ||||||||
| S43 | Deck cargo barge | |||||||||
| S44 | Launching/cargo barge | 30,000 | ||||||||
| S45 | Launching/cargo barge | 20,000 | ||||||||
| S46 | Deck cargo barge | |||||||||
| S47 | Deck cargo barge | |||||||||
| S600 | Light duty cargo barge | 30,000 | ||||||||
| FPSO - Cidade de Vitoria | FPSO unit with a production capacity of up to 100,000 barrels a day | |||||||||
| FPSO - Gimboa | FPSO unit with a production capacity of up to 60,000 barrels a day | |||||||||
| Firenze FPSO | FPSO unit with a production capacity of up to 12,000 barrels a day | |||||||||
(a) Owned by the Saipem-managed joint venture ER SAI Caspian Contractor Llc.
- 70 -
Contents
Eni Fact Book Financial Data
Profit and loss account | (euro million) | 2008 | 2009 | 2010 | 2011 | 2012 |
| Net sales from operations | 106,978 | 81,932 | 96,617 | 107,690 | 127,220 | ||||||||||||
| Other income and revenues | 696 | 1,094 | 967 | 926 | 1,546 | ||||||||||||
| Total revenues | 107,674 | 83,026 | 97,584 | 108,616 | 128,766 | ||||||||||||
| Purchases, services and other | (76,119 | ) | (58,091 | ) | (68,774 | ) | (78,795 | ) | (95,363 | ) | |||||||
| Payroll and related costs | (3,747 | ) | (3,928 | ) | (4,428 | ) | (4,404 | ) | (4,658 | ) | |||||||
| Total operating expenses | (79,866 | ) | (62,019 | ) | (73,202 | ) | (83,199 | ) | (100,021 | ) | |||||||
| Other operating income (expense) | (124 | ) | 55 | 131 | 171 | (158 | ) | ||||||||||
| Depreciation, depletion, amortization and impairments | (9,302 | ) | (9,267 | ) | (9,031 | ) | (8,785 | ) | (13,561 | ) | |||||||
| Operating profit | 18,382 | 11,795 | 15,482 | 16,803 | 15,026 | ||||||||||||
| Finance (expense) income | (661 | ) | (565 | ) | (749 | ) | (1,146 | ) | (1,307 | ) | |||||||
| Net income from investments | 1,346 | 534 | 1,112 | 2,123 | 2,881 | ||||||||||||
| Profit before income taxes | 19,067 | 11,764 | 15,845 | 17,780 | 16,600 | ||||||||||||
| Income taxes | (9,269 | ) | (6,258 | ) | (8,581 | ) | (9,903 | ) | (11,659 | ) | |||||||
| Tax rate (%) | 48.6 | 53.2 | 54.2 | 55.7 | 70.2 | ||||||||||||
| Net profit - continuing operations | 9,798 | 5,506 | 7,264 | 7,877 | 4,941 | ||||||||||||
| Attributable to: | |||||||||||||||||
| - Eni’s shareholders | 8,996 | 4,488 | 6,252 | 6,902 | 4,198 | ||||||||||||
| - Non-controlling interest | 802 | 1,018 | 1,012 | 975 | 743 | ||||||||||||
| Net profit - discontinued operations | (240 | ) | (189 | ) | 119 | (74 | ) | 3,732 | |||||||||
| Attributable to: | |||||||||||||||||
| - Eni’s shareholders | (171 | ) | (121 | ) | 66 | (42 | ) | 3,590 | |||||||||
| - Non-controlling interest | (69 | ) | (68 | ) | 53 | (32 | ) | 142 | |||||||||
| Net profit | 9,558 | 5,317 | 7,383 | 7,803 | 8,673 | ||||||||||||
| Attributable to: | |||||||||||||||||
| - Eni’s shareholders | 8,825 | 4,367 | 6,318 | 6,860 | 7,788 | ||||||||||||
| - Non-controlling interest | 733 | 950 | 1,065 | 943 | 885 | ||||||||||||
| Net profit attributable to Eni's shareholders - continuing operations | 8,996 | 4,488 | 6,252 | 6,902 | 4,198 | ||||||||||||
| Exclusion of inventory holding (gains) losses | 723 | (191 | ) | (610 | ) | (724 | ) | (23 | ) | ||||||||
| Exclusion of special items | 596 | 1,024 | 1,128 | 760 | 2,953 | ||||||||||||
| of which: | |||||||||||||||||
| - non-recurring items | (21 | ) | 250 | (246 | ) | 69 | |||||||||||
| - other special items | 617 | 774 | 1,374 | 691 | 2,953 | ||||||||||||
| Adjusted net profit attributable to Eni’s shareholders - continuing operations | 10,315 | 5,321 | 6,770 | 6,938 | 7,128 | ||||||||||||
| Adjusted net profit attributable to Eni’s shareholders - discontinued operations | (151 | ) | (114 | ) | 99 | 31 | 195 | ||||||||||
| Adjusted net profit attributable to Eni’s shareholders | 10,164 | 5,207 | 6,869 | 6,969 | 7,323 | ||||||||||||
- 71 -
Contents
Eni Fact Book Financial Data
Summarized Group Balance Sheet | (euro million) | Dec. 31, 2008 | Dec. 31, 2009 | Dec. 31, 2010 | Dec. 31, 2011 | Dec. 31, 2012 |
| Fixed assets | |||||||||||||||
| Property, plant and equipment | 55,933 | 59,765 | 67,404 | 73,578 | 63,466 | ||||||||||
| Inventories - Compulsory stock | 1,196 | 1,736 | 2,024 | 2,433 | 2,538 | ||||||||||
| Intangible assets | 11,019 | 11,469 | 11,172 | 10,950 | 4,487 | ||||||||||
| Equity-accounted investments and other investments | 5,881 | 6,244 | 6,090 | 6,242 | 9,350 | ||||||||||
| Receivables and securities held for operating purposes | 1,219 | 1,261 | 1,743 | 1,740 | 1,457 | ||||||||||
| Net payables related to capital expenditure | (787 | ) | (749 | ) | (970 | ) | (1,576 | ) | (1,142 | ) | |||||
| 74,461 | 79,726 | 87,463 | 93,367 | 80,156 | |||||||||||
| Net working capital | |||||||||||||||
| Inventories | 6,082 | 5,495 | 6,589 | 7,575 | 8,496 | ||||||||||
| Trade receivables | 16,444 | 14,916 | 17,221 | 17,709 | 19,966 | ||||||||||
| Trade payables | (12,590 | ) | (10,078 | ) | (13,111 | ) | (13,436 | ) | (14,993 | ) | |||||
| Tax payables and provisions for net deferred tax liabilities | (5,323 | ) | (1,988 | ) | (2,684 | ) | (3,503 | ) | (3,318 | ) | |||||
| Provisions | (9,506 | ) | (10,319 | ) | (11,792 | ) | (12,735 | ) | (13,603 | ) | |||||
| Other current assets and liabilities | (4,544 | ) | (3,968 | ) | (1,286 | ) | 281 | 2,347 | |||||||
| (9,437 | ) | (5,942 | ) | (5,063 | ) | (4,109 | ) | (1,105 | ) | ||||||
| Equity instruments | 2,741 | ||||||||||||||
| Provisions for employee post-retirement benefits | (947 | ) | (944 | ) | (1,032 | ) | (1,039 | ) | (982 | ) | |||||
| Discontinued operations and assets held for sale including related liabilities | 68 | 266 | 479 | 206 | 155 | ||||||||||
| CAPITAL EMPLOYED, NET | 66,886 | 73,106 | 81,847 | 88,425 | 78,224 | ||||||||||
| Shareholders’ equity | |||||||||||||||
| attributable to: - Eni's shareholders | 44,436 | 46,073 | 51,206 | 55,472 | 59,199 | ||||||||||
| attributable to: - Non-controlling interest | 4,074 | 3,978 | 4,522 | 4,921 | 3,514 | ||||||||||
| 48,510 | 50,051 | 55,728 | 60,393 | 62,713 | |||||||||||
| Net borrowings | 18,376 | 23,055 | 26,119 | 28,032 | 15,511 | ||||||||||
| TOTAL LIABILITIES AND SHAREHOLDERS’ EQUITY | 66,886 | 73,106 | 81,847 | 88,425 | 78,224 | ||||||||||
- 72 -
Contents
Eni Fact Book Financial Data
Summarized Group Cash Flow Statement | (euro million) | 2008 | 2009 | 2010 | 2011 | 2012 |
| Net profit - continuing operations | 9,798 | 5,506 | 7,264 | 7,877 | 4,941 | ||||||||||||
| Adjustments to reconcile net profit to net cash provided by operating activities: | |||||||||||||||||
| - depreciation, depletion and amortization and other non-monetary items | 8,312 | 8,607 | 8,521 | 8,606 | 11,354 | ||||||||||||
| - net gains on disposal of assets | (229 | ) | (226 | ) | (558 | ) | (1,176 | ) | (875 | ) | |||||||
| - dividends, interest, taxes and other changes | 9,024 | 6,379 | 8,829 | 9,918 | 11,923 | ||||||||||||
| Changes in working capital related to operations | 4,756 | (874 | ) | (1,158 | ) | (1,696 | ) | (3,373 | ) | ||||||||
| Dividends received, taxes paid, interest (paid) received during the period | (10,155 | ) | (8,637 | ) | (8,758 | ) | (9,766 | ) | (11,614 | ) | |||||||
| Net cash provided by operating activities - continuing operations | 21,506 | 10,755 | 14,140 | 13,763 | 12,356 | ||||||||||||
| Net cash provided by operating activities - discontinued operations | 295 | 381 | 554 | 619 | 15 | ||||||||||||
| Net cash provided by operating activities | 21,801 | 11,136 | 14,694 | 14,382 | 12,371 | ||||||||||||
| Capital expenditure - continuing operations | (12,935 | ) | (12,216 | ) | (12,450 | ) | (11,909 | ) | (12,761 | ) | |||||||
| Capital expenditure - discontinued operations | (1,627 | ) | (1,479 | ) | (1,420 | ) | (1,529 | ) | (756 | ) | |||||||
| Capital expenditure | (14,562 | ) | (13,695 | ) | (13,870 | ) | (13,438 | ) | (13,517 | ) | |||||||
| Investments and purchase of consolidated subsidiaries and businesses | (4,019 | ) | (2,323 | ) | (410 | ) | (360 | ) | (569 | ) | |||||||
| Disposals | 979 | 3,595 | 1,113 | 1,912 | 6,014 | ||||||||||||
| Other cash flow related to capital expenditure, investments and disposals | (267 | ) | (295 | ) | 228 | 627 | (136 | ) | |||||||||
| Free cash flow | 3,932 | (1,582 | ) | 1,755 | 3,123 | 4,163 | |||||||||||
| Borrowings (repayment) of debt related to financing activities | 911 | 396 | (26 | ) | 41 | (83 | ) | ||||||||||
| Changes in short and long-term financial debt | 980 | 3,841 | 2,272 | 1,104 | 5,947 | ||||||||||||
| Dividends paid and changes in non-controlling interests and reserves | (6,005 | ) | (2,956 | ) | (4,099 | ) | (4,327 | ) | (3,746 | ) | |||||||
| Effect of changes in consolidation and exchange differences | 7 | (30 | ) | 39 | 10 | (16 | ) | ||||||||||
| NET CASH FLOW FOR THE PERIOD | (175 | ) | (331 | ) | (59 | ) | (49 | ) | 6,265 | ||||||||
Changes in net borrowings | (euro million) | 2008 | 2009 | 2010 | 2011 | 2012 |
| Free cash flow | 3,932 | (1,582 | ) | 1,755 | 3,123 | 4,163 | |||||||||||
| Net borrowings of acquired companies | (286 | ) | (33 | ) | (2 | ) | |||||||||||
| Net borrowings of divested companies | 181 | (192 | ) | 12,446 | |||||||||||||
| Exchange differences on net borrowings and other changes | 129 | (141 | ) | (687 | ) | (517 | ) | (340 | ) | ||||||||
| Dividends paid and changes in non-controlling interest and reserves | (6,005 | ) | (2,956 | ) | (4,099 | ) | (4,327 | ) | (3,746 | ) | |||||||
| CHANGE IN NET BORROWINGS | (2,049 | ) | (4,679 | ) | (3,064 | ) | (1,913 | ) | 12,521 |
Net sales from operations | (euro million) | 2008 | 2009 | 2010 | 2011 | 2012 |
| Exploration & Production | 33,042 | 23,801 | 29,497 | 29,121 | 35,881 | ||||||||||||
| Gas & Power | 36,122 | 29,272 | 27,806 | 33,093 | 36,200 | ||||||||||||
| Refining & Marketing | 45,017 | 31,769 | 43,190 | 51,219 | 62,656 | ||||||||||||
| Chemicals | 6,303 | 4,203 | 6,141 | 6,491 | 6,418 | ||||||||||||
| Engineering & Construction | 9,176 | 9,664 | 10,581 | 11,834 | 12,771 | ||||||||||||
| Other activities | 185 | 88 | 105 | 85 | 119 | ||||||||||||
| Corporate and financial companies | 1,331 | 1,280 | 1,386 | 1,365 | 1,369 | ||||||||||||
| Impact of unrealized intragroup profit elimination (a) | 75 | (66 | ) | 100 | (54 | ) | (75 | ) | |||||||||
| Consolidation adjustment | (24,273 | ) | (18,079 | ) | (22,189 | ) | (25,464 | ) | (28,119 | ) | |||||||
| 106,978 | 81,932 | 96,617 | 107,690 | 127,220 |
(a) This item concerned mainly intragroup sales of commodities, services and capital goods recorded in the assets of the purchasing business segment as of end of the period.
Net sales to customers | (euro million) | 2008 | 2009 | 2010 | 2011 | 2012 |
| Exploration & Production | 14,125 | 10,171 | 12,947 | 10,677 | 15,559 | ||||||||||||
| Gas & Power | 35,085 | 28,517 | 26,837 | 31,749 | 34,169 | ||||||||||||
| Refining & Marketing | 43,521 | 30,804 | 41,845 | 48,428 | 59,690 | ||||||||||||
| Chemicals | 5,905 | 3,965 | 5,898 | 6,202 | 6,007 | ||||||||||||
| Engineering & Construction | 7,957 | 8,349 | 8,779 | 10,510 | 11,664 | ||||||||||||
| Other activities | 156 | 64 | 80 | 62 | 79 | ||||||||||||
| Corporate and financial companies | 154 | 128 | 131 | 116 | 127 | ||||||||||||
| Impact of unrealized intragroup profit elimination | 75 | (66 | ) | 100 | (54 | ) | (75 | ) | |||||||||
| 106,978 | 81,932 | 96,617 | 107,690 | 127,220 |
- 73 -
Contents
Eni Fact Book Financial Data
Net sales by geographic area of destination | (euro million) | 2008 | 2009 | 2010 | 2011 | 2012 |
| Italy | 41,739 | 26,655 | 45,896 | 31,906 | 33,998 | |||||||
| Other EU Countries | 29,341 | 24,331 | 21,125 | 35,536 | 35,578 | |||||||
| Rest of Europe | 7,125 | 5,213 | 4,172 | 7,537 | 9,940 | |||||||
| Africa | 12,331 | 10,174 | 13,068 | 11,333 | 14,681 | |||||||
| Americas | 7,218 | 7,080 | 6,282 | 9,612 | 15,282 | |||||||
| Asia | 8,916 | 8,208 | 5,785 | 10,258 | 16,394 | |||||||
| Other areas | 308 | 271 | 289 | 1,508 | 1,347 | |||||||
| Total outside Italy | 65,239 | 55,277 | 50,721 | 75,784 | 93,222 | |||||||
| 106,978 | 81,932 | 96,617 | 107,690 | 127,220 | ||||||||
Purchases, services and other | (euro million) | 2008 | 2009 | 2010 | 2011 | 2012 |
| Production costs - raw, ancillary and consumable materials and goods | 58,419 | 40,093 | 48,407 | 60,826 | 74,767 | ||||||||||||
| Production costs - services | 13,137 | 13,296 | 14,939 | 13,551 | 15,354 | ||||||||||||
| Operating leases and other | 2,496 | 2,505 | 2,997 | 3,045 | 3,434 | ||||||||||||
| Net provisions | 874 | 1,025 | 1,401 | 527 | 871 | ||||||||||||
| Other expenses | 1,590 | 1,466 | 1,252 | 1,140 | 1,342 | ||||||||||||
| less: | |||||||||||||||||
| capitalized direct costs associated with self-constructed tangible and intangible assets | (397 | ) | (294 | ) | (222 | ) | (294 | ) | (405 | ) | |||||||
| 76,119 | 58,091 | 68,774 | 78,795 | 95,363 | |||||||||||||
Principal accountant fees and services | (euro thousand) | 2008 | 2009 | 2010 | 2011 | 2012 |
| Audit fees | 27,962 | 30,748 | 21,114 | 22,031 | 23,042 | |||||||
| Audit-related fees | 152 | 276 | 183 | 1,113 | 1,351 | |||||||
| Tax fees | 46 | 51 | 166 | 323 | 25 | |||||||
| All other fees | 1 | 3 | ||||||||||
| 28,161 | 31,075 | 21,463 | 23,467 | 24,421 | ||||||||
Payroll and related costs | (euro million) | 2008 | 2009 | 2010 | 2011 | 2012 |
| Wages and salaries | 2,938 | 3,064 | 3,299 | 3,435 | 3,886 | ||||||||||||
| Social security contributions | 612 | 620 | 631 | 675 | 674 | ||||||||||||
| Cost related to defined benefit plans and defined contribution plans | 91 | 128 | 154 | 148 | 148 | ||||||||||||
| Other costs | 257 | 307 | 557 | 334 | 187 | ||||||||||||
| less: | |||||||||||||||||
| capitalized direct costs associated with self-constructed tangible and intangible assets | (151 | ) | (191 | ) | (213 | ) | (188 | ) | (237 | ) | |||||||
| 3,747 | 3,928 | 4,428 | 4,404 | 4,658 | |||||||||||||
Depreciation, depletion, amortization and impairments | (euro million) | 2008 | 2009 | 2010 | 2011 | 2012 |
| Exploration & Production | 6,678 | 6,789 | 6,928 | 6,251 | 7,988 | ||||||||||||
| Gas & Power | 284 | 435 | 425 | 413 | 405 | ||||||||||||
| Refining & Marketing | 430 | 408 | 333 | 351 | 331 | ||||||||||||
| Chemicals | 116 | 83 | 83 | 90 | 90 | ||||||||||||
| Engineering & Construction | 335 | 433 | 513 | 596 | 683 | ||||||||||||
| Other activities | 4 | 2 | 2 | 2 | 1 | ||||||||||||
| Corporate and financial companies | 76 | 83 | 79 | 75 | 65 | ||||||||||||
| Impact of unrealized intragroup profit elimination | (14 | ) | (17 | ) | (20 | ) | (23 | ) | (25 | ) | |||||||
| Total depreciation, depletion and amortization | 7,909 | 8,216 | 8,343 | 7,755 | 9,538 | ||||||||||||
| Impairments | 1,393 | 1,051 | 688 | 1,030 | 4,023 | ||||||||||||
| 9,302 | 9,267 | 9,031 | 8,785 | 13,561 | |||||||||||||
Operating profit by Division | (euro million) | 2008 | 2009 | 2010 | 2011 | 2012 |
| Exploration & Production | 16,239 | 9,120 | 13,866 | 15,887 | 18,451 | ||||||||||||
| Gas & Power | 2,330 | 1,914 | 896 | (326 | ) | (3,221 | ) | ||||||||||
| Refining & Marketing | (988 | ) | (102 | ) | 149 | (273 | ) | (1,303 | ) | ||||||||
| Chemicals | (845 | ) | (675 | ) | (86 | ) | (424 | ) | (683 | ) | |||||||
| Engineering & Construction | 1,045 | 881 | 1,302 | 1,422 | 1,433 | ||||||||||||
| Other activities | (466 | ) | (436 | ) | (1,384 | ) | (427 | ) | (302 | ) | |||||||
| Corporate and financial companies | (623 | ) | (420 | ) | (361 | ) | (319 | ) | (345 | ) | |||||||
| Impact of unrealized intragroup profit elimination | 1,690 | 1,513 | 1,100 | 1,263 | 996 | ||||||||||||
| 18,382 | 11,795 | 15,482 | 16,803 | 15,026 |
- 74 -
Contents
Eni Fact Book Financial Data
NON-GAAP measures
Reconciliation of reported operating profit and reported net profit to results on an adjusted basis
| Management evaluates Group and business performance on the basis of adjusted operating profit and adjusted net profit, which are arrived at by excluding inventory holding gains or losses, special items and, in determining the business segments’ adjusted results, finance charges on finance debt and interest income. The adjusted operating profit of each business segment reports gains and losses on derivative financial instruments entered into to manage exposure to movements in foreign currency exchange rates which impact industrial margins and translation of commercial payables and receivables. Accordingly also currency translation effects recorded through profit and loss are reported within business segments’ adjusted operating profit. The taxation effect of the items excluded from adjusted operating or net profit is determined based on the specific rate of taxes applicable to each of them. The Italian statutory tax rate is applied to finance charges and income (38% is applied to charges recorded by companies in the energy sector, whilst a tax rate of 27.5% is applied to all other companies). Adjusted operating profit and adjusted net profit are non-GAAP financial measures under either IFRS or US GAAP. Management includes them in order to facilitate a comparison of base business performance across periods, and to allow financial analysts to evaluate Eni’s trading performance on the basis of their forecasting models. The following is a description of items that are excluded from the calculation of adjusted results. Special items include certain significant income or charges pertaining to either: (i) infrequent or unusual events and transactions, being identified as non-recurring items under such circumstances; (ii) certain events or transactions which are not considered to be representative of the ordinary course of business, as in the case of environmental provisions, restructuring charges, | asset impairments or write ups and gains or losses on divestments even though they occurred in past periods or are likely to occur in future ones; or (iii) exchange rate differences and derivatives relating to industrial activities and commercial payables and receivables, particularly exchange rate derivatives to manage commodity pricing formulas which are quoted in a currency other than the functional currency. Those items are reclassified in operating profit with a corresponding adjustment to net finance charges, notwithstanding the handling of foreign currency Exchange risks is made centrally by netting off naturally-occurring opposite positions and then dealing with any residual risk exposure in the exchange rate market. As provided for in Decision No. 15519 of July 27, 2006 of the Italian market regulator (Consob), non recurring material income or charges are to be clearly reported in the management’s discussion and financial tables. Also, special items include gains and losses on re-measurement at fair value of certain non hedging commodity derivatives, including the ineffective portion of cash flow hedges and certain derivatives financial instruments embedded in the pricing formula of long-term gas supply agreements of the Exploration & Production Division. Finance charges or income related to net borrowings excluded from the adjusted net profit of business segments are comprised of interest charges on finance debt and interest income earned on cash and cash equivalents not related to operations. Therefore, the adjusted net profit of business segments includes finance charges or income deriving from certain segment-operated assets, i.e., interest income on certain receivable financing and securities related to operations and finance charge pertaining to the accretion of certain provisions recorded on a discounted basis (as in the case of the asset retirement obligations in the Exploration & Production Division). Finance charges or interest income and related taxation effects excluded from the adjusted net profit of the business segments are allocated on the aggregate Corporate and financial companies. For a reconciliation of adjusted operating profit and adjusted net profit to reported operating profit and reported net profit see tables below. |
- 75 -
Contents
Eni Fact Book Financial Data
| 2008 | (euro million) |
Other activities(a) | Discontinued operations | ||||
Exploration & Production | Gas & Power(a) | Refining & Marketing | Chemicals | Engineering & Construction | Corporate and financial companies | Snam | Other activities | Impact of unrealized intragroup profit elimination | Group | Snam | Consolidation adjustments | Total | Continuing operations | |||||||||||||||
| Reported operating profit | 16,239 | 2,330 | (988 | ) | (845 | ) | 1,045 | (623 | ) | 1,700 | (466 | ) | 125 | 18,517 | (1,700 | ) | 1,565 | (135 | ) | 18,382 | ||||||||||||||||||||||
| Exclusion of inventory holding (gains) losses | (429 | ) | 1,199 | 166 | 936 | 936 | ||||||||||||||||||||||||||||||||||||
| Exclusion of special items | ||||||||||||||||||||||||||||||||||||||||||
| of which: | ||||||||||||||||||||||||||||||||||||||||||
| Non-recurring (income) charges | (21 | ) | (21 | ) | (21 | ) | ||||||||||||||||||||||||||||||||||||
| Other special (income) charges: | 927 | (123 | ) | 365 | 297 | (4 | ) | 341 | 30 | 222 | 2,055 | (30 | ) | (30 | ) | 2,025 | ||||||||||||||||||||||||||
| environmental charges | 4 | 76 | 8 | 221 | 309 | (8 | ) | (8 | ) | 301 | ||||||||||||||||||||||||||||||||
| asset impairments | 989 | 1 | 299 | 278 | 5 | 1,572 | 1,572 | |||||||||||||||||||||||||||||||||||
| gains on disposal of assets | 4 | (1 | ) | 13 | (5 | ) | (4 | ) | (9 | ) | 8 | (14 | ) | (8 | ) | (8 | ) | (8 | ) | (16 | ) | |||||||||||||||||||||
| risk provisions | 4 | 4 | 4 | |||||||||||||||||||||||||||||||||||||||
| provision for redundancy incentives | 8 | 6 | 23 | 8 | 28 | 14 | 4 | 91 | (14 | ) | (14 | ) | 77 | |||||||||||||||||||||||||||||
| re-measurement gains/losses on commodity derivatives | (18 | ) | (74 | ) | (21 | ) | 52 | (61 | ) | (61 | ) | |||||||||||||||||||||||||||||||
| exchange rate differences and derivatives | (56 | ) | (56 | ) | (25 | ) | 16 | (121 | ) | (121 | ) | |||||||||||||||||||||||||||||||
| other | (3 | ) | 270 | 2 | 269 | 269 | ||||||||||||||||||||||||||||||||||||
| Special items of operating profit | 927 | (123 | ) | 344 | 297 | (4 | ) | 341 | 30 | 222 | 2,034 | (30 | ) | (30 | ) | 2,004 | ||||||||||||||||||||||||||
| Adjusted operating profit | 17,166 | 1,778 | 555 | (382 | ) | 1,041 | (282 | ) | 1,730 | (244 | ) | 125 | 21,487 | (1,730 | ) | 1,565 | (165 | ) | 21,322 | |||||||||||||||||||||||
| Net finance (expense) income (b) | 70 | 3 | 1 | 1 | 1 | (577 | ) | 21 | (39 | ) | (519 | ) | (21 | ) | (21 | ) | (540 | ) | ||||||||||||||||||||||||
| Net income (expense) from investments (b) | 609 | 393 | 174 | (9 | ) | 49 | 5 | 27 | 4 | 1,252 | (27 | ) | (27 | ) | 1,225 | |||||||||||||||||||||||||||
| Income taxes (b) | (9,983 | ) | (738 | ) | (225 | ) | 79 | (307 | ) | 352 | (554 | ) | (49 | ) | (11,425 | ) | 554 | (121 | ) | 433 | (10,992 | ) | ||||||||||||||||||||
| Tax rate (%) | 55.9 | 33.9 | 30.8 | 28.1 | 31.2 | 51.4 | 49.9 | |||||||||||||||||||||||||||||||||||
| Adjusted net profit | 7,862 | 1,436 | 505 | (311 | ) | 784 | (502 | ) | 1,224 | (279 | ) | 76 | 10,795 | (1,224 | ) | 1,444 | 220 | 11,015 | ||||||||||||||||||||||||
| of which attributable to: | ||||||||||||||||||||||||||||||||||||||||||
| - non-controlling interest | 631 | 69 | 700 | |||||||||||||||||||||||||||||||||||||||
| - Eni’s shareholders | 10,164 | 151 | 10,315 | |||||||||||||||||||||||||||||||||||||||
| Reported net profit attributable to Eni’s shareholders | 8,825 | 171 | 8,996 | |||||||||||||||||||||||||||||||||||||||
| Exclusion of inventory holding (gains) losses | 723 | 723 | ||||||||||||||||||||||||||||||||||||||||
| Exclusion of special items: | 616 | (20 | ) | 596 | ||||||||||||||||||||||||||||||||||||||
| - non-recurring charges | (21 | ) | (21 | ) | ||||||||||||||||||||||||||||||||||||||
| - other special (income) charges | 637 | (20 | ) | 617 | ||||||||||||||||||||||||||||||||||||||
| Adjusted net profit attributable to Eni’s shareholders | 10,164 | 151 | 10,315 | |||||||||||||||||||||||||||||||||||||||
(a) Following the announced divestment plan, Snam results are reclassified from "Gas & Power" sector to "Other activities" and accounted as discontinued operations.
(b) Excluding special items.
- 76 -
Contents
Eni Fact Book Financial Data
| 2009 | (euro million) |
Other activities(a) | Discontinued operations | ||||
Exploration & Production | Gas & Power(a) | Refining & Marketing | Chemicals | Engineering & Construction | Corporate and financial companies | Snam | Other activities | Impact of unrealized intragroup profit elimination | Group | Snam | Consolidation adjustments | Total | Continuing operations | |||||||||||||||
| Reported operating profit | 9,120 | 1,914 | (102 | ) | (675 | ) | 881 | (420 | ) | 1,773 | (436 | ) | 12,055 | (1,773 | ) | 1,513 | (260 | ) | 11,795 | |||||||||||||||||||||||
| Exclusion of inventory holding (gains) losses | 326 | (792 | ) | 121 | (345 | ) | (345 | ) | ||||||||||||||||||||||||||||||||||
| Exclusion of special items | ||||||||||||||||||||||||||||||||||||||||||
| of which: | ||||||||||||||||||||||||||||||||||||||||||
| Non-recurring (income) charges | 250 | 250 | 250 | |||||||||||||||||||||||||||||||||||||||
| Other special (income) charges: | 369 | (218 | ) | 513 | 113 | (11 | ) | 78 | 23 | 178 | 1,045 | (23 | ) | (23 | ) | 1,022 | ||||||||||||||||||||||||||
| environmental charges | 7 | 72 | 12 | 207 | 298 | (12 | ) | (12 | ) | 286 | ||||||||||||||||||||||||||||||||
| asset impairments | 618 | 27 | 389 | 121 | 2 | 5 | 1,162 | 1,162 | ||||||||||||||||||||||||||||||||||
| gains on disposal of assets | (270 | ) | (1 | ) | (2 | ) | 3 | (5 | ) | (2 | ) | (277 | ) | 5 | 5 | (272 | ) | |||||||||||||||||||||||||
| risk provisions | 115 | 17 | (4 | ) | 128 | 128 | ||||||||||||||||||||||||||||||||||||
| provision for redundancy incentives | 31 | 9 | 22 | 10 | 38 | 16 | 8 | 134 | (16 | ) | (16 | ) | 118 | |||||||||||||||||||||||||||||
| re-measurement gains/losses on commodity derivatives | (15 | ) | (292 | ) | 39 | (3 | ) | (16 | ) | (287 | ) | (287 | ) | |||||||||||||||||||||||||||||
| exchange rate differences and derivatives | 5 | (83 | ) | (24 | ) | (15 | ) | (117 | ) | (117 | ) | |||||||||||||||||||||||||||||||
| other | 40 | (36 | ) | 4 | 4 | |||||||||||||||||||||||||||||||||||||
| Special items of operating profit | 369 | (218 | ) | 513 | 113 | 239 | 78 | 23 | 178 | 1,295 | (23 | ) | (23 | ) | 1,272 | |||||||||||||||||||||||||||
| Adjusted operating profit | 9,489 | 2,022 | (381 | ) | (441 | ) | 1,120 | (342 | ) | 1,796 | (258 | ) | 13,005 | (1,796 | ) | 1,513 | (283 | ) | 12,722 | |||||||||||||||||||||||
| Net finance (expense) income (b) | (23 | ) | 6 | (443 | ) | 14 | 12 | (434 | ) | (14 | ) | (14 | ) | (448 | ) | |||||||||||||||||||||||||||
| Net income(expense) from investments (b) | 243 | 297 | 75 | 49 | 35 | 1 | 700 | (35 | ) | (35 | ) | 665 | ||||||||||||||||||||||||||||||
| Income taxes (b) | (5,828 | ) | (670 | ) | 94 | 90 | (277 | ) | 77 | (597 | ) | (3 | ) | (7,114 | ) | 597 | (83 | ) | 514 | (6,600 | ) | |||||||||||||||||||||
| Tax rate (%) | 60.0 | 28.8 | .. | 23.7 | 32.4 | 53.6 | 51.0 | |||||||||||||||||||||||||||||||||||
| Adjusted net profit | 3,881 | 1,655 | (212 | ) | (351 | ) | 892 | (708 | ) | 1,248 | (245 | ) | (3 | ) | 6,157 | (1,248 | ) | 1,430 | 182 | 6,339 | ||||||||||||||||||||||
| of which attributable to: | ||||||||||||||||||||||||||||||||||||||||||
| - non-controlling interest | 950 | 68 | 1,018 | |||||||||||||||||||||||||||||||||||||||
| - Eni’s shareholders | 5,207 | 114 | 5,321 | |||||||||||||||||||||||||||||||||||||||
| Reported net profit attributable to Eni’s shareholders | 4,367 | 121 | 4,488 | |||||||||||||||||||||||||||||||||||||||
| Exclusion of inventory holding (gains) losses | (191 | ) | (191 | ) | ||||||||||||||||||||||||||||||||||||||
| Exclusion of special items: | 1,031 | (7 | ) | 1,024 | ||||||||||||||||||||||||||||||||||||||
| - non-recurring charges | 250 | 250 | ||||||||||||||||||||||||||||||||||||||||
| - other special (income) charges | 781 | (7 | ) | 774 | ||||||||||||||||||||||||||||||||||||||
| Adjusted net profit attributable to Eni’s shareholders | 5,207 | 114 | 5,321 | |||||||||||||||||||||||||||||||||||||||
(a) Following the announced divestment plan, Snam results are reclassified from "Gas & Power" sector to "Other activities" and accounted as discontinued operations.
(b) Excluding special items.
- 77 -
Contents
Eni Fact Book Financial Data
| 2010 | (euro million) |
Other activities(a) | Discontinued operations | ||||
Exploration & Production | Gas & Power(a) | Refining & Marketing | Chemicals | Engineering & Construction | Corporate and financial companies | Snam | Other activities | Impact of unrealized intragroup profit elimination | Group | Snam | Consolidation adjustments | Total | Continuing operations | |||||||||||||||
| Reported operating profit | 13,866 | 896 | 149 | (86 | ) | 1,302 | (361 | ) | 2,000 | (1,384 | ) | (271 | ) | 16,111 | (2,000 | ) | 1,371 | (629 | ) | 15,482 | ||||||||||||||||||||||
| Exclusion of inventory holding (gains) losses | (117 | ) | (659 | ) | (105 | ) | (881 | ) | (881 | ) | ||||||||||||||||||||||||||||||||
| Exclusion of special items | ||||||||||||||||||||||||||||||||||||||||||
| of which: | ||||||||||||||||||||||||||||||||||||||||||
| Non-recurring (income) charges | (270 | ) | 24 | (246 | ) | (246 | ) | |||||||||||||||||||||||||||||||||||
| Other special (income) charges: | 32 | 759 | 329 | 95 | 96 | 46 | 1,179 | 2,536 | (46 | ) | (46 | ) | 2,490 | |||||||||||||||||||||||||||||
| environmental charges | 30 | 16 | 169 | 9 | 1,145 | 1,369 | (9 | ) | (9 | ) | 1,360 | |||||||||||||||||||||||||||||||
| asset impairments | 127 | 426 | 76 | 52 | 3 | 10 | 8 | 702 | (10 | ) | (10 | ) | 692 | |||||||||||||||||||||||||||||
| gains on disposal of assets | (241 | ) | (16 | ) | 5 | 4 | (248 | ) | (4 | ) | (4 | ) | (252 | ) | ||||||||||||||||||||||||||||
| risk provisions | 78 | 2 | 8 | 7 | 95 | 95 | ||||||||||||||||||||||||||||||||||||
| provision for redundancy incentives | 97 | 52 | 113 | 26 | 14 | 88 | 23 | 10 | 423 | (23 | ) | (23 | ) | 400 | ||||||||||||||||||||||||||||
| re-measurement gains/losses on commodity derivatives | 30 | (10 | ) | (22 | ) | (2 | ) | (2 | ) | |||||||||||||||||||||||||||||||||
| exchange rate differences and derivatives | 14 | 195 | (10 | ) | 17 | 216 | 216 | |||||||||||||||||||||||||||||||||||
| other | 5 | (38 | ) | 5 | 9 | (19 | ) | (19 | ) | |||||||||||||||||||||||||||||||||
| Special items of operating profit | 32 | 489 | 329 | 95 | 24 | 96 | 46 | 1,179 | 2,290 | (46 | ) | (46 | ) | 2,244 | ||||||||||||||||||||||||||||
| Adjusted operating profit | 13,898 | 1,268 | (181 | ) | (96 | ) | 1,326 | (265 | ) | 2,046 | (205 | ) | (271 | ) | 17,520 | (2,046 | ) | 1,371 | (675 | ) | 16,845 | |||||||||||||||||||||
| Net finance (expense) income (b) | (205 | ) | 34 | 33 | (783 | ) | 22 | (9 | ) | (908 | ) | (22 | ) | (22 | ) | (930 | ) | |||||||||||||||||||||||||
| Net income (expense) from investments (b) | 274 | 362 | 92 | 1 | 10 | 44 | (2 | ) | 781 | (44 | ) | (44 | ) | 737 | ||||||||||||||||||||||||||||
| Income taxes (b) | (8,358 | ) | (397 | ) | 33 | 22 | (375 | ) | 181 | (667 | ) | 102 | (9,459 | ) | 667 | (78 | ) | 589 | (8,870 | ) | ||||||||||||||||||||||
| Tax rate (%) | 59.8 | 23.9 | .. | 27.4 | 31.6 | 54.4 | 53.3 | |||||||||||||||||||||||||||||||||||
| Adjusted net profit | 5,609 | 1,267 | (56 | ) | (73 | ) | 994 | (867 | ) | 1,445 | (216 | ) | (169 | ) | 7,934 | (1,445 | ) | 1,293 | (152 | ) | 7,782 | |||||||||||||||||||||
| of which attributable to: | ||||||||||||||||||||||||||||||||||||||||||
| - non-controlling interest | 1,065 | (53 | ) | 1,012 | ||||||||||||||||||||||||||||||||||||||
| - Eni’s shareholders | 6,869 | (99 | ) | 6,770 | ||||||||||||||||||||||||||||||||||||||
| Reported net profit attributable to Eni’s shareholders | 6,318 | (66 | ) | 6,252 | ||||||||||||||||||||||||||||||||||||||
| Exclusion of inventory holding (gains) losses | (610 | ) | (610 | ) | ||||||||||||||||||||||||||||||||||||||
| Exclusion of special items: | 1,161 | (33 | ) | 1,128 | ||||||||||||||||||||||||||||||||||||||
| - non-recurring charges | (246 | ) | (246 | ) | ||||||||||||||||||||||||||||||||||||||
| - other special (income) charges | 1,407 | (33 | ) | 1,374 | ||||||||||||||||||||||||||||||||||||||
| Adjusted net profit attributable to Eni’s shareholders | 6,869 | (99 | ) | 6,770 | ||||||||||||||||||||||||||||||||||||||
(a) Following the announced divestment plan, Snam results are reclassified from "Gas & Power" sector to "Other activities" and accounted as discontinued operations.
(b) Excluding special items.
- 78 -
Contents
Eni Fact Book Financial Data
| 2011 | (euro million) |
Other activities(a) | Discontinued operations | ||||
Exploration & Production | Gas & Power(a) | Refining & Marketing | Chemicals | Engineering & Construction | Corporate and financial companies | Snam | Other activities | Impact of unrealized intragroup profit elimination | Group | Snam | Consolidation adjustments | Total | Continuing operations | |||||||||||||||
| Reported operating profit | 15,887 | (326 | ) | (273 | ) | (424 | ) | 1,422 | (319 | ) | 2,084 | (427 | ) | (189 | ) | 17,435 | (2,084 | ) | 1,452 | (632 | ) | 16,803 | ||||||||||||||||||||
| Exclusion of inventory holding (gains) losses | (166 | ) | (907 | ) | (40 | ) | (1,113 | ) | (1,113 | ) | ||||||||||||||||||||||||||||||||
| Exclusion of special items | ||||||||||||||||||||||||||||||||||||||||||
| of which: | ||||||||||||||||||||||||||||||||||||||||||
| Non-recurring (income) charges | 10 | 59 | 69 | 69 | ||||||||||||||||||||||||||||||||||||||
| Other special (income) charges: | 188 | 245 | 641 | 181 | 21 | 53 | 27 | 142 | 1,498 | (27 | ) | (27 | ) | 1,471 | ||||||||||||||||||||||||||||
| environmental charges | 34 | 1 | 10 | 141 | 186 | (10 | ) | (10 | ) | 176 | ||||||||||||||||||||||||||||||||
| asset impairments | 190 | 154 | 488 | 160 | 35 | (9 | ) | 4 | 1,022 | 9 | 9 | 1,031 | ||||||||||||||||||||||||||||||
| gains on disposal of assets | (63 | ) | 10 | 4 | (1 | ) | (4 | ) | (7 | ) | (61 | ) | 4 | 4 | (57 | ) | ||||||||||||||||||||||||||
| risk provisions | 77 | 8 | (6 | ) | 9 | 88 | 88 | |||||||||||||||||||||||||||||||||||
| provision for redundancy incentives | 44 | 34 | 81 | 17 | 10 | 9 | 6 | 8 | 209 | (6 | ) | (6 | ) | 203 | ||||||||||||||||||||||||||||
| re-measurement gains/losses on commodity derivatives | 1 | 45 | (3 | ) | (28 | ) | 15 | 15 | ||||||||||||||||||||||||||||||||||
| exchange rate differences and derivatives | (2 | ) | (82 | ) | (4 | ) | 3 | (85 | ) | (85 | ) | |||||||||||||||||||||||||||||||
| other | 18 | 17 | 27 | 51 | 24 | (13 | ) | 124 | (24 | ) | (24 | ) | 100 | |||||||||||||||||||||||||||||
| Special items of operating profit | 188 | 245 | 641 | 191 | 21 | 53 | 27 | 201 | 1,567 | (27 | ) | (27 | ) | 1,540 | ||||||||||||||||||||||||||||
| Adjusted operating profit | 16,075 | (247 | ) | (539 | ) | (273 | ) | 1,443 | (266 | ) | 2,111 | (226 | ) | (189 | ) | 17,889 | (2,111 | ) | 1,452 | (659 | ) | 17,230 | ||||||||||||||||||||
| Net finance (expense) income (b) | (231 | ) | 43 | (876 | ) | 19 | 5 | (1,040 | ) | (19 | ) | (19 | ) | (1,059 | ) | |||||||||||||||||||||||||||
| Net income (expense) from investments (b) | 624 | 363 | 99 | 95 | 1 | 44 | (3 | ) | 1,223 | (44 | ) | (44 | ) | 1,179 | ||||||||||||||||||||||||||||
| Income taxes (b) | (9,603 | ) | 93 | 176 | 67 | (440 | ) | 388 | (918 | ) | (1 | ) | 78 | (10,160 | ) | 918 | (195 | ) | 723 | (9,437 | ) | |||||||||||||||||||||
| Tax rate (%) | 58.3 | .. | .. | 28.6 | 42.2 | 56.2 | 54.4 | |||||||||||||||||||||||||||||||||||
| Adjusted net profit | 6,865 | 252 | (264 | ) | (206 | ) | 1,098 | (753 | ) | 1,256 | (225 | ) | (111 | ) | 7,912 | (1,256 | ) | 1,257 | 1 | 7,913 | ||||||||||||||||||||||
| of which attributable to: | ||||||||||||||||||||||||||||||||||||||||||
| - non-controlling interest | 943 | 32 | 975 | |||||||||||||||||||||||||||||||||||||||
| - Eni’s shareholders | 6,969 | (31 | ) | 6,938 | ||||||||||||||||||||||||||||||||||||||
| Reported net profit attributable to Eni’s shareholders | 6,860 | 42 | 6,902 | |||||||||||||||||||||||||||||||||||||||
| Exclusion of inventory holding (gains) losses | (724 | ) | (724 | ) | ||||||||||||||||||||||||||||||||||||||
| Exclusion of special items: | 833 | (73 | ) | 760 | ||||||||||||||||||||||||||||||||||||||
| - non-recurring charges | 69 | 69 | ||||||||||||||||||||||||||||||||||||||||
| - other special (income) charges | 764 | (73 | ) | 691 | ||||||||||||||||||||||||||||||||||||||
| Adjusted net profit attributable to Eni’s shareholders | 6,969 | (31 | ) | 6,938 | ||||||||||||||||||||||||||||||||||||||
(a) Following the announced divestment plan, Snam results are reclassified from "Gas & Power" sector to "Other activities" and accounted as discontinued operations.
(b) Excluding special items.
- 79 -
Contents
Eni Fact Book Financial Data
| 2012 | (euro million) |
Other activities(a) | Discontinued operations | ||||
Exploration & Production | Gas & Power(a) | Refining & Marketing | Chemicals | Engineering & Construction | Corporate and financial companies | Snam | Other activities | Impact of unrealized intragroup profit elimination | Group | Snam | Consolidation adjustments | Total | Continuing operations | |||||||||||||||
| Reported operating profit | 18,451 | (3,221 | ) | (1,303 | ) | (683 | ) | 1,433 | (345 | ) | 1,676 | (302 | ) | 208 | 15,914 | (1,676 | ) | 788 | (888 | ) | 15,026 | |||||||||||||||||||||
| Exclusion of inventory holding (gains) losses | 163 | (29 | ) | 63 | (214 | ) | (17 | ) | (17 | ) | ||||||||||||||||||||||||||||||||
| Exclusion of special items: | ||||||||||||||||||||||||||||||||||||||||||
| environmental charges | (2 | ) | 40 | 71 | 25 | 134 | (71 | ) | (71 | ) | 63 | |||||||||||||||||||||||||||||||
| asset impairments | 550 | 2,494 | 846 | 112 | 25 | 2 | 4,029 | 4,029 | ||||||||||||||||||||||||||||||||||
| gains on disposal of assets | (542 | ) | (3 | ) | 5 | 1 | 3 | (22 | ) | (12 | ) | (570 | ) | 22 | 22 | (548 | ) | |||||||||||||||||||||||||
| risk provisions | 7 | 831 | 49 | 18 | 5 | 35 | 945 | 945 | ||||||||||||||||||||||||||||||||||
| provision for redundancy incentives | 6 | 5 | 19 | 14 | 7 | 11 | 2 | 2 | 66 | (2 | ) | (2 | ) | 64 | ||||||||||||||||||||||||||||
| re-measurement gains/losses on commodity derivatives | 1 | 1 | (3 | ) | (1 | ) | (1 | ) | ||||||||||||||||||||||||||||||||||
| exchange rate differences and derivatives | (9 | ) | (51 | ) | (8 | ) | (11 | ) | (79 | ) | (79 | ) | ||||||||||||||||||||||||||||||
| other | 54 | 138 | 53 | 26 | 271 | 271 | ||||||||||||||||||||||||||||||||||||
| Special items of operating profit | 67 | 3,412 | 1,004 | 135 | 32 | 16 | 51 | 78 | 4,795 | (51 | ) | (51 | ) | 4,744 | ||||||||||||||||||||||||||||
| Adjusted operating profit | 18,518 | 354 | (328 | ) | (485 | ) | 1,465 | (329 | ) | 1,727 | (224 | ) | (6 | ) | 20,692 | (1,727 | ) | 788 | (939 | ) | 19,753 | |||||||||||||||||||||
| Net finance (expense) income (b) | (248 | ) | 31 | (4 | ) | (1 | ) | (861 | ) | (51 | ) | (22 | ) | (1,156 | ) | 51 | 51 | (1,105 | ) | |||||||||||||||||||||||
| Net income (expense) from investments (b) | 436 | 261 | 63 | 2 | 55 | 99 | 38 | (1 | ) | 953 | (38 | ) | (38 | ) | 915 | |||||||||||||||||||||||||||
| Income taxes (b) | (11,281 | ) | (173 | ) | 90 | 89 | (411 | ) | 115 | (712 | ) | 2 | (12,281 | ) | 712 | (123 | ) | 589 | (11,692 | ) | ||||||||||||||||||||||
| Tax rate (%) | 60.3 | 26.8 | .. | 27.0 | 41.5 | 59.9 | 59.8 | |||||||||||||||||||||||||||||||||||
| Adjusted net profit | 7,425 | 473 | (179 | ) | (395 | ) | 1,109 | (976 | ) | 1,002 | (247 | ) | (4 | ) | 8,208 | (1,002 | ) | 665 | (337 | ) | 7,871 | |||||||||||||||||||||
| of which attributable to: | ||||||||||||||||||||||||||||||||||||||||||
| - non-controlling interest | 885 | (142 | ) | 743 | ||||||||||||||||||||||||||||||||||||||
| - Eni’s shareholders | 7,323 | (195 | ) | 7,128 | ||||||||||||||||||||||||||||||||||||||
| Reported net profit attributable to Eni’s shareholders | 7,788 | (3,590 | ) | 4,198 | ||||||||||||||||||||||||||||||||||||||
| Exclusion of inventory holding (gains) losses | (23 | ) | (23 | ) | ||||||||||||||||||||||||||||||||||||||
| Exclusion of special items | (442 | ) | 3,395 | 2,953 | ||||||||||||||||||||||||||||||||||||||
| Adjusted net profit attributable to Eni’s shareholders | 7,323 | (195 | ) | 7,128 | ||||||||||||||||||||||||||||||||||||||
(a) Following the announced divestment plan, Snam results are reclassified from "Gas & Power" sector to "Other activities" and accounted as discontinued operations.
(b) Excluding special items.
- 80 -
Contents
Eni Fact Book Financial Data
Breakdown of special items (a) | (euro million) | 2008 | 2009 | 2010 | 2011 | 2012 |
| Non-recurring charges (income) | (21 | ) | 250 | (246 | ) | 69 | |||||||||||
| of which: estimated charge from the possible resolution of the TSKJ matter | 250 | ||||||||||||||||
| of which: settlement/payments on antitrust and other Authorities proceedings | (21 | ) | (246 | ) | 69 | ||||||||||||
| Other special charges (income): | 2,055 | 1,045 | 2,536 | 1,498 | 4,795 | ||||||||||||
| - environmental charges | 309 | 298 | 1,369 | 186 | 134 | ||||||||||||
| - asset impairments | 1,572 | 1,162 | 702 | 1,022 | 4,029 | ||||||||||||
| - gains on disposal of assets | (8 | ) | (277 | ) | (248 | ) | (61 | ) | (570 | ) | |||||||
| - risk provisions | 4 | 128 | 95 | 88 | 945 | ||||||||||||
| - provision for redundancy incentives | 91 | 134 | 423 | 209 | 66 | ||||||||||||
| - re-measurement gains/losses on commodity derivatives | (61 | ) | (287 | ) | (2 | ) | 15 | (1 | ) | ||||||||
| - exchange rate differences and derivatives | (121 | ) | (117 | ) | 216 | (85 | ) | (79 | ) | ||||||||
| - other | 269 | 4 | (19 | ) | 124 | 271 | |||||||||||
| Special items of operating profit | 2,034 | 1,295 | 2,290 | 1,567 | 4,795 | ||||||||||||
| Net finance (expense) income | 121 | 117 | (181 | ) | 89 | 202 | |||||||||||
| of which: | |||||||||||||||||
| exchange rate differences and derivatives | 121 | 117 | (216 | ) | 85 | 79 | |||||||||||
| Net income from investments | (239 | ) | 179 | (324 | ) | (883 | ) | (5,408 | ) | ||||||||
| of which: | |||||||||||||||||
| gains from disposals | (217 | ) | (332 | ) | (1,118 | ) | (2,354 | ) | |||||||||
| of which: international transport | (1,044 | ) | |||||||||||||||
| of which: Galp | (311 | ) | |||||||||||||||
| of which: Snam | (2,019 | ) | |||||||||||||||
| of which: Padana Energia | (169 | ) | |||||||||||||||
| of which: GreenStream | (93 | ) | |||||||||||||||
| of which: GTT (Gaztransport et Technigaz SAS) | (185 | ) | |||||||||||||||
| gains from revaluation of investments | (3,151 | ) | |||||||||||||||
| of which: Galp | (1,700 | ) | |||||||||||||||
| of which: Snam | (1,451 | ) | |||||||||||||||
| impairments | 179 | 28 | 191 | 156 | |||||||||||||
| Income taxes | (1,402 | ) | (560 | ) | (624 | ) | 60 | (31 | ) | ||||||||
| of which: | |||||||||||||||||
| tax impact of Law Decree. No. 112 of June 25, 2008 | (270 | ) | |||||||||||||||
| tax impact of 2008 Budget Law | (290 | ) | |||||||||||||||
| adjustment to deferred tax for Libyan assets | (173 | ) | |||||||||||||||
| impairment on deferred tax assets E&P | 72 | ||||||||||||||||
| deferred tax liability on Italian subsidiaries | 803 | ||||||||||||||||
| deferred tax adjustment in a Production Sharing Agreement | 552 | ||||||||||||||||
| re-allocation of tax impact on Eni SpA dividends and other special items | (46 | ) | (219 | ) | 29 | 29 | 147 | ||||||||||
| taxes on special items of operating profit | (623 | ) | (413 | ) | (653 | ) | (521 | ) | (981 | ) | |||||||
| Total special items of net profit | 514 | 1,031 | 1,161 | 833 | (442 | ) | |||||||||||
| attributable to: | |||||||||||||||||
| - Non-controlling interest | (102 | ) | |||||||||||||||
| - Eni’s shareholders | 616 | 1,031 | 1,161 | 833 | (442 | ) | |||||||||||
(a) Including discontinued operations.
Adjusted operating profit by Division | (euro million) | 2008 | 2009 | 2010 | 2011 | 2012 |
| Exploration & Production | 17,166 | 9,489 | 13,898 | 16,075 | 18,518 | ||||||||||||
| Gas & Power | 1,778 | 2,022 | 1,268 | (247 | ) | 354 | |||||||||||
| Refining & Marketing | 555 | (381 | ) | (181 | ) | (539 | ) | (328 | ) | ||||||||
| Chemicals | (382 | ) | (441 | ) | (96 | ) | (273 | ) | (485 | ) | |||||||
| Engineering & Construction | 1,041 | 1,120 | 1,326 | 1,443 | 1,465 | ||||||||||||
| Other activities | (244 | ) | (258 | ) | (205 | ) | (226 | ) | (224 | ) | |||||||
| Corporate and financial companies | (282 | ) | (342 | ) | (265 | ) | (266 | ) | (329 | ) | |||||||
| Impact of unrealized intragroup profit elimination | 1,690 | 1,513 | 1,100 | 1,263 | 782 | ||||||||||||
| 21,322 | 12,722 | 16,845 | 17,230 | 19,753 |
- 81 -
Contents
Eni Fact Book Financial Data
Adjusted net profit by Division | (euro million) | 2008 | 2009 | 2010 | 2011 | 2012 |
| Exploration & Production | 7,862 | 3,881 | 5,609 | 6,865 | 7,425 | ||||||||||||
| Gas & Power | 1,436 | 1,655 | 1,267 | 252 | 473 | ||||||||||||
| Refining & Marketing | 505 | (212 | ) | (56 | ) | (264 | ) | (179 | ) | ||||||||
| Chemicals | (311 | ) | (351 | ) | (73 | ) | (206 | ) | (395 | ) | |||||||
| Engineering & Construction | 784 | 892 | 994 | 1,098 | 1,109 | ||||||||||||
| Other activities | (279 | ) | (245 | ) | (216 | ) | (225 | ) | (247 | ) | |||||||
| Corporate and financial companies | (502 | ) | (708 | ) | (867 | ) | (753 | ) | (976 | ) | |||||||
| Impact of unrealized intragroup profit elimination | 1,520 | 1,427 | 1,124 | 1,146 | 661 | ||||||||||||
| 11,015 | 6,339 | 7,782 | 7,913 | 7,871 | |||||||||||||
| Attributable to: | |||||||||||||||||
| Non-controlling interest | 700 | 1,018 | 1,012 | 975 | 743 | ||||||||||||
| Eni's shareholders | 10,315 | 5,321 | 6,770 | 6,938 | 7,128 | ||||||||||||
Finance income (expense) | (euro million) | 2008 | 2009 | 2010 | 2011 | 2012 |
| Income from equity instruments | 241 | 163 | |||||||||||||||
| Exchange differences, net | 206 | (106 | ) | 92 | (111 | ) | 131 | ||||||||||
| Finance income (expense) related to net borrowings and other | (667 | ) | (614 | ) | (634 | ) | (809 | ) | (1,038 | ) | |||||||
| Net income from securities | 21 | 3 | 10 | 9 | 9 | ||||||||||||
| Financial expense due to the passage of time (accretion discount) | (233 | ) | (197 | ) | (236 | ) | (235 | ) | (308 | ) | |||||||
| Income (expense) on derivatives | (427 | ) | (6 | ) | (131 | ) | (112 | ) | (251 | ) | |||||||
| less: | |||||||||||||||||
| Finance expense capitalized | 198 | 192 | 150 | 112 | 150 | ||||||||||||
| (661 | ) | (565 | ) | (749 | ) | (1,146 | ) | (1,307 | ) | ||||||||
| of which, net income from receivables and securities held for financing operating activities and interest on tax credits | 78 | 40 | 64 | 67 | 61 | ||||||||||||
Income (expense on) from investments | (euro million) | 2008 | 2009 | 2010 | 2011 | 2012 |
| Share of profit of equity-accounted investments | 734 | 655 | 673 | 634 | 526 | ||||||||||||
| Share of loss of equity-accounted investments | (105 | ) | (241 | ) | (149 | ) | (106 | ) | (233 | ) | |||||||
| Gains on disposals | 218 | 16 | 332 | 1,121 | 349 | ||||||||||||
| Losses on disposals | (1 | ) | |||||||||||||||
| Dividends | 510 | 164 | 264 | 659 | 431 | ||||||||||||
| Decreases (increases) in the provision for losses on investments | (16 | ) | (59 | ) | (31 | ) | (28 | ) | (15 | ) | |||||||
| Other income (expense), net | 6 | (1 | ) | 23 | (157 | ) | 1,823 | ||||||||||
| 1,346 | 534 | 1,112 | 2,123 | 2,881 |
- 82 -
Contents
Eni Fact Book Financial Data
Property, plant and equipment by Division (at year end) | (euro million) | 2008 | 2009 | 2010 | 2011 | 2012 |
| Property, plant and equipment by segment, gross | |||||||||||||||||
| Exploration & Production | 64,338 | 71,189 | 85,494 | 96,561 | 103,369 | ||||||||||||
| Gas & Power | 4,623 | 4,750 | 4,155 | 4,206 | 4,373 | ||||||||||||
| Refining & Marketing | 12,899 | 13,378 | 14,177 | 14,884 | 15,744 | ||||||||||||
| Chemicals | 5,036 | 5,174 | 5,226 | 5,438 | 5,589 | ||||||||||||
| Engineering & Construction | 7,702 | 9,163 | 10,714 | 11,809 | 12,621 | ||||||||||||
| Other activities - Snam (*) | 16,106 | 17,290 | 18,355 | 19,449 | |||||||||||||
| Other activities | 1,550 | 1,592 | 1,614 | 1,617 | 1,617 | ||||||||||||
| Corporate and financial companies | 391 | 373 | 372 | 422 | 470 | ||||||||||||
| Impact of unrealized intragroup profit elimination | (355 | ) | (343 | ) | (495 | ) | (523 | ) | (486 | ) | |||||||
| 112,290 | 122,566 | 139,612 | 153,863 | 143,297 | |||||||||||||
| Property, plant and equipment by segment, net | |||||||||||||||||
| Exploration & Production | 32,355 | 34,462 | 40,521 | 45,527 | 47,533 | ||||||||||||
| Gas & Power | 3,314 | 3,235 | 2,614 | 2,501 | 2,412 | ||||||||||||
| Refining & Marketing | 4,496 | 4,397 | 4,766 | 4,758 | 4,439 | ||||||||||||
| Chemicals | 912 | 853 | 990 | 960 | 928 | ||||||||||||
| Engineering & Construction | 5,154 | 6,305 | 7,422 | 7,969 | 8,213 | ||||||||||||
| Other activities - Snam (*) | 9,724 | 10,543 | 11,262 | 12,016 | |||||||||||||
| Other activities | 83 | 79 | 78 | 76 | 76 | ||||||||||||
| Corporate and financial companies | 212 | 179 | 171 | 196 | 227 | ||||||||||||
| Impact of unrealized intragroup profit elimination | (317 | ) | (288 | ) | (420 | ) | (425 | ) | (362 | ) | |||||||
| 55,933 | 59,765 | 67,404 | 73,578 | 63,466 | |||||||||||||
(*) Property, plant and equipment pertaining to the segment Other activities - Snam has been reclassified from the Gas & Power segment.
Capital expenditure by Division | (euro million) | 2008 | 2009 | 2010 | 2011 | 2012 |
| Exploration & Production | 9,281 | 9,486 | 9,690 | 9,435 | 10,307 | ||||||||||||
| Gas & Power | 431 | 207 | 265 | 192 | 225 | ||||||||||||
| Refining & Marketing | 965 | 635 | 711 | 866 | 842 | ||||||||||||
| Chemicals | 212 | 145 | 251 | 216 | 172 | ||||||||||||
| Engineering & Construction | 2,027 | 1,630 | 1,552 | 1,090 | 1,011 | ||||||||||||
| Other activities | 52 | 44 | 22 | 10 | 14 | ||||||||||||
| Corporate and financial companies | 95 | 57 | 109 | 128 | 152 | ||||||||||||
| Impact of unrealized intragroup profit elimination | (128 | ) | 12 | (150 | ) | (28 | ) | 38 | |||||||||
| Capital expenditure - continuing operations | 12,935 | 12,216 | 12,450 | 11,909 | 12,761 | ||||||||||||
| Capital expenditure - discontinued operations | 1,627 | 1,479 | 1,420 | 1,529 | 756 | ||||||||||||
| Capital expenditure | 14,562 | 13,695 | 13,870 | 13,438 | 13,517 | ||||||||||||
| Investments | 4,305 | 2,323 | 410 | 360 | 569 | ||||||||||||
| Capital expenditure and investments | 18,867 | 16,018 | 14,280 | 13,798 | 14,086 |
Capital expenditure by geographic area of origin | (euro million) | 2008 | 2009 | 2010 | 2011 | 2012 |
| Italy | 2,047 | 1,719 | 1,624 | 2,058 | 2,130 | |||||||
| Other European Union Countries | 1,660 | 1,454 | 1,710 | 1,337 | 1,255 | |||||||
| Rest of Europe | 582 | 574 | 724 | 1,174 | 1,630 | |||||||
| Africa | 5,153 | 4,645 | 5,083 | 4,369 | 4,725 | |||||||
| Americas | 1,240 | 1,207 | 1,156 | 978 | 1,184 | |||||||
| Asia | 1,777 | 2,033 | 1,941 | 1,608 | 1,663 | |||||||
| Other areas | 476 | 584 | 212 | 385 | 174 | |||||||
| Total outside Italy | 10,888 | 10,497 | 10,826 | 9,851 | 10,631 | |||||||
| Capital expenditure - continuing operations | 12,935 | 12,216 | 12,450 | 11,909 | 12,761 | |||||||
| Capital expenditure - discontinued operations | ||||||||||||
| Italy | 1,627 | 1,479 | 1,420 | 1,529 | 756 | |||||||
| Capital expenditure | 14,562 | 13,695 | 13,870 | 13,438 | 13,517 | |||||||
- 83 -
Contents
Eni Fact Book Financial Data
| Net borrowings | (euro million) |
| Debt and bonds | Cash and cash equivalents | Securities held for non-operating purposes | Financing receivables held for non-operating purposes | Total | ||||||
| 2008 | |||||||||||||||
| Short-term debt | 6,908 | (1,939 | ) | (185 | ) | (337 | ) | 4,447 | |||||||
| Long-term debt | 13,929 | 13,929 | |||||||||||||
| 20,837 | (1,939 | ) | (185 | ) | (337 | ) | 18,376 | ||||||||
| 2009 | |||||||||||||||
| Short-term debt | 6,736 | (1,608 | ) | (64 | ) | (73 | ) | 4,991 | |||||||
| Long-term debt | 18,064 | 18,064 | |||||||||||||
| 24,800 | (1,608 | ) | (64 | ) | (73 | ) | 23,055 | ||||||||
| 2010 | |||||||||||||||
| Short-term debt | 7,478 | (1,549 | ) | (109 | ) | (6 | ) | 5,814 | |||||||
| Long-term debt | 20,305 | 20,305 | |||||||||||||
| 27,783 | (1,549 | ) | (109 | ) | (6 | ) | 26,119 | ||||||||
| 2011 | |||||||||||||||
| Short-term debt | 6,495 | (1,500 | ) | (37 | ) | (28 | ) | 4,930 | |||||||
| Long-term debt | 23,102 | 23,102 | |||||||||||||
| 29,597 | (1,500 | ) | (37 | ) | (28 | ) | 28,032 | ||||||||
| 2012 | |||||||||||||||
| Short-term debt | 5,184 | (7,765 | ) | (34 | ) | (1,153 | ) | (3,768 | ) | ||||||
| Long-term debt | 19,279 | 19,279 | |||||||||||||
| 24,463 | (7,765 | ) | (34 | ) | (1,153 | ) | 15,511 |
- 84 -
Contents
Eni Fact Book Employees
Employees
Employees at year end (a) | (units) | 2008 | 2009 | 2010 | 2011 | 2012 |
| Italy | 4,054 | 3,883 | 3,906 | 3,797 | 3,933 | |||||||
| Exploration & Production | Outside Italy | 6,182 | 6,388 | 6,370 | 6,628 | 7,371 | ||||||
| 10,236 | 10,271 | 10,276 | 10,425 | 11,304 | ||||||||
| Italy | 2,649 | 2,585 | 2,479 | 2,310 | 2,126 | |||||||
| Gas & Power | Outside Italy | 2,663 | 2,562 | 2,593 | 2,485 | 2,626 | ||||||
| 5,312 | 5,147 | 5,072 | 4,795 | 4,752 | ||||||||
| Italy | 6,609 | 6,467 | 6,162 | 5,790 | 5,505 | |||||||
| Refining & Marketing | Outside Italy | 1,718 | 1,699 | 1,860 | 1,801 | 1,620 | ||||||
| 8,327 | 8,166 | 8,022 | 7,591 | 7,125 | ||||||||
| Italy | 5,224 | 5,045 | 4,903 | 4,750 | 4,606 | |||||||
| Chemicals | Outside Italy | 1,050 | 1,023 | 1,069 | 1,054 | 1,062 | ||||||
| 6,274 | 6,068 | 5,972 | 5,804 | 5,668 | ||||||||
| Italy | 5,420 | 5,174 | 4,915 | 5,197 | 5,186 | |||||||
| Engineering & Construction | Outside Italy | 30,209 | 30,795 | 33,911 | 33,364 | 38,201 | ||||||
| 35,629 | 35,969 | 38,826 | 38,561 | 43,387 | ||||||||
| Italy | 1,070 | 968 | 939 | 880 | 871 | |||||||
| Other activities | Outside Italy | - | - | - | - | - | ||||||
| 1,070 | 968 | 939 | 880 | 871 | ||||||||
| Italy | 4,717 | 4,706 | 4,497 | 4,334 | 4,577 | |||||||
| Corporate and financial companies | Outside Italy | 149 | 166 | 164 | 184 | 154 | ||||||
| 4,866 | 4,872 | 4,661 | 4,518 | 4,731 | ||||||||
| Italy | 36,123 | 35,085 | 27,801 | 27,058 | 26,804 | |||||||
| Total employees at year end | Outside Italy | 41,971 | 42,633 | 45,967 | 45,516 | 51,034 | ||||||
| 71,714 | 71,461 | 73,768 | 72,574 | 77,838 | ||||||||
| of which: senior managers | 1,471 | 1,438 | 1,454 | 1,468 | 1,474 | |||||||
(a) Following the divestment of controlling interest and consequent exclusion from consolidation of Snam, starting from 2012, payroll of the Gas & Power Division includes the Marketing and International Transport businesses only. Prior year data have been reclassified accordingly.
- 85 -
Contents
Eni Fact Book Supplemental oil and gas information
Supplemental oil and gas information
| Oil and natural gas reserves Eni’s criteria concerning evaluation and classification of proved developed and undeveloped reserves follow Regulation S-X 4-10 of the U.S. Securities and Exchange Commission and have been disclosed in accordance with FASB Extractive Activities - oil&gas (Topic 932). | adjustments required by applicable contractual arrangements, and other pertinent information are provided. In 2012, Ryder Scott Company and DeGolyer and MacNaughton2 provided an independent evaluation of almost 33% of Eni’s total proved reserves as of December 31, 20123, confirming, as in previous years, the reasonableness of Eni’s internal evaluations. In the three year period from 2010 to 2012, 92% of Eni’s total proved reserves were subject to independent evaluation. As of December 31, 2012, the principal properties not subjected to independent evaluation in the last three years are Bouri and Bu Attifel (Libya) and M’Boundi (Congo). Eni operates under Production Sharing Agreements, PSAs, in several of the foreign jurisdictions where it has oil and gas exploration and production activities. Reserves of oil and natural gas to which Eni is entitled under PSA arrangements are shown in accordance with Eni’s economic interest in the volumes of oil and natural gas estimated to be recoverable in future years. Such reserves include estimated quantities allocated to Eni for recovery of costs, income taxes owed by Eni but settled by its joint venture partners (which are state-owned entities) out of Eni’s share of production and Eni’s net equity share after cost recovery. Proved oil and gas reserves associated with PSAs represented 55%, 49% and 47% of total proved reserves as of December 31, 2010, 2011 and 2012, respectively, on an oil-equivalent basis. Similar effects as PSAs apply to service and "buy-back" contracts; proved reserves associated with such contracts represented 3%, 1% and 2% of total proved reserves on an oil-equivalent basis as of December 31, 2010, 2011 and 2012, respectively. Oil and gas reserve quantities include: (i) oil and natural gas quantities in excess of cost recovery which the company has an obligation to purchase under certain PSAs with governments or authorities, whereby the company serves as producer of reserves. Reserve volumes associated with oil and gas deriving from such obligation represent 0.6%, 0.8% and 1.1% of total proved reserves as of December 31, 2010, 2011 and 2012, respectively, on an oil equivalent basis; (ii) volumes of natural gas used for own consumption; (iii) the quantities of hydrocarbons related to the Angola LNG plant. Numerous uncertainties are inherent in estimating quantities of proved reserves, in projecting future productions and development expenditures. The accuracy of any reserve estimate is a function of the quality of available data and engineering and geological interpretation and evaluation. The results of drilling, testing and production after the date of the estimate may require substantial upward or downward revisions. In addition, changes in oil and natural gas prices have an effect on the quantities of Eni’s proved reserves since estimates of reserves are based on prices and costs relevant to the date when such estimates are made. Consequently, the evaluation of reserves could also significantly differ from actual oil and natural gas volumes that will be produced. The following table presents yearly changes in estimated proved reserves, developed and undeveloped, of hydrocarbons, liquids (including crude oil, condensate and natural gas liquids) and natural gas as of December 31, 2010, 2011 and 2012. |
(1) From 1991 to 2002 DeGolyer and MacNaughton, from 2003 also Ryder Scott.
(2) The reports of independent engineers are available on Eni website eni.com, section Publications/Annual Report 2012.
(3) Including reserves of equity-accounted entities.
- 86 -
Contents
Eni Fact Book Supplemental oil and gas information
| Movements in net proved hydrocarbons reserves | (mmboe) |
| Italy (a) | Rest of Europe | North Africa | Sub-Saharan Africa | Kazakhstan | Rest of Asia | America | Australia and Oceania | Total | ||||||||||
| 2010 | |||||||||||||||||||||||||||
| Consolidated subsidiaries | |||||||||||||||||||||||||||
| Reserves at December 31, 2009 | 703 | 590 | 1,922 | 1,141 | 1,221 | 236 | 263 | 133 | 6,209 | ||||||||||||||||||
| of which: | |||||||||||||||||||||||||||
| developed | 490 | 432 | 1,266 | 799 | 614 | 139 | 168 | 122 | 4,030 | ||||||||||||||||||
| undeveloped | 213 | 158 | 656 | 342 | 607 | 97 | 95 | 11 | 2,179 | ||||||||||||||||||
| Purchase of minerals in place | |||||||||||||||||||||||||||
| Revisions of previous estimates | 97 | 34 | 353 | 116 | (56 | ) | 104 | 13 | 661 | ||||||||||||||||||
| Improved recovery | 1 | 1 | 2 | ||||||||||||||||||||||||
| Extensions and discoveries | 57 | 39 | 22 | 1 | 2 | 4 | 125 | ||||||||||||||||||||
| Production | (67 | ) | (80 | ) | (218 | ) | (145 | ) | (39 | ) | (46 | ) | (48 | ) | (10 | ) | (653 | ) | |||||||||
| Sales of minerals in place | (9 | ) | (1 | ) | (2 | ) | (12 | ) | |||||||||||||||||||
| Reserves at December 31, 2010 | 724 | 601 | 2,096 | 1,133 | 1,126 | 295 | 230 | 127 | 6,332 | ||||||||||||||||||
| Equity-accounted entities | |||||||||||||||||||||||||||
| Reserves at December 31, 2009 | 15 | 22 | 309 | 16 | 362 | ||||||||||||||||||||||
| of which: | |||||||||||||||||||||||||||
| developed | 12 | 5 | 44 | 13 | 74 | ||||||||||||||||||||||
| undeveloped | 3 | 17 | 265 | 3 | 288 | ||||||||||||||||||||||
| Purchase of minerals in place | |||||||||||||||||||||||||||
| Revisions of previous estimates | 9 | 1 | 10 | (1 | ) | 19 | |||||||||||||||||||||
| Improved recovery | 12 | 12 | |||||||||||||||||||||||||
| Extensions and discoveries | 1 | 6 | 120 | 127 | |||||||||||||||||||||||
| Production | (2 | ) | (1 | ) | (2 | ) | (4 | ) | (9 | ) | |||||||||||||||||
| Sales of minerals in place | |||||||||||||||||||||||||||
| Reserves at December 31, 2010 | 23 | 28 | 317 | 143 | 511 | ||||||||||||||||||||||
| Reserves at December 31, 2010 | 724 | 601 | 2,119 | 1,161 | 1,126 | 612 | 373 | 127 | 6,843 | ||||||||||||||||||
| Developed | 554 | 405 | 1,237 | 817 | 543 | 182 | 167 | 117 | 4,022 | ||||||||||||||||||
| consolidated subsidiaries | 554 | 405 | 1,215 | 812 | 543 | 139 | 141 | 117 | 3,926 | ||||||||||||||||||
| equity-accounted entities | 22 | 5 | 43 | 26 | 96 | ||||||||||||||||||||||
| Undeveloped | 170 | 196 | 882 | 344 | 583 | 430 | 206 | 10 | 2,821 | ||||||||||||||||||
| consolidated subsidiaries | 170 | 196 | 881 | 321 | 583 | 156 | 89 | 10 | 2,406 | ||||||||||||||||||
| equity-accounted entities | 1 | 23 | 274 | 117 | 415 | ||||||||||||||||||||||
(a) Including approximately 769 and 767 billion cubic feet of natural gas held in storage at December 31, 2009 and 2010, respectively.
- 87 -
Contents
Eni Fact Book Supplemental oil and gas information
| Movements in net proved hydrocarbons reserves | (mmboe) |
| Italy (a) | Rest of Europe | North Africa | Sub-Saharan Africa | Kazakhstan | Rest of Asia | America | Australia and Oceania | Total | ||||||||||
| 2011 | |||||||||||||||||||||||||||
| Consolidated subsidiaries | |||||||||||||||||||||||||||
| Reserves at December 31, 2010 | 724 | 601 | 2,096 | 1,133 | 1,126 | 295 | 230 | 127 | 6,332 | ||||||||||||||||||
| of which: | |||||||||||||||||||||||||||
| developed | 554 | 405 | 1,215 | 812 | 543 | 139 | 141 | 117 | 3,926 | ||||||||||||||||||
| undeveloped | 170 | 196 | 881 | 321 | 583 | 156 | 89 | 10 | 2,406 | ||||||||||||||||||
| Purchase of minerals in place | 2 | 2 | |||||||||||||||||||||||||
| Revisions of previous estimates | 48 | 94 | 88 | 12 | (137 | ) | (26 | ) | 10 | 17 | 106 | ||||||||||||||||
| Improved recovery | 2 | 2 | 2 | 6 | |||||||||||||||||||||||
| Extensions and discoveries | 1 | 13 | 3 | 14 | 40 | 71 | |||||||||||||||||||||
| Production | (68 | ) | (78 | ) | (158 | ) | (133 | ) | (39 | ) | (39 | ) | (42 | ) | (11 | ) | (568 | ) | |||||||||
| Sales of minerals in place | (2 | ) | (7 | ) | (9 | ) | |||||||||||||||||||||
| Reserves at December 31, 2011 | 707 | 630 | 2,031 | 1,021 | 950 | 230 | 238 | 133 | 5,940 | ||||||||||||||||||
| Equity-accounted entities | |||||||||||||||||||||||||||
| Reserves at December 31, 2010 | 23 | 28 | 317 | 143 | 511 | ||||||||||||||||||||||
| of which: | |||||||||||||||||||||||||||
| developed | 22 | 5 | 43 | 26 | 96 | ||||||||||||||||||||||
| undeveloped | 1 | 23 | 274 | 117 | 415 | ||||||||||||||||||||||
| Purchase of minerals in place | |||||||||||||||||||||||||||
| Revisions of previous estimates | 37 | 73 | 13 | 123 | |||||||||||||||||||||||
| Improved recovery | 1 | 1 | |||||||||||||||||||||||||
| Extensions and discoveries | 19 | 268 | 233 | 520 | |||||||||||||||||||||||
| Production | (2 | ) | (1 | ) | (2 | ) | (4 | ) | (9 | ) | |||||||||||||||||
| Sales of minerals in place | |||||||||||||||||||||||||||
| Reserves at December 31, 2011 | 21 | 83 | 656 | 386 | 1,146 | ||||||||||||||||||||||
| Reserves at December 31, 2011 | 707 | 630 | �� | 2,052 | 1,104 | 950 | 886 | 624 | 133 | 7,086 | |||||||||||||||||
| Developed | 540 | 374 | 1,194 | 746 | 482 | 134 | 188 | 112 | 3,770 | ||||||||||||||||||
| consolidated subsidiaries | 540 | 374 | 1,175 | 742 | 482 | 129 | 162 | 112 | 3,716 | ||||||||||||||||||
| equity-accounted entities | 19 | 4 | 5 | 26 | 54 | ||||||||||||||||||||||
| Undeveloped | 167 | 256 | 858 | 358 | 468 | 752 | 436 | 21 | 3,316 | ||||||||||||||||||
| consolidated subsidiaries | 167 | 256 | 856 | 279 | 468 | 101 | 76 | 21 | 2,224 | ||||||||||||||||||
| equity-accounted entities | 2 | 79 | 651 | 360 | 1,092 | ||||||||||||||||||||||
(a) Including, approximately, 767 and 767 billion cubic feet of natural gas held in storage at December 31, 2010 and 2011, respectively.
- 88 -
Contents
Eni Fact Book Supplemental oil and gas information
| Movements in net proved hydrocarbons reserves | (mmboe) |
| Italy (a) | Rest of Europe | North Africa | Sub-Saharan Africa | Kazakhstan | Rest of Asia | America | Australia and Oceania | Total | ||||||||||
| 2012 | |||||||||||||||||||||||||||
| Consolidated subsidiaries | |||||||||||||||||||||||||||
| Reserves at December 31, 2011 | 707 | 630 | 2,031 | 1,021 | 950 | 230 | 238 | 133 | 5,940 | ||||||||||||||||||
| of which: | |||||||||||||||||||||||||||
| developed | 540 | 374 | 1,175 | 742 | 482 | 129 | 162 | 112 | 3,716 | ||||||||||||||||||
| undeveloped | 167 | 256 | 856 | 279 | 468 | 101 | 76 | 21 | 2,224 | ||||||||||||||||||
| Purchase of minerals in place | |||||||||||||||||||||||||||
| Revisions of previous estimates | 24 | 20 | 67 | 82 | 91 | (5 | ) | 34 | 8 | 321 | |||||||||||||||||
| Improved recovery | 1 | 20 | 7 | 28 | |||||||||||||||||||||||
| Extensions and discoveries | 4 | 6 | 10 | 86 | 85 | 9 | 200 | ||||||||||||||||||||
| Production | (69 | ) | (66 | ) | (213 | ) | (126 | ) | (37 | ) | (41 | ) | (45 | ) | (13 | ) | (610 | ) | |||||||||
| Sales of minerals in place | (142 | ) | (22 | ) | (48 | ) | (212 | ) | |||||||||||||||||||
| Reserves at December 31, 2012 | 524 | 591 | 1,915 | 1,048 | 1,041 | 184 | 236 | 128 | 5,667 | ||||||||||||||||||
| Equity-accounted entities | |||||||||||||||||||||||||||
| Reserves at December 31, 2011 | 21 | 83 | 656 | 386 | 1,146 | ||||||||||||||||||||||
| of which: | |||||||||||||||||||||||||||
| developed | 19 | 4 | 5 | 26 | 54 | ||||||||||||||||||||||
| undeveloped | 2 | 79 | 651 | 360 | 1,092 | ||||||||||||||||||||||
| Purchase of minerals in place | |||||||||||||||||||||||||||
| Revisions of previous estimates | 8 | 247 | 255 | ||||||||||||||||||||||||
| Improved recovery | |||||||||||||||||||||||||||
| Extensions and discoveries | 1 | 3 | 10 | 135 | 149 | ||||||||||||||||||||||
| Production | (2 | ) | (1 | ) | (6 | ) | (4 | ) | (13 | ) | |||||||||||||||||
| Sales of minerals in place | (4 | ) | (34 | ) | (38 | ) | |||||||||||||||||||||
| Reserves at December 31, 2012 | 20 | 81 | 668 | 730 | 1,499 | ||||||||||||||||||||||
| Reserves at December 31, 2012 | 524 | 591 | 1,935 | 1,129 | 1,041 | 852 | 966 | 128 | 7,166 | ||||||||||||||||||
| Developed | 406 | 349 | 1,100 | 716 | 458 | 190 | 190 | 107 | 3,516 | ||||||||||||||||||
| consolidated subsidiaries | 406 | 349 | 1,080 | 716 | 458 | 108 | 170 | 107 | 3,394 | ||||||||||||||||||
| equity-accounted entities | 20 | 82 | 20 | 122 | |||||||||||||||||||||||
| Undeveloped | 118 | 242 | 835 | 413 | 583 | 662 | 776 | 21 | 3,650 | ||||||||||||||||||
| consolidated subsidiaries | 118 | 242 | 835 | 332 | 583 | 76 | 66 | 21 | 2,273 | ||||||||||||||||||
| equity-accounted entities | 81 | 586 | 710 | 1,377 | |||||||||||||||||||||||
(a) Including, approximately, 767 billion cubic feet of natural gas held in storage at December 31, 2011.
- 89 -
Contents
Eni Fact Book Supplemental oil and gas information
| Movements in net proved liquids reserves | (mmbbl) |
| Italy | Rest of Europe | North Africa | Sub-Saharan Africa | Kazakhstan | Rest of Asia | America | Australia and Oceania | Total | ||||||||||
| 2010 | |||||||||||||||||||||||||||
| Consolidated subsidiaries | |||||||||||||||||||||||||||
| Reserves at December 31, 2009 | 233 | 351 | 895 | 770 | 849 | 94 | 153 | 32 | 3,377 | ||||||||||||||||||
| of which: | |||||||||||||||||||||||||||
| developed | 141 | 218 | 659 | 544 | 291 | 45 | 80 | 23 | 2,001 | ||||||||||||||||||
| undeveloped | 92 | 133 | 236 | 226 | 558 | 49 | 73 | 9 | 1,376 | ||||||||||||||||||
| Purchase of minerals in place | |||||||||||||||||||||||||||
| Revisions of previous estimates | 38 | 17 | 178 | 75 | (37 | ) | 62 | 2 | 335 | ||||||||||||||||||
| Improved recovery | 1 | 1 | 2 | ||||||||||||||||||||||||
| Extensions and discoveries | 25 | 13 | 22 | 1 | 61 | ||||||||||||||||||||||
| Production | (23 | ) | (44 | ) | (108 | ) | (116 | ) | (24 | ) | (17 | ) | (22 | ) | (3 | ) | (357 | ) | |||||||||
| Sales of minerals in place | (1 | ) | (2 | ) | (3 | ) | |||||||||||||||||||||
| Reserves at December 31, 2010 | 248 | 349 | 978 | 750 | 788 | 139 | 134 | 29 | 3,415 | ||||||||||||||||||
| Equity-accounted entities | |||||||||||||||||||||||||||
| Reserves at December 31, 2009 | �� | 13 | 7 | 50 | 16 | 86 | |||||||||||||||||||||
| of which: | |||||||||||||||||||||||||||
| developed | 10 | 4 | 7 | 13 | 34 | ||||||||||||||||||||||
| undeveloped | 3 | 3 | 43 | 3 | 52 | ||||||||||||||||||||||
| Purchase of minerals in place | |||||||||||||||||||||||||||
| Revisions of previous estimates | 8 | (6 | ) | (2 | ) | ||||||||||||||||||||||
| Improved recovery | 12 | 12 | |||||||||||||||||||||||||
| Extensions and discoveries | 117 | 117 | |||||||||||||||||||||||||
| Production | (2 | ) | (1 | ) | (4 | ) | (7 | ) | |||||||||||||||||||
| Sales of minerals in place | |||||||||||||||||||||||||||
| Reserves at December 31, 2010 | 19 | 6 | 44 | 139 | 208 | ||||||||||||||||||||||
| Reserves at December 31, 2010 | 248 | 349 | 997 | 756 | 788 | 183 | 273 | 29 | 3,623 | ||||||||||||||||||
| Developed | 183 | 207 | 674 | 537 | 251 | 44 | 87 | 20 | 2,003 | ||||||||||||||||||
| consolidated subsidiaries | 183 | 207 | 656 | 533 | 251 | 39 | 62 | 20 | 1,951 | ||||||||||||||||||
| equity-accounted entities | 18 | 4 | 5 | 25 | 52 | ||||||||||||||||||||||
| Undeveloped | 65 | 142 | 323 | 219 | 537 | 139 | 186 | 9 | 1,620 | ||||||||||||||||||
| consolidated subsidiaries | 65 | 142 | 322 | 217 | 537 | 100 | 72 | 9 | 1,464 | ||||||||||||||||||
| equity-accounted entities | 1 | 2 | 39 | 114 | 156 | ||||||||||||||||||||||
- 90 -
Contents
Eni Fact Book Supplemental oil and gas information
| Movements in net proved liquids reserves | (mmbbl) |
| Italy | Rest of Europe | North Africa | Sub-Saharan Africa | Kazakhstan | Rest of Asia | America | Australia and Oceania | Total | ||||||||||
| 2011 | |||||||||||||||||||||||||||
| Consolidated subsidiaries | |||||||||||||||||||||||||||
| Reserves at December 31, 2010 | 248 | 349 | 978 | 750 | 788 | 139 | 134 | 29 | 3,415 | ||||||||||||||||||
| of which: | |||||||||||||||||||||||||||
| developed | 183 | 207 | 656 | 533 | 251 | 39 | 62 | 20 | 1,951 | ||||||||||||||||||
| undeveloped | 65 | 142 | 322 | 217 | 537 | 100 | 72 | 9 | 1,464 | ||||||||||||||||||
| Purchase of minerals in place | |||||||||||||||||||||||||||
| Revisions of previous estimates | 34 | 58 | 10 | 14 | (112 | ) | (20 | ) | 1 | (15 | ) | ||||||||||||||||
| Improved recovery | 2 | 2 | 2 | 6 | |||||||||||||||||||||||
| Extensions and discoveries | 9 | 2 | 11 | 17 | 39 | ||||||||||||||||||||||
| Production | (23 | ) | (44 | ) | (75 | ) | (100 | ) | (23 | ) | (13 | ) | (20 | ) | (4 | ) | (302 | ) | |||||||||
| Sales of minerals in place | (2 | ) | (7 | ) | (9 | ) | |||||||||||||||||||||
| Reserves at December 31, 2011 | 259 | 372 | 917 | 670 | 653 | 106 | 132 | 25 | 3,134 | ||||||||||||||||||
| Equity-accounted entities | |||||||||||||||||||||||||||
| Reserves at December 31, 2010 | 19 | 6 | 44 | 139 | 208 | ||||||||||||||||||||||
| of which: | |||||||||||||||||||||||||||
| developed | 18 | 4 | 5 | 25 | 52 | ||||||||||||||||||||||
| undeveloped | 1 | 2 | 39 | 114 | 156 | ||||||||||||||||||||||
| Purchase of minerals in place | |||||||||||||||||||||||||||
| Revisions of previous estimates | 11 | 6 | 11 | 28 | |||||||||||||||||||||||
| Improved recovery | 1 | 1 | |||||||||||||||||||||||||
| Extensions and discoveries | 6 | 60 | 4 | 70 | |||||||||||||||||||||||
| Production | (2 | ) | (1 | ) | (4 | ) | (7 | ) | |||||||||||||||||||
| Sales of minerals in place | |||||||||||||||||||||||||||
| Reserves at December 31, 2011 | 17 | 22 | 110 | 151 | 300 | ||||||||||||||||||||||
| Reserves at December 31, 2011 | 259 | 372 | 934 | 692 | 653 | 216 | 283 | 25 | 3,434 | ||||||||||||||||||
| Developed | 184 | 195 | 638 | 487 | 215 | 34 | 117 | 25 | 1,895 | ||||||||||||||||||
| consolidated subsidiaries | 184 | 195 | 622 | 483 | 215 | 34 | 92 | 25 | 1,850 | ||||||||||||||||||
| equity-accounted entities | 16 | 4 | 25 | 45 | |||||||||||||||||||||||
| Undeveloped | 75 | 177 | 296 | 205 | 438 | 182 | 166 | 1,539 | |||||||||||||||||||
| consolidated subsidiaries | 75 | 177 | 295 | 187 | 438 | 72 | 40 | 1,284 | |||||||||||||||||||
| equity-accounted entities | 1 | 18 | 110 | 126 | 255 | ||||||||||||||||||||||
- 91 -
Contents
Eni Fact Book Supplemental oil and gas information
| Movements in net proved liquids reserves | (mmbbl) |
| Italy | Rest of Europe | North Africa | Sub-Saharan Africa | Kazakhstan | Rest of Asia | America | Australia and Oceania | Total | ||||||||||
| 2012 | |||||||||||||||||||||||||||
| Consolidated subsidiaries | |||||||||||||||||||||||||||
| Reserves at December 31, 2011 | 259 | 372 | 917 | 670 | 653 | 106 | 132 | 25 | 3,134 | ||||||||||||||||||
| of which: | |||||||||||||||||||||||||||
| developed | 184 | 195 | 622 | 483 | 215 | 34 | 92 | 25 | 1,850 | ||||||||||||||||||
| undeveloped | 75 | 177 | 295 | 187 | 438 | 72 | 40 | 1,284 | |||||||||||||||||||
| Purchase of minerals in place | |||||||||||||||||||||||||||
| Revisions of previous estimates | (9 | ) | 10 | 55 | 26 | 62 | (9 | ) | 40 | 6 | 181 | ||||||||||||||||
| Improved recovery | 1 | 20 | 7 | 28 | |||||||||||||||||||||||
| Extensions and discoveries | 3 | 10 | 65 | 8 | 86 | ||||||||||||||||||||||
| Production | (23 | ) | (35 | ) | (98 | ) | (90 | ) | (22 | ) | (15 | ) | (26 | ) | (7 | ) | (316 | ) | |||||||||
| Sales of minerals in place | (6 | ) | (23 | ) | (29 | ) | |||||||||||||||||||||
| Reserves at December 31, 2012 | 227 | 351 | 904 | 672 | 670 | 82 | 154 | 24 | 3,084 | ||||||||||||||||||
| Equity-accounted entities | |||||||||||||||||||||||||||
| Reserves at December 31, 2011 | 17 | 22 | 110 | 151 | 300 | ||||||||||||||||||||||
| of which: | |||||||||||||||||||||||||||
| developed | 16 | 4 | 25 | 45 | |||||||||||||||||||||||
| undeveloped | 1 | 18 | 110 | 126 | 255 | ||||||||||||||||||||||
| Purchase of minerals in place | |||||||||||||||||||||||||||
| Revisions of previous estimates | (1 | ) | 2 | 1 | |||||||||||||||||||||||
| Improved recovery | |||||||||||||||||||||||||||
| Extensions and discoveries | 1 | 3 | 4 | ||||||||||||||||||||||||
| Production | (1 | ) | (1 | ) | (1 | ) | (4 | ) | (7 | ) | |||||||||||||||||
| Sales of minerals in place | (4 | ) | (28 | ) | (32 | ) | |||||||||||||||||||||
| Reserves at December 31, 2012 | 17 | 16 | 114 | 119 | 266 | ||||||||||||||||||||||
| Reserves at December 31, 2012 | 227 | 351 | 921 | 688 | 670 | 196 | 273 | 24 | 3,350 | ||||||||||||||||||
| Developed | 165 | 180 | 601 | 456 | 203 | 49 | 128 | 24 | 1,806 | ||||||||||||||||||
| consolidated subsidiaries | 165 | 180 | 584 | 456 | 203 | 41 | 109 | 24 | 1,762 | ||||||||||||||||||
| equity-accounted entities | 17 | 8 | 19 | 44 | |||||||||||||||||||||||
| Undeveloped | 62 | 171 | 320 | 232 | 467 | 147 | 145 | 1,544 | |||||||||||||||||||
| consolidated subsidiaries | 62 | 171 | 320 | 216 | 467 | 41 | 45 | 1,322 | |||||||||||||||||||
| equity-accounted entities | 16 | 106 | 100 | 222 | |||||||||||||||||||||||
- 92 -
Contents
Eni Fact Book Supplemental oil and gas information
| Movements in net proved natural gas reserves | (bcf) |
| Italy (a) | Rest of Europe | North Africa | Sub-Saharan Africa | Kazakhstan | Rest of Asia | America | Australia and Oceania | Total | ||||||||||
| 2010 | |||||||||||||||||||||||||||
| Consolidated subsidiaries | |||||||||||||||||||||||||||
| Reserves at December 31, 2009 | 2,704 | 1,380 | 5,894 | 2,127 | 2,139 | 814 | 629 | 575 | 16,262 | ||||||||||||||||||
| of which: | |||||||||||||||||||||||||||
| developed | 2,001 | 1,231 | 3,486 | 1,463 | 1,859 | 539 | 506 | 565 | 11,650 | ||||||||||||||||||
| undeveloped | 703 | 149 | 2,408 | 664 | 280 | 275 | 123 | 10 | 4,612 | ||||||||||||||||||
| Purchase of minerals in place | |||||||||||||||||||||||||||
| Revisions of previous estimates | 234 | 48 | 778 | 161 | (179 | ) | 211 | 41 | (18 | ) | 1,276 | ||||||||||||||||
| Improved recovery | |||||||||||||||||||||||||||
| Extensions and discoveries | 177 | 146 | 4 | 5 | 22 | 354 | |||||||||||||||||||||
| Production | (246 | ) | (204 | ) | (609 | ) | (161 | ) | (86 | ) | (158 | ) | (145 | ) | (35 | ) | (1,644 | ) | |||||||||
| Sales of minerals in place | (48 | ) | (2 | ) | (50 | ) | |||||||||||||||||||||
| Reserves at December 31, 2010 | 2,644 | 1,401 | 6,207 | 2,127 | 1,874 | 871 | 530 | 544 | 16,198 | ||||||||||||||||||
| Equity-accounted entities | |||||||||||||||||||||||||||
| Reserves at December 31, 2009 | 14 | 85 | 1,487 | 2 | 1,588 | ||||||||||||||||||||||
| of which: | |||||||||||||||||||||||||||
| developed | 12 | 5 | 217 | 234 | |||||||||||||||||||||||
| undeveloped | 2 | 80 | 1,270 | 2 | 1,354 | ||||||||||||||||||||||
| Purchase of minerals in place | |||||||||||||||||||||||||||
| Revisions of previous estimates | 6 | (1 | ) | 44 | 2 | 51 | |||||||||||||||||||||
| Improved recovery | |||||||||||||||||||||||||||
| Extensions and discoveries | 6 | 34 | 18 | 58 | |||||||||||||||||||||||
| Production | (2 | ) | (11 | ) | (13 | ) | |||||||||||||||||||||
| Sales of minerals in place | |||||||||||||||||||||||||||
| Reserves at December 31, 2010 | 24 | 118 | 1,520 | 22 | 1,684 | ||||||||||||||||||||||
| Reserves at December 31, 2010 | 2,644 | 1,401 | 6,231 | 2,245 | 1,874 | 2,391 | 552 | 544 | 17,882 | ||||||||||||||||||
| Developed | 2,061 | 1,103 | 3,122 | 1,554 | 1,621 | 774 | 437 | 539 | 11,211 | ||||||||||||||||||
| consolidated subsidiaries | 2,061 | 1,103 | 3,100 | 1,550 | 1,621 | 560 | 431 | 539 | 10,965 | ||||||||||||||||||
| equity-accounted entities | 22 | 4 | 214 | 6 | 246 | ||||||||||||||||||||||
| Undeveloped | 583 | 298 | 3,109 | 691 | 253 | 1,617 | 115 | 5 | 6,671 | ||||||||||||||||||
| consolidated subsidiaries | 583 | 298 | 3,107 | 577 | 253 | 311 | 99 | 5 | 5,233 | ||||||||||||||||||
| equity-accounted entities | 2 | 114 | 1,306 | 16 | 1,438 | ||||||||||||||||||||||
(a) Including, approximately, 769 and 767 billion cubic feet of natural gas held in storage at December 31, 2009 and 2010, respectively.
- 93 -
Contents
Eni Fact Book Supplemental oil and gas information
| Movements in net proved natural gas reserves | (bcf) |
| Italy (a) | Rest of Europe | North Africa | Sub-Saharan Africa | Kazakhstan | Rest of Asia | America | Australia and Oceania | Total | ||||||||||
| 2011 | |||||||||||||||||||||||||||
| Consolidated subsidiaries | |||||||||||||||||||||||||||
| Reserves at December 31, 2010 | 2,644 | 1,401 | 6,207 | 2,127 | 1,874 | 871 | 530 | 544 | 16,198 | ||||||||||||||||||
| of which: | |||||||||||||||||||||||||||
| developed | 2,061 | 1,103 | 3,100 | 1,550 | 1,621 | 560 | 431 | 539 | 10,965 | ||||||||||||||||||
| undeveloped | 583 | 298 | 3,107 | 577 | 253 | 311 | 99 | 5 | 5,233 | ||||||||||||||||||
| Purchase of minerals in place | 9 | 9 | |||||||||||||||||||||||||
| Revisions of previous estimates | 80 | 199 | 436 | (11 | ) | (142 | ) | (38 | ) | 51 | 96 | 671 | |||||||||||||||
| Improved recovery | 3 | 3 | |||||||||||||||||||||||||
| Extensions and discoveries | 4 | 18 | 9 | 18 | 131 | 180 | |||||||||||||||||||||
| Production | (246 | ) | (196 | ) | (462 | ) | (185 | ) | (84 | ) | (148 | ) | (122 | ) | (36 | ) | (1,479 | ) | |||||||||
| Sales of minerals in place | |||||||||||||||||||||||||||
| Reserves at December 31, 2011 | 2,491 | 1,425 | 6,190 | 1,949 | 1,648 | 685 | 590 | 604 | 15,582 | ||||||||||||||||||
| Equity-accounted entities | |||||||||||||||||||||||||||
| Reserves at December 31, 2010 | 24 | 118 | 1,520 | 22 | 1,684 | ||||||||||||||||||||||
| of which: | |||||||||||||||||||||||||||
| developed | 22 | 4 | 214 | 6 | 246 | ||||||||||||||||||||||
| undeveloped | 2 | 114 | 1,306 | 16 | 1,438 | ||||||||||||||||||||||
| Purchase of minerals in place | 2 | 2 | |||||||||||||||||||||||||
| Revisions of previous estimates | (2 | ) | 147 | 372 | 11 | 528 | |||||||||||||||||||||
| Improved recovery | |||||||||||||||||||||||||||
| Extensions and discoveries | 74 | 1,150 | 1,274 | 2,498 | |||||||||||||||||||||||
| Production | (2 | ) | (1 | ) | (9 | ) | (12 | ) | |||||||||||||||||||
| Sales of minerals in place | |||||||||||||||||||||||||||
| Reserves at December 31, 2011 | 2 | 20 | 338 | 3,033 | 1,307 | 4,700 | |||||||||||||||||||||
| Reserves at December 31, 2011 | 2,491 | 1,427 | 6,210 | 2,287 | 1,648 | 3,718 | 1,897 | 604 | 20,282 | ||||||||||||||||||
| Developed | 1,977 | 995 | 3,087 | 1,441 | 1,480 | 552 | 393 | 491 | 10,416 | ||||||||||||||||||
| consolidated subsidiaries | 1,977 | 995 | 3,070 | 1,437 | 1,480 | 528 | 385 | 491 | 10,363 | ||||||||||||||||||
| equity-accounted entities | 17 | 4 | 24 | 8 | 53 | ||||||||||||||||||||||
| Undeveloped | 514 | 432 | 3,123 | 846 | 168 | 3,166 | 1,504 | 113 | 9,866 | ||||||||||||||||||
| consolidated subsidiaries | 514 | 430 | 3,120 | 512 | 168 | 157 | 205 | 113 | 5,219 | ||||||||||||||||||
| equity-accounted entities | 2 | 3 | 334 | 3,009 | 1,299 | 4,647 | |||||||||||||||||||||
(a) Including, approximately, 767 and 767 billion cubic feet of natural gas held in storage at December 31, 2010 and 2011, respectively.
- 94 -
Contents
Eni Fact Book Supplemental oil and gas information
| Movements in net proved natural gas reserves | (bcf) |
| Italy (a) | Rest of Europe | North Africa | Sub-Saharan Africa | Kazakhstan | Rest of Asia | America | Australia and Oceania | Total | ||||||||||
| 2012 | |||||||||||||||||||||||||||
| Consolidated subsidiaries | |||||||||||||||||||||||||||
| Reserves at December 31, 2011 | 2,491 | 1,425 | 6,190 | 1,949 | 1,648 | 685 | 590 | 604 | 15,582 | ||||||||||||||||||
| of which: | |||||||||||||||||||||||||||
| developed | 1,977 | 995 | 3,070 | 1,437 | 1,480 | 528 | 385 | 491 | 10,363 | ||||||||||||||||||
| undeveloped | 514 | 430 | 3,120 | 512 | 168 | 157 | 205 | 113 | 5,219 | ||||||||||||||||||
| Purchase of minerals in place | |||||||||||||||||||||||||||
| Revisions of previous estimates | 154 | 45 | 284 | 141 | 18 | (41 | ) | 5 | 606 | ||||||||||||||||||
| Improved recovery | |||||||||||||||||||||||||||
| Extensions and discoveries | 24 | 15 | 1 | 113 | 469 | 2 | 4 | 628 | |||||||||||||||||||
| Production | (254 | ) | (168 | ) | (633 | ) | (196 | ) | (81 | ) | (143 | ) | (104 | ) | (37 | ) | (1,616 | ) | |||||||||
| Sales of minerals in place | (782 | ) | (89 | ) | (139 | ) | (1,010 | ) | |||||||||||||||||||
| Reserves at December 31, 2012 | 1,633 | 1,317 | 5,558 | 2,061 | 2,038 | 562 | 449 | 572 | 14,190 | ||||||||||||||||||
| Equity-accounted entities | |||||||||||||||||||||||||||
| Reserves at December 31, 2011 | 2 | 20 | 338 | 3,033 | 1,307 | 4,700 | |||||||||||||||||||||
| of which: | |||||||||||||||||||||||||||
| developed | 17 | 4 | 24 | 8 | 53 | ||||||||||||||||||||||
| undeveloped | 2 | 3 | 334 | 3,009 | 1,299 | 4,647 | |||||||||||||||||||||
| Purchase of minerals in place | |||||||||||||||||||||||||||
| Revisions of previous estimates | (2 | ) | (2 | ) | 3 | 1 | 1,340 | 1,340 | |||||||||||||||||||
| Improved recovery | |||||||||||||||||||||||||||
| Extensions and discoveries | 17 | 38 | 739 | 794 | |||||||||||||||||||||||
| Production | (2 | ) | (2 | ) | (29 | ) | (33 | ) | |||||||||||||||||||
| Sales of minerals in place | (3 | ) | (31 | ) | (34 | ) | |||||||||||||||||||||
| Reserves at December 31, 2012 | 16 | 353 | 3,043 | 3,355 | 6,767 | ||||||||||||||||||||||
| Reserves at December 31, 2012 | 1,633 | 1,317 | 5,574 | 2,414 | 2,038 | 3,605 | 3,804 | 572 | 20,957 | ||||||||||||||||||
| Developed | 1,325 | 925 | 2,736 | 1,429 | 1,401 | 774 | 340 | 459 | 9,389 | ||||||||||||||||||
| consolidated subsidiaries | 1,325 | 925 | 2,720 | 1,429 | 1,401 | 372 | 334 | 459 | 8,965 | ||||||||||||||||||
| equity-accounted entities | 16 | 402 | 6 | 424 | |||||||||||||||||||||||
| Undeveloped | 308 | 392 | 2,838 | 985 | 637 | 2,831 | 3,464 | 113 | 11,568 | ||||||||||||||||||
| consolidated subsidiaries | 308 | 392 | 2,838 | 632 | 637 | 190 | 115 | 113 | 5,225 | ||||||||||||||||||
| equity-accounted entities | 353 | 2,641 | 3,349 | 6,343 | |||||||||||||||||||||||
(a) Including, approximately, 767 billion cubic feet of natural gas held in storage at December 31, 2011.
- 95 -
Contents
Eni Fact Book Supplemental oil and gas information
| Results of operations from oil and gas producing activities (a) | (euro million) |
| Italy | Rest of Europe | North Africa | Sub-Saharan Africa | Kazakhstan | Rest of Asia | America | Australia and Oceania | Total | ||||||||||
| 2010 | |||||||||||||||||||||||||||
| Consolidated subsidiaries | |||||||||||||||||||||||||||
| Revenues: | |||||||||||||||||||||||||||
| - sales to consolidated entities | 2,725 | 3,006 | 2,094 | 5,314 | 324 | 34 | 1,139 | 69 | 14,705 | ||||||||||||||||||
| - sales to third parties | 263 | 6,604 | 1,696 | 890 | 1,429 | 562 | 289 | 11,733 | |||||||||||||||||||
| Total revenues | 2,725 | 3,269 | 8,698 | 7,010 | 1,214 | 1,463 | 1,701 | 358 | 26,438 | ||||||||||||||||||
| Operations costs | (278 | ) | (555 | ) | (593 | ) | (902 | ) | (184 | ) | (150 | ) | (292 | ) | (69 | ) | (3,023 | ) | |||||||||
| Production taxes | (184 | ) | (300 | ) | (700 | ) | (37 | ) | (1,221 | ) | |||||||||||||||||
| Exploration expenses | (35 | ) | (116 | ) | (85 | ) | (465 | ) | (6 | ) | (263 | ) | (204 | ) | (25 | ) | (1,199 | ) | |||||||||
| D.D. & A. and provision for abandonment (b) | (621 | ) | (615 | ) | (1,063 | ) | (1,739 | ) | (84 | ) | (696 | ) | (872 | ) | (84 | ) | (5,774 | ) | |||||||||
| Other income (expenses) | (560 | ) | 254 | (392 | ) | (219 | ) | (161 | ) | (138 | ) | (45 | ) | (25 | ) | (1,286 | ) | ||||||||||
| Pretax income from producing activities | 1,047 | 2,237 | 6,265 | 2,985 | 779 | 179 | 288 | 155 | 13,935 | ||||||||||||||||||
| Income taxes | (382 | ) | (1,296 | ) | (4,037 | ) | (1,962 | ) | (291 | ) | (119 | ) | (154 | ) | (36 | ) | (8,277 | ) | |||||||||
| Results of operations from E&P activities of consolidated subsidiaries (c) | 665 | 941 | 2,228 | 1,023 | 488 | 60 | 134 | 119 | 5,658 | ||||||||||||||||||
| Equity-accounted entities | |||||||||||||||||||||||||||
| Revenues: | |||||||||||||||||||||||||||
| - sales to consolidated entities | |||||||||||||||||||||||||||
| - sales to third parties | 16 | 65 | 69 | 206 | 356 | ||||||||||||||||||||||
| Total revenues | 16 | 65 | 69 | 206 | 356 | ||||||||||||||||||||||
| Operations costs | (16 | ) | (9 | ) | (7 | ) | (9 | ) | (41 | ) | |||||||||||||||||
| Production taxes | (3 | ) | (69 | ) | (72 | ) | |||||||||||||||||||||
| Exploration expenses | (4 | ) | (2 | ) | (4 | ) | (35 | ) | (45 | ) | |||||||||||||||||
| D.D. & A. and provision for abandonment | (4 | ) | (26 | ) | (25 | ) | (17 | ) | (72 | ) | |||||||||||||||||
| Other income (expenses) | 6 | 12 | (10 | ) | (67 | ) | (59 | ) | |||||||||||||||||||
| Pretax income from producing activities | (5 | ) | 40 | 23 | 9 | 67 | |||||||||||||||||||||
| Income taxes | 4 | (20 | ) | (17 | ) | (33 | ) | (66 | ) | ||||||||||||||||||
| Results of operations from E&P activities of equity-accounted entities (c) | (1 | ) | 20 | 6 | (24 | ) | 1 | ||||||||||||||||||||
(a) Results of operations from oil and gas producing activities represent only those revenues and expenses directly associated with such activities, including operating overheads. These amounts do not include any allocation of interest expense or general corporate overhead and, therefore, are not necessarily indicative of the contributions to consolidated net earnings of Eni. Related income taxes are computed by applying the local income tax rates to the pre-tax income from producing activities. Eni is a party to certain Production Sharing Agreements (PSAs), whereby a portion of Eni’s share of oil and gas production is withheld and sold by its joint venture partners which are state owned entities, with proceeds being remitted to the state in satisfaction of Eni’s PSA related tax liabilities. Revenue and income taxes include such taxes owed by Eni but paid by state-owned entities out of Eni’s share of oil and gas production.
(b) Includes asset impairments amounting to euro 123 million in 2010.
(c) The "Successful Effort Method" application would have led to a decrease of result of operations of euro 385 million in 2010 for the consolidated subsidiaries and a decrease of euro 5 million in 2010 for equity-accounted entities.
- 96 -
Contents
Eni Fact Book Supplemental oil and gas information
| Results of operations from oil and gas producing activities | (euro million) |
| Italy | Rest of Europe | North Africa | Sub-Saharan Africa | Kazakhstan | Rest of Asia | America | Australia and Oceania | Total | ||||||||||
| 2011 | |||||||||||||||||||||||||||
| Consolidated subsidiaries | |||||||||||||||||||||||||||
| Revenues: | |||||||||||||||||||||||||||
| - sales to consolidated entities | 3,583 | 3,695 | 1,956 | 5,945 | 411 | 178 | 1,634 | 93 | 17,495 | ||||||||||||||||||
| - sales to third parties | 514 | 5,090 | 1,937 | 1,268 | 1,233 | 132 | 344 | 10,518 | |||||||||||||||||||
| Total revenues | 3,583 | 4,209 | 7,046 | 7,882 | 1,679 | 1,411 | 1,766 | 437 | 28,013 | ||||||||||||||||||
| Operations costs | (284 | ) | (566 | ) | (483 | ) | (830 | ) | (171 | ) | (183 | ) | (364 | ) | (88 | ) | (2,969 | ) | |||||||||
| Production taxes | (245 | ) | (165 | ) | (853 | ) | (37 | ) | (1,300 | ) | |||||||||||||||||
| Exploration expenses | (38 | ) | (113 | ) | (128 | ) | (509 | ) | (6 | ) | (177 | ) | (136 | ) | (58 | ) | (1,165 | ) | |||||||||
| D.D. & A. and provision for abandonment (a) | (606 | ) | (704 | ) | (843 | ) | (1,435 | ) | (112 | ) | (486 | ) | (901 | ) | (103 | ) | (5,190 | ) | |||||||||
| Other income (expenses) | (562 | ) | 142 | (508 | ) | (314 | ) | (160 | ) | (151 | ) | 125 | 8 | (1,420 | ) | ||||||||||||
| Pretax income from producing activities | 1,848 | 2,968 | 4,919 | 3,941 | 1,230 | 377 | 490 | 196 | 15,969 | ||||||||||||||||||
| Income taxes | (761 | ) | (2,043 | ) | (3,013 | ) | (2,680 | ) | (413 | ) | (157 | ) | (184 | ) | (120 | ) | (9,371 | ) | |||||||||
| Results of operations from E&P activities of consolidated subsidiaries (b) | 1,087 | 925 | 1,906 | 1,261 | 817 | 220 | 306 | 76 | 6,598 | ||||||||||||||||||
| Equity-accounted entities | |||||||||||||||||||||||||||
| Revenues: | |||||||||||||||||||||||||||
| - sales to consolidated entities | |||||||||||||||||||||||||||
| - sales to third parties | 2 | 19 | 93 | 89 | 262 | 465 | |||||||||||||||||||||
| Total revenues | 2 | 19 | 93 | 89 | 262 | 465 | |||||||||||||||||||||
| Operations costs | (11 | ) | (10 | ) | (9 | ) | (17 | ) | (47 | ) | |||||||||||||||||
| Production taxes | (1 | ) | (4 | ) | (113 | ) | (118 | ) | |||||||||||||||||||
| Exploration expenses | (6 | ) | (5 | ) | (8 | ) | (9 | ) | (28 | ) | |||||||||||||||||
| D.D. & A. and provision for abandonment | (1 | ) | (24 | ) | (23 | ) | (21 | ) | (69 | ) | |||||||||||||||||
| Other income (expenses) | (4 | ) | 6 | 11 | (20 | ) | (51 | ) | (58 | ) | |||||||||||||||||
| Pretax income from producing activities | (9 | ) | 9 | 65 | 29 | 51 | 145 | ||||||||||||||||||||
| Income taxes | (4 | ) | (35 | ) | (32 | ) | (4 | ) | (75 | ) | |||||||||||||||||
| Results of operations from E&P activities of equity-accounted entities (b) | (9 | ) | 5 | 30 | (3 | ) | 47 | 70 | |||||||||||||||||||
(a) Includes asset impairments amounting to euro 189 million in 2011.
(b) The "Successful Effort Method" application would have led to an increase of result of operations of euro 118 million in 2011 for the consolidated subsidiaries and an increase of euro 20 million in 2011 for equity-accounted entities.
- 97 -
Contents
Eni Fact Book Supplemental oil and gas information
| Results of operations from oil and gas producing activities | (euro million) |
| Italy | Rest of Europe | North Africa | Sub-Saharan Africa | Kazakhstan | Rest of Asia | America | Australia and Oceania | Total | ||||||||||
| 2012 | |||||||||||||||||||||||||||
| Consolidated subsidiaries | |||||||||||||||||||||||||||
| Revenues: | |||||||||||||||||||||||||||
| - sales to consolidated entities | 3,712 | 3,177 | 2,338 | 6,040 | 459 | 425 | 1,614 | 425 | 18,190 | ||||||||||||||||||
| - sales to third parties | 50 | 715 | 9,129 | 2,243 | 1,368 | 1,387 | 106 | 333 | 15,331 | ||||||||||||||||||
| Total revenues | 3,762 | 3,892 | 11,467 | 8,283 | 1,827 | 1,812 | 1,720 | 758 | 33,521 | ||||||||||||||||||
| Operations costs | (302 | ) | (655 | ) | (606 | ) | (913 | ) | (188 | ) | (209 | ) | (361 | ) | (134 | ) | (3,368 | ) | |||||||||
| Production taxes | (307 | ) | (390 | ) | (818 | ) | (43 | ) | (1,558 | ) | |||||||||||||||||
| Exploration expenses | (32 | ) | (154 | ) | (153 | ) | (993 | ) | (3 | ) | (230 | ) | (147 | ) | (123 | ) | (1,835 | ) | |||||||||
| D.D. & A. and provision for abandonment (a) | (779 | ) | (683 | ) | (1,137 | ) | (1,750 | ) | (120 | ) | (720 | ) | (1,256 | ) | (167 | ) | (6,612 | ) | |||||||||
| Other income (expenses) | (202 | ) | (120 | ) | (937 | ) | (447 | ) | 206 | (151 | ) | 74 | (42 | ) | (1,619 | ) | |||||||||||
| Pretax income from producing activities | 2,140 | 2,280 | 8,244 | 3,362 | 1,722 | 459 | 30 | 292 | 18,529 | ||||||||||||||||||
| Income taxes | (918 | ) | (1,524 | ) | (5,194 | ) | (2,508 | ) | (736 | ) | (176 | ) | (14 | ) | (164 | ) | (11,234 | ) | |||||||||
| Results of operations from E&P activities of consolidated subsidiaries (b) | 1,222 | 756 | 3,050 | 854 | 986 | 283 | 16 | 128 | 7,295 | ||||||||||||||||||
| Equity-accounted entities | |||||||||||||||||||||||||||
| Revenues: | |||||||||||||||||||||||||||
| - sales to consolidated entities | |||||||||||||||||||||||||||
| - sales to third parties | 2 | 20 | 44 | 144 | 300 | 510 | |||||||||||||||||||||
| Total revenues | 2 | 20 | 44 | 144 | 300 | 510 | |||||||||||||||||||||
| Operations costs | (10 | ) | (5 | ) | (14 | ) | (20 | ) | (49 | ) | |||||||||||||||||
| Production taxes | (1 | ) | (3 | ) | (4 | ) | (128 | ) | (136 | ) | |||||||||||||||||
| Exploration expenses | (5 | ) | (2 | ) | (11 | ) | (4 | ) | (22 | ) | |||||||||||||||||
| D.D. & A. and provision for abandonment | (50 | ) | (2 | ) | (13 | ) | (41 | ) | (35 | ) | (141 | ) | |||||||||||||||
| Other income (expenses) | (7 | ) | 2 | (48 | ) | (6 | ) | (55 | ) | (114 | ) | ||||||||||||||||
| Pretax income from producing activities | (61 | ) | 5 | (33 | ) | 75 | 62 | 48 | |||||||||||||||||||
| Income taxes | (3 | ) | 4 | (36 | ) | (38 | ) | (73 | ) | ||||||||||||||||||
| Results of operations from E&P activities of equity-accounted entities (b) | (61 | ) | 2 | (29 | ) | 39 | 24 | (25 | ) | ||||||||||||||||||
(a) Includes asset impairments amounting to euro 547 million in 2012.
(b) The "Successful Effort Method" application would have led to a decrease of result of operations of euro 189 million in 2012 for the consolidated subsidiaries and a decrease of euro 2 million in 2012 for equity-accounted entities.
- 98 -
Contents
Eni Fact Book Supplemental oil and gas information
| Capitalized cost (a) | (euro million) |
| Italy | Rest of Europe | North Africa | Sub-Saharan Africa | Kazakhstan | Rest of Asia | America | Australia and Oceania | Total | ||||||||||
| December 31, 2011 | |||||||||||||||||||||||||||
| Consolidated subsidiaries | |||||||||||||||||||||||||||
| Proved mineral interests | 11,356 | 11,481 | 15,519 | 19,539 | 2,523 | 6,136 | 8,976 | 1,889 | 77,419 | ||||||||||||||||||
| Unproved mineral interests | 31 | 325 | 582 | 2,893 | 40 | 1,543 | 1,409 | 204 | 7,027 | ||||||||||||||||||
| Support equipment and facilities | 285 | 34 | 1,442 | 923 | 85 | 41 | 61 | 13 | 2,884 | ||||||||||||||||||
| Incomplete wells and other | 956 | 1,778 | 2,755 | 898 | 5,333 | 136 | 1,029 | 12,885 | |||||||||||||||||||
| Gross Capitalized Costs | 12,628 | 13,618 | 20,298 | 24,253 | 7,981 | 7,856 | 11,475 | 2,106 | 100,215 | ||||||||||||||||||
| Accumulated depreciation, depletion and amortization | (8,633 | ) | (8,582 | ) | (9,750 | ) | (13,069 | ) | (906 | ) | (5,411 | ) | (6,806 | ) | (650 | ) | (53,807 | ) | |||||||||
| Net Capitalized Costs consolidated subsidiaries (b) (c) | 3,995 | 5,036 | 10,548 | 11,184 | 7,075 | 2,445 | 4,669 | 1,456 | 46,408 | ||||||||||||||||||
| Equity-accounted entities | |||||||||||||||||||||||||||
| Proved mineral interests | 2 | 80 | 240 | 698 | 330 | 1,350 | |||||||||||||||||||||
| Unproved mineral interests | 44 | 271 | 315 | ||||||||||||||||||||||||
| Support equipment and facilities | 8 | 6 | 3 | 17 | |||||||||||||||||||||||
| Incomplete wells and other | 2 | 1 | 1,011 | 185 | 223 | 1,422 | |||||||||||||||||||||
| Gross Capitalized Costs | 48 | 89 | 1,251 | 1,160 | 556 | 3,104 | |||||||||||||||||||||
| Accumulated depreciation, depletion and amortization | (2 | ) | (74 | ) | (131 | ) | (388 | ) | (89 | ) | (684 | ) | |||||||||||||||
| Net Capitalized Costs equity-accounted entities (b) (c) | 46 | 15 | 1,120 | 772 | 467 | 2,420 | |||||||||||||||||||||
| December 31, 2012 | |||||||||||||||||||||||||||
| Consolidated subsidiaries | |||||||||||||||||||||||||||
| Proved mineral interests | 12,579 | 12,428 | 16,240 | 20,875 | 2,451 | 6,477 | 10,018 | 1,894 | 82,962 | ||||||||||||||||||
| Unproved mineral interests | 31 | 324 | 411 | 3,047 | 39 | 1,467 | 1,249 | 200 | 6,768 | ||||||||||||||||||
| Support equipment and facilities | 267 | 39 | 1,421 | 961 | 75 | 78 | 59 | 12 | 2,912 | ||||||||||||||||||
| Incomplete wells and other | 732 | 3,347 | 3,181 | 974 | 5,746 | 358 | 876 | 1 | 15,215 | ||||||||||||||||||
| Gross Capitalized Costs | 13,609 | 16,138 | 21,253 | 25,857 | 8,311 | 8,380 | 12,202 | 2,107 | 107,857 | ||||||||||||||||||
| Accumulated depreciation, depletion and amortization | (9,364 | ) | (9,346 | ) | (10,671 | ) | (14,225 | ) | (928 | ) | (6,002 | ) | (7,879 | ) | (832 | ) | (59,247 | ) | |||||||||
| Net Capitalized Costs consolidated subsidiaries (b) (c) | 4,245 | 6,792 | 10,582 | 11,632 | 7,383 | 2,378 | 4,323 | 1,275 | 48,610 | ||||||||||||||||||
| Equity-accounted entities | |||||||||||||||||||||||||||
| Proved mineral interests | 1 | 83 | 52 | 964 | 322 | 1,422 | |||||||||||||||||||||
| Unproved mineral interests | 54 | 279 | 333 | ||||||||||||||||||||||||
| Support equipment and facilities | 7 | 6 | 3 | 16 | |||||||||||||||||||||||
| Incomplete wells and other | 22 | 1 | 1,052 | 114 | 200 | 1,389 | |||||||||||||||||||||
| Gross Capitalized Costs | 77 | 91 | 1,104 | 1,363 | 525 | 3,160 | |||||||||||||||||||||
| Accumulated depreciation, depletion and amortization | (55 | ) | (72 | ) | (421 | ) | (111 | ) | (659 | ) | |||||||||||||||||
| Net Capitalized Costs equity-accounted entities (b) (c) | 22 | 19 | 1,104 | 942 | 414 | 2,501 | |||||||||||||||||||||
(a) Capitalized costs represent the total expenditures for proved and unproved mineral interests and related support equipment and facilities utilized in oil and gas exploration and production activities, together with related accumulated depreciation, depletion and amortization.
(b) The amounts include net capitalized financial charges totaling euro 614 million in 2011 and euro 672 million in 2012 for the consolidated subsidiaries and euro 11 million in 2011 and euro 24 million in 2012 for equity-accounted entities.
(c) The amounts do not include costs associated with exploration activities which are capitalized in order to reflect their investment nature and amortized in full when incurred. The "Successful Effort Method" application would have led to an increase in net capitalized costs of euro 3,608 million in 2011 e euro 4,071 million in 2012 for the consolidated subsidiaries and of euro 101 million in 2011 and euro 74 million in 2012 for equity-accounted entities.
- 99 -
Contents
Eni Fact Book Supplemental oil and gas information
| Cost incurred (a) | (euro million) |
| Italy | Rest of Europe | North Africa | Sub-Saharan Africa | Kazakhstan | Rest of Asia | America | Australia and Oceania | Total | ||||||||||
| 2010 | |||||||||||||||||||||||||||
| Consolidated subsidiaries | |||||||||||||||||||||||||||
| Proved property acquisitions | |||||||||||||||||||||||||||
| Unproved property acquisitions | |||||||||||||||||||||||||||
| Exploration | 34 | 114 | 84 | 406 | 6 | 223 | 119 | 26 | 1,012 | ||||||||||||||||||
| Development (b) | 579 | 890 | 2,674 | 1,909 | 1,031 | 359 | 1,309 | 160 | 8,911 | ||||||||||||||||||
| Total costs incurred consolidated subsidiaries | 613 | 1,004 | 2,758 | 2,315 | 1,037 | 582 | 1,428 | 186 | 9,923 | ||||||||||||||||||
| Equity-accounted entities | |||||||||||||||||||||||||||
| Proved property acquisitions | |||||||||||||||||||||||||||
| Unproved property acquisitions | |||||||||||||||||||||||||||
| Exploration | 4 | 2 | 4 | 35 | 45 | ||||||||||||||||||||||
| Development (c) | 7 | 200 | 46 | 114 | 367 | ||||||||||||||||||||||
| Total costs incurred equity-accounted entities | 11 | 202 | 50 | 149 | 412 | ||||||||||||||||||||||
| 2011 | |||||||||||||||||||||||||||
| Consolidated subsidiaries | |||||||||||||||||||||||||||
| Proved property acquisitions | |||||||||||||||||||||||||||
| Unproved property acquisitions | 57 | 697 | 754 | ||||||||||||||||||||||||
| Exploration | 38 | 100 | 128 | 482 | 6 | 156 | 60 | 240 | 1,210 | ||||||||||||||||||
| Development (b) | 815 | 1,921 | 1,487 | 1,698 | 935 | 385 | 971 | 70 | 8,282 | ||||||||||||||||||
| Total costs incurred consolidated subsidiaries | 853 | 2,021 | 1,672 | 2,877 | 941 | 541 | 1,031 | 310 | 10,246 | ||||||||||||||||||
| Equity-accounted entities | |||||||||||||||||||||||||||
| Proved property acquisitions | |||||||||||||||||||||||||||
| Unproved property acquisitions | |||||||||||||||||||||||||||
| Exploration | 5 | 5 | 8 | 9 | 27 | ||||||||||||||||||||||
| Development (c) | 2 | 3 | 659 | 68 | 154 | 886 | |||||||||||||||||||||
| Total costs incurred equity-accounted entities | 7 | 3 | 664 | 76 | 163 | 913 | |||||||||||||||||||||
| 2012 | |||||||||||||||||||||||||||
| Consolidated subsidiaries | |||||||||||||||||||||||||||
| Proved property acquisitions | 14 | 27 | 2 | 43 | |||||||||||||||||||||||
| Unproved property acquisitions | |||||||||||||||||||||||||||
| Exploration | 32 | 151 | 153 | 1,142 | 3 | 193 | 80 | 96 | 1,850 | ||||||||||||||||||
| Development (b) | 1,045 | 2,485 | 1,441 | 2,246 | 762 | 702 | 1,071 | 16 | 9,768 | ||||||||||||||||||
| Total costs incurred consolidated subsidiaries | 1,077 | 2,636 | 1,608 | 3,415 | 765 | 895 | 1,153 | 112 | 11,661 | ||||||||||||||||||
| Equity-accounted entities | |||||||||||||||||||||||||||
| Proved property acquisitions | |||||||||||||||||||||||||||
| Unproved property acquisitions | |||||||||||||||||||||||||||
| Exploration | 13 | 2 | 11 | 4 | 30 | ||||||||||||||||||||||
| Development (c) | 19 | 7 | 117 | 188 | 154 | 485 | |||||||||||||||||||||
| Total costs incurred equity-accounted entities | 32 | 9 | 128 | 192 | 154 | 515 | |||||||||||||||||||||
(a) Costs incurred represent amounts both capitalized and expensed in connection with oil and gas producing activities.
(b) Includes the abandonment costs of the assets for euro 269 million in 2010, euro 918 million in 2011 and euro 1,381 million in 2012.
(c) Includes the abandonment costs of the assets for euro -3 million in 2010, euro 15 million in 2011 and euro 63 million in 2012.
- 100 -
Contents
Eni Fact Book Supplemental oil and gas information
Standardized measure of discounted future net cash flows
| Estimated future cash inflows represent the revenues that would be received from production and are determined by applying year-end the average prices during the years ended. Future price changes are considered only to the extent provided by contractual arrangements. Estimated future development and production costs are determined by estimating the expenditures to be incurred in developing and producing the proved reserves at the end of the year. Neither the effects of price and cost escalations nor expected future changes in technology and operating practices have been considered. The standardized measure is calculated as the excess of future cash inflows from proved reserves less future costs of producing and developing the reserves, future income taxes and a yearly 10% discount factor. Future production costs include the estimated expenditures related to the production of proved reserves plus any production taxes without consideration of future inflation. Future | development costs include the estimated costs of drilling development wells and installation of production facilities, plus the net costs associated with dismantlement and abandonment of wells and facilities, under the assumption that year-end costs continue without considering future inflation. Future income taxes were calculated in accordance with the tax laws of the Countries in which Eni operates. The standardized measure of discounted future net cash flows, related to the preceding proved oil and gas reserves, is calculated in accordance with the requirements of FASB Extractive Activities - oil&gas (Topic 932). The standardized measure does not purport to reflect realizable values or fair market value of Eni’s proved reserves. An estimate of fair value would also take into account, among other things, hydrocarbon resources other than proved reserves, anticipated changes in future prices and costs and a discount factor representative of the risks inherent in the oil and gas exploration and production activity. |
- 101 -
Contents
Eni Fact Book Supplemental oil and gas information
| Standardized measure of discounted future net cash flows | (euro million) |
| Italy | Rest of Europe | North Africa | Sub-Saharan Africa | Kazakhstan | Rest of Asia | America | Australia and Oceania | Total | ||||||||||
| December 31, 2010 | |||||||||||||||||||||||||||
| Consolidated subsidiaries | |||||||||||||||||||||||||||
| Future cash inflows | 30,047 | 27,973 | 86,728 | 45,790 | 41,053 | 9,701 | 8,546 | 3,846 | 253,684 | ||||||||||||||||||
| Future production costs | (4,865 | ) | (7,201 | ) | (12,896 | ) | (13,605 | ) | (6,686 | ) | (3,201 | ) | (2,250 | ) | (611 | ) | (51,315 | ) | |||||||||
| Future development and abandonment costs | (4,499 | ) | (6,491 | ) | (8,827 | ) | (5,310 | ) | (5,192 | ) | (3,489 | ) | (1,713 | ) | (221 | ) | (35,742 | ) | |||||||||
| Future net inflow before income tax | 20,683 | 14,281 | 65,005 | 26,875 | 29,175 | 3,011 | 4,583 | 3,014 | 166,627 | ||||||||||||||||||
| Future income tax | (6,289 | ) | (9,562 | ) | (37,108 | ) | (14,468 | ) | (7,213 | ) | (872 | ) | (910 | ) | (805 | ) | (77,227 | ) | |||||||||
| Future net cash flows | 14,394 | 4,719 | 27,897 | 12,407 | 21,962 | 2,139 | 3,673 | 2,209 | 89,400 | ||||||||||||||||||
| 10% discount factor | (7,224 | ) | (1,608 | ) | (13,117 | ) | (3,884 | ) | (14,829 | ) | (419 | ) | (1,392 | ) | (850 | ) | (43,323 | ) | |||||||||
| Standardized measure of discounted future net cash flows | 7,170 | 3,111 | 14,780 | 8,523 | 7,133 | 1,720 | 2,281 | 1,359 | 46,077 | ||||||||||||||||||
| Equity-accounted entities | |||||||||||||||||||||||||||
| Future cash inflows | 498 | 750 | 2,893 | 7,363 | 11,504 | ||||||||||||||||||||||
| Future production costs | (251 | ) | (98 | ) | (972 | ) | (2,676 | ) | (3,997 | ) | |||||||||||||||||
| Future development and abandonment costs | (35 | ) | (128 | ) | (879 | ) | (1,188 | ) | (2,230 | ) | |||||||||||||||||
| Future net inflow before income tax | 212 | 524 | 1,042 | 3,499 | 5,277 | ||||||||||||||||||||||
| Future income tax | (2 | ) | (69 | ) | (338 | ) | (2,145 | ) | (2,554 | ) | |||||||||||||||||
| Future net cash flows | 210 | 455 | 704 | 1,354 | 2,723 | ||||||||||||||||||||||
| 10% discount factor | (113 | ) | (160 | ) | (515 | ) | (852 | ) | (1,640 | ) | |||||||||||||||||
| Standardized measure of discounted future net cash flows | 97 | 295 | 189 | 502 | 1,083 | ||||||||||||||||||||||
| Total | 7,170 | 3,111 | 14,877 | 8,818 | 7,133 | 1,909 | 2,783 | 1,359 | 47,160 | ||||||||||||||||||
| December 31, 2011 | |||||||||||||||||||||||||||
| Consolidated subsidiaries | |||||||||||||||||||||||||||
| Future cash inflows | 38,200 | 37,974 | 109,825 | 59,263 | 50,443 | 10,403 | 11,980 | 5,185 | 323,273 | ||||||||||||||||||
| Future production costs | (5,740 | ) | (7,666 | ) | (17,627 | ) | (15,191 | ) | (7,845 | ) | (3,852 | ) | (2,687 | ) | (813 | ) | (61,421 | ) | |||||||||
| Future development and abandonment costs | (4,712 | ) | (7,059 | ) | (9,639 | ) | (5,734 | ) | (3,705 | ) | (2,842 | ) | (1,836 | ) | (224 | ) | (35,751 | ) | |||||||||
| Future net inflow before income tax | 27,748 | 23,249 | 82,559 | 38,338 | 38,893 | 3,709 | 7,457 | 4,148 | 226,101 | ||||||||||||||||||
| Future income tax | (9,000 | ) | (15,912 | ) | (46,676 | ) | (23,075 | ) | (9,866 | ) | (1,124 | ) | (2,474 | ) | (1,254 | ) | (109,381 | ) | |||||||||
| Future net cash flows | 18,748 | 7,337 | 35,883 | 15,263 | 29,027 | 2,585 | 4,983 | 2,894 | 116,720 | ||||||||||||||||||
| 10% discount factor | (9,692 | ) | (2,572 | ) | (16,191 | ) | (4,833 | ) | (17,599 | ) | (559 | ) | (1,914 | ) | (1,122 | ) | (54,482 | ) | |||||||||
| Standardized measure of discounted future net cash flows | 9,056 | 4,765 | 19,692 | 10,430 | 11,428 | 2,026 | 3,069 | 1,772 | 62,238 | ||||||||||||||||||
| Equity-accounted entities | |||||||||||||||||||||||||||
| Future cash inflows | 21 | 649 | 1,866 | 6,141 | 15,067 | 23,744 | |||||||||||||||||||||
| Future production costs | (5 | ) | (259 | ) | (471 | ) | (1,540 | ) | (4,598 | ) | (6,873 | ) | |||||||||||||||
| Future development and abandonment costs | (2 | ) | (36 | ) | (147 | ) | (1,247 | ) | (1,754 | ) | (3,186 | ) | |||||||||||||||
| Future net inflow before income tax | 14 | 354 | 1,248 | 3,354 | 8,715 | 13,685 | |||||||||||||||||||||
| Future income tax | (3 | ) | (3 | ) | (189 | ) | (824 | ) | (5,368 | ) | (6,387 | ) | |||||||||||||||
| Future net cash flows | 11 | 351 | 1,059 | 2,530 | 3,347 | 7,298 | |||||||||||||||||||||
| 10% discount factor | (183 | ) | (475 | ) | (1,825 | ) | (2,155 | ) | (4,638 | ) | |||||||||||||||||
| Standardized measure of discounted future net cash flows | 11 | 168 | 584 | 705 | 1,192 | 2,660 | |||||||||||||||||||||
| Total | 9,056 | 4,776 | 19,860 | 11,014 | 11,428 | 2,731 | 4,261 | 1,772 | 64,898 | ||||||||||||||||||
- 102 -
Contents
Eni Fact Book Supplemental oil and gas information
| Standardized measure of discounted future net cash flows | (euro million) |
| Italy | Rest of Europe | North Africa | Sub-Saharan Africa | Kazakhstan | Rest of Asia | America | Australia and Oceania | Total | ||||||||||
| December 31, 2012 | |||||||||||||||||||||||||||
| Consolidated subsidiaries | |||||||||||||||||||||||||||
| Future cash inflows | 30,308 | 38,912 | 108,343 | 56,978 | 53,504 | 7,881 | 11,008 | 4,957 | 311,891 | ||||||||||||||||||
| Future production costs | (5,900 | ) | (8,190 | ) | (18,555 | ) | (14,844 | ) | (9,561 | ) | (2,854 | ) | (2,520 | ) | (921 | ) | (63,345 | ) | |||||||||
| Future development and abandonment costs | (3,652 | ) | (7,511 | ) | (8,412 | ) | (6,873 | ) | (3,802 | ) | (1,974 | ) | (1,502 | ) | (197 | ) | (33,923 | ) | |||||||||
| Future net inflow before income tax | 20,756 | 23,211 | 81,376 | 35,261 | 40,141 | 3,053 | 6,986 | 3,839 | 214,623 | ||||||||||||||||||
| Future income tax | (6,911 | ) | (15,063 | ) | (44,256 | ) | (21,348 | ) | (10,293 | ) | (903 | ) | (2,906 | ) | (1,181 | ) | (102,861 | ) | |||||||||
| Future net cash flows | 13,845 | 8,148 | 37,120 | 13,913 | 29,848 | 2,150 | 4,080 | 2,658 | 111,762 | ||||||||||||||||||
| 10% discount factor | (5,519 | ) | (2,630 | ) | (16,539 | ) | (4,976 | ) | (17,943 | ) | (496 | ) | (1,337 | ) | (1,030 | ) | (50,470 | ) | |||||||||
| Standardized measure of discounted future net cash flows | 8,326 | 5,518 | 20,581 | 8,937 | 11,905 | 1,654 | 2,743 | 1,628 | 61,292 | ||||||||||||||||||
| Equity-accounted entities | |||||||||||||||||||||||||||
| Future cash inflows | 1 | 658 | 3,594 | 6,689 | 18,132 | 29,074 | |||||||||||||||||||||
| Future production costs | (203 | ) | (576 | ) | (2,216 | ) | (5,003 | ) | (7,998 | ) | |||||||||||||||||
| Future development and abandonment costs | (1 | ) | (17 | ) | (101 | ) | (1,061 | ) | (2,563 | ) | (3,743 | ) | |||||||||||||||
| Future net inflow before income tax | 438 | 2,917 | 3,412 | 10,566 | 17,333 | ||||||||||||||||||||||
| Future income tax | (36 | ) | (1,291 | ) | (795 | ) | (5,729 | ) | (7,851 | ) | |||||||||||||||||
| Future net cash flows | 402 | 1,626 | 2,617 | 4,837 | 9,482 | ||||||||||||||||||||||
| 10% discount factor | (206 | ) | (962 | ) | (1,747 | ) | (3,621 | ) | (6,536 | ) | |||||||||||||||||
| Standardized measure of discounted future net cash flows | 196 | 664 | 870 | 1,216 | 2,946 | ||||||||||||||||||||||
| Total | 8,326 | 5,518 | 20,777 | 9,601 | 11,905 | 2,524 | 3,959 | 1,628 | 64,238 | ||||||||||||||||||
- 103 -
Contents
Eni Fact Book Supplemental oil and gas information
| Changes in standardized measure of discounted future net cash flows | (euro million) |
| Consolidated subsidiaries | Equity-accounted entities | Total | ||||
| Standardized measure of discounted future net cash flows at December 31, 2009 | 31,500 | 257 | 31,757 | ||||||
| Increase (decrease): | |||||||||
| - sales, net of production costs | (22,194 | ) | (243 | ) | (22,437 | ) | |||
| - net changes in sales and transfer prices, net of production costs | 24,415 | 406 | 24,821 | ||||||
| - extensions, discoveries and improved recovery, net of future production and development costs | 1,926 | 1,409 | 3,335 | ||||||
| - changes in estimated future development and abandonment costs | (6,464 | ) | (386 | ) | (6,850 | ) | |||
| - development costs incurred during the period that reduced future development costs | 8,520 | 368 | 8,888 | ||||||
| - revisions of quantity estimates | 12,600 | 143 | 12,743 | ||||||
| - accretion of discount | 6,519 | 53 | 6,572 | ||||||
| - net change in income taxes | (11,802 | ) | (1,115 | ) | (12,917 | ) | |||
| - purchase of reserves in-place | |||||||||
| - sale of reserves in-place | (177 | ) | (177 | ) | |||||
| - changes in production rates (timing) and other | 1,234 | 191 | 1,425 | ||||||
| Net increase (decrease) | 14,577 | 826 | 15,403 | ||||||
| Standardized measure of discounted future net cash flows at December 31, 2010 | 46,077 | 1,083 | 47,160 | ||||||
| Increase (decrease): | |||||||||
| - sales, net of production costs | (23,744 | ) | (300 | ) | (24,044 | ) | |||
| - net changes in sales and transfer prices, net of production costs | 40,961 | 442 | 41,403 | ||||||
| - extensions, discoveries and improved recovery, net of future production and development costs | 1,580 | 2,457 | 4,037 | ||||||
| - changes in estimated future development and abandonment costs | (3,890 | ) | (392 | ) | (4,282 | ) | |||
| - development costs incurred during the period that reduced future development costs | 7,301 | 866 | 8,167 | ||||||
| - revisions of quantity estimates | 1,337 | (87 | ) | 1,250 | |||||
| - accretion of discount | 8,640 | 235 | 8,875 | ||||||
| - net change in income taxes | (17,067 | ) | (1,678 | ) | (18,745 | ) | |||
| - purchase of reserves in-place | 37 | 10 | 47 | ||||||
| - sale of reserves in-place | (146 | ) | (146 | ) | |||||
| - changes in production rates (timing) and other | 1,152 | 24 | 1,176 | ||||||
| Net increase (decrease) | 16,161 | 1,577 | 17,738 | ||||||
| Standardized measure of discounted future net cash flows at December 31, 2011 | 62,238 | 2,660 | 64,898 | ||||||
| Increase (decrease): | |||||||||
| - sales, net of production costs | (28,595 | ) | (325 | ) | (28,920 | ) | |||
| - net changes in sales and transfer prices, net of production costs | 2,264 | (56 | ) | 2,208 | |||||
| - extensions, discoveries and improved recovery, net of future production and development costs | 4,868 | 812 | 5,680 | ||||||
| - changes in estimated future development and abandonment costs | (3,802 | ) | (357 | ) | (4,159 | ) | |||
| - development costs incurred during the period that reduced future development costs | 8,199 | 409 | 8,608 | ||||||
| - revisions of quantity estimates | 3,725 | 824 | 4,549 | ||||||
| - accretion of discount | 12,527 | 477 | 13,004 | ||||||
| - net change in income taxes | 2,207 | (830 | ) | 1,377 | |||||
| - purchase of reserves in-place | |||||||||
| - sale of reserves in-place | (1,509 | ) | (615 | ) | (2,124 | ) | |||
| - changes in production rates (timing) and other | (830 | ) | (53 | ) | (883 | ) | |||
| Net increase (decrease) | (946 | ) | 286 | (660 | ) | ||||
| Standardized measure of discounted future net cash flows at December 31, 2012 | 61,292 | 2,946 | 64,238 | ||||||
- 104 -
Contents
Eni Fact Book Quarterly information
Quarterly information
| Main financial data (a) (b) |
| 2010 | 2011 | 2012 | ||||
| (euro million) | I Q | II Q | III Q | IV Q | I Q | II Q | III Q | IV Q | I Q | II Q | III Q | IV Q | |||||||||||||||||||||||||||||||||
| Net sales from operations | 24,429 | 22,426 | 22,162 | 27,600 | 96,617 | 28,408 | 24,118 | 25,516 | 29,648 | 107,690 | 33,140 | 30,063 | 31,494 | 32,523 | 127,220 | ||||||||||||||||||||||||||||||
| Operating income: | 4,750 | 4,135 | 3,855 | 2,742 | 15,482 | 5,583 | 3,604 | 4,241 | 3,375 | 16,803 | 6,537 | 2,780 | 4,072 | 1,637 | 15,026 | ||||||||||||||||||||||||||||||
| Exploration & Production | 3,297 | 3,401 | 3,369 | 3,799 | 13,866 | 4,106 | 3,693 | 3,919 | 4,169 | 15,887 | 5,090 | 4,453 | 4,361 | 4,547 | 18,451 | ||||||||||||||||||||||||||||||
| Gas & Power | 798 | 114 | (53 | ) | 37 | 896 | 358 | (317 | ) | (170 | ) | (197 | ) | (326 | ) | 916 | (1,558 | ) | (764 | ) | (1,815 | ) | (3,221 | ) | |||||||||||||||||||||
| Refining & Marketing | 105 | 255 | (65 | ) | (146 | ) | 149 | 303 | 73 | 32 | (681 | ) | (273 | ) | 111 | (789 | ) | 454 | (1,079 | ) | (1,303 | ) | |||||||||||||||||||||||
| Chemicals | 36 | 17 | 24 | (163 | ) | (86 | ) | 108 | (113 | ) | (122 | ) | (297 | ) | (424 | ) | (96 | ) | (134 | ) | (130 | ) | (323 | ) | (683 | ) | |||||||||||||||||||
| Engineering & Construction | 291 | 334 | 327 | 350 | 1,302 | 354 | 366 | 304 | 398 | 1,422 | 376 | 364 | 387 | 306 | 1,433 | ||||||||||||||||||||||||||||||
| Other activities | (60 | ) | (115 | ) | (58 | ) | (1,151 | ) | (1,384 | ) | (27 | ) | (138 | ) | (79 | ) | (183 | ) | (427 | ) | (39 | ) | (107 | ) | (48 | ) | (108 | ) | (302 | ) | |||||||||||||||
| Corporate and financial companies | (70 | ) | (82 | ) | (47 | ) | (162 | ) | (361 | ) | (112 | ) | (76 | ) | (85 | ) | (46 | ) | (319 | ) | (84 | ) | (103 | ) | (69 | ) | (89 | ) | (345 | ) | |||||||||||||||
| Unrealized profit intragroup elimination and consolidation adjustments | 353 | 211 | 358 | 178 | 1,100 | 493 | 116 | 442 | 212 | 1,263 | 263 | 654 | (119 | ) | 198 | 996 | |||||||||||||||||||||||||||||
| Net income | 2,235 | 1,803 | 1,658 | 556 | 6,252 | 2,614 | 1,197 | 1,775 | 1,316 | 6,902 | 3,544 | 156 | 2,462 | (1,964 | ) | 4,198 | |||||||||||||||||||||||||||||
| Capital expenditure | 2,512 | 4,034 | 2,511 | 3,393 | 12,450 | 2,615 | 3,343 | 2,568 | 3,383 | 11,909 | 2,632 | 3,015 | 3,224 | 3,890 | 12,761 | ||||||||||||||||||||||||||||||
| Investments | 39 | 76 | 186 | 109 | 410 | 41 | 87 | 92 | 140 | 360 | 245 | 61 | 207 | 56 | 569 | ||||||||||||||||||||||||||||||
| Net borrowings at period end | 21,052 | 23,342 | 25,261 | 26,119 | 26,119 | 24,951 | 25,978 | 28,273 | 28,032 | 28,032 | 27,426 | 26,909 | 19,617 | 15,511 | 15,511 | ||||||||||||||||||||||||||||||
(a) Quarterly data are unaudited.
(b) In accordance with the guidelines of IFRS 5, results of the Italian regulated businesses managed by Snam divested in accordance to Article 15 of Law Decree No. 1 of January 24, 2012, enacted into Law No. 27 of March 24, 2012 have been reported as discontinued operations from July 1, 2012. Prior year data have been reclassified accordingly.
| Key market indicators |
| 2010 | 2011 | 2012 | ||||
| I Q | II Q | III Q | IV Q | I Q | II Q | III Q | IV Q | I Q | II Q | III Q | IV Q | |||||||||||||||||||
| Average price of Brent dated crude oil (a) | 76.24 | 78.30 | 76.86 | 86.48 | 79.47 | 104.97 | 117.36 | 113.46 | 109.31 | 111.27 | 118.49 | 108.19 | 109.61 | 110.02 | 111.58 | |||||||||||||||
| Average EUR/USD exchange rate (b) | 1.384 | 1.273 | 1.291 | 1.359 | 1.327 | 1.367 | 1.439 | 1.413 | 1.348 | 1.392 | 1.311 | 1.281 | 1.250 | 1.297 | 1.285 | |||||||||||||||
| Average price in euro of Brent dated crude oil | 55.09 | 61.51 | 59.54 | 63.64 | 59.89 | 76.79 | 81.56 | 80.30 | 81.09 | 79.94 | 90.38 | 84.46 | 87.69 | 84.83 | 86.83 | |||||||||||||||
| Average European refining margin (c) | 2.40 | 3.39 | 2.09 | 2.74 | 2.66 | 1.74 | 1.09 | 2.87 | 2.52 | 2.06 | 2.92 | 5.89 | 7.96 | 2.54 | 4.83 | |||||||||||||||
| Average European refining margins Brent/Ural (c) | 3.20 | 4.56 | 2.48 | 3.78 | 3.47 | 3.35 | 2.20 | 2.92 | 3.13 | 2.90 | 3.26 | 6.31 | 7.35 | 2.83 | 4.94 | |||||||||||||||
| Average European refining margins in euro | 1.74 | 2.66 | 1.62 | 2.02 | 2.00 | 1.27 | 0.76 | 2.03 | 1.87 | 1.48 | 2.23 | 4.60 | 6.37 | 1.96 | 3.76 | |||||||||||||||
| Price of NBP gas (d) | 5.61 | 5.68 | 6.68 | 8.29 | 6.56 | 9.09 | 9.36 | 8.74 | 8.92 | 9.03 | 9.34 | 9.09 | 9.00 | 10.49 | 9.48 | |||||||||||||||
| Euribor - three-month euro rate (%) | 0.6 | 0.7 | 0.9 | 1.0 | 0.8 | 1.1 | 1.4 | 1.6 | 1.5 | 1.4 | 1.0 | 0.7 | 0.4 | 0.2 | 0.6 | |||||||||||||||
| Libor - three-month dollar rate (%) | 0.3 | 0.4 | 0.4 | 0.3 | 0.3 | 0.3 | 0.3 | 0.3 | 0.5 | 0.3 | 0.5 | 0.5 | 0.4 | 0.3 | 0.4 | |||||||||||||||
(a) In USD per barrel. Source: Platt’s Oilgram.
(b) Source: BCE.
(c) In US$ per barrel FOB Mediterranean Brent dated crude oil. Eni elaborations on Platt’s Oilgram data.
(d) In US$ per BTU. Source Platt’s Oilgram.
- 105 -
Contents
Eni Fact Book Quarterly information
| Main operating data |
| 2010 | 2011 | 2012 | ||||
| I Q | II Q | III Q | IV Q | I Q | II Q | III Q | IV Q | I Q | II Q | III Q | IV Q | |||||||||||||||||||
| Liquids production | (kbbl/d) | 1,011 | 980 | 948 | 1,049 | 997 | 899 | 793 | 793 | 896 | 845 | 867 | 856 | 891 | 912 | 882 | ||||||||||||||||
| Natural gas production | (mmcf/d) | 4,615 | 4,319 | 4,203 | 5,021 | 4,540 | 4,356 | 3,867 | 3,773 | 4,345 | 4,085 | 4,480 | 4,394 | 4,545 | 4,584 | 4,501 | ||||||||||||||||
| Hydrocarbons production | (kboe/d) | 1,842 | 1,758 | 1,705 | 1,954 | 1,815 | 1,684 | 1,489 | 1,473 | 1,678 | 1,581 | 1,683 | 1,647 | 1,718 | 1,747 | 1,701 | ||||||||||||||||
| Italy | 182 | 185 | 182 | 182 | 183 | 186 | 172 | 193 | 191 | 186 | 188 | 186 | 187 | 195 | 189 | |||||||||||||||||
| Rest of Europe | 243 | 208 | 200 | 236 | 222 | 224 | 221 | 203 | 217 | 216 | 206 | 172 | 162 | 172 | 178 | |||||||||||||||||
| North Africa | 589 | 583 | 549 | 688 | 602 | 505 | 384 | 367 | 497 | 438 | 570 | 569 | 593 | 610 | 586 | |||||||||||||||||
| Sub-Saharan Africa | 402 | 388 | 407 | 403 | 400 | 375 | 356 | 364 | 381 | 369 | 335 | 332 | 387 | 324 | 345 | |||||||||||||||||
| Kazakhstan | 121 | 107 | 85 | 117 | 108 | 117 | 106 | 96 | 105 | 106 | 111 | 106 | 90 | 99 | 102 | |||||||||||||||||
| Rest of Asia | 122 | 123 | 125 | 155 | 131 | 120 | 104 | 103 | 121 | 112 | 111 | 127 | 128 | 149 | 129 | |||||||||||||||||
| America | 159 | 139 | 128 | 145 | 143 | 131 | 122 | 121 | 128 | 126 | 119 | 119 | 135 | 166 | 135 | |||||||||||||||||
| Australia and Oceania | 24 | 25 | 29 | 28 | 26 | 26 | 24 | 26 | 38 | 28 | 43 | 36 | 36 | 32 | 37 | |||||||||||||||||
| Production sold | (mmboe) | 158.6 | 154.1 | 151.7 | 173.6 | 638.0 | 145.7 | 129.1 | 130.0 | 143.7 | 548.5 | 149.2 | 144.6 | 150.5 | 154.4 | 598.7 | ||||||||||||||||
| Sales of natural gas to third parties | (bcm) | 26.51 | 15.62 | 14.95 | 24.38 | 81.46 | 27.87 | 17.33 | 14.59 | 21.23 | 81.02 | 26.12 | 16.38 | 16.56 | 21.91 | 80.97 | ||||||||||||||||
| Own consumption of natural gas | 1.54 | 1.53 | 1.56 | 1.56 | 6.19 | 1.65 | 1.53 | 1.41 | 1.62 | 6.21 | 1.77 | 1.57 | 1.58 | 1.51 | 6.43 | |||||||||||||||||
| Sales to third parties and own consumption | 28.05 | 17.15 | 16.51 | 25.94 | 87.65 | 29.52 | 18.86 | 16.00 | 22.85 | 87.23 | 27.89 | 17.95 | 18.14 | 23.42 | 87.40 | |||||||||||||||||
| Sales of natural gas of Eni's affiliates (net to Eni) | 2.46 | 2.04 | 2.09 | 2.82 | 9.41 | 2.81 | 2.14 | 1.96 | 2.62 | 9.53 | 2.72 | 2.20 | 1.34 | 1.66 | 7.92 | |||||||||||||||||
| Total sales and own consumption of natural gas | 30.51 | 19.19 | 18.60 | 28.76 | 97.06 | 32.33 | 21.00 | 17.96 | 25.47 | 96.76 | 30.61 | 20.15 | 19.48 | 25.08 | 95.32 | |||||||||||||||||
| Electricity sales | (TWh) | 9.00 | 9.61 | 10.70 | 10.23 | 39.54 | 9.68 | 9.66 | 9.55 | 11.39 | 40.28 | 12.29 | 9.62 | 10.54 | 10.13 | 42.58 | ||||||||||||||||
| Sales of refined products | (mmtonnes) | 10.87 | 11.77 | 12.01 | 12.15 | 46.80 | 10.34 | 11.03 | 13.16 | 10.49 | 45.02 | 10.01 | 12.73 | 13.25 | 12.34 | 48.33 | ||||||||||||||||
| Retail sales in Italy | 2.01 | 2.17 | 2.28 | 2.17 | 8.63 | 1.94 | 2.14 | 2.23 | 2.05 | 8.36 | 1.81 | 1.98 | 2.24 | 1.80 | 7.83 | |||||||||||||||||
| Wholesale sales in Italy | 2.04 | 2.33 | 2.50 | 2.58 | 9.45 | 2.19 | 2.22 | 2.47 | 2.48 | 9.36 | 2.06 | 2.18 | 2.20 | 2.18 | 8.62 | |||||||||||||||||
| Retail sales Rest of Europe | 0.67 | 0.77 | 0.91 | 0.75 | 3.10 | 0.70 | 0.76 | 0.80 | 0.75 | 3.01 | 0.72 | 0.76 | 0.81 | 0.75 | 3.04 | |||||||||||||||||
| Wholesale sales Rest of Europe | 0.86 | 0.97 | 1.06 | 0.99 | 3.88 | 0.81 | 0.97 | 1.08 | 0.98 | 3.84 | 0.89 | 1.03 | 1.05 | 0.99 | 3.96 | |||||||||||||||||
| Wholesale sales outside Europe | 0.09 | 0.11 | 0.11 | 0.11 | 0.42 | 0.10 | 0.11 | 0.11 | 0.11 | 0.43 | 0.10 | 0.11 | 0.10 | 0.11 | 0.42 | |||||||||||||||||
| Other markets | 5.20 | 5.42 | 5.15 | 5.55 | 21.32 | 4.60 | 4.83 | 6.47 | 4.12 | 20.02 | 4.43 | 6.67 | 6.85 | 6.49 | 24.46 | |||||||||||||||||
- 106 -
Contents

Contents
Contents

Contents

Table of Contents
Contents

Contents

Table of Contents
|
| |||||||||
| Contents | |||||||||
| 2 | Our activities | ||||||||
| 4 | Eni at a glance | ||||||||
| 6 | The competitive environment | ||||||||
| 8 | Our strategy | ||||||||
| Business review | |||||||||
| 10 | n Exploration & Production | ||||||||
| 15 | n Gas & Power | ||||||||
| "Eni in 2012" report comprises an extract of the description of the business, the management’s discussion and analysis of financial condition and results of operations and certain other Company information from Eni’s Annual Report for the year ended December 31, 2012. It does not contain sufficient information to allow as full an understanding of financial results, operating performance and business developments of Eni as "Eni 2012 Annual Report". It is not deemed to be filed or submitted with any Italian or US market or other regulatory authorities. You may obtain a copy of "Eni in 2012" and "Eni 2012 Annual Report" on request, free of charge (see the request form on Eni’s web site – eni.com – under the section "Publications"). "Eni in 2012" and "Eni 2012 Annual Report" may be downloaded from Eni’s web site under the section "Publications". Financial data presented in this report is based on consolidated financial statements prepared in accordance with the IFRS endorsed by the EU. This report contains certain forward-looking statements particularly those regarding capital expenditures, development and management of oil and gas resources, dividends, buy-back, allocation of future cash flow from operations, future operating performance, gearing, targets of production and sale growth, new markets and the progress and timing of projects. By their nature, forward-looking statements involve risks and uncertainties because they relate to events and depend on circumstances that will or may occur in the future. | Actual results may differ from those expressed in such statements, depending on a variety of factors, including the timing of bringing new fields on stream; management’s ability in carrying out industrial plans and in succeeding in commercial transactions; future levels of industry product supply; demand and pricing; operational problems; general economic conditions; political stability and economic growth in relevant areas of the world; changes in laws and regulations; development and use of new technologies; changes in public expectations and other changes in business conditions; the actions of competitors and other factors discussed elsewhere in this document. As Eni shares, in the form of ADRs, are listed on the New York Stock Exchange (NYSE), an Annual Report on Form 20-F has been filed with the US Securities and Exchange Commission in accordance with the US Securities Exchange Act of 1934. Eni shares are traded on the Italian Stock Exchange (Mercato Telematico Azionario) and on the New York Stock Exchange (NYSE) under the ticker symbol "E". | 20 | n Refining & Marketing | ||||||
| 25 | n Chemicals | ||||||||
| 27 | n Engineering & Construction | ||||||||
| Financial review | |||||||||
| 30 | Group results for the year | ||||||||
| 30 | Trading environment | ||||||||
| 30 | 2012 results | ||||||||
| 32 | Outlook for 2013 | ||||||||
| 33 | Financial risk factors | ||||||||
| 35 | Financial information | ||||||||
| 43 | n Frequently used terms | ||||||||
| 46 | Directors and officers | ||||||||
| 50 | Investor information | ||||||||
Contents
Eni in 2012 Our activities
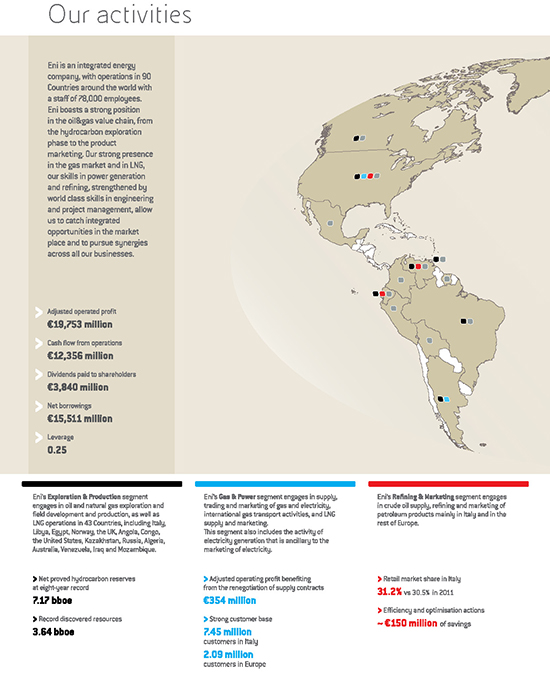
- 2 -
Contents
Eni in 2012 Our activities

- 3 -
Contents
Eni in 2012 Eni at a glance
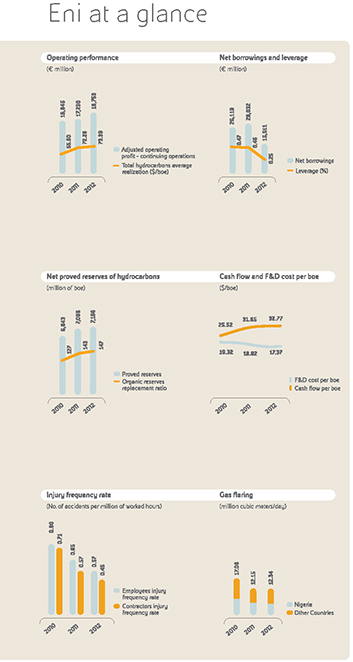 | Operating performance Net borrowings and leverage
Net proved reserves of hydrocarbons Cash flow and F&D cost per boe
Injury frequency rate Gas flaring |
- 4 -
Contents
Eni in 2012 Eni at a glance
| Energy savings We continued to upgrade the energy efficiency of our operations in order to achieve a rational use of energy and process optimization. In R&M and Chemicals, initiatives concluded in 2012 allowed to reach important savings. Diversity and inclusiveness
Capex Safety of our employees
Research and development Customer satisfaction |
|

- 5 -
Contents
Eni in 2012 The competitive environment

- 6 -
Contents
Eni in 2012 The competitive environment
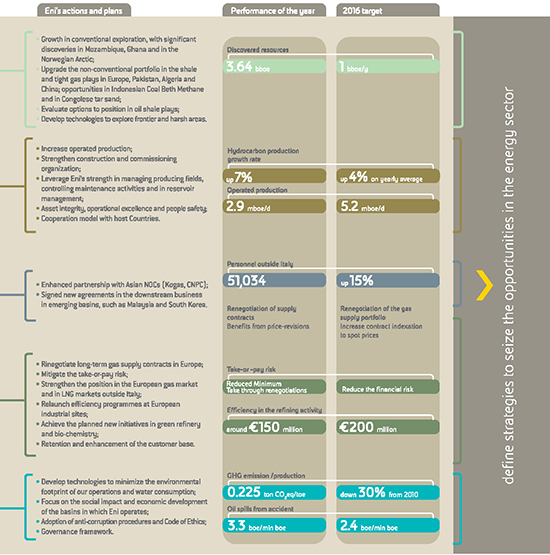
- 7 -
Contents
Eni in 2012 Our strategy
| Our strategy Eni’s excellent market position and competitive advantages derive from the Company’s strategic choices which are consistent with the long-term nature of the business. Our long-term success owes to a sustainable business model backed by a framework of clear and straightforward rules of corporate governance, rigorous risk management and adoption of the highest ethical standards. | 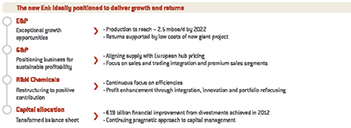 | |||
| In 2012 Eni laid the foundations for a new growth phase of its oil and gas production, one which promises to outperform the industry over the medium and long-term. In the meanwhile, Eni has started the reorganization of its mid and downstream activities to manage the current European downturn. In the Chemical segment, Eni has progressed at repositioning the business to deliver sustainable results. Eni’s strategies, resource allocation processes and management of day-by-day operations underpin sustainable value creation to shareholders and, more generally, to all of our stakeholders. The oil&gas industry is copying with a complex scenario featured by the global economic slowdown, particularly in the Euro-zone, and volatile market conditions for energy commodities. In the medium to long-term, the main challenges will be driven by rising competitive pressures in accessing hydrocarbon reserves, stricter regulation addressing environmental preservation and mitigation of the climate risk, growing importance of renewable sources as well as the role of unconventional resources in satisfying energy needs. Eni’s strategy for the 2013-2016 four-year period confirms the priorities of profitably growing oil and gas production, recovering profitability in the downstream gas sector, improving efficiency in downstream oil, chemicals and general services supporting business activities, as well as retaining the global leadership in Engineering & Construction focusing on the most technologically advanced | and innovative segments. In 2012 following the divestment of a significant interest in Snam and deconsolidation of the investee’s net borrowings as well as the transaction involving Eni’s interest in Galp, the Group achieved a substantial improvement in its leverage at 2012 year end down to 0.25 thanks to euro 19 billion of disposals. This renewed and strengthened balance sheet will help the Company mitigate its greater exposure to the Exploration & Production business. The increased weight of upstream activities in Eni’s portfolio will yield higher returns but also greater risks and volatility compared to the Italian regulated businesses that were divested in 2012. For these reasons, management will remain strongly focused on preserving the Company’s financial structure as well as managing the upstream risks in the foreseeable future. We intend to maintain our leverage within a target range of 0.1-0.3 at our long-term Brent price scenario of $90 a barrel flat in the next four years. This range will allow us to absorb temporary fluctuations in oil prices, the market environment and business results. Over the next four years, we plan that net cash generated by operating activities will enable Eni to finance a large capital expenditure program amounting to euro 56.8 billion to fuel production growth. In addition we are committed to raise further euro 10 billion from completing the disposal of our residual interests in Snam and Galp and other portfolio transactions. Given the Company’s changed business profile and improved balance sheet, management plans to distribute cash to shareholders by means of a revised dividend policy and share repurchases. The new dividend policy contemplates a progressive, growing dividend at a rate which is expected to be determined year-to-year taking into account Eni’s underlying earnings and cash flow growth as well as capital expenditure requirements and the targeted financial structure. Management will also evaluate the achievement of the targeted production levels in the Exploration & Production segment, the status of renegotiations at gas long-term supply contracts in the Gas & Power segment and the | delivery of efficiency gains in the downstream businesses. The other leg of our long-term strategy will be a continuing focus on managing the upstream risks. We intend to mitigate the political risk by expanding the geographic reach of our activities and deploying the Eni cooperation model with host Countries based on the commitment to maximize the value delivered to local communities and invest in long-term initiatives that benefit our local partners (access to energy, education and health). The risk of "project delivery" will require the in-source of critical engineering and project management activities as well as careful monitoring of supply-chain programming. Finally, the operational risk relating to drilling activities will be managed by applying Eni’s rigorous procedures throughout the engineering and execution stages, leveraging on proprietary drilling technologies, internal skills and know-how, increased control of operations and specific technologies aimed at minimizing blow-out risks and responding quickly and effectively in case of emergencies.
| ||
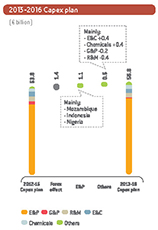
- 8 -
Contents
Contents
Eni in 2012 Business review / Exploration & Production
![]()
Key performance indicators |
2010 | 2011 | 2012 | ||||||
| Employees injury frequency rate | (No. of accidents per million of worked hours) | 0.72 | 0.41 | 0.28 | ||||
| Contractors injury frequency rate | 0.48 | 0.41 | 0.36 | |||||
| Fatality index | (No. of fatalities per 100 million of worked hours) | 7.90 | 1.83 | 0.81 | ||||
| Net sales from operations (a) | (euro million) | 29,497 | 29,121 | 35,881 | ||||
| Operating profit | 13,866 | 15,887 | 18,451 | |||||
| Adjusted operating profit | 13,898 | 16,075 | 18,518 | |||||
| Adjusted net profit | 5,609 | 6,865 | 7,425 | |||||
| Capital expenditure | 9,690 | 9,435 | 10,307 | |||||
| Adjusted ROACE | (%) | 16.0 | 17.2 | 17.6 | ||||
| Profit per boe (b) | ($/boe) | 11.91 | 16.98 | 15.95 | ||||
| Opex per boe (b) | 6.14 | 7.28 | 7.10 | |||||
| Cash flow per boe (d) | 25.52 | 31.65 | 32.77 | |||||
| Finding & Development cost per boe (c) (d) | 19.32 | 18.82 | 17.37 | |||||
| Average hydrocarbons realizations (d) | 55.60 | 72.26 | 73.39 | |||||
| Production of hydrocarbons (d) | (kboe/d) | 1,815 | 1,581 | 1,701 | ||||
| Estimated net proved reserves of hydrocarbons (d) | (mmboe) | 6,843 | 7,086 | 7,166 | ||||
| Reserves life index (d) | (years) | 10.3 | 12.3 | 11.5 | ||||
| Organic reserves replacement ratio (d) | (%) | 127 | 143 | 147 | ||||
| Employees at year end | (units) | 10,276 | 10,425 | 11,304 | ||||
| of which: outside Italy | 6,370 | 6,628 | 7,371 | |||||
| Oil spills | (bbl) | 3,820 | 2,930 | 3,093 | ||||
| Oil spills from sabotage and terrorism | 18,695 | 7,657 | 8,384 | |||||
| Produced water re-injected | (%) | 44 | 43 | 49 | ||||
| Direct GHG emissions | (mmtonnes CO2 eq) | 31.20 | 23.59 | 28.46 | ||||
| of which: from flaring | 13.83 | 9.55 | 9.46 | |||||
| Community investment | (euro million) | 72 | 62 | 59 | ||||
| (a) Before elimination of intragroup sales. (b) Consolidated subsidiaries. (c) Three-year average. (d) Includes Eni’s share of equity-accounted entities. |
2012 Highlights
| Performance of the year > In 2012 employees and contractors injury frequency rate declined by 31.7% and 12.2% compared to the previous year. > Total greenhouse gas emissions increased by 20.6% due to the recovery of activities in Libya. Greenhouse gas emissions from flaring were in line with 2011 (down 0.9%). > In 2012 the E&P Division reported a record performance with an adjusted net profit amounting to euro 7,425 million (up 8.2% from 2011) driven by an ongoing production recovery in Libya. | > Eni reported oil and natural gas production for the full year of 1,701 kboe/day (up 7% from 2011) sustained by the recovery of activities in Libya, the start-up/ramp-up of fields, particularly in Russia and Australia, and higher production in Iraq. > Estimated net proved reserves at December 31, 2012 was an eight-year record at 7.17 bboe based on a reference Brent price of $111 per barrel. The organic reserves replacement ratio was 147% with a reserves life index of 11.5 years (12.3 | years in 2011). > Oil spills increased in the full year (up 5.6% from accidents and up 9.5% from sabotage and terrorism) due to force majeure and security issues in Nigeria. > Capital expenditure amounted to euro 10,307 million (up 9.2% from 2011) to fuel the growth of major projects in Norway, the United States, Congo, Italy, Kazakhstan, Angola and Algeria. > In 2012 overall R&D expenditure of the Exploration & Production Division |
- 10 -
Contents
Eni in 2012 Business review / Exploration & Production
| amounted to approximately euro 94 million (euro 90 million in 2011). Mozambique | Exploration activity > Full year 2012 was a record for exploration, adding 3.64 bboe of discovered resources, about six times the production of the year, increasing our reserves to best ever levels with rapid time-to-market and cost effectiveness. Our approach in the selective development initiatives, advanced technologies and knowledge management of core basins will be the key to achieve future targets. New resources were, in addition to the above mentioned Mozambique discoveries, the appraisal of the Skrugard/Havis discoveries in the Barents Sea and the Sankofa field in Ghana, a relevant onshore discovery in Pakistan as well as other successes in Egypt, Congo, Indonesia, Angola, the United States and Nigeria. > Our portfolio was boosted with the acquisition of new exploration acreage in high potential areas such as Kenya, Liberia, Vietnam, Cyprus, offshore Russia and shale gas in Ukraine, as well as legacy areas such as China, Pakistan, Indonesia and Norway. > Exploration expenditure amounted to euro 1,850 million (up 52.9% from 2011) to complete 60 new exploratory wells (34.1 net to Eni). The overall commercial success rate was 40% (40.8% net to Eni). In addition 144 exploratory wells drilled are in progress at year end (62 net to Eni). Portfolio | (FPSA) of the Karachaganak field and the Republic of Kazakhstan closed a settlement agreement of all pending claims relating to the recovery of costs incurred to develop the field. The Contracting Companies divested 10% of their rights and interest in the project to Kazakhstan’s KazMunaiGas for $1 billion net cash consideration ($325 million being Eni’s share). > The Consortium partners and the Authorities of the Republic of Kazakhstan reached an agreement on the Amendment to the sanctioned development plan of the Kashagan field (Amendment 4) which included an update to the project schedule, a revision of the investments estimate and the settlement of all pending claims relating to recoverable costs and other tax matters. The commercial production start-up is expected by the end of the first half of 2013. > Divested production and development assets in Italy, Nigeria, Norway, the United Kingdom and offshore Gulf of Mexico confirming a selective growth approach to optimize Eni’s asset portfolio and to enhance the competitiveness of Eni’s full-cycle production costs. > Sanctioned by Venezuelan authorities the development plan of the Perla gas project, in Block Cardón IV (Eni’s interest 50%), in the Gulf of Venezuela. Two more phases were sanctioned to reach a production plateau of approximately 1,200 mmcf/d. > Made final investment decisions to develop fields in Angola, Congo, Nigeria and Italy which are expected to add 59 kboe/d in 2016. |
| Strategies Eni’s Exploration & Production business boasts a strong competitive position in a number of strategic oil and gas basins in the world, namely the Caspian Region, North and Sub-Saharan Africa, Venezuela, Russia, the Barents Sea and the Gulf of Mexico. Eni’s strategy is to deliver organic production growth with increasing returns and full reserve replacement. Growth will be fuelled by continuing production start-ups and ramp-ups in Eni’s core areas leveraging Eni’s vast knowledge of reservoirs and geological basins, as well as technical and producing synergies. We intend to drive higher returns and manage the operational risk in our | upstream operations by reducing time to market, increasing total volumes of operated production as well as selectively picking partners in non-operated joint-projects. Our growth trajectory will be supported by our ongoing commitment in establishing and consolidating our partnerships with key host Countries, leveraging the Eni co-operation model. We expect that continuing technological innovation and competence build-up will drive production growth by increasing rates of reserve recovery, developing drilling techniques to be applied in complex environment to fully exploiting marginal fields and leveraging deep/ultra deep offshore areas potential. Consistent with the long-term nature of the business, strategic guidelines for our Exploration | & Production Division have remained basically unchanged in the years, as follows: • Maintain strong profitable production growth. Management plans to invest euro 39.9 billion to develop reserves over the next four years. An important share of these expenditures will be allocated to certain development projects which will support the Company’s long-term production plateau, in particular we plan to |
- 11 -
Contents
Eni in 2012 Business review / Exploration & Production
| start developing the recent gas discovery offshore Mozambique and to progress large and complex projects in the Barents Sea, Nigeria and Indonesia. We are also planning to maintain a prevailing share of projects regulated by production sharing agreements in our portfolio; this will shorten cost recovery in an environment of high crude oil prices. Our long-term sustainable growth will leverage on continuous exploration activities, with planned expenses of euro 5.5 billion, which are intended to pursue finding projects in well-established basins and in high potential frontier areas. Approximately euro 1.8 billion will be spent to execute development projects through equity-accounted entities. Maintain strong production growth Eni’s Exploration & Production segment engages in oil and natural gas exploration and field development and production, as well as LNG operations in 43 Countries, including Italy, Libya, Egypt, Norway, the UK, Angola, Congo, the United States, Kazakhstan, Russia, Algeria, Australia, Venezuela, Iraq and Mozambique. | of construction activities; and (iii) signing framework agreements with major suppliers, using standardized specifications to speed up the pre-award process for critical equipment and plants, increasing focus on supply chain programming to optimize order flows. Eni will pursue further growth options by developing unconventional plays, gas-to-LNG projects and integrated gas projects. Finally, we intend to optimize our portfolio of development properties by focusing on areas where our presence is well established, and divesting non-strategic or marginal assets. > Production and reserves: |  To achieve that target, we intend: Actual production volumes will vary from year to year due to the timing of individual project start-ups, operational outages, reservoir performance, regulatory changes, asset sales, severe weather events, price effects under production sharing contracts and other factors. Estimated net proved reserves at December 31, 2012 was an eight-year record at 7.17 bboe based on a reference Brent price of $111 per barrel. Additions to proved reserves booked in 2012 derived from: (i) revisions of previous estimates were 576 mmboe mainly reported in Venezuela, Kazakhstan, Nigeria and Egypt; (ii) extensions, discoveries and other factors were 349 mmboe, with major increases booked in Venezuela, Kazakhstan and Angola; (iii) improved recovery were 28 mmboe mainly reported in Algeria and Nigeria. The reserves life index is 11.5 years. |
- 12 -
Contents
Eni in 2012 Business review / Exploration & Production
| through fast sanctioning and time to market of new projects. We made final investment decisions to develop fields in Angola, Congo, Nigeria and Venezuela as well as other minor projects in Italy. Eni will continue focusing on well-established areas of presence where availability of production facilities will enable the Company to readily put in production discovered reserves. We plan to increase returns at our oil and gas projects by reducing time to market, as 90% of the discoveries made in 2008-2012 will reach production within 8 years from their discovery. Our reserve replacement will be underpinned by our strong focus on exploration and timely conversion of resources into reserves and production, while at the same time fighting depletion and enhancing the recovery factor in existing fields through effective reservoir management. Exploration Exploration activities play a major role in our sustainable growth strategy by fuelling new production and securing access to new opportunities. | World-class discoveries have been made in the Barents Sea with the appraisal campaign of the mineral potential at the oil and gas Skrugard discovery and the new Havis oil and gas discovery in the PL532 license (Eni’s interest 30%). Both fields are planned to be put in production by means of a fast-track synergic development. In addition we have made the gas and condensate Salina discovery in the PL 533 license (Eni’s interest 40%). In Ghana, appraisal activities at the Sankofa discovery in the Offshore Cape Three Points license (Eni operator with a 47.22% interest) confirmed the overall potential of the discovery to be around 450 million barrels of oil in place. A relevant onshore discovery was made in Pakistan with estimated resources of 300 to 400 bcf of gas in place and in line with Eni’s strategy of focusing on conventional and synergic assets. Other significant exploration successes were achieved in Egypt, Congo, Indonesia, Angola, the United States and Nigeria where synergies with existing infrastructures will reduce the time-to-market of discovered resources. Our consistent performance confirms the effectiveness of our exploration strategy, with its focus on proven basins, a select number of high-potential frontier themes and accelerating appraisal campaigns. Building on this success, over the next four years we will confirm our exploration efforts to further strengthen the basis of our long-term growth. Exploration projects will attract some euro 5.5 billion in the next four years to appraise the latest discoveries made by the Company and to support continuing reserve replacement. The most important amounts of exploration expenses will be incurred in Angola, Russia, the United States, Nigeria, Egypt, Norway and Indonesia; important resources will be dedicated to explore new areas (Kenya, Vietnam, Ukraine and Cyprus) and on unconventional plays. |  shared rights for exploration and development in 43 Countries on five continents for a total acreage of 251,170 square kilometers net to Eni of which developed acreage was 40,939 square kilometers and undeveloped acreage was 210,231 square kilometers. Eni’s portfolio was boosted with the acquisition of new exploration acreage in high potential areas such as Kenya, Liberia, Vietnam, Cyprus, offshore Russia and shale gas in Ukraine, as well as legacy areas such as China, Pakistan, Indonesia and Norway. Develop new Eni has a strong pipeline of development projects that will fuel the medium and long-term growth of its oil and gas production. |
- 13 -
Contents
Eni in 2012 Business review / Exploration & Production
A description of our hubs is provided below.
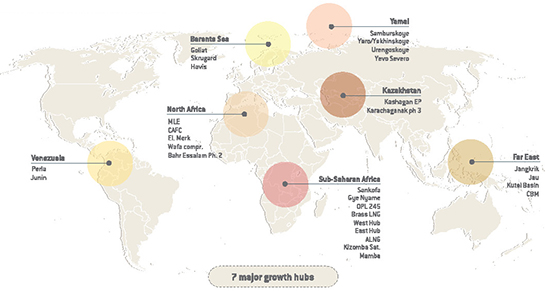
| > Oil & gas major hubs Africa While Libya and Egypt are the pillars of our current production in the area, our main ongoing projects are located in Algeria, Angola and moving to long-term in Mozambique. Algeria – We achieved the production start-up at the MLE (Eni 75%) field as part of the MLE-CAFC integrated project; and lately, at the El Merk (Eni 12.25%) project. These projects will add 30 kboe/d in 2013 and will grow to 45 kboe/d at the end of 2016. Angola – Block 15/06 (Eni 35%, Op.) is our major giant development in this Country. The potential resources will be developed within the West Hub and the East Hub projects. Production start-up of the West Hub is expected in 2014 with a peaking production of 25 kbbl/d in 2016. The East Hub will be sanctioned in 2013. Peak production is expected at approximately 15 kbbl/d. | Kazakhstan Kazakhstan is one of our legacy Countries where we have interests in the Karachaganak (Eni 29.25%, Op.) and the Kashagan (Eni 16.81%) supergiant fields. The Karachaganak field still contains about 5 bboe of reserves, approximately four times the amount already produced, with competitive production costs. Phase 3 of development is currently under study. The project is aimed at further developing gas and condensates reserves by means of the installation, in stages, of gas treatment plants and re-injection facilities to increase gas sales and liquids production. The development plan is currently in the phase of technical and marketing definition to be presented to the relevant Authorities. Start-up and commercial production of the Kashagan field is confirmed by the end of the first half of 2013, as agreed with the Republic of Kazakhstan. In 2013 the project will add approximately 20 kboe/d. Russia | also on the Yaro-Yakhinskoye field. The Yamal hub will provide a plateau of 165 kboe/d by 2016. Barents Sea Venezuela |
- 14 -
Contents
Eni in 2012 Business review / Gas & Power
![]()
Key performance indicators (*) |
2010 | 2011 | 2012 | ||||||
| Employees injury frequency rate | (No. of accidents per million of worked hours) | 3.97 | 2.44 | 1.84 | |||||||
| Contractors injury frequency rate | 4.00 | 5.22 | 3.64 | ||||||||
| Net sales from operations (a) | (euro million) | 27,806 | 33,093 | 36,200 | |||||||
| Operating profit | 896 | (326 | ) | (3,221 | ) | ||||||
| Adjusted operating profit | 1,268 | (247 | ) | 354 | |||||||
| Marketing | 923 | (657 | ) | 45 | |||||||
| International transport | 345 | 410 | 309 | ||||||||
| Adjusted net profit | 1,267 | 252 | 473 | ||||||||
| Pro-forma adjusted EBITDA | 2,562 | 949 | 1,314 | ||||||||
| Marketing | 1,863 | 257 | 856 | ||||||||
| International transport | 699 | 692 | 458 | ||||||||
| Capital expenditure | 265 | 192 | 225 | ||||||||
| Worldwide gas sales (b) | (bcm) | 97.06 | 96.76 | 95.32 | |||||||
| LNG sales (c) | 15.00 | 15.70 | 14.60 | ||||||||
| Customers in Italy | (million) | 6.88 | 7.10 | 7.45 | |||||||
| Electricity sold | (TWh) | 39.54 | 40.28 | 42.58 | |||||||
| Employees at period end | (units) | 5,072 | 4,795 | 4,752 | |||||||
| Direct GHG emissions | (mmtonnes CO2 eq) | 13.41 | 12.77 | 12.70 | |||||||
| Customer satisfaction score (CSC) (d) | (%) | 87.4 | 88.6 | 89.8 | |||||||
| Water consumption/withdrawals per kWh eq produced | (cm/kW eq) | 0.013 | 0.014 | 0.012 | |||||||
(*) Following the divestment plan of the Regulated Business in Italy, results of the Gas & Power Division include Marketing and International transport activities. Prior periods have been modified on a like-for-like basis.
(a) Before elimination of intragroup sales.
(b) Include volumes marketed by the Exploration & Production Division of 2.73 bcm (5.65 and 2.86 bcm in 2010 and 2011, respectively).
(c) LNG sales of affiliates and associates of the Gas & Power Division (included in worldwide gas sales) and the Exploration & Production Division.
(d) 2012 figure is calculated as the average of the CSS reviewed by the AEEG in the first half of 2012 and the result reviewed by the Eni satisfaction survey in the second half of 2012.
2012 Highlights
| Performance of the year > In 2012, Eni’s continuous commitment and the resources dedicated to safety allowed to improve significantly the accident frequency rate. In particular a positive trend was confirmed for employees (down 24.6% from 2011), while the rate for contractors returned to levels lower than in 2010, improving by 30% from 2011. > In 2012, the water consumption rate of EniPower’s plants declined both in general (down 11.2% from 2011) and per kWh produced (down 13.8%). > In 2012, adjusted net profit was euro 473 million, almost doubling the 2011 results. This reflected a better performance of the Marketing business in a context of weak demand and mounting competitive pressures. Declining selling prices were more | than offset by the benefits associated with the renegotiations of the supply contracts, certain of which with effects retroactive to 2011, and an improved supply mix following the full recovery of Libyan supplies. > Worldwide gas sales decreased by 1.5% to 95.32 bcm due to lower European demand and competitive pressures. Sales in Italy were in line with 2011, while they declined slightly in European markets, in particular in Benelux due to competitive pressure and in the Iberian Peninsula due to the divestment of Galp. > Electricity sales of 42.58 TWh increased by 2.30 TWh from 2011, up 5.7%. > Capital expenditure of euro 225 million concerned essentially flexibility and upgrading of combined cycle power stations (euro 131 million) and initiatives in gas marketing (euro 81 million). | Commercial Agreements in the Far East > Eni signed a trilateral agreement with Korea Gas Corporation and Japanese company Chubu Electric Power Company for the sale of 28 loads of LNG (liquefied natural gas) corresponding to 1.7 million tonnes of LNG in the 2013-2017 period. Entry in the French and Belgian markets |
- 15 -
Contents
Eni in 2012 Business review / Gas & Power
| Strategies Eni’s Gas & Power segment engages in supply, trading and marketing of gas and electricity, international transport, and LNG supply and marketing. This segment also includes the activities of electricity generation. The Gas & Power strategic guidelines are the following: Management believes that profitability in the Company’s gas marketing business will gradually recover along the plan period, however the visibility into future results of operations is constrained by the ongoing volatility in marketing margins. Our profitability outlook factors in the expected benefits of ongoing renegotiations at the Company long-term supply contracts which the Company is seeking to finalize over time | during the plan period. Currently, 80% of Eni’s supplies are under renegotiation. Management will also seek to improve profitability by means of cost efficiencies, streamlining business support activities and reducing marketing, general and administrative costs. In addition, the Company intends to capture margins improvements by means of trading activities by entering derivative contracts both in the commodity and the financial trading venues in order to capture possible favorable trends in market prices, within the limits set by internal policies and guidelines that define the maximum tolerable level of market risk. As part of this strategy, the Company intends to improve results of operations by effectively managing the flexibilities associated with the Company’s assets (gas supply contracts, transportation rights, and customer base and market position). This can be achieved through strategies of asset-backed trading by entering into arbitrage contracts to leverage on commodity price volatility exploiting the flexibility provided by the Company’s assets. Gas Market trends Management expects the outlook in the European gas sector to remain unfavorable over the short to the medium-term due to continuing demand weakness and oversupplies, against the backdrop of the economic downturn. | On the other side of the equation, European gas intermediaries, including Eni, have seen their profit margins squeezed by rising trends in costs of oil-linked gas supplies, as provided by pricing formulas in long-term supply contracts. In addition, minimum off-take obligations and the necessity to minimize the associated financial exposure have forced gas operators to compete more aggressively on pricing in consideration of lower selling opportunities, with negative effects on selling prices, and hence profitability. In 2012, gas demand in Europe declined by 2% (down by 4% in Italy) due to lower consumption in all market segments on the back of the economic downturn. The power generation segment recorded the steepest fall, hit by an ongoing expansion in the use of renewable sources and a shift to coal as feedstock for power plants due to cost advantages. Due to the severity of the contraction in European gas demand and ongoing uncertainties in the macroeconomic outlook, management has revised down its projections of gas demand over the medium to long-term to factor in a number of trends: Management now expects EU demand to increase at an average growth rate of approximately 1.8% along the planning period. Gas demand in Italy is expected to grow with an average rate of approximately 1.7% in the same period. The projected level of gas demand in 2016 is significantly below the level recorded in the pre-crisis years. As a result of those drivers, we expect that current market imbalances will continue over the next two to three years. Looking beyond, however, we believe that certain potential catalysts may help rebalance the European gas market. Those include: possible developments in the decommissioning of nuclear plants in countries like Japan, Taiwan and in Europe; continuing growth in LNG imports in China, India and other emerging countries in East Asia, Middle East and South America where we expect that consumption |
- 16 -
Contents
Eni in 2012 Business review / Gas & Power
| will increase significantly mainly driven by robust rates of economic development; the possible enactment of stricter environmental regulation in the EU; and finally we expect that gas production in Europe will progressively decline due to mature field depletion while the gas balance might tighten in the North African area due to growing consumption. Any combination of those possible developments could trigger a recovery in European gas prices and a market tightening. In such an environment, Eni’s competitive advantages given by a solid portfolio of gas contracts, access to infrastructures and storage capacity, innovative product offering and | trading capabilities would drive significant upside potential. Gas sales: In 2012, sales of natural gas were 95.32 bcm, down 1.44 bcm, or 1.5% from 2011. | negative scenario and increasing competitive pressure, were offset by higher sales at Italian hubs and, at a lower extent, to the residential segment reflecting efficient commercial initiatives. Sales on target markets in Europe of 48.29 bcm showed a slight decline from 2011 (down 2.9%). This decline was mainly due to lower sales in Benelux and in the Iberian Peninsula due to the exclusion of Galp sales after the loss of control, offset only in part by increases recorded in France and in Germany/Austria. Sales to markets outside Europe increased by 0.55 bcm due to higher LNG sales in the Far East, in particular in Japan. |
Gas sales by market (bcm) |
2010 | 2011 | 2012 | ||||||
| ITALY | 34.29 | 34.68 | 34.78 | |||||
| Wholesalers | 4.84 | 5.16 | 4.65 | |||||
| Gas release | 0.68 | |||||||
| Italian gas exchange and spot markets | 4.65 | 5.24 | 7.52 | |||||
| Industries | 6.41 | 7.21 | 6.93 | |||||
| Medium-sized enterprises and services | 1.09 | 0.88 | 0.81 | |||||
| Power generation | 4.04 | 4.31 | 2.55 | |||||
| Residential | 6.39 | 5.67 | 5.89 | |||||
| Own consumption | 6.19 | 6.21 | 6.43 | |||||
| INTERNATIONAL SALES | 62.77 | 62.08 | 60.54 | |||||
| Rest of Europe | 54.52 | 52.98 | 51.02 | |||||
| Importers in Italy | 8.44 | 3.24 | 2.73 | |||||
| European markets | 46.08 | 49.74 | 48.29 | |||||
| Iberian Peninsula | 7.11 | 7.48 | 6.29 | |||||
| Germany/Austria | 5.67 | 6.47 | 7.78 | |||||
| Benelux | 15.64 | 13.84 | 10.31 | |||||
| Hungary | 2.36 | 2.24 | 2.02 | |||||
| UK/Northern Europe | 4.45 | 4.21 | 4.75 | |||||
| Turkey | 3.95 | 6.86 | 7.22 | |||||
| France | 6.09 | 7.01 | 8.36 | |||||
| Other | 0.81 | 1.63 | 1.56 | |||||
| Extra European markets | 2.60 | 6.24 | 6.79 | |||||
| E&P in Europe and in the Gulf of Mexico | 5.65 | 2.86 | 2.73 | |||||
| WORLDWIDE GAS SALES | 97.06 | 96.76 | 95.32 | |||||
| In 2013 management expects to achieve stable natural gas sales compared to 2012 on a homogeneous basis, i.e. excluding the impact of the Galp divestment. Marketing strategy: Over the 2013-2016 period, Eni’s marketing strategy will focus on certain distinct commercial objectives: | • to maintain its leadership in the Italian market mainly by strengthening the customer base in the valuable segments of retail consumers and small and medium businesses; • to strengthen Eni’s position in Europe in the business gas market, where the Company has a well balanced portfolio in terms of geographies, customer segments and contract duration. In particular management plans to regain market share in Italy and to expand sales in | European target markets by leveraging first of all on the improved competitiveness of the Company’s cost position reflecting the expected benefits of the renegotiation of its supply contracts. About the marketing effort, we intend to improve the quality of our offer. We are targeting the industrial and wholesale segment across Europe, where we have integrated our commercial and trading operations in order to develop new structured products for those sophisticated customers. Those products will include multiple pricing options and volume flexibility. |
- 17 -
Contents
Eni in 2012 Business review / Gas & Power

| In order to increase exposure to the retail segment, management plans to expand its customer base in Italy and outside Italy, by almost 3 million clients in the next four years to reach a total of 14 million customers by 2016, strengthening Eni’s position in this segment. Particularly in the retail market in Italy, Eni’s marketing action will focus on the combined commercial offer "luce, gas, carburanti" (electricity, gas and fuels), high standards of service, and the adoption of lean marketing procedures to facilitate customers’ tasks and optimization of commercial channels (such as agencies, remote selling, energy stores) with a strong focus on web channels. Supply In order to secure long-term access to gas availability, particularly with a view of supplying the Italian gas market, Eni has signed a number of long-term gas supply contracts with key producing Countries that supply the European gas markets. These contracts have been ensuring approximately 80 bcm/y of gas availability from 2010 (including the Eni Gas & Power NV portfolio of supplies and excluding Eni’s other subsidiaries and affiliates) with a residual life of approximately 16 years and a pricing mechanism that indexes the cost of gas to the price of crude oil and its derivatives (gasoil, fuel oil, etc.). |
| |||
| sold outside Italy, represented approximately 91% of total supplies, an increase of 3.03 BCM, or 4%, from 2011, mainly reflecting higher volumes | purchased from Libya (up 4.23 BCM), almost tripled from 2011 when the GreenStream gas pipeline had been shutdown. | |||
| ||||
| LNG Eni is present in all phases of the LNG business: gas feeding, liquefaction, shipping, re- | gasification and sale through operated activities or interests in joint ventures and associates. Eni’s presence in the business is synergic with to the Company’s plans to develop its large gas | |||


- 18 -
Contents
Eni in 2012 Business review / Gas & Power
| reserve base in Africa and elsewhere in the world. The LNG business has been marginally impacted by the economic downturn and oversupply affecting the European gas market, as well as by structural modifications in the US market. LNG flexibility allowed to adapt the business model to a changing market scenario and to increase the value of the commodity entering in new markets. Looking forward, we expect that the LNG business will be one of the major drivers of our Gas & Power Division. We are targeting to increase LNG sales and profitability mainly through cargo diversion to Asia or South America and we have signed long-term supply agreements with clients in East Asia. At present, we participate through our affiliates in a number of facilities located in Spain (regasification) and Egypt (liquefaction). The Company has also access to LNG supplies in Algeria and Qatar. Our main ongoing interest in the LNG business is the joint Pascagoula project with our Exploration & Production business. The Pascagoula project is part of an upstream development project related to the construction of an LNG plant in Angola designed to produce 5.2 mmtonnes of LNG (approximately 7.3 bcm/y) in order to monetize part of the Company’s gas reserves. Power generation Eni’s main power generation plants are located in Ferrera Erbognone, Ravenna, Livorno, Taranto, Mantova, Brindisi, Ferrara and in various photovoltaic parks. | increased production at the Ferrara plant, offset in part by decreases at the Ferrera Erbognone and Ravenna plants. As of December 31, 2012, installed operational capacity was 5.3 GW. Power availability in 2012 was supported by the growth in electricity trading activities (up 1.86 TWh, or 12.4%) due to higher volumes traded on the Italian power exchange benefiting from lower purchase prices. By 2015, Eni expects to complete its plans for capacity expansion targeting an installed capacity of 5.4 GW. In the medium term, Eni intends to consolidate operations at its power generation plants and to enhance the flexibility of assets in order to better meet market needs. Furthermore Eni intends to develop the production from renewable sources focusing on photovoltaic power plants, and on the Company’s "Green Chemistry" project for the remediation of the Porto Torres site, where it will be also build a bio-mass power plant. International transport Eni owns capacity entitlements in an extensive network of international high pressure pipelines enabling the Company to import natural gas produced in Russia, Algeria, the North Sea, including the Netherlands and Norway, and Libya to Italy. The Company participates to both entities which own and operate the pipelines, the pipeline owners, and entities which manage transport rights, the carriers. For financial reporting purposes, such entities are either fully-consolidated or equity-accounted depending on the Company’s interest or agreements with other shareholders. | Follows a description of the main international pipelines currently participated or operated by Eni. • TTPC The pipeline, 740-kilometer long, made up of two lines that are each 370-kilometer long with a transport capacity of 33.2 bcm/y and five compression stations. This pipeline transports natural gas from Algeria across Tunisia from Oued Saf Saf at the Algerian border to Cap Bon on the Mediterranean coast where it links with the TMPC pipeline. • TMPC The pipeline for the import of Algerian gas is 775-kilometer long and consists of five lines that are each 155-kilometer long with a transport capacity of 33.5 bcm/y. It crosses the underwater Sicily Channel from Cap Bon to Mazara del Vallo in Sicily, the point of entry into the Italian natural gas transport system. • GreenStream The pipeline, jointly-owned with the Libyan National Oil Co, started operations in October 2004 for the import of Libyan gas produced at Eni operated fields Bahr Essalam and Wafa. It is 520-kilometer long with a transport capacity of 8 bcm/y expandible to 11 bcm/y and crosses underwater in the Mediterranean Sea from Mellitah on the Libyan coast to Gela in Sicily, the point of entry into the Italian natural gas transport system. • Eni holds a 50% interest in the Blue Stream underwater pipeline (water depth greater than 2,150 meters) linking the Russian coast to the Turkish coast of the Black Sea. This pipeline is 774-kilometer long on two lines and has transport capacity of 16 bcm/y. It is part of a joint venture to sell gas produced in Russia on the Turkish market. |
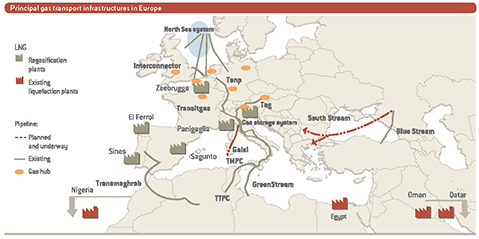
- 19 -
Contents
Eni in 2012 Business review / Refining & Marketing
![]()
Key performance indicators |
2010 | 2011 | 2012 | ||||||
| Employees injury frequency rate | (No. of accidents per million of worked hours) | 1.77 | 1.96 | 1.08 | |||||||
| Contractors injury frequency rate | 3.59 | 3.21 | 2.32 | ||||||||
| Net sales from operations (a) | (euro million) | 43,190 | 51,219 | 62,656 | |||||||
| Operating profit | 149 | (273 | ) | (1,303 | ) | ||||||
| Adjusted operating profit | (181 | ) | (539 | ) | (328 | ) | |||||
| Adjusted net profit | (56 | ) | (264 | ) | (179 | ) | |||||
| Capital expenditure | 711 | 866 | 842 | ||||||||
| Refinery throughputs on own account | (mmtonnes) | 34.80 | 31.96 | 30.01 | |||||||
| Conversion index | (%) | 61 | 61 | 61 | |||||||
| Balanced capacity of refineries | (kbbl/d) | 757 | 767 | 767 | |||||||
| Retail sales of petroleum products in Europe | (mmtonnes) | 11.73 | 11.37 | 10.87 | |||||||
| Service stations in Europe at year end | (units) | 6,167 | 6,287 | 6,384 | |||||||
| Average throughput per service station in Europe | (kliters) | 2,353 | 2,206 | 2,064 | |||||||
| Retail efficiency index | (%) | 1.53 | 1.50 | 1.48 | |||||||
| Employees at period end | (units) | 8,022 | 7,591 | 7,125 | |||||||
| Direct GHG emissions | (mmtonnes CO2 eq) | 7.76 | 7.23 | 6.03 | |||||||
| SOx emissions (sulphur oxide) | (ktonnes SO2 eq) | 28.05 | 23.07 | 16.99 | |||||||
| NOx emissions (nitrogen oxide) | (ktonnes NO2 eq) | 7.96 | 6.74 | 5.87 | |||||||
| Water consumption rate (refineries)/refinery throughputs | (cm/tonnes) | 28.36 | 30.98 | 25.33 | |||||||
| Biofuels marketed | (mmtonnes) | 17.79 | 13.26 | 14.83 | |||||||
| Customer satisfaction index | (likert scale) | 7.84 | 7.74 | 7.90 | |||||||
(a) Before elimination of intragroup sales.
2012 Highlights
| Performance of the year > The injury frequency rates decreased from 2011 (down 45% for employees and 27.7% for contractors). > In 2012 the trend in GHG, NOx and SOx, emissions continued to decline, benefiting from energy saving measures and increasing use of natural gas to replace fuel oil. > The 2012 scenario was weighted down by a steep fall in fuel demand in Italy and continued deteriorating fundamentals in the refining activity. Against this backdrop, Eni’s Refining & Marketing Division managed to reduce adjusted operating loss by euro 85 million from 2011 (down euro 179 million) due to better operating performances and improved efficiency at | our operated refineries. Results posted by the Marketing activity were impacted by falling demand, high competitive pressure and increased expenses associated with certain marketing initiatives including a special discount on prices at the pump during the summer week-ends. > In 2012 refining throughputs were 30.01 mmtonnes, down 6.1% from 2011. In Italy, processed volumes decreased (down 7.8%) due to the anticipation of scheduled standstills in order to mitigate the negative impact of the trading environment mainly at the Taranto and Gela refineries. Outside Italy, Eni’s refining throughputs increased by 3.2% in particular in the Czech Republic. | > Retail sales in Italy of 7.83 mmtonnes decreased by 6.3% from 2011. This decline was driven by sharply lower consumption of gasoil and gasoline in Italy (down 8.3% from 2011) and increased competitive pressure. In 2012 Eni’s average retail market share was 31.2% increasing by 0.7 percentage points from 2011 benefiting from the commercial initiatives made in the third quarter of 2012. > Retail sales in the rest of Europe of 3.04 mmtonnes improved slightly from 2011 (up 1%). Volume additions in Austria and Switzerland, reflecting successful commercial initiatives were offset by lower sales in Eastern Europe due to declining demand. |
- 20 -
Contents
Eni in 2012 Business review / Refining & Marketing
| Strategies Eni’s Refining & Marketing segment engages in the supply of crude oil, refining and marketing of refined products, trading and shipping of crude oil and refined products primarily in Italy and in Central-Eastern Europe. In Italy, Eni is the largest refining and marketing operator in terms of capacity and market share. The Company’s operations are fully integrated through refining, supply, trading, logistics and marketing so as to maximize cost efficiencies and effectiveness of operations. | meaningful improvement in the trading environment. The ongoing economic downturn is anticipated to weigh on a recovery in demand and in refining margins. On the supply side, we see that capacity rationalization is progressing as 11 refineries have shut down in Europe eliminating 1.4 mmboe/d of processing capacity and we believe that a further 15 refineries could potentially close in coming years. However, we assume that the trading environment will not get any benefits from the current rationalization process at least over the short to the medium-term. Retail and wholesale marketing activities of refined products will be affected by sluggish demand and product oversupply that is expected to trigger pricing competition. Our priority in the Refining & Marketing segment remains to restore profitability and improve the cash generation against the backdrop of weak industry fundamentals. Our strategic guidelines are: • to intensify cost reduction initiatives, energy saving and optimization of plant operations, in order to drive margin expansions; | • to make selective capital expenditure projects; • to enhance profitability at our marketing operations through a number of initiatives for improving service quality and client retention and non-oil profit contribution; • to grow selectively in target European markets and divest marginal assets. In the four year period, management plans to implement selective capital projects for upgrading refinery complexity and modernizing the retail network for a total amount of euro 2.4 billion. Approximately euro 1.7 billion is expected to be employed to convert the Venice plant into a bio-refinery, upgrade the Company’s best refineries and improving plant efficiency and reliability. Retail activities will attract some 25% of the planned expenditure which will be mainly directed to upgrade and modernize our service stations in Italy and in selected European Countries, and to complete the network rebranding. Based on these actions, management expects the Refining & Marketing Division to break-even by 2014, assuming the same trading environment as in 2012. |
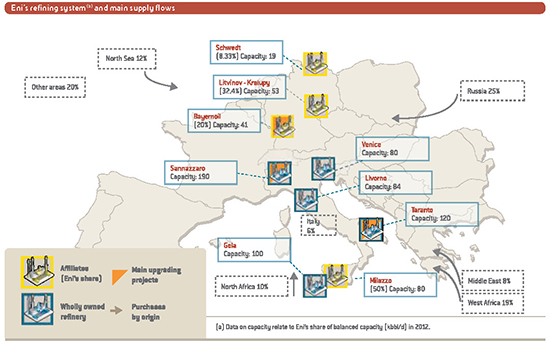
- 21 -
Contents
Eni in 2012 Business review / Refining & Marketing
| Refining > Planned actions > Our assets ITALY | Western Italy and Switzerland. The high flexibility and conversion capacity of this refinery allows it to process a wide range of feedstock. From a logistical standpoint this refinery is located along the route of the Central Europe Pipeline, which links the Genoa terminal with French speaking Switzerland. This refinery contains two primary distillation plants and relevant facilities, including three desulphurization units. Conversion is obtained through a fluid catalytic cracker (FCC), two hydrocrackers (HdC), and a visbreaking thermal conversion unit with a gasification facility loaded with heavy residue from visbreaking unit (tar) to produce syn-gas to feed the nearby EniPower power plant at Ferrera Erbognone. The most important ongoing project is a conversion unit based on the EST (Eni Slurry Technology) proprietary technology which targets the full upgrading of the heavy and extra-heavy barrel. Start-up of this facility is scheduled by 2013. As part of this initiative, Eni is developing the Slurry Dual Catalyst (an evolution of EST), based on a combination of two nano-catalysts, which could lead to a relevant breakthrough in the EST process, increasing its productivity and improving product quality. Another strategic process is the development of a process for hydrogen production, Hydrogen SCT-CPO (Short Contact Time-Catalytic Partial Oxidation) whose design is nearly completed. This reforming technology aims at transforming gaseous and liquid hydrocarbons (also derived from bio-mass) into synthetic gas (carbon monoxide and hydrogen) at competitive costs. Taranto refinery has balanced refining capacity of 120 kbbl/d and a conversion index of 72%. This refinery process most of oil produced in Eni’s Val d’Agri fields carried to Taranto through the Monte Alpi pipeline (in 2012 a total of 2.26 mmtonnes of this oil was processed). It principally produces fuels for automotive use and residential heating purposes for the Southern Italian markets. The complexity is achieved through a Residue Hydroconversion Unit (RHU) - Hydrocracking process and a "Two Stage" Visbreaking-Thermal Cracking unit. Gela refinery has balanced refining capacity of 100 kbbl/d and a conversion index of 142%. Located on the Southern coast of Sicily, it is integrated with upstream operations processing heavy crude produced from Eni’s nearby offshore and onshore fields. Its high conversion level is ensured by an FCC unit with go-finer for feedstocks upgrading and two coking plants enabling conversion of | heavy residues topping or vacuum residues. In order to achieve full compliance with the tightest environmental standards, in the power station there is SNOx plant to remove suphur dioxide, nitrogen oxides and particulates from flue gases. An underway refurbishment of the Gela power plant, substantially renewing pet-coke boilers, will increase profitability maximizing synergies from refining and power generation. OUTSIDE ITALY > Operational efficiency and Logistics Eni is a primary operator in storage and transport of petroleum products in Italy with its logistical integrated infrastructure consisting of 20 directly managed storage sites and a network of petroleum product pipelines for products sale and storage of LPG and crude. Located in the Vado Ligure-Genova (Petrolig), Arquata Scrivia (Sigemi), Venice (Petroven), Ravenna (Petra) and Trieste (DCT) sites, they reduce logistic costs, and increase efficiency. |
- 22 -
Contents
Eni in 2012 Business review / Refining & Marketing
| Marketing Eni is the leader in the retail marketing of refined products in Italy with a 31.2% market share, marketing a wide range of refined petroleum products, through an extensive network of operated service stations, franchises and other distribution systems. In 2012, 2,300 of Eni service stations were re-branded to the "eni brand". We plan to complete this activity by the end of 2013. In spite of a weak domestic demand for fuels and rising competition, management plans to preserve the market share achieved in 2012 (31.2%). We expect that effective marketing campaigns, development of the non-oil offering and continuous network upgrading will underpin our market share and client retention. In 2012, retail sales in Italy were 7.79 mmtonnes, down 6.5% driven by lower consumption of fuel and gasoline, in particular at highway service stations related to the decline in freight transportation. At December 31, 2012, Eni’s retail network in Italy consisted of 4,780 service stations, 79 more than at December 31, 2011.
|
| |||
| Co-marketing During the summer months of 2012, Eni launched a number of co-marketing promotions implemented with important partners, such as Coop, Vodafone and Despar, mainly targeting Italian households. This has been achieved by offering | significant discounts on primary goods and services. Eni has made an important step to get closer to its customers and will continue to do so also during the second half of 2013 with other co-marketing activities with major national and international brands. | |||
| ||||
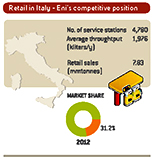


- 23 -
Contents
Eni in 2012 Business review / Refining & Marketing
| > Retail – outside Italy Eni’s strategy in the rest of Europe is focused on selectively growing its market share, particularly in Germany, Austria and Eastern Europe (e.g. Czech Republic) leveraging on the synergies ensured by the proximity of these markets to Eni’s production and logistic facilities. In 2012, retail sales of refined products marketed in the rest of Europe (3.04 mmtonnes) were basically stable (up 1%). Volume additions in Austria and Switzerland reflecting successful commercial policies were almost completely offset by lower sales in Eastern Europe due to declining demand. At December 31, 2012, Eni’s retail network in the rest of Europe consisted of 1,604 service stations, an increase of 18 units from December 31, 2011. The key markets of Eni’s presence are: Austria with a 11.7% market share, Hungary with 11.9%, Czech Republic with 10.8%, Slovakia with 9.7%, Switzerland with 7.1% and Germany with a 3.2% on national basis. > Non-oil | > Wholesale and other businesses Fuels Eni markets gasoline and other fuels on the wholesale market in Italy, including diesel fuel for automotive use and for heating purposes, for agricultural vehicles and for vessels and fuel oil. Major customers are resellers, agricultural users, manufacturing industries, public utilities and transports, as well as final users (transporters, condominiums, farmers, fishers, etc.). Eni provides its customers with its expertise in the area of fuels with a wide range of products that cover all market requirements. Along with traditional products provided with the Eni high quality standard, there is also an innovative low environmental impact line, which includes AdvanceDiesel especially targeted for heavy duty public and private transports. Customer care and product distribution is supported by a widespread commercial and logistical organization present all over Italy and articulated in local marketing offices and a network of agents and concessionaires. In 2012, sales volumes on wholesale markets in Italy (8.62 mmtonnes) declined by approximately 740 ktonnes, down 7.9%, mainly due to declining sales of gasoline and gasoil related to lower demand from transports and industrial customers due to a generalized slowdown and lower jet fuel sales related to declining demand. LPG | Lubricants Eni operates six (owned and co-owned) blending plants, in Italy, Europe, North and South America, Africa and the Far East. With a wide range of products composed of over 650 different blends Eni masters international state-of-art know-how for the formulation of products for vehicles (engine oil, special fluids and transmission oils) and industries (lubricants for hydraulic systems, industrial machinery and metal processing). In Italy, Eni is leader in the manufacture and sale of lubricant bases. In 2012, retail and wholesale sales in Italy amounted to 96 ktonnes with a 24.3% market share. Oxygenates |
- 24 -
Contents
Eni in 2012 Business review / Chemicals
![]()
Key performance indicators |
2010 | 2011 | 2012 | ||||||
| Employees injury frequency rate | (No. of accidents per million of worked hours) | 1.54 | 1.47 | 0.76 | |||||||
| Contractors injury frequency rate | 5.94 | 4.60 | 1.66 | ||||||||
| Net sales from operations (a) | (euro million) | 6,141 | 6,491 | 6,418 | |||||||
| Intermediates | 2,833 | 2,987 | 3,110 | ||||||||
| Polymers | 3,126 | 3,299 | 3,128 | ||||||||
| Other sales | 182 | 205 | 180 | ||||||||
| Operating profit | (86 | ) | (424 | ) | (683 | ) | |||||
| Adjusted operating profit | (96 | ) | (273 | ) | (485 | ) | |||||
| Adjusted net profit | (73 | ) | (206 | ) | (395 | ) | |||||
| Capital expenditure | 251 | 216 | 172 | ||||||||
| Production | (ktonnes) | 7,220 | 6,245 | 6,090 | |||||||
| Sales of petrochemical products | 4,731 | 4,040 | 3,953 | ||||||||
| Average plant utilization rate | (%) | 72.9 | 65.3 | 66.7 | |||||||
| Employees at year end | (units) | 5,972 | 5,804 | 5,668 | |||||||
| Direct GHG emissions | (mmtonnes CO2 eq) | 4.69 | 4.12 | 3.69 | |||||||
| NMVOC (Non-Methane Volatile Organic Compound) emissions | (ktonnes) | 4.71 | 4.18 | 4.40 | |||||||
| SOx emissions (sulphur oxide) | (ktonnes SO2 eq) | 3.30 | 3.17 | 2.19 | |||||||
| NOx emissions (nitrogen oxide) | (ktonnes NO2 eq) | 4.87 | 4.14 | 3.43 | |||||||
| Recycled/reused water | (%) | 82.7 | 81.8 | 81.5 | |||||||
(a) Before elimination of intragroup sales.
2012 Highlights
| Performance of the year > In 2012 the employees and contractors injury frequency rates continued to follow the positive trends of previous years (down 48.3% and 63.9%, respectively). > In 2012 emissions of greenhouse gases, NOx and SOx decreased due to energy saving. > In 2012 the sector reported sharply higher operating losses at euro 395 million (down euro 189 million from 2011), due to weak trends in demand reflecting the economic downturn and falling unit margins. > Sales of petrochemical products were 3,953 ktonnes, down 87 ktonnes, or 2.1% from 2011, due to declining consumption. > Petrochemical production volumes were 6,090 ktonnes, decreasing by 155 ktonnes, down 2.48%, due a steep decline in demand for petrochemical products in all businesses, in particular the steepest decline was reported in polyethylene. | > In 2012 overall expenditure in R&D amounted to approximately euro 38 million in line with the previous year. A total of new 18 patent applications were filed, including one in collaboration with our Exploration & Production Division. Expansion in international markets Bio-based chemicals | company, signed a strategic partnership to manufacture guayule-based bio-rubber materials in a production complex in Southern Europe. The partnership will cover the entire manufacturing chain. Versalis will produce high-margin materials for consumer and medical specialty markets. The investment will include an ambitious research project to develop technologies targeting the tire industry. In June 2012, a Memorandum of Understanding was signed with Genomatica and Novamont to establish a technological joint venture in Italy aimed at developing a new technology for the production of butadiene from renewable feedstock. This joint venture will also hold exclusive rights for the industrial application of the research results, including licensing it to third parties. |
- 25 -
Contents
Eni in 2012 Business review / Chemicals
| Strategies The chemical industry is subject to fluctuations in demand in response to macroeconomic cycles, leading to volatile results of operations and cash flow. It is a highly competitive industry due to lack of entry barriers, product commoditization and excess capacity, which may exacerbate the impact of any demand downturns on the results reported by Eni’s Chemical business. Eni’s chemical operations have been facing increasing competition from Asian companies and the petrochemical arm of national oil companies based in the Middle East which can leverage on long-term competitive advantages in terms of lower operating costs and cheaper feedstock costs. Management also expects that US-based petrochemical companies will regain competitiveness in the medium term leveraging on the large domestic availability of raw materials which can be extracted from shale gas. Based on these initiatives, management expects chemical operations to break-even in the next four-year period. Business areas > Intermediates Intermediate revenues (euro 3,110 million) increased by euro 123 million from 2011 (up |
| |||
| 4%) due to the positive performance of derivatives, reflecting increased sales volumes (up 21%) and average unit prices (up 10%) due to a more dynamic market and product availability. Sales volumes of olefins and aromatics declined (down 2% and 4.5%, respectively) due to the shutdown of the polyethylene line in the Sicilian plants due to their lack of profitability and demand decline. Average unit aromatics prices increased by 12% driven by the price of benzene (up 18.7%). Intermediates production (4,112.5 ktonnes) was in line with last year (up 0.3%). An increase was registered in derivatives (up 12%) for phenol/derivatives and styrene monomer that last year had been affected by the planned facility downtimes at the Mantova plant. Production of olefins and aromatics declined by 2.7% and 5.4%, respectively. > Polymers | characterized by high elasticity that allow them to regain their original shape even after having been subjected to extensive deformation. Versalis has a leading position in this sector and produces a wide range of products for the following sectors: tyres, footwear, adhesives, building components, pipes, electrical cables, car components and sealings, household appliances; they can be used as modifiers for plastics and bitumens, as additives for lubricating oils (solid elastomers); paper coating and saturation, carpet backing, molded foams, adhesives (synthetic latex). Versalis is one of the world’s major producers of elastomers and synthetic latex. Polymer revenues (euro 3,128 million) decreased by euro 171 million from 2011 (down 5.2%) due to decreased sales volumes (down 5.8%) resulting from a steep decline in demand in particular on Italian and European markets, offset in part by slight increases in the markets of Eastern Europe. Unit prices of elastomers declined (down 1.3%) due to lower unit prices for SBR/BR rubbers, affected by the downturn of the automotive industry and of polyethylene (down 0.4%), despite an improvement in the second part of the year. | |||
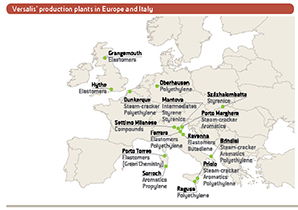
- 26 -
Contents
Eni in 2012 Business review / Engineering & Construction
![]()
Key performance indicators |
2010 | 2011 | 2012 | ||||||
| Employees injury frequency rate | (No. of accidents per million of worked hours) | 0.45 | 0.44 | 0.54 | ||||
| Contractors injury frequency rate | 0.33 | 0.21 | 0.17 | |||||
| Fatality index | (No. of fatalities per 100 million of worked hours) | 2.14 | 1.82 | 0.93 | ||||
| Net sales from operations (a) | (euro million) | 10,581 | 11,834 | 12,771 | ||||
| Operating profit | 1,302 | 1,422 | 1,433 | |||||
| Adjusted operating profit | 1,326 | 1,443 | 1,465 | |||||
| Adjusted net profit | 994 | 1,098 | 1,109 | |||||
| Capital expenditure | 1,552 | 1,090 | 1,011 | |||||
| Orders acquired | (euro million) | 12,935 | 12,505 | 13,391 | ||||
| Order backlog | 20,505 | 20,417 | 19,739 | |||||
| Employees at period end | (units) | 38,826 | 38,561 | 43,387 | ||||
| Employees outside Italy | (%) | 87.3 | 86.5 | 89.2 | ||||
| Local managers | 45.3 | 43.0 | 42.3 | |||||
| Local procurement | 61.3 | 56.4 | 51.8 | |||||
| Healthcare expenditure | (euro thousand) | 19,506 | 32,410 | 21,236 | ||||
| Security expenditure | 26,403 | 50,541 | 81,777 | |||||
| Direct GHG emissions | (mmtonnes CO2 eq) | 1.11 | 1.32 | 1.54 | ||||
(a) Before elimination of intragroup sales.
2012 Highlights
| Performance of the year > The percentage of manager positions covered by local personnel is higher than 40% of total managerial positions, except for France and Italy, reflecting however fluctuations due to he opening of new yards and short-term projects. > The overall amount of procurement was euro 9,584 million, of which euro 7,802 million related to operating projects, 51.8% of which was procured with local suppliers. > In 2012 the employees injury frequency rate worsened from 2011 (by 22.7%) while it improved for contractors by 19%. Saipem continues to strive to mitigate and reduce | accidents and injuries to its employees and contractors by means of training and awareness campaigns, such as the "Working at height", the dedicated HSE training portal and training courses for crane operators. > Safety and environment expenditure increased by 24% from 2011 (from euro 83 million to euro 103 million). > In 2012 the Engineering & Construction sector reported adjusted net profit amounting to euro 1,109 million, in line with 2011 (up 1%). This result reflects the good operating performance recorded mainly in the Drilling businesses deriving from the full operations of Scarabeo 9 and to greater profitability | from the Saipem 10000 vessel, almost totally offset by the decline in performance of the Engineering & Construction business due to falling demand for oilfield services and lower margins at certain works related to the general downturn especially in the second half of the year. > Capital expenditure amounted to euro 1,011 million (euro 1,090 million in 2011) and mainly regarded the upgrading of the drilling and construction fleet. > In 2012 overall expenditure in R&D amounted approximately to euro 15 million in line with 2011. A total of 13 new patent applications were filed. |
| Strategies Through Saipem, a subsidiary listed on the Italian Stock Exchange (Eni’s interest is 42.91%), and Saipem’s controlled entities, Eni engages in engineering and construction, as well as offshore and onshore drilling targeting the oil&gas industry. In those | markets Saipem boasts a strong competitive position, particularly in executing large, complex EPC contracts for the construction of offshore and onshore facilities and systems to develop hydrocarbons reserves as well as LNG, refining and petrochemicals plants, pipeline laying and offshore and onshore drilling services. The Company | owes its market position to technological and operational skills which we believe are acknowledged in the marketplace due to its capabilities to operate in frontier areas and complex ecosystems, efficiently and effectively managing large projects, engineering competencies and availability of technologically-advanced vessels and rigs |
- 27 -
Contents
Eni in 2012 Business review / Engineering & Construction
| which have been upgraded in recent years through a large capital expenditure plan. Management expects to further strengthen Saipem’s competitive position in the medium term, leveraging on its business model articulated across various market sectors combined with a strong competitive position in frontier areas, which are traditionally less exposed to the cyclical nature of this market. Based on those strengths we believe that Saipem will be able to overcome current headwinds due to macroeconomic uncertainties and a margin slowdown that are expected to affect the profitability outlook in 2013. > Engineering & Construction Offshore In 2012 revenues amounted to euro 5,207 million, increasing by 5.5% from 2011, due to higher levels of activity in the Middle and Far East. Orders acquired amounted to euro 7,477 million (euro 6,131 million in 2011) and related to: (i) an EPCI contract with INPEX for the installation of an underwater pipeline 889-kilometer long linking the offshore Ichthys field with the onshore shut-off valves in the area of Darwin, Australia; (ii) an EPCI contract with Lukoil for the installation of two underwater pipelines linking the offshore Vladimir Filanovsky block in the northern area of the Caspian Sea, with the onshore facility between 10-20 | kilometers inland in the Russian Republic of Kalmyk. > Engineering & Construction Onshore In 2012 revenues amounted to euro 5,745 million, increasing by 3.9% from 2011, due to higher levels of activity in the Middle East and North America. Orders acquired amounted to euro 3,972 million (euro 5,006 million in 2011), declining mainly as a result of the cancellation of the Jurassic contract in the third quarter of 2012. Among the main orders acquired were: (i)a turn-key contract for Shell concerning the SSAGS (Southern Swamp Associated Gas) project concerning the construction of four compression stations and new production facilities for the treatment of collected gas in various areas of the Delta State in Nigeria; (ii) an EPC contract for Saudi Aramco and Sumitomo Chemical for the Naphtha and Aromatics Package (RP2) of the Rabigh II project. > Offshore drilling | companies. In the offshore drilling segment Saipem mainly operates in West Africa, the North Sea, the Mediterranean Sea and the Middle East and boasts significant market positions in the most complex segments of deep and ultra-deep offshore, leveraging on the outstanding technical features of its drilling platforms and vessels, capable of drilling exploration and development wells at a maximum depth of 9,200 meters. In order to better meet industry demands, Saipem is finalizing an upgrading program of its drilling fleet providing it with state-of-art rigs to enhance its role as high quality player capable of operating also in complex and harsh environments. In parallel, investments are ongoing to renew and to keep up the production capacity of other fleet equipment (upgrade equipment to the characteristics of projects or to clients’ needs and purchase of support equipment). In 2012 revenues amounted to euro 1,089 million, increasing by 30.6% from 2011. Revenues deriving from the entry in full activity of the semisubmersible rigs Scarabeo 8 and Scarabeo 9 in 2012 were offset in part by the planned facility downtime of the Scarabeo 3 and Scarabeo 6 semisubmersible rigs. Orders acquired amounted to euro 1,025 million (euro 780 million in 2011), relating mainly to the drilling contract of the Scarabeo 7 operating in Indonesian waters; (ii) the contract of the Perro Negro jack up operating in Italian waters. > Onshore drilling In 2012 revenues amounted to euro 730 million, increasing slightly from 2011. |
- 28 -
Contents

- 29 -
Contents
Eni in 2012 Group results for the year
Group results for the year
| Trading environment Eni’s results of operations and the year-to-year comparability of its financial results are affected by a number of external factors which exist in the industry environment, including changes in oil, natural gas and refined products prices, industry-wide movements in refining and petrochemical margins and fluctuations in exchange rates and interest rates. Changes in weather conditions from year to year can influence demand for natural gas and some petroleum products, thus affecting results of operations of the natural gas business and, to a lesser extent, of the refining and marketing business. 2012 Group results were achieved in a trading environment characterized by a marker Brent price of $111.58 per barrel, almost in line with 2011. The gas market was influenced by weak demand as a consequence of the European economic slowdown and strong competition fuelled by oversupplies. In spite of a 5% rise in European spot prices gas margins were | squeezed by higher oil-linked supply costs. Refining margins showed a recovery from the depressed levels registered a year ago (the benchmark margin on Brent crude averaged $4.83 per barrel, up $2.77 per barrel). However the absolute size of margins remained in unprofitable territory due to the volatility in the trading environment and weak fuel demand on the back of the economic downturn, excess capacity and high cost of oil feedstock and oil-linked energy utilities. Furthermore, Eni’s complex refineries were impacted by narrowing price differentials between light and heavy crudes. Results for the year were helped by the appreciation of the US dollar over the euro (up 7.7%). 2012 results In 2012, net profit attributable to Eni’s shareholders from continuing operations was euro 4,198 million, a decrease of euro 2,704 million, down by 39.2% from 2011. The result was negatively impacted by a lower operating profit, down by euro 1,777 million driven by the recognition of impairment losses of euro 4,029 million (euro 1,031 million in | 2011) which were mainly incurred in the gas marketing and refining businesses due to a reduced profitability outlook on the back of the ongoing European downturn. In addition, net profit reflected increased income taxes (up by euro 1,756 million) due to higher taxable income reported by the Exploration & Production Division, subject to higher tax rates, and a write-down of euro 1,030 million recognized at deferred tax assets of Italian subsidiaries. On a positive side, net profit for the year reflected higher net profit from investments (up by euro 758 million) mainly due to gains from the disposal of part of Eni’s interest in Galp and other Galp-related transactions. Net profit from discontinued operations included results of Snam until loss of control by Eni and the gains recorded both on the divestment of about 30% of Snam to Cassa Depositi e Prestiti for an amount of euro 2,019 million and the fair value revaluation at the residual interest based on current market prices for euro 1,451 million. Adjusted net profit attributable to Eni’s shareholders including results from discontinued operations amounted to euro 7,788 million, an increase of euro 928 million (up 13.5% from 2011). |

- 30 -
Contents
Eni in 2012 Group results for the year
| Results for the year (euro million) |
| 2010 | 2011 | 2012 | Change | % Ch. | |||||||||||
| 6,252 | Net profit attributable to Eni’s shareholders - continuing operations | 6,902 | 4,198 | (2,704 | ) | (39.2 | ) | ||||||||
| (610 | ) | Exclusion of inventory holding (gains) losses | (724 | ) | (23 | ) | |||||||||
| 1,128 | Exclusion of special items | 760 | 2,953 | ||||||||||||
| of which: | |||||||||||||||
| (246 | ) | - non-recurring items | 69 | ||||||||||||
| 1,374 | - other special items | 691 | 2,953 | ||||||||||||
| 6,770 | Adjusted net profit attributable to Eni’s shareholders - continuing operations (a) | 6,938 | 7,128 | 190 | 2.7 | ||||||||||
(a) For a detailed explanation of adjusted operating profit and net profit see paragraph "Reconciliation of reported operating and net profit to results on an adjusted basis".
| Special charges in operating profit from continuing operations of euro 4,744 million mainly related to: (i) impairment losses of euro 4,029 million relating to goodwill and other tangible and intangible assets in the gas marketing and the refining businesses. In performing the impairment review, management assumed a reduced profitability outlook in those businesses driven by a deteriorating European macroeconomic environment, volatility in commodity prices and margins, and rising competitive pressures. Other impairment losses were incurred at a number of oil&gas properties in the Exploration & Production Division reflecting downward reserve revisions and a changed pricing environment, as well as marginal lines of business in the Chemical segment due to lack of profitability perspectives; | (ii) extraordinary expenses and risk provisions of euro 945 million incurred in connection with price revisions at long-term gas purchase contracts which were presented as special items given the contractual time span for price revisions expired in previous periods and relating to gas volumes purchased in previous reporting periods, including the one related to the settlement of an arbitration proceeding with GasTerra; (iii) a gain on the divestment of a 10% interest in the Karachaganak project to the Kazakh partner KazMunaiGas as part of the settlement agreement (euro 343 million). Special items in net profit included: | fair value through profit, following the loss of significant influence over the investee (euro 865 million) as well as a gain recognized through profit on occasion of a capital increase made by Galp’s subsidiary Petrogal which was subscribed by a new partner (euro 835 million); (ii) a portion of the write-down incurred at Italian subsidiaries’ deferred tax assets (euro 800 million out of a global write-down of euro 1,030 million) which was driven by a lower likelihood of recoverability due to an expected reduction in taxable income generated in Italy, and as Eni has lost the availability of Snam taxable profit against which Italian tax assets can be utilized following the deconsolidation of Snam. The breakdown of adjusted net profit by Division is shown in the table below: |
| Adjusted net profit by Division (euro million) |
| 2010 | 2011 | 2012 | Change | % Ch. | |||||||||||
| 5,609 | Exploration & Production | 6,865 | 7,425 | 560 | 8.2 | ||||||||||
| 1,267 | Gas & Power | 252 | 473 | 221 | 87.7 | ||||||||||
| (56 | ) | Refining & Marketing | (264 | ) | (179 | ) | 85 | 32.2 | |||||||
| (73 | ) | Chemicals | (206 | ) | (395 | ) | (189 | ) | (91.7 | ) | |||||
| 994 | Engineering & Construction | 1,098 | 1,109 | 11 | 1.0 | ||||||||||
| (216 | ) | Other activities | (225 | ) | (247 | ) | (22 | ) | (9.8 | ) | |||||
| (867 | ) | Corporate and financial companies | (753 | ) | (976 | ) | (223 | ) | (29.6 | ) | |||||
| 1,124 | Impact of unrealized intragroup profit elimination (a) | 1,146 | 661 | (485 | ) | ||||||||||
| 7,782 | Adjusted net profit - continuing operations | 7,913 | 7,871 | (42 | ) | (0.5 | ) | ||||||||
| of which attributable to: | |||||||||||||||
| 1,012 | - Non-controlling interest | 975 | 743 | (232 | ) | (23.8 | ) | ||||||||
| 6,770 | - Eni’s shareholders | 6,938 | 7,128 | 190 | 2.7 | ||||||||||
(a) This item concerned mainly intragroup sales of commodities, services and capital goods recorded in the assets of the purchasing business segment as of end period.
| > Capital expenditure In 2012, capital expenditure of continuing operations amounted to euro 12,761 million, mainly relating to: • development activities deployed mainly in Norway, the United States, Congo, | Italy, Kazakhstan, Angola and Algeria, and exploratory activities of which 98% was spent outside Italy, primarily in Mozambique, Liberia, Ghana, Indonesia, Nigeria, Angola and Australia; • upgrading of the Engineering & Construction | fleet of vessels and rigs (euro 1,011 million); • projects designed to improve the conversion rate and flexibility of refineries (euro 622 million), in particular at the Sannazzaro refinery, as well as upgrading and rebranding of the refined product retail network (euro 220 million). |
- 31 -
Contents
Eni in 2012 Group results for the year
| Capital expenditure by Division (euro million) |
| 2010 | 2011 | 2012 | Change | % Ch. | |||||||||||
| 9,690 | Exploration & Production | 9,435 | 10,307 | 872 | 9.2 | ||||||||||
| 265 | Gas & Power | 192 | 225 | 33 | 17.2 | ||||||||||
| 711 | Refining & Marketing | 866 | 842 | (24 | ) | (2.8 | ) | ||||||||
| 251 | Chemicals | 216 | 172 | (44 | ) | (20.4 | ) | ||||||||
| 1,552 | Engineering & Construction | 1,090 | 1,011 | (79 | ) | (7.2 | ) | ||||||||
| 22 | Other activities | 10 | 14 | 4 | .. | ||||||||||
| 109 | Corporate and financial companies | 128 | 152 | 24 | 18.8 | ||||||||||
| (150 | ) | Impact of unrealized intragroup profit elimination | (28 | ) | 38 | 66 | |||||||||
| 12,450 | Capital expenditure - continuing operations | 11,909 | 12,761 | 852 | 7.2 | ||||||||||
| 1,420 | Capital expenditure - discontinued operations | 1,529 | 756 | (773 | ) | (50.6 | ) | ||||||||
| 13,870 | Capital expenditure | 13,438 | 13,517 | 79 | 0.6 | ||||||||||
| > Sources and uses of cash The Company’s cash requirements for capital expenditure, dividends to shareholders, and working capital were financed by a combination of funds generated from operations, borrowings and divestments. Net cash provided by operating activities of continuing operations (euro 12,356 million) and proceeds from disposals of euro 6,014 million funded cash outflows relating to capital expenditure totaling euro 12,761 million and investments (euro 569 million) relating to the acquisition of Nuon in Belgium and joint venture projects, as well as dividend payments amounting to euro 4,379 million (of which euro 1,956 million relating to the 2012 interim dividend and euro 1,884 million to the balance dividend for fiscal year 2011 to Eni’s shareholders and the remaining part related to other dividend payments to non-controlling interests). Disposals of assets mainly regarded the divestment of a 30% interest less one share in Snam to Cassa Depositi e Prestiti (euro 3,517 million), two tranches of the interest in Galp for an overall amount of euro 963 million (a 5% interest sold to Amorim BV and a 4% sold through an accelerated book-building procedure), a 10% interest in the Karachaganak field (approximately euro 500 million) and other non-strategic assets in the Exploration & Production Division (euro 695 million). The proceeds on the divestment of a 5% interest in Snam before loss of control to institutional investors (euro 612 million) were recognized as an equity transaction. > Capital structure and ratios | that this improved financial position is consistent with the Company’s new business profile, which features greater exposure to the Exploration & Production segment. For planning purposes, management projected the Company’s expected cash flows assuming a scenario of Brent prices at 90 $/bbl for the years 2013-2016 to assess the financial compatibility of its capital expenditure programs and dividend policy with internal targets of ratio of total equity to net borrowing. Under that assumption, in 2013, the ratio of net borrowings to total equity is projected to be substantially in line with the level achieved at the end of 2012, due to cash flows from operations and portfolio management. Going forward, management currently expects to maintain this ratio within a target range of 0.1-0.3. This range will allow us to absorb temporary fluctuations in oil prices, the market environment and business results. The projected future cash flows from operations are estimated to fully fund capital expenditure plans. Furthermore management expects to deliver more than euro 10 billion of additional cash flows from asset disposal, mainly the divestment of the residual interest of Eni in Snam and Galp, the announced divestment of the 28.57% interest in Eni East Africa and other marginal assets in the Exploration & Production segment. Our cash flow projections are based on our Brent scenario of 90 $/bbl flat in the next four years. We note that Brent price in the period January 1 to March 28, 2013 was 112.60 $/bbl on average. We estimated that our cash flow from operations may improve by around euro 120 million for each dollar increase in Brent prices on a yearly basis. > Returning cash to shareholders | as an interim dividend with the balance of euro 0.54 per share expected to be paid in late May 2013. The dividend for fiscal year 2012 represents an increase of 4% compared to the 2011 dividend. Management has adopted a new dividend policy which contemplates a progressive, growing dividend at a rate which is expected to be determined year-to-year taking into account Eni’s underlying earnings and cash flow growth as well as capital expenditure requirements and the targeted financial structure. Management will also evaluate the achievement of the targeted production levels in the Exploration & Production segment, the status of renegotiations at long-term gas supply contracts in the Gas & Power segment and the delivery on efficiency gains in the downstream businesses. Management also plans to return cash to shareholders by means of a new flexible buy-back program, which has been authorized by the Shareholders’ Meeting for a total amount of euro 6 billion. The buy-back will be activated at management’s sole discretion and when a number of conditions are met. These include, but are not limited to, a level of leverage which management assesses to be sound enough given market conditions and well within our target range limit of 0.3, and full funding of capital expenditure requirements and dividends throughout the plan period. In 2013, management would consider the activation of the buyback program, provided oil prices remain at current levels and Eni makes good progress on its business and cash flow targets. Outlook for 2013 Management expects an uncertain macroeconomic outlook in 2013, particularly in the Euro-zone where businesses and households are cautious about investments |
- 32 -
Contents
Eni in 2012 Group results for the year
| and consumption decisions. We expect that a number of factors will support the price of crude oil including ongoing geopolitical risks as well as an improved balance between world demand and supplies of crude oil. For investment evaluation purposes and short-term financial projections, Eni assumes a full-year average price of $90 a barrel for the Brent crude benchmark. Management expects continuing weak conditions in the European gas, refining and marketing of fuels and chemical sectors. Demand for energy commodities is anticipated to remain sluggish due to the ongoing economic stagnation; unit margins are exposed to competitive pressures and the risk of new increases in the costs of oil-based raw materials in an extremely volatile environment. In this scenario, the recovery of profitability in the Gas & Power, Refining & Marketing and Chemical segments will depend greatly on management actions to optimize operations and improve the cost position. Management expects that year-on-year comparability of results from continuing operations in 2013 will be affected by the fact that in 2012 Snam margins on intra-group transactions relating to the supply of gas transport and other services have been eliminated upon consolidation, while in 2013 those transactions will be accounted as third-party transactions, thus affecting the Group operating costs and profits. Financial risk factors > Market risk and sensitivity | at which the prices of finished products adjust to reflect changes in crude oil prices. In addition, the Group’s activities are, to various degrees, sensitive to fluctuations in the euro/$ exchange rate as commodities are generally priced internationally in US dollars or linked to dollar denominated products as in the case of gas prices. Overall, an appreciation of the euro against the dollar reduces the Group’s results from operations and liquidity, and vice versa. As part of its financing and cash management activities, the Company uses derivative instruments to manage its exposure to changes in interest rates and foreign exchange rates. These instruments are principally interest rate and currency swaps. The Company also enters into commodity derivatives as part of its ordinary commercial, trading activities and risk management and optimization activities as well as, from time to time, to hedge the exposure to variability in future cash flows due to movements in commodity prices, in view of pursuing acquisitions of oil and gas reserves as part of the Company’s ordinary asset portfolio management or other strategic initiatives. Due to a changed competitive environment in the European gas market and also considering the development of highly liquid spot markets for gas and volatile gas margins, management has implemented through 2011 new risk management policies and instruments to safeguard the value of the Company’s assets in the gas value chain and to seek to profit from market and trading opportunities. As part of its risk management strategy, the Company actively manages exposure to the commodity risk by entering into commodity derivatives transactions on both financial and physical trading venues targeting different objectives. (i) On one hand, management enters commodity derivative transactions to hedge the risk of variability in future cash flows on already contracted or highly probable future sales exposed to commodity risk depending on the circumstance that costs of supplies may be indexed to different market and oil benchmarks compared to the indexing of selling prices. Management has been implementing tight correlation between such commodity derivatives transactions and underlying physical contracts in order to account for those derivatives in accordance with hedging accounting in compliance with IAS 39, where possible; and (ii) on the other hand, management | enters purchase/sale commodity contracts for speculative purposes in order to alter the risk profile associated with a portfolio of assets (purchase contracts, transport entitlements, storage capacity) or leverage any price differences in the marketplace, seeking to increase margins on existing assets in case of favorable trends in the commodity pricing environment or seeking a potential profit based on expectations of future trends in prices. These contracts may lead to gains as well as losses, which, in each case, may be significant. Those derivatives will be accounted through profit and loss, resulting in higher volatility in the gas business operating profit. These trading activities are executed within limits set by internal policies and guidelines that define the maximum tolerable level of market risk. Furthermore the Company intends to optimize the value of its assets (gas supply contracts, storage sites, transportation rights, customer base, and market position) by effectively managing the flexibilities associated with them. This can be achieved through strategies of asset-backed trading where the underlying items are represented by the Company’s assets. We believe that the risk associated with asset backed trading activities is mitigated by the natural hedge granted by the assets availability. In 2012, Eni’s risk management activities helped reduce the Group exposure to the commodity risk. Furthermore trading activities including asset-backed activities reported a positive contribution to the Group results of operations. We are planning to expand those trading activities both in the Gas & Power and the Refining & Marketing businesses. In fact, in 2012 the Company started a reorganization to integrate the supply activities of the Gas & Power and Refining & Marketing segments together with our trading, risk management and the wholesale activities of gas and LNG. This integration will allow us to capture opportunities from market trends and synergies in commodity risk management. > Liquidity and counterparty risks |
- 33 -
Contents
Eni in 2012 Group results for the year
| expenses to meet its obligations or, under the worst conditions, the inability of the Company to continue as a going concern. As part of its financial planning process, Eni manages the liquidity risk by targeting such a capital structure as to allow the Company to maintain a level of liquidity adequate to the Group’s needs, optimizing the opportunity cost of maintaining liquidity reserves also achieving an efficient balance in terms of maturity and composition of finance debt. The Group capital structure is set according to the Company’s industrial targets and within the limits established by the Company’s Board of Directors who are responsible for prescribing the maximum ratio of debt to total equity and minimum ratio of medium and long-term debt to total debt as well as fixed rate medium and long-term debt to total medium and long-term debt. In spite of ongoing tough credit market conditions resulting in higher spreads to borrowers, the Company has succeeded in maintaining access to a wide range of funding at competitive rates through the capital markets and banks. The actions implemented as part of Eni’s 2012 financial planning have enabled the Group to maintain access to the credit market particularly via the issue of commercial paper also targeting to increase the flexibility of funding facilities. The minimization of liquidity risks is a strategic driver of the next four-year financial plan. In particular in 2012, Eni issued three bonds addressed to institutional investors for a total amount of euro 1.82 billion, all at fixed rate with maturity of approximately 8 years. In November, as part of the divestment process of its interest in Galp, Eni also issued a convertible bond with underlying Galp shares equal to 8% of the share capital of the investee for a total amount of euro 1.03 billion at fixed rate with a maturity of three years. | year, allowing the Company to be financially independent also in case of negative trends in the trading environment; (ii) increase the level of liquidity to face possible extraordinary needs; and (iii) increase the flexibility of the Company’s financial structure considering lingering uncertainties in the credit markets, in a similar way as the policies adopted by the peer group companies and with a view of improving the Company’s financial rating assessment. Cash stock will be available only for short-term operations with a very low risk profile. At present, the Group believes it has access to sufficient funding and has also both committed and uncommitted borrowing facilities to meet currently foreseeable borrowing requirements. Eni has in place a program for the issuance of Euro Medium Term Notes up to euro 15 billion, of which about euro 12.3 billion were drawn as of December 31, 2012. The Group has credit ratings of A and A-1, respectively, for long and short-term debt assigned by Standard & Poor’s and A3 and P-2 assigned by Moody’s; the outlook is negative in both ratings. | the global macroeconomic environment and implement the necessary actions to mitigate such risks, coherently with Company strategies. Credit risk is the potential exposure of the Group to losses in case counterparties fail to perform or pay amounts due. The Group manages differently credit risk depending on whether credit risk arises from exposure to financial counterparties or to customers relating to outstanding receivables. Individual business units and Eni’s corporate financial and accounting units are responsible for managing credit risk arising in the normal course of business. |
- 34 -
Contents
Eni in 2012 Financial information
Financial information
| Summary of significant accounting policies and practices Eni prepares its consolidated financial statements in accordance with the International Financial Reporting Standards (IFRS) issued by the International Accounting Standards Board (IASB) and adopted by the European Union. Differences in certain respects between IFRS as endorsed by the EU and IFRS as issued by IASB are on matters that do not relate to Eni. On this basis, Eni’s financial statements are fully in compliance with IFRS as issued by IASB. The consolidated financial statements of Eni include the accounts of the parent company Eni SpA and of all Italian and foreign significant subsidiaries in which Eni directly or indirectly | holds the majority of voting rights or is otherwise able to exercise control as in the case of "de facto" controlled entities. Control comprises the power to govern the financial and operating policies of the investee so as to obtain benefits from its activities. Immaterial subsidiaries, jointly controlled entities, and other entities in which the Group is in a position to exercise a significant influence through participation in the financial and operating policy decisions of the investee are generally accounted for under the equity method. Revenues from sales of crude oil, natural gas, petroleum and petrochemical products are recognized when the products are delivered and title passes to the customer. Revenue recognition in the Engineering & Construction Division is based on the stage of completion of contracts as measured on the cost-to-cost basis applied to contractual revenues. Eni enters into various derivative financial transactions to manage exposures to certain market risks, including foreign currency exchange rate risks, interest rate risks and commodity risks. Such derivative financial instruments are assets and liabilities recognized at fair value starting on the date on which a derivative contract is entered into and are subsequently re-measured at fair value. Derivatives are designated as hedges when the hedging relationship between the hedged item or transaction and the hedging instrument is highly effective and formally documented. Changes in the fair value of cash flow hedges, hedging exposure to variability in cash flows, are recognized in equity, except for the ineffective portion which is recognized in profit or loss; subsequently amounts taken to equity are transferred to the profit and loss account when the hedged transaction affects profit or loss. Changes in fair value of derivatives held for trading purposes, including derivatives for which the hedging relationship is not formally documented or is ineffective, are recognized in profit or loss. Inventories of crude oil, natural gas and oil products are stated at the lower of purchase | or production cost and net realizable value. Cost is determined by applying the weighted-average cost method. Contract work in progress is recorded on the basis of contractual considerations by reference to the stage of completion of a contract measured on a cost-to-cost basis. Property, plant and equipment is stated at cost less any accumulated depreciation, depletion and amortization charges and impairment losses. Depreciation, depletion and amortization of oil and gas properties (capitalized costs incurred to obtain access to proved reserves and to provide facilities for extracting, gathering and storing oil and gas) is calculated based on the Unit-Of-Production (UOP) method on proved reserves or proved developed reserves. Other property, plant and equipment is depreciated on a straight-line basis over its expected useful life. Exploration costs (costs associated with exploratory activities for oil and gas including geological and geophysical exploration costs and exploratory drilling well expenditures) are capitalized and fully amortized as incurred. Intangible assets are initially stated at cost. Intangible assets having a defined useful life are amortized systematically, based on the straight-line method. Goodwill and intangibles lacking a defined useful life are not amortized but are reviewed periodically for impairment. Impairment of tangible and intangible assets Eni assesses its property, plant and equipment and intangible assets, including goodwill, for impairment whenever events or changes in circumstances indicate that the carrying values of the assets may not be recoverable. Indications of impairment include changes in the Group’s business plans, changes in commodity prices leading to unprofitable performance and, for oil and gas properties, significant downward revisions of estimated proved reserve quantities. The recoverability of an asset or group of assets is assessed by comparing the carrying value with the recoverable amount |
- 35 -
Contents
Eni in 2012 Financial information
| represented by the higher of fair value less costs to sell and value in use. In assessing value in use, the Group makes an estimate of the future cash flows expected to be derived from the use of the asset on the basis of reasonable and documented assumptions that represent the best estimate of the future economic conditions during the remaining useful life of the asset, giving more importance to independent assumptions. Oil, natural gas and petroleum products prices used to quantify the expected future cash flows are estimated based on forward prices prevailing in the marketplace for the first four years of the estimate and management’s long-term planning assumptions thereafter. Future cash flows are discounted at a rate that reflects current market valuation of the time value of money and those specific risks of the asset that are not reflected in the estimation of future cash flows. The Group uses a discount rate that is calculated as the weighted average cost of capital to the Group (WACC), adjusted to reflect specific Country risks of each asset. Asset retirement obligations, that may be incurred for the dismantling and removal of assets and the reclamation of sites, are evaluated estimating the costs to be incurred when the asset is retired. Future estimated costs are discounted if the effect of the time value of money is material. The initial estimate is reviewed periodically to reflect changes in circumstances and other factors surrounding the estimate, including the discount rates. The Company recognizes material provisions for asset retirement | in the upstream business. No significant asset retirement obligations associated with any legal obligations to retire refining, marketing and transportation (downstream) and chemical long-lived assets are generally recognized, as indeterminate settlement dates for the asset retirement prevent estimation of the fair value of the associated asset retirement obligation. Provisions, including environmental liabilities, are recognized when the Group has a current (legal or constructive) obligation as a result of a past event, when it is probable that an outflow of resources embodying economic benefit will be required to settle the obligation, and when the obligation can be reliably estimated. The initial estimate to settle the obligation is discounted when the effect of the time value of money is material. The estimate is reviewed periodically to take account of changes in costs expected to be incurred to settle the obligation and other factors, including changes in the discount rates. Eni is a party to a number of legal proceedings arising in the ordinary course of business. Based on information available to date, and taking into account the existing risk provisions, Eni’s management believes that ongoing litigations will not have a material adverse effect on Eni’s financial position and results of operations. However, there can be no assurance that in the future Eni will not incur material charges in connection with pending litigations as new information becomes available and new developments may occur. For further information about | pending litigations, see Note 34 - Legal proceedings - to the consolidated financial statements of 2012 included in Eni’s Annual Report. The preparation of consolidated financial statements requires the use of estimates and assumptions that affect the reported amounts of assets, liabilities, revenues and expenses. Estimates made are based on complex or subjective judgments, past experience, other assumptions deemed reasonable in consideration of the information available at the time. The accounting policies and areas that require the most significant judgments and estimates to be used in the preparation of consolidated financial statements are in relation to the accounting for oil and natural gas activities, specifically in the determination of proved and proved developed reserves, impairment of fixed assets, intangible assets and goodwill, asset retirement obligations, business combinations, pensions and other post-retirement benefits, recognition of environmental liabilities and recognition of revenues in the engineering and construction business. Although the Company uses its best estimates and judgments, actual results could differ from the estimates and assumptions used. For further information regarding accounting policies and practices, see Note 3 - Summary of significant accounting policies – and Note 5 - Use of accounting estimates – to the consolidated financial statements of 2012 included in Eni’s Annual Report. |
- 36 -
Contents
Eni in 2012 Financial information
| Profit and loss account (euro million) |
| 2010 | 2011 | 2012 | |||||||
| REVENUES | |||||||||
| Net sales from operations | 96,617 | 107,690 | 127,220 | ||||||
| Other income and revenues | 967 | 926 | 1,546 | ||||||
| 97,584 | 108,616 | 128,766 | |||||||
| OPERATING EXPENSES | |||||||||
| Purchases, services and other | 68,774 | 78,795 | 95,363 | ||||||
| - of which non-recurring charge (income) | (246 | ) | 69 | ||||||
| Payroll and related costs | 4,428 | 4,404 | 4,658 | ||||||
| OTHER OPERATING (EXPENSE) INCOME | 131 | 171 | (158 | ) | |||||
| DEPRECIATION, DEPLETION, AMORTIZATION AND IMPAIRMENTS | 9,031 | 8,785 | 13,561 | ||||||
| OPERATING PROFIT | 15,482 | 16,803 | 15,026 | ||||||
| FINANCE INCOME (EXPENSE) | |||||||||
| Finance income | 6,109 | 6,376 | 7,218 | ||||||
| Finance expense | (6,727 | ) | (7,410 | ) | (8,274 | ) | |||
| Derivative financial instruments | (131 | ) | (112 | ) | (251 | ) | |||
| (749 | ) | (1,146 | ) | (1,307 | ) | ||||
| INCOME (EXPENSE) FROM INVESTMENTS | |||||||||
| Share of profit (loss) of equity-accounted investments | 493 | 500 | 278 | ||||||
| Other gain (loss) from investments | 619 | 1,623 | 2,603 | ||||||
| 1,112 | 2,123 | 2,881 | |||||||
| PROFIT BEFORE INCOME TAXES | 15,845 | 17,780 | 16,600 | ||||||
| Income taxes | (8,581 | ) | (9,903 | ) | (11,659 | ) | |||
| Net profit for the year - Continuing operations | 7,264 | 7,877 | 4,941 | ||||||
| Net profit (loss) for the year - Discontinued operations | 119 | (74 | ) | 3,732 | |||||
| Net profit for the year | 7,383 | 7,803 | 8,673 | ||||||
| Attributable to: | |||||||||
| Eni | |||||||||
| - continuing operations | 6,252 | 6,902 | 4,198 | ||||||
| - discontinued operations | 66 | (42 | ) | 3,590 | |||||
| 6,318 | 6,860 | 7,788 | |||||||
| Non-controlling interest | |||||||||
| - continuing operations | 1,012 | 975 | 743 | ||||||
| - discontinued operations | 53 | (32 | ) | 142 | |||||
| 1,065 | 943 | 885 | |||||||
- 37 -
Contents
Eni in 2012 Financial information
| Balance sheet (euro million) |
| Dec. 31, 2011 | Dec. 31, 2012 | |||||
| ASSETS | ||||||
| Current assets | ||||||
| Cash and cash equivalents | 1,500 | 7,765 | ||||
| Other financial assets available for sale | 262 | 235 | ||||
| Trade and other receivables | 24,595 | 28,621 | ||||
| Inventories | 7,575 | 8,496 | ||||
| Current tax assets | 549 | 771 | ||||
| Other current tax assets | 1,388 | 1,230 | ||||
| Other current assets | 2,326 | 1,624 | ||||
| Total current assets | 38,195 | 48,742 | ||||
| Non-current assets | ||||||
| Property, plant and equipment | 73,578 | 63,466 | ||||
| Inventory - compulsory stock | 2,433 | 2,538 | ||||
| Intangible assets | 10,950 | 4,487 | ||||
| Equity-accounted investments | 5,843 | 4,265 | ||||
| Other investments | 399 | 5,085 | ||||
| Other financial assets | 1,578 | 1,229 | ||||
| Deferred tax assets | 5,514 | 4,913 | ||||
| Other non-current receivables | 4,225 | 4,400 | ||||
| Total non-current assets | 104,520 | 90,383 | ||||
| Assets held for sale | 230 | 516 | ||||
| TOTAL ASSETS | 142,945 | 139,641 | ||||
| LIABILITIES AND SHAREHOLDERS’ EQUITY | ||||||
| Current liabilities | ||||||
| Short-term debt | 4,459 | 2,223 | ||||
| Current portion of long-term debt | 2,036 | 2,961 | ||||
| Trade and other payables | 22,912 | 23,581 | ||||
| Income taxes payables | 2,092 | 1,622 | ||||
| Other taxes payables | 1,896 | 2,162 | ||||
| Other current liabilities | 2,237 | 1,437 | ||||
| Total current liabilities | 35,632 | 33,986 | ||||
| Non-current liabilities | ||||||
| Long-term debt | 23,102 | 19,279 | ||||
| Provisions for contingencies | 12,735 | 13,603 | ||||
| Provisions for employee benefits | 1,039 | 982 | ||||
| Deferred tax liabilities | 7,120 | 6,740 | ||||
| Other non-current liabilities | 2,900 | 1,977 | ||||
| Total non-current liabilities | 46,896 | 42,581 | ||||
| Liabilities directly associated with assets held for sale | 24 | 361 | ||||
| TOTAL LIABILITIES | 82,552 | 76,928 | ||||
| SHAREHOLDERS’ EQUITY | ||||||
| Non-controlling interest | 4,921 | 3,514 | ||||
| Eni shareholders’ equity | ||||||
| Share capital | 4,005 | 4,005 | ||||
| Reserves related to cash flow hedging derivatives net of tax effect | 49 | (16 | ) | |||
| Other reserves | 53,195 | 49,579 | ||||
| Treasury shares | (6,753 | ) | (201 | ) | ||
| Interim dividend | (1,884 | ) | (1,956 | ) | ||
| Net profit | 6,860 | 7,788 | ||||
| Total Eni shareholders’ equity | 55,472 | 59,199 | ||||
| TOTAL SHAREHOLDERS’ EQUITY | 60,393 | 62,713 | ||||
| TOTAL LIABILITIES AND SHAREHOLDERS’ EQUITY | 142,945 | 139,641 | ||||
- 38 -
Contents
Eni in 2012 Financial information
| Statements of cash flow (euro million) |
| 2010 | 2011 | 2012 | |||||||
| Net profit of the year - Continuing operations | 7,264 | 7,877 | 4,941 | ||||||
| Adjustments to reconcile net profit to net cash provided by operating activities: | |||||||||
| Depreciation and amortization | 8,343 | 7,755 | 9,538 | ||||||
| Impairments of tangible and intangible assets, net | 688 | 1,030 | 4,023 | ||||||
| Share of (profit) loss of equity-accounted investments | (493 | ) | (500 | ) | (278 | ) | |||
| Gain on disposal of assets, net | (558 | ) | (1,176 | ) | (875 | ) | |||
| Dividend income | (264 | ) | (659 | ) | (431 | ) | |||
| Interest income | (95 | ) | (99 | ) | (108 | ) | |||
| Interest expense | 607 | 773 | 803 | ||||||
| Income taxes | 8,581 | 9,903 | 11,659 | ||||||
| Other changes | (39 | ) | 331 | (1,945 | ) | ||||
| Changes in working capital: | |||||||||
| - inventories | (1,141 | ) | (1,400 | ) | (1,395 | ) | |||
| - trade receivables | (1,923 | ) | 218 | (3,184 | ) | ||||
| - trade payables | 2,811 | 34 | 2,029 | ||||||
| - provisions for contingencies | 575 | 109 | 338 | ||||||
| - other assets and liabilities | (1,480 | ) | (657 | ) | (1,161 | ) | |||
| Cash flow from changes in working capital | (1,158 | ) | (1,696 | ) | (3,373 | ) | |||
| Net change in the provisions for employee benefits | 22 | (10 | ) | 16 | |||||
| Dividends received | 766 | 955 | 988 | ||||||
| Interest received | 124 | 99 | 91 | ||||||
| Interest paid | (630 | ) | (927 | ) | (825 | ) | |||
| Income taxes paid, net of tax receivables received | (9,018 | ) | (9,893 | ) | (11,868 | ) | |||
| Net cash provided by operating activities - Continuing operations | 14,140 | 13,763 | 12,356 | ||||||
| Net cash provided by operating activities - Discontinued operations | 554 | 619 | 15 | ||||||
| Net cash provided by operating activities | 14,694 | 14,382 | 12,371 | ||||||
| Investing activities: | |||||||||
| - tangible assets | (12,308 | ) | (11,658 | ) | (11,222 | ) | |||
| - intangible assets | (1,562 | ) | (1,780 | ) | (2,295 | ) | |||
| - consolidated subsidiaries and businesses | (143 | ) | (115 | ) | (178 | ) | |||
| - investments | (267 | ) | (245 | ) | (391 | ) | |||
| - securities | (50 | ) | (62 | ) | (17 | ) | |||
| - financing receivables | (866 | ) | (715 | ) | (1,634 | ) | |||
| - change in payables and receivables in relation to investing activities and capitalized depreciation | 261 | 379 | 54 | ||||||
| Cash flow from investing activities | (14,935 | ) | (14,196 | ) | (15,683 | ) | |||
| Disposals: | |||||||||
| - tangible assets | 272 | 154 | 1,229 | ||||||
| - intangible assets | 57 | 41 | 61 | ||||||
| - consolidated subsidiaries and businesses | 215 | 1,006 | 3,521 | ||||||
| - investments | 569 | 711 | 1,203 | ||||||
| - securities | 14 | 128 | 52 | ||||||
| - financing receivables | 841 | 695 | 1,578 | ||||||
| - change in payables and receivables in relation to disposals | 2 | 243 | (252 | ) | |||||
| Cash flow from disposals | 1,970 | 2,978 | 7,392 | ||||||
| Net cash used in investing activities | (12,965 | ) | (11,218 | ) | (8,291 | ) | |||
| Proceeds from long-term debt | 2,953 | 4,474 | 10,484 | ||||||
| Repayments of long-term debt | (3,327 | ) | (889 | ) | (3,784 | ) | |||
| Increase (decrease) in short-term debt | 2,646 | (2,481 | ) | (753 | ) | ||||
| 2,272 | 1,104 | 5,947 | |||||||
| Net capital contributions by non-controlling interest | 26 | ||||||||
| Sale of treasury shares | 3 | ||||||||
| Net acquisition of treasury shares different from Eni SpA | 37 | 17 | 29 | ||||||
| Acquisition of additional interests in consolidated subsidiaries | (126 | ) | 604 | ||||||
| Dividends paid to Eni’s shareholders | (3,622 | ) | (3,695 | ) | (3,840 | ) | |||
| Dividends paid to non-controlling interest | (514 | ) | (552 | ) | (539 | ) | |||
| Net cash used in financing activities | (1,827 | ) | (3,223 | ) | 2,201 | ||||
| Effect of change in consolidation (inclusion/exclusion of significant/insignificant subsidiaries) | (7 | ) | (4 | ) | |||||
| Effect of exchange rate changes on cash and cash equivalents and other changes | 39 | 17 | (12 | ) | |||||
| Net cash flow of the year | (59 | ) | (49 | ) | 6,265 | ||||
| Cash and cash equivalents - beginning of the year | 1,608 | 1,549 | 1,500 | ||||||
| Cash and cash equivalents - end of the year | 1,549 | 1,500 | 7,765 | ||||||
- 39 -
Contents
Eni in 2012 Financial information
| Non-GAAP measures > Reconciliation of reported operating profit and reported net profit to results on an adjusted basis | and translation of commercial payables and receivables. Accordingly also currency translation effects recorded through profit and loss are reported within business segments’ adjusted operating profit. The taxation effect of the items excluded from adjusted operating or net profit is determined based on the specific rate of taxes applicable to each of them. The Italian statutory tax rate is applied to finance charges and income (38% is applied to charges recorded by companies in the energy sector, whilst a tax rate of 27.5% is applied to all other companies). Adjusted operating profit and adjusted net profit are non-GAAP financial measures under either IFRS or US GAAP. Management includes them in order to facilitate a comparison of base business performance across periods, and to allow financial analysts to evaluate Eni’s trading performance on the basis of their forecasting models. The following | is a description of items that are excluded from the calculation of adjusted results. Inventory holding gain or loss is the difference between the cost of sales of the volumes sold in the period based on the cost of supplies of the same period and the cost of sales of the volumes sold calculated using the weighted average cost method of inventory accounting. Special items include certain significant income or charges pertaining to either: (i) infrequent or unusual events and transactions, being identified as non-recurring items under such circumstances; (ii) certain events or transactions which are not considered to be representative of the ordinary course of business, as in the case of environmental provisions, restructuring charges, asset impairments or write ups and gains or losses on |
| 2012 (euro million) |
OTHER ACTIVITIES(a) | DISCONTINUED OPERATIONS | ||||
Exploration & Production | Gas & Power(a) | Refining & Marketing | Chemicals | Engineering & Construction | Corporate and financial companies | Snam | Other activities | Impact of unrealized intragroup profit elimination | GROUP | Snam | Consolidation adjustments | Total | CONTINUING OPERATIONS | |||||||||||||||
| Operating profit | 18,451 | (3,221 | ) | (1,303 | ) | (683 | ) | 1,433 | (345 | ) | 1,676 | (302 | ) | 208 | 15,914 | (1,676 | ) | 788 | (888 | ) | 15,026 | |||||||||||||||||||||
| Exclusion of inventory holding (gains) losses | 163 | (29 | ) | 63 | (214 | ) | (17 | ) | (17 | ) | ||||||||||||||||||||||||||||||||
| Exclusion of special items: | ||||||||||||||||||||||||||||||||||||||||||
| - asset impairments | 550 | 2,494 | 846 | 112 | 25 | 2 | 4,029 | 4,029 | ||||||||||||||||||||||||||||||||||
| - gains on disposal of assets | (542 | ) | (3 | ) | 5 | 1 | 3 | (22 | ) | (12 | ) | (570 | ) | 22 | 22 | (548 | ) | |||||||||||||||||||||||||
| - risk provisions | 7 | 831 | 49 | 18 | 5 | 35 | 945 | 945 | ||||||||||||||||||||||||||||||||||
| - environmental charges | (2 | ) | 40 | 71 | 25 | 134 | (71 | ) | (71 | ) | 63 | |||||||||||||||||||||||||||||||
| - provision for redundancy incentives | 6 | 5 | 19 | 14 | 7 | 11 | 2 | 2 | 66 | (2 | ) | (2 | ) | 64 | ||||||||||||||||||||||||||||
| - re-measurement gains/losses on commodity derivatives | 1 | 1 | (3 | ) | (1 | ) | (1 | ) | ||||||||||||||||||||||||||||||||||
| - exchange rate differences and derivatives | (9 | ) | (51 | ) | (8 | ) | (11 | ) | (79 | ) | (79 | ) | ||||||||||||||||||||||||||||||
| - other | 54 | 138 | 53 | 26 | 271 | 271 | ||||||||||||||||||||||||||||||||||||
| Special items of operating profit | 67 | 3,412 | 1,004 | 135 | 32 | 16 | 51 | 78 | 4,795 | (51 | ) | (51 | ) | 4,744 | ||||||||||||||||||||||||||||
| Adjusted operating profit | 18,518 | 354 | (328 | ) | (485 | ) | 1,465 | (329 | ) | 1,727 | (224 | ) | (6 | ) | 20,692 | (1,727 | ) | 788 | (939 | ) | 19,753 | |||||||||||||||||||||
| Net finance (expense) income (b) | (248 | ) | 31 | (4 | ) | (1 | ) | (861 | ) | (51 | ) | (22 | ) | (1,156 | ) | 51 | 51 | (1,105 | ) | |||||||||||||||||||||||
| Net income (expense) from investments (b) | 436 | 261 | 63 | 2 | 55 | 99 | 38 | (1 | ) | 953 | (38 | ) | (38 | ) | 915 | |||||||||||||||||||||||||||
| Income taxes (b) | (11,281 | ) | (173 | ) | 90 | 89 | (411 | ) | 115 | (712 | ) | 2 | (12,281 | ) | 712 | (123 | ) | 589 | (11,692 | ) | ||||||||||||||||||||||
| Tax rate (%) | 60.3 | 26.8 | .. | 27.0 | 41.5 | 59.9 | 59.8 | |||||||||||||||||||||||||||||||||||
| Adjusted net profit | 7,425 | 473 | (179 | ) | (395 | ) | 1,109 | (976 | ) | 1,002 | (247 | ) | (4 | ) | 8,208 | (1,002 | ) | 665 | (337 | ) | 7,871 | |||||||||||||||||||||
| of which attributable to: | ||||||||||||||||||||||||||||||||||||||||||
| - non-controlling interest | 885 | (142 | ) | 743 | ||||||||||||||||||||||||||||||||||||||
| - Eni’s shareholders | 7,323 | (195 | ) | 7,128 | ||||||||||||||||||||||||||||||||||||||
| Net profit attributable to Eni’s shareholders | 7,788 | (3,590 | ) | 4,198 | ||||||||||||||||||||||||||||||||||||||
| Exclusion of inventory holding (gains) losses | (23 | ) | (23 | ) | ||||||||||||||||||||||||||||||||||||||
| Exclusion of special items | (442 | ) | 3,395 | 2,953 | ||||||||||||||||||||||||||||||||||||||
| Adjusted net profit attributable to Eni’s shareholders | 7,323 | (195 | ) | 7,128 | ||||||||||||||||||||||||||||||||||||||
(a) Following the divestment plan, Snam results are reclassified from "Gas & Power" sector to "Other activities" and accounted as discontinued operations.
(b) Excluding special items.
- 40 -
Contents
Eni in 2012 Financial information
| divestments even though they occurred in past periods or are likely to occur in future ones; or (iii) exchange rate differences and derivatives relating to industrial activities and commercial payables and receivables, particularly exchange rate derivatives to manage commodity pricing formulas which are quoted in a currency other than the functional currency. Those items are reclassified in operating profit with a corresponding adjustment to net finance charges, notwithstanding the handling of foreign currency exchange risks is made centrally by netting off naturally-occurring opposite positions and then dealing with any residual risk exposure in the exchange rate market. As provided for in Decision No. 15519 of July 27, 2006, of the Italian market regulator | (Consob), non recurring material income or charges are to be clearly reported in the management’s discussion and financial tables. Also, special items include gains and losses on re-measurement at fair value of certain non hedging commodity derivatives, including the ineffective portion of cash flow hedges and certain derivatives financial instruments embedded in the pricing formula of long-term gas supply agreements of the Exploration & Production Division. Finance charges or income related to net borrowings excluded from the adjusted net profit of business segments are comprised of interest charges on finance debt and interest income earned on cash and cash equivalents | not related to operations. Therefore, the adjusted net profit of business segments includes finance charges or income deriving from certain segment-operated assets, i.e., interest income on certain receivable financing and securities related to operations and finance charge pertaining to the accretion of certain provisions recorded on a discounted basis (as in the case of the asset retirement obligations in the Exploration & Production Division). Finance charges or interest income and related taxation effects excluded from the adjusted net profit of the business segments are allocated on the aggregate corporate and financial companies. For a reconciliation of adjusted operating profit and adjusted net profit to reported operating profit and reported net profit see tables below. |
| 2011 (euro million) |
OTHER ACTIVITIES(a) | DISCONTINUED OPERATIONS | ||||
Exploration & Production | Gas & Power(a) | Refining & Marketing | Chemicals | Engineering & Construction | Corporate and financial companies | Snam | Other activities | Impact of unrealized intragroup profit elimination | GROUP | Snam | Consolidation adjustments | Total | CONTINUING OPERATIONS | |||||||||||||||
| Operating profit | 15,887 | (326 | ) | (273 | ) | (424 | ) | 1,422 | (319 | ) | 2,084 | (427 | ) | (189 | ) | 17,435 | (2,084 | ) | 1,452 | (632 | ) | 16,803 | ||||||||||||||||||||
| Exclusion of inventory holding (gains) losses | (166 | ) | (907 | ) | (40 | ) | (1,113 | ) | (1,113 | ) | ||||||||||||||||||||||||||||||||
| Exclusion of special items | ||||||||||||||||||||||||||||||||||||||||||
| of which: | ||||||||||||||||||||||||||||||||||||||||||
| Non-recurring (income) charges | 10 | 59 | 69 | 69 | ||||||||||||||||||||||||||||||||||||||
| Other special (income) charges | 188 | 245 | 641 | 181 | 21 | 53 | 27 | 142 | 1,498 | (27 | ) | (27 | ) | 1,471 | ||||||||||||||||||||||||||||
| - asset impairments | 190 | 154 | 488 | 160 | 35 | (9 | ) | 4 | 1,022 | 9 | 9 | 1,031 | ||||||||||||||||||||||||||||||
| - gains on disposal of assets | (63 | ) | 10 | 4 | (1 | ) | (4 | ) | (7 | ) | (61 | ) | 4 | 4 | (57 | ) | ||||||||||||||||||||||||||
| - risk provisions | 77 | 8 | (6 | ) | 9 | 88 | 88 | |||||||||||||||||||||||||||||||||||
| - environmental charges | 34 | 1 | 10 | 141 | 186 | (10 | ) | (10 | ) | 176 | ||||||||||||||||||||||||||||||||
| - provision for redundancy incentives | 44 | 34 | 81 | 17 | 10 | 9 | 6 | 8 | 209 | (6 | ) | (6 | ) | 203 | ||||||||||||||||||||||||||||
| - re-measurement gains/losses on commodity derivatives | 1 | 45 | (3 | ) | (28 | ) | 15 | 15 | ||||||||||||||||||||||||||||||||||
| - exchange rate differences and derivatives | (2 | ) | (82 | ) | (4 | ) | 3 | (85 | ) | (85 | ) | |||||||||||||||||||||||||||||||
| - other | 18 | 17 | 27 | 51 | 24 | (13 | ) | 124 | (24 | ) | (24 | ) | 100 | |||||||||||||||||||||||||||||
| Special items of operating profit | 188 | 245 | 641 | 191 | 21 | 53 | 27 | 201 | 1,567 | (27 | ) | (27 | ) | 1,540 | ||||||||||||||||||||||||||||
| Adjusted operating profit | 16,075 | (247 | ) | (539 | ) | (273 | ) | 1,443 | (266 | ) | 2,111 | (226 | ) | (189 | ) | 17,889 | (2,111 | ) | 1,452 | (659 | ) | 17,230 | ||||||||||||||||||||
| Net finance (expense) income (b) | (231 | ) | 43 | (876 | ) | 19 | 5 | (1,040 | ) | (19 | ) | (19 | ) | (1,059 | ) | |||||||||||||||||||||||||||
| Net income (expense) from investments (b) | 624 | 363 | 99 | 95 | 1 | 44 | (3 | ) | 1,223 | (44 | ) | (44 | ) | 1,179 | ||||||||||||||||||||||||||||
| Income taxes (b) | (9,603 | ) | 93 | 176 | 67 | (440 | ) | 388 | (918 | ) | (1 | ) | 78 | (10,160 | ) | 918 | (195 | ) | 723 | (9,437 | ) | |||||||||||||||||||||
| Tax rate (%) | 58.3 | .. | .. | 28.6 | 42.2 | 56.2 | 54.4 | |||||||||||||||||||||||||||||||||||
| Adjusted net profit | 6,865 | 252 | (264 | ) | (206 | ) | 1,098 | (753 | ) | 1,256 | (225 | ) | (111 | ) | 7,912 | (1,256 | ) | 1,257 | 1 | 7,913 | ||||||||||||||||||||||
| of which attributable to: | ||||||||||||||||||||||||||||||||||||||||||
| - non-controlling interest | 943 | 32 | 975 | |||||||||||||||||||||||||||||||||||||||
| - Eni’s shareholders | 6,969 | (31 | ) | 6,938 | ||||||||||||||||||||||||||||||||||||||
| Net profit attributable to Eni’s shareholders | 6,860 | 42 | 6,902 | |||||||||||||||||||||||||||||||||||||||
| Exclusion of inventory holding (gains) losses | (724 | ) | (724 | ) | ||||||||||||||||||||||||||||||||||||||
| Exclusion of special items: | 833 | (73 | ) | 760 | ||||||||||||||||||||||||||||||||||||||
| - non-recurring charges | 69 | 69 | ||||||||||||||||||||||||||||||||||||||||
| - other special (income) charges | 764 | (73 | ) | 691 | ||||||||||||||||||||||||||||||||||||||
| Adjusted net profit attributable to Eni’s shareholders | 6,969 | (31 | ) | 6,938 | ||||||||||||||||||||||||||||||||||||||
(a) Following the divestment plan, Snam results are reclassified from "Gas & Power" sector to "Other activities" and accounted as discontinued operations.
(b) Excluding special items.
- 41 -
Contents
Eni in 2012 Financial information
| 2010 (euro million) |
OTHER ACTIVITIES(a) | DISCONTINUED OPERATIONS | ||||
Exploration & Production | Gas & Power(a) | Refining & Marketing | Chemicals | Engineering & Construction | Corporate and financial companies | Snam | Other activities | Impact of unrealized intragroup profit elimination | GROUP | Snam | Consolidation adjustments | Total | CONTINUING OPERATIONS | |||||||||||||||
| Operating profit | 13,866 | 896 | 149 | (86 | ) | 1,302 | (361 | ) | 2,000 | (1,384 | ) | (271 | ) | 16,111 | (2,000 | ) | 1,371 | (629 | ) | 15,482 | ||||||||||||||||||||||
| Exclusion of inventory holding (gains) losses | (117 | ) | (659 | ) | (105 | ) | (881 | ) | (881 | ) | ||||||||||||||||||||||||||||||||
| Exclusion of special items | ||||||||||||||||||||||||||||||||||||||||||
| of which: | ||||||||||||||||||||||||||||||||||||||||||
| Non-recurring (income) charges | (270 | ) | 24 | (246 | ) | (246 | ) | |||||||||||||||||||||||||||||||||||
| Other special (income) charges: | 32 | 759 | 329 | 95 | 96 | 46 | 1,179 | 2,536 | (46 | ) | (46 | ) | 2,490 | |||||||||||||||||||||||||||||
| - asset impairments | 127 | 426 | 76 | 52 | 3 | 10 | 8 | 702 | (10 | ) | (10 | ) | 692 | |||||||||||||||||||||||||||||
| - gains on disposal of assets | (241 | ) | (16 | ) | 5 | 4 | (248 | ) | (4 | ) | (4 | ) | (252 | ) | ||||||||||||||||||||||||||||
| - risk provisions | 78 | 2 | 8 | 7 | 95 | 95 | ||||||||||||||||||||||||||||||||||||
| - environmental charges | 30 | 16 | 169 | 9 | 1,145 | 1,369 | (9 | ) | (9 | ) | 1,360 | |||||||||||||||||||||||||||||||
| - provision for redundancy incentives | 97 | 52 | 113 | 26 | 14 | 88 | 23 | 10 | 423 | (23 | ) | (23 | ) | 400 | ||||||||||||||||||||||||||||
| - re-measurement gains/losses on commodity derivatives | 30 | (10 | ) | (22 | ) | (2 | ) | (2 | ) | |||||||||||||||||||||||||||||||||
| - exchange rate differences and derivatives | 14 | 195 | (10 | ) | 17 | 216 | 216 | |||||||||||||||||||||||||||||||||||
| - other | 5 | (38 | ) | 5 | 9 | (19 | ) | (19 | ) | |||||||||||||||||||||||||||||||||
| Special items of operating profit | 32 | 489 | 329 | 95 | 24 | 96 | 46 | 1,179 | 2,290 | (46 | ) | (46 | ) | 2,244 | ||||||||||||||||||||||||||||
| Adjusted operating profit | 13,898 | 1,268 | (181 | ) | (96 | ) | 1,326 | (265 | ) | 2,046 | (205 | ) | (271 | ) | 17,520 | (2,046 | ) | 1,371 | (675 | ) | 16,845 | |||||||||||||||||||||
| Net finance (expense) income (b) | (205 | ) | 34 | 33 | (783 | ) | 22 | (9 | ) | (908 | ) | (22 | ) | (22 | ) | (930 | ) | |||||||||||||||||||||||||
| Net income from investments (b) | 274 | 362 | 92 | 1 | 10 | 44 | (2 | ) | 781 | (44 | ) | (44 | ) | 737 | ||||||||||||||||||||||||||||
| Income taxes (b) | (8,358 | ) | (397 | ) | 33 | 22 | (375 | ) | 181 | (667 | ) | 102 | (9,459 | ) | 667 | (78 | ) | 589 | (8,870 | ) | ||||||||||||||||||||||
| Tax rate (%) | 59.8 | 23.9 | .. | 27.4 | 31.6 | 54.4 | 53.3 | |||||||||||||||||||||||||||||||||||
| Adjusted net profit | 5,609 | 1,267 | (56 | ) | (73 | ) | 994 | (867 | ) | 1,445 | (216 | ) | (169 | ) | 7,934 | (1,445 | ) | 1,293 | (152 | ) | 7,782 | |||||||||||||||||||||
| of which attributable to: | ||||||||||||||||||||||||||||||||||||||||||
| - non-controlling interest | 1,065 | (53 | ) | 1,012 | ||||||||||||||||||||||||||||||||||||||
| - Eni’s shareholders | 6,869 | (99 | ) | 6,770 | ||||||||||||||||||||||||||||||||||||||
| Net profit attributable to Eni’s shareholders | 6,318 | (66 | ) | 6,252 | ||||||||||||||||||||||||||||||||||||||
| Exclusion of inventory holding (gains) losses | (610 | ) | (610 | ) | ||||||||||||||||||||||||||||||||||||||
| Exclusion of special items: | 1,161 | (33 | ) | 1,128 | ||||||||||||||||||||||||||||||||||||||
| - non-recurring charges | (246 | ) | (246 | ) | ||||||||||||||||||||||||||||||||||||||
| - other special (income) charges | 1,407 | (33 | ) | 1,374 | ||||||||||||||||||||||||||||||||||||||
| Adjusted net profit attributable to Eni’s shareholders | 6,869 | (99 | ) | 6,770 | ||||||||||||||||||||||||||||||||||||||
(a) Following the divestment plan, Snam results are reclassified from "Gas & Power" sector to "Other activities" and accounted as discontinued operations.
(b) Excluding special items.
- 42 -
Contents
Eni in 2012 Financial information
![]()
For a reconciliation of Summarized Group Balance Sheet and Summarized Group Cash Flow Statement with the corresponding statutory tables see Eni’s 2012 Annual Report, "Reconciliation of Summarized Group Balance Sheet and Statement of Cash Flows to Statutory Schemes" pages 86-88.
| > Summarized Group Balance Sheet The Summarized Group Balance Sheet aggregates the amount of assets and liabilities derived from the statutory balance sheet in accordance with functional criteria which consider the enterprise conventionally divided into the three fundamental areas | focusing on resource investments, operations and financing. Management believes that this Summarized Group Balance Sheet is useful information in assisting investors to assess Eni’s capital structure and to analyze its sources of funds and investments in fixed assets and working capital. Management | uses the Summarized Group Balance Sheet to calculate key ratios such as the proportion of net borrowings to shareholders’ equity (leverage) intended to evaluate whether Eni’s financing structure is sound and well-balanced. |
| Summarized Group Balance Sheet (euro million) |
| Dec. 31, 2011 | Dec. 31, 2012 | |||||
| Fixed assets | ||||||
| Property, plant and equipment | 73,578 | 63,466 | ||||
| Inventories - Compulsory stock | 2,433 | 2,538 | ||||
| Intangible assets | 10,950 | 4,487 | ||||
| Equity-accounted investments and other investments | 6,242 | 9,350 | ||||
| Receivables and securities held for operating purposes | 1,740 | 1,457 | ||||
| Net payables related to capital expenditure | (1,576 | ) | (1,142 | ) | ||
| 93,367 | 80,156 | |||||
| Net working capital | ||||||
| Inventories | 7,575 | 8,496 | ||||
| Trade receivables | 17,709 | 19,966 | ||||
| Trade payables | (13,436 | ) | (14,993 | ) | ||
| Tax payables and provisions for net deferred tax liabilities | (3,503 | ) | (3,318 | ) | ||
| Provisions | (12,735 | ) | (13,603 | ) | ||
| Other current assets and liabilities | 281 | 2,347 | ||||
| (4,109 | ) | (1,105 | ) | |||
| Provisions for employee post-retirement benefits | (1,039 | ) | (982 | ) | ||
| Assets held for sale including related liabilities | 206 | 155 | ||||
| CAPITAL EMPLOYED NET | 88,425 | 78,224 | ||||
| - Eni shareholders’ equity | 55,472 | 59,199 | ||||
| - Non-controlling interest | 4,921 | 3,514 | ||||
| Shareholders’ equity | 60,393 | 62,713 | ||||
| Net borrowings | 28,032 | 15,511 | ||||
| TOTAL LIABILITIES AND SHAREHOLDERS’ EQUITY | 88,425 | 78,224 | ||||
| > Net borrowings and leverage Eni evaluates its financial condition by reference to net borrowings, which is calculated as total finance debt less: cash, cash equivalents and certain very liquid investments not related to operations, including among others non-operating financing receivables and securities not related to operations. Non-operating financing receivables consist of amounts due | to Eni’s financing subsidiaries from banks and other financing institutions and amounts due to other subsidiaries from banks for investing purposes and deposits in escrow. Securities not related to operations consist primarily of government and corporate securities. Leverage is a measure used by management to assess the Company’s level of indebtedness. It is calculated as a ratio of net borrowings | which is calculated by excluding cash and cash equivalents and certain very liquid assets from financial debt to shareholders’ equity, including non-controlling interest. Management periodically reviews leverage in order to assess the soundness and efficiency of the Group Balance Sheet in terms of optimal mix between net borrowings and net equity, and to carry out benchmark analysis with industry standards. |
- 43 -
Contents
Eni in 2012 Financial information
| Net borrowings and leverage (euro million) |
| Dec. 31, 2011 | Dec. 31, 2012 | |||||
| Total debt | 29,597 | 24,463 | ||||
| - Short-term debt | 6,495 | 5,184 | ||||
| - Long-term debt | 23,102 | 19,279 | ||||
| Cash and cash equivalents | (1,500 | ) | (7,765 | ) | ||
| Securities held for non-operating purposes | (37 | ) | (34 | ) | ||
| Financing receivables for non-operating purposes | (28 | ) | (1,153 | ) | ||
| Net borrowings | 28,032 | 15,511 | ||||
| Shareholders’ equity including non-controlling interest | 60,393 | 62,713 | ||||
| Leverage | 0.46 | 0.25 | ||||
| > Summarized Group Cash Flow Statement and Change in net borrowings Eni’s summarized Group Cash Flow Statement derives from the statutory statement of cash flows. It enables investors to understand the link existing between changes in cash and cash equivalents (deriving from the statutory cash flows statement) and in net borrowings (deriving from the summarized cash flow | statement) that occurred from the beginning of the period to the end of period. The measure enabling such a link is represented by the free cash flow which is the cash in excess of capital expenditure needs. Starting from free cash flow it is possible to determine either: (i) changes in cash and cash equivalents for the period by adding/deducting cash flows relating to financing debts/receivables (issuance/repayment of debt and receivables | related to financing activities), shareholders’ equity (dividends paid, net repurchase of own shares, capital issuance) and the effect of changes in consolidation and of exchange rate differences; and (ii) change in net borrowings for the period by adding/deducting cash flows relating to shareholders’ equity and the effect of changes in consolidation and of exchange rate differences. The free cash flow is a non-GAAP measure of financial performance. | ||
| Summarized Group Cash Flow Statement (euro million) |
| 2010 | 2011 | 2012 | |||||||
| Net profit - continuing operations | 7,264 | 7,877 | 4,941 | ||||||
| Adjustments to reconcile net profit to net cash provided by operating activities: | |||||||||
| - depreciation, depletion and amortization and other non-monetary items | 8,521 | 8,606 | 11,354 | ||||||
| - net gains on disposal of assets | (558 | ) | (1,176 | ) | (875 | ) | |||
| - dividends, interest, taxes and other changes | 8,829 | 9,918 | 11,923 | ||||||
| Changes in working capital related to operations | (1,158 | ) | (1,696 | ) | (3,373 | ) | |||
| Dividends received, taxes paid, interest (paid) received during the period | (8,758 | ) | (9,766 | ) | (11,614 | ) | |||
| Net cash provided by operating activities - continuing operations | 14,140 | 13,763 | 12,356 | ||||||
| Net cash provided by operating activities - discontinued operations | 554 | 619 | 15 | ||||||
| Net cash provided by operating activities | 14,694 | 14,382 | 12,371 | ||||||
| Capital expenditure - continuing operations | (12,450 | ) | (11,909 | ) | (12,761 | ) | |||
| Capital expenditure - discontinued operations | (1,420 | ) | (1,529 | ) | (756 | ) | |||
| Capital expenditure | (13,870 | ) | (13,438 | ) | (13,517 | ) | |||
| Investments and purchase of consolidated subsidiaries and businesses | (410 | ) | (360 | ) | (569 | ) | |||
| Disposals | 1,113 | 1,912 | 6,014 | ||||||
| Other cash flow related to capital expenditure, investments and disposals | 228 | 627 | (136 | ) | |||||
| Free cash flow | 1,755 | 3,123 | 4,163 | ||||||
| Borrowings (repayment) of debt related to financing activities | (26 | ) | 41 | (83 | ) | ||||
| Changes in short and long-term financial debt | 2,272 | 1,104 | 5,947 | ||||||
| Dividends paid and changes in non-controlling interests and reserves | (4,099 | ) | (4,327 | ) | (3,746 | ) | |||
| Effect of changes in consolidation area and exchange differences | 39 | 10 | (16 | ) | |||||
| NET CASH FLOW | (59 | ) | (49 | ) | 6,265 | ||||
| Change in net borrowings (euro million) |
| 2010 | 2011 | 2012 | |||||||
| Free cash flow | 1,755 | 3,123 | 4,163 | ||||||
| Net borrowings of acquired companies | (33 | ) | (2 | ) | |||||
| Net borrowings of divested companies | (192 | ) | 12,446 | ||||||
| Exchange differences on net borrowings and other changes | (687 | ) | (517 | ) | (340 | ) | |||
| Dividends paid and changes in non-controlling interest and reserves | (4,099 | ) | (4,327 | ) | (3,746 | ) | |||
| CHANGE IN NET BORROWINGS | (3,064 | ) | (1,913 | ) | 12,521 | ||||
| > Pro-forma adjusted EBITDA EBITDA (Earnings Before Interest, Taxes, Depreciation and Amortization charges) on an adjusted basis is calculated by adding amortization and depreciation charges to | adjusted operating profit, which is also modified to take into account the impact associated with certain derivatives instruments as detailed below. This performance indicator includes the adjusted EBITDA of Eni’s wholly owned | subsidiaries and Eni’s share of adjusted EBITDA generated by certain associates which are accounted for under the equity method for IFRS purposes. In order to calculate the EBITDA pro-forma adjusted, the adjusted operating profit |
- 44 -
Contents
Eni in 2012 Financial information
| of the Marketing business has been modified to take into account the impact of the settlement of certain commodity and exchange rate derivatives that do not meet the formal criteria to be classified as hedges under the IFRS. These are entered into by the Company in view of certain amounts of gas and electricity that the Company expects to supply at fixed prices during future periods. The impact of those derivatives has been allocated to the EBITDA pro-forma adjusted relating to the reporting periods during which those supplies at fixed prices are recognized. Management believes that the EBITDA pro-forma adjusted is an important alternative measure to assess the performance of Eni’s Gas & Power Division, taking into account evidence that this Division is comparable to European utilities in the gas and power generation sector. This measure is provided in order to assist investors and financial analysts in assessing the divisional performance of Eni Gas & Power, as compared to its European peers, as EBITDA is widely used as the main performance indicator for utilities. The EBITDA pro-forma adjusted is a non-GAAP measure under IFRS. > Production sharing agreements (PSA) > Possible reserves > Probable reserves | > Proved reserves Proved oil and gas reserves are those quantities of oil and gas, which, by analysis of geoscience and engineering data, can be estimated with reasonable certainty to be economically producible, from a given date forward, from known reservoirs, and under existing economic conditions, operating methods, and government regulations, prior to the time at which contracts providing the right to operate expire, unless evidence indicates that renewal is reasonably certain, regardless of whether deterministic or probabilistic methods are used for the estimation. The project to extract the hydrocarbons must have commenced or the operator must be reasonably certain that it will commence the project within a reasonable time. Existing economic conditions include prices and costs at which economic producibility from a reservoir is to be determined. The price shall be the average price during the 12-month period prior to the ending date of the period covered by the report, determined as an unweighted arithmetic average of the first-day-of-the-month price for each month within such period, unless prices are defined by contractual arrangements, excluding escalations based upon future conditions. Reserves are classified as either developed and undeveloped. Proved developed oil and gas reserves are reserves that can be expected to be recovered through existing wells with existing equipment and operating methods or in which the cost of the required equipment is relatively minor compared to the cost of a new well, and through installed extraction equipment and infrastructure operational at the time of the reserves estimate if the extraction is by means not involving a well. Proved undeveloped oil and gas reserves are reserves of any category that are expected to be recovered from new wells on undrilled acreage, or from existing wells where a relatively major expenditure is required for recompletion. > Recoverable reserves > Reserves | all permits and financing required to implement the project. Reserves can be: (i) developed reserves quantities of oil and gas anticipated to be through installed extraction equipment and infrastructure operational at the time of the reserves estimate; (ii) undeveloped reserves: oil and gas expected to be recovered from new wells, facilities and operating methods. > Reserve replacement ratio > Average reserve life index > Resource base > Take-or-pay > Conversion |
- 45 -
Contents
Eni in 2012 Directors and officers
![]()
Was born in 1964 and has been Chairman of the Board of Eni since May 2011. He is also Vice Chairman of GE Capital Interbanca SpA; a member of the Board of Directors and of the Audit Committee of Exor SpA; a member of the European Advisory Board of Blackstone and a member of the Massachusetts Institute of Technology E.I. External Advisory Board. He is also a member of the Italian Corporate Governance Committee, of the executive committees of Confindustria (where he chairs the Foreign Investment Committee), Assonime (Association of Italian Joint Stock Companies), Aspen Institute Italia; a member of the Board of Directors of FEEM-Eni Enrico Mattei Foundation, of the Italian Institute of Technology and of the LUISS Business School Advisory Board. He is co-Chair of the B20 Task Force on Improving Transparency and Anti-Corruption and director of the World Economic Forum Partnering Against Corruption Initiative. He holds a degree in Engineering from the Polytechnic of Turin. In 1989 he started his career as entrepreneur at Recchi SpA, a general contractor active in 25 Countries in the construction of high-tech public infrastructure. Since 1994 he has served as Executive Chairman of Recchi America Inc., the US branch of Recchi Group. In 1999 he joined General Electric, where he held several management positions in Europe and in the United States. He served as Director of GE Capital Structure Finance Group; Managing Director for Industrial M&A and Business Development for GE EMEA; President & CEO of GE Italy. Until May 2011 he was President & CEO of GE South Europe. Mr. Recchi was a member of the Organizing Committee for the Rome Candidacy for the 2020 Olympic Games, of the Board of Permasteelisa SpA, of the Advisory Board of Invest Industrial (private equity) and visiting professor in Structured Finance at Turin University.
Has been Chief Executive Officer of Eni since June 2005. He is currently a Non-Executive Director of Assicurazioni Generali, Non-Executive Deputy Chairman of the London Stock Exchange Group and a Non- Executive Director of Veolia Environnement. He also sits on the Board of Overseers of Columbia | Business School and of Fondazione Teatro alla Scala. After receiving a degree in economics and business from Luigi Bocconi University in Milan in 1969, he worked for three years at Chevron, before obtaining an MBA from Columbia University, New York, and continuing his career at McKinsey. In 1973 he joined Saint Gobain, where he held a series of management positions in Italy and abroad, until his appointment as head of the glass division in Paris in 1984. From 1985 to 1996 he was Deputy Chairman and CEO of Techint. In 1996 he moved to the UK and served as CEO of Pilkington until May 2002. From May 2002 to May 2005 he served as Chief Executive Officer and General Manager of Enel. From 2005 to July 2006 he was Chairman of Alliance Unichem. In May 2004 he was decorated as Cavaliere del Lavoro of the Italian Republic. In November 2007 he was decorated as an Officier of the French Légion d’Honneur.
Was born in 1941 and has been a Director of Eni since May 2011. He graduated from the University of Turin with a degree in Economics and Business. He is a certified public auditor. He is currently Chairman of the Board of Statutory Auditors of RAI SpA, Natuzzi SpA, Difesa Servizi SpA, Rainet SpA and Director of Arcese Trasporti SpA. He has taught courses in Finance, Administration and Control at the Isvor Fiat SpA training institute. In 1968 he was hired by Impresit as Chief Accountant, where he managed the finance department of the local branch in Jordan. He joined the Fiat Group in 1969 where over the years he held a series positions of increasing responsibility in the area of finance, administration and control. From 1979 to 1990 he was in charge of Financial Reporting at the Fiat Group and was also responsible for controlling the transport companies of the Fiat Group operating public transport concessions (Sapav, Sadem, Sita) and oversaw their subsequent sale. In 1990 he was appointed Joint Manager of Finance and Control of the Fiat Group, before becoming, in 1998, Chief Administration Officer (CAO). From 2000 to 2004, he was Chief Executive Officer and Deputy Chairman of Business Solutions, a new sector created by Fiat to provide business services. In 1993 he was the Italian Representative to the European Commission for the fiscal harmonization of the Member States. In 1992 he was decorated as Cavaliere Ordine al Merito of the Italian Republic and, in 1995, an Ufficiale Ordine al Merito of the Italian Republic. | Was born in 1948 and has been a Director of Eni since May 2011. He is currently a founding partner of Tokos Srl, a securities investment consulting firm, and Chairman of Società Metropolitana Acque Torino SpA, and a Director of Ersel SIM SpA, Millbo SpA and Sicme Motori Srl. He began his career at SAIAG SpA, in the Administration and Control area. In 1975 he joined Fiat Iveco SpA where he held a series of positions: Controller of Fiat V.I. SpA, Head of Administration, Finance and Control, head of Personnel of Orlandi SpA in Modena (1977-1980) and Project Manager (1981-1982). In 1983 he joined the GFT Group, where he was head of Administration, Finance and Control of Cidat SpA, a GFT SpA subsidiary (1983-1984), Central Controller of the GFT Group (1984-1988), Head of Finance and Control of the GFT Group (1989-1994) and Managing Director of GFT SpA, with ordinary and extraordinary powers over all operating activities (1994-1995). In 1995 he was appointed Chief Executive Officer of SCI SpA, where he oversaw the restructuring process. In 1998 he was appointed Central Manager and, subsequently, Director of Ersel SIM SpA, a position he held until June 2000. In 2000 he became Central Manager of Planning and Control at the Ferrero Group and General Manager of Soremartec, the technical research and marketing company of the Ferrero Group. In May 2003 he was appointed CFO of the Coin Group. In 2006 he became Central Corporate Manager at Lavazza SpA, serving as a member of the Board of Directors from 2008 to June 2011.
Was born in 1969 and has been a Director of Eni since June 2008. He is a lawyer specializing in criminal and administrative law, and has been admitted to argue before the Supreme Court and the higher Courts. He has been Chairman of the Board of Directors of Finpiemonte partecipazioni SpA since August 2010. He serves as a consultant to government agencies and business organizations on business, corporate, administrative and local government law. He was Mayor of Baveno (Verbania) from April 1995 to June 2004 and Chairman of the Assembly of Mayors of Con.Ser.Vco from September 1995 to June 1999. Until June 2004 he was a member of the |
(*) Appointed by the Ordinary Shareholders’ Meeting held on May 5, 2011, for a three-year period. The Board of Directors appointed Paolo Scaroni Chief Executive Officer. The Board mandate will expire with the shareholders’ meeting approving the financial statements for the year ending December 31, 2013.
- 46 -
Contents
Eni in 2012 Directors and officers
| Assembly of Mayors of the Asl 14 health authority, the steering committee of the Verbania health district, the Assembly of Mayors of the Valle Ossola waste water consortium, the Assembly of Mayors of the Verbania social services consortium. From April 2005 to January 2008 he was a member of the Stresa (VB) city council. From October 2001 to April 2004 he was a Director of CIM SpA of Novara (merchandise interport centre) and from December 2002 to December 2005 a Director and executive committee member of Finpiemonte SpA. From June 2005 to June 2008 he was a Director of Consip SpA. He was Vice President and Provincial Councillor in charge of the budget, financial reporting, property, legal affairs and productive activities of the Province of Verbano-Cusio-Ossola from June 2009 to October 2011. He was Director of the Provincial Board of the Province of Verbano-Cusio-Ossola from October 2011 to November 2012.
Has been a Director of Eni since May 2011. He was born in Pescara in 1949 and graduated with a degree in law from "Gabriele D’Annunzio" University of Chieti and Pescara. He has been a member of the Board of Directors of the Ravenna Festival since 2007 and he has been Chairman of Italimmobili Srl since 2011. In 1976 he was hired by Banca Nazionale del Lavoro (BNL) where he held a series of positions: Head of the "Lending Advisory" of BNL in Busto Arsizio (1982), Deputy Manager for the industrial division at the BNL branch in Ravenna (1983-1987), Area Chief of BNL in Venice (1987-1989) and Joint Manager of the central office of BNL in Rome (1989-1990). In 1990 he was appointed Commercial Manager at Banca Popolare and in 1994 he transferred, holding the same position, to Cassa di Risparmio di Ravenna Group (Carisp Ravenna and Banca di Imola). From 2001 to 2006 he was Chief Secretary to the Under-Secretary of Defence, where he was mainly involved in the Defence Ministry’s contacts with industry and international relations. From 2008 to 2011 he was Chief Secretary of the Minister of Defence. From 2003 to 2006 he was a Director of Fintecna SpA and from 2005 to 2008 a Director of Finmeccanica SpA.
Was born in 1957 and has been Director of Eni since May 2011. He received a degree in Business Administration from Università Luigi Bocconi of Milan. He is currently Chairman of Banca Monte dei Paschi di Siena, of Appeal Strategy & Finance Srl and member of the Supervisory Board of Sberbank. He is also member of the Board of Directors of the Bocconi University in Milan. He began his career | in 1977 at the Banco Lariano, becoming Branch Manager in Milan. In 1987 he joined McKinsey where he was Project Manager in the strategy area for the finance sector. In 1989 he was appointed Head of relations with financial institutions and integrated development projects at Bain, Cuneo e Associati firm (now Bain & Co). In 1991 he left the consulting field to join RAS, Riunione Adriatica di Sicurtà, where he was given responsibility, as General Manager, for the banking and parabanking sectors. He was also in charge of expanding the revenues of that group’s bank and of the other group companies operating in the field of asset management. In 1994 he joined Credito Italiano as Joint Central Manager, with responsibility for Programming and Control, becoming General Manager in 1995. In 1997 he was appointed Chief Executive Officer of Credito Italiano and subsequently of Unicredit, a position he held until September 2010. On an international level he was Chairman of the European Banking Federation in Bruxelles and Chairman of the Internal Monetary Conference Washington. In May 2004 he was decorated as a Cavaliere del Lavoro.
Was born in 1945 and has been a Director of Eni since May 2002. He graduated from the Università Luigi Bocconi of Milan with a degree in Economics and Business. He is also Chairman of Confimprese, Deputy Chairman of Sesto Immobiliare SpA and Director of Mondadori SpA. After graduating, he joined Chase Manhattan Bank. In 1974 he was appointed manager of Saifi Finanziaria (Fiat Group) and from 1976 to 1991 he was a partner at Egon Zehnder. In this period he was appointed Director of Lancôme Italia and of companies belonging to the RCS Corriere della Sera Group and the Versace Group. From 1995 to 2007 he was Chairman and Chief Executive Officer of McDonald’s Italia. He was also Chairman of Sambonet SpA and Kenwood Italia SpA, a founding partner of Eric Salmon & Partners, Chairman of the American Chamber of Commerce, General Director of Italian Heritage and Antiquities in the Ministry of Cultural Heritage and Activities and Chairman of Convention Bureau Italia SpA. He was decorated as a Cavaliere del Lavoro in June 2002.
Was born in 1940 and has been a Director of Eni since June 2008. He is currently Vice Chairman of Banca CR Firenze SpA (Cassa di Risparmio di Firenze SpA). He is also a Director and member of the Executive Committee of Rimorchiatori Riuniti SpA. He started working in 1959 in a stock brokerage in Milan. From 1965 to 1982, he worked at Banco | di Napoli as deputy manager of the stock market and securities department. He held a series of management positions in the asset management field, notably as manager of securities funds at Eurogest from 1982 to 1984, and General Manager of Interbancaria Gestioni from 1984 to 1987. After moving to the Prime group (1987 to 2000), he was Chief Executive Officer of the parent company for an extended period of time. He was Director of ERSEL SIM, member of the steering council of Assogestioni and of the Committee for the Corporate Governance of listed companies formed by Borsa Italiana. He was a Director of Enel from October 2000 to June 2008. BOARD COMMITTEES BOARD OF STATUTORY AUDITORS EXTERNAL AUDITORS GROUP OFFICERS (a) In charge until December 4, 2012; since December 5, 2012 Paolo Scaroni has been Gas & Power Chief Operating Officer ad interim. |
- 47 -
Contents
Eni in 2012 Directors and officers
| > Remuneration1 The Eni Remuneration Policy is defined consistently with the recommendations of the Borsa Italiana Code as transposed in the Eni Code. It is approved by the Board of Directors following a proposal by the Compensation Committee, made up of non-executive, independent Directors, and is | defined in accordance with the governance model adopted by the Company and with the recommendations of the Corporate Governance Code. This Policy aims to align the interests of management with the prime objective of creating sustainable value for shareholders over the medium-long term, in accordance | with the guidelines defined in the Strategic Plan of the Company. The table describes the main elements of the approved 2013 Guidelines for the remuneration of the Chief Executive Officer and General Manager (CEO/GM), of the Chief Operating Officers of Eni’s Divisions and other Managers with strategic responsibilities (MSR). | ||
| Remuneration Policy 2013 |
| Component | Aims and characteristics | Implementation condition | Values |
| Fixed remuneration | Reflects the skills, experiences and contribution related to the assigned role | Setting of the remuneration levels through benchmarks consistent with Eni and with the responsibilities of the specific roles | CEO/GM euro 1,430,000 annually (unchanged since 2005) MSR: remuneration determined on the basis of the level of the specific role with possible adjustments in relation to competitive placement targets (average market values) |
| Annual variable incentives | Promotes the achievement of annual budget objectives All the managers participate in the Plan Target incentives assigned are differentiated based on different roles Incentives paid on the basis of results achieved in the previous year | CEO/GM Objectives: - Implementation of strategic, financial and sustainability guidelines (30%) - Operational Performance of Divisions (30%) - Adjusted EBIT (30%) - Efficiency program (10%) MSR objectives: business and individual objectives determined based on those of the CEO/GM and on the responsibilities assigned Performance scale for each objective 70÷130 points (*); minimum threshold for the incentive equal to a total performance of 85 points | CEO/GM: on-target bonus of 110% of the fixed remuneration (min. 87.5% and max. 155%) MSR: on-target incentives up to a maximum 60% of the fixed remuneration |
| Deferred Monetary Incentive (2012-2014 Plan) | Promotes the business profitability growth in the long-term All managers who have reached the annual objectives participate in the Plan Target incentives assigned are differentiated based on specific roles | EBITDA performance measured against the EBITDA value as per the Plan Amount assigned on the basis of the EBITDA results achieved in the previous year evaluated in accordance with the performance scale 70÷130 (*) Amount paid as a variable percentage between zero and 170% of the amount assigned, on the basis of the average results achieved in the vesting period, evaluated in accordance with the performance scale 70÷170 (*) Vesting period: three years | CEO/GM: on-target incentive assigned of 55% of the fixed remuneration (min. 38.5% and max. 71.5%) MSR: on-target incentives assigned up to a maximum 40% of the fixed remuneration |
| Long-Term Monetary Incentive (2012-2014 Plan) | Promotes a business long-term profitability growth superior of that of the peers Managers who are critical for the business participate in Plan Target incentives assigned are differentiated based on specific roles | Performance measured in terms of the variation of the Adjusted Net Profit + DD&A, compared to the ones reported by the main Oil Majors in the Eni Peer group (Exxon, Shell, Chevron, BP, Total, Conoco) Incentive paid as a variable percentage between zero and 130% of the assigned amount, based on the average annual placement achieved in the vesting period: 1° Place 130% 2° Place 115% 3° Place 100% 4° Place 85% ——————————————————————————————————— 5° Place 70% 6° Place 0% 7° Place 0% Vesting period: three years | CEO/GM: on-target incentive assigned to target on the basis of the annual value of the previous stock option plan MSR: on-target incentives assigned up to a maximum 50% of the fixed remuneration |
| Benefits | The remuneration package is integrated with social security and insurance-related benefits, according to a "total reward" approach | Conditions defined by the national collective labor agreement and complementary company level agreements applicable to senior managers | - Supplementary pension plan - Supplementary health plan - Insurance coverages - Company car |
(*) Performance rated below the minimum threshold (70 points) is considered equal to zero.
| Pursuant to Article 84-quater of Consob Decision No. 11971 of May 14, 1999, and subsequent modifications, the following table below reports individual remuneration paid in 2012 to each Member of the Board of Directors, Statutory Auditors, and Chief Operating Officers. The overall amount earned by other Managers with strategic responsibilities is reported too. In compliance with the rule, the table provides details on: • "Fixed remuneration" which includes, following the criteria of competence, fixed remuneration and fixed salary from employment due for the year, gross of social security and tax expenses to be paid by the employee; it excludes lump-sum expense reimbursements and attendance fees, as they are not envisaged; • "Committees membership remuneration" which reports, following the criteria of | competence, the compensation due to the Directors for participation in the Committees established by the Board; • "Variable non-equity remuneration - Bonuses and other incentives" which reports the incentives paid during the year due to the vesting of the relative rights following the assessment and approval of the relative performance results by the relevant company bodies, in accordance with that specified, in greater detail, in the Table "Monetary incentive plans for Directors, Chief Operating Officers, and other Managers with strategic responsibilities"; the column "Profit sharing", does not include any figures, as no form of profit-sharing is envisaged; • "Non-monetary benefits" which reports, in accordance with competence and taxability criteria, the value of fringe benefits awarded; | • "Other remuneration" reports, in accordance with the criteria of competence, any other remuneration deriving from other services provided; • "Total" which reports the sum of the amounts of all the previous items; • "Fair value of equity remuneration" which reports the fair value of competence of the year related to the existing stock option plans, estimated in accordance with international accounting standards which assign the relevant cost in the vesting period; • "Severance indemnities for end of office or termination of employment" which reports the indemnities accrued, even if not yet paid, for the terminations which occurred during the course of financial year considered or in relation to the end of the office and/or employment. |
(1) For detailed information on Eni’s remuneration policy and compensation see the “Remuneration Report 2013” available on Eni’s website under the sections “Governance” and “Investor relations”.
- 48 -
Contents
Eni in 2012 Directors and officers
| Remuneration paid to Directors, Statutory Auditors, Chief Operating Officers, and other Managers with strategic responsibilities |
| (euro thousand) | Variable non-equity remuneration | |||
Name | Office | Term of office | Office expiry(*) | Fixed remuneration | Committee membership remuneration | Bonuses and other incentives | Profit sharing | Non-monetary benefits | Other remuneration | Total 2012 | Fair Value of equity remuneration | Severance indemnity for end of office or termination of employment | ||||||||||||
| Board of Directors | ||||||||||||||||||||||||
| Giuseppe Recchi | Chairman | 01.01 - 31.12 | 04.2014 | 765 | 245 | 4 | 1,014 | |||||||||||||||||
| Paolo Scaroni | CEO and General Manager | 01.01 - 31.12 | 04.2014 | 1,430 | 4,952 | 15 | 6,397 | |||||||||||||||||
| Carlo Cesare Gatto | Director | 01.01 - 31.12 | 04.2014 | 115 | 50 | 165 | ||||||||||||||||||
| Alessandro Lorenzi | Director | 01.01 - 31.12 | 04.2014 | 115 | 59 | 174 | ||||||||||||||||||
| Paolo Marchioni | Director | 01.01 - 31.12 | 04.2014 | 115 | 50 | 165 | ||||||||||||||||||
| Roberto Petri | Director | 01.01 - 31.12 | 04.2014 | 115 | 36 | 151 | ||||||||||||||||||
| Alessandro Profumo | Director | 01.01 - 31.12 | 04.2014 | 115 | 45 | 160 | ||||||||||||||||||
| Mario Resca | Director | 01.01 - 31.12 | 04.2014 | 115 | 45 | 160 | ||||||||||||||||||
| Francesco Taranto | Director | 01.01 - 31.12 | 04.2014 | 115 | 50 | 165 | ||||||||||||||||||
| Board of Statutory Auditors | 435 | 435 | ||||||||||||||||||||||
| Chief Operating Officers | ||||||||||||||||||||||||
| Claudio Descalzi | E&P Division | 01.01 - 31.12 | 04.2014 | 773 | 1,171 | 13 | 599 | 2,556 | ||||||||||||||||
| Domenico Dispenza | G&P Division | 01.01 - 31.12 | 04.2014 | 372 | 335 | 10 | 717 | |||||||||||||||||
| Angelo Fanelli | R&M Division | 01.01 - 31.12 | 04.2014 | 559 | 533 | 14 | 1,106 | |||||||||||||||||
| Other Managers with strategic responsibilities (**) | 5,432 | 6,597 | 133 | 145 | 12,307 | 2,917 | ||||||||||||||||||
| 10,571 | 335 | 13,833 | 189 | 744 | 25,672 | 2,917 | ||||||||||||||||||
(*) The term of office expires with the Shareholders’ Meeting approving the financial statements for the year ending December 31, 2013.
(**) Managers who were permanent members of the Company Management Committee during the course of the year and with the Chief Executive Officer and Chief Operating Officers of Eni’s Divisions, and those who report directly to the Chief Executive Officer (thirteen managers).
The following table sets out long-term variable components.
| Bonuses of the year | Bonuses of previous years | Other bonuses | ||||
| Name | Office | (euro thousand) | paid/ payable | deferred | deferral period | no longer payable | paid/ payable (a) | still deferred |
| Giuseppe Recchi | Chairman | 245 | ||||||||||||||
| Paolo Scaroni | CEO and General Manager | 2,110 | 3,150 | 896 | 2,842 | 6,522 | ||||||||||
| Claudio Descalzi | Chief Operating Officer E&P Division | 579 | 743 | 442 | 1,294 | 150 | ||||||||||
| Umberto Vergine | Chief Operating Officer G&P Division (b) | 191 | 387 | 144 | 447 | |||||||||||
| Angelo Fanelli | Chief Operating Officer R&M Division | 369 | 481 | 164 | 925 | |||||||||||
| Other Managers with strategic responsibilities (c) | 3,281 | 2,916 | 1,114 | 2,866 | 5,216 | 450 | ||||||||||
| 6,775 | 7,677 | 2,010 | 6,458 | 14,404 | 600 |
(a) Payment relative to deferred monetary incentive awarded in 2009.
(b) Chief Operating Officer G&P Division until December 4, 2012.
(c) Managers who were permanent members of the Company Management Committee, during the course of the year together with the Chief Executive Officer and Chief Operating Officers of Eni’s Divisions, and those who report directly to the Chief Executive Officer (thirteen managers).
| > Overall remuneration of key management personnel Remuneration of persons responsible of key positions in planning, direction and control functions of Eni Group companies, including executive and non-executive Directors, Chief Operating Officers and other managers with strategic responsibilities in charge at December 31, 2012, amounted to euro 33 million, as described in the table below: |
| ||||
| (euro million) | 2012 | ||||
| Fees and salaries | 21 | ||||
| Post employment benefits | 1 | ||||
| Other long-term benefits | 11 | ||||
| Indemnity upon termination of the office | 0 | ||||
| 33 | |||||

- 49 -
Contents
Eni in 2012 Investor information
Investor information
| > Eni share performance in 2012 In accordance with Article 5 of the By-laws, the Company’s share capital amounts to euro 4,005,358,876.00, fully-paid, and is represented by 3,634,185,330 ordinary registered shares without indication of par value. As of December 31, 2012, the decrease of No. 371,266,546 shares held in treasury compared to December 31, 2011 (No. 382,654,833 shares) was due to the cancellation of No. 371,173,546 shares, as | resolved by the Extraordinary and Ordinary Shareholders’ Meeting held on July 16, 2012 and to the sale of No. 93,000 shares following 2004 stock option plans. In the last session of 2012, the Eni share price, quoted on the Italian Stock Exchange, was euro 18.34, up 14.6 percentage points from the price quoted at the end of 2011 (euro 16.01). The Italian Stock Exchange is the primary market where the Eni share is traded. During the year the FTSE/MIB index, the basket including the 40 most | important shares listed on the Italian Stock Exchange, increased by 7.8 percentage points. At the end of 2012, the Eni ADR listed on the NYSE was $49.14, up 19.07% compared to the price registered in the last session of 2011 ($41.27). One ADR is equal to two Eni ordinary shares. In the same period the S&P 500 index increased by 13.2 percentage points. Eni market capitalization at the end of 2012 was euro 66.4 billion (euro 58 billion at the end of |
| Share information |
| 2010 | 2011 | 2012 | ||||||
| Market quotations for common stock on the Mercato Telematico Azionario (MTA) | ||||||||
| High | (euro) | 18.56 | 18.42 | 18.70 | ||||
| Low | 14.61 | 12.17 | 15.25 | |||||
| Average daily close | 16.39 | 15.95 | 17.18 | |||||
| Year-end close | 16.34 | 16.01 | 18.34 | |||||
| Market quotations for ADR on the New York Stock Exchange | ||||||||
| High | (US$) | 53.89 | 53.74 | 49.44 | ||||
| Low | 35.37 | 32.98 | 36.85 | |||||
| Average daily close | 43.56 | 44.41 | 44.24 | |||||
| Year-end close | 43.74 | 41.27 | 49.14 | |||||
| Average daily traded volumes | (million of shares) | 20.69 | 22.85 | 15.63 | ||||
| Value of traded volumes | (euro million) | 336 | 355 | 267 | ||||

- 50 -
Contents
Eni in 2012 Investor information
| 2011), confirming Eni as the first company for market capitalization listed on the Italian Stock Exchange. Shares traded during the year | totaled almost 3.9 billion, with a daily average of shares traded of 15.6 million (22.9 million in 2011). | The total trade value of Eni shares amounted to approximately euro 68 billion (euro 92 billion in 2011), equal to a daily average of euro 267 million. |
| Share data |
| 2010 | 2011 | 2012 | |||||||
| Net profit - continuing operations | |||||||||
| - per share (a) | (euro) | 1.72 | 1.90 | 1.16 | |||||
| - per ADR (a) (b) | (US$) | 4.59 | 5.29 | 2.98 | |||||
| Adjusted net profit - continuing operations | |||||||||
| - per share (a) | (euro) | 1.87 | 1.92 | 1.97 | |||||
| - per ADR (a) (b) | (US$) | 4.96 | 5.35 | 5.06 | |||||
| Leverage | 0.47 | 0.46 | 0.25 | ||||||
| Coverage | 22.2 | 15.4 | 11.7 | ||||||
| Current ratio | 1.00 | 1.10 | 1.40 | ||||||
| Debt coverage | 56.3 | 51.3 | 80.5 | ||||||
| Dividends pertaining to the year | (euro per share) | 1.00 | 1.04 | 1.08 | |||||
| Pay-out | (%) | 57 | 55 | 50 | |||||
| Dividend yield (c) | (%) | 6.1 | 6.6 | 5.9 | |||||
| TSR | (2.2) | 5.1 | 22.0 | ||||||
(a) Fully diluted. Ratio of net profit and average number of shares outstanding in the year. Dollar amounts are converted on the basis of the average EUR/USD exchange rate quoted by ECB for the year presented.
(b) One American Depositary Receipt (ADR) is equal two Eni ordinary shares.
(c) Ratio of dividend for the period and the average price of Eni shares as recorded in December.

Dividends
| Management intends to propose to the Annual Shareholders’ Meeting scheduled on May 10, 2013, the distribution of a dividend of euro 1.08 per share for fiscal year 2012, of which euro 0.54 was already paid as interim dividend in September 2012. Total cash outlay for the 2012 dividend is expected at approximately euro 3.9 billion (including euro 1.96 billion already paid in September 2012) in case the Annual Shareholders’ Meeting approves the annual dividend. In future years, management expects to continue paying interim dividends for each | fiscal year, with the balance to the full-year dividend to be paid in each following year. Eni intends to continue paying interim dividends in the future. Holders of ADRs receive their dividends in US dollars. The rate of exchange used to determine the amount in dollars is equal to the official rate recorded on the date of dividend payment in Italy (May 23, 2013). | (currently 27%) to all Depository Trust Company Participants, representing payment of Eni SpA’s gross dividend. By submitting to Bank of New York Mellon certain required documents with respect to each dividend payment, US holders of ADRs will enable the Italian Depositary bank and Bank of New York Mellon as ADR Depositary to pay the dividend at the reduced withholding tax rate of 15%. US shareholders can obtain relevant documents as well as a complete instruction packet to benefit from this tax relief by contacting Bank of New York Mellon at 1.201.680.6825. |
- 51 -
Contents
Eni in 2012 Investor information
Publications
|

| 1 | Annual Report 2012 a comprehensive report on Eni’s activities and financial and sustainability results for the year. | set of operating and financial statistics. | in the section Publications (eni.com/sites/ENI_en_IT/documentation/documentation.page?type=bilrap&leftbox=documentazione&doc_from=hpeni_left). Shareholders may receive a hard copy of Eni’s publications, free of charge, by filling in the request form found in the section Publications or through an email request addressed to segreteriasocietaria.azionisti@eni.com or to investor.relations@eni.com. Any other information relevant to shareholders and investors can be found at Eni’s website under the "Investor Relations" section. | |||||||
| 4 | Remuneration Report 2013 a report on Eni’s compensation and remuneration policies pursuant to rule 123-ter of Legislative Decree No. 58/1998. | |||||||||
| 2 | Annual Report on Form 20-F 2012 a comprehensive report on Eni’s activities and results to comply with the reporting requirements of the US Securities Exchange Act of 1934 and filed with the US Securities and Exchange Commission. | |||||||||
| 5 | Corporate Governance Report 2012 a report on the Corporate Governance system adopted by Eni pursuant to rule 123-bis of Legislative Decree No. 58/1998. | |||||||||
| 3 | Fact Book 2012 a report on Eni’s businesses, strategies, objectives and development projects, including a full | |||||||||
| These and other Eni publications are available on Eni’s internet site eni.com, | ||||||||||
| Financial calendar | ||||||||||
| The dates of the Board of Directors’ meetings to be held during 2013 in order to approve/review the Company’s quarterly and semi-annual, and annual preliminary results are the following: | Results for the first quarter of 2013 | April 24, 2013 |
| Results for the second quarter and the first half of 2013 and proposal of interim dividend for the financial year 2013 | July 31, 2013 | |
| Results for the third quarter of 2013 | October 29, 2013 | |
| Preliminary full-year results for the year ending December 31, 2013 and dividend proposal for the financial year 2013 | February 2014 |
- 52 -
Contents

Contents

Contents
Contents

Table of Contents
Eni Shareholders approve 2012 Financial Statements
at Annual Meeting
- 2012 net profit euro 9.07 billion
- Total dividend per share for 2012 of euro 1.08
- Remuneration Report approved
- Authorization to the Board of Directors to acquire treasury shares
Rome, May 10, 2013 - The Ordinary General Meeting of Eni’s shareholders which was held today, resolved the following:
- to approve Eni SpA’s Financial Statements at December 31, 2012, which reported a net profit amounting to 9,078,358,525.02 euro;
- to allocate net profit for the period of 9,078,358,525.02 euro, of which 7,122,048,121.80 euro remain following the distribution of the 2012 interim dividend of 0.54 euro per share, approved by the Board of Directors on September 20, 2012, as follows:
- an amount of 2,603,272,923.40 euro to the reserve required by Article 6, paragraph 1, letter a) of Legislative Decree No. 38 of February 28, 2005;
- an amount of 3,391,234,297.34 euro to the optional reserve;
- the remaining profit and where necessary, using the available reserve, allocated to shareholders in the form of a dividend of 0.54 euro per share owned and outstanding at the ex-dividend date, thus completing payment of the dividend for the financial year 2012. The total dividend per share for financial year 2012 therefore amounts to 1.08 euro per share; - the payment of the balance of the 2012 dividend amounting to 0.54 euro, payable starting from May 23, 2013, with an ex-dividend date of May 20, 2013 and a record date of May 22, 2013;
- in favor of the first section of the Remuneration report regarding the company’s policy on the remuneration of board directors, general managers and executives with strategic responsibilities and the procedures used to adopt and implement this policy;
- to cancel, for the portion not yet implemented as of the date of the Shareholders’ Meeting, the authorization for the Board of Directors to acquire treasury shares as resolved at the Shareholders’ Meeting of July 16, 2012;
- to authorize the Board of Directors to purchase on the Mercato Telematico Azionario - in one or more transactions and in any case within 18 months from the date of the resolution - up to a maximum number of 363,000,000 ordinary Eni shares, for a price of no less than euro 1.102 and not more than the official price reported by the Borsa Italiana for the shares on the trading day prior to each individual transaction, plus 5%, and in any case up to a total amount of euro 6,000,000,000.00, in accordance with
- 1 -
Table of Contents
the procedures established in the Rules of the Markets organized and managed by Borsa Italiana SpA. In order to respect the limit envisaged in the third paragraph of Article 2357 of the Italian Civil Code, the number of shares to be acquired and the relative amount shall take into account the number and amount of Eni shares already held in the portfolio.
Company Contacts:
Press Office: Tel. +39.0252031875 - +39.06598232030
Freephone for shareholders (from Italy): 800940924
Freephone for shareholders (from abroad): +39. 800 11 22 34 56
Switchboard: +39-0659821
ufficio.stampa@eni.com
segreteriasocietaria.azionisti@eni.com
investor.relations@eni.com
Web site: www.eni.com
- 2 -
Table of Contents

Table of Contents
Eni and Sonatrach reached an agreement on their gas contract
San Donato Milanese (Milan), May 28, 2013 - Eni and Sonatrach have agreed on a package solution for 2013 and 2014 within the framework of their commercial discussions under the existing gas contract.
As part of the Agreement, Eni and Sonatrach will reduce certain quantities of the contractual gas volumes delivered into Italy.
This agreement is part of the renegotiations program started in the recent months, and contributes to the announced objectives of profitability and cash generation.
Company Contacts:
Press Office: Tel. +39.0252031875 - +39.06598232030
Freephone for shareholders (from Italy): 800940924
Freephone for shareholders (from abroad): +39. 800 11 22 34 56
Switchboard: +39-0659821
ufficio.stampa@eni.com
segreteriasocietaria.azionisti@eni.com
investor.relations@eni.com
Web site: www.eni.com
Table of Contents
Eni: Board of Directors approves bond issue
San Donato Milanese (Milan) May 30, 2013 - Eni's Board of Directors this afternoon approved the possible issue of one or more bonds, to be placed with institutional investors, with a value of up to a maximum amount of 3 billion euro, or its equivalent in other currencies, to be issued in one or more tranches by May 30, 2014.
The bonds will enable Eni to maintain a well-balanced financial structure, in terms of short term and medium/long-term debt and average duration of the debt. The bonds may be listed on regulated markets.
Company Contacts:
Press Office: Tel. +39.0252031875 - +39.06598232030
Freephone for shareholders (from Italy): 800940924
Freephone for shareholders (from abroad): +39. 800 11 22 34 56
Switchboard: +39-0659821
ufficio.stampa@eni.com
segreteriasocietaria.azionisti@eni.com
investor.relations@eni.com
Web site: www.eni.com