UNITED STATES SECURITIES AND EXCHANGE COMMISSION
Washington, D.C. 20549
Form N-CSR
CERTIFIED SHAREHOLDER REPORT OF REGISTERED
MANAGEMENT INVESTMENT COMPANIES
Investment Company Act File Number: 811-07377
Morgan Stanley Insight Fund
(Exact Name of Registrant as Specified in Charter)
1585 Broadway, New York, New York 10036
(Address of Principal Executive Offices)
John H. Gernon
1585 Broadway, New York, New York 10036
(Name and Address of Agent for Services)
(212) 762-1886
(Registrant’s Telephone Number)
December 31
Date of Fiscal Year End
June 30, 2024
Date of Reporting Period
Item 1. Reports to Stockholders
(a)
TABLE OF CONTENTS
Morgan Stanley Insight Fund
Semi-Annual Shareholder Report June 30, 2024
This semi-annual shareholder report contains important information about Morgan Stanley Insight Fund for the period of January 1, 2024 to June 30, 2024. You can find additional information about the Fund at www.morganstanley.com/im/shareholderreports. You can also request this information by contacting us at 1-800-869-6397.
What were the Fund costs for the last six months?
(based on a hypothetical $10,000 investment)
| Class Name | Costs of a $10,000 investment | Costs paid as a percentage of a $10,000 investment |
|---|
| Class A | $57 | 1.15% |
| Total Net Assets | $1,185,710,072 |
| # of Portfolio Holdings | 40 |
| Portfolio Turnover Rate | 19% |
What did the Fund invest in?
The following tables reflect what the Fund invested in as of the report date.
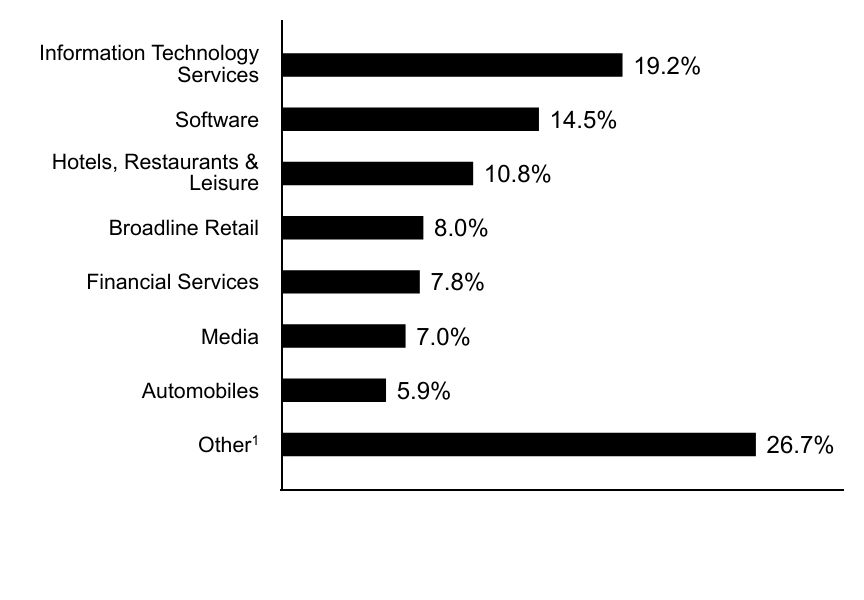
Sector Allocation (% of total investments)
| Value | Value |
|---|
OtherFootnote Reference1 | 26.7% |
| Automobiles | 5.9% |
| Media | 7.0% |
| Financial Services | 7.8% |
| Broadline Retail | 8.0% |
| Hotels, Restaurants & Leisure | 10.8% |
| Software | 14.5% |
| Information Technology Services | 19.2% |
| Footnote | Description |
Footnote1 | Industries and/or investment types representing less than 5% of total investments. |
Top Ten Holdings (% of total investments)
| Cloudflare, Inc. | 8.1% |
| Trade Desk, Inc. | 6.7% |
| DoorDash, Inc. | 6.2% |
| Tesla, Inc. | 5.7% |
| Shopify, Inc. | 5.5% |
| Global-e Online Ltd. | 5.2% |
| Snowflake, Inc. | 4.7% |
| ROBLOX Corp. | 4.7% |
| Affirm Holdings, Inc. | 4.5% |
| Airbnb, Inc. | 4.5% |
| Total | 55.8% |
If you wish to view additional information about the Fund, including the prospectus, statement of additional information, financial statements and holdings, please scan the QR code or visit www.morganstanley.com/im/shareholderreports. For proxy information, please visit www.morganstanley.com/im/en-us/institutional-investor/about-us/proxy-voting/vote-summary-report.desktop.html.
The Funds may deliver a single copy of certain required shareholder documents (including prospectuses, shareholder reports, and proxy materials) to investors with the same last name and the same address. Your participation will continue indefinitely unless you instruct otherwise by calling 1-800-869-6397 or by contacting your financial intermediary. Your instruction will typically be effective within 30 days of receipt.
Not FDIC Insured | May Lose Value | No Bank Guarantee
Semi-Annual Shareholder Report June 30, 2024
Morgan Stanley Insight Fund
Semi-Annual Shareholder Report June 30, 2024
This semi-annual shareholder report contains important information about Morgan Stanley Insight Fund for the period of January 1, 2024 to June 30, 2024. You can find additional information about the Fund at www.morganstanley.com/im/shareholderreports. You can also request this information by contacting us at 1-800-869-6397.
What were the Fund costs for the last six months?
(based on a hypothetical $10,000 investment)
| Class Name | Costs of a $10,000 investment | Costs paid as a percentage of a $10,000 investment |
|---|
| Class C | $94 | 1.90% |
| Total Net Assets | $1,185,710,072 |
| # of Portfolio Holdings | 40 |
| Portfolio Turnover Rate | 19% |
What did the Fund invest in?
The following tables reflect what the Fund invested in as of the report date.
Sector Allocation (% of total investments)
| Value | Value |
|---|
OtherFootnote Reference1 | 26.7% |
| Automobiles | 5.9% |
| Media | 7.0% |
| Financial Services | 7.8% |
| Broadline Retail | 8.0% |
| Hotels, Restaurants & Leisure | 10.8% |
| Software | 14.5% |
| Information Technology Services | 19.2% |
| Footnote | Description |
Footnote1 | Industries and/or investment types representing less than 5% of total investments. |
Top Ten Holdings (% of total investments)
| Cloudflare, Inc. | 8.1% |
| Trade Desk, Inc. | 6.7% |
| DoorDash, Inc. | 6.2% |
| Tesla, Inc. | 5.7% |
| Shopify, Inc. | 5.5% |
| Global-e Online Ltd. | 5.2% |
| Snowflake, Inc. | 4.7% |
| ROBLOX Corp. | 4.7% |
| Affirm Holdings, Inc. | 4.5% |
| Airbnb, Inc. | 4.5% |
| Total | 55.8% |
If you wish to view additional information about the Fund, including the prospectus, statement of additional information, financial statements and holdings, please scan the QR code or visit www.morganstanley.com/im/shareholderreports. For proxy information, please visit www.morganstanley.com/im/en-us/institutional-investor/about-us/proxy-voting/vote-summary-report.desktop.html.
The Funds may deliver a single copy of certain required shareholder documents (including prospectuses, shareholder reports, and proxy materials) to investors with the same last name and the same address. Your participation will continue indefinitely unless you instruct otherwise by calling 1-800-869-6397 or by contacting your financial intermediary. Your instruction will typically be effective within 30 days of receipt.
Not FDIC Insured | May Lose Value | No Bank Guarantee
Semi-Annual Shareholder Report June 30, 2024
Morgan Stanley Insight Fund
Semi-Annual Shareholder Report June 30, 2024
This semi-annual shareholder report contains important information about Morgan Stanley Insight Fund for the period of January 1, 2024 to June 30, 2024. You can find additional information about the Fund at www.morganstanley.com/im/shareholderreports. You can also request this information by contacting us at 1-800-869-6397.
What were the Fund costs for the last six months?
(based on a hypothetical $10,000 investment)
| Class Name | Costs of a $10,000 investment | Costs paid as a percentage of a $10,000 investment |
|---|
| Class I | $45 | 0.91% |
| Total Net Assets | $1,185,710,072 |
| # of Portfolio Holdings | 40 |
| Portfolio Turnover Rate | 19% |
What did the Fund invest in?
The following tables reflect what the Fund invested in as of the report date.
Sector Allocation (% of total investments)
| Value | Value |
|---|
OtherFootnote Reference1 | 26.7% |
| Automobiles | 5.9% |
| Media | 7.0% |
| Financial Services | 7.8% |
| Broadline Retail | 8.0% |
| Hotels, Restaurants & Leisure | 10.8% |
| Software | 14.5% |
| Information Technology Services | 19.2% |
| Footnote | Description |
Footnote1 | Industries and/or investment types representing less than 5% of total investments. |
Top Ten Holdings (% of total investments)
| Cloudflare, Inc. | 8.1% |
| Trade Desk, Inc. | 6.7% |
| DoorDash, Inc. | 6.2% |
| Tesla, Inc. | 5.7% |
| Shopify, Inc. | 5.5% |
| Global-e Online Ltd. | 5.2% |
| Snowflake, Inc. | 4.7% |
| ROBLOX Corp. | 4.7% |
| Affirm Holdings, Inc. | 4.5% |
| Airbnb, Inc. | 4.5% |
| Total | 55.8% |
If you wish to view additional information about the Fund, including the prospectus, statement of additional information, financial statements and holdings, please scan the QR code or visit www.morganstanley.com/im/shareholderreports. For proxy information, please visit www.morganstanley.com/im/en-us/institutional-investor/about-us/proxy-voting/vote-summary-report.desktop.html.
The Funds may deliver a single copy of certain required shareholder documents (including prospectuses, shareholder reports, and proxy materials) to investors with the same last name and the same address. Your participation will continue indefinitely unless you instruct otherwise by calling 1-800-869-6397 or by contacting your financial intermediary. Your instruction will typically be effective within 30 days of receipt.
Not FDIC Insured | May Lose Value | No Bank Guarantee
Semi-Annual Shareholder Report June 30, 2024
Morgan Stanley Insight Fund
Semi-Annual Shareholder Report June 30, 2024
This semi-annual shareholder report contains important information about Morgan Stanley Insight Fund for the period of January 1, 2024 to June 30, 2024. You can find additional information about the Fund at www.morganstanley.com/im/shareholderreports. You can also request this information by contacting us at 1-800-869-6397.
What were the Fund costs for the last six months?
(based on a hypothetical $10,000 investment)
| Class Name | Costs of a $10,000 investment | Costs paid as a percentage of a $10,000 investment |
|---|
| Class IR | $40 | 0.81% |
| Total Net Assets | $1,185,710,072 |
| # of Portfolio Holdings | 40 |
| Portfolio Turnover Rate | 19% |
What did the Fund invest in?
The following tables reflect what the Fund invested in as of the report date.
Sector Allocation (% of total investments)
| Value | Value |
|---|
OtherFootnote Reference1 | 26.7% |
| Automobiles | 5.9% |
| Media | 7.0% |
| Financial Services | 7.8% |
| Broadline Retail | 8.0% |
| Hotels, Restaurants & Leisure | 10.8% |
| Software | 14.5% |
| Information Technology Services | 19.2% |
| Footnote | Description |
Footnote1 | Industries and/or investment types representing less than 5% of total investments. |
Top Ten Holdings (% of total investments)
| Cloudflare, Inc. | 8.1% |
| Trade Desk, Inc. | 6.7% |
| DoorDash, Inc. | 6.2% |
| Tesla, Inc. | 5.7% |
| Shopify, Inc. | 5.5% |
| Global-e Online Ltd. | 5.2% |
| Snowflake, Inc. | 4.7% |
| ROBLOX Corp. | 4.7% |
| Affirm Holdings, Inc. | 4.5% |
| Airbnb, Inc. | 4.5% |
| Total | 55.8% |
If you wish to view additional information about the Fund, including the prospectus, statement of additional information, financial statements and holdings, please scan the QR code or visit www.morganstanley.com/im/shareholderreports. For proxy information, please visit www.morganstanley.com/im/en-us/institutional-investor/about-us/proxy-voting/vote-summary-report.desktop.html.
The Funds may deliver a single copy of certain required shareholder documents (including prospectuses, shareholder reports, and proxy materials) to investors with the same last name and the same address. Your participation will continue indefinitely unless you instruct otherwise by calling 1-800-869-6397 or by contacting your financial intermediary. Your instruction will typically be effective within 30 days of receipt.
Not FDIC Insured | May Lose Value | No Bank Guarantee
Semi-Annual Shareholder Report June 30, 2024
Morgan Stanley Insight Fund
Semi-Annual Shareholder Report June 30, 2024
This semi-annual shareholder report contains important information about Morgan Stanley Insight Fund for the period of January 1, 2024 to June 30, 2024. You can find additional information about the Fund at www.morganstanley.com/im/shareholderreports. You can also request this information by contacting us at 1-800-869-6397.
What were the Fund costs for the last six months?
(based on a hypothetical $10,000 investment)
| Class Name | Costs of a $10,000 investment | Costs paid as a percentage of a $10,000 investment |
|---|
| Class L | $81 | 1.64% |
| Total Net Assets | $1,185,710,072 |
| # of Portfolio Holdings | 40 |
| Portfolio Turnover Rate | 19% |
What did the Fund invest in?
The following tables reflect what the Fund invested in as of the report date.
Sector Allocation (% of total investments)
| Value | Value |
|---|
OtherFootnote Reference1 | 26.7% |
| Automobiles | 5.9% |
| Media | 7.0% |
| Financial Services | 7.8% |
| Broadline Retail | 8.0% |
| Hotels, Restaurants & Leisure | 10.8% |
| Software | 14.5% |
| Information Technology Services | 19.2% |
| Footnote | Description |
Footnote1 | Industries and/or investment types representing less than 5% of total investments. |
Top Ten Holdings (% of total investments)
| Cloudflare, Inc. | 8.1% |
| Trade Desk, Inc. | 6.7% |
| DoorDash, Inc. | 6.2% |
| Tesla, Inc. | 5.7% |
| Shopify, Inc. | 5.5% |
| Global-e Online Ltd. | 5.2% |
| Snowflake, Inc. | 4.7% |
| ROBLOX Corp. | 4.7% |
| Affirm Holdings, Inc. | 4.5% |
| Airbnb, Inc. | 4.5% |
| Total | 55.8% |
If you wish to view additional information about the Fund, including the prospectus, statement of additional information, financial statements and holdings, please scan the QR code or visit www.morganstanley.com/im/shareholderreports. For proxy information, please visit www.morganstanley.com/im/en-us/institutional-investor/about-us/proxy-voting/vote-summary-report.desktop.html.
The Funds may deliver a single copy of certain required shareholder documents (including prospectuses, shareholder reports, and proxy materials) to investors with the same last name and the same address. Your participation will continue indefinitely unless you instruct otherwise by calling 1-800-869-6397 or by contacting your financial intermediary. Your instruction will typically be effective within 30 days of receipt.
Not FDIC Insured | May Lose Value | No Bank Guarantee
Semi-Annual Shareholder Report June 30, 2024
Morgan Stanley Insight Fund
Semi-Annual Shareholder Report June 30, 2024
This semi-annual shareholder report contains important information about Morgan Stanley Insight Fund for the period of January 1, 2024 to June 30, 2024. You can find additional information about the Fund at www.morganstanley.com/im/shareholderreports. You can also request this information by contacting us at 1-800-869-6397.
What were the Fund costs for the last six months?
(based on a hypothetical $10,000 investment)
| Class Name | Costs of a $10,000 investment | Costs paid as a percentage of a $10,000 investment |
|---|
| Class R6 | $40 | 0.81% |
| Total Net Assets | $1,185,710,072 |
| # of Portfolio Holdings | 40 |
| Portfolio Turnover Rate | 19% |
What did the Fund invest in?
The following tables reflect what the Fund invested in as of the report date.
Sector Allocation (% of total investments)
| Value | Value |
|---|
OtherFootnote Reference1 | 26.7% |
| Automobiles | 5.9% |
| Media | 7.0% |
| Financial Services | 7.8% |
| Broadline Retail | 8.0% |
| Hotels, Restaurants & Leisure | 10.8% |
| Software | 14.5% |
| Information Technology Services | 19.2% |
| Footnote | Description |
Footnote1 | Industries and/or investment types representing less than 5% of total investments. |
Top Ten Holdings (% of total investments)
| Cloudflare, Inc. | 8.1% |
| Trade Desk, Inc. | 6.7% |
| DoorDash, Inc. | 6.2% |
| Tesla, Inc. | 5.7% |
| Shopify, Inc. | 5.5% |
| Global-e Online Ltd. | 5.2% |
| Snowflake, Inc. | 4.7% |
| ROBLOX Corp. | 4.7% |
| Affirm Holdings, Inc. | 4.5% |
| Airbnb, Inc. | 4.5% |
| Total | 55.8% |
If you wish to view additional information about the Fund, including the prospectus, statement of additional information, financial statements and holdings, please scan the QR code or visit www.morganstanley.com/im/shareholderreports. For proxy information, please visit www.morganstanley.com/im/en-us/institutional-investor/about-us/proxy-voting/vote-summary-report.desktop.html.
The Funds may deliver a single copy of certain required shareholder documents (including prospectuses, shareholder reports, and proxy materials) to investors with the same last name and the same address. Your participation will continue indefinitely unless you instruct otherwise by calling 1-800-869-6397 or by contacting your financial intermediary. Your instruction will typically be effective within 30 days of receipt.
Not FDIC Insured | May Lose Value | No Bank Guarantee
Semi-Annual Shareholder Report June 30, 2024
(b) Not applicable.
Item 2. Code of Ethics
Not required in this filing.
Item 3. Audit Committee Financial Expert
Not required in this filing.
Item 4. Principal Accountant Fees and Services
Not required in this filing.
Item 5. Audit Committee of Listed Registrants
Not applicable.
Item 6. Schedule of Investments
| (a) | Please see schedule of investments contained in the Financial Statements and Financial Highlights included under Item 7 of this Form N-CSR. |
Item 7. Financial Statements and Financial Highlights for Open-End Management Investment Companies

Morgan Stanley Insight Fund
Semi-Annual Financial Statements and Additional Information
June 30, 2024

Morgan Stanley Insight Fund
Table of Contents (unaudited)
2
Morgan Stanley Insight Fund
Consolidated Portfolio of Investments ◼ June 30, 2024 (unaudited)
NUMBER OF
SHARES | |
| | VALUE | |
| | | Common Stocks (93.8%) | |
| | | Automobiles (6.0%) | |
| | 191,761 | | | Rivian Automotive, Inc.,
Class A (a) | | $ | 2,573,433 | | |
| | 347,924 | | | Tesla, Inc. (a) | | | 68,847,201 | | |
| | | | 71,420,634 | | |
| | | Biotechnology (3.0%) | |
| | 4,237,726 | | | Arbutus Biopharma
Corp. (a) | | | 13,094,573 | | |
| | 50,745 | | | Intellia Therapeutics,
Inc. (a) | | | 1,135,673 | | |
| | 795,260 | | | ProKidney Corp. (a) | | | 1,956,340 | | |
| | 1,787,591 | | | Roivant Sciences Ltd. (a) | | | 18,894,837 | | |
| | 34,830 | | | XOMA Corp. (a) | | | 825,123 | | |
| | | | 35,906,546 | | |
| | | Broadline Retail (8.1%) | |
| | 1,725,611 | | | Global-e Online Ltd.
(Israel) (a) | | | 62,587,911 | | |
| | 20,685 | | | MercadoLibre, Inc. (a) | | | 33,993,729 | | |
| | | | 96,581,640 | | |
| | | Electronic Equipment,
Instruments &
Components (0.0%) | |
| | 3,889 | | | Magic Leap, Inc., Class A
(acquisition cost -
$1,890,214; acquired
12/22/15) (a)(b)(c) | | | — | | |
| | | Entertainment (4.7%) | |
| | 1,495,802 | | | ROBLOX Corp.,
Class A (a) | | | 55,658,792 | | |
| | | Financial Services (7.9%) | |
| | 32,915 | | | Adyen NV (Netherlands) (a) | | | 39,092,343 | | |
| | 1,805,597 | | | Affirm Holdings, Inc. (a) | | | 54,547,085 | | |
| | | | 93,639,428 | | |
| | | Ground Transportation (3.4%) | |
| | 555,681 | | | Uber Technologies, Inc. (a) | | | 40,386,895 | | |
| | | Health Care Providers &
Services (1.9%) | |
| | 3,437,932 | | | Agilon Health, Inc. (a) | | | 22,484,075 | | |
NUMBER OF
SHARES | |
| | VALUE | |
| | | Health Care Technology (0.6%) | |
| | 236,479 | | | Doximity, Inc., Class A (a) | | $ | 6,614,318 | | |
| | | Hotels, Restaurants &
Leisure (10.9%) | |
| | 353,627 | | | Airbnb, Inc., Class A (a) | | | 53,620,462 | | |
| | 689,433 | | | DoorDash, Inc., Class A (a) | | | 74,996,522 | | |
| | | | 128,616,984 | | |
| | | Information Technology
Services (19.4%) | |
| | 1,180,437 | | | Cloudflare, Inc., Class A (a) | | | 97,775,596 | | |
| | 1,473,021 | | | Fastly, Inc., Class A (a) | | | 10,856,165 | | |
| | 995,079 | | | Shopify, Inc., Class A
(Canada) (a) | | | 65,724,968 | | |
| | 414,166 | | | Snowflake, Inc., Class A (a) | | | 55,949,685 | | |
| | | | 230,306,414 | | |
| | | Leisure Products (0.8%) | |
| | 2,956,954 | | | Peloton Interactive, Inc.,
Class A (a) | | | 9,994,504 | | |
| | | Life Sciences Tools &
Services (0.3%) | |
| | 185,761 | | | 10X Genomics, Inc.,
Class A (a) | | | 3,613,051 | | |
| | | Media (7.1%) | |
| | 338,950 | | | Cardlytics, Inc. (a) | | | 2,782,780 | | |
| | 828,045 | | | Trade Desk, Inc.,
Class A (a) | | | 80,875,155 | | |
| | | | 83,657,935 | | |
| | | Pharmaceuticals (4.4%) | |
| | 1,962,005 | | | Royalty Pharma PLC,
Class A | | | 51,738,072 | | |
| | | Software (11.5%) | |
| | 381,564 | | | Appian Corp., Class A (a) | | | 11,775,065 | | |
| | 6,028,293 | | | Aurora Innovation, Inc. (a) | | | 16,698,372 | | |
| | 298,897 | | | Bill Holdings, Inc. (a) | | | 15,727,960 | | |
| | 26,173 | | | MicroStrategy, Inc.,
Class A (a) | | | 36,052,784 | | |
| | 1,240,853 | | | QXO, Inc. (a)(d) | | | 11,341,397 | | |
| | 1,325,612 | | | Samsara, Inc., Class A (a) | | | 44,673,124 | | |
| | | | 136,268,702 | | |
See Notes to Consolidated Financial Statements
3
Morgan Stanley Insight Fund
Consolidated Portfolio of Investments ◼ June 30, 2024 (unaudited) continued
NUMBER OF
SHARES | |
| | VALUE | |
| | | Specialty Retail (3.8%) | |
| | 346,624 | | | Carvana Co. (a) | | $ | 44,617,441 | | |
| | | | | Total Common Stocks
(Cost $ 972,991,110) | | | 1,111,505,431 | | |
| | | Preferred Stocks (3.2%) | |
| | | Software (3.2%) | |
| | 523,556 | | | Databricks, Inc.,
Series H (a)(b)(c)
(acquisition cost -
$38,473,059; acquired
8/31/21) | | | 37,785,037 | | |
| | 197,427 | | | Lookout, Inc., Series F (a)(b)(c)
(acquisition cost -
$2,255,228; acquired
6/17/14) | | | 489,619 | | |
| | | | | Total Preferred Stocks
(Cost $ 40,728,287) | | | 38,274,656 | | |
| | | Investment Company (2.4%) | |
| | 846,547 | | | iShares Bitcoin Trust (a)
(Cost $32,756,544) | | | 28,901,114 | | |
NUMBER OF
SHARES (000) | | | |
| |
| | | Short-Term Investment (1.9%) | |
| | | Investment Company (1.9%) | |
| | 22,385 | | | Morgan Stanley Institutional
Liquidity Funds - Treasury
Securities Portfolio -
Institutional Class, 5.14%
(See Note 9)
(Cost $22,384,930) | | | 22,384,930 | | |
| Total Investments
Excluding Purchased
Options
(Cost $1,068,860,871) | | | | 101.3 | % | | | 1,201,066,131 | | |
NUMBER OF
SHARES (000) | |
| | VALUE | |
Total Purchased Options
Outstanding
(Cost $4,532,075) | | | 0.1 | % | | $ | 1,384,923 | | |
Total Investments
(Cost $1,073,392,946)
(e)(f)(g) | | | 101.4 | % | | | 1,202,451,054 | | |
Liabilities in Excess of
Other Assets | | | (1.4 | ) | | | (16,740,982 | ) | |
Net Assets | | | 100.0 | % | | $ | 1,185,710,072 | | |
(a) Non-income producing security.
(b) Security cannot be offered for public resale without first being registered under the Securities Act of 1933 and related rules ("restricted security"). Acquisition date represents the day on which an enforceable right to acquire such security is obtained and is presented along with related cost in the security description. The Fund has registration rights for certain restricted securities. Any costs related to such registration are borne by the issuer. The aggregate value of restricted securities (excluding 144A holdings) at June 30, 2024 amounts to $38,274,656 and represents 3.2% of net assets.
(c) At June 30, 2024, the Fund held fair valued securities valued at $38,274,656, representing 3.2% of net assets. These holdings have been fair valued using significant unobservable inputs as determined in good faith under procedures established by and under the general supervision of the Fund's (as defined herein) Trustees.
(d) Security cannot be offered for public resale without first being registered under the Securities Act of 1933 and related rules ("restricted security"). The aggregate value of restricted securities (excluding 144A holdings) at June 30, 2024 amounts to $11,341,397 and represents 1.0% of net assets.
(e) The fair value and percentage of net assets, $39,092,343 and 3.3%, respectively, represent the securities that have been fair valued under the fair valuation policy for international investments as described in Note A-1 within the Notes to Consolidated Financial Statements.
(f) Securities are available for collateral in connection with purchased options.
See Notes to Consolidated Financial Statements
4
Morgan Stanley Insight Fund
Consolidated Portfolio of Investments ◼ June 30, 2024 (unaudited) continued
(g) At June 30, 2024, the aggregate cost for federal income tax purposes approximates the aggregate cost for book purposes. The aggregate gross unrealized appreciation is $268,653,457 and the aggregate gross unrealized depreciation is $139,595,349, resulting in net unrealized appreciation of $129,058,108.
Call Options Purchased:
The Fund had the following call options purchased open at June 30, 2024:
COUNTERPARTY | |
DESCRIPTION | |
STRIKE
PRICE | |
EXPIRATION
DATE | |
NUMBER OF
CONTRACTS | | NOTIONAL
AMOUNT
(000) | |
VALUE | |
PREMIUMS
PAID | |
UNREALIZED
DEPRECIATION | |
Goldman Sachs &
Co. LLC | | USD/CNH | | CNH | 7.69 | | | Jan-25 | | | 391,056,861 | | | $ | 391,057 | | | $ | 638,596 | | | $ | 1,479,679 | | | $ | (841,083 | ) | |
JPMorgan Chase
Bank NA | | USD/CNH | | CNH | 7.78 | | | Mar-25 | | | 347,874,941 | | | | 347,875 | | | | 732,625 | | | | 1,476,729 | | | | (744,104 | ) | |
JPMorgan Chase
Bank NA | | USD/CNH | | CNH | 7.79 | | | Aug-24 | | | 380,595,801 | | | | 380,596 | | | | 13,702 | | | | 1,575,667 | | | | (1,561,965 | ) | |
| | | | | | | | | | | | | $ | 1,384,923 | | | $ | 4,532,075 | | | $ | (3,147,152 | ) | |
CNH — Chinese Yuan Renminbi Offshore
USD — United States Dollar
See Notes to Consolidated Financial Statements
5
Morgan Stanley Insight Fund
Consolidated Portfolio of Investments ◼ June 30, 2024 (unaudited) continued
Consolidated Summary of Investments
INDUSTRY | | VALUE | | PERCENT OF
TOTAL
INVESTMENTS | |
Information Technology Services | | $ | 230,306,414 | | | | 19.2 | % | |
Software | | | 174,543,358 | | | | 14.5 | | |
Hotels, Restaurants & Leisure | | | 128,616,984 | | | | 10.7 | | |
Broadline Retail | | | 96,581,640 | | | | 8.0 | | |
Financial Services | | | 93,639,428 | | | | 7.8 | | |
Media | | | 83,657,935 | | | | 7.0 | | |
Automobiles | | | 71,420,634 | | | | 5.9 | | |
Entertainment | | | 55,658,792 | | | | 4.6 | | |
Pharmaceuticals | | | 51,738,072 | | | | 4.3 | | |
Investment Companies | | | 51,286,044 | | | | 4.3 | | |
Specialty Retail | | | 44,617,441 | | | | 3.7 | | |
Ground Transportation | | | 40,386,895 | | | | 3.4 | | |
Biotechnology | | | 35,906,546 | | | | 3.0 | | |
Health Care Providers & Services | | | 22,484,075 | | | | 1.9 | | |
Leisure Products | | | 9,994,504 | | | | 0.8 | | |
Health Care Technology | | | 6,614,318 | | | | 0.5 | | |
Life Sciences Tools & Services | | | 3,613,051 | | | | 0.3 | | |
Purchased Options | | | 1,384,923 | | | | 0.1 | | |
Electronic Equipment, Instruments & Components | | | — | † | | | 0.0 | | |
Total Investments | | $ | 1,202,451,054 | | | | 100.0 | % | |
† Includes a security valued at zero.
See Notes to Consolidated Financial Statements
6
Morgan Stanley Insight Fund
Consolidated Financial Statements
Consolidated Statement of Assets and Liabilities June 30, 2024 (unaudited)
Assets: | |
Investments in securities, at value (cost $1,051,008,016) | | $ | 1,180,066,124 | | |
Investment in affiliate, at value (cost $22,384,930) | | | 22,384,930 | | |
Total investments in securities, at value (cost $1,073,392,946) | | | 1,202,451,054 | | |
Receivable for: | |
Shares of beneficial interest sold | | | 307,373 | | |
Investments sold | | | 151,732 | | |
Dividends from affiliate | | | 51,633 | | |
Securities lending income | | | 13,628 | | |
Prepaid expenses and other assets | | | 227,185 | | |
Total Assets | | | 1,203,202,605 | | |
Liabilities: | |
Due to broker | | | 1,470,000 | | |
Payable for: | |
Investments purchased | | | 11,695,337 | | |
Shares of beneficial interest redeemed | | | 2,803,388 | | |
Advisory fee | | | 634,856 | | |
Transfer and sub transfer agency fees | | | 309,440 | | |
Distribution fee | | | 208,780 | | |
Administration fee | | | 77,679 | | |
Accrued expenses and other payables | | | 293,053 | | |
Total Liabilities | | | 17,492,533 | | |
Net Assets | | $ | 1,185,710,072 | | |
Composition of Net Assets: | |
Paid-in-Capital | | $ | 2,837,609,406 | | |
Total Accumulated Loss | | | (1,651,899,334 | ) | |
Net Assets | | $ | 1,185,710,072 | | |
Class A Shares: | |
Net Assets | | $ | 638,491,142 | | |
| Shares Outstanding (unlimited shares authorized, $0.01 par value) | | | 24,457,068 | | |
Net Asset Value Per Share | | $ | 26.11 | | |
Maximum Offering Price Per Share,
(net asset value plus 5.54% of net asset value) | | $ | 27.56 | | |
Class L Shares: | |
Net Assets | | $ | 13,500,666 | | |
| Shares Outstanding (unlimited shares authorized, $0.01 par value) | | | 1,246,155 | | |
Net Asset Value Per Share | | $ | 10.83 | | |
Class I Shares: | |
Net Assets | | $ | 439,019,598 | | |
| Shares Outstanding (unlimited shares authorized, $0.01 par value) | | | 13,510,007 | | |
Net Asset Value Per Share | | $ | 32.50 | | |
Class C Shares: | |
Net Assets | | $ | 86,497,435 | | |
| Shares Outstanding (unlimited shares authorized, $0.01 par value) | | | 8,650,247 | | |
Net Asset Value Per Share | | $ | 10.00 | | |
Class R6 Shares: | |
Net Assets | | $ | 8,189,896 | | |
| Shares Outstanding (unlimited shares authorized, $0.01 par value) | | | 248,959 | | |
Net Asset Value Per Share | | $ | 32.90 | | |
Class IR Shares: | |
Net Assets | | $ | 11,335 | | |
| Shares Outstanding (unlimited shares authorized, $0.01 par value) | | | 343 | | |
Net Asset Value Per Share | | $ | 33.05 | | |
See Notes to Consolidated Financial Statements
7
Morgan Stanley Insight Fund
Consolidated Financial Statements continued
Consolidated Statement of Operations For the six months ended June 30, 2024 (unaudited)
Net Investment Loss:
Income | |
Dividends | | $ | 796,560 | | |
Dividends from affiliate (Note 9) | | | 579,414 | | |
Income from securities loaned - net | | | 76,437 | | |
Total Income | | | 1,452,411 | | |
Expenses | |
Advisory fee (Note 4) | | | 4,470,610 | | |
Distribution fee (Class A) (Note 5) | | | 894,801 | | |
Distribution fee (Class L) (Note 5) | | | 53,256 | | |
Distribution fee (Class C) (Note 5) | | | 477,910 | | |
Sub transfer agency fees and expenses (Class A) | | | 386,037 | | |
Sub transfer agency fees and expenses (Class L) | | | 4,857 | | |
Sub transfer agency fees and expenses (Class I) | | | 274,186 | | |
Sub transfer agency fees and expenses (Class C) | | | 52,433 | | |
Administration fee (Note 4) | | | 546,785 | | |
Professional fees | | | 118,455 | | |
Transfer agency fees and expenses (Class A) (Note 7) | | | 27,559 | | |
Transfer agency fees and expenses (Class L) (Note 7) | | | 2,500 | | |
Transfer agency fees and expenses (Class I) (Note 7) | | | 49,755 | | |
Transfer agency fees and expenses (Class C) (Note 7) | | | 5,377 | | |
Transfer agency fees and expenses (Class R6) (Note 7) | | | 5,209 | | |
Transfer agency fees and expenses (Class IR) (Note 7) | | | 1,074 | | |
Shareholder reports and notices | | | 87,071 | | |
Registration fees | | | 46,645 | | |
Custodian fees (Note 8) | | | 26,670 | | |
Trustees' fees and expenses | | | 9,520 | | |
Other | | | 44,503 | | |
Total Expenses | | | 7,585,213 | | |
Less: rebate from Morgan Stanley affiliated cash sweep (Note 9) | | | (21,590 | ) | |
Less: reimbursement of class specific expenses (Class IR) (Note 4) | | | (1,073 | ) | |
Net Expenses | | | 7,562,550 | | |
Net Investment Loss | | | (6,110,139 | ) | |
Realized and Unrealized Gain (Loss):
Realized Gain (Loss) on: | |
Investments sold | | | 21,139,802 | | |
Foreign currency translation | | | (3,330 | ) | |
Net Realized Gain | | | 21,136,472 | | |
Change in Unrealized Appreciation (Depreciation) on: | |
Investments | | | (32,292,772 | ) | |
Foreign currency translation | | | 86 | | |
Net Change in Unrealized Appreciation (Depreciation) | | | (32,292,686 | ) | |
Net Loss | | | (11,156,214 | ) | |
Net Decrease in Net Assets Resulting from Operations | | $ | (17,266,353 | ) | |
See Notes to Consolidated Financial Statements
8
Morgan Stanley Insight Fund
Consolidated Financial Statements continued
Consolidated Statements of Changes in Net Assets
| | | FOR THE SIX
MONTHS ENDED
JUNE 30, 2024 | | FOR THE YEAR
ENDED
DECEMBER 31, 2023 | |
| | | (unaudited) | | | |
Increase (Decrease) in Net Assets:
Operations: | |
Net investment loss | | $ | (6,110,139 | ) | | $ | (12,322,368 | ) | |
Net realized gain (loss) | | | 21,136,472 | | | | (504,900,780 | ) | |
Net change in unrealized appreciation (depreciation) | | | (32,292,686 | ) | | | 1,130,382,317 | | |
Net Increase (Decrease) in Net Assets Resulting from Operations | | | (17,266,353 | ) | | | 613,159,169 | | |
Net decrease from transactions in shares of beneficial interest | | | (377,779,263 | ) | | | (364,446,572 | ) | |
Net Increase (Decrease) | | | (395,045,616 | ) | | | 248,712,597 | | |
Net Assets: | |
Beginning of period | | | 1,580,755,688 | | | | 1,332,043,091 | | |
End of Period | | $ | 1,185,710,072 | | | $ | 1,580,755,688 | | |
See Notes to Consolidated Financial Statements
9
Morgan Stanley Insight Fund
Notes to Consolidated Financial Statements ◼ June 30, 2024 (unaudited)
1. Organization and Accounting Policies
Morgan Stanley Insight Fund (the "Fund") is registered under the Investment Company Act of 1940, as amended (the "Act"), as a diversified, open-end management investment company. The Fund's investment objective is to seek long-term capital appreciation. The Fund was organized as a Massachusetts business trust on October 17, 1995 and commenced operations on February 27, 1996. On July 28, 1997, the Fund converted to a multiple class share structure.
The Fund applies investment company accounting and reporting guidance Accounting Standards Codification ("ASC") Topic 946. In the preparation of these financial statements, management has evaluated subsequent events occurring after the date of the Fund's Consolidated Statement of Assets and Liabilities through the date that the financial statements were issued.
The Fund has issued Class A shares, Class L shares, Class I shares, Class C shares, Class R6 shares and Class IR shares. Class C shares will automatically convert to Class A shares eight years after the end of the calendar month in which the shares were purchased. The six classes are substantially the same except that most Class A shares are subject to a sales charge imposed at the time of purchase and some Class A shares and most Class C shares are subject to a contingent deferred sales charge imposed on shares redeemed within one year. Class L shares, Class I shares, Class R6 shares and Class IR shares are not subject to a sales charge. Additionally, Class A shares, Class L shares and Class C shares incur distribution expenses.
The Fund suspended offering Class L shares to all investors (April 30, 2015). Class L shareholders of the Fund do not have the option of purchasing additional Class L shares. However, the existing Class L shareholders may invest through reinvestment of dividends and distributions. In addition, Class L shares of the Fund may be exchanged for Class L shares of any Morgan Stanley Multi-Class Fund, even though Class L shares are closed to investors.
The following is a summary of significant accounting policies:
The Fund may invest up to 25% of its total assets in a wholly-owned subsidiary of the Fund organized as a company under the laws of the Cayman Islands, Insight Cayman Portfolio, Ltd. (the "Subsidiary"). The Subsidiary may invest in bitcoin indirectly through cash settled futures or indirectly through investments in pooled investment vehicles and exchange-traded products that invest in bitcoin ("bitcoin ETFs"). The Fund is the sole shareholder of the Subsidiary, and it is not currently expected that shares of the Subsidiary will be sold or offered to other investors. The consolidated portfolio of investments and consolidated financial statements include the positions and accounts of the Fund and the Subsidiary. All intercompany accounts and transactions of the Fund and the Subsidiary have been eliminated in consolidation and all accounting policies of the Subsidiary are consistent with those of the Fund. As of June 30, 2024, the Subsidiary represented $28,989,905 or 2.44% of the net assets of the Fund.
10
Morgan Stanley Insight Fund
Notes to Consolidated Financial Statements ◼ June 30, 2024 (unaudited) continued
Investments in the Subsidiary are expected to provide the Fund with exposure to bitcoin within the limitations of Subchapter M of the Code and recent Internal Revenue Service ("IRS") revenue rulings, which require that a mutual fund receive no more than ten percent of its gross income from such investments in order to receive favorable tax treatment as a regulated investment company ("RIC"). Tax treatment of the income received from the Subsidiary may potentially be affected by changes in legislation, regulations or other legally binding authority, which could affect the character, timing and amount of the Fund's taxable income and distributions. If such changes occur, the Fund may need to significantly change its investment strategy and recognize unrealized gains in order to remain qualified for taxation as a RIC, which could adversely affect the Fund.
A. Valuation of Investments — (1) An equity portfolio security listed or traded on an exchange is valued at its latest reported sales price (or at the exchange official closing price if such exchange reports an official closing price), and if there were no sales on a given day and if there is no official exchange closing price for that day, the security is valued at the mean between the last reported bid and asked prices if such bid and asked prices are available on the relevant exchanges. If only bid prices are available then the latest bid price may be used. Listed equity securities not traded on the valuation date with no reported bid and asked prices available on the exchange are valued at the mean between the current bid and asked prices obtained from one or more reputable brokers/dealers. In cases where a security is traded on more than one exchange, the security is valued on the exchange designated as the primary market; (2) all other equity portfolio securities for which over-the-counter ("OTC") market quotations are readily available are valued at the latest reported sales price (or at the market official closing price if such market reports an official closing price), and if there was no trading in the security on a given day and if there is no official closing price from relevant markets for that day, the security is valued at the mean between the last reported bid and asked prices if such bid and asked prices are available on the relevant markets. An unlisted equity security that does not trade on the valuation date and for which bid and asked prices from the relevant markets are unavailable is valued at the mean between the current bid and asked prices obtained from one or more reputable brokers/dealers; (3) when market quotations are not readily available, as defined by Rule 2a-5 under the Act, including circumstances under which Morgan Stanley Investment Management Inc. (the "Adviser"), a wholly-owned subsidiary of Morgan Stanley determines that the closing price, last sale price or the mean between the last reported bid and asked prices are not reflective of a security's market value, portfolio securities are valued at their fair value as determined in good faith under procedures approved by and under the general supervision of the Fund's Board of Trustees (the "Trustees"). Each business day, the Fund uses a third-party pricing service approved by the Trustees to assist with the valuation of foreign equity securities. Events occurring after the close of trading on foreign exchanges may result in adjustments to the valuation of foreign securities to reflect market trading that occurs after the close of the applicable foreign markets of comparable securities or other instruments that have a strong correlation
11
Morgan Stanley Insight Fund
Notes to Consolidated Financial Statements ◼ June 30, 2024 (unaudited) continued
to the fair-valued securities to more accurately reflect their fair value as of the close of regular trading on the NYSE; (4) foreign exchange transactions ("spot contracts") and foreign exchange forward contracts ("forward contracts") are valued daily using an independent pricing vendor at the spot and forward rates, respectively, as of the close of the NYSE; (5) listed options are valued at the last reported sales price on the exchange on which they are listed (or at the exchange official closing price if such exchange reports an official closing price). If an official closing price or last reported sales price is unavailable, the listed option should be fair valued at the mean between its latest bid and ask prices. Unlisted options are valued at the mean between their latest bid and ask prices from a reputable broker/dealer or valued by a pricing service/vendor; (6) fixed income securities may be valued by an outside pricing service/vendor approved by the Trustees. The pricing service/vendor may employ a pricing model that takes into account, among other things, bids, yield spreads and/or other market data and specific security characteristics. If the Adviser, a wholly-owned subsidiary of Morgan Stanley, determines that the price provided by the outside pricing service/vendor does not reflect the security's fair value or is unable to provide a price, prices from reputable brokers/dealers may also be utilized. In these circumstances, the value of the security will be the mean of bid and asked prices obtained from reputable brokers/dealers; and (7) investments in mutual funds, including the Morgan Stanley Institutional Liquidity Funds, are valued at the net asset value ("NAV") as of the close of each business day.
In connection with Rule 2a-5 of the Act, the Trustees have designated the Fund's Adviser as its valuation designee. The valuation designee has responsibility for determining fair value and to make the actual calculations pursuant to the fair valuation methodologies previously approved by the Trustees. Under procedures approved by the Trustees, the Fund's Adviser, as valuation designee, has formed a Valuation Committee whose members are approved by the Trustees. The Valuation Committee provides administration and oversight of the Fund's valuation policies and procedures, which are reviewed at least annually by the Trustees. These procedures allow the Fund to utilize independent pricing services, quotations from securities and financial instrument dealers and other market sources to determine fair value.
B. Accounting for Investments — Security transactions are accounted for on the trade date (date the order to buy or sell is executed). Realized gains and losses on security transactions are determined by the identified cost method. Dividend income and other distributions are recorded on the ex-dividend date (except for certain foreign dividends which may be recorded as soon as the Fund is informed of such dividends) net of applicable withholding taxes. Non-cash dividends received in the form of stock, if any, are recognized on the ex-dividend date and recorded as non-cash dividend income at fair value. Discounts are accreted and premiums are amortized over the life of the respective securities and are included in interest income. Interest income is accrued daily as earned.
12
Morgan Stanley Insight Fund
Notes to Consolidated Financial Statements ◼ June 30, 2024 (unaudited) continued
C. Multiple Class Allocations — Investment income, realized and unrealized gain (loss) and non-class specific expenses are allocated daily based upon the proportion of net assets of each class. Class specific expenses are borne by the respective share classes and include distribution, transfer agency, co-transfer agency and sub transfer agency fees.
D. Foreign Currency Translation and Foreign Investments — The books and records of the Fund are maintained in U.S. dollars. Foreign currency amounts are translated into U.S. dollars as follows:
— investments, other assets and liabilities at the prevailing rate of exchange on the valuation date;
— investment transactions and investment income at the prevailing rates of exchange on the dates of such transactions.
Although the net assets of the Fund are presented at the foreign exchange rates and market values at the close of the period, the Fund does not isolate that portion of the results of operations arising as a result of changes in the foreign exchange rates from the fluctuations arising from changes in the market prices of securities held at period end. Similarly, the Fund does not isolate the effect of changes in foreign exchange rates from the fluctuations arising from changes in the market prices of securities sold during the period. Accordingly, realized and unrealized foreign currency gains (losses) on investments in securities are included in the reported net realized and unrealized gains (losses) on investment transactions and balances. However, pursuant to U.S. federal income tax regulations, gains and losses from certain foreign currency transactions and the foreign currency portion of gains and losses realized on sales and maturities of foreign denominated debt securities are treated as ordinary income for U.S. federal income tax purposes.
Net realized gains (losses) on foreign currency transactions represent net foreign exchange gains (losses) from foreign currency forward exchange contracts, disposition of foreign currencies, currency gains (losses) realized between the trade and settlement dates on securities transactions, and the difference between the amount of investment income and foreign withholding taxes recorded on the Fund's books and the U.S. dollar equivalent amounts actually received or paid. The change in unrealized currency gains (losses) on foreign currency translations for the period is reflected in the Consolidated Statement of Operations.
E. Repurchase Agreements — The Fund may enter into repurchase agreements under which the Fund lends cash and takes possession of securities with an agreement that the counterparty will repurchase such securities. In connection with transactions in repurchase agreements, a bank as custodian for the Fund takes possession of the underlying securities which are held as collateral, with a market value at least equal to the amount of the repurchase transaction, including principal and accrued interest. To the extent that any repurchase transaction exceeds one business day, the value of
13
Morgan Stanley Insight Fund
Notes to Consolidated Financial Statements ◼ June 30, 2024 (unaudited) continued
the collateral is marked-to-market on a daily basis to determine that the value of the collateral does not decrease below the repurchase price plus accrued interest as earned. If such a decrease occurs, additional collateral will be requested and, when received, will be added to the account to maintain full collateralization. In the event of default on the obligation to repurchase, the Fund has the right to liquidate the collateral and apply the proceeds in satisfaction of the obligation. In the event of default or bankruptcy by the counterparty to the agreement, realization of the collateral proceeds may be subject to cost and delays. The Fund, along with other affiliated investment companies, may utilize a joint trading account for the purpose of entering into repurchase agreements.
F. Securities Lending — The Fund may lend securities to qualified financial institutions, such as broker/dealers, to earn additional income. Any increase or decrease in the fair value of the securities loaned that might occur and any interest earned or dividends declared on those securities during the term of the loan would remain in the Fund. The Fund receives cash or securities as collateral in an amount equal to or exceeding 100% of the current fair value of the loaned securities. The collateral is marked-to-market daily by State Street Bank and Trust Company ("State Street"), the securities lending agent, to ensure that a minimum of 100% collateral coverage is maintained.
Based on pre-established guidelines, the securities lending agent invests any cash collateral that is received in an affiliated money market portfolio and repurchase agreements. Securities lending income is generated from the earnings on the invested collateral and borrowing fees, less any rebates owed to the borrowers and compensation to the lending agent, and is recorded as "Income from securities loaned — net" in the Fund's Consolidated Statement of Operations.
The Fund has the right under the securities lending agreement to recover the securities from the borrower on demand.
At June 30, 2024, the Fund did not have any outstanding securities on loan.
G. Restricted Securities — The Fund invests in unregistered or otherwise restricted securities. The term "restricted securities" refers to securities that are unregistered or are held by control persons of the issuer and securities that are subject to contractual restrictions on their resale. As a result, restricted securities may be more difficult to value and the Fund may have difficulty disposing of such assets either in a timely manner or for a reasonable price. In order to dispose of an unregistered security, the Fund, where it has contractual rights to do so, may have to cause such security to be registered. A considerable period may elapse between the time the decision is made to sell the security and the time the security is registered so that the Fund can sell it. Contractual restrictions on the resale of securities vary in length and scope and are generally the result of a negotiation between the issuer and the acquirer of the securities. The Fund would, in either case, bear market risks during that period. Restricted securities are identified in the Consolidated Portfolio of Investments.
14
Morgan Stanley Insight Fund
Notes to Consolidated Financial Statements ◼ June 30, 2024 (unaudited) continued
H. Dividends and Distributions to Shareholders — Dividends and distributions to shareholders are recorded on the ex-dividend date. Dividends from net investment income, if any, are declared and paid annually. Net realized capital gains, if any, are distributed at least annually.
I. Use of Estimates — The preparation of financial statements in accordance with generally accepted accounting principles in the United States ("GAAP") requires management to make estimates and assumptions that affect the reported amounts and disclosures. Actual results could differ from those estimates.
J. Indemnifications — The Fund enters into contracts that contain a variety of indemnification clauses. The Fund's maximum exposure under these arrangements is unknown as this would involve future claims that may be made against the Fund that have not yet occurred.
2. Fair Valuation Measurements
Financial Accounting Standard Board ("FASB") ASC 820, "Fair Value Measurement" ("ASC 820"), defines fair value as the price that would be received to sell an asset or pay to transfer a liability in an orderly transaction between market participants at the measurement date. ASC 820 establishes a three-tier hierarchy to distinguish between (1) inputs that reflect the assumptions market participants would use in valuing an asset or liability developed based on market data obtained from sources independent of the reporting entity (observable inputs); and (2) inputs that reflect the reporting entity's own assumptions about the assumptions market participants would use in valuing an asset or liability developed based on the best information available in the circumstances (unobservable inputs) and to establish classification of fair value measurements for disclosure purposes. Various inputs are used in determining the value of the Fund's investments. The inputs are summarized in the three broad levels listed below:
• Level 1 — unadjusted quoted prices in active markets for identical investments
• Level 2 — other significant observable inputs (including quoted prices for similar investments, interest rates, prepayment speeds, credit risk, etc.)
• Level 3 — significant unobservable inputs including the Fund's own assumptions in determining the fair value of investments. Factors considered in making this determination may include, but are not limited to, information obtained by contacting the issuer, analysts, or the appropriate stock exchange (for exchange-traded securities), analysis of the issuer's financial statements or other available documents and, if necessary, available information concerning other securities in similar circumstances.
The inputs or methodology used for valuing securities are not necessarily an indication of the risk associated with investing in those securities and the determination of the significance of a particular
15
Morgan Stanley Insight Fund
Notes to Consolidated Financial Statements ◼ June 30, 2024 (unaudited) continued
input to the fair value measurement in its entirety requires judgment and considers factors specific to each security.
The following is a summary of the inputs used to value the Fund's investments as of June 30, 2024:
INVESTMENT TYPE | | LEVEL 1
UNADJUSTED
QUOTED
PRICES | | LEVEL 2
OTHER
SIGNIFICANT
OBSERVABLE
INPUTS | | LEVEL 3
SIGNIFICANT
UNOBSERVABLE
INPUTS | | TOTAL | |
Assets: | |
Common Stocks | |
Automobiles | | $ | 71,420,634 | | | $ | — | | | $ | — | | | $ | 71,420,634 | | |
Biotechnology | | | 35,906,546 | | | | — | | | | — | | | | 35,906,546 | | |
Broadline Retail | | | 96,581,640 | | | | — | | | | — | | | | 96,581,640 | | |
Electronic Equipment, Instruments &
Components | | | — | | | | — | | | | — | † | | | — | † | |
Entertainment | | | 55,658,792 | | | | — | | | | — | | | | 55,658,792 | | |
Financial Services | | | 54,547,085 | | | | 39,092,343 | | | | — | | | | 93,639,428 | | |
Ground Transportation | | | 40,386,895 | | | | — | | | | — | | | | 40,386,895 | | |
Health Care Providers & Services | | | 22,484,075 | | | | — | | | | — | | | | 22,484,075 | | |
Health Care Technology | | | 6,614,318 | | | | — | | | | — | | | | 6,614,318 | | |
Hotels, Restaurants & Leisure | | | 128,616,984 | | | | — | | | | — | | | | 128,616,984 | | |
Information Technology Services | | | 230,306,414 | | | | — | | | | — | | | | 230,306,414 | | |
Leisure Products | | | 9,994,504 | | | | — | | | | — | | | | 9,994,504 | | |
Life Sciences Tools & Services | | | 3,613,051 | | | | — | | | | — | | | | 3,613,051 | | |
Media | | | 83,657,935 | | | | — | | | | — | | | | 83,657,935 | | |
Pharmaceuticals | | | 51,738,072 | | | | — | | | | — | | | | 51,738,072 | | |
Software | | | 124,927,305 | | | | 11,341,397 | | | | — | | | | 136,268,702 | | |
Specialty Retail | | | 44,617,441 | | | | — | | | | — | | | | 44,617,441 | | |
Total Common Stocks | | | 1,061,071,691 | | | | 50,433,740 | | | | — | † | | | 1,111,505,431 | † | |
Preferred Stocks | |
Software | | | — | | | | — | | | | 38,274,656 | | | | 38,274,656 | | |
Investment Company | | | 28,901,114 | | | | — | | | | — | | | | 28,901,114 | | |
Call Options Purchased | | | — | | | | 1,384,923 | | | | — | | | | 1,384,923 | | |
Short-Term Investment | |
Investment Company | | | 22,384,930 | | | | — | | | | — | | | | 22,384,930 | | |
Total Assets | | $ | 1,112,357,735 | | | $ | 51,818,663 | | | $ | 38,274,656 | † | | $ | 1,202,451,054 | † | |
† Includes a security valued at zero.
Transfers between investment levels may occur as the markets fluctuate and/or the availability of data used in an investment's valuation changes.
16
Morgan Stanley Insight Fund
Notes to Consolidated Financial Statements ◼ June 30, 2024 (unaudited) continued
Following is a reconciliation of investments in which significant unobservable inputs (Level 3) were used in determining fair value:
| | | COMMON
STOCK | | PREFERRED
STOCKS | |
Beginning Balance | | $ | — | † | | $ | 54,979,940 | | |
Purchases | | | — | | | | — | | |
Sales | | | — | | | | (15,497,105 | ) | |
Transfers in | | | — | | | | — | | |
Transfers out | | | — | | | | — | | |
Corporate actions | | | — | | | | — | | |
Change in unrealized appreciation (depreciation) | | | — | | | | 814,583 | | |
Realized gains (losses) | | | — | | | | (2,022,762 | ) | |
Ending Balance | | $ | — | † | | $ | 38,274,656 | | |
Net change in unrealized appreciation (depreciation) from investments
still held as of June 30, 2024 | | $ | — | | | $ | 814,583 | | |
† Includes a security valued at zero.
The following table presents additional information about valuation techniques and inputs used for investments that are measured at fair value and categorized within Level 3 as of June 30, 2024. Various valuation techniques were used in the valuation of certain investments and weighted based on the level of significance. The Fund calculated the weighted averages of the unobservable inputs relative to each investment's fair value as of June 30, 2024:
| | | FAIR VALUE AT
JUNE 30, 2024 | | VALUATION
TECHNIQUE | | UNOBSERVABLE
INPUT | | AMOUNT OR RANGE/
WEIGHTED AVERAGE* | | IMPACT TO
VALUATION FROM
AN INCREASE
IN INPUT** | |
Preferred
Stocks | | $ | 38,274,656
| | | Market Transaction
Method | | Precedent
Transaction | | $ | 65.00 | | |
Increase | |
| |
| | Discounted Cash
Flow | | Weighted Average
Cost of Capital | | |
14.0%–17.5%/15.0% | | |
Decrease | |
| | | | | | Perpetual Growth Rate | | | 3.0%–4.0%/3.5% | | | Increase | |
| |
| | Market Comparable
Companies | | Enterprise
Value/Revenue | | | 3.7x–21.9x/13.9x | | | Increase | |
| |
| |
| | Discount for Lack of
Marketability | | | 9.0%–11.0%/11.0% | | | Decrease | |
| |
| | Comparable
Transactions | | Enterprise
Value/Revenue | | | 8.5 | x | | Increase | |
* Amount is indicative of the weighted average.
** Represents the expected directional change in the fair value of the Level 3 investments that would result from an increase in the corresponding input. A decrease to the unobservable input would have the opposite effect. Significant changes in these inputs could result in significantly higher or lower fair value measurements.
17
Morgan Stanley Insight Fund
Notes to Consolidated Financial Statements ◼ June 30, 2024 (unaudited) continued
3. Derivatives
The Fund may, but it is not required to, use derivative instruments for a variety of purposes, including hedging, risk management, portfolio management or to earn income. Derivatives are financial instruments whose value is based, in part, on the value of an underlying asset, interest rate, index or financial instrument. Prevailing interest rates and volatility levels, among other things, also affect the value of derivative instruments. A derivative instrument often has risks similar to its underlying asset and may have additional risks, including imperfect correlation between the value of the derivative and the underlying asset, risks of default by the counterparty to certain transactions, magnification of losses incurred due to changes in the market value of the securities, instruments, indices or interest rates to which the derivative instrument relates, risks that the transactions may not be liquid, risks arising from margin and payment requirements, risks arising from mispricing or valuation complexity and operational and legal risks. The use of derivatives involves risks that are different from, and possibly greater than, the risks associated with other portfolio investments. Derivatives may involve the use of highly specialized instruments that require investment techniques and risk analyses different from those associated with other portfolio investments. All of the Fund's holdings, including derivative instruments, are marked-to-market each day with the change in value reflected in unrealized appreciation (depreciation). Upon disposition, a realized gain or loss is recognized.
Certain derivative transactions may give rise to a form of leverage. Leverage magnifies the potential for gain and risk of loss. Leverage associated with derivative transactions may cause the Fund to liquidate portfolio positions when it may not be advantageous to do so to satisfy its obligations or may cause the Fund to be more volatile than if the Fund had not been leveraged. Although the Adviser seeks to use derivatives to further the Fund's investment objectives, there is no assurance that the use of derivatives will achieve this result.
Following is a description of the derivative instruments and techniques that the Fund used during the period and their associated risks:
Options — In respect to options, the Fund is subject to equity risk, interest rate risk and foreign currency exchange risk in the normal course of pursuing its investment objectives. If the Fund buys an option, it buys a legal contract giving it the right to buy or sell a specific amount of the underlying instrument or foreign currency, or futures contract on the underlying instrument or foreign currency, at an agreed-upon price during a period of time or on a specified date typically in exchange for a premium paid by the Fund. The Fund may purchase put and call options. Purchasing call options tends to increase the Fund's exposure to the underlying (or similar) instrument. Purchasing put options tends to decrease the Fund's exposure to the underlying (or similar) instrument. When entering into purchased
18
Morgan Stanley Insight Fund
Notes to Consolidated Financial Statements ◼ June 30, 2024 (unaudited) continued
option contracts, the Fund bears the risk of interest or exchange rates or securities prices moving unexpectedly, in which case, the Fund may not achieve the anticipated benefits of the purchased option contracts; however the risk of loss is limited to the premium paid. Purchased options are reported as part of "Total Investments in Securities" in the Consolidated Statement of Assets and Liabilities. Premium paid for purchasing options which expired are treated as realized losses. If the Fund sells an option, it sells to another party the right to buy from or sell to the Fund a specific amount of the underlying instrument or foreign currency, or futures contract on the underlying instrument or foreign currency, at an agreed upon price during a period of time or on a specified date typically in exchange for a premium received by the Fund. When options are purchased OTC, the Fund bears the risk that the counterparty that wrote the option will be unable or unwilling to perform its obligations under the option contract. Options may also be illiquid and the Fund may have difficulty closing out its position. A decision as to whether, when and how to use options involves the exercise of skill and judgment and even a well-conceived option transaction may be unsuccessful because of market behavior or unexpected events. The prices of options can be highly volatile and the use of options can lower total returns.
FASB ASC 815, "Derivatives and Hedging" ("ASC 815"), is intended to improve financial reporting about derivative instruments by requiring enhanced disclosures to enable investors to better understand how and why the Fund uses derivative instruments, how these derivative instruments are accounted for and their effects on the Fund's financial position and results of operations.
The following table sets forth the fair value of the Fund's derivative contracts by primary risk exposure as of June 30, 2024:
PRIMARY RISK EXPOSURE | | ASSET DERIVATIVES CONSOLIDATED
STATEMENT OF ASSETS AND LIABILITIES LOCATION | | FAIR VALUE | |
Currency Risk | | Investments, at Value (Purchased Options) | | $ | 1,384,923 | (a) | |
(a) Amounts are included in Investments in securities in the Consolidated Statement of Assets and Liabilities.
The following tables set forth by primary risk exposure of the Fund's realized gains (losses) and change in unrealized appreciation (depreciation) by type of derivative contract for the six months ended June 30, 2024 in accordance with ASC 815:
AMOUNT OF REALIZED GAIN (LOSS) ON DERIVATIVES
PRIMARY RISK EXPOSURE | | PURCHASED
OPTIONS | |
Currency Risk | | $ | (2,857,497 | )(a) | |
(a) Amounts are included in Realized Loss on Investments in the Consolidated Statement of Operations.
19
Morgan Stanley Insight Fund
Notes to Consolidated Financial Statements ◼ June 30, 2024 (unaudited) continued
CHANGE IN UNREALIZED APPRECIATION (DEPRECIATION) ON DERIVATIVES
PRIMARY RISK EXPOSURE | | PURCHASED
OPTIONS | |
Currency Risk | | $ | 498,499 | (a) | |
(a) Amounts are included in Change in Unrealized Appreciation (Depreciation) on Investments in the Consolidated Statement of Operations.
At June 30, 2024, the Fund's derivative assets and liabilities are as follows:
GROSS AMOUNTS OF ASSETS AND LIABILITIES PRESENTED IN THE CONSOLIDATED STATEMENT OF ASSETS AND LIABILITIES
DERIVATIVES | | ASSETS(b) | | LIABILITIES(b) | |
Purchased Options | | $ | 1,384,923 | (a) | | $ | — | | |
(a) Amounts are included in Investments in securities in the Consolidated Statement of Assets and Liabilities.
(b) Absent an event of default or early termination, OTC derivative assets and liabilities are presented gross and not offset in the Consolidated Statement of Assets and Liabilities.
The Fund typically enters into International Swaps and Derivatives Association, Inc. Master Agreements ("ISDA Master Agreements") or similar master agreements (collectively, "Master Agreements") with its contract counterparties for certain OTC derivatives in order to, among other things, reduce its credit risk to counterparties. ISDA Master Agreements include provisions for general obligations, representations, collateral and events of default or termination. Under an ISDA Master Agreement, the Fund typically may offset with the counterparty certain OTC derivative financial instruments' payables and/or receivables with collateral held and/or posted and create one single net payment (close-out netting) in the event of default, termination and/or potential deterioration in the credit quality of the counterparty. Various Master Agreements govern the terms of certain transactions with counterparties, including transactions such as swap, forward, repurchase and reverse repurchase agreements. These Master Agreements typically attempt to reduce the counterparty risk associated with such transactions by specifying credit protection mechanisms and providing standardization that improves legal certainty. Cross-termination provisions under Master Agreements typically provide that a default in connection with one transaction between the Fund and a counterparty gives the non-defaulting party the right to terminate any other transactions in place with the defaulting party to create one single net payment due to/due from the defaulting party and may be a feature in certain Master Agreements. In the event the Fund exercises its right to terminate a Master Agreement after a counterparty experiences a termination event as defined in the Master Agreement, the return of collateral with market value in excess of the Fund's net liability may be delayed or denied.
20
Morgan Stanley Insight Fund
Notes to Consolidated Financial Statements ◼ June 30, 2024 (unaudited) continued
The following table presents derivative financial instruments that are subject to enforceable netting arrangements as of June 30, 2024:
GROSS AMOUNTS NOT OFFSET IN THE CONSOLIDATED STATEMENT OF ASSETS AND LIABILITIES
COUNTERPARTY | | GROSS ASSET DERIVATIVES
PRESENTED IN THE
CONSOLIDATED STATEMENT OF
ASSETS AND LIABILITIES | | FINANCIAL
INSTRUMENT | | COLLATERAL
RECEIVED(a) | | NET AMOUNT
(NOT LESS THAN $0) | |
Goldman Sachs & Co. LLC | | $ | 638,596 | | | $ | — | | | $ | (638,596 | ) | | $ | 0 | | |
JPMorgan Chase Bank NA | | | 746,327 | | | | — | | | | (746,327 | ) | | | 0 | | |
Total | | $ | 1,384,923 | | | $ | — | | | $ | (1,384,923 | ) | | $ | 0 | | |
(a) In some instances, the actual collateral received may be more than the amount shown here due to overcollateralization.
For the six months ended June 30, 2024, the average monthly amount outstanding for each derivative type is as follows:
Purchased Options: | |
Average monthly notional amount | | | 1,240,903,542 | | |
4. Advisory/Administration Agreements
Pursuant to an Investment Advisory Agreement with the Adviser, the Fund pays an advisory fee, accrued daily and paid monthly, by applying the following annual rates to the net assets of the Fund determined as of the close of each business day: 0.67% to the portion of the daily net assets not exceeding $500 million; 0.645% to the portion of the daily net assets exceeding $500 million but not exceeding $2 billion; 0.62% to the portion of the daily net assets exceeding $2 billion but not exceeding $3 billion; and 0.595% to the portion of the daily net assets exceeding $3 billion. For the six months ended June 30, 2024, the advisory fee rate (net of rebate) was equivalent to an annual effective rate of 0.65% of the Fund's average daily net assets.
The Adviser also serves as the Administrator to the Fund and provides administrative services pursuant to an Administration Agreement for an annual fee, accrued daily and paid monthly, of 0.08% of the Fund's average daily net assets.
Under a Sub-Administration Agreement between the Administrator and State Street, State Street provides certain administrative services to the Fund. For such services, the Administrator pays State Street a portion of the fee the Administrator receives from the Fund.
The Adviser/Administrator has agreed to reduce its advisory fee, its administration fee and/or reimburse the Fund so that total annual operating expenses, excluding certain investment related expenses, taxes, interest and other extraordinary expenses (including litigation), will not exceed 1.27% for Class A, 1.77% for Class L, 0.92% for Class I, 2.02% for Class C, 0.85% for Class R6 and 0.85%
21
Morgan Stanley Insight Fund
Notes to Consolidated Financial Statements ◼ June 30, 2024 (unaudited) continued
for Class IR. The fee waivers and/or expense reimbursements will continue for at least one year from the date of the Fund's prospectus or until such time that the Trustees act to discontinue all or a portion of such waivers and/or expense reimbursements when they deem such action is appropriate. For the six months ended June 30, 2024, $1,073 of other expenses were reimbursed by the Adviser pursuant to this arrangement.
The Adviser provides investment advisory services to the Subsidiary pursuant to the Subsidiary Investment Management Agreement (the "Agreement"). Under the Agreement, the Subsidiary will pay the Adviser at the end of each fiscal quarter, calculated by applying a quarterly rate, based on the annual rate of 0.05%, to the average daily net assets of the Subsidiary.
The Adviser has agreed to waive its advisory fees by the amount of advisory fees it receives from the Subsidiary.
5. Plan of Distribution
Shares of the Fund are distributed by Morgan Stanley Distribution, Inc. (the "Distributor"), an affiliate of the Adviser/Administrator. The Fund has adopted a Plan of Distribution (the "Plan") pursuant to Rule 12b-1 under the Act. The Plan provides that the Fund will pay the Distributor a fee which is accrued daily and paid monthly at the following annual rates: (i) Class A — up to 0.25% of the average daily net assets of Class A shares; (ii) Class L — up to 0.75% of the average daily net assets of Class L shares; and (iii) Class C — up to 1.00% of the average daily net assets of Class C shares.
In the case of Class A shares, Class L shares and Class C shares, expenses incurred pursuant to the Plan in any calendar year in excess of 0.25%, 0.75% and 1.00% of the average daily net assets of Class A shares, Class L shares and Class C shares, respectively, will not be reimbursed by the Fund through payments in any subsequent year, except that expenses representing a gross sales commission credited to Financial Intermediaries at the time of sale may be reimbursed in the subsequent calendar year. The Distributor has advised the Fund that there were no unreimbursed expenses representing a gross sales commission credited to Financial Intermediaries in the case of Class A, Class L, or Class C at June 30, 2024. For the six months ended June 30, 2024, the distribution fee was accrued for Class A shares, Class L shares and Class C shares at the annual rate of 0.25%, 0.75% and 1.00%, respectively.
The Distributor has informed the Fund that for the six months ended June 30, 2024, it received contingent deferred sales charges from certain redemptions of the Fund's Class A shares and Class C shares of $10,201 and $3,706, respectively, and received $56,703 in front-end sales charges from sales of the Fund's Class A shares. The respective shareholders pay such charges, which are not an expense of the Fund.
22
Morgan Stanley Insight Fund
Notes to Consolidated Financial Statements ◼ June 30, 2024 (unaudited) continued
6. Shares of Beneficial Interest
Transactions in shares of beneficial interest, including direct exchanges pursuant to share class conversions for all periods presented, were as follows:
| | | FOR THE SIX
MONTHS ENDED
JUNE 30, 2024 | | FOR THE YEAR
ENDED
DECEMBER 31, 2023 | |
| | | (unaudited) | | | |
| | | SHARES | | AMOUNT | | SHARES | | AMOUNT | |
CLASS A SHARES | |
Sold | | | 606,287 | | | $ | 15,761,091 | | | | 3,574,097 | | | $ | 76,819,144 | | |
Redeemed | | | (6,873,158 | ) | | | (179,930,016 | ) | | | (11,063,007 | ) | | | (240,615,900 | ) | |
Net decrease — Class A | | | (6,266,871 | ) | | | (164,168,925 | ) | | | (7,488,910 | ) | | | (163,796,756 | ) | |
CLASS L SHARES | |
Redeemed | | | (149,975 | ) | | | (1,643,750 | ) | | | (257,677 | ) | | | (2,367,942 | ) | |
CLASS I SHARES | |
Sold | | | 1,312,861 | | | | 42,890,043 | | | | 5,586,002 | | | | 149,582,358 | | |
Redeemed | | | (5,211,467 | ) | | | (169,269,820 | ) | | | (11,569,989 | ) | | | (300,703,194 | ) | |
Net decrease — Class I | | | (3,898,606 | ) | | | (126,379,777 | ) | | | (5,983,987 | ) | | | (151,120,836 | ) | |
CLASS C SHARES | |
Sold | | | 162,159 | | | | 1,633,197 | | | | 587,962 | | | | 4,994,548 | | |
Redeemed | | | (1,851,940 | ) | | | (18,494,274 | ) | | | (2,750,255 | ) | | | (22,825,880 | ) | |
Net decrease — Class C | | | (1,689,781 | ) | | | (16,861,077 | ) | | | (2,162,293 | ) | | | (17,831,332 | ) | |
CLASS R6 SHARES | |
Sold | | | 61,340 | | | | 2,012,019 | | | | 634,552 | | | | 17,354,963 | | |
Redeemed | | | (2,183,900 | ) | | | (70,737,753 | ) | | | (1,693,532 | ) | | | (46,684,669 | ) | |
Net decrease — Class R6 | | | (2,122,560 | ) | | | (68,725,734 | ) | | | (1,058,980 | ) | | | (29,329,706 | ) | |
Net decrease in Fund | | | (14,127,793 | ) | | $ | (377,779,263 | ) | | | (16,951,846 | ) | | $ | (364,446,572 | ) | |
7. Dividend Disbursing and Transfer/Co-Transfer Agent
The Fund's dividend disbursing and transfer agent is SS&C Global Investor & Distribution Solutions, Inc. ("SS&C GIDS"). Pursuant to a Transfer Agency Agreement, the Fund pays SS&C GIDS a fee based on the number of classes, accounts and transactions relating to the Fund.
Eaton Vance Management ("EVM"), an affiliate of Morgan Stanley, provides co-transfer agency and related services to the Fund pursuant to a Co-Transfer Agency Services Agreement. For the six months ended June 30, 2024, co-transfer agency fees and expenses incurred to EVM, included in "Transfer agency fees and expenses" in the Consolidated Statement of Operations, amounted to $8,069.
23
Morgan Stanley Insight Fund
Notes to Consolidated Financial Statements ◼ June 30, 2024 (unaudited) continued
8. Custodian Fees
State Street (the "Custodian") also serves as Custodian for the Fund in accordance with a Custodian Agreement. The Custodian holds cash, securities and other assets of the Fund as required by the Act. Custody fees are payable monthly based on assets held in custody, investment purchases and sales activity and account maintenance fees, plus reimbursement for certain out-of-pocket expenses.
9. Security Transactions and Transactions with Affiliates
The cost of purchases and proceeds from sales of investment securities, excluding short-term investments, for the six months ended June 30, 2024, aggregated $258,430,691 and $622,406,520, respectively.
The Fund invests in the Institutional Class of the Morgan Stanley Institutional Liquidity Funds — Treasury Securities Portfolio (the "Liquidity Fund"), an open-end management investment company managed by the Adviser, both directly and as a portion of the securities held as collateral on loaned securities. Advisory fees paid by the Fund are reduced by an amount equal to its pro-rata share of the advisory and administration fees paid by the Fund due to its investment in the Liquidity Fund. For the six months ended June 30, 2024, advisory fees paid were reduced by $21,590 relating to the Fund's investment in the Liquidity Fund.
A summary of the Fund's transactions in shares of affiliated investments during the six months ended June 30, 2024 is as follows:
AFFILIATED
INVESTMENT
COMPANY | | VALUE
DECEMBER 31,
2023 | | PURCHASES
AT COST | | PROCEEDS
FROM SALES | | DIVIDEND
INCOME | | REALIZED
GAIN
(LOSS) | | CHANGE IN
UNREALIZED
APPRECIATION
(DEPRECIATION) | | VALUE
JUNE 30,
2024 | |
Liquidity Fund | | $ | 29,626,883 | | | $ | 326,949,402 | | | $ | 334,191,355 | | | $ | 579,414 | | | $ | — | | | $ | — | | | $ | 22,384,930 | | |
During the six months ended June 30, 2024, the Fund incurred $6,270 in brokerage commissions with Morgan Stanley & Co. LLC, an affiliate of the Adviser/Administrator and Distributor, for portfolio transactions executed on behalf of the Fund.
The Fund is permitted to purchase and sell securities ("cross-trade") from and to other Morgan Stanley funds as well as other funds and client accounts for which the Adviser or an affiliate of the Adviser serves as investment adviser, pursuant to procedures approved by the Trustees in compliance with Rule 17a-7 under the Act (the "Rule"). Each cross-trade is executed at the current market price in compliance with provisions of the Rule. For the six months ended June 30, 2024, the Fund did not engage in any cross-trade transactions.
24
Morgan Stanley Insight Fund
Notes to Consolidated Financial Statements ◼ June 30, 2024 (unaudited) continued
Each Trustee receives an annual retainer fee for serving as a Trustee of the Morgan Stanley Funds. The aggregate compensation paid to each Trustee is paid by the Morgan Stanley Funds, and is allocated on a pro rata basis among each of the operational funds of the Morgan Stanley Funds based on the relative net assets of each of the funds. The Fund also reimburses such Trustees for travel and other out-of-pocket expenses incurred by them in connection with attending such meetings.
The Fund has an unfunded Deferred Compensation Plan (the "Compensation Plan"), which allows each independent Trustee to defer payment of all, or a portion, of the fees he or she receives for serving on the Board of Trustees. Each eligible Trustee generally may elect to have the deferred amounts credited with a return equal to the total return on one or more of the Morgan Stanley funds that are offered as investment options under the Compensation Plan. Appreciation/depreciation and distributions received from these investments are recorded with an offsetting increase/decrease in the deferred compensation obligation and do not affect the NAV of the Fund.
10. Federal Income Tax Status
It is the Fund's intention to continue to qualify as a RIC and distribute all of its taxable and tax-exempt income. Accordingly, no provision for federal income taxes is required in the consolidated financial statements.
The Fund may be subject to taxes imposed by countries in which it invests. Such taxes are generally based on income and/or capital gains earned or repatriated. Taxes are accrued based on net investment income, net realized gains and net unrealized appreciation as such income and/or gains are earned. Taxes may also be based on transactions in foreign currency and are accrued based on the value of investments denominated in such currency.
FASB ASC 740-10, "Income Taxes — Overall", sets forth a minimum threshold for consolidated financial statement recognition of the benefit of a tax position taken or expected to be taken in a tax return. Management has concluded there are no significant uncertain tax positions that would require recognition in the consolidated financial statements. If applicable, the Fund recognizes interest accrued related to unrecognized tax benefits in "Interest Expense" and penalties in "Other Expenses" in the Consolidated Statement of Operations. The Fund files tax returns with the U.S. Internal Revenue Service, New York and various states. Generally, each of the tax years in the four-year period ended December 31, 2023 remains subject to examination by taxing authorities.
25
Morgan Stanley Insight Fund
Notes to Consolidated Financial Statements ◼ June 30, 2024 (unaudited) continued
The tax character of distributions paid may differ from the character of distributions shown for GAAP purposes due to short-term capital gains being treated as ordinary income for tax purposes. The tax character of distributions paid during fiscal years 2023 and 2022 was as follows:
2023 DISTRIBUTIONS PAID FROM: | | 2022 DISTRIBUTIONS PAID FROM: | |
ORDINARY
INCOME | | LONG-TERM
CAPITAL GAIN | | ORDINARY
INCOME | | LONG-TERM
CAPITAL GAIN | |
| $ | — | | | $ | — | | | $ | — | | | $ | 505,623,988 | | |
The amount and character of income and gains to be distributed are determined in accordance with income tax regulations which may differ from GAAP. These book/tax differences are either considered temporary or permanent in nature.
Temporary differences are attributable to differing book and tax treatments for the timing of the recognition of gains (losses) on certain investment transactions and the timing of the deductibility of certain expenses.
Permanent differences, due to a net operating loss, resulted in the following reclassifications among the components of net assets at December 31, 2023:
TOTAL
ACCUMULATED
LOSS | | PAID-IN-
CAPITAL | |
| $ | 15,603,744 | | | $ | (15,603,744 | ) | |
At December 31, 2023, the Fund had no distributable earnings on a tax basis.
At December 31, 2023, the Fund had available for federal income tax purposes unused short-term and long-term capital losses of $379,190,057 and $1,223,505,549, respectively, that do not have an expiration date.
To the extent that capital loss carryforwards are used to offset any future capital gains realized, no capital gains tax liability will be incurred by the Fund for gains realized and not distributed. To the extent that capital gains are offset, such gains will not be distributed to the shareholders.
11. Market Risk and Risks Relating to Certain Financial Instruments
The Fund may lend securities to qualified financial institutions, such as broker/dealers, to earn additional income. Risks in securities lending transactions are that a borrower may not provide additional collateral when required or return the securities when due, and that the value of the short-term investments will be less than the amount of cash collateral plus any rebate that is required to be returned to the borrower.
26
Morgan Stanley Insight Fund
Notes to Consolidated Financial Statements ◼ June 30, 2024 (unaudited) continued
Foreign security and currency transactions may involve certain considerations and risks not typically associated with those of U.S. dollar denominated transactions as a result of, among other factors, fluctuations of exchange rates in relation to the U.S. dollar, the possibility of lower levels of governmental supervision and regulation of foreign securities markets and the possibility of political or economic instability.
Bitcoin: The Fund may have exposure to cryptocurrencies indirectly through cash settled futures bitcoin exposure or indirectly through bitcoin ETFs. Cryptocurrencies (also referred to as "virtual currencies" and "digital currencies") are digital assets designed to act as a medium of exchange. Although cryptocurrency is an emerging asset class, there are thousands of cryptocurrencies, the most well-known of which is bitcoin. Cryptocurrency facilitates decentralized, peer-to-peer financial exchange and value storage that is used like money, without the oversight of a central authority or banks. The value of cryptocurrency is not backed by any government, corporation, or other identified body. Similar to fiat currencies (i.e., a currency that is backed by a central bank or a national, supra-national or quasi-national organization), cryptocurrencies are susceptible to theft, loss and destruction. For example, the bitcoin held by bitcoin ETFs (and the Fund's indirect exposure to such bitcoin) is also susceptible to these risks. The value of the bitcoin ETFs investments in cryptocurrency is subject to fluctuations in the value of the cryptocurrency, which have been and may in the future be highly volatile and subject to sharp declines. The value of cryptocurrencies is determined by the supply and demand for cryptocurrency in the global market for the trading of cryptocurrency, which consists primarily of transactions on electronic exchanges. The price of bitcoin could drop precipitously (including to zero) for a variety of reasons, including, but not limited to, regulatory changes, a crisis of confidence, flaw or operational issue in the bitcoin network or a change in user preference to competing cryptocurrencies. The Bitcoin ETF exposure could result in substantial losses to the Fund.
Market: The value of an investment in the Fund is based on the values of the Fund's investments, which change due to economic and other events that affect markets generally, as well as those that affect particular regions, countries, industries, companies or governments. The risks associated with these developments may be magnified if certain social, political, economic and other conditions and events adversely interrupt the global economy and financial markets. Securities in the Fund's portfolio may underperform due to inflation (or expectations for inflation), interest rates, global demand for particular products or resources, natural disasters and extreme weather events, health emergencies (such as epidemics and pandemics), terrorism, regulatory events and governmental or quasi-governmental actions. The occurrence of global events similar to those in recent years, such as terrorist attacks around the world, natural disasters, health emergencies, social and political (including geopolitical) discord and tensions or debt crises and downgrades, among others, may result in market volatility and may have long term effects on both the U.S. and global financial markets. The occurrence of such
27
Morgan Stanley Insight Fund
Notes to Consolidated Financial Statements ◼ June 30, 2024 (unaudited) continued
events may be sudden and unexpected, and it is difficult to predict when similar events affecting the U.S. or global financial markets may occur, the effects that such events may have and the duration of those effects (which may last for extended periods). Any such event(s) could have a significant adverse impact on the value, liquidity and risk profile of the Fund's portfolio, as well as its ability to sell securities and/or meet redemptions. Any such event(s) or similar types of factors and developments may also adversely affect the financial performance of the Fund's investments (and, in turn, the Fund's investment results) and/or negatively impact broad segments of businesses and populations and have a significant and rapid negative impact on the performance of the Fund's investments, and exacerbate preexisting risks to the Fund.
12. Credit Facility
The Fund and other Morgan Stanley funds participated in a $500,000,000 committed, unsecured revolving line of credit facility (the "Facility") with State Street. This Facility is to be used for temporary emergency purposes or funding of shareholder redemption requests. The interest rate for any funds drawn will be based on the federal funds rate or overnight bank funding rate plus a spread. The Facility also has a commitment fee of 0.25% per annum based on the unused portion of the Facility, which is allocated among participating funds based on relative net assets. During the six months ended June 30, 2024, the Fund did not have any borrowings under the Facility.
13. Other
At June 30, 2024, the Fund had record owners of 10% or greater. Investment activities of these shareholders could have a material impact on the Fund. The aggregate percentage of such owners was 63.4%.
28
Morgan Stanley Insight Fund
Consolidated Financial Highlights
Selected ratios and per share data for a share of beneficial interest outstanding throughout each period:
| | | FOR THE
SIX MONTHS
ENDED
JUNE 30, | | FOR THE YEAR ENDED
DECEMBER 31, | | FOR THE
PERIOD
DECEMBER 1,
2020 TO
DECEMBER 31, | | FOR THE YEAR ENDED
NOVEMBER 30, | |
| | | 2024 | | 2023 | | 2022 | | 2021 | | 2020(1) | | 2020(1) | | 2019(1) | |
| | | (unaudited) | | | | | | | | | | | | | |
Class A Shares | |
Selected Per Share Data: | |
Net asset value, beginning
of period | | $ | 26.39 | | | $ | 17.28 | | | $ | 65.88 | | | $ | 80.81 | | | $ | 87.67 | | | $ | 43.85 | | | $ | 39.12 | | |
Income (loss) from
investment operations: | |
| Net investment loss(2) | | | (0.12 | ) | | | (0.19 | ) | | | (0.34 | ) | | | (0.79 | ) | | | (0.07 | ) | | | (0.65 | ) | | | (0.29 | ) | |
Net realized and unrealized
gain (loss) | | | (0.16 | ) | | | 9.30 | | | | (39.30 | ) | | | (4.30 | ) | | | 0.53 | | | | 47.31 | | | | 8.07 | | |
Total income (loss) from
investment operations | | | (0.28 | ) | | | 9.11 | | | | (39.64 | ) | | | (5.09 | ) | | | 0.46 | | | | 46.66 | | | | 7.78 | | |
Less distributions from: | |
Net investment income | | | — | | | | — | | | | — | | | | (0.02 | ) | | | — | | | | — | | | | — | | |
Net realized gain | | | — | | | | — | | | | (8.96 | ) | | | (9.82 | ) | | | (7.32 | ) | | | (2.84 | ) | | | (3.05 | ) | |
Total distributions | | | — | | | | — | | | | (8.96 | ) | | | (9.84 | ) | | | (7.32 | ) | | | (2.84 | ) | | | (3.05 | ) | |
Net asset value, end of period | | $ | 26.11 | | | $ | 26.39 | | | $ | 17.28 | | | $ | 65.88 | | | $ | 80.81 | | | $ | 87.67 | | | $ | 43.85 | | |
| Total Return(3) | | | (1.06 | )%(4) | | | 52.72 | %(5) | | | (61.43 | )% | | | (6.60 | )% | | | 0.44 | %(4) | | | 114.36 | % | | | 21.87 | % | |
Ratios to Average Net Assets: | |
Net expenses | | | 1.15 | %(6)(7) | | | 1.11 | %(7)(8) | | | 1.15 | %(7) | | | 1.10 | %(7) | | | 1.05 | %(6)(7) | | | 1.09 | %(7) | | | 1.16 | %(7) | |
Net expenses excluding
interest expenses | | | N/A | | | | N/A | | | | N/A | | | | 1.10 | %(7) | | | N/A | | | | 1.09 | %(7) | | | N/A | | |
Net investment loss | | | (0.93 | )%(6)(7) | | | (0.88 | )%(7)(8) | | | (0.94 | )%(7) | | | (0.92 | )%(7) | | | (1.02 | )%(6)(7) | | | (1.08 | )%(7) | | | (0.70 | )%(7) | |
Rebate from Morgan Stanley
affiliate | | | 0.00 | %(6)(9) | | | 0.00 | %(9) | | | 0.00 | %(9) | | | 0.00 | %(9) | | | 0.01 | %(6) | | | 0.01 | % | | | 0.01 | % | |
Supplemental Data: | |
Net assets, end of period,
in thousands | | $ | 638,491 | | | $ | 810,696 | | | $ | 660,505 | | | $ | 2,599,064 | | | $ | 3,404,472 | | | $ | 3,311,047 | | | $ | 1,047,509 | | |
Portfolio turnover rate | | | 19 | %(4) | | | 40 | % | | | 37 | % | | | 72 | % | | | 17 | %(4) | | | 55 | % | | | 93 | % | |
(1) Not consolidated.
(2) The per share amounts were computed using an average number of shares outstanding during the period.
(3) Does not reflect the deduction of sales charge. Calculated based on the net asset value as of the last business day of the period.
(4) Not annualized.
(5) Reflects prior period transfer agency and sub transfer agency fees that were reimbursed in 2023. The amount of the reimbursement was immaterial on a per share basis and the impact was less than 0.005% to the total return of Class A shares.
(6) Annualized.
(7) The ratios reflect the rebate of certain Fund expenses in connection with investments in a Morgan Stanley affiliate during the period. The effect of the rebate on the ratios is disclosed in the above table as "Rebate from Morgan Stanley affiliate."
(8) If the Fund had not received the reimbursement of transfer agency and sub transfer agency fees from the Adviser, the net expenses and net investment loss ratios, would have been as follows for Class A shares:
PERIOD ENDED | | EXPENSE
RATIO | | NET INVESTMENT
LOSS RATIO | |
December 31, 2023 | | | 1.15 | % | | | (0.92 | )% | |
(9) Amount is less than 0.005%.
See Notes to Consolidated Financial Statements
29
Morgan Stanley Insight Fund
Consolidated Financial Highlights continued
| | | FOR THE
SIX MONTHS
ENDED
JUNE 30, | | FOR THE YEAR ENDED
DECEMBER 31, | | FOR THE
PERIOD
DECEMBER 1,
2020 TO
DECEMBER 31, | | FOR THE YEAR ENDED
NOVEMBER 30, | |
| | | 2024 | | 2023 | | 2022 | | 2021 | | 2020(1) | | 2020(1) | | 2019(1) | |
| | | (unaudited) | | | | | | | | | | | | | |
Class L Shares | |
Selected Per Share Data: | |
Net asset value, beginning
of period | | $ | 10.98 | | | $ | 7.23 | | | $ | 40.00 | | | $ | 53.31 | | | $ | 60.31 | | | $ | 31.22 | | | $ | 28.88 | | |
Income (loss) from
investment operations: | |
| Net investment loss(2) | | | (0.08 | ) | | | (0.12 | ) | | | (0.30 | ) | | | (0.76 | ) | | | (0.07 | ) | | | (0.62 | ) | | | (0.35 | ) | |
Net realized and unrealized
gain (loss) | | | (0.07 | ) | | | 3.87 | | | | (23.51 | ) | | | (2.73 | ) | | | 0.39 | | | | 32.55 | | | | 5.74 | | |
Total income (loss) from
investment operations | | | (0.15 | ) | | | 3.75 | | | | (23.81 | ) | | | (3.49 | ) | | | 0.32 | | | | 31.93 | | | | 5.39 | | |
Less distributions from: | |
Net investment income | | | — | | | | — | | | | — | | | | (0.00 | )(3) | | | — | | | | — | | | | — | | |
Net realized gain | | | — | | | | — | | | | (8.96 | ) | | | (9.82 | ) | | | (7.32 | ) | | | (2.84 | ) | | | (3.05 | ) | |
Total distributions | | | — | | | | — | | | | (8.96 | ) | | | (9.82 | ) | | | (7.32 | ) | | | (2.84 | ) | | | (3.05 | ) | |
Net asset value, end of period | | $ | 10.83 | | | $ | 10.98 | | | $ | 7.23 | | | $ | 40.00 | | | $ | 53.31 | | | $ | 60.31 | | | $ | 31.22 | | |
| Total Return(4) | | | (1.37 | )%(5) | | | 52.08 | %(6) | | | (61.64 | )% | | | (6.98 | )% | | | 0.39 | %(5) | | | 113.35 | % | | | 21.29 | % | |
Ratios to Average Net Assets: | |
Net expenses | | | 1.64 | %(7)(8) | | | 1.59 | %(8)(9) | | | 1.62 | %(8) | | | 1.53 | %(8) | | | 1.52 | %(7)(8) | | | 1.58 | %(8) | | | 1.63 | %(8) | |
Net expenses excluding
interest expenses | | | N/A | | | | N/A | | | | N/A | | | | 1.53 | %(8) | | | N/A | | | | 1.58 | %(8) | | | N/A | | |
Net investment loss | | | (1.43 | )%(7)(8) | | | (1.36 | )%(8)(9) | | | (1.41 | )%(8) | | | (1.35 | )%(8) | | | (1.49 | )%(7)(8) | | | (1.56 | )%(8) | | | (1.20 | )%(8) | |
Rebate from Morgan Stanley
affiliate | | | 0.00 | %(7)(10) | | | 0.00 | %(10) | | | 0.00 | %(10) | | | 0.00 | %(10) | | | 0.01 | %(7) | | | 0.01 | % | | | 0.01 | % | |
Supplemental Data: | |
Net assets, end of period,
in thousands | | $ | 13,501 | | | $ | 15,325 | | | $ | 11,949 | | | $ | 44,361 | | | $ | 56,517 | | | $ | 57,565 | | | $ | 31,998 | | |
Portfolio turnover rate | | | 19 | %(5) | | | 40 | % | | | 37 | % | | | 72 | % | | | 17 | %(5) | | | 55 | % | | | 93 | % | |
(1) Not consolidated.
(2) The per share amounts were computed using an average number of shares outstanding during the period.
(3) Amount is less than $0.005 per share.
(4) Calculated based on the net asset value as of the last business day of the period.
(5) Not annualized.
(6) Reflects prior period transfer agency and sub transfer agency fees that were reimbursed in 2023. The amount of the reimbursement was immaterial on a per share basis and the impact was less than 0.005% to the total return of Class L shares.
(7) Annualized.
(8) The ratios reflect the rebate of certain Fund expenses in connection with investments in a Morgan Stanley affiliate during the period. The effect of the rebate on the ratios is disclosed in the above table as "Rebate from Morgan Stanley affiliate."
(9) If the Fund had not received the reimbursement of transfer agency and sub transfer agency fees from the Adviser, the net expenses and net investment loss ratios, would have been as follows for Class L shares:
PERIOD ENDED | | EXPENSE
RATIO | | NET INVESTMENT
LOSS RATIO | |
December 31, 2023 | | | 1.64 | % | | | (1.41 | )% | |
(10) Amount is less than 0.005%.
See Notes to Consolidated Financial Statements
30
Morgan Stanley Insight Fund
Consolidated Financial Highlights continued
| | | FOR THE
SIX MONTHS
ENDED
JUNE 30, | | FOR THE YEAR ENDED
DECEMBER 31, | | FOR THE
PERIOD
DECEMBER 1,
2020 TO
DECEMBER 31, | | FOR THE YEAR ENDED
NOVEMBER 30, | |
| | | 2024 | | 2023 | | 2022 | | 2021 | | 2020(1) | | 2020(1) | | 2019(1) | |
| | | (unaudited) | | | | | | | | | | | | | |
Class I Shares | |
Selected Per Share Data: | |
Net asset value, beginning
of period | | $ | 32.81 | | | $ | 21.44 | | | $ | 76.46 | | | $ | 91.91 | | | $ | 98.70 | | | $ | 48.87 | | | $ | 43.14 | | |
Income (loss) from
investment operations: | |
| Net investment loss(2) | | | (0.11 | ) | | | (0.17 | ) | | | (0.30 | ) | | | (0.63 | ) | | | (0.06 | ) | | | (0.57 | ) | | | (0.20 | ) | |
Net realized and unrealized
gain (loss) | | | (0.20 | ) | | | 11.54 | | | | (45.76 | ) | | | (4.96 | ) | | | 0.59 | | | | 53.24 | | | | 8.98 | | |
Total income (loss) from
investment operations | | | (0.31 | ) | | | 11.37 | | | | (46.06 | ) | | | (5.59 | ) | | | 0.53 | | | | 52.67 | | | | 8.78 | | |
Less distributions from: | |
Net investment income | | | — | | | | — | | | | — | | | | (0.04 | ) | | | — | | | | — | | | | — | | |
Net realized gain | | | — | | | | — | | | | (8.96 | ) | | | (9.82 | ) | | | (7.32 | ) | | | (2.84 | ) | | | (3.05 | ) | |
Total distributions | | | — | | | | — | | | | (8.96 | ) | | | (9.86 | ) | | | (7.32 | ) | | | (2.84 | ) | | | (3.05 | ) | |
Net asset value, end of period | | $ | 32.50 | | | $ | 32.81 | | | $ | 21.44 | | | $ | 76.46 | | | $ | 91.91 | | | $ | 98.70 | | | $ | 48.87 | | |
| Total Return(3) | | | (0.94 | )%(4) | | | 53.03 | %(5) | | | (61.32 | )% | | | (6.35 | )% | | | 0.46 | %(4) | | | 114.94 | % | | | 22.17 | % | |
Ratios to Average Net Assets: | |
Net expenses | | | 0.91 | %(6)(7) | | | 0.88 | %(7)(8)(9) | | | 0.90 | %(7) | | | 0.83 | %(7) | | | 0.81 | %(6)(7) | | | 0.83 | %(7) | | | 0.90 | %(7) | |
Net expenses excluding
interest expenses | | | N/A | | | | N/A | | | | N/A | | | | 0.83 | %(7) | | | N/A | | | | 0.83 | %(7) | | | N/A | | |
Net investment loss | | | (0.70 | )%(6)(7) | | | (0.65 | )%(7)(8)(9) | | | (0.70 | )%(7) | | | (0.65 | )%(7) | | | (0.78 | )%(6)(7) | | | (0.82 | )%(7) | | | (0.43 | )%(7) | |
Rebate from Morgan Stanley
affiliate | | | 0.00 | %(6)(10) | | | 0.00 | %(10) | | | 0.00 | %(10) | | | 0.00 | %(10) | | | 0.01 | %(6) | | | 0.01 | % | | | 0.01 | % | |
Supplemental Data: | |
Net assets, end of period,
in thousands | | $ | 439,020 | | | $ | 571,096 | | | $ | 501,518 | | | $ | 2,746,086 | | | $ | 3,201,566 | | | $ | 3,150,156 | | | $ | 730,090 | | |
Portfolio turnover rate | | | 19 | %(4) | | | 40 | % | | | 37 | % | | | 72 | % | | | 17 | %(4) | | | 55 | % | | | 93 | % | |
(1) Not consolidated.
(2) The per share amounts were computed using an average number of shares outstanding during the period.
(3) Calculated based on the net asset value as of the last business day of the period.
(4) Not annualized.
(5) Performance was positively impacted by approximately 0.04% for Class I shares due to the reimbursement of transfer agency and sub transfer agency fees from prior years. Had this reimbursement not occurred, the total return for Class I shares would have been 52.99%.
(6) Annualized.
(7) The ratios reflect the rebate of certain Fund expenses in connection with investments in a Morgan Stanley affiliate during the period. The effect of the rebate on the ratios is disclosed in the above table as "Rebate from Morgan Stanley affiliate."
(8) If the Fund had not received the reimbursement of transfer agency and sub transfer agency fees from the Adviser, the net expenses and net investment loss ratios, would have been as follows for Class I shares:
PERIOD ENDED | | EXPENSE
RATIO | | NET INVESTMENT
LOSS RATIO | |
December 31, 2023 | | | 0.92 | % | | | (0.69 | )% | |
(9) If the Fund had borne all of its expenses that were reimbursed and/or waived by the Adviser/Administrator, the annualized expense and net investment loss ratios would have been as follows for Class I shares:
PERIOD ENDED | | EXPENSE
RATIO | | NET INVESTMENT
LOSS RATIO | |
December 31, 2023 | | | 0.93 | % | | | (0.70 | )% | |
(10) Amount is less than 0.005%.
See Notes to Consolidated Financial Statements
31
Morgan Stanley Insight Fund
Consolidated Financial Highlights continued
| | | FOR THE
SIX MONTHS
ENDED
JUNE 30, | | FOR THE YEAR ENDED
DECEMBER 31, | | FOR THE
PERIOD
DECEMBER 1,
2020 TO
DECEMBER 31, | | FOR THE YEAR ENDED
NOVEMBER 30, | |
| | | 2024 | | 2023 | | 2022 | | 2021 | | 2020(1) | | 2020(1) | | 2019(1) | |
| | | (unaudited) | | | | | | | | | | | | | |
Class C Shares | |
Selected Per Share Data: | |
Net asset value, beginning
of period | | $ | 10.14 | | | $ | 6.70 | | | $ | 38.71 | | | $ | 52.06 | | | $ | 59.08 | | | $ | 30.72 | | | $ | 28.53 | | |
Income (loss) from
investment operations: | |
| Net investment loss(2) | | | (0.08 | ) | | | (0.14 | ) | | | (0.35 | ) | | | (0.88 | ) | | | (0.08 | ) | | | (0.74 | ) | | | (0.42 | ) | |
Net realized and unrealized
gain (loss) | | | (0.06 | ) | | | 3.58 | | | | (22.70 | ) | | | (2.65 | ) | | | 0.38 | | | | 31.94 | | | | 5.66 | | |
Total income (loss) from
investment operations | | | (0.14 | ) | | | 3.44 | | | | (23.05 | ) | | | (3.53 | ) | | | 0.30 | | | | 31.20 | | | | 5.24 | | |
Less distributions from: | |
Net investment income | | | — | | | | — | | | | — | | | | (0.00 | )(3) | | | — | | | | — | | | | — | | |
Net realized gain | | | — | | | | — | | | | (8.96 | ) | | | (9.82 | ) | | | (7.32 | ) | | | (2.84 | ) | | | (3.05 | ) | |
Total distributions | | | — | | | | — | | | | (8.96 | ) | | | (9.82 | ) | | | (7.32 | ) | | | (2.84 | ) | | | (3.05 | ) | |
Net asset value, end of period | | $ | 10.00 | | | $ | 10.14 | | | $ | 6.70 | | | $ | 38.71 | | | $ | 52.06 | | | $ | 59.08 | | | $ | 30.72 | | |
| Total Return(4) | | | (1.38 | )%(5) | | | 51.34 | %(6) | | | (61.68 | )% | | | (7.25 | )% | | | 0.38 | %(5) | | | 112.77 | % | | | 21.00 | % | |
Ratios to Average Net Assets: | |
Net expenses | | | 1.90 | %(7)(8) | | | 1.88 | %(8)(9) | | | 1.88 | %(8) | | | 1.80 | %(8)(10) | | | 1.77 | %(7)(8) | | | 1.83 | %(8) | | | 1.90 | %(8) | |
Net expenses excluding
interest expenses | | | N/A | | | | N/A | | | | N/A | | | | 1.80 | %(8)(10) | | | N/A | | | | 1.83 | %(8) | | | N/A | | |
Net investment loss | | | (1.69 | )%(7)(8) | | | (1.65 | )%(8)(9) | | | (1.67 | )%(8) | | | (1.62 | )%(8)(10) | | | (1.73 | )%(7)(8) | | | (1.82 | )%(8) | | | (1.44 | )%(8) | |
Rebate from Morgan Stanley
affiliate | | | 0.00 | %(7)(11) | | | 0.00 | %(11) | | | 0.00 | %(11) | | | 0.00 | %(11) | | | 0.01 | %(7) | | | 0.01 | % | | | 0.01 | % | |
Supplemental Data: | |
Net assets, end of period,
in thousands | | $ | 86,497 | | | $ | 104,895 | | | $ | 83,721 | | | $ | 357,118 | | | $ | 386,615 | | | $ | 373,580 | | | $ | 117,696 | | |
Portfolio turnover rate | | | 19 | %(5) | | | 40 | % | | | 37 | % | | | 72 | % | | | 17 | %(5) | | | 55 | % | | | 93 | % | |
(1) Not consolidated.
(2) The per share amounts were computed using an average number of shares outstanding during the period.
(3) Amount is less than $0.005 per share.
(4) Does not reflect the deduction of sales charge. Calculated based on the net asset value as of the last business day of the period.
(5) Not annualized.
(6) Reflects prior period transfer agency and sub transfer agency fees that were reimbursed in 2023. The amount of the reimbursement was immaterial on a per share basis and the impact was less than 0.005% to the total return of Class C shares.
(7) Annualized.
(8) The ratios reflect the rebate of certain Fund expenses in connection with investments in a Morgan Stanley affiliate during the period. The effect of the rebate on the ratios is disclosed in the above table as "Rebate from Morgan Stanley affiliate."
(9) If the Fund had not received the reimbursement of transfer agency and sub transfer agency fees from the Adviser, the net expenses and net investment loss ratios, would have been as follows for Class C shares:
PERIOD ENDED | | EXPENSE
RATIO | | NET INVESTMENT
LOSS RATIO | |
December 31, 2023 | | | 1.92 | % | | | (1.69 | )% | |
(10) If the Fund had borne all of its expenses that were reimbursed and/or waived by the Adviser/Administrator, the annualized expense and net investment loss ratios would have been as follows for Class C shares:
PERIOD ENDED | | EXPENSE
RATIO | | NET INVESTMENT
LOSS RATIO | |
December 31, 2021 | | | 1.81 | % | | | (1.63 | )% | |
(11) Amount is less than 0.005%.
See Notes to Consolidated Financial Statements
32
Morgan Stanley Insight Fund
Consolidated Financial Highlights continued
| | | FOR THE
SIX MONTHS
ENDED
JUNE 30, | | FOR THE YEAR ENDED
DECEMBER 31, | | FOR THE
PERIOD
DECEMBER 1,
2020 TO
DECEMBER 31, | | FOR THE YEAR ENDED
NOVEMBER 30, | |
| | | 2024 | | 2023 | | 2022 | | 2021 | | 2020(1) | | 2020(1) | | 2019(1) | |
| | | (unaudited) | | | | | | | | | | | | | |
| Class R6 Shares(2) | |
Selected Per Share Data: | |
Net asset value, beginning
of period | | $ | 33.20 | | | $ | 21.67 | | | $ | 76.99 | | | $ | 92.39 | | | $ | 99.17 | | | $ | 49.05 | | | $ | 43.34 | | |
Income (loss) from
investment operations: | |
| Net investment loss(3) | | | (0.10 | ) | | | (0.14 | ) | | | (0.24 | ) | | | (0.52 | ) | | | (0.06 | ) | | | (0.60 | ) | | | (0.11 | ) | |
Net realized and unrealized
gain (loss) | | | (0.20 | ) | | | 11.67 | | | | (46.12 | ) | | | (5.01 | ) | | | 0.60 | | | | 53.56 | | | | 8.87 | | |
Total income (loss) from
investment operations | | | (0.30 | ) | | | 11.53 | | | | (46.36 | ) | | | (5.53 | ) | | | 0.54 | | | | 52.96 | | | | 8.76 | | |
Less distributions from: | |
Net investment income | | | — | | | | — | | | | — | | | | (0.05 | ) | | | — | | | | — | | | | — | | |
Net realized gain | | | — | | | | — | | | | (8.96 | ) | | | (9.82 | ) | | | (7.32 | ) | | | (2.84 | ) | | | (3.05 | ) | |
Total distributions | | | — | | | | — | | | | (8.96 | ) | | | (9.87 | ) | | | (7.32 | ) | | | (2.84 | ) | | | (3.05 | ) | |
Net asset value, end of period | | $ | 32.90 | | | $ | 33.20 | | | $ | 21.67 | | | $ | 76.99 | | | $ | 92.39 | | | $ | 99.17 | | | $ | 49.05 | | |
| Total Return(4) | | | (0.90 | )%(5) | | | 53.21 | %(6) | | | (61.29 | )% | | | (6.24 | )% | | | 0.46 | %(5) | | | 115.12 | % | | | 22.01 | % | |
Ratios to Average Net Assets: | |
Net expenses | | | 0.81 | %(7)(8) | | | 0.77 | %(8)(9) | | | 0.78 | %(8)(10) | | | 0.72 | %(8)(10) | | | 0.71 | %(7)(8) | | | 0.73 | %(8)(10) | | | 0.77 | %(8)(10) | |
Net expenses excluding
interest expenses | | | N/A | | | | N/A | | | | N/A | | | | 0.72 | %(8)(10) | | | N/A | | | | 0.73 | %(8)(10) | | | N/A | | |
Net investment loss | | | (0.60 | )%(7)(8) | | | (0.54 | )%(8)(9) | | | (0.57 | )%(8)(10) | | | (0.53 | )%(8)(10) | | | (0.68 | )%(7)(8) | | | (0.75 | )%(8)(10) | | | (0.22 | )%(8)(10) | |
Rebate from Morgan Stanley
affiliate | | | 0.00 | %(7)(11) | | | 0.00 | % | | | 0.01 | % | | | 0.00 | %(11) | | | 0.01 | %(7) | | | 0.01 | % | | | 0.01 | % | |
Supplemental Data: | |
Net assets, end of period,
in thousands | | $ | 8,190 | | | $ | 78,733 | | | $ | 74,343 | | | $ | 209,463 | | | $ | 95,977 | | | $ | 81,699 | | | $ | 423 | | |
Portfolio turnover rate | | | 19 | %(5) | | | 40 | % | | | 37 | % | | | 72 | % | | | 17 | %(5) | | | 55 | % | | | 93 | % | |
(1) Not consolidated.
(2) Effective April 29, 2022, Class IS shares were renamed Class R6 shares.
(3) The per share amounts were computed using an average number of shares outstanding during the period.
(4) Calculated based on the net asset value as of the last business day of the period.
(5) Not annualized.
(6) Performance was positively impacted by approximately 0.05% for Class R6 shares due to the reimbursement of transfer agency fees from prior years. Had this reimbursement not occurred, the total return for Class R6 shares would have been 53.16%.
(7) Annualized.
(8) The ratios reflect the rebate of certain Fund expenses in connection with investments in a Morgan Stanley affiliate during the period. The effect of the rebate on the ratios is disclosed in the above table as "Rebate from Morgan Stanley affiliate."
(9) If the Fund had not received the reimbursement of transfer agency fees from the Adviser, the net expenses and net investment loss ratios, would have been as follows for Class R6 shares:
PERIOD ENDED | | EXPENSE
RATIO | | NET INVESTMENT
LOSS RATIO | |
December 31, 2023 | | | 0.80 | % | | | (0.57 | )% | |
(10) If the Fund had borne all of its expenses that were reimbursed and/or waived by the Adviser/Administrator, the annualized expense and net investment loss ratios would have been as follows for Class R6 shares:
PERIOD ENDED | | EXPENSE
RATIO | | NET INVESTMENT
LOSS RATIO | |
December 31, 2022 | | | 0.79 | % | | | (0.58 | )% | |
December 31, 2021 | | | 0.73 | | | | (0.54 | ) | |
November 30, 2020 | | | 0.76 | | | | (0.78 | ) | |
November 30, 2019 | | | 0.78 | | | | (0.23 | ) | |
(11) Amount is less than 0.005%.
See Notes to Consolidated Financial Statements
33
Morgan Stanley Insight Fund
Consolidated Financial Highlights continued
| | | FOR THE
SIX MONTHS
ENDED
JUNE 30, | | FOR THE YEAR ENDED DECEMBER 31, | | FOR THE
PERIOD
DECEMBER 1,
2020 TO
DECEMBER 31, | | FOR THE
YEAR
ENDED
NOVEMBER 30, | | FOR THE
PERIOD
JULY 12,
2019(1) TO
NOVEMBER 30, | |
| | | 2024 | | 2023 | | 2022 | | 2021 | | 2020(2) | | 2020(2) | | 2019(2) | |
| | | (unaudited) | | | | | | | | | | | | | |
Class IR Shares | |
Selected Per Share Data: | |
Net asset value, beginning
of period | | $ | 33.35 | | | $ | 21.77 | | | $ | 77.24 | | | $ | 92.65 | | | $ | 99.43 | | | $ | 49.17 | | | $ | 51.67 | | |
Income (loss) from
investment operations: | |
| Net investment loss(3) | | | (0.10 | ) | | | (0.14 | ) | | | (0.29 | ) | | | (0.54 | ) | | | (0.06 | ) | | | (0.47 | ) | | | (0.05 | ) | |
Net realized and
unrealized gain (loss) | | | (0.20 | ) | | | 11.72 | | | | (46.22 | ) | | | (5.00 | ) | | | 0.60 | | | | 53.57 | | | | (2.45 | ) | |
Total income (loss) from
investment operations | | | (0.30 | ) | | | 11.58 | | | | (46.51 | ) | | | (5.54 | ) | | | 0.54 | | | | 53.10 | | | | (2.50 | ) | |
Less distributions from: | |
Net investment income | | | — | | | | — | | | | — | | | | (0.05 | ) | | | — | | | | — | | | | — | | |
Net realized gain | | | — | | | | — | | | | (8.96 | ) | | | (9.82 | ) | | | (7.32 | ) | | | (2.84 | ) | | | — | | |
Total distributions | | | — | | | | — | | | | (8.96 | ) | | | (9.87 | ) | | | (7.32 | ) | | | (2.84 | ) | | | — | | |
Net asset value, end of
period | | $ | 33.05 | | | $ | 33.35 | | | $ | 21.77 | | | $ | 77.24 | | | $ | 92.65 | | | $ | 99.43 | | | $ | 49.17 | | |
| Total Return(4) | | | (0.90 | )%(5) | | | 53.19 | %(6) | | | (61.29 | )% | | | (6.23 | )% | | | 0.46 | %(5) | | | 115.13 | % | | | (4.84 | )%(5) | |
Ratios to Average Net Assets: | |
Net expenses | | | 0.81 | %(7)(8)(9) | | | 0.76 | %(8)(9)(10) | | | 0.76 | %(8) | | | 0.72 | %(8) | | | 0.71 | %(7)(8) | | | 0.73 | %(8) | | | 0.77 | %(7)(8)(9) | |
Net expenses excluding
interest expenses | | | N/A | | | | N/A | | | | N/A | | | | 0.72 | %(8) | | | N/A | | | | 0.73 | %(8) | | | N/A | | |
Net investment loss | | | (0.57 | )%(7)(8)(9) | | | (0.52 | )%(8)(9)(10) | | | (0.61 | )%(8) | | | (0.55 | )%(8) | | | (0.68 | )%(7)(8) | | | (0.71 | )%(8) | | | (0.28 | )%(7)(8)(9) | |
Rebate from Morgan
Stanley affiliate | | | 0.00 | %(7)(11) | | | 0.00 | %(11) | | | 0.00 | %(11) | | | 0.00 | %(11) | | | 0.01 | %(7) | | | 0.01 | % | | | 0.01 | %(7) | |
Supplemental Data: | |
Net assets, end of period,
in thousands | | $ | 11 | | | $ | 11 | | | $ | 7 | | | $ | 195,328 | | | $ | 317,213 | | | $ | 315,757 | | | $ | 133,266 | | |
Portfolio turnover rate | | | 19 | %(5) | | | 40 | % | | | 37 | % | | | 72 | % | | | 17 | %(5) | | | 55 | % | | | 93 | % | |
(1) Commencement of Offering.
(2) Not consolidated.
(3) The per share amounts were computed using an average number of shares outstanding during the period.
(4) Calculated based on the net asset value as of the last business day of the period.
(5) Not annualized.
(6) Performance was positively impacted by approximately 0.04% for Class IR shares due to the reimbursement of transfer agency fees from prior years. Had this reimbursement not occurred, the total return for Class IR shares would have been 53.15%.
(7) Annualized.
(8) The ratios reflect the rebate of certain Fund expenses in connection with investments in a Morgan Stanley affiliate during the period. The effect of the rebate on the ratios is disclosed in the above table as "Rebate from Morgan Stanley affiliate."
(9) If the Fund had borne all of its expenses that were reimbursed and/or waived by the Adviser/Administrator, the annualized expense and net investment loss ratios would have been as follows for Class IR shares:
PERIOD ENDED | | EXPENSE
RATIO | | NET INVESTMENT
INCOME (LOSS) RATIO | |
June 30, 2024 | | | 19.83 | % | | | (19.59 | )% | |
December 31, 2023 | | | 28.71 | | | | (28.47 | ) | |
November 30, 2019 | | | 0.81 | | | | (0.32 | ) | |
(10) If the Fund had not received the reimbursement of transfer agency fees from the Adviser, the net expenses and net investment loss ratios, would have been as follows for Class IR shares:
PERIOD ENDED | | EXPENSE
RATIO | | NET INVESTMENT
LOSS RATIO | |
December 31, 2023 | | | 0.80 | % | | | (0.56 | )% | |
(11) Amount is less than 0.005%.
See Notes to Consolidated Financial Statements
34
Morgan Stanley Insight Fund
Investment Advisory Agreement Approval (unaudited)
Nature, Extent and Quality of Services
The Board reviewed and considered the nature and extent of the investment advisory services provided by the Adviser under the advisory agreement, including portfolio management, investment research and equity and fixed income securities trading. The Board also reviewed and considered the nature and extent of the non-advisory, administrative services provided by the Administrator under the administration agreement, including accounting, operations, clerical, bookkeeping, compliance, business management and planning, legal services and the provision of supplies, office space and utilities at the Adviser's expense. The Board also considered the Adviser's investment in personnel and infrastructure that benefits the Fund. (The Adviser and Administrator together are referred to as the "Adviser" and the advisory and administration agreements together are referred to as the "Management Agreement.") The Board also considered that the Adviser serves a variety of other investment advisory clients and has experience overseeing service providers. The Board also compared the nature of the services provided by the Adviser with similar services provided by non-affiliated advisers as prepared by Broadridge Financial Solutions, Inc. ("Broadridge").
The Board reviewed and considered the qualifications of the portfolio managers, the senior administrative managers and other key personnel of the Adviser who provide the advisory and administrative services to the Fund. The Board determined that the Adviser's portfolio managers and key personnel are well qualified by education and/or training and experience to perform the services in an efficient and professional manner. The Board concluded that the nature and extent of the advisory and administrative services provided were necessary and appropriate for the conduct of the business and investment activities of the Fund and supported its decision to approve the Management Agreement.
Performance, Fees and Expenses of the Fund
The Board reviewed the performance, fees and expenses of the Fund compared to its peers, as prepared by Broadridge, and to appropriate benchmarks where applicable. The Board discussed with the Adviser the performance goals and the actual results achieved in managing the Fund. When considering a fund's performance, the Board and the Adviser place emphasis on trends and longer-term returns (focusing on one-year, three-year and five-year performance, as of December 31, 2023, or since inception, as applicable). When a fund underperforms its benchmark and/or its peer group average, the Board and the Adviser discuss the causes of such underperformance and, where necessary, they discuss specific changes to investment strategy or investment personnel. The Board noted that the Fund's performance was above its peer group average for the one-year period but below its peer group average for the three- and five-year periods. The Board discussed with the Adviser the level of the advisory and administration fees (together, the "management fee") for this Fund relative to comparable funds and/or other accounts advised by the Adviser and/or compared to its peers as prepared by Broadridge. In addition to the management fee, the Board also reviewed the Fund's total expense ratio. The Board noted that the Fund's management fee was lower than its peer group average and the total
35
Morgan Stanley Insight Fund
Investment Advisory Agreement Approval (unaudited) continued
expense ratio was higher than but close to its peer group average. After discussion, the Board concluded that the Fund's (i) performance was acceptable; and (ii) management fee and total expense ratio were competitive with its peer group averages.
Economies of Scale
The Board considered the size and growth prospects of the Fund and how that relates to the Fund's total expense ratio and particularly the Fund's management fee rate, which includes breakpoints. In conjunction with its review of the Adviser's profitability, the Board discussed with the Adviser how a change in assets can affect the efficiency or effectiveness of managing the Fund and whether the management fee level is appropriate relative to current and projected asset levels and/or whether the management fee structure reflects economies of scale as asset levels change. The Board has determined that its review of the actual and/or potential economies of scale of the Fund supports its decision to approve the Management Agreement.
Profitability of the Adviser and Affiliates
The Board considered information concerning the costs incurred and profits realized by the Adviser and its affiliates during the last year from their relationship with the Fund and during the last two years from their relationship with the Morgan Stanley Fund Complex and reviewed with the Adviser the cost allocation methodology used to determine the profitability of the Adviser and affiliates. The Board has determined that its review of the analysis of the Adviser's expenses and profitability supports its decision to approve the Management Agreement.
Other Benefits of the Relationship
The Board considered other direct and indirect benefits to the Adviser and/or its affiliates derived from their relationship with the Fund and other funds advised by the Adviser. These benefits may include, among other things, fees for trading, distribution and/or shareholder servicing and for transaction processing and reporting platforms used by securities lending agents, and research received by the Adviser generated from commission dollars spent on funds' portfolio trading. The Board reviewed with the Adviser these arrangements and the reasonableness of the Adviser's costs relative to the services performed. The Board has determined that its review of the other benefits received by the Adviser or its affiliates supports its decision to approve the Management Agreement.
Resources of the Adviser and Historical Relationship Between the Fund and the Adviser
The Board considered whether the Adviser is financially sound and has the resources necessary to perform its obligations under the Management Agreement. The Board also reviewed and considered the historical relationship between the Fund and the Adviser, including the organizational structure of the Adviser, the policies and procedures formulated and adopted by the Adviser for managing the Fund's
36
Morgan Stanley Insight Fund
Investment Advisory Agreement Approval (unaudited) continued
operations and the Board's confidence in the competence and integrity of the senior managers and key personnel of the Adviser. The Board concluded that the Adviser has the financial resources necessary to fulfill its obligations under the Management Agreement and that it is beneficial for the Fund to continue its relationship with the Adviser.
Other Factors and Current Trends
The Board considered the controls and procedures adopted and implemented by the Adviser and monitored by the Fund's Chief Compliance Officer and concluded that the conduct of business by the Adviser indicates a good faith effort on its part to adhere to high ethical standards in the conduct of the Fund's business.
General Conclusion
After considering and weighing all of the above factors, with various written materials and verbal information presented by the Adviser, the Board concluded that it would be in the best interest of the Fund and its shareholders to approve renewal of the Management Agreement for another year. In reaching this conclusion the Board did not give particular weight to any single piece of information or factor referenced above. The Board considered these factors and information over the course of the year and in numerous meetings, some of which were in executive session with only the independent Board members and their counsel present. It is possible that individual Board members may have weighed these factors, and the information presented, differently in reaching their individual decisions to approve the Management Agreement.
37
(This page has been left blank intentionally.)
This report is submitted for the general information of the shareholders of the Fund. For more detailed information about the Fund, its fees and expenses and other pertinent information, please read its Prospectus. The Fund's Statement of Additional Information contains additional information about the Fund, including its Trustees. It is available, without charge, by calling 1 (800) 869-6397.
This report is not authorized for distribution to prospective investors in the Fund unless preceded or accompanied by an effective Prospectus. Please read the Prospectus carefully before investing.
Morgan Stanley Distribution, Inc., member FINRA.
© 2024 Morgan Stanley

Item 8. Changes in and Disagreements with Accountants for Open-End Management Investment Companies
Not applicable.
Item 9. Proxy Disclosures for Open-End Management Investment Companies
Not applicable.
Item 10. Remuneration Paid to Directors, Officers, and Others of Open-End Management Investment Companies
The information is disclosed as part of the Financial Statements included in Item 7 of this Form N-CSR.
Item 11. Statement Regarding Basis for Approval of Investment Advisory Contract
This information is disclosed in the Semi-Annual Financial Statements and Additional Information under Item 7 of this Form N-CSR.
Item 12. Disclosure of Proxy Voting Policies and Procedures for Closed-End Management Investment Companies
Not applicable.
Item 13. Portfolio Managers of Closed-End Management Investment Companies
Not applicable.
Item 14. Purchases of Equity Securities by Closed-End Management Investment Company and Affiliated Purchasers
Not applicable.
Item 15. Submission of Matters to a Vote of Security Holders
There have been no material changes to the procedures by which shareholders may recommend nominee to the Fund’s Board of Trustees since the Fund last provided disclosure in response to this item.
Item 16. Controls and Procedures
| (a) | It is the conclusion of the registrant’s principal executive officer and principal financial officer that the effectiveness of the registrant’s current disclosure controls and procedures (such disclosure controls and procedures having been evaluated within 90 days of the date of this filing) provide reasonable assurance that the information required to be disclosed by the registrant has been recorded, processed, summarized and reported within the time period specified in the Commission’s rules and forms and that the information required to be disclosed by the registrant has been accumulated and communicated to the registrant’s principal executive officer and principal financial officer in order to allow timely decisions regarding required disclosure. |
| (b) | There have been no changes in the registrant’s internal controls over financial reporting during the period covered by this report that has materially affected, or is reasonably likely to materially affect, the registrant’s internal control over financial reporting. |
Item 17. Disclosure of Securities Lending Activities for Closed-End Management Investment Companies
Not applicable.
Item 18. Recovery of Erroneously Awarded Compensation
Not applicable.
Item 19. Exhibits
(a)(1) Registrant’s Code of Ethics – Not applicable (please see Item 2).
(a)(2)(i) Principal Financial Officer’s Section 302 certification.
(a)(2)(ii) Principal Executive Officer’s Section 302 certification.
(b) Combined Section 906 certification.
Signatures
Pursuant to the requirements of the Securities Exchange Act of 1934 and the Investment Company Act of 1940, the registrant has duly caused this report to be signed on its behalf by the undersigned, thereunto duly authorized.
Morgan Stanley Insight Fund
| By: | /s/ John H. Gernon | |
| | John H. Gernon | |
| | Principal Executive Officer | |
| | | |
| Date: | August 20, 2024 | |
Pursuant to the requirements of the Securities Exchange Act of 1934 and the Investment Company Act of 1940, this report has been signed below by the following persons on behalf of the registrant and in the capacities and on the dates indicated.
| By: | /s/ Francis J. Smith | |
| | Francis J. Smith | |
| | Principal Financial Officer | |
| | | |
| Date: | August 20, 2024 | |
| | | |
| By: | /s/ John H. Gernon | |
| | John H. Gernon | |
| | Principal Executive Officer | |
| | | |
| Date: | August 20, 2024 | |