| UNITED STATES |
| SECURITIES AND EXCHANGE COMMISSION |
| Washington, D.C. 20549 |
FORM N-CSR |
CERTIFIED SHAREHOLDER REPORT OF REGISTERED |
MANAGEMENT INVESTMENT COMPANIES |
| Investment Company Act File Number: 811-07381 |
| T. Rowe Price Health Sciences Fund, Inc. |
| (Exact name of registrant as specified in charter) |
| 100 East Pratt Street, Baltimore, MD 21202 |
| (Address of principal executive offices) |
| David Oestreicher |
| 100 East Pratt Street, Baltimore, MD 21202 |
| (Name and address of agent for service) |
| Registrant’s telephone number, including area code: (410) 345-2000 |
| Date of fiscal year end: December 31 |
| Date of reporting period: December 31, 2008 |
Item 1: Report to Shareholders
 |
| Health Sciences Fund | December 31, 2008 |
The views and opinions in this report were current as of December 31, 2008. They are not guarantees of performance or investment results and should not be taken as investment advice. Investment decisions reflect a variety of factors, and the managers reserve the right to change their views about individual stocks, sectors, and the markets at any time. As a result, the views expressed should not be relied upon as a forecast of the fund’s future investment intent. The report is certified under the Sarbanes-Oxley Act, which requires mutual funds and other public companies to affirm that, to the best of their knowledge, the information in their financial reports is fairly and accurately stated in all material respects.
REPORTS ON THE WEB
Sign up for our E-mail Program, and you can begin to receive updated fund reports and prospectuses online rather than through the mail. Log in to your account at troweprice.com for more information.
Manager’s Letter
Fellow Shareholders
Stocks suffered significant losses in the final quarter of 2008, capping off a brutal year for equities. Although the health care sector outperformed the broad market, we are disappointed to report large losses for the six and 12 months ended December 31, 2008. Stock markets worldwide have experienced extreme volatility this year, due to heightened credit market turmoil and the global economic slowdown. Health care stocks performed decently in the early part of the year, but they trended sharply lower late in the reporting period. In short, as stocks succumbed to sustained selling pressure, there were no places to hide, and every segment within the health care sector declined.
HIGHLIGHTS
• Health care stocks fell sharply but outperformed the broad market during the past six and 12 months, as investors sought perceived safe havens within tumultuous equity markets.
• The Health Sciences Fund posted significant losses for the year, outperforming the broad market and underperforming the Lipper Health/Biotechnology Funds Index.
• We remain focused on investing in companies with new and important medicines for unmet medical needs.
• We believe that generating outperformance in the health care sector will be increasingly dependent on stock selection, rather than an emphasis on a particular subsector of the health care industry.
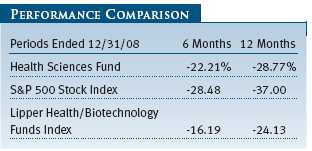
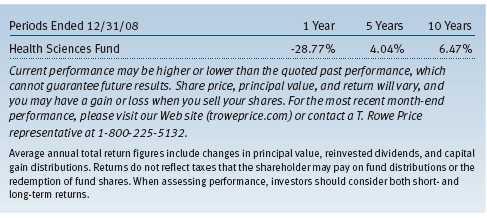
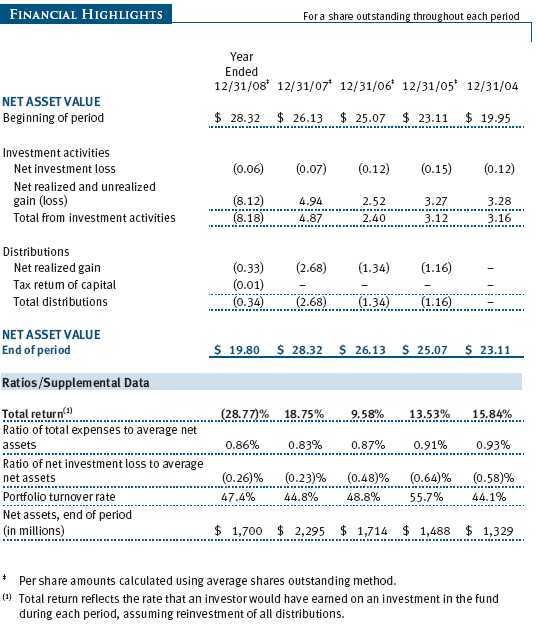
Your fund’s performance suffered greatly in the second half, and we understand that these results are painful for shareholders—we are shareholders ourselves. As the Performance Comparison table shows, the Health Sciences Fund returned -28.77% in 2008. Much of this substantial decline occurred in the second half of the year as the fund returned -22.21% for the six months ended December 31, 2008. Although it is of little comfort when returns are so negative, your fund outperformed the broad market as measured by the S&P 500 Index in both periods. However, the fund trailed the Lipper index significantly in the past six months, causing us to lag our peer group for the year. Stock selection was the primary driver of our underperformance in the period.
Despite the recent weakness, the Health Sciences Fund has delivered consistently strong longer-term performance compared with the Lipper universe of health care funds. Lipper ranked the fund in the top 13% of its health care funds universe for the past 10 years, in the top 16% for the five-year period, and in the top 22% of its peer group for the three years ended December 31, 2008. (Based on cumulative total return, Lipper ranked the Health Sciences Fund 100 of 118, 22 of 102, 14 of 90, and 4 of 31 funds for the 1-, 3-, 5-, and 10-year periods ended December 31, 2008, respectively. Past performance cannot guarantee future results.)
MARKET ENVIRONMENT
Stock prices reflected the state of the U.S. economy, which has been in a recession since the end of 2007, with job losses mounting and real estate prices tumbling. In December, the Federal Reserve lowered the key federal funds target rate from 1.00% to a historically low range of 0.00% to 0.25% in an unprecedented move to shore up the floundering economy. In addition to the rate reduction, the Fed announced that it would take other measures to breathe life into the economy, including the possible purchase of agency, mortgage-backed, and Treasury securities.
Given this backdrop, stocks spent most of the year on a downward trajectory that grew steeper as the year progressed. The U.S. equity market began the year with its worst quarterly decline since 2002. Stocks rebounded in April and May as the credit crisis appeared to be abating, but a fresh round of losses in the financials sector sent the stock market down sharply in June. Volatility increased further in September as the financials sector unraveled, leading to another substantial decline in October—the worst month for stocks since the 1987 crash. The equity market bottomed in late November and staged a modest recovery through the end of the year, but the major indexes still finished 2008 down more than 35%.
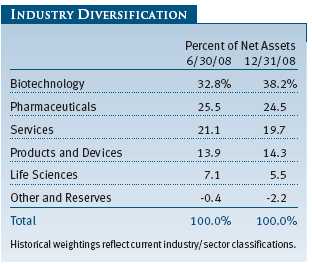
Within the Lipper Health/Biotechnology Funds Index, every segment posted declines. The best performers in the past six months were biotechnology (-4.6%) and pharmaceuticals (-11.8%), the two largest segments of the Lipper health care benchmark. These two segments represent approximately 60% of your portfolio. The smaller segments—life sciences, products and devices, and services groups—declined approximately 35%, 26%, and 20%, respectively. In past years, we’ve seen one or two areas of the health care sector that look poised for superior performance but, in our view, there doesn’t appear to be a dominant theme in the health care sector at this time. As we wrote in our midyear shareholder report, we believe stock selection will have far more bearing on our performance than sector allocation decisions. To our dismay, though, stock selection detracted from our comparison with the benchmark over the past six months.
PORTFOLIO REVIEW
Biotechnology and Pharmaceuticals
In many instances, Wall Street refers to smaller, therapeutic-based companies as biotechs. Originally, a firm was classified as a biotech because its research and development focused on large molecules, or proteins, which usually led to injectable therapeutics. On the other hand, pharmaceutical firms typically work with small molecules and develop pills, tablets, or capsules. However, these labels no longer describe a meaningful distinction.
Our large allocation to the biotechnology and pharmaceuticals segments stems from our belief that the pharmaceutical industry’s business model—the discovery, development, manufacture, and commercialization of medicines or therapeutic devices—is the primary driver of long-term value in the health care sector. Typically, large pharmaceutical companies have a large base of revenues and income, and one drug—even if it is extremely successful—may not be enough to affect the bottom line significantly. Biotechnology companies, however, tend to be smaller, and the successful introduction of one important new medicine can materially affect a company’s revenues and earnings. We are especially focused on those companies with new and important medicines or treatments for unmet medical needs. Although this strategy encompasses more risk because a firm that is highly dependent on the success of a single drug can decline significantly on bad news, we manage this risk in part by owning a diversified basket of stocks and controlling our position sizes.
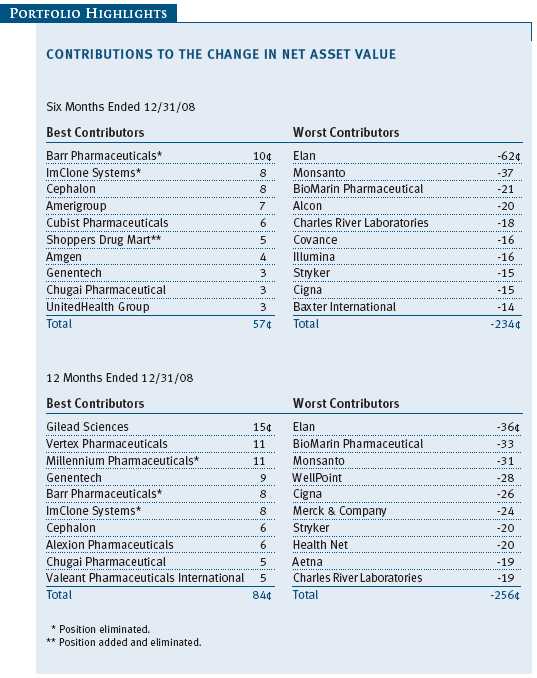
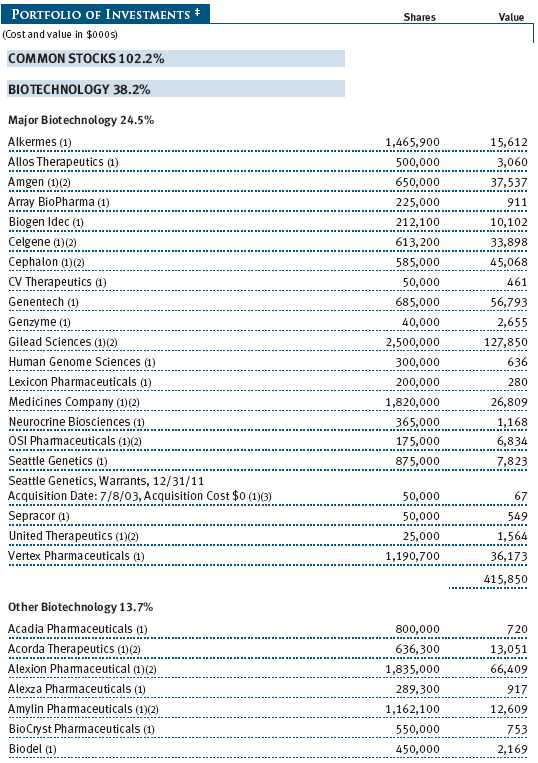
Over the last six months, the portfolio’s two best contributors were both takeovers—Barr Pharmaceuticals and ImClone Systems. In mid-July, the shares of generic drug manufacturer Barr Pharmaceuticals jumped from the mid-$40 range to more than $60 on news of its merger with a wholly owned subsidiary of Israel-based Teva Pharmaceutical. Teva has been a significant portfolio holding for many years. It generated disappointing results for the six-month period but has rallied significantly off its November lows. Teva accounted for almost 3% of the portfolio at the end of the reporting period. (Please refer to the portfolio of investments for a complete list of holdings and the amount each represents in the portfolio.)
Similarly, ImClone Systems’ stock rose approximately 30% on news of a $60 per share buyout offer from Bristol-Myers Squibb (a significant contributor in the second half). Eli Lilly eventually trumped Bristol-Myers’ final offer, and ImClone was acquired for $70 per share in the fourth quarter. Our gains on ImClone during the past six months handily outstripped the small loss we booked on Lilly.
The third-best contributor in the second half of 2008 was Cephalon. This biopharmaceutical company is one of the portfolio’s 10 largest holdings and has been a core holding for several years. We have trimmed our allocation in the stock since mid-2007 despite our optimism about its near- and intermediate-term growth prospects because of the limited visibility on the patent protection of several of the company’s key growth drivers. Nevertheless, we’ve maintained a sizable position in this mid-cap holding for three primary reasons: We think Cephalon can grow its earnings at a 20% clip over the long term; the stock has a compelling valuation relative to its growth rate; and we have a high level of confidence in its longstanding CEO, Frank Baldino, and his strategy and execution to achieve sustainable growth.
Our largest detractor for the last six months was Elan. Elan was the portfolio’s best first-half contributor and our worst in the second half. The company’s fortunes are tied to its multiple sclerosis drug Tysabri. Six months ago we wrote that we believed the drug would enjoy strong sales so long as the risk of progressive multifocal leukoencephalopathy (PML), a sometimes lethal side effect, remained low. In late July, Elan disclosed that two patients taking Tysabri had developed PML. Although neither case was fatal, Elan’s stock plunged more than 50% in short order—the fall exacerbated by a simultaneous change in market sentiment regarding the company’s important Phase III Alzheimer’s disease program.
We still like Elan’s prospects for several reasons. It has an under-appreciated world-class platform in neurodegenerative diseases (multiple sclerosis, Alzheimer’s, and Parkinson’s). The probability of success in the Phase III Alzheimer’s product is above 50%, and the commercial potential is larger than any product in the biopharmaceutical industry. The company’s balance sheet has significantly improved over the past three years. And finally, the current share price, in our opinion, does not reflect the multifaceted opportunities for value creation—Tysabri’s future, an eventual spin-off of its drug technology business, and the Alzheimer’s and Parkinson’s programs—or an acquisition by the product-hungry pharmaceutical industry.
Our second-largest detractor in the second half of 2008 was Monsanto, a leading global provider of agricultural products for farmers. Through its seeds and genomics division, the company produces genetically engineered fruit and vegetable seeds with biotechnology traits that assist farmers in managing drought conditions, controlling insects, and improving productivity. It also manufactures herbicides for agricultural and industrial applications under brand names including Roundup, Bollgard, and YieldGard. The stock had enjoyed a multiyear runup and peaked with the surge in grain prices shortly after midyear, but as grain prices tumbled, Monsanto’s shares retreated from near $145 to about $70 at the end of the year. Monsanto faces challenges in 2009, including maintaining its market share after raising prices more than its competitors and increasing generic competition. However, we think that the company can grow earnings in the 17% range next year, which should be a compelling story for earnings-starved investors.
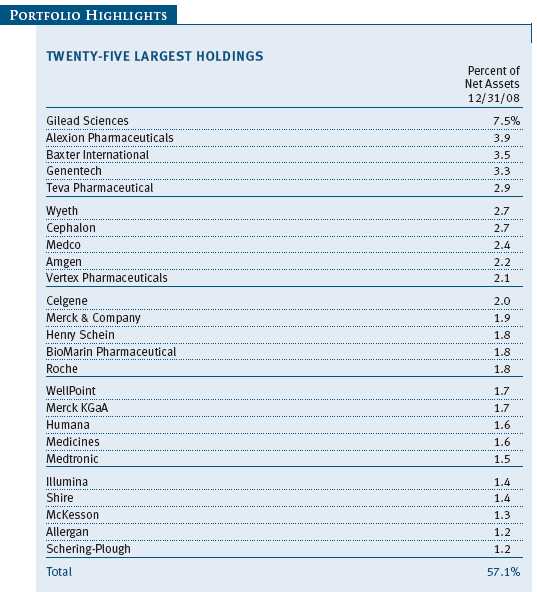
A quick recap of our largest holdings: The portfolio’s largest position, Gilead Sciences, was a significant contributor for the year despite its lackluster six-month performance. The company continues to enjoy success with its suite of drugs for the treatment of HIV. Gilead and Bristol-Myers Squibb partnered to produce and market Atripla, a once-a-day pill that combines two of Gilead’s HIV medicines and one of Bristol Myers’. The drug continues to generate robust sales. We remain impressed with Gilead’s management team and its history of good execution in all aspects of its business. The company is dominant in its core therapeutics business and continues to generate strong sales and earnings growth.
Within this segment, the portfolio’s second-largest holding and a strong year-ago performer, Alexion Pharmaceuticals, generated powerful 6- and 12-month results. We remain committed to this core small-/ mid-cap specialty pharmaceutical holding and believe it can be a long-term winner. Baxter International struggled in the past six months, and our third-largest holding was among our 10 biggest detractors, largely due to the size of this holding. The company generates consistent upper single-digit earnings gains and has regularly exceeded the market’s forecasts. Genentech, fourth in terms of its portfolio allocation, was also the fourth-best contributor for the year. The company was the target of an acquisition bid by Swiss pharmaceutical company Roche. Aside from the takeover boost, Genentech received FDA approval for usage of Avastin in the treatment of breast cancer (Avastin was already approved for the treatment of colorectal and lung cancers). And rounding out our top five, Teva Pharmaceutical, mentioned earlier in this report, was a detractor over the past six months.
Services
Our services holdings generally detracted over the past six months. Amerigroup and UnitedHealth Group were the standout performers. Amerigroup’s health care plans are focused on serving people who receive benefits from publicly sponsored programs through contracts with primary care physicians, specialists, and hospitals. The stock benefited from its improvement in its medical loss ratio. The company continues to execute well in its key markets—with noteworthy gains in Tennessee—and raised its per share earnings guidance. We think Amerigroup can grow its earnings in the 20% range. UnitedHealth held its own in the second half as the company exceeded expectations on metrics such as enrollment, medical loss ratio, and cash flow. Among our largest positions in the services group, WellPoint and Humana posted losses and were significant underperformers in the portfolio. During the past six months, we closed out positions in several other significant detractors, including Walgreen, Coventry Health Care, Healthways, and LifePoint Hospitals.
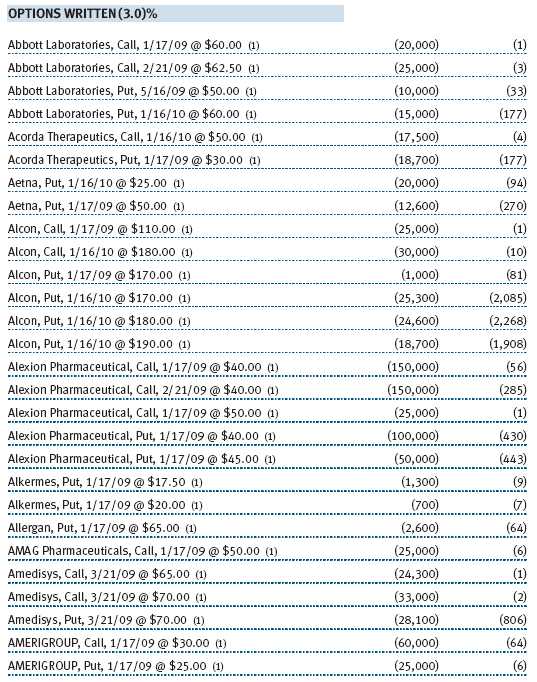
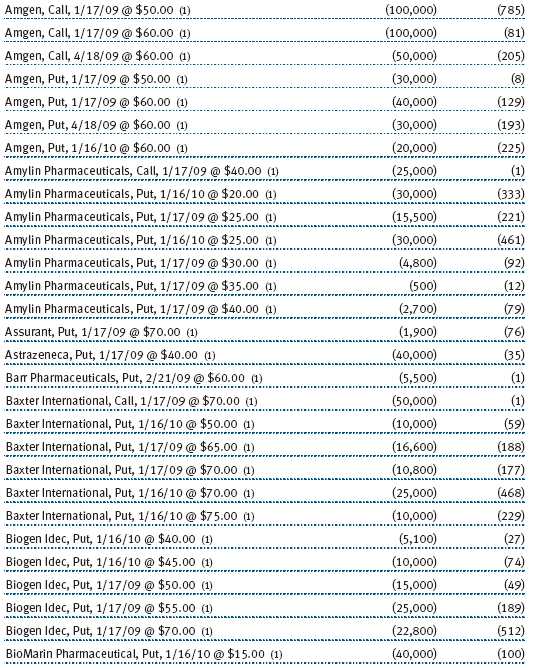
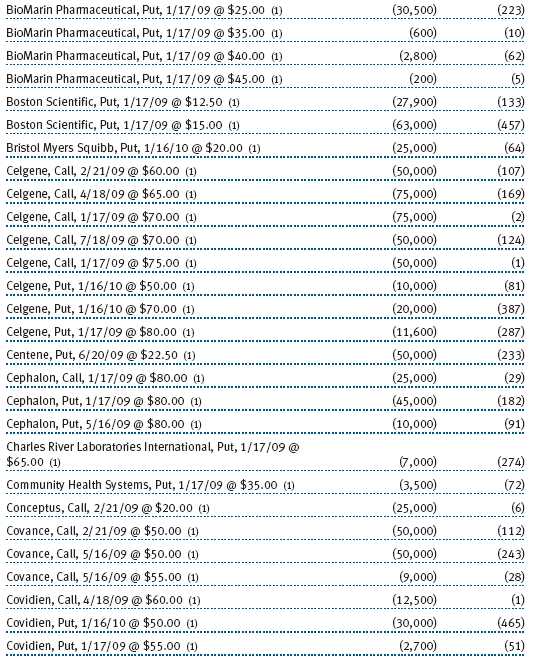
While most of the portfolio’s investments are in U.S. common stocks, the fund can and will selectively invest in companies domiciled outside the country. Over the past six months, the portfolio’s holdings in overseas investments generated weak results. Additionally, the fund writes call and put options primarily as a means of augmenting income. Normally, the portfolio will own the securities on which it writes these options. The premium income recovered by writing covered calls can help reduce, but not eliminate, portfolio volatility. Over the past six months, options income contributed positively to portfolio results.
OUTLOOK
We believe that generating outperformance in the health care sector will be increasingly dependent on effective stock selection, rather than on an emphasis on a particular subsector of the health care industry. As always, we seek the strongest companies in each of the four main areas of health care: pharmaceuticals, biotechnology, services, and medical devices. Although each subsector offers attractive growth opportunities, we favor therapeutic companies developing novel products for unmet medical needs, which are largely found in the biotech industry.
The current environment for health care earnings remains above average and should be relatively stable regardless of global economic developments. We believe the relative performance of the stocks in the health care sector is going to be more dependent on the S&P 500’s earnings results than on earnings in the health care sector itself. Our reasoning is as follows: If the S&P 500’s earnings slow, as Wall Street expects, then investors are likely to gravitate toward health care stocks because of their earnings stability.
The Probability of Health Care Reform Is Reasonably High
Because health care is a heavily regulated industry, we are wary of a dramatic change in Washington, especially relating to the industry’s reimbursement and regulatory oversight. Any significant shift in what a company can expect to receive when it brings a new medicine to the marketplace would be disruptive. We think the Democrats view the national economic crisis as a clear mandate to “do something big” and view control of both the executive and legislative branches as a unique opportunity to push through long sought-after health care reform. Because the chance may not present itself again for decades, there is a sense of urgency in capitalizing on this opportunity.
Additionally, deficit spending is being wholeheartedly embraced in D.C. The political view seems to be that the biggest risk to the economy is not spending enough. As a result, financial constraints are not an impediment to health care reform; rather, they are almost viewed as an enabler. Consensus is growing on Capitol Hill that our health care issues and our economic problems are inextricably linked as the increased burden of health care costs have threatened our competitiveness (e.g., the big three automakers). There is more support now from the business community than there was 10 or 15 years ago for a solution to our health care challenges.
Despite these potential challenges and uncertainties, we think the sector holds tremendous opportunity. We have an aging population that demands the best in health care—every day for the next 20 years, approximately 13,000 Americans will reach 60 years of age—and an explosion in scientific understanding should lead to better medicines. Much of the spending on health care is tied to Medicare, which should provide a stable source of funding. Additionally, the need for health care and medicines is not viewed as discretionary; like consumer staples, people will spend to maintain their health no matter what the stock market does. As long as society continues to desire new therapies to soften the impact of disease and government price controls are not imposed, health care should remain an area of significant growth for the long term.
We appreciate your continued confidence and support.
Respectfully submitted,
Kris H. Jenner
President of the fund and chairman of its Investment Advisory Committee
January 21, 2009
The committee chairman has day-to-day responsibility for managing the portfolio and works with committee members in developing and executing the fund’s investment program.
RISKS OF GROWTH INVESTING
Growth stocks can be volatile for several reasons. Since these companies usually invest a high portion of earnings in their businesses, they may lack the dividends of value stocks that can cushion stock prices in a falling market. Also, earnings disappointments often lead to sharply falling prices because investors buy growth stocks in anticipation of superior earnings growth.
RISKS OF HEALTH SCIENCES FUND INVESTING
Funds that invest only in specific industries will experience greater volatility than funds investing in a broad range of industries. Companies in the health sciences field are subject to special risks such as increased competition within the health care industry, changes in legislation or government regulations, reductions in government funding, product liability or other litigation, and the obsolescence of popular products.
GLOSSARY
Lipper index: Fund benchmarks that consist of a small number of the largest mutual funds in a particular category as tracked by Lipper Inc.
S&P 500 Stock Index: An index consisting of 500 stocks chosen for market size, liquidity, and industry group representation. It is a market value-weighted index, with each stock’s weight in the index proportionate to its market value.
Performance and Expenses
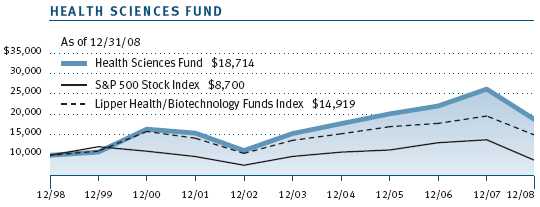
| GROWTH OF $10,000 |
This chart shows the value of a hypothetical $10,000 investment in the fund over the past 10 fiscal year periods or since inception (for funds lacking 10-year records). The result is compared with benchmarks, which may include a broad-based market index and a peer group average or index. Market indexes do not include expenses, which are deducted from fund returns as well as mutual fund averages and indexes.
| AVERAGE ANNUAL COMPOUND TOTAL RETURN |
This table shows how the fund would have performed each year if its actual (or cumulative) returns for the periods shown had been earned at a constant rate.
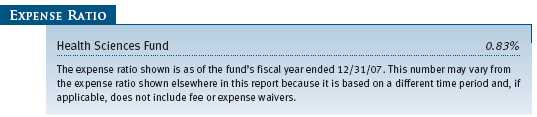
| FUND EXPENSE EXAMPLE |
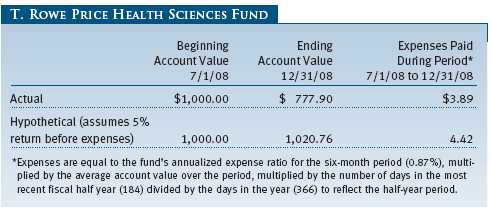
As a mutual fund shareholder, you may incur two types of costs: (1) transaction costs, such as redemption fees or sales loads, and (2) ongoing costs, including management fees, distribution and service (12b-1) fees, and other fund expenses. The following example is intended to help you understand your ongoing costs (in dollars) of investing in the fund and to compare these costs with the ongoing costs of investing in other mutual funds. The example is based on an investment of $1,000 invested at the beginning of the most recent six-month period and held for the entire period.
Actual Expenses
The first line of the following table (“Actual”) provides information about actual account values and expenses based on the fund’s actual returns. You may use the information in this line, together with your account balance, to estimate the expenses that you paid over the period. Simply divide your account value by $1,000 (for example, an $8,600 account value divided by $1,000 = 8.6), then multiply the result by the number in the first line under the heading “Expenses Paid During Period” to estimate the expenses you paid on your account during this period.
Hypothetical Example for Comparison Purposes
The information on the second line of the table (“Hypothetical”) is based on hypothetical account values and expenses derived from the fund’s actual expense ratio and an assumed 5% per year rate of return before expenses (not the fund’s actual return). You may compare the ongoing costs of investing in the fund with other funds by contrasting this 5% hypothetical example and the 5% hypothetical examples that appear in the shareholder reports of the other funds. The hypothetical account values and expenses may not be used to estimate the actual ending account balance or expenses you paid for the period.
Note: T. Rowe Price charges an annual small-account maintenance fee of $10, generally for accounts with less than $2,000 ($500 for UGMA/UTMA). The fee is waived for any investor whose T. Rowe Price mutual fund accounts total $25,000 or more, accounts employing automatic investing, and IRAs and other retirement plan accounts that utilize a prototype plan sponsored by T. Rowe Price (although a separate custodial or administrative fee may apply to such accounts). This fee is not included in the accompanying table. If you are subject to the fee, keep it in mind when you are estimating the ongoing expenses of investing in the fund and when comparing the expenses of this fund with other funds.
You should also be aware that the expenses shown in the table highlight only your ongoing costs and do not reflect any transaction costs, such as redemption fees or sales loads. Therefore, the second line of the table is useful in comparing ongoing costs only and will not help you determine the relative total costs of owning different funds. To the extent a fund charges transaction costs, however, the total cost of owning that fund is higher.
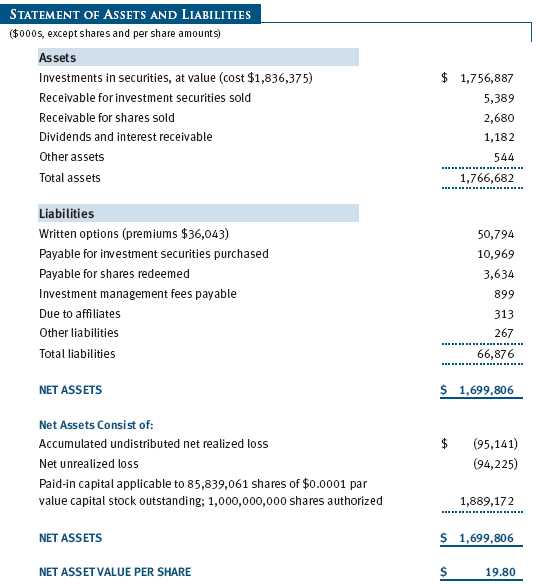
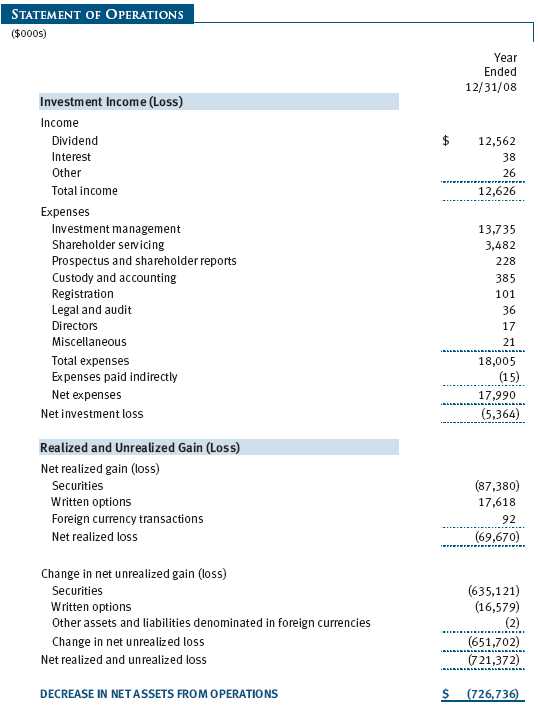
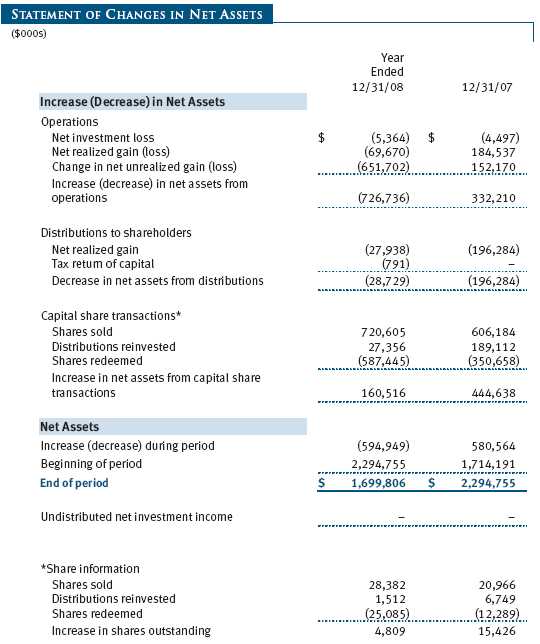
The accompanying notes are an integral part of these financial statements.

The accompanying notes are an integral part of these financial statements.
The accompanying notes are an integral part of these financial statements.
The accompanying notes are an integral part of these financial statements.
The accompanying notes are an integral part of these financial statements.
| NOTES TO FINANCIAL STATEMENTS |
T. Rowe Price Health Sciences Fund, Inc. (the fund), is registered under the Investment Company Act of 1940 (the 1940 Act) as a diversified, open-end management investment company. The fund commenced operations on December 29, 1995. The fund seeks long-term capital appreciation.
NOTE 1 - SIGNIFICANT ACCOUNTING POLICIES
Basis of Preparation The accompanying financial statements were prepared in accordance with accounting principles generally accepted in the United States of America, which require the use of estimates made by fund management. Fund management believes that estimates and security valuations are appropriate; however, actual results may differ from those estimates, and the security valuations reflected in the financial statements may differ from the value the fund ultimately realizes upon sale of the securities.
Investment Transactions, Investment Income, and Distributions Income and expenses are recorded on the accrual basis. Dividends received from mutual fund investments are reflected as dividend income; capital gain distributions are reflected as realized gain/loss. Dividend income and capital gain distributions are recorded on the ex-dividend date. Income tax-related interest and penalties, if incurred, would be recorded as income tax expense. Investment transactions are accounted for on the trade date. Realized gains and losses are reported on the identified cost basis. Distributions to shareholders are recorded on the ex-dividend date. Income distributions are declared and paid on an annual basis. Capital gain distributions, if any, are declared and paid by the fund, typically on an annual basis.
Currency Translation Assets, including investments, and liabilities denominated in foreign currencies are translated into U.S. dollar values each day at the prevailing exchange rate, using the mean of the bid and asked prices of such currencies against U.S. dollars as quoted by a major bank. Purchases and sales of securities, income, and expenses are translated into U.S. dollars at the prevailing exchange rate on the date of the transaction. The effect of changes in foreign currency exchange rates on realized and unrealized security gains and losses is reflected as a component of security gains and losses.
Rebates and Credits Subject to best execution, the fund may direct certain security trades to brokers who have agreed to rebate a portion of the related brokerage commission to the fund in cash. Commission rebates are reflected as realized gain on securities in the accompanying financial statements and totaled $134,000 for the year ended December 31, 2008. Additionally, the fund earns credits on temporarily uninvested cash balances at the custodian that reduce the fund’s custody charges. Custody expense in the accompanying financial statements is presented before reduction for credits, which are reflected as expenses paid indirectly.
In-Kind Redemptions In accordance with guidelines described in the fund’s prospectus, the fund may distribute portfolio securities rather than cash as payment for a redemption of fund shares (in-kind redemption). For financial reporting purposes, the fund recognizes a gain on in-kind redemptions to the extent the value of the distributed securities on the date of redemption exceeds the cost of those securities. Gains and losses realized on in-kind redemptions are not recognized for tax purposes and are reclassified from undistributed realized gain (loss) to paid-in capital. During the year ended December 31, 2008, the fund realized $19,723,000 of net gain on $26,884,000 of in-kind redemptions.
New Accounting Pronouncements On January 1, 2008, the fund adopted Statement of Financial Accounting Standards No. 157 (FAS 157), Fair Value Measurements. FAS 157 defines fair value, establishes the framework for measuring fair value, and expands the disclosures of fair value measurements in the financial statements. Adoption of FAS 157 did not have a material impact on the fund’s net assets or results of operations.
In March 2008, the Financial Accounting Standards Board issued Statement of Financial Accounting Standards No. 161 (FAS 161), Disclosures about Derivative Instruments and Hedging Activities, which is effective for fiscal years and interim periods beginning after November 15, 2008. FAS 161 requires enhanced disclosures about derivative and hedging activities, including how such activities are accounted for and their effect on financial position, performance and cash flows. Management is currently evaluating the impact the adoption of FAS 161 will have on the fund’s financial statements and related disclosures.
NOTE 2 - VALUATION
The fund’s investments are reported at fair value as defined under FAS 157. The fund values its investments and computes its net asset value per share at the close of the New York Stock Exchange (NYSE), normally 4 p.m. ET, each day that the NYSE is open for business.
Valuation Methods Equity securities listed or regularly traded on a securities exchange or in the over-the-counter (OTC) market are valued at the last quoted sale price or, for certain markets, the official closing price at the time the valuations are made, except for OTC Bulletin Board securities, which are valued at the mean of the latest bid and asked prices. A security that is listed or traded on more than one exchange is valued at the quotation on the exchange determined to be the primary market for such security. Listed securities not traded on a particular day are valued at the mean of the latest bid and asked prices for domestic securities and the last quoted sale price for international securities.
Investments in mutual funds are valued at the mutual fund’s closing net asset value per share on the day of valuation. Purchased and written options are valued at the mean of the closing bid and asked prices.
Other investments, including restricted securities, and those for which the above valuation procedures are inappropriate or are deemed not to reflect fair value are stated at fair value as determined in good faith by the T. Rowe Price Valuation Committee, established by the fund’s Board of Directors.
For valuation purposes, the last quoted prices of non-U.S. equity securities may be adjusted under the circumstances described below. If the fund determines that developments between the close of a foreign market and the close of the NYSE will, in its judgment, materially affect the value of some or all of its portfolio securities, the fund will adjust the previous closing prices to reflect what it believes to be the fair value of the securities as of the close of the NYSE. In deciding whether it is necessary to adjust closing prices to reflect fair value, the fund reviews a variety of factors, including developments in foreign markets, the performance of U.S. securities markets, and the performance of instruments trading in U.S. markets that represent foreign securities and baskets of foreign securities. A fund may also fair value securities in other situations, such as when a particular foreign market is closed but the fund is open. The fund uses outside pricing services to provide it with closing prices and information to evaluate and/or adjust those prices. The fund cannot predict how often it will use closing prices and how often it will determine it necessary to adjust those prices to reflect fair value. As a means of evaluating its security valuation process, the fund routinely compares closing prices, the next day’s opening prices in the same markets, and adjusted prices.
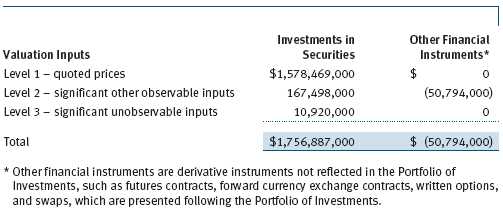
Valuation Inputs Various inputs are used to determine the value of the fund’s investments. These inputs are summarized in the three broad levels listed below:
Level 1 – quoted prices in active markets for identical securities
Level 2 – observable inputs other than Level 1 quoted prices (including, but not limited to, quoted prices for similar securities, interest rates, prepayment speeds, credit risk)
Level 3 – unobservable inputs
Observable inputs are those based on market data obtained from sources independent of the fund, and unobservable inputs reflect the fund’s own assumptions based on the best information available. The input levels are not necessarily an indication of the risk or liquidity associated with investments at that level. For example, non-U.S. equity securities actively traded in foreign markets generally are reflected in Level 2 despite the availability of closing prices, because the fund evaluates and determines whether those closing prices reflect fair value at the close of the NYSE or require adjustment, as described above. The following table summarizes the fund’s investments, based on the inputs used to determine their values on December 31, 2008:
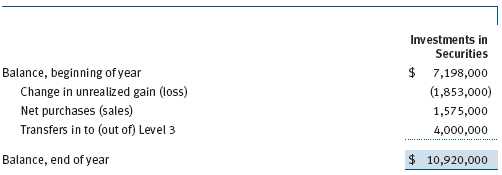
Following is a reconciliation of the fund’s Level 3 investments for the year ended December 31, 2008:
NOTE 3 - INVESTMENT TRANSACTIONS
Consistent with its investment objective, the fund engages in the following practices to manage exposure to certain risks or to enhance performance. The investment objective, policies, program, and risk factors of the fund are described more fully in the fund’s prospectus and Statement of Additional Information.
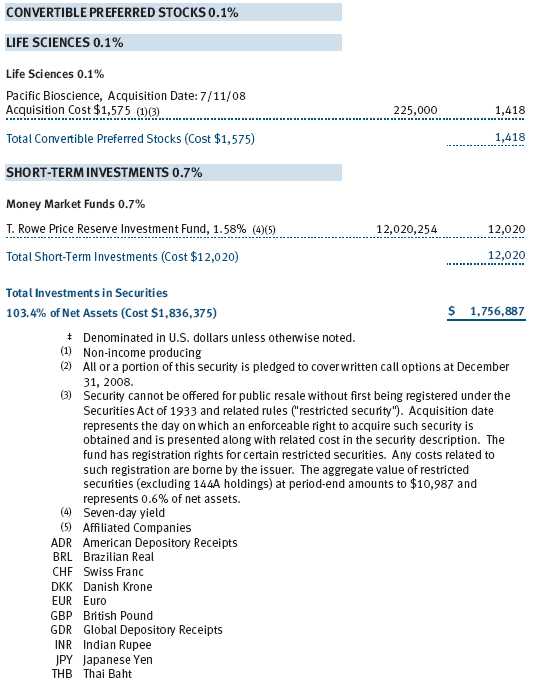
Restricted Securities The fund may invest in securities that are subject to legal or contractual restrictions on resale. Prompt sale of such securities at an acceptable price may be difficult and may involve substantial delays and additional costs.
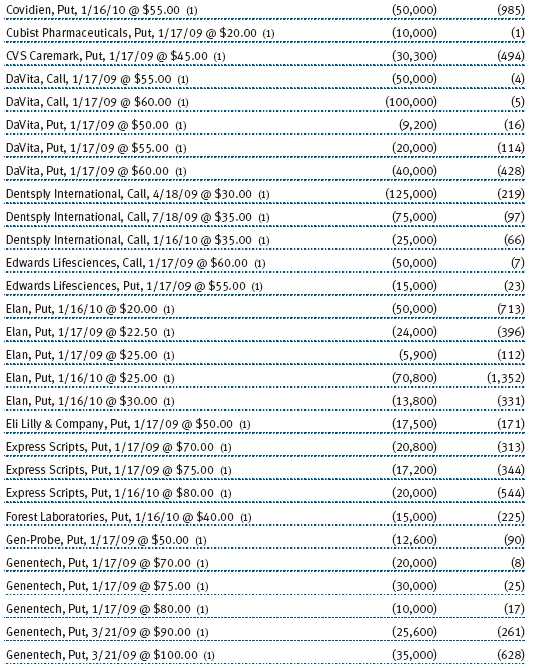
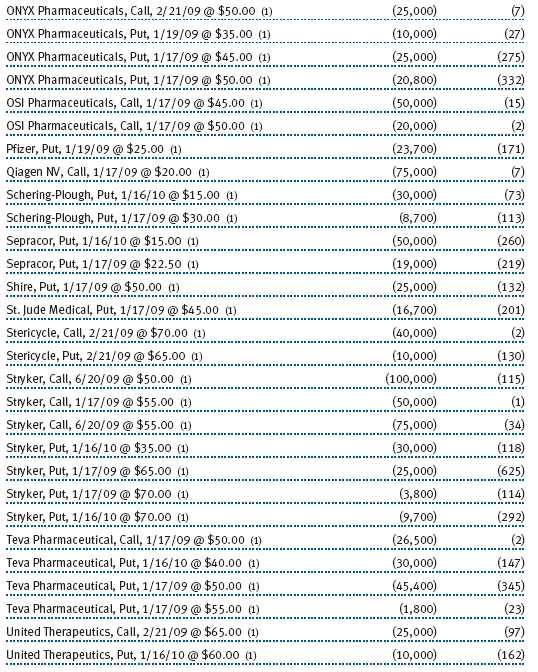
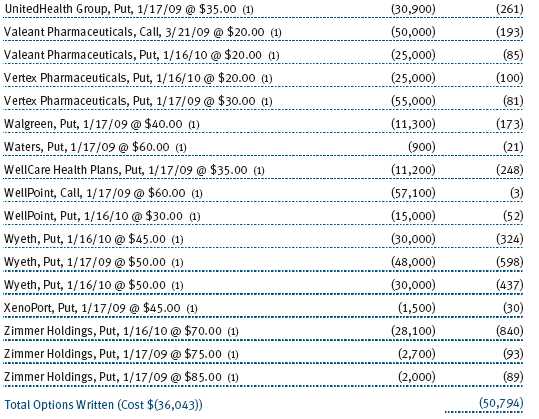
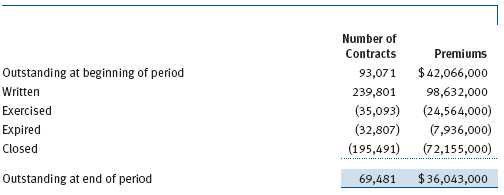
Options Call and put options give the holder the right to purchase and sell, respectively, a security at a specified price on a certain date. Risks arise from possible illiquidity of the options market and from movements in security values. Written options are reflected in the accompanying Statement of Assets and Liabilities at market value. Transactions in options written and related premiums received during the year ended December 31, 2008, were as follows:
Other Purchases and sales of portfolio securities, other than short-term securities, aggregated $1,209,729,000 and $1,001,200,000 respectively, for the year ended December 31, 2008.
NOTE 4 - FEDERAL INCOME TAXES
No provision for federal income taxes is required since the fund intends to continue to qualify as a regulated investment company under Subchapter M of the Internal Revenue Code and distribute to shareholders all of its taxable income and gains. Distributions are determined in accordance with Federal income tax regulations, which differ from generally accepted accounting principles, and, therefore, may differ significantly in amount or character from net investment income and realized gains for financial reporting purposes. Financial reporting records are adjusted for permanent book/tax differences to reflect tax character but are not adjusted for temporary differences.
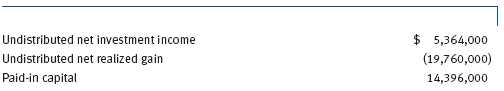
Reclassifications to paid-in capital relate primarily to the current net operating loss and redemptions in kind. For the year ended December 31, 2008, the following reclassifications, which had no impact on results of operations or net assets, were recorded to reflect tax character:
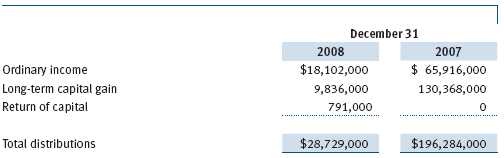
Distributions during the years ended December 31, 2008 and December 31, 2007 were characterized for tax purposes as follows:
At December 31, 2008, the tax-basis cost of investments and components of net assets were as follows:
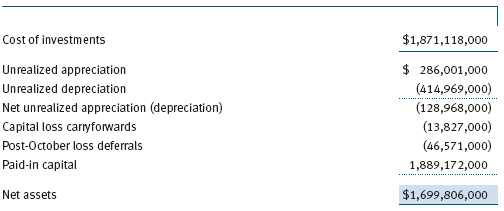
The difference between book-basis and tax-basis net unrealized appreciation (depreciation) is attributable to the deferral of losses from wash sales and on certain derivative contracts for tax purposes. The fund intends to retain realized gains to the extent of available capital loss carryforwards. As of December 31, 2008, all unused capital loss carryforwards expire in fiscal 2016. Pursuant to federal income tax regulations applicable to investment companies, recognition of capital losses on certain transactions is deferred until the subsequent tax year. Consequently, realized losses reflected in the accompanying financial statements include net capital losses realized between November 1 and the fund’s fiscal year-end that have not been recognized for tax purposes (Post-October loss deferrals).
NOTE 5 - RELATED PARTY TRANSACTIONS
The fund is managed by T. Rowe Price Associates, Inc. (the manager or Price Associates), a wholly owned subsidiary of T. Rowe Price Group, Inc. The investment management agreement between the fund and the manager provides for an annual investment management fee, which is computed daily and paid monthly. The fee consists of an individual fund fee, equal to 0.35% of the fund’s average daily net assets, and a group fee. The group fee rate is calculated based on the combined net assets of certain mutual funds sponsored by Price Associates (the group) applied to a graduated fee schedule, with rates ranging from 0.48% for the first $1 billion of assets to 0.285% for assets in excess of $220 billion. The fund’s group fee is determined by applying the group fee rate to the fund’s average daily net assets. At December 31, 2008, the effective annual group fee rate was 0.31%.
In addition, the fund has entered into service agreements with Price Associates and two wholly owned subsidiaries of Price Associates (collectively, Price). Price Associates computes the daily share price and provides certain other administrative services to the fund. T. Rowe Price Services, Inc., provides shareholder and administrative services in its capacity as the fund’s transfer and dividend disbursing agent. T. Rowe Price Retirement Plan Services, Inc., provides subaccounting and recordkeeping services for certain retirement accounts invested in the fund. For the year ended December 31, 2008, expenses incurred pursuant to these service agreements were $173,000 for Price Associates, $2,092,000 for T. Rowe Price Services, Inc., and $234,000 for T. Rowe Price Retirement Plan Services, Inc. The total amount payable at period-end pursuant to these service agreements is reflected as Due to Affiliates in the accompanying financial statements.
Additionally, the fund is one of several mutual funds in which certain college savings plans managed by Price Associates may invest. As approved by the fund’s Board of Directors, shareholder servicing costs associated with each college savings plan are borne by the fund in proportion to the average daily value of its shares owned by the college savings plan. For the year ended December 31, 2008, the fund was charged $47,000 for shareholder servicing costs related to the college savings plans, of which $35,000 was for services provided by Price. The amount payable at period-end pursuant to this agreement is reflected as Due to Affiliates in the accompanying financial statements. At December 31, 2008, approximately 1% of the outstanding shares of the fund were held by college savings plans.
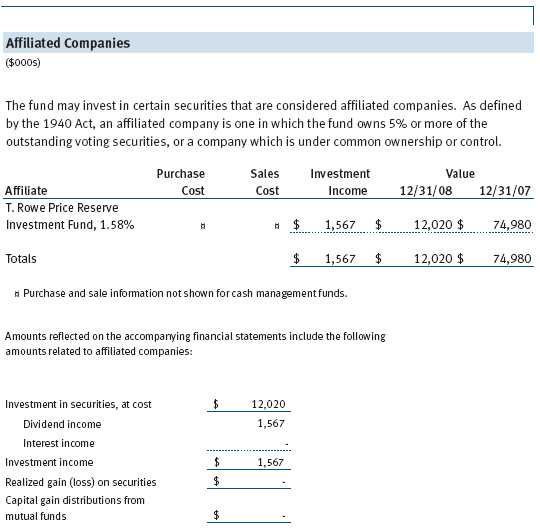
The fund may invest in the T. Rowe Price Reserve Investment Fund and the T. Rowe Price Government Reserve Investment Fund (collectively, the T. Rowe Price Reserve Investment Funds), open-end management investment companies managed by Price Associates and considered affiliates of the fund. The T. Rowe Price Reserve Investment Funds are offered as cash management options to mutual funds, trusts, and other accounts managed by Price Associates and/or its affiliates and are not available for direct purchase by members of the public. The T. Rowe Price Reserve Investment Funds pay no investment management fees.
As of December 31, 2008, T. Rowe Price Group, Inc., and/or its wholly owned subsidiaries owned 380,491 shares of the fund, representing less than 1% of the fund’s net assets.
| REPORT OF INDEPENDENT REGISTERED PUBLIC ACCOUNTING FIRM |
To the Board of Directors and Shareholders of T. Rowe Price Health Sciences Fund, Inc.
In our opinion, the accompanying statement of assets and liabilities, including the schedule of investments, and the related statements of operations and of changes in net assets and the financial highlights present fairly, in all material respects, the financial position of T. Rowe Price Health Sciences Fund, Inc. (the “Fund”) at December 31, 2008, the results of its operations for the year then ended, the changes in its net assets for each of the two years in the period then ended and the financial highlights for each of the five years in the period then ended, in conformity with accounting principles generally accepted in the United States of America. These financial statements and financial highlights (hereafter referred to as “financial statements”) are the responsibility of the Fund’s management; our responsibility is to express an opinion on these financial statements based on our audits. We conducted our audits of these financial statements in accordance with the standards of the Public Company Accounting Oversight Board (United States). Those standards require that we plan and perform the audit to obtain reasonable assurance about whether the financial statements are free of material misstatement. An audit includes examining, on a test basis, evidence supporting the amounts and disclosures in the financial statements, assessing the accounting principles used and significant estimates made by management, and evaluating the overall financial statement presentation. We believe that our audits, which included confirmation of securities at December 31, 2008 by correspondence with the custodian and brokers and confirmation of the underlying fund by correspondence with the transfer agent, provide a reasonable basis for our opinion.
PricewaterhouseCoopers LLP
Baltimore, Maryland
February 12, 2009
| TAX INFORMATION (UNAUDITED) FOR THE TAX YEAR ENDED 12/31/08 |
We are providing this information as required by the Internal Revenue Code. The amounts shown may differ from those elsewhere in this report because of differences between tax and financial reporting requirements.
The fund’s distributions to shareholders included:
• $18,102,000 from short-term capital gains,
• $9,836,000 from long-term capital gains subject to the 15% rate gains category.
| INFORMATION ON PROXY VOTING POLICIES, PROCEDURES, AND RECORDS |
A description of the policies and procedures used by T. Rowe Price funds and portfolios to determine how to vote proxies relating to portfolio securities is available in each fund’s Statement of Additional Information, which you may request by calling 1-800-225-5132 or by accessing the SEC’s Web site, www.sec.gov. The description of our proxy voting policies and procedures is also available on our Web site, www.troweprice.com. To access it, click on the words “Our Company” at the top of our corporate homepage. Then, when the next page appears, click on the words “Proxy Voting Policies” on the left side of the page.
Each fund’s most recent annual proxy voting record is available on our Web site and through the SEC’s Web site. To access it through our Web site, follow the directions above, then click on the words “Proxy Voting Records” on the right side of the Proxy Voting Policies page.
| HOW TO OBTAIN QUARTERLY PORTFOLIO HOLDINGS |
The fund files a complete schedule of portfolio holdings with the Securities and Exchange Commission for the first and third quarters of each fiscal year on Form N-Q. The fund’s Form N-Q is available electronically on the SEC’s Web site (www.sec.gov); hard copies may be reviewed and copied at the SEC’s Public Reference Room, 450 Fifth St. N.W., Washington, DC 20549. For more information on the Public Reference Room, call 1-800-SEC-0330.
| ABOUT THE FUND’S DIRECTORS AND OFFICERS |
Your fund is governed by a Board of Directors (Board) that meets regularly to review a wide variety of matters affecting the fund, including performance, investment programs, compliance matters, advisory fees and expenses, service providers, and other business affairs. The Board elects the fund’s officers, who are listed in the final table. At least 75% of Board members are independent of T. Rowe Price Associates, Inc. (T. Rowe Price), and T. Rowe Price International, Inc. (T. Rowe Price International); “inside” or “interested” directors are employees or officers of T. Rowe Price. The business address of each director and officer is 100 East Pratt Street, Baltimore, Maryland 21202. The Statement of Additional Information includes additional information about the directors and is available without charge by calling a T. Rowe Price representative at 1-800-225-5132.
| Independent Directors | |
| Name | |
| (Year of Birth) | Principal Occupation(s) During Past Five Years and Directorships of |
| Year Elected* | Other Public Companies |
| Jeremiah E. Casey | Director, National Life Insurance (2001 to 2005); Director, The Rouse |
| (1940) | Company, real estate developers (1990 to 2004) |
| 2005 | |
| Anthony W. Deering | Chairman, Exeter Capital, LLC, a private investment firm (2004 to |
| (1945) | present); Director, Under Armour (8/08 to present); Director, Vornado |
| 2001 | Real Estate Investment Trust (3/04 to present); Director, Mercantile |
| Bankshares (2002 to 2007); Member, Advisory Board, Deutsche | |
| Bank North America (2004 to present); Director, Chairman of the | |
| Board, and Chief Executive Officer, The Rouse Company, real estate | |
| developers (1997 to 2004) | |
| Donald W. Dick, Jr. | Principal, EuroCapital Advisors, LLC, an acquisition and management |
| (1943) | advisory firm (10/95 to present); Chairman, The Haven Group, a |
| 1995 | custom manufacturer of modular homes (1/04 to present) |
| David K. Fagin | Chairman and President, Nye Corporation (6/88 to present); Director, |
| (1938) | Golden Star Resources Ltd. (5/92 to present); Director, Pacific Rim |
| 1995 | Mining Corp. (2/02 to present); Director, B.C. Corporation (3/08 |
| to present); Chairman, Canyon Resources Corp. (8/07 to 3/08); | |
| Director, Atna Resources Ltd. (3/08 to present) | |
| Karen N. Horn | Director, Eli Lilly and Company (1987 to present); Director, Simon |
| (1943) | Property Group (2004 to present); Director, Federal National |
| 2003 | Mortgage Association (9/06 to present); Director, Norfolk Southern |
| (2/08 to present); Director, Georgia Pacific (5/04 to 12/05); | |
| Managing Director and President, Global Private Client Services, | |
| Marsh Inc. (1999 to 2003) | |
| Theo C. Rodgers | President, A&R Development Corporation (1977 to present) |
| (1941) | |
| 2005 | |
| John G. Schreiber | Owner/President, Centaur Capital Partners, Inc., a real estate |
| (1946) | investment company (1991 to present); Partner, Blackstone Real |
| 2001 | Estate Advisors, L.P. (10/92 to present) |
| *Each independent director oversees 126 T. Rowe Price portfolios (except for Mr. Fagin, who oversees | |
| 125 T. Rowe Price portfolios) and serves until retirement, resignation, or election of a successor. | |
| Inside Directors | |
| Name | |
| (Year of Birth) | |
| Year Elected* | |
| [Number of T. Rowe Price | Principal Occupation(s) During Past Five Years and Directorships of |
| Portfolios Overseen] | Other Public Companies |
| Edward C. Bernard | Director and Vice President, T. Rowe Price; Vice Chairman of the |
| (1956) | Board, Director, and Vice President, T. Rowe Price Group, Inc.; |
| 2006 | Chairman of the Board, Director, and President, T. Rowe Price |
| [126] | Investment Services, Inc.; Chairman of the Board and Director, |
| T. Rowe Price Global Asset Management Limited, T. Rowe Price | |
| Global Investment Services Limited, T. Rowe Price Retirement Plan | |
| Services, Inc., T. Rowe Price Savings Bank, and T. Rowe Price | |
| Services, Inc.; Director, T. Rowe Price International, Inc.; Chief | |
| Executive Officer, Chairman of the Board, Director, and President, | |
| T. Rowe Price Trust Company; Chairman of the Board, all funds | |
| John H. Laporte, CFA | Director and Vice President, T. Rowe Price and T. Rowe Price Group, |
| (1945) | Inc.; Vice President, T. Rowe Price Trust Company; Vice President, |
| 1995 | Health Sciences Fund |
| [16] | |
| *Each inside director serves until retirement, resignation, or election of a successor. | |
| Officers | |
| Name (Year of Birth) | |
| Title and Fund(s) Served | Principal Occupation(s) |
| G. Mark Bussard (1972) | Vice President, T. Rowe Price and T. Rowe Price |
| Vice President, Health Sciences Fund | Group, Inc.; formerly cofounder and Chief |
| Operating Officer, Rivanna Pharmaceuticals | |
| (to 2006); student, Darden Graduate School of | |
| Business and University of Virginia (to 2004) | |
| Roger L. Fiery III, CPA (1959) | Vice President, T. Rowe Price, T. Rowe Price |
| Vice President, Health Sciences Fund | Group, Inc., T. Rowe Price International, Inc., |
| and T. Rowe Price Trust Company | |
| John R. Gilner (1961) | Chief Compliance Officer and Vice President, |
| Chief Compliance Officer, Health Sciences Fund | T. Rowe Price; Vice President, T. Rowe Price |
| Group, Inc., and T. Rowe Price Investment | |
| Services, Inc. | |
| Gregory S. Golczewski (1966) | Vice President, T. Rowe Price and T. Rowe Price |
| Vice President, Health Sciences Fund | Trust Company |
| Gregory K. Hinkle, CPA (1958) | Vice President, T. Rowe Price, T. Rowe Price |
| Treasurer, Health Sciences Fund | Group, Inc., T. Rowe Price Investment Services, |
| Inc., and T. Rowe Price Trust Company; formerly | |
| Partner, PricewaterhouseCoopers LLP (to 2007) | |
| Andrew R. Hyman, M.D. (1968) | Vice President, T. Rowe Price International; |
| Vice President, Health Sciences Fund | formerly Principal, L. Capital Partners (to 2007); |
| Health Care Analyst, Columbus Circle Investors | |
| (to 2005) | |
| Kris H. Jenner, M.D., D.Phil. (1962) | Vice President, T. Rowe Price and T. Rowe Price |
| President, Health Sciences Fund | Group, Inc. |
| Susan J. Klein (1950) | Vice President, T. Rowe Price |
| Vice President, Health Sciences Fund | |
| Patricia B. Lippert (1953) | Assistant Vice President, T. Rowe Price and |
| Secretary, Health Sciences Fund | T. Rowe Price Investment Services, Inc. |
| Jay S. Markowitz, M.D. (1962) | Vice President, T. Rowe Price and T. Rowe |
| Vice President, Health Sciences Fund | Price Group, Inc. |
| Jason Nogueira, CFA (1974) | Vice President, T. Rowe Price and T. Rowe Price |
| Vice President, Health Sciences Fund | Group, Inc.; formerly Healthcare Equity Analyst, |
| Putnam Investments (to 2004); student, | |
| Harvard Business School (to 2003) | |
| David Oestreicher (1967) | Director and Vice President, T. Rowe Price |
| Vice President, Health Sciences Fund | Investment Services, Inc., T. Rowe Price Trust |
| Company, and T. Rowe Price Services, Inc.; Vice | |
| President, T. Rowe Price, T. Rowe Price Global | |
| Asset Management Limited, T. Rowe Price | |
| Global Investment Services Limited, T. Rowe | |
| Price Group, Inc., T. Rowe Price International, | |
| Inc., and T. Rowe Price Retirement Plan | |
| Services, Inc. | |
| Charles G. Pepin (1966) | Director, T. Rowe Price Trust Company; Vice |
| Vice President, Health Sciences Fund | President, T. Rowe Price and T. Rowe Price |
| Group, Inc. | |
| John C.A. Sherman (1969) | Vice President, T. Rowe Price Group, Inc., and |
| Vice President, Health Sciences Fund | T. Rowe Price International, Inc. |
| Taymour R. Tamaddon, CFA (1976) | Vice President, T. Rowe Price and T. Rowe Price |
| Vice President, Health Sciences Fund | Group, Inc.; formerly intern, T. Rowe Price |
| (to 2004) | |
| Julie L. Waples (1970) | Vice President, T. Rowe Price |
| Vice President, Health Sciences Fund | |
| Unless otherwise noted, officers have been employees of T. Rowe Price or T. Rowe Price International | |
| for at least five years. | |
Item 2. Code of Ethics.
The registrant has adopted a code of ethics, as defined in Item 2 of Form N-CSR, applicable to its principal executive officer, principal financial officer, principal accounting officer or controller, or persons performing similar functions. A copy of this code of ethics is filed as an exhibit to this Form N-CSR. No substantive amendments were approved or waivers were granted to this code of ethics during the period covered by this report.
Item 3. Audit Committee Financial Expert.
The registrant’s Board of Directors/Trustees has determined that Ms. Karen N. Horn qualifies as an audit committee financial expert, as defined in Item 3 of Form N-CSR. Ms. Horn is considered independent for purposes of Item 3 of Form N-CSR.
Item 4. Principal Accountant Fees and Services.
(a) – (d) Aggregate fees billed to the registrant for the last two fiscal years for professional services rendered by the registrant’s principal accountant were as follows:
Audit fees include amounts related to the audit of the registrant’s annual financial statements and services normally provided by the accountant in connection with statutory and regulatory filings. Audit-related fees include amounts reasonably related to the performance of the audit of the registrant’s financial statements and specifically include the issuance of a report on internal controls and, if applicable, agreed-upon procedures related to fund acquisitions. Tax fees include amounts related to services for tax compliance, tax planning, and tax advice. The nature of these services specifically includes the review of distribution calculations and the preparation of Federal, state, and excise tax returns. All other fees include the registrant’s pro-rata share of amounts for agreed-upon procedures in conjunction with service contract approvals by the registrant’s Board of Directors/Trustees.
(e)(1) The registrant’s audit committee has adopted a policy whereby audit and non-audit services performed by the registrant’s principal accountant for the registrant, its investment adviser, and any entity controlling, controlled by, or under common control with the investment adviser that provides ongoing services to the registrant require pre-approval in advance at regularly scheduled audit committee meetings. If such a service is required between regularly scheduled audit committee meetings, pre-approval may be authorized by one audit committee member with ratification at the next scheduled audit committee meeting. Waiver of pre-approval for audit or non-audit services requiring fees of a de minimis amount is not permitted.
(2) No services included in (b) – (d) above were approved pursuant to paragraph (c)(7)(i)(C) of Rule 2-01 of Regulation S-X.
(f) Less than 50 percent of the hours expended on the principal accountant’s engagement to audit the registrant’s financial statements for the most recent fiscal year were attributed to work performed by persons other than the principal accountant’s full-time, permanent employees.
(g) The aggregate fees billed for the most recent fiscal year and the preceding fiscal year by the registrant’s principal accountant for non-audit services rendered to the registrant, its investment adviser, and any entity controlling, controlled by, or under common control with the investment adviser that provides ongoing services to the registrant were $1,922,000 and $1,486,000, respectively.
(h) All non-audit services rendered in (g) above were pre-approved by the registrant’s audit committee. Accordingly, these services were considered by the registrant’s audit committee in maintaining the principal accountant’s independence.
Item 5. Audit Committee of Listed Registrants.
Not applicable.
Item 6. Investments.
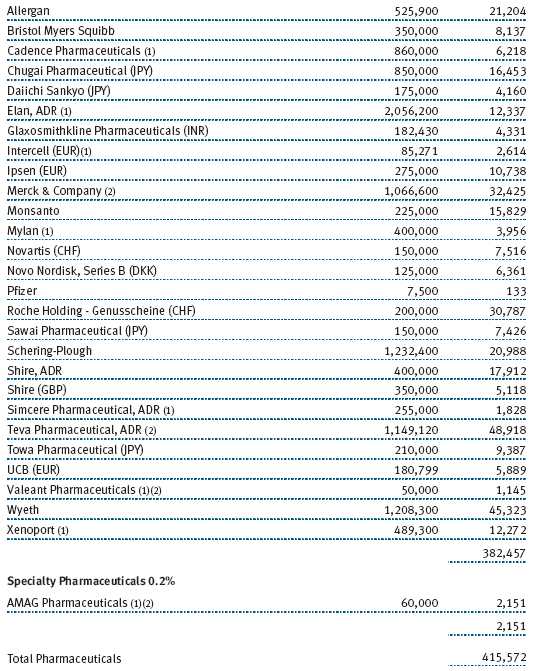
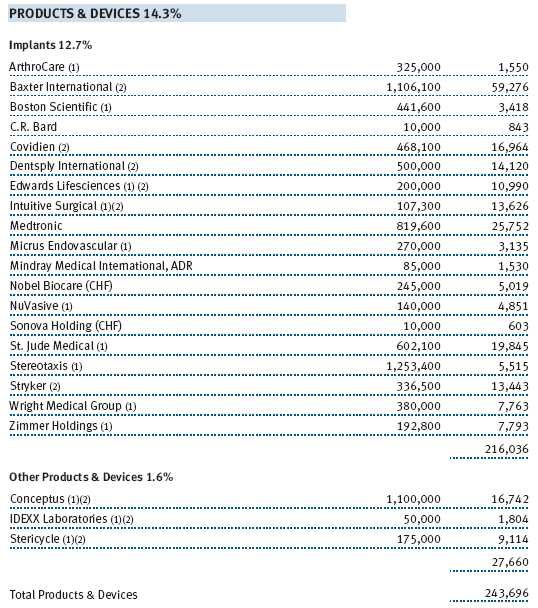
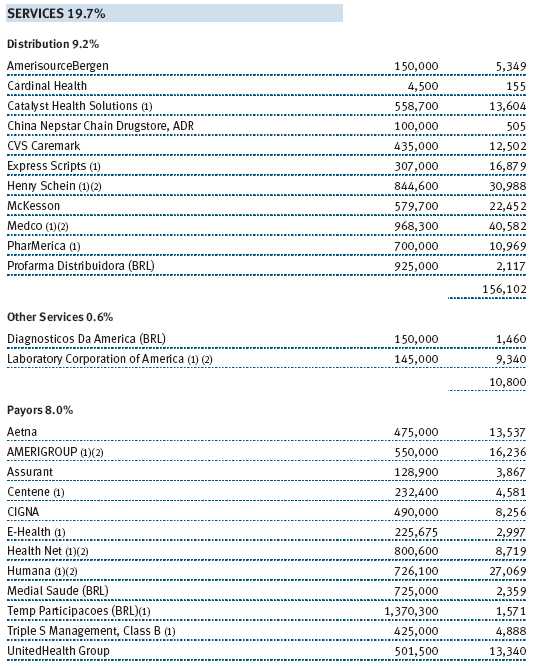
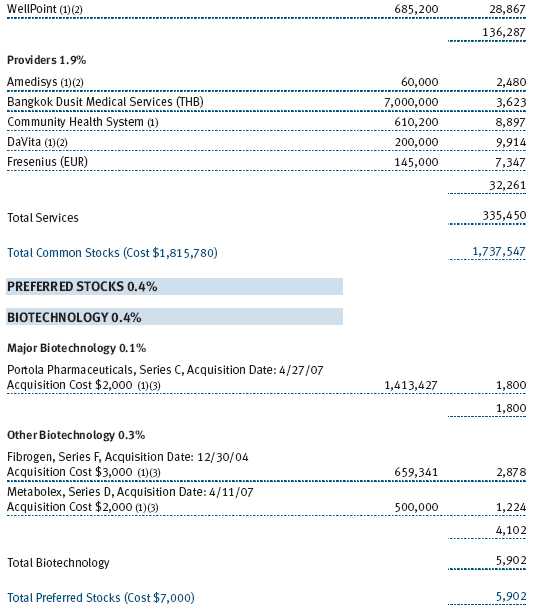
(a) Not applicable. The complete schedule of investments is included in Item 1 of this Form N-CSR.
(b) Not applicable.
Item 7. Disclosure of Proxy Voting Policies and Procedures for Closed-End Management Investment Companies.
Not applicable.
Item 8. Portfolio Managers of Closed-End Management Investment Companies.
Not applicable.
Item 9. Purchases of Equity Securities by Closed-End Management Investment Company and Affiliated Purchasers.
Not applicable.
Item 10. Submission of Matters to a Vote of Security Holders.
Not applicable.
Item 11. Controls and Procedures.
(a) The registrant’s principal executive officer and principal financial officer have evaluated the registrant’s disclosure controls and procedures within 90 days of this filing and have concluded that the registrant’s disclosure controls and procedures were effective, as of that date, in ensuring that information required to be disclosed by the registrant in this Form N-CSR was recorded, processed, summarized, and reported timely.
(b) The registrant’s principal executive officer and principal financial officer are aware of no change in the registrant’s internal control over financial reporting that occurred during the registrant’s second fiscal quarter covered by this report that has materially affected, or is reasonably likely to materially affect, the registrant’s internal control over financial reporting.
Item 12. Exhibits.
(a)(1) The registrant’s code of ethics pursuant to Item 2 of Form N-CSR is attached.
(2) Separate certifications by the registrant's principal executive officer and principal financial officer, pursuant to Section 302 of the Sarbanes-Oxley Act of 2002 and required by Rule 30a-2(a) under the Investment Company Act of 1940, are attached.
(3) Written solicitation to repurchase securities issued by closed-end companies: not applicable.
(b) A certification by the registrant's principal executive officer and principal financial officer, pursuant to Section 906 of the Sarbanes-Oxley Act of 2002 and required by Rule 30a-2(b) under the Investment Company Act of 1940, is attached.
SIGNATURES | |
| Pursuant to the requirements of the Securities Exchange Act of 1934 and the Investment | |
| Company Act of 1940, the registrant has duly caused this report to be signed on its behalf by the | |
| undersigned, thereunto duly authorized. | |
| T. Rowe Price Health Sciences Fund, Inc. | |
| By | /s/ Edward C. Bernard |
| Edward C. Bernard | |
| Principal Executive Officer | |
| Date | February 19, 2009 |
| Pursuant to the requirements of the Securities Exchange Act of 1934 and the Investment | |
| Company Act of 1940, this report has been signed below by the following persons on behalf of | |
| the registrant and in the capacities and on the dates indicated. | |
| By | /s/ Edward C. Bernard |
| Edward C. Bernard | |
| Principal Executive Officer | |
| Date | February 19, 2009 |
| By | /s/ Gregory K. Hinkle |
| Gregory K. Hinkle | |
| Principal Financial Officer | |
| Date | February 19, 2009 |