UNITED STATES
SECURITIES AND EXCHANGE COMMISSION
Washington, D.C. 20549
FORM N-CSR
CERTIFIED SHAREHOLDER REPORT OF REGISTERED
MANAGEMENT INVESTMENT COMPANIES
Investment Company Act File Number: 811-07381
| T. Rowe Price Health Sciences Fund, Inc. |
| (Exact name of registrant as specified in charter) |
| 100 East Pratt Street, Baltimore, MD 21202 |
| (Address of principal executive offices) |
| David Oestreicher |
| 100 East Pratt Street, Baltimore, MD 21202 |
| (Name and address of agent for service) |
Registrant’s telephone number, including area code: (410) 345-2000
Date of fiscal year end: December 31
Date of reporting period: June 30, 2014
Item 1. Report to Shareholders
 |
| Health Sciences Fund | June 30, 2014 |
The views and opinions in this report were current as of June 30, 2014. They are not guarantees of performance or investment results and should not be taken as investment advice. Investment decisions reflect a variety of factors, and the managers reserve the right to change their views about individual stocks, sectors, and the markets at any time. As a result, the views expressed should not be relied upon as a forecast of the fund’s future investment intent. The report is certified under the Sarbanes-Oxley Act, which requires mutual funds and other public companies to affirm that, to the best of their knowledge, the information in their financial reports is fairly and accurately stated in all material respects.
REPORTS ON THE WEB
Sign up for our E-mail Program, and you can begin to receive updated fund reports and prospectuses online rather than through the mail. Log in to your account at troweprice.com for more information.
Manager’s Letter
Fellow Shareholders
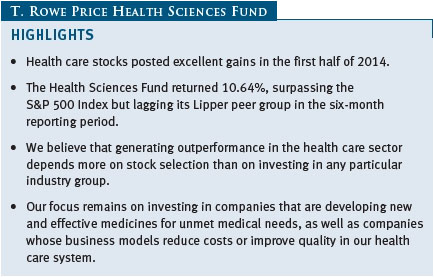
The health care sector generated excellent results in the first half of 2014. This traditionally defensive sector was a top performer in the S&P 500 Index over the past six months as investors remained concerned about earnings growth and the durability of the economic recovery. We are pleased to report that your fund posted strong performance. We remain optimistic about the long-term prospects for health care stocks, but, after delivering exceptional returns in recent years, we have tempered our expectations for near-term performance.
PERFORMANCE COMPARISON
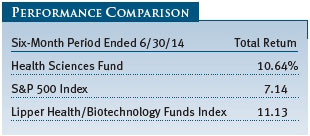
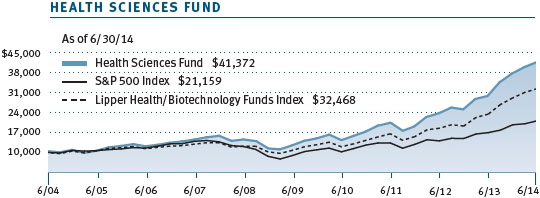
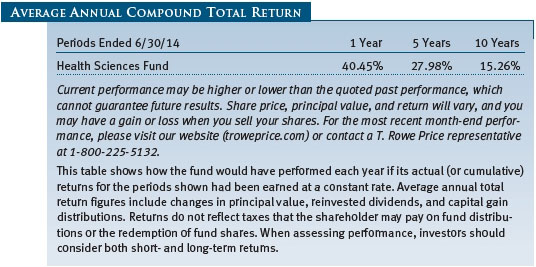
The Health Sciences Fund returned 10.64% in the six-month period ended June 30, 2014, outperforming the 7.14% return for the S&P 500 Index but modestly trailing the 11.13% return for the Lipper Health/Biotechnology Funds Index. Stock selection in the products and devices, biotechnology, and services segments contributed to relative performance, while stock selection in life sciences hurt our performance relative to the Lipper index.
As shown in the Growth of $10,000 chart on page 12, your fund has significantly outperformed the S&P 500 Index for the 10-year period ended June 30, 2014. The Health Sciences Fund has also posted consistently strong longer-term performance versus its Lipper peer group, and over the past 5- and 10-year periods, your fund ranked in the top decile of all health/biotechnology funds. (Based on cumulative total return, Lipper ranked the Health Sciences Fund 19 of 86, 19 of 76, 7 of 69, and 5 of 53 funds in the Lipper health/biotechnology funds universe for the 1-, 3-, 5-, and 10-year periods ended June 30, 2014, respectively. Past performance cannot guarantee future results.)
MARKET ENVIRONMENT
Health care stocks performed well in the first half of our fiscal year, building on 2013’s substantial gains. The broad market advanced, although it was a frustrating period with market leadership changing hands against a backdrop of escalating violence in the Middle East and macroeconomic concerns in various corners of the globe. The U.S. economy unexpectedly contracted at an annualized rate of 2.9% in the first quarter—its worst showing since early 2009. However, investors took news of the contraction largely in stride as many indicators suggested that the slowdown was mostly due to the unusually severe winter weather in much of the country.
Better economic data in the spring helped the major stock market indexes reach new highs in June. The pace of monthly payroll gains picked up substantially from February, with employers adding jobs at the fastest pace since 1999. The Federal Reserve was among those expecting a rebound in economic growth in the latter half of the year. The central bank, citing improvement in the labor market, increasing business and household spending, and diminishing restraint from fiscal policy, continued to taper its monthly asset purchases.
All sectors within the S&P 500 Index advanced over the past six months, but gains varied widely. Industry groups within the health care sector were also uniformly positive, but volatility crept into our market. Sentiment changed abruptly in March when investors began to focus on several key developments, including the situation in Ukraine, a slowdown in China, shifting Fed policies, and regulatory issues in the U.S., all of which coincided with an abrupt reversal in market leadership. Against this backdrop, investors sold many of the “highflier” stocks that had performed well last year. Biotechnology stocks, which had generated spectacular gains in 2013 and into 2014, endured about a 20% sell-off in the March/April period. However, most of these stocks recovered their losses as fast as they had fallen.
Within the Lipper index, the best-performing segments were life sciences (21%) and pharmaceuticals (14%), which represented approximately 4% and 20% of the benchmark, respectively, at the end of June. Biotech and products and devices stocks generated similar gains of approximately 10% and accounted for about 43% and 15%, respectively. The services sector, which represented about 19% of the benchmark, lagged, posting about an 8% return.
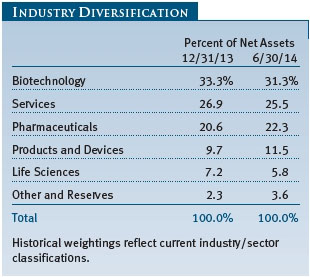
Your portfolio’s largest allocation differences are in biotech, where our 31% allocation is significantly less than the benchmark, and in services, where we are about seven-percentage-points overweight. As we have written in previous shareholder reports, we select companies based on their individual merits, a process commonly referred to as bottom-up stock selection. While we keep an eye on our overall industry allocations and global economic conditions, we believe stock selection will have more bearing on our performance than allocation decisions or macroeconomic considerations.
PORTFOLIO REVIEW
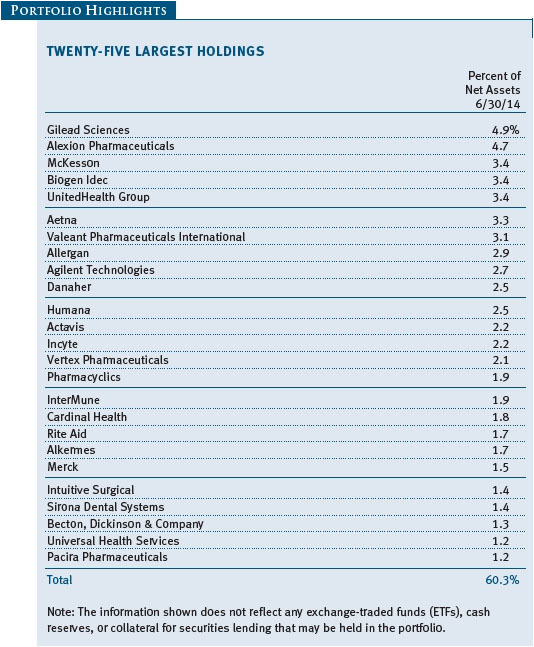
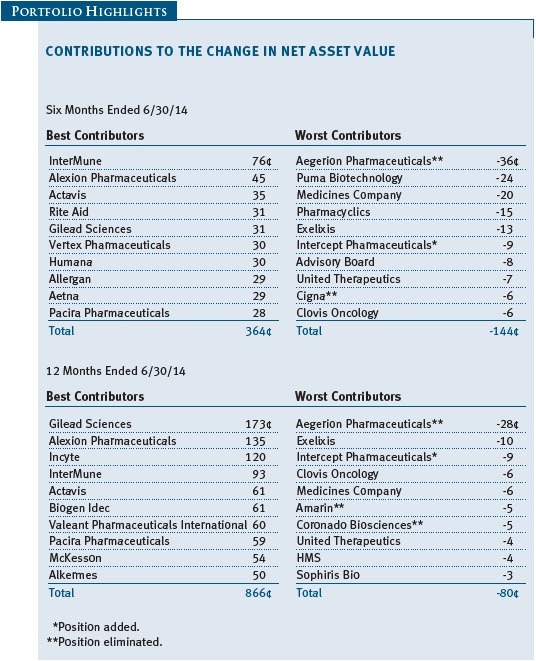
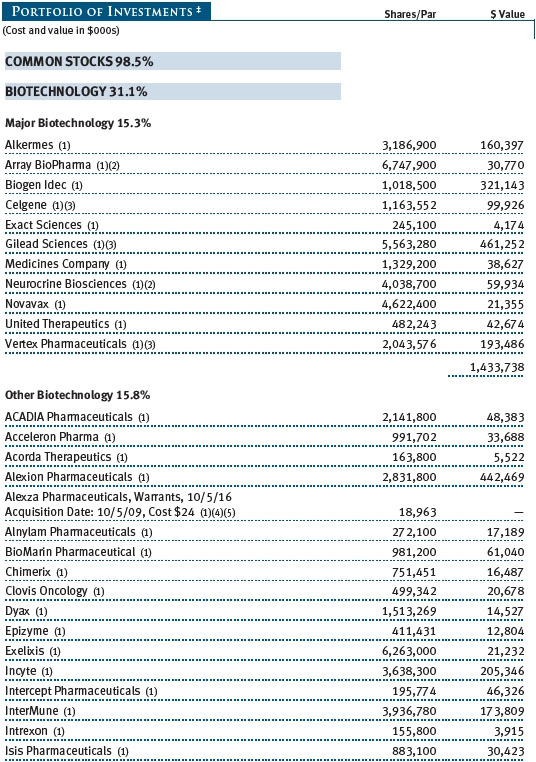
The portfolio generated strong absolute and relative performance in the biotech sector due to stock selection. Over the past six months, InterMune and Alexion Pharmaceuticals were the best contributors, as shown in the Contributions to the Change in Net Asset Value table on page 11. InterMune’s shares surged after the company announced that Esbriet/Pirfenidone, its oral therapy for the treatment of idiopathic pulmonary fibrosis (IPF), met its goals in a late-stage clinical trial. The results of the phase III study showed Esbriet was successful on a number of endpoints. Esbriet will not cure IPF, but it helps slow the rate of deterioration and is improving survival in IPF patients. The company plans to file for Food and Drug Administration (FDA)/U.S. approval of the drug in the third quarter. (Please refer to the portfolio of investments for a complete list of holdings and the amount each represents in the portfolio.)
Alexion Pharmaceuticals has been among our strongest contributors for several years and has become the second-largest holding. This mid-cap biotech develops drugs for patients with life-threatening diseases and other serious medical conditions. It has only one commercial product, Soliris, which is currently approved for two rare, or orphan, diseases: PNH, a rare blood-borne genetic disease, and aHUS, a genetic disorder that can lead to kidney failure, heart attack, or stroke. We like the prospects for Alexion because Soliris has a long patent life, the drug requires modest commercial expenses to sell, and we believe that there is a good probability that Soliris will be approved for other rare disorders.
Gilead Sciences and Vertex Pharmaceuticals were also strong contributors in the reporting period. Gilead has been among our largest portfolio holdings for more than a decade. While the company has a solid base business as the leading provider of HIV treatments, its launch earlier this year of Sovaldi, a revolutionary treatment for the hepatitis C virus (HCV), has been the main driver of performance over the past several months. Sovaldi’s commercial launch has been one of the strongest in biotech history, as revenue for the first quarter alone was over $2 billion. Sovaldi dramatically improves on the current standard of care for HCV, as it is simpler (a once-a-day pill) and has significantly higher cure rates. While Sovaldi will face competition in the coming months, we believe it is a superior treatment and should be able to take and maintain a majority share in the large and growing HCV market. Although we are confident in Gilead’s long-term success, we significantly trimmed our outsized position and locked in some of the profits we had accrued over many years.
We have established a large position in Vertex, which has an approved therapy for cystic fibrosis (CF), called Kalydeco. The drug addresses a specific mutation (there are hundreds) and, since its launch in 2012, is being used by more than 90% of patients in the U.S. with this particular mutation. CF is a progressive disease and Kalydeco stabilizes its progression. Vertex recently released positive late-stage data on another CF drug, which, when used in combination with Kalydeco, could help a much larger CF population for which no effective drugs currently exist. We are excited about the prospects for Vertex because this drug combination should benefit a much larger number of patients with CF.
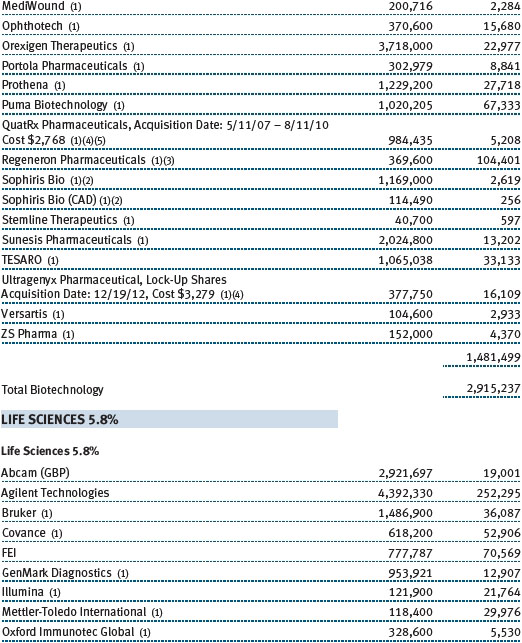
We had several significant detractors in biotech, including Puma Biotechnology and Medicines Company. Although Puma was a terrible performer in the six-month period, its share price had approximately doubled in the prior 18 months. Puma traded near $15 when we first started accumulating our position, and the stock peaked above $140 earlier this year before ending the period below $70. The company’s major product is neratinib for the treatment of patients with breast cancer, non-small cell lung cancer, and solid tumors. Concerns about approval from the FDA caused a sell-off in the stock. We believed that the fears are overblown and added to our position as the stock declined. We have been rewarded. New data were released in July (after the end of this reporting period) that showed efficacy in treating adjuvant breast cancer, which is one of the larger breast cancer subsets. The news release caused Puma’s stock surge past $200 at the time of this writing.
The Medicines Company decline was due to the FDA’s refusal to approve Cangrelor, a blood thinner used in heart patients undergoing procedures to implant stents. The FDA determined that Cangrelor did not show superiority to clopidogrel, which is marketed by Bristol-Myers Squibb and Sanofi under the Plavix brand name, and that the clinical trials sponsored by Medicines Company were unethically and inappropriately administered. We have reduced our position in Medicines Company. Although its drug could ultimately get approval, we have become concerned about the company’s ability to commercialize the products in its pipeline.
We believe that the discovery, development, manufacture, and commercialization of medicines are the drivers of long-term value and that many of the best investments in health care will come from therapeutics companies, those that produce medicines that prevent disease, relieve symptoms, and provide cures. While we used the bio-technology pullback in the first quarter to add to the sector, we were net sellers during the six-month period as some of the stocks in this sector have reached what we view as unsustainable valuation levels.
Much of the merger and acquisition activity we are seeing in the health care sector appears to be primarily about lowering tax rates and saving money. When companies are facing marginal topline growth and peak-level profit margins, it usually spells disaster. But one of the ways that companies can boost the bottom line is by reducing taxes. And right now it looks like Congress will do nothing to change the tax codes. More and more, companies are exploiting the situation and redomiciling their “operations” overseas, where taxes are lower.
In the pharmaceuticals sector, Actavis and Allergan were top contributors that benefited from tax-inversion merger activity. On July 1, 2014, Dublin-based Actavis announced that it had completed its acquisition of Forrest Laboratories in a cash and equity transaction valued at approximately $25 billion. The combination created one of the world’s fastest-growing specialty pharmaceutical companies, with annual revenues of more than $15 billion anticipated for 2015. Allergan benefited from a proposed takeover by Valeant Pharmaceuticals International. Although Allergan has repeatedly rebuffed the hostile $53 billion takeover offer, believing that it is better as a standalone company, the Botox manufacturer’s share price rise in the first half reflects the takeover premium.
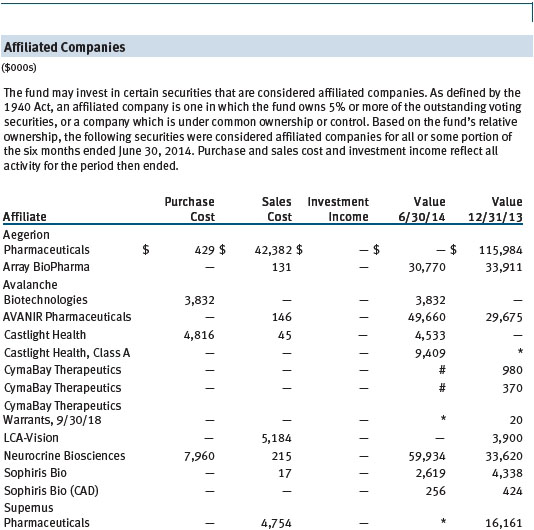
Small-cap Aegerion Pharmaceuticals, a former star performer for the portfolio, was the worst performer for the past six months. Like many young specialty pharmaceutical companies, Aegerion is a single-product firm. It is focused on developing and commercializing lomitapide (sold under the commercial name Juxtapid), a once-a-day pill for the treatment of homozygous familial hypercholesterolemia (HoFH). Patients with HoFH have an inherited defect that leads to elevated cholesterol levels, putting them at a very high risk for early cardiovascular events and possibly death. Sales of the drug have not been good enough to justify its lofty valuation, and the company faces patent risk and future competition. The combination of these three issues led us to eliminate our position.
The portfolio’s largest overweight allocation is in the services industry, and most of that is in managed care. Humana was the best contributor in the managed care space, but we have larger positions and earned good returns from our holdings in UnitedHealth Group and Aetna. Humana and its peers are currently posting revenue gains like growth companies thanks to Medicare Advantage. The program is a no-brainer for everyone over the age of 65. It’s a win-win for patients, the government, and these insurers (of course the insurers don’t win if they misprice the coverage). But the program is a boon for the segment because as prices go up, they simply charge more, passing along the increase to the consumers. There is limited competition between these companies, and the Affordable Care Act just gave them a shot in the arm by forcing everyone to have health care coverage. Companies that need more growth can be more aggressive in their pricing and taking more risk on new members.
We are underweight and have an active bet against health care providers because we see a secular trend for individuals to have to pay more—through higher deductibles and out-of-pocket expenses—of their health care costs, which brings down utilization rates. Overall, the providers are consolidating in an attempt to benefit from economies of scale and raise prices, without much success. We eliminated a handful of holdings in the space, including LCA-Vision, DaVita HealthCare Partners, Life Healthcare Group, Bumrungrad Hospital, and Select Medical Holdings. We are concerned that health care prices are continuing to rise much faster than the rate of inflation, and we believe that it is an unsustainable trend, which, at some point, could end badly for the companies in the providers segment. Although we have recently purchased a few holdings such as Community Health Systems and maintained a large position in Universal Health Services, we intend to remain underweight in medical technology and hospital companies.
While most of the portfolio’s investments are in U.S. common stocks, the fund will selectively invest in non-U.S. companies. Over the past six months, our overseas investments contributed to returns. Additionally, the fund writes call and put options primarily as a means of augmenting income. Normally, the portfolio will own the securities on which it writes these options. The premium income recovered by writing covered calls can help reduce, but not eliminate, volatility. Over the past six months, the options strategy benefited the portfolio’s results.
OUTLOOK
Health care stocks have been one of the strongest sectors of the market for the past five years, but I believe it is unlikely that our near-term returns can match the pace of recent gains. Health care will remain a growth industry, and it is likely that we will see pockets of exciting performance within the two areas that we emphasize—the introduction of highly innovative and effective medical products and businesses in the health care services area that provide quality outcomes in a cost-effective manner. Longer term, however, I remain very optimistic about future innovation in health care.
Because of the growing prevalence of insurance plans with high deductibles and higher out-of-pocket expenses, I believe health care utilization rates could remain depressed. This should favor companies that benefit from lower utilization, such as managed care companies, while creating a more challenging environment for volume-driven businesses, such as health care providers. Our team of health care analysts continues to monitor the rollout of the Affordable Care Act’s health care exchanges. While the rebound in enrollment is encouraging, the mix in the risk pool remains unclear, which could put pressure on managed care margins in the current plan year should the exchanges prove to have attracted a less healthy population than expected.
There is huge potential for significant breakthrough developments. I believe that in the next decade we’ll uncover cancer therapies that will make a massive difference and enable patients to live longer and healthier lives. I’m excited about new drugs that enable the immune system to play a larger role in cancer therapy. More broadly, another exciting area is gene replacement technology, which, over the next 10 to 15 years, could play a critical role in treating genetically caused diseases in which a particular gene is specifically targeted. For example, I’ve invested in two private companies in phase III testing that are focused on gene replacement therapy for very rare ocular diseases. It’s a one-time treatment for people who are destined to go blind.
There are other huge areas with unmet needs, such as Alzheimer’s, liver disease, and generalized fibrosis, where we are seeing real innovation. I remain extremely encouraged about the opportunities for long-term investors in this sector.
Respectfully submitted,

Taymour R. Tamaddon
President of the fund and chairman of its Investment Advisory Committee
July 24, 2014
The committee chairman has day-to-day responsibility for managing the portfolio and works with committee members in developing and executing the fund’s investment program.
RISK OF GROWTH INVESTING
Growth stocks can be volatile for several reasons. Since these companies usually invest a high portion of earnings in their businesses, they may lack the dividends of value stocks that can cushion stock prices in a falling market. Also, earnings disappointments often lead to sharply falling prices because investors buy growth stocks in anticipation of superior earnings growth.
RISK OF HEALTH SCIENCES FUND INVESTING
Funds that invest only in specific industries will experience greater volatility than funds investing in a broad range of industries. Companies in the health sciences field are subject to special risks such as increased competition within the health care industry, changes in legislation or government regulations, reductions in government funding, product liability or other litigation, and the obsolescence of popular products.
GLOSSARY
Lipper index: Fund benchmarks that consist of a small number of the largest mutual funds in a particular category as tracked by Lipper Inc.
S&P 500 Index: An index consisting of 500 stocks chosen for market size, liquidity, and industry group representation. It is a market value-weighted index, with each stock’s weight in the index proportionate to its market value.
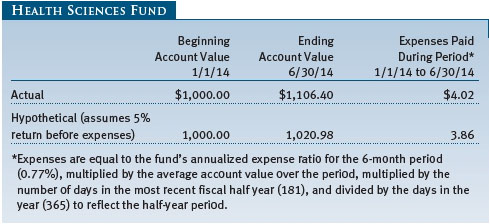
Performance and Expenses
| Growth of $10,000 |
This chart shows the value of a hypothetical $10,000 investment in the fund over the past 10 fiscal year periods or since inception (for funds lacking 10-year records). The result is compared with benchmarks, which may include a broad-based market index and a peer group average or index. Market indexes do not include expenses, which are deducted from fund returns as well as mutual fund averages and indexes.
| Fund Expense Example |
As a mutual fund shareholder, you may incur two types of costs: (1) transaction costs, such as redemption fees or sales loads, and (2) ongoing costs, including management fees, distribution and service (12b-1) fees, and other fund expenses. The following example is intended to help you understand your ongoing costs (in dollars) of investing in the fund and to compare these costs with the ongoing costs of investing in other mutual funds. The example is based on an investment of $1,000 invested at the beginning of the most recent six-month period and held for the entire period.
Actual Expenses
The first line of the following table (Actual) provides information about actual account values and expenses based on the fund’s actual returns. You may use the information on this line, together with your account balance, to estimate the expenses that you paid over the period. Simply divide your account value by $1,000 (for example, an $8,600 account value divided by $1,000 = 8.6), then multiply the result by the number on the first line under the heading “Expenses Paid During Period” to estimate the expenses you paid on your account during this period.
Hypothetical Example for Comparison Purposes
The information on the second line of the table (Hypothetical) is based on hypothetical account values and expenses derived from the fund’s actual expense ratio and an assumed 5% per year rate of return before expenses (not the fund’s actual return). You may compare the ongoing costs of investing in the fund with other funds by contrasting this 5% hypothetical example and the 5% hypothetical examples that appear in the shareholder reports of the other funds. The hypothetical account values and expenses may not be used to estimate the actual ending account balance or expenses you paid for the period.
Note: T. Rowe Price charges an annual account service fee of $20, generally for accounts with less than $10,000. The fee is waived for any investor whose T. Rowe Price mutual fund accounts total $50,000 or more; accounts electing to receive electronic delivery of account statements, transaction confirmations, prospectuses, and shareholder reports; or accounts of an investor who is a T. Rowe Price Preferred Services, Personal Services, or Enhanced Personal Services client (enrollment in these programs generally requires T. Rowe Price assets of at least $100,000). This fee is not included in the accompanying table. If you are subject to the fee, keep it in mind when you are estimating the ongoing expenses of investing in the fund and when comparing the expenses of this fund with other funds.
You should also be aware that the expenses shown in the table highlight only your ongoing costs and do not reflect any transaction costs, such as redemption fees or sales loads. Therefore, the second line of the table is useful in comparing ongoing costs only and will not help you determine the relative total costs of owning different funds. To the extent a fund charges transaction costs, however, the total cost of owning that fund is higher.
Unaudited
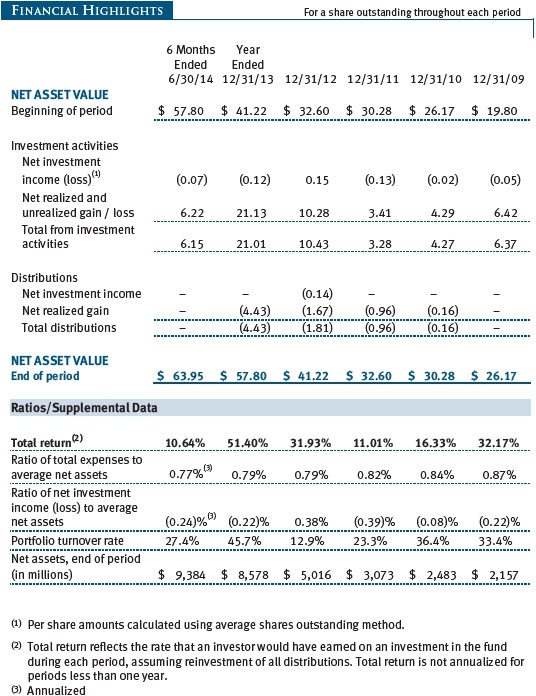
The accompanying notes are an integral part of these financial statements.
Unaudited

The accompanying notes are an integral part of these financial statements.
Unaudited
The accompanying notes are an integral part of these financial statements.
Unaudited
The accompanying notes are an integral part of these financial statements.
Unaudited
The accompanying notes are an integral part of these financial statements.
Unaudited
| Notes to Financial Statements |
T. Rowe Price Health Sciences Fund, Inc. (the fund), is registered under the Investment Company Act of 1940 (the 1940 Act) as a diversified, open-end management investment company. The fund commenced operations on December 29, 1995. The fund seeks long-term capital appreciation.
NOTE 1 - SIGNIFICANT ACCOUNTING POLICIES
Basis of Preparation The fund is an investment company and follows accounting and reporting guidance in the Financial Accounting Standards Board Accounting Standards Codification Topic 946 (ASC 946). The accompanying financial statements were prepared in accordance with accounting principles generally accepted in the United States of America (GAAP), including but not limited to ASC 946. GAAP requires the use of estimates made by management. Management believes that estimates and valuations are appropriate; however, actual results may differ from those estimates, and the valuations reflected in the accompanying financial statements may differ from the value ultimately realized upon sale or maturity.
Investment Transactions, Investment Income, and Distributions Income and expenses are recorded on the accrual basis. Premiums and discounts on debt securities are amortized for financial reporting purposes. Dividends received from mutual fund investments are reflected as dividend income; capital gain distributions are reflected as realized gain/loss. Dividend income and capital gain distributions are recorded on the ex-dividend date. Income tax-related interest and penalties, if incurred, would be recorded as income tax expense. Investment transactions are accounted for on the trade date. Realized gains and losses are reported on the identified cost basis. Distributions to shareholders are recorded on the ex-dividend date. Income distributions are declared and paid annually. Capital gain distributions, if any, are generally declared and paid by the fund annually.
Currency Translation Assets, including investments, and liabilities denominated in foreign currencies are translated into U.S. dollar values each day at the prevailing exchange rate, using the mean of the bid and asked prices of such currencies against U.S. dollars as quoted by a major bank. Purchases and sales of securities, income, and expenses are translated into U.S. dollars at the prevailing exchange rate on the date of the transaction. The effect of changes in foreign currency exchange rates on realized and unrealized security gains and losses is reflected as a component of security gains and losses.
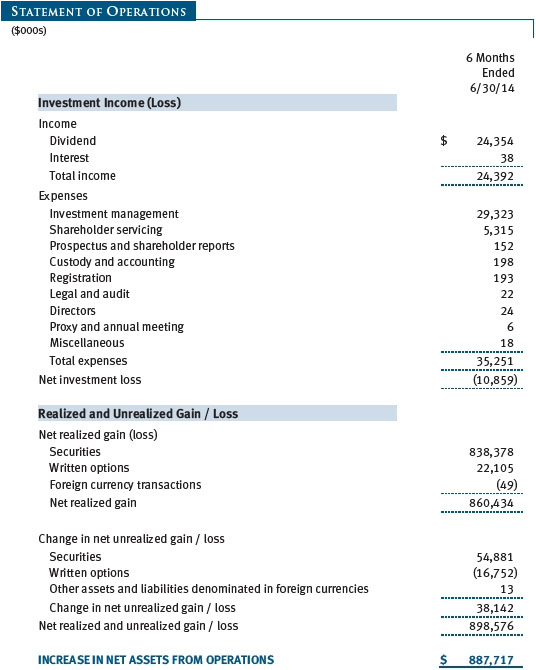
Rebates Subject to best execution, the fund may direct certain security trades to brokers who have agreed to rebate a portion of the related brokerage commission to the fund in cash. Commission rebates are reflected as realized gain on securities in the accompanying financial statements and totaled $74,000 for the six months ended June 30, 2014.
NOTE 2 - VALUATION
The fund’s financial instruments are valued and its net asset value (NAV) per share is computed at the close of the New York Stock Exchange (NYSE), normally 4 p.m. ET, each day the NYSE is open for business.
Fair Value The fund’s financial instruments are reported at fair value, which GAAP defines as the price that would be received to sell an asset or paid to transfer a liability in an orderly transaction between market participants at the measurement date. The T. Rowe Price Valuation Committee (the Valuation Committee) has been established by the fund’s Board of Directors (the Board) to ensure that financial instruments are appropriately priced at fair value in accordance with GAAP and the 1940 Act. Subject to oversight by the Board, the Valuation Committee develops and oversees pricing-related policies and procedures and approves all fair value determinations. Specifically, the Valuation Committee establishes procedures to value securities; determines pricing techniques, sources, and persons eligible to effect fair value pricing actions; oversees the selection, services, and performance of pricing vendors; oversees valuation-related business continuity practices; and provides guidance on internal controls and valuation-related matters. The Valuation Committee reports to the fund’s Board; is chaired by the fund’s treasurer; and has representation from legal, portfolio management and trading, operations, and risk management.
Various valuation techniques and inputs are used to determine the fair value of financial instruments. GAAP establishes the following fair value hierarchy that categorizes the inputs used to measure fair value:
Level 1 – quoted prices (unadjusted) in active markets for identical financial instruments that the fund can access at the reporting date
Level 2 – inputs other than Level 1 quoted prices that are observable, either directly or indirectly (including, but not limited to, quoted prices for similar financial instruments in active markets, quoted prices for identical or similar financial instruments in inactive markets, interest rates and yield curves, implied volatilities, and credit spreads)
Level 3 – unobservable inputs
Observable inputs are developed using market data, such as publicly available information about actual events or transactions, and reflect the assumptions that market participants would use to price the financial instrument. Unobservable inputs are those for which market data are not available and are developed using the best information available about the assumptions that market participants would use to price the financial instrument. GAAP requires valuation techniques to maximize the use of relevant observable inputs and minimize the use of unobservable inputs. When multiple inputs are used to derive fair value, the financial instrument is assigned to the level within the fair value hierarchy based on the lowest-level input that is significant to the fair value of the financial instrument. Input levels are not necessarily an indication of the risk or liquidity associated with financial instruments at that level but rather the degree of judgment used in determining those values.
Valuation Techniques Equity securities listed or regularly traded on a securities exchange or in the over-the-counter (OTC) market are valued at the last quoted sale price or, for certain markets, the official closing price at the time the valuations are made. OTC Bulletin Board securities are valued at the mean of the closing bid and asked prices. A security that is listed or traded on more than one exchange is valued at the quotation on the exchange determined to be the primary market for such security. Listed securities not traded on a particular day are valued at the mean of the closing bid and asked prices for domestic securities and the last quoted sale or closing price for international securities.
For valuation purposes, the last quoted prices of non-U.S. equity securities may be adjusted to reflect the fair value of such securities at the close of the NYSE. If the fund determines that developments between the close of a foreign market and the close of the NYSE will, in its judgment, materially affect the value of some or all of its portfolio securities, the fund will adjust the previous quoted prices to reflect what it believes to be the fair value of the securities as of the close of the NYSE. In deciding whether it is necessary to adjust quoted prices to reflect fair value, the fund reviews a variety of factors, including developments in foreign markets, the performance of U.S. securities markets, and the performance of instruments trading in U.S. markets that represent foreign securities and baskets of foreign securities. The fund may also fair value securities in other situations, such as when a particular foreign market is closed but the fund is open. The fund uses outside pricing services to provide it with quoted prices and information to evaluate or adjust those prices. The fund cannot predict how often it will use quoted prices and how often it will determine it necessary to adjust those prices to reflect fair value. As a means of evaluating its security valuation process, the fund routinely compares quoted prices, the next day’s opening prices in the same markets, and adjusted prices.
Actively traded domestic equity securities generally are categorized in Level 1 of the fair value hierarchy. Non-U.S. equity securities generally are categorized in Level 2 of the fair value hierarchy despite the availability of quoted prices because, as described above, the fund evaluates and determines whether those quoted prices reflect fair value at the close of the NYSE or require adjustment. OTC Bulletin Board securities, certain preferred securities, and equity securities traded in inactive markets generally are categorized in Level 2 of the fair value hierarchy.
Debt securities generally are traded in the OTC market. Securities with remaining maturities of one year or more at the time of acquisition are valued at prices furnished by dealers who make markets in such securities or by an independent pricing service, which considers the yield or price of bonds of comparable quality, coupon, maturity, and type, as well as prices quoted by dealers who make markets in such securities. Generally, debt securities are categorized in Level 2 of the fair value hierarchy; however, to the extent the valuations include significant unobservable inputs, the securities would be categorized in Level 3.
Investments in mutual funds are valued at the mutual fund’s closing NAV per share on the day of valuation and are categorized in Level 1 of the fair value hierarchy. Listed options, and OTC options with a listed equivalent, are valued at the mean of the closing bid and asked prices and generally are categorized in Level 2 of the fair value hierarchy. Assets and liabilities other than financial instruments, including short-term receivables and payables, are carried at cost, or estimated realizable value, if less, which approximates fair value.
Thinly traded financial instruments and those for which the above valuation procedures are inappropriate or are deemed not to reflect fair value are stated at fair value as determined in good faith by the Valuation Committee. The objective of any fair value pricing determination is to arrive at a price that could reasonably be expected from a current sale. Financial instruments fair valued by the Valuation Committee are primarily private placements, restricted securities, warrants, rights, and other securities that are not publicly traded.
Subject to oversight by the Board, the Valuation Committee regularly makes good faith judgments to establish and adjust the fair valuations of certain securities as events occur and circumstances warrant. For instance, in determining the fair value of an equity investment with limited market activity, such as a private placement or a thinly traded public company stock, the Valuation Committee considers a variety of factors, which may include, but are not limited to, the issuer’s business prospects, its financial standing and performance, recent investment transactions in the issuer, new rounds of financing, negotiated transactions of significant size between other investors in the company, relevant market valuations of peer companies, strategic events affecting the company, market liquidity for the issuer, and general economic conditions and events. In consultation with the investment and pricing teams, the Valuation Committee will determine an appropriate valuation technique based on available information, which may include both observable and unobservable inputs. The Valuation Committee typically will afford greatest weight to actual prices in arm’s length transactions, to the extent they represent orderly transactions between market participants; transaction information can be reliably obtained; and prices are deemed representative of fair value. However, the Valuation Committee may also consider other valuation methods such as market-based valuation multiples; a discount or premium from market value of a similar, freely traded security of the same issuer; or some combination. Fair value determinations are reviewed on a regular basis and updated as information becomes available, including actual purchase and sale transactions of the issue. Because any fair value determination involves a significant amount of judgment, there is a degree of subjectivity inherent in such pricing decisions, and fair value prices determined by the Valuation Committee could differ from those of other market participants. Depending on the relative significance of unobservable inputs, including the valuation technique(s) used, fair valued securities may be categorized in Level 2 or 3 of the fair value hierarchy.
Valuation Inputs The following table summarizes the fund’s financial instruments, based on the inputs used to determine their fair values on June 30, 2014:

There were no material transfers between Levels 1 and 2 during the six months ended June 30, 2014.
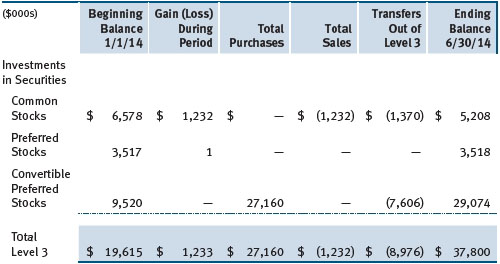
Following is a reconciliation of the fund’s Level 3 holdings for the six months ended June 30, 2014. Gain (loss) reflects both realized and change in unrealized gain/loss on Level 3 holdings during the period, if any, and is included on the accompanying Statement of Operations. The change in unrealized gain/loss on Level 3 instruments held at June 30, 2014, totaled $1,233,000 for the six months ended June 30, 2014. Transfers into and out of Level 3 are reflected at the value of the financial instrument at the beginning of the period. During the six months, transfers out of Level 3 were because observable market data became available for the security.
NOTE 3 - DERIVATIVE INSTRUMENTS
During the six months ended June 30, 2014, the fund invested in derivative instruments. As defined by GAAP, a derivative is a financial instrument whose value is derived from an underlying security price, foreign exchange rate, interest rate, index of prices or rates, or other variable; it requires little or no initial investment and permits or requires net settlement. The fund invests in derivatives only if the expected risks and rewards are consistent with its investment objectives, policies, and overall risk profile, as described in its prospectus and Statement of Additional Information. The fund may use derivatives for a variety of purposes, such as seeking to hedge against declines in principal value, increase yield, invest in an asset with greater efficiency and at a lower cost than is possible through direct investment, or to adjust credit exposure. The risks associated with the use of derivatives are different from, and potentially much greater than, the risks associated with investing directly in the instruments on which the derivatives are based. The fund at all times maintains sufficient cash reserves, liquid assets, or other SEC-permitted asset types to cover its settlement obligations under open derivative contracts.
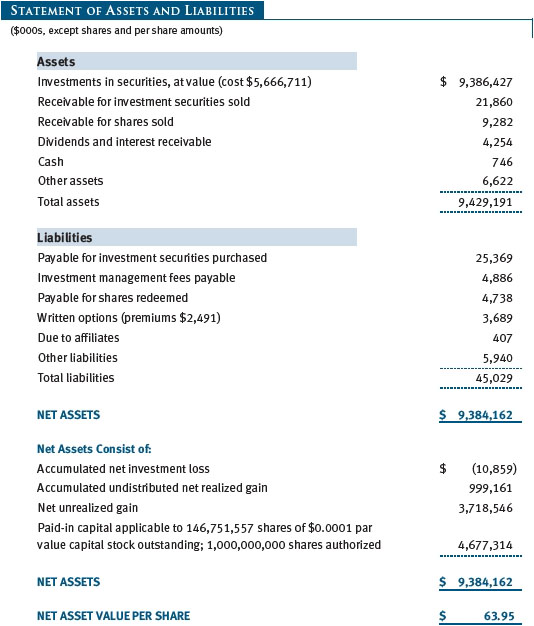
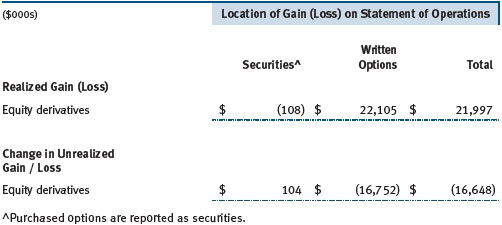
The fund values its derivatives at fair value, as described in Note 2, and recognizes changes in fair value currently in its results of operations. Accordingly, the fund does not follow hedge accounting, even for derivatives employed as economic hedges. Generally, the fund accounts for its derivatives on a gross basis. It does not offset the fair value of derivative liabilities against the fair value of derivative assets on its financial statements, nor does it offset the fair value of derivative instruments against the right to reclaim or obligation to return collateral. As of June 30, 2014, the fund held equity derivatives with a fair value of $3,689,000, included in Written options, on the accompanying Statement of Assets and Liabilities.
Additionally, the amount of gains and losses on derivative instruments recognized in fund earnings during the six months ended June 30, 2014, and the related location on the accompanying Statement of Operations is summarized in the following table by primary underlying risk exposure:
Counterparty Risk and Collateral The fund invests in exchange-traded or centrally cleared derivative contracts, such as futures, exchange-traded options, and centrally cleared swaps. Counterparty risk on such derivatives is minimal because the clearinghouse provides protection against counterparty defaults. For futures and centrally cleared swaps, the fund is required to deposit collateral in an amount equal to a certain percentage of the contract value (margin requirement), and the margin requirement must be maintained over the life of the contract. Each clearing broker, in its sole discretion, may adjust the margin requirements applicable to the fund.
Collateral may be in the form of cash or debt securities issued by the U.S. government or related agencies. Cash and currencies posted by the fund are reflected as cash deposits in the accompanying financial statements and generally are restricted from withdrawal by the fund; securities posted by the fund are so noted in the accompanying Portfolio of Investments; both remain in the fund’s assets. As of June 30, 2014, no margin had been posted by the fund for exchange-traded and/or centrally cleared derivatives.
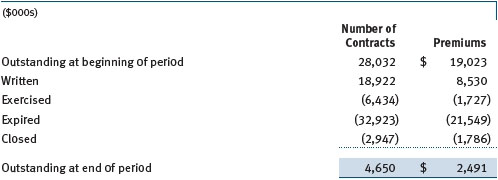
Options The fund is subject to equity price risk in the normal course of pursuing its investment objectives and uses options to help manage such risk. The fund may use options to manage exposure to security prices, interest rates, foreign currencies, and credit quality; as an efficient means of adjusting exposure to all or a part of a target market; to enhance income; as a cash management tool; or to adjust credit exposure. Options are included in net assets at fair value; purchased options are included in Investments in Securities; and written options are separately reflected as a liability on the accompanying Statement of Assets and Liabilities. Premiums on unexercised, expired options are recorded as realized gains or losses; premiums on exercised options are recorded as an adjustment to the proceeds from the sale or cost of the purchase. The difference between the premium and the amount received or paid in a closing transaction is also treated as realized gain or loss. In return for a premium paid, call and put options give the holder the right, but not the obligation, to purchase or sell, respectively, a security at a specified exercise price. Risks related to the use of options include possible illiquidity of the options markets; trading restrictions imposed by an exchange or counterparty; movements in the underlying security values and, for written options, potential losses in excess of the fund’s initial investment. During the six months ended June 30, 2014, the volume of the fund’s activity in options, based on underlying notional amounts, was generally between 0% and 3% of net assets. Transactions in written options and related premiums received during the six months ended June 30, 2014, were as follows:
NOTE 4 - OTHER INVESTMENT TRANSACTIONS
Consistent with its investment objective, the fund engages in the following practices to manage exposure to certain risks and/or to enhance performance. The investment objective, policies, program, and risk factors of the fund are described more fully in the fund’s prospectus and Statement of Additional Information.
Restricted Securities The fund may invest in securities that are subject to legal or contractual restrictions on resale. Prompt sale of such securities at an acceptable price may be difficult and may involve substantial delays and additional costs.
Other Purchases and sales of portfolio securities other than short-term securities aggregated $2,478,664,000 and $2,477,965,000, respectively, for the six months ended June 30, 2014.
NOTE 5 - FEDERAL INCOME TAXES
No provision for federal income taxes is required since the fund intends to continue to qualify as a regulated investment company under Subchapter M of the Internal Revenue Code and distribute to shareholders all of its taxable income and gains. Distributions determined in accordance with federal income tax regulations may differ in amount or character from net investment income and realized gains for financial reporting purposes. Financial reporting records are adjusted for permanent book/tax differences to reflect tax character but are not adjusted for temporary differences. The amount and character of tax-basis distributions and composition of net assets are finalized at fiscal year-end; accordingly, tax-basis balances have not been determined as of the date of this report.
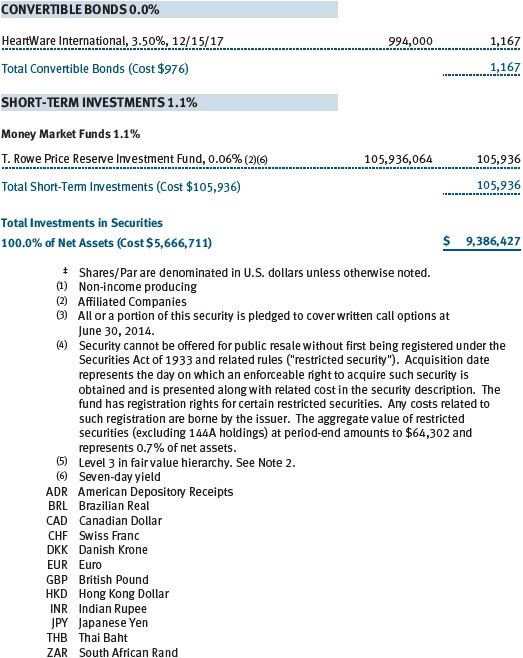
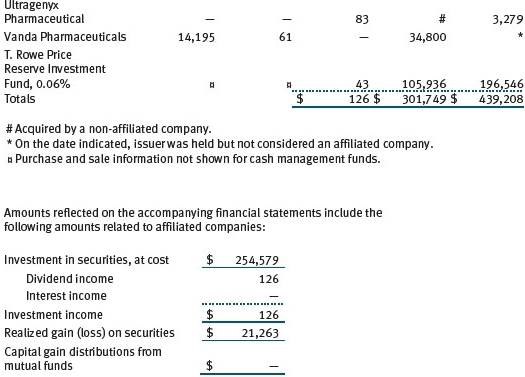
At June 30, 2014, the cost of investments for federal income tax purposes was $5,680,479,000. Net unrealized gain aggregated $3,704,778,000 at period-end, of which $3,792,639,000 related to appreciated investments and $87,861,000 related to depreciated investments.
NOTE 6 - RELATED PARTY TRANSACTIONS
The fund is managed by T. Rowe Price Associates, Inc. (Price Associates), a wholly owned subsidiary of T. Rowe Price Group, Inc. (Price Group). The investment management agreement between the fund and Price Associates provides for an annual investment management fee, which is computed daily and paid monthly. The fee consists of an individual fund fee, equal to 0.35% of the fund’s average daily net assets, and a group fee. The group fee rate is calculated based on the combined net assets of certain mutual funds sponsored by Price Associates (the group) applied to a graduated fee schedule, with rates ranging from 0.48% for the first $1 billion of assets to 0.275% for assets in excess of $400 billion. The fund’s group fee is determined by applying the group fee rate to the fund’s average daily net assets. At June 30, 2014, the effective annual group fee rate was 0.29%.
In addition, the fund has entered into service agreements with Price Associates and two wholly owned subsidiaries of Price Associates (collectively, Price). Price Associates computes the daily share price and provides certain other administrative services to the fund. T. Rowe Price Services, Inc., provides shareholder and administrative services in its capacity as the fund’s transfer and dividend-disbursing agent. T. Rowe Price Retirement Plan Services, Inc., provides subaccounting and recordkeeping services for certain retirement accounts invested in the fund. For the six months ended June 30, 2014, expenses incurred pursuant to these service agreements were $73,000 for Price Associates; $1,788,000 for T. Rowe Price Services, Inc.; and $447,000 for T. Rowe Price Retirement Plan Services, Inc. The total amount payable at period-end pursuant to these service agreements is reflected as Due to Affiliates in the accompanying financial statements.
Additionally, the fund is one of several mutual funds in which certain college savings plans managed by Price Associates may invest. As approved by the fund’s Board of Directors, shareholder servicing costs associated with each college savings plan are borne by the fund in proportion to the average daily value of its shares owned by the college savings plan. For the six months ended June 30, 2014, the fund was charged $21,000 for shareholder servicing costs related to the college savings plans, of which $12,000 was for services provided by Price. The amount payable at period-end pursuant to this agreement is reflected as Due to Affiliates in the accompanying financial statements. At June 30, 2014, less than 1% of the outstanding shares of the fund were held by college savings plans.
The fund may invest in the T. Rowe Price Reserve Investment Fund, the T. Rowe Price Government Reserve Investment Fund, or the T. Rowe Price Short-Term Reserve Fund (collectively, the Price Reserve Investment Funds), open-end management investment companies managed by Price Associates and considered affiliates of the fund. The Price Reserve Investment Funds are offered as short-term investment options to mutual funds, trusts, and other accounts managed by Price Associates or its affiliates and are not available for direct purchase by members of the public. The Price Reserve Investment Funds pay no investment management fees.
| Information on Proxy Voting Policies, Procedures, and Records |
A description of the policies and procedures used by T. Rowe Price funds and portfolios to determine how to vote proxies relating to portfolio securities is available in each fund’s Statement of Additional Information. You may request this document by calling 1-800-225-5132 or by accessing the SEC’s website, sec.gov.
The description of our proxy voting policies and procedures is also available on our website, troweprice.com. To access it, click on the words “Social Responsibility” at the top of our corporate homepage. Next, click on the words “Conducting Business Responsibly” on the left side of the page that appears. Finally, click on the words “Proxy Voting Policies” on the left side of the page that appears.
Each fund’s most recent annual proxy voting record is available on our website and through the SEC’s website. To access it through our website, follow the above directions to reach the “Conducting Business Responsibly” page. Click on the words “Proxy Voting Records” on the left side of that page, and then click on the “View Proxy Voting Records” link at the bottom of the page that appears.
| How to Obtain Quarterly Portfolio Holdings |
The fund files a complete schedule of portfolio holdings with the Securities and Exchange Commission for the first and third quarters of each fiscal year on Form N-Q. The fund’s Form N-Q is available electronically on the SEC’s website (sec.gov); hard copies may be reviewed and copied at the SEC’s Public Reference Room, 100 F St. N.E., Washington, DC 20549. For more information on the Public Reference Room, call 1-800-SEC-0330.
| Approval of Investment Management Agreement |
On April 30, 2014, the fund’s Board of Directors (Board), including a majority of the fund’s independent directors, approved the continuation of the investment management agreement (Advisory Contract) between the fund and its investment advisor, T. Rowe Price Associates, Inc. (Advisor). The April meeting followed a telephonic meeting held on March 4, 2014, during which the Board reviewed information and discussed the continuation of the Advisory Contract. In connection with its deliberations, the Board requested, and the Advisor provided, such information as the Board (with advice from independent legal counsel) deemed reasonably necessary. The Board considered a variety of factors in connection with its review of the Advisory Contract, also taking into account information provided by the Advisor during the course of the year, as discussed below:
Services Provided by the Advisor
The Board considered the nature, quality, and extent of the services provided to the fund by the Advisor. These services included, but were not limited to, directing the fund’s investments in accordance with its investment program and the overall management of the fund’s portfolio, as well as a variety of related activities such as financial, investment operations, and administrative services; compliance; maintaining the fund’s records and registrations; and shareholder communications. The Board also reviewed the background and experience of the Advisor’s senior management team and investment personnel involved in the management of the fund, as well as the Advisor’s compliance record. The Board concluded that it was satisfied with the nature, quality, and extent of the services provided by the Advisor.
Investment Performance of the Fund
The Board reviewed the fund’s three-month, one-year, and year-by-year returns, as well as the fund’s average annualized total returns over the 3-, 5-, and 10-year periods, and compared these returns with a wide variety of previously agreed-upon comparable performance measures and market data, including those supplied by Lipper and Morningstar, which are independent providers of mutual fund data.
On the basis of this evaluation and the Board’s ongoing review of investment results, and factoring in the relative market conditions during certain of the performance periods, the Board concluded that the fund’s performance was satisfactory.
Costs, Benefits, Profits, and Economies of Scale
The Board reviewed detailed information regarding the revenues received by the Advisor under the Advisory Contract and other benefits that the Advisor (and its affiliates) may have realized from its relationship with the fund, including any research received under “soft dollar” agreements and commission-sharing arrangements with broker-dealers. The Board considered that the Advisor may receive some benefit from soft-dollar arrangements pursuant to which research is received from broker-dealers that execute the applicable fund’s portfolio transactions. The Board received information on the estimated costs incurred and profits realized by the Advisor from managing T. Rowe Price mutual funds. The Board also reviewed estimates of the profits realized from managing the fund in particular, and the Board concluded that the Advisor’s profits were reasonable in light of the services provided to the fund.
The Board also considered whether the fund benefits under the fee levels set forth in the Advisory Contract from any economies of scale realized by the Advisor. Under the Advisory Contract, the fund pays a fee to the Advisor for investment management services composed of two components—a group fee rate based on the combined average net assets of most of the T. Rowe Price mutual funds (including the fund) that declines at certain asset levels and an individual fund fee rate based on the fund’s average daily net assets—and the fund pays its own expenses of operations. The Board concluded that the advisory fee structure for the fund continued to provide for a reasonable sharing of benefits from any economies of scale with the fund’s investors.
Fees
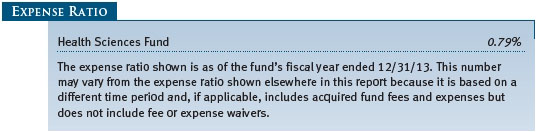
The Board was provided with information regarding industry trends in management fees and expenses, and the Board reviewed the fund’s management fee rate, operating expenses, and total expense ratio in comparison with fees and expenses of other comparable funds based on information and data supplied by Lipper. The information provided to the Board indicated that the fund’s management fee rate was above the median for certain groups of comparable funds and at or below the median for other groups of comparable funds. The information also indicated that the fund’s total expense ratio was at or below the median for comparable funds.
The Board also reviewed the fee schedules for institutional accounts and private accounts with similar mandates that are advised or subadvised by the Advisor and its affiliates. Management provided the Board with information about the Advisor’s responsibilities and services provided to institutional account clients, including information about how the requirements and economics of the institutional business are fundamentally different from those of the mutual fund business. The Board considered information showing that the mutual fund business is generally more complex from a business and compliance perspective than the institutional business and that the Advisor generally performs significant additional services and assumes greater risk in managing the fund and other T. Rowe Price mutual funds than it does for institutional account clients.
On the basis of the information provided and the factors considered, the Board concluded that the fees paid by the fund under the Advisory Contract are reasonable.
Approval of the Advisory Contract
As noted, the Board approved the continuation of the Advisory Contract. No single factor was considered in isolation or to be determinative to the decision. Rather, the Board concluded, in light of a weighting and balancing of all factors considered, that it was in the best interests of the fund and its shareholders for the Board to approve the continuation of the Advisory Contract (including the fees to be charged for services thereunder). The independent directors were advised throughout the process by independent legal counsel.
Item 2. Code of Ethics.
A code of ethics, as defined in Item 2 of Form N-CSR, applicable to its principal executive officer, principal financial officer, principal accounting officer or controller, or persons performing similar functions is filed as an exhibit to the registrant’s annual Form N-CSR. No substantive amendments were approved or waivers were granted to this code of ethics during the registrant’s most recent fiscal half-year.
Item 3. Audit Committee Financial Expert.
Disclosure required in registrant’s annual Form N-CSR.
Item 4. Principal Accountant Fees and Services.
Disclosure required in registrant’s annual Form N-CSR.
Item 5. Audit Committee of Listed Registrants.
Not applicable.
Item 6. Investments.
(a) Not applicable. The complete schedule of investments is included in Item 1 of this Form N-CSR.
(b) Not applicable.
Item 7. Disclosure of Proxy Voting Policies and Procedures for Closed-End Management Investment Companies.
Not applicable.
Item 8. Portfolio Managers of Closed-End Management Investment Companies.
Not applicable.
Item 9. Purchases of Equity Securities by Closed-End Management Investment Company and Affiliated Purchasers.
Not applicable.
Item 10. Submission of Matters to a Vote of Security Holders.
Not applicable.
Item 11. Controls and Procedures.
(a) The registrant’s principal executive officer and principal financial officer have evaluated the registrant’s disclosure controls and procedures within 90 days of this filing and have concluded that the registrant’s disclosure controls and procedures were effective, as of that date, in ensuring that information required to be disclosed by the registrant in this Form N-CSR was recorded, processed, summarized, and reported timely.
(b) The registrant’s principal executive officer and principal financial officer are aware of no change in the registrant’s internal control over financial reporting that occurred during the registrant’s second fiscal quarter covered by this report that has materially affected, or is reasonably likely to materially affect, the registrant’s internal control over financial reporting.
Item 12. Exhibits.
(a)(1) The registrant’s code of ethics pursuant to Item 2 of Form N-CSR is filed with the registrant’s annual Form N-CSR.
(2) Separate certifications by the registrant's principal executive officer and principal financial officer, pursuant to Section 302 of the Sarbanes-Oxley Act of 2002 and required by Rule 30a-2(a) under the Investment Company Act of 1940, are attached.
(3) Written solicitation to repurchase securities issued by closed-end companies: not applicable.
(b) A certification by the registrant's principal executive officer and principal financial officer, pursuant to Section 906 of the Sarbanes-Oxley Act of 2002 and required by Rule 30a-2(b) under the Investment Company Act of 1940, is attached.
SIGNATURES
Pursuant to the requirements of the Securities Exchange Act of 1934 and the Investment Company Act of 1940, the registrant has duly caused this report to be signed on its behalf by the undersigned, thereunto duly authorized.
T. Rowe Price Health Sciences Fund, Inc.
| By | /s/ Edward C. Bernard | |
| Edward C. Bernard | ||
| Principal Executive Officer | ||
| Date August 18, 2014 | ||
Pursuant to the requirements of the Securities Exchange Act of 1934 and the Investment Company Act of 1940, this report has been signed below by the following persons on behalf of the registrant and in the capacities and on the dates indicated.
| By | /s/ Edward C. Bernard | |
| Edward C. Bernard | ||
| Principal Executive Officer | ||
| Date August 18, 2014 | ||
| By | /s/ Gregory K. Hinkle | |
| Gregory K. Hinkle | ||
| Principal Financial Officer | ||
| Date August 18, 2014 | ||