UNITED STATES
SECURITIES AND EXCHANGE COMMISSION
Washington, D.C. 20549
FORM N-CSR
CERTIFIED SHAREHOLDER REPORT OF REGISTERED
MANAGEMENT INVESTMENT COMPANIES
Investment Company Act File Number: 811-07381
| T. Rowe Price Health Sciences Fund, Inc. |
| (Exact name of registrant as specified in charter) |
| 100 East Pratt Street, Baltimore, MD 21202 |
| (Address of principal executive offices) |
| David Oestreicher |
| 100 East Pratt Street, Baltimore, MD 21202 |
| (Name and address of agent for service) |
Registrant’s telephone number, including area code: (410) 345-2000
Date of fiscal year end: December 31
Date of reporting period: December 31, 2019
 |
| Health Sciences Fund | December 31, 2019 |
| PRHSX | Investor Class |
| THISX | I Class |
Beginning on January 1, 2021, as permitted by SEC regulations, paper copies of the T. Rowe Price funds’ annual and semiannual shareholder reports will no longer be mailed, unless you specifically request them. Instead, shareholder reports will be made available on the funds’ website (troweprice.com/prospectus), and you will be notified by mail with a website link to access the reports each time a report is posted to the site.
If you already elected to receive reports electronically, you will not be affected by this change and need not take any action. At any time, shareholders who invest directly in T. Rowe Price funds may generally elect to receive reports or other communications electronically by enrolling attroweprice.com/paperlessor, if you are a retirement plan sponsor or invest in the funds through a financial intermediary (such as an investment advisor, broker-dealer, insurance company, or bank), by contacting your representative or your financial intermediary.
You may elect to continue receiving paper copies of future shareholder reports free of charge. To do so, if you invest directly with T. Rowe Price, please call T. Rowe Price as follows: IRA, nonretirement account holders, and institutional investors,1-800-225-5132; small business retirement accounts,1-800-492-7670. If you are a retirement plan sponsor or invest in the T. Rowe Price funds through a financial intermediary, please contact your representative or financial intermediary or follow additional instructions if included with this document. Your election to receive paper copies of reports will apply to all funds held in your account with your financial intermediary or, if you invest directly in the T. Rowe Price funds, with T. Rowe Price. Your election can be changed at any time in the future.
| T. ROWE PRICE HEALTH SCIENCES FUND |
HIGHLIGHTS
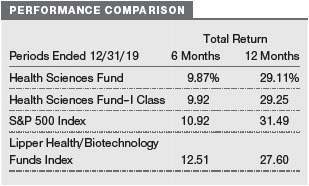
| ■ | The Health Sciences Fund returned 29.11% in the 12 months ended December 31, 2019. The fund outperformed its benchmark, the Lipper Health/Biotechnology Funds Index, but trailed the broad market as measured by the S&P 500 Index. |
| ■ | Overall, stock selection drove our relative outperformance, especially within the biotechnology and life sciences segments, while allocation effects in pharmaceuticals modestly detracted. |
| ■ | While volatility will likely remain a feature of the health care sector in the near term given the upcoming U.S. elections in November, we believe the fundamental quality of the companies we own will drive long-term performance. |
| ■ | We remain focused on investing in companies that are developing new and effective therapies for unmet medical needs and on businesses that provide quality outcomes in a cost-effective manner. |

Log in to your account attroweprice.comfor more information.
*Certain mutual fund accounts that are assessed an annual account service fee can also save money by switching to e-delivery.
CIO Market Commentary
Dear Shareholder
Stocks posted strong gains in 2019 as most major U.S. indexes hit record highs in a broad-based rally that more than offset 2018’s losses. Large- and mid-cap growth stocks were the strongest performers, with the S&P 500 and Nasdaq benchmarks recording their best year since 2013. U.S. shares outpaced their global counterparts, although most non-U.S. indexes also finished with solid double-digit gains.
Technology shares performed best within the S&P 500, helped by strong gains from industry giants Apple and Microsoft, and financial stocks also outperformed the broader market. Fixed income securities produced solid gains during the period as well—with corporate bonds leading the way—as longer-term Treasury yields fell to historic lows in late summer before partially rebounding.
In a sign that public markets have retained discipline, investors expressed skepticism about certain private-equity valuation levels when compared with their prospects for financial profitability. Relatively few initial public offerings (IPOs) saw their prices appreciate during the year, and one high-profile IPO candidate (WeWork) decided to withdraw its offering altogether after its valuation was dramatically reduced in the weeks before its proposed IPO.
Although the year opened with concerns that an escalating U.S.-China trade dispute could lead to a recession, global central banks played a key role in supporting markets. Fed policymakers delivered quarter-percentage-point rate cuts in July, September, and October and took steps to maintain liquidity in short-term lending markets. Other central banks also acted to address flagging growth, including the European Central Bank, which lowered its benchmark deposit rate deeper into negative territory and announced that it was restarting its quantitative easing program.
The pivot to a more accommodative monetary policy was a marked change from 2018, when the Fed raised rates four times, and appeared to be successful in reenergizing the economy. After contracting earlier in 2019, key U.S. manufacturing indicators showed signs of stabilizing by year-end, and the labor market remained strong, with solid payroll gains and an unemployment rate hovering near a 50-year low. With this more encouraging economic backdrop, it was not a surprise that in December Fed officials seemed satisfied that monetary policy was properly positioned to support continued growth and forecast no additional rate moves in 2020.
Besides central bank policy, investors also closely followed developments in the U.S.-China trade dispute. Stocks stumbled in May and August after the U.S. announced new tariffs on some Chinese imports and China retaliated with new tariffs of its own. However, investors generally took an optimistic view of trade negotiations, which limited the trade war’s toll on markets, and in December the two countries announced a “phase one” agreement to reduce some existing tariffs and cancel the imposition of new ones.
With monetary policy worldwide largely committed to ensuring market liquidity and some global economic indicators showing signs of improvement, there are reasons to be optimistic in 2020. However, we caution investors not to expect the outsized gains of the past year. If the post-World War II era is to be a guide, the S&P 500 has on average generated mid-single-digit returns in the fourth year of a presidential cycle.
Further market advances will likely hinge on a resumption in earnings growth, which stalled in 2019, and there is no shortage of global risks in the year ahead. Unresolved trade issues, tensions in the Middle East, and policy debates on taxes, health care, and wealth disparity leading up to the U.S. presidential election all have the potential to cause market volatility.
In addition to these risks, T. Rowe Price analysts will be closely following how disruptive forces such as innovation, technological change, and automation could impact a growing number of global industries. In an uncertain environment, with a wide dispersion of returns possible, we believe that in-depth fundamental research that integrates environmental, social, and governance considerations will be critical to successfully assess opportunities and risks. I am confident our strategic investing approach will continue to serve our shareholders well.
Thank you for your continued confidence in T. Rowe Price.
Sincerely,

Robert Sharps
Group Chief Investment Officer
Management’s Discussion of Fund Performance
INVESTMENT OBJECTIVE
The fund seeks long-term capital appreciation.
FUND COMMENTARY
How did the fund perform in the past 12 months?
The Health Sciences Fund returned 29.11% in the 12-month period ended December 31, 2019. The fund outperformed its benchmark, the Lipper Health/ Biotechnology Funds Index, but underperformed the S&P 500 Index. (Returns for I Class shares varied slightly, reflecting their different fee structure.Past performance cannot guarantee future results.)
What factors influenced the fund’s performance?
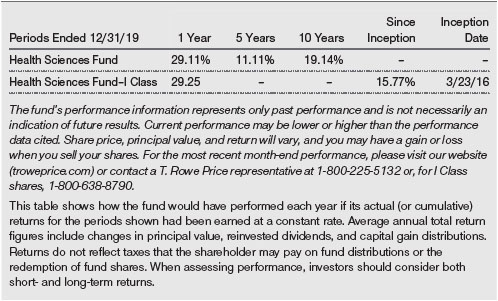
Health care stocks surged, ebbed, and surged again within a volatile year as strong gains in the first half of the year gave way to a sharp sell-off in the September quarter and a subsequent strong fourth-quarter rally. With healthcare likely to be one of the principal topics of debate in the upcoming U.S. election cycle, we think the sector’s volatile performance is likely to persist. While performance could be somewhat challenged in the near term due to macro headwinds, we believe the focus on fundamentals and stock picking will continue to be the primary drivers of the portfolio’s long-term outperformance as shown in the Average Annual Compound Total Return table on page 11.
Every subsector in the benchmark, the Lipper Health/Biotechnology Funds Index, generated gains of more than 20% over the 12-month period, led by the biotechnology and life sciences segments, which both generated returns of roughly 35%. Overall, stock selection drove relative outperformance, while allocation decisions modestly added value.
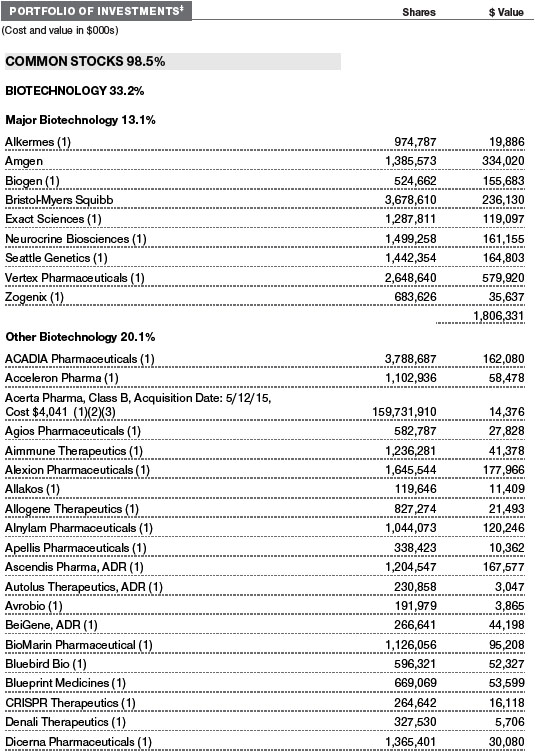
At the subsector level, biotechnology contributed the most to relative results thanks to stock selection.Kodiak Scienceswas among the strongest performers. The company is focused on the development of novel biologics for the treatment of chronic, highly prevalent retinal diseases such as wetage-related macular degeneration, retinal vein occlusion, and diabetic macular edema. The shares traded sharply higher in December after the company announced a royalty sale on KSI-301, the firm’s biopolymer therapy. Preliminary efficacy and safety data presented for the drug have been highly encouraging thus far, and the deal removes a financing overhang for costs associated with funding large registration-enabling clinical trials. (Please refer to the fund’s portfolio of investments for a complete list of holdings and the amount each represents in the portfolio.)
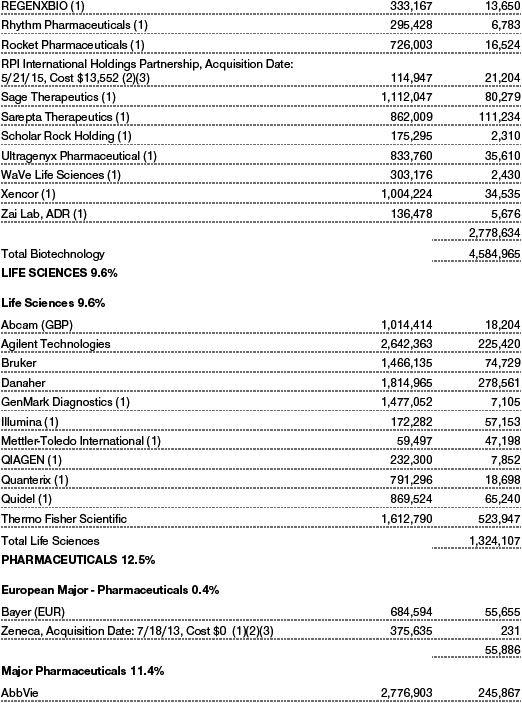
Life sciences was another area of relative strength as stock selection and an overweight allocation to the group both added value. Our position inThermo Fisher Scientific, one of the most vertically integrated companies in the life sciences tools industry, contributed to relative gains. Shares moved higher throughout the period as the company benefited from steady growth in biopharma spending, stable demand from academic and government customers, and recent acquisitions that helped expand its product offerings. We continue to like the company for its industry-leading position and strong execution, as well as management’s history of strong capital deployment decisions.
Longtime holdingDanaherwas also a top contributor. The shares rallied following the February announcement that it was acquiring GE’s biopharma unit. While Danaher is highly diversified in many growth areas, we believe the acquisition will provide it with a robust innovation pipeline and favorable exposure to specific therapeutic assets and programs.
The pharmaceuticals segment modestly detracted from relative performance as the positive contributions from stock selection were more than offset by the portfolio’s average overweight allocation to what was the worst-performing health care segment. Shares ofPfizerdeclined after it announced plans to buy generic pharmaceutical companyMylanin late July and combine it with its own off-patent branded and generics business, Upjohn. We subsequently eliminated our position in Pfizer.
How is the fund positioned?
We devote most of our efforts to identifying companies that are developing new and innovative medicines or treatments for unmet medical needs. We attempt to maintain broad industry diversification across the entire health care sector. However, we do not attempt to mirror the benchmark’s allocations. The portfolio’s large allocations to the biotechnology and pharmaceuticals segmentsstem from our belief that the discovery, development, manufacture, and commercialization of innovative, game-changing medicines are the primary drivers of long-term value in the health care sector.
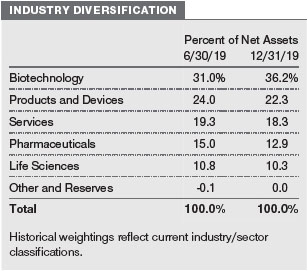
Biotechnology represents our largest allocation within the portfolio. We believe that many of the best investments in health care will come from therapeutics companies producing medicines that prevent disease, relieve symptoms, and provide cures. Our biotechnology holdings generally lean toward the smaller side of the capitalization spectrum, as smaller companies tend to benefit more from successful product launches than larger,mature companies. While this approach can increase volatility at the individual stock level due to the binary nature of clinical drug trials, we seek to manage this risk by limiting position sizes. As potential therapies successfully clear clinical hurdles, we may increase our positions as the risks decline.
Broadly speaking, life sciences companies make analytical tools and other equipment, along with a range of clinical and research services. Although it is the smallest subsector in both the portfolio and our benchmark, the life sciences group represents our largest overweight. Within the segment, we have core positions in Thermo Fisher Scientific and Danaher.
We have an underweight exposure to the services sector, which is a broad category that includes payers, providers, drug distributors, and health care information technology companies. We trimmed our exposure to managed care companies, such asUnitedHealth Group,Anthem, andCigna, earlier in the year given the prospects for heightened political rhetoric around health care reform and have largely avoided drug distributors, which has driven our underweight allocation to the group.
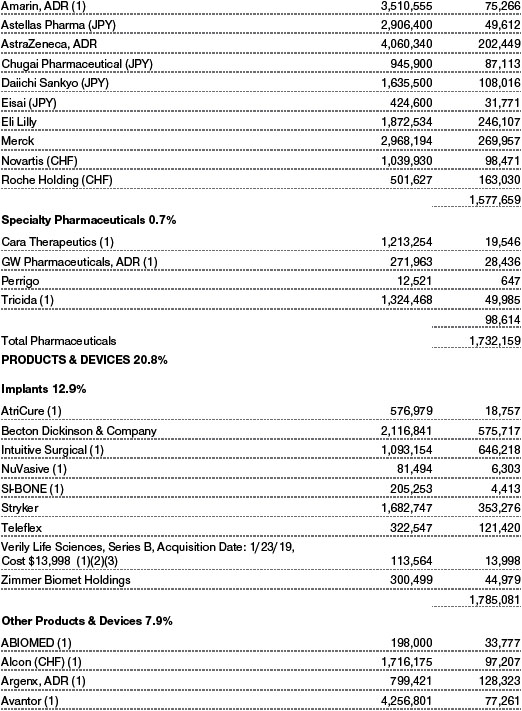
We were active with our positioning within the pharmaceuticals sector during the period and ended the year with a modest underweight position relative to the benchmark. As is the case with biotechnology, we generally favor pharmaceutical companies that are developing novel therapeutics. Our topposition within the subsector isMerck, a name that we added to over the period. We think the company has a strong position in lung cancer and other tumor types with its Keytruda asset, and we like the growth profile for Gardasil, a vaccine for use in the prevention of HPV infection. Merck also has top-tier vaccines and animal health businesses and a solid balance sheet that provides capital allocation optionality.
What is portfolio management’s outlook?
We continue to have a favorable long-term view on the health care sector given the secular tailwinds related to aging populations, increasing demand for clinical procedures, and accelerating innovation on both the drug front as well as within medical devices. However, we also expect that the space will remain somewhat volatile leading up to the U.S. elections as political rhetoric surrounding the sector and perceived regulatory and legislative risks are likely to rise.
We saw a resurgence in acquisition activity within the biotechnology sector in the second half of 2019, and we think there is room for that to continue into 2020. While valuations for smaller-cap therapeutic companies have risen, several larger biotechnology and pharmaceutical companies with strong balance sheets and access to cheap capital are looking to replenish their pipelines and improve their growth profiles. Innovation on the drug discovery front also remains strong, and we expect advancement in the science of medicine to persist. Even though concerns about disruptive drug pricing reform have largely abated, at least for the time being, they remain a potential headwind for the sector.
Similarly, we have seen the political rhetoric around “Medicare for All” recede as Democratic presidential candidates have largely acknowledged the enormous political hurdles to passing major health care reform, particularly in its most extreme form. Health care stocks have been highly sensitive to swings in polling, and we recognize that we are still early in the election cycle and that much can change between now and November.
As a result, areas such as life sciences (which should continue to benefit from the ongoing innovation that is occurring in both academia and the biopharma industry) and products and devices (which is generally less prone to pricing pressure than drug manufacturers) remain prominent within the portfolio. These areas have historically outperformed both the S&P 500 and the broader health care market in election years, and the names we own have specific growth drivers behind them.
Our mandate calls for maintaining broad diversification across the health care investment landscape. Therefore, we continue to emphasize companies with highly innovative medical therapies and businesses in the health care services areas that provide quality outcomes in a cost-effective manner. While we may see periods of increasing volatility and uncertainty in the near term, we think our emphasis on taking a longer-term view and identifying investment ideas through fundamental, bottom-up research should continue to add value for our clients.
The views expressed reflect the opinions of T. Rowe Price as of the date of this report and are subject to change based on changes in market, economic, or other conditions. These views are not intended to be a forecast of future events and are no guarantee of future results.
RISKS OF GROWTH INVESTING
Growth stocks can be volatile for several reasons. Since these companies usually invest a high portion of earnings in their businesses, they may lack the dividends of value stocks that can cushion stock prices in a falling market. Also, earnings disappointments often lead to sharply falling prices because investors buy growth stocks in anticipation of superior earnings growth.
RISKS OF HEALTH SCIENCES FUND INVESTING
Funds that invest only in specific industries will experience greater volatility than funds investing in a broad range of industries. Companies in the health sciences field are subject to special risks, such as increased competition within the health care industry, changes in legislation or government regulations, reductions in government funding, product liability or other litigation, and the obsolescence of popular products.
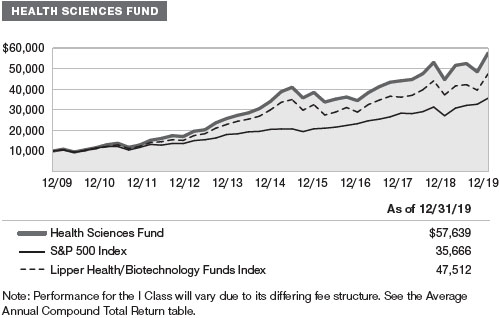
GROWTH OF $10,000
This chart shows the value of a hypothetical $10,000 investment in the fund over the past 10 fiscal year periods or since inception (for funds lacking 10-year records). The result is compared with benchmarks, which include a broad-based market index and may also include a peer group average or index. Market indexes do not include expenses, which are deducted from fund returns as well as mutual fund averages and indexes.
AVERAGE ANNUAL COMPOUND TOTAL RETURN
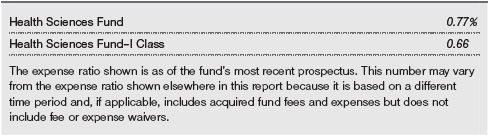
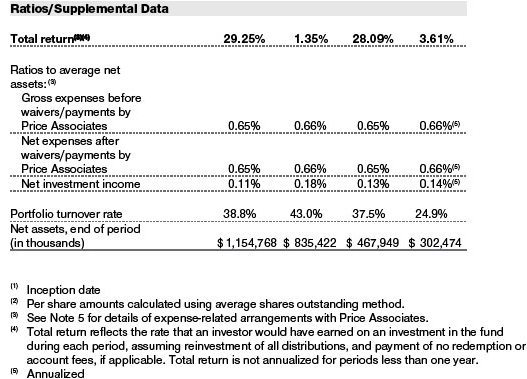
EXPENSE RATIO
FUND EXPENSE EXAMPLE
As a mutual fund shareholder, you may incur two types of costs: (1) transaction costs, such as redemption fees or sales loads, and (2) ongoing costs, including management fees, distribution and service (12b-1) fees, and other fund expenses. The following example is intended to help you understand your ongoing costs (in dollars) of investing in the fund and to compare these costs with the ongoing costs of investing in other mutual funds. The example is based on an investment of $1,000 invested at the beginning of the most recent six-month period and held for the entire period.
Please note that the fund has two share classes: The original share class (Investor Class) charges no distribution and service (12b-1) fee, and the I Class shares are also available to institutionally oriented clients and impose no 12b-1 or administrative fee payment. Each share class is presented separately in the table.
Actual Expenses
The first line of the following table (Actual) provides information about actual account values and expenses based on the fund’s actual returns. You may use the information on this line, together with your account balance, to estimate the expenses that you paid over the period. Simply divide your account value by $1,000 (for example, an $8,600 account value divided by $1,000 = 8.6), then multiply the result by the number on the first line under the heading “Expenses Paid During Period” to estimate the expenses you paid on your account during this period.
Hypothetical Example for Comparison Purposes
The information on the second line of the table (Hypothetical) is based on hypothetical account values and expenses derived from the fund’s actual expense ratio and an assumed 5% per year rate of return before expenses (not the fund’s actual return). You may compare the ongoing costs of investing in the fund with other funds by contrasting this 5% hypothetical example and the 5% hypothetical examples that appear in the shareholder reports of the other funds. The hypothetical account values and expenses may not be used to estimate the actual ending account balance or expenses you paid for the period.
Note:T. Rowe Price charges an annual account service fee of $20, generally for accounts with less than $10,000. The fee is waived for any investor whose T. Rowe Price mutual fund accounts total $50,000 or more; accounts electing to receive electronic delivery of account statements, transaction confirmations, prospectuses, and shareholder reports; or accounts of an investor who is a T. Rowe Price Personal Services or Enhanced Personal Services client (enrollment in these programs generally requires T. Rowe Price assets of at least $250,000). This fee is not included in the accompanying table. If you are subject to the fee, keep it in mind when you are estimating the ongoing expenses of investing in the fund and when comparing the expenses of this fund with other funds.
You should also be aware that the expenses shown in the table highlight only your ongoing costs and do not reflect any transaction costs, such as redemption fees or sales loads. Therefore, the second line of the table is useful in comparing ongoing costs only and will not help you determine the relative total costs of owning different funds. To the extent a fund charges transaction costs, however, the total cost of owning that fund is higher.

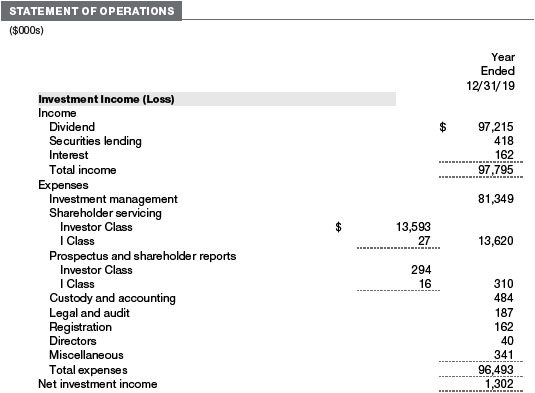
The accompanying notes are an integral part of these financial statements.
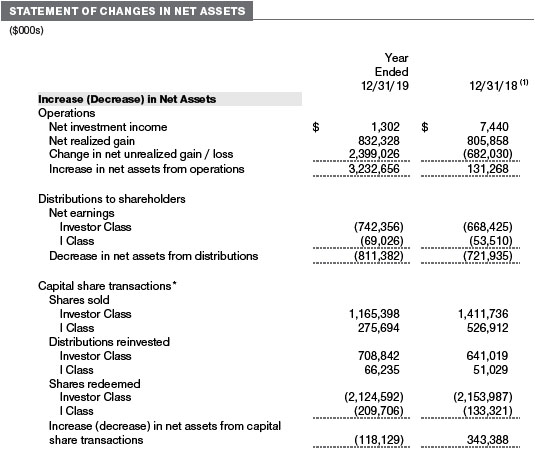
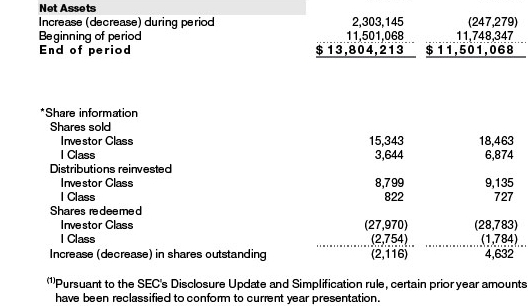
The accompanying notes are an integral part of these financial statements.


The accompanying notes are an integral part of these financial statements.
The accompanying notes are an integral part of these financial statements.
The accompanying notes are an integral part of these financial statements.
The accompanying notes are an integral part of these financial statements.
| NOTES TO FINANCIAL STATEMENTS |
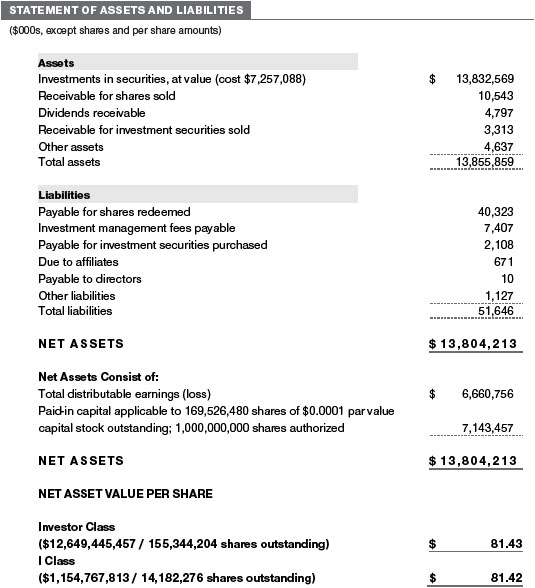
T. Rowe Price Health Sciences Fund, Inc. (the fund) is registered under the Investment Company Act of 1940 (the 1940 Act) as a nondiversified, open-end management investment company. The fund seeks long-term capital appreciation. The fund has two classes of shares: the Health Sciences Fund (Investor Class) and the Health Sciences Fund–I Class (I Class). I Class shares require a $1 million initial investment minimum, although the minimum generally is waived for retirement plans, financial intermediaries, and certain other accounts. Each class has exclusive voting rights on matters related solely to that class; separate voting rights on matters that relate to both classes; and, in all other respects, the same rights and obligations as the other class.
NOTE 1 - SIGNIFICANT ACCOUNTING POLICIES
Basis of PreparationThe fund is an investment company and follows accounting and reporting guidance in the Financial Accounting Standards Board (FASB)Accounting Standards Codification Topic 946 (ASC 946). The accompanying financial statements were prepared in accordance with accounting principles generally accepted in the United States of America (GAAP), including, but not limited to, ASC 946. GAAP requires the use of estimates made by management. Management believes that estimates and valuations are appropriate; however, actual results may differ from those estimates, and the valuations reflected in the accompanying financial statements may differ from the value ultimately realized upon sale or maturity. Certain prior year amounts in the accompanying financial statements and financial highlights have been restated to conform to current year presentation.
Investment Transactions, Investment Income, and DistributionsInvestment transactions are accounted for on the trade date basis. Income and expenses are recorded on the accrual basis. Realized gains and losses are reported on the identified cost basis. Income tax-related interest and penalties, if incurred, are recorded as income tax expense. Dividends received from mutual fund investments are reflected as dividend income; capital gain distributions are reflected as realized gain/loss. Dividend income and capital gain distributions are recorded on the ex-dividend date. Non-cash dividends, if any, are recorded at the fair market value of the asset received. Distributions to shareholders are recorded on the ex-dividend date. Income distributions, if any, are declared and paid by each class annually. A capital gain distribution may also be declared and paid by the fund annually.
Currency TranslationAssets, including investments, and liabilities denominated in foreign currencies are translated into U.S. dollar values each day at the prevailing exchange rate, using the mean of the bid and asked prices of such currencies against U.S. dollars as quoted by a major bank. Purchases and sales of securities, income, and expenses are translated into U.S. dollars at the prevailing exchange rate on the respective date of such transaction. The effect of changes in foreign currency exchange rates on realized and unrealized security gains and losses is not bifurcated from the portion attributable to changes in market prices.
Class AccountingShareholder servicing, prospectus, and shareholder report expenses incurred by each class are charged directly to the class to which they relate. Expenses common to both classes, investment income, and realized and unrealized gains and losses are allocated to the classes based upon the relative daily net assets of each class.
New Accounting GuidanceEffective January 1, 2019, the fund adopted FASB guidance that shortened the amortization period for certain callable debt securities held at a premium. Adoption had no effect on the fund’s net assets or results of operations.
IndemnificationIn the normal course of business, the fund may provide indemnification in connection with its officers and directors, service providers, and/or private company investments. The fund’s maximum exposure under these arrangements is unknown; however, the risk of material loss is currently considered to be remote.
NOTE 2 - VALUATION
The fund’s financial instruments are valued and each class’s net asset value (NAV) per share is computed at the close of the New York Stock Exchange (NYSE), normally 4 p.m. ET, each day the NYSE is open for business. However, the NAV per share may be calculated at a time other than the normal close of the NYSE if trading on the NYSE is restricted, if the NYSE closes earlier, or as may be permitted by the SEC.
Fair ValueThe fund’s financial instruments are reported at fair value, which GAAP defines as the price that would be received to sell an asset or paid to transfer a liability in an orderly transaction between market participants at the measurement date. The T. Rowe Price Valuation Committee (the Valuation Committee) is an internal committee that has been delegated certain responsibilities by the fund’s Board of Directors (the Board) to ensure that financial instruments are appropriately priced at fair value in accordance with GAAP and the 1940 Act. Subject to oversight by the Board, the Valuation Committee develops and oversees pricing-related policies and procedures and approves all fair value determinations. Specifically, the Valuation Committeeestablishes procedures to value securities; determines pricing techniques, sources, and persons eligible to effect fair value pricing actions; oversees the selection, services, and performance of pricing vendors; oversees valuation-related business continuity practices; and provides guidance on internal controls and valuation-related matters. The Valuation Committee reports to the Board and has representation from legal, portfolio management and trading, operations, risk management, and the fund’s treasurer.
Various valuation techniques and inputs are used to determine the fair value of financial instruments. GAAP establishes the following fair value hierarchy that categorizes the inputs used to measure fair value:
Level 1 – quoted prices (unadjusted) in active markets for identical financial instruments that the fund can access at the reporting date
Level 2 – inputs other than Level 1 quoted prices that are observable, either directly or indirectly (including, but not limited to, quoted prices for similar financial instruments in active markets, quoted prices for identical or similar financial instruments in inactive markets, interest rates and yield curves, implied volatilities, and credit spreads)
Level 3 – unobservable inputs
Observable inputs are developed using market data, such as publicly available information about actual events or transactions, and reflect the assumptions that market participants would use to price the financial instrument. Unobservable inputs are those for which market data are not available and are developed using the best information available about the assumptions that market participants would use to price the financial instrument. GAAP requires valuation techniques to maximize the use of relevant observable inputs and minimize the use of unobservable inputs. When multiple inputs are used to derive fair value, the financial instrument is assigned to the level within the fair value hierarchy based on the lowest-level input that is significant to the fair value of the financial instrument. Input levels are not necessarily an indication of the risk or liquidity associated with financial instruments at that level but rather the degree of judgment used in determining those values.
Valuation TechniquesEquity securities listed or regularly traded on a securities exchange or in the over-the-counter (OTC) market are valued at the last quoted sale price or, for certain markets, the official closing price at the time the valuations are made. OTC Bulletin Board securities are valued at the mean of the closing bid and asked prices. A security that is listed or traded on more than one exchange is valued at the quotation on the exchange determined to be the primary market for such security.
Listed securities not traded on a particular day are valued at the mean of the closing bid and asked prices for domestic securities and the last quoted sale or closing price for international securities.
For valuation purposes, the last quoted prices of non-U.S. equity securities may be adjusted to reflect the fair value of such securities at the close of the NYSE. If the fund determines that developments between the close of a foreign market and the close of the NYSE will affect the value of some or all of its portfolio securities, the fund will adjust the previous quoted prices to reflect what it believes to be the fair value of the securities as of the close of the NYSE. In deciding whether it is necessary to adjust quoted prices to reflect fair value, the fund reviews a variety of factors, including developments in foreign markets, the performance of U.S. securities markets, and the performance of instruments trading in U.S. markets that represent foreign securities and baskets of foreign securities. The fund may also fair value securities in other situations, such as when a particular foreign market is closed but the fund is open. The fund uses outside pricing services to provide it with quoted prices and information to evaluate or adjust those prices. The fund cannot predict how often it will use quoted prices and how often it will determine it necessary to adjust those prices to reflect fair value. As a means of evaluating its security valuation process, the fund routinely compares quoted prices, the next day’s opening prices in the same markets, and adjusted prices.
Actively traded equity securities listed on a domestic exchange generally are categorized in Level 1 of the fair value hierarchy. Non-U.S. equity securities generally are categorized in Level 2 of the fair value hierarchy despite the availability of quoted prices because, as described above, the fund evaluates and determines whether those quoted prices reflect fair value at the close of the NYSE or require adjustment. OTC Bulletin Board securities, certain preferred securities, and equity securities traded in inactive markets generally are categorized in Level 2 of the fair value hierarchy.
Investments in mutual funds are valued at the mutual fund’s closing NAV per share on the day of valuation and are categorized in Level 1 of the fair value hierarchy. Assets and liabilities other than financial instruments, including short-term receivables and payables, are carried at cost, or estimated realizable value, if less, which approximates fair value.
Thinly traded financial instruments and those for which the above valuation procedures are inappropriate or are deemed not to reflect fair value are stated at fair value as determined in good faith by the Valuation Committee. The objective of any fair value pricing determination is to arrive at a price that could reasonably be expected from a current sale. Financial instruments fair valued by the Valuation Committee are primarily private placements, restricted securities, warrants, rights, and other securities that are not publicly traded.
Subject to oversight by the Board, the Valuation Committee regularly makes good faith judgments to establish and adjust the fair valuations of certain securities as events occur and circumstances warrant. For instance, in determining the fair value of an equity investment with limited market activity, such as a private placement or a thinly traded public company stock, the Valuation Committee considers a variety of factors, which may include, but are not limited to, the issuer’s business prospects, its financial standing and performance, recent investment transactions in the issuer, new rounds of financing, negotiated transactions of significant size between other investors in the company, relevant market valuations of peer companies, strategic events affecting the company, market liquidity for the issuer, and general economic conditions and events. In consultation with the investment and pricing teams, the Valuation Committee will determine an appropriate valuation technique based on available information, which may include both observable and unobservable inputs. The Valuation Committee typically will afford greatest weight to actual prices in arm’s length transactions, to the extent they represent orderly transactions between market participants, transaction information can be reliably obtained, and prices are deemed representative of fair value. However, the Valuation Committee may also consider other valuation methods such as market-based valuation multiples; a discount or premium from market value of a similar, freely traded security of the same issuer; or some combination. Fair value determinations are reviewed on a regular basis and updated as information becomes available, including actual purchase and sale transactions of the issue. Because any fair value determination involves a significant amount of judgment, there is a degree of subjectivity inherent in such pricing decisions, and fair value prices determined by the Valuation Committee could differ from those of other market participants. Depending on the relative significance of unobservable inputs, including the valuation technique(s) used, fair valued securities may be categorized in Level 2 or 3 of the fair value hierarchy.
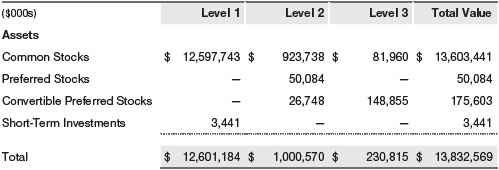
Valuation InputsThe following table summarizes the fund’s financial instruments, based on the inputs used to determine their fair values on December 31, 2019 (for further detail by category, please refer to the accompanying Portfolio of Investments):
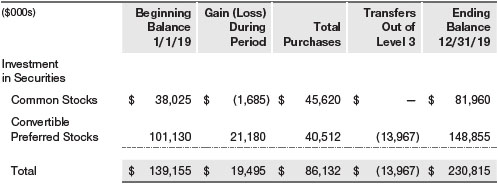
Following is a reconciliation of the fund’s Level 3 holdings for the year ended December 31, 2019. Gain (loss) reflects both realized and change in unrealized gain/ loss on Level 3 holdings during the period, if any, and is included on the accompanying Statement of Operations. The change in unrealized gain/loss on Level 3 instruments held at December 31, 2019, totaled $19,495,000 for the year ended December 31, 2019. During the year, transfers out of Level 3 were because observable market data became available for the security.
NOTE 3 - OTHER INVESTMENT TRANSACTIONS
Consistent with its investment objective, the fund engages in the following practices to manage exposure to certain risks and/or to enhance performance. The investment objective, policies, program, and risk factors of the fund are described more fully in the fund’s prospectus and Statement of Additional Information.
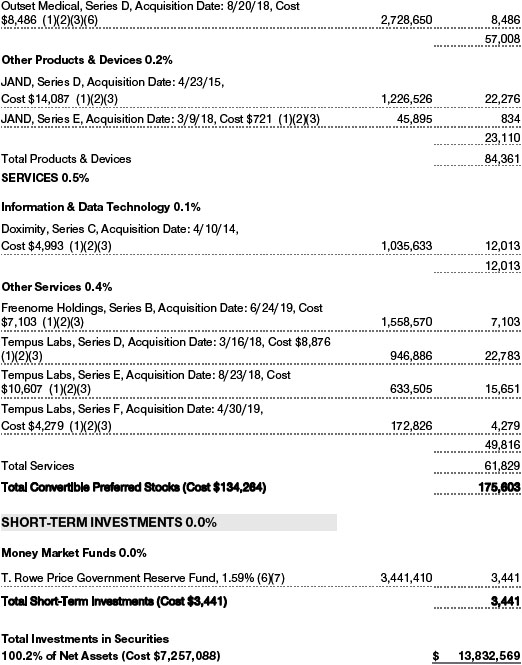
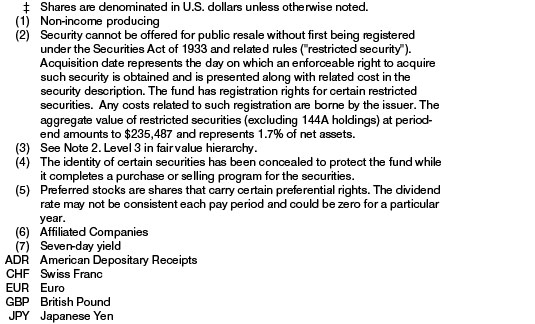
Restricted SecuritiesThe fund invests in securities that are subject to legal or contractual restrictions on resale. Prompt sale of such securities at an acceptable price may be difficult and may involve substantial delays and additional costs.
Securities LendingThe fund may lend its securities to approved borrowers to earn additional income. Its securities lending activities are administered by a lending agent in accordance with a securities lending agreement. Security loans generally do not have stated maturity dates, and the fund may recall a security at any time. The fund receives collateral in the form of cash or U.S. government securities. Collateral is maintained over the life of the loan in an amount not less than the value of loaned securities; any additional collateral required due to changes in security values is delivered to thefund the next business day. Cash collateral is invested in accordance with investment guidelines approved by fund management. Additionally, the lending agent indemnifies the fund against losses resulting from borrower default. Although risk is mitigated by the collateral and indemnification, the fund could experience a delay in recovering its securities and a possible loss of income or value if the borrower fails to return the securities, collateral investments decline in value, and the lending agent fails to perform. Securities lending revenue consists of earnings on invested collateral and borrowing fees, net of any rebates to the borrower, compensation to the lending agent, and other administrative costs. In accordance with GAAP, investments made with cash collateral are reflected in the accompanying financial statements, but collateral received in the form of securities is not. At December 31, 2019, there were no securities on loan.
OtherPurchases and sales of portfolio securities other than short-term securities aggregated $4,942,792,000 and $5,801,071,000, respectively, for the year ended December 31, 2019.
NOTE 4 - FEDERAL INCOME TAXES
No provision for federal income taxes is required since the fund intends to continue to qualify as a regulated investment company under Subchapter M of the Internal Revenue Code and distribute to shareholders all of its taxable income and gains. Distributions determined in accordance with federal income tax regulations may differ in amount or character from net investment income and realized gains for financial reporting purposes.
The fund files U.S. federal, state, and local tax returns as required. The fund’s tax returns are subject to examination by the relevant tax authorities until expiration of the applicable statute of limitations, which is generally three years after the filing of the tax return but which can be extended to six years in certain circumstances. Tax returns for open years have incorporated no uncertain tax positions that require a provision for income taxes.
Financial reporting records are adjusted for permanent book/tax differences to reflect tax character but are not adjusted for temporary differences.
The permanent book/tax adjustments have no impact on results of operations or net assets and relate primarily to a tax practice that treats a portion of the proceeds from each redemption of capital shares as a distribution of taxable net investment income or realized capital gain. For the year ended December 31, 2019, the following reclassification was recorded:
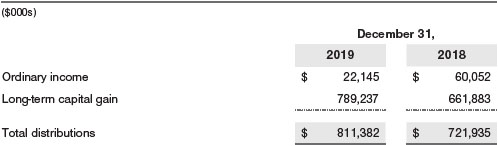
Distributions during the years ended December 31, 2019 and December 31, 2018, were characterized for tax purposes as follows:
At December 31, 2019, the tax-basis cost of investments and components of net assets were as follows:
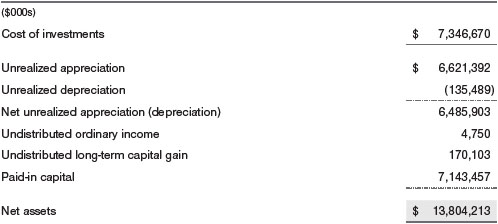
The difference between book-basis and tax-basis net unrealized appreciation (depreciation) is attributable to the deferral of losses from wash sales and the realization of gains/losses on passive foreign investment companies for tax purposes.
During the year ended December 31, 2019, the fund utilized $12,114,000 of capital loss carryforwards.
NOTE 5 - RELATED PARTY TRANSACTIONS
The fund is managed by T. Rowe Price Associates, Inc. (Price Associates), a wholly owned subsidiary of T. Rowe Price Group, Inc. (Price Group). The investment management agreement between the fund and Price Associates provides for an annual investment management fee, which is computed daily and paid monthly. The fee consists of an individual fund fee, equal to 0.35% of the fund’s average daily net assets, and a group fee. The group fee rate is calculated based on the combined net assets of certain mutual funds sponsored by Price Associates (the group) applied to a graduated fee schedule, with rates ranging from 0.48% for the first $1 billion of assets to 0.265% for assets in excess of $650 billion. The fund’s group fee is determined by applying the group fee rate to the fund’s average daily net assets. The fee is computed daily and paid monthly. At December 31, 2019, the effective annual group fee rate was 0.29%.
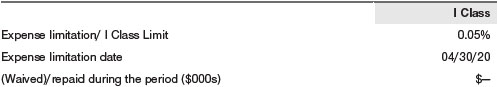
The I Class is subject to an operating expense limitation (I Class Limit) pursuant to which Price Associates is contractually required to pay all operating expenses of the I Class, excluding management fees; interest; expenses related to borrowings, taxes, and brokerage; and other non-recurring expenses permitted by the investment management agreement, to the extent such operating expenses, on an annualized basis, exceed the I Class Limit. This agreement will continue through the expense limitation date indicated in the table below, and may be renewed, revised, or revoked only with approval of the fund’s Board. The I Class is required to repay Price Associates for expenses previously paid to the extent the class’s net assets grow or expenses decline sufficiently to allow repayment without causing the class’s operating expenses (after the repayment is taken into account) to exceed the lesser of: (1) the I Class Limit in place at the time such amounts were paid; or (2) the current I Class Limit. However, no repayment will be made more than three years after the date of a payment or waiver.
In addition, the fund has entered into service agreements with Price Associates and two wholly owned subsidiaries of Price Associates, each an affiliate of the fund (collectively, Price). Price Associates provides certain accounting and administrative services to the fund. T. Rowe Price Services, Inc. provides shareholder and administrative services in its capacity as the fund’s transfer and dividend-disbursing agent. T. Rowe Price Retirement Plan Services, Inc. provides subaccounting and recordkeeping services for certain retirement accounts invested in the Investor Class. For the year ended December 31, 2019, expenses incurred pursuant to these service agreements were $70,000 for Price Associates; $4,254,000 for T. Rowe Price Services, Inc.; and $586,000 for T. Rowe Price Retirement Plan Services, Inc. All amounts due to and due from Price, exclusive of investment management fees payable, are presented net on the accompanying Statement of Assets and Liabilities.
Additionally, the fund is one of several mutual funds in which certain college savings plans managed by Price Associates may invest. As approved by the fund’s Board of Directors, shareholder servicing costs associated with each college savings plan are borne by the fund in proportion to the average daily value of its shares owned by the college savings plan. For the year ended December 31, 2019, the fund was charged $81,000 for shareholder servicing costs related to the college savings plans, of which $51,000 was for services provided by Price. All amounts due to and due from Price, exclusive of investment management fees payable, are presented net on the accompanying Statement of Assets and Liabilities. At December 31, 2019, less than 1% of the outstanding shares of the Investor Class were held by college savings plans.
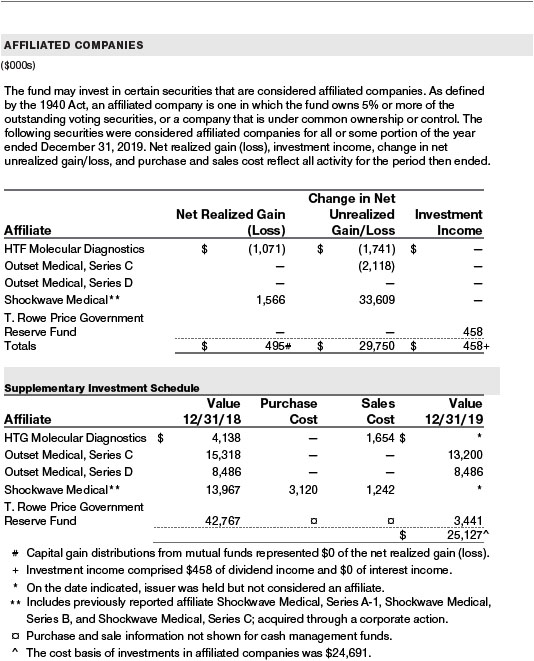
The fund may invest its cash reserves in certain open-end management investment companies managed by Price Associates and considered affiliates of the fund: the T. Rowe Price Government Reserve Fund or the T. Rowe Price Treasury Reserve Fund, organized as money market funds, or the T. Rowe Price Short-Term Fund, a short-term bond fund (collectively, the Price Reserve Funds). The Price Reserve Funds are offered as short-term investment options to mutual funds, trusts, and other accounts managed by Price Associates or its affiliates and are not available for direct purchase by members of the public. Cash collateral from securities lending is invested in the T. Rowe Price Short-Term Fund. The Price Reserve Funds pay no investment management fees.
The fund may participate in securities purchase and sale transactions with other funds or accounts advised by Price Associates (cross trades), in accordance with procedures adopted by the fund’s Board and Securities and Exchange Commission rules, which require, among other things, that such purchase and sale cross trades be effected at the independent current market price of the security. During the year ended December 31, 2019, the fund had no purchases or sales cross trades with other funds or accounts advised by Price Associates.
REPORT OF INDEPENDENT REGISTERED PUBLIC ACCOUNTING FIRM
To the Board of Directors and Shareholders of T. Rowe Price Health Sciences
Fund, Inc.
Opinion on the Financial Statements
We have audited the accompanying statement of assets and liabilities, including the portfolio of investments, of T. Rowe Price Health Sciences Fund, Inc. (the “Fund”) as of December 31, 2019, the related statement of operations for the year ended December 31, 2019, the statement of changes in net assets for each of the two years in the period ended December 31, 2019, including the related notes, and the financial highlights for each of the periods indicated therein (collectively referred to as the “financial statements”). In our opinion, the financial statements present fairly, in all material respects, the financial position of the Fund as of December 31, 2019, the results of its operations for the year then ended, the changes in its net assets for each of the two years in the period ended December 31, 2019 and the financial highlights for each of the periods indicated therein, in conformity with accounting principles generally accepted in the United States of America.
Basis for Opinion
These financial statements are the responsibility of the Fund’s management. Our responsibility is to express an opinion on the Fund’s financial statements based on our audits. We are a public accounting firm registered with the Public Company Accounting Oversight Board (United States) (PCAOB) and are required to be independent with respect to the Fund in accordance with the U.S. federal securities laws and the applicable rules and regulations of the Securities and Exchange Commission and the PCAOB.
We conducted our audits of these financial statements in accordance with the standards of the PCAOB. Those standards require that we plan and perform the audit to obtain reasonable assurance about whether the financial statements are free of material misstatement, whether due to error or fraud.
Our audits included performing procedures to assess the risks of material misstatement of the financial statements, whether due to error or fraud, and performing procedures that respond to those risks. Such procedures included examining, on a test basis, evidence regarding the amounts and disclosures in the financial statements. Our audits also included evaluating the accounting principles used and significant estimates made by management, as well as evaluating the overall presentation of the financial statements. Our procedures included confirmation of securities owned as of December 31, 2019 by correspondence with the custodians, transfer agent and brokers; when replies were not received from brokers, we performed other auditing procedures. We believe that our audits provide a reasonable basis for our opinion.
PricewaterhouseCoopers LLP
Baltimore, Maryland
February 14, 2020
We have served as the auditor of one or more investment companies in the T. Rowe Price group of investment companies since 1973.
TAX INFORMATION (UNAUDITED) FOR THE TAX YEAR ENDED 12/31/19
We are providing this information as required by the Internal Revenue Code. The amounts shown may differ from those elsewhere in this report because of differences between tax and financial reporting requirements.
The fund’s distributions to shareholders included
| ■ | $13,390,000 from short-term capital gains. |
| ■ | $839,846,000 from long-term capital gains, subject to long-term capital gains tax rate of not greater than 20%. |
For taxable non-corporate shareholders, $8,449,000 of the fund’s income represents qualified dividend income subject to long-term capital gains tax rate of not greater than 20%.
For corporate shareholders, $8,449,000 of the fund’s income qualifies for the dividends-received deduction.
INFORMATION ON PROXY VOTING POLICIES, PROCEDURES, AND RECORDS
A description of the policies and procedures used by T. Rowe Price funds and portfolios to determine how to vote proxies relating to portfolio securities is available in each fund’s Statement of Additional Information. You may request this document by calling 1-800-225-5132 or by accessing the SEC’s website, sec.gov.
The description of our proxy voting policies and procedures is also available on our corporate website. To access it, please visit the following Web page:
https://www.troweprice.com/corporate/en/utility/policies.html
Scroll down to the section near the bottom of the page that says, “Proxy Voting Policies.” Click on the Proxy Voting Policies link in the shaded box.
Each fund’s most recent annual proxy voting record is available on our website and through the SEC’s website. To access it through T. Rowe Price, visit the website location shown above, and scroll down to the section near the bottom of the page that says, “Proxy Voting Records.” Click on the Proxy Voting Records link in the shaded box.
HOW TO OBTAIN QUARTERLY PORTFOLIO HOLDINGS
Effective for reporting periods on or after March 1, 2019, a fund, except a money market fund, files a complete schedule of portfolio holdings with the Securities and Exchange Commission (SEC) for the first and third quarters of each fiscal year as an exhibit to its reports on Form N-PORT. Prior to March 1, 2019, a fund, including a money market fund, filed a complete schedule of portfolio holdings with the SEC for the first and third quarters of each fiscal year on Form N-Q. A money market fund files detailed month-end portfolio holdings information on Form N-MFP with the SEC each month and posts a complete schedule of portfolio holdings on its website (troweprice.com) as of each month-end for the previous six months. A fund’s Forms N-PORT, N-MFP, and N-Q are available electronically on the SEC’s website (sec.gov).
ABOUT THE FUND’S DIRECTORS AND OFFICERS
Your fund is overseen by a Board of Directors (Board) that meets regularly to review a wide variety of matters affecting or potentially affecting the fund, including performance, investment programs, compliance matters, advisory fees and expenses, service providers, and business and regulatory affairs. The Board elects the fund’s officers, who are listed in the final table. At least 75% of the Board’s members are independent of the Boards of T. Rowe Price Associates, Inc. (T. Rowe Price), and its affiliates; “inside” or “interested” directors are employees or officers of T. Rowe Price. The business address of each director and officer is 100 East Pratt Street, Baltimore, Maryland 21202. The Statement of Additional Information includes additional information about the fund directors and is available without charge by calling a T. Rowe Price representative at 1-800-638-5660.
| INDEPENDENT DIRECTORS(a) | ||
| Name (Year of Birth) Year Elected [Number of T. Rowe Price Portfolios Overseen] | Principal Occupation(s) and Directorships of Public Companies and Other Investment Companies During the Past Five Years | |
| Teresa Bryce Bazemore (1959) 2018 [189] | President, Radian Guaranty (2008 to 2017); Chief Executive Officer, Bazemore Consulting LLC (2018 to present); Director, Chimera Investment Corporation (2017 to present); Director, Federal Home Loan Bank of Pittsburgh (2017 to present) | |
| Ronald J. Daniels (1959) 2018 [189] | President, The Johns Hopkins University(b)and Professor, Political Science Department, The Johns Hopkins University (2009 to present); Director, Lyndhurst Holdings (2015 to present) | |
| Bruce W. Duncan (1951) 2013 [189] | Chief Executive Officer and Director (January 2009 to December 2016), Chairman of the Board (January 2016 to present), and President (January 2009 to September 2016), First Industrial Realty Trust, an owner and operator of industrial properties; Chairman of the Board (2005 to September 2016) and Director (1999 to September 2016), Starwood Hotels & Resorts, a hotel and leisure company; Member, Investment Company Institute Board of Governors (2017 to present); Member, Independent Directors Council Governing Board (2017 to present); Senior Advisor, KKR (November 2018 to present); Director, Boston Properties (May 2016 to present); Director, Marriott International, Inc. (September 2016 to present) | |
| Robert J. Gerrard, Jr. (1952) 2012 [189] | Advisory Board Member, Pipeline Crisis/Winning Strategies, a collaborative working to improve opportunities for young African Americans (1997 to January 2016); Chairman of the Board, all funds (July 2018 to present) | |
| Paul F. McBride (1956) 2013 [189] | Advisory Board Member, Vizzia Technologies (2015 to present); Board Member, Dunbar Armored (2012 to 2018) | |
| Cecilia E. Rouse, Ph.D. (1963) 2012 [189] | Dean, Woodrow Wilson School (2012 to present); Professor and Researcher, Princeton University (1992 to present); Director, MDRC, a nonprofit education and social policy research organization (2011 to present); Member, National Academy of Education (2010 to present); Research Associate of Labor Studies Program at the National Bureau of Economic Research (2011 to 2015); Board Member, National Bureau of Economic Research (2011 to present); Chair of Committee on the Status of Minority Groups in the Economic Profession of the American Economic Association (2012 to 2018); Vice President (2015 to 2016) and Board Member, American Economic Association (2018 to present) | |
| John G. Schreiber (1946) 2001 [189] | Owner/President, Centaur Capital Partners, Inc., a real estate investment company (1991 to present); Cofounder, Partner, and Cochairman of the Investment Committee, Blackstone Real Estate Advisors, L.P. (1992 to 2015); Director, Blackstone Mortgage Trust, a real estate finance company (2012 to 2016); Director and Chairman of the Board, Brixmor Property Group, Inc. (2013 to present); Director, Hilton Worldwide (2007 to present); Director, Hudson Pacific Properties (2014 to 2016); Director, Invitation Homes (2014 to 2017); Director, JMB Realty Corporation (1980 to present) | |
| Mark R. Tercek(c) (1957) 2009 [0] | President and Chief Executive Officer, The Nature Conservancy (2008 to present) | |
| (a) All information about the independent directors was current as of February 19, 2019, unless otherwise indicated, except for the number of portfolios overseen, which is current as of the date of this report. | ||
| (b) William J. Stromberg, president and chief executive officer of T. Rowe Price Group, Inc., the parent company of the Price Funds’ investment advisor, has served on the Board of Trustees of Johns Hopkins University since 2014 and is a member of the Johns Hopkins University Board’s Compensation Committee. | ||
| (c) Effective February 15, 2019, Mr. Tercek resigned from his role as independent director of the Price Funds. | ||
| INSIDE DIRECTORS | ||
| Name (Year of Birth) Year Elected* [Number of T. Rowe Price Portfolios Overseen] | Principal Occupation(s) and Directorships of Public Companies and Other Investment Companies During the Past Five Years | |
| David Oestreicher (1967) 2018 [189] | Chief Legal Officer, Vice President, and Secretary, T. Rowe Price Group, Inc.; Director, Vice President, and Secretary, T. Rowe Price Investment Services, Inc., T. Rowe Price Retirement Plan Services, Inc., T. Rowe Price Services, Inc., and T. Rowe Price Trust Company; Vice President and Secretary, T. Rowe Price, T. Rowe Price Hong Kong (Price Hong Kong), and T. Rowe Price International; Vice President, T. Rowe Price Japan (Price Japan) and T. Rowe Price Singapore (Price Singapore); Principal Executive Officer and Executive Vice President, all funds | |
| Robert W. Sharps, CFA, CPA** (1971) 2017 [189] | Director and Vice President, T. Rowe Price; Vice President, T. Rowe Price Group, Inc., and T. Rowe Price Trust Company | |
| *Each inside director serves until retirement, resignation, or election of a successor. | ||
| **Mr. Sharps replaced Edward A. Wiese as director of the domestic fixed income Price Funds effective January 1, 2019. | ||
| OFFICERS | ||
| Name (Year of Birth) Position Held With Health Sciences Fund | Principal Occupation(s) | |
| Ziad Bakri, M.D., CFA (1980) President | Vice President, T. Rowe Price and T. Rowe Price Group, Inc. | |
| Darrell N. Braman (1963) Vice President and Secretary | Vice President, Price Hong Kong, Price Singapore, T. Rowe Price, T. Rowe Price Group, Inc., T. Rowe Price International, T. Rowe Price Retirement Plan Services, Inc., and T. Rowe Price Services, Inc. | |
| Anne Daub (1973) Vice President | Vice President, T. Rowe Price; formerly, Senior Analyst, Soros Fund Management LLC (to 2018); Senior Analyst, Citadel LLC (to 2017); Senior Analyst, Visium Asset Management LP (2016) | |
| Alan S. Dupski, CPA (1982) Assistant Treasurer | Vice President, T. Rowe Price and T. Rowe Price Group, Inc. | |
| Melissa C. Gallagher (1974) Vice President | Vice President, T. Rowe Price Group, Inc., and T. Rowe Price International | |
| John R. Gilner (1961) Chief Compliance Officer | Chief Compliance Officer and Vice President, T. Rowe Price; Vice President, T. Rowe Price Group, Inc., and T. Rowe Price Investment Services, Inc. | |
| Gary J. Greb (1961) Vice President | Vice President, T. Rowe Price, T. Rowe Price International, and T. Rowe Price Trust Company | |
| John Hall (1977) Vice President | Vice President, T. Rowe Price | |
| Jeffrey Holford, Ph.D., ACA (1972) Vice President | Vice President, T. Rowe Price and T. Rowe Price Group, Inc.; formerly, Managing Director, Jeffries Financial Group (to 2018) | |
| Rachel D. Jonas (1983) Vice President | Vice President, T. Rowe Price and T. Rowe Price Group, Inc.; formerly, Analyst, Sands Capital Management (to 2016) | |
| Paul J. Krug, CPA (1964) Vice President | Vice President, T. Rowe Price, T. Rowe Price Group, Inc., and T. Rowe Price Trust Company | |
| Catherine D. Mathews (1963) Principal Financial Officer, Vice President, and Treasurer | Vice President, T. Rowe Price, T. Rowe Price Group, Inc., and T. Rowe Price Trust Company | |
| Adam Poussard (1984) Vice President | Vice President, T. Rowe Price and T. Rowe Price Group, Inc. | |
| John W. Ratzesberger (1975) Vice President | Vice President, T. Rowe Price, T. Rowe Price Group, Inc., and T. Rowe Price Trust Company | |
| Shannon H. Rauser (1987) Assistant Secretary | Assistant Vice President, T. Rowe Price | |
| Taymour R. Tamaddon, CFA (1976) Vice President | Vice President, T. Rowe Price, T. Rowe Price Group, Inc., and T. Rowe Price Trust Company | |
| Megan Warren (1968) Vice President | Vice President, T. Rowe Price, T. Rowe Price Group, Inc., T. Rowe Price Retirement Plan Services, Inc., T. Rowe Price Services, Inc., and T. Rowe Price Trust Company; formerly, Executive Director, JPMorgan Chase (to 2017) | |
| Jon D. Wood, CFA (1979) Vice President | Vice President, T. Rowe Price and T. Rowe Price Group, Inc. | |
| Rouven J. Wool-Lewis, Ph.D. (1973) Vice President | Vice President, T. Rowe Price and T. Rowe Price Group, Inc. | |
| Nina Xu (1987) Vice President | Employee, T. Rowe Price | |
| Unless otherwise noted, officers have been employees of T. Rowe Price or T. Rowe Price International for at least 5 years. | ||
Item 1. (b) Notice pursuant to Rule 30e-3.
Not applicable.
Item 2. Code of Ethics.
The registrant has adopted a code of ethics, as defined in Item 2 of Form N-CSR, applicable to its principal executive officer, principal financial officer, principal accounting officer or controller, or persons performing similar functions. A copy of this code of ethics is filed as an exhibit to this Form N-CSR. No substantive amendments were approved or waivers were granted to this code of ethics during the period covered by this report.
Item 3. Audit Committee Financial Expert.
The registrant’s Board of Directors/Trustees has determined that Mr. Bruce W. Duncan qualifies as an audit committee financial expert, as defined in Item 3 of Form N-CSR. Mr. Duncan is considered independent for purposes of Item 3 of Form N-CSR.
Item 4. Principal Accountant Fees and Services.
(a) – (d) Aggregate fees billed for the last two fiscal years for professional services rendered to, or on behalf of, the registrant by the registrant’s principal accountant were as follows:
Audit fees include amounts related to the audit of the registrant’s annual financial statements and services normally provided by the accountant in connection with statutory and regulatory filings. Audit-related fees include amounts reasonably related to the performance of the audit of the registrant’s financial statements and specifically include the issuance of a report on internal controls and, if applicable, agreed-upon procedures related to fund acquisitions. Tax fees include amounts related to services for tax compliance, tax planning, and tax advice. The nature of these services specifically includes the review of distribution calculations and the preparation of Federal, state, and excise tax returns. All other fees include the registrant’s pro-rata share of amounts for agreed-upon procedures in conjunction with service contract approvals by the registrant’s Board of Directors/Trustees.
(e)(1) The registrant’s audit committee has adopted a policy whereby audit and non-audit services performed by the registrant’s principal accountant for the registrant, its investment adviser, and any entity controlling, controlled by, or under common control with the investment adviser that provides ongoing services to the registrant require pre-approval in advance at regularly scheduled audit committee meetings. If such a service is required between regularly scheduled audit committee meetings, pre-approval may be authorized by one audit committee member with ratification at the next scheduled audit committee meeting. Waiver of pre-approval for audit or non-audit services requiring fees of a de minimis amount is not permitted.
(2) No services included in (b) – (d) above were approved pursuant to paragraph (c)(7)(i)(C) of Rule 2-01 of Regulation S-X.
(f) Less than 50 percent of the hours expended on the principal accountant’s engagement to audit the registrant’s financial statements for the most recent fiscal year were attributed to work performed by persons other than the principal accountant’s full-time, permanent employees.
(g) The aggregate fees billed for the most recent fiscal year and the preceding fiscal year by the registrant’s principal accountant for non-audit services rendered to the registrant, its investment adviser, and any entity controlling, controlled by, or under common control with the investment adviser that provides ongoing services to the registrant were $3,227,000 and $2,544,000, respectively.
(h) All non-audit services rendered in (g) above were pre-approved by the registrant’s audit committee. Accordingly, these services were considered by the registrant’s audit committee in maintaining the principal accountant’s independence.
Item 5. Audit Committee of Listed Registrants.
Not applicable.
Item 6. Investments.
(a) Not applicable. The complete schedule of investments is included in Item 1 of this Form N-CSR.
(b) Not applicable.
Item 7. Disclosure of Proxy Voting Policies and Procedures for Closed-End Management Investment Companies.
Not applicable.
Item 8. Portfolio Managers of Closed-End Management Investment Companies.
Not applicable.
Item 9. Purchases of Equity Securities by Closed-End Management Investment Company and Affiliated Purchasers.
Not applicable.
Item 10. Submission of Matters to a Vote of Security Holders.
Not applicable.
Item 11. Controls and Procedures.
(a) The registrant’s principal executive officer and principal financial officer have evaluated the registrant’s disclosure controls and procedures within 90 days of this filing and have concluded that the registrant’s disclosure controls and procedures were effective, as of that date, in ensuring that information required to be disclosed by the registrant in this Form N-CSR was recorded, processed, summarized, and reported timely.
(b) The registrant’s principal executive officer and principal financial officer are aware of no change in the registrant’s internal control over financial reporting that occurred during the period covered by this report that has materially affected, or is reasonably likely to materially affect, the registrant’s internal control over financial reporting.
Item 12. Disclosure of Securities Lending Activities for Closed-End Management Investment Companies.
Not applicable.
Item 13. Exhibits.
(a)(1) The registrant’s code of ethics pursuant to Item 2 of Form N-CSR is attached.
(2) Separate certifications by the registrant's principal executive officer and principal financial officer, pursuant to Section 302 of the Sarbanes-Oxley Act of 2002 and required by Rule 30a-2(a) under the Investment Company Act of 1940, are attached.
(3) Written solicitation to repurchase securities issued by closed-end companies: not applicable.
(b) A certification by the registrant’s principal executive officer and principal financial officer, pursuant to Section 906 of the Sarbanes-Oxley Act of 2002 and required by Rule 30a-2(b) under the Investment Company Act of 1940, is attached.
SIGNATURES
Pursuant to the requirements of the Securities Exchange Act of 1934 and the Investment Company Act of 1940, the registrant has duly caused this report to be signed on its behalf by the undersigned, thereunto duly authorized.
T. Rowe Price Health Sciences Fund, Inc.
| By | /s/ David Oestreicher | |||||
| David Oestreicher | ||||||
| Principal Executive Officer | ||||||
| Date | February 14, 2020 | |||||
Pursuant to the requirements of the Securities Exchange Act of 1934 and the Investment Company Act of 1940, this report has been signed below by the following persons on behalf of the registrant and in the capacities and on the dates indicated.
| By | /s/ David Oestreicher | |||||
| David Oestreicher | ||||||
| Principal Executive Officer | ||||||
| Date | February 14, 2020 | |||||
| By | /s/ Alan S. Dupski | |||||
| Alan S. Dupski | ||||||
| Principal Financial Officer | ||||||
| Date | February 14, 2020 | |||||