UNITED STATES
SECURITIES AND EXCHANGE COMMISSION
WASHINGTON, D.C. 20549
FORM N-CSR
CERTIFIED SHAREHOLDER REPORT OF REGISTERED MANAGEMENT
INVESTMENT COMPANIES
Investment Company Act file number: 811-07391
ALLIANCEBERNSTEIN DIVERSIFIED YIELD FUND, INC.
(Exact name of registrant as specified in charter)
1345 Avenue of the Americas, New York, New York 10105
(Address of principal executive offices) (Zip code)
Joseph J. Mantineo
AllianceBernstein L.P.
1345 Avenue of the Americas New York, New York 10105
(Name and address of agent for service)
Registrant’s telephone number, including area code: (800) 221-5672
Date of fiscal year end: October 31, 2009
Date of reporting period: April 30, 2009
ITEM 1. REPORTS TO STOCKHOLDERS.
2
SEMI-ANNUAL REPORT
AllianceBernstein Diversified Yield Fund

Semi-Annual Report
Investment Products Offered
| | • | | Are Not Bank Guaranteed |
The investment return and principal value of an investment in the Fund will fluctuate as the prices of the individual securities in which it invests fluctuate, so that your shares, when redeemed, may be worth more or less than their original cost. You should consider the investment objectives, risks, charges and expenses of the Fund carefully before investing. For a free copy of the Fund’s prospectus, which contains this and other information, visit our web site at www.alliancebernstein.com or call your financial advisor or AllianceBernstein® at (800) 227-4618. Please read the prospectus carefully before you invest.
You may obtain performance information current to the most recent month-end by visiting www.alliancebernstein.com.
This shareholder report must be preceded or accompanied by the Fund’s prospectus for individuals who are not current shareholders of the Fund.
You may obtain a description of the Fund’s proxy voting policies and procedures, and information regarding how the Fund voted proxies relating to portfolio securities during the most recent 12-month period ended June 30, without charge. Simply visit AllianceBernstein’s web site at www.alliancebernstein.com, or go to the Securities and Exchange Commission’s (the “Commission”) web site at www.sec.gov, or call AllianceBernstein at (800) 227-4618.
The Fund files its complete schedule of portfolio holdings with the Commission for the first and third quarters of each fiscal year on Form N-Q. The Fund’s Forms N-Q are available on the Commission’s web site at www.sec.gov. The Fund’s Forms N-Q may also be reviewed and copied at the Commission’s Public Reference Room in Washington, DC; information on the operation of the Public Reference Room may be obtained by calling (800) SEC-0330. AllianceBernstein publishes full portfolio holdings for the Fund monthly at www.alliancebernstein.com.
AllianceBernstein Investments, Inc. is an affiliate of AllianceBernstein L.P., the manager of the AllianceBernstein funds, and is a member of FINRA.
AllianceBernstein® and the AB Logo are registered trademarks and service marks used by permission of the owner, AllianceBernstein L.P.
June 15, 2009
Semi-Annual Report
This report provides management’s discussion of fund performance for AllianceBernstein Diversified Yield Fund (the “Fund”) for the semi-annual reporting period ended April 30, 2009.
Investment Objective and Policies
This Fund’s investment objective is to generate current income consistent with preservation of capital. The Fund employs a dynamic risk allocation, meaning that the Fund’s risk profile may vary significantly over time based upon market conditions. The Fund invests in a portfolio of fixed-income securities of US and non-US companies and US Government and non-US government securities and supranational entities, including lower-rated securities. The Fund limits its investments in the securities of any one foreign government to 25% of its total assets. The Fund may invest in debt securities with a range of maturities from short- to long-term.
The Fund typically maintains at least 50% of its net assets in investment-grade securities. The Fund may invest up to 50% of its net assets in below-investment-grade securities, such as corporate high-yield fixed-income securities, sovereign debt obligations and fixed-income securities of issuers located in emerging markets.
The Fund may also invest in mortgage-related and other asset-backed securities, loan participations, inflation-protected securities, structured securities, variable, floating, and inverse floating rate instruments,
preferred stock, and may use other investment techniques. The Fund may make short sales of securities or currencies or maintain a short position. The Fund may use borrowings or other leverage for investment purposes. The Fund intends, among other things, to enter into transactions such as reverse repurchase agreements and dollar rolls. The Fund may invest, without limit, in derivatives, such as options, futures, forwards or swap agreements.
Investment Results
The table on page 5 shows the Fund’s performance compared with its benchmark, the Barclays Capital Global Aggregate Bond Index (hedged to the US Dollar, “USD”) for the six- and 12-month periods ended April 30, 2009. Also included in the table are returns for the Fund’s peer group, as represented by the Lipper Multi-Sector Income Funds Average (the “Lipper Average”). Funds in the Lipper Average have generally similar investment objectives to the Fund, although some may have different investment policies and sales and management fees. For an additional comparison, returns for the Merrill Lynch (“ML”) 3-Month US Treasury Bill (“T-Bill”) Index are also included.
For the six-month period ended April 30, 2009, the Fund’s Class A shares without sales charges underperformed the benchmark and Lipper Average, but outperformed the ML 3-Month T-Bill Index. For the 12-month period, the Fund underperformed both indices. Even though the Fund’s
| | |
| ALLIANCEBERNSTEIN DIVERSIFIED YIELD FUND • | | 1 |
overall risk exposure entering the semi-annual period was modest, a continued broad liquidity crunch stemming from the subprime crisis led to falling government bond yields and widening spreads across fixed-income markets. Detracting from returns for both periods was exposure to subprime-related asset-backed securities (ABS) and collateralized debt obligations (CDOs), as well as Alt-A mortgage securities (Alt-A, or “alternative” mortgage are home loans made with less than full documentation); and positions in commercial mortgage-backed securities (CMBS). Positions in investment-grade corporate bonds and high-yield bank loans and the Fund’s position in emerging-market debt added to its performance for the six-month period.
Market Review and Investment Strategy
Extreme risk aversion that seized the markets following the bankruptcy of Lehman Brothers in mid-September accelerated into the fourth quarter of 2008 as massive global deleveraging continued. Tumult in the financial markets bled into the real economy, in the US and across the globe. Economic data for virtually every country experienced a significant downturn. Investors flocked to the safety of government securities and credit markets sold off dramatically. The yield on US Treasury bills reached near zero, showing that investors were willing to forgo a return on their investment in exchange for a safe place to park their cash. While global government bond yields hit or neared
record lows, yield spreads on investment-grade corporate bonds shot to peaks unseen since the 1930s.
Challenges continued into the first quarter of 2009 as asset prices in many markets continued to fall and policymakers scrambled to combat the severe global economic slowdown. Volatility remained high, although below the peaks of late 2008. Diversification across asset classes and geographies provided little shelter from the storm. Government debt, a safe haven in the flight from risk in 2008, suffered overall modest losses in the first quarter. And as yields rose, total returns on global corporate bonds were negative, even as spreads ebbed from historic peaks.
In an effort to restart borrowing, central banks around the world aggressively slashed interest rates. Official rates in the US, Switzerland and Japan are now near zero. Monetary authorities also unveiled an array of unorthodox measures including directly purchasing assets such as mortgages and long-term Treasuries. Additionally, governments in both developed and developing countries have pledged a record dose of fiscal stimulus including a mix of tax cuts and infrastructure spending to help cushion the impact of the downturn.
The global economy and financial markets continue to face real challenges. The timing of recovery remains unclear and uncertainty still surrounds government actions and their impact on the economy. However, the Fund’s Absolute Return Strategies Investment
| | |
| 2 | | • ALLIANCEBERNSTEIN DIVERSIFIED YIELD FUND |
Team (the “Team”) believes that powerful forces for recovery are gathering. Across the capital markets, strong recoveries typically follow very weak periods. These market upturns tend to come swiftly, often before there is solid evidence of an economic turnaround (i.e. April 2009’s subsequent strong rebound in equity and credit sensitive markets).
The Team believes the recent turmoil has created opportunities not seen in generations. While Fund performance
tracked the indices lower as the credit crisis deepened, the Team believes the Fund is well positioned for recovery. The recent turmoil has created compelling valuations in fixed-income markets and wide yield spreads are compensating investors as they wait for recovery. Risk premiums over governments are near historic highs in many sectors. The Team believes more than at any time in recent history, investors are likely to be well rewarded for sticking to a disciplined, long-term approach to asset allocation.
| | |
| ALLIANCEBERNSTEIN DIVERSIFIED YIELD FUND • | | 3 |
HISTORICAL PERFORMANCE
An Important Note About the Value of Historical Performance
The performance shown on the following pages represents past performance and does not guarantee future results. Current performance may be lower or higher than the performance information shown. You may obtain performance information current to the most recent month-end by visiting www.alliancebernstein.com.
The investment return and principal value of an investment in the Fund will fluctuate, so that your shares, when redeemed, may be worth more or less than their original cost. You should consider the investment objectives, risks, charges and expenses of the Fund carefully before investing. For a free copy of the Fund’s prospectus, which contains this and other information, visit our website at www.alliancebernstein.com or call your financial advisor or AllianceBernstein Investments at 800.227.4618. You should read the prospectus carefully before you invest.
All fees and expenses related to the operation of the Fund have been deducted. NAV returns do not reflect sales charges; if sales charges were reflected, the Fund’s quoted performance would be lower. SEC returns reflect the applicable sales charges for each share class: a 4.25% maximum front-end sales charge for Class A shares; the applicable contingent deferred sales charge for Class B shares (4% year 1, 3% year 2, 2% year 3, 1% year 4); a 1% 1 year contingent deferred sales charge for Class C shares. Returns for the different share classes will vary due to different expenses associated with each class. Performance assumes reinvestment of distributions and does not account for taxes.
Benchmark Disclosure
Neither the unmanaged Barclays Capital Global Aggregate Bond Index (US dollar hedged) nor the unmanaged Merrill Lynch (ML) 3-Month US Treasury Bill (T-Bill) Index reflect fees and expenses associated with the active management of a mutual fund portfolio. The indices do not use leverage. The Barclays Capital Global Aggregate Bond Index provides a broad-based measure of the international investment-grade bond market. The index combines the Barclays Capital US Aggregate Index with dollar-denominated versions of the Pan-European Index and the Japanese, Canadian, Australian and New Zealand components of the Global Treasury Index. The ML 3-month US T-Bill Index is composed of a single issue purchased at the beginning of the month and held for a full month. Each month the index is rebalanced and the issue selected is the outstanding Treasury bill that matures closest to, but not beyond, three months from the rebalancing date. The Lipper Multi-Sector Income Funds Average consisted of 159 funds and 147 funds for the six- and 12-month periods ended April 30, 2009, respectively. An investor cannot invest directly in an index or average, and their results are not indicative of the performance for any specific investment, including the Fund.
A Word About Risk
The Fund can invest in foreign securities, including emerging markets, which may magnify fluctuations due to changes in foreign exchange rates and the possibility of substantial volatility due to political and economic uncertainties in foreign countries. Price fluctuation in the Fund’s securities may be caused by changes in the general level of interest rates or changes in bond credit quality ratings. The Fund can invest a portion of its assets in the securities of a single issuer, a single region, a single foreign country and may invest up to 50% of its assets in below-investment-grade securities which may present greater risk. The Fund may invest in high yield bonds, otherwise known as “junk bonds,” which involve a greater risk of default and price volatility than other bonds. Investing in below-investment-grade securities presents special risks, including credit risk. The Fund may use leverage which may increase fluctuation caused by changes in interest rates or bond credit quality ratings. Please note, as interest rates rise, existing bond prices fall and can cause the value of an investment in the Fund to decline. Changes in interest rates have a greater effect on bonds with longer maturities than on those with shorter maturities. Similar to direct bond ownership, bond funds have the same interest rate, inflation and credit risks that are associated with the underlying bonds owned by the Fund. Fund purchasers should understand that, in contrast to owning individual bonds, there are ongoing fees and expenses associated with owning shares of bond funds. While the Fund invests principally in bonds and other fixed-income securities, in order to achieve its investment objectives, the Fund may at times use certain types of investment derivatives, such as options, futures, forwards and swaps. These instruments involve risks different from, and in certain cases, greater than, the risks presented by more traditional investments. These risks are fully discussed in the Fund’s prospectus.
(Historical Performance continued on next page)
| | |
| 4 | | • ALLIANCEBERNSTEIN DIVERSIFIED YIELD FUND |
Historical Performance
HISTORICAL PERFORMANCE
(continued from previous page)
| | | | | | |
| | | | | | |
THE FUND VS. ITS BENCHMARK PERIODS ENDED APRIL 30, 2009 | | Returns | | |
| | 6 Months | | 12 Months | | |
AllianceBernstein Diversified Yield Fund* | | | | | | |
Class A | | 1.18% | | -11.61% | | |
| |
Class B** | | 0.84% | | -12.21% | | |
| |
Class C | | 0.83% | | -12.21% | | |
| |
Advisor Class† | | 1.34% | | -11.34% | | |
| |
Class R† | | 1.08% | | -11.81% | | |
| |
Class K† | | 1.15% | | -11.37% | | |
| |
Class I† | | 1.35% | | -11.33% | | |
| |
Barclays Capital^ Global Aggregate Bond Index (Hedged to the USD) | | 5.76% | | 4.62% | | |
| |
Lipper Multi-Sector Income Funds Average | | 6.99% | | -10.07% | | |
| |
Merrill Lynch 3-Month US T-Bill Index | | 0.18% | | 1.13% | | |
| |
* Includes the impact of proceeds received and credited to the Fund resulting from class action settlements, which enhanced the Fund’s performance for the six- and 12-month periods ended April 30, 2009, by 0.54% and 0.56%, respectively. ** Effective January 31, 2009, Class B shares are no longer be available for purchase to new investors. Please see Note A for more information. † Please note that these share classes are for investors purchasing shares through accounts established under certain fee-based programs sponsored and maintained by certain broker-dealers and financial intermediaries, institutional pension plans and/or investment advisory clients of, and certain other persons associated with, the Adviser and its affiliates or the Funds. ^ Formerly Lehman Brothers. |
| | | | | | |
See Historical Performance and Benchmark disclosures on previous page.
(Historical Performance continued on next page)
| | |
| ALLIANCEBERNSTEIN DIVERSIFIED YIELD FUND • | | 5 |
Historical Performance
HISTORICAL PERFORMANCE
(continued from previous page)
| | | | | | | | | |
| AVERAGE ANNUAL RETURNS AS OF APRIL 30, 2009 | |
| | | NAV Returns | | | SEC Returns | | | SEC Yields** | |
| | | | | | | | | |
| Class A Shares | | | | | | | | 5.48 | % |
1 Year | | -11.61 | % | | -15.34 | % | | | |
5 Years | | 1.71 | % | | 0.83 | % | | | |
10 Years | | 3.12 | % | | 2.67 | % | | | |
| | | | | | | | | |
| Class B Shares | | | | | | | | 5.03 | % |
1 Year | | -12.21 | % | | -15.59 | % | | | |
5 Years | | 1.01 | % | | 1.01 | % | | | |
10 Years(a) | | 2.68 | % | | 2.68 | % | | | |
| | | | | | | | | |
| Class C Shares | | | | | | | | 5.03 | % |
1 Year | | -12.21 | % | | -13.06 | % | | | |
5 Years | | 1.02 | % | | 1.02 | % | | | |
10 Years | | 2.40 | % | | 2.40 | % | | | |
| | | | | | | | | |
| Advisor Class Shares† | | | | | | | | 6.03 | % |
1 Year | | -11.34 | % | | -11.34 | % | | | |
5 Years | | 2.02 | % | | 2.02 | % | | | |
10 Years | | 3.43 | % | | 3.43 | % | | | |
| | | | | | | | | |
| Class R Shares† | | | | | | | | 5.55 | % |
1 Year | | -11.81 | % | | -11.81 | % | | | |
Since Inception* | | -0.14 | % | | -0.14 | % | | | |
| | | | | | | | | |
| Class K Shares† | | | | | | | | 5.77 | % |
1 Year | | -11.37 | % | | -11.37 | % | | | |
Since Inception* | | 0.16 | % | | 0.16 | % | | | |
| | | | | | | | | |
| Class I Shares† | | | | | | | | 6.04 | % |
1 Year | | -11.33 | % | | -11.33 | % | | | |
Since Inception* | | 0.46 | % | | 0.46 | % | | | |
The Fund’s current prospectus fee table shows the Fund’s total annual operating expense ratios as 1.65%, 2.41%, 2.36%, 1.33%, 1.88%, 1.53% and 1.28% for Class A, Class B, Class C, Advisor Class, Class R, Class K and Class I, respectively, gross of any fee waivers or expense reimbursements. Contractual fee waivers and/or expense reimbursements limit the Fund’s annual operating expense ratios to 0.90%, 1.60%,1.60%, 0.60%, 1.10%, 0.85% and 0.60% for Class A, Class B, Class C, Advisor Class, Class R, Class K and Class I, respectively. These waivers/reimbursements extend through the Fund’s current fiscal year and may be extended by the Adviser for additional one-year terms. Absent reimbursements or waivers, performance would have been lower. The Financial Highlights section of this report sets forth expense ratio data for the current reporting period; the expense ratios shown above may differ from the expense ratios in the Financial Highlights sections since they are based on different time periods.
(a) | | Assumes conversion of Class B shares into Class A shares after eight years. |
| * | | Inception dates: 3/1/05 for Class R, Class K and Class I shares. |
| ** | | SEC yields are calculated based on SEC guidelines for the 30-day period ended April 30, 2009. |
| † | | These share classes are offered at net asset value (NAV) to eligible investors and their SEC returns are the same as the NAV returns. Please note that these share classes are for investors purchasing shares through accounts established under certain fee-based programs sponsored and maintained by certain broker-dealers and financial intermediaries, institutional pension plans and/or investment advisory clients of, and certain other persons associated with, the Adviser and its affiliates or the Funds. The inception dates for these share classes are listed above. |
See Historical Performance disclosures on page 4.
(Historical Performance continued on next page)
| | |
| 6 | | • ALLIANCEBERNSTEIN DIVERSIFIED YIELD FUND |
Historical Performance
HISTORICAL PERFORMANCE
(continued from previous page)
| | | | | | | |
SEC AVERAGE ANNUAL RETURNS (WITH SALES CHARGES) AS OF THE MOST RECENT CALENDAR QUARTER-END (MARCH 31, 2009) | |
| | | | | | | SEC Returns | |
| | | | | | | |
| Class A Shares | | | | | | | |
1 Year | | | | | | -17.85 | % |
5 Years | | | | | | -0.46 | % |
10 Years | | | | | | 2.47 | % |
| | | | | | | |
| Class B Shares | | | | | | | |
1 Year | | | | | | -18.07 | % |
5 Years | | | | | | -0.30 | % |
10 Years(a) | | | | | | 2.48 | % |
| | | | | | | |
| Class C Shares | | | | | | | |
1 Year | | | | | | -15.60 | % |
5 Years | | | | | | -0.28 | % |
10 Years | | | | | | 2.20 | % |
| | | | | | | |
| Advisor Class Shares† | | | | | | | |
1 Year | | | | | | -13.95 | % |
5 Years | | | | | | 0.73 | % |
10 Years | | | | | | 3.22 | % |
| | | | | | | |
| Class R Shares† | | | | | | | |
1 Year | | | | | | -14.41 | % |
Since Inception* | | | | | | -1.14 | % |
| | | | | | | |
| Class K Shares† | | | | | | | |
1 Year | | | | | | -13.84 | % |
Since Inception* | | | | | | -0.80 | % |
| | | | | | | |
| Class I Shares† | | | | | | | |
1 Year | | | | | | -13.94 | % |
Since Inception* | | | | | | -0.54 | % |
(a) | | Assumes conversion of Class B shares into Class A shares after eight years. |
| * | | Inception dates: 12/18/97 for Advisor Class shares; 3/1/05 for Class R, Class K and Class I shares. |
| † | | Please note that these share classes are for investors purchasing shares through accounts established under certain fee-based programs sponsored and maintained by certain broker-dealers and financial intermediaries, institutional pension plans and/or investment advisory clients of, and certain other persons associated with, the Adviser and its affiliates or the Funds. The inception dates for these share classes are listed above. |
See Historical Performance disclosures on page 4.
| | |
| ALLIANCEBERNSTEIN DIVERSIFIED YIELD FUND • | | 7 |
Historical Performance
FUND EXPENSES
As a shareholder of the Fund, you incur two types of costs: (1) transaction costs, including sales charges (loads) on purchase payments, contingent deferred sales charges on redemptions and (2) ongoing costs, including management fees; distribution (12b-1) fees; and other Fund expenses. This example is intended to help you understand your ongoing costs (in dollars) of investing in the Fund and to compare these costs with the ongoing costs of investing in other mutual funds.
The Example is based on an investment of $1,000 invested at the beginning of the period and held for the entire period as indicated below.
Actual Expenses
The table below provides information about actual account values and actual expenses. You may use the information, together with the amount you invested, to estimate the expenses that you paid over the period. Simply divide your account value by $1,000 (for example, an $8,600 account value divided by $1,000 = 8.6), then multiply the result by the number under the heading entitled “Expenses Paid During Period” to estimate the expenses you paid on your account during this period.
Hypothetical Example for Comparison Purposes
The table below also provides information about hypothetical account values and hypothetical expenses based on the Fund’s actual expense ratio and an assumed annual rate of return of 5% before expenses, which is not the Fund’s actual return. The hypothetical account values and expenses may not be used to estimate the actual ending account balance or expenses you paid for the period. You may use this information to compare the ongoing costs of investing in the Fund and other funds by comparing this 5% hypothetical example with the 5% hypothetical examples that appear in the shareholder reports of other funds.
Please note that the expenses shown in the table are meant to highlight your ongoing costs only and do not reflect any transactional costs, such as sales charges (loads), or contingent deferred sales charges on redemptions. Therefore, the hypothetical example is useful in comparing ongoing costs only, and will not help you determine the relative total costs of owning different funds. In addition, if these transactional costs were included, your costs would have been higher.
| | | | | | | | | | | | | | | | | | |
| | | Beginning
Account Value
November 1, 2008 | | Ending
Account Value
April 30, 2009 | | Expenses Paid
During Period* |
| | | Actual | | Hypothetical | | Actual | | Hypothetical** | | Actual | | Hypothetical |
| Class A | | $ | 1,000 | | $ | 1,000 | | $ | 1,011.82 | | $ | 1,020.33 | | $ | 4.49 | | $ | 4.51 |
| Class B | | $ | 1,000 | | $ | 1,000 | | $ | 1,008.37 | | $ | 1,016.86 | | $ | 7.97 | | $ | 8.00 |
| Class C | | $ | 1,000 | | $ | 1,000 | | $ | 1,008.35 | | $ | 1,016.86 | | $ | 7.97 | | $ | 8.00 |
| Advisor Class | | $ | 1,000 | | $ | 1,000 | | $ | 1,013.39 | | $ | 1,021.82 | | $ | 3.00 | | $ | 3.01 |
| Class R | | $ | 1,000 | | $ | 1,000 | | $ | 1,010.79 | | $ | 1,019.34 | | $ | 5.48 | | $ | 5.51 |
| Class K | | $ | 1,000 | | $ | 1,000 | | $ | 1,011.53 | | $ | 1,020.58 | | $ | 4.24 | | $ | 4.26 |
| Class I | | $ | 1,000 | | $ | 1,000 | | $ | 1,013.47 | | $ | 1,021.82 | | $ | 3.00 | | $ | 3.01 |
| * | | Expenses are equal to the classes’ annualized expense ratios of 0.90%, 1.60%, 1.60%, 0.60%, 1.10%, 0.85% and 0.60%, respectively, multiplied by the average account value over the period, multiplied by 181/365 (to reflect the one-half year period). |
| ** | | Assumes 5% return before expenses. |
| | |
| 8 | | • ALLIANCEBERNSTEIN DIVERSIFIED YIELD FUND |
Fund Expenses
PORTFOLIO SUMMARY
April 30, 2009 (unaudited)
PORTFOLIO STATISTICS
Net Assets ($mill): $61.5
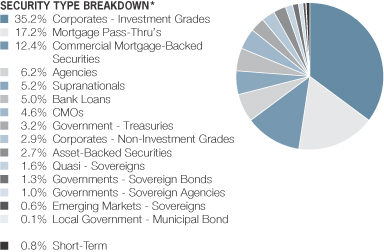
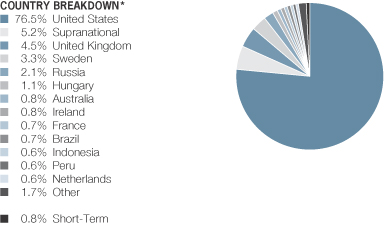
| * | | All data are as of April 30, 2009. The Fund’s security type and country breakdowns are expressed as a percentage of total investments and may vary over time. “Other” country weightings represent 0.6% or less in the following countries: Canada, Germany, Italy, Kazakhstan and Luxembourg. |
| | |
| ALLIANCEBERNSTEIN DIVERSIFIED YIELD FUND • | | 9 |
Portfolio Summary
PORTFOLIO OF INVESTMENTS
April 30, 2009 (unaudited)
| | | | | | | |
| | | | | Principal
Amount
(000) | | U.S. $ Value |
| |
| | | | | | | |
CORPORATES - INVESTMENT GRADES – 32.8% | | | | | | | |
Industrial – 15.1% | | | | | | | |
Basic – 1.5% | | | | | | | |
ArcelorMittal
6.125%, 6/01/18 | | US$ | | 225 | | $ | 181,318 |
PPG Industries, Inc.
5.75%, 3/15/13 | | | | 220 | | | 223,889 |
Rio Tinto Finance USA Ltd.
8.95%, 5/01/14 | | | | 150 | | | 155,263 |
Weyerhaeuser Co.
7.375%, 3/15/32 | | | | 469 | | | 356,722 |
| | | | | | | |
| | | | | | | 917,192 |
| | | | | | | |
Capital Goods – 0.8% | | | | | | | |
John Deere Capital Corp.
5.25%, 10/01/12 | | | | 300 | | | 307,421 |
Tyco International Finance SA
8.50%, 1/15/19 | | | | 150 | | | 160,560 |
| | | | | | | |
| | | | | | | 467,981 |
| | | | | | | |
Communications - Media – 0.9% | | | | | | | |
BSKYB Finance UK PLC
5.625%, 10/15/15(a) | | | | 225 | | | 204,551 |
Reed Elsevier Capital, Inc.
7.75%, 1/15/14 | | | | 215 | | | 220,120 |
Time Warner Cable, Inc.
7.50%, 4/01/14 | | | | 150 | | | 161,130 |
| | | | | | | |
| | | | | | | 585,801 |
| | | | | | | |
Communications - Telecommunications – 4.9% | | | | | | | |
AT&T, Inc.
5.60%, 5/15/18 | | | | 455 | | | 457,423 |
Embarq Corp.
7.082%, 6/01/16 | | | | 466 | | | 447,360 |
New Cingular Wireless Services, Inc.
8.75%, 3/01/31 | | | | 180 | | | 206,037 |
Qwest Corp.
8.875%, 3/15/12 | | | | 442 | | | 448,630 |
Telecom Italia Spa
1.957%, 6/07/10(b) | | EUR | | 200 | | | 255,482 |
US Cellular Corp.
6.70%, 12/15/33 | | US$ | | 445 | | | 351,430 |
Verizon Communications, Inc.
5.25%, 4/15/13 | | | | 220 | | | 230,831 |
Vodafone Group PLC
1.66%, 6/15/11(b) | | | | 435 | | | 415,415 |
1.845%, 1/13/12(b) | | EUR | | 150 | | | 187,912 |
| | | | | | | |
| | | | | | | 3,000,520 |
| | | | | | | |
| | |
| 10 | | • ALLIANCEBERNSTEIN DIVERSIFIED YIELD FUND |
Portfolio of Investments
| | | | | | | |
| | | |
| | | | | Principal
Amount
(000) | | U.S. $ Value |
| |
| | | | | | | |
Consumer Non-Cyclical – 2.6% | | | | | | | |
Bunge Ltd. Finance Corp.
5.10%, 7/15/15 | | US$ | | 154 | | $ | 133,895 |
Cadbury Schweppes US Finance LLC
5.125%, 10/01/13(a) | | | | 415 | | | 405,165 |
Kraft Foods, Inc.
6.125%, 8/23/18 | | | | 210 | | | 213,323 |
Pfizer, Inc.
3.173%, 3/15/11(b) | | | | 300 | | | 307,775 |
Reynolds American, Inc.
7.625%, 6/01/16 | | | | 428 | | | 376,371 |
Whirlpool Corp.
8.60%, 5/01/14 | | | | 20 | | | 20,493 |
Wyeth
5.50%, 2/01/14 | | | | 160 | | | 171,756 |
| | | | | | | |
| | | | | | | 1,628,778 |
| | | | | | | |
Energy – 1.7% | | | | | | | |
Anadarko Petroleum Corp.
1.72%, 9/15/09(b) | | | | 435 | | | 434,342 |
Noble Energy, Inc.
8.25%, 3/01/19 | | | | 153 | | | 166,734 |
Valero Energy Corp.
6.875%, 4/15/12 | | | | 215 | | | 219,942 |
Weatherford International Ltd.
5.15%, 3/15/13 | | | | 225 | | | 211,276 |
| | | | | | | |
| | | | | | | 1,032,294 |
| | | | | | | |
Technology – 2.4% | | | | | | | |
Electronic Data Systems Corp.
Series B
6.00%, 8/01/13 | | | | 458 | | | 489,856 |
IBM International Group Capital LLC
1.394%, 7/29/09(b) | | | | 445 | | | 445,562 |
Motorola, Inc.
7.50%, 5/15/25 | | | | 446 | | | 318,649 |
Oracle Corp.
4.95%, 4/15/13 | | | | 217 | | | 230,469 |
| | | | | | | |
| | | | | | | 1,484,536 |
| | | | | | | |
Transportation - Railroads – 0.3% | | | | | | | |
Canadian Pacific Railway Co.
5.75%, 5/15/13 | | | | 185 | | | 176,123 |
| | | | | | | |
| | | | | | | 9,293,225 |
| | | | | | | |
Financial Institutions – 14.0% | | | | | | | |
Banking – 10.2% | | | | | | | |
ABN Amro Bank NV
1.484%, 3/09/15(b) | | | | 450 | | | 312,028 |
American Express Credit Corp.
0.558%, 2/24/12(b) | | | | 435 | | | 358,450 |
| | |
| ALLIANCEBERNSTEIN DIVERSIFIED YIELD FUND • | | 11 |
Portfolio of Investments
| | | | | | | |
| | | |
| | | | | Principal
Amount
(000) | | U.S. $ Value |
| |
| | | | | | | |
Anglo Irish Bank Corp.
2.01%, 6/25/14(b) | | EUR | | 600 | | $ | 333,133 |
ANZ Capital Trust III
2.31%, 12/15/53(b) | | | | 600 | | | 285,790 |
Barclays Bank PLC
Series 3
2.138%, 7/31/09(b) | | GBP | | 500 | | | 421,615 |
Bear Stearns Cos Inc.
1.446%, 11/28/11(b) | | US$ | | 440 | | | 410,599 |
Capital One Financial
1.573%, 9/10/09(b) | | | | 435 | | | 423,803 |
Citigroup, Inc.
5.50%, 4/11/13 | | | | 460 | | | 409,983 |
Credit Suisse USA, Inc.
4.70%, 6/01/09 | | | | 440 | | | 441,018 |
Deutsche Bank AG/London
4.875%, 5/20/13 | | | | 181 | | | 179,743 |
Goldman Sachs Group, Inc.
1.561%, 10/07/11(b) | | | | 435 | | | 401,474 |
Merrill Lynch & Co Inc.
1.501%, 6/05/12(b) | | | | 440 | | | 358,903 |
Morgan Stanley
1.399%, 1/09/12(b) | | | | 440 | | | 384,646 |
Skandinaviska Enskilda
1.733%, 10/06/14(b) | | EUR | | 600 | | | 685,008 |
Wachovia Corp.
Series MTN
5.50%, 5/01/13 | | US$ | | 465 | | | 455,878 |
Wells Fargo & Co.
1.189%, 1/24/12(b) | | | | 435 | | | 394,666 |
| | | | | | | |
| | | | | | | 6,256,737 |
| | | | | | | |
Finance – 1.9% | | | | | | | |
General Electric Capital Corp.
4.80%, 5/01/13 | | | | 225 | | | 220,049 |
HSBC Finance Corp.
1.411%, 3/12/10(b) | | | | 435 | | | 416,248 |
International Lease Finance Co.
1.451%, 7/15/11(b) | | | | 435 | | | 294,178 |
1.489%, 7/13/12(b) | | | | 435 | | | 267,388 |
| | | | | | | |
| | | | | | | 1,197,863 |
| | | | | | | |
Insurance – 1.9% | | | | | | | |
Aetna, Inc.
6.75%, 12/15/37 | | | | 507 | | | 441,753 |
Genworth Financial, Inc.
1.60%, 6/20/11 | | JPY | | 22,000 | | | 79,262 |
Series MTN
6.515%, 5/22/18 | | US$ | | 230 | | | 72,986 |
| | |
| 12 | | • ALLIANCEBERNSTEIN DIVERSIFIED YIELD FUND |
Portfolio of Investments
| | | | | | | |
| | | |
| | | | | Principal
Amount
(000) | | U.S. $ Value |
| |
| | | | | | | |
ING Groep NV
5.775%, 12/08/15(c) | | US$ | | 58 | | $ | 21,460 |
UnitedHealth Group, Inc.
5.25%, 3/15/11 | | | | 220 | | | 223,485 |
XL Capital Ltd.
5.25%, 9/15/14 | | | | 476 | | | 340,400 |
| | | | | | | |
| | | | | | | 1,179,346 |
| | | | | | | |
| | | | | | | 8,633,946 |
| | | | | | | |
Utility – 3.1% | | | | | | | |
Electric – 1.8% | | | | | | | |
FirstEnergy Corp.
Series B
6.45%, 11/15/11 | | | | 215 | | | 218,363 |
MidAmerican Energy Holdings Co.
5.875%, 10/01/12 | | | | 215 | | | 222,232 |
Nisource Finance Corp.
6.15%, 3/01/13 | | | | 455 | | | 421,344 |
Progress Energy, Inc.
7.10%, 3/01/11 | | | | 210 | | | 221,598 |
| | | | | | | |
| | | | | | | 1,083,537 |
| | | | | | | |
Natural Gas – 0.7% | | | | | | | |
Energy Transfer Partners LP
6.125%, 2/15/17 | | | | 225 | | | 206,650 |
Enterprise Products Operating LLC
Series B
5.60%, 10/15/14 | | | | 225 | | | 208,874 |
| | | | | | | |
| | | | | | | 415,524 |
| | | | | | | |
Other Utility – 0.6% | | | | | | | |
Veolia Environnement
5.25%, 6/03/13 | | | | 385 | | | 381,647 |
| | | | | | | |
| | | | | | | 1,880,708 |
| | | | | | | |
Non Corporate Sectors – 0.6% | | | | | | | |
Agencies - Not Government Guaranteed – 0.6% | | | | | | | |
Gaz Capital SA
6.212%, 11/22/16(a) | | | | 516 | | | 394,740 |
| | | | | | | |
| | | |
Total Corporates - Investment Grades
(cost $23,733,303) | | | | | | | 20,202,619 |
| | | | | | | |
| | | | | | | |
MORTGAGE PASS-THRU’S – 16.0% | | | | | | | |
Agency Fixed Rate 30-Year – 13.0% | | | | | | | |
Federal Home Loan Mortgage Corp. Gold
Series 2007
6.50%, 12/01/33 | | | | 1,558 | | | 1,668,401 |
Series 2008
6.50%, 7/01/34 | | | | 926 | | | 993,888 |
| | |
| ALLIANCEBERNSTEIN DIVERSIFIED YIELD FUND • | | 13 |
Portfolio of Investments
| | | | | | | |
| | | |
| | | | | Principal
Amount
(000) | | U.S. $ Value |
| |
| | | | | | | |
Federal National Mortgage Association | | | | | | | |
Series 2002
6.50%, 8/01/32 | | US$ | | 2,064 | | $ | 2,214,056 |
Series 2008
6.50%, 12/01/28-10/01/35 | | | | 2,896 | | | 3,112,871 |
| | | | | | | |
| | | | | | | 7,989,216 |
| | | | | | | |
Agency ARMS – 3.0% | | | | | | | |
Federal Home Loan Mortgage Corp. | | | | | | | |
Series 2006
6.209%, 12/01/36(b) | | | | 415 | | | 432,445 |
Series 2007
5.909%, 4/01/37(b) | | | | 772 | | | 803,809 |
Federal National Mortgage Association
Series 2006
5.82%, 11/01/36(b) | | | | 604 | | | 630,858 |
| | | | | | | |
| | | | | | | 1,867,112 |
| | | | | | | |
Total Mortgage Pass-Thru’s
(cost $9,514,487) | | | | | | | 9,856,328 |
| | | | | | | |
| | | | | | | |
COMMERCIAL MORTGAGE-BACKED SECURITIES – 11.5% | | | | | | | |
Non-Agency Fixed Rate CMBS – 11.3% | | | | | | | |
Banc of America Commercial Mortgage, Inc.
Series 2007-5, Class A4
5.492%, 2/10/51 | | | | 490 | | | 352,959 |
Bear Stearns Commercial Mortgage Securities, Inc.
Series 2006-PW11, Class A2
5.575%, 3/11/39 | | | | 450 | | | 423,378 |
Series 2006-T24, Class A4
5.537%, 10/12/41 | | | | 375 | | | 323,764 |
Series 2007-PW18, Class A4
5.70%, 6/11/50 | | | | 495 | | | 401,076 |
Commercial Mortgage Pass Through Certificates
Series 2007-C9, Class A4
6.01%, 12/10/49 | | | | 200 | | | 150,481 |
Credit Suisse Mortgage Capital Certificates | | | | | | | |
Series 2006-C3, Class A3
6.02%, 6/15/38 | | | | 450 | | | 338,968 |
Series 2006-C5, Class A3
5.311%, 12/15/39 | | | | 255 | | | 180,892 |
CS First Boston Mortgage Securities Corp. | | | | | | | |
Series 2004-C3, Class A5
5.113%, 7/15/36 | | | | 250 | | | 222,338 |
Series 2005-C5, Class A3
5.10%, 8/15/38 | | | | 450 | | | 397,316 |
| | |
| 14 | | • ALLIANCEBERNSTEIN DIVERSIFIED YIELD FUND |
Portfolio of Investments
| | | | | | | |
| | | |
| | | | | Principal
Amount
(000) | | U.S. $ Value |
| |
| | | | | | | |
Greenwich Capital Commercial Funding Corp.
Series 2007-GG9, Class A4
5.444%, 3/10/39 | | US$ | | 225 | | $ | 176,169 |
JP Morgan Chase Commercial Mortgage Securities Corp. | | | | | | | |
Series 2006-CB15, Class A4
5.814%, 6/12/43 | | | | 325 | | | 224,443 |
Series 2006-CB17, Class A4
5.429%, 12/12/43 | | | | 450 | | | 348,379 |
Series 2007-C1, Class A4
5.716%, 2/15/51 | | | | 325 | | | 216,875 |
LB-UBS Commercial Mortgage Trust | | | | | | | |
Series 2006-C1, Class A4
5.156%, 2/15/31 | | | | 500 | | | 413,120 |
Series 2006-C6, Class A4
5.372%, 9/15/39 | | | | 530 | | | 426,789 |
Series 2007-C1, Class A4
5.424%, 2/15/40 | | | | 600 | | | 432,777 |
Merrill Lynch/Countrywide Commercial Mortgage Trust
Series 2006-3, Class A4
5.414%, 7/12/46 | | | | 390 | | | 312,670 |
Morgan Stanley Capital I
Series 2005-HQ6, Class A4A
4.989%, 8/13/42 | | | | 325 | | | 280,022 |
Wachovia Bank Commercial Mortgage Trust | | | | | | | |
Series 2006-C27, Class A3
5.765%, 7/15/45 | | | | 450 | | | 363,976 |
Series 2007-C31, Class A4
5.509%, 4/15/47 | | | | 450 | | | 300,998 |
Series 2007-C32, Class A2
5.924%, 6/15/49 | | | | 450 | | | 387,156 |
Series 2007-C32, Class A3
5.929%, 6/15/49 | | | | 375 | | | 265,982 |
| | | | | | | |
| | | | | | | 6,940,528 |
| | | | | | | |
Non-Agency Floating Rate CMBS – 0.2% | | | | | | | |
Credit Suisse Mortgage Capital Certificates
Series 2006-TF2A, Class SVD
0.921%, 10/15/21(a)(b) | | | | 190 | | | 77,771 |
GS Mortgage Securities Corp. II
Series 2007-EOP, Class E
0.93%, 3/06/20(a)(b) | | | | 105 | | | 70,421 |
| | | | | | | |
| | | | | | | 148,192 |
| | | | | | | |
Total Commercial Mortgage-Backed Securities
(cost $8,824,029) | | | | | | | 7,088,720 |
| | | | | | | |
| | | | | | | |
| | |
| ALLIANCEBERNSTEIN DIVERSIFIED YIELD FUND • | | 15 |
Portfolio of Investments
| | | | | | | |
| | | |
| | | | | Principal
Amount
(000) | | U.S. $ Value |
| |
| | | | | | | |
AGENCIES – 5.8% | | | | | | | |
Agency Debentures – 5.8% | | | | | | | |
Bank of America Corp. – FDIC INS
1.339%, 4/30/12(b) | | US$ | | 620 | | $ | 626,562 |
Citigroup Funding, Inc. – FDIC INS
Series 2
1.369%, 4/30/12(b) | | | | 880 | | | 884,382 |
JP Morgan Chase & Co. – FDIC INS
Series FRN
1.55%, 6/15/12(b) | | | | 895 | | | 897,476 |
Morgan Stanley – FDIC INS
Series FRN
1.638%, 6/20/12(b) | | | | 620 | | | 623,512 |
State Street Bank and Trust Co. – FDIC INS
Series FRN
1.488%, 9/15/11(b) | | | | 522 | | | 525,633 |
| | | | | | | |
| | | |
Total Agencies
(cost $3,548,310) | | | | | | | 3,557,565 |
| | | | | | | |
| | | | | | | |
SUPRANATIONALS – 4.8% | | | | | | | |
European Investment Bank
1.571%, 3/05/12(b) | | | | 1,200 | | | 1,198,582 |
Inter-American Development Bank
1.52%, 3/16/11(b) | | | | 880 | | | 879,477 |
International Bank for Reconstruction & Development
1.506%, 3/04/11(b) | | | | 900 | | | 899,320 |
| | | | | | | |
| | | |
Total Supranationals
(cost $2,980,000) | | | | | | | 2,977,379 |
| | | | | | | |
| | | | | | | |
BANK LOANS – 4.7% | | | | | | | |
Industrial – 3.6% | | | | | | | |
Communications - Telecommunications – 1.5% | | | | | | | |
Level 3 Financing, Inc.
2.71%-3.39%, 3/13/14(b) | | | | 82 | | | 65,481 |
Sorenson Communications, Inc.
2.93%, 8/16/13(b) | | | | 429 | | | 391,715 |
Telesat Canada | | | | | | | |
3.43%-4.27%, 10/31/14(b) | | | | 455 | | | 419,620 |
4.22%, 10/31/14(b) | | | | 39 | | | 36,040 |
| | | | | | | |
| | | | | | | 912,856 |
| | | | | | | |
Consumer Cyclical - Other – 0.5% | | | | | | | |
Hanesbrands, Inc.
5.20%-5.84%, 9/05/13(b) | | | | 328 | | | 320,353 |
| | | | | | | |
| | |
| 16 | | • ALLIANCEBERNSTEIN DIVERSIFIED YIELD FUND |
Portfolio of Investments
| | | | | | | |
| | | |
| | | | | Principal
Amount
(000) | | U.S. $ Value |
| |
| | | | | | | |
Consumer Non-Cyclical – 0.5% | | | | | | | |
Mylan Inc.
3.69%-4.50%, 10/02/14(b) | | US$ | | 291 | | $ | 276,761 |
| | | | | | | |
| | | |
Energy – 0.5% | | | | | | | |
Infrastrux Group, Inc.
4.68%, 11/03/12(b)(d) | | | | 380 | | | 324,349 |
| | | | | | | |
| | | |
Technology – 0.6% | | | | | | | |
First Data Corp.
3.18%-3.19%, 9/24/14(b) | | | | 493 | | | 358,417 |
| | | | | | | |
| | | | | | | 2,192,736 |
| | | | | | | |
Utility – 1.0% | | | | | | | |
Electric – 1.0% | | | | | | | |
FirstLight Power Resources, Inc.
5.75%, 5/01/14(b) | | | | 1,000 | | | 630,000 |
| | | | | | | |
| | | |
Financial Institutions – 0.1% | | | | | | | |
Banking – 0.1% | | | | | | | |
North Las Vegas
8.43%, 5/09/11(b)(d) | | | | 61 | | | 27,436 |
12.68%, 5/09/12(b)(d) | | | | 504 | | | 25,186 |
| | | | | | | |
| | | | | | | 52,622 |
| | | | | | | |
Total Bank Loans
(cost $4,029,363) | | | | | | | 2,875,358 |
| | | | | | | |
| | | | | | | |
CMOS – 4.3% | | | | | | | |
Agency Floating Rate – 2.3% | | | | | | | |
Freddie Mac Reference REMIC
Series 2006-R008, Class FK
0.851%, 7/15/23(b) | | | | 810 | | | 802,376 |
Freddie Mac REMIC
Series 2005-3067, Class FA
0.801%, 11/15/35(b) | | | | 641 | | | 623,266 |
| | | | | | | |
| | | | | | | 1,425,642 |
| | | | | | | |
Non-Agency ARMS – 1.2% | | | | | | | |
Bear Stearns Alt-A Trust | | | | | | | |
Series 2006-3, Class 22A1
5.957%, 5/25/36(c) | | | | 299 | | | 151,937 |
Series 2007-1, Class 21A1
5.694%, 1/25/47(c) | | | | 442 | | | 192,527 |
Countrywide Alternative Loan Trust
Series 2006-OA7, Class 1A1
3.582%, 6/25/46(c) | | | | 383 | | | 103,981 |
Deutsche Mortgage Securities, Inc.
Series 2005-WF1, Class 1A1
5.107%, 6/26/35(a) | | | | 111 | | | 100,424 |
| | |
| ALLIANCEBERNSTEIN DIVERSIFIED YIELD FUND • | | 17 |
Portfolio of Investments
| | | | | | | |
| | | |
| | | | | Principal
Amount
(000) | | U.S. $ Value |
| |
| | | | | | | |
Merrill Lynch Mortgage Investors, Inc.
Series 2005-A9, Class 2A1A
5.15%, 12/25/35(c) | | US$ | | 209 | | $ | 169,147 |
| | | | | | | |
| | | | | | | 718,016 |
| | | | | | | |
Non-Agency Floating Rate – 0.8% | | | | | | | |
Countrywide Alternative Loan Trust | | | | | | | |
Series 2005-62, Class 2A1
2.514%, 12/25/35(b) | | | | 164 | | | 64,666 |
Series 2007-OA3, Class M1
0.748%, 4/25/47(b) | | | | 120 | | | 1,782 |
Greenpoint Mortgage Funding Trust
Series 2006-AR2, Class 4A1
3.514%, 3/25/36(b) | | | | 471 | | | 174,848 |
Lehman XS Trust
Series 2007-2N, Class M1
0.778%, 2/25/37(b) | | | | 395 | | | 3,511 |
Series 2007-4N, Class M1
0.888%, 3/25/47(b) | | | | 400 | | | 3,760 |
Residential Accredit Loans, Inc.
Series 2006-QO7, Class M1
0.848%, 9/25/46(b) | | | | 325 | | | 1,619 |
WaMu Mortgage Pass Through Certificates
Series 2005-AR13, Class B1
1.038%, 10/25/45(b) | | | | 187 | | | 15,007 |
Series 2006-AR17, Class B1
0.828%, 12/25/46(b) | | | | 299 | | | 3,931 |
Series 2007-OA5, Class 1A
2.264%, 6/25/47(b) | | | | 576 | | | 204,327 |
| | | | | | | |
| | | | | | | 473,451 |
| | | | | | | |
Total CMOs
(cost $5,843,327) | | | | | | | 2,617,109 |
| | | | | | | |
| | | | | | | |
GOVERNMENTS - TREASURIES – 3.0% | | | | | | | |
Hungary – 1.0% | | | | | | | |
Hungary Government Bond
Series 14/C
5.50%, 2/12/14 | | HUF | | 172,820 | | | 649,474 |
| | | | | | | |
| | | |
Sweden – 2.0% | | | | | | | |
Sweden Government Bond
Series 1046
5.50%, 10/08/12 | | SEK | | 8,680 | | | 1,204,702 |
| | | | | | | |
| | | |
Total Governments-Treasuries
(cost $1,806,239) | | | | | | | 1,854,176 |
| | | | | | | |
| | | | | | | |
| | |
| 18 | | • ALLIANCEBERNSTEIN DIVERSIFIED YIELD FUND |
Portfolio of Investments
| | | | | | | |
| | | |
| | | | | Principal
Amount
(000) | | U.S. $ Value |
| |
| | | | | | | |
CORPORATES - NON-INVESTMENT GRADES – 2.7% | | | | | | | |
Industrial – 1.7% | | | | | | | |
Basic – 0.7% | | | | | | | |
Abitibi-Consolidated Co. of Canada
6.00%, 6/20/13* | | US$ | | 275 | | $ | 19,250 |
Steel Capital SA for OAO Severstal
9.75%, 7/29/13(a) | | | | 100 | | | 74,750 |
United States Steel Corp.
6.65%, 6/01/37 | | | | 508 | | | 320,235 |
| | | | | | | |
| | | | | | | 414,235 |
| | | | | | | |
Capital Goods – 0.2% | | | | | | | |
Ardagh Glass Finance PLC
7.125%, 6/15/17(a) | | EUR | | 112 | | | 103,731 |
| | | | | | | |
| | | |
Communications - Media – 0.0% | | | | | | | |
ION Media Networks, Inc.
Series A
11.00%, 7/31/13 | | US$ | | 6 | | | 4 |
| | | | | | | |
| | | |
Consumer Cyclical - Other – 0.4% | | | | | | | |
Starwood Hotels & Resorts Worldwide, Inc.
7.375%, 11/15/15 | | | | 316 | | | 256,750 |
| | | | | | | |
| | | |
Consumer Cyclical - Retailers – 0.1% | | | | | | | |
Limited Brands, Inc.
6.90%, 7/15/17 | | | | 33 | | | 27,410 |
| | | | | | | |
| | | |
Consumer Non-Cyclical – 0.3% | | | | | | | |
Aramark Services Inc.
4.528%, 2/01/15(b) | | | | 200 | | | 160,000 |
HCA, Inc.
7.58%, 9/15/25 | | | | 65 | | | 36,968 |
8.50%, 4/15/19(a) | | | | 10 | | | 10,050 |
| | | | | | | |
| | | | | | | 207,018 |
| | | | | | | |
| | | | | | | 1,009,148 |
| | | | | | | |
Financial Institutions – 0.6% | | | | | | | |
Banking – 0.3% | | | | | | | |
Commerzbank Capital Funding Trust I
5.012%, 4/12/16(c) | | EUR | | 100 | | | 26,462 |
Dexia Credit Local
4.30%, 11/18/15(c) | | | | 150 | | | 41,678 |
National Westminster Bank PLC
6.625%, 10/05/09(c) | | | | 200 | | | 148,187 |
| | | | | | | |
| | | | | | | 216,327 |
| | | | | | | |
Brokerage – 0.2% | | | | | | | |
Lehman Brothers Holdings, Inc.
2.95%, 5/25/10(b)(e) | | US$ | | 435 | | | 60,900 |
3.02%, 1/12/12(b)(e) | | | | 440 | | | 61,600 |
| | | | | | | |
| | | | | | | 122,500 |
| | | | | | | |
| | |
| ALLIANCEBERNSTEIN DIVERSIFIED YIELD FUND • | | 19 |
Portfolio of Investments
| | | | | | | |
| | | |
| | | | | Principal
Amount
(000) | | U.S. $ Value |
| |
| | | | | | | |
Insurance – 0.1% | | | | | | | |
Liberty Mutual Group, Inc.
7.80%, 3/15/37(a) | | US$ | | 105 | | $ | 43,050 |
| | | | | | | |
| | | | | | | 381,877 |
| | | | | | | |
Utility – 0.4% | | | | | | | |
Electric – 0.4% | | | | | | | |
Edison Mission Energy
7.00%, 5/15/17 | | | | 115 | | | 86,825 |
NRG Energy, Inc.
7.25%, 2/01/14 | | | | 185 | | | 178,525 |
| | | | | | | |
| | | | | | | 265,350 |
| | | | | | | |
Total Corporates - Non-Investment Grades
(cost $3,281,297) | | | | | | | 1,656,375 |
| | | | | | | |
| | | | | | | |
ASSET-BACKED SECURITIES – 2.5% | | | | | | | |
Home Equity Loans - Floating Rate – 1.6% | | | | | | | |
Bear Stearns Asset Backed Securities, Inc.
Series 2007-HE3, Class M1
0.888%, 4/25/37(b) | | | | 175 | | | 3,990 |
HFC Home Equity Loan Asset Backed Certificates
Series 2006-1, Class M1
0.727%, 1/20/36(b) | | | | 220 | | | 123,707 |
Series 2007-2, Class M1
0.757%, 7/20/36(b) | | | | 415 | | | 106,153 |
Home Equity Loan Trust
Series 2007-FRE1, Class 2AV2
0.598%, 4/25/37(b) | | | | 255 | | | 88,087 |
Lehman XS Trust
Series 2006-18N, Class M2
0.848%, 12/25/36(b) | | | | 415 | | | 3,422 |
Master Asset Backed Securities Trust
Series 2006-NC3, Class M1
0.668%, 10/25/36(b) | | | | 200 | | | 3,140 |
Morgan Stanley Structured Trust
Series 2007-1, Class A2
0.628%, 6/25/37(b) | | | | 430 | | | 218,512 |
Newcastle Mortgage Securities Trust
Series 2007-1, Class 2A1
0.568%, 4/25/37(b) | | | | 293 | | | 193,240 |
Option One Mortgage Loan Trust
Series 2007-2, Class M1
0.798%, 3/25/37(b) | | | | 135 | | | 2,929 |
Wells Fargo Home Equity Trust
Series 2004-1, Class 1A
0.738%, 4/25/34(b) | | | | 492 | | | 258,340 |
| | | | | | | |
| | | | | | | 1,001,520 |
| | | | | | | |
| | |
| 20 | | • ALLIANCEBERNSTEIN DIVERSIFIED YIELD FUND |
Portfolio of Investments
| | | | | | | |
| | | |
| | | | | Principal
Amount
(000) | | U.S. $ Value |
| |
| | | | | | | |
Credit Cards - Floating Rate – 0.8% | | | | | | | |
BA Credit Card Trust
Series 2007-A9, Class A9
0.491%, 11/17/14(b) | | US$ | | 200 | | $ | 181,989 |
Chase Issuance Trust FRN
Series 2007-A1, Class A1
0.471%, 3/15/13(b) | | | | 315 | | | 302,622 |
| | | | | | | |
| | | | | | | 484,611 |
| | | | | | | |
Home Equity Loans - Fixed Rate – 0.1% | | | | | | | |
Home Equity Mortgage Trust
Series 2006-5, Class A1
5.50%, 1/25/37 | | | | 215 | | | 31,537 |
Nationstar NIM Trust
Series 2007-A, Class A
9.97%, 3/25/37(f)(g) | | | | 3 | | | 165 |
| | | | | | | |
| | | | | | | 31,702 |
| | | | | | | |
Other ABS - Floating Rate – 0.0% | | | | | | | |
Topanga CDO Ltd.
Series 2006-2A, Class A1
0.94%, 12/10/46(b)(f)(g) | | | | 350 | | | 3,500 |
| | | | | | | |
| | | |
Total Asset-Backed Securities
(cost $4,103,400) | | | | | | | 1,521,333 |
| | | | | | | |
| | | | | | | |
QUASI-SOVEREIGNS – 1.5% | | | | | | | |
Quasi-Sovereign Bonds – 1.5% | | | | | | | |
Kazakhstan – 0.3% | | | | | | | |
KazMunaiGaz Finance Sub BV
9.125%, 7/02/18(a) | | | | 200 | | | 173,000 |
| | | | | | | |
| | | |
Russia – 1.2% | | | | | | | |
RSHB Capital SA for OJSC Russian Agricultural Bank
7.75%, 5/29/18(a) | | | | 920 | | | 736,000 |
| | | | | | | |
| | | |
Total Quasi-Sovereigns
(cost $1,125,713) | | | | | | | 909,000 |
| | | | | | | |
| | | | | | | |
GOVERNMENTS - SOVEREIGN BONDS – 1.2% | | | | | | | |
Brazil – 0.6% | | | | | | | |
Republic of Brazil
8.25%, 1/20/34 | | | | 330 | | | 375,375 |
| | | | | | | |
| | | |
Peru – 0.6% | | | | | | | |
Republic of Peru
8.375%, 5/03/16 | | | | 65 | | | 75,317 |
9.875%, 2/06/15 | | | | 230 | | | 276,628 |
| | | | | | | |
| | | | | | | 351,945 |
| | | | | | | |
Total Governments - Sovereign Bonds
(cost $652,940) | | | | | | | 727,320 |
| | | | | | | |
| | |
| ALLIANCEBERNSTEIN DIVERSIFIED YIELD FUND • | | 21 |
Portfolio of Investments
| | | | | | | |
| | | |
| | | | | Principal
Amount
(000) | | U.S. $ Value |
| |
| | | | | | | |
GOVERNMENTS - SOVEREIGN AGENCIES – 1.0% | | | | | | | |
United Kingdom – 1.0% | | | | | | | |
Lloyds TSB Bank PLC FRN
2.028%, 4/01/11(a)(b)
(cost $600,000) | | US$ | | 600 | | $ | 599,031 |
| | | | | | | |
| | | | | | | |
EMERGING MARKETS - SOVEREIGNS – 0.6% | | | | | | | |
Indonesia – 0.6% | | | | | | | |
Indonesia Rupiah Credit Linked Note
12.90%, 6/17/22
(cost $391,128) | | IDR | | 3,656,000 | | | 360,760 |
| | | | | | | |
| | | | | | | |
LOCAL GOVERNMENTS - MUNICIPAL BONDS – 0.1% | | | | | | | |
United States – 0.1% | | | | | | | |
Alameda Corridor Transp Auth MBIA
6.60%, 10/01/29
(cost $116,056) | | US$ | | 100 | | | 85,372 |
| | | | | | | |
| | | | | | | |
SHORT-TERM INVESTMENTS – 0.7% | | | | | | | |
Commercial Paper – 0.7% | | | | | | | |
Unicredito Italiano NY
Series YCD
1.051%, 5/15/09(b)
(cost $444,988) | | | | 445 | | | 444,980 |
| | | | | | | |
| | | |
Total Investments – 93.2%
(cost $70,994,580) | | | | | | | 57,333,425 |
Other assets less liabilities – 6.8% | | | | | | | 4,167,868 |
| | | | | | | |
| | | |
Net Assets – 100.0% | | | | | | $ | 61,501,293 |
| | | | | | | |
FINANCIAL FUTURES CONTRACTS (see Note D)
| | | | | | | | | | | | | | |
| Type | | Number of
Contracts | | Expiration
Month | | Original
Value | | Value at
April 30,
2009 | | Unrealized
Appreciation/
(Depreciation) | |
Purchased Contracts | | | | | | | | | | | | |
Euro-Bobl Future | | 3,000 | | June 2009 | | $ | 461,814 | | $ | 460,359 | | $ | (1,455 | ) |
Euro-Bobl Future | | 15,000 | | June 2009 | | | 2,309,566 | | | 2,301,797 | | | (7,769 | ) |
US 5 Yr Note | | 8,000 | | June 2009 | | | 937,644 | | | 937,125 | | | (519 | ) |
| | | | | | | | | | | | | | |
Sold Contracts | | | | | | | | | | | | | | |
US Treasury Bond Future | | 16,000 | | June 2009 | | | 2,020,837 | | | 1,961,000 | | | 59,837 | |
| | | | | | | | | | | | | | |
| | | | | | | | | | | | $ | 50,094 | |
| | | | | | | | | | | | | | |
| | |
| 22 | | • ALLIANCEBERNSTEIN DIVERSIFIED YIELD FUND |
Portfolio of Investments
FORWARD CURRENCY EXCHANGE CONTRACTS (see Note D)
| | | | | | | | | | | | |
| | | Contract
Amount
(000) | | U.S. $
Value on
Origination
Date | | U.S. $
Value at
April 30,
2009 | | Unrealized
Appreciation/
(Depreciation) | |
Buy Contracts: | | | | | | | | | | | | |
Australian Dollar settling 6/04/09 | | 918 | | $ | 650,581 | | $ | 665,449 | | $ | 14,868 | |
Euro Dollar settling 5/07/09 | | 19 | | | 24,526 | | | 25,791 | | | 1,265 | |
Euro Dollar settling 5/07/09 | | 105 | | | 132,358 | | | 139,328 | | | 6,970 | |
Euro Dollar settling 5/07/09 | | 537 | | | 696,488 | | | 710,761 | | | 14,273 | |
Euro Dollar settling 5/07/09 | | 439 | | | 580,750 | | | 580,903 | | | 153 | |
New Zealand Dollar settling 5/20/09 | | 609 | | | 305,111 | | | 344,233 | | | 39,122 | |
Norwegian Kroner settling 6/03/09 | | 4,282 | | | 645,382 | | | 651,420 | | | 6,038 | |
Norwegian Kroner settling 6/03/09 | | 3,877 | | | 577,411 | | | 589,787 | | | 12,376 | |
Swedish Krona settling 5/28/09 | | 10,718 | | | 1,262,467 | | | 1,332,384 | | | 69,917 | |
Swiss Franc settling 5/22/09 | | 108 | | | 96,481 | | | 94,859 | | | (1,622 | ) |
| | | | | | | | | | | | |
Sale Contracts: | | | | | | | | | | | | |
British Pound settling 6/22/09 | | 682 | | | 992,273 | | | 1,008,528 | | | (16,255 | ) |
Euro Dollar settling 5/07/09 | | 1,482 | | | 1,887,557 | | | 1,960,873 | | | (73,316 | ) |
Euro Dollar settling 5/07/09 | | 957 | | | 1,201,010 | | | 1,265,797 | | | (64,787 | ) |
Euro Dollar settling 5/07/09 | | 20 | | | 26,046 | | | 26,153 | | | (107 | ) |
Euro Dollar settling 5/07/09 | | 21 | | | 27,997 | | | 28,057 | | | (60 | ) |
Euro Dollar settling 5/07/09 | | 91 | | | 119,639 | | | 120,097 | | | (458 | ) |
Euro Dollar settling 5/07/09 | | 72 | | | 93,800 | | | 95,351 | | | (1,551 | ) |
Euro Dollar settling 7/08/09 | | 12 | | | 15,413 | | | 15,420 | | | (7 | ) |
Hungary Forints settling 5/13/09 | | 139,987 | | | 554,601 | | | 640,968 | | | (86,367 | ) |
Japanese Yen settling 5/14/09 | | 9,358 | | | 94,643 | | | 94,902 | | | (259 | ) |
New Zealand Dollar settling 5/20/09 | | 607 | | | 309,782 | | | 342,809 | | | (33,027 | ) |
Swedish Krona settling 5/28/09 | | 5,574 | | | 654,650 | | | 692,891 | | | (38,241 | ) |
Swedish Krona settling 5/28/09 | | 9,979 | | | 1,209,290 | | | 1,240,499 | | | (31,209 | ) |
Swiss Franc settling 5/22/09 | | 1,445 | | | 1,290,320 | | | 1,266,137 | | | 24,183 | |
Swiss Franc settling 5/22/09 | | 73 | | | 63,001 | | | 63,652 | | | (651 | ) |
| (a) | | Security is exempt from registration under Rule 144A of the Securities Act of 1933. These securities are considered liquid and may be resold in transactions exempt from registration, normally to qualified institutional buyers. At April 30, 2009, the aggregate market value of these securities amounted to $2,992,684 or 4.9% of net assets. |
| (b) | | Floating Rate Security. Stated interest rate was in effect at April 30, 2009. |
| (c) | | Variable rate coupon, rate shown as of April 30, 2009. |
| (d) | | Pay-In-Kind Payments (PIK). |
| (e) | | Security is in default and is non-income producing. |
| (f) | | Illiquid security, valued at fair value. |
| (g) | | Security is exempt from registration under Rule 144A of the Securities Act of 1933. These securities, which represent 0.01% of net assets as of April 30, 2009, are considered illiquid and restricted (see Note A). |
| * | | Security is in default. |
| | | | | | | | | | | |
| Restricted Securities | | Acquisition
Date | | Acquisition
Cost | | Market
Value | | Percentage of
Net Assets | |
Topanga CDO Ltd.
Series 2006-2A, Class A1
0.94%, 12/10/46 | | 11/27/06 | | $ | 350,000 | | $ | 3,500 | | 0.01 | % |
Nationstar NIM Trust
Series 2007-A, Class A
9.97%, 3/25/37 | | 4/12/07 | | | 75,000 | | | 165 | | 0.00 | % |
| | |
| ALLIANCEBERNSTEIN DIVERSIFIED YIELD FUND • | | 23 |
Portfolio of Investments
| | | The fund currently owns investments collateralized by subprime mortgage loans. Subprime loans are offered to homeowners who do not have a history of debt or who have had problems meeting their debt obligations. Because repayment is less certain, subprime borrowers pay a higher rate of interest than prime borrowers. As of April 30, 2009, the fund’s total exposure to subprime investments was 3.18% of net assets. These investments are valued in accordance with the fund’s Valuation Policies (see Note A for additional details). |
Currency Abbreviations:
|
| EUR – Euro Dollar |
| GBP – Great British Pound |
| HUF – Hungarian Forint |
| IDR – Indonesian Rupiah |
| JPY – Japanese Yen |
| SEK – Swedish Krona |
Glossary:
ABS – Asset-Backed Securities
ARMS – Adjustable Rate Mortgages
CMBS – Commercial Mortgage-Backed Securities
CMOS – Collateralized Mortgage Obligations
FRN – Floating Rate Note
LP – Limited Partnership
MBIA – MBIA Insurance Corporation
OJSC – Open Joint Stock Company
REMIC – Real Estate Mortgage Investment Conduit
See notes to financial statements.
| | |
| 24 | | • ALLIANCEBERNSTEIN DIVERSIFIED YIELD FUND |
Portfolio of Investments
STATEMENT OF ASSETS & LIABILITIES
April 30, 2009 (unaudited)
| | | | |
| Assets | | | | |
Investments in securities, at value (cost $70,994,580) | | $ | 57,333,425 | |
Cash | | | 3,528,642 | (a) |
Foreign currencies, at value (cost $12,796) | | | 12,986 | |
Receivable for investment securities sold and foreign
currency contracts | | | 3,811,545 | |
Receivable for capital stock sold | | | 725,021 | |
Interest receivable | | | 541,346 | |
Unrealized appreciation of forward currency exchange contracts | | | 189,165 | |
Receivable for variation margin on futures contracts | | | 76,448 | |
Receivable from Adviser | | | 22,916 | |
| | | | |
Total assets | | | 66,241,494 | |
| | | | |
| Liabilities | | | | |
Payable for investment securities purchased and foreign currency contracts | | | 3,499,432 | |
Payable for capital stock redeemed | | | 602,561 | |
Unrealized depreciation of forward currency exchange contracts | | | 347,917 | |
Dividends payable | | | 67,162 | |
Administrative fee payable | | | 38,553 | |
Distribution fee payable | | | 25,212 | |
Transfer Agent fee payable | | | 4,624 | |
Accrued expenses and other liabilities | | | 154,740 | |
| | | | |
Total liabilities | | | 4,740,201 | |
| | | | |
Net Assets | | $ | 61,501,293 | |
| | | | |
| Composition of Net Assets | | | | |
Capital stock, at par | | $ | 8,418 | |
Additional paid-in capital | | | 109,652,333 | |
Undistributed net investment income | | | 71,660 | |
Accumulated net realized loss on investment
and foreign currency transactions | | | (34,463,670 | ) |
Net unrealized depreciation of investments
and foreign currency denominated assets and liabilities | | | (13,767,448 | ) |
| | | | |
| | $ | 61,501,293 | |
| | | | |
Net Asset Value Per Share—21 billion shares of capital stock authorized, $.001 par value
| | | | | | | | | |
| Class | | Net Assets | | Shares
Outstanding | | Net Asset
Value | |
| A | | $ | 38,638,021 | | 5,289,796 | | $ | 7.30 | * |
| | |
| B | | $ | 8,916,728 | | 1,219,510 | | $ | 7.31 | |
| | |
| C | | $ | 10,284,220 | | 1,407,360 | | $ | 7.31 | |
| | |
| Advisor | | $ | 3,290,666 | | 450,657 | | $ | 7.30 | |
| | |
| R | | $ | 341,367 | | 46,877 | | $ | 7.28 | |
| | |
| K | | $ | 22,053 | | 3,019 | | $ | 7.30 | |
| | |
| I | | $ | 8,238 | | 1,130 | | $ | 7.29 | |
| | |
| * | | The maximum offering price per share for Class A shares was $7.62 which reflects a sales charge of 4.25%. |
| (a) | | An amount of $49,800 has been segregated to collateralize margin requirement for the open futures contracts outstanding at April 30, 2009. |
See notes to financial statements.
| | |
| ALLIANCEBERNSTEIN DIVERSIFIED YIELD FUND • | | 25 |
Statement of Assets & Liabilities
STATEMENT OF OPERATIONS
Six Months Ended April 30, 2009 (unaudited)
| | | | | | | | |
| Investment Income | | | | | | | | |
Interest | | | | | | $ | 1,776,270 | |
| | | | | | | | |
| Expenses | | | | | | | | |
Advisory fee (see Note B) | | $ | 154,956 | | | | | |
Distribution fee—Class A | | | 55,581 | | | | | |
Distribution fee—Class B | | | 55,671 | | | | | |
Distribution fee—Class C | | | 50,575 | | | | | |
Distribution fee—Class R | | | 716 | | | | | |
Distribution fee—Class K | | | 26 | | | | | |
Transfer agency—Class A | | | 29,506 | | | | | |
Transfer agency—Class B | | | 11,216 | | | | | |
Transfer agency—Class C | | | 8,870 | | | | | |
Transfer agency—Advisor Class | | | 2,683 | | | | | |
Transfer agency—Class R | | | 225 | | | | | |
Transfer agency—Class K | | | 18 | | | | | |
Custodian | | | 64,399 | | | | | |
Administrative | | | 55,061 | | | | | |
Registration fees | | | 54,627 | | | | | |
Audit | | | 47,731 | | | | | |
Legal | | | 23,094 | | | | | |
Printing | | | 23,308 | | | | | |
Directors’ fees | | | 24,861 | | | | | |
Miscellaneous | | | 6,099 | | | | | |
| | | | | | | | |
Total expenses | | | 669,223 | | | | | |
Less: expenses waived by the Adviser
(see Note B) | | | (320,707 | ) | | | | |
| | | | | | | | |
Net expenses | | | | | | | 348,516 | |
| | | | | | | | |
Net investment income | | | | | | | 1,427,754 | |
| | | | | | | | |
| Realized and Unrealized Gain (Loss) on Investment and Foreign Currency Transactions | | | | | | | | |
Net realized gain (loss) on: | | | | | | | | |
Investment transactions | | | | | | | (2,308,204 | ) |
Futures contracts | | | | | | | (1,328,555 | ) |
Swap contracts | | | | | | | 43,673 | |
Foreign currency transactions | | | | | | | 244,054 | |
Net change in unrealized appreciation/
(depreciation) of: | | | | | | | | |
Investment transactions | | | | | | | 2,474,782 | |
Futures contracts | | | | | | | (454,982 | ) |
Swap contracts | | | | | | | 2,140 | |
Foreign currency denominated assets and liabilities | | | | | | | 261,156 | |
| | | | | | | | |
Net loss on investments and foreign currency transactions | | | | | | | (1,065,936 | ) |
| | | | | | | | |
Net Increase in Net Assets from Operations | | | | | | $ | 361,818 | |
| | | | | | | | |
See notes to financial statements.
| | |
| 26 | | • ALLIANCEBERNSTEIN DIVERSIFIED YIELD FUND |
Statement of Operations
STATEMENT OF CHANGES IN NET ASSETS
| | | | | | | | |
| | | Six Months Ended
April 30, 2009
(unaudited) | | | Year Ended
October 31,
2008 | |
| Increase (Decrease) in Net Assets from Operations | | | | | | | | |
Net investment income | | $ | 1,427,754 | | | $ | 3,532,950 | |
Net realized loss on investments and foreign currency transactions | | | (3,349,032 | ) | | | (913,381 | ) |
Net change in unrealized appreciation/depreciation of investments and foreign currency denominated assets and liabilities | | | 2,283,096 | | | | (15,501,374 | ) |
Contributions from Adviser (see Note B) | | | – 0 | – | | | 6,203 | |
| | | | | | | | |
Net increase (decrease) in net assets from operations | | | 361,818 | | | | (12,875,602 | ) |
| Dividends to Shareholders from: | | | | | | | | |
Net investment income | | | | | | | | |
Class A | | | (897,255 | ) | | | (2,077,939 | ) |
Class B | | | (231,999 | ) | | | (737,950 | ) |
Class C | | | (209,958 | ) | | | (475,843 | ) |
Advisor Class | | | (86,663 | ) | | | (238,825 | ) |
Class R | | | (6,605 | ) | | | (8,868 | ) |
Class K | | | (504 | ) | | | (4,418 | ) |
Class I | | | (204 | ) | | | (432 | ) |
| Capital Stock Transactions | | | | | | | | |
Net decrease | | | (6,014,738 | ) | | | (11,828,818 | ) |
| | | | | | | | |
Total decrease | | | (7,086,108 | ) | | | (28,248,695 | ) |
| Net Assets | | | | | | | | |
Beginning of period | | | 68,587,401 | | | | 96,836,096 | |
| | | | | | | | |
End of period (including undistributed net investment income of $71,660 and $77,094, respectively) | | $ | 61,501,293 | | | $ | 68,587,401 | |
| | | | | | | | |
See notes to financial statements.
| | |
| ALLIANCEBERNSTEIN DIVERSIFIED YIELD FUND • | | 27 |
Statement of Changes in Net Assets
NOTES TO FINANCIAL STATEMENTS
April 30, 2009 (unaudited)
NOTE A
Significant Accounting Policies
AllianceBernstein Diversified Yield Fund (the “Fund”), formerly AllianceBernstein Global Strategic Income Trust, Inc., was incorporated in the State of Maryland on October 25, 1995 as a diversified, open-end management investment company. The Fund offers Class A, Class B, Class C, Advisor Class, Class R, Class K and Class I shares. Class A shares are sold with a front-end sales charge of up to 4.25% for purchases not exceeding $1,000,000. With respect to purchases of $1,000,000 or more, Class A shares redeemed within one year of purchase may be subject to a contingent deferred sales charge of 1%. Class B shares are currently sold with a contingent deferred sales charge which declines from 4% to zero depending on the period of time the shares are held. Effective January 31, 2009, sales of Class B shares of the Fund to new investors were suspended. Class B shares will only be issued (i) upon the exchange of Class B shares from another AllianceBernstein Fund, (ii) for purposes of dividend reinvestment, (iii) through the Fund’s Automatic Investment Program (the “Program”) for accounts that established the Program prior to January 31, 2009, and (iv) for purchases of additional shares by Class B shareholders as of January 31, 2009. The ability to establish a new Automatic Investment Program for accounts containing Class B shares was suspended as of January 31, 2009. Class B shares will automatically convert to Class A shares eight years after the end of the calendar month of purchase. Class C shares are subject to a contingent deferred sales charge of 1% on redemptions made within the first year after purchase. Class R and Class K shares are sold without an initial or contingent deferred sales charge. Advisor Class and Class I shares are sold without an initial or contingent deferred sales charge and are not subject to ongoing distribution expenses. All seven classes of shares have identical voting, dividend, liquidation and other rights and the same terms and conditions, except that the classes bear different distribution and transfer agency expenses. Each class has exclusive voting rights with respect to its distribution plan. The financial statements have been prepared in conformity with U.S. generally accepted accounting principles, which require management to make certain estimates and assumptions that affect the reported amounts of assets and liabilities in the financial statements and amounts of income and expenses during the reporting period. Actual results could differ from those estimates. The following is a summary of significant accounting policies followed by the Fund.
1. Security Valuation
Portfolio securities are valued at their current market value determined on the basis of market quotations or, if market quotations are not readily available or are deemed unreliable, at “fair value” as determined in accordance with procedures established by and under the general supervision of the Fund’s Board of Directors.
| | |
| 28 | | • ALLIANCEBERNSTEIN DIVERSIFIED YIELD FUND |
Notes to Financial Statements
In general, the market value of securities which are readily available and deemed reliable are determined as follows. Securities listed on a national securities exchange (other than securities listed on the NASDAQ Stock Market, Inc. (“NASDAQ”)) or on a foreign securities exchange are valued at the last sale price at the close of the exchange or foreign securities exchange. If there has been no sale on such day, the securities are valued at the mean of the closing bid and ask prices on such day. Securities listed on more than one exchange are valued by reference to the principal exchange on which the securities are traded; securities listed only on NASDAQ are valued in accordance with the NASDAQ Official Closing Price; listed put or call options are valued at the last sale price. If there has been no sale on that day, such securities will be valued at the closing bid prices on that day; open futures contracts and options thereon are valued using the closing settlement price or, in the absence of such a price, the most recent quoted bid price. If there are no quotations available for the day of valuation, the last available closing settlement price is used; securities traded in the over-the-counter market (“OTC”) are valued at the mean of the current bid and asked prices as reported by the National Quotation Bureau or other comparable sources; U.S. Government securities and other debt instruments having 60 days or less remaining until maturity are valued at amortized cost if their original maturity was 60 days or less; or by amortizing their fair value as of the 61st day prior to maturity if their original term to maturity exceeded 60 days; fixed-income securities, including mortgage backed and asset backed securities, may be valued on the basis of prices provided by a pricing service or at a price obtained from one or more of the major broker/dealers. In cases where broker/dealer quotes are obtained, AllianceBernstein L.P. (the “Adviser”) may establish procedures whereby changes in market yields or spreads are used to adjust, on a daily basis, a recently obtained quoted price on a security; and OTC and other derivatives are valued on the basis of a quoted bid price or spread from a major broker/dealer in such security. Investments in money market funds are valued at their net asset value each day.
Securities for which market quotations are not readily available (including restricted securities) or are deemed unreliable are valued at fair value. Factors considered in making this determination may include, but are not limited to, information obtained by contacting the issuer, analysts, analysis of the issuer’s financial statements or other available documents. In addition, the Fund may use fair value pricing for securities primarily traded in non-U.S. markets because, most foreign markets close well before the Fund values its securities at 4:00 p.m., Eastern Time. The earlier close of these foreign markets gives rise to the possibility that significant events, including broad market moves, may have occurred in the interim and may materially affect the value of those securities.
| | |
| ALLIANCEBERNSTEIN DIVERSIFIED YIELD FUND • | | 29 |
Notes to Financial Statements
2. Fair Value Measurements
The Fund adopted Financial Accounting Standards Board Statement of Financial Accounting Standards No. 157, Fair Value Measurements (“FAS 157”), effective December 1, 2007. In accordance with FAS 157, fair value is defined as the price that the Fund would receive to sell an asset or pay to transfer a liability in an orderly transaction between market participants at the measurement date. FAS 157 also establishes a framework for measuring fair value, and a three-level hierarchy for fair value measurements based upon the transparency of inputs to the valuation of an asset or liability. Inputs may be observable or unobservable and refer broadly to the assumptions that market participants would use in pricing the asset or liability. Observable inputs reflect the assumptions market participants would use in pricing the asset or liability based on market data obtained from sources independent of the Fund. Unobservable inputs reflect the Fund’s own assumptions about the assumptions that market participants would use in pricing the asset or liability developed based on the best information available in the circumstances. Each investment is assigned a level based upon the observability of the inputs which are significant to the overall valuation. The three-tier hierarchy of inputs is summarized below.
| | • | | Level 1—quoted prices in active markets for identical investments |
| | • | | Level 2—other significant observable inputs (including quoted prices for similar investments, interest rates, prepayment speeds, credit risk, etc.) |
| | • | | Level 3—significant unobservable inputs (including the Fund’s own assumptions in determining the fair value of investments) |
The following table summarizes the valuation of the Fund’s investments by the above fair value hierarchy levels as of April 30, 2009:
| | | | | | | | |
Level | | Investments in
Securities | | | Other
Financial
Instruments* | |
Level 1 | | $ | – 0 | – | | $ | 50,094 | |
Level 2 | | | 50,200,431 | | | | (158,752 | ) |
Level 3 | | | 7,132,994 | | | | – 0 | – |
| | | | | | | | |
Total | | $ | 57,333,425 | | | $ | (108,658 | ) |
| | | | | | | | |
| * | | Other financial instruments are derivative instruments, such as futures and forwards contracts, which are valued at the unrealized appreciation/depreciation on the instrument. |
| | |
| 30 | | • ALLIANCEBERNSTEIN DIVERSIFIED YIELD FUND |
Notes to Financial Statements
Following is a reconciliation of investments in which significant unobservable inputs (Level 3) were used in determining fair value:
| | | | | | | | |
| | | Investments
In Securities | | | Other
Financial
Instruments | |
Balance as of 10/31/08 | | $ | 19,912,958 | | | $ | – 0 | – |
Accrued discounts/premiums | | | 25,519 | | | | – 0 | – |
Realized loss | | | (2,088,793 | ) | | | – 0 | – |
Change in unrealized appreciation/depreciation | | | 764,985 | | | | – 0 | – |
Net purchases (sales) | | | (12,139,545) | | | | – 0 | – |
Net transfers in and/or out of Level 3 | | | 657,870 | | | | – 0 | – |
| | | | | | | | |
Balance as of 4/30/09 | | $ | 7,132,994 | | | $ | – 0 | – |
| | | | | | | | |
Net change in unrealized appreciation/depreciation from investments held as of 4/30/09 | | $ | (889,910 | )** | | $ | – 0 | – |
| | | | | | | | |
| ** | | The unrealized appreciation/depreciation is included in net change in unrealized appreciation/depreciation of investments in the accompanying statement of operations. |
3. Currency Translation
Assets and liabilities denominated in foreign currencies and commitments under forward currency exchange contracts are translated into U.S. dollars at the mean of the quoted bid and asked prices of such currencies against the U.S. dollar. Purchases and sales of portfolio securities are translated into U.S. dollars at the rates of exchange prevailing when such securities were acquired or sold. Income and expenses are translated into U.S. dollars at rates of exchange prevailing when accrued.
Net realized gain or loss on foreign currency transactions represents foreign exchange gains and losses from sales and maturities of foreign fixed income investments, foreign currency exchange contracts, holding of foreign currencies, currency gains or losses realized between the trade and settlement dates on foreign investment transactions, and the difference between the amounts of dividends, interest and foreign withholding taxes recorded on the Fund’s books and the U.S. dollar equivalent amounts actually received or paid. Net unrealized currency gains and losses from valuing foreign currency denominated assets and liabilities at period end exchange rates are reflected as a component of unrealized appreciation and depreciation of investments and foreign currency denominated assets and liabilities.
4. Taxes
It is the Fund’s policy to meet the requirements of the Internal Revenue Code applicable to regulated investment companies and to distribute all of its investment company taxable income and net realized gains, if any, to shareholders. Therefore, no provisions for federal income or excise taxes are required. The
| | |
| ALLIANCEBERNSTEIN DIVERSIFIED YIELD FUND • | | 31 |
Notes to Financial Statements
Fund may be subject to taxes imposed by countries in which it invests. Such taxes are generally based on income and/or capital gains earned or repatriated. Taxes are accrued and applied to net investment income, net realized gains and net unrealized appreciation/depreciation as such income and/or gains are earned.
In accordance with the FASB Interpretation No. 48, “Accounting for Uncertainties in Income Taxes” (“FIN 48”), management has analyzed the Fund’s tax positions taken on federal and state income tax returns for all open tax years (the current and the prior three tax years) and has concluded that no provision for income tax is required in the Fund’s financial statements.
5. Investment Income and Investment Transactions
Interest income is accrued daily. Investment transactions are accounted for on the date securities are purchased or sold. Investment gains or losses are determined on the identified cost basis. The Fund amortizes premiums and accretes discounts as adjustments to interest income.
6. Class Allocations
All income earned and expenses incurred by the Fund are borne on a pro-rata basis by each settled class of shares, based on the proportionate interest in the Fund represented by the net assets of such class, except for class specific expenses which are allocated to the respective class. Realized and unrealized gains and losses are allocated among various share classes based on their respective net assets.
7. Dividends and Distributions
Dividends and distributions to shareholders are recorded on the ex-dividend date. Income and capital gains distributions are determined in accordance with federal tax regulations and may differ from those determined in accordance with U.S. generally accepted accounting principles. To the extent these differences are permanent, such amounts are reclassified within the capital accounts based on their federal tax basis treatment; temporary differences do not require such reclassification.
8. Repurchase Agreements
It is the Fund’s policy that its custodian or designated subcustodian take control of securities as collateral under repurchase agreements and to determine on a daily basis that the value of such securities is sufficient to cover the value of the repurchase agreements. If the seller defaults and the value of the collateral declines, or if bankruptcy proceedings are commenced with respect to seller of the security, realization of collateral by the Fund may be delayed or limited.
| | |
| 32 | | • ALLIANCEBERNSTEIN DIVERSIFIED YIELD FUND |
Notes to Financial Statements
NOTE B
Advisory Fee and Other Transactions with Affiliates
Under the terms of the investment advisory agreement, the Fund pays the Adviser an advisory fee at an annual rate of .50% of the first $2.5 billion, .45% of the next $2.5 billion and .40% in excess of $5 billion, of the Fund’s average daily net assets. The fee is accrued daily and paid monthly. Effective November 5, 2007, the Adviser has agreed to waive its fees and bear certain expenses to the extent necessary to limit total operating expenses on an annual basis to .90%, 1.60%, 1.60%, .60%, 1.10%, .85% and .60% of the daily average net assets for the Class A, Class B, Class C, Advisor Class, Class R, Class K and Class I shares, respectively. This waiver extends through October 31, 2009 and then may be extended by the Adviser for additional one-year terms. For the six months ended April 30, 2009, such reimbursement amounted to $320,707.
During the year ended October 31, 2008, the Adviser reimbursed the Fund $6,203 for trading losses incurred due to a trade entry error.
Pursuant to the investment advisory agreement, the Fund may reimburse the Adviser for certain legal and accounting services provided to the Fund by the Adviser. For the six months ended April 30, 2009, such fees amounted to $55,061.
The Fund compensates AllianceBernstein Investor Services, Inc. (“ABIS”), a wholly-owned subsidiary of the Adviser, under a Transfer Agency Agreement for providing personnel and facilities to perform transfer agency services for the Fund. ABIS may make payments to intermediaries that provide omnibus account services, sub-accounting services and/or networking services. The compensation retained by ABIS amounted to $23,862 for the six months ended April 30, 2009.
For the six months ended April 30, 2009, there was no reduction for the expenses of Class A, Class B, Class C and Advisor Class shares under an expense offset arrangement with ABIS.
AllianceBernstein Investments, Inc. (the “Distributor”), a wholly-owned subsidiary of the Adviser, serves as the distributor of the Fund’s shares. The Distributor has advised the Fund that it has retained front-end sales charges of $1,294 from the sale of Class A shares and received $74, $9,709 and $0 in contingent deferred sales charges imposed upon redemption by shareholders of Class A, Class B and Class C shares, respectively, for the six months ended April 30, 2009.
NOTE C
Distribution Services Agreement
The Fund has adopted a Distribution Services Agreement (the “Agreement”) pursuant to Rule 12b-1 under the Investment Company Act of 1940. Under the
| | |
| ALLIANCEBERNSTEIN DIVERSIFIED YIELD FUND • | | 33 |
Notes to Financial Statements
Agreement the Fund pays distribution and servicing fees to the Distributor at an annual rate of up to .30% of the average daily net assets attributable to the Class A shares, 1% of the average daily net assets attributable to the Class B and Class C shares, .50% of the Fund’s average daily net assets attributable to Class R shares and .25% of the Fund’s average daily net assets attributable to Class K shares. There are no distribution and servicing fees on the Class I and Advisor Class shares. The fees are accrued daily and paid monthly. The Agreement provides that the Distributor will use such payments in their entirety for distribution assistance and promotional activities. The Distributor has incurred expenses in excess of the distribution costs reimbursed by the Fund in the amounts of $8,467,486, $1,839,191, $18,269 and $12,915 for Class B, Class C, Class R and Class K shares, respectively. While such costs may be recovered from the Fund in future periods so long as the Agreement is in effect, the rate of the distribution and servicing fees payable under the Agreement may not be increased without a shareholder vote. In accordance with the Agreement, there is no provision for recovery of unreimbursed distribution costs, incurred by the Distributor, beyond the current fiscal period for Class A shares. The Agreement also provides that the Adviser may use its own resources to finance the distribution of the Fund’s shares.
NOTE D
Investment Transactions
Purchases and sales of investment securities (excluding short-term investments) for the six months ended April 30, 2009, were as follows:
| | | | | | | |
| | | Purchases | | | Sales |
Investment securities (excluding U.S. government securities) | | $ | 18,608,891 | | | $ | 23,391,903 |
U.S. government securities | | | – 0 | – | | | 2,164,956 |
The cost of investments for federal income tax purposes was substantially the same as cost for financial reporting purposes. Accordingly, gross unrealized appreciation and unrealized depreciation (excluding foreign currency contracts, futures contracts and swap contracts) are as follows:
| | | | |
Gross unrealized appreciation | | $ | 658,168 | |
Gross unrealized depreciation | | | (14,319,323 | ) |
| | | | |
Net unrealized depreciation | | $ | (13,661,155 | ) |
| | | | |
1. Financial Futures Contracts
The Fund may buy or sell financial futures contracts for the purpose of hedging its portfolio against adverse effects of anticipated movements in the market or for investment purposes. The Fund bears the market risk that arises from changes in the value of these financial instruments and the imperfect correlation between movements in the price of the futures contracts and movements in the price of the securities hedged or used for cover. The Fund may also purchase or sell
| | |
| 34 | | • ALLIANCEBERNSTEIN DIVERSIFIED YIELD FUND |
Notes to Financial Statements
futures contracts for foreign currencies or options thereon for non-hedging purposes as a means of making direct investment in foreign currencies, as described below under “Currency Transactions”.
At the time the Fund enters into a futures contract, the Fund deposits and maintains as collateral an initial margin with the broker, as required by the exchange on which the transaction is effected. Pursuant to the contract, the Fund agrees to receive from or pay to the broker an amount of cash equal to the daily fluctuation in the value of the contract. Such receipts or payments are known as variation margin and are recorded by the Fund as unrealized gains or losses. Risks may arise from the potential inability of a counterparty to meet the terms of the contract. When the contract is closed, the Fund records a realized gain or loss equal to the difference between the value of the contract at the time it was opened and the time it was closed.
2. Forward Currency Exchange Contracts
The Fund may enter into forward currency exchange contracts in order to hedge its exposure to changes in foreign currency exchange rates on its foreign portfolio holdings or to hedge certain firm purchase and sales commitments denominated in foreign currencies and for non-hedging purposes as a means of making direct investments in foreign currencies, as described below under “Currency Transactions”. A forward currency exchange contract is a commitment to purchase or sell a foreign currency at a future date at a negotiated forward rate. The gain or loss arising from the difference between the original contract and the closing of such contract would be included in net realized gain or loss on foreign currency transactions.
Fluctuations in the value of open forward currency exchange contracts are recorded for financial reporting purposes as unrealized appreciation and depreciation by the Fund.
The Fund’s custodian will place and maintain cash not available for investment or other liquid assets in a separate account of the Fund having a value at least equal to the aggregate amount of the Fund’s commitments under forward currency exchange contracts entered into with respect to position hedges. Risks may arise from the potential inability of a counterparty to meet the terms of a contract and from unanticipated movements in the value of a foreign currency relative to the U.S. dollar. The face or contract amount, in U.S. dollars reflects the total exposure the Fund has in that particular currency contract.
3. Option Transactions
For hedging and investment purposes, the Fund may purchase and write (sell) put and call options on U.S. and foreign securities, including government securities, and foreign currencies that are traded on U.S. and foreign securities exchanges and over-the-counter markets. The Fund may also use options transactions for non-hedging purposes as a means of making direct investments in foreign currencies, as described below under “Currency Transactions”.
| | |
| ALLIANCEBERNSTEIN DIVERSIFIED YIELD FUND • | | 35 |
Notes to Financial Statements
The risk associated with purchasing an option is that the Fund pays a premium whether or not the option is exercised. Additionally, the Fund bears the risk of loss of the premium and change in market value should the counterparty not perform under the contract. Put and call options purchased are accounted for in the same manner as portfolio securities. The cost of securities acquired through the exercise of call options is increased by premiums paid. The proceeds from securities sold through the exercise of put options are decreased by the premiums paid.
When the Fund writes an option, the premium received by the Fund is recorded as a liability and is subsequently adjusted to the current market value of the option written. Premiums received from written options which expire unexercised are recorded by the Fund on the expiration date as realized gains from options written. The difference between the premium received and the amount paid on effecting a closing purchase transaction, including brokerage commissions, is also treated as a realized gain, or if the premium received is less than the amount paid for the closing purchase transaction, as a realized loss. If a call option is exercised, the premium received is added to the proceeds from the sale of the underlying security or currency in determining whether the Fund has realized a gain or loss. If a put option is exercised, the premium received reduces the cost basis of the security or currency purchased by the Fund. In writing an option, the Fund bears the market risk of an unfavorable change in the price of the security or currency underlying the written option. Exercise of an option written by the Fund could result in the Fund selling or buying a security or currency at a price different from the current market value. For the six months ended April 30, 2009, the Fund had no transactions in written options.
4. Swap Agreements
The Fund may enter into swaps to hedge its exposure to interest rates, credit risk, or currencies or for investment purposes. The Fund may also enter into swaps for non-hedging purposes as a means of making direct investments in foreign currencies, as described below under “Currency Transactions”. A swap is an agreement that obligates two parties to exchange a series of cash flows at specified intervals based upon or calculated by reference to changes in specified prices or rates for a specified amount of an underlying asset. The payment flows are usually netted against each other, with the difference being paid by one party to the other. In addition, collateral may be pledged or received by the Fund in accordance with the terms of the respective swap agreements to provide value and recourse to the Fund or its counterparties in the event of default or bankruptcy/insolvency.
Risks may arise as a result of the failure of the counterparty to the swap contract to comply with the terms of the swap contract. The loss incurred by the failure of a counterparty is generally limited to the net interim payment to be received by the Fund, and/or the termination value at the end of the contract. Therefore, the Fund considers the creditworthiness of each counterparty to a swap contract in evaluating potential credit risk. Additionally, risks may arise from
| | |
| 36 | | • ALLIANCEBERNSTEIN DIVERSIFIED YIELD FUND |
Notes to Financial Statements
unanticipated movements in interest rates or in the value of the underlying securities. The Fund accrues for the interim payments on swap contracts on a daily basis, with the net amount recorded within unrealized appreciation/depreciation of swap contracts on the statement of assets and liabilities. Once the interim payments are settled in cash, the net amount is recorded as realized gain/loss on swaps on the statement of operations, in addition to realized gain/loss recorded upon the termination of swap contracts. Fluctuations in the value of swap contracts are recorded as a component of net change in unrealized appreciation/depreciation of investments.
Credit Default Swaps:
During the six months ended April 30, 2009, the Fund adopted FASB Staff Position FAS No. 133-1 and FIN 45-4, “Disclosures about Credit Derivatives and Certain Guarantees: An Amendment of FASB Statement No. 133 and FASB Interpretation No. 45” (the “Position”). The Position amends FASB Statement No. 133 (“FAS 133”), “Accounting for Derivative Instruments and Hedging Activities”, and FASB Interpretation No. 45 (“FIN 45”), Guarantor’s Accounting and Disclosure Requirements for Guarantees”. Consequently, the Fund has amended its portfolio of investments and notes to financial statements disclosures in accordance with the Position.
The Fund may enter into credit default swaps. The Fund may purchase credit protection (“Buy Contract”) or provide credit protection (“Sale Contract”) on the referenced obligation of the credit default swap. During the term of the swap agreement, the Fund receives/(pays) fixed payments from/(to) the respective counterparty, calculated at the agreed upon interest rate applied to the notional amount. The accrual for these interim payments is recorded within unrealized appreciation/depreciation of swap contracts on the statement of assets and liabilities. Upfront premiums paid or received in connection with credit default swap contracts are recognized as cost or proceeds on the statement of assets and liabilities and are amortized on a straight line basis over the life of the contract. Amortized upfront premiums are included in net realized gain/(loss) from swaps on the statement of operations. If the Fund is a buyer/(seller) of protection and a credit event occurs, as defined under the terms of the swap agreement, the Fund will either (i) receive from the seller/(pay to the buyer) of protection an amount equal to the notional amount of the swap contract (the “Maximum Payout Amount”) and deliver/(take delivery of) the referenced obligation or (ii) receive/(pay) a net settlement amount in the form of cash or securities equal to the notional amount of the swap less the recovery value of the referenced obligation.
Credit default swaps may involve greater risks than if a Fund had invested in the referenced obligation directly. Credit default swaps are subject to general market risk, liquidity risk, counterparty risk and credit risk. If the Fund is a buyer of protection and no credit event occurs, it will lose its investment. If the Fund is a seller of protection and a credit event occurs, the value of the referenced obligation
| | |
| ALLIANCEBERNSTEIN DIVERSIFIED YIELD FUND • | | 37 |
Notes to Financial Statements
received by the Fund coupled with the periodic payments previously received, may be less than the Maximum Payout Amount it pays to the buyer, resulting in a loss to the Fund.
Implied credit spreads utilized in determining the market value of credit default swaps on issuers as of period end are disclosed in the portfolio of investments. The implied spreads serve as an indicator of the current status of the payment/ performance risk and typically reflect the likelihood of default by the issuer on the referenced obligation. The implied credit spread of a particular reference entity reflects the cost of buying/selling protection and may include upfront payments required to be made to enter into the agreement. Widening credit spreads and, with respect to buy contracts, increasing market values, in absolute terms when compared to the notional amount of the swap, typically represent a deterioration of the referenced entity’s credit soundness and greater likelihood of default or other credit event occurring as defined under the terms of the agreement. A credit spread identified as “Defaulted” indicates a credit event has occurred for the referenced entity or obligation.
In certain circumstances Maximum Payout Amounts may be partially offset by recovery values of the respective referenced obligations, upfront premium received upon entering into the agreement, or net amounts received from settlement of buy protection credit default swap agreements entered into by the Fund for the same reference obligation with the same counterparty.
5. Currency Transactions
The Fund may invest in non-U.S. Dollar securities on a currency hedged or unhedged basis. The Fund may seek investment opportunities by taking long or short positions in currencies through the use of currency-related derivatives, including forward currency exchange contracts, futures and options on futures, swaps, and options. The Fund may enter into transactions for investment opportunities when it anticipates that a foreign currency will appreciate or depreciate in value but securities denominated in that currency are not held by the Fund and do not present attractive investment opportunities. Such transactions may also be used when the Adviser believes that it may be more efficient than a direct investment in a foreign currency-denominated security. The Fund may also conduct currency exchange contracts on a spot basis (i.e., for cash at the spot rate prevailing in the currency exchange market for buying or selling currencies).
6. Dollar Rolls
The Fund may enter into dollar rolls. Dollar rolls involve sales by the Fund of securities for delivery in the current month and the Fund’s simultaneously contracting to repurchase substantially similar (same type and coupon) securities on a specified future date. During the roll period, the Fund forgoes principal and interest paid on the securities. The Fund is compensated by the difference between the current sales price and the lower forward price for the future purchase (often referred to as the “drop”) as well as by the interest earned on the
| | |
| 38 | | • ALLIANCEBERNSTEIN DIVERSIFIED YIELD FUND |
Notes to Financial Statements
cash proceeds of the initial sale. Dollar rolls involve the risk that the market value of the securities the Fund is obligated to repurchase under the agreement may decline below the repurchase price. Dollar rolls are speculative techniques and may be considered to be borrowings by the Fund. For the six months ended April 30, 2009, the Fund had no income earned from dollar roll transactions.
7. Reverse Repurchase Agreements
Under a reverse repurchase agreement, the Fund sells securities and agrees to repurchase them at a mutually agreed upon date and price. At the time the Fund enters into a reverse repurchase agreement, it will establish a segregated account with the custodian containing liquid assets having at least equal to the repurchase price. For the six months ended April 30, 2009, the Fund had no transactions in reverse repurchase agreements.
NOTE E
Capital Stock
Each class consists of 3,000,000,000 authorized shares. Transactions in capital shares for each class were as follows:
| | | | | | | | | | | | | | | | | | |
| | | | | | | | | | | | | | | | | | |
| | | Shares | | | | | Amount | | | |
| | | Six Months Ended
April 30, 2009 (unaudited) | | | Year Ended
October 31,
2008 | | | | | Six Months Ended
April 30, 2009 (unaudited) | | | Year Ended
October 31,
2008 | | | |
| | | | | |
| Class A | | | | | | | | | | | | | | | | | | |
Shares sold | | 352,740 | | | 2,136,735 | | | | | $ | 2,506,467 | | | $ | 18,659,670 | | | |
| | | | |
Shares issued in reinvestment of dividends and distributions | | 78,650 | | | 175,559 | | | | | | 552,712 | | | | 1,498,821 | | | |
| | | | |
Shares converted from Class B | | 411,326 | | | 660,939 | | | | | | 2,916,820 | | | | 5,618,599 | | | |
| | | | |
Shares redeemed | | (913,470 | ) | | (2,994,056 | ) | | | | | (6,441,837 | ) | | | (25,390,323 | ) | | |
| | | | |
Net increase (decrease) | | (70,754 | ) | | (20,823 | ) | | | | $ | (465,838 | ) | | $ | 386,767 | | | |
| | | | |
| | | | | | | | | | | | | | | | | | |
| Class B | | | | | | | | | | | | | | | | | | |
Shares sold | | 86,119 | | | 324,279 | | | | | $ | 608,080 | | | $ | 2,806,055 | | | |
| | | | |
Shares issued in reinvestment of dividends and distributions | | 19,902 | | | 49,884 | | | | | | 139,916 | | | | 427,284 | | | |
| | | | |
Shares converted to Class A | | (410,903 | ) | | (660,209 | ) | | | | | (2,916,820 | ) | | | (5,618,599 | ) | | |
| | | | |
Shares redeemed | | (321,996 | ) | | (891,721 | ) | | | | | (2,279,292 | ) | | | (7,636,196 | ) | | |
| | | | |
Net decrease | | (626,878 | ) | | (1,177,767 | ) | | | | $ | (4,448,116 | ) | | $ | (10,021,456 | ) | | |
| | | | |
| | |
| ALLIANCEBERNSTEIN DIVERSIFIED YIELD FUND • | | 39 |
Notes to Financial Statements
| | | | | | | | | | | | | | | | | | |
| | | | | | | | | | | | | | | | | | |
| | | Shares | | | | | Amount | | | |
| | | Six Months Ended
April 30, 2009 (unaudited) | | | Year Ended
October 31,
2008 | | | | | Six Months Ended
April 30, 2009 (unaudited) | | | Year Ended
October 31,
2008 | | | |
| | | | | |
| Class C | | | | | | | | | | | | | | | | | | |
Shares sold | | 175,234 | | | 466,963 | | | | | $ | 1,263,396 | | | $ | 3,977,556 | | | |
| | | | |
Shares issued in reinvestment of dividends and distributions | | 21,297 | | | 37,629 | | | | | | 147,915 | | | | 320,564 | | | |
| | | | |
Shares redeemed | | (309,229 | ) | | (669,854 | ) | | | | | (2,199,134 | ) | | | (5,717,511 | ) | | |
| | | | |
Net decrease | | (112,698 | ) | | (165,262 | ) | | | | $ | (787,823 | ) | | $ | (1,419,391 | ) | | |
| | | | |
| | | | | | | | | | | | | | | | | | |
| Advisor Class | | | | | | | | | | | | | | | | | | |
Shares sold | | 41,308 | | | 457,368 | | | | | $ | 291,731 | | | $ | 4,035,364 | | | |
| | | | |
Shares issued in reinvestment of dividends and distributions | | 9,331 | | | 21,252 | | | | | | 87,835 | | | | 181,694 | | | |
| | | | |
Shares redeemed | | (108,098 | ) | | (583,774 | ) | | | | | (782,085 | ) | | | (5,078,433 | ) | | |
| | | | |
Net decrease | | (57,459 | ) | | (105,154 | ) | | | | $ | (402,519 | ) | | $ | (861,375 | ) | | |
| | | | |
| | | | | | | | | | | | | | | | | | |
| Class R | | | | | | | | | | | | | | | | | | |
Shares sold | | 15,474 | | | 20,390 | | | | | $ | 108,108 | | | $ | 173,469 | | | |
| | | | |
Shares issued in reinvestment of dividends and distributions | | 942 | | | 1,008 | | | | | | 6,609 | | | | 8,494 | | | |
| | | | |
Shares redeemed | | (3,702 | ) | | (7,979 | ) | | | | | (26,117 | ) | | | (68,472 | ) | | |
| | | | |
Net increase | | 12,714 | | | 13,419 | | | | | $ | 88,600 | | | $ | 113,491 | | | |
| | | | |
| | | | | | | | | | | | | | | | | | |
| Class K | | | | | | | | | | | | | | | | | | |
Shares sold | | 92 | | | 38,235 | | | | | $ | 651 | | | $ | 329,734 | | | |
| | | | |
Shares issued in reinvestment of dividends and distributions | | 44 | | | 380 | | | | | | 307 | | | | 3,274 | | | |
| | | | |
Shares redeemed | | – 0 | – | | (42,090 | ) | | | | | – 0 | – | | | (359,862 | ) | | |
| | | | |
Net increase (decrease) | | 136 | | | (3,475 | ) | | | | $ | 958 | | | $ | (26,854 | ) | | |
| | | | |
| | | | | | | | | | | | | | | | | | |
| Class I | | | | | | | | | | | | | | | | | | |
Shares sold | | – 0 | – | | – 0 | – | | | | $ | – 0 | – | | $ | – 0 | – | | |
| | | | |
Shares redeemed | | – 0 | – | | – 0 | – | | | | | – 0 | – | | | – 0 | – | | |
| | | | |
Net increase | | – 0 | – | | – 0 | – | | | | $ | – 0 | – | | $ | – 0 | – | | |
| | | | |
NOTE F
Risks Involved in Investing in the Fund
Interest Rate Risk and Credit Risk—Interest rate risk is the risk that changes in interest rates will affect the value of the Fund’s investments in fixed-income debt securities such as bonds or notes. Increases in interest rates may cause the value
| | |
| 40 | | • ALLIANCEBERNSTEIN DIVERSIFIED YIELD FUND |
Notes to Financial Statements
of the Fund’s investments to decline. Credit risk is the risk that the issuer or guarantor of a debt security, or the counterparty to a derivative contract, will be unable or unwilling to make timely principal and/or interest payments, or to otherwise honor its obligations. The degree of risk for a particular security may be reflected in its credit risk rating. Credit risk is greater for medium quality and lower-rated securities. Lower-rated debt securities and similar unrated securities (commonly known as “junk bonds”) have speculative elements or are predominantly speculative risks.
Foreign Securities Risk—Investing in securities of foreign companies or foreign governments involves special risks which include changes in foreign currency exchange rates and the possibility of future political and economic developments which could adversely affect the value of such securities. Moreover, securities of many foreign companies or foreign governments and their markets may be less liquid and their prices more volatile than those of comparable U.S. companies or of the U.S. government.
Currency Risk—This is the risk that changes in foreign currency exchange rates may negatively affect the value of the Fund’s investments or reduce the returns of the Fund. For example, the value of the Fund’s investments in foreign currency-denominated securities or currencies may decrease if the U.S. Dollar is strong (i.e., gaining value relative to other currencies) and other currencies are weak (i.e., losing value relative to the U.S. Dollar). Currency markets are generally not as regulated as securities markets. Independent of the Portfolio’s investments in securities denominated in foreign currencies, the Portfolio’s positions in various foreign currencies may cause the Portfolio to experience investment losses due to the changes in exchange rates and interest rates.
Leverage Risk—When the Fund borrows money or otherwise leverages its portfolio, it may be volatile because leverage tends to exaggerate the effect of any increase or decrease in the value of the Fund’s investments. The Fund may create leverage through the use of reverse repurchase arrangements, forward currency exchange contracts, forward commitments, dollar rolls or futures contracts or by borrowing money. The use of derivative instruments by the Fund, such as forwards, futures, options and swaps, may also result in a form of leverage.
Derivatives Risk—The Fund may invest in derivatives such as forwards, options, futures and swaps. These investments may be illiquid, difficult to price, and leveraged so that small changes may produce disproportionate losses for the Fund, and subject to counterparty risk to a greater degree than more traditional investments.
Indemnification Risk—In the ordinary course of business, the Fund enters into contracts that contain a variety of indemnifications. The Fund’s maximum exposure under these arrangements is unknown. However, the Fund has not had prior claims or losses pursuant to these indemnification provisions and expects the risk of loss thereunder to be remote.
| | |
| ALLIANCEBERNSTEIN DIVERSIFIED YIELD FUND • | | 41 |
Notes to Financial Statements
NOTE G
Joint Credit Facility
A number of open-end mutual funds managed by the Adviser, including the Fund, participate in a $250 million revolving credit facility (the “Facility”) intended to provide for short-term financing if necessary, subject to certain restrictions, in connection with abnormal redemption activity. Commitment fees related to the Facility are paid by the participating funds and are included in miscellaneous expenses in the statement of operations. The Fund did not utilize the Facility during the six months ended April 30, 2009.
NOTE H
Distributions to Shareholders
The tax character of distributions paid for the year ending October 31, 2009 will be determined at the end of the current fiscal year. The tax character of distributions paid during the fiscal years ended October 31, 2008 and October 31, 2007 were as follows:
| | | | | | |
| | | 2008 | | 2007 |
Distributions paid from: | | | | | | |
Ordinary income | | $ | 3,544,275 | | $ | 2,808,423 |
| | | | | | |
Total taxable distributions | | | 3,544,275 | | | 2,808,423 |
| | | | | | |
Total distributions paid | | $ | 3,544,275 | | $ | 2,808,423 |
| | | | | | |
As of October 31, 2008, the components of accumulated earnings/(deficit) on a tax basis were as follows:
| | | | |
Accumulated capital and other losses | | $ | (30,875,872) | (a) |
Unrealized appreciation/(depreciation) | | | (16,108,481) | (b) |
| | | | |
Total accumulated earnings/(deficit) | | $ | (46,984,353) | (c) |
| | | | |
| (a) | | On October 31, 2008, the Fund had a net capital loss carryforward of $30,650,071 of which $6,449,342 expires in the year 2009, $23,821,171 expires in the year 2010, and $379,558 expires in the year 2016. To the extent future capital gains are offset by capital loss carryforwards, such gains will not be distributed. For the six months ended April 30, 2009, the cumulative deferred loss on straddles was $225,801. |
| (b) | | The differences between book-basis and tax-basis unrealized appreciation/(depreciation) are attributable primarily to the tax treatment of swap income, the tax deferral of losses on wash sales, the realization for tax purposes of gains/losses on certain derivative instruments, and the difference between book and tax amortization methods for premium. |
| (c) | | The difference between book-basis and tax-basis components of accumulated earnings/ (deficit) is attributable primarily to dividends payable. |
NOTE I
Legal Proceedings
On October 2, 2003, a purported class action complaint entitled Hindo, et al. v. AllianceBernstein Growth & Income Fund, et al. (“Hindo Complaint”) was filed against the Adviser, Alliance Capital Management Holding L.P. (“Alliance Holding”), Alliance Capital Management Corporation, AXA Financial, Inc., the
| | |
| 42 | | • ALLIANCEBERNSTEIN DIVERSIFIED YIELD FUND |
Notes to Financial Statements
AllianceBernstein Funds, certain officers of the Adviser (“AllianceBernstein defendants”), and certain other unaffiliated defendants, as well as unnamed Doe defendants. The Hindo Complaint was filed in the United States District Court for the Southern District of New York by alleged shareholders of two of the AllianceBernstein Funds. The Hindo Complaint alleges that certain of the AllianceBernstein defendants failed to disclose that they improperly allowed certain hedge funds and other unidentified parties to engage in “late trading” and “market timing” of AllianceBernstein Fund securities, violating Sections 11 and 15 of the Securities Act, Sections 10(b) and 20(a) of the Exchange Act and Sections 206 and 215 of the Advisers Act. Plaintiffs seek an unspecified amount of compensatory damages and rescission of their contracts with the Adviser, including recovery of all fees paid to the Adviser pursuant to such contracts.
Following October 2, 2003, 43 additional lawsuits making factual allegations generally similar to those in the Hindo Complaint were filed in various federal and state courts against the Adviser and certain other defendants. On September 29, 2004, plaintiffs filed consolidated amended complaints with respect to four claim types: mutual fund shareholder claims; mutual fund derivative claims; derivative claims brought on behalf of Alliance Holding; and claims brought under ERISA by participants in the Profit Sharing Plan for Employees of the Adviser. All four complaints include substantially identical factual allegations, which appear to be based in large part on the Order of the SEC dated December 18, 2003 as amended and restated January 15, 2004 (“SEC Order”) and the New York State Attorney General Assurance of Discontinuance dated September 1, 2004 (“NYAG Order”).
On April 21, 2006, the Adviser and attorneys for the plaintiffs in the mutual fund shareholder claims, mutual fund derivative claims, and ERISA claims entered into a confidential memorandum of understanding containing their agreement to settle these claims. The agreement will be documented by a stipulation of settlement and will be submitted for court approval at a later date. The settlement amount ($30 million), which the Adviser previously accrued and disclosed, has been disbursed. The derivative claims brought on behalf of Alliance Holding, in which plaintiffs seek an unspecified amount of damages, remain pending.
It is possible that these matters and/or other developments resulting from these matters could result in increased redemptions of the AllianceBernstein Mutual Funds’ shares or other adverse consequences to the AllianceBernstein Mutual Funds. This may require the AllianceBernstein Mutual Funds to sell investments held by those funds to provide for sufficient liquidity and could also have an adverse effect on the investment performance of the AllianceBernstein Mutual Funds. However, the Adviser believes that these matters are not likely to have a material adverse effect on its ability to perform advisory services relating to the AllianceBernstein Mutual Funds.
| | |
| ALLIANCEBERNSTEIN DIVERSIFIED YIELD FUND • | | 43 |
Notes to Financial Statements
NOTE J
Recent Accounting Pronouncement
On March 19, 2008, the FASB released Statement of Financial Accounting Standards No. 161, “Disclosures about Derivative Instruments and Hedging Activities” (“FAS 161”). FAS 161 requires qualitative disclosures about objectives and strategies for using derivatives, quantitative disclosures about fair value amounts of and gains and losses on derivative instruments, and disclosures about credit-risk-related contingent features in derivative agreements. The application of FAS 161 is required for fiscal years beginning after November 15, 2008 and interim periods within those fiscal years. At this time, management is evaluating the implications of FAS 161 and believes the adoption of FAS 161 will have no material impact on the Fund’s financial statements.
| | |
| 44 | | • ALLIANCEBERNSTEIN DIVERSIFIED YIELD FUND |
Notes to Financial Statements
FINANCIAL HIGHLIGHTS
Selected Data For A Share Of Capital Stock Outstanding Throughout Each Period
| | | | | | | | | | | | | | | | | | |
| | | Class A | |
| | | Six Months
Ended
April 30,
2009 (unaudited) | | | Year Ended October 31, | |
| | | | 2008 | | | 2007 | | | 2006 | | | 2005 | | | 2004(a) | |
| | | |
| | | | | | | | | | | | | | | | | | |
Net asset value, beginning of period | | $ 7.39 | | | $ 9.02 | | | $ 8.62 | | | $ 8.70 | | | $ 8.63 | | | $ 8.65 | |
| | | |
Income From Investment Operations | | | | | | | | | | | | | | | | | | |
Net investment income(b) | | .17 | | | .36 | | | .34 | | | .34 | | | .39 | | | .48 | (c) |
Net realized and unrealized gain (loss) on investment and foreign currency transactions | | (.09 | ) | | (1.63 | ) | | .40 | | | .14 | | | .09 | | | .02 | |
Contributions from Adviser | | – 0 | – | | – 0 | –(d) | | – 0 | – | | – 0 | – | | – 0 | – | | – 0 | – |
| | | |
Net increase (decrease) in net asset value from operations | | .08 | | | (1.27 | ) | | .74 | | | .48 | | | .48 | | | .50 | |
| | | |
Less: Dividends and Distributions | | | | | | | | | | | | | | | | | | |
Dividends from net investment income | | (.17 | ) | | (.36 | ) | | (.34 | ) | | (.34 | ) | | (.41 | ) | | (.52 | ) |
Distributions from net realized gains on investment and foreign currency transactions | | – 0 | – | | – 0 | – | | – 0 | – | | (.22 | ) | | – 0 | – | | – 0 | – |
| | | |
Total dividends and distributions | | (.17 | ) | | (.36 | ) | | (.34 | ) | | (.56 | ) | | (.41 | ) | | (.52 | ) |
| | | |
Net asset value, end of period | | $ 7.30 | | | $ 7.39 | | | $ 9.02 | | | $ 8.62 | | | $ 8.70 | | | $ 8.63 | |
| | | |
Total Return | | | | | | | | | | | | | | | | | | |
Total investment return based on net asset value(e) | | 1.18 | %* | | (14.57 | ) %* | | 8.60 | %* | | 5.61 | % | | 5.67 | % | | 5.89 | % |
Ratios/Supplemental Data | | | | | | | | | | | | | | | | | | |
Net assets, end of period (000’s omitted) | | $38,638 | | | $39,639 | | | $48,542 | | | $25,348 | | | $24,250 | | | $29,465 | |
Ratio to average net assets of: | | | | | | | | | | | | | | | | | | |
Expenses, net of waivers/reimbursements | | .90 | %(f) | | .90 | % | | 1.47 | % | | 1.78 | %(g) | | 1.54 | % | | 1.43 | % |
Expenses, before waivers/reimbursements | | 1.92 | %(f) | | 1.65 | % | | 1.47 | % | | 1.78 | %(g) | | 1.54 | % | | 1.60 | % |
Expenses, before waivers/reimbursements excluding interest expense | | 1.92 | %(f) | | 1.65 | % | | 1.47 | % | | 1.72 | %(g) | | 1.54 | % | | 1.60 | % |
Net investment income | | 4.83 | %(f) | | 4.13 | % | | 3.81 | % | | 3.93 | %(g) | | 4.65 | % | | 5.83 | %(c) |
Portfolio turnover rate | | 33 | % | | 81 | % | | 134 | % | | 169 | % | | 98 | % | | 106 | % |
See footnote summary on page 52.
| | |
| ALLIANCEBERNSTEIN DIVERSIFIED YIELD FUND • | | 45 |
Financial Highlights
Selected Data For A Share Of Capital Stock Outstanding Throughout Each Period
| | | | | | | | | | | | | | | | | | |
| | | Class B | |
| | | Six Months
Ended
April 30,
2009
(unaudited) | | | Year Ended October 31, | |
| | | | 2008 | | | 2007 | | | 2006 | | | 2005 | | | 2004(a) | |
| | | |
| | | | | | | | | | | | | | | | | | |
Net asset value, beginning of period | | $ 7.40 | | | $ 9.03 | | | $ 8.63 | | | $ 8.70 | | | $ 8.63 | | | $ 8.65 | |
| | | |
Income From Investment Operations | | | | | | | | | | | | | | | | | | |
Net investment income(b) | | .15 | | | .30 | | | .26 | | | .28 | | | .32 | | | .41 | (c) |
Net realized and unrealized gain (loss) on investment and foreign currency transactions | | (.09 | ) | | (1.64 | ) | | .41 | | | .14 | | | .10 | | | .02 | |
Contributions from Adviser | | – 0 | – | | – 0 | –(d) | | – 0 | – | | – 0 | – | | – 0 | – | | – 0 | – |
| | | |
Net increase (decrease) in net asset value from operations | | .06 | | | (1.34 | ) | | .67 | | | .42 | | | .42 | | | .43 | |
| | | |
Less: Dividends and Distributions | | | | | | | | | | | | | | | | | | |
Dividends from net investment income | | (.15 | ) | | (.29 | ) | | (.27 | ) | | (.27 | ) | | (.35 | ) | | (.45 | ) |
Distributions from net realized gains on investment and foreign currency transactions | | – 0 | – | | – 0 | – | | – 0 | – | | (.22 | ) | | – 0 | – | | – 0 | – |
| | | |
Total dividends and distributions | | (.15 | ) | | (.29 | ) | | (.27 | ) | | (.49 | ) | | (.35 | ) | | (.45 | ) |
| | | |
Net asset value, end of period | | $ 7.31 | | | $ 7.40 | | | $ 9.03 | | | $ 8.63 | | | $ 8.70 | | | $ 8.63 | |
| | | |
Total Return | | | | | | | | | | | | | | | | | | |
Total investment return based on net asset value(e) | | .84 | %* | | (15.15 | )%* | | 7.77 | %* | | 4.96 | % | | 4.92 | % | | 5.13 | % |
Ratios/Supplemental Data | | | | | | | | | | | | | | | | | | |
Net assets, end of period (000’s omitted) | | $8,917 | | | $13,666 | | | $27,303 | | | $40,136 | | | $59,513 | | | $84,385 | |
Ratio to average net assets of: | | | | | | | | | | | | | | | | | | |
Expenses, net of waivers/reimbursements | | 1.60 | %(f) | | 1.60 | % | | 2.28 | % | | 2.50 | %(g) | | 2.25 | % | | 2.15 | % |
Expenses, before waivers/reimbursements | | 2.67 | %(f) | | 2.41 | % | | 2.28 | % | | 2.50 | %(g) | | 2.25 | % | | 2.32 | % |
Expenses, before waivers/reimbursements excluding interest expense | | 2.67 | %(f) | | 2.41 | % | | 2.28 | % | | 2.45 | %(g) | | 2.25 | % | | 2.32 | % |
Net investment income | | 4.15 | %(f) | | 3.43 | % | | 2.93 | % | | 3.24 | %(g) | | 3.94 | % | | 5.12 | %(c) |
Portfolio turnover rate | | 33 | % | | 81 | % | | 134 | % | | 169 | % | | 98 | % | | 106 | % |
See footnote summary on page 52.
| | |
| 46 | | • ALLIANCEBERNSTEIN DIVERSIFIED YIELD FUND |
Financial Highlights
Selected Data For A Share Of Capital Stock Outstanding Throughout Each Period
| | | | | | | | | | | | | | | | | | |
| | | Class C | |
| | | Six Months
Ended
April 30,
2009 (unaudited) | | | Year Ended October 31, | |
| | | | 2008 | | | 2007 | | | 2006 | | | 2005 | | | 2004(a) | |
| | | |
| | | | | | | | | | | | | | | | | | |
Net asset value, beginning of period | | $ 7.40 | | | $ 9.02 | | | $ 8.63 | | | $ 8.71 | | | $ 8.64 | | | $ 8.65 | |
| | | |
Income From Investment Operations | | | | | | | | | | | | | | | | | | |
Net investment income(b) | | .15 | | | .29 | | | .27 | | | .28 | | | .33 | | | .40 | (c) |
Net realized and unrealized gain (loss) on investment and foreign currency transactions | | (.09 | ) | | (1.61 | ) | | .39 | | | .14 | | | .09 | | | .04 | |
Contributions from Adviser | | – 0 | – | | – 0 | –(d) | | – 0 | – | | – 0 | – | | – 0 | – | | – 0 | – |
| | | |
Net increase (decrease) in net asset value from operations | | .06 | | | (1.32 | ) | | .66 | | | .42 | | | .42 | | | .44 | |
| | | |
Less: Dividends and Distributions | | | | | | | | | | | | | | | | | | |
Dividends from net investment income | | (.15 | ) | | (.30 | ) | | (.27 | ) | | (.28 | ) | | (.35 | ) | | (.45 | ) |
Distributions from net realized gains on investment and foreign currency transactions | | – 0 | – | | – 0 | – | | – 0 | – | | (.22 | ) | | – 0 | – | | – 0 | – |
| | | |
Total dividends and distributions | | (.15 | ) | | (.30 | ) | | (.27 | ) | | (.50 | ) | | (.35 | ) | | (.45 | ) |
| | | |
Net asset value, end of period | | $ 7.31 | | | $ 7.40 | | | $ 9.02 | | | $ 8.63 | | | $ 8.71 | | | $ 8.64 | |
| | | |
Total Return | | | | | | | | | | | | | | | | | | |
Total investment return based on net asset value(e) | | .83 | %* | | (15.05 | )%* | | 7.69 | %* | | 4.86 | % | | 4.93 | % | | 5.25 | % |
Ratios/Supplemental Data | | | | | | | | | | | | | | | | | | |
Net assets, end of period (000’s omitted) | | $10,284 | | | $11,245 | | | $15,208 | | | $11,040 | | | $11,492 | | | $14,094 | |
Ratio to average net assets of: | | | | | | | | | | | | | | | | | | |
Expenses, net of waivers/reimbursements | | 1.60 | %(f) | | 1.60 | % | | 2.20 | % | | 2.49 | %(g) | | 2.25 | % | | 2.14 | % |
Expenses, before waivers/reimbursements | | 2.64 | %(f) | | 2.36 | % | | 2.20 | % | | 2.49 | %(g) | | 2.25 | % | | 2.31 | % |
Expenses, before waivers/reimbursements excluding interest expense | | 2.64 | %(f) | | 2.36 | % | | 2.20 | % | | 2.44 | %(g) | | 2.25 | % | | 2.31 | % |
Net investment income | | 4.13 | %(f) | | 3.44 | % | | 3.03 | % | | 3.22 | %(g) | | 3.94 | % | | 5.14 | %(c) |
Portfolio turnover rate | | 33 | % | | 81 | % | | 134 | % | | 169 | % | | 98 | % | | 106 | % |
See footnote summary on page 52.
| | |
| ALLIANCEBERNSTEIN DIVERSIFIED YIELD FUND • | | 47 |
Financial Highlights
Selected Data For A Share Of Capital Stock Outstanding Throughout Each Period
| | | | | | | | | | | | | | | | | | |
| | | Advisor Class | |
| | | Six Months
Ended
April 30,
2009
(unaudited) | | | Year Ended October 31, | |
| | | | 2008 | | | 2007 | | | 2006 | | | 2005 | | | 2004(a) | |
| | | |
| | | | | | | | | | | | | | | | | | |
Net asset value, beginning of period | | $ 7.39 | | | $ 9.02 | | | $ 8.62 | | | $ 8.70 | | | $ 8.63 | | | $ 8.65 | |
| | | |
Income From Investment Operations | | | | | | | | | | | | | | | | | | |
Net investment income(b) | | .18 | | | .38 | | | .37 | | | .36 | | | .47 | | | .47 | (c) |
Net realized and unrealized gain (loss) on investment and foreign currency transactions | | (.09 | ) | | (1.63 | ) | | .39 | | | .14 | | | .04 | | | .05 | |
Contributions from Adviser | | – 0 | – | | – 0 | –(d) | | – 0 | – | | – 0 | – | | – 0 | – | | – 0 | – |
| | | |
Net increase (decrease) in net asset value from operations | | .09 | | | (1.25 | ) | | .76 | | | .50 | | | .51 | | | .52 | |
| | | |
Less: Dividends and Distributions | | | | | | | | | | | | | | | | | | |
Dividends from net investment income | | (.18 | ) | | (.38 | ) | | (.36 | ) | | (.36 | ) | | (.44 | ) | | (.54 | ) |
Distributions from net realized gains on investment and foreign currency transactions | | – 0 | – | | – 0 | – | | – 0 | – | | (.22 | ) | | – 0 | – | | – 0 | – |
| | | |
Total dividends and distributions | | (.18 | ) | | (.38 | ) | | (.36 | ) | | (.58 | ) | | (.44 | ) | | (.54 | ) |
| | | |
Net asset value, end of period | | $ 7.30 | | | $ 7.39 | | | $ 9.02 | | | $ 8.62 | | | $ 8.70 | | | $ 8.63 | |
| | | |
Total Return | | | | | | | | | | | | | | | | | | |
Total investment return based on net asset value(e) | | 1.34 | %* | | (14.31 | )%* | | 8.89 | %* | | 5.94 | % | | 6.01 | % | | 6.21 | % |
Ratios/Supplemental Data | | | | | | | | | | | | | | | | | | |
Net assets, end of period (000’s omitted) | | $3,291 | | | $3,756 | | | $5,529 | | | $2,494 | | | $1,594 | | | $900 | |
Ratio to average net assets of: | | | | | | | | | | | | | | | | | | |
Expenses, net of waivers/reimbursements | | .60 | %(f) | | .60 | % | | 1.14 | % | | 1.49 | %(g) | | 1.26 | % | | 1.13 | % |
Expenses, before waivers/reimbursements | | 1.63 | %(f) | | 1.33 | % | | 1.14 | % | | 1.49 | %(g) | | 1.26 | % | | 1.30 | % |
Expenses, before waivers/reimbursements excluding interest expense | | 1.63 | %(f) | | 1.33 | % | | 1.14 | % | | 1.44 | %(g) | | 1.26 | % | | 1.30 | % |
Net investment income | | 5.13 | %(f) | | 4.42 | % | | 4.00 | % | | 4.17 | %(g) | | 4.93 | % | | 6.15 | %(c) |
Portfolio turnover rate | | 33 | % | | 81 | % | | 134 | % | | 169 | % | | 98 | % | | 106 | % |
See footnote summary on page 52.
| | |
| 48 | | • ALLIANCEBERNSTEIN DIVERSIFIED YIELD FUND |
Financial Highlights
Selected Data For A Share Of Capital Stock Outstanding Throughout Each Period
| | | | | | | | | | | | | | | |
| | | Class R | |
| | | Six Months
Ended
April 30,
2009
(unaudited) | | | Year Ended October 31, | | | March 1,
2005(h) to
October 31,
2005 | |
| | | | 2008 | | | 2007 | | | 2006 | | |
| | | |
| | | | | | | | | | | | | | | |
Net asset value, beginning of period | | $ 7.37 | | | $ 8.99 | | | $ 8.61 | | | $ 8.69 | | | $ 8.85 | |
| | | |
Income From Investment Operations | | | | | | | | | | | | | | | |
Net investment income(b) | | .16 | | | .34 | | | .35 | | | .31 | | | .25 | |
Net realized and unrealized gain (loss) on investment and foreign currency transactions | | (.09 | ) | | (1.62 | ) | | .34 | | | .14 | | | (.15 | ) |
Contributions from Adviser | | – 0 | – | | – 0 | –(d) | | – 0 | – | | – 0 | – | | – 0 | – |
| | | |
Net increase (decrease) in net asset value from operations | | .07 | | | (1.28 | ) | | .69 | | | .45 | | | .10 | |
| | | |
Less: Dividends and Distributions | | | | | | | | | | | | | | | |
Dividends from net investment income | | (.16 | ) | | (.34 | ) | | (.31 | ) | | (.31 | ) | | (.26 | ) |
Distributions from net realized gains on investment and foreign currency transactions | | – 0 | – | | – 0 | – | | – 0 | – | | (.22 | ) | | – 0 | – |
| | | |
Total dividends and distributions | | (.16 | ) | | (.34 | ) | | (.31 | ) | | (.53 | ) | | (.26 | ) |
| | | |
Net asset value, end of period | | $ 7.28 | | | $ 7.37 | | | $ 8.99 | | | $ 8.61 | | | $ 8.69 | |
| | | |
Total Return | | | | | | | | | | | | | | | |
Total investment return based on net asset value(e) | | 1.08 | %* | | (14.65 | )%* | | 8.15 | %* | | 5.32 | % | | 1.17 | % |
Ratios/Supplemental Data | | | | | | | | | | | | | | | |
Net assets, end of period (000’s omitted) | | $341 | | | $252 | | | $187 | | | $20 | | | $10 | |
Ratio to average net assets of: | | | | | | | | | | | | | | | |
Expenses, net of waivers/reimbursements | | 1.10 | %(f) | | 1.10 | % | | 1.58 | % | | 2.03 | %(g) | | 1.94 | %(f) |
Expenses, before waivers/reimbursements | | 2.12 | %(f) | | 1.88 | % | | 1.58 | % | | 2.03 | %(g) | | 1.94 | %(f) |
Expenses, before waivers/reimbursements excluding interest expense | | 2.12 | %(f) | | 1.88 | % | | 1.58 | % | | 1.98 | %(g) | | 1.94 | %(f) |
Net investment income | | 4.60 | %(f) | | 3.98 | % | | 4.08 | % | | 3.64 | %(g) | | 4.25 | %(f) |
Portfolio turnover rate | | 33 | % | | 81 | % | | 134 | % | | 169 | % | | 98 | % |
See footnote summary on page 52.
| | |
| ALLIANCEBERNSTEIN DIVERSIFIED YIELD FUND • | | 49 |
Financial Highlights
Selected Data For A Share Of Capital Stock Outstanding Throughout Each Period
| | | | | | | | | | | | | | | |
| | | Class K | |
| | | Six Months
Ended
April 30,
2009
(unaudited) | | | Year Ended October 31, | | | March 1,
2005(h) to
October 31, | |
| | | | 2008 | | | 2007 | | | 2006 | | | 2005 | |
| | | |
| | | | | | | | | | | | | | | |
Net asset value, beginning of period | | $ 7.39 | | | $ 9.00 | | | $ 8.61 | | | $ 8.69 | | | $ 8.85 | |
| | | |
Income From Investment Operations | | | | | | | | | | | | | | | |
Net investment income(b) | | .17 | | | .38 | | | .32 | | | .29 | | | .27 | |
Net realized and unrealized gain (loss) on investment and foreign currency transactions | | (.09 | ) | | (1.63 | ) | | .40 | | | .19 | | | (.15 | ) |
Contributions from Adviser | | – 0 | – | | – 0 | –(d) | | – 0 | – | | – 0 | – | | – 0 | – |
| | | |
Net increase (decrease) in net asset value from operations | | .08 | | | (1.25 | ) | | .72 | | | .48 | | | .12 | |
| | | |
Less: Dividends and Distributions | | | | | | | | | | | | | | | |
Dividends from net investment income | | (.17 | ) | | (.36 | ) | | (.33 | ) | | (.34 | ) | | (.28 | ) |
Distributions from net realized gains on investment and foreign currency transactions | | – 0 | – | | – 0 | – | | – 0 | – | | (.22 | ) | | – 0 | – |
| | | |
Total dividends and distributions | | (.17 | ) | | (.36 | ) | | (.33 | ) | | (.56 | ) | | (.28 | ) |
| | | |
Net asset value, end of period | | $ 7.30 | | | $ 7.39 | | | $ 9.00 | | | $ 8.61 | | | $ 8.69 | |
| | | |
Total Return | | | | | | | | | | | | | | | |
Total investment return based on net asset value(e) | | 1.15 | %* | | (14.28 | ) %* | | 8.46 | %* | | 5.61 | % | | 1.36 | % |
Ratios/Supplemental Data | | | | | | | | | | | | | | | |
Net assets, end of period (000’s omitted) | | $22 | | | $21 | | | $57 | | | $141 | | | $10 | |
Ratio to average net assets of: | | | | | | | | | | | | | | | |
Expenses, net of waivers/ reimbursements | | .85 | %(f) | | .85 | % | | 1.59 | % | | 1.80 | %(g) | | 1.63 | %(f) |
Expenses, before waivers/ reimbursements | | 1.89 | %(f) | | 1.53 | % | | 1.59 | % | | 1.80 | %(g) | | 1.63 | %(f) |
Expenses, before waivers/ reimbursements excluding interest expense | | 1.89 | %(f) | | 1.53 | % | | 1.59 | % | | 1.75 | %(g) | | 1.63 | %(f) |
Net investment income | | 4.87 | %(f) | | 4.02 | % | | 3.47 | % | | 3.63 | %(g) | | 4.55 | %(f) |
Portfolio turnover rate | | 33 | % | | 81 | % | | 134 | % | | 169 | % | | 98 | % |
See footnote summary on page 52.
| | |
| 50 | | • ALLIANCEBERNSTEIN DIVERSIFIED YIELD FUND |
Financial Highlights
Selected Data For A Share Of Capital Stock Outstanding Throughout Each Period
| | | | | | | | | | | | | | | |
| | | Class I | |
| | | Six Months
Ended
April 30,
2009
(unaudited) | | | Year Ended October 31, | | | March 1,
2005(h) to
October 31, 2005 | |
| | | | 2008 | | | 2007 | | | 2006 | | |
| | | |
| | | | | | | | | | | | | | | |
Net asset value, beginning of period | | $ 7.38 | | | $ 9.00 | | | $ 8.61 | | | $ 8.69 | | | $ 8.85 | |
| | | |
Income From Investment Operations | | | | | | | | | | | | | | | |
Net investment income(b) | | .18 | | | .38 | | | .36 | | | .37 | | | .29 | |
Net realized and unrealized gain (loss) on investment and foreign currency transactions | | (.09 | ) | | (1.62 | ) | | .40 | | | .14 | | | (.15 | ) |
Contributions from Adviser | | – 0 | – | | – 0 | –(d) | | – 0 | – | | – 0 | – | | – 0 | – |
| | | |
Net increase (decrease) in net asset value from operations | | .09 | | | (1.24 | ) | | .76 | | | .51 | | | .14 | |
| | | |
Less: Dividends and Distributions | | | | | | | | | | | | | | | |
Dividends from net investment income | | (.18 | ) | | (.38 | ) | | (.37 | ) | | (.37 | ) | | (.30 | ) |
Distributions from net realized gains on investment and foreign currency transactions | | – 0 | – | | – 0 | – | | – 0 | – | | (.22 | ) | | – 0 | – |
| | | |
Total dividends and distributions | | (.18 | ) | | (.38 | ) | | (.37 | ) | | (.59 | ) | | (.30 | ) |
| | | |
Net asset value, end of period | | $ 7.29 | | | $ 7.38 | | | $ 9.00 | | | $ 8.61 | | | $ 8.69 | |
| | | |
Total Return | | | | | | | | | | | | | | | |
Total investment return based on net asset value(e) | | 1.35 | %* | | (14.21 | )%* | | 8.92 | %* | | 5.95 | % | | 1.58 | % |
Ratios/Supplemental Data | | | | | | | | | | | | | | | |
Net assets, end of period (000’s omitted) | | $8 | | | $8 | | | $10 | | | $10 | | | $10 | |
Ratio to average net assets of: | | | | | | | | | | | | | | | |
Expenses, net of waivers/ reimbursements | | .60 | %(f) | | .60 | % | | 1.14 | % | | 1.46 | %(g) | | 1.30 | %(f) |
Expenses, before waivers/ reimbursements | | 1.44 | %(f) | | 1.28 | % | | 1.14 | % | | 1.46 | %(g) | | 1.30 | %(f) |
Expenses, before waivers/ reimbursements excluding interest expense | | 1.44 | %(f) | | 1.28 | % | | 1.14 | % | | 1.41 | %(g) | | 1.30 | %(f) |
Net investment income | | 5.14 | %(f) | | 4.45 | % | | 4.06 | % | | 4.25 | %(g) | | 4.88 | %(f) |
Portfolio turnover rate | | 33 | % | | 81 | % | | 134 | % | | 169 | % | | 98 | % |
See footnote summary on page 52.
| | |
| ALLIANCEBERNSTEIN DIVERSIFIED YIELD FUND • | | 51 |
Financial Highlights
| (a) | | As of November 1, 2003, the Fund has adopted the method of accounting for interim payments on swap contracts in accordance with Financial Accounting Standards Board Statement No. 133. These interim payments are reflected within net realized and unrealized gain (loss) on swap contracts, however, prior to November 1, 2003, these interim payments were reflected within interest income/expense on the statement of operations. The effect of this change for the year ended October 31, 2004, was to decrease net investment income per share by $0.001 for Class A, B, C, and Advisor Class and increase net realized and unrealized gain (loss) on investment transactions per share by $0.001 for Class A, B, C, and Advisor Class. Consequently, the ratios of net investment income to average net assets were decreased by 0.20% for Class A, B, C and Advisor Class, respectively. |
| (b) | | Based on average shares outstanding. |
| (c) | | Net of waivers/reimbursement by the Adviser. |
| (d) | | Amount is less than $.0005. |
| (e) | | Total investment return is calculated assuming an initial investment made at the net asset value at the beginning of the period, reinvestment of all dividends and distributions at net asset value during the period, and redemption on the last day of the period. Initial sales charge or contingent deferred sales charge is not reflected in the calculation of the total investment return. Total investment return does not reflect the deduction of taxes that a shareholder would pay on fund distributions or the redemption of fund shares. Total investment return calculated for a period of less than one year is not annualized. |
| (g) | | The ratio includes expenses attributable to costs of proxy solicitation. |
| (h) | | Commencement of distributions. |
| * | | Includes the impact of proceeds received and credited to the Fund resulting from the class action settlements, which enhanced the performance of each share class for the six months ended April 30, 2009 and the years ended October 31, 2008 and October 31, 2007, by 0.54%, 0.81% and 4.31%, respectively. |
See notes to financial statements.
| | |
| 52 | | • ALLIANCEBERNSTEIN DIVERSIFIED YIELD FUND |
Financial Highlights
BOARD OF DIRECTORS
| | |
William H. Foulk, Jr.(1), Chairman John H. Dobkin(1) Michael J. Downey(1) D. James Guzy(1) | | Nancy P. Jacklin(1) Garry L. Moody(1) Marshall C. Turner(1) Earl D. Weiner(1) |
OFFICERS
| | |
Robert M. Keith, President and Chief Executive Officer Philip L. Kirstein, Senior Vice President and Independent Compliance Officer Paul J. DeNoon(2), Vice President Joran Laird(2), Vice President Douglas J. Peebles(2), Vice President | | Matthew S. Sheridan(2), Vice President Greg J. Wilensky(2), Vice President Emilie D. Wrapp, Secretary Joseph J. Mantineo, Treasurer and Chief Financial Officer Stephen Woetzel, Controller |
| | |
Principal Underwriter AllianceBernstein Investments, Inc. 1345 Avenue of the Americas New York, NY 10105 Custodian and Accounting Agent Brown Brothers Harriman & Company 40 Water Street Boston, MA 02109 Legal Counsel Seward & Kissel LLP One Battery Park Plaza New York, NY 10004 | | Transfer Agent AllianceBernstein Investor Services, Inc. P.O. Box 786003 San Antonio, TX 78278-6003 Toll-free (800) 221-5672 Independent Registered Public Accounting Firm Ernst & Young LLP 5 Times Square New York, NY 10036 |
| (1) | | Member of the Audit Committee, Governance and Nominating Committee and Independent Directors Committee. Mr. Foulk is the sole member of the Fair Value Pricing Committee. |
| (2) | | The day-to-day management of, and investment decisions for, the Fund’s portfolio are made by the Global Fixed Income Investment Team and Global Credit Investment Team. Messrs. DeNoon, Laird, Peebles, Sheridan and Wilensky are the investment professionals with the most significant responsibility for the day-to-day management of the Fund’s portfolio. |
| | |
| ALLIANCEBERNSTEIN DIVERSIFIED YIELD FUND • | | 53 |
Board of Directors
Information Regarding the Review and Approval of the Fund’s Advisory Agreement
The disinterested directors (the “directors”) of AllianceBernstein Diversified Yield Fund, Inc. (the “Fund”) unanimously approved the continuance of the Fund’s Advisory Agreement with the Adviser at a meeting held on November 4-6, 2008.
Prior to approval of the continuance of the Advisory Agreement, the directors had requested from the Adviser, and received and evaluated, extensive materials. They reviewed the proposed continuance of the Advisory Agreement with the Adviser and with experienced counsel who are independent of the Adviser, who advised on the relevant legal standards. The directors also reviewed an independent evaluation prepared by the Fund’s Senior Officer (who is also the Fund’s Independent Compliance Officer) of the reasonableness of the advisory fee in the Advisory Agreement wherein the Senior Officer concluded that the contractual fee for the Fund was reasonable. The directors also discussed the proposed continuance in private sessions with counsel and the Fund’s Senior Officer.
The directors considered their knowledge of the nature and quality of the services provided by the Adviser to the Fund gained from their experience as directors or trustees of most of the registered investment companies advised by the Adviser, their overall confidence in the Adviser’s integrity and competence they have gained from that experience, the Adviser’s initiative in identifying and raising potential issues with the directors and its responsiveness, frankness and attention to concerns raised by the directors in the past, including the Adviser’s willingness to consider and implement organizational and operational changes designed to improve investment results and the services provided to the AllianceBernstein Funds. The directors noted that they have four regular meetings each year, at each of which they receive presentations from the Adviser on the investment results of the Fund and review extensive materials and information presented by the Adviser.
The directors also considered all other factors they believed relevant, including the specific matters discussed below. In their deliberations, the directors did not identify any particular information that was all-important or controlling, and different directors may have attributed different weights to the various factors. The directors determined that the selection of the Adviser to manage the Fund and the overall arrangements between the Fund and the Adviser, as provided in the Advisory Agreement, including the advisory fee, were fair and reasonable in light of the services performed, expenses incurred and such other matters as the directors considered relevant in the exercise of their business judgment. The material factors and conclusions that formed the basis for the directors’ determinations included the following:
Nature, Extent and Quality of Services Provided
The directors considered the scope and quality of services provided by the Adviser under the Advisory Agreement, including the quality of the investment
| | |
| 54 | | • ALLIANCEBERNSTEIN DIVERSIFIED YIELD FUND |
research capabilities of the Adviser and the other resources it has dedicated to performing services for the Fund. They also noted the professional experience and qualifications of the Fund’s portfolio management team and other senior personnel of the Adviser. The directors also considered that the Advisory Agreement provides that the Fund will reimburse the Adviser for the cost to it of providing certain clerical, accounting, administrative and other services provided at the Fund’s request by employees of the Adviser or its affiliates. Requests for these reimbursements are approved by the directors on a quarterly basis and, to the extent requested and paid, result in a higher rate of total compensation from the Fund to the Adviser than the fee rate stated in the Fund’s Advisory Agreement. The directors noted that the methodology used to determine the reimbursement amounts had been reviewed by an independent consultant retained by the Fund’s Senior Officer. The quality of administrative and other services, including the Adviser’s role in coordinating the activities of the Fund’s other service providers, also were considered. The directors concluded that, overall, they were satisfied with the nature, extent and quality of services provided to the Fund under the Advisory Agreement.
Costs of Services Provided and Profitability
The directors reviewed a schedule of the revenues, expenses and related notes indicating the profitability of the Fund to the Adviser for calendar years 2006 and 2007 that had been prepared with an expense allocation methodology arrived at in consultation with an independent consultant retained by the Fund’s Senior Officer. The directors reviewed the assumptions and methods of allocation used by the Adviser in preparing fund-specific profitability data and noted that there are a number of potentially acceptable allocation methodologies for information of this type. The directors noted that the profitability information reflected all revenues and expenses of the Adviser’s relationship with the Fund, including those relating to its subsidiaries which provide transfer agency and distribution services to the Fund. The directors recognized that it is difficult to make comparisons of profitability between fund advisory contracts because comparative information is not generally publicly available and is affected by numerous factors. The directors focused on the profitability of the Adviser’s relationship with the Fund before taxes and distribution expenses. The directors concluded that they were satisfied that the Adviser’s level of profitability from its relationship with the Fund was not unreasonable.
Fall-Out Benefits
The directors considered the benefits to the Adviser and its affiliates from their relationships with the Fund other than the fees and expense reimbursements payable under the Advisory Agreement, including but not limited to benefits relating to 12b-1 fees and sales charges received by the Fund’s principal underwriter (which is a wholly owned subsidiary of the Adviser) in respect of certain classes of the Fund’s shares and transfer agency fees paid by the Fund to a wholly owned subsidiary of the Adviser. The directors recognized that the Adviser’s
| | |
| ALLIANCEBERNSTEIN DIVERSIFIED YIELD FUND • | | 55 |
profitability would be somewhat lower without these benefits. The directors noted that since the Fund does not engage in brokerage transactions, the Adviser does not receive soft dollar benefits in respect of portfolio transactions of the Fund. The directors understood that the Adviser also might derive reputational and other benefits from its association with the Fund.
Investment Results
In addition to the information reviewed by the directors in connection with the meeting, the directors receive detailed performance information for the Fund at each regular Board meeting during the year. At the November 2008 meeting, the directors reviewed information prepared by Lipper showing performance of the Class A Shares of the Fund as compared with that of a group of similar funds selected by Lipper (the “Performance Group”) and as compared with a broader array of funds selected by Lipper (the “Performance Universe”), and information prepared by the Adviser showing performance of the Class A Shares as compared with the Barclays Capital Global Aggregate Bond Index (USD hedged) (the “Index”), in each case for the 1-, 3-, 5- and 10-year periods ended July 31, 2008 and (in the case of the Index) the since inception period (January 1996 inception). The directors noted that the Fund was in the 5th quintile of the Performance Group and the Performance Universe for the 1-year period, 4th quintile of the Performance Group and the Performance Universe for the 3- and 5-year periods, 4th quintile of the Performance Group and 5th quintile of the Performance Universe for the 10-year period, and that the Fund underperformed the Index in the 1-, 3- and 10-year periods and outperformed the Index in the 5-year and since inception periods. The directors also noted that they had approved modifications to the Fund’s investment policy guidelines and a name change to AllianceBernstein Diversified Yield Fund effective November 2007. The directors noted that the substantial underperformance of the Fund in the 1-year period had the effect of pulling down the Fund’s longer-term historical performance, which in prior periods had generally compared favorably to its peers. Based on their review, the directors concluded that the Fund’s relative performance over time had been satisfactory.
Advisory Fees and Other Expenses
The directors considered the advisory fee rate paid by the Fund to the Adviser and information prepared by Lipper concerning advisory fee rates paid by other funds in the same Lipper category as the Fund at a common asset level. The directors recognized that it is difficult to make comparisons of advisory fees because there are variations in the services that are included in the fees paid by other funds.
The directors also considered the fees the Adviser charges other clients with an investment style substantially similar to that of the Fund. For this purpose, they reviewed information in the Adviser’s Form ADV and the evaluation from the Fund’s Senior Officer disclosing the institutional fee schedule for institutional
| | |
| 56 | | • ALLIANCEBERNSTEIN DIVERSIFIED YIELD FUND |
products managed by the Adviser that have an investment style substantially similar to that of the Fund. The directors noted that the institutional fee schedule for clients with an investment style substantially similar to that of the Fund had breakpoints at lower asset levels than those in the fee schedule applicable to the Fund and that the application of the institutional fee schedule to the level of assets of the Fund would result in a fee rate that would be lower than that in the Fund’s Advisory Agreement. The directors noted that the Adviser may, in some cases, agree to fee rates with large institutional clients that are lower than those reviewed by the directors and that they had previously discussed with the Adviser its policies in respect of such arrangements.
The Adviser reviewed with the directors the significantly greater scope of the services it provides to the Fund relative to institutional clients. The Adviser also noted that because mutual funds are constantly issuing and redeeming shares, they are more difficult to manage than an institutional account, where the assets tend to be relatively stable. In light of these facts, the directors did not place significant weight on these fee comparisons.
The directors also considered the total expense ratio of the Class A shares of the Fund in comparison to the fees and expenses of funds within two comparison groups created by Lipper: an Expense Group and an Expense Universe. Lipper described an Expense Group as a representative sample of funds similar to the Fund and an Expense Universe as a broader group, consisting of all funds in the investment classification/objective with a similar load type as the Fund. The Class A expense ratio of the Fund was based on the Fund’s latest fiscal year. The Lipper information included the pro forma expense ratio for Class A Shares provided by the Adviser assuming the new lower expense cap for the Fund following the Adviser’s fixed-income fund realignment effective November 2007 had been in effect for the Fund’s full fiscal year. All references to expense ratios herein are to the pro forma expense ratio. The directors view the expense ratio information as relevant to their evaluation of the Adviser’s services because the Adviser is responsible for coordinating services provided to the Fund by others. The directors noted that it was likely that the expense ratios of some funds in the Fund’s Lipper category were lowered by waivers or reimbursements by those funds’ investment advisers, which in some cases were voluntary and perhaps temporary.
The directors noted that the Fund’s contractual effective advisory fee rate, at approximate current size, of 50 basis points was lower than the Expense Group median. The directors noted that the administrative expense reimbursement was 12 basis points in the Fund’s latest fiscal year, and that as a result the rate of total compensation received by the Adviser pursuant to the Advisory Agreement was higher than the Expense Group median. The directors noted that the Fund’s pro forma total expense ratio, reflecting a lower cap by the Adviser effective November 2007 until at least October 31, 2009 (and subject to expiration thereafter upon notice from the Adviser within 60 days of the end of the Fund’s
| | |
| ALLIANCEBERNSTEIN DIVERSIFIED YIELD FUND • | | 57 |
fiscal year), was lower than the Expense Group and Expense Universe medians. The directors concluded that the Fund’s pro forma expense ratio was satisfactory.
Economies of Scale
The directors noted that the advisory fee schedule for the Fund contains breakpoints that reduce the fee rates on assets above specified levels. The directors also considered presentations by an independent consultant discussing economies of scale in the mutual fund industry and for the AllianceBernstein Funds, as well as a presentation by the Adviser concerning certain of its views on economies of scale. The directors believe that economies of scale may be realized (if at all) by the Adviser across a variety of products and services, and not only in respect of a single fund. The directors noted that there is no established methodology for establishing breakpoints that give effect to the fund-specific services provided by a fund’s adviser and to the economies of scale that an adviser may realize in its overall mutual fund business or those components of it which directly or indirectly affect a fund’s operations. The directors observed that in the mutual fund industry as a whole, as well as among funds similar to the Fund, there is no uniformity or pattern in the fees and asset levels at which breakpoints (if any) apply. The directors also noted that the advisory agreements for many funds do not have breakpoints at all. Having taken these factors into account, the directors concluded that the Fund’s breakpoint arrangements would result in a sharing of economies of scale in the event the Fund’s net assets exceed a breakpoint in the future.
| | |
| 58 | | • ALLIANCEBERNSTEIN DIVERSIFIED YIELD FUND |
THE FOLLOWING IS NOT PART OF THE SHAREHOLDER REPORT OR THE FINANCIAL STATEMENTS
SUMMARY OF SENIOR OFFICER’S EVALUATION OF INVESTMENT ADVISORY AGREEMENT1
The following is a summary of the evaluation of the Investment Advisory Agreement between AllianceBernstein L.P. (the “Adviser”) and the AllianceBernstein Diversified Yield Fund, Inc., (the “Fund”).2 ,3 The evaluation of the Investment Advisory Agreement was prepared by Philip L. Kirstein, the Senior Officer of the Fund, for the Directors of the Fund, as required by the September 1, 2004 Assurance of Discontinuance (“AoD”) between the Adviser and the New York State Attorney General (the “NYAG”). The Senior Officer’s evaluation of the Investment Advisory Agreement is not meant to diminish the responsibility or authority of the Board of Directors of the Fund to perform its duties pursuant to Section 15 of the Investment Company Act of 1940 (the “40 Act”) and applicable state law. The purpose of the summary is to provide shareholders with a synopsis of the independent evaluation of the reasonableness of the advisory fees proposed to be paid by the Fund which was provided to the Directors in connection with their review of the proposed approval of the continuance of the Investment Advisory Agreement. The Senior Officer’s evaluation considered the following factors:
| | 1. | Advisory fees charged to institutional and other clients of the Adviser for like services; |
| | 2. | Advisory fees charged by other mutual fund companies for like services; |
| | 3. | Costs to the Adviser and its affiliates of supplying services pursuant to the advisory agreement, excluding any intra-corporate profit; |
| | 4. | Profit margins of the Adviser and its affiliates from supplying such services; |
| | 5. | Possible economies of scale as the Fund grows larger; and |
| | 6. | Nature and quality of the Adviser’s services including the performance of the Fund. |
FUND ADVISORY FEES, EXPENSE CAPS, REIMBURSEMENTS & RATIOS
The Adviser proposed that the Fund pay the advisory fee set forth in the table below for receiving the services to be provided pursuant to the Investment Advisory Agreement. The fee schedule below, implemented in January 2004 in consideration of the Adviser’s settlement with the NYAG in December 2003, is
| 1 | | It should be noted that Senior Officer’s fee evaluation was completed on October 22, 2008. |
| 2 | | Future references to the Fund do not include “AllianceBernstein.” References in the fee summary pertaining to performance and expense ratios refer to the Class A shares of the Fund. |
| 3 | | It should be noted that prior to November 5, 2007, the Fund was named AllianceBernstein Global Strategic Income Trust Fund, Inc. |
| | |
| ALLIANCEBERNSTEIN DIVERSIFIED YIELD FUND • | | 59 |
based on a master schedule that contemplates eight categories of funds with almost all funds in each category having the same advisory schedule.4
| | | | | | | |
| Category | | Advisory Fee Based on % of
Average Daily Net Assets | | Net Assets 09/30/08 ($MIL) | | Fund |
| High Income | | 50 bp on 1st $2.5 billion
45 bp on next $2.5 billion
40 bp on the balance | | $ | 76.4 | | Diversified Yield Fund, Inc |
The Adviser is reimbursed as specified in the Investment Advisory Agreement for certain clerical, legal, accounting, administrative and other services provided to the Fund. During the Fund’s most recently completed fiscal year, the Adviser received $102,200 (0.12% of the Fund’s average daily net assets) for such services.
The Adviser agreed to waive that portion of its advisory fees and/or reimburse the Fund for that portion of the Fund’s total operating expenses to the degree necessary to limit the Fund’s expense ratios to the amounts set forth below for the Fund’s current fiscal year. The waiver is terminable by the Adviser at the end of the Fund’s fiscal year upon at least 60 days written notice. In addition, set forth below are the Fund’s gross expense ratios, annualized for the most recent semi-annual period:
| | | | | | | | |
| Fund | | Expense Cap Pursuant to
Expense Limitation
Undertaking | | Gross
Expense
Ratio5 | | Fiscal
Year End |
| Diversified Yield Fund, Inc. | | Advisor Class A Class B Class C Class R Class K Class I | | 0.60%
0.90% 1.60% 1.60% 1.10% 0.85% 0.60% | | 1.26%
1.56% 2.34% 2.29% 1.74% 1.44% 1.21% | | October 31 |
| I. | ADVISORY FEES CHARGED TO INSTITUTIONAL AND OTHER CLIENTS |
The advisory fees charged to investment companies which the Adviser manages and sponsors are normally higher than those charged to similar sized institutional accounts, including pension plans and sub-advised investment companies. The fee differential reflects, among other things, different services provided to such clients, and different liabilities assumed. Services provided by the Adviser to the Fund that are not provided to non-investment company clients include
| 4 | | Most of the AllianceBernstein Mutual Funds, which the Adviser manages, were affected by the Adviser’s settlement with the NYAG. |
| | |
| 60 | | • ALLIANCEBERNSTEIN DIVERSIFIED YIELD FUND |
providing office space and personnel to serve as Fund Officers, who among other responsibilities make the certifications required under the Sarbanes-Oxley Act of 2002, and coordinating with and monitoring the Fund’s third party service providers such as Fund counsel, auditors, custodians, transfer agents and pricing services. The accounting, administrative, legal and compliance requirements for the Fund are more costly than those for institutional client assets due to the greater complexities and time required for investment companies, although as previously noted, a portion of these expenses are reimbursed by the Fund to the Adviser. Also, retail mutual funds managed by the Adviser are widely held. Servicing the Fund’s investors is more time consuming and labor intensive compared to institutional clients since the Adviser needs to communicate with a more extensive network of financial intermediaries and shareholders. The Adviser also believes that it incurs substantial entrepreneurial risk when offering a new mutual fund since establishing a new mutual fund requires a large upfront investment and it may take a long time for the fund to achieve profitability since the fund must be priced to scale from inception in order to be competitive and assets are acquired one account at a time. In addition, managing the cash flow of an investment company may be more difficult than that of a stable pool of assets, such as an institutional account with little cash movement in either direction, particularly, if a fund is in net redemption and the Adviser is frequently forced to sell securities to raise cash for redemptions. However, managing a fund with positive cash flow may be easier at times than managing a stable pool of assets. Finally, in recent years, investment advisers have been sued by institutional clients and have suffered reputational damage both by the attendant publicity and outcomes other than complete victories. Accordingly, the legal and reputational risks associated with institutional accounts are greater than previously thought, although still not equal to those related to the mutual fund industry.
Notwithstanding the Adviser’s view that managing an investment company is not comparable to managing other institutional accounts because the services provided are different, it is worth considering information regarding the advisory fees charged to institutional accounts with a substantially similar investment style as the Fund.6 In addition to the AllianceBernstein Institutional fee schedule, set forth below is what would have been the effective advisory fee of the Fund had the AllianceBernstein Institutional fee schedule been applicable to the Fund versus the Fund’s advisory fees based on September 30, 2008 net assets.
| 6 | | The Adviser has indicated that with respect to institutional accounts with assets greater than $300 million, it will negotiate a fee schedule, although it should be noted that there were no such institutional accounts that are similar in investment style as the Fund, which opened in the last three years. Discounts that are negotiated vary based upon each client relationship. |
| | |
| ALLIANCEBERNSTEIN DIVERSIFIED YIELD FUND • | | 61 |
| | | | | | | | |
| Fund | | Net Assets 09/30/08 ($MIL) | | AllianceBernstein (“AB”)
Institutional (“Inst.”) Fee Schedule | | Effective
AB Inst.
Adv. Fee | | Fund Advisory Fee |
| Diversified Yield Fund, Inc. | | $76.4 | | Diversified Yield Schedule 40 bp on 1st $30 million 25 bp on the balance Minimum Account Size: $50 m | | 0.348% | | 0.500% |
The Adviser represented that it does not sub-advise any registered investment company that has a similar investment strategy as the Fund.
| II. | MANAGEMENT FEES CHARGED BY OTHER MUTUAL FUND COMPANIES FOR LIKE SERVICES. |
Lipper, Inc. (“Lipper”), an analytical service that is not affiliated with the Adviser, compared the fees charged to the Fund with fees charged to other investment companies for similar services by other investment advisers. Lipper’s analysis included the Fund’s ranking with respect to the contractual management fee relative to the median of the Fund’s Lipper Expense Group (“EG”)7 at the approximate current asset level of the Fund.8
Lipper describes an EG as a representative sample of comparable funds. Lipper’s standard methodology for screening funds to be included in an EG entails the consideration of several fund criteria, including fund type, investment classification/objective, load type and similar 12b-1/non-12b-1 service fees, asset (size) comparability, and expense components and attributes. An EG will typically consist of seven to twenty funds.
| | | | | | |
| Fund | | Contractual
Management Fee (%)9 | | Lipper Exp. Group Median (%) | | Rank |
| Diversified Yield Fund, Inc. | | 0.500 | | 0.600 | | 2/7 |
| 7 | | It should be noted that Lipper does not consider average account size when constructing EGs. Funds with relatively small average account sizes tend to have higher transfer agent expense ratios than comparable sized funds that have relatively large average account sizes. Note that there are limitations on Lipper expense category data because different funds categorize expenses differently. |
| 8 | | The contractual management fee is calculated by Lipper using the Fund’s contractual management fee rate at a hypothetical asset level. The hypothetical asset level is based on the combined net assets of all classes of the Fund, rounded up to the next $25 million. Lipper’s total expense ratio information is based on the most recent annual report except as otherwise noted. A ranking of “1” means that the Fund has the lowest effective fee rate in the Lipper peer group. |
| 9 | | The contractual management fee does not reflect any expense reimbursements made by the Fund to the Adviser for certain clerical, legal, accounting, administrative, and other services. In addition, the contractual management fee does not reflect any management fee waivers for expense caps that would effectively reduce the actual contractual management fee. |
| | |
| 62 | | • ALLIANCEBERNSTEIN DIVERSIFIED YIELD FUND |
Lipper also compared the Fund’s most recently completed fiscal year total expense ratio to the medians of the Fund’s EG and Lipper Expense Universe (“EU”). The EU is as a broader group compared to the EG, consisting of all funds that have the same investment classification/objective and load type as the subject Fund.10 Pro-forma total expense ratio information (shown in bold and italicized) is included in the table below:
| | | | | | | | | | |
| Fund | | Expense Ratio
(%)11 | | Lipper Exp. Group Median (%) | | Lipper Group Rank | | Lipper Exp. Universe Median (%) | | Lipper Universe Rank |
| Diversified Yield Fund, Inc. | | 1.470 | | 1.117 | | 7/7 | | 1.026 | | 25/26 |
Pro-forma12 | | 0.900 | | 1.117 | | 1/7 | | 1.026 | | 5/26 |
Based on this analysis, the Fund has a more favorable ranking on a pro-forma total expense ratio basis than on a management fee basis.
| III. | COSTS TO THE ADVISER AND ITS AFFILIATES OF SUPPLYING SERVICES PURSUANT TO THE ADVISORY FEE ARRANGEMENT, EXCLUDING ANY INTRA-CORPORATE PROFIT. |
The Adviser utilizes two profitability reporting systems, which operate independently but are aligned with each other, to estimate the Adviser’s profitability in connection with investment advisory services provided to the Fund. The Senior Officer has retained a consultant to provide independent advice regarding the alignment of the two profitability systems as well as the methodologies and allocations utilized by both profitability systems. See Section IV for additional discussion.
| IV. | PROFIT MARGINS OF THE ADVISER AND ITS AFFILIATES FOR SUPPLYING SUCH SERVICES. |
The profitability information for the Fund prepared by the Adviser for the Board of Directors was reviewed by the Senior Officer and the consultant. The Adviser’s profitability from providing investment advisory services to the Fund decreased during calendar year 2007, relative to 2006.
In addition to the Adviser’s direct profits from managing the Fund, certain of the Adviser’s affiliates have business relationships with the Fund and may earn a profit from providing other services to the Fund. The courts have referred to this type of business opportunity as “fall-out benefits” to the Adviser and indicated that such benefits should be factored into the evaluation of the total relationship between the Fund and the Adviser. Neither case law nor common business practice precludes the Adviser’s affiliates from earning a reasonable profit on this
| 10 | | Except for asset (size) comparability, Lipper uses the same criteria for selecting an EG peer when selecting an EU peer. Unlike the EG, the EU allows for the same adviser to be represented by more than just one fund. |
| 11 | | Most recently completed fiscal year Class A share total expense ratio. |
| 12 | | Pro-forma shows what would have been the total expense ratio of the Fund had the Fund’s current expense limitation undertaking been in effect for the full fiscal year. |
| | |
| ALLIANCEBERNSTEIN DIVERSIFIED YIELD FUND • | | 63 |
type of relationship provided the affiliates’ charges and services are competitive. These affiliates provide transfer agent and distribution related services to the Fund and receive transfer agent fees, Rule 12b-1 payments, front-end sales loads and contingent deferred sales charges (“CDSC”).
AllianceBernstein Investments, Inc. (“ABI”), an affiliate of the Adviser, is the Fund’s principal underwriter. ABI and the Adviser have disclosed in the Fund’s prospectus that they may make revenue sharing payments from their own resources, in addition to resources derived from sales loads and Rule 12b-1 fees, to firms that sell shares of the Fund. In 2007, ABI paid approximately 0.04% of the average monthly assets of the AllianceBernstein Mutual Funds or approximately $24 million for distribution services and educational support (revenue sharing payments). For 2008, it is anticipated, ABI will pay approximately 0.04% of the average monthly assets of the AllianceBernstein Mutual Funds or approximately $28 million.13 During the Fund’s most recently completed fiscal year, ABI received from the Fund $10,095, $563,169 and $21,711 in front-end sales charges, Rule 12b-1 and CDSC fees, respectively.
Fees and reimbursements for out of pocket expenses charged by AllianceBernstein Investor Services, Inc. (“ABIS”), the affiliated transfer agent for the Fund, are charged on a per account basis, based on the level of service provided and the class of share held by the account. ABIS also receives a fee per shareholder sub-account for each account maintained by an intermediary on an omnibus basis. ABIS’ after-tax profitability decreased in 2007 in comparison to 2006. During the Fund’s most recently completed fiscal year, ABIS received $55,575 in fees from the Fund.14
| V. | POSSIBLE ECONOMIES OF SCALE |
The Adviser has indicated that economies of scale are being shared with shareholders through fee structures,15 subsidies and enhancement to services. Based on some of the professional literature that has considered economies of scale in the mutual fund industry, it is thought that to the extent economies of scale exist, they may more often exist across a fund family as opposed to a specific fund. This is because the costs incurred by the Adviser, such as investment research or technology for trading or compliance systems, can be spread across a
| 13 | | ABI currently inserts the “Advance” in quarterly account statements and pays the incremental costs associated with the mailing. The incremental cost is less than what an “independent mailing” would cost. |
| 14 | | The fees disclosed are net of any expense offsets with ABIS. An expense offset is created by the interest earned on the positive cash balance that occur within the transfer agent account as there is a one day lag with regards to money movement from the shareholder’s account to the transfer agent’s account and then the transfer agent’s account to the Fund’s account. During the Fund’s most recently completed fiscal year, the fees paid by the Fund to ABIS were reduced by $6,410 under the offset agreement between the Fund and ABIS. |
| 15 | | Fee structures include fee reductions, pricing at scale and breakpoints in advisory fee schedules. |
| | |
| 64 | | • ALLIANCEBERNSTEIN DIVERSIFIED YIELD FUND |
greater asset base as the fund family increases in size. It is also possible that as the level of services required to operate a successful investment company has increased over time, and advisory firms have made such investments in their business to provide services, there may be a sharing of economies of scale without a reduction in advisory fees.
An independent consultant, retained by the Senior Officer, provided the Board of Directors an update of the Deli 16 study on advisory fees and various fund characteristics. The independent consultant first reiterated the results of his previous two dimensional comparison analysis (fund size and family size) with the Board of Directors.17 The independent consultant then discussed the results of the regression model that was utilized to study the effects of various factors on advisory fees. The regression model output indicated that the bulk of the variation in fees predicted were explained by various factors, but substantially by fund assets under management (“AUM”), family AUM, index fund indicator and investment style. The independent consultant also compared the advisory fees of the AllianceBernstein Mutual Funds to similar funds managed by 19 other large asset managers, regardless of fund size and the large asset manager’s proportion of mutual fund assets to non-mutual fund assets.
| VI. | NATURE AND QUALITY OF THE ADVISER’S SERVICES, INCLUDING THE PERFORMANCE OF THE FUND |
With assets under management of approximately $590 billion as of September 30, 2008, the Adviser has the investment experience to manage and provide non-investment services (described in Section I) to the Fund.
| 16 | | The Deli study was originally published in 2002 based on 1997 data. |
| 17 | | The two dimensional analysis showed patterns of lower advisory fees for funds with larger asset sizes and funds from larger family sizes compared to funds with smaller asset sizes and funds from smaller family sizes, which according to the independent consultant is indicative of a sharing of economies of scale and scope. However, in less liquid and active markets, such is not the case, as the empirical analysis showed potential for diseconomies of scale in those markets. The empirical analysis also showed diminishing economies of scale and scope as funds surpassed a certain high level of assets. |
| | |
| ALLIANCEBERNSTEIN DIVERSIFIED YIELD FUND • | | 65 |
The information below shows the 1, 3, 5 and 10 year performance returns and rankings of the Fund18 relative to its Lipper Performance Group (“PG”) and Lipper Performance Universe (“PU”)19 for the periods ended July 31, 2008.20
| | | | | | | | | | |
| | | Fund
Return (%) | | PG
Median (%) | | PU
Median (%) | | PG Rank | | PU Rank |
1 year | | -3.08 | | 2.18 | | 2.97 | | 6/7 | | 29/34 |
3 year | | 3.34 | | 3.63 | | 4.13 | | 5/7 | | 21/28 |
5 year | | 5.11 | | 5.14 | | 6.27 | | 4/5 | | 20/25 |
10 year | | 4.53 | | 4.62 | | 5.38 | | 4/5 | | 17/21 |
Set forth below are the 1, 3, 5 and 10 year and since inception net performance returns of the Fund (in bold)21 versus its benchmark.22 Fund and benchmark volatility and reward-to-variability ratio (“Sharpe Ratio”) information is also shown.23
| 18 | | The performance returns and rankings are for the Class A shares of the Fund. It should be noted that the performance returns of the Fund that is shown were provided by the Adviser. Lipper maintains its own database that includes the Fund’s performance returns. However, differences in the distribution price (ex-date versus payable date) and rounding differences may cause the Adviser’s own performance returns of the Fund to be one or two basis points different from Lipper. To maintain consistency in this evaluation, the performance returns of the Fund, as reported by the Adviser, are provided instead of Lipper. |
| 19 | | The Fund’s PG is identical to the Fund’s EG. The Fund’s PU is not identical to the Fund’s EU as the criteria for including/excluding a fund in/from a PU are somewhat different from that of an EU. |
| 20 | | Note that the current Lipper investment classification/objective dictates the PG and PU throughout the life of the Fund even if the Fund may have had a different investment classification/objective at different points in time. |
| 21 | | The performance returns and risk measures shown in the table are for the Class A shares of the Fund. |
| 22 | | The Adviser provided Portfolio and benchmark performance return information for the periods through July 31, 2008. Benchmark inception is from the nearest month-end after the Fund’s inception date. |
| 23 | | Fund volatility and Sharpe Ratio information was obtained through Lipper LANA, a database maintained by Lipper. Benchmark volatility and Sharpe Ratio information was estimated by the Senior Officer using standard Lipper methodology. Volatility is a statistical measure of the tendency of a market price or yield to vary over time. A Sharpe Ratio is a risk adjusted measure of return that divides a fund’s return in excess of the riskless return by the fund’s standard deviation. A fund with a greater volatility would be seen as more risky than a fund with equivalent performance but lower volatility; for that reason, a greater return would be demanded for the more risky fund. A fund with a higher Sharpe Ratio would be viewed as better performing than a fund with a lower Sharpe Ratio. |
| | |
| 66 | | • ALLIANCEBERNSTEIN DIVERSIFIED YIELD FUND |
| | | | | | | | | | | | | | | | |
| | | Periods Ending July 31, 2008
Annualized Net Performance |
| | | 1
Year
(%) | | 3
Year
(%) | | 5
Year
(%) | | 10
Year
(%) | | Since
Inception
(%) | | Annualized | | Risk
Period
(Year) |
| | | | | | | | Volatility
(%) | | Sharpe
(%) | |
| Diversified Yield Fund, Inc. | | -3.08 | | 3.34 | | 5.11 | | 4.53 | | 6.80 | | 6.02 | | 0.18 | | 10 |
| Lehman Brothers Global Aggregate Bond Index (USD hedged) | | 4.68 | | 3.66 | | 4.16 | | 5.30 | | 5.95 | | 2.75 | | 0.67 | | 10 |
| Inception Date: January 9, 1996 |
CONCLUSION:
Based on the factors discussed above the Senior Officer’s conclusion is that the proposed advisory fee for the Fund is reasonable and within the range of what would have been negotiated at arms-length in light of all the surrounding circumstances. This conclusion in respect of the Fund is based on an evaluation of all of these factors and no single factor was dispositive.
Dated: November 25, 2008
| | |
| ALLIANCEBERNSTEIN DIVERSIFIED YIELD FUND • | | 67 |
THIS PAGE IS NOT PART OF THE SHAREHOLDER REPORT OR THE FINANCIAL STATEMENTS
ALLIANCEBERNSTEIN FAMILY OF FUNDS
Wealth Strategies Funds
Balanced Wealth Strategy
Wealth Appreciation Strategy
Wealth Preservation Strategy
Tax-Managed Balanced Wealth Strategy
Tax-Managed Wealth Appreciation Strategy
Tax-Managed Wealth Preservation Strategy
Blended Style Funds
U.S. Large Cap Portfolio
International Portfolio
Tax-Managed International Portfolio
Growth Funds
Domestic
Growth Fund
Large Cap Growth Fund
Small Cap Growth Portfolio
Small/Mid Cap Growth Fund*
Global & International
Global Growth Fund*
Global Thematic Growth Fund*
Greater China ‘97 Fund
International Growth Fund
Value Funds
Domestic
Balanced Shares
Focused Growth & Income Fund
Growth & Income Fund
Small/Mid Cap Value Fund
Utility Income Fund
Value Fund
Global & International
Global Real Estate Investment Fund
Global Value Fund
International Value Fund
Taxable Bond Funds
Diversified Yield Fund
Global Bond Fund
High Income Fund
Intermediate Bond Portfolio
Short Duration Portfolio
Municipal Bond Funds
| | |
National
National II*
Arizona
California
Florida
Massachusetts
Michigan | | Minnesota
New Jersey
New York
Ohio
Pennsylvania
Virginia |
Intermediate Municipal Bond Funds
Intermediate California
Intermediate Diversified
Intermediate New York
Closed-End Funds
AllianceBernstein Global High Income Fund
AllianceBernstein Income Fund
AllianceBernstein National Municipal Income Fund
ACM Managed Dollar Income Fund
Alliance California Municipal Income Fund
Alliance New York Municipal Income Fund
The Spain Fund
Retirement Strategies Funds
| | | | |
2000 Retirement Strategy | | 2020 Retirement Strategy | | 2040 Retirement Strategy |
2005 Retirement Strategy | | 2025 Retirement Strategy | | 2045 Retirement Strategy |
2010 Retirement Strategy | | 2030 Retirement Strategy | | 2050 Retirement Strategy |
2015 Retirement Strategy | | 2035 Retirement Strategy | | 2055 Retirement Strategy |
We also offer Exchange Reserves,** which serves as the money market fund exchange vehicle for the AllianceBernstein mutual funds.
You should consider the investment objectives, risks, charges and expenses of any AllianceBernstein fund/portfolio carefully before investing. For free copies of our prospectuses, which contain this and other information, visit us online at www.alliancebernstein.com or contact your financial advisor. Please read the prospectus carefully before investing.
| * | | Prior to November 3, 2008, Small/Mid Cap Growth Fund was named Mid-Cap Growth Fund, Global Growth Fund was named Global Research Growth Fund, and Global Thematic Growth Fund was named Global Technology Fund. Prior to December 1, 2008, National II was named Insured National. |
| ** | An investment in the Fund is not a deposit in a bank and is not insured or guaranteed by the Federal Deposit Insurance Corporation or any other government agency. Although the Fund seeks to preserve the value of your investment at $1.00 per share, it is possible to lose money by investing in the Fund. |
| | |
| 68 | | • ALLIANCEBERNSTEIN DIVERSIFIED YIELD FUND |
AllianceBernstein Family Of Funds
ALLIANCEBERNSTEIN DIVERSIFIED YIELD FUND
1345 Avenue of the Americas
New York, NY 10105
800.221.5672
| | |
| |
| DYF-0152-0409 | |  |
ITEM 2. CODE OF ETHICS.
Not applicable when filing a semi-annual report to shareholders.
ITEM 3. AUDIT COMMITTEE FINANCIAL EXPERT.
Not applicable when filing a semi-annual report to shareholders.
ITEM 4. PRINCIPAL ACCOUNTANT FEES AND SERVICES.
Not applicable when filing a semi-annual report to shareholders.
ITEM 5. AUDIT COMMITTEE OF LISTED REGISTRANTS.
Not applicable to the registrant.
ITEM 6. SCHEDULE OF INVESTMENTS.
Please see Schedule of Investments contained in the Report to Shareholders included under Item 1 of this Form N-CSR.
ITEM 7. DISCLOSURE OF PROXY VOTING POLICIES AND PROCEDURES FOR CLOSED-END MANAGEMENT INVESTMENT COMPANIES.
Not applicable to the registrant.
ITEM 8. PORTFOLIO MANAGERS OF CLOSED-END MANAGEMENT INVESTMENT COMPANIES.
Not applicable to the registrant.
ITEM 9. PURCHASES OF EQUITY SECURITIES BY CLOSED-END MANAGEMENT INVESTMENT COMPANY AND AFFILIATED PURCHASERS.
Not applicable to the registrant.
ITEM 10. SUBMISSION OF MATTERS TO A VOTE OF SECURITY HOLDERS.
There have been no material changes to the procedures by which shareholders may recommend nominees to the Fund’s Board of Directors since the Fund last provided disclosure in response to this item.
3
ITEM 11. CONTROLS AND PROCEDURES.
(a) The registrant’s principal executive officer and principal financial officer have concluded that the registrant’s disclosure controls and procedures (as defined in Rule 30a-2(c) under the Investment Company Act of 1940, as amended) are effective at the reasonable assurance level based on their evaluation of these controls and procedures as of a date within 90 days of the filing date of this document.
(b) There were no changes in the registrant’s internal controls over financial reporting that occurred during the second fiscal quarter of the period that has materially affected, or is reasonably likely to materially affect, the registrant’s internal control over financial reporting.
ITEM 12. EXHIBITS.
The following exhibits are attached to this Form N-CSR:
| | |
EXHIBIT NO. | | DESCRIPTION OF EXHIBIT |
| |
| 12 (b) (1) | | Certification of Principal Executive Officer Pursuant to Section 302 of the Sarbanes-Oxley Act of 2002 |
| |
| 12 (b) (2) | | Certification of Principal Financial Officer Pursuant to Section 302 of the Sarbanes-Oxley Act of 2002 |
| |
| 12 (c) | | Certification of Principal Executive Officer and Principal Financial Officer Pursuant to Section 906 of the Sarbanes-Oxley Act of 2002 |
4
SIGNATURES
Pursuant to the requirements of the Securities Exchange Act of 1934 and the Investment Company Act of 1940, the registrant has duly caused this report to be signed on its behalf by the undersigned, thereunto duly authorized.
(Registrant): AllianceBernstein Diversified Yield Fund, Inc.
| | |
| |
| By: | | /s/ Robert M. Keith |
| | Robert M. Keith President |
| |
| Date: | | June 29, 2009 |
Pursuant to the requirements of the Securities Exchange Act of 1934 and the Investment Company Act of 1940, this report has been signed below by the following persons on behalf of the registrant and in the capacities and on the dates indicated.
| | |
| |
| By: | | /s/ Robert M. Keith |
| | Robert M. Keith President |
| |
| Date: | | June 29, 2009 |
| |
| By: | | /s/ Joseph J. Mantineo |
| | Joseph J. Mantineo Treasurer and Chief Financial Officer |
| |
| Date: | | June 29, 2009 |
5