UNITED STATES
SECURITIES AND EXCHANGE COMMISSION
WASHINGTON, D.C. 20549
FORM N-CSR
CERTIFIED SHAREHOLDER REPORT OF REGISTERED
MANAGEMENT INVESTMENT COMPANIES
Investment Company Act file number: 811-07391
ALLIANCEBERNSTEIN UNCONSTRAINED BOND FUND, INC.
(Exact name of registrant as specified in charter)
1345 Avenue of the Americas, New York, New York 10105
(Address of principal executive offices) (Zip code)
Joseph J. Mantineo
AllianceBernstein L.P.
1345 Avenue of the Americas
New York, New York 10105
(Name and address of agent for service)
Registrant’s telephone number, including area code: (800) 221-5672
Date of fiscal year end: October 31, 2011
Date of reporting period: October 31, 2011
ITEM 1. REPORTS TO STOCKHOLDERS.
ANNUAL REPORT
AllianceBernstein Unconstrained Bond Fund

Annual Report
Investment Products Offered
| | • | | Are Not Bank Guaranteed |
Investors should consider the investment objectives, risks, charges and expenses of the Fund carefully before investing. For copies of our prospectus or summary prospectus, which contain this and other information, visit us online at www.alliancebernstein.com or contact your AllianceBernstein Investments representative. Please read the prospectus and/or summary prospectus carefully before investing.
This shareholder report must be preceded or accompanied by the Fund’s prospectus for individuals who are not current shareholders of the Fund.
You may obtain a description of the Fund’s proxy voting policies and procedures, and information regarding how the Fund voted proxies relating to portfolio securities during the most recent 12-month period ended June 30, without charge. Simply visit AllianceBernstein’s website at www.alliancebernstein.com, or go to the Securities and Exchange Commission’s (the “Commission”) website at www.sec.gov, or call AllianceBernstein at (800) 227-4618.
The Fund files its complete schedule of portfolio holdings with the Commission for the first and third quarters of each fiscal year on Form N-Q. The Fund’s Forms N-Q are available on the Commission’s website at www.sec.gov. The Fund’s Forms N-Q may also be reviewed and copied at the Commission’s Public Reference Room in Washington, DC; information on the operation of the Public Reference Room may be obtained by calling (800) SEC-0330. AllianceBernstein publishes full portfolio holdings for the Fund monthly at www.alliancebernstein.com.
AllianceBernstein Investments, Inc. (ABI) is the distributor of the AllianceBernstein family of mutual funds. ABI is a member of FINRA and is an affiliate of AllianceBernstein L.P., the manager of the funds.
AllianceBernstein® and the AB Logo are registered trademarks and service marks used by permission of the owner, AllianceBernstein L.P.
December 14, 2011
Annual Report
This report provides management’s discussion of fund performance for AllianceBernstein Unconstrained Bond Fund (the “Fund”) for the annual reporting period ended October 31, 2011.
Investment Objective and Policies
On February 1, 2011, the Board of Directors of the Fund approved proposals to rename the Fund “AllianceBernstein Unconstrained Bond Fund, Inc.” from “Diversified Yield Fund,” and to adopt a new investment policy. The Fund’s investment objective remains the same, which is to generate income consistent with preservation of capital. In connection with the changes in the Fund’s name, the Directors approved a proposal to adopt a new non-fundamental policy to invest, under normal circumstances, at least 80% of its net assets in fixed-income securities and derivative instruments related to fixed-income securities. The name change is intended to describe more clearly the Fund’s approach to risk and asset allocation as a multi-sector fixed-income fund that may invest in securities of any issuer, including U.S. and non-U.S. governments and corporations, and of any duration. The name and investment policy changes became effective February 3, 2011. At this time, the Fund’s primary benchmark was changed from the Barclays Capital Global Aggregate Bond Index (U.S. dollar hedged) to the Bank of America Merrill Lynch (“BofA ML”) 3-Month U.S. Treasury Bill (“T-Bill”) Index.
The Fund invests, under normal circumstances, at least 80% of its net assets in fixed income securities and derivatives related to fixed income securities. The Fund employs a dynamic risk allocation, meaning that the Fund’s risk profile may vary significantly over time based upon market conditions. The Fund invests in a portfolio of fixed income securities of U.S. and non-U.S. companies and U.S. and non-U.S. government securities and supranational entities, including lower-rated securities.
The Fund may invest in debt securities with a range of maturities from short- to long-term. The Fund expects that its average portfolio duration will vary normally from negative three years to positive seven years, depending upon AllianceBernstein L.P.’s (the “Adviser’s”) forecast of interest rates and assessment of market risks generally. Duration is a measure of a fixed income security’s sensitivity to changes in interest rates. The value of a fixed income security with positive duration will decline if interest rates increase. Conversely, the value of a fixed income security with negative duration will increase as interest rates increase. The Fund will seek to achieve negative duration through the use of derivatives, such as futures and total return swaps.
The Adviser selects securities for purchase or sale based on its assessment of the securities’ risk and return characteristics as well as the securities’ impact on the overall risk and return characteristics of the Fund. In making this assessment, the Adviser takes into
| | | | |
| ALLIANCEBERNSTEIN UNCONSTRAINED BOND FUND • | | | 1 | |
account various factors including the credit quality and sensitivity to interest rates of the securities under consideration and of the Fund’s other holdings. The Fund typically maintains at least 50% of its net assets in investment-grade securities. The Fund may invest up to 50% of its net assets in below investment grade securities, such as corporate high yield fixed income securities, sovereign debt obligations and fixed income securities of issuers located in emerging markets.
The Fund may also invest in mortgage-related and other asset-backed securities, loan participations, inflation-protected securities, structured securities, variable, floating, and inverse floating rate instruments and preferred stock, and may use other investment techniques. The Fund may make short sales of securities or currencies or maintain a short position. The Fund may use borrowings or other leverage for investment purposes. The Fund intends, among other things, to enter into transactions such as reverse repurchase agreements and dollar rolls. The Fund may invest, without limit, in derivatives, such as options, futures, forwards, or swap agreements.
Investment Results
The table on page 6 shows the Fund’s performance compared with its new primary benchmark, the BofA ML 3-Month T-Bill Index, and its old primary benchmark, the Barclays Capital Global Aggregate Bond Index, for the six- and 12-month periods ended October 31, 2011.
The Fund outperformed its new primary benchmark for the 12-month
period, and underperformed for the six-month period, and underperformed its old primary benchmark for both periods, before sales charges. The Fund provided positive absolute returns for the 12-month period; government securities—particularly an allocation to U.S. Treasuries—were a strong contributor. U.S. Treasuries posted strong returns for the period, benefiting from their safe haven status as global uncertainty rose and investors became more risk averse. Exposure to commercial mortgage-backed securities (“CMBS”), asset-backed securities, agency mortgage-backed securities, high yield bank loan debt and emerging market sovereign debt were also positive contributors for the period. The Fund’s short credit default exposure detracted, dampening the relative outperformance for the annual period.
For the six-month period, the Fund’s return fell into negative territory as relative corporate exposure detracted. Short positions in credit default swaps (both investment-grade and high yield) were the primary detractor for the period.
The Fund utilized currency forwards in order to hedge unwanted currency exposure, or to create the desired currency exposure in the portfolio. The Fund’s overall currency exposure contributed positively for the 12-month period, helped by a long position in the Norwegian krone. The Fund’s currency positioning for the six-month period was a modest detractor, as short positions in the Japanese yen and Swiss franc detracted.
| | |
| 2 | | • ALLIANCEBERNSTEIN UNCONSTRAINED BOND FUND |
During both periods, the Fund utilized interest rate swaps and Treasury futures to manage the overall interest rate risk of the Fund. Overall yield curve positioning, particularly in the U.S., was a strong positive. The Fund’s country allocation, specifically a focus on the U.S. where returns were stronger, was also a positive contributor for both periods.
Market Review and Investment Strategy
The global economic recovery that was underway slowed early in the year, resulting from a myriad of global events. Social unrest in North Africa and the Middle East, supply disruptions from the natural disaster in Japan and a spike in commodity prices, particularly oil, all provided headwinds for the global economy early in the year. During the six-month period ended October 31, 2011, renewed fears of a double-dip recession roiled the global capital markets, driving up risk aversion, sending equities sharply lower and widening credit spreads. Fiscal challenges—ranging from the contentious debate over the U.S. debt ceiling to the ongoing sovereign debt woes of Greece and the peripheral European nations—were at the forefront of investors’ worries. The mounting fear and uncertainty led to a spike in financial market volatility.
Fixed income markets posted solid positive absolute returns for the annual period. The broad investment grade fixed income market posted a positive return every month with the exception of June, as investors preferred fixed income over equity assets.
Non-government sectors generally outperformed in the first six months, with Treasuries rallying toward the end of the period as risk aversion set in and investors preferred safety. Although fixed income absolute returns were positive for the annual period, volatility was elevated and returns swung month to month between risk assets and safer Treasuries dependent on investors’ risk tolerance. Investor concerns over the health of the economy and worries emanating from the European sovereign debt crisis led to the exacerbated financial market volatility.
For the 12-month period ended October 31, 2011, investment grade corporates and high yield corporates led positive returns, followed by agency mortgage-backed securities, CMBS, asset-backed securities and high yield bank loans. Mortgage-backed securities were supported by government purchases, while CMBS benefited from a stabilization of property fundamentals and investor appetite for yield. Corporate securities were helped by continued strong revenue and earnings growth. U.S. Treasury securities, which were in negative territory early in the period, rallied strongly in response to increased global uncertainties to post 5.27% for the annual period. During the period, government yields declined across the maturity spectrum.
The Fund has been constructed to enhance overall yield, utilizing a global multi sector approach based on the Unconstrained Bond Team’s (the “Team’s”) best research ideas. The
| | | | |
| ALLIANCEBERNSTEIN UNCONSTRAINED BOND FUND • | | | 3 | |
Team invested in credit sectors including high yield and investment-grade corporates, CMBS, high yield bank loans and emerging market debt, as well as global sovereign and government securities. The Team also
utilized high yielding currency exposure. To balance risk and reduce volatility in negative market conditions, the Team employed derivatives including options, interest rate swaps and futures.
| | |
| 4 | | • ALLIANCEBERNSTEIN UNCONSTRAINED BOND FUND |
HISTORICAL PERFORMANCE
An Important Note About Historical Performance
The investment return and principal value of an investment in the Fund will fluctuate, so that shares, when redeemed, may be worth more or less than their original cost. Performance shown on the following pages represents past performance and does not guarantee future results. Current performance may be lower or higher than the performance information shown. You may obtain performance information current to the most recent month-end by visiting www.alliancebernstein.com.
All fees and expenses related to the operation of the Fund have been deducted. NAV returns do not reflect sales charges; if sales charges were reflected, the Fund’s quoted performance would be lower. SEC returns reflect the applicable sales charges for each share class: a 4.25% maximum front-end sales charge for Class A shares; the applicable contingent deferred sales charge for Class B shares (4% year 1, 3% year 2, 2% year 3, 1% year 4); a 1% 1-year contingent deferred sales charge for Class C shares. Returns for the different share classes will vary due to different expenses associated with each class. Performance assumes reinvestment of distributions and does not account for taxes.
Benchmark Disclosure
The unmanaged BofA ML® 3-Month U.S. T-Bill Index and the Barclays Capital Global Aggregate Bond Index (U.S. dollar hedged) do not reflect fees and expenses associated with the active management of a fund portfolio. The BofA ML 3-Month U.S. T-Bill Index measures the performance of Treasury securities maturing in 90 days. The Barclays Capital Global Aggregate Bond Index (U.S. dollar hedged) represents the performance of the global investment-grade developed fixed income markets. An investor cannot invest directly in an index or average, and their results are not indicative of the performance for any specific investment, including the Fund.
A Word About Risk
Market Risk: The market values of the portfolio’s holdings rise and fall from day to day, so investments may lose value.
Credit Risk: A bond’s credit rating reflects the issuer’s ability to make timely payments of interest or principal—the lower the rating, the higher the risk of default. If the issuer’s financial strength deteriorates, the issuer’s rating may be lowered and the bond’s value may decline.
Inflation Risk: Prices for goods and services tend to rise over time, which may erode the purchasing power of investments.
Below Investment-Grade Securities Risk: Investments in fixed income securities with lower ratings (commonly known as “junk bonds”) tend to have a higher probability that an issuer will default or fail to meet its payment obligations.
Foreign (Non-U.S.) Risk: Non-U.S. securities may be more volatile because of political, regulatory, market and economic uncertainties associated with such securities. Fluctuations in currency exchange rates may negatively affect the value of the investment or reduce returns. These risks are magnified in emerging or developing markets.
Interest Rate Risk (with Prepayment Risk): As interest rates rise, bond prices fall and vice versa—long-term securities tend to rise and fall more than short-term securities. The values of mortgage-related and asset-backed securities are particularly sensitive to changes in interest rates due to prepayment risk.
Derivatives Risk: Investing in derivative instruments such as options, futures, forwards or swaps can be riskier than traditional investments, and may be more volatile, especially in a down market. Trying to enhance investment returns by borrowing money or using other leverage tools—magnify both gains and losses, resulting in greater volatility.
These risks are fully discussed in the Fund’s prospectus.
(Historical Performance continued on next page)
| | | | |
| ALLIANCEBERNSTEIN UNCONSTRAINED BOND FUND • | | | 5 | |
Historical Performance
HISTORICAL PERFORMANCE
(continued from previous page)
| | | | | | | | | | |
| | | | | | | | | | |
THE FUND VS. ITS BENCHMARK PERIODS ENDED OCTOBER 31, 2011 | | NAV Returns | | | |
| | 6 Months | | | 12 Months | | | |
AllianceBernstein Unconstrained Bond Fund† | | | | | | | | | | |
Class A | | | -0.83% | | | | 1.37% | | | |
|
Class B* | | | -1.18% | | | | 0.66% | | | |
|
Class C | | | -1.18% | | | | 0.66% | | | |
|
Advisor Class** | | | -0.57% | | | | 1.79% | | | |
|
Class R** | | | -0.81% | | | | 1.29% | | | |
|
Class K** | | | -0.69% | | | | 1.54% | | | |
|
Class I** | | | -0.69% | | | | 1.69% | | | |
|
New benchmark: BofA ML 3-Month U.S. T-Bill Index | | | 0.04% | | | | 0.13% | | | |
|
Old benchmark: Barclays Capital Global Aggregate Bond Index (U.S. dollar hedged) | | | 3.66% | | | | 2.78% | | | |
|
† Includes the impact of proceeds received and credited to the Fund resulting from class action settlements, which enhanced the Fund’s performance for the six- and 12-month periods ended October 31, 2011, by 0.01% and 0.10%, respectively, for all share classes. * Effective January 31, 2009, Class B shares are no longer available for purchase to new investors. Please see Note A for more information. ** Please note that these share classes are for investors purchasing shares through accounts established under certain fee-based programs sponsored and maintained by certain broker-dealers and financial intermediaries, institutional pension plans and/or investment advisory clients of, and certain other persons associated with, the Adviser and its affiliates or the Funds. |
| | | | | | | | | | |
See Historical Performance and Benchmark disclosures on previous page.
(Historical Performance continued on next page)
| | |
| 6 | | • ALLIANCEBERNSTEIN UNCONSTRAINED BOND FUND |
Historical Performance
HISTORICAL PERFORMANCE
(continued from previous page)
GROWTH OF A $10,000 INVESTMENT IN THE FUND
10/31/01 TO 10/31/11
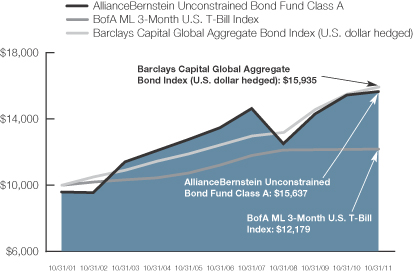
This chart illustrates the total value of an assumed $10,000 investment in AllianceBernstein Unconstrained Bond Fund Class A shares (from 10/31/01 to 10/31/11) as compared to the performance of its benchmarks. The chart reflects the deduction of the maximum 4.25% sales charge from the initial $10,000 investment in the Fund and assumes the reinvestment of dividends and capital gains distributions.
See Historical Performance and Benchmark disclosures on page 5.
(Historical Performance continued on next page)
| | | | |
| ALLIANCEBERNSTEIN UNCONSTRAINED BOND FUND • | | | 7 | |
Historical Performance
HISTORICAL PERFORMANCE
(continued from previous page)
| | | | | | | | | | | | |
| AVERAGE ANNUAL RETURNS AS OF OCTOBER 31, 2011 | |
| | | NAV Returns | | | SEC Returns | | | SEC Yields* | |
| | | | | | | | | | | | |
| Class A Shares | | | | | | | | | | | 1.67 | % |
1 Year | | | 1.37 | % | | | -2.97 | % | | | | |
5 Years | | | 3.04 | % | | | 2.15 | % | | | | |
10 Years | | | 5.02 | % | | | 4.57 | % | | | | |
| | | | | | | | | | | | |
| Class B Shares | | | | | | | | | | | 0.96 | % |
1 Year | | | 0.66 | % | | | -3.26 | % | | | | |
5 Years | | | 2.31 | % | | | 2.31 | % | | | | |
10 Years(a) | | | 4.59 | % | | | 4.59 | % | | | | |
| | | | | | | | | | | | |
| Class C Shares | | | | | | | | | | | 1.04 | % |
1 Year | | | 0.66 | % | | | -0.32 | % | | | | |
5 Years | | | 2.29 | % | | | 2.29 | % | | | | |
10 Years | | | 4.28 | % | | | 4.28 | % | | | | |
| | | | | | | | | | | | |
| Advisor Class Shares‡ | | | | | | | | | | | 2.04 | % |
1 Year | | | 1.79 | % | | | 1.79 | % | | | | |
5 Years | | | 3.34 | % | | | 3.34 | % | | | | |
10 Years | | | 5.34 | % | | | 5.34 | % | | | | |
| | | | | | | | | | | | |
| Class R Shares‡ | | | | | | | | | | | 1.33 | % |
1 Year | | | 1.29 | % | | | 1.29 | % | | | | |
5 Years | | | 2.82 | % | | | 2.82 | % | | | | |
Since Inception† | | | 3.08 | % | | | 3.08 | % | | | | |
| | | | | | | | | | | | |
| Class K Shares‡ | | | | | | | | | | | 1.69 | % |
1 Year | | | 1.54 | % | | | 1.54 | % | | | | |
5 Years | | | 3.14 | % | | | 3.14 | % | | | | |
Since Inception† | | | 3.39 | % | | | 3.39 | % | | | | |
| | | | | | | | | | | | |
| Class I Shares‡ | | | | | | | | | | | 2.10 | % |
1 Year | | | 1.69 | % | | | 1.69 | % | | | | |
5 Years | | | 3.36 | % | | | 3.36 | % | | | | |
Since Inception† | | | 3.65 | % | | | 3.65 | % | | | | |
The Fund’s current prospectus fee table shows the Fund’s total annual operating expense ratios as 1.55%, 2.30%, 2.26%, 1.23%, 1.88%, 1.29% and 1.18% for Class A, Class B, Class C, Advisor Class, Class R, Class K and Class I shares, respectively, gross of any fee waivers or expense reimbursements. Contractual fee waivers and/or expense reimbursements limit the Fund’s annual operating expense ratios (exclusive of interest expense) to 0.90%, 1.60%, 1.60%, 0.60%, 1.10%, 0.85% and 0.60% for Class A, Class B, Class C, Advisor Class, Class R, Class K and Class I shares, respectively. These waivers/reimbursements extend throughout the Fund’s current fiscal year and may be extended by the Adviser for additional one-year terms. Absent reimbursements or waivers, performance would have been lower. The Financial Highlights section of this report sets forth expense ratio data for the current reporting period; the expense ratios shown above may differ from the expense ratios in the Financial Highlights sections since they are based on different time periods.
| * | | SEC yields are calculated based on SEC guidelines for the 30-day period ended October 31, 2011. |
| (a) | | Assumes conversion of Class B shares into Class A shares after eight years. |
| † | | Inception date: 3/1/05. |
| ‡ | | These share classes are offered at net asset value (NAV) to eligible investors and their SEC returns are the same as the NAV returns. Please note that these share classes are for investors purchasing shares through accounts established under certain fee-based programs sponsored and maintained by certain broker-dealers and financial intermediaries, institutional pension plans and/or investment advisory clients of, and certain other persons associated with, the Adviser and its affiliates or the Funds. The inception date for Class R, Class K and Class I shares is listed above. |
See Historical Performance disclosures on page 5.
(Historical Performance continued on next page)
| | |
| 8 | | • ALLIANCEBERNSTEIN UNCONSTRAINED BOND FUND |
Historical Performance
HISTORICAL PERFORMANCE
(continued from previous page)
| | | | |
SEC AVERAGE ANNUAL RETURNS (WITH ANY APPLICABLE SALES CHARGES) AS OF THE MOST RECENT CALENDAR QUARTER-END (SEPTEMBER 30, 2011) | |
| | | SEC Returns | |
| | | | |
| Class A Shares | | | | |
1 Year | | | -1.34 | % |
5 Years | | | 2.46 | % |
10 Years | | | 5.04 | % |
| | | | |
| Class B Shares | | | | |
1 Year | | | -1.61 | % |
5 Years | | | 2.64 | % |
10 Years(a) | | | 5.04 | % |
| | | | |
| Class C Shares | | | | |
1 Year | | | 1.38 | % |
5 Years | | | 2.63 | % |
10 Years | | | 4.74 | % |
| | | | |
| Advisor Class Shares‡ | | | | |
1 Year | | | 3.27 | % |
5 Years | | | 3.65 | % |
10 Years | | | 5.79 | % |
| | | | |
| Class R Shares‡ | | | | |
1 Year | | | 2.77 | % |
5 Years | | | 3.13 | % |
Since Inception† | | | 3.27 | % |
| | | | |
| Class K Shares‡ | | | | |
1 Year | | | 3.26 | % |
5 Years | | | 3.47 | % |
Since Inception† | | | 3.60 | % |
| | | | |
| Class I Shares‡ | | | | |
1 Year | | | 3.43 | % |
5 Years | | | 3.68 | % |
Since Inception† | | | 3.85 | % |
| (a) | | Assumes conversion of Class B shares into Class A shares after eight years. |
| † | | Inception date: 3/1/05. |
| ‡ | | Please note that these share classes are for investors purchasing shares through accounts established under certain fee-based programs sponsored and maintained by certain broker-dealers and financial intermediaries, institutional pension plans and/or investment advisory clients of, and certain other persons associated with, the Adviser and its affiliates or the Funds. The inception date for Class R, Class K and Class I shares is listed above. |
See Historical Performance disclosures on page 5.
| | | | |
| ALLIANCEBERNSTEIN UNCONSTRAINED BOND FUND • | | | 9 | |
Historical Performance
FUND EXPENSES
(unaudited)
As a shareholder of the Fund, you incur two types of costs: (1) transaction costs, including sales charges (loads) on purchase payments, contingent deferred sales charges on redemptions and (2) ongoing costs, including management fees; distribution (12b-1) fees; and other Fund expenses. This example is intended to help you understand your ongoing costs (in dollars) of investing in the Fund and to compare these costs with the ongoing costs of investing in other mutual funds.
The Example is based on an investment of $1,000 invested at the beginning of the period and held for the entire period as indicated below.
Actual Expenses
The table below provides information about actual account values and actual expenses. You may use the information, together with the amount you invested, to estimate the expenses that you paid over the period. Simply divide your account value by $1,000 (for example, an $8,600 account value divided by $1,000 = 8.6), then multiply the result by the number under the heading entitled “Expenses Paid During Period” to estimate the expenses you paid on your account during this period.
Hypothetical Example for Comparison Purposes
The table below also provides information about hypothetical account values and hypothetical expenses based on the Fund’s actual expense ratio and an assumed annual rate of return of 5% before expenses, which is not the Fund’s actual return. The hypothetical account values and expenses may not be used to estimate the actual ending account balance or expenses you paid for the period. You may use this information to compare the ongoing costs of investing in the Fund and other funds by comparing this 5% hypothetical example with the 5% hypothetical examples that appear in the shareholder reports of other funds.
Please note that the expenses shown in the table are meant to highlight your ongoing costs only and do not reflect any transactional costs, such as sales charges (loads), or contingent deferred sales charges on redemptions. Therefore, the hypothetical example is useful in comparing ongoing costs only, and will not help you determine the relative total costs of owning different funds. In addition, if these transactional costs were included, your costs would have been higher.
| | | | | | | | | | | | | | | | | | | | | | | | |
| | | Beginning
Account Value
May 1, 2011 | | | Ending
Account Value
October 31, 2011 | | | Expenses Paid
During Period* | |
| | | Actual | | | Hypothetical | | | Actual | | | Hypothetical** | | | Actual | | | Hypothetical | |
| Class A | | $ | 1,000 | | | $ | 1,000 | | | $ | 991.70 | | | $ | 1,020.67 | | | $ | 4.52 | | | $ | 4.58 | |
| Class B | | $ | 1,000 | | | $ | 1,000 | | | $ | 988.20 | | | $ | 1,017.14 | | | $ | 8.02 | | | $ | 8.13 | |
| Class C | | $ | 1,000 | | | $ | 1,000 | | | $ | 988.20 | | | $ | 1,017.14 | | | $ | 8.02 | | | $ | 8.13 | |
| Advisor Class | | $ | 1,000 | | | $ | 1,000 | | | $ | 994.30 | | | $ | 1,022.18 | | | $ | 3.01 | | | $ | 3.06 | |
| Class R | | $ | 1,000 | | | $ | 1,000 | | | $ | 991.90 | | | $ | 1,019.66 | | | $ | 5.52 | | | $ | 5.60 | |
| Class K | | $ | 1,000 | | | $ | 1,000 | | | $ | 993.10 | | | $ | 1,020.92 | | | $ | 4.27 | | | $ | 4.33 | |
| Class I | | $ | 1,000 | | | $ | 1,000 | | | $ | 993.10 | | | $ | 1,022.18 | | | $ | 3.01 | | | $ | 3.06 | |
| * | | Expenses are equal to the classes’ annualized expense ratios of 0.90%, 1.60%, 1.60%, 0.60%, 1.10%, 0.85% and 0.60%, respectively, multiplied by the average account value over the period, multiplied by 184/365 (to reflect the one-half year period). |
| ** | | Assumes 5% return before expenses. |
| | |
| 10 | | • ALLIANCEBERNSTEIN UNCONSTRAINED BOND FUND |
Fund Expenses
PORTFOLIO SUMMARY
October 31, 2011 (unaudited)
PORTFOLIO STATISTICS
Net Assets ($mil): $100.6
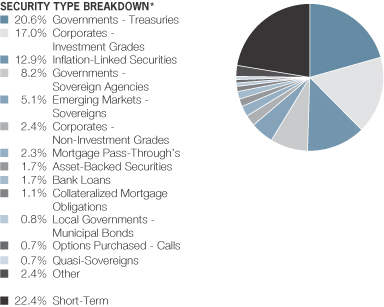
| * | | All data are as of October 31, 2011. The Fund’s security type breakdowns are expressed as a percentage of total investments and may vary over time. The Fund also enters into derivative transactions, which may be used for hedging or investment purposes (see “Portfolio of Investments” section of the report for additional details). “Other” security type weightings represent 0.5% or less in the following security types: Commercial Mortgage-Backed Securities, Emerging Markets—Corporate Bonds, Emerging Markets—Treasuries, Options Purchased—Puts, Governments—Sovereign Bonds, Preferred Stocks and Supranationals. |
| | | | |
| ALLIANCEBERNSTEIN UNCONSTRAINED BOND FUND • | | | 11 | |
Portfolio Summary
PORTFOLIO SUMMARY
October 31, 2011 (unaudited)
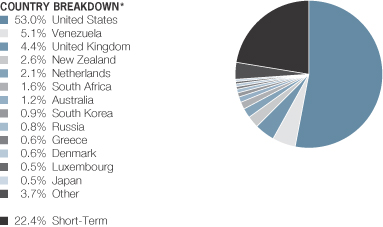
| * | | All data are as of October 31, 2011. The Fund’s country breakdowns are expressed as a percentage of total investments and may vary over time. The Fund also enters into derivative transactions, which may be used for hedging or investment purposes (see “Portfolio of Investments” section of the report for additional details). “Other” country weightings represent 0.4% or less in the following countries: Bermuda, Canada, Cayman Islands, Colombia, Czech Republic, Dominican Republic, France, Germany, Hungary, Ireland, Italy, Kazakhstan, Malaysia, Supranational, Sweden and Switzerland. |
| | |
| 12 | | • ALLIANCEBERNSTEIN UNCONSTRAINED BOND FUND |
Portfolio Summary
PORTFOLIO OF INVESTMENTS
October 31, 2011
| | | | | | | | | | |
| | | | | Principal
Amount (000) | | | U.S. $ Value | |
| |
| | | | | | | | | | |
GOVERNMENTS -
TREASURIES – 25.0% | | | | | | | | | | |
Greece – 0.7% | | | | | | | | | | |
Hellenic Republic Government Bond Series 30YR
4.60%, 9/20/40 | | EUR | | | 1,750 | | | $ | 772,232 | |
| | | | | | | | | | |
| | | |
New Zealand – 3.2% | | | | | | | | | | |
New Zealand Government Bond
Series 1111
6.00%, 11/15/11 | | NZD | | | 3,015 | | | | 2,441,746 | |
Series 521
6.00%, 5/15/21 | | | | | 850 | | | | 764,155 | |
| | | | | | | | | | |
| | | | | | | | | 3,205,901 | |
| | | | | | | | | | |
South Africa – 1.8% | | | | | | | | | | |
South Africa Government Bond
Series R206
7.50%, 1/15/14 | | ZAR | | | 13,850 | | | | 1,801,020 | |
| | | | | | | | | | |
| | | |
United States – 19.3% | | | | | | | | | | |
U.S. Treasury Bonds
3.75%, 8/15/41(a) | | U.S.$ | | | 2,825 | | | | 3,121,625 | |
3.875%, 8/15/40(a) | | | | | 1,825 | | | | 2,058,543 | |
4.25%, 11/15/40(a) | | | | | 1,080 | | | | 1,297,519 | |
4.375%, 5/15/41 | | | | | 900 | | | | 1,104,750 | |
U.S. Treasury Notes
1.125%, 1/15/12 | | | | | 10,000 | | | | 10,022,270 | |
1.375%, 9/15/12(a) | | | | | 1,800 | | | | 1,818,914 | |
| | | | | | | | | | |
| | | | | | | | | 19,423,621 | |
| | | | | | | | | | |
Total Governments - Treasuries
(cost $24,025,009) | | | | | | | | | 25,202,774 | |
| | | | | | | | | | |
| | | | | | | | | | |
CORPORATES - INVESTMENT GRADES – 20.6% | | | | | | | | | | |
Industrial – 9.3% | | | | | | | | | | |
Basic – 1.3% | | | | | | | | | | |
AngloGold Ashanti Holdings PLC
5.375%, 4/15/20 | | | | | 115 | | | | 112,947 | |
ArcelorMittal
6.125%, 6/01/18 | | | | | 225 | | | | 231,102 | |
Dow Chemical Co. (The)
7.60%, 5/15/14 | | | | | 91 | | | | 103,267 | |
Georgia-Pacific LLC
5.40%, 11/01/20(b) | | | | | 57 | | | | 63,548 | |
International Paper Co.
9.375%, 5/15/19 | | | | | 160 | | | | 205,171 | |
Lubrizol Corp.
8.875%, 2/01/19 | | | | | 155 | | | | 210,563 | |
| | | | |
| ALLIANCEBERNSTEIN UNCONSTRAINED BOND FUND • | | | 13 | |
Portfolio of Investments
| | | | | | | | | | |
| | | | | Principal
Amount (000) | | | U.S. $ Value | |
| |
| | | | | | | | | | |
Packaging Corp. of America
5.75%, 8/01/13 | | U.S.$ | | | 180 | | | $ | 193,080 | |
PPG Industries, Inc.
5.75%, 3/15/13 | | | | | 220 | | | | 233,472 | |
| | | | | | | | | | |
| | | | | | | | | 1,353,150 | |
| | | | | | | | | | |
Capital Goods – 0.6% | | | | | | | | | | |
CRH Finance BV
7.375%, 5/28/14 | | EUR | | | 120 | | | | 182,471 | |
Republic Services, Inc.
5.25%, 11/15/21 | | U.S.$ | | | 200 | | | | 228,033 | |
Tyco International Finance SA
8.50%, 1/15/19 | | | | | 150 | | | | 193,429 | |
| | | | | | | | | | |
| | | | | | | | | 603,933 | |
| | | | | | | | | | |
Communications - Media – 1.3% | | | | | | | | | | |
BSKYB Finance UK PLC
5.625%, 10/15/15(b) | | | | | 225 | | | | 253,454 | |
CBS Corp.
8.20%, 5/15/14 | | | | | 155 | | | | 178,136 | |
Comcast Corp.
5.30%, 1/15/14 | | | | | 180 | | | | 195,574 | |
DirecTV Holdings LLC/DirecTV Financing Co., Inc.
4.75%, 10/01/14 | | | | | 70 | | | | 75,961 | |
Reed Elsevier Capital, Inc.
7.75%, 1/15/14 | | | | | 215 | | | | 243,128 | |
Time Warner Cable, Inc.
7.50%, 4/01/14 | | | | | 150 | | | | 170,284 | |
WPP Finance UK
8.00%, 9/15/14 | | | | | 165 | | | | 188,630 | |
| | | | | | | | | | |
| | | | | | | | | 1,305,167 | |
| | | | | | | | | | |
Communications - Telecommunications – 1.7% | | | | | | | | | | |
American Tower Corp.
5.05%, 9/01/20 | | | | | 140 | | | | 147,900 | |
Bell Canada
4.85%, 6/30/14 | | CAD | | | 195 | | | | 207,859 | |
British Telecommunications PLC
8.75%, 12/07/16(c) | | GBP | | | 100 | | | | 196,577 | |
Deutsche Telekom International Finance BV
7.125%, 9/26/12 | | | | | 110 | | | | 184,841 | |
Embarq Corp.
7.082%, 6/01/16 | | U.S.$ | | | 271 | | | | 293,703 | |
Koninklijke KPN NV
5.00%, 11/13/12 | | EUR | | | 130 | | | | 185,487 | |
United States Cellular Corp.
6.70%, 12/15/33 | | U.S.$ | | | 275 | | | | 266,329 | |
| | |
| 14 | | • ALLIANCEBERNSTEIN UNCONSTRAINED BOND FUND |
Portfolio of Investments
| | | | | | | | | | |
| | | | | Principal
Amount (000) | | | U.S. $ Value | |
| |
| | | | | | | | | | |
Vodafone Group PLC
1.97%, 1/13/12(d) | | EUR | | | 150 | | | $ | 207,521 | |
| | | | | | | | | | |
| | | | | | | | | 1,690,217 | |
| | | | | | | | | | |
Consumer Cyclical -
Automotive – 0.9% | | | | | | | | | | |
American Honda Finance Corp.
5.125%, 10/03/12 | | | | | 150 | | | | 213,927 | |
Daimler Finance North America LLC
6.50%, 11/15/13 | | U.S.$ | | | 160 | | | �� | 175,413 | |
Harley-Davidson Funding Corp.
5.75%, 12/15/14(b) | | | | | 137 | | | | 149,332 | |
Nissan Motor Acceptance Corp.
4.50%, 1/30/15(b) | | | | | 146 | | | | 153,357 | |
Volvo Treasury AB
5.95%, 4/01/15(b) | | | | | 190 | | | | 205,410 | |
| | | | | | | | | | |
| | | | | | | | | 897,439 | |
| | | | | | | | | | |
Consumer Cyclical -
Entertainment – 0.2% | | | | | | | | | | |
Viacom, Inc.
6.25%, 4/30/16 | | | | | 165 | | | | 190,375 | |
| | | | | | | | | | |
| | | |
Consumer Cyclical - Other – 0.4% | | | | | | | | | | |
Carnival PLC
4.25%, 11/27/13 | | EUR | | | 140 | | | | 198,880 | |
Marriott International, Inc./DE
Series J
5.625%, 2/15/13 | | U.S.$ | | | 185 | | | | 191,863 | |
| | | | | | | | | | |
| | | | | | | | | 390,743 | |
| | | | | | | | | | |
Consumer Cyclical - Retailers – 0.3% | | | | | | | | | | |
CVS Caremark Corp.
6.60%, 3/15/19 | | | | | 85 | | | | 103,673 | |
Nordstrom, Inc.
6.25%, 1/15/18 | | | | | 180 | | | | 210,587 | |
| | | | | | | | | | |
| | | | | | | | | 314,260 | |
| | | | | | | | | | |
Consumer Non-Cyclical – 0.7% | | | | | | | | | | |
Altria Group, Inc.
9.25%, 8/06/19 | | | | | 150 | | | | 199,403 | |
Beam, Inc.
3.00%, 6/01/12 | | | | | 90 | | | | 91,091 | |
Bunge Ltd. Finance Corp.
5.10%, 7/15/15 | | | | | 154 | | | | 161,329 | |
Newell Rubbermaid, Inc.
5.50%, 4/15/13 | | | | | 32 | | | | 33,776 | |
Reynolds American, Inc.
7.625%, 6/01/16 | | | | | 173 | | | | 206,082 | |
Whirlpool Corp.
8.60%, 5/01/14 | | | | | 20 | | | | 22,664 | |
| | | | | | | | | | |
| | | | | | | | | 714,345 | |
| | | | | | | | | | |
| | | | |
| ALLIANCEBERNSTEIN UNCONSTRAINED BOND FUND • | | | 15 | |
Portfolio of Investments
| | | | | | | | | | |
| | | | | Principal
Amount (000) | | | U.S. $ Value | |
| |
| | | | | | | | | | |
Energy – 1.0% | | | | | | | | | | |
Anadarko Petroleum Corp.
5.95%, 9/15/16 | | U.S.$ | | | 34 | | | $ | 39,073 | |
Hess Corp.
8.125%, 2/15/19 | | | | | 35 | | | | 45,052 | |
Nabors Industries, Inc.
9.25%, 1/15/19 | | | | | 160 | | | | 201,502 | |
Noble Energy, Inc.
8.25%, 3/01/19 | | | | | 153 | | | | 201,286 | |
Noble Holding International Ltd.
4.90%, 8/01/20 | | | | | 15 | | | | 16,269 | |
Valero Energy Corp.
6.875%, 4/15/12 | | | | | 215 | | | | 220,596 | |
Weatherford International Ltd./Bermuda
5.15%, 3/15/13 | | | | | 225 | | | | 235,386 | |
Williams Cos., Inc. (The)
7.875%, 9/01/21 | | | | | 72 | | | | 90,959 | |
| | | | | | | | | | |
| | | | | | | | | 1,050,123 | |
| | | | | | | | | | |
Technology – 0.4% | | | | | | | | | | |
Agilent Technologies, Inc.
5.00%, 7/15/20 | | | | | 28 | | | | 30,522 | |
Motorola Solutions, Inc.
7.50%, 5/15/25 | | | | | 181 | | | | 210,969 | |
Xerox Corp.
8.25%, 5/15/14 | | | | | 165 | | | | 187,855 | |
| | | | | | | | | | |
| | | | | | | | | 429,346 | |
| | | | | | | | | | |
Transportation - Airlines – 0.2% | | | | | | | | | | |
Southwest Airlines Co.
5.25%, 10/01/14 | | | | | 90 | | | | 96,337 | |
5.75%, 12/15/16 | | | | | 70 | | | | 77,283 | |
| | | | | | | | | | |
| | | | | | | | | 173,620 | |
| | | | | | | | | | |
Transportation - Railroads – 0.2% | | | | | | | | | | |
CSX Corp.
7.375%, 2/01/19 | | | | | 149 | | | | 188,434 | |
| | | | | | | | | | |
| | | |
Transportation - Services – 0.1% | | | | | | | | | | |
Ryder System, Inc.
7.20%, 9/01/15 | | | | | 71 | | | | 83,958 | |
| | | | | | | | | | |
| | | | | | | | | 9,385,110 | |
| | | | | | | | | | |
Financial Institutions – 8.6% | | | | | | | | | | |
Banking – 4.2% | | | | | | | | | | |
American Express Credit Corp.
6.625%, 9/24/12 | | GBP | | | 200 | | | | 332,883 | |
ANZ Capital Trust III
2.188%, 12/15/53(d) | | EUR | | | 210 | | | | 221,565 | |
Bank of Scotland PLC
5.625%, 5/23/13 | | | | | 120 | | | | 170,988 | |
| | |
| 16 | | • ALLIANCEBERNSTEIN UNCONSTRAINED BOND FUND |
Portfolio of Investments
| | | | | | | | | | |
| | | | | Principal
Amount (000) | | | U.S. $ Value | |
| |
| | | | | | | | | | |
Barclays Bank PLC
4.75%, 3/15/20 | | EUR | | | 160 | | | $ | 123,980 | |
Bear Stearns Cos. LLC (The)
1.888%, 7/27/12(d) | | | | | 140 | | | | 193,318 | |
Capital One Financial Corp.
7.375%, 5/23/14 | | U.S.$ | | | 170 | | | | 190,269 | |
Citigroup, Inc.
5.50%, 4/11/13 | | | | | 185 | | | | 191,955 | |
Deutsche Bank AG/London
4.875%, 5/20/13 | | | | | 181 | | | | 187,448 | |
Fifth Third Bank/Ohio
4.75%, 2/01/15 | | | | | 250 | | | | 261,212 | |
Goldman Sachs Group, Inc. (The)
6.00%, 6/15/20 | | | | | 165 | | | | 173,770 | |
Lloyds TSB Bank PLC
4.375%, 1/12/15(b) | | | | | 195 | | | | 195,536 | |
Macquarie Group Ltd.
7.625%, 8/13/19(b) | | | | | 115 | | | | 120,426 | |
Merrill Lynch & Co., Inc.
1.84%, 5/30/14(d) | | EUR | | | 250 | | | | 305,341 | |
Morgan Stanley
5.50%, 7/24/20 | | U.S.$ | | | 175 | | | | 174,086 | |
National Australia Bank Ltd.
3.75%, 3/02/15(b) | | | | | 90 | | | | 94,178 | |
Royal Bank of Scotland NV
1.037%, 3/09/15(d) | | | | | 450 | | | | 357,750 | |
Societe Generale SA
2.50%, 1/15/14(b) | | | | | 180 | | | | 172,108 | |
Standard Chartered Bank
5.875%, 9/26/17(b) | | EUR | | | 100 | | | | 141,056 | |
Swedbank AB
0.473%, 5/18/17(d) | | U.S.$ | | | 200 | | | | 193,034 | |
UBS AG/Stamford CT
5.875%, 7/15/16 | | | | | 195 | | | | 201,443 | |
Wachovia Corp.
5.50%, 5/01/13 | | | | | 175 | | | | 186,080 | |
| | | | | | | | | | |
| | | | | | | | | 4,188,426 | |
| | | | | | | | | | |
Brokerage – 1.0% | | | | | | | | | | |
GFI Group, Inc.
8.375%, 7/19/18(b) | | | | | 1,000 | | | | 930,000 | |
Jefferies Group, Inc.
6.875%, 4/15/21 | | | | | 70 | | | | 67,460 | |
| | | | | | | | | | |
| | | | | | | | | 997,460 | |
| | | | | | | | | | |
Finance – 0.4% | | | | | | | | | | |
General Electric Capital Corp.
4.80%, 5/01/13 | | | | | 225 | | | | 236,783 | |
SLM Corp.
1.785%, 11/15/11(d) | | EUR | | | 155 | | | | 214,209 | |
| | | | | | | | | | |
| | | | | | | | | 450,992 | |
| | | | | | | | | | |
| | | | |
| ALLIANCEBERNSTEIN UNCONSTRAINED BOND FUND • | | | 17 | |
Portfolio of Investments
| | | | | | | | | | |
| | | | | Principal
Amount (000) | | | U.S. $ Value | |
| |
| | | | | | | | | | |
Insurance – 2.4% | | | | | | | | | | |
Aetna, Inc.
6.75%, 12/15/37 | | U.S.$ | | | 257 | | | $ | 327,011 | |
Allied World Assurance Co. Ltd.
5.50%, 11/15/20 | | | | | 180 | | | | 184,567 | |
Allstate Corp. (The)
6.125%, 5/15/37 | | | | | 90 | | | | 83,025 | |
CIGNA Corp.
5.125%, 6/15/20 | | | | | 90 | | | | 97,553 | |
Coventry Health Care, Inc.
5.95%, 3/15/17 | | | | | 40 | | | | 44,942 | |
6.125%, 1/15/15 | | | | | 20 | | | | 21,982 | |
6.30%, 8/15/14 | | | | | 125 | | | | 137,275 | |
Genworth Financial, Inc.
6.515%, 5/22/18 | | | | | 230 | | | | 207,563 | |
Hartford Life Institutional Funding
5.375%, 1/17/12 | | GBP | | | 150 | | | | 242,379 | |
Humana, Inc.
6.30%, 8/01/18 | | U.S.$ | | | 25 | | | | 28,646 | |
6.45%, 6/01/16 | | | | | 20 | | | | 22,511 | |
7.20%, 6/15/18 | | | | | 180 | | | | 210,223 | |
Lincoln National Corp.
8.75%, 7/01/19 | | | | | 47 | | | | 57,345 | |
Markel Corp.
7.125%, 9/30/19 | | | | | 60 | | | | 68,768 | |
Marsh & McLennan Cos., Inc.
5.375%, 7/15/14 | | | | | 1 | | | | 1,086 | |
Nationwide Mutual Insurance Co.
9.375%, 8/15/39(b) | | | | | 165 | | | | 202,445 | |
Principal Financial Group, Inc.
7.875%, 5/15/14 | | | | | 115 | | | | 130,789 | |
Prudential Financial, Inc.
6.20%, 1/15/15 | | | | | 135 | | | | 148,404 | |
Series D
7.375%, 6/15/19 | | | | | 25 | | | | 30,354 | |
UnitedHealth Group, Inc.
6.00%, 2/15/18 | | | | | 65 | | | | 76,597 | |
WellPoint, Inc.
5.875%, 6/15/17 | | | | | 20 | | | | 23,052 | |
7.00%, 2/15/19 | | | | | 45 | | | | 55,781 | |
| | | | | | | | | | |
| | | | | | | | | 2,402,298 | |
| | | | | | | | | | |
Other Finance – 0.2% | | | | | | | | | | |
ORIX Corp.
4.71%, 4/27/15 | | | | | 183 | | | | 187,723 | |
| | | | | | | | | | |
| | | |
REITS – 0.4% | | | | | | | | | | |
Digital Realty Trust LP
5.25%, 3/15/21 | | | | | 250 | | | | 244,116 | |
| | |
| 18 | | • ALLIANCEBERNSTEIN UNCONSTRAINED BOND FUND |
Portfolio of Investments
| | | | | | | | | | |
| | | | | Principal
Amount (000) | | | U.S. $ Value | |
| |
| | | | | | | | | | |
Health Care REIT, Inc.
4.95%, 1/15/21 | | U.S.$ | | | 180 | | | $ | 169,501 | |
| | | | | | | | | | |
| | | | | | | | | 413,617 | |
| | | | | | | | | | |
| | | | | | | | | 8,640,516 | |
| | | | | | | | | | |
Utility – 2.2% | | | | | | | | | | |
Electric – 1.2% | | | | | | | | | | |
Allegheny Energy Supply Co. LLC
8.25%, 4/15/12(b) | | | | | 175 | | | | 180,225 | |
Ameren Corp.
8.875%, 5/15/14 | | | | | 113 | | | | 127,844 | |
Constellation Energy Group, Inc.
5.15%, 12/01/20 | | | | | 180 | | | | 184,918 | |
FirstEnergy Corp.
Series B
6.45%, 11/15/11 | | | | | 10 | | | | 10,016 | |
Nisource Finance Corp.
6.15%, 3/01/13 | | | | | 175 | | | | 185,506 | |
Ohio Power Co.
Series F
5.50%, 2/15/13 | | | | | 118 | | | | 123,492 | |
PPL Energy Supply LLC
6.50%, 5/01/18 | | | | | 180 | | | | 204,139 | |
TECO Finance, Inc.
4.00%, 3/15/16 | | | | | 45 | | | | 47,374 | |
5.15%, 3/15/20 | | | | | 55 | | | | 60,173 | |
Union Electric Co.
6.70%, 2/01/19 | | | | | 25 | | | | 30,826 | |
| | | | | | | | | | |
| | | | | | | | | 1,154,513 | |
| | | | | | | | | | |
Natural Gas – 1.0% | | | | | | | | | | |
DCP Midstream LLC
9.75%, 3/15/19(b) | | | | | 155 | | | | 203,533 | |
Energy Transfer Partners LP
6.125%, 2/15/17 | | | | | 225 | | | | 248,566 | |
Enterprise Products Operating LLC
Series G
5.60%, 10/15/14 | | | | | 225 | | | | 248,041 | |
EQT Corp.
8.125%, 6/01/19 | | | | | 35 | | | | 41,644 | |
Spectra Energy Capital LLC
8.00%, 10/01/19 | | | | | 170 | | | | 213,549 | |
Williams Partners LP
3.80%, 2/15/15 | | | | | 48 | | | | 50,325 | |
| | | | | | | | | | |
| | | | | | | | | 1,005,658 | |
| | | | | | | | | | |
| | | | | | | | | 2,160,171 | |
| | | | | | | | | | |
| | | | |
| ALLIANCEBERNSTEIN UNCONSTRAINED BOND FUND • | | | 19 | |
Portfolio of Investments
| | | | | | | | | | |
| | | | | Principal
Amount
(000) | | | U.S. $ Value | |
| |
| | | | | | | | | | |
Non Corporate Sectors – 0.5% | | | | | | | | | | |
Agencies - Not Government Guaranteed – 0.5% | | | | | | | | | | |
Ecopetrol SA
7.625%, 7/23/19 | | U.S.$ | | | 58 | | | $ | 69,194 | |
Gazprom OAO Via Gaz Capital SA
6.212%, 11/22/16(b) | | | | | 416 | | | | 447,720 | |
| | | | | | | | | | |
| | | | | | | | | 516,914 | |
| | | | | | | | | | |
Total Corporates - Investment Grades
(cost $19,636,787) | | | | | | | | | 20,702,711 | |
| | | | | | | | | | |
| | | | | | | | | | |
INFLATION-LINKED SECURITIES – 15.7% | | | | | | | | | | |
United States – 15.7% | | | | | | | | | | |
U.S. Treasury Inflation Index
2.50%, 7/15/16 (TIPS) | | | | | 13,013 | | | | 15,140,424 | |
3.00%, 7/15/12 (TIPS)(a) | | | | | 605 | | | | 622,509 | |
| | | | | | | | | | |
| | | |
Total Inflation-Linked Securities
(cost $15,708,364) | | | | | | | | | 15,762,933 | |
| | | | | | | | | | |
| | | | | | | | | | |
GOVERNMENTS - SOVEREIGN AGENCIES – 10.0% | | | | | | | | | | |
Australia – 1.0% | | | | | | | | | | |
Macquarie Bank Ltd.
2.60%, 1/20/12(b) | | | | | 265 | | | | 266,243 | |
Suncorp-Metway Ltd.
1.903%, 7/16/12(b)(d) | | | | | 750 | | | | 757,887 | |
| | | | | | | | | | |
| | | | | | | | | 1,024,130 | |
| | | | | | | | | | |
Denmark – 0.7% | | | | | | | | | | |
Finance for Danish Industry
2.125%, 3/21/13 | | EUR | | | 500 | | | | 697,731 | |
| | | | | | | | | | |
| | |
Netherlands – 1.8% | | | | | | | | |
ING Bank NV
2.625%, 2/09/12(b) | | U.S.$ | | | 340 | | | | 341,899 | |
NIBC Bank NV
3.125%, 2/17/12 | | EUR | | | 530 | | | | 737,980 | |
SNS Bank NV
2.875%, 1/30/12 | | | | | 535 | | | | 743,122 | |
| | | | | | | | | | |
| | | | | | | | | 1,823,001 | |
| | | | | | | | | | |
South Korea – 0.8% | | | | | | | | | | |
Export-Import Bank of Korea
6.60%, 11/04/13(b) | | IDR | | | 7,720,000 | | | | 847,090 | |
| | | | | | | | | | |
| | | |
United Kingdom – 3.3% | | | | | | | | | | |
Lloyds TSB Bank PLC
2.75%, 3/16/12 | | GBP | | | 475 | | | | 769,008 | |
| | |
| 20 | | • ALLIANCEBERNSTEIN UNCONSTRAINED BOND FUND |
Portfolio of Investments
| | | | | | | | | | |
| | | | | Principal
Amount
(000) | | | U.S. $ Value | |
| |
| | | | | | | | | | |
Royal Bank of Scotland PLC (The)
0.981%, 5/11/12(b)(d) | | U.S.$ | | | 650 | | | $ | 651,980 | |
Skipton Building Society
2.00%, 4/05/12 | | GBP | | | 480 | | | | 775,054 | |
West Bromwich Building Society
2.00%, 4/05/12 | | | | | 344 | | | | 555,644 | |
Yorkshire Building Society
2.00%, 3/30/12 | | | | | 323 | | | | 521,248 | |
| | | | | | | | | | |
| | | | | | | | | 3,272,934 | |
| | | | | | | | | | |
United States – 2.4% | | | | | | | | | | |
General Electric Capital Corp.
4.00%, 6/15/12 | | EUR | | | 192 | | | | 269,997 | |
Goldman Sachs Group, Inc. (The) - FDIC Insured
3.50%, 12/08/11 | | | | | 1,535 | | | | 2,128,665 | |
| | | | | | | | | | |
| | | | | | | | | 2,398,662 | |
| | | | | | | | | | |
Total Governments - Sovereign Agencies
(cost $9,856,105) | | | | | | | | | 10,063,548 | |
| | | | | | | | | | |
| | | | | | | | | | |
EMERGING MARKETS - SOVEREIGNS – 6.2% | | | | | | | | | | |
Venezuela – 6.2% | | | | | | | | | | |
Republic of Venezuela
7.65%, 4/21/25
(cost $6,006,879) | | U.S.$ | | | 10,000 | | | | 6,225,000 | |
| | | | | | | | | | |
| | | | | | | | | | |
CORPORATES - NON-INVESTMENT GRADES – 2.9% | | | | | | | | | | |
Industrial – 2.2% | | | | | | | | | | |
Basic – 0.4% | | | | | | | | | | |
United States Steel Corp.
6.65%, 6/01/37 | | | | | 238 | | | | 178,500 | |
Weyerhaeuser Co.
7.375%, 3/15/32 | | | | | 204 | | | | 203,846 | |
| | | | | | | | | | |
| | | | | | | | | 382,346 | |
| | | | | | | | | | |
Capital Goods – 0.3% | | | | | | | | | | |
Ardagh Glass Finance PLC
7.125%, 6/15/17(b) | | EUR | | | 112 | | | | 141,414 | |
Case New Holland, Inc.
7.875%, 12/01/17 | | U.S.$ | | | 128 | | | | 144,320 | |
| | | | | | | | | | |
| | | | | | | | | 285,734 | |
| | | | | | | | | | |
Communications - Media – 0.6% | | | | | | | | | | |
CCO Holdings LLC/CCO Holdings Capital Corp.
7.875%, 4/30/18 | | | | | 24 | | | | 25,560 | |
8.125%, 4/30/20 | | | | | 8 | | | | 8,660 | |
| | | | |
| ALLIANCEBERNSTEIN UNCONSTRAINED BOND FUND • | | | 21 | |
Portfolio of Investments
| | | | | | | | | | |
| | | | | Principal
Amount
(000) | | | U.S. $ Value | |
| |
| | | | | | | | | | |
Intelsat Jackson Holdings SA
7.25%, 4/01/19(b) | | U.S.$ | | | 247 | | | $ | 248,235 | |
RR Donnelley & Sons Co.
4.95%, 4/01/14 | | | | | 175 | | | | 171,500 | |
Ziggo Bond Co. BV
8.00%, 5/15/18(b) | | EUR | | | 85 | | | | 119,967 | |
| | | | | | | | | | |
| | | | | | | | | 573,922 | |
| | | | | | | | | | |
Communications - Telecommunications – 0.4% | | | | | | | | | | |
Sunrise Communications International SA
7.00%, 12/31/17(b) | | | | | 100 | | | | 140,791 | |
Wind Acquisition Finance SA
7.25%, 2/15/18(b) | | U.S.$ | | | 200 | | | | 194,000 | |
Windstream Corp.
7.875%, 11/01/17 | | | | | 55 | | | | 59,400 | |
| | | | | | | | | | |
| | | | | | | | | 394,191 | |
| | | | | | | | | | |
Consumer Cyclical - Other – 0.0% | | | | | | | | | | |
Standard Pacific Corp.
10.75%, 9/15/16 | | | | | 35 | | | | 36,225 | |
| | | | | | | | | | |
| | | |
Consumer Non-Cyclical – 0.4% | | | | | | | | | | |
ARAMARK Corp.
3.929%, 2/01/15(d) | | | | | 200 | | | | 191,500 | |
HCA, Inc.
7.58%, 9/15/25 | | | | | 65 | | | | 59,475 | |
Universal Health Services, Inc.
7.125%, 6/30/16 | | | | | 135 | | | | 145,800 | |
| | | | | | | | | | |
| | | | | | | | | 396,775 | |
| | | | | | | | | | |
Energy – 0.1% | | | | | | | | | | |
Tesoro Corp.
6.50%, 6/01/17 | | | | | 85 | | | | 85,850 | |
| | | | | | | | | | |
| | | | | | | | | 2,155,043 | |
| | | | | | | | | | |
Financial Institutions – 0.7% | | | | | | | | | | |
Banking – 0.2% | | | | | | | | | | |
National Westminster Bank PLC
3.707%, 1/05/12(d) | | EUR | | | 200 | | | | 193,856 | |
| | | | | | | | | | |
| | | |
Brokerage – 0.2% | | | | | | | | | | |
Lehman Brothers Holdings, Inc.
Zero Coupon 5/25/10-1/12/12(d)(e) | | U.S.$ | | | 875 | | | | 215,469 | |
| | | | | | | | | | |
| | | |
Finance – 0.2% | | | | | | | | | | |
International Lease Finance Corp. 0.748%, 7/13/12(d) | | | | | 230 | | | | 219,936 | |
| | | | | | | | | | |
| | |
| 22 | | • ALLIANCEBERNSTEIN UNCONSTRAINED BOND FUND |
Portfolio of Investments
| | | | | | | | | | |
| | | | | Principal
Amount
(000) | | | U.S. $ Value | |
| |
| | | | | | | | | | |
Insurance – 0.1% | | | | | | | | | | |
ING Capital Funding Trust III
Series 9
3.969%, 12/31/11(d) | | U.S.$ | | | 130 | | | $ | 110,139 | |
| | | | | | | | | | |
| | | | | | | | | 739,400 | |
| | | | | | | | | | |
Total Corporates - Non-Investment Grades
(cost $3,674,728) | | | | | | | | | 2,894,443 | |
| | | | | | | | | | |
| | | | | | | | | | |
MORTGAGE PASS-THROUGH’S – 2.8% | | | | | | | | |
Agency Fixed Rate 30-Year – 2.2% | | | | | | | | | | |
Federal National Mortgage Association
6.00%, 2/01/40 | | | | | 778 | | | | 852,752 | |
Series 2008
6.00%, 5/01/38 | | | | | 1,277 | | | | 1,399,187 | |
| | | | | | | | | | |
| | | | | | | | | 2,251,939 | |
| | | | | | | | | | |
Agency ARMs – 0.6% | | | | | | | | | | |
Federal Home Loan Mortgage Corp.
Series 2006
6.097%, 12/01/36(d) | | | | | 64 | | | | 66,996 | |
Series 2007
5.732%, 4/01/37(d) | | | | | 303 | | | | 322,134 | |
Federal National Mortgage Association
Series 2006
5.593%, 11/01/36(d) | | | | | 159 | | | | 166,258 | |
| | | | | | | | | | |
| | | | | | | | | 555,388 | |
| | | | | | | | | | |
Total Mortgage Pass-Through’s
(cost $2,759,615) | | | | | | | | | 2,807,327 | |
| | | | | | | | | | |
| | | | | | | | | | |
ASSET-BACKED SECURITIES – 2.0% | | | | | | | | | | |
Home Equity Loans - Floating Rate – 1.0% | | | | | | | | | | |
Bear Stearns Asset Backed Securities Trust
Series 2007-HE3, Class M1
0.695%, 4/25/37(d)(f) | | | | | 175 | | | | 3,210 | |
HSBC Home Equity Loan Trust
Series 2006-1, Class M1
0.525%, 1/20/36(d) | | | | | 141 | | | | 123,267 | |
Series 2007-2, Class M1
0.555%, 7/20/36(d) | | | | | 415 | | | | 282,648 | |
Morgan Stanley Structured Trust
Series 2007-1, Class A2
0.435%, 6/25/37(d) | | | | | 430 | | | | 274,473 | |
Option One Mortgage Loan Trust
Series 2007-2, Class M1
0.605%, 3/25/37(d)(f) | | | | | 135 | | | | 413 | |
| | | | |
| ALLIANCEBERNSTEIN UNCONSTRAINED BOND FUND • | | | 23 | |
Portfolio of Investments
| | | | | | | | | | |
| | | | | Principal
Amount
(000) | | | U.S. $ Value | |
| |
| | | | | | | | | | |
Wells Fargo Home Equity Trust
Series 2004-1, Class 1A
0.545%, 4/25/34(d) | | U.S.$ | | | 349 | | | $ | 298,521 | |
| | | | | | | | | | |
| | | | | | | | | 982,532 | |
| | | | | | | | | | |
Credit Cards - Floating Rate – 0.5% | | | | | | | | | | |
Discover Card Master Trust
Series 2009-A1, Class A1
1.543%, 12/15/14(d) | | | | | 185 | | | | 186,374 | |
Series 2009-A2, Class A
1.543%, 2/17/15(d) | | | | | 105 | | | | 105,749 | |
Series 2010-A1, Class A1
0.893%, 9/15/15(d) | | | | | 195 | | | | 196,312 | |
| | | | | | | | | | |
| | | | | | | | | 488,435 | |
| | | | | | | | | | |
Other ABS - Fixed Rate – 0.4% | | | | | | | | | | |
CW Capital Cobalt Ltd.
Series 2006-C1, Class AMP1
5.501%, 8/15/48(b) | | | | | 570 | | | | 474,047 | |
| | | | | | | | | | |
| | | |
Autos - Floating Rate – 0.1% | | | | | | | | | | |
Wheels SPV LLC
Series 2009-1, Class A
1.793%, 3/15/18(b)(d) | | | | | 93 | | | | 93,125 | |
| | | | | | | | | | |
| | | |
Home Equity Loans -
Fixed Rate – 0.0% | | | | | | | | | | |
Nationstar NIM Trust
Series 2007-A, Class A
9.79%, 3/25/37(g)(h) | | | | | 3 | | | | – 0 | – |
| | | | | | | | | | |
| | | |
Total Asset-Backed Securities
(cost $2,762,180) | | | | | | | | | 2,038,139 | |
| | | | | | | | | | |
| | | | | | | | | | |
BANK LOANS – 2.0% | | | | | | | | | | |
Utility – 1.2% | | | | | | | | | | |
Electric – 1.2% | | | | | | | | | | |
FirstLight Power Resources, Inc. (fka NE Energy, Inc.)
4.75%, 5/01/14(d) | | | | | 1,000 | | | | 907,500 | |
Texas Competitive Electric Holdings Company LLC (TXU)
3.74%-3.81%, 10/10/14(d) | | | | | 473 | | | | 351,992 | |
| | | | | | | | | | |
| | | | | | | | | 1,259,492 | |
| | | | | | | | | | |
Industrial – 0.8% | | | | | | | | | | |
Communications - Telecommunications – 0.1% | | | | | | | | | | |
Level 3 Financing, Inc.
2.65%, 3/13/14(d) | | | | | 82 | | | | 79,531 | |
| | | | | | | | | | |
| | |
| 24 | | • ALLIANCEBERNSTEIN UNCONSTRAINED BOND FUND |
Portfolio of Investments
| | | | | | | | | | |
| | | | | Principal
Amount
(000) | | | U.S. $ Value | |
| |
| | | | | | | | | | |
Consumer Cyclical - Other – 0.3% | | | | | | | | | | |
Caesars Entertainment Operating Company, Inc. (fka Harrah’s Operating Company, Inc.)
3.32%-3.42%, 1/28/15(d) | | U.S.$ | | | 314 | | | $ | 276,088 | |
November 2005 Land Investors, LLC (North Las Vegas Consortium)
7.25%, 4/30/10(d)(e) | | | | | 519 | | | | 1,323 | |
| | | | | | | | | | |
| | | | | | | | | 277,411 | |
| | | | | | | | | | |
Technology – 0.4% | | | | | | | | | | |
First Data Corporation
2.99%, 9/24/14(d) | | | | | 437 | | | | 404,128 | |
| | | | | | | | | | |
| | | | | | | | | 761,070 | |
| | | | | | | | | | |
Total Bank Loans
(cost $2,708,724) | | | | | | | | | 2,020,562 | |
| | | | | | | | | | |
| | | | | | | | | | |
COLLATERALIZED MORTGAGE OBLIGATIONS – 1.4% | | | | | | | | | | |
Agency Floating Rate – 0.7% | | | | | | | | | | |
Freddie Mac Reference REMICs
Series R008, Class FK
0.643%, 7/15/23(d) | | | | | 221 | | | | 221,344 | |
Freddie Mac REMICs
Series 3067, Class FA
0.593%, 11/15/35(d) | | | | | 464 | | | | 462,589 | |
| | | | | | | | | | |
| | | | | | | | | 683,933 | |
| | | | | | | | | | |
Non-Agency Floating Rate – 0.6% | | | | | | | | | | |
Countrywide Alternative Loan Trust
Series 2005-62, Class 2A1
1.23%, 12/25/35(d) | | | | | 106 | | | | 64,717 | |
Series 2007-OA3, Class M1
0.555%, 4/25/47(d)(f) | | | | | 117 | | | | 437 | |
Greenpoint Mortgage Funding Trust
Series 2006-AR2, Class 4A1
2.242%, 3/25/36(d) | | | | | 369 | | | | 234,926 | |
Washington Mutual Alternative Mortgage Pass-Through Certificates
Series 2007-OA5, Class 1A
0.98%, 6/25/47(d) | | | | | 462 | | | | 260,897 | |
| | | | | | | | | | |
| | | | | | | | | 560,977 | |
| | | | | | | | | | |
Non-Agency Fixed Rate – 0.1% | | | | | | | | | | |
Countrywide Alternative Loan Trust
Series 2006-OA7, Class 1A1
2.193%, 6/25/46 | | | | | 317 | | | | 120,731 | |
| | | | |
| ALLIANCEBERNSTEIN UNCONSTRAINED BOND FUND • | | | 25 | |
Portfolio of Investments
| | | | | | | | | | |
| | | | | Principal
Amount
(000) | | | U.S. $ Value | |
| |
| | | | | | | | | | |
Merrill Lynch Mortgage Investors, Inc.
Series 2005-A9, Class 2A1A
2.556%, 12/25/35 | | U.S.$ | | | 15 | | | $ | 14,714 | |
| | | | | | | | | | |
| | | | | | | | | 135,445 | |
| | | | | | | | | | |
Total Collateralized Mortgage Obligations
(cost $2,080,256) | | | | | | | | | 1,380,355 | |
| | | | | | | | | | |
| | | | | | | | | | |
LOCAL GOVERNMENTS - MUNICIPAL BONDS – 1.0% | | | | | | | | | | |
United States – 1.0% | | | | | | | | | | |
Alameda Corridor Trnsp Auth CA
NPFGC
6.60%, 10/01/29 | | | | | 100 | | | | 99,507 | |
New Jersey Turnpike Auth
7.102%, 1/01/41 | | | | | 240 | | | | 315,024 | |
New York City Trans Fin Auth
5.767%, 8/01/36 | | | | | 250 | | | | 285,760 | |
University of California
5.77%, 5/15/43 | | | | | 240 | | | | 268,469 | |
| | | | | | | | | | |
| | | |
Total Local Governments - Municipal Bonds
(cost $855,704) | | | | | | | | | 968,760 | |
| | | | | | | | | | |
| | | | | | | | | | |
QUASI-SOVEREIGNS – 0.9% | | | | | | | | | | |
Quasi-Sovereign Bonds – 0.9% | | | | | | | | | | |
Kazakhstan – 0.2% | | | | | | | | | | |
KazMunayGas National Co.
9.125%, 7/02/18(b) | | | | | 200 | | | | 242,000 | |
| | | | | | | | | | |
| | | |
Malaysia – 0.2% | | | | | | | | | | |
Petronas Capital Ltd.
5.25%, 8/12/19(b) | | | | | 190 | | | | 214,868 | |
| | | | | | | | | | |
| | | |
Russia – 0.5% | | | | | | | | | | |
Russian Agricultural Bank OJSC Via RSHB Capital SA
7.75%, 5/29/18(b) | | | | | 410 | | | | 452,537 | |
| | | | | | | | | | |
| | | |
Total Quasi-Sovereigns
(cost $801,606) | | | | | | | | | 909,405 | |
| | | | | | | | | | |
| | |
| 26 | | • ALLIANCEBERNSTEIN UNCONSTRAINED BOND FUND |
Portfolio of Investments
| | | | | | | | | | |
| | | | |
Contracts | | | U.S. $ Value | |
| |
| | | | | | | | | | |
OPTIONS PURCHASED -
CALLS – 0.9% | | | | | | | | | | |
Options on Equity Index Future Contracts – 0.9% | | | | | | | | | | |
C/O GSWBGDPA
Expiration: Nov 2011,
Exercise Price: $96.77(i) | | | | | 9,400,000 | | | $ | 8,075 | |
C/O ISHARES MSCI E
Expiration: Nov 2011,
Exercise Price: $60.00(i)(j) | | | | | 2,250 | | | | 5,625 | |
C/O ISHARES MSCI E
Expiration: Dec 2011,
Exercise Price: $44.00(i)(j) | | | | | 3,715 | | | | 276,767 | |
C/O SPDR SP 500 E
Expiration: Nov 2011,
Exercise Price: $125.00(i)(j) | | | | | 1,045 | | | | 323,428 | |
C/O SPDR SP 500 E
Expiration: Nov 2011,
Exercise Price: $135.00(i)(j) | | | | | 2,080 | | | | 23,920 | |
C/O SPDR SP 500 E
Expiration: Dec 2011,
Exercise Price: $134.00(i)(j) | | | | | 1,010 | | | | 88,880 | |
C/O SPDR SP 500 E
Expiration: Jan 2012,
Exercise Price: $121.00(i)(j) | | | | | 208 | | | | 171,808 | |
| | | | | | | | | | |
Total Options Purchased - Calls
(cost $856,191) | | | | | | | | | 898,503 | |
| | | | | | | | | | |
| | | |
| | | | | Principal
Amount
(000) | | | | |
EMERGING MARKETS - CORPORATE BONDS – 0.6% | | | | | | | | | | |
Financial Institutions – 0.4% | | | | | | | | | | |
Insurance – 0.4% | | | | | | | | | | |
Stoneheath RE
3.523%, 11/30/11(d) | | U.S.$ | | | 600 | | | | 439,500 | |
| | | | | | | | | | |
| | | | | | | | | | |
Industrial – 0.2% | | | | | | | | | | |
Basic – 0.1% | | | | | | | | | | |
Severstal OAO Via Steel Capital SA
9.75%, 7/29/13(b) | | | | | 100 | | | | 107,250 | |
| | | | | | | | | | |
| | | |
Communications - Media – 0.1% | | | | | | | | | | |
Central European Media Enterprises Ltd.
11.625%, 9/15/16(b) | | EUR | | | 50 | | | | 63,650 | |
| | | | | | | | | | |
| | | | | | | | | 170,900 | |
| | | | | | | | | | |
Total Emerging Markets - Corporate Bonds
(cost $711,315) | | | | | | | 610,400 | |
| | | | | | | | | | |
| | | | |
| ALLIANCEBERNSTEIN UNCONSTRAINED BOND FUND • | | | 27 | |
Portfolio of Investments
| | | | | | | | | | |
| Company | | | |
Contracts | | | U.S. $ Value | |
| |
| | | | | | | | | | |
OPTIONS PURCHASED - PUTS – 0.6% | | | | | | | | |
Options on Forward Contracts – 0.3% | | | | | | | | | | |
AUD/USD
Expiration: Dec 2011, Exercise Price: AUD 0.96(i) | | | | | 5,600,000 | | | $ | 20,043 | |
KRW/USD
Expiration: Dec 2011, Exercise Price: KRW 1,160.00(i) | | | | | 6,290,000,000 | | | | 46,576 | |
KRW/USD
Expiration: Jan 2012, Exercise Price: KRW 1,210.00(i) | | | | | 25,160,00,000 | | | | 201,267 | |
| | | | | | | | | | |
| | | | | | | | | 267,886 | |
| | | | | | | | | | |
| | | |
| | | | | Notional
Amount
(000) | | | | |
Swaptions – 0.2% | | | | | | | | | | |
1 year Interest Rate Swap (OTC)
Pay 3 Month USD-LIBOR
Strike Rate 2.21%,
Expires Dec 2011(i) | | U.S.$ | | | 11,750 | | | | 262,370 | |
| | | | | | | | | | |
| | | |
| | | | | Contracts | | | | |
Options on Equity Index Future Contracts – 0.1% | | | | | | | | | | |
P/O SPDR SP 500 E
Expiration: Nov 2011,
Exercise Price: $115.00(i)(j) | | | | | 1,045 | | | | 71,582 | |
| | | | | | | | | | |
| | | |
Total Options Purchased - Puts
(cost $1,008,879) | | | | | | | | | 601,838 | |
| | | | | | | | | | |
| | | |
| | | | | Principal
Amount
(000) | | | | |
GOVERNMENTS - SOVEREIGN BONDS – 0.5% | | | | | | | | | | |
Hungary – 0.5% | | | | | | | | | | |
Hungary Government International Bond
6.375%, 3/29/21
(cost $506,349) | | U.S.$ | | | 510 | | | | 490,875 | |
| | | | | | | | | | |
| | | | | | | | | | |
EMERGING MARKETS -
TREASURIES – 0.4% | | | | | | | | | | |
Dominican Republic – 0.4% | | | | | | | | | | |
Dominican Republic
15.95%, 6/04/21(b)
(cost $413,016) | | DOP | | | 16,100 | | | | 403,962 | |
| | | | | | | | | | |
| | | | | | | | | | |
SUPRANATIONALS – 0.3% | | | | | | | | | | |
European Bank for Reconstruction & Development
Series G
9.25%, 9/10/12
(cost $339,777) | | BRL | | | 595 | | | | 349,604 | |
| | | | | | | | | | |
| | |
| 28 | | • ALLIANCEBERNSTEIN UNCONSTRAINED BOND FUND |
Portfolio of Investments
| | | | | | | | | | |
| | | | | Principal
Amount
(000) | | | U.S. $ Value | |
| |
| | | | | | | | | | |
COMMERCIAL MORTGAGE - BACKED SECURITIES – 0.3% | | | | | | | | | | |
Non-Agency Floating Rate CMBS – 0.3% | | | | | | | | |
Credit Suisse Mortgage Capital Certificates
Series 2006-TF2A, Class SVD
0.713%, 10/15/21(b)(d) | | U.S.$ | | | 190 | | | $ | 175,532 | |
GS Mortgage Securities Corp. II
Series 2007-EOP, Class E
2.669%, 3/06/20(b)(d) | | | | | 105 | | | | 100,501 | |
| | | | | | | | | | |
| | | |
Total Commercial Mortgage-Backed Securities
(cost $295,000) | | | | | | | | | 276,033 | |
| | | | | | | | | | |
| | | |
| | | | | Shares | | | | |
PREFERRED STOCKS – 0.1% | | | | | | | | | | |
Financial Institutions – 0.1% | | | | | | | | | | |
Banking – 0.1% | | | | | | | | | | |
Zions Bancorporation
9.50%
(cost $108,204) | | | | | 6,200 | | | | 160,456 | |
| | | | | | | | | | |
| | | | | | | | | | |
COMMON STOCKS – 0.0% | | | | | | | | | | |
Abitibibowater, Inc.(f)(g)(h)
(cost $0) | | | | | 275,000 | | | | – 0 | – |
| | | | | | | | | | |
| | | | | | | | | | |
SHORT-TERM INVESTMENTS – 27.3% | | | | | | | | |
Investment Companies – 6.4% | | | | | | | | | | |
AllianceBernstein Fixed-Income Shares, Inc. – Government STIF Portfolio, 0.09%(k)
(cost $6,403,039) | | | | | 6,403,039 | | | | 6,403,039 | |
| | | | | | | | | | |
| | | |
| | | | | Principal
Amount
(000) | | | | |
U.S. Treasury Bill – 20.9% | | | | | | | | | | |
U.S. Treasury Bill
Zero Coupon 11/03/11-1/19/12
(cost $20,999,652) | | U.S.$ | | | 21,000 | | | | 20,999,652 | |
| | | | | | | | | | |
| | | |
Total Short-Term Investments
(cost $27,402,691) | | | | | | | | | 27,402,691 | |
| | | | | | | | | | |
Total Investments – 121.5%
(cost $122,517,379) | | | | | | | | | 122,170,319 | |
Other assets less liabilities – (21.5)% | | | | | | | | | (21,612,326 | ) |
| | | | | | | | | | |
| | | |
Net Assets – 100.0% | | | | | | | | $ | 100,557,993 | |
| | | | | | | | | | |
| | | | |
| ALLIANCEBERNSTEIN UNCONSTRAINED BOND FUND • | | | 29 | |
Portfolio of Investments
FUTURES CONTRACTS (see Note D)
| | | | | | | | | | | | | | | | | | |
| Type | | Number of
Contracts | | | Expiration
Month | | Original
Value | | | Value at
October 31,
2011 | | | Unrealized
Appreciation/
(Depreciation) | |
Purchased Contracts | | | | | | | | | | | | |
CBOE VIX Futures | | | 8 | | | January 2012 | | $ | 253,240 | | | $ | 238,400 | | | $ | (14,840 | ) |
Euro-Schatz Futures | | | 7 | | | December 2011 | | | 1,060,025 | | | | 1,062,495 | | | | 2,470 | |
| | | |
Sold Contracts | | | | | | | | | | | | |
Australian 10 Yr Treasury Bond Futures | | | 7 | | | December 2011 | | | 847,857 | | | | 823,538 | | | | 24,319 | |
U.S. 5 Yr Note Futures | | | 36 | | | December 2011 | | | 4,411,517 | | | | 4,413,938 | | | | (2,421 | ) |
U.S. Long Bond Futures | | | 9 | | | December 2011 | | | 1,250,508 | | | | 1,251,281 | | | | (773 | ) |
| | | | | | | | | | | | | | | | | | |
| | | | | | | | | | | | | | | | $ | 8,755 | |
| | | | | | | | | | | | | | | | | | |
FORWARD CURRENCY EXCHANGE CONTRACTS (see Note D)
| | | | | | | | | | | | | | | | |
| Counterparty & Description | | Contract
Amount
(000) | | | U.S. $
Value on
Origination
Date | | | U.S. $
Value at
October 31,
2011 | | | Unrealized
Appreciation/
(Depreciation) | |
Buy Contracts | | | | | | | | | | | | | | | | |
Brown Brothers Harriman & Co.: | | | | | | | | | | | | | | | | |
Canadian Dollar settling 11/17/11 | | | 120 | | | $ | 119,707 | | | $ | 120,022 | | | $ | 315 | |
Great British Pound settling 11/17/11 | | | 6 | | | | 8,815 | | | | 9,088 | | | | 273 | |
Norwegian Krone settling 12/12/11 | | | 145 | | | | 24,776 | | | | 25,919 | | | | 1,143 | |
Polish Zloty settling 12/12/11 | | | 6 | | | | 1,795 | | | | 1,847 | | | | 52 | |
Swedish Krona settling 12/12/11 | | | 236 | | | | 34,685 | | | | 36,173 | | | | 1,488 | |
Citibank: | | | | | | | | | | | | | | | | |
Australian Dollar settling 11/17/11 | | | 442 | | | | 447,420 | | | | 464,710 | | | | 17,290 | |
Euro settling 12/12/11 | | | 575 | | | | 792,317 | | | | 795,642 | | | | 3,325 | |
Japanese Yen settling 11/17/11 | | | 16,090 | | | | 211,092 | | | | 205,862 | | | | (5,230 | ) |
New Zealand Dollar settling 11/17/11 | | | 530 | | | | 429,433 | | | | 428,213 | | | | (1,220 | ) |
Norwegian Krone settling 11/17/11 | | | 2,534 | | | | 446,124 | | | | 454,656 | | | | 8,532 | |
Swedish Krona settling 11/17/11 | | | 2,974 | | | | 444,687 | | | | 455,939 | | | | 11,252 | |
Credit Suisse First Boston: | | | | | | | | | | | | | | | | |
Chinese Yuan Renminbi settling 1/13/12(1) | | | 6,430 | | | | 991,943 | | | | 1,011,023 | | | | 19,080 | |
Goldman Sachs: | | | | | | | | | | | | | | | | |
Brazilian Real settling 11/03/11(1) | | | 643 | | | | 365,115 | | | | 374,611 | | | | 9,496 | |
Brazilian Real settling 11/03/11(1) | | | 643 | | | | 381,008 | | | | 374,611 | | | | (6,397 | ) |
Standard Chartered Bank: | | | | | | | | | | | | | | | | |
South Korean Won settling 11/10/11 | | | 249,202 | | | | 230,252 | | | | 224,725 | | | | (5,527 | ) |
| | | | |
Sale Contracts | | | | | | | | | | | | | | | | |
Brown Brothers Harriman & Co.: | | | | | | | | | | | | | | | | |
Canadian Dollar settling 11/17/11 | | | 120 | | | | 116,182 | | | | 120,022 | | | | (3,840 | ) |
Euro settling 12/12/11 | | | 136 | | | | 187,943 | | | | 187,616 | | | | 327 | |
Great British Pound settling 11/17/11 | | | 6 | | | | 8,740 | | | | 9,088 | | | | (348 | ) |
| | |
| 30 | | • ALLIANCEBERNSTEIN UNCONSTRAINED BOND FUND |
Portfolio of Investments
| | | | | | | | | | | | | | | | |
| Counterparty & Description | | Contract
Amount
(000) | | | U.S. $
Value on
Origination
Date | | | U.S. $
Value at
October 31,
2011 | | | Unrealized
Appreciation/
(Depreciation) | |
Japanese Yen settling 11/17/11 | | | 1,570 | | | $ | 20,552 | | | $ | 20,087 | | | $ | 465 | |
Citibank: | | | | | | | | | | | | | | | | |
Canadian Dollar settling 12/12/11 | | | 220 | | | | 211,573 | | | | 220,511 | | | | (8,938 | ) |
Euro settling 11/17/11 | | | 120 | | | | 162,241 | | | | 166,017 | | | | (3,776 | ) |
Euro settling 12/12/11 | | | 6,256 | | | | 8,375,371 | | | | 8,652,724 | | | | (277,353 | ) |
Great British Pound settling 12/12/11 | | | 2,176 | | | | 3,383,851 | | | | 3,496,542 | | | | (112,691 | ) |
Japanese Yen settling 11/17/11 | | | 88,727 | | | | 1,162,991 | | | | 1,135,212 | | | | 27,779 | |
New Zealand Dollar settling 12/12/11 | | | 3,945 | | | | 3,022,184 | | | | 3,180,914 | | | | (158,730 | ) |
South African Rand settling 12/12/11 | | | 14,471 | | | | 1,805,241 | | | | 1,812,575 | | | | (7,334 | ) |
Credit Suisse First Boston: | | | | | | | | | | | | | | | | |
Chinese Yuan Renminbi settling 1/13/12(1) | | | 6,430 | | | | 997,673 | | | | 1,011,023 | | | | (13,350 | ) |
Deutsche Bank: | | | | | | | | | | | | | | | | |
Euro settling 11/17/11 | | | 232 | | | | 317,458 | | | | 320,443 | | | | (2,985 | ) |
Swiss Franc settling 11/17/11 | | | 387 | | | | 433,595 | | | | 441,294 | | | | (7,699 | ) |
Goldman Sachs: | | | | | | | | | | | | | | | | |
Brazilian Real settling 11/03/11(1) | | | 643 | | | | 381,008 | | | | 374,611 | | | | 6,397 | |
Brazilian Real settling 11/03/11(1) | | | 643 | | | | 354,453 | | | | 374,611 | | | | (20,158 | ) |
Brazilian Real settling 12/02/11(1) | | | 643 | | | | 362,768 | | | | 371,761 | | | | (8,993 | ) |
Morgan Stanley & Co., Inc.: | | | | | | | | | | | | | | | | |
Indonesian Rupiah settling 11/21/11 | | | 7,149,532 | | | | 807,401 | | | | 806,289 | | | | 1,112 | |
Standard Chartered Bank: | | | | | | | | | | | | | | | | |
South Korean Won settling 11/10/11 | | | 249,202 | | | | 210,697 | | | | 224,725 | | | | (14,028 | ) |
| | | | | | | | | | | | | | | | |
| | | | | | | | | | | | | | $ | (550,271 | ) |
| | | | | | | | | | | | | | | | |
| (1) | | Contract represents a non-deliverable forward where payment is received from or paid to a counterparty based on the net realized gain/loss on settlement date. |
PUT OPTIONS WRITTEN (see Note D)
| | | | | | | | | | | | | | | | |
| Description | | Contracts | | | Exercise
Price | | | Expiration
Month | | | U.S. $ Value | |
Put – SPDR S&P 500 ETF Trust(j)
(premium received $415,902) | | | 1,045 | | | $ | 120 | | | | November 2011 | | | $ | (148,390 | ) |
CALL OPTIONS WRITTEN (see Note D)
| | | | | | | | | | | | | | | | |
| Description | | Contracts | | | Exercise
Price | | | Expiration
Month | | | U.S. $ Value | |
Call – SPDR S&P 500 ETF Trust(j)
(premium received $483,826) | | | 1,045 | | | $ | 120 | | | | November 2011 | | | $ | (691,267) | |
| | | | |
| ALLIANCEBERNSTEIN UNCONSTRAINED BOND FUND • | | | 31 | |
Portfolio of Investments
CURRENCY OPTIONS WRITTEN (see Note D)
| | | | | | | | | | | | | | | | | | | | | | | | | | | | |
| Description | | Exercise
Price | | | Expiration
Date | | | Contracts | | | Premiums | | | Market
Value | |
Put – AUD vs. USD | | | AUD | | | | 0.90 | | | | 12/07/11 | | | | AUD | | | | 5,600,000 | | | $ | 35,728 | | | $ | (3,506 | ) |
Put – KRW vs. USD | | | KRW | | | | 1,230.00 | | | | 12/07/11 | | | | KRW | | | | 6,290,000,000 | | | | 26,029 | | | | (14,865 | ) |
Put – KRW vs. USD | | | | | | | 1,140.00 | | | | 01/16/12 | | | | | | | | 12,580,000,000 | | | | 392,297 | | | | (230,418 | ) |
| | | | | | | | | | | | | | | | | | | | | | | | | | | | |
| | | | | | | | | | | | | | | | | | | | | | | | | | $ | (248,789 | ) |
| | | | | | | | | | | | | | | | | | | | | | | | | | | | |
INTEREST RATE SWAPTIONS WRITTEN (see Note D)
| | | | | | | | | | | | | | | | | | | | | | | | |
| Description | | Index | | Counter-
Party | | Exercise
Rate | | | Expiration
Date | | | Notional
Amount (000) | | | Premiums | | | Market
Value | |
1 Year Interest Rate Swap (OTC) | | 3 -Month
USD-LIBOR | | Citibank | | | 2.56 | % | | | 12/21/11 | | | $ | 11,750 | | | $ | 111,625 | | | $ | (107,106 | ) |
1 Year Interest Rate Swap (OTC) | | 3 -Month
USD-LIBOR | | Citibank | | | 4.04 | | | | 03/08/12 | | | | 1,750 | | | | 45,500 | | | | (400,664 | ) |
1 Year Interest Rate Swap (OTC) | | 3 -Month
USD-LIBOR | | Credit
Suisse
International | | | 4.00 | | | | 03/05/12 | | | | 625 | | | | 16,250 | | | | (138,499 | ) |
1 Year Interest Rate Swap (OTC) | | 3 -Month
USD-LIBOR | | Deutsche
Bank AG | | | 3.97 | | | | 03/14/12 | | | | 1,900 | | | | 51,490 | | | | (409,419 | ) |
| | | | | | | | | | | | | | | | | | | | | | | | |
| | | | | | | | | | | | | | | | | | | | | | $ | (1,055,688) | |
| | | | | | | | | | | | | | | | | | | | | | | | |
INTEREST RATE SWAP TRANSACTIONS (see Note D)
| | | | | | | | | | | | | | | | | | | | |
| | | | | | | | | | | | Rate Type | | | |
Swap
Counterparty | | | | | Notional
Amount
(000) | | | Termination
Date | | | Payments
made
by the
Portfolio | | Payments
received
by the
Portfolio | | Unrealized
Appreciation/
(Depreciation) | |
Bank of America | | | AUD | | | | 9,300 | | | | 9/23/16 | | | 6 Month BBSW | | 4.43% | | $ | (100,510) | |
Citibank | | | JPY | | | | 377,500 | | | | 8/1/16 | | | 0.51% | | 6 Month LIBOR | | | (8,947 | ) |
Citibank | | | $ | | | | 43,000 | | | | 8/19/16 | | | 1.21% | | 3 Month LIBOR | | | 32,646 | |
Citibank | | | | | | | 23,750 | | | | 9/12/16 | | | 1.19% | | 3 Month LIBOR | | | 79,014 | |
Citibank | | | NZD | | | | 3,000 | | | | 9/27/16 | | | 3 Month BKBM | | 3.66% | | | (30,509 | ) |
Citibank | | | $ | | | | 17,500 | | | | 9/12/18 | | | 3 Month LIBOR | | 1.7% | | | (117,745 | ) |
Citibank | | | | | | | 23,500 | | | | 8/19/21 | | | 3 Month LIBOR | | 2.36% | | | 177,716 | |
Credit Suisse First Boston | | | | | | | 30,130 | | | | 10/28/16 | | | 1.38% | | 3 Month LIBOR | | | (96,849 | ) |
Credit Suisse First Boston | | | | | | | 22,300 | | | | 10/28/18 | | | 3 Month LIBOR | | 1.88% | | | 30,798 | |
Credit Suisse First Boston | | | | | | | 530 | | | | 3/11/41 | | | 4.41% | | 3 Month LIBOR | | | (156,333 | ) |
Deutsche Bank | | | EUR | | | | 15,500 | | | | 8/5/13 | | | 6 Month
EURIBOR | | 1.81% | | | 85,094 | |
Deutsche Bank | | | $ | | | | 101,250 | | | | 10/31/13 | | | 0.64% | | 3 Month LIBOR | | | (161,685 | ) |
Deutsche Bank | | | | | | | 8,750 | | | | 8/9/16 | | | 1.47% | | 3 Month LIBOR | | | (112,101 | ) |
Deutsche Bank | | | | | | | 4,750 | | | | 9/8/16 | | | 1.18% | | 3 Month LIBOR | | | 15,856 | |
| | |
| 32 | | • ALLIANCEBERNSTEIN UNCONSTRAINED BOND FUND |
Portfolio of Investments
| | | | | | | | | | | | | | | | | | | | |
| | | | | | | | | | | | Rate Type | | | |
Swap
Counterparty | | | | | Notional
Amount
(000) | | | Termination
Date | | | Payments
made
by the
Portfolio | | Payments
received
by the
Portfolio | | Unrealized
Appreciation/
(Depreciation) | |
Deutsche Bank | | | $ | | | | 3,450 | | | | 9/8/18 | | | 3 Month LIBOR | | 1.68% | | $ | (28,437 | ) |
Deutsche Bank | | | EUR | | | | 3,550 | | | | 2/7/21 | | | 3.5% | | 6 Month
EURIBOR | | | (509,446 | ) |
Deutsche Bank | | | $ | | | | 4,800 | | | | 8/9/21 | | | 3 Month LIBOR | | 2.66% | | | 174,749 | |
Goldman Sachs | | | | | | | 18,370 | | | | 10/26/16 | | | 1.44% | | 3 Month
LIBOR | | | (114,523 | ) |
Goldman Sachs | | | | | | | 10,050 | | | | 10/26/21 | | | 3 Month LIBOR | | 2.42% | | | 76,437 | |
JPMorgan Chase Bank | | | | | | | 1,340 | | | | 11/10/12 | | | 6 Month LIBOR | | 1.41% | | | 6,124 | |
JPMorgan Chase Bank | | | GBP | | | | 2,280 | | | | 11/10/15 | | | 2.26% | | 6 Month
LIBOR | | | (112,025 | ) |
JPMorgan Chase Bank | | | $ | | | | 650 | | | | 4/20/20 | | | 3.74% | | 3 Month
LIBOR | | | (83,374 | ) |
JPMorgan Chase Bank | | | | | | | 950 | | | | 4/26/20 | | | 3.77% | | 3 Month
LIBOR | | | (123,926 | ) |
JPMorgan Chase Bank | | | GBP | | | | 940 | | | | 11/10/20 | | | 6 Month LIBOR | | 3.28% | | | 104,009 | |
JPMorgan Chase Bank | | | $ | | | | 1,560 | | | | 11/12/20 | | | 3 Month LIBOR | | 2.83% | | | 100,329 | |
Morgan Stanley | | | | | | | 2,100 | | | | 11/12/12 | | | 3 Month LIBOR | | 0.66% | | | 8,257 | |
Morgan Stanley | | | | | | | 3,660 | | | | 11/12/15 | | | 1.55% | | 3 Month
LIBOR | | | (103,203 | ) |
Morgan Stanley | | | | | | | 1,350 | | | | 7/13/16 | | | 6 Month EURIBOR | | 2.59% | | | 58,773 | |
Morgan Stanley | | | EUR | | | | 1,680 | | | | 7/22/16 | | | 6 Month EURIBOR | | 2.60% | | | 73,990 | |
| | | | | | | | | | | | | | | | | | | | |
| | | | | | | | | | | | | | | | | | $ | (835,821) | |
| | | | | | | | | | | | | | | | | | | | |
CREDIT DEFAULT SWAP CONTRACTS ON CORPORATE, SOVEREIGN ISSUES AND INDICES (see Note D)
| | | | | | | | | | | | | | | | | | | | | | | | |
Swap Counterparty &
Referenced Obligation | | Fixed
Deal
(Pay)
Receive
Rate | | | Implied
Credit
Spread at
October 31,
2011 | | | Notional
Amount
(000) | | | Market
Value | | | Upfront
Premiums
(Paid)
Received | | | Unrealized
Appreciation/
(Depreciation) | |
Buy Contracts | | | | | | | | | | | | | | | | | | | | | | | | |
Bank of America: | | | | | | | | | | | | | | | | | | | | | | | | |
Republic of Korea, 4.875% 9/22/14, 12/20/16* | | | (1.00 | )% | | | 1.39 | % | | $ | 4,700 | | | $ | 81,913 | | | $ | (232,774) | | | $ | (150,861) | |
United Kingdom of Great Britain and Northern Ireland, 4.25% 6/7/32, 9/20/16* | | | (1.00 | ) | | | 0.79 | | | | 11,800 | | | | (132,392 | ) | | | 117,066 | | | | (15,326) | |
Citibank: | | | | | | | | | | | | | | | | | | | | | | | | |
CDX NAIG-15 5 Year Index, 12/20/15* | | | (1.00 | ) | | | 1.09 | | | | 20,000 | | | | 46,862 | | | | 181,985 | | | | 228,847 | |
Hellenic Republic,
5.9% 10/22/22, 6/20/16* | | | (0.00 | ) | | | 43.11 | | | | 2.500 | | | | 177,394 | | | | — | | | | 177.394 | |
| | | | |
| ALLIANCEBERNSTEIN UNCONSTRAINED BOND FUND • | | | 33 | |
Portfolio of Investments
| | | | | | | | | | | | | | | | | | | | | | | | |
Swap Counterparty &
Referenced Obligation | | Fixed
Deal
(Pay)
Receive
Rate | | | Implied
Credit
Spread at
October 31,
2011 | | | Notional
Amount
(000) | | | Market
Value | | | Upfront
Premiums
(Paid)
Received | | | Unrealized
Appreciation/
(Depreciation) | |
Venezuela Government International Bond, 9.25% 9/15/27, 3/20/16* | | | (5.00 | )% | | | 9.54 | % | | $ | 6,550 | | | $ | 896,463 | | | $ | (1,406,285 | ) | | $ | (509,822 | ) |
Credit Suisse First Boston: | | | | | | | | | | | | | | | | | | | | | | | | |
Assa Abloy AB, 6.52%, 6/22/16, 6/20/16* | | | (1.00 | ) | | | 0.77 | | | | 500 | | | | (5,717 | ) | | | 11,734 | | | | 6,017 | |
Astrazeneca PLC, 7% 11/15/23, 6/20/16* | | | (1.00 | ) | | | 0.48 | | | | 500 | | | | (12,384 | ) | | | 13,485 | | | | 1,101 | |
Black & Decker Corp., 5.75% 11/15/16, 6/20/16* | | | (1.00 | ) | | | 0.47 | | | | 500 | | | | (12,590 | ) | | | 15,277 | | | | 2,687 | |
BPB Ltd., 6.5% 3/17/10, 6/20/16* | | | (1.00 | ) | | | 0.67 | | | | 500 | | | | (7,982 | ) | | | 9,746 | | | | 1,764 | |
CDX NAIG-15 5 Year Index, 12/20/15* | | | (1.00 | ) | | | 1.09 | | | | 13,600 | | | | 31,488 | | | | (145,994 | ) | | | (114,506 | ) |
Deutsche Bahn Finance BV, 5% 7/24/19, 6/20/16* | | | (1.00 | ) | | | 0.67 | | | | 500 | | | | (7,940 | ) | | | 12,233 | | | | 4,293 | |
Hershey Co., 6.95% 8/15/12, 6/20/16* | | | (1.00 | ) | | | 0.41 | | | | 500 | | | | (13,960 | ) | | | 12,759 | | | | (1,201 | ) |
Sanofi-Aventis, 3.375% 12/21/15, 6/20/16* | | | (1.00 | ) | | | 0.48 | | | | 500 | | | | (12,453 | ) | | | 13,234 | | | | 781 | |
Svenska Handelsbanken AB, 1.75% 3/8/10, 6/20/16* | | | (1.00 | ) | | | 1.09 | | | | 500 | | | | 1,450 | | | | 12,233 | | | | 13,683 | |
Deutsche Bank: | | | | | | | | | | | | | | | | | | | | | | | | |
Covidien International, 6% 10/15/17, 6/20/16* | | | (1.00 | ) | | | 0.58 | | | | 500 | | | | (10,128 | ) | | | 12,508 | | | | 2,380 | |
Freeport-McMoran Corp., 8.75% 6/1/11, 6/20/16* | | | (1.00 | ) | | | 0.21 | | | | 500 | | | | (18,676 | ) | | | 19,093 | | | | 417 | |
Kingdom of Thailand, 7.07% 9/30/13, 9/20/16* | | | (1.00 | ) | | | 1.64 | | | | 9,350 | | | | 259,447 | | | | (265,676 | ) | | | (6,229 | ) |
Republic of Korea,
4.875% 9/22/14,
9/20/16* | | | (1.00 | ) | | | 1.35 | | | | 2,300 | | | | 34,135 | | | | (6,667 | ) | | | 27,468 | |
HSBC Securities Inc.: | | | | | | | | | | | | | | | | | | | | | | | | |
France Government Bond OAT,
4.25% 4/25/19, 12/20/15* | | | (0.25 | ) | | | 1.61 | | | | 750 | | | | 39,584 | | | | (30,884 | ) | | | 8,700 | |
Morgan Stanley: | | | | | | | | | | | | | | | | | | | | | | | | |
CDX NAIG-17 5 Year Index, 12/20/16* | | | (1.00 | ) | | | 1.21 | | | | 10,300 | | | | 91,302 | | | | (258,754 | ) | | | (167,452 | ) |
CDX NAHY-16 5 Year Index, 6/20/16* | | | (5.00 | ) | | | 5.91 | | | | 3,600 | | | | 100,500 | | | | 9,000 | | | | 109,500 | |
| | |
| 34 | | • ALLIANCEBERNSTEIN UNCONSTRAINED BOND FUND |
Portfolio of Investments
| | | | | | | | | | | | | | | | | | | | | | | | |
Swap Counterparty &
Referenced Obligation | | Fixed
Deal
(Pay)
Receive
Rate | | | Implied
Credit
Spread at
October 31,
2011 | | | Notional
Amount
(000) | | | Market
Value | | | Upfront
Premiums
(Paid)
Received | | | Unrealized
Appreciation/
(Depreciation) | |
Coca-Cola Co.,
5.75% 3/15/11, 6/20/16* | | | (1.00 | )% | | | 0.38 | % | | $ | 500 | | | $ | (14,577 | ) | | $ | 15,074 | | | $ | 497 | |
Republic of Korea, 4.875% 9/22/14, 9/20/16* | | | (1.00 | ) | | | 1.35 | | | | 2,350 | | | | 34,877 | | | | (5,118 | ) | | | 29,759 | |
Syngenta AG, 4.125% 4/22/15, 6/20/16* | | | (1.00 | ) | | | 0.76 | | | | 500 | | | | (6,018 | ) | | | 11,734 | | | | 5,716 | |
Target Corp., 5.375% 5/1/17, 6/20/16* | | | (1.00 | ) | | | 0.47 | | | | 500 | | | | (12,482 | ) | | | 11,807 | | | | (675 | ) |
| | | | | | |
Sale Contracts | | | | | | | | | | | | | | | | | | | | | | | | |
Bank of America: | | | | | | | | | | | | | | | | | | | | | | | | |
Republic of China,
4.75% 10/29/13, 12/20/16* | | | 1.00 | | | | 1.28 | | | | 4,700 | | | | (57,784 | ) | | | 140,659 | | | | 82,875 | |
Citibank: | | | | | | | | | | | | | | | | | | | | | | | | |
CDX NAIG-15 5 Year Index, 12/20/15* | | | 5.00 | | | | 17.73 | | | | 2,600 | | | | (897,956 | ) | | | 747,500 | | | | (150,456 | ) |
CDX NAIG-15 5 Year Index, 12/20/15* | | | 5.00 | | | | 17.73 | | | | 5,000 | | | | (1,727,533 | ) | | | 1,393,750 | | | | (333,783 | ) |
CDX NAIG-9 5 Year Index, 12/20/12* | | | 5.00 | | | | 44.27 | | | | 762 | | | | (276,539 | ) | | | 145,255 | | | | (131,284 | ) |
CDX NAIG-9 5 Year Index, 12/20/12* | | | 5.00 | | | | 44.27 | | | | 914 | | | | (331,846 | ) | | | 190,804 | | | | (141,042 | ) |
Credit Suisse First Boston: | | | | | | | | | | | | | | | | | | | | | | | | |
CMBX NAAM-5, 2/15/51* | | | 0.50 | | | | 0.41 | | | | 2,000 | | | | (488,834 | ) | | | 501,000 | | | | 12,166 | |
Next PLC,
5.25% 9/30/13, 6/20/16* | | | 1.00 | | | | 1.75 | | | | 500 | | | | (15,617 | ) | | | 5,223 | | | | (10,394 | ) |
Reliance Industries Ltd.,
10.375% 6/24/16, 6/20/16* | | | 1.00 | | | | 2.50 | | | | 510 | | | | (31,420 | ) | | | 11,609 | | | | (19,811 | ) |
Transocean, Inc.,
7.375% 4/15/18, 6/20/16* | | | 1.00 | | | | 1.97 | | | | 500 | | | | (20,147 | ) | | | 5,693 | | | | (14,454 | ) |
Deutsche Bank: | | | | | | | | | | | | | | | | | | | | | | | | |
Hellenic Republic,
5.9% 10/22/22, 6/20/16* | | | (0.00 | ) | | | 43.11 | | | | 850 | | | | (60,314 | ) | | | — | | | | (60,314 | ) |
Republic of China,
4.75% 10/29/13, 9/20/16* | | | 1.00 | | | | 1.23 | | | | 9,300 | | | | (89,246 | ) | | | (61,155 | ) | | | (150,401 | ) |
Unum Group,
7.375% 6/15/32, 6/20/16* | | | 1.00 | | | | 2.54 | | | | 500 | | | | (31,532 | ) | | | 10,139 | | | | (21,393 | ) |
Morgan Stanley: | | | | | | | | | | | | | | | | | | | | | | | | |
CDX NAHY-15 5 Year Index, 12/20/15* | | | 5.00 | | | | 5.49 | | | | 3,600 | | | | (39,768 | ) | | | (45,000 | ) | | | (84,768 | ) |
| | | | |
| ALLIANCEBERNSTEIN UNCONSTRAINED BOND FUND • | | | 35 | |
Portfolio of Investments
| | | | | | | | | | | | | | | | | | | | | | | | |
Swap Counterparty &
Referenced Obligation | | Fixed
Deal
(Pay)
Receive
Rate | | | Implied
Credit
Spread at
October 31,
2011 | | | Notional
Amount
(000) | | | Market
Value | | | Upfront
Premiums
(Paid)
Received | | | Unrealized
Appreciation/
(Depreciation) | |
CDX NAIG-9 5 Year Index, 12/20/12 | | | 5.00 | % | | | 44.27 | % | | $ | 724 | | | $ | (262,712 | ) | | $ | 130,208 | | | $ | (132,504 | ) |
CMBX NAAJ-5, 2/15/51* | | | 0.98 | | | | 0.43 | | | | 5,000 | | | | (2,094,283 | ) | | | 1,929,900 | | | | (164,383 | ) |
CMBX NAAM-5, 2/15/51* | | | 0.50 | | | | 0.49 | | | | 3,000 | | | | (733,250 | ) | | | 862,750 | | | | 129,500 | |
Daiwa Securities
Group Inc.,
2.08% 2/17/16, 6/20/16* | | | 1.00 | | | | 2.96 | | | | 510 | | | | (40,642 | ) | | | 15,706 | | | | (24,936 | ) |
El Paso Corp.,
6.875% 06/15/14, 6/20/16* | | | 1.00 | | | | 1.90 | | | | 510 | | | | (19,083 | ) | | | 16,774 | | | | (2,309 | ) |
ICICI Bank Ltd.,
5.5% 3/25/15, 6/20/16* | | | 1.00 | | | | 3.30 | | | | 500 | | | | (46,240 | ) | | | 23,866 | | | | (22,374 | ) |
Republic of China,
4.75% 10/29/13, 9/20/16* | | | 1.00 | | | | 1.23 | | | | 4,700 | | | | (45,103 | ) | | | (30,941 | ) | | | (76,044 | ) |
Telecom Italia SpA, 5.375% 1/29/19, 6/20/16* | | | 1.00 | | | | 3.58 | | | | 510 | | | | (52,368 | ) | | | 19,781 | | | | (32,587 | ) |
| | | | | | | | | | | | | | | | | | | | | | | | |
| | | | | | | | | | | | | | | | | | | | | | $ | (1,693,764) | |
| | | | | | | | | | | | | | | | | | | | | | | | |
TOTAL RETURN SWAP CONTRACTS ON INDICES (see Note D)
| | | | | | | | | | | | | | | | | | | | | | |
Receive/
Pay Total
Return on
Reference
Index | | Index | | # of
Shares
or Units | | | Rate
Paid by the Fund | | | Notional
Amount
(000) | | | Maturity
Date | | Counterparty | | Unrealized
Appreciation/
(Depreciation) | |
Receive Total Return on Reference Index | | | | | | | | | | | | | |
Receive | | BEFSEBWS Index | | | 2,500,000 | | | | 1.25% | | | $ | 2,500 | | | 9/21/12 | | Barclays Capital Inc. | | $ | (3,861 | ) |
Receive | | CSAVIR on 20th Index | | | 33,747 | | | | 0.04% | | | | 4,695 | | | 8/20/12 | | Credit Suisse First Boston | | | (5,905 | ) |
Receive | | GCSCS Index | | | 1,690,952 | | |
| 1-Month
EURIBOR
Plus
0.50% |
| | | 1,691 | | | 2/17/12 | | Credit Suisse First Boston | | | (22,873 | ) |
Receive | | GSMR Friday Index* | | | 4,559 | | | | — | | | | 183 | | | 9/21/12 | | Goldman Sachs | | | 2,488 | |
Receive | | GSMR Friday Index* | | | 4,919 | | | | — | | | | 200 | | | 9/21/12 | | Goldman Sachs | | | (152 | ) |
Receive | | GSMR Monday Index* | | | 8,125 | | | | — | | | | 194 | | | 9/17/12 | | Goldman Sachs | | | (3,434 | ) |
Receive | | GSMR Monday Index* | | | 8,479 | | | | — | | | | 200 | | | 9/17/12 | | Goldman Sachs | | | (661 | ) |
Receive | | GSMR Thursday Index* | | | 4,374 | | | | — | | | | 182 | | | 9/20/12 | | Goldman Sachs | | | 2,904 | |
| | |
| 36 | | • ALLIANCEBERNSTEIN UNCONSTRAINED BOND FUND |
Portfolio of Investments
| | | | | | | | | | | | | | | | | | | | | | |
Receive/
Pay Total
Return on
Reference
Index | | Index | | # of
Shares
or Units | | | Rate
Paid by the Fund | | | Notional
Amount
(000) | | | Maturity
Date | | Counterparty | | Unrealized
Appreciation/
(Depreciation) | |
Receive | | GSMR Thursday Index* | | | 4,722 | | | | — | | | $ | 200 | | | 9/20/12 | | Goldman Sachs | | $ | 110 | |
Receive | | GSMR Tuesday Index* | | | 2,896 | | | | — | | | | 193 | | | 9/18/12 | | Goldman Sachs | | | 4,246 | |
Receive | | GSMR Tuesday Index* | | | 2,972 | | | | — | | | | 200 | | | 9/18/12 | | Goldman Sachs | | | 1,991 | |
Receive | | GSMR Wednesday Index* | | | 3,621 | | | | — | | | | 194 | | | 9/19/12 | | Goldman Sachs | | | 6,955 | |
Receive | | GSMR Wednesday Index* | | | 3,639 | | | | — | | | | 200 | | | 9/19/12 | | Goldman Sachs | | | 2,001 | |
Receive | | GSWFLRLC Index | | | 14,304 | | |
| 1-Month
USD-LIBOR-
BBA Plus
0.40% |
| | | 2,017 | | | 10/24/12 | | Goldman Sachs | | | 26,165 | |
Receive | | GSWFLRLC Index | | | 14,522 | | |
| 1-Month
USD-LIBOR-
BBA Plus
0.40% |
| | | 2,014 | | | 10/26/12 | | Goldman Sachs | | | 60,070 | |
| | | | | | | | | | | | | | | | | | | | | | |
| | | | | | | | | | | | | | | | | | | | $ | 70,044 | |
| | | | | | | | | | | | | | | | | | | | | | |
| * | | The total return swap underlying is the Goldman Sachs Mean Reversion (“GSMR”) strategy. This strategy involves buying daily variance swaps and simultaneously selling weekly variance swaps on the S&P 500 Index over the same time period. |
VARIANCE SWAPS CONTRACTS (see Note D)
| | | | | | | | | | | | | | | | | | | | |
Swap Counterparty &
Referenced
Obligation | | Volatility
Strike
Price | | | Notional
Amount
(000) | | | Market
Value | | | Upfront
Premiums
(Paid)
Received | | | Unrealized
Appreciation/
(Depreciation) | |
Sale Contracts | | | | | | | | | | | | | | | | | | | | |
Goldman Sachs: | | | | | | | | | | | | | | | | | | | | |
Nikkei 225 Index
11/11/11* | | | 26.80 | % | | | JPY 20,636 | | | $ | 95,934 | | | $ | — | | | $ | 95,934 | |
Unfunded Loan Commitments (see Note D.4)
As of October 31, 2011, the Fund had the following unfunded loan commitment of $700,000 which could be extended at the option of the borrower:
| | | | | | | | | | | | |
| Borrower | | Unfunded Loan
Commitments | | | Cost | | | Value | |
General Motors Holding, LLC Revolver
LIBOR +2.75% 10/27/15 | | $ | 700,000 | | | $ | — | | | $ | (81,950 | ) |
| | | | | | | | | | | | |
| (a) | | Position, or a portion thereof, has been segregated to collateralize interest rate and credit default swaps. The aggregate market value of this security amounted to $7,453,084. |
| (b) | | Security is exempt from registration under Rule 144A of the Securities Act of 1933. These securities are considered liquid and may be resold in transactions exempt from registration, normally to qualified institutional buyers. At October 31, 2011, the aggregate market value of these securities amounted to $9,549,306 or 9.5% of net assets. |
| | | | |
| ALLIANCEBERNSTEIN UNCONSTRAINED BOND FUND • | | | 37 | |
Portfolio of Investments
| (c) | | Coupon rate adjusts periodically based upon a predetermined schedule. Stated interest rate in effect at October 31, 2011. |
| (d) | | Floating Rate Security. Stated interest rate was in effect at October 31, 2011. |
| (e) | | Security is in default and is non-income producing. |
| (h) | | Security is exempt from registration under Rule 144A of the Securities Act of 1933. These securities, which represent 0.00% of net assets as of October 31, 2011, are considered illiquid and restricted. |
| | | | | | | | | | | | | | | | |
| Restricted Securities | | Acquisition
Date | | | Cost | | | Market
Value | | | Percentage of
Net Assets | |
Nationstar NIM Trust
Series 2007-A, Class A
9.79%, 3/25/37 | | | 4/04/07 | | | $ | 3,301 | | | $ | — | | | | 0.00 | % |
| (i) | | Non-income producing security. |
| (j) | | One contract relates to 100 shares. |
| (k) | | Investment in affiliated money market mutual fund. The rate shown represents the 7-day yield as of period end. |
Currency Abbreviations:
AUD – Australian Dollar
BRL – Brazilian Real
CAD – Canadian Dollar
DOP – Dominican Peso
EUR – Euro
GBP – Great British Pound
IDR – Indonesian Rupiah
JPY – Japanese Yen
KRW – South Korean Won
NZD – New Zealand Dollar
ZAR – South African Rand
Glossary:
ABS – Asset-Backed Securities
ARMs – Adjustable Rate Mortgages
BBSW – AUD Bank Bill Reference Rate
BEFSEBWS Index – Barclay’s Capital Enhanced Buy-Write Straddle Strategy Excess Return
BKBM – NZD Bank Bill Reference Rate
CMBS – Commercial Mortgage-Backed Securities
CSAVIR – Credit Suisse Adaptive Volatility Index Roll
EURIBOR – Euro Interbank Offered Rate
FDIC – Federal Deposit Insurance Corporation
GCSCS Index – Credit Suisse Global Carry Selector Index
LIBOR – London Interbank Offered Rates
NPFGC – National Public Finance Guarantee Corporation
OJSC – Open Joint Stock Company
REIT – Real Estate Investment Trust
REMICs – Real Estate Mortgage Investment Conduits
TIPS – Treasury Inflation Protected Security
See notes to financial statements.
| | |
| 38 | | • ALLIANCEBERNSTEIN UNCONSTRAINED BOND FUND |
Portfolio of Investments
STATEMENT OF ASSETS & LIABILITIES
October 31, 2011
| | | | |
| Assets | | | | |
Investments in securities, at value | | | | |
Unaffiliated issuers (cost $116,114,340) | | $ | 115,767,280 | |
Affiliated issuers (cost $6,403,039) | | | 6,403,039 | (a) |
Cash | | | 246,426 | |
Foreign currencies, at value (cost $133,795) | | | 137,426 | |
Cash held at broker | | | 153,273 | |
Receivable for unfunded loan commitments, unsettled | | | 58,201 | |
Receivable for investment securities sold | | | 6,780,421 | |
Upfront premiums paid on credit default swap contracts | | | 2,489,248 | |
Dividends and interest receivable | | | 1,093,065 | |
Unrealized appreciation of interest rate swap contracts | | | 1,023,792 | |
Unrealized appreciation of credit default swap contracts | | | 845,545 | |
Receivable for capital stock sold | | | 146,322 | |
Unrealized appreciation of forward currency exchange contracts | | | 108,326 | |
Unrealized appreciation of total return swap contracts | | | 106,930 | |
Unrealized appreciation of variance swap contracts | | | 95,934 | |
Receivable from Adviser | | | 50,194 | |
| | | | |
Total assets | | | 135,505,422 | |
| | | | |
| Liabilities | | | | |
Payable for investment securities purchased | | | 20,231,787 | |
Upfront premiums received on credit default swap contracts | | | 6,629,585 | |
Unrealized depreciation of credit default swap contracts | | | 2,539,309 | |
Options written, at value (premium received $1,578,647) | | | 2,144,134 | |
Unrealized depreciation of interest rate swap contracts | | | 1,859,613 | |
Unrealized depreciation of forward currency exchange contracts | | | 658,597 | |
Due to broker | | | 290,000 | |
Payable for capital stock redeemed | | | 186,212 | |
Dividends payable | | | 71,027 | |
Unrealized depreciation of total return swap contracts | | | 36,886 | |
Administrative fee payable | | | 24,649 | |
Unrealized depreciation of unfunded loan commitments | | | 81,950 | |
Distribution fee payable | | | 20,841 | |
Payable for variation margin on futures contracts | | | 19,494 | |
Transfer Agent fee payable | | | 3,732 | |
Accrued expenses and other liabilities | | | 149,613 | |
| | | | |
Total liabilities | | | 34,947,429 | |
| | | | |
Net Assets | | $ | 100,557,993 | |
| | | | |
| Composition of Net Assets | | | | |
Capital stock, at par | | $ | 12,074 | |
Additional paid-in capital | | | 109,327,423 | |
Undistributed net investment income | | | 1,548,576 | |
Accumulated net realized loss on investment
and foreign currency transactions | | | (6,480,915 | ) |
Net unrealized depreciation of investments
and foreign currency denominated assets and liabilities | | | (3,849,165 | ) |
| | | | |
| | $ | 100,557,993 | |
| | | | |
| (a) | | Includes cash collateral of $290,000 received from broker for credit default swap contracts. |
See notes to financial statements.
| | | | |
| ALLIANCEBERNSTEIN UNCONSTRAINED BOND FUND • | | | 39 | |
Statement of Assets & Liabilities
Net Asset Value Per Share—21 billion shares of capital stock authorized, $.001 par value
| | | | | | | | | | | | |
| Class | | Net Assets | | | Shares
Outstanding | | | Net Asset Value | |
| A | | $ | 38,969,829 | | | | 4,678,371 | | | $ | 8.33 | * |
| |
| B | | $ | 2,514,914 | | | | 301,639 | | | $ | 8.34 | |
| |
| C | | $ | 11,332,234 | | | | 1,359,913 | | | $ | 8.33 | |
| |
| Advisor | | $ | 46,740,483 | | | | 5,613,657 | | | $ | 8.33 | |
| |
| R | | $ | 870,940 | | | | 104,844 | | | $ | 8.31 | |
| |
| K | | $ | 120,196 | | | | 14,417 | | | $ | 8.34 | |
| |
| I | | $ | 9,397 | | | | 1,130.31 | | | $ | 8.31 | |
| |
| * | | The maximum offering price per share for Class A shares was $8.70 which reflects a sales charge of 4.25%. |
See notes to financial statements.
| | |
| 40 | | • ALLIANCEBERNSTEIN UNCONSTRAINED BOND FUND |
Statement of Assets & Liabilities
STATEMENT OF OPERATIONS
Year Ended October 31, 2011
| | | | | | | | |
| Investment Income | | | | | | | | |
Interest | | $ | 3,708,158 | | | | | |
Dividends | | | | | | | | |
Unaffiliated issuers | | | 13,736 | | | | | |
Affiliated issuers | | | 11,453 | | | | | |
Other fee income | | | 62,968 | | | $ | 3,796,315 | |
| | | | | | | | |
| Expenses | | | | | | | | |
Advisory fee (see Note B) | | | 465,625 | | | | | |
Distribution fee—Class A | | | 124,397 | | | | | |
Distribution fee—Class B | | | 30,477 | | | | | |
Distribution fee—Class C | | | 120,625 | | | | | |
Distribution fee—Class R | | | 2,917 | | | | | |
Distribution fee—Class K | | | 332 | | | | | |
Transfer agency—Class A | | | 36,254 | | | | | |
Transfer agency—Class B | | | 4,903 | | | | | |
Transfer agency—Class C | | | 12,019 | | | | | |
Transfer agency—Advisor Class | | | 29,530 | | | | | |
Transfer agency—Class R | | | 1,517 | | | | | |
Transfer agency—Class K | | | 247 | | | | | |
Transfer agency—Class I | | | 10 | | | | | |
Registration fees | | | 130,577 | | | | | |
Custodian | | | 78,047 | | | | | |
Administrative | | | 74,692 | | | | | |
Legal | | | 60,966 | | | | | |
Audit | | | 55,620 | | | | | |
Directors’ fees | | | 53,203 | | | | | |
Printing | | | 46,936 | | | | | |
Miscellaneous | | | 15,419 | | | | | |
| | | | | | | | |
Total expenses before interest expense | | | 1,344,313 | | | | | |
Interest expense | | | 204 | | | | | |
| | | | | | | | |
Total expenses | | | 1,344,517 | | | | | |
Less: expenses waived and reimbursed by the Adviser (see Note B) | | | (506,640 | ) | | | | |
| | | | | | | | |
Net expenses | | | | | | | 837,877 | |
| | | | | | | | |
Net investment income | | | | | | | 2,958,438 | |
| | | | | | | | |
| Realized and Unrealized Gain (Loss) on Investment and Foreign Currency Transactions | | | | | | | | |
Net realized gain (loss) on: | | | | | | | | |
Investment transactions | | | | | | | (3,633,297 | ) |
Swap contracts | | | | | | | 671,488 | |
Futures contracts | | | | | | | 33,762 | |
Options written | | | | | | | 1,504,233 | |
Foreign currency transactions | | | | | | | 1,888,577 | |
Net change in unrealized appreciation/depreciation of: | | | | | | | | |
Investments | | | | | | | 969,873 | |
Swap contracts | | | | | | | (2,218,532 | ) |
Futures contracts | | | | | | | 9,403 | |
Options written | | | | | | | (558,961 | ) |
Unfunded loan commitments | | | | | | | (23,749 | ) |
Foreign currency denominated assets and liabilities | | | | | | | (396,971 | ) |
| | | | | | | | |
Net loss on investment and foreign currency transactions | | | | | | | (1,754,174 | ) |
| | | | | | | | |
Net Increase in Net Assets from Operations | | | | | | $ | 1,204,264 | |
| | | | | | | | |
See notes to financial statements.
| | | | |
| ALLIANCEBERNSTEIN UNCONSTRAINED BOND FUND • | | | 41 | |
Statement of Operations
STATEMENT OF CHANGES IN NET ASSETS
| | | | | | | | |
| | | Year Ended
October 31,
2011 | | | Year Ended
October 31,
2010 | |
| Increase (Decrease) in Net Assets from Operations | | | | | | | | |
Net investment income | | $ | 2,958,438 | | | $ | 2,024,559 | |
Net realized gain (loss) on investment and foreign currency transactions | | | 464,763 | | | | (471,605 | ) |
Net change in unrealized appreciation/depreciation of investments and foreign currency denominated assets and liabilities | | | (2,218,937 | ) | | | 4,085,099 | |
| | | | | | | | |
Net increase in net assets from operations | | | 1,204,264 | | | | 5,638,053 | |
| Distributions to Shareholders from | | | | | | | | |
Net investment income | | | | | | | | |
Class A | | | (1,398,390 | ) | | | (1,227,277 | ) |
Class B | | | (80,037 | ) | | | (105,965 | ) |
Class C | | | (322,093 | ) | | | (288,995 | ) |
Advisor Class | | | (1,343,685 | ) | | | (355,689 | ) |
Class R | | | (18,477 | ) | | | (11,299 | ) |
Class K | | | (4,476 | ) | | | (1,066 | ) |
Class I | | | (353 | ) | | | (289 | ) |
| Capital Stock Transactions | | | | | | | | |
Net increase (decrease) | | | 29,306,153 | | | | (9,838,505 | ) |
Proceeds from third party regulatory settlement (see Note E) | | | 189 | | | | 13,103 | |
| | | | | | | | |
Total increase (decrease) | | | 27,343,095 | | | | (6,177,929 | ) |
| Net Assets | | | | | | | | |
Beginning of period | | | 73,214,898 | | | | 79,392,827 | |
| | | | | | | | |
End of period (including undistributed net investment income of $1,548,576 and distributions in excess of $(13,168), respectively) | | $ | 100,557,993 | | | $ | 73,214,898 | |
| | | | | | | | |
See notes to financial statements.
| | |
| 42 | | • ALLIANCEBERNSTEIN UNCONSTRAINED BOND FUND |
Statement of Changes in Net Assets
NOTES TO FINANCIAL STATEMENTS
October 31, 2011
NOTE A
Significant Accounting Policies
AllianceBernstein Unconstrained Bond Fund, Inc. (the “Fund”), formerly AllianceBernstein Diversified Yield Fund, Inc., was incorporated in the State of Maryland on October 25, 1995 and is registered under the Investment Company Act of 1940 as a diversified, open-end management investment company. The Fund offers Class A, Class B, Class C, Advisor Class, Class R, Class K and Class I shares. Class A shares are sold with a front-end sales charge of up to 4.25% for purchases not exceeding $1,000,000. With respect to purchases of $1,000,000 or more, Class A shares redeemed within one year of purchase may be subject to a contingent deferred sales charge of 1%. Class B shares are currently sold with a contingent deferred sales charge which declines from 4% to zero depending on the period of time the shares are held. Effective January 31, 2009, sales of Class B shares of the Fund to new investors were suspended. Class B shares will only be issued (i) upon the exchange of Class B shares from another AllianceBernstein Mutual Fund, (ii) for purposes of dividend reinvestment, (iii) through the Fund’s Automatic Investment Program (the “Program”) for accounts that established the Program prior to January 31, 2009, and (iv) for purchases of additional shares by Class B shareholders as of January 31, 2009. The ability to establish a new Program for accounts containing Class B shares was suspended as of January 31, 2009. Class B shares will automatically convert to Class A shares eight years after the end of the calendar month of purchase. Class C shares are subject to a contingent deferred sales charge of 1% on redemptions made within the first year after purchase. Class R and Class K shares are sold without an initial or contingent deferred sales charge. Advisor Class and Class I shares are sold without an initial or contingent deferred sales charge and are not subject to ongoing distribution expenses. All seven classes of shares have identical voting, dividend, liquidation and other rights and the same terms and conditions, except that the classes bear different distribution and transfer agency expenses. Each class has exclusive voting rights with respect to its distribution plan. The financial statements have been prepared in conformity with U.S. generally accepted accounting principles (“U.S. GAAP”), which require management to make certain estimates and assumptions that affect the reported amounts of assets and liabilities in the financial statements and amounts of income and expenses during the reporting period. Actual results could differ from those estimates. The following is a summary of significant accounting policies followed by the Fund.
1. Security Valuation
Portfolio securities are valued at their current market value determined on the basis of market quotations or, if market quotations are not readily available or are deemed unreliable, at “fair value” as determined in accordance with procedures established by and under the general supervision of the Fund’s Board of Directors.
| | | | |
| ALLIANCEBERNSTEIN UNCONSTRAINED BOND FUND • | | | 43 | |
Notes to Financial Statements
In general, the market value of securities which are readily available and deemed reliable are determined as follows: securities listed on a national securities exchange (other than securities listed on the NASDAQ Stock Market, Inc. (“NASDAQ”)) or on a foreign securities exchange are valued at the last sale price at the close of the exchange or foreign securities exchange. If there has been no sale on such day, the securities are valued at the mean of the closing bid and ask prices on such day. Securities listed on more than one exchange are valued by reference to the principal exchange on which the securities are traded; securities listed only on NASDAQ are valued in accordance with the NASDAQ Official Closing Price; listed or over the counter market (“OTC”) put or call options are valued at the mid level between the current bid and asked prices. If either a current bid or current ask price is unavailable, AllianceBernstein L.P. (the “Adviser”) will have discretion to determine the best valuation (e.g. last trade price); open futures contracts are valued using the closing settlement price or, in the absence of such a price, the most recent quoted bid price. If there are no quotations available for the day of valuation, the last available closing settlement price is used; U.S. government securities and other debt instruments having 60 days or less remaining until maturity are valued at amortized cost if their original maturity was 60 days or less; or by amortizing their fair value as of the 61st day prior to maturity if their original term to maturity exceeded 60 days; fixed-income securities, including mortgage backed and asset backed securities, may be valued on the basis of prices provided by a pricing service or at a price obtained from one or more of the major broker/dealers. In cases where broker/dealer quotes are obtained, the Adviser may establish procedures whereby changes in market yields or spreads are used to adjust, on a daily basis, a recently obtained quoted price on a security; and swaps and other derivatives are valued daily, primarily using independent pricing services, independent pricing models using market inputs, as well as third party broker-dealers or counterparties, which are approved by the Board of Directors. Investments in money market funds are valued at their net asset value each day.
Securities for which market quotations are not readily available (including restricted securities) or are deemed unreliable are valued at fair value. Factors considered in making this determination may include, but are not limited to, information obtained by contacting the issuer, analysts, analysis of the issuer’s financial statements or other available documents. In addition, the Fund may use fair value pricing for securities primarily traded in non-U.S. markets because most foreign markets close well before the Fund values its securities at 4:00 p.m., Eastern Time. The earlier close of these foreign markets gives rise to the possibility that significant events, including broad market moves, may have occurred in the interim and may materially affect the value of those securities.
2. Fair Value Measurements
In accordance with U.S. GAAP regarding fair value measurements, fair value is defined as the price that the Fund would receive to sell an asset or pay to transfer
| | |
| 44 | | • ALLIANCEBERNSTEIN UNCONSTRAINED BOND FUND |
Notes to Financial Statements
a liability in an orderly transaction between market participants at the measurement date. The U.S. GAAP disclosure requirements establish a framework for measuring fair value, and a three-level hierarchy for fair value measurements based upon the transparency of inputs to the valuation of an asset or liability. Inputs may be observable or unobservable and refer broadly to the assumptions that market participants would use in pricing the asset or liability. Observable inputs reflect the assumptions market participants would use in pricing the asset or liability based on market data obtained from sources independent of the Fund. Unobservable inputs reflect the Fund’s own assumptions about the assumptions that market participants would use in pricing the asset or liability based on the best information available in the circumstances. Each investment is assigned a level based upon the observability of the inputs which are significant to the overall valuation. The three-tier hierarchy of inputs is summarized below.
| | • | | Level 1—quoted prices in active markets for identical investments |
| | • | | Level 2—other significant observable inputs (including quoted prices for similar investments, interest rates, prepayment speeds, credit risk, etc.) |
| | • | | Level 3—significant unobservable inputs (including the Fund’s own assumptions in determining the fair value of investments) |
The following table summarizes the valuation of the Fund’s investments by the above fair value hierarchy levels as of October 31, 2011:
| | | | | | | | | | | | | | | | |
Investments in
Securities | | Level 1 | | | Level 2 | | | Level 3 | | | Total | |
Governments—Treasuries | | $ | – 0 | – | | $ | 25,202,774 | | | $ | – 0 | – | | $ | 25,202,774 | |
Corporates—Investment Grades | | | – 0 | – | | | 20,702,711 | | | | – 0 | – | | | 20,702,711 | |
Inflation-Linked Securities | | | – 0 | – | | | 15,762,933 | | | | – 0 | – | | | 15,762,933 | |
Governments—Sovereign Agencies | | | – 0 | – | | | 10,063,548 | | | | – 0 | – | | | 10,063,548 | |
Emerging Markets—Sovereigns | | | – 0 | – | | | 6,225,000 | | | | – 0 | – | | | 6,225,000 | |
Corporates—Non-Investment Grades | | | – 0 | – | | | 2,894,443 | | | | – 0 | – | | | 2,894,443 | |
Mortgage Pass-Through’s | | | – 0 | – | | | 2,807,327 | | | | – 0 | – | | | 2,807,327 | |
Asset-Backed Securities | | | – 0 | – | | | 581,560 | | | | 1,456,579 | | | | 2,038,139 | |
Bank Loans | | | – 0 | – | | | – 0 | – | | | 2,020,562 | | | | 2,020,562 | |
Collateralized Mortgage Obligations | | | – 0 | – | | | – 0 | – | | | 1,380,355 | | | | 1,380,355 | |
Local Governments—Municipal Bonds | | | – 0 | – | | | 968,760 | | | | – 0 | – | | | 968,760 | |
Quasi-Sovereigns | | | – 0 | – | | | 909,405 | | | | – 0 | – | | | 909,405 | |
Emerging Markets—Corporate Bonds | | | – 0 | – | | | 610,400 | | | | – 0 | – | | | 610,400 | |
Governments—Sovereign Bonds | | | – 0 | – | | | 490,875 | | | | – 0 | – | | | 490,875 | |
Emerging Markets—Treasuries | | | – 0 | – | | | – 0 | – | | | 403,962 | | | | 403,962 | |
Supranationals | | | – 0 | – | | | 349,604 | | | | – 0 | – | | | 349,604 | |
Commercial Mortgage-Backed Securities | | | – 0 | – | | | – 0 | – | | | 276,033 | | | | 276,033 | |
Preferred Stocks | | | 160,456 | | | | – 0 | – | | | – 0 | – | | | 160,456 | |
Options Purchased-Calls | | | 890,428 | | | | – 0 | – | | | 8,075 | | | | 898,503 | |
Options Purchased-Puts | | | 71,583 | | | | – 0 | – | | | 530,255 | | | | 601,838 | |
Short-Term Investments | | | 27,402,691 | | | | – 0 | – | | | – 0 | – | | | 27,402,691 | |
| | | | | | | | | | | | | | | | |
Total Investments in Securities | | | 28,525,158 | | | | 87,569,340 | | | | 6,075,821 | | | | 122,170,319 | |
| | | | |
| ALLIANCEBERNSTEIN UNCONSTRAINED BOND FUND • | | | 45 | |
Notes to Financial Statements
| | | | | | | | | | | | | | | | |
Investments in
Securities | | Level 1 | | | Level 2 | | | Level 3 | | | Total | |
Other Financial Instruments*: | | | | | | | | | | | | | | | | |
Assets | | | | | | | | | | | | | | | | |
Credit Default Swaps | | $ | – 0 | – | | $ | 668,151 | | | $ | 177,394 | | | $ | 845,545 | |
Interest Rate Swaps | | | – 0 | – | | | 1,023,792 | | | | – 0 | – | | | 1,023,792 | |
Futures Contracts | | | 26,789 | | | | – 0 | – | | | – 0 | – | | | 26,789 | † |
Forward Currency Exchange Contracts | | | – 0 | – | | | 108,326 | | | | – 0 | – | | | 108,326 | |
Total Return Swaps | | | – 0 | – | | | 86,235 | | | | 20,695 | | | | 106,930 | |
Variance Swaps | | | – 0 | – | | | – 0 | – | | | 95,934 | | | | 95,934 | |
Liabilities | | | | | | | | | | | | | | | | |
Credit Default Swaps | | | – 0 | – | | | (2,478,995 | ) | | | (60,314 | ) | | | (2,539,309 | ) |
Interest Rate Swaps | | | – 0 | – | | | (1,859,613 | ) | | | – 0 | – | | | (1,859,613 | ) |
Futures Contracts | | | (18,034 | ) | | | – 0 | – | | | – 0 | – | | | (18,034 | )† |
Forward Currency Exchange Contracts | | | – 0 | – | | | (658,597 | ) | | | – 0 | – | | | (658,597 | ) |
Total Return Swaps | | | – 0 | – | | | (32,639 | ) | | | (4,247 | ) | | | (36,886 | ) |
Written Options | | | (839,658 | ) | | | – 0 | – | | | (1,304,476 | ) | | | (2,144,134 | ) |
Unfunded Loan Commitment | | | – 0 | – | | | – 0 | – | | | (23,749 | ) | | | (23,749 | ) |
| | | | | | | | | | | | | | | | |
Total | | $ | 27,694,255 | | | $ | 84,426,000 | | | $ | 4,977,058 | | | $ | 117,097,313 | |
| | | | | | | | | | | | | | | | |
| * | | Other financial instruments are derivative instruments, such as futures, forwards and swaps contracts, which are valued at the unrealized appreciation/depreciation on the instrument. Other financial instruments may also include options written which are valued at market value. |
| † | | Only variation margin receivable/payable at period end is reported within the statements of assets and liabilities. Cumulative appreciation/depreciation of futures contracts is reported in the portfolio of investments. |
Following is a reconciliation of investments in which significant unobservable inputs (Level 3) were used in determining fair value. The transfers between levels of the fair value hierarchy assumes the financial instrument was transferred at the beginning of the reporting period.
| | | | | | | | | | | | | | | | |
| | | Asset-Backed
Securities | | | Bank Loans | | | CMOs | | | Emerging
Markets -
Treasuries | |
Balance as of 10/31/10 | | $ | 1,214,000 | | | $ | 2,215,140 | | | $ | 1,224,207 | | | $ | – 0 | – |
Accrued discounts/ | | | | | | | | | | | | | | | | |
(premiums) | | | (113 | ) | | | 24,087 | | | | (626 | ) | | | 240 | |
Realized gain (loss) | | | (370,660 | ) | | | (45,895 | ) | | | (448,326 | ) | | | – 0 | – |
Change in unrealized appreciation/depreciation | | | 640,623 | | | | 16,153 | | | | 756,438 | | | | (9,054 | ) |
Purchases | | | 536,729 | | | | 414,573 | | | | – 0 | – | | | 412,776 | |
Sales | | | (564,000 | ) | | | (603,496 | ) | | | (1,069,269 | ) | | | – 0 | – |
Transfers into Level 3 | | | – 0 | – | | | – 0 | – | | | 917,931 | | | | – 0 | – |
Transfers out of Level 3 | | | – 0 | – | | | – 0 | – | | | – 0 | – | | | – 0 | – |
| | | | | | | | | | | | | | | | |
Balance as of 10/31/11 | | $ | 1,456,579 | | | $ | 2,020,562 | | | $ | 1,380,355 | | | $ | 403,962 | |
| | | | | | | | | | | | | | | | |
Net change in unrealized appreciation/depreciation from investments held as of 10/31/11 | | $ | 71,696 | | | $ | (59,465 | ) | | $ | (32,136 | ) | | $ | (9,054 | ) |
| | |
| 46 | | • ALLIANCEBERNSTEIN UNCONSTRAINED BOND FUND |
Notes to Financial Statements
| | | | | | | | | | | | | | | | |
| | | Commercial
Mortgage -
Backed
Securities | | | Corporates -
Non
Investment
Grades | | | Options
Purchased
- Calls | | | Options
Purchased -
Puts | |
Balance as of 10/31/10 | | $ | 2,209,971 | | | $ | 143,703 | | | $ | – 0 | – | | $ | – 0 | – |
Accrued discounts/(premiums) | | | 458 | | | | – 0 | – | | | – 0 | – | | | – 0 | – |
Realized gain (loss) | | | 118,185 | | | | – 0 | – | | | – 0 | – | | | – 0 | – |
Change in unrealized appreciation/depreciation | | | (120,611 | ) | | | – 0 | – | | | (76,525 | ) | | | (217,374 | ) |
Purchases | | | – 0 | – | | | – 0 | – | | | 84,600 | | | | 747,629 | |
Sales | | | (1,931,970 | ) | | | – 0 | – | | | – 0 | – | | | – 0 | – |
Transfers into Level 3 | | | – 0 | – | | | – 0 | – | | | – 0 | – | | | – 0 | – |
Transfers out of Level 3 | | | – 0 | – | | | (143,703 | ) | | | – 0 | – | | | – 0 | – |
| | | | | | | | | | | | | | | | |
Balance as of 10/31/11 | | $ | 276,033 | | | $ | – 0 | – | | $ | 8,075 | | | $ | 530,255 | |
| | | | | | | | | | | | | | | | |
Net change in unrealized appreciation/depreciation from investments held as of 10/31/11 | | $ | 12,569 | | | $ | – 0 | – | | $ | (76,525 | ) | | $ | (217,374 | ) |
| | | | |
| | | Credit
Default
Swaps | | | Total Return
Swaps | | | Variance
Swaps | | | Options
Written | |
Balance as of 10/31/10 | | $ | – 0 | – | | $ | – 0 | – | | $ | – 0 | – | | $ | – 0 | – |
Accrued discounts/(premiums) | | | – 0 | – | | | – 0 | – | | | – 0 | – | | | – 0 | – |
Realized gain (loss) | | | – 0 | – | | | – 0 | – | | | – 0 | – | | | (9,834 | ) |
Change in unrealized appreciation/depreciation | | | 117,080 | | | | 16,448 | | | | 95,934 | | | | (625,557 | ) |
Purchases | | | – 0 | – | | | – 0 | – | | | – 0 | – | | | (708,169 | ) |
Sales | | | – 0 | – | | | – 0 | – | | | – 0 | – | | | 39,084 | |
Transfers into Level 3 | | | – 0 | – | | | – 0 | – | | | – 0 | – | | | – 0 | – |
Transfers out of Level 3 | | | – 0 | – | | | – 0 | – | | | – 0 | – | | | – 0 | – |
| | | | | | | | | | | | | | | | |
Balance as of 10/31/11 | | $ | 117,080 | | | $ | 16,448 | | | $ | 95,934 | | | $ | (1,304,476 | ) |
| | | | | | | | | | | | | | | | |
Net change in unrealized appreciation/depreciation from investments held as of 10/31/11 | | $ | 117,080 | | | $ | 16,448 | | | $ | 95,934 | | | $ | (625,557 | ) |
| | | | |
| | | Unfunded
Loan
Commitment | | | Total | | | | | | | |
Balance as of 10/31/10 | | $ | – 0 | – | | $ | 7,007,021 | | | | | | | | | |
Accrued discounts/(premiums) | | | – 0 | – | | | 24,046 | | | | | | | | | |
Realized gain (loss) | | | – 0 | – | | | (756,530 | ) | | | | | | | | |
Change in unrealized appreciation/depreciation | | | (23,749 | ) | | | 569,806 | | | | | | | | | |
Purchases | | | – 0 | – | | | 1,488,138 | | | | | | | | | |
Sales | | | – 0 | – | | | (4,129,651 | ) | | | | | | | | |
Transfers into Level 3 | | | – 0 | – | | | 917,931 | | | | | | | | | |
Transfers out of Level 3 | | | – 0 | – | | | (143,703 | ) | | | | | | | | |
| | | | | | | | | | | | | | | | |
Balance as of 10/31/11 | | $ | (23,749 | ) | | $ | 4,977,058 | | | | | | | | | |
| | | | | | | | | | | | | | | | |
Net change in unrealized appreciation/depreciation from investments held as of 10/31/11 | | $ | (23,749 | ) | | $ | (730,133 | )** | | | | | | | | |
| | | | |
| ALLIANCEBERNSTEIN UNCONSTRAINED BOND FUND • | | | 47 | |
Notes to Financial Statements
| ** | | The unrealized appreciation/depreciation is included in net change in unrealized appreciation/depreciation of investments and other financial instruments in the accompanying statement of operations. |
3. Currency Translation
Assets and liabilities denominated in foreign currencies and commitments under forward currency exchange contracts are translated into U.S. dollars at the mean of the quoted bid and ask prices of such currencies against the U.S. dollar. Purchases and sales of portfolio securities are translated into U.S. dollars at the rates of exchange prevailing when such securities were acquired or sold. Income and expenses are translated into U.S. dollars at rates of exchange prevailing when accrued.
Net realized gain or loss on foreign currency transactions represents foreign exchange gains and losses from sales and maturities of foreign fixed income investments, foreign currency exchange contracts, holding of foreign currencies, currency gains or losses realized between the trade and settlement dates on foreign investment transactions, and the difference between the amounts of dividends, interest and foreign withholding taxes recorded on the Fund’s books and the U.S. dollar equivalent amounts actually received or paid. Net unrealized currency gains and losses from valuing foreign currency denominated assets and liabilities at period end exchange rates are reflected as a component of net unrealized appreciation and depreciation of investments and foreign currency denominated assets and liabilities.
4. Taxes
It is the Fund’s policy to meet the requirements of the Internal Revenue Code applicable to regulated investment companies and to distribute all of its investment company taxable income and net realized gains, if any, to shareholders. Therefore, no provisions for federal income or excise taxes are required. The Fund may be subject to taxes imposed by countries in which it invests. Such taxes are generally based on income and/or capital gains earned or repatriated. Taxes are accrued and applied to net investment income, net realized gains and net unrealized appreciation/depreciation as such income and/or gains are earned.
In accordance with U.S. GAAP requirements regarding accounting for uncertainties in income taxes, management has analyzed the Fund’s tax positions taken or expected to be taken on federal and state income tax returns for all open tax years (the current and the prior three tax years) and has concluded that no provision for income tax is required in the Fund’s financial statements.
5. Investment Income and Investment Transactions
Interest income is accrued daily. Investment transactions are accounted for on the date securities are purchased or sold. Investment gains or losses are determined on the identified cost basis. The Fund amortizes premiums and accretes discounts as adjustments to interest income.
| | |
| 48 | | • ALLIANCEBERNSTEIN UNCONSTRAINED BOND FUND |
Notes to Financial Statements
6. Class Allocations
All income earned and expenses incurred by the Fund are borne on a pro-rata basis by each settled class of shares, based on the proportionate interest in the Fund represented by the net assets of such class, except for class specific expenses which are allocated to the respective class. Realized and unrealized gains and losses are allocated among various share classes based on their respective net assets.
7. Dividends and Distributions
Dividends and distributions to shareholders, if any, are recorded on the ex-dividend date. Income dividends and capital gains distributions are determined in accordance with federal tax regulations and may differ from those determined in accordance with U.S. GAAP. To the extent these differences are permanent, such amounts are reclassified within the capital accounts based on their federal tax basis treatment; temporary differences do not require such reclassification.
8. Repurchase Agreements
It is the Fund’s policy that its custodian or designated subcustodian take control of securities as collateral under repurchase agreements and to determine on a daily basis that the value of such securities is sufficient to cover the value of the repurchase agreements. If the seller defaults and the value of the collateral declines, or if bankruptcy proceedings are commenced with respect to seller of the security, realization of collateral by the Fund may be delayed or limited.
NOTE B
Advisory Fee and Other Transactions with Affiliates
Under the terms of the investment advisory agreement, the Fund pays the Adviser an advisory fee at an annual rate of .50% of the first $2.5 billion, .45% of the next $2.5 billion and .40% in excess of $5 billion, of the Fund’s average daily net assets. The fee is accrued daily and paid monthly.
The Adviser has agreed to waive its fees and bear certain expenses to the extent necessary to limit total operating expenses on an annual basis to .90%, 1.60%, 1.60%, .60%, 1.10%, .85% and .60% of the daily average net assets for the Class A, Class B, Class C, Advisor Class, Class R, Class K and Class I shares, respectively. This waiver extends through October 31, 2012 and then may be extended by the Adviser for additional one-year terms. For the year ended October 31, 2011, such reimbursement amounted to $506,640.
Pursuant to the investment advisory agreement, the Fund may reimburse the Adviser for certain legal and accounting services provided to the Fund by the Adviser. For the year ended October 31, 2011, such fee amounted to $74,692.
The Fund compensates AllianceBernstein Investor Services, Inc. (“ABIS”), a wholly-owned subsidiary of the Adviser, under a Transfer Agency Agreement for
| | | | |
| ALLIANCEBERNSTEIN UNCONSTRAINED BOND FUND • | | | 49 | |
Notes to Financial Statements
providing personnel and facilities to perform transfer agency services for the Fund. ABIS may make payments to intermediaries that provide omnibus account services, sub-accounting services and/or networking services. The compensation retained by ABIS amounted to $36,001 for the year ended October 31, 2011.
For the year ended October 31, 2011, there was no reduction for the expenses of Class A, Class B, Class C and Advisor Class shares under an expense offset arrangement with ABIS.
AllianceBernstein Investments, Inc. (the “Distributor”), a wholly-owned subsidiary of the Adviser, serves as the distributor of the Fund’s shares. The Distributor has advised the Fund that it has retained front-end sales charges of $2,428 from the sale of Class A shares and received $3,656, $2,796 and $720 in contingent deferred sales charges imposed upon redemption by shareholders of Class A, Class B and Class C shares, respectively, for the year ended October 31, 2011.
The Fund may invest in the AllianceBernstein Fixed-Income Shares, Inc.—Government STIF Portfolio, an open-end management investment company managed by the Adviser. The Government STIF Portfolio is offered as a cash management option to mutual funds and other institutional accounts of the Adviser, and is not available for direct purchase by members of the public. The Government STIF Portfolio pays no investment management fees but does bear its own expenses. A summary of the Fund’s transactions in shares of the Government STIF Portfolio for the year ended October 31, 2011 is as follows:
| | | | | | | | | | | | | | | | |
Market Value
October 31, 2010
(000) | | Purchases
at Cost
(000) | | | Sales
Proceeds
(000) | | | Market Value
October 31, 2011
(000) | | | Dividend
Income
(000) | |
| $ 8,949 | | $ | 122,563 | | | $ | 125,109 | | | $ | 6,403 | | | $ | 11 | |
NOTE C
Distribution Services Agreement
The Fund has adopted a Distribution Services Agreement (the “Agreement”) pursuant to Rule 12b-1 under the Investment Company Act of 1940. Under the Agreement the Fund pays distribution and servicing fees to the Distributor at an annual rate of up to .30% of the Fund’s average daily net assets attributable to Class A shares, 1% of the Fund’s average daily net assets attributable to Class B and Class C shares, .50% of the Fund’s average daily net assets attributable to Class R shares and .25% of the Fund’s average daily net assets attributable to Class K shares. There are no distribution and servicing fees on Advisor Class and Class I shares. The fees are accrued daily and paid monthly. The Agreement provides that the Distributor will use such payments in their entirety for distribution assistance and promotional activities. Since the commencement of the Fund’s operation, the Distributor has incurred expenses in excess of the distribution costs reimbursed by the Fund in the amounts of $8,369,374,
| | |
| 50 | | • ALLIANCEBERNSTEIN UNCONSTRAINED BOND FUND |
Notes to Financial Statements
$1,983,773, $27,913 and $12,968 for Class B, Class C, Class R and Class K shares, respectively. While such costs may be recovered from the Fund in future periods so long as the Agreement is in effect, the rate of the distribution and servicing fees payable under the Agreement may not be increased without a shareholder vote. In accordance with the Agreement, there is no provision for recovery of unreimbursed distribution costs, incurred by the Distributor, beyond the current fiscal period for Class A shares. The Agreement also provides that the Adviser may use its own resources to finance the distribution of the Fund’s shares.
NOTE D
Investment Transactions
Purchases and sales of investment securities (excluding short-term investments) for the year ended October 31, 2011, were as follows:
| | | | | | | | |
| | | Purchases | | | Sales | |
Investment securities (excluding
U.S. government securities) | | $ | 37,481,009 | | | $ | 33,825,493 | |
U.S. government securities | | | 43,667,208 | | | | 24,723,919 | |
The cost of investments for federal income tax purposes, gross unrealized appreciation and unrealized depreciation (excluding foreign currency contracts and futures contracts) are as follows:
| | | | |
Cost | | $ | 122,517,497 | |
| | | | |
Gross unrealized appreciation | | $ | 4,308,232 | |
Gross unrealized depreciation | | | (4,655,410 | ) |
| | | | |
Net unrealized depreciation | | $ | (347,178 | ) |
| | | | |
1. Derivative Financial Instruments
The Fund may use derivatives to earn income and enhance returns, to hedge or adjust the risk profile of its portfolio, to replace more traditional direct investments, or to obtain exposure to otherwise inaccessible markets.
The principal types of derivatives utilized by the Fund, as well as the methods in which they may be used are:
| | • | | Forward Currency Exchange Contracts |
The Fund may enter into forward currency exchange contracts in order to hedge its exposure to changes in foreign currency exchange rates on its foreign portfolio holdings, to hedge certain firm purchase and sales commitments denominated in foreign currencies and for non-hedging purposes as a means of making direct investments in foreign currencies, as described below under “Currency Transactions”.
A forward currency exchange contract is a commitment to purchase or sell a foreign currency at a future date at a negotiated forward rate. The gain or
| | | | |
| ALLIANCEBERNSTEIN UNCONSTRAINED BOND FUND • | | | 51 | |
Notes to Financial Statements
loss arising from the difference between the original contract and the closing of such contract would be included in net realized gain or loss on foreign currency transactions. Fluctuations in the value of open forward currency exchange contracts are recorded for financial reporting purposes as unrealized appreciation and/or depreciation by the Fund. Risks may arise from the potential inability of a counterparty to meet the terms of a contract and from unanticipated movements in the value of a foreign currency relative to the U.S. dollar. The face or contract amount, in U.S. dollars reflects the total exposure the Fund has in that particular currency contract.
During the year ended October 31, 2011, the Fund held foreign-currency contracts for hedging and non-hedging purposes.
The Fund may buy or sell futures contracts for the purpose of hedging its portfolio against adverse effects of anticipated movements in the market. The Fund bears the market risk that arises from changes in the value of these instruments and the imperfect correlation between movements in the price of the futures contracts and movements in the price of the securities hedged or used for cover. The Fund may also purchase or sell futures contracts for foreign currencies or options thereon for non-hedging purposes as a means of making direct investment in foreign currencies, as described below under “Currency Transactions”.
At the time the Fund enters into a futures contract, the Fund deposits and maintains as collateral an initial margin with the broker, as required by the exchange on which the transaction is effected. Pursuant to the contract, the Fund agrees to receive from or pay to the broker an amount of cash equal to the daily fluctuation in the value of the contract. Such receipts or payments are known as variation margin and are recorded by the Fund as unrealized gains or losses. Risks may arise from the potential inability of a counter party to meet the terms of the contract. The credit/counterparty risk for exchange-traded futures contracts is generally less than privately negotiated futures contracts, since the clearinghouse, which is the issuer or counterparty to each exchange-traded future, provides a guarantee of performance. The guarantee is supported by a daily payment system (i.e., margin requirements). When the contract is closed, the Fund records a realized gain or loss equal to the difference between the value of the contract at the time it was opened and the time it was closed.
Use of long futures contracts subjects the Fund to risk of loss in excess of the amounts shown on the statement of assets and liabilities, up to the notional value of the futures contracts. Use of short futures contracts subjects the Fund to unlimited risk of loss. Under some circumstances, futures exchanges may establish daily limits on the amount that the price of a futures contract can vary from the previous day’s settlement price, which could effectively prevent liquidation of unfavorable positions.
| | |
| 52 | | • ALLIANCEBERNSTEIN UNCONSTRAINED BOND FUND |
Notes to Financial Statements
During the year ended October 31, 2011, the Fund held future contracts for hedging and non-hedging purposes.
For hedging and investment purposes, the Fund may purchase and write (sell) put and call options on U.S. and foreign securities, including government securities, and foreign currencies that are traded on U.S. and foreign securities exchanges and over-the-counter markets. The Fund may also use options transactions for non-hedging purposes as a means of making direct investments in foreign currencies, as described below under “Currency Transactions”.
The risk associated with purchasing an option is that the Fund pays a premium whether or not the option is exercised. Additionally, the Fund bears the risk of loss of the premium and change in market value should the counterparty not perform under the contract. Put and call options purchased are accounted for in the same manner as portfolio securities. The cost of securities acquired through the exercise of call options is increased by premiums paid. The proceeds from securities sold through the exercise of put options are decreased by the premiums paid.
The Fund may also invest in options on swap agreements, also called “swaptions”. A swaption is an option that gives the buyer the right, but not the obligation, to enter into a swap on a future date in exchange for paying a market-based “premium”. A receiver swaption gives the owner the right to receive the total return of a specified asset, reference rate, or index. A payer swaption gives the owner the right to pay the total return of a specified asset, reference rate, or index. Swaptions also include options that allow an existing swap to be terminated or extended by one of the counterparties.
When the Fund writes an option, the premium received by the Fund is recorded as a liability and is subsequently adjusted to the current market value of the option written. Premiums received from written options which expire unexercised are recorded by the Fund on the expiration date as realized gains from options written. The difference between the premium received and the amount paid on effecting a closing purchase transaction, including brokerage commissions, is also treated as a realized gain, or if the premium received is less than the amount paid for the closing purchase transaction, as a realized loss. If a call option is exercised, the premium received is added to the proceeds from the sale of the underlying security or currency in determining whether the Fund has realized a gain or loss. If a put option is exercised, the premium received reduces the cost basis of the security or currency purchased by the Fund. In writing an option, the Fund bears the market risk of an unfavorable change in the price of the security or currency underlying the written option. Exercise of an option written by the Fund could result in the Fund selling or buying a security or currency at a price different from the current market value.
| | | | |
| ALLIANCEBERNSTEIN UNCONSTRAINED BOND FUND • | | | 53 | |
Notes to Financial Statements
During the year ended October 31, 2011, the Fund held options for hedging and non-hedging purposes.
For the year ended October 31, 2011, the Fund had the following transactions:
| | | | | | | | |
| | | Number of
Contracts | | | Premiums
Received | |
Options written outstanding as of 10/31/10 | | | 3,700,000 | | | $ | 13,690 | |
Options written | | | 32,485,552,090 | | | | 7,446,077 | |
Options expired | | | – 0 | – | | | – 0 | – |
Options bought back | | | (13,505,475,000 | ) | | | (5,260,829 | ) |
Options exercised | | | (92,150,000 | ) | | | (620,291 | ) |
| | | | | | | | |
Options written outstanding as of 10/31/11 | | | 18,891,627,090 | | | $ | 1,578,647 | |
| | | | | | | | |
The Fund may enter into swaps to hedge its exposure to interest rates, credit risk, or currencies. The Fund may also enter into swaps for non-hedging purposes as a means of gaining market exposures including by making direct investments in foreign currencies, as described below under “Currency Transactions” or in order to take a “long” or “short” position with respect to an underlying referenced asset described below under “Total Return Swaps”. A swap is an agreement that obligates two parties to exchange a series of cash flows at specified intervals based upon or calculated by reference to changes in specified prices or rates for a specified amount of an underlying asset. The payment flows are usually netted against each other, with the difference being paid by one party to the other. In addition, collateral may be pledged or received by the Fund in accordance with the terms of the respective swap agreements to provide value and recourse to the Fund or its counterparties in the event of default, bankruptcy or insolvency by one of the parties to the swap agreement.
Risks may arise as a result of the failure of the counterparty to the swap contract to comply with the terms of the swap contract. The loss incurred by the failure of a counterparty is generally limited to the net interim payment to be received by the Fund, and/or the termination value at the end of the contract. Therefore, the Fund considers the creditworthiness of each counterparty to a swap contract in evaluating potential counterparty risk. This risk is mitigated by having a netting arrangement between the Fund and the counterparty and by the posting of collateral by the counterparty to the Fund to cover the Fund’s exposure to the counterparty. Additionally, risks may arise from unanticipated movements in interest rates or in the value of the underlying securities. The Fund accrues for the interim payments on swap contracts on a daily basis, with the net amount recorded within unrealized appreciation/depreciation of swap contracts on the statement of assets and liabilities, where applicable.
| | |
| 54 | | • ALLIANCEBERNSTEIN UNCONSTRAINED BOND FUND |
Notes to Financial Statements
Once the interim payments are settled in cash, the net amount is recorded as realized gain/(loss) on swaps on the statement of operations, in addition to any realized gain/(loss) recorded upon the termination of swap contracts. Fluctuations in the value of swap contracts are recorded as a component of net change in unrealized appreciation/depreciation of swap contracts on the statement of operations.
Interest Rate Swaps:
The Fund is subject to interest rate risk exposure in the normal course of pursuing its investment objectives. Because the Fund holds fixed rate bonds, the value of these bonds may decrease if interest rates rise. To help hedge against this risk and to maintain its ability to generate income at prevailing market rates, the Fund may enter into interest rate swap contracts. Interest rate swaps are agreements between two parties to exchange cash flows based on a notional amount. The Fund may elect to pay a fixed rate and receive a floating rate, or, receive a fixed rate and pay a floating rate on a notional amount.
In addition, the Fund may also enter into interest rate swap transactions to preserve a return or spread on a particular investment or portion of its portfolio, or protecting against an increase in the price of securities the Fund anticipates purchasing at a later date. Interest rate swaps involve the exchange by a Fund with another party of their respective commitments to pay or receive interest (e.g., an exchange of floating rate payments for fixed rate payments) computed based on a contractually-based principal (or “notional”) amount. Interest rate swaps are entered into on a net basis (i.e., the two payment streams are netted out, with the Fund receiving or paying, as the case may be, only the net amount of the two payments).
During the year ended October 31, 2011, the Fund held interest rate swap contracts for hedging and non-hedging purposes.
Credit Default Swaps:
The Fund may enter into credit default swaps, including to manage its exposure to the market or certain sectors of the market, to reduce its risk exposure to defaults by corporate and sovereign issuers held by the Fund, or to create exposure to corporate or sovereign issuers to which it is not otherwise exposed. The Fund may purchase credit protection (“Buy Contract”) or provide credit protection (“Sale Contract”) on the referenced obligation of the credit default swap. During the term of the swap agreement, the Fund receives/(pays) fixed payments from/(to) the respective counterparty, calculated at the agreed upon interest rate applied to the notional amount. The accrual for these interim payments is recorded within unrealized appreciation/depreciation of swap contracts on the statement of assets and liabilities. Upfront premiums paid or received in connection with credit default swap contracts are recognized as cost or proceeds on the statement of assets and liabilities and are amortized on a
| | | | |
| ALLIANCEBERNSTEIN UNCONSTRAINED BOND FUND • | | | 55 | |
Notes to Financial Statements
straight line basis over the life of the contract. Amortized upfront premiums are included in net realized gain/(loss) from swaps on the statement of operations. If the Fund is a buyer/(seller) of protection and a credit event occurs, as defined under the terms of the swap agreement, the Fund will either (i) receive from the seller/(pay to the buyer) of protection an amount equal to the notional amount of the swap contract (the “Maximum Payout Amount”) and deliver/(take delivery of) the referenced obligation or (ii) receive/(pay) a net settlement amount in the form of cash or securities equal to the notional amount of the swap less the recovery value of the referenced obligation.
During the year ended October 31, 2011, the Fund held credit default swap contracts for hedging and non-hedging purposes.
Credit default swaps may involve greater risks than if the Fund had invested in the referenced obligation directly. Credit default swaps are subject to general market risk, liquidity risk, counterparty risk and credit risk. If the Fund is a buyer of protection and no credit event occurs, it will lose its investment. If the Fund is a seller of protection and a credit event occurs, the value of the referenced obligation received by the Fund coupled with the periodic payments previously received may be less than the Maximum Payout Amount it pays to the buyer, resulting in a net loss to the Fund.
Implied credit spreads over Treasuries of comparable maturity utilized in determining the market value of credit default swaps on issuers as of period end are disclosed in the portfolio of investments. The implied spreads serve as an indicator of the current status of the payment/ performance risk and typically reflect the market’s assessment of the likelihood of default by the issuer on the referenced obligation. The implied credit spread of a particular reference entity reflects the cost of buying/selling protection and may include upfront payments required to be made to enter into the agreement. Widening credit spreads typically represent a deterioration of the referenced entity’s credit soundness and greater likelihood of default or other credit event occurring as defined under the terms of the agreement. A credit spread identified as “Defaulted” indicates a credit event has occurred for the referenced entity or obligation.
At October 31, 2011, the Fund had Sale Contracts outstanding with Maximum Payout Amounts aggregating $47,190,000 with unrealized appreciation of $224,541 and unrealized depreciation of $1,573,237 and ranging from a term of 1 to 39 years, as reflected in the portfolio of investments.
In certain circumstances Maximum Payout Amounts may be partially offset by recovery values of the respective referenced obligations, upfront premium received upon entering into the agreement, or net amounts
| | |
| 56 | | • ALLIANCEBERNSTEIN UNCONSTRAINED BOND FUND |
Notes to Financial Statements
received from settlement of buy protection credit default swap agreements entered into by the Fund for the same reference obligation with the same counterparty.
Total Return Swaps:
The Fund may enter into total return swaps in order take a “long” or “short” position with respect to an underlying referenced asset. The Fund is subject to market price volatility of the underlying referenced asset. A total return swap involves commitments to pay interest in exchange for a market linked return based on a notional amount. To the extent that the total return of the security, group of securities or index underlying the transaction exceeds or falls short of the offsetting interest obligation, the Fund will receive a payment from or make a payment to the counterparty.
During the year ended October 31, 2011, the Fund held total return swaps for hedging and non-hedging purposes.
Variance Swaps:
The Fund may enter into variance swaps to hedge equity market risk or adjust exposure to the equity markets. Variance swaps are contracts in which two parties agree to exchange cash payments based on the difference between the stated level of variance and the actual variance realized on underlying asset(s) or index(es). Actual “variance” as used here is defined as the sum of the square of the returns on the reference asset(s) or index(es) (which in effect is a measure of its “volatility”) over the length of the contract term. So the parties to a variance swap can be said to exchange actual volatility for a contractually stated rate of volatility.
During the year ended October 31, 2011, the Fund held variance swaps for hedging and non-hedging purposes.
Documentation governing the Fund’s swap transactions may contain provisions for early termination of a swap in the event the net assets of the Fund declines below specific levels set forth in the documentation (“net asset contingent features”). If these levels are triggered, the Fund’s counterparty has the right to terminate the swap and require the Fund to pay or receive a settlement amount in connection with the terminated swap transaction. As of October 31, 2011, the Fund had open swap contracts in net liability positions, with credit contingent features, in the amount of $2,532,838. The fair value of assets pledged as collateral by the Fund for such swap contracts was $7,453,084 at October 31, 2011. If a trigger event had occurred at October 31, 2011, for those swap contracts in a net liability position, no additional amounts would be required to be posted by the Fund since the aggregate fair value of the required collateral posted exceeded the settlement amounts of open derivative contracts.
| | | | |
| ALLIANCEBERNSTEIN UNCONSTRAINED BOND FUND • | | | 57 | |
Notes to Financial Statements
At October 31, 2011 the Fund had entered into the following derivatives:
| | | | | | | | | | | | |
| | | Asset Derivatives | | | Liability Derivatives | |
Derivative Type | | Statement of
Assets and
Liabilities
Location | | Fair Value | | | Statement of
Assets and
Liabilities
Location | | Fair Value | |
Interest rate contracts | | Unrealized appreciation of interest rate swap contracts | | $ | 1,023,792 | | | Unrealized depreciation of interest rate swap contracts | | $ | 1,859,613 | |
| | | | |
| | Receivable/Payable for variation margin on futures contracts | | | 23,595 | * | | Options written, at value | | | 1,055,688 | |
| | | | |
Foreign exchange contracts | | Unrealized appreciation of forward currency exchange contracts | | | 108,326 | | | Unrealized depreciation of forward currency exchange contracts | | | 658,597 | |
| | | | |
| | | | | | | | Options written, at value | | | 248,789 | |
| | | | |
Credit contracts | | Unrealized appreciation of credit default swap contracts | | | 845,545 | | | Unrealized depreciation of credit default swap contracts | | | 2,539,309 | |
| | | | |
Equity contracts | | Unrealized appreciation of total return swap contracts | | | 106,930 | | | Unrealized depreciation of total return swap contracts | | | 36,886 | |
| | | | |
| | Unrealized appreciation of variance swap contracts | | | 95,934 | | | Options written, at value | | | 839,657 | |
| | | | |
| | | | | | | | Receivable/Payable for variation margin on futures contracts | | | 14,840 | * |
| | | | | | | | | | | | |
Total | | | | $ | 2,204,122 | | | | | $ | 7,253,379 | |
| | | | | | | | | | | | |
The effect of derivative instruments on the statement of operations for the year ended October 31, 2011:
| | | | | | | | | | |
Derivative Type | | Location of Gain or (Loss) on
Derivatives | | Realized Gain
or (Loss) on
Derivatives | | | Change in
Unrealized
Appreciation or
(Depreciation) | |
Credit contracts | | Net realized gain/(loss) on swap contracts; Net change in unrealized appreciation/depreciation of swap contracts | | $ | (844,987) | | | $ | (1,707,835) | |
| | |
| 58 | | • ALLIANCEBERNSTEIN UNCONSTRAINED BOND FUND |
Notes to Financial Statements
| | | | | | | | | | |
Derivative Type | | Location of Gain or (Loss) on
Derivatives | | Realized Gain
or (Loss) on
Derivatives | | | Change in
Unrealized
Appreciation or
(Depreciation) | |
| | | |
| | Net realized gain/(loss) on options written; Net change in unrealized appreciation/ depreciation of options written | | $ | 66,870 | | | $ | 6,526 | |
| | | |
Interest rate contracts | | Net realized gain/(loss) on swap contracts; Net change in unrealized appreciation/depreciation of swap contracts | | | 1,241,161 | | | | (676,675 | ) |
| | | |
| | Net realized gain/(loss) on options written; Net change in unrealized appreciation/depreciation of options written | | | (482,765 | ) | | | (830,823 | ) |
| | | |
| | Net realized gain/(loss) on futures contracts; Net change in unrealized appreciation/depreciation of futures contracts | | | (339,899 | ) | | | 24,243 | |
| | | |
Equity contracts | | Net realized gain/(loss) on swap contracts; Net change in unrealized appreciation/depreciation of swap contracts | | | 275,314 | | | | 165,978 | |
| | | |
| | Net realized gain/(loss) on options written; Net change in unrealized appreciation/ depreciation of options written | | | | | | | 60,071 | |
| | | |
| | Net realized gain/(loss) on futures contracts; Net change in unrealized appreciation/depreciation of futures contracts | | | 373,661 | | | | (14,840 | ) |
| | | |
Foreign exchange
contracts | | Net realized gain/(loss) on foreign currency transactions; Net change in unrealized appreciation/depreciation of foreign currency denominated assets and liabilities | | | 353,072 | | | | (374,392 | ) |
| | | |
| | Net realized gain/(loss) on options written; Net change in unrealized appreciation/ depreciation of options written | | | 1,920,128 | | | | 205,265 | |
| | | | | | | | | | |
Total | | | | $ | 2,562,555 | | | $ | (3,142,482 | ) |
| | | | | | | | | | |
| * | | Only variation margin receivable/payable at period end is reported within the statement of assets and liabilities. Cumulative appreciation/(depreciation) of futures contracts is reported in the portfolio of investments. |
For the year ended October 31, 2011, the average monthly principal amount of foreign currency exchange contracts was $51,152,970, the average monthly notional amount of interest rate swap contracts was $171,971,780, the average
| | | | |
| ALLIANCEBERNSTEIN UNCONSTRAINED BOND FUND • | | | 59 | |
Notes to Financial Statements
monthly notional amount of credit default swap contracts was $85,329,004 and the average monthly notional amount of interest rate index futures contracts was $8,016,704. For ten months of the year, the average monthly notional amount of currency option contracts was $58,743,711 and the average monthly notional amount of interest rate swaption contracts was $23,335,000. For seven months of the year, the average monthly notional amount of equity index futures contracts was $2,797,171. For four months of the year, and the average monthly notional amount of credit default swaption contracts was $5,200,000. For three months of the year, the average monthly notional amount of total return swap contracts was $12,877,754. For one month of the year, the average monthly notional amount of variance rate swap contracts was $263,955.
2. Currency Transactions
The Fund may invest in non-U.S. Dollar securities on a currency hedged or unhedged basis. The Fund may seek investment opportunities by taking long or short positions in currencies through the use of currency-related derivatives, including forward currency exchange contracts, futures and options on futures, swaps, and other options. The Fund may enter into transactions for investment opportunities when it anticipates that a foreign currency will appreciate or depreciate in value but securities denominated in that currency are not held by the Fund and do not present attractive investment opportunities. Such transactions may also be used when the Adviser believes that it may be more efficient than a direct investment in a foreign currency-denominated security. The Fund may also conduct currency exchange contracts on a spot basis (i.e., for cash at the spot rate prevailing in the currency exchange market for buying or selling currencies).
3. Reverse Repurchase Agreements
Under a reverse repurchase agreement, the Fund sells securities and agrees to repurchase them at a mutually agreed upon date and price. At the time the Fund enters into a reverse repurchase agreement, it will establish a segregated account with the custodian containing liquid assets having at least equal to the repurchase price. For the year ended October 31, 2011, the Fund had no transactions in reverse repurchase agreements.
4. Loan Participations and Assignments
The Fund may invest in direct debt instruments which are interests in amounts owed to lenders or lending syndicates by corporate, governmental, or other borrowers, either in the form of participations at the time the loan is originated (“Participations”) or by buying an interest in the loan in the secondary market from a financial institution or institutional investor (“Assignments”). A loan is often administered by a bank or other financial institution (the “Lender”) that acts as agent for all holders. The agent administers the terms of the loan as specified in the loan agreement. When investing in Participations, the Fund generally has no right to enforce compliance with the terms of the loan agreement with the borrower. In addition, when investing in Participations, the Fund has the right to receive payments of principal, interest and any fees to
| | |
| 60 | | • ALLIANCEBERNSTEIN UNCONSTRAINED BOND FUND |
Notes to Financial Statements
which it is entitled only from the Lender and only upon receipt of payments by the Lender from the borrower. As a result, the Fund may be subject to the credit risk of both the borrower and the Lender. When the Fund purchases Assignments from Lenders, it will typically acquire direct rights against the borrower on the loan. These loans may include participations in “bridge loans”, which are loans taken out by borrowers for a short period (typically less than six months) pending arrangement of more permanent financing through, for example, the issuance of bonds, frequently high-yield bonds issued for the purpose of acquisitions. The Fund may also participate in unfunded loan commitments, which are contractual obligations for investing in future Participations, and receive a commitment fee based on the amount of the commitment. Under these arrangements, the Fund may receive a fixed rate commitment fee and, if and to the extent the borrower borrows under the facility, the Fund may receive an additional funding fee. Unfunded loan commitments and funded loans are marked to market daily.
As of October 31, 2011, the Fund had the following unfunded loan commitment which could be extended at the option of the borrower pursuant to the following loan agreement. In order to take the loan below, the Fund has a receivable for unfunded loan commitments, unsettled of $58,201. The unrealized depreciation on such loan was $23,749.
| | | | | | | | |
Borrower | | Unfunded Loan
Commitment | | | Funded | |
General Motors Holding, LLC, LIBOR +
2.75%, 10/27/15 | | $ | 700,000 | | | $ | – 0 | – |
During the year ended October 31, 2011, the Fund received commitment fees and additional funding fees of $62,968 and $0, respectively, which are included in other fee income on the statement of operations.
NOTE E
Capital Stock
Each class consists of 3,000,000,000 authorized shares. Transactions in capital shares for each class were as follows:
| | | | | | | | | | | | | | | | | | | | |
| | | | | | | | | | | | | | | | | | | | |
| | | Shares | | | | | Amount | | | |
| | | Year Ended
October 31, 2011 | | | Year Ended
October 31, 2010 | | | | | Year Ended
October 31, 2011 | | | Year Ended
October 31, 2010 | | | |
| | | | | | |
| Class A | | | | | | | | | | | | | | | | | |
Shares sold | | | 783,885 | | | | 694,647 | | | | | $ | 6,650,837 | | | $ | 5,749,114 | | | |
| | | |
Shares issued in reinvestment of dividends and distributions | | | 91,121 | | | | 82,629 | | | | | | 772,726 | | | | 685,397 | | | |
| | | |
Shares converted from Class B | | | 110,417 | | | | 209,151 | | | | | | 936,585 | | | | 1,736,726 | | | |
| | | |
Shares redeemed | | | (1,335,671 | ) | | | (1,656,253 | ) | | | | | (11,353,594 | ) | | | (13,728,395 | ) | | |
| | | |
Net decrease | | | (350,248 | ) | | | (669,826 | ) | | | | $ | (2,993,446 | ) | | $ | (5,557,158 | ) | | |
| | | |
| | | | | | | | | | | | | | | | | | | | |
| | | | |
| ALLIANCEBERNSTEIN UNCONSTRAINED BOND FUND • | | | 61 | |
Notes to Financial Statements
| | | | | | | | | | | | | | | | | | | | |
| | | | | | | | | | | | | | | | | | | | |
| | | Shares | | | | | Amount | | | |
| | | Year Ended
October 31, 2011 | | | Year Ended
October 31, 2010 | | | | | Year Ended
October 31, 2011 | | | Year Ended
October 31, 2010 | | | |
| | | | | | |
Class B | | | | | | | | | | | | | | | | | | | | |
Shares sold | | | 56,502 | | | | 40,021 | | | | | $ | 476,939 | | | $ | 333,829 | | | |
| | | |
Shares issued in reinvestment of dividends and distributions | | | 6,585 | | | | 6,411 | | | | | | 55,898 | | | | 53,511 | | | |
| | | |
Shares converted to Class A | | | (110,294 | ) | | | (208,899 | ) | | | | | (936,585 | ) | | | (1,736,726 | ) | | |
| | | |
Shares redeemed | | | (104,463 | ) | | | (152,367 | ) | | | | | (888,139 | ) | | | (1,268,226 | ) | | |
| | | |
Net decrease | | | (151,670 | ) | | | (314,834 | ) | | | | $ | (1,291,887 | ) | | $ | (2,617,612 | ) | | |
| | | |
| | | | | | | | | | | | | | | | | | | | |
| Class C | | | | | | | | | | | | | | | | | |
Shares sold | | | 283,475 | | | | 256,444 | | | | | $ | 2,402,382 | | | $ | 2,130,257 | | | |
| | | |
Shares issued in reinvestment of dividends and distributions | | | 22,716 | | | | 21,337 | | | | | | 192,699 | | | | 176,919 | | | |
| | | |
Shares redeemed | | | (503,324 | ) | | | (495,564 | ) | | | | | (4,267,148 | ) | | | (4,122,697 | ) | | |
| | | |
Net decrease | | | (197,133 | ) | | | (217,783 | ) | | | | $ | (1,672,067 | ) | | $ | (1,815,521 | ) | | |
| | | |
| | | | | | | | | | | | | | | | | | | | |
| Advisor Class | | | | | | | | | | | | | | | | | |
Shares sold | | | 4,888,073 | | | | 948,881 | | | | | $ | 41,490,850 | | | $ | 7,897,779 | | | |
| | | |
Shares issued in reinvestment of dividends and distributions | | | 43,273 | | | | 22,146 | | | | | | 366,650 | | | | 184,069 | | | |
| | | |
Shares redeemed | | | (808,436 | ) | | | (994,581 | ) | | | | | (6,881,229 | ) | | | (8,238,472 | ) | | |
| | | |
Net increase (decrease) | | | 4,122,910 | | | | (23,554 | ) | | | | $ | 34,976,271 | | | $ | (156,624 | ) | | |
| | | |
| | | | | | | | | | | | | | | | | | | | |
| Class R | | | | | | | | | | | | | | | | | |
Shares sold | | | 60,406 | | | | 18,018 | | | | | $ | 507,622 | | | $ | 149,147 | | | |
| | | |
Shares issued in reinvestment of dividends and distributions | | | 2,152 | | | | 1,360 | | | | | | 18,193 | | | | 11,269 | | | |
| | | |
Shares redeemed | | | (18,589 | ) | | | (3,539 | ) | | | | | (156,628 | ) | | | (29,392 | ) | | |
| | | |
Net increase | | | 43,969 | | | | 15,839 | | | | | $ | 369,187 | | | $ | 131,024 | | | |
| | | |
| | | | | | | | | | | | | | | | | | | | |
| Class K | | | | | | | | | | | | | | | | | |
Shares sold | | | 232 | | | | 20,865 | | | | | $ | 1,971 | | | $ | 176,702 | | | |
| | | |
Shares issued in reinvestment of dividends and distributions | | | 496 | | | | 82 | | | | | | 4,209 | | | | 684 | | | |
| | | |
Shares redeemed | | | (10,399 | ) | | | – 0 | – | | | | | (88,085 | ) | | | – 0 | – | | |
| | | |
Net increase (decrease) | | | (9,671 | ) | | | 20,947 | | | | | $ | (81,905 | ) | | $ | 177,386 | | | |
| | | |
| | | | | | | | | | | | | | | | | | | | |
| | |
| 62 | | • ALLIANCEBERNSTEIN UNCONSTRAINED BOND FUND |
Notes to Financial Statements
| | | | | | | | | | | | | | | | | | | | |
| | | | | | | | | | | | | | | | | | | | |
| | | Shares | | | | | Amount | | | |
| | | Year Ended
October 31, 2011 | | | Year Ended
October 31, 2010 | | | | | Year Ended
October 31, 2011 | | | Year Ended
October 31, 2010 | | | |
| | | | | | |
Class I | | | | | | | | | | | | | | | | | |
Shares sold | | | – 0 | – | | | – 0 | – | | | | $ | – 0 | – | | $ | – 0 | – | | |
| | | |
Shares redeemed | | | – 0 | – | | | – 0 | – | | | | $ | – 0 | – | | | – 0 | – | | |
| | | |
Net increase | | | – 0 | – | | | – 0 | – | | | | $ | – 0 | – | | $ | – 0 | – | | |
| | | |
During the years ended October 31, 2011 and October 31, 2010, a third party vendor reimbursed the Fund $189 and $13,103, respectively, for losses incurred due to a trade entry error. This amount is presented in the Fund’s statement of changes in net assets. Neither the Fund nor its affiliates were involved in the proceedings or the calculation of the payment.
NOTE F
Risks Involved in Investing in the Fund
Interest Rate Risk and Credit Risk—Interest rate risk is the risk that changes in interest rates will affect the value of the Fund’s investments in fixed-income debt securities such as bonds or notes. Increases in interest rates may cause the value of the Fund’s investments to decline. Credit risk is the risk that the issuer or guarantor of a debt security, or the counterparty to a derivative contract, will be unable or unwilling to make timely principal and/or interest payments, or to otherwise honor its obligations. The degree of risk for a particular security may be reflected in its credit risk rating. Credit risk is greater for medium quality and lower-rated securities. Lower-rated debt securities and similar unrated securities (commonly known as “junk bonds”) have speculative elements or are predominantly speculative risks.
Foreign Securities Risk—Investing in securities of foreign companies or foreign governments involves special risks which include changes in foreign currency exchange rates and the possibility of future political and economic developments which could adversely affect the value of such securities. Moreover, securities of many foreign companies or foreign governments and their markets may be less liquid and their prices more volatile than those of comparable U.S. companies or of the U.S. government.
Currency Risk—This is the risk that changes in foreign currency exchange rates may negatively affect the value of the Fund’s investments or reduce the returns of the Fund. For example, the value of the Fund’s investments in foreign currency-denominated securities or currencies may decrease if the U.S. Dollar is strong (i.e., gaining value relative to other currencies) and other currencies are weak (i.e., losing value relative to the U.S. Dollar). Currency markets are generally not as regulated as securities markets. Independent of the Fund’s investments in securities denominated in foreign currencies, the Fund’s positions in various foreign currencies may cause the Fund to experience investment losses due to the changes in exchange rates and interest rates.
| | | | |
| ALLIANCEBERNSTEIN UNCONSTRAINED BOND FUND • | | | 63 | |
Notes to Financial Statements
Derivatives Risk—The Fund may enter into derivative transactions such as forwards, options, futures and swaps. Derivatives may be illiquid, difficult to price, and leveraged so that small changes may produce disproportionate losses for the Fund, and subject to counterparty risk to a greater degree than more traditional investments. Derivatives may result in significant losses including losses that are far greater than the value of the derivatives reflected on the statement of assets and liabilities.
Leverage Risk—When the Fund borrows money or otherwise leverages its investments, its performance may be volatile because leverage tends to exaggerate the effect of any increase or decrease in the value of the Fund’s investments. The Fund may create leverage through the use of reverse repurchase arrangements, forward currency exchange contracts, forward commitments, dollar rolls or futures contracts or by borrowing money. The use of derivative instruments by the Fund, such as forwards, futures, options and swaps, may also result in a form of leverage. Leverage may result in higher returns to the Fund than is the Fund were not leveraged, but may also adversely affect returns, particularly if the market is declining.
Indemnification Risk—In the ordinary course of business, the Fund enters into contracts that contain a variety of indemnifications. The Fund’s maximum exposure under these arrangements is unknown. However, the Fund has not had prior claims or losses pursuant to these indemnification provisions and expects the risk of loss thereunder to be remote. Therefore, the Fund has not accrued any liability in connection with these indemnification provisions.
NOTE G
Joint Credit Facility
A number of open-end mutual funds managed by the Adviser, including the Fund, participate in a $140 million revolving credit facility (the “Facility”) intended to provide for short-term financing if necessary, subject to certain restrictions, in connection with abnormal redemption activity. Commitment fees related to the Facility are paid by the participating funds and are included in miscellaneous expenses in the statement of operations. The Fund did not utilize the Facility during the year ended October 31, 2011.
NOTE H
Distributions to Shareholders
The tax character of distributions paid during the fiscal years ended October 31, 2011 and October 31, 2010 were as follows:
| | | | | | | | |
| | | 2011 | | | 2010 | |
Distributions paid from: | | | | | | | | |
Ordinary income | | $ | 3,167,511 | | | $ | 1,990,580 | |
| | | | | | | | |
Total taxable distributions | | | 3,167,511 | | | | 1,990,580 | |
| | | | | | | | |
Total distributions paid | | $ | 3,167,511 | | | $ | 1,990,580 | |
| | | | | | | | |
| | |
| 64 | | • ALLIANCEBERNSTEIN UNCONSTRAINED BOND FUND |
Notes to Financial Statements
As of October 31, 2011, the components of accumulated earnings/(deficit) on a tax basis were as follows:
| | | | |
Accumulated capital and other losses | | $ | (7,111,879 | )(a) |
Unrealized appreciation/(depreciation) | | | (1,576,593 | )(b) |
| | | | |
Total accumulated earnings/(deficit) | | $ | (8,688,472 | )(c) |
| | | | |
| (a) | | On October 31, 2011, the Fund had a net capital loss carryforward of $6,497,739 of which $379,558 expires in the year 2016, $3,751,542 expires in the year 2017, $1,053,051 expires in the year 2018, and $1,313,588 expires in the year 2019. To the extent future capital gains are offset by capital loss carryforwards, such gains will not be distributed. For the year ended October 31, 2011, the cumulative deferred loss on straddles was $614,140. |
| (b) | | The differences between book-basis and tax-basis unrealized appreciation/(depreciation) are attributable primarily to the tax treatment of swap income, the realization for tax purposes of gains/losses on certain derivative instruments, and the difference between book and tax amortization methods for premium. |
| (c) | | The differences between book-basis and tax-basis components of accumulated earnings/(deficit) are attributable primarily to dividends payable and the tax treatment of interest on defaulted securities. |
During the current fiscal year, permanent differences primarily due to the tax treatment of swap income, paydown reclassification, consent fee reclassification, foreign currency reclassification, reclassifications on futures and swaps, and the treatment of proceeds from the sale of defaulted securities resulted in a net decrease in distributions in excess of net investment income, a net increase in accumulated net realized loss on investment and foreign currency transactions, and a net decrease to additional paid-in capital. These reclassifications had no effect on net assets.
NOTE I
New Accounting Pronouncements
In April 2011, the Financial Accounting Standards Board (“FASB”) issued an Accounting Standard Update (“ASU”) related to the accounting for repurchase agreements and similar agreements that both entitle and obligate a transferor to repurchase or redeem financial assets before their maturity. The ASU modifies the criteria for determining effective control of transferred assets and, as a result, certain agreements may now be accounted for as secured borrowings. The ASU is effective prospectively for new transfers and existing transactions that are modified in the first interim or annual period beginning on or after December 15, 2011. At this time, management is evaluating the implications of this ASU and its impact on the financial statements has not been determined.
In May 2011, the FASB issued an ASU to develop common requirements for measuring fair value and for disclosing information about fair value measurements in U.S. GAAP and International Financial Reporting Standards (“IFRS”). The amendments are intended to improve the comparability of fair value measurements presented and disclosed in the financial statements prepared in accordance with U.S. GAAP and IFRS. The ASU is effective during interim or annual
| | | | |
| ALLIANCEBERNSTEIN UNCONSTRAINED BOND FUND • | | | 65 | |
Notes to Financial Statements
periods beginning after December 15, 2011. At this time, management is evaluating the implication of this ASU and its impact on the financial statements has not been determined.
NOTE J
Subsequent Events
Management has evaluated subsequent events for possible recognition or disclosure in the financial statements through the date the financial statements are issued. Management has determined that there are no material events that would require disclosure in the Fund’s financial statements through this date.
| | |
| 66 | | • ALLIANCEBERNSTEIN UNCONSTRAINED BOND FUND |
Notes to Financial Statements
FINANCIAL HIGHLIGHTS
Selected Data For A Share of Capital Stock Outstanding Throughout Each Period
| | | | | | | | | | | | | | | | | | | | |
| | | Class A | |
| | | Year Ended October 31, | |
| | | 2011 | | | 2010 | | | 2009 | | | 2008 | | | 2007 | |
| | | | |
| | | | | | | | | | | | | | | | | | | | |
Net asset value, beginning of period | | | $ 8.50 | | | | $ 8.10 | | | | $ 7.39 | | | | $ 9.02 | | | | $ 8.62 | |
| | | | |
Income From Investment Operations | | | | | | | | | | | | | | | | | | | | |
Net investment income(a) | | | .25 | (b) | | | .24 | | | | .32 | | | | .36 | | | | .34 | |
Net realized and unrealized gain (loss) on investment and foreign currency transactions | | | (.13 | ) | | | .39 | | | | .71 | | | | (1.63 | ) | | | .40 | |
Contributions from Adviser | | | – 0 | – | | | – 0 | – | | | – 0 | – | | | .00 | (c) | | | – 0 | – |
| | | | |
Net increase (decrease) in net asset value from operations | | | .12 | | | | .63 | | | | 1.03 | | | | (1.27 | ) | | | .74 | |
| | | | |
Less: Dividends and Distributions | | | | | | | | | | | | | | | | | | | | |
Dividends from net investment income | | | (.29 | ) | | | (.23 | ) | | | (.28 | ) | | | (.36 | ) | | | (.34 | ) |
Tax return of capital | | | – 0 | – | | | – 0 | – | | | (.04 | ) | | | – 0 | – | | | – 0 | – |
| | | | |
Total dividends and distributions | | | (.29 | ) | | | (.23 | ) | | | (.32 | ) | | | (.36 | ) | | | (.34 | ) |
| | | | |
Net asset value, end of period | | | $ 8.33 | | | | $ 8.50 | | | | $ 8.10 | | | | $ 7.39 | | | | $ 9.02 | |
| | | | |
Total Return | | | | | | | | | | | | | | | | | | | | |
Total investment return based on net asset value(d) | | | 1.37 | %* | | | 7.88 | %* | | | 14.45 | %* | | | (14.57 | )%* | | | 8.60 | %* |
Ratios/Supplemental Data | | | | | | | | | | | | | | | | | | | | |
Net assets, end of period (000’s omitted) | | | $38,970 | | | | $42,733 | | | | $46,138 | | | | $39,639 | | | | $48,542 | |
Ratio to average net assets of: | | | | | | | | | | | | | | | | | | | | |
Expenses, net of waivers/reimbursements | | | .90 | % | | | .90 | %(e) | | | .90 | % | | | .90 | % | | | 1.47 | % |
Expenses, before waivers/reimbursements | | | 1.44 | % | | | 1.55 | %(e) | | | 1.69 | % | | | 1.65 | % | | | 1.47 | % |
Expenses, before waivers/reimbursements excluding interest expense | | | 1.44 | % | | | 1.55 | %(e) | | | 1.69 | % | | | 1.65 | % | | | 1.47 | % |
Net investment income | | | 2.98 | %(b) | | | 2.83 | %(e) | | | 4.24 | % | | | 4.13 | % | | | 3.81 | % |
Portfolio turnover rate | | | 78 | % | | | 54 | % | | | 86 | % | | | 81 | % | | | 134 | % |
See footnote summary on page 74.
| | | | |
| ALLIANCEBERNSTEIN UNCONSTRAINED BOND FUND • | | | 67 | |
Financial Highlights
Selected Data For A Share of Capital Stock Outstanding Throughout Each Period
| | | | | | | | | | | | | | | | | | | | |
| | | Class B | |
| | | Year Ended October 31, | |
| | | 2011 | | | 2010 | | | 2009 | | | 2008 | | | 2007 | |
| | | | |
| | | | | | | | | | | | | | | | | | | | |
Net asset value, beginning of period | | | $ 8.51 | | | | $ 8.11 | | | | $ 7.40 | | | | $ 9.03 | | | | $ 8.63 | |
| | | | |
Income From Investment Operations | | | | | | | | | | | | | | | | | | | | |
Net investment income(a) | | | .17 | (b) | | | .18 | | | | .26 | | | | .30 | | | | .26 | |
Net realized and unrealized gain (loss) on investment and foreign currency transactions | | | (.11 | ) | | | .39 | | | | .72 | | | | (1.64 | ) | | | .41 | |
Contributions from Adviser | | | – 0 | – | | | – 0 | – | | | – 0 | – | | | .00 | (c) | | | – 0 | – |
| | | | |
Net increase (decrease) in net asset value from operations | | | .06 | | | | .57 | | | | .98 | | | | (1.34 | ) | | | .67 | |
| | | | |
Less: Dividends and Distributions | | | | | | | | | | | | | | | | | | | | |
Dividends from net investment income | | | (.23 | ) | | | (.17 | ) | | | (.23 | ) | | | (.29 | ) | | | (.27 | ) |
Tax return of capital | | | – 0 | – | | | – 0 | – | | | (.04 | ) | | | – 0 | – | | | – 0 | – |
| | | | |
Total dividends and distributions | | | (.23 | ) | | | (.17 | ) | | | (.27 | ) | | | (.29 | ) | | | (.27 | ) |
| | | | |
Net asset value, end of period | | | $ 8.34 | | | | $ 8.51 | | | | $ 8.11 | | | | $ 7.40 | | | | $ 9.03 | |
| | | | |
Total Return | | | | | | | | | | | | | | | | | | | | |
Total investment return based on net asset value(d) | | | 0.66 | %* | | | 7.13 | %* | | | 13.65 | %* | | | (15.15 | )%* | | | 7.77 | %* |
Ratios/Supplemental Data | | | | | | | | | | | | | | | | | | | | |
Net assets, end of period (000’s omitted) | | | $2,515 | | | | $3,856 | | | | $6,226 | | | | $13,666 | | | | $27,303 | |
Ratio to average net assets of: | | | | | | | | | | | | | | | | | | | | |
Expenses, net of waivers/reimbursements | | | 1.60 | % | | | 1.60 | %(e) | | | 1.60 | % | | | 1.60 | % | | | 2.28 | % |
Expenses, before waivers/reimbursements | | | 2.21 | % | | | 2.30 | %(e) | | | 2.49 | % | | | 2.41 | % | | | 2.28 | % |
Expenses, before waivers/reimbursements excluding interest expense | | | 2.21 | % | | | 2.30 | %(e) | | | 2.49 | % | | | 2.41 | % | | | 2.28 | % |
Net investment income | | | 2.06 | %(b) | | | 2.15 | %(e) | | | 3.66 | % | | | 3.43 | % | | | 2.93 | % |
Portfolio turnover rate | | | 78 | % | | | 54 | % | | | 86 | % | | | 81 | % | | | 134 | % |
See footnote summary on page 74.
| | |
| 68 | | • ALLIANCEBERNSTEIN UNCONSTRAINED BOND FUND |
Financial Highlights
Selected Data For A Share of Capital Stock Outstanding Throughout Each Period
| | | | | | | | | | | | | | | | | | | | |
| | | Class C | |
| | | Year Ended October 31, | |
| | | 2011 | | | 2010 | | | 2009 | | | 2008 | | | 2007 | |
| | | | |
| | | | | | | | | | | | | | | | | | | | |
Net asset value, beginning of period | | | $ 8.50 | | | | $ 8.10 | | | | $ 7.40 | | | | $ 9.02 | | | | $ 8.63 | |
| | | | |
Income From Investment Operations | | | | | | | | | | | | | | | | | | | | |
Net investment income(a) | | | .19 | (b) | | | .18 | | | | .26 | | | | .29 | | | | .27 | |
Net realized and unrealized gain (loss) on investment and foreign currency transactions | | | (.13 | ) | | | .39 | | | | .71 | | | | (1.61 | ) | | | .39 | |
Contributions from Adviser | | | – 0 | – | | | – 0 | – | | | – 0 | – | | | .00 | (c) | | | – 0 | – |
| | | | |
Net increase (decrease) in net asset value from operations | | | .06 | | | | .57 | | | | .97 | | | | (1.32 | ) | | | .66 | |
| | | | |
Less: Dividends and Distributions | | | | | | | | | | | | | | | | | | | | |
Dividends from net investment income | | | (.23 | ) | | | (.17 | ) | | | (.23 | ) | | | (.30 | ) | | | (.27 | ) |
Tax return of capital | | | – 0 | – | | | – 0 | – | | | (.04 | ) | | | – 0 | – | | | – 0 | – |
| | | | |
Total dividends and distributions | | | (.23 | ) | | | (.17 | ) | | | (.27 | ) | | | (.30 | ) | | | (.27 | ) |
| | | | |
Net asset value, end of period | | | $ 8.33 | | | | $ 8.50 | | | | $ 8.10 | | | | $ 7.40 | | | | $ 9.02 | |
| | | | |
Total Return | | | | | | | | | | | | | | | | | | | | |
Total investment return based on net asset value(d) | | | 0.66 | %* | | | 7.13 | %* | | | 13.50 | %* | | | (15.05 | )%* | | | 7.69 | %* |
Ratios/Supplemental Data | | | | | | | | | | | | | | | | | | | | |
Net assets, end of period (000’s omitted) | | | $11,332 | | | | $13,236 | | | | $14,376 | | | | $11,245 | | | | $15,208 | |
Ratio to average net assets of: | | | | | | | | | | | | | | | | | | | | |
Expenses, net of waivers/reimbursements | | | 1.60 | % | | | 1.60 | %(e) | | | 1.60 | % | | | 1.60 | % | | | 2.20 | % |
Expenses, before waivers/reimbursements | | | 2.15 | % | | | 2.26 | %(e) | | | 2.39 | % | | | 2.36 | % | | | 2.20 | % |
Expenses, before waivers/reimbursements excluding interest expense | | | 2.15 | % | | | 2.26 | %(e) | | | 2.39 | % | | | 2.36 | % | | | 2.20 | % |
Net investment income | | | 2.27 | %(b) | | | 2.13 | %(e) | | | 3.53 | % | | | 3.44 | % | | | 3.03 | % |
Portfolio turnover rate | | | 78 | % | | | 54 | % | | | 86 | % | | | 81 | % | | | 134 | % |
See footnote summary on page 74.
| | | | |
| ALLIANCEBERNSTEIN UNCONSTRAINED BOND FUND • | | | 69 | |
Financial Highlights
Selected Data for A Share of Capital Stock Outstanding Throughout Each Period
| | | | | | | | | | | | | | | | | | | | |
| | | Advisor Class | |
| | | Year Ended October 31, | |
| | | 2011 | | | 2010 | | | 2009 | | | 2008 | | | 2007 | |
| | | | |
| | | | | | | | | | | | | | | | | | | | |
Net asset value, beginning of period | | | $ 8.49 | | | | $ 8.09 | | | | $ 7.39 | | | | $ 9.02 | | | | $ 8.62 | |
| | | | |
Income From Investment Operations | | | | | | | | | | | | | | | | | | | | |
Net investment income(a) | | | .32 | (b) | | | .26 | | | | .32 | | | | .38 | | | | .37 | |
Net realized and unrealized gain (loss) on investment and foreign currency transactions | | | (.17 | ) | | | .39 | | | | .72 | | | | (1.63 | ) | | | .39 | |
Contributions from Adviser | | | – 0 | – | | | – 0 | – | | | – 0 | – | | | .00 | (c) | | | – 0 | – |
| | | | |
Net increase (decrease) in net asset value from operations | | | .15 | | | | .65 | | | | 1.04 | | | | (1.25 | ) | | | .76 | |
| | | | |
Less: Dividends and Distributions | | | | | | | | | | | | | | | | | | | | |
Dividends from net investment income | | | (.31 | ) | | | (.25 | ) | | | (.30 | ) | | | (.38 | ) | | | (.36 | ) |
Tax return of capital | | | – 0 | – | | | – 0 | – | | | (.04 | ) | | | – 0 | – | | | – 0 | – |
| | | | |
Total dividends and distributions | | | (.31 | ) | | | (.25 | ) | | | (.34 | ) | | | (.38 | ) | | | (.36 | ) |
| | | | |
Net asset value, end of period | | | $ 8.33 | | | | $ 8.49 | | | | $ 8.09 | | | | $ 7.39 | | | | $ 9.02 | |
| | | | |
Total Return | | | | | | | | | | | | | | | | | | | | |
Total investment return based on net asset value(d) | | | 1.79 | %* | | | 8.21 | %* | | | 14.64 | %* | | | (14.31 | )%* | | | 8.89 | %* |
Ratios/Supplemental Data | | | | | | | | | | | | | | | | | | | | |
Net assets, end of period (000’s omitted) | | | $46,740 | | | | $12,660 | | | | $12,255 | | | | $3,756 | | | | $5,529 | |
Ratio to average net assets of: | | | | | | | | | | | | | | | | | | | | |
Expenses, net of waivers/reimbursements | | | .60 | % | | | .60 | %(e) | | | .60 | % | | | .60 | % | | | 1.14 | % |
Expenses, before waivers/reimbursements | | | 1.14 | % | | | 1.23 | %(e) | | | 1.28 | % | | | 1.33 | % | | | 1.14 | % |
Expenses, before waivers/reimbursements excluding interest expense | | | 1.14 | % | | | 1.23 | %(e) | | | 1.28 | % | | | 1.33 | % | | | 1.14 | % |
Net investment income | | | 3.81 | %(b) | | | 3.14 | %(e) | | | 4.39 | % | | | 4.42 | % | | | 4.00 | % |
Portfolio turnover rate | | | 78 | % | | | 54 | % | | | 86 | % | | | 81 | % | | | 134 | % |
See footnote summary on page 74.
| | |
| 70 | | • ALLIANCEBERNSTEIN UNCONSTRAINED BOND FUND |
Financial Highlights
Selected Data for A Share of Capital Stock Outstanding Throughout Each Period
| | | | | | | | | | | | | | | | | | | | |
| | | Class R | |
| | | Year Ended October 31, | |
| | | 2011 | | | 2010 | | | 2009 | | | 2008 | | | 2007 | |
| | | | |
| | | | | | | | | | | | | | | | | | | | |
Net asset value, beginning of period | | | $ 8.47 | | | | $ 8.07 | | | | $ 7.37 | | | | $ 8.99 | | | | $ 8.61 | |
| | | | | | | | |
Income From Investment Operations | | | | | | | | | | | | | | | | | | | | |
Net investment income(a) | | | .25 | (b) | | | .22 | | | | .30 | | | | .34 | | | | .35 | |
Net realized and unrealized gain (loss) on investment and foreign currency transactions | | | (.14 | ) | | | .39 | | | | .70 | | | | (1.62 | ) | | | .34 | |
Contributions from Adviser | | | – 0 | – | | | – 0 | – | | | – 0 | – | | | .00 | (c) | | | – 0 | – |
| | | | |
Net increase (decrease) in net asset value from operations | | | .11 | | | | .61 | | | | 1.00 | | | | (1.28 | ) | | | .69 | |
| | | | |
Less: Dividends and Distributions | | | | | | | | | | | | | | | | | | | | |
Dividends from net investment income | | | (.27 | ) | | | (.21 | ) | | | (.26 | ) | | | (.34 | ) | | | (.31 | ) |
Tax return of capital | | | – 0 | – | | | – 0 | – | | | (.04 | ) | | | – 0 | – | | | – 0 | – |
| | | | |
Total dividends and distributions | | | (.27 | ) | | | (.21 | ) | | | (.30 | ) | | | (.34 | ) | | | (.31 | ) |
| | | | |
Net asset value, end of period | | | $ 8.31 | | | | $ 8.47 | | | | $ 8.07 | | | | $ 7.37 | | | | $ 8.99 | |
| | | | |
Total Return | | | | | | | | | | | | | | | | | | | | |
Total investment return based on net asset value(d) | | | 1.29 | %* | | | 7.68 | %* | | | 14.12 | %* | | | (14.65 | )%* | | | 8.15 | %* |
Ratios/Supplemental Data | | | | | | | | | | | | | | | | | | | | |
Net assets, end of period (000’s omitted) | | | $871 | | | | $516 | | | | $364 | | | | $252 | | | | $187 | |
Ratio to average net assets of: | | | | | | | | | | | | | | | | | | | | |
Expenses, net of waivers/reimbursements | | | 1.10 | % | | | 1.10 | %(e) | | | 1.10 | % | | | 1.10 | % | | | 1.58 | % |
Expenses, before waivers/reimbursements | | | 1.84 | % | | | 1.88 | %(e) | | | 1.96 | % | | | 1.88 | % | | | 1.58 | % |
Expenses, before waivers/reimbursements excluding interest expense | | | 1.84 | % | | | 1.88 | %(e) | | | 1.96 | % | | | 1.88 | % | | | 1.58 | % |
Net investment income | | | 2.98 | %(b) | | | 2.61 | %(e) | | | 4.02 | % | | | 3.98 | % | | | 4.08 | % |
Portfolio turnover rate | | | 78 | % | | | 54 | % | | | 86 | % | | | 81 | % | | | 134 | % |
See footnote summary on page 74.
| | | | |
| ALLIANCEBERNSTEIN UNCONSTRAINED BOND FUND • | | | 71 | |
Financial Highlights
Selected Data for A Share of Capital Stock Outstanding Throughout Each Period
| | | | | | | | | | | | | | | | | | | | |
| | | Class K | |
| | | Year Ended October 31, | |
| | | 2011 | | | 2010 | | | 2009 | | | 2008 | | | 2007 | |
| | | | |
| | | | | | | | | | | | | | | | | | | | |
Net asset value, beginning of period | | | $ 8.50 | | | | $ 8.10 | | | | $ 7.39 | | | | $ 9.00 | | | | $ 8.61 | |
| | | | |
Income From Investment Operations | | | | | | | | | | | | | | | | | | | | |
Net investment income(a) | | | .24 | (b) | | | .23 | | | | .32 | | | | .38 | | | | .32 | |
Net realized and unrealized gain (loss) on investment and foreign currency transactions | | | (.11 | ) | | | .41 | | | | .71 | | | | (1.63 | ) | | | .40 | |
Contributions from Adviser | | | – 0 | – | | | – 0 | – | | | – 0 | – | | | .00 | (c) | | | – 0 | – |
| | | | |
Net increase (decrease) in net asset value from operations | | | .13 | | | | .64 | | | | 1.03 | | | | (1.25 | ) | | | .72 | |
| | | | |
Less: Dividends and Distributions | | | | | | | | | | | | | | | | | | | | |
Dividends from net investment income | | | (.29 | ) | | | (.24 | ) | | | (.28 | ) | | | (.36 | ) | | | (.33 | ) |
Tax return of capital | | | – 0 | – | | | – 0 | – | | | (.04 | ) | | | – 0 | – | | | – 0 | – |
| | | | |
Total dividends and distributions | | | (.29 | ) | | | (.24 | ) | | | (.32 | ) | | | (.36 | ) | | | (.33 | ) |
| | | | |
Net asset value, end of period | | | $ 8.34 | | | | $ 8.50 | | | | $ 8.10 | | | | $ 7.39 | | | | $ 9.00 | |
| | | | |
Total Return | | | | | | | | | | | | | | | | | | | | |
Total investment return based on net asset value(d) | | | 1.54 | %* | | | 8.00 | %* | | | 14.45 | %* | | | (14.28 | )%* | | | 8.46 | %* |
Ratios/Supplemental Data | | | | | | | | | | | | | | | | | | | | |
Net assets, end of period (000’s omitted) | | | $120 | | | | $205 | | | | $25 | | | | $21 | | | | $57 | |
Ratio to average net assets of: | | | | | | | | | | | | | | | | | | | | |
Expenses, net of waivers/reimbursements | | | .85 | % | | | .85 | %(e) | | | .85 | % | | | .85 | % | | | 1.59 | % |
Expenses, before waivers/reimbursements | | | 1.50 | % | | | 1.29 | %(e) | | | 1.68 | % | | | 1.53 | % | | | 1.59 | % |
Expenses, before waivers/reimbursements excluding interest expense | | | 1.50 | % | | | 1.29 | %(e) | | | 1.68 | % | | | 1.53 | % | | | 1.59 | % |
Net investment income | | | 2.78 | %(b) | | | 2.73 | %(e) | | | 4.29 | % | | | 4.02 | % | | | 3.47 | % |
Portfolio turnover rate | | | 78 | % | | | 54 | % | | | 86 | % | | | 81 | % | | | 134 | % |
See footnote summary on page 74.
| | |
| 72 | | • ALLIANCEBERNSTEIN UNCONSTRAINED BOND FUND |
Financial Highlights
Selected Data for A Share of Capital Stock Outstanding Throughout Each Period
| | | | | | | | | | | | | | | | | | | | |
| | | Class I | |
| | | Year Ended October 31, | |
| | | 2011 | | | 2010 | | | 2009 | | | 2008 | | | 2007 | |
| | | | |
| | | | | | | | | | | | | | | | | | | | |
Net asset value, beginning of period | | | $ 8.48 | | | | $ 8.08 | | | | $ 7.38 | | | | $ 9.00 | | | | $ 8.61 | |
| | | | |
Income From Investment Operations | | | | | | | | | | | | | | | | | | | | |
Net investment income(a) | | | .28 | (b) | | | .26 | | | | .34 | | | | .38 | | | | .36 | |
Net realized and unrealized gain (loss) on investment and foreign currency transactions | | | (.14 | ) | | | .40 | | | | .70 | | | | (1.62 | ) | | | .40 | |
Contributions from Adviser | | | – 0 | – | | | – 0 | – | | | – 0 | – | | | .00 | (c) | | | – 0 | – |
| | | | |
Net increase (decrease) in net asset value from operations | | | .14 | | | | .66 | | | | 1.04 | | | | (1.24 | ) | | | .76 | |
| | | | |
Less: Dividends and Distributions | | | | | | | | | | | | | | | | | | | | |
Dividends from net investment income | | | (.31 | ) | | | (.26 | ) | | | (.30 | ) | | | (.38 | ) | | | (.37 | ) |
Tax return of capital | | | – 0 | – | | | – 0 | – | | | (.04 | ) | | | – 0 | – | | | – 0 | – |
| | | | |
Total dividends and distributions | | | (.31 | ) | | | (.26 | ) | | | (.34 | ) | | | (.38 | ) | | | (.37 | ) |
| | | | |
Net asset value, end of period | | | $ 8.31 | | | | $ 8.48 | | | | $ 8.08 | | | | $ 7.38 | | | | $ 9.00 | |
| | | | |
Total Return | | | | | | | | | | | | | | | | | | | | |
Total investment return based on net asset value(d) | | | 1.69 | %* | | | 8.26 | %* | | | 14.69 | %* | | | (14.21 | )%* | | | 8.92 | %* |
Ratios/Supplemental Data | | | | | | | | | | | | | | | | | | | | |
Net assets, end of period (000’s omitted) | | | $9 | | | | $10 | | | | $9 | | | | $8 | | | | $10 | |
Ratio to average net assets of: | | | | | | | | | | | | | | | | | | | | |
Expenses, net of waivers/reimbursements | | | .60 | % | | | .60 | %(e) | | | .60 | % | | | .60 | % | | | 1.14 | % |
Expenses, before waivers/reimbursements | | | 1.17 | % | | | 1.18 | %(e) | | | 1.25 | % | | | 1.28 | % | | | 1.14 | % |
Expenses, before waivers/reimbursements excluding interest expense | | | 1.17 | % | | | 1.18 | %(e) | | | 1.25 | % | | | 1.28 | % | | | 1.14 | % |
Net investment income | | | 3.35 | %(b) | | | 3.13 | %(e) | | | 4.57 | % | | | 4.45 | % | | | 4.06 | % |
Portfolio turnover rate | | | 78 | % | | | 54 | % | | | 86 | % | | | 81 | % | | | 134 | % |
See footnote summary on page 74.
| | | | |
| ALLIANCEBERNSTEIN UNCONSTRAINED BOND FUND • | | | 73 | |
Financial Highlights
| (a) | | Based on average shares outstanding. |
| (b) | | Net of expenses waived/reimbursed by the Adviser. |
| (c) | | Amount is less than $.005. |
| (d) | | Total investment return is calculated assuming an initial investment made at the net asset value at the beginning of the period, reinvestment of all dividends and distributions at net asset value during the period, and redemption on the last day of the period. Initial sales charges or contingent deferred sales charges are not reflected in the calculation of total investment return. Total return does not reflect the deduction of taxes that a shareholder would pay on fund distributions or the redemption of fund shares. Total investment return calculated for a period of less than one year is not annualized. |
| (e) | | The ratio includes expenses attributable to costs of proxy solicitation. |
| * | | Includes the impact of proceeds received and credited to the Fund resulting from the class action settlements, which enhanced the performance of each share class for the years ended October 31, 2011, October 31, 2010, October 31, 2009, October 31, 2008, and October 31, 2007, by 0.08%, 0.55%, 0.57%, 0.81% and 4.31%, respectively. |
See notes to financial statements.
| | |
| 74 | | • ALLIANCEBERNSTEIN UNCONSTRAINED BOND FUND |
Financial Highlights
REPORT OF INDEPENDENT REGISTERED
PUBLIC ACCOUNTING FIRM
To the Board of Directors of AllianceBernstein Bond Fund, Inc.
and Shareholders of the AllianceBernstein Unconstrained Bond Fund
We have audited the accompanying consolidated statement of assets and liabilities of AllianceBernstein Unconstrained Bond Fund, Inc. (the “Fund”) (formerly known as AllianceBernstein Diversified Yield Fund, Inc.), including the portfolio of investments, as of October 31, 2011, and the related statement of operations the year then ended, the statement of changes in net assets for each of the two years then ended, and the financial highlights for each of the periods indicated therein. These financial statements and financial highlights are the responsibility of the Fund’s management. Our responsibility is to express an opinion on these financial statements and financial highlights based on our audits.
We conducted our audits in accordance with the standards of the Public Company Accounting Oversight Board (United States). Those standards require that we plan and perform the audit to obtain reasonable assurance about whether the financial statements and financial highlights are free of material misstatement. We were not engaged to perform an audit of the Fund’s internal control over financial reporting. Our audit included consideration of internal control over financial reporting as a basis for designing audit procedures that are appropriate in the circumstances, but not for the purpose of expressing an opinion on the effectiveness of the Fund’s internal control over financial reporting. Accordingly, we express no such opinion. An audit also includes examining, on a test basis, evidence supporting the amounts and disclosures in the financial statements and financial highlights, assessing the accounting principles used and significant estimates made by management, and evaluating the overall financial statement presentation. Our procedures included confirmation of securities owned as of October 31, 2011 by correspondence with the custodian and others or by other appropriate auditing procedures where replies from others were not received. We believe that our audits provide a reasonable basis for our opinion.
In our opinion, the financial statements and financial highlights referred to above present fairly, in all material respects, the consolidated financial position of AllianceBernstein Unconstrained Bond Fund at October 31, 2011, the results of their operations for the year then ended, changes in their net assets for each of the two years then ended, and the financial highlights for each of the periods indicated therein, in conformity with U.S. generally accepted accounting principles.

New York, New York
December 30, 2011
| | | | |
| ALLIANCEBERNSTEIN UNCONSTRAINED BOND FUND • | | | 75 | |
Report of Independent Registered Public Accounting Firm
2011 FEDERAL TAX INFORMATION
(unaudited)
For Federal income tax purposes, the following information is furnished with respect to the distributions paid by the Fund during the taxable year ended October 31, 2011.
For foreign shareholders, 100% of ordinary income dividends paid may be considered to be qualifying to be taxed as interest-related dividends.
Shareholders should not use the above information to prepare their income tax returns. The information necessary to complete your income tax returns will be included with your Form 1099-DIV which will be sent to you separately in January 2012.
| | |
| 76 | | • ALLIANCEBERNSTEIN UNCONSTRAINED BOND FUND |
2011 Federal Tax Information
BOARD OF DIRECTORS
| | |
William H. Foulk, Jr.(1), Chairman John H. Dobkin(1) Michael J. Downey(1) D. James Guzy(1) Nancy P. Jacklin(1) | | Robert M. Keith, President and Chief Executive Officer Garry L. Moody(1) Marshall C. Turner, Jr.(1) Earl D. Weiner(1) |
OFFICERS
| | |
Philip L. Kirstein, Senior Vice President and Independent Compliance Officer Paul J. DeNoon(2), Vice President Joel J. McKoan(2), Vice President Michael L. Mon(2), Vice President Douglas J. Peebles(2) , Vice President | | Matthew S. Sheridan(2) , Vice President Emilie D. Wrapp, Secretary Joseph J. Mantineo, Treasurer and Chief Financial Officer Stephen M. Woetzel, Controller |
| | |
Principal Underwriter AllianceBernstein Investments, Inc. 1345 Avenue of the Americas New York, NY 10105 Custodian and Accounting Agent Brown Brothers Harriman & Co. 40 Water Street Boston, MA 02109 Legal Counsel Seward & Kissel LLP One Battery Park Plaza New York, NY 10004 | | Transfer Agent AllianceBernstein Investor Services, Inc. P.O. Box 786003 San Antonio, TX 78278-6003 Toll-Free (800) 221-5672 Independent Registered Public Accounting Firm Ernst & Young LLP 5 Times Square New York, NY 10036 |
| (1) | | Member of the Audit Committee, the Governance and Nominating Committee and the Independent Directors Committee. Mr. Foulk is the sole member of the Fair Value Pricing Committee. |
| (2) | | The day-to-day management of, and investment decisions for, the Fund’s portfolio are made by the Global Fixed Income Investment Team and the Global Credit Investment Team. Messrs. DeNoon, McKoan, Mon, Peebles and Sheridan are the investment professionals with the most significant responsibility for the day-to-day management of the Fund’s portfolio. |
| | | | |
| ALLIANCEBERNSTEIN UNCONSTRAINED BOND FUND • | | | 77 | |
Board of Directors
MANAGEMENT OF THE FUND
Board of Directors Information
The business and affairs of the Fund are managed under the direction of the Board of Directors. Certain information concerning the Fund’s Directors is set forth below.
| | | | | | | | |
NAME,
ADDRESS*, AGE,
(FIRST YEAR ELECTED**) | | PRINCIPAL
OCCUPATION(S)
DURING PAST FIVE YEARS
AND OTHER RELEVANT
QUALIFICATIONS*** | | PORTFOLIOS
IN FUND
COMPLEX
OVERSEEN BY
DIRECTOR | | | OTHER
DIRECTORSHIPS
HELD BY
DIRECTOR IN THE
PAST FIVE YEARS |
| INTERESTED DIRECTOR | | | | | | |
Robert M. Keith, †
1345 Avenue of the Americas
New York, NY 10105
51
(2010) | | Senior Vice President of AllianceBernstein L.P. (the “Adviser”),** and the head of AllianceBernstein Investments, Inc. (“ABI”),** since July 2008; Director of ABI and President of the AllianceBernstein Mutual Funds. Previously, he served as Executive Managing Director of ABI from December 2006 to June 2008. Prior to joining ABI in 2006, Executive Managing Director of Bernstein Global Wealth Management, and prior thereto, Senior Managing Director and Global Head of Client Service and Sales of the Adviser’s institutional investment management business since 2004. Prior thereto, Managing Director and Head of North American Client Service and Sales in the Adviser’s institutional investment management business, with which he had been associated since prior to 2004. | | | 102 | | | None |
| | |
| 78 | | • ALLIANCEBERNSTEIN UNCONSTRAINED BOND FUND |
Management of the Fund
| | | | | | | | |
NAME,
ADDRESS*, AGE,
(FIRST YEAR ELECTED**) | | PRINCIPAL
OCCUPATION(S)
DURING PAST FIVE YEARS
AND OTHER RELEVANT
QUALIFICATIONS*** | | PORTFOLIOS
IN FUND
COMPLEX
OVERSEEN BY
DIRECTOR | | | OTHER
DIRECTORSHIPS
HELD BY
DIRECTOR IN THE
PAST FIVE YEARS |
| DISINTERESTED DIRECTORS | | | | | | |
William H. Foulk, Jr., #, ##
Chairman of the Board
79
(1995) | | Investment Adviser and an Independent Consultant since prior to 2006. Previously, he was Senior Manager of Barrett Associates, Inc., a registered investment adviser. He was formerly Deputy Comptroller and Chief Investment Officer of the State of New York and, prior thereto, Chief Investment Officer of the New York Bank for Savings. He has served as a director or trustee of various AllianceBernstein Funds since 1983 and has been Chairman of the AllianceBernstein Funds and of the Independent Directors Committee of such Funds since 2003. He is also active in a number of mutual fund related organizations and committees. | | | 102 | | | None |
| | | | | | | | |
John H. Dobkin, #
69
(1995) | | Independent Consultant since prior to 2006. Formerly, President of Save Venice, Inc. (preservation organization) from 2001-2002, Senior Advisor from June 1999-June 2000 and President of Historic Hudson Valley (historic preservation) from December 1989-May 1999. Previously, Director of the National Academy of Design. He has served as a director or trustee of various AllianceBernstein Funds since 1992, and as Chairman of the Audit Committees of a number of such Funds from 2001-2008. | | | 102 | | | None |
| | | | |
| ALLIANCEBERNSTEIN UNCONSTRAINED BOND FUND • | | | 79 | |
Management of the Fund
| | | | | | | | |
NAME,
ADDRESS*, AGE,
(FIRST YEAR ELECTED**) | | PRINCIPAL
OCCUPATION(S)
DURING PAST FIVE YEARS
AND OTHER RELEVANT
QUALIFICATIONS*** | | PORTFOLIOS
IN FUND
COMPLEX
OVERSEEN BY
DIRECTOR | | | OTHER
DIRECTORSHIPS
HELD BY
DIRECTOR IN THE
PAST FIVE YEARS |
DISINTERESTED DIRECTORS
(continued) | | | | | | |
Michael J. Downey, #
67
(2005) | | Private Investor since prior to 2006. Formerly, managing partner of Lexington Capital, LLC (investment advisory firm) from December 1997 until December 2003. From 1987 until 1993, Chairman and CEO of Prudential Mutual Fund Management, director of the Prudential Mutual funds, and member of the Executive Committee of Prudential Securities, Inc. He has served as a director or trustee of the AllianceBernstein Funds since 2005 and is a director of two other registered investment companies (and Chairman of one of them). | | | 102 | | | Asia Pacific Fund, Inc. and The Merger Fund since prior to 2006 and Prospect Acquisition Corp. (financial services) since 2007 until 2009 |
| | | | | | | | |
D. James Guzy, #
75
(2005) | | Chairman of the Board of PLX Technology (semi-conductors) and of SRC Computers Inc., with which he has been associated since prior to 2006. He was a director of Intel Corporation (semi-conductors) from 1969 until 2008 and served as Chairman of the Finance Committee of such company for several years until May 2008. He has served as a director or trustee of one or more of the AllianceBernstein Funds since 1982. | | | 102 | | | Cirrus Logic Corporation (semi-conductors) and PLX Technology (semi-conductors) since prior to 2006 and Intel Corporation (semi-conductors) since prior to 2006 until 2008 |
| | |
| 80 | | • ALLIANCEBERNSTEIN UNCONSTRAINED BOND FUND |
Management of the Fund
| | | | | | | | |
NAME,
ADDRESS*, AGE,
(FIRST YEAR ELECTED**) | | PRINCIPAL
OCCUPATION(S)
DURING PAST FIVE YEARS
AND OTHER RELEVANT
QUALIFICATIONS*** | | PORTFOLIOS
IN FUND
COMPLEX
OVERSEEN BY
DIRECTOR | | | OTHER
DIRECTORSHIPS
HELD BY
DIRECTOR IN THE
PAST FIVE YEARS |
DISINTERESTED DIRECTORS
(continued) | | | | | | |
Nancy P. Jacklin, #
63
(2006) | | Professorial Lecturer at the Johns Hopkins School of Advanced International Studies since 2008. Formerly, U.S. Executive Director of the International Monetary Fund (December 2002-May 2006); Partner, Clifford Chance (1992-2002); Sector Counsel, International Banking and Finance, and Associate General Counsel, Citicorp (1985-1992); Assistant General Counsel (International), Federal Reserve Board of Governors (1982-1985); and Attorney Advisor, U.S. Department of the Treasury (1973-1982). Member of the Bar of the District of Columbia and of New York; and member of the Council on Foreign Relations. She has served as a director or trustee of the AllianceBernstein Funds since 2006. | | | 102 | | | None |
| | | | |
| ALLIANCEBERNSTEIN UNCONSTRAINED BOND FUND • | | | 81 | |
Management of the Fund
| | | | | | | | |
NAME,
ADDRESS*, AGE,
(FIRST YEAR ELECTED**) | | PRINCIPAL
OCCUPATION(S)
DURING PAST FIVE YEARS
AND OTHER RELEVANT
QUALIFICATIONS*** | | PORTFOLIOS
IN FUND
COMPLEX
OVERSEEN BY
DIRECTOR | | | OTHER
DIRECTORSHIPS
HELD BY
DIRECTOR IN THE
PAST FIVE YEARS |
DISINTERESTED DIRECTORS
(continued) | | | | | | |
Garry L. Moody, # 59 (2008) | | Independent Consultant. Formerly, Partner, Deloitte & Touche LLP (1995-2008) where he held a number of senior positions, including Vice Chairman, and U.S. and Global Investment Management Practice Managing Partner; President, Fidelity Accounting and Custody Services Company (1993-1995); and Partner, Ernst & Young LLP (1975-1993), where he served as the National Director of Mutual Fund Tax Services. He is also a member of the Governing Council of the Independent Directors Council (IDC), an organization of independent directors of mutual funds. He has served as a director or trustee, and as Chairman of the Audit Committee, of most of the AllianceBernstein Funds since 2008. | | | 102 | | | None |
| | |
| 82 | | • ALLIANCEBERNSTEIN UNCONSTRAINED BOND FUND |
Management of the Fund
| | | | | | | | |
NAME,
ADDRESS*, AGE,
(FIRST YEAR ELECTED**) | | PRINCIPAL
OCCUPATION(S)
DURING PAST FIVE YEARS
AND OTHER RELEVANT
QUALIFICATIONS*** | | PORTFOLIOS
IN FUND
COMPLEX
OVERSEEN BY
DIRECTOR | | | OTHER
DIRECTORSHIPS
HELD BY
DIRECTOR IN THE
PAST FIVE YEARS |
DISINTERESTED DIRECTORS
(continued) | | | | | | |
Marshall C. Turner, Jr., #
70
(2005) | | Private Investor since prior to 2006. Interim CEO of MEMC Electronic Materials, Inc. (semi-conductor and solar cell substrates) from November 2008 until March 2009. He was Chairman and CEO of Dupont Photomasks, Inc. (components of semi-conductor manufacturing), 2003-2005, and President and CEO, 2005-2006, after the company was acquired and renamed Toppan Photomasks, Inc. He has extensive experience in venture capital investing including prior service as general partner of three institutional venture capital partnerships, and serves on the boards of a number of education and science-related non-profit organizations. He has served as a director or trustee of one or more of the AllianceBernstein Funds since 1992. | | | 102 | | | Xilinx, Inc. (programmable logic semi-conductors) and MEMC Electronic Materials, Inc. (semi-conductor and solar cell substrates) since prior to 2006 |
| | | | | | | | |
Earl D. Weiner, #
72
(2007) | | Of Counsel, and Partner prior to January 2007, of the law firm Sullivan & Cromwell LLP and member of ABA Federal Regulation of Securities Committee Task Force to draft editions of the Fund Director’s Guidebook. He also serves as a director or trustee of various non-profit organizations and has served as Chairman or Vice Chairman of a number of them. He has served as a director or trustee of the AllianceBernstein Funds since 2007 and is Chairman of the Governance and Nominating Committees of most of the Funds. | | | 102 | | | None |
| | | | |
| ALLIANCEBERNSTEIN UNCONSTRAINED BOND FUND • | | | 83 | |
Management of the Fund
| * | | The address for each of the Fund’s disinterested Directors is c/o AllianceBernstein L.P., Attention: Philip L. Kirstein, 1345 Avenue of the Americas, New York, NY 10105. |
| ** | | There is no stated term of office for the Fund’s Directors. |
| *** | | The information above includes each Director’s principal occupation during the last five years and other information relating to the experience, attributes, and skills relevant to each Director’s qualifications to serve as a Director, which led to the conclusion that each Director should serve as a Director for the Fund. |
| † | | Mr. Keith is an “interested person” of the Fund, as defined in the 1940 Act, due to his position as a Senior Vice President of the Adviser. |
| # | | Member of the Audit Committee, the Governance and Nominating Committee and the Independent Directors Committee. |
| ## | | Member of the Fair Value Pricing Committee. |
| | |
| 84 | | • ALLIANCEBERNSTEIN UNCONSTRAINED BOND FUND |
Management of the Fund
Officer Information
Certain information concerning the Fund’s Officers is listed below.
| | | | |
NAME, ADDRESS*
AND AGE | | POSITION(S)
HELD WITH FUND | | PRINCIPAL OCCUPATION
DURING PAST 5 YEARS |
Robert M. Keith 51 | | President and Chief Executive Officer | | See biography above. |
| | | | |
Philip L. Kirstein 66 | | Senior Vice President and Independent Compliance Officer | | Senior Vice President and Independent Compliance Officer of the AllianceBernstein Funds, with which he has been associated since October 2004. Prior thereto, he was Of Counsel to Kirkpatrick & Lockhart, LLP from October 2003 to October 2004, and General Counsel of Merrill Lynch Investment Managers, L.P. since prior to March 2003. |
| | | | |
Paul J. DeNoon 49 | | Vice President | | Senior Vice President of the Adviser**, with which he has been associated since prior to 2006. |
| | | | |
Joel J. McKoan 53 | | Vice President | | Senior Vice President of the Adviser**, with which he has been associated since prior to 2006. |
| | | | |
Michael L. Mon 42 | | Vice President | | Vice President of the Adviser**, with which he has been associated since prior to 2006. |
| | | | |
Douglas J. Peebles 46 | | Vice President | | Senior Vice President of the Adviser**, with which he has been associated since prior to 2006. |
| | | | |
Matthew S. Sheridan 36 | | Vice President | | Vice President of the Adviser**, with which he has been associated since prior to 2006. |
| | | | |
Emilie D. Wrapp 56 | | Secretary | | Senior Vice President, Assistant General Counsel and Assistant Secretary of ABI**, with which she has been associated since prior to 2006. |
| | | | |
Joseph J. Mantineo 52 | | Treasurer and Chief Financial Officer | | Senior Vice President of AllianceBernstein Investor Services, Inc. (“ABIS”)**, with which he has been associated since prior to 2006. |
| | | | |
Stephen M. Woetzel 40 | | Controller | | Vice President of ABIS**, with which he has been associated since prior to 2006. |
| * | | The address for each of the Fund’s Officers is 1345 Avenue of the Americas, New York, NY 10105. |
| ** | | The Adviser, ABI and ABIS are affiliates of the Fund. |
| | | The Fund’s Statement of Additional Information (SAI) has additional information about the Fund’s Directors and Officers and is available without charge upon request. Contact your financial representative or AllianceBernstein at (800) 227-4618, or visit www.alliancebernstein.com, for a free prospectus or SAI. |
| | | | |
| ALLIANCEBERNSTEIN UNCONSTRAINED BOND FUND • | | | 85 | |
Management of the Fund
THE FOLLOWING IS NOT PART OF THE SHAREHOLDER REPORT OR THE FINANCIAL STATEMENTS
SUMMARY OF SENIOR OFFICER’S EVALUATION OF INVESTMENT ADVISORY AGREEMENT1
The following is a summary of the evaluation of the Investment Advisory Agreement between AllianceBernstein L.P. (the “Adviser”) and The AllianceBernstein Unconstrained Bond Fund2 (the “Fund”),3 prepared by Philip L. Kirstein, the Senior Officer of the Fund for the Directors of the Fund, as required by the August 2004 agreement between the Adviser and the New York State Attorney General (the “NYAG”). The Senior Officer’s evaluation of the Investment Advisory Agreement is not meant to diminish the responsibility or authority of the Board of Directors to perform its duties pursuant to Section 15 of the Investment Company Act of 1940 (the “40 Act”) and applicable state law. The purpose of the summary is to provide shareholders with a synopsis of the independent evaluation of the reasonableness of the advisory fees proposed to be paid by the Fund which was provided to the Directors in connection with their review of the proposed approval of the continuance of the Investment Advisory Agreement.
The Senior Officer’s evaluation considered the following factors:
| | 1. | Advisory fees charged to institutional and other clients of the Adviser for like services; |
| | 2. | Advisory fees charged by other mutual fund companies for like services; |
| | 3. | Costs to the Adviser and its affiliates of supplying services pursuant to the advisory agreement, excluding any intra-corporate profit; |
| | 4. | Profit margins of the Adviser and its affiliates from supplying such services; |
| | 5. | Possible economies of scale as the Fund grows larger; and |
| | 6. | Nature and quality of the Adviser’s services including the performance of the Fund. |
These factors, with the exception of the first factor, are generally referred to as the “Gartenberg factors,” which were articulated by the United States Court of Appeals for the Second Circuit in 1982. Gartenberg v. Merrill Lynch Asset Management, Inc., 694 F. 2d 923 (2d Cir. 1982). On March 30, 2010, the
| 1 | | The information in the fee evaluation was completed on October 20, 2011 and discussed with the Board of Directors on November 1-3, 2011. |
| 2 | | Prior to February 3, 2011, the Fund was known as AllianceBernstein Diversified Yield Fund, Inc. |
| 3 | | Future references to the Fund do not include “AllianceBernstein.” References in the fee summary pertaining to performance and expense ratios refer to Class A shares of the Fund. |
| | |
| 86 | | • ALLIANCEBERNSTEIN UNCONSTRAINED BOND FUND |
Supreme Court held the Gartenberg decision was correct in its basic formulation of what §36(b) requires: to face liability under §36(b), “an investment adviser must charge a fee that is so disproportionately large that it bears no reasonable relationship to the services rendered and could not have been the product of arm’s length bargaining.” Jones v. Harris Associates L.P., 130 S. Ct. 1418 (2010). In Jones, the Court stated the Gartenberg approach fully incorporates the correct understanding of fiduciary duty within the context of section 36(b) and noted with approval that “Gartenberg insists that all relevant circumstances be taken into account” and “uses the range of fees that might result from arm’s length bargaining as the benchmark for reviewing challenged fees.”4
ADVISORY FEES, NET ASSETS, & EXPENSE RATIOS
The Adviser proposed that the Fund pay the advisory fee set forth in the table below for receiving the services to be provided pursuant to the Investment Advisory Agreement. The fee schedule below, implemented in January 2004 in consideration of the Adviser’s settlement with the NYAG in December 2003, is based on a master schedule that contemplates eight categories of funds with almost all funds in each category having the same advisory fee schedule.5 Also shown are the Fund’s net assets on September 30, 2011.
| | | | | | |
| Category | | Advisory Fee6 | | September 30, 2011 Net Assets
($MM) | |
| High Income | | 50 bp on 1st $2.5 billion 45 bp on next $2.5 billion 40 bp on the balance | | $ | 99.9 | |
The Fund’s Investment Advisory Agreement provides for the Adviser to be reimbursed for certain clerical, legal, accounting, administrative and other services provided to the Fund. During the Fund’s most recently completed fiscal year, the Adviser received $88,288 (0.11% of the Fund’s average daily net assets) for providing such services.
The Adviser has agreed to waive that portion of its advisory fees and/or reimburse the Fund for that portion of the Fund’ total operating expenses to the degree necessary to limit the Fund’s expense ratio to the amounts set forth below for the Fund’s current fiscal year. The waiver agreement is terminable by the Adviser at the end of the Fund’ fiscal year upon at least 60 days written
| 4 | | Jones v. Harris at 1427. |
| 5 | | Most of the AllianceBernstein Mutual Funds, which the Adviser manages, were affected by the Adviser’s settlement with the NYAG. |
| 6 | | The advisory fees are based on the Fund’s average daily adjusted total assets (i.e. the average daily value of total assets minus the sum of accrued liabilities other than the principal amount of money borrowed). |
| | | | |
| ALLIANCEBERNSTEIN UNCONSTRAINED BOND FUND • | | | 87 | |
notice. In addition, set forth below are the gross expense ratios of the Fund, annualized for the most recent semi-annual period:7
| | | | | | | | | | | | |
| Fund | | Expense Cap Pursuant to
Expense Limitation
Undertaking | | | Gross Expense
Ratio (4/30/11)8 | | | Fiscal
Year End |
| Unconstrained Bond Fund, Inc. | | Advisor Class A Class B Class C Class R Class K Class I | |
| 0.60
0.90 1.60 1.60 1.10 0.85 0.60 | %
% % % % % % | |
| 1.07
1.41 2.18 2.12 1.77 1.48 1.17 | %
% % % % % % | | October 31 |
| I. | ADVISORY FEES CHARGED TO INSTITUTIONAL AND OTHER CLIENTS. |
The advisory fees charged to investment companies which the Adviser manages and sponsors are normally higher than those charged to similar sized institutional accounts, including pension plans and sub-advised investment companies. The fee differential reflects, among other things, different services provided to such clients, and different liabilities assumed. Services provided by the Adviser to the Fund that are not provided to non-investment company clients and sub-advised investment companies include providing office space and personnel to serve as Fund Officers, who among other responsibilities make the certifications required under the Sarbanes-Oxley Act of 2002, and coordinating with and monitoring the Fund’s third party service providers such as Fund counsel, auditors, custodians, transfer agents and pricing services. The accounting, administrative, legal and compliance requirements for the Fund are more costly than those for institutional assets due to the greater complexities and time required for investment companies, although as previously noted, the Adviser is reimbursed for providing some of these services. Also, retail mutual funds managed by the Adviser are widely held. Servicing the Fund’ investors is more time consuming and labor intensive compared to institutional clients since the Adviser needs to communicate with a more extensive network of financial intermediaries and shareholders. The Adviser also believes that it incurs substantial entrepreneurial risk when offering a new mutual fund since establishing a new mutual fund requires a large upfront investment and it may take a long time for the fund to achieve profitability since the fund must be priced to scale from inception in order to be competitive and assets are acquired one account at a time. In addition, managing the cash flow of an investment company may be more difficult than managing that of a stable pool of assets, such as an institutional account with little cash movement in either direction, particularly, if a fund is in net redemption and the Adviser is frequently forced to sell securities to raise cash for redemptions. However, managing a fund with positive cash flow may be easier at times than managing a stable pool of assets. Finally, in recent
| 7 | | Semi-annual total expense ratios are unaudited. |
| | |
| 88 | | • ALLIANCEBERNSTEIN UNCONSTRAINED BOND FUND |
years, investment advisers have been sued by institutional clients and have suffered reputational damage both by the attendant publicity and outcomes other than complete victories. Accordingly, the legal and reputational risks associated with institutional accounts are greater than previously thought, although still not equal to those related to the mutual fund industry.
Notwithstanding the Adviser’s view that managing an investment company is not comparable to managing other institutional accounts because the services provided are different, the Supreme Court has indicated consideration should be given to the advisory fees charged to institutional accounts with a similar investment style as the Fund.9 In addition to the AllianceBernstein Institutional fee schedule, set forth below is what would have been the effective advisory fee of the Fund had the AllianceBernstein Institutional fee schedule been applicable to the Fund versus the Fund’s advisory fee based on September 30, 2011 net assets.10
| | | | | | | | | | | | |
| Fund | | Net Assets 9/30/11 ($MM) | | | AllianceBernstein
Institutional Fee Schedule | | Effective
AB Inst.
Adv. Fee (%) | | | Fund Advisory Fee (%) |
| Unconstrained Bond Fund, Inc. | | | $99.9 | | | Diversified Yield Schedule 40 bp on 1st $50 million 25 bp on the balance Minimum account size: $50m | | | 0.325% | | | 0.500% |
The Adviser represented that it does not sub-advise any registered investment companies of other fund families with a substantially similar investment style as the Fund.
| II. | MANAGEMENT FEES CHARGED BY OTHER MUTUAL FUND COMPANIES FOR LIKE SERVICES. |
Lipper, Inc. (“Lipper”), an analytical service that is not affiliated with the Adviser, compared the fees charged to the Fund with fees charged to other investment companies for similar services offered by other investment advisers.11
| 9 | | The Supreme Court stated that “courts may give such comparisons the weight that they merit in light of the similarities and differences between the services that the clients in question require, but the courts must be wary of inapt comparisons.” Among the significant differences the Supreme Court noted that may exist between services provided to mutual funds and institutional accounts are “higher marketing costs.” Jones v. Harris at 1428. |
| 10 | | The Adviser has indicated that with respect to institutional accounts with assets greater than $300 million, it will negotiate a fee schedule. Discounts that are negotiated vary based upon each client relationship. |
| 11 | | The Supreme Court cautioned against accepting mutual fund fee comparisons without careful scrutiny since “these comparisons are problematic because these fees, like those challenged, may not be the product of negotiations conducted at arm’s length.” Jones v. Harris at 1429. |
| | | | |
| ALLIANCEBERNSTEIN UNCONSTRAINED BOND FUND • | | | 89 | |
Lipper’s analysis included the comparison of the Fund’s contractual management fee, estimated at the approximate current asset level of the Fund, to the median of the Fund’s Lipper Expense Group (“EG”)12 and the Fund’s contractual management fee ranking.13
Lipper describes an EG as a representative sample of comparable funds. Lipper’s standard methodology for screening funds to be included in an EG entails the consideration of several fund criteria, including fund type, investment classification/objective, load type and similar 12b-1/non-12b-1 service fees, asset (size) comparability, expense components and attributes. An EG will typically consist of seven to twenty funds.
| | | | | | | | | | | | |
| Fund | | Contractual
Management Fee (%)14 | | | Lipper Exp. Group Median (%) | | | Lipper
Group Rank | |
| Unconstrained Bond Fund, Inc. | | | 0.500 | | | | 0.600 | | | | 2/11 | |
Lipper also compared the Fund’s total expense ratio to the medians of the Fund’s EG and Lipper Expense Universe (“EU”). The EU is a broader group compared to the EG, consisting of all funds that have the same investment classifications/objective and load type as the subject Fund.
| | | | | | | | | | | | | | | | | | | | |
| Fund | | Expense Ratio (%)15 | | | Lipper Exp. Group
Median (%) | | | Lipper Group Rank | | | Lipper Exp. Universe Median (%) | | | Lipper
Universe Rank | |
| Unconstrained Bond Fund, Inc. | | | 0.899 | | | | 1.149 | | | | 2/11 | | | | 1.026 | | | | 5/33 | |
Based on this analysis, the Fund has equally favorable rankings on a management fee basis and on a total expense basis.
| 12 | | Lipper does not consider average account size when constructing EGs. Funds with relatively small average account sizes tend to have higher transfer agent expense ratio than comparable sized funds that have relatively large average account sizes. Note that there are limitations on Lipper expense category data because different funds categorize expenses differently. |
| 13 | | The contractual management fee is calculated by Lipper using the Fund’s contractual management fee rate at a hypothetical asset level. The hypothetical asset level is based on the combined net assets of all classes of the Fund, rounded up to the next $25 million. Lipper’s total expense ratio information is based on the most recent annual report except as otherwise noted. A ranking of “1” would mean that the Fund had the lowest effective fee rate in the Lipper peer group. |
| 14 | | The contractual management fee does not reflect any expense reimbursements made by the Fund to the Adviser for certain clerical, legal, accounting, administrative, and other services. In addition, the contractual management fee does not reflect any advisory fee waivers or expense reimbursements made by the Adviser that would effectively reduce the actual effective management fee. |
| 15 | | Most recently completed fiscal year Class A share total expense ratio. |
| | |
| 90 | | • ALLIANCEBERNSTEIN UNCONSTRAINED BOND FUND |
| III. | COSTS TO THE ADVISER AND ITS AFFILIATES OF SUPPLYING SERVICES PURSUANT TO THE MANAGEMENT FEE ARRANGEMENT, EXCLUDING ANY INTRA-CORPORATE PROFIT. |
The Adviser utilizes two profitability reporting systems, which operate independently but are aligned with each other, to estimate the Adviser’s profitability in connection with investment advisory services provided to the Fund. The Senior Officer has retained a consultant to provide independent advice regarding the alignment of the two profitability systems as well as the methodologies and allocations utilized by both profitability systems. See Section IV for additional discussion.
| IV. | PROFIT MARGINS OF THE ADVISER AND ITS AFFILIATES FOR SUPPLYING SUCH SERVICES. |
The Fund’s profitability information, prepared by the Adviser for the Board of Directors, was reviewed by the Senior Officer and the consultant. The Adviser’s profitability from providing investment advisory services to the Fund was less negative during calendar year 2010, relative to 2009.
In addition to the Adviser’s direct profits from managing the Fund, certain of the Adviser’s affiliates have business relationships with the Fund and may earn a profit from providing other services to the Fund. The courts have referred to this type of business opportunity as “fall-out benefits” to the Adviser and indicated that such benefits should be factored into the evaluation of the total relationship between the Fund and the Adviser. Neither case law nor common business practice precludes the Adviser’s affiliates from earning a reasonable profit on this type of relationship provided the affiliates’ charges and services are competitive and the relationship otherwise complies with the 40 Act restrictions. These affiliates provide transfer agent and distribution services to the Fund and receive transfer agent fees, Rule 12b-1 payments, front-end sales loads and contingent deferred sales charges (“CDSC”).
AllianceBernstein Investments, Inc. (“ABI”), an affiliate of the Adviser, is the Fund’s principal underwriter. ABI and the Adviser have disclosed in the Fund’s prospectus that they may make revenue sharing payments from their own resources, in addition to resources derived from sales loads and Rule 12b-1 fees, to firms that sell shares of the Fund. In 2010, ABI paid approximately 0.04% of the average monthly assets of the AllianceBernstein Mutual Funds or approximately $13.8 million for distribution services and educational support (revenue sharing payments).
During the Fund’s most recently completed fiscal year, ABI received from the Fund $3,898, $323,331 and $9,893 in front-end sales charges, Rule 12b-1 and CDSC fees, respectively.
| | | | |
| ALLIANCEBERNSTEIN UNCONSTRAINED BOND FUND • | | | 91 | |
Fees and reimbursements for out of pocket expenses charged by AllianceBernstein Investor Services, Inc. (“ABIS”), the affiliated transfer agent for the Fund, are based on the level of the network account and the class of shares held by the account. ABIS also receives a fee per shareholder sub-account for each account maintained by an intermediary on an omnibus basis. ABIS received $42,536 in net fees from the Fund during the Fund’s most recently completed fiscal year:
| V. | POSSIBLE ECONOMIES OF SCALE. |
The Adviser has indicated that economies of scale are being shared with shareholders through fee structures,16 subsidies and enhancement to services. Based on some of the professional literature that has considered economies of scale in the mutual fund industry, it is thought that to the extent economies of scale exist, they may more often exist across a fund family as opposed to a specific fund. This is because the costs incurred by the Adviser, such as investment research or technology for trading or compliance systems can be spread across a greater asset base as the fund family increases in size. It is also possible that as the level of services required to operate a successful investment company has increased over time, and advisory firms make such investments in their business to provide services, there may be a sharing of economies of scale without a reduction in advisory fees.
In February 2008, an independent consultant, retained by the Senior Officer, provided the Board of Directors an update of the Deli17 study on advisory fees and various fund characteristics.18 The independent consultant first reiterated the results of his previous two dimensional comparison analysis (fund size and family size) with the Board of Directors.19 The independent consultant then discussed the results of the regression model that was utilized to study the effects of various factors on advisory fees. The regression model output indicated that the bulk of the variation in fees predicted were explained by various factors, but substantially by fund AUM, family AUM, index fund indicator and investment style. The independent consultant also compared the advisory fees of the
| 16 | | Fee structures include fee reductions, pricing at scale and breakpoints in advisory fee schedules. |
| 17 | | The Deli study, originally published in 2002 based on 1997 data and updated for the February 2008 Presentation, may be of diminished value due to the age of the data used in the presentation and the changes experienced in the industry over the last four years. |
| 18 | | As mentioned previously, the Supreme Court cautioned against accepting mutual fund fee comparisons without careful scrutiny since the fees may not be the product of negotiations conducted at arm’s length. See Jones V. Harris at 1429. |
| 19 | | The two dimensional analysis showed patterns of lower advisory fees for funds with larger asset sizes and funds from larger family sizes compared to funds with smaller asset sizes and funds from smaller family sizes, which according to the independent consultant is indicative of a sharing of economies of scale and scope. However, in less liquid and active markets, such is not the case, as the empirical analysis showed potential for diseconomies of scale in those markets. The empirical analysis also showed diminishing economies of scale and scope as funds surpassed a certain high level of assets. |
| | |
| 92 | | • ALLIANCEBERNSTEIN UNCONSTRAINED BOND FUND |
AllianceBernstein Mutual Funds to similar funds managed by 19 other large asset managers, regardless of the fund size and each Adviser’s proportion of mutual fund assets to non-mutual fund assets.
| VI. | NATURE AND QUALITY OF THE ADVISER’S SERVICES, INCLUDING THE PERFORMANCE OF THE FUND. |
With assets under management of approximately $402 billion as of September 30, 2011, the Adviser has the investment experience to manage and provide non-investment services (described in Section I) to the Fund.
The information prepared by Lipper shows the 1, 3, 5 and 10 year performance rankings20 of the Fund relative to its Lipper Performance Group (“PG”) and Lipper Performance Universe (“PU”)21 for the periods ended July 31, 2011.22
| | | | | | | | | | | | | | | | | | | | |
| | | Fund Return (%) | | | PG Median (%) | | | PU Median (%) | | | PG Rank | | | PU Rank | |
| Unconstrained Bond Fund, Inc. | | | | | | | | | | | | | | | | | | | | |
1 year | | | 4.51 | | | | 7.59 | | | | 8.65 | | | | 10/11 | | | | 33/37 | |
3 year | | | 4.02 | | | | 8.71 | | | | 9.46 | | | | 9/10 | | | | 31/32 | |
5 year | | | 3.67 | | | | 6.65 | | | | 7.43 | | | | 6/7 | | | | 24/25 | |
10 year | | | 5.14 | | | | 6.73 | | | | 7.80 | | | | 5/5 | | | | 22/22 | |
Set forth below are the 1, 3, 5 and 10 year and since inception performance returns of the Fund (in bold)23 versus its benchmarks.24 Fund and benchmark volatility and reward-to-variability ratio (“Sharpe Ratio”) information is also shown.25
| 20 | | The performance returns and rankings of the Fund are for the Fund’ Class A shares. It should be noted that performance returns of the Fund were provided by Lipper. |
| 21 | | The Fund’s PG is identical to the Fund’s EG. The Fund’s PU is not identical to the Fund’s EU as the criteria for including/excluding a fund from a PU is somewhat different from that of an EU. |
| 22 | | The current Lipper investment classification/objective dictates the PG and PU throughout the life of the Fund even if a Fund had a different investment classification/objective at a different point in time. |
| 23 | | The performance returns and risk measures shown in the table are for the Class A shares of the Fund. |
| 24 | | The Adviser provided Fund and benchmark performance return information for periods through July 31, 2011. |
| 25 | | Fund and benchmark volatility and Sharpe Ratio information was obtained through Lipper LANA, a database maintained by Lipper. Volatility is a statistical measure of the tendency of a market price or yield to vary over time. A Sharpe Ratio is a risk adjusted measure of return that divides a fund’s return in excess of the riskless return by the fund’s standard deviation. A fund with a greater volatility would be viewed as more risky than a fund with equivalent performance but lower volatility; for that reason, a greater return would be demanded for the more risky fund. A fund with a higher Sharpe Ratio would be regarded as better performing than a fund with a lower Sharpe Ratio. |
| | | | |
| ALLIANCEBERNSTEIN UNCONSTRAINED BOND FUND • | | | 93 | |
| | | | | | | | | | | | | | | | | | | | | | | | | | | | | | | | |
| | | Periods Ending July 31, 2011 | |
| | | Annualized Performance | | | Since
Inception
(%) | | | Annualized | | | Risk Period (Year) | |
| | | 1 Year
(%) | | | 3 Year
(%) | | | 5 Year
(%) | | | 10 Year
(%) | | | | Volatility (%) | | | Sharpe (%) | | |
| Unconstrained Bond Fund, Inc. | | | 4.51 | | | | 3.94 | | | | 3.62 | | | | 5.11 | | | | 6.24 | | | | 5.89 | | | | 0.52 | | | | 10 | |
| Bank of America Merrill Lynch 3-Month U.S. Treasury Bill Index | | | 0.14 | | | | 0.36 | | | | 1.91 | | | | 2.09 | | | | N/A | | | | 0.52 | | | | N/A | | | | 10 | |
| Barclays Capital Global Aggregate Bond Index (USD hedged) | | | 2.39 | | | | 5.71 | | | | 5.29 | | | | 4.96 | | | | N/A | | | | | | | | | | | | | |
| Inception Date: January 9, 1996 | | | | | | | | | | | | | |
CONCLUSION:
Based on the factors discussed above the Senior Officer’s conclusion is that the proposed advisory fee for the Fund is reasonable and within the range of what would have been negotiated at arm’s length in light of all the surrounding circumstances. This conclusion in respect of the Fund is based on an evaluation of all of these factors and no single factor was dispositive.
Dated: November 28, 2011
| | |
| 94 | | • ALLIANCEBERNSTEIN UNCONSTRAINED BOND FUND |
THIS PAGE IS NOT PART OF THE SHAREHOLDER REPORT OR THE FINANCIAL STATEMENTS
ALLIANCEBERNSTEIN FAMILY OF FUNDS
Wealth Strategies Funds
Balanced Wealth Strategy
Conservative Wealth Strategy
Wealth Appreciation Strategy
Tax-Managed Balanced Wealth Strategy
Tax-Managed Conservative Wealth Strategy
Tax-Managed Wealth Appreciation Strategy
Asset Allocation/Multi-Asset
Emerging Markets Multi-Asset
International Portfolio
Real Asset Strategy
Tax-Managed International Portfolio
Growth Funds
Domestic
Growth Fund
Large Cap Growth Fund
Small Cap Growth Portfolio
Small/Mid Cap Growth Fund
U.S. Strategic Research Portfolio
Global & International
Global Thematic Growth Fund
Greater China ’97 Fund
International Discovery Equity Portfolio
International Focus 40 Portfolio
International Growth Fund
Value Funds
Domestic
Core Opportunities Fund
Equity Income Fund
Growth & Income Fund
Small/Mid Cap Value Fund
Value Fund
Global & International
Global Real Estate Investment Fund
Global Value Fund
International Value Fund
Taxable Bond Funds
Bond Inflation Strategy
Global Bond Fund
High Income Fund
Intermediate Bond Portfolio
Short Duration Portfolio
Unconstrained Bond Fund*
Municipal Bond Funds
| | |
Arizona California High Income Massachusetts Michigan Minnesota Municipal Bond Inflation Strategy | | National New Jersey New York Ohio Pennsylvania Virginia |
Intermediate Municipal Bond Funds
Intermediate California
Intermediate Diversified
Intermediate New York
Closed-End Funds
Alliance California Municipal Income Fund
Alliance New York Municipal Income Fund
AllianceBernstein Global High Income Fund
AllianceBernstein Income Fund
AllianceBernstein National Municipal Income Fund
Alternatives
Market Neutral Strategy-Global
Market Neutral Strategy-U.S.
Balanced
Balanced Shares
Retirement Strategies Funds
| | | | |
2000 Retirement Strategy | | 2020 Retirement Strategy | | 2040 Retirement Strategy |
2005 Retirement Strategy | | 2025 Retirement Strategy | | 2045 Retirement Strategy |
2010 Retirement Strategy | | 2030 Retirement Strategy | | 2050 Retirement Strategy |
2015 Retirement Strategy | | 2035 Retirement Strategy | | 2055 Retirement Strategy |
We also offer Exchange Reserves,** which serves as the money market fund exchange vehicle for the AllianceBernstein mutual funds.
You should consider the investment objectives, risks, charges and expenses of any AllianceBernstein fund/portfolio carefully before investing. For free copies of our prospectuses, which contain this and other information, visit us online at www.alliancebernstein.com or contact your financial advisor. Please read the prospectus carefully before investing.
| * | | Prior to February 3, 2011, Unconstrained Bond Fund was named Diversified Yield Fund. |
| ** | An investment in the Fund is not a deposit in a bank and is not insured or guaranteed by the Federal Deposit Insurance Corporation or any other government agency. Although the Fund seeks to preserve the value of your investment at $1.00 per share, it is possible to lose money by investing in the Fund. |
| | | | |
| ALLIANCEBERNSTEIN UNCONSTRAINED BOND FUND • | | | 95 | |
AllianceBernstein Family of Funds
NOTES
| | |
| 96 | | • ALLIANCEBERNSTEIN UNCONSTRAINED BOND FUND |
ALLIANCEBERNSTEIN UNCONSTRAINED BOND FUND
1345 Avenue of the Americas
New York, NY 10105
800.221.5672
| | |
| |
| UB-0151-1011 | |  |
ITEM 2. CODE OF ETHICS.
(a) The registrant has adopted a code of ethics that applies to its principal executive officer, principal financial officer and principal accounting officer. A copy of the registrant’s code of ethics is filed herewith as Exhibit 12(a)(1).
(b) During the period covered by this report, no material amendments were made to the provisions of the code of ethics adopted in 2(a) above.
(c) During the period covered by this report, no implicit or explicit waivers to the provisions of the code of ethics adopted in 2(a) above were granted.
ITEM 3. AUDIT COMMITTEE FINANCIAL EXPERT.
The registrant’s Board of Directors has determined that independent directors Garry L. Moody and William H. Foulk, Jr. qualify as audit committee financial experts.
ITEM 4. PRINCIPAL ACCOUNTANT FEES AND SERVICES.
(a) - (c) The following table sets forth the aggregate fees billed by the independent registered public accounting firm Ernst & Young LLP, for the Fund’s last two fiscal years for professional services rendered for: (i) the audit of the Fund’s annual financial statements included in the Fund’s annual report to stockholders; (ii) assurance and related services that are reasonably related to the performance of the audit of the Fund’s financial statements and are not reported under (i), which include advice and education related to accounting and auditing issues and quarterly press release review (for those Funds which issue press releases), and preferred stock maintenance testing (for those Funds that issue preferred stock); and (iii) tax compliance, tax advice and tax return preparation.
| | | | | | | | | | | | | | | | |
| | | | | | Audit Fees | | | Audit-Related
Fees | | | Tax Fees | |
AB Unconstrained Bond Fund | | | 2010 | | | $ | 40,000 | | | $ | — | | | $ | 16,971 | |
| | | 2011 | | | $ | 68,000 | | | $ | 295 | | | $ | 17,891 | |
(d) Not applicable.
(e) (1) Beginning with audit and non-audit service contracts entered into on or after May 6, 2003, the Fund’s Audit Committee policies and procedures require the pre-approval of all audit and non-audit services provided to the Fund by the Fund’s independent registered public accounting firm. The Fund’s Audit Committee policies and procedures also require pre-approval of all audit and non-audit services provided to the Adviser and Service Affiliates to the extent that these services are directly related to the operations or financial reporting of the Fund.
(e) (2) All of the amounts for Audit Fees, Audit-Related Fees and Tax Fees in the table under Item 4 (a) – (c) are for services pre-approved by the Fund’s Audit Committee.
(f) Not applicable.
(g) The following table sets forth the aggregate non-audit services provided to the Fund, the Fund’s Adviser and entities that control, are controlled by or under common control with the Adviser that provide ongoing services to the Fund, which include preparing an annual internal control report pursuant to Statement on Auditing Standards No. 70 (“Service Affiliates”):
| | | | | | | | | | | | |
| | | | | | All Fees for
Non-Audit Services
Provided to the
Portfolio, the Adviser
and Service Affiliates | | | Pre-approved by the
Audit Committee
(Portion Comprised of
Audit Related Fees)
(Portion Comprised of
Tax Fees) | |
AB Unconstrained Bond Fund | | | 2010 | | | $ | 709,151 | | | $ | 144,686 | |
| | | | | | | | | | $ | (127,715 | ) |
| | | | | | | | | | $ | (16,971 | ) |
| | | |
| | | 2011 | | | $ | 693,852 | | | $ | 18,186 | |
| | | | | | | | | | $ | (295 | ) |
| | | | | | | | | | $ | (17,891 | ) |
(h) The Audit Committee of the Fund has considered whether the provision of any non-audit services not pre-approved by the Audit Committee provided by the Fund’s independent registered public accounting firm to the Adviser and Service Affiliates is compatible with maintaining the auditor’s independence.
ITEM 5. AUDIT COMMITTEE OF LISTED REGISTRANTS.
Not applicable to the registrant.
ITEM 6. SCHEDULE OF INVESTMENTS.
Please see Schedule of Investments contained in the Report to Shareholders included under Item 1 of this Form N-CSR.
ITEM 7. DISCLOSURE OF PROXY VOTING POLICIES AND PROCEDURES FOR CLOSED-END MANAGEMENT INVESTMENT COMPANIES.
Not applicable to the registrant.
ITEM 8. PORTFOLIO MANAGERS OF CLOSED-END MANAGEMENT INVESTMENT COMPANIES.
Not applicable to the registrant.
ITEM 9. PURCHASES OF EQUITY SECURITIES BY CLOSED-END MANAGEMENT INVESTMENT COMPANY AND AFFILIATED PURCHASERS.
Not applicable to the registrant.
ITEM 10. SUBMISSION OF MATTERS TO A VOTE OF SECURITY HOLDERS.
There have been no material changes to the procedures by which shareholders may recommend nominees to the Fund’s Board of Directors since the Fund last provided disclosure in response to this item.
ITEM 11. CONTROLS AND PROCEDURES.
(a) The registrant’s principal executive officer and principal financial officer have concluded that the registrant’s disclosure controls and procedures (as defined in Rule 30a-3 (c) under the Investment Company Act of 1940, as amended) are effective at the reasonable assurance level based on their evaluation of these controls and procedures as of a date within 90 days of the filing date of this document.
(b) There were no changes in the registrant’s internal controls over financial reporting that occurred during the second fiscal quarter of the period that has materially affected, or is reasonably likely to materially affect, the registrant’s internal control over financial reporting.
ITEM 12. EXHIBITS.
The following exhibits are attached to this Form N-CSR:
| | |
EXHIBIT NO. | | DESCRIPTION OF EXHIBIT |
| 12 (a) (1) | | Code of Ethics that is subject to the disclosure of Item 2 hereof |
| |
| 12 (b) (1) | | Certification of Principal Executive Officer Pursuant to Section 302 of the Sarbanes-Oxley Act of 2002 |
| |
| 12 (b) (2) | | Certification of Principal Financial Officer Pursuant to Section 302 of the Sarbanes-Oxley Act of 2002 |
| |
| 12 (c) | | Certification of Principal Executive Officer and Principal Financial Officer Pursuant to Section 906 of the Sarbanes-Oxley Act of 2002 |
SIGNATURES
Pursuant to the requirements of the Securities Exchange Act of 1934 and the Investment Company Act of 1940, the registrant has duly caused this report to be signed on its behalf by the undersigned, thereunto duly authorized.
(Registrant): AllianceBernstein Unconstrained Bond Fund, Inc.
| | |
| By: | | /s/ Robert M. Keith |
| | Robert M. Keith President |
Date: December 22, 2011
Pursuant to the requirements of the Securities Exchange Act of 1934 and the Investment Company Act of 1940, this report has been signed below by the following persons on behalf of the registrant and in the capacities and on the dates indicated.
| | |
| By: | | /s/ Robert M. Keith |
| | Robert M. Keith President |
Date: December 22, 2011
| | |
| By: | | /s/ Joseph J. Mantineo |
| | Joseph J. Mantineo |
| | Treasurer and Chief Financial Officer |
Date: December 22, 2011