UNITED STATES
SECURITIES AND EXCHANGE COMMISSION
WASHINGTON, D.C. 20549
FORM N-CSR
CERTIFIED SHAREHOLDER REPORT OF REGISTERED
MANAGEMENT INVESTMENT COMPANIES
Investment Company Act file number: 811-07391
ALLIANCEBERNSTEIN UNCONSTRAINED BOND FUND, INC.
(Exact name of registrant as specified in charter)
1345 Avenue of the Americas, New York, New York 10105
(Address of principal executive offices) (Zip code)
Joseph J. Mantineo
AllianceBernstein L.P.
1345 Avenue of the Americas
New York, New York 10105
(Name and address of agent for service)
Registrant’s telephone number, including area code: (800) 221-5672
Date of fiscal year end: October 31, 2012
Date of reporting period: April 30, 2012
Explanatory Note:
The Registrant is filing this Amendment to its Certified Shareholder Report on Form N-CSR filed with the Securities and Exchange Commission on July 5, 2012 to amend Item 1: “Reports to Stockholders”. The purpose of the Amendment is to correct, among other things, certain information in the Fund’s financial statements and in the performance-related sections of the Report. The following pages in the Report have been revised: 2, 6, 7, 9, 10, 12, 15-21, 24-26, 31, 33-36, 40-42, 53, 55, 63-69. Other than the revisions addressed by these pages, this Form N-CSR/A does not reflect events occurring after the filing of the original Form N-CSR.
ITEM 1. REPORTS TO STOCKHOLDERS.
SEMI-ANNUAL REPORT
AllianceBernstein Unconstrained Bond Fund

Semi-Annual Report
Investment Products Offered
|
•Are Not FDIC Insured •May Lose Value •Are Not Bank Guaranteed |
Investors should consider the investment objectives, risks, charges and expenses of the Fund carefully before investing. For copies of our prospectus or summary prospectus, which contain this and other information, visit us online at www.alliancebernstein.com or contact your AllianceBernstein Investments representative. Please read the prospectus and/or summary prospectus carefully before investing.
This shareholder report must be preceded or accompanied by the Fund’s prospectus for individuals who are not current shareholders of the Fund.
You may obtain a description of the Fund’s proxy voting policies and procedures, and information regarding how the Fund voted proxies relating to portfolio securities during the most recent 12-month period ended June 30, without charge. Simply visit AllianceBernstein’s website at www.alliancebernstein.com, or go to the Securities and Exchange Commission’s (the “Commission”) website at www.sec.gov, or call AllianceBernstein at (800) 227-4618.
The Fund files its complete schedule of portfolio holdings with the Commission for the first and third quarters of each fiscal year on Form N-Q. The Fund’s Forms N-Q are available on the Commission’s website at www.sec.gov. The Fund’s Forms N-Q may also be reviewed and copied at the Commission’s Public Reference Room in Washington, DC; information on the operation of the Public Reference Room may be obtained by calling (800) SEC-0330. AllianceBernstein publishes full portfolio holdings for the Fund monthly at www.alliancebernstein.com.
AllianceBernstein Investments, Inc. (ABI) is the distributor of the AllianceBernstein family of mutual funds. ABI is a member of FINRA and is an affiliate of AllianceBernstein L.P., the manager of the funds.
AllianceBernstein® and the AB Logo are registered trademarks and service marks used by permission of the owner, AllianceBernstein L.P.
June 26, 2012
Semi-Annual Report
This report provides management’s discussion of fund performance for AllianceBernstein Unconstrained Bond Fund (the “Fund”) for the semi-annual reporting period ended April 30, 2012.
Investment Objective and Policies
The Fund’s investment objective is to generate income consistent with preservation of capital. The Fund invests, under normal circumstances, at least 80% of its net assets in fixed-income securities and derivatives related to fixed-income securities. The Fund employs a dynamic risk allocation, meaning that the Fund’s risk profile may vary significantly over time based upon market conditions. The Fund invests in a portfolio of fixed-income securities of U.S. and non-U.S. companies and U.S. and non-U.S. Government securities and supranational entities, including lower-rated securities.
The Fund may invest in debt securities with a range of maturities from short- to long-term. The Fund expects that its average portfolio duration will vary normally from negative 3 years to positive 7 years, depending upon AllianceBernstein L.P.’s (the “Adviser’s”) forecast of interest rates and assessment of market risks generally. Duration is a measure of a fixed-income security’s sensitivity to changes in interest rates. The value of a fixed-income security with positive duration will decline if interest rates increase. Conversely, the value of a fixed-income security with negative duration will increase as interest rates increase.
The Fund will seek to achieve negative duration through the use of derivatives, such as futures and total return swaps. The Adviser selects securities for purchase or sale based on its assessment of the securities’ risk and return characteristics as well as the securities’ impact on the overall risk and return characteristics of the Fund. In making this assessment, the Adviser takes into account various factors, including the credit quality and sensitivity to interest rates of the securities under consideration and of the Fund’s other holdings.
The Fund typically maintains at least 50% of its net assets in investment grade securities. The Fund may invest up to 50% of its net assets in below investment grade securities, such as corporate high-yield fixed-income securities, sovereign debt obligations and fixed-income securities of issuers located in emerging markets. The Fund may also invest in mortgage-related and other asset-backed securities, loan participations, inflation-protected securities, structured securities, variable, floating, and inverse floating rate instruments and preferred stock, and may use other investment techniques. The Fund may make short sales of securities or currencies or maintain a short position. The Fund may use borrowings or other leverage for investment purposes. The Fund intends, among other things, to enter into transactions such as reverse repurchase agreements and dollar rolls. The Fund may invest, without limit, in derivatives, such as options, futures, forwards, or swaps.
| | | | |
| ALLIANCEBERNSTEIN UNCONSTRAINED BOND FUND • | | | 1 | |
Investment Results
The table on page 6 shows the Fund’s performance compared with its benchmark, the Bank of America Merrill Lynch (“BofA ML”) 3-Month U.S. T-Bill Index, and the Barclays Capital (“BC”) Global Aggregate Bond Index (U.S. dollar hedged), for the six- and 12-month periods ended April 30, 2012. The Fund’s Class A shares provided solid positive absolute returns and outperformed the benchmark for both periods, before sales charges. The Fund’s Class A shares outperformed the BC Global Aggregate Bond Index (U.S. dollar hedged) for the six-month period, and underperformed for the 12-month period, before sales charges. For the six-month period, exposure to spread product—specifically commercial mortgage-backed securities (“CMBS”), emerging market debt, investment-grade corporates and high yield corporates—all contributed positively. Exposure to European government securities detracted as the sovereign debt crisis impacted that region.
For the 12-month period, U.S. interest rate exposure was a significant positive, as U.S. Treasury yields declined as risk aversion rose. Conversely, spread exposure mostly detracted. Exposure to investment-grade corporates, high yield corporates, sovereigns and emerging market debt all detracted, as investors were more risk-averse earlier in the period. Exposure to euro-area governments detracted. Positions in inflation-linked securities also detracted as inflation remained subdued.
During both periods, the Fund utilized derivatives in the form of Treasury
futures and interest rate swaps in order to manage overall duration and yield curve positioning. For both periods, the Fund’s longer-than-benchmark duration exposure was a significant positive as yields declined. As part of the Fund’s credit position, credit default swaps were utilized, contributing positively for both periods. Currency forwards were utilized for hedging back currency on non-U.S. dollar positions and to manage the Fund’s overall currency exposure. The utilization of these derivatives over both periods had an immaterial impact on performance. Both variance swaps and total return swaps were utilized for non-hedging purposes, which had a positive impact on performance for both periods. The Fund also utilized options purchased for hedging and non-hedging purposes, which added to performance for both periods, and options written for non-hedging purposes, which detracted from performance for both periods.
Market Review and Investment Strategy
Volatility continued during the six-month period ended April 30, 2012, as global markets remained highly correlated with headlines emanating from Europe’s ongoing debt crisis. After early bouts of investor risk aversion which drove Treasury yields lower, market sentiment improved in the first quarter of 2012. Global economic data turned more positive, and worries over the euro debt crisis eased with positive policy intervention. In the U.S., labor and manufacturing data showed improvement, resulting in more solid
| | |
| 2 | | • ALLIANCEBERNSTEIN UNCONSTRAINED BOND FUND |
consumer confidence numbers. In the euro area, finance ministers agreed to grant Greece a second bailout package worth €130 billion and the European Central Bank’s second long-term refinancing operation further increased liquidity in the euro area banking system—reducing investor concerns across the globe, at least in the near-term. Investors also agreed to restructure €172 billion worth of Greek bonds.
In April, however, unease about Europe’s sovereign debt woes once again moved to the forefront. The latest cause for worry centered on Spain, the euro area’s fourth-largest economy, which entered its second recession since 2009. Standard & Poor’s cut Spain’s sovereign rating two notches to BBB+, subsequently leading to the downgrade of 11 Spanish banks. In the U.S., better-than-expected first quarter earnings helped mitigate some of the anxiety in the financial markets.
Despite the volatility, non-government sectors of the U.S. fixed-income market outperformed during the six-month period—benefiting from the improvement in investor sentiment in the first quarter of 2012. As measured within the benchmark, U.S. corporate securities returned a solid 3.64%, helped by a rebound in financials at 4.90%. Corporate earnings remain strong and corporate balance sheets are in solid
shape; the ratio of liquid assets to short-term liabilities, a measure of the ability of businesses to meet their obligations, is the highest it has been in decades. High yield corporates also rebounded strongly, posting a return of 6.91%, as well as CMBS at 5.69%, benefiting from a stabilization of property fundamentals and investor appetite for yield. Government securities lagged the credit markets, with U.S. Treasuries returning 1.87%, as its safe haven premium diminished in the first quarter.
The Fund continued to utilize a global multi-sector approach based on the Global Fixed Income Investment Team and Global Credit Investment Teams’ (collectively, the “Teams”) best research ideas. As both fundamental and quantitative signals indicated a more positive environment in 2012, the Teams selectively added risk across sectors with a focus on corporate debt (investment grade and high yield), particularly corporates in the U.S. From a fundamental viewpoint, investment-grade corporates continue to appear attractive and despite year-to-date spread tightening, spreads remain well above their long-term averages. As valuations in CMBS became richer, the Teams reduced exposure to that sector for relative opportunities elsewhere. With elevated market volatility, the Fund’s non-U.S. dollar currency exposure has been minimized.
| | | | |
| ALLIANCEBERNSTEIN UNCONSTRAINED BOND FUND • | | | 3 | |
HISTORICAL PERFORMANCE
Benchmark Disclosure
The unmanaged BofA ML® 3-Month U.S. T-Bill Index and the unmanaged BC Global Aggregate Bond Index (U.S. dollar hedged) do not reflect fees and expenses associated with the active management of a fund portfolio. The BofA ML 3-Month U.S. T-Bill Index measures the performance of Treasury securities maturing in 90 days. The BC Global Aggregate Bond Index (U.S. dollar hedged) represents the performance of the global investment-grade developed fixed-income markets. An investor cannot invest directly in an index or average, and their results are not indicative of the performance for any specific investment, including the Fund.
A Word About Risk
Market Risk: The value of the Fund’s assets will fluctuate as the stock or bond market fluctuates. The value of its investments may decline, sometimes rapidly and unpredictably, simply because of economic changes or other events that affect large portions of the market.
Interest Rate Risk: Changes in interest rates will affect the value of investments in fixed-income securities. When interest rates rise, the value of investments in fixed-income securities tends to fall and this decrease in value may not be offset by higher income from new investments. Interest rate risk is generally greater for fixed-income securities with longer maturities or durations.
Credit Risk: An issuer or guarantor of a fixed-income security, or the counterparty to a derivatives or other contract, may be unable or unwilling to make timely payments of interest or principal, or to otherwise honor its obligations. The issuer or guarantor may default, causing a loss of the full principal amount of a security. The degree of risk for a particular security may be reflected in its credit rating. There is the possibility that the credit rating of a fixed-income security may be downgraded after purchase, which may adversely affect the value of the security.
Below Investment-Grade Securities: Investments in fixed-income securities with lower ratings (commonly known as “junk bonds”) tend to have a higher probability that an issuer will default or fail to meet its payment obligations. These securities may be subject to greater price volatility due to such factors as specific corporate developments, interest rate sensitivity, negative perceptions of the junk bond market generally and less secondary market liquidity.
Inflation Risk: This is the risk that the value of assets or income from investments will be less in the future as inflation decreases the value of money. As inflation increases, the value of the Fund’s assets can decline as can the value of the Fund’s distributions. This risk is significantly greater if the Fund invests a significant portion of its assets in fixed-income securities with longer maturities.
Foreign (Non-U.S.) Risk: Investments in securities of non-U.S. issuers may involve more risk than those of U.S. issuers. These securities may fluctuate more widely in price and may be less liquid due to adverse market, economic, political, regulatory or other factors.
Emerging Market Risk: Investments in emerging market countries may have more risk because the markets are less developed and less liquid as well as being subject to increased economic, political, regulatory or other uncertainties.
Currency Risk: Fluctuations in currency exchange rates may negatively affect the value of the Fund’s investments or reduce its returns.
Leverage Risk: To the extent the Fund uses leveraging techniques, its net asset value (“NAV”) may be more volatile because leverage tends to exaggerate the effect of changes in interest rates and any increase or decrease in the value of the Fund’s investments.
(Historical Performance continued on next page)
| | |
| 4 | | • ALLIANCEBERNSTEIN UNCONSTRAINED BOND FUND |
Historical Performance
HISTORICAL PERFORMANCE
(continued from previous page)
Prepayment Risk: The value of mortgage-related or asset-backed securities may be particularly sensitive to changes in prevailing interest rates. Early payments of principal on some mortgage-related securities may occur during periods of falling mortgage interest rates and expose the Fund to a lower rate of return upon reinvestment of principal. Early payments associated with mortgage-related securities cause these securities to experience significantly greater price and yield volatility than is experienced by traditional fixed-income securities. During periods of rising interest rates, a reduction in prepayments may increase the effective life of mortgage-related securities, subjecting them to greater risk of decline in market value in response to rising interest rates. If the life of a mortgage-related security is inaccurately predicted, the Fund may not be able to realize the rate of return it expected.
Derivatives Risk: Investments in derivatives may be illiquid, difficult to price, and leveraged so that small changes may produce disproportionate losses for the Fund, and may be subject to counterparty risk to a greater degree than more traditional investments.
Management Risk: The Fund is subject to management risk because it is an actively managed investment fund. The Adviser will apply its investment techniques and risk analyses in making investment decisions, but there is no guarantee that its techniques will produce the intended results.
These risks are fully discussed in the Fund’s prospectus.
An Important Note About Historical Performance
The investment return and principal value of an investment in the Fund will fluctuate, so that shares, when redeemed, may be worth more or less than their original cost. Performance shown on the following pages represents past performance and does not guarantee future results. Current performance may be lower or higher than the performance information shown. You may obtain performance information current to the most recent month-end by visiting www.alliancebernstein.com.
All fees and expenses related to the operation of the Fund have been deducted. NAV returns do not reflect sales charges; if sales charges were reflected, the Fund’s quoted performance would be lower. SEC returns reflect the applicable sales charges for each share class: a 4.25% maximum front-end sales charge for Class A shares; the applicable contingent deferred sales charge for Class B shares (4% year 1, 3% year 2, 2% year 3, 1% year 4); a 1% 1-year contingent deferred sales charge for Class C shares. Returns for the different share classes will vary due to different expenses associated with each class. Performance assumes reinvestment of distributions and does not account for taxes.
(Historical Performance continued on next page)
| | | | |
| ALLIANCEBERNSTEIN UNCONSTRAINED BOND FUND • | | | 5 | |
Historical Performance
HISTORICAL PERFORMANCE
(continued from previous page)
| | | | | | | | | | |
| | | | | | | | | | |
THE FUND VS. ITS BENCHMARK
PERIODS ENDED APRIL 30, 2012 | | NAV Returns | | | |
| | 6 Months | | | 12 Months | | | |
AllianceBernstein Bond Fund Unconstrained Bond Fund | | | | | | | | | | |
Class A | | | 6.94% | | | | 6.05% | | | |
|
Class B* | | | 6.45% | | | | 5.19% | | | |
|
Class C | | | 6.58% | | | | 5.32% | | | |
|
Advisor Class** | | | 6.98% | | | | 6.38% | | | |
|
Class R** | | | 6.73% | | | | 5.87% | | | |
|
Class K** | | | 6.83% | | | | 6.09% | | | |
|
Class I** | | | 7.12% | | | | 6.38% | | | |
|
BofA ML 3-Month U.S. T-Bill Index | | | 0.01% | | | | 0.05% | | | |
|
BC Global Aggregate Bond Index (U.S. dollar hedged) | | | 2.83% | | | | 6.59% | | | |
|
* Effective January 31, 2009, Class B shares are no longer available for purchase to new investors. Please see Note A for more information. ** Please note that these share classes are for investors purchasing shares through accounts established under certain fee-based programs sponsored and maintained by certain broker-dealers and financial intermediaries, institutional pension plans and/or investment advisory clients of, and certain other persons associated with, the Adviser and its affiliates or the Funds. |
| | | | | | | | | | |
See Benchmark and Historical Performance disclosures on pages 4-5.
(Historical Performance continued on next page)
| | |
| 6 | | • ALLIANCEBERNSTEIN UNCONSTRAINED BOND FUND |
Historical Performance
HISTORICAL PERFORMANCE
(continued from previous page)
| | | | | | | | | | | | |
| AVERAGE ANNUAL RETURNS AS OF APRIL 30, 2012 | |
| | | NAV Returns | | | SEC Returns | | | SEC Yields* | |
| | | | | | | | | | | | |
| Class A Shares | | | | | | | | | | | 0.10 | % |
1 Year | | | 6.05 | % | | | 1.54 | % | | | | |
5 Years | | | 2.85 | % | | | 1.96 | % | | | | |
10 Years | | | 5.59 | % | | | 5.14 | % | | | | |
| | | | | | | | | | | | |
| Class B Shares | | | | | | | | | | | -0.60 | % |
1 Year | | | 5.19 | % | | | 1.19 | % | | | | |
5 Years | | | 2.13 | % | | | 2.13 | % | | | | |
10 Years(a) | | | 5.14 | % | | | 5.14 | % | | | | |
| | | | | | | | | | | | |
| Class C Shares | | | | | | | | | | | -0.56 | % |
1 Year | | | 5.32 | % | | | 4.32 | % | | | | |
5 Years | | | 2.14 | % | | | 2.14 | % | | | | |
10 Years | | | 4.84 | % | | | 4.84 | % | | | | |
| | | | | | | | | | | | |
| Advisor Class Shares‡ | | | | | | | | | | | 0.39 | % |
1 Year | | | 6.38 | % | | | 6.38 | % | | | | |
5 Years | | | 3.15 | % | | | 3.15 | % | | | | |
10 Years | | | 5.89 | % | | | 5.89 | % | | | | |
| | | | | | | | | | | | |
| Class R Shares‡ | | | | | | | | | | | -0.26 | % |
1 Year | | | 5.87 | % | | | 5.87 | % | | | | |
5 Years | | | 2.64 | % | | | 2.64 | % | | | | |
Since Inception† | | | 3.81 | % | | | 3.81 | % | | | | |
| | | | | | | | | | | | |
| Class K Shares‡ | | | | | | | | | | | 0.02 | % |
1 Year | | | 6.09 | % | | | 6.09 | % | | | | |
5 Years | | | 2.95 | % | | | 2.95 | % | | | | |
Since Inception† | | | 4.11 | % | | | 4.11 | % | | | | |
| | | | | | | | | | | | |
| Class I Shares‡ | | | | | | | | | | | 0.40 | % |
1 Year | | | 6.38 | % | | | 6.38 | % | | | | |
5 Years | | | 3.19 | % | | | 3.19 | % | | | | |
Since Inception† | | | 4.39 | % | | | 4.39 | % | | | | |
The Fund’s current prospectus fee table shows the Fund’s total annual operating expense ratios as 1.44%, 2.21%, 2.15%, 1.14%, 1.84%, 1.50% and 1.17% for Class A, Class B, Class C, Advisor, Class R, Class K and Class I shares, respectively, gross of any fee waivers or expense reimbursements. Contractual fee waivers and/or expense reimbursements limit the Fund’s annual operating expense ratios exclusive of interest expense to 0.90%, 1.60%, 1.60%, 0.60%, 1.10%, 0.85% and 0.60% for Class A, Class B, Class C, Advisor, Class R, Class K and Class I shares, respectively. These waivers/reimbursements extend through January 31, 2013 and may be extended by the Adviser for additional one-year terms. Absent reimbursements or waivers, performance would have been lower. The Financial Highlights section of this report sets forth expense ratio data for the current reporting period; the expense ratios shown above may differ from the expense ratios in the Financial Highlights sections since they are based on different time periods.
| * | | SEC yields are calculated based on SEC guidelines for the 30-day period ended April 30, 2012. |
| (a) | | Assumes conversion of Class B shares into Class A shares after eight years. |
| ‡ | | These share classes are offered at NAV to eligible investors and their SEC returns are the same as the NAV returns. Please note that these share classes are for investors purchasing shares through accounts established under certain fee-based programs sponsored and maintained by certain broker-dealers and financial intermediaries, institutional pension plans and/or investment advisory clients of, and certain other persons associated with, the Adviser and its affiliates or the Funds. The inception date for Class R, Class K and Class I shares is listed below. |
| † | | Inception date: 3/1/05. |
See Historical Performance disclosures on pages 4-5.
(Historical Performance continued on next page)
| | | | |
| ALLIANCEBERNSTEIN UNCONSTRAINED BOND FUND • | | | 7 | |
Historical Performance
HISTORICAL PERFORMANCE
(continued from previous page)
| | | | |
SEC AVERAGE ANNUAL RETURNS (WITH ANY APPLICABLE SALES CHARGES)
AS OF THE MOST RECENT CALENDAR QUARTER-END (MARCH 31, 2012) | |
| | | SEC Returns | |
| | | | |
| Class A Shares | | | | |
1 Year | | | 1.20 | % |
5 Years | | | 1.93 | % |
10 Years | | | 5.08 | % |
| | | | |
| Class B Shares | | | | |
1 Year | | | 0.98 | % |
5 Years | | | 2.11 | % |
10 Years(a) | | | 5.08 | % |
| | | | |
| Class C Shares | | | | |
1 Year | | | 3.98 | % |
5 Years | | | 2.09 | % |
10 Years | | | 4.79 | % |
| | | | |
| Advisor Class Shares‡ | | | | |
1 Year | | | 5.91 | % |
5 Years | | | 3.09 | % |
10 Years | | | 5.84 | % |
| | | | |
| Class R Shares‡ | | | | |
1 Year | | | 5.64 | % |
5 Years | | | 2.59 | % |
Since Inception† | | | 3.72 | % |
| | | | |
| Class K Shares‡ | | | | |
1 Year | | | 5.75 | % |
5 Years | | | 2.93 | % |
Since Inception† | | | 4.02 | % |
| | | | |
| Class I Shares‡ | | | | |
1 Year | | | 6.04 | % |
5 Years | | | 3.12 | % |
Since Inception† | | | 4.29 | % |
| (a) | | Assumes conversion of Class B shares into Class A shares after eight years. |
| ‡ | | Please note that these share classes are for investors purchasing shares through accounts established under certain fee-based programs sponsored and maintained by certain broker-dealers and financial intermediaries, institutional pension plans and/or investment advisory clients of, and certain other persons associated with, the Adviser and its affiliates or the Funds. The inception date for Class R, Class K and Class I shares is listed below. |
| † | | Inception date: 3/1/05. |
See Historical Performance disclosures on pages 4-5.
| | |
| 8 | | • ALLIANCEBERNSTEIN UNCONSTRAINED BOND FUND |
Historical Performance
FUND EXPENSES
(unaudited)
As a shareholder of the Fund, you incur two types of costs: (1) transaction costs, including sales charges (loads) on purchase payments, contingent deferred sales charges on redemptions and (2) ongoing costs, including management fees; distribution (12b-1) fees; and other Fund expenses. This example is intended to help you understand your ongoing costs (in dollars) of investing in the Fund and to compare these costs with the ongoing costs of investing in other mutual funds.
The Example is based on an investment of $1,000 invested at the beginning of the period and held for the entire period as indicated below.
Actual Expenses
The table below provides information about actual account values and actual expenses. You may use the information, together with the amount you invested, to estimate the expenses that you paid over the period. Simply divide your account value by $1,000 (for example, an $8,600 account value divided by $1,000 = 8.6), then multiply the result by the number under the heading entitled “Expenses Paid During Period” to estimate the expenses you paid on your account during this period.
Hypothetical Example for Comparison Purposes
The table below also provides information about hypothetical account values and hypothetical expenses based on the Fund’s actual expense ratio and an assumed annual rate of return of 5% before expenses, which is not the Fund’s actual return. The hypothetical account values and expenses may not be used to estimate the actual ending account balance or expenses you paid for the period. You may use this information to compare the ongoing costs of investing in the Fund and other funds by comparing this 5% hypothetical example with the 5% hypothetical examples that appear in the shareholder reports of other funds.
Please note that the expenses shown in the table are meant to highlight your ongoing costs only and do not reflect any transactional costs, such as sales charges (loads), or contingent deferred sales charges on redemptions. Therefore, the hypothetical example is useful in comparing ongoing costs only, and will not help you determine the relative total costs of owning different funds. In addition, if these transactional costs were included, your costs would have been higher.
| | | | | | | | | | | | | | | | |
| | | Beginning
Account Value
November 1, 2011 | | | Ending
Account Value
April 30, 2012 | | | Expenses Paid
During Period* | | | Annualized
Expense Ratio* | |
| Class A | | | | | | | | | | | | | | | | |
Actual | | $ | 1,000 | | | $ | 1,069.40 | | | $ | 4.63 | | | | 0.90 | % |
Hypothetical** | | $ | 1,000 | | | $ | 1,020.39 | | | $ | 4.52 | | | | 0.90 | % |
| Class B | | | | | | | | | | | | | | | | |
Actual | | $ | 1,000 | | | $ | 1,064.50 | | | $ | 8.21 | | | | 1.60 | % |
Hypothetical** | | $ | 1,000 | | | $ | 1,016.91 | | | $ | 8.02 | | | | 1.60 | % |
| Class C | | | | | | | | | | | | | | | | |
Actual | | $ | 1,000 | | | $ | 1,065.80 | | | $ | 8.22 | | | | 1.60 | % |
Hypothetical** | | $ | 1,000 | | | $ | 1,016.91 | | | $ | 8.02 | | | | 1.60 | % |
| Advisor Class | | | | | | | | | | | | | | | | |
Actual | | $ | 1,000 | | | $ | 1,069.80 | | | $ | 3.09 | | | | 0.60 | % |
Hypothetical** | | $ | 1,000 | | | $ | 1,021.88 | | | $ | 3.02 | | | | 0.60 | % |
| Class R | | | | | | | | | | | | | | | | |
Actual | | $ | 1,000 | | | $ | 1,067.30 | | | $ | 5.65 | | | | 1.10 | % |
Hypothetical** | | $ | 1,000 | | | $ | 1,019.39 | | | $ | 5.52 | | | | 1.10 | % |
| Class K | | | | | | | | | | | | | | | | |
Actual | | $ | 1,000 | | | $ | 1,068.30 | | | $ | 4.37 | | | | 0.85 | % |
Hypothetical** | | $ | 1,000 | | | $ | 1,020.64 | | | $ | 4.27 | | | | 0.85 | % |
| Class I | | | | | | | | | | | | | | | | |
Actual | | $ | 1,000 | | | $ | 1,071.20 | | | $ | 3.09 | | | | 0.60 | % |
Hypothetical** | | $ | 1,000 | | | $ | 1,021.88 | | | $ | 3.02 | | | | 0.60 | % |
| * | | Expenses are equal to the classes’ annualized expense ratios respectively, multiplied by the average account value over the period, multiplied by 182/366 (to reflect the one-half year period). |
| ** | | Assumes 5% return before expenses. |
| | | | |
| ALLIANCEBERNSTEIN UNCONSTRAINED BOND FUND • | | | 9 | |
Fund Expenses
PORTFOLIO SUMMARY
April 30, 2012 (unaudited)
PORTFOLIO STATISTICS
Net Assets ($mil): $95.8
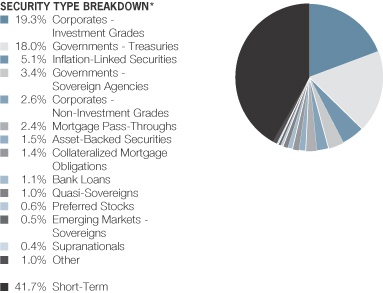
| * | | All data are as of April 30, 2012. The Fund’s security type breakdown is expressed as a percentage of total investments and may vary over time. The Fund also enters into derivative transactions, which may be used for hedging or investment purposes (see “Portfolio of Investments” section of the report for additional details). “Other” security type weightings represent 0.3% or less in the following security types: Commercial Mortgage-Backed Securities, Common Stocks, Emerging Markets—Corporate Bonds, Emerging Markets—Treasuries, Local Governments—Municipal Bonds, Options Purchased—Calls and Options Purchased—Puts. |
| | |
| 10 | | • ALLIANCEBERNSTEIN UNCONSTRAINED BOND FUND |
Portfolio Summary
PORTFOLIO SUMMARY
April 30, 2012 (unaudited)
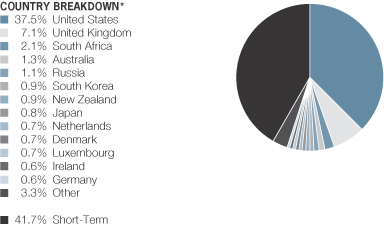
| * | | All data are as of April 30, 2012. The Fund’s country breakdown is expressed as a percentage of total investments and may vary over time. The Fund also enters into derivative transactions, which may be used for hedging or investment purposes (see “Portfolio of Investments” section of the report for additional details). “Other” country weightings represent 0.5% or less in the following countries: Bermuda, Canada, Czech Republic, Dominican Republic, France, Greece, Hungary, Italy, Kazakhstan, Malaysia, Supranational, Sweden and Switzerland. |
| | | | |
| ALLIANCEBERNSTEIN UNCONSTRAINED BOND FUND • | | | 11 | |
Portfolio Summary
PORTFOLIO OF INVESTMENTS
April 30, 2012 (unaudited)
| | | | | | | | | | |
| | | | | Principal
Amount
(000) | | | U.S. $ Value | |
| |
| | | | | | | | | | |
CORPORATES - INVESTMENT GRADES – 18.9% | | | | | | | | | | |
Industrial – 8.9% | | | | | | | | | | |
Basic – 1.4% | | | | | | | | | | |
AngloGold Ashanti Holdings PLC
5.375%, 4/15/20 | | U.S.$ | | | 115 | | | $ | 117,875 | |
ArcelorMittal
6.125%, 6/01/18 | | | | | 225 | | | | 237,140 | |
Dow Chemical Co. (The)
7.60%, 5/15/14 | | | | | 91 | | | | 102,561 | |
Georgia-Pacific LLC
5.40%, 11/01/20(a) | | | | | 57 | | | | 64,966 | |
International Paper Co.
9.375%, 5/15/19 | | | | | 160 | | | | 213,837 | |
Lubrizol Corp.
8.875%, 2/01/19 | | | | | 155 | | | | 212,208 | |
Packaging Corp. of America
5.75%, 8/01/13 | | | | | 180 | | | | 188,678 | |
PPG Industries, Inc.
5.75%, 3/15/13 | | | | | 220 | | | | 229,597 | |
| | | | | | | | | | |
| | | | | | | | | 1,366,862 | |
| | | | | | | | | | |
Capital Goods – 0.6% | | | | | | | | | | |
CRH Finance Ltd.
7.375%, 5/28/14 | | EUR | | | 120 | | | | 176,169 | |
Republic Services, Inc.
5.25%, 11/15/21 | | U.S.$ | | | 200 | | | | 232,831 | |
Tyco International Finance SA
8.50%, 1/15/19 | | | | | 150 | | | | 196,584 | |
| | | | | | | | | | |
| | | | | | | | | 605,584 | |
| | | | | | | | | | |
Communications - Media – 1.4% | | | | | | | | | | |
BSKYB Finance UK PLC
5.625%, 10/15/15(a) | | | | | 225 | | | | 255,050 | |
CBS Corp.
8.20%, 5/15/14 | | | | | 155 | | | | 176,049 | |
Comcast Corp.
5.30%, 1/15/14 | | | | | 180 | | | | 193,069 | |
DirecTV Holdings LLC/DirecTV Financing Co., Inc.
4.75%, 10/01/14 | | | | | 70 | | | | 75,832 | |
Reed Elsevier Capital, Inc.
7.75%, 1/15/14 | | | | | 215 | | | | 237,034 | |
Time Warner Cable, Inc.
7.50%, 4/01/14 | | | | | 150 | | | | 167,854 | |
WPP Finance UK
8.00%, 9/15/14 | | | | | 165 | | | | 189,457 | |
| | | | | | | | | | |
| | | | | | | | | 1,294,345 | |
| | | | | | | | | | |
| | |
| 12 | | • ALLIANCEBERNSTEIN UNCONSTRAINED BOND FUND |
Portfolio of Investments
| | | | | | | | | | |
| | | | | Principal
Amount
(000) | | | U.S. $ Value | |
| |
| | | | | | | | | | |
Communications -
Telecommunications – 1.2% | | | | | | | | | | |
American Tower Corp.
5.05%, 9/01/20 | | U.S.$ | | | 140 | | | $ | 148,130 | |
Bell Canada
4.85%, 6/30/14 | | CAD | | | 195 | | | | 207,985 | |
British Telecommunications PLC
8.50%, 12/07/16 | | GBP | | | 100 | | | | 197,839 | |
Deutsche Telekom International Finance BV
7.125%, 9/26/12 | | | | | 110 | | | | 182,422 | |
Koninklijke KPN NV
5.00%, 11/13/12 | | EUR | | | 130 | | | | 175,571 | |
United States Cellular Corp.
6.70%, 12/15/33 | | U.S.$ | | | 275 | | | | 273,761 | |
| | | | | | | | | | |
| | | | | | | | | 1,185,708 | |
| | | | | | | | | | |
Consumer Cyclical - Automotive – 0.9% | | | | | | | | | | |
American Honda Finance Corp.
5.125%, 10/03/12 | | EUR | | | 150 | | | | 202,093 | |
Daimler Finance North America LLC
6.50%, 11/15/13 | | U.S.$ | | | 160 | | | | 173,377 | |
Harley-Davidson Funding Corp.
5.75%, 12/15/14(a) | | | | | 137 | | | | 149,108 | |
Nissan Motor Acceptance Corp.
4.50%, 1/30/15(a) | | | | | 146 | | | | 156,382 | |
Volvo Treasury AB
5.95%, 4/01/15(a) | | | | | 190 | | | | 208,838 | |
| | | | | | | | | | |
| | | | | | | | | 889,798 | |
| | | | | | | | | | |
Consumer Cyclical -
Entertainment – 0.2% | | | | | | | | | | |
Viacom, Inc.
6.25%, 4/30/16 | | | | | 165 | | | | 193,221 | |
| | | | | | | | | | |
| | | |
Consumer Cyclical - Other – 0.4% | | | | | | | | | | |
Carnival PLC
4.25%, 11/27/13 | | EUR | | | 140 | | | | 190,311 | |
Marriott International, Inc./DE
Series J
5.625%, 2/15/13 | | U.S.$ | | | 185 | | | | 191,564 | |
| | | | | | | | | | |
| | | | | | | | | 381,875 | |
| | | | | | | | | | |
Consumer Cyclical - Retailers – 0.3% | | | | | | | | | | |
CVS Caremark Corp.
6.60%, 3/15/19 | | | | | 85 | | | | 105,557 | |
Nordstrom, Inc.
6.25%, 1/15/18 | | | | | 180 | | | | 221,436 | |
| | | | | | | | | | |
| | | | | | | | | 326,993 | |
| | | | | | | | | | |
Consumer Non-Cyclical – 0.7% | | | | | | | | | | |
Altria Group, Inc.
9.25%, 8/06/19 | | | | | 150 | | | | 204,675 | |
| | | | |
| ALLIANCEBERNSTEIN UNCONSTRAINED BOND FUND • | | | 13 | |
Portfolio of Investments
| | | | | | | | | | |
| | | | | Principal
Amount
(000) | | | U.S. $ Value | |
| |
| | | | | | | | | | |
Bunge Ltd. Finance Corp.
5.10%, 7/15/15 | | U.S.$ | | | 154 | | | $ | 165,851 | |
Newell Rubbermaid, Inc.
5.50%, 4/15/13 | | | | | 32 | | | | 33,283 | |
Reynolds American, Inc.
7.625%, 6/01/16 | | | | | 173 | | | | 208,575 | |
Whirlpool Corp.
8.60%, 5/01/14 | | | | | 20 | | | | 22,458 | |
| | | | | | | | | | |
| | | | | | | | | 634,842 | |
| | | | | | | | | | |
Energy – 0.8% | | | | | | | | | | |
Anadarko Petroleum Corp.
5.95%, 9/15/16 | | | | | 34 | | | | 39,309 | |
Hess Corp.
8.125%, 2/15/19 | | | | | 35 | | | | 45,496 | |
Nabors Industries, Inc.
9.25%, 1/15/19 | | | | | 160 | | | | 208,542 | |
Noble Energy, Inc.
8.25%, 3/01/19 | | | | | 153 | | | | 195,876 | |
Noble Holding International Ltd.
4.90%, 8/01/20 | | | | | 15 | | | | 16,374 | |
Weatherford International Ltd./Bermuda 5.15%, 3/15/13 | | | | | 225 | | | | 232,911 | |
Williams Cos., Inc. (The)
7.875%, 9/01/21 | | | | | 45 | | | | 57,191 | |
| | | | | | | | | | |
| | | | | | | | | 795,699 | |
| | | | | | | | | | |
Technology – 0.5% | | | | | | | | | | |
Agilent Technologies, Inc.
5.00%, 7/15/20 | | | | | 28 | | | | 31,727 | |
Motorola Solutions, Inc.
7.50%, 5/15/25 | | | | | 181 | | | | 220,145 | |
Xerox Corp.
8.25%, 5/15/14 | | | | | 165 | | | | 186,238 | |
| | | | | | | | | | |
| | | | | | | | | 438,110 | |
| | | | | | | | | | |
Transportation - Airlines – 0.2% | | | | | | | | | | |
Southwest Airlines Co. | | | | | | | | | | |
5.25%, 10/01/14 | | | | | 90 | | | | 96,713 | |
5.75%, 12/15/16 | | | | | 70 | | | | 77,885 | |
| | | | | | | | | | |
| | | | | | | | | 174,598 | |
| | | | | | | | | | |
Transportation - Railroads – 0.2% | | | | | | | | | | |
CSX Corp.
7.375%, 2/01/19 | | | | | 149 | | | | 189,727 | |
| | | | | | | | | | |
| | | |
Transportation - Services – 0.1% | | | | | | | | | | |
Ryder System, Inc.
7.20%, 9/01/15 | | | | | 71 | | | | 81,888 | |
| | | | | | | | | | |
| | | | | | | | | 8,559,250 | |
| | | | | | | | | | |
| | |
| 14 | | • ALLIANCEBERNSTEIN UNCONSTRAINED BOND FUND |
Portfolio of Investments
| | | | | | | | | | |
| | | | | Principal
Amount
(000) | | | U.S. $ Value | |
| |
| | | | | | | | | | |
Financial Institutions – 7.6% | | | | | | | | | | |
Banking – 4.4% | | | | | | | | | | |
American Express Credit Corp.
6.625%, 9/24/12 | | GBP | | | 200 | | | $ | 329,734 | |
ANZ Capital Trust III
1.536%, 12/15/53(b) | | EUR | | | 210 | | | | 226,551 | |
Bank of Scotland PLC
5.625%, 5/23/13 | | | | | 120 | | | | 164,911 | |
Barclays Bank PLC
4.75%, 3/15/20 | | | | | 160 | | | | 127,015 | |
Bear Stearns Cos. LLC (The)
1.024%, 7/27/12(b) | | | | | 140 | | | | 185,605 | |
Capital One Financial Corp.
7.375%, 5/23/14 | | U.S.$ | | | 170 | | | | 188,375 | |
Citigroup, Inc.
5.50%, 4/11/13 | | | | | 185 | | | | 191,420 | |
Deutsche Bank AG/London
4.875%, 5/20/13 | | | | | 181 | | | | 187,974 | |
Fifth Third Bank/Ohio
4.75%, 2/01/15 | | | | | 250 | | | | 268,208 | |
Goldman Sachs Group, Inc. (The)
6.00%, 6/15/20 | | | | | 165 | | | | 176,512 | |
Lloyds TSB Bank PLC
4.375%, 1/12/15(a) | | | | | 195 | | | | 199,449 | |
Macquarie Group Ltd.
7.625%, 8/13/19(a) | | | | | 115 | | | | 123,844 | |
Merrill Lynch & Co., Inc.
1.306%, 5/30/14(b) | | EUR | | | 250 | | | | 314,571 | |
Morgan Stanley
5.50%, 7/24/20 | | U.S.$ | | | 175 | | | | 172,091 | |
National Australia Bank Ltd.
3.75%, 3/02/15(a) | | | | | 90 | | | | 94,749 | |
Royal Bank of Scotland NV
1.175%, 3/09/15(b) | | | | | 450 | | | | 378,900 | |
Societe Generale SA
2.50%, 1/15/14(a) | | | | | 180 | | | | 176,946 | |
Standard Chartered Bank
5.875%, 9/26/17(a) | | EUR | | | 100 | | | | 143,318 | |
Swedbank AB
0.673%, 5/18/17(b) | | U.S.$ | | | 200 | | | | 199,352 | |
UBS AG/Stamford CT
5.875%, 7/15/16 | | | | | 195 | | | | 206,204 | |
Wachovia Corp.
5.50%, 5/01/13 | | | | | 175 | | | | 183,163 | |
| | | | | | | | | | |
| | | | | | | | | 4,238,892 | |
| | | | | | | | | | |
Brokerage – 0.1% | | | | | | | | | | |
Jefferies Group, Inc.
6.875%, 4/15/21 | | | | | 70 | | | | 69,738 | |
| | | | | | | | | | |
| | | | |
| ALLIANCEBERNSTEIN UNCONSTRAINED BOND FUND • | | | 15 | |
Portfolio of Investments
| | | | | | | | | | |
| | | | | Principal
Amount
(000) | | | U.S. $ Value | |
| |
| | | | | | | | | | |
Finance – 0.2% | | | | | | | | | | |
General Electric Capital Corp.
4.80%, 5/01/13 | | U.S.$ | | | 225 | | | $ | 234,061 | |
| | | | | | | | | | |
| | | |
Insurance – 2.2% | | | | | | | | | | |
Aetna, Inc.
6.75%, 12/15/37 | | | | | 257 | | | | 333,644 | |
Allied World Assurance Co. Ltd.
5.50%, 11/15/20 | | | | | 180 | | | | 186,883 | |
Allstate Corp. (The)
6.125%, 5/15/37 | | | | | 90 | | | | 88,200 | |
CIGNA Corp.
5.125%, 6/15/20 | | | | | 90 | | | | 100,556 | |
Coventry Health Care, Inc.
5.95%, 3/15/17 | | | | | 40 | | | | 45,770 | |
6.125%, 1/15/15 | | | | | 20 | | | | 21,729 | |
6.30%, 8/15/14 | | | | | 125 | | | | 136,898 | |
Genworth Financial, Inc.
6.515%, 5/22/18 | | | | | 230 | | | | 229,240 | |
Humana, Inc.
6.30%, 8/01/18 | | | | | 25 | | | | 29,106 | |
6.45%, 6/01/16 | | | | | 20 | | | | 22,868 | |
7.20%, 6/15/18 | | | | | 180 | | | | 217,357 | |
Lincoln National Corp.
8.75%, 7/01/19 | | | | | 47 | | | | 60,120 | |
Markel Corp.
7.125%, 9/30/19 | | | | | 60 | | | | 69,356 | |
Marsh & McLennan Cos., Inc.
5.375%, 7/15/14 | | | | | 1 | | | | 1,075 | |
Nationwide Mutual Insurance Co.
9.375%, 8/15/39(a) | | | | | 165 | | | | 210,946 | |
Prudential Financial, Inc.
6.20%, 1/15/15 | | | | | 135 | | | | 149,345 | |
Series D | | | | | | | | | | |
7.375%, 6/15/19 | | | | | 25 | | | | 31,117 | |
UnitedHealth Group, Inc.
6.00%, 2/15/18 | | | | | 65 | | | | 79,286 | |
WellPoint, Inc.
5.875%, 6/15/17 | | | | | 20 | | | | 23,526 | |
7.00%, 2/15/19 | | | | | 45 | | | | 56,743 | |
| | | | | | | | | | |
| | | | | | | | | 2,093,765 | |
| | | | | | | | | | |
Other Finance – 0.2% | | | | | | | | | | |
ORIX Corp.
4.71%, 4/27/15 | | | | | 183 | | | | 192,296 | |
| | | | | | | | | | |
| | | |
REITS – 0.5% | | | | | | | | | | |
Digital Realty Trust LP
5.25%, 3/15/21 | | | | | 250 | | | | 264,789 | |
| | |
| 16 | | • ALLIANCEBERNSTEIN UNCONSTRAINED BOND FUND |
Portfolio of Investments
| | | | | | | | | | |
| | | | | Principal
Amount
(000) | | | U.S. $ Value | |
| |
| | | | | | | | | | |
Health Care REIT, Inc.
4.95%, 1/15/21 | | U.S.$ | | | 180 | | | $ | 186,883 | |
| | | | | | | | | | |
| | | | | | | | | 451,672 | |
| | | | | | | | | | |
| | | | | | | | | 7,280,424 | |
| | | | | | | | | | |
Utility – 1.9% | | | | | | | | | | |
Electric – 0.8% | | | | | | | | | | |
Constellation Energy Group, Inc.
5.15%, 12/01/20 | | | | | 180 | | | | 199,517 | |
Nisource Finance Corp.
6.15%, 3/01/13 | | | | | 80 | | | | 83,343 | |
Ohio Power Co.
Series F
5.50%, 2/15/13 | | | | | 118 | | | | 122,243 | |
PPL Energy Supply LLC
6.50%, 5/01/18 | | | | | 180 | | | | 206,760 | |
TECO Finance, Inc.
4.00%, 3/15/16 | | | | | 45 | | | | 48,139 | |
5.15%, 3/15/20 | | | | | 55 | | | | 62,343 | |
Union Electric Co.
6.70%, 2/01/19 | | | | | 25 | | | | 31,136 | |
| | | | | | | | | | |
| | | | | | | | | 753,481 | |
| | | | | | | | | | |
Natural Gas – 1.1% | | | | | | | | | | |
DCP Midstream LLC
9.75%, 3/15/19(a) | | | | | 155 | | | | 200,522 | |
Energy Transfer Partners LP
6.125%, 2/15/17 | | | | | 225 | | | | 250,886 | |
Enterprise Products Operating LLC
Series G
5.60%, 10/15/14 | | | | | 225 | | | | 248,473 | |
EQT Corp.
8.125%, 6/01/19 | | | | | 35 | | | | 41,877 | |
Spectra Energy Capital LLC
8.00%, 10/01/19 | | | | | 170 | | | | 218,845 | |
Williams Partners LP
3.80%, 2/15/15 | | | | | 48 | | | | 51,095 | |
| | | | | | | | | | |
| | | | | | | | | 1,011,698 | |
| | | | | | | | | | |
| | | | | | | | | 1,765,179 | |
| | | | | | | | | | |
Non Corporate Sectors – 0.5% | | | | | | | | | | |
Agencies - Not Government Guaranteed – 0.5% | | | | | | | | | | |
Gazprom OAO Via Gaz Capital SA
6.212%, 11/22/16(a) | | | | | 416 | | | | 454,480 | |
| | | | | | | | | | |
| | | |
Total Corporates - Investment Grades
(cost $16,774,527) | | | | | | | | | 18,059,333 | |
| | | | | | | | | | |
| | | | | | | | | | |
| | | | |
| ALLIANCEBERNSTEIN UNCONSTRAINED BOND FUND • | | | 17 | |
Portfolio of Investments
| | | | | | | | | | |
| | | | | Principal
Amount
(000) | | | U.S. $ Value | |
| |
| | | | | | | | | | |
GOVERNMENTS - TREASURIES – 17.7% | | | | | | | | | | |
Greece – 0.1% | | | | | | | | | | |
Hellenic Republic Government Bond | | | | | | | | | | |
Series GDP | | | | | | | | | | |
Zero Coupon, 10/15/42 | | EUR | | | 276 | | | $ | 1,879 | |
Series PSI | | | | | | | | | | |
2.00%, 2/24/23-2/24/42(c) | | | | | 276 | | | | 67,732 | |
| | | | | | | | | | |
| | | | | | | | | 69,611 | |
| | | | | | | | | | |
New Zealand – 0.9% | | | | | | | | | | |
New Zealand Government Bond
Series 521
6.00%, 5/15/21 | | NZD | | | 850 | | | | 808,269 | |
| | | | | | | | | | |
| | | |
South Africa – 1.9% | | | | | | | | | | |
South Africa Government Bond
Series R206
7.50%, 1/15/14 | | ZAR | | | 13,850 | | | | 1,836,309 | |
| | | | | | | | | | |
| | | |
United States – 14.8% | | | | | | | | | | |
U.S. Treasury Bonds
3.125%, 11/15/41(d) | | U.S.$ | | | 2,340 | | | | 2,347,312 | |
3.125%, 2/15/42 | | | | | 9,970 | | | | 9,998,036 | |
U.S. Treasury Notes
1.375%, 9/15/12(d) | | | | | 1,800 | | | | 1,808,226 | |
| | | | | | | | | | |
| | | | | | | | | 14,153,574 | |
| | | | | | | | | | |
Total Governments - Treasuries
(cost $16,418,072) | | | | | | | | | 16,867,763 | |
| | | | | | | | | | |
| | | | | | | | | | |
INFLATION-LINKED SECURITIES – 4.9% | | | | | | | | | | |
United Kingdom – 4.3% | | | | | | | | | | |
United Kingdom Gilt Inflation Linked
Series 3MO
1.25%, 11/22/17 | | GBP | | | 2,204 | | | | 4,136,430 | |
| | | | | | | | | | |
| | | |
United States – 0.6% | | | | | | | | | | |
U.S. Treasury Inflation Index
3.00%, 7/15/12 (TIPS)(d) | | U.S.$ | | | 608 | | | | 617,178 | |
| | | | | | | | | | |
| | | |
Total Inflation-Linked Securities
(cost $4,649,821) | | | | | | | | | 4,753,608 | |
| | | | | | | | | | |
| | | | | | | | | | |
GOVERNMENTS - SOVEREIGN
AGENCIES – 3.4% | | | | | | | | | | |
Australia – 0.8% | | | | | | | | | | |
Suncorp-Metway Ltd.
1.967%, 7/16/12(a)(b) | | | | | 750 | | | | 752,456 | |
| | | | | | | | | | |
| | | |
Denmark – 0.7% | | | | | | | | | | |
Finance for Danish Industry
2.125%, 3/21/13 | | EUR | | | 500 | | | | 670,226 | |
| | | | | | | | | | |
| | |
| 18 | | • ALLIANCEBERNSTEIN UNCONSTRAINED BOND FUND |
Portfolio of Investments
| | | | | | | | | | |
| | | | | Principal
Amount
(000) | | | U.S. $ Value | |
| |
| | | | | | | | | | |
South Korea – 0.9% | | | | | | | | | | |
Export-Import Bank of Korea
6.60%, 11/04/13(a) | | IDR | | | 7,720,000 | | | $ | 843,562 | |
| | | | | | | | | | |
| | | |
United Kingdom – 0.7% | | | | | | | | | | |
Royal Bank of Scotland PLC (The)
1.21%, 5/11/12(a)(b) | | U.S.$ | | | 650 | | | | 650,008 | |
| | | | | | | | | | |
| | | |
United States – 0.3% | | | | | | | | | | |
General Electric Capital Corp.
4.00%, 6/15/12 | | EUR | | | 192 | | | | 255,119 | |
| | | | | | | | | | |
| | | |
Total Governments - Sovereign Agencies
(cost $3,207,321) | | | | | | | | | 3,171,371 | |
| | | | | | | | | | |
| | | | | | | | | | |
CORPORATES - NON-INVESTMENT
GRADES – 2.4% | | | | | | | | | | |
Industrial – 1.8% | | | | | | | | | | |
Basic – 0.2% | | | | | | | | | | |
Weyerhaeuser Co.
7.375%, 3/15/32 | | U.S.$ | | | 204 | | | | 222,793 | |
| | | | | | | | | | |
| | | |
Capital Goods – 0.3% | | | | | | | | | | |
Ardagh Glass Finance PLC
7.125%, 6/15/17(a) | | EUR | | | 112 | | | | 140,100 | |
Case New Holland, Inc.
7.875%, 12/01/17 | | U.S.$ | | | 128 | | | | 149,120 | |
| | | | | | | | | | |
| | | | | | | | | 289,220 | |
| | | | | | | | | | |
Communications - Media – 0.4% | | | | | | | | | | |
CCO Holdings LLC/CCO Holdings Capital Corp.
7.875%, 4/30/18 | | | | | 24 | | | | 25,980 | |
8.125%, 4/30/20 | | | | | 8 | | | | 8,960 | |
Intelsat Jackson Holdings SA
7.25%, 4/01/19 | | | | | 247 | | | | 257,498 | |
Ziggo Bond Co. BV
8.00%, 5/15/18(a) | | EUR | | | 85 | | | | 121,234 | |
| | | | | | | | | | |
| | | | | | | | | 413,672 | |
| | | | | | | | | | |
Communications - Telecommunications – 0.4% | | | | | | | | | | |
Sunrise Communications International SA
7.00%, 12/31/17(a) | | | | | 100 | | | | 140,312 | |
Wind Acquisition Finance SA
7.25%, 2/15/18(a) | | U.S.$ | | | 200 | | | | 189,500 | |
Windstream Corp.
7.875%, 11/01/17 | | | | | 55 | | | | 60,775 | |
| | | | | | | | | | |
| | | | | | | | | 390,587 | |
| | | | | | | | | | |
| | | | |
| ALLIANCEBERNSTEIN UNCONSTRAINED BOND FUND • | | | 19 | |
Portfolio of Investments
| | | | | | | | | | |
| | | | | Principal
Amount
(000) | | | U.S. $ Value | |
| |
| | | | | | | | | | |
Consumer Cyclical - Other – 0.0% | | | | | | | | | | |
Standard Pacific Corp.
10.75%, 9/15/16 | | U.S.$ | | | 35 | | | $ | 40,250 | |
| | | | | | | | | | |
| | | |
Consumer Non-Cyclical – 0.4% | | | | | | | | | | |
ARAMARK Corp.
3.966%, 2/01/15(b) | | | | | 200 | | | | 199,000 | |
HCA, Inc.
7.58%, 9/15/25 | | | | | 65 | | | | 59,881 | |
Universal Health Services, Inc.
7.125%, 6/30/16 | | | | | 135 | | | | 152,888 | |
| | | | | | | | | | |
| | | | | | | | | 411,769 | |
| | | | | | | | | | |
Energy – 0.1% | | | | | | | | | | |
Tesoro Corp.
6.50%, 6/01/17 | | | | | 85 | | | | 87,763 | |
| | | | | | | | | | |
| | | | | | | | | 1,856,054 | |
| | | | | | | | | | |
Financial Institutions – 0.6% | | | | | | | | | | |
Banking – 0.2% | | | | | | | | | | |
National Westminster Bank PLC
2.92%, 7/15/12(b) | | EUR | | | 200 | | | | 174,728 | |
| | | | | | | | | | |
| | | |
Brokerage – 0.2% | | | | | | | | | | |
Lehman Brothers Holdings
Zero Coupon, 5/25/10-1/12/12(e) | | U.S.$ | | | 875 | | | | 212,188 | |
| | | | | | | | | | |
| | | |
Finance – 0.2% | | | | | | | | | | |
International Lease Finance Corp.
0.819%, 7/13/12(b) | | | | | 230 | | | | 229,096 | |
| | | | | | | | | | |
| | | | | | | | | 616,012 | |
| | | | | | | | | | |
Total Corporates - Non-Investment Grades
(cost $2,554,953) | | | | | | | | | 2,472,066 | |
| | | | | | | | | | |
| | | | | | | | | | |
MORTGAGE PASS-THROUGHS – 2.3% | | | | | | | | | | |
Agency Fixed Rate 30-Year – 2.0% | | | | | | | | | | |
Federal National Mortgage Association
6.00%, 2/01/40 | | | | | 656 | | | | 723,981 | |
Series 2008
6.00%, 5/01/38 | | | | | 1,083 | | | | 1,197,836 | |
| | | | | | | | | | |
| | | | | | | | | 1,921,817 | |
| | | | | | | | | | |
Agency ARMs – 0.3% | | | | | | | | | | |
Federal Home Loan Mortgage Corp.
Series 2006
2.965%, 12/01/36(b) | | | | | 59 | | | | 62,876 | |
Series 2007
5.428%, 4/01/37(b) | | | | | 251 | | | | 267,822 | |
| | | | | | | | | | |
| | | | | | | | | 330,698 | |
| | | | | | | | | | |
Total Mortgage Pass-Throughs
(cost $2,194,842) | | | | | | | | | 2,252,515 | |
| | | | | | | | | | |
| | |
| 20 | | • ALLIANCEBERNSTEIN UNCONSTRAINED BOND FUND |
Portfolio of Investments
| | | | | | | | | | |
| | | | | Principal
Amount
(000) | | | U.S. $ Value | |
| |
| | | | | | | | | | |
ASSET-BACKED SECURITIES – 1.4% | | | | | | | | | | |
Home Equity Loans -
Floating Rate – 0.9% | | | | | | | | | | |
Bear Stearns Asset Backed Securities Trust
Series 2007-HE3, Class M1
0.689%, 4/25/37(b)(f) | | U.S.$ | | | 175 | | | $ | 2,985 | |
HSBC Home Equity Loan Trust
Series 2006-1, Class M1
0.52%, 1/20/36(b) | | | | | 131 | | | | 109,081 | |
Series 2007-2, Class M1
0.55%, 7/20/36(b) | | | | | 415 | | | | 241,549 | |
Morgan Stanley Structured Trust
Series 2007-1, Class A2
0.429%, 6/25/37(b) | | | | | 430 | | | | 243,120 | |
Option One Mortgage Loan Trust
Series 2007-2, Class M1
0.599%, 3/25/37(b)(f) | | | | | 104 | | | | 561 | |
Wells Fargo Home Equity Trust
Series 2004-1, Class 1A
0.539%, 4/25/34(b) | | | | | 326 | | | | 282,532 | |
| | | | | | | | | | |
| | | | | | | | | 879,828 | |
| | | | | | | | | | |
Credit Cards - Floating Rate – 0.5% | | | | | | | | | | |
Discover Card Master Trust | | | | | | | | | | |
Series 2009-A1, Class A1
1.54%, 12/15/14(b) | | | | | 185 | | | | 185,267 | |
Series 2009-A2, Class A
1.54%, 2/17/15(b) | | | | | 105 | | | | 105,352 | |
Series 2010-A1, Class A1
0.89%, 9/15/15(b) | | | | | 195 | | | | 195,930 | |
| | | | | | | | | | |
| | | | | | | | | 486,549 | |
| | | | | | | | | | |
Autos - Floating Rate – 0.0% | | | | | | | | | | |
Wheels SPV LLC
Series 2009-1, Class A
1.79%, 3/15/18(a)(b) | | | | | 43 | | | | 42,594 | |
| | | | | | | | | | |
| | | |
Home Equity Loans - Fixed Rate – 0.0% | | | | | | | | | | |
Nationstar NIM Trust
Series 2007-A, Class A
9.79%, 3/25/37(f)(g)(h) | | | | | 3 | | | | – 0 | – |
| | | | | | | | | | |
| | | |
Total Asset-Backed Securities
(cost $2,113,955) | | | | | | | | | 1,408,971 | |
| | | | | | | | | | |
| | | | | | | | | | |
COLLATERALIZED MORTGAGE
OBLIGATIONS – 1.3% | | | | | | | | | | |
Agency Floating Rate – 0.6% | | | | | | | | | | |
Freddie Mac Reference REMICs
Series R008, Class FK
0.64%, 7/15/23(b) | | | | | 156 | | | | 155,979 | |
| | | | |
| ALLIANCEBERNSTEIN UNCONSTRAINED BOND FUND • | | | 21 | |
Portfolio of Investments
| | | | | | | | | | |
| | | | | Principal
Amount
(000) | | | U.S. $ Value | |
| |
| | | | | | | | | | |
Freddie Mac REMICs
Series 3067, Class FA
0.59%, 11/15/35(b) | | U.S.$ | | | 418 | | | $ | 417,632 | |
| | | | | | | | | | |
| | | | | | | | | 573,611 | |
| | | | | | | | | | |
Non-Agency Floating Rate – 0.6% | | | | | | | | | | |
Countrywide Alternative Loan Trust
Series 2005-62, Class 2A1
1.158%, 12/25/35(b) | | | | | 100 | | | | 56,199 | |
Greenpoint Mortgage Funding Trust
Series 2006-AR2, Class 4A1
2.158%, 3/25/36(b) | | | | | 358 | | | | 215,610 | |
Washington Mutual Alternative Mortgage Pass-Through Certificates
Series 2007-OA5, Class 1A
0.909%, 6/25/47(b) | | | | | 445 | | | | 295,988 | |
| | | | | | | | | | |
| | | | | | | | | 567,797 | |
| | | | | | | | | | |
Non-Agency Fixed Rate – 0.1% | | | | | | | | | | |
Countrywide Alternative Loan Trust
Series 2006-OA7, Class 1A1
2.125%, 6/25/46 | | | | | 283 | | | | 117,234 | |
Merrill Lynch Mortgage Investors, Inc.
Series 2005-A9, Class 2A1A
2.619%, 12/25/35 | | | | | 6 | | | | 6,388 | |
| | | | | | | | | | |
| | | | | | | | | 123,622 | |
| | | | | | | | | | |
Total Collateralized Mortgage Obligations
(cost $1,774,584) | | | | | | | | | 1,265,030 | |
| | | | | | | | | | |
| | | | | | | | | | |
BANK LOANS – 1.1% | | | | | | | | | | |
Industrial – 0.8% | | | | | | | | | | |
Communications -
Telecommunications – 0.1% | | | | | | | | | | |
Level 3 Financing, Inc.
2.49%-2.72%, 3/13/14(b) | | | | | 82 | | | | 81,428 | |
| | | | | | | | | | |
| | | |
Consumer Cyclical - Other – 0.3% | | | | | | | | | | |
Caesars Entertainment Operating Company, Inc. (fka Harrah’s Operating Company, Inc.)
3.24%-3.47%, 1/28/15(b) | | | | | 312 | | | | 296,577 | |
November 2005 Land Investors, LLC (North Las Vegas Consortium)
7.25%, 4/30/10(b)(f)(i) | | | | | 519 | | | | – 0 | – |
| | | | | | | | | | |
| | | | | | | | | 296,577 | |
| | | | | | | | | | |
Technology – 0.4% | | | | | | | | | | |
First Data Corporation
2.99%, 9/24/14(b) | | | | | 437 | | | | 417,339 | |
| | | | | | | | | | |
| | | | | | | | | 795,344 | |
| | | | | | | | | | |
| | |
| 22 | | • ALLIANCEBERNSTEIN UNCONSTRAINED BOND FUND |
Portfolio of Investments
| | | | | | | | | | |
| | | | | Principal
Amount
(000) | | | U.S. $ Value | |
| |
| | | | | | | | | | |
Utility – 0.3% | | | | | | | | | | |
Electric – 0.3% | | | | | | | | | | |
Texas Competitive Electric Holdings
Company, LLC (TXU)
3.74%, 10/10/14(b) | | U.S.$ | | | 473 | | | $ | 270,996 | |
| | | | | | | | | | |
| | | |
Total Bank Loans
(cost $1,707,154) | | | | | | | | | 1,066,340 | |
| | | | | | | | | | |
| | | | | | | | | | |
QUASI-SOVEREIGNS – 1.0% | | | | | | | | | | |
Quasi-Sovereign Bonds – 1.0% | | | | | | | | | | |
Kazakhstan – 0.3% | | | | | | | | | | |
KazMunayGas National Co.
9.125%, 7/02/18(a) | | | | | 200 | | | | 249,250 | |
| | | | | | | | | | |
| | | |
Malaysia – 0.2% | | | | | | | | | | |
Petronas Capital Ltd.
5.25%, 8/12/19(a) | | | | | 190 | | | | 215,950 | |
| | | | | | | | | | |
| | | |
Russia – 0.5% | | | | | | | | | | |
Russian Agricultural Bank OJSC Via RSHB Capital SA
7.75%, 5/29/18(a) | | | | | 410 | | | | 463,813 | |
| | | | | | | | | | |
| | | |
Total Quasi-Sovereigns
(cost $801,518) | | | | | | | | | 929,013 | |
| | | | | | | | | | |
| | | |
| | | | | Shares | | | | |
PREFERRED STOCKS – 0.6% | | | | | | | | | | |
Financial Institutions – 0.6% | | | | | | | | | | |
Banking – 0.2% | | | | | | | | | | |
Zions Bancorporation
9.50%, 9/15/13 | | | | | 6,200 | | | | 162,564 | |
| | | | | | | | | | |
| | | |
Insurance – 0.4% | | | | | | | | | | |
XLIT Ltd.
3.586%(b) | | | | | 600 | | | | 420,937 | |
| | | | | | | | | | |
| | | |
Total Preferred Stocks
(cost $647,717) | | | | | | | | | 583,501 | |
| | | | | | | | | | |
| | | |
| | | | | Principal
Amount
(000) | | | | |
EMERGING MARKETS -
SOVEREIGNS – 0.5% | | | | | | | | | | |
Hungary – 0.5% | | | | | | | | | | |
Hungary Government International Bond
6.375%, 3/29/21
(cost $506,492) | | U.S.$ | | | 510 | | | | 489,600 | |
| | | | | | | | | | |
| | | | |
| ALLIANCEBERNSTEIN UNCONSTRAINED BOND FUND • | | | 23 | |
Portfolio of Investments
| | | | | | | | | | |
| | | | | Principal
Amount
(000) | | | U.S. $ Value | |
| |
| | | | | | | | | | |
SUPRANATIONALS – 0.4% | | | | | | | | | | |
European Financial Stability Facility
0.40%, 3/12/13 | | EUR | | | 131 | | | $ | 173,380 | |
1.00%, 3/12/14(a) | | | | | 131 | | | | 173,798 | |
| | | | | | | | | | |
| | | |
Total Supranationals
(cost $341,848) | | | | | | | | | 347,178 | |
| | | | | | | | | | |
| | | |
| | | | | Contracts | | | | |
OPTIONS PURCHASED - PUTS – 0.3% | | | | | | | | |
Options on Forward Contracts – 0.2% | | | | | | | | | | |
JPY/USD
Expiration: Jul 2012,
Exercise Price: JPY 80.78(e) | | | | | 759,332,000 | | | | 220,067 | |
| | | | | | | | | | |
| | | |
Options on Funds and Investment
Trusts – 0.1% | | | | | | | | | | |
P/O SPDR S&P 500 ETF Trust
Expiration: May 2012,
Exercise Price: $ 128.00(e)(j) | | | | | 163 | | | | 2,119 | |
P/O SPDR S&P 500 ETF Trust
Expiration: May 2012,
Exercise Price: $ 140.00(e)(j) | | | | | 169 | | | | 31,349 | |
P/O SPDR S&P 500 ETF Trust
Expiration: Jun 2012,
Exercise Price: $ 137.00(e)(j) | | | | | 131 | | | | 29,279 | |
| | | | | | | | | | |
| | | | | | | | | 62,747 | |
| | | | | | | | | | |
| | | |
Total Options Purchased - Puts
(cost $317,975) | | | | | | | | | 282,814 | |
| | | | | | | | | | |
| | | |
| | | | | Principal
Amount
(000) | | | | |
EMERGING MARKETS -
TREASURIES – 0.2% | | | | | | | | | | |
Dominican Republic – 0.2% | | | | | | | | | | |
Dominican Republic
15.95%, 6/04/21(a)
(cost $205,351) | | DOP | | | 8,000 | | | | 198,138 | |
| | | | | | | | | | |
| | | | | | | | | | |
COMMERCIAL MORTGAGE-BACKED SECURITY – 0.2% | | | | | | | | | | |
Non-Agency Floating Rate CMBS – 0.2% | | | | | | | | | | |
Credit Suisse Mortgage Capital Certificates
Series 2006-TF2A, Class SVD
0.71%, 10/15/21(a)(b)
(cost $190,000) | | U.S.$ | | | 190 | | | | 171,056 | |
| | | | | | | | | | |
| | |
| 24 | | • ALLIANCEBERNSTEIN UNCONSTRAINED BOND FUND |
Portfolio of Investments
| | | | | | | | | | |
| | | | | Principal
Amount
(000) | | | U.S. $ Value | |
| |
| | | | | | | | | | |
EMERGING MARKETS - CORPORATE BONDS – 0.2% | | | | | | | | | | |
Industrial – 0.2% | | | | | | | | | | |
Basic – 0.1% | | | | | | | | | | |
Severstal OAO Via Steel Capital SA
9.75%, 7/29/13(a) | | U.S.$ | | | 100 | | | $ | 107,250 | |
| | | | | | | | | | |
| | | |
Communications - Media – 0.1% | | | | | | | | | | |
Central European Media Enterprises Ltd. 11.625%, 9/15/16(a) | | EUR | | | 50 | | | | 61,883 | |
| | | | | | | | | | |
| | | |
Total Emerging Markets - Corporate Bonds
(cost $171,897) | | | | | | | | | 169,133 | |
| | | | | | | | | | |
| | | | | | | | | | |
LOCAL GOVERNMENTS - MUNICIPAL BONDS – 0.1% | | | | | | | | | | |
United States – 0.1% | | | | | | | | | | |
Alameda Corridor Trnsp Auth CA
NPFGC
6.60%, 10/01/29
(cost $114,511) | | U.S.$ | | | 100 | | | | 105,297 | |
| | | | | | | | | | |
| | | |
| | | | | Contracts | | | | |
OPTIONS PURCHASED - CALLS – 0.1% | | | | | | | | | | |
Options on Funds and Investment
Trusts – 0.1% | | | | | | | | | | |
C/O SPDR S&P 500 ETF Trust
Expiration: May 2012,
Exercise Price: $ 138.00(e)(j)
(cost $52,979) | | | | | 163 | | | | 50,775 | |
| | | | | | | | | | |
| | | |
| | | | | Shares | | | | |
COMMON STOCKS – 0.0% | | | | | | | | | | |
Abitibibowater, Inc.(e)(f)(g)
(cost $0) | | | | | 275,000 | | | | – 0 | – |
| | | | | | | | | | |
| | | |
| | | | | Principal
Amount
(000) | | | | |
SHORT-TERM INVESTMENTS – 40.8% | | | | | | | | | | |
U.S. Treasury Bills – 23.0% | | | | | | | | | | |
U.S. Treasury Bill
Zero Coupon, 5/10/12(d) | | U.S.$ | | | 15,000 | | | | 14,999,625 | |
Zero Coupon, 6/21/12 | | | | | 7,000 | | | | 6,999,207 | |
| | | | | | | | | | |
| | | |
Total U.S. Treasury Bills
(cost $21,998,832) | | | | | | | | | 21,998,832 | |
| | | | | | | | | | |
| | | | |
| ALLIANCEBERNSTEIN UNCONSTRAINED BOND FUND • | | | 25 | |
Portfolio of Investments
| | | | | | | | | | |
| | | |
| | | | |
Shares | | | U.S. $ Value | |
| |
| | | | | | | | | | |
Investment Companies – 17.8% | | | | | | | | | | |
AllianceBernstein Fixed-Income Shares, Inc. – Government STIF Portfolio, 0.12%(k)
(cost $17,064,345) | | U.S.$ | | | 17,064,345 | | | $ | 17,064,345 | |
| | | | | | | | | | |
| | | |
Total Short-Term Investments
(cost $39,063,177) | | | | | | | | | 39,063,177 | |
| | | | | | | | | | |
| | | |
Total Investments – 97.8%
(cost $93,808,694) | | | | | | | | | 93,706,679 | |
Other assets less liabilities – 2.2% | | | | | | | | | 2,095,614 | |
| | | | | | | | | | |
| | | |
Net Assets – 100.0% | | | | | | | | $ | 95,802,293 | |
| | | | | | | | | | |
FUTURES CONTRACTS (see Note D)
| | | | | | | | | | | | | | | | | | | | |
| Type | | Number of
Contracts | | | Expiration
Month | | | Original
Value | | | Value at
April 30,
2012 | | | Unrealized
Appreciation/
(Depreciation) | |
Purchased Contracts | | | | | | | | | | | | | |
Euro-Schatz Futures | | | 5 | | | | June 2012 | | | $ | 730,153 | | | $ | 732,006 | | | $ | 1,853 | |
| | | |
Sold Contracts | | | | | | | | | | | | | |
Australian 10 Yr Bond Futures | | | 7 | | | | June 2012 | | | | 849,608 | | | | 873,923 | | | | (24,315 | ) |
U.S. 5 Yr Note Futures | | | 32 | | | | June 2012 | | | | 3,941,250 | | | | 3,961,500 | | | | (20,250) | |
U.S. Long Bond Futures | | | 9 | | | | June 2012 | | | | 1,274,075 | | | | 1,285,875 | | | | (11,800 | ) |
| | | | | | | | | | | | | | | | | | | | |
| | | | | | | | | | | | | | | | | | $ | (54,512 | ) |
| | | | | | | | | | | | | | | | | | | | |
FORWARD CURRENCY EXCHANGE CONTRACTS (see Note D)
| | | | | | | | | | | | | | | | |
| Counterparty & Description | | Contract
Amount
(000) | | | U.S. $
Value on
Origination
Date | | | U.S. $
Value at
April 30,
2012 | | | Unrealized
Appreciation/
(Depreciation) | |
Buy Contracts | | | | | | | | | | | | | | | | |
Brown Brothers Harriman & Co.: | | | | | | | | | | | | | | | | |
Australian Dollar settling 5/24/12 | | | 128 | | | $ | 131,727 | | | $ | 132,634 | | | $ | 907 | |
Japanese Yen settling 5/24/12 | | | 3,805 | | | | 47,217 | | | | 47,666 | | | | 449 | |
Norwegian Krone settling 5/24/12 | | | 40 | | | | 6,882 | | | | 6,972 | | | | 90 | |
Swedish Krona settling 5/24/12 | | | 46 | | | | 6,761 | | | | 6,850 | | | | 89 | |
| | | | |
Sale Contracts | | | | | | | | | | | | | | | | |
Brown Brothers Harriman & Co.: | | | | | | | | | | | | | | | | |
Euro settling 5/24/12 | | | 35 | | | | 45,526 | | | | 45,894 | | | | (368 | ) |
Euro settling 5/24/12 | | | 32 | | | | 41,813 | | | | 42,224 | | | | (411 | ) |
South African Rand settling 5/24/12 | | | 14,471 | | | | 1,808,332 | | | | 1,855,249 | | | | (46,917 | ) |
Citibank: | | | | | | | | | | | | | | | | |
New Zealand Dollar settling 5/24/12 | | | 978 | | | | 797,875 | | | | 798,414 | | | | (539 | ) |
| | |
| 26 | | • ALLIANCEBERNSTEIN UNCONSTRAINED BOND FUND |
Portfolio of Investments
| | | | | | | | | | | | | | | | |
| Counterparty & Description | | Contract
Amount
(000) | | | U.S. $
Value on
Origination
Date | | | U.S. $
Value at
April 30,
2012 | | | Unrealized
Appreciation/
(Depreciation) | |
Deutsche Bank: | | | | | | | | | | | | | | | | |
Great British Pound settling 5/24/12 | | | 2,944 | | | $ | 4,666,597 | | | $ | 4,777,854 | | | $ | (111,257) | |
Royal Bank of Canada: | | | | | | | | | | | | | | | | |
Canadian Dollar settling 5/24/12 | | | 220 | | | | 219,629 | | | | 222,599 | | | | (2,970 | ) |
Standard Chartered Bank: | | | | | | | | | | | | | | | | |
Indonesian Rupiah settling 6/15/12 | | | 7,149,532 | | | | 773,759 | | | | 776,178 | | | | (2,419 | ) |
UBS Securities LLC: | | | | | | | | | | | | | | | | |
Euro settling 5/24/12 | | | 2,964 | | | | 3,873,209 | | | | 3,924,126 | | | | (50,917 | ) |
| | | | | | | | | | | | | | | | |
| | | | | | | | | | | | | | $ | (214,263 | ) |
| | | | | | | | | | | | | | | | |
CALL OPTIONS WRITTEN (see Note D)
| | | | | | | | | | | | | | | | |
| Description | | Contracts | | | Exercise
Price | | | Expiration
Month | | | U.S. $ Value | |
Call – SPDR S&P 500 ETF Trust(j)
(premium received $113,278) | | | 163 | | | $ | 133 | | | | May 2012 | | | $ | (119,398) | |
PUT OPTIONS WRITTEN (see Note D)
| | | | | | | | | | | | | | | | |
| Description | | Contracts | | | Exercise
Price | | | Expiration
Month | | | U.S. $ Value | |
Put – SPDR S&P 500 ETF Trust(j)
(premium received $18,904) | | | 163 | | | $ | 133 | | | | May 2012 | | | $ | (5,868) | |
CURRENCY OPTIONS WRITTEN (see Note D)
| | | | | | | | | | | | | | | | | | | | | | | | | | | | |
| Description | | Exercise
Price | | | Expiration
Date | | | Contracts | | | Premiums Received | | | Market
Value | |
Put – JPY vs. USD | | | JPY | | | $ | 80 | | | | 4/12/13 | | | | JPY | | | | 755,290 | | | $ | 421,120 | | | $ | (448,747) | |
CREDIT DEFAULT SWAPTIONS (see Note D)
| | | | | | | | | | | | | | | | | | | | | | | | | | |
| Description | | Counter-
party | | Buy/Sell
Protection | | | Strike
Price | | | Expiration
Date | | | Notional
Amount
(000) | | | Premiums
Received | | | Market
Value | |
Put – CDX NAHY-17 5 Year Index | | JPMorgan
Chase
Bank, N.A. | | | Sell | | | | 0.98 | % | | | 6/20/12 | | | $ | 2,400 | | | $ | 77,290 | | | $ | (45,253 | ) |
Put – CDX NAIG-17 5 Year Index | | Barclays
Bank PLC | | | Sell | | | | 0.90 | | | | 6/20/12 | | | | 16,830 | | | | 75,735 | | | | (56,979 | ) |
Put – CDX NAIG-17 5 Year Index | | Barclays
Bank PLC | | | Buy | | | | 0.85 | | | | 6/20/12 | | | | 16,830 | | | | 21,038 | | | | (23,921 | ) |
Put – CDX NAHY-18 5 Year Index | | Credit
Suisse
International | | | Sell | | | | 0.97 | | | | 5/16/12 | | | | 2,400 | | | | 43,920 | | | | (26,386 | ) |
| | | | | | | | | | | | | | | | | | | | | | | | | | |
| | | | | | | | | | | | | | | | | | | | | | | | $ | (152,539) | |
| | | | | | | | | | | | | | | | | | | | | | | | | | |
| | | | |
| ALLIANCEBERNSTEIN UNCONSTRAINED BOND FUND • | | | 27 | |
Portfolio of Investments
INTEREST RATE SWAP TRANSACTIONS (see Note D)
| | | | | | | | | | | | | | | | | | | | |
| | | | | | | | | | | | Rate Type | | | |
| Swap Counterparty | | Notional
Amount
(000) | | | Termination
Date | | | Payments
made
by the
Fund | | Payments
received
by the
Fund | | Unrealized
Appreciation/
(Depreciation) | |
Bank of America, N.A. | | | $ | | | | 7,850 | | | | 2/1/17 | | | 1.03% | | 3 Month LIBOR | | $ | 762 | |
Barclays Bank PLC | | | | | | | 5,220 | | | | 2/16/17 | | | 1.09% | | 3 Month LIBOR | | | (11,827 | ) |
Citibank, N.A. | | | JPY | | | | 377,500 | | | | 8/1/16 | | | 0.51% | | 6 Month LIBOR | | | (24,427 | ) |
Citibank, N.A. | | | $ | | | | 11,640 | | | | 8/19/16 | | | 1.21% | | 3 Month LIBOR | | | (137,436 | ) |
Citibank, N.A. | | | | | | | 8,660 | | | | 12/2/16 | | | 1.31% | | 3 Month LIBOR | | | (149,583 | ) |
Citibank, N.A. | | | | | | | 23,200 | | | | 1/10/17 | | | 1.21% | | 3 Month LIBOR | | | (251,167 | ) |
Citibank, N.A. | | | | | | | 6,700 | | | | 3/1/17 | | | 1.10% | | 3 Month LIBOR | | | (13,400 | ) |
Citibank, N.A. | | | | | | | 6,360 | | | | 8/19/21 | | | 3 Month LIBOR | | 2.36% | | | 248,787 | |
Citibank, N.A. | | | | | | | 4,700 | | | | 12/2/21 | | | 3 Month LIBOR | | 2.21% | | | 131,578 | |
Citibank, N.A. | | | | | | | 9,700 | | | | 1/10/22 | | | 3 Month LIBOR | | 2.08% | | | 129,209 | |
Citibank, N.A. | | | | | | | 5,040 | | | | 2/3/22 | | | 1.91% | | 3 Month LIBOR | | | 27,568 | |
Citibank, N.A. | | | | | | | 4,700 | | | | 3/21/42 | | | 3.11% | | 3 Month LIBOR | | | (301,031 | ) |
Credit Suisse International | | | GBP | | | | 8,580 | | | | 4/2/14 | | | 6 Month LIBOR | | 1.23% | | | (40,797 | ) |
Credit Suisse International | | | JPY | | | | 3,850,000 | | | | 4/4/14 | | | 0.35% | | 6 Month LIBOR | | | (6,559 | ) |
Credit Suisse International | | | $ | | | | 23,300 | | | | 4/4/14 | | | 0.58% | | 3 Month LIBOR | | | (16,517 | ) |
Credit Suisse International | | | | | | | 12,460 | | | | 4/4/14 | | | 3 Month LIBOR | | 0.58% | | | 9,236 | |
Credit Suisse International | | | GBP | | | | 15,100 | | | | 1/6/17 | | | 1.58% | | 6 Month LIBOR | | | 89,423 | |
Credit Suisse International | | | | | | | 6,000 | | | | 1/6/22 | | | 6 Month LIBOR | | 2.3% | | | (64,129 | ) |
JPMorgan Chase Bank, N.A. | | | $ | | | | 650 | | | | 4/20/20 | | | 3.74% | | 3 Month LIBOR | | | (110,012 | ) |
JPMorgan Chase Bank, N.A. | | | | | | | 950 | | | | 4/26/20 | | | 3.77% | | 3 Month LIBOR | | | (146,431 | ) |
JPMorgan Chase Bank, N.A. | | | | | | | 9,820 | | | | 3/20/22 | | | 2.38% | | 3 Month LIBOR | | | (339,233 | ) |
| | | | | | | | | | | | | | | | | | | | |
| | | | | | | | | | | | | | | | | | $ | (975,986) | |
| | | | | | | | | | | | | | | | | | | | |
| | |
| 28 | | • ALLIANCEBERNSTEIN UNCONSTRAINED BOND FUND |
Portfolio of Investments
CREDIT DEFAULT SWAP CONTRACTS ON CORPORATE, SOVEREIGN ISSUES AND INDICES (see Note D)
| | | | | | | | | | | | | | | | | | | | | | | | |
Swap Counterparty &
Referenced Obligation | | Fixed
Rate
(Pay)
Receive | | | Implied
Credit
Spread at
April 30,
2012 | | | Notional
Amount
(000) | | | Market
Value | | | Upfront
Premiums
(Paid)
Received | | | Unrealized
Appreciation/
(Depreciation) | |
Buy Contracts | | | | | | | | | | | | | | | | | | | | | | | | |
Bank of America, N.A.: | | | | | | | | | | | | | | | | | | | | | | | | |
Republic of Korea,
4.875% 9/22/14, 12/20/16* | | | (1.00 | )% | | | 1.10 | % | | $ | 4,700 | | | $ | 18,736 | | | $ | (210,784) | | | $ | (192,048) | |
United Kingdom of Great Britain and Northern Ireland, 4.25% 6/7/32, 9/20/16* | | | (1.00 | ) | | | 0.51 | | | | 7,070 | | | | (155,093) | | | | 63,245 | | | | (91,848) | |
Barclays Bank PLC: | | | | | | | | | | | | | | | | | | | | | | | | |
Spain Government Bond, 5.5% 7/30/17, 3/20/17* | | | (1.00 | ) | | | 4.71 | | | | 480 | | | | 71,906 | | | | (49,751 | ) | | | 22,155 | |
Credit Suisse International: | | | | | | | | | | | | | | | | | | | | | | | | |
Black & Decker Corp., 5.75% 11/15/16, 6/20/16* | | | (1.00 | )% | | | 0.31 | % | | | 500 | | | | (14,837 | ) | | | 13,806 | | | | (1,031 | ) |
Compagnie de Saint-Gobain, 4.75%, 4/11/17, 6/20/16* | | | (1.00 | ) | | | 0.60 | | | | 500 | | | | (8,810 | ) | | | 8,804 | | | | (6 | ) |
Hershey Co., 6.95% 8/15/12, 6/20/16* | | | (1.00 | ) | | | 0.40 | | | | 500 | | | | (12,973 | ) | | | 11,530 | | | | (1,443 | ) |
Svenska Handelsbanken AB, 1.75% 3/8/10, 6/20/16* | | | (1.00 | ) | | | 1.15 | | | | 500 | | | | 2,384 | | | | 11,052 | | | | 13,436 | |
Deutsche Bank AG: | | | | | | | | | | | | | | | | | | | | | | | | |
France Government Bond OAT, 4.25%, 4/25/19, 3/20/17* | | | (0.25 | ) | | | 1.88 | | | | 2,350 | | | | 175,377 | | | | (169,265 | ) | | | 6,112 | |
Freeport-McMoran Corp., 9.5% 6/1/31, 6/20/16* | | | (1.00 | ) | | | 0.25 | | | | 500 | | | | (15,931 | ) | | | 17,254 | | | | 1,323 | |
Kingdom of Thailand, 7.07% 9/30/13, 9/20/16* | | | (1.00 | ) | | | 1.14 | | | | 9,350 | | | | 49,315 | | | | (239,442 | ) | | | (190,127 | ) |
Republic of Korea, 4.875% 9/22/14, 9/20/16* | | | (1.00 | ) | | | 1.06 | | | | 2,300 | | | | 3,529 | | | | (6,025 | ) | | | (2,496 | ) |
Goldman Sachs International: | | | | | | | | | | | | | | | | | | | | | | | | |
France Government Bond OAT, 4.25%, 4/25/19, 12/20/16* | | | (0.25 | ) | | | 1.82 | | | | 2,350 | | | | 162,108 | | | | (167,084) | | | | (4,976 | ) |
United Kingdom of Great Britain and Northern Ireland, 4.25% 6/7/32, 12/20/16* | | | (1.00 | ) | | | 0.56 | | | | 12,800 | | | | (268,181 | ) | | | (11,233 | ) | | | (279,414) | |
JPMorgan Chase Bank, N.A.: | | | | | | | | | | | | | | | | | | | | | | | | |
CDX NAIG-18 5 Year Index, 6/20/17* | | | (1.00 | ) | | | 0.95 | | | | 4,720 | | | | (17,652 | ) | | | (2,302 | ) | | | (19,954 | ) |
| | | | |
| ALLIANCEBERNSTEIN UNCONSTRAINED BOND FUND • | | | 29 | |
Portfolio of Investments
| | | | | | | | | | | | | | | | | | | | | | | | |
Swap Counterparty &
Referenced Obligation | | Fixed
Rate
(Pay)
Receive | | | Implied
Credit
Spread at
April 30,
2012 | | | Notional
Amount
(000) | | | Market
Value | | | Upfront
Premiums
(Paid)
Received | | | Unrealized
Appreciation/
(Depreciation) | |
Morgan Stanley Capital Services, Inc.: | | | | | | | | | | | | | | | | | | | | | | | | |
Coca-Cola Co., 5.75% 3/15/11, 6/20/16* | | | (1.00 | )% | | | 0.41 | % | | $ | 500 | | | $ | (12,237 | ) | | $ | 13,622 | | | $ | 1,385 | |
Republic of Korea, 4.875% 9/22/14, 9/20/16* | | | (1.00 | ) | | | 1.06 | | | | 2,350 | | | | 3,606 | | | | (4,626 | ) | | | (1,020 | ) |
Target Corp., 5.375% 5/1/17, 6/20/16* | | | (1.00 | ) | | | 0.38 | | | | 500 | | | | (13,396 | ) | | | 10,670 | | | | (2,726 | ) |
UBS AG: | | | | | | | | | | | | | | | | | | | | | | | | |
Federative Republic of Brazil, 12.25% 3/6/30, 6/20/17* | | | (1.00 | ) | | | 1.24 | | | | 7,050 | | | | 74,570 | | | | (109,558 | ) | | | (34,988 | ) |
Republic of Ireland, 4.5% 4/18/20, 3/20/17* | | | (1.00 | ) | | | 5.72 | | | | 480 | | | | 87,109 | | | | (85,550 | ) | | | 1,559 | |
| | | | | | |
Sale Contracts | | | | | | | | | | | | | | | | | | | | | | | | |
Bank of America, N.A.: | | | | | | | | | | | | | | | | | | | | | | | | |
Republic of China, 4.75% 10/29/13, 12/20/16* | | | 1.00 | | | | 1.02 | | | | 4,700 | | | | (1,097 | ) | | | 113,917 | | | | 112,820 | |
Citibank, N.A.: | | | | | | | | | | | | | | | | | | | | | | | | |
CDX NAHY-18 5 Year Index, 6/20/17* | | | 5.00 | | | | 5.79 | | | | 11,400 | | | | (296,875 | ) | | | 483,213 | | | | 186,338 | |
Deutsche Bank AG: | | | | | | | | | | | | | | | | | | | | | | | | |
Repubic of China, 4.75% 10/29/13, 9/20/16* | | | 1.00 | | | | 0.96 | | | | 9,300 | | | | 21,499 | | | | (55,267 | ) | | | (33,768 | ) |
JPMorgan Chase Bank, N.A.: | | | | | | | | | | | | | | | | | | | | | | | | |
CDX NAHY-18 5 Year Index, 6/20/17* | | | 5.00 | | | | 5.79 | | | | 1,180 | | | | (30,729 | ) | | | 61,589 | | | | 30,860 | |
Morgan Stanley Capital Services Inc.: | | | | | | | | | | | | | | | | | | | | | | | | |
CDX EM-17 5 Year Index, 6/20/17* | | | 5.00 | | | | 2.47 | | | | 8,300 | | | | 1,015,367 | | | | (1,055,935 | ) | | | (40,568 | ) |
Repubic of China, 4.75% 10/29/13, 9/20/16* | | | 1.00 | | | | 0.96 | | | | 4,700 | | | | 10,865 | | | | (27,965 | ) | | | (17,100 | ) |
| | | | | | | | | | | | | | | | | | | | | | | | |
| | | | | | | | | | | | | | | | | | | | | | $ | (537,525) | |
| | | | | | | | | | | | | | | | | | | | | | | | |
| | |
| 30 | | • ALLIANCEBERNSTEIN UNCONSTRAINED BOND FUND |
Portfolio of Investments
TOTAL RETURN SWAP CONTRACTS ON INDICES (see Note D)
| | | | | | | | | | | | | | | | | | | | | | |
Receive
Total
Return on
Reference
Index | | Index | | # of
Shares
or Units | | | Rate
Paid by
the Fund | | Notional
Amount
(000) | | | Maturity
Date | | | Counterparty | | Unrealized
Appreciation/
(Depreciation) | |
Receive Total Return on Reference Index | | | | | | | | | | | | | | |
Receive | | LBUSTRUU
Index | | | 33,500 | | | 1-Month
USD-LIBOR
Minus
0.06% | | $ | 58,800 | | | | 5/31/12 | | | Barclays
Bank PLC | | $ | 8,183 | |
Receive | | BCIT3T
Index | | | 46,923 | | | 1-Month
USD-LIBOR
Minus
0.04% | | | 11,840 | | | | 6/2/12 | | | Barclays
Bank PLC | | | 83,357 | |
| | | | | | | | | | | | | | | | | | | | | | |
| | | | | | | | | | | | | | | | | | | | $ | 91,540 | |
| | | | | | | | | | | | | | | | | | | | | | |
UNFUNDED LOAN COMMITMENTS (see Note D.4)
As of April 30, 2012, the Fund had the following unfunded loan commitment of $700,000, which could be extended at the option of the borrower:
| | | | | | | | | | | | |
| Borrower | | Unfunded Loan
Commitments | | | Cost | | | Value | |
General Motors Holding, LLC Revolver
LIBOR + 2.75%, 10/27/15 | | $ | 700,000 | | | $ | — | | | $ | (74,568) | |
| | | | | | | | | | | | |
| (a) | | Security is exempt from registration under Rule 144A of the Securities Act of 1933. These securities are considered liquid and may be resold in transactions exempt from registration, normally to qualified institutional buyers. At April 30, 2012, the aggregate market value of these securities amounted to $6,959,502 or 7.3% of net assets. |
| (b) | | Floating Rate Security. Stated interest rate was in effect at April 30, 2012. |
| (c) | | Coupon rate adjusts periodically based upon a predetermined schedule. Stated interest rate in effect at April 30, 2012. |
| (d) | | Position, or a portion thereof, has been segregated to collateralize OTC derivatives outstanding. The aggregate market value of this security amounted to $2,048,495. |
| (e) | | Non-income producing security. |
| (h) | | Security is exempt from registration under Rule 144A of the Securities Act of 1933. This security, which represents 0.00% of net assets as of April 30, 2012, is considered illiquid and restricted. |
| | | | | | | | | | | | | | | | |
| Restricted Securities | | Acquisition
Date | | | Cost | | | Market
Value | | | Percentage of
Net Assets | |
Nationstar NIM Trust
Series 2007-A, Class A
9.79%, 3/25/37 | | | 4/04/07 | | | $ | 3,301 | | | $ | — | | | | 0.00 | % |
| (i) | | Security is in default and is non-income producing. |
| (j) | | One contract relates to 100 shares. |
| (k) | | Investment in affiliated money market mutual fund. The rate shown represents the 7-day yield as of period end. |
| | | | |
| ALLIANCEBERNSTEIN UNCONSTRAINED BOND FUND • | | | 31 | |
Portfolio of Investments
Currency Abbreviations:
CAD – Canadian Dollar
DOP – Dominican Peso
EUR – Euro
GBP – Great British Pound
IDR – Indonesian Rupiah
JPY – Japanese Yen
NZD – New Zealand Dollar
ZAR – South African Rand
Glossary:
ARMs – Adjustable Rate Mortgages
BCIT3T – Barclays Capital US Inflation Linked Bonds 1 to 10 Year
CDX-EM – Emerging Market Credit Default Swap Index
CDX-NAHY – North American High Yield Credit Default Swap Index
CDX-NAIG – North American Investment Grade Credit Default Swap Index
CMBS – Commercial Mortgage-Backed Securities
LBUSTRUU – Barclays Capital US Agg Total Return Value Unhedged USD
LIBOR – London Interbank Offered Rates
NPFGC – National Public Finance Guarantee Corporation
OJSC – Open Joint Stock Company
REIT – Real Estate Investment Trust
REMICs – Real Estate Mortgage Investment Conduits
TIPS – Treasury Inflation Protected Security
See notes to financial statements.
| | |
| 32 | | • ALLIANCEBERNSTEIN UNCONSTRAINED BOND FUND |
Portfolio of Investments
STATEMENT OF ASSETS & LIABILITIES
April 30, 2012 (unaudited)
| | | | |
| Assets | | | | |
Investments in securities, at value | | | | |
Unaffiliated issuers (cost $76,744,349) | | $ | 76,642,334 | |
Affiliated issuers (cost $17,064,345) | | | 17,064,345 | |
Foreign currencies, at value (cost $154,089) | | | 155,127 | |
Upfront premiums paid on credit default swap contracts | | | 2,194,787 | |
Cash held at broker | | | 1,478,570 | (a) |
Dividends and interest receivable | | | 677,734 | |
Receivable for investment securities sold | | | 649,196 | |
Unrealized appreciation of interest rate swap contracts | | | 636,563 | |
Receivable for capital stock sold | | | 506,441 | |
Unrealized appreciation of credit default swap contracts | | | 375,988 | |
Unrealized appreciation of total return swap contracts | | | 91,540 | |
Receivable from Adviser | | | 7,699 | |
Unrealized appreciation of forward currency exchange contracts | | | 1,535 | |
| | | | |
Total assets | | | 100,481,859 | |
| | | | |
| Liabilities | | | | |
Unrealized depreciation of interest rate swap contracts | | | 1,612,549 | |
Unrealized depreciation of credit default swap contracts | | | 913,513 | |
Upfront premiums received on credit default swap contracts | | | 808,702 | |
Outstanding call option written, at value (premium received $771,285) | | | 726,552 | |
Unrealized depreciation of forward currency exchange contracts | | | 215,798 | |
Payable for capital stock redeemed | | | 151,286 | |
Unfunded loan commitments, at value | | | 74,568 | |
Dividends payable | | | 27,977 | |
Cash collateral received from broker | | | 26,000 | |
Distribution fee payable | | | 21,027 | |
Administrative fee payable | | | 18,688 | |
Due to Custodian | | | 11,468 | |
Transfer Agent fee payable | | | 4,280 | |
Payable for variation margin on futures contracts | | | 2,282 | |
Accrued expenses and other liabilities | | | 64,876 | |
| | | | |
Total liabilities | | | 4,679,566 | |
| | | | |
Net Assets | | $ | 95,802,293 | |
| | | | |
| Composition of Net Assets | | | | |
Capital stock, at par | | $ | 10,845 | |
Additional paid-in capital | | | 99,037,947 | |
Undistributed net investment income | | | 1,768,718 | |
Accumulated net realized loss on investment and foreign currency transactions | | | (3,253,183 | ) |
Net unrealized depreciation of investments and foreign currency denominated assets and liabilities | | | (1,762,034 | ) |
| | | | |
| | $ | 95,802,293 | |
| | | | |
| (a) | | Amount represents margin deposit for options outstanding and margin requirements for open futures contracts outstanding at April 30, 2012. |
See notes to financial statements.
| | | | |
| ALLIANCEBERNSTEIN UNCONSTRAINED BOND FUND • | | | 33 | |
Statement of Assets & Liabilities
Net Asset Value Per Share—21 billion shares of capital stock authorized, $.001 par value
| | | | | | | | | | | | |
| Class | | Net Assets | | | Shares
Outstanding | | | Net Asset
Value | |
| |
| A | | $ | 41,645,022 | | | | 4,712,987 | | | $ | 8.84 | * |
| |
| B | | $ | 2,257,363 | | | | 255,250 | | | $ | 8.84 | |
| |
| C | | $ | 11,558,797 | | | | 1,307,671 | | | $ | 8.84 | |
| |
| Advisor | | $ | 39,215,831 | | | | 4,441,429 | | | $ | 8.83 | |
| |
| R | | $ | 1,071,348 | | | | 121,579 | | | $ | 8.81 | |
| |
| K | | $ | 43,964 | | | | 4,971 | | | $ | 8.84 | |
| |
| I | | $ | 9,968 | | | | 1,130 | | | $ | 8.82 | |
| |
| * | | The maximum offering price per share for Class A shares was $9.23 which reflects a sales charge of 4.25%. |
See notes to financial statements.
| | |
| 34 | | • ALLIANCEBERNSTEIN UNCONSTRAINED BOND FUND |
Statement of Assets & Liabilities
STATEMENT OF OPERATIONS
Six Months Ended April 30, 2012 (unaudited)
| | | | | | | | |
| Investment Income | | | | | | | | |
Interest | | $ | 1,367,953 | | | | | |
Dividends | | | | | | | | |
Unaffiliated issuers (net of foreign taxes withheld of $1,105) | | | 17,328 | | | | | |
Affiliated issuers | | | 4,600 | | | | | |
Other fee income | | | 810 | | | $ | 1,390,691 | |
| | | | | | | | |
| Expenses | | | | | | | | |
Advisory fee (see Note B) | | | 237,785 | | | | | |
Distribution fee—Class A | | | 60,258 | | | | | |
Distribution fee—Class B | | | 12,180 | | | | | |
Distribution fee—Class C | | | 54,100 | | | | | |
Distribution fee—Class R | | | 2,360 | | | | | |
Distribution fee—Class K | | | 130 | | | | | |
Transfer agency—Class A | | | 16,097 | | | | | |
Transfer agency—Class B | | | 1,525 | | | | | |
Transfer agency—Class C | | | 5,072 | | | | | |
Transfer agency—Advisor Class | | | 16,314 | | | | | |
Transfer agency—Class R | | | 1,227 | | | | | |
Transfer agency—Class K | | | 91 | | | | | |
Transfer agency—Class I | | | 2 | | | | | |
Audit | | | 51,064 | | | | | |
Registration fees | | | 47,433 | | | | | |
Custodian | | | 46,878 | | | | | |
Administrative | | | 29,523 | | | | | |
Directors’ fees | | | 27,832 | | | | | |
Printing | | | 20,974 | | | | | |
Legal | | | 20,727 | | | | | |
Miscellaneous | | | 10,586 | | | | | |
| | | | | | | | |
Total expenses before interest expense | | | 662,158 | | | | | |
Less: expenses waived and reimbursed by the Adviser (see Note B) | | | (247,559 | ) | | | | |
| | | | | | | | |
Net expenses | | | | | | | 414,599 | |
| | | | | | | | |
Net investment income | | | | | | | 976,092 | |
| | | | | | | | |
| Realized and Unrealized Gain (Loss) on Investment and Foreign Currency Transactions | | | | | | | | |
Net realized gain (loss) on: | | | | | | | | |
Investment transactions | | | | | | | (1,215,435 | ) |
Swap contracts | | | | | | | 2,626,207 | |
Futures contracts | | | | | | | 541,616 | |
Options written | | | | | | | 793,002 | |
Foreign currency transactions | | | | | | | 482,342 | |
Net change in unrealized appreciation/depreciation of: | | | | | | | | |
Investments | | | | | | | 245,045 | |
Swap contracts | | | | | | | 941,636 | |
Futures contracts | | | | | | | (63,267 | ) |
Options written | | | | | | | 610,220 | |
Unfunded loan commitments | | | | | | | 8,440 | |
Foreign currency denominated assets and liabilities | | | | | | | 345,057 | |
| | | | | | | | |
Net gain on investment and foreign currency transactions | | | | | | | 5,314,863 | |
| | | | | | | | |
Net Increase in Net Assets from Operations | | | | | | $ | 6,290,955 | |
| | | | | | | | |
See notes to financial statements.
| | | | |
| ALLIANCEBERNSTEIN UNCONSTRAINED BOND FUND • | | | 35 | |
Statement of Operations
STATEMENT OF CHANGES IN NET ASSETS
| | | | | | | | |
| | | Six Months Ended
April 30, 2012
(unaudited) | | | Year Ended
October 31,
2011 | |
| Increase (Decrease) in Net Assets from Operations | | | | | | | | |
Net investment income | | $ | 976,092 | | | $ | 2,958,438 | |
Net realized gain on investment and foreign currency transactions | | | 3,227,732 | | | | 464,763 | |
Net change in unrealized appreciation/depreciation of investments and foreign currency denominated assets and liabilities | | | 2,087,131 | | | | (2,218,937 | ) |
| | | | | | | | |
Net increase in net assets from operations | | | 6,290,955 | | | | 1,204,264 | |
Dividends and Distributions
to Shareholders from | | | | | | | | |
Net investment income | | | | | | | | |
Class A | | | (311,299 | ) | | | (1,398,390 | ) |
Class B | | | (10,490 | ) | | | (80,037 | ) |
Class C | | | (46,738 | ) | | | (322,093 | ) |
Advisor Class | | | (380,153 | ) | | | (1,343,685 | ) |
Class R | | | (6,313 | ) | | | (18,477 | ) |
Class K | | | (868 | ) | | | (4,476 | ) |
Class I | | | (89 | ) | | | (353 | ) |
| Capital Stock Transactions | | | | | | | | |
Net increase (decrease) | | | (10,290,899 | ) | | | 29,306,153 | |
Proceeds from third party regulatory settlement (see Note E) | | | 194 | | | | 189 | |
| | | | | | | | |
Total increase (decrease) | | | (4,755,700 | ) | | | 27,343,095 | |
| Net Assets | | | | | | | | |
Beginning of period | | | 100,557,993 | | | | 73,214,898 | |
| | | | | | | | |
End of period (including undistributed net investment income of $1,768,718 and $1,548,576, respectively) | | $ | 95,802,293 | | | $ | 100,557,993 | |
| | | | | | | | |
See notes to financial statements.
| | |
| 36 | | • ALLIANCEBERNSTEIN UNCONSTRAINED BOND FUND |
Statement of Changes in Net Assets
NOTES TO FINANCIAL STATEMENTS
April 30, 2012 (unaudited)
NOTE A
Significant Accounting Policies
AllianceBernstein Unconstrained Bond Fund, Inc. (the “Fund”), formerly AllianceBernstein Diversified Yield Fund, Inc., was incorporated in the State of Maryland on October 25, 1995 and is registered under the Investment Company Act of 1940 as a diversified, open-end management investment company. The Fund offers Class A, Class B, Class C, Advisor Class, Class R, Class K and Class I shares. Class A shares are sold with a front-end sales charge of up to 4.25% for purchases not exceeding $1,000,000. With respect to purchases of $1,000,000 or more, Class A shares redeemed within one year of purchase may be subject to a contingent deferred sales charge of 1%. Class B shares are currently sold with a contingent deferred sales charge which declines from 4% to zero depending on the period of time the shares are held. Effective January 31, 2009, sales of Class B shares of the Fund to new investors were suspended. Class B shares will only be issued (i) upon the exchange of Class B shares from another AllianceBernstein Mutual Fund, (ii) for purposes of dividend reinvestment, (iii) through the Fund’s Automatic Investment Program (the “Program”) for accounts that established the Program prior to January 31, 2009, and (iv) for purchases of additional shares by Class B shareholders as of January 31, 2009. The ability to establish a new Program for accounts containing Class B shares was suspended as of January 31, 2009. Class B shares will automatically convert to Class A shares eight years after the end of the calendar month of purchase. Class C shares are subject to a contingent deferred sales charge of 1% on redemptions made within the first year after purchase. Class R and Class K shares are sold without an initial or contingent deferred sales charge. Advisor Class and Class I shares are sold without an initial or contingent deferred sales charge and are not subject to ongoing distribution expenses. All seven classes of shares have identical voting, dividend, liquidation and other rights and the same terms and conditions, except that the classes bear different distribution and transfer agency expenses. Each class has exclusive voting rights with respect to its distribution plan. The financial statements have been prepared in conformity with U.S. generally accepted accounting principles (“U.S. GAAP”), which require management to make certain estimates and assumptions that affect the reported amounts of assets and liabilities in the financial statements and amounts of income and expenses during the reporting period. Actual results could differ from those estimates. The following is a summary of significant accounting policies followed by the Fund.
1. Security Valuation
Portfolio securities are valued at their current market value determined on the basis of market quotations or, if market quotations are not readily available or are deemed unreliable, at “fair value” as determined in accordance with procedures established by and under the general supervision of the Fund’s Board of Directors.
In general, the market value of securities which are readily available and deemed reliable are determined as follows: securities listed on a national securities
| | | | |
| ALLIANCEBERNSTEIN UNCONSTRAINED BOND FUND • | | | 37 | |
Notes to Financial Statements
exchange (other than securities listed on the NASDAQ Stock Market, Inc. (“NASDAQ”)) or on a foreign securities exchange are valued at the last sale price at the close of the exchange or foreign securities exchange. If there has been no sale on such day, the securities are valued at the last traded price from the previous day. Securities listed on more than one exchange are valued by reference to the principal exchange on which the securities are traded; securities listed only on NASDAQ are valued in accordance with the NASDAQ Official Closing Price; listed or over the counter market (“OTC”) put or call options are valued at the mid level between the current bid and asked prices. If either a current bid or current ask price is unavailable, AllianceBernstein L.P. (the “Adviser”) will have discretion to determine the best valuation (e.g. last trade price in the case of listed options); open futures contracts are valued using the closing settlement price or, in the absence of such a price, the most recent quoted bid price. If there are no quotations available for the day of valuation, the last available closing settlement price is used; U.S. government securities and other debt instruments having 60 days or less remaining until maturity are valued at amortized cost if their original maturity was 60 days or less; or by amortizing their fair value as of the 61st day prior to maturity if their original term to maturity exceeded 60 days; fixed-income securities, including mortgage backed and asset backed securities, may be valued on the basis of prices provided by a pricing service or at a price obtained from one or more of the major broker/dealers. In cases where broker/dealer quotes are obtained, the Adviser may establish procedures whereby changes in market yields or spreads are used to adjust, on a daily basis, a recently obtained quoted price on a security. Swaps and other derivatives are valued daily, primarily using independent pricing services, independent pricing models using market inputs, as well as third party broker-dealers or counterparties. Investments in money market funds are valued at their net asset value each day.
Securities for which market quotations are not readily available (including restricted securities) or are deemed unreliable are valued at fair value. Factors considered in making this determination may include, but are not limited to, information obtained by contacting the issuer, analysts, analysis of the issuer’s financial statements or other available documents. In addition, the Fund may use fair value pricing for securities primarily traded in non-U.S. markets because most foreign markets close well before the Fund values its securities at 4:00 p.m., Eastern Time. The earlier close of these foreign markets gives rise to the possibility that significant events, including broad market moves, may have occurred in the interim and may materially affect the value of those securities.
2. Fair Value Measurements
In accordance with U.S. GAAP regarding fair value measurements, fair value is defined as the price that the Fund would receive to sell an asset or pay to transfer a liability in an orderly transaction between market participants at the measurement date. The U.S. GAAP disclosure requirements establish a framework for measuring fair value, and a three-level hierarchy for fair value measurements
| | |
| 38 | | • ALLIANCEBERNSTEIN UNCONSTRAINED BOND FUND |
Notes to Financial Statements
based upon the transparency of inputs to the valuation of an asset or liability. Inputs may be observable or unobservable and refer broadly to the assumptions that market participants would use in pricing the asset or liability. Observable inputs reflect the assumptions market participants would use in pricing the asset or liability based on market data obtained from sources independent of the Fund. Unobservable inputs reflect the Fund’s own assumptions about the assumptions that market participants would use in pricing the asset or liability based on the best information available in the circumstances. Each investment is assigned a level based upon the observability of the inputs which are significant to the overall valuation. The three-tier hierarchy of inputs is summarized below.
| | • | | Level 1—quoted prices in active markets for identical investments |
| | • | | Level 2—other significant observable inputs (including quoted prices for similar investments, interest rates, prepayment speeds, credit risk, etc.) |
| | • | | Level 3—significant unobservable inputs (including the Fund’s own assumptions in determining the fair value of investments) |
The following table summarizes the valuation of the Fund’s investments by the above fair value hierarchy levels as of April 30, 2012:
| | | | | | | | | | | | | | | | |
Investments in Securities | | Level 1 | | | Level 2 | | | Level 3 | | | Total | |
Corporates—Investment Grades | | $ | – 0 | – | | $ | 18,059,333 | | | $ | – 0 | – | | $ | 18,059,333 | |
Governments—Treasuries | | | – 0 | – | | | 16,867,763 | | | | – 0 | – | | | 16,867,763 | |
Inflation-Linked Securities | | | – 0 | – | | | 4,753,608 | | | | – 0 | – | | | 4,753,608 | |
Governments—Sovereign Agencies | | | – 0 | – | | | 3,171,371 | | | | – 0 | – | | | 3,171,371 | |
Corporates—Non-Investment Grades | | | – 0 | – | | | 2,259,878 | | | | 212,188 | | | | 2,472,066 | |
Mortgage Pass-Throughs | | | – 0 | – | | | 2,252,515 | | | | – 0 | – | | | 2,252,515 | |
Asset-Backed Securities | | | – 0 | – | | | 529,143 | | | | 879,828 | | | | 1,408,971 | |
Collateralized Mortgage Obligations | | | – 0 | – | | | 155,979 | | | | 1,109,051 | | | | 1,265,030 | |
Bank Loans | | | – 0 | – | | | – 0 | – | | | 1,066,340 | | | | 1,066,340 | |
Quasi-Sovereigns | | | – 0 | – | | | 929,013 | | | | – 0 | – | | | 929,013 | |
Preferred Stocks | | | 162,564 | | | | 420,937 | | | | – 0 | – | | | 583,501 | |
Emerging Markets—Sovereigns | | | – 0 | – | | | 489,600 | | | | – 0 | – | | | 489,600 | |
Supranationals | | | – 0 | – | | | 347,178 | | | | – 0 | – | | | 347,178 | |
Emerging Markets—Treasuries | | | – 0 | – | | | – 0 | – | | | 198,138 | | | | 198,138 | |
Commercial Mortgage-Backed Securities | | | – 0 | – | | | – 0 | – | | | 171,056 | | | | 171,056 | |
Emerging Markets—Corporate Bonds | | | – 0 | – | | | 169,133 | | | | – 0 | – | | | 169,133 | |
Local Governments—Municipal Bonds | | | – 0 | – | | | 105,297 | | | | – 0 | – | | | 105,297 | |
Options Purchased—Calls | | | 50,775 | | | | – 0 | – | | | – 0 | – | | | 50,775 | |
Options Purchased—Puts | | | 62,747 | | | | – 0 | – | | | 220,067 | | | | 282,814 | |
Short-Term Investments | | | 39,063,177 | | | | – 0 | – | | | – 0 | – | | | 39,063,177 | |
| | | | | | | | | | | | | | | | |
Total Investments in Securities | | | 39,339,263 | | | | 50,510,748 | | | | 3,856,668 | | | | 93,706,679 | |
| | | | |
| ALLIANCEBERNSTEIN UNCONSTRAINED BOND FUND • | | | 39 | |
Notes to Financial Statements
| | | | | | | | | | | | | | | | |
Investments in Securities | | Level 1 | | | Level 2 | | | Level 3 | | | Total | |
Other Financial Instruments*: | | | | | | | | | | | | | | | | |
Assets | | | | | | | | | | | | | | | | |
Credit Default Swaps | | $ | – 0 | – | | $ | 375,988 | | | $ | – 0 | – | | $ | 375,988 | |
Interest Rate Swaps | | | – 0 | – | | | 608,233 | | | | 28,330 | | | | 636,563 | |
Futures Contracts | | | 1,853 | | | | – 0 | – | | | – 0 | – | | | 1,853 | † |
Forward Currency Exchange Contracts | | | – 0 | – | | | 1,535 | | | | – 0 | – | | | 1,535 | |
Total Return Swaps | | | – 0 | – | | | – 0 | – | | | 91,540 | | | | 91,540 | |
Liabilities | | | | | | | | | | | | | | | | |
Credit Default Swaps | | | – 0 | – | | | (913,513 | ) | | | – 0 | – | | | (913,513 | ) |
Interest Rate Swaps | | | – 0 | – | | | (1,612,549 | ) | | | – 0 | – | | | (1,612,549 | ) |
Futures Contracts | | | (56,365 | ) | | | – 0 | – | | | – 0 | – | | | (56,365 | )† |
Forward Currency Exchange Contracts | | | – 0 | – | | | (215,798 | ) | | | – 0 | – | | | (215,798 | ) |
Written Options | | | (125,266 | ) | | | – 0 | – | | | (601,286 | ) | | | (726,552 | ) |
Unfunded Loan Commitment | | | – 0 | – | | | – 0 | – | | | (74,568 | ) | | | (74,568 | ) |
| | | | | | | | | | | | | | | | |
Total | | $ | 39,159,485 | | | $ | 48,754,644 | | | $ | 3,300,684 | | | $ | 91,214,813 | |
| | | | | | | | | | | | | | | | |
| * | | Other financial instruments are derivative instruments, such as futures, forwards and swaps contracts, which are valued at the unrealized appreciation/depreciation on the instrument. Other financial instruments may also include options written which are valued at market value. |
| † | | Only variation margin receivable/payable at period end is reported within the statements of assets and liabilities. Cumulative appreciation/depreciation of futures contracts is reported in the portfolio of investments. |
Following is a reconciliation of investments in which significant unobservable inputs (Level 3) were used in determining fair value. The transfers between levels of the fair value hierarchy assumes the financial instrument was transferred at the beginning of the reporting period.
| | | | | | | | | | | | | | | | |
| | | Corporates -
Non Investment
Grades | | | Asset-
Backed
Securities | | | Collateralized
Mortgage
Obligations | | | Bank Loans | |
Balance as of 10/31/11 | | $ | – 0 | – | | $ | 1,456,579 | | | $ | 1,380,355 | | | $ | 2,020,562 | |
Accrued
discounts/(premiums) | | | – 0 | – | | | 265 | | | | (264 | ) | | | 11,284 | |
Realized gain (loss) | | | – 0 | – | | | (12,084 | ) | | | (462 | ) | | | (11,282 | ) |
Change in unrealized appreciation/depreciation | | | 5,636 | | | | 20,311 | | | | 190,367 | | | | 48,672 | |
Purchases | | | 206,552 | | | | – 0 | – | | | 389 | | | | 419,796 | |
Sales | | | – 0 | – | | | (585,243 | ) | | | (239,990 | ) | | | (1,421,369 | ) |
Settlements | | | – 0 | – | | | – 0 | – | | | – 0 | – | | | – 0 | – |
Transfers into Level 3 | | | – 0 | – | | | – 0 | – | | | – 0 | – | | | – 0 | – |
Transfers out of Level 3 | | | – 0 | – | | | – 0 | – | | | (221,344 | ) | | | (1,323 | ) |
| | | | | | | | | | | | | | | | |
Balance as of 4/30/12 | | $ | 212,188 | | | $ | 879,828 | | | $ | 1,109,051 | | | $ | 1,066,340 | |
| | | | | | | | | | | | | | | | |
Net change in unrealized
appreciation/depreciation
from investments held as of 4/30/12 | | $ | 5,636 | | | $ | (74,076 | ) | | $ | 37,690 | | | $ | (70,036 | ) |
| | |
| 40 | | • ALLIANCEBERNSTEIN UNCONSTRAINED BOND FUND |
Notes to Financial Statements
| | | | | | | | | | | | | | | | |
| | | | |
| | | Emerging
Markets -
Treasuries | | | Commercial
Mortgage-
Backed
Securities | | | Options
Purchased -
Calls | | | Options
Purchased -
Puts | |
Balance as of 10/31/11 | | $ | 403,962 | | | $ | 276,033 | | | $ | 8,075 | | | $ | 530,255 | |
Accrued
discounts/(premiums) | | | 230 | | | | – 0 | – | | | – 0 | – | | | – 0 | – |
Realized gain (loss) | | | (8,293 | ) | | | (4,200 | ) | | | (84,600 | ) | | | (747,629 | ) |
Change in unrealized appreciation/depreciation | | | 1,842 | | | | 23 | | | | 76,525 | | | | 252,261 | |
Purchases | | | – 0 | – | | | – 0 | – | | | – 0 | – | | | 185,180 | |
Sales | | | (199,603 | ) | | | (100,800 | ) | | | – 0 | – | | | – 0 | – |
Settlements | | | – 0 | – | | | – 0 | – | | | – 0 | – | | | – 0 | – |
Transfers into Level 3 | | | – 0 | – | | | – 0 | – | | | – 0 | – | | | – 0 | – |
Transfers out of Level 3 | | | – 0 | – | | | – 0 | – | | | – 0 | – | | | – 0 | – |
| | | | | | | | | | | | | | | | |
Balance as of 4/30/12 | | $ | 198,138 | | | $ | 171,056 | | | $ | – 0 | – | | $ | 220,067 | |
| | | | | | | | | | | | | | | | |
Net change in unrealized appreciation/depreciation from investments held as of 4/30/12 | | $ | (2,588 | ) | | $ | (4,476 | ) | | $ | – 0 | – | | $ | 34,887 | |
| | | | | | | | | | | | | | | | |
| | | | |
| | | Credit
Default
Swaps | | | Total
Return
Swaps | | | Variance
Swaps | | | Interest
Rate
Swaps | |
Balance as of 10/31/11 | | $ | 117,080 | | | $ | 16,448 | | | $ | 95,934 | | | $ | – 0 | – |
Accrued discounts/(premiums) | | | – 0 | – | | | (21,479 | ) | | | – 0 | – | | | – 0 | – |
Realized gain (loss) | | | 195,738 | | | | 1,419,914 | | | | 45,694 | | | | – 0 | – |
Change in unrealized appreciation/depreciation | | | (117,080 | ) | | | 75,092 | | | | (95,934 | ) | | | 28,330 | |
Purchases | | | – 0 | – | | | – 0 | – | | | – 0 | – | | | – 0 | – |
Sales | | | – 0 | – | | | – 0 | – | | | – 0 | – | | | – 0 | – |
Settlements | | | (195,738 | ) | | | (1,398,435 | ) | | | (45,694 | ) | | | – 0 | – |
Transfers into Level 3 | | | – 0 | – | | | – 0 | – | | | – 0 | – | | | – 0 | – |
Transfers out of Level 3 | | | – 0 | – | | | – 0 | – | | | – 0 | – | | | – 0 | – |
| | | | | | | | | | | | | | | | |
Balance as of 4/30/12 | | $ | – 0 | – | | $ | 91,540 | | | $ | – 0 | – | | $ | 28,330 | |
| | | | | | | | | | | | | | | | |
Net change in unrealized appreciation/depreciation from investments held as of 4/30/12 | | $ | – 0 | – | | $ | 82,071 | | | $ | – 0 | – | | $ | 28,330 | |
| | | | |
| ALLIANCEBERNSTEIN UNCONSTRAINED BOND FUND • | | | 41 | |
Notes to Financial Statements
| | | | | | | | | | | | |
| | | |
| | | Written
Options | | | Unfunded
Loan
Commitment | | | Total | |
Balance as of 10/31/11 | | $ | (1,304,476 | ) | | $ | (23,749 | ) | | $ | 4,977,058 | |
Accrued discounts/(premiums) | | | – 0 | – | | | – 0 | – | | | (9,964 | ) |
Realized gain (loss) | | | (424,351 | ) | | | – 0 | – | | | 368,445 | |
Change in unrealized
appreciation/depreciation | | | 663,373 | | | | 8,440 | | | | 1,157,858 | |
Purchases | | | 1,103,270 | | | | (59,259 | ) | | | 1,855,928 | |
Sales | | | (639,102 | ) | | | – 0 | – | | | (3,186,107 | ) |
Settlements | | | – 0 | – | | | – 0 | – | | | (1,639,867 | ) |
Transfers into Level 3 | | | – 0 | – | | | – 0 | – | | | – 0 | – |
Transfers out of Level 3 | | | – 0 | – | | | – 0 | – | | | (222,667 | ) |
| | | | | | | | | | | | |
Balance as of 4/30/12 | | $ | (601,286 | ) | | $ | (74,568 | ) | | $ | 3,300,684 | |
| | | | | | | | | | | | |
Net change in unrealized
appreciation/depreciation from investments held as of 4/30/12 | | $ | 37,816 | | | $ | (50,819 | ) | | $ | 24,435 | ** |
| ** | | The unrealized appreciation/depreciation is included in net change in unrealized appreciation/depreciation of investments and other financial instruments in the accompanying statement of operations. |
3. Currency Translation
Assets and liabilities denominated in foreign currencies and commitments under forward currency exchange contracts are translated into U.S. dollars at the mean of the quoted bid and ask prices of such currencies against the U.S. dollar. Purchases and sales of portfolio securities are translated into U.S. dollars at the rates of exchange prevailing when such securities were acquired or sold. Income and expenses are translated into U.S. dollars at rates of exchange prevailing when accrued.
Net realized gain or loss on foreign currency transactions represents foreign exchange gains and losses from sales and maturities of foreign fixed income investments, foreign currency exchange contracts, holding of foreign currencies, currency gains or losses realized between the trade and settlement dates on foreign investment transactions, and the difference between the amounts of dividends, interest and foreign withholding taxes recorded on the Fund’s books and the U.S. dollar equivalent amounts actually received or paid. Net unrealized currency gains and losses from valuing foreign currency denominated assets and liabilities at period end exchange rates are reflected as a component of net unrealized appreciation and depreciation of investments and foreign currency denominated assets and liabilities.
4. Taxes
It is the Fund’s policy to meet the requirements of the Internal Revenue Code applicable to regulated investment companies and to distribute all of its investment company taxable income and net realized gains, if any, to shareholders. Therefore, no provisions for federal income or excise taxes are required. The Fund may be subject to taxes imposed by countries in which it invests. Such
| | |
| 42 | | • ALLIANCEBERNSTEIN UNCONSTRAINED BOND FUND |
Notes to Financial Statements
taxes are generally based on income and/or capital gains earned or repatriated. Taxes are accrued and applied to net investment income, net realized gains and net unrealized appreciation/depreciation as such income and/or gains are earned.
In accordance with U.S. GAAP requirements regarding accounting for uncertainties in income taxes, management has analyzed the Fund’s tax positions taken or expected to be taken on federal and state income tax returns for all open tax years (the current and the prior three tax years) and has concluded that no provision for income tax is required in the Fund’s financial statements.
5. Investment Income and Investment Transactions
Interest income is accrued daily. Investment transactions are accounted for on the date securities are purchased or sold. Investment gains or losses are determined on the identified cost basis. The Fund amortizes premiums and accretes discounts as adjustments to interest income.
6. Class Allocations
All income earned and expenses incurred by the Fund are borne on a pro-rata basis by each settled class of shares, based on the proportionate interest in the Fund represented by the net assets of such class, except for class specific expenses which are allocated to the respective class. Realized and unrealized gains and losses are allocated among various share classes based on their respective net assets.
7. Dividends and Distributions
Dividends and distributions to shareholders, if any, are recorded on the ex-dividend date. Income dividends and capital gains distributions are determined in accordance with federal tax regulations and may differ from those determined in accordance with U.S. GAAP. To the extent these differences are permanent, such amounts are reclassified within the capital accounts based on their federal tax basis treatment; temporary differences do not require such reclassification.
8. Repurchase Agreements
It is the Fund’s policy that its custodian or designated subcustodian take control of securities as collateral under repurchase agreements and to determine on a daily basis that the value of such securities is sufficient to cover the value of the repurchase agreements. If the seller defaults and the value of the collateral declines, or if bankruptcy proceedings are commenced with respect to seller of the security, realization of collateral by the Fund may be delayed or limited.
| | | | |
| ALLIANCEBERNSTEIN UNCONSTRAINED BOND FUND • | | | 43 | |
Notes to Financial Statements
NOTE B
Advisory Fee and Other Transactions with Affiliates
Under the terms of the investment advisory agreement, the Fund pays the Adviser an advisory fee at an annual rate of .50% of the first $2.5 billion, .45% of the next $2.5 billion and .40% in excess of $5 billion, of the Fund’s average daily net assets. The fee is accrued daily and paid monthly.
The Adviser has agreed to waive its fees and bear certain expenses to the extent necessary to limit total operating expenses on an annual basis to .90%, 1.60%, 1.60%, .60%, 1.10%, .85% and .60% of the daily average net assets for the Class A, Class B, Class C, Advisor Class, Class R, Class K and Class I shares, respectively. This waiver extends through October 31, 2012 and then may be extended by the Adviser for additional one-year terms. For the six months ended April 30, 2012, such reimbursement amounted to $247,559.
Pursuant to the investment advisory agreement, the Fund may reimburse the Adviser for certain legal and accounting services provided to the Fund by the Adviser. For the six months ended April 30, 2012, such fee amounted to $29,523.
The Fund compensates AllianceBernstein Investor Services, Inc. (“ABIS”), a wholly-owned subsidiary of the Adviser, under a Transfer Agency Agreement for providing personnel and facilities to perform transfer agency services for the Fund. ABIS may make payments to intermediaries that provide omnibus account services, sub-accounting services and/or networking services. The compensation retained by ABIS amounted to $16,436 for the six months ended April 30, 2012.
For the six months ended April 30, 2012, there was no reduction for the expenses of Class A, Class B, Class C and Advisor Class shares under an expense offset arrangement with ABIS.
AllianceBernstein Investments, Inc. (the “Distributor”), a wholly-owned subsidiary of the Adviser, serves as the distributor of the Fund’s shares. The Distributor has advised the Fund that it has retained front-end sales charges of $1,903 from the sale of Class A shares and received $263, $691 and $117 in contingent deferred sales charges imposed upon redemption by shareholders of Class A, Class B and Class C shares, respectively, for the six months ended April 30, 2012.
The Fund may invest in the AllianceBernstein Fixed-Income Shares, Inc.—Government STIF Portfolio, an open-end management investment company managed by the Adviser. The Government STIF Portfolio is offered as a cash management option to mutual funds and other institutional accounts of the Adviser, and is not available for direct purchase by members of the public. The Government STIF Portfolio pays no investment management fees but does bear
| | |
| 44 | | • ALLIANCEBERNSTEIN UNCONSTRAINED BOND FUND |
Notes to Financial Statements
its own expenses. A summary of the Fund’s transactions in shares of the Government STIF Portfolio for the six months ended April 30, 2012 is as follows:
| | | | | | | | | | | | | | | | |
Market Value
October 31, 2011
(000) | | Purchases
at Cost
(000) | | | Sales
Proceeds
(000) | | | Market Value
April 30, 2012
(000) | | | Dividend
Income
(000) | |
| $ 6,403 | | $ | 123,946 | | | $ | 113,285 | | | $ | 17,064 | | | $ | 5 | |
NOTE C
Distribution Services Agreement
The Fund has adopted a Distribution Services Agreement (the “Agreement”) pursuant to Rule 12b-1 under the Investment Company Act of 1940. Under the Agreement the Fund pays distribution and servicing fees to the Distributor at an annual rate of up to .30% of the Fund’s average daily net assets attributable to Class A shares, 1% of the Fund’s average daily net assets attributable to Class B and Class C shares, .50% of the Fund’s average daily net assets attributable to Class R shares and .25% of the Fund’s average daily net assets attributable to Class K shares. There are no distribution and servicing fees on Advisor Class and Class I shares. The fees are accrued daily and paid monthly. The Agreement provides that the Distributor will use such payments in their entirety for distribution assistance and promotional activities. Since the commencement of the Fund’s operation, the Distributor has incurred expenses in excess of the distribution costs reimbursed by the Fund in the amounts of $8,360,628, $2,001,887, $33,600 and $12,973 for Class B, Class C, Class R and Class K shares, respectively. While such costs may be recovered from the Fund in future periods so long as the Agreement is in effect, the rate of the distribution and servicing fees payable under the Agreement may not be increased without a shareholder vote. In accordance with the Agreement, there is no provision for recovery of unreimbursed distribution costs, incurred by the Distributor, beyond the current fiscal period for Class A shares. The Agreement also provides that the Adviser may use its own resources to finance the distribution of the Fund’s shares.
NOTE D
Investment Transactions
Purchases and sales of investment securities (excluding short-term investments) for the six months ended April 30, 2012, were as follows:
| | | | | | | | |
| | | Purchases | | | Sales | |
Investment securities (excluding
U.S. government securities) | | $ | 29,473,963 | | | $ | 49,211,838 | |
U.S. government securities | | | 16,534,359 | | | | 26,765,351 | |
| | | | |
| ALLIANCEBERNSTEIN UNCONSTRAINED BOND FUND • | | | 45 | |
Notes to Financial Statements
The cost of investments for federal income tax purposes was substantially the same as cost for financial reporting purposes. Accordingly, gross unrealized appreciation and unrealized depreciation (excluding foreign currency contracts and futures contracts) are as follows:
| | | | |
Gross unrealized appreciation | | $ | 2,686,959 | |
Gross unrealized depreciation | | | (2,788,974 | ) |
| | | | |
Net unrealized depreciation | | $ | (102,015 | ) |
| | | | |
1. Derivative Financial Instruments
The Fund may use derivatives in an effort to earn income and enhance returns, to replace more traditional direct investments, to obtain exposure to otherwise inaccessible markets (collectively, “investment purpose”), or to hedge or adjust the risk profile of its portfolio.
The principal types of derivatives utilized by the Fund, as well as the methods in which they may be used are:
| | • | | Forward Currency Exchange Contracts |
The Fund may enter into forward currency exchange contracts in order to hedge its exposure to changes in foreign currency exchange rates on its foreign portfolio holdings, to hedge certain firm purchase and sales commitments denominated in foreign currencies and for non-hedging purposes as a means of making direct investments in foreign currencies, as described below under “Currency Transactions”.
A forward currency exchange contract is a commitment to purchase or sell a foreign currency at a future date at a negotiated forward rate. The gain or loss arising from the difference between the original contract and the closing of such contract would be included in net realized gain or loss on foreign currency transactions. Fluctuations in the value of open forward currency exchange contracts are recorded for financial reporting purposes as unrealized appreciation and/or depreciation by the Fund. Risks may arise from the potential inability of a counterparty to meet the terms of a contract and from unanticipated movements in the value of a foreign currency relative to the U.S. dollar. The face or contract amount, in U.S. dollars reflects the total exposure the Fund has in that particular currency contract.
During the six months ended April 30, 2012, the Fund held foreign-currency contracts for hedging and non-hedging purposes.
The Fund may buy or sell futures contracts for investment purposes or for the purpose of hedging its portfolio against adverse effects of potential movements in the market. The Fund bears the market risk that arises from changes in the value of these instruments and the imperfect correlation
| | |
| 46 | | • ALLIANCEBERNSTEIN UNCONSTRAINED BOND FUND |
Notes to Financial Statements
between movements in the price of the futures contracts and movements in the price of the assets, reference rates or indices which they are designed to track. Among other things, the Fund may purchase or sell futures contracts for foreign currencies or options thereon for non-hedging purposes as a means of making direct investment in foreign currencies, as described below under “Currency Transactions”.
At the time the Fund enters into a futures contract, the Fund deposits and maintains as collateral an initial margin with the broker, as required by the exchange on which the transaction is effected. Pursuant to the contract, the Fund agrees to receive from or pay to the broker an amount of cash equal to the daily fluctuation in the value of the contract. Such receipts or payments are known as variation margin and are recorded by the Fund as unrealized gains or losses. Risks may arise from the potential inability of a counter party to meet the terms of the contract. The credit/counterparty risk for exchange-traded futures contracts is generally less than privately negotiated futures contracts, since the clearinghouse, which is the issuer or counterparty to each exchange-traded future, provides a guarantee of performance. The guarantee is supported by a daily payment system (i.e., margin requirements). When the contract is closed, the Fund records a realized gain or loss equal to the difference between the value of the contract at the time it was opened and the time it was closed.
Use of long futures contracts subjects the Fund to risk of loss in excess of the amounts shown on the statement of assets and liabilities, up to the notional value of the futures contracts. Use of short futures contracts subjects the Fund to unlimited risk of loss. Under some circumstances, futures exchanges may establish daily limits on the amount that the price of a futures contract can vary from the previous day’s settlement price, which could effectively prevent liquidation of unfavorable positions.
During the six months ended April 30, 2012, the Fund held future contracts for hedging and non-hedging purposes.
For hedging and investment purposes, the Fund may purchase and write (sell) put and call options on U.S. and foreign securities, including government securities, and foreign currencies that are traded on U.S. and foreign securities exchanges and over-the-counter markets. Among other things, the Fund may use options transactions for non-hedging purposes as a means of making direct investments in foreign currencies, as described below under “Currency Transactions” and may use options strategies involving the purchase and/or writing of various combinations of call and/or put options, for hedging and investment purposes.
The risk associated with purchasing an option is that the Fund pays a premium whether or not the option is exercised. Additionally, the Fund bears the risk of loss of the premium and change in market value should
| | | | |
| ALLIANCEBERNSTEIN UNCONSTRAINED BOND FUND • | | | 47 | |
Notes to Financial Statements
the counterparty not perform under the contract. Put and call options purchased are accounted for in the same manner as portfolio securities. The cost of securities acquired through the exercise of call options is increased by premiums paid. The proceeds from securities sold through the exercise of put options are decreased by the premiums paid.
The Fund may also invest in options on swap agreements, also called “swaptions”. A swaption is an option that gives the buyer the right, but not the obligation, to enter into a swap on a future date in exchange for paying a market-based “premium”. A receiver swaption gives the owner the right to receive the total return of a specified asset, reference rate, or index. A payer swaption gives the owner the right to pay the total return of a specified asset, reference rate, or index. Swaptions also include options that allow an existing swap to be terminated or extended by one of the counterparties.
When the Fund writes an option, the premium received by the Fund is recorded as a liability and is subsequently adjusted to the current market value of the option written. Premiums received from written options which expire unexercised are recorded by the Fund on the expiration date as realized gains from options written. The difference between the premium received and the amount paid on effecting a closing purchase transaction, including brokerage commissions, is also treated as a realized gain, or if the premium received is less than the amount paid for the closing purchase transaction, as a realized loss. If a call option is exercised, the premium received is added to the proceeds from the sale of the underlying security or currency in determining whether the Fund has realized a gain or loss. If a put option is exercised, the premium received reduces the cost basis of the security or currency purchased by the Fund. In writing an option, the Fund bears the market risk of an unfavorable change in the price of the security or currency underlying the written option. Exercise of an option written by the Fund could result in the Fund selling or buying a security or currency at a price different from the current market value.
During the six months ended April 30, 2012, the Fund held purchased options for hedging and non-hedging purposes.
During the six months ended April 30, 2012, the Fund held written options for non-hedging purposes.
| | |
| 48 | | • ALLIANCEBERNSTEIN UNCONSTRAINED BOND FUND |
Notes to Financial Statements
For the six months ended April 30, 2012, the Fund had the following transactions in written options:
| | | | | | | | |
| | | Number of
Contracts | | | Premiums
Received | |
Options written outstanding as of 10/31/11 | | | 18,891,627,090 | | | $ | 1,578,647 | |
Options written | | | 25,996,289,366 | | | | 4,080,342 | |
Options expired | | | (31,467,351,620 | ) | | | (500,778 | ) |
Options bought back | | | (12,626,814,510 | ) | | | (4,386,926 | ) |
Options exercised | | | – 0 | – | | | – 0 | – |
| | | | | | | | |
Options written outstanding as of 4/30/12 | | | 793,750,326 | | | $ | 771,285 | |
| | | | | | | | |
The Fund may enter into swaps to hedge its exposure to interest rates, credit risk, or currencies. The Fund may also enter into swaps for non-hedging purposes as a means of gaining market exposures including by making direct investments in foreign currencies, as described below under “Currency Transactions” or in order to take a “long” or “short” position with respect to an underlying referenced asset described below under “Total Return Swaps”. A swap is an agreement that obligates two parties to exchange a series of cash flows at specified intervals based upon or calculated by reference to changes in specified prices or rates for a specified amount of an underlying asset. The payment flows are usually netted against each other, with the difference being paid by one party to the other. In addition, collateral may be pledged or received by the Fund in accordance with the terms of the respective swap agreements to provide value and recourse to the Fund or its counterparties in the event of default, bankruptcy or insolvency by one of the parties to the swap agreement.
Risks may arise as a result of the failure of the counterparty to the swap contract to comply with the terms of the swap contract. The loss incurred by the failure of a counterparty is generally limited to the net interim payment to be received by the Fund, and/or the termination value at the end of the contract. Therefore, the Fund considers the creditworthiness of each counterparty to a swap contract in evaluating potential counterparty risk. This risk is mitigated by having a netting arrangement between the Fund and the counterparty and by the posting of collateral by the counterparty to the Fund to cover the Fund’s exposure to the counterparty. Additionally, risks may arise from unanticipated movements in interest rates or in the value of the underlying securities. The Fund accrues for the interim payments on swap contracts on a daily basis, with the net amount recorded within unrealized appreciation/depreciation of swap contracts on the statement of assets and liabilities, where applicable. Once the interim payments are settled in cash, the net amount is recorded as realized gain/(loss) on swaps on the statement of operations, in addition
| | | | |
| ALLIANCEBERNSTEIN UNCONSTRAINED BOND FUND • | | | 49 | |
Notes to Financial Statements
to any realized gain/(loss) recorded upon the termination of swap contracts. Fluctuations in the value of swap contracts are recorded as a component of net change in unrealized appreciation/depreciation of swap contracts on the statement of operations.
Interest Rate Swaps:
The Fund is subject to interest rate risk exposure in the normal course of pursuing its investment objectives. Because the Fund holds fixed rate bonds, the value of these bonds may decrease if interest rates rise. To help hedge against this risk and to maintain its ability to generate income at prevailing market rates, the Fund may enter into interest rate swap contracts. Interest rate swaps are agreements between two parties to exchange cash flows based on a notional amount. The Fund may elect to pay a fixed rate and receive a floating rate, or, receive a fixed rate and pay a floating rate on a notional amount.
In addition, the Fund may also enter into interest rate swap transactions to preserve a return or spread on a particular investment or portion of its portfolio, or protecting against an increase in the price of securities the Fund anticipates purchasing at a later date. Interest rate swaps involve the exchange by a Fund with another party of their respective commitments to pay or receive interest (e.g., an exchange of floating rate payments for fixed rate payments) computed based on a contractually-based principal (or “notional”) amount. Interest rate swaps are entered into on a net basis (i.e., the two payment streams are netted out, with the Fund receiving or paying, as the case may be, only the net amount of the two payments).
During the six months ended April 30, 2012, the Fund held interest rate swap contracts for hedging and non-hedging purposes.
Credit Default Swaps:
The Fund may enter into credit default swaps, including to manage its exposure to the market or certain sectors of the market, to reduce its risk exposure to defaults by corporate and sovereign issuers held by the Fund, or to create exposure to corporate or sovereign issuers to which it is not otherwise exposed. The Fund may purchase credit protection (“Buy Contract”) or provide credit protection (“Sale Contract”) on the referenced obligation of the credit default swap. During the term of the swap agreement, the Fund receives/(pays) fixed payments from/(to) the respective counterparty, calculated at the agreed upon interest rate applied to the notional amount. The accrual for these interim payments is recorded within unrealized appreciation/depreciation of swap contracts on the statement of assets and liabilities. Upfront premiums paid or received in connection with credit default swap contracts are recognized as cost or proceeds on the statement of assets and liabilities and are amortized on a straight line basis over the life of the contract. Amortized upfront premiums are included in net realized gain/(loss) from swaps on the
| | |
| 50 | | • ALLIANCEBERNSTEIN UNCONSTRAINED BOND FUND |
Notes to Financial Statements
statement of operations. If the Fund is a buyer/(seller) of protection and a credit event occurs, as defined under the terms of the swap agreement, the Fund will either (i) receive from the seller/(pay to the buyer) of protection an amount equal to the notional amount of the swap contract (the “Maximum Payout Amount”) and deliver/(take delivery of) the referenced obligation or (ii) receive/(pay) a net settlement amount in the form of cash or securities equal to the notional amount of the swap less the recovery value of the referenced obligation.
During the six months ended April 30, 2012, the Fund held credit default swap contracts for hedging and non-hedging purposes.
Credit default swaps may involve greater risks than if the Fund had invested in the referenced obligation directly. Credit default swaps are subject to general market risk, liquidity risk, counterparty risk and credit risk. If the Fund is a buyer of protection and no credit event occurs, it will lose its investment. If the Fund is a seller of protection and a credit event occurs, the value of the referenced obligation received by the Fund coupled with the periodic payments previously received may be less than the Maximum Payout Amount it pays to the buyer, resulting in a net loss to the Fund.
Implied credit spreads over Treasuries of comparable maturity utilized in determining the market value of credit default swaps on issuers as of period end are disclosed in the portfolio of investments. The implied spreads serve as an indicator of the current status of the payment/ performance risk and typically reflect the market’s assessment of the likelihood of default by the issuer on the referenced obligation. The implied credit spread of a particular reference entity reflects the cost of buying/selling protection and may include upfront payments required to be made to enter into the agreement. Widening credit spreads typically represent a deterioration of the referenced entity’s credit soundness and greater likelihood of default or other credit event occurring as defined under the terms of the agreement. A credit spread identified as “Defaulted” indicates a credit event has occurred for the referenced entity or obligation.
At April 30, 2012, the Fund had Sale Contracts outstanding with Maximum Payout Amounts aggregating $39,580,000 with unrealized appreciation of $345,222 and unrealized depreciation of $123,365 and ranging from a term of 4 to 5 years, as reflected in the portfolio of investments.
In certain circumstances Maximum Payout Amounts may be partially offset by recovery values of the respective referenced obligations, upfront premium received upon entering into the agreement, or net amounts received from settlement of buy protection credit default swap agreements entered into by the Fund for the same reference obligation with the same counterparty.
| | | | |
| ALLIANCEBERNSTEIN UNCONSTRAINED BOND FUND • | | | 51 | |
Notes to Financial Statements
Total Return Swaps:
The Fund may enter into total return swaps in order take a “long” or “short” position with respect to an underlying referenced asset. The Fund is subject to market price volatility of the underlying referenced asset. A total return swap involves commitments to pay interest in exchange for a market linked return based on a notional amount. To the extent that the total return of the security, group of securities or index underlying the transaction exceeds or falls short of the offsetting interest obligation, the Fund will receive a payment from or make a payment to the counterparty.
During the six months ended April 30, 2012, the Fund held total return swaps for non-hedging purposes.
Variance Swaps:
The Fund may enter into variance swaps to hedge equity market risk or adjust exposure to the equity markets. Variance swaps are contracts in which two parties agree to exchange cash payments based on the difference between the stated level of variance and the actual variance realized on underlying asset(s) or index(es). Actual “variance” as used here is defined as the sum of the square of the returns on the reference asset(s) or index(es) (which in effect is a measure of its “volatility”) over the length of the contract term. So the parties to a variance swap can be said to exchange actual volatility for a contractually stated rate of volatility.
During the six months ended April 30, 2012, the Fund held variance swaps for non-hedging purposes.
Documentation governing the Fund’s OTC derivatives may contain provisions for early termination of such transaction in the event the net assets of the Fund decline below specific levels set forth in the documentation (“net asset contingent features”). If these levels are triggered, the Fund’s counterparty has the right to terminate such transaction and require the Fund to pay or receive a settlement amount in connection with the terminated transaction. As of April 30, 2012, the Fund had OTC derivatives with contingent features in net liability positions in the amount of $2,213,280. The fair value of assets pledged as collateral by the Fund for such derivatives was $3,457,495 at April 30, 2012. If a trigger event had occurred at April 30, 2012, for those derivatives in a net liability position, no additional amounts would be required to be posted by the Fund since the aggregate fair value of the required collateral posted exceeded the settlement amounts of open derivative contracts.
| | |
| 52 | | • ALLIANCEBERNSTEIN UNCONSTRAINED BOND FUND |
Notes to Financial Statements
At April 30, 2012 the Fund had entered into the following derivatives:
| | | | | | | | | | | | |
| | | Asset Derivatives | | | Liability Derivatives | |
Derivative Type | | Statement of
Assets and
Liabilities
Location | | Fair Value | | | Statement of
Assets and
Liabilities
Location | | Fair Value | |
Interest rate contracts | |
Unrealized appreciation of interest rate swap contracts | | $ | 636,563 | | | Unrealized depreciation of interest rate swap contracts | | $ | 1,612,549 | |
| | | | |
| | | | | | | | Receivable/Payable for variation margin on futures contracts | | | 54,512 | * |
| | | | |
Foreign exchange contracts | | Unrealized appreciation of forward currency exchange contracts | | | 1,535 | | | Unrealized depreciation of forward currency exchange contracts | | | 215,798 | |
| | | | |
| | Investments in securities, at value | | | 220,067 | | | Options written, at value | | | 448,747 | |
| | | | |
Credit contracts | | Unrealized appreciation of credit default swap contracts | | | 375,988 | | | Unrealized depreciation of credit default swap contracts | | | 913,513 | |
| | | | |
| | | | | | | | Options written, at value | | | 152,539 | |
| | | | |
Equity contracts | | Unrealized appreciation of total return swap contracts | | | 91,540 | | | | | | | |
| | | | |
| | Investment in securities, at value | | | 113,522 | | | Options written, at value | | | 125,266 | |
| | | | | | | | | | | | |
Total | | | | $ | 1,439,215 | | | | | $ | 3,522,924 | |
| | | | | | | | | | | | |
| | | | |
| ALLIANCEBERNSTEIN UNCONSTRAINED BOND FUND • | | | 53 | |
Notes to Financial Statements
The effect of derivative instruments on the statement of operations for the six months ended April 30, 2012:
| | | | | | | | | | |
Derivative Type | | Location of Gain
or (Loss) on
Derivatives | | Realized Gain
or (Loss) on
Derivatives | | | Change in
Unrealized
Appreciation or
(Depreciation) | |
Interest rate contracts | | Net realized gain/(loss) on swap contracts; Net change in unrealized appreciation/depreciation of swap contracts | | $ | 847,912 | | | $ | (140,165 | ) |
| | | |
| | Net realized gain/(loss) on futures contracts; Net change in unrealized appreciation/depreciation of futures contracts | | | (78,184 | ) | | | (78,107 | ) |
| | | |
| | Net realized gain/(loss) on investment transactions; Net change in unrealized appreciation/depreciation of investment transactions | | | (244,400 | ) | | | (17,970 | ) |
| | | |
| | Net realized gain/(loss) on options written; Net change in unrealized appreciation/depreciation of options written | | | (744,531 | ) | | | 830,823 | |
| | | |
Foreign exchange contracts | | Net realized gain/(loss) on foreign currency transactions; Net change in unrealized appreciation/depreciation of foreign currency denominated assets and liabilities | | | (141,988 | ) | | | 336,008 | |
| | | |
| | Net realized gain/(loss) on investment transactions; Net change in unrealized appreciation/depreciation of investment transactions | | | (448,813 | ) | | | 270,231 | |
| | |
| 54 | | • ALLIANCEBERNSTEIN UNCONSTRAINED BOND FUND |
Notes to Financial Statements
| | | | | | | | | | |
Derivative Type | | Location of Gain
or (Loss) on
Derivatives | | Realized Gain
or (Loss) on
Derivatives | | | Change in
Unrealized
Appreciation or
(Depreciation) | |
| | | |
| | Net realized gain/(loss) on options written; Net change in unrealized appreciation/depreciation of options written | | $ | 376,645 | | | $ | (242,892 | ) |
| | | |
Credit contracts | | Net realized gain/(loss) on swap contracts; Net change in unrealized appreciation/depreciation of swap contracts | | | (1,081,778 | ) | | | 1,156,239 | |
| | | |
| | Net realized gain/(loss) on options written; Net change in unrealized appreciation/depreciation of options written | | | 56,200 | | | | 65,444 | |
| | | |
Equity contracts | | Net realized gain/(loss) on swap contracts; Net change in unrealized appreciation/depreciation of swap contracts | | | 2,860,073 | | | | (74,438 | ) |
| | | |
| | Net realized gain (loss) on investment transactions; Net change in unrealized appreciation/depreciation of investment transactions | | | (1,802,103 | ) | | | 75,104 | |
| | | |
| | Net realized gain/(loss) on futures contracts; Net change in unrealized appreciation/depreciation of futures contracts | | | 619,800 | | | | 14,840 | |
| | | |
| | Net realized gain/(loss) on options written; Net change in unrealized appreciation/depreciation of options written | | | 1,104,688 | | | | (53,155 | ) |
| | | | | | | | | | |
Total | | | | $ | 1,323,521 | | | $ | 2,141,962 | |
| | | | | | | | | | |
| * | | Only variation margin receivable/payable at period end is reported within the statement of assets and liabilities. Cumulative appreciation/(depreciation) of futures contracts is reported in the portfolio of investments. |
| | | | |
| ALLIANCEBERNSTEIN UNCONSTRAINED BOND FUND • | | | 55 | |
Notes to Financial Statements
For the six months ended April 30, 2012, the average monthly principal amount of foreign currency exchange contracts was $21,726,449, the average monthly notional amount of interest rate swap contracts was $237,365,033, the average monthly notional amount of credit default swap contracts was $105,169,715, the average monthly notional amount of total return rate swap contracts was $57,947,432, the average monthly notional amount of interest rate index futures contracts was $5,443,743, the average monthly cost of purchased equity options contracts was $429,304, the average monthly notional amount of equity index futures contracts was $3,960,978 and the average monthly cost of purchased currency options contracts was $430,616. For five months of the six month period, the average monthly notional amount of variance swap contracts was $373,305. For two months of the six month period, the average monthly cost of purchased interest rate swaption contracts was $244,400.
2. Currency Transactions
The Fund may invest in non-U.S. Dollar securities on a currency hedged or unhedged basis. The Fund may seek investment opportunities by taking long or short positions in currencies through the use of currency-related derivatives, including forward currency exchange contracts, futures and options on futures, swaps, and other options. The Fund may enter into transactions for investment opportunities when it anticipates that a foreign currency will appreciate or depreciate in value but securities denominated in that currency are not held by the Fund and do not present attractive investment opportunities. Such transactions may also be used when the Adviser believes that it may be more efficient than a direct investment in a foreign currency-denominated security. The Fund may also conduct currency exchange contracts on a spot basis (i.e., for cash at the spot rate prevailing in the currency exchange market for buying or selling currencies).
3. Reverse Repurchase Agreements
Under a reverse repurchase agreement, the Fund sells securities and agrees to repurchase them at a mutually agreed upon date and price. At the time the Fund enters into a reverse repurchase agreement, it will establish a segregated account with the custodian containing liquid assets having at least equal to the repurchase price. For the six months ended April 30, 2012, the Fund had no transactions in reverse repurchase agreements.
4. Loan Participations and Assignments
The Fund may invest in direct debt instruments which are interests in amounts owed to lenders or lending syndicates by corporate, governmental, or other borrowers, either in the form of participations at the time the loan is originated (“Participations”) or by buying an interest in the loan in the secondary market from a financial institution or institutional investor (“Assignments”). A loan is often administered by a bank or other financial institution (the “Lender”) that acts as agent for all holders. The agent administers the terms of the loan as
| | |
| 56 | | • ALLIANCEBERNSTEIN UNCONSTRAINED BOND FUND |
Notes to Financial Statements
specified in the loan agreement. When investing in Participations, the Fund generally has no right to enforce compliance with the terms of the loan agreement with the borrower. In addition, when investing in Participations, the Fund has the right to receive payments of principal, interest and any fees to which it is entitled only from the Lender and only upon receipt of payments by the Lender from the borrower. As a result, the Fund may be subject to the credit risk of both the borrower and the Lender. When the Fund purchases Assignments from Lenders, it will typically acquire direct rights against the borrower on the loan. These loans may include participations in “bridge loans”, which are loans taken out by borrowers for a short period (typically less than six months) pending arrangement of more permanent financing through, for example, the issuance of bonds, frequently high-yield bonds issued for the purpose of acquisitions. The Fund may also participate in unfunded loan commitments, which are contractual obligations for investing in future Participations, and receive a commitment fee based on the amount of the commitment. Under these arrangements, the Fund will receive a fixed rate commitment fee and, if and to the extent the borrower borrows under the facility, the Fund may receive an additional funding fee.
Unfunded loan commitments and funded loans are marked to market daily.
As of April 30, 2012, the Fund had the following unfunded loan commitment which could be extended at the option of the borrower pursuant to the respective loan agreement. The unrealized depreciation on such loans was $15,309.
| | | | | | | | |
Borrower | | Unfunded Loan
Participation
Commitment | | | Funded | |
General Motors Holding, LLC, LIBOR +
2.75%, 10/27/15……………………………… | | $ | 700,000 | | | $ | – 0 | – |
As of April 30, 2012, the Fund had no bridge loan commitments outstanding; however, the Fund received commitment fees or additional funding fees during the period in the amount of $810. Additionally, the Fund received $59,259 as an upfront payment for the trading discount in assuming the General Motors Holdings loan.
| | | | |
| ALLIANCEBERNSTEIN UNCONSTRAINED BOND FUND • | | | 57 | |
Notes to Financial Statements
NOTE E
Capital Stock
Each class consists of 3,000,000,000 authorized shares. Transactions in capital shares for each class were as follows:
| | | | | | | | | | | | | | | | | | | | |
| | | | | | | | | | | | | | | | | | | | |
| | | Shares | | | | | Amount | | | |
| | | Six Months Ended
April 30, 2012
(unaudited) | | | Year Ended
October 31,
2011 | | | | | Six Months Ended
April 30, 2012
(unaudited) | | | Year Ended
October 31,
2011 | | | |
| | | | | | |
| Class A | | | | | | | | | | | | | | | | | | | | |
Shares sold | | | 596,108 | | | | 783,885 | | | | | $ | 5,109,872 | | | $ | 6,650,837 | | | |
| | | |
Shares issued in reinvestment of dividends and distributions | | | 23,215 | | | | 91,121 | | | | | | 197,696 | | | | 772,726 | | | |
| | | |
Shares converted from Class B | | | 31,459 | | | | 110,417 | | | | | | 272,513 | | | | 936,585 | | | |
| | | |
Shares redeemed | | | (616,166 | ) | | | (1,335,671 | ) | | | | | (5,297,816 | ) | | | (11,353,594 | ) | | |
| | | |
Net increase (decrease) | | | 34,616 | | | | (350,248 | ) | | | | $ | 282,265 | | | $ | (2,993,446 | ) | | |
| | | |
| | | | | | | | | | | | | | | | | | | | |
| Class B | | | | | | | | | | | | | | | | | | | | |
Shares sold | | | 13,592 | | | | 56,502 | | | | | $ | 115,194 | | | $ | 476,939 | | | |
| | | |
Shares issued in reinvestment of dividends and distributions | | | 956 | | | | 6,585 | | | | | | 8,122 | | | | 55,898 | | | |
| | | |
Shares converted to Class A | | | (31,433 | ) | | | (110,294 | ) | | | | | (272,513 | ) | | | (936,585 | ) | | |
| | | |
Shares redeemed | | | (29,504 | ) | | | (104,463 | ) | | | | | (252,063 | ) | | | (888,139 | ) | | |
| | | |
Net decrease | | | (46,389 | ) | | | (151,670 | ) | | | | $ | (401,260 | ) | | $ | (1,291,887 | ) | | |
| | | |
| | | | | | | | | | | | | | | | | | | | |
| Class C | | | | | | | | | | | | | | | | | | | | |
Shares sold | | | 215,339 | | | | 283,475 | | | | | $ | 1,859,077 | | | $ | 2,402,382 | | | |
| | | |
Shares issued in reinvestment of dividends and distributions | | | 3,922 | | | | 22,716 | | | | | | 33,236 | | | | 192,699 | | | |
| | | |
Shares redeemed | | | (271,503 | ) | | | (503,324 | ) | | | | | (2,298,752 | ) | | | (4,267,148 | ) | | |
| | | |
Net decrease | | | (52,242 | ) | | | (197,133 | ) | | | | $ | (406,439 | ) | | $ | (1,672,067 | ) | | |
| | | |
| | | | | | | | | | | | | | | | | | | | |
| Advisor Class | | | | | | | | | | | | | | | | | | | | |
Shares sold | | | 815,203 | | | | 4,888,073 | | | | | $ | 6,879,578 | | | $ | 41,490,850 | | | |
| | | |
Shares issued in reinvestment of dividends and distributions | | | 41,651 | | | | 43,273 | | | | | | 354,070 | | | | 366,650 | | | |
| | | |
Shares redeemed | | | (2,029,082 | ) | | | (808,436 | ) | | | | | (17,060,614 | ) | | | (6,881,229 | ) | | |
| | | |
Net increase (decrease) | | | (1,172,228 | ) | | | 4,122,910 | | | | | $ | (9,826,966 | ) | | $ | 34,976,271 | | | |
| | | |
| | | | | | | | | | | | | | | | | | | | |
| | |
| 58 | | • ALLIANCEBERNSTEIN UNCONSTRAINED BOND FUND |
Notes to Financial Statements
| | | | | | | | | | | | | | | | | | | | |
| | | | | | | | | | | | | | | | | | | | |
| | | Shares | | | | | Amount | | | |
| | | Six Months Ended
April 30, 2012
(unaudited) | | | Year Ended
October 31,
2011 | | | | | Six Months Ended
April 30, 2012
(unaudited) | | | Year Ended
October 31,
2011 | | | |
| Class R | | | | | | | | | | | | | | | | | | | | |
Shares sold | | | 24,146 | | | | 60,406 | | | | | $ | 206,723 | | | $ | 507,622 | | | |
| | | |
Shares issued in reinvestment of dividends and distributions | | | 774 | | | | 2,152 | | | | | | 6,583 | | | | 18,193 | | | |
| | | |
Shares redeemed | | | (8,185 | ) | | | (18,589 | ) | | | | | (68,724 | ) | | | (156,628 | ) | | |
| | | |
Net increase | | | 16,735 | | | | 43,969 | | | | | $ | 144,582 | | | $ | 369,187 | | | |
| | | |
| | | | | | | | | | | | | | | | | | | | |
| Class K | | | | | | | | | | | | | | | | | | | | |
Shares sold | | | 123 | | | | 232 | | | | | $ | 1,062 | | | $ | 1,971 | | | |
| | | |
Shares issued in reinvestment of dividends and distributions | | | 101 | | | | 496 | | | | | | 862 | | | | 4,209 | | | |
| | | |
Shares redeemed | | | (9,670 | ) | | | (10,399 | ) | | | | | (85,005 | ) | | | (88,085 | ) | | |
| | | |
Net decrease | | | (9,446 | ) | | | (9,671 | ) | | | | $ | (83,081 | ) | | $ | (81,905 | ) | | |
| | | |
| | | | | | | | | | | | | | | | | | | | |
| Class I | | | | | | | | | | | | | | | | | | | | |
Shares sold | | | – 0 | – | | | – 0 | – | | | | $ | – 0 | – | | $ | – 0 | – | | |
| | | |
Shares redeemed | | | – 0 | – | | | – 0 | – | | | | | – 0 | – | | | – 0 | – | | |
| | | |
Net increase | | | – 0 | – | | | – 0 | – | | | | $ | – 0 | – | | $ | – 0 | – | | |
| | | |
For the six months ended April 30, 2012 and the year ended October 31, 2011, a third party vendor reimbursed the Fund $194 and $189, respectively, for losses incurred due to a trade entry error. This amount is presented in the Fund’s statement of changes in net assets. Neither the Fund nor its affiliates were involved in the proceedings or the calculation of the payment.
NOTE F
Risks Involved in Investing in the Fund
Interest Rate Risk and Credit Risk—Interest rate risk is the risk that changes in interest rates will affect the value of the Fund’s investments in fixed-income debt securities such as bonds or notes. Increases in interest rates may cause the value of the Fund’s investments to decline. Credit risk is the risk that the issuer or guarantor of a debt security, or the counterparty to a derivative contract, will be unable or unwilling to make timely principal and/or interest payments, or to otherwise honor its obligations. The degree of risk for a particular security may be reflected in its credit risk rating. Credit risk is greater for medium quality and lower-rated securities. Lower-rated debt securities and similar unrated securities (commonly known as “junk bonds”) have speculative elements or are predominantly speculative risks.
Foreign Securities Risk—Investing in securities of foreign companies or foreign governments involves special risks which include changes in foreign currency exchange rates and the possibility of future political and economic developments
| | | | |
| ALLIANCEBERNSTEIN UNCONSTRAINED BOND FUND • | | | 59 | |
Notes to Financial Statements
which could adversely affect the value of such securities. Moreover, securities of many foreign companies or foreign governments and their markets may be less liquid and their prices more volatile than those of comparable U.S. companies or of the U.S. government.
Emerging Market Risk—Investments in emerging market countries may have more risk because the markets are less developed and less liquid as well as being subject to increased economic, political, regulatory or other uncertainties.
Inflation Risk—This is the risk that the value of assets or income from investments will be less in the future as inflation decreases the value of money. As inflation increases, the value of the Fund’s assets can decline as can the value of the Fund’s distributions. This risk is significantly greater if the Fund invests a significant portion of its assets in fixed-income securities with longer maturities.
Currency Risk—This is the risk that changes in foreign currency exchange rates may negatively affect the value of the Fund’s investments or reduce the returns of the Fund. For example, the value of the Fund’s investments in foreign currency-denominated securities or currencies may decrease if the U.S. Dollar is strong (i.e., gaining value relative to other currencies) and other currencies are weak (i.e., losing value relative to the U.S. Dollar). Currency markets are generally not as regulated as securities markets. Independent of the Fund’s investments in securities denominated in foreign currencies, the Fund’s positions in various foreign currencies may cause the Fund to experience investment losses due to the changes in exchange rates and interest rates.
Derivatives Risk—The Fund may enter into derivative transactions such as forwards, options, futures and swaps. Derivatives may be illiquid, difficult to price, and leveraged so that small changes may produce disproportionate losses for the Fund, and subject to counterparty risk to a greater degree than more traditional investments. Derivatives may result in significant losses, including losses that are far greater than the value of the derivatives reflected on the statement of assets and liabilities.
Leverage Risk—When the Fund borrows money or otherwise leverages its investments, its performance may be volatile because leverage tends to exaggerate the effect of any increase or decrease in the value of the Fund’s investments. The Fund may create leverage through the use of reverse repurchase arrangements, forward currency exchange contracts, forward commitments, dollar rolls or futures contracts or by borrowing money. The use of derivative instruments by the Fund, such as forwards, futures, options and swaps, may also result in a form of leverage. Leverage may result in higher returns to the Fund than if the Fund were not leveraged, but may also adversely affect returns, particularly if the market is declining.
Indemnification Risk—In the ordinary course of business, the Fund enters into contracts that contain a variety of indemnifications. The Fund’s maximum
| | |
| 60 | | • ALLIANCEBERNSTEIN UNCONSTRAINED BOND FUND |
Notes to Financial Statements
exposure under these arrangements is unknown. However, the Fund has not had prior claims or losses pursuant to these indemnification provisions and expects the risk of loss thereunder to be remote. Therefore, the Fund has not accrued any liability in connection with these indemnification provisions.
NOTE G
Joint Credit Facility
A number of open-end mutual funds managed by the Adviser, including the Fund, participate in a $140 million revolving credit facility (the “Facility”) intended to provide for short-term financing if necessary, subject to certain restrictions, in connection with abnormal redemption activity. Commitment fees related to the Facility are paid by the participating funds and are included in miscellaneous expenses in the statement of operations. The Fund did not utilize the Facility during the six months ended April 30, 2012.
NOTE H
Distributions to Shareholders
The tax character of distributions paid for the year ending October 31, 2012 will be determined at the end of the current fiscal year.
The tax character of distributions paid during the fiscal years ended October 31, 2011 and October 31, 2010 were as follows:
| | | | | | | | |
| | | 2011 | | | 2010 | |
Distributions paid from: | | | | | | | | |
Ordinary income | | $ | 3,167,511 | | | $ | 1,990,580 | |
| | | | | | | | |
Total taxable distributions | | | 3,167,511 | | | | 1,990,580 | |
| | | | | | | | |
Total distributions paid | | $ | 3,167,511 | | | $ | 1,990,580 | |
| | | | | | | | |
As of October 31, 2011, the components of accumulated earnings/(deficit) on a tax basis were as follows:
| | | | |
Accumulated capital and other losses | | $ | (7,111,879 | )(a) |
Unrealized appreciation/(depreciation) | | | (1,576,593 | )(b) |
| | | | |
Total accumulated earnings/(deficit) | | $ | (8,688,472 | )(c) |
| | | | |
| (a) | | On October 31, 2011, the Fund had a net capital loss carryforward of $6,497,739 of which $379,558 expires in the year 2016, $3,751,542 expires in the year 2017, $1,053,051 expires in the year 2018, and $1,313,588 expires in the year 2019. To the extent future capital gains are offset by capital loss carryforwards, such gains will not be distributed. For the year ended October 31, 2011, the cumulative deferred loss on straddles was $614,140. |
| (b) | | The differences between book-basis and tax-basis unrealized appreciation/(depreciation) are attributable primarily to the tax treatment of swap income, the realization for tax purposes of gains/losses on certain derivative instruments, and the difference between book and tax amortization methods for premium. |
| (c) | | The differences between book-basis and tax-basis components of accumulated earnings/ (deficit) are attributable primarily to dividends payable and the tax treatment of interest on defaulted securities. |
| | | | |
| ALLIANCEBERNSTEIN UNCONSTRAINED BOND FUND • | | | 61 | |
Notes to Financial Statements
For tax purposes, net capital losses may be carried over to offset future capital gains, if any. Under the Regulated Investment Company Modernization Act of 2010, funds are permitted to carry forward capital losses incurred in taxable years beginning after December 22, 2010 for an indefinite period. These post-enactment capital losses must be utilized prior to the pre-enactment capital losses, which are subject to expiration. Post-enactment capital loss carryforwards will retain their character as either short-term or long-term capital losses rather than being considered short-term as under previous regulation.
NOTE I
New Accounting Pronouncements
In April 2011, the Financial Accounting Standards Board (“FASB”) issued an Accounting Standard Update (“ASU”) related to the accounting for repurchase agreements and similar agreements that both entitle and obligate a transferor to repurchase or redeem financial assets before their maturity. The ASU modifies the criteria for determining effective control of transferred assets and, as a result, certain agreements may now be accounted for as secured borrowings. The ASU is effective prospectively for new transfers and existing transactions that are modified in the first interim or annual period beginning on or after December 15, 2011. At this time, management is evaluating the implications of this ASU and its impact on the financial statements has not been determined.
In May 2011, the FASB issued an ASU to develop common requirements for measuring fair value and for disclosing information about fair value measurements in U.S. GAAP and International Financial Reporting Standards (“IFRS”). The amendments are intended to improve the comparability of fair value measurements presented and disclosed in the financial statements prepared in accordance with U.S. GAAP and IFRS. The ASU is effective during interim or annual periods beginning after December 15, 2011. At this time, management is evaluating the implication of this ASU and its impact on the financial statements has not been determined.
In December 2011, the FASB issued an ASU related to disclosures about offsetting assets and liabilities in financial statements. The amendments in this update require an entity to disclose both gross and net information for derivatives and other financial instruments that are either offset in the statement of assets and liabilities or subject to an enforceable master netting arrangement or similar agreement. The ASU is effective during interim or annual reporting periods beginning on or after January 1, 2013. At this time, management is evaluating the implication of this ASU and its impact on the financial statements has not been determined.
NOTE J
Subsequent Events
Management has evaluated subsequent events for possible recognition or disclosure in the financial statements through the date the financial statements are issued. Management has determined that there are no material events that would require disclosure in the Fund’s financial statements through this date.
| | |
| 62 | | • ALLIANCEBERNSTEIN UNCONSTRAINED BOND FUND |
Notes to Financial Statements
FINANCIAL HIGHLIGHTS
Selected Data For A Share Of Capital Stock Outstanding Throughout Each Period
| | | | | | | | | | | | | | | | | | | | | | | | |
| | | Class A | |
| | | Six Months
Ended
April 30,
2012
(unaudited) | | | Year Ended October 31, | |
| | | 2011 | | | 2010 | | | 2009 | | | 2008 | | | 2007 | |
| | | | |
| | | | | | | | | | | | | | | | | | | | | | | | |
Net asset value, beginning of period | | | $ 8.33 | | | | $ 8.50 | | | | $ 8.10 | | | | $ 7.39 | | | | $ 9.02 | | | | $ 8.62 | |
| | | | | | | | | | | | |
Income From Investment Operations | | | | | | | | | | | | | | | | | | | | | | | | |
Net investment income(a) | | | .09 | (b) | | | .25 | (b) | | | .24 | | | | .32 | | | | .36 | | | | .34 | |
Net realized and unrealized gain (loss) on investment and foreign currency transactions | | | .49 | | | | (.13 | ) | | | .39 | | | | .71 | | | | (1.63 | ) | | | .40 | |
Contributions from Adviser | | | – 0 | – | | | – 0 | – | | | – 0 | – | | | – 0 | – | | | .00 | (c) | | | – 0 | – |
| | | | |
Net increase (decrease) in net asset value from operations | | | .58 | | | | .12 | | | | .63 | | | | 1.03 | | | | (1.27 | ) | | | .74 | |
| | | | |
Less: Dividends and Distributions | | | | | | | | | | | | | | | | | | | | | | | | |
Dividends from net investment income | | | (.07 | ) | | | (.29 | ) | | | (.23 | ) | | | (.28 | ) | | | (.36 | ) | | | (.34 | ) |
Tax return of capital | | | – 0 | – | | | – 0 | – | | | – 0 | – | | | (.04 | ) | | | – 0 | – | | | – 0 | – |
| | | | |
Total dividends and distributions | | | (.07 | ) | | | (.29 | ) | | | (.23 | ) | | | (.32 | ) | | | (.36 | ) | | | (.34 | ) |
| | | | |
Net asset value, end of period | | | $ 8.84 | | | | $ 8.33 | | | | $ 8.50 | | | | $ 8.10 | | | | $ 7.39 | | | | $ 9.02 | |
| | | | |
Total Return | | | | | | | | | | | | | | | | | | | | | | | | |
Total investment return based on net asset value(d) | | | 6.94 | %* | | | 1.3 | 7%* | | | 7.88 | %* | | | 14.45 | %* | | | (14.57 | )%* | | | 8.60 | %* |
Ratios/Supplemental Data | | | | | | | | | | | | | | | | | | | | | | | | |
Net assets, end of period (000’s omitted) | | | $41,645 | | | | $38,970 | | | | $42,733 | | | | $46,138 | | | | $39,639 | | | | $48,542 | |
Ratio to average net assets of: | | | | | | | | | | | | | | | | | | | | | | | | |
Expenses, net of waivers/reimbursements | | | .90 | %(e) | | | .90 | % | | | .90 | %(f) | | | .90 | % | | | .90 | % | | | 1.47 | % |
Expenses, before waivers/reimbursements | | | 1.42 | %(e) | | | 1.44 | % | | | 1.55 | %(f) | | | 1.69 | % | | | 1.65 | % | | | 1.47 | % |
Expenses, before waivers/reimbursements excluding interest expense | | | 1.42 | %(e) | | | 1.44 | % | | | 1.55 | %(f) | | | 1.69 | % | | | 1.65 | % | | | 1.47 | % |
Net investment income | | | 1.99 | %(b)(e) | | | 2.98 | %(b) | | | 2.83 | %(f) | | | 4.24 | % | | | 4.13 | % | | | 3.81 | % |
Portfolio turnover rate | | | 115 | % | | | 78 | % | | | 54 | % | | | 86 | % | | | 81 | % | | | 134 | % |
See footnote summary on page 70.
| | | | |
| ALLIANCEBERNSTEIN UNCONSTRAINED BOND FUND • | | | 63 | |
Financial Highlights
Selected Data For A Share Of Capital Stock Outstanding Throughout Each Period
| | | | | | | | | | | | | | | | | | | | | | | | |
| | | Class B | |
| | | Six Months
Ended
April 30,
2012
(unaudited) | | | Year Ended October 31, | |
| | | | 2011 | | | 2010 | | | 2009 | | | 2008 | | | 2007 | |
| | | | |
| | | | | | | | | | | | | | | | | | | | | | | | |
Net asset value, beginning of period | | | $ 8.34 | | | | $ 8.51 | | | | $ 8.11 | | | | $ 7.40 | | | | $ 9.03 | | | | $ 8.63 | |
| | | | | | | | | | | | |
Income From Investment Operations | | | | | | | | | | | | | | | | | | | | | | | | |
Net investment income(a) | | | .06 | (b) | | | .17 | (b) | | | .18 | | | | .26 | | | | .30 | | | | .26 | |
Net realized and unrealized gain (loss) on investment and foreign currency transactions | | | .48 | | | | (.11 | ) | | | .39 | | | | .72 | | | | (1.64 | ) | | | .41 | |
Contributions from Adviser | | | – 0 | – | | | – 0 | – | | | – 0 | – | | | – 0 | – | | | .00 | (c) | | | – 0 | – |
| | | | |
Net increase (decrease) in net asset value from operations | | | .54 | | | | .06 | | | | .57 | | | | .98 | | | | (1.34 | ) | | | .67 | |
| | | | |
Less: Dividends and Distributions | | | | | | | | | | | | | | | | | | | | | | | | |
Dividends from net investment income | | | (.04 | ) | | | (.23 | ) | | | (.17 | ) | | | (.23 | ) | | | (.29 | ) | | | (.27 | ) |
Tax return of capital | | | – 0 | – | | | – 0 | – | | | – 0 | – | | | (.04 | ) | | | – 0 | – | | | – 0 | – |
| | | | |
Total dividends and distributions | | | (.04 | ) | | | (.23 | ) | | | (.17 | ) | | | (.27 | ) | | | (.29 | ) | | | (.27 | ) |
| | | | |
Net asset value, end of period | | | $ 8.84 | | | | $ 8.34 | | | | $ 8.51 | | | | $ 8.11 | | | | $ 7.40 | | | | $ 9.03 | |
| | | | |
Total Return | | | | | | | | | | | | | | | | | | | | | | | | |
Total investment return based on net asset value(d) | | | 6.45 | %* | | | 0.66 | %* | | | 7.13 | %* | | | 13.65 | %* | | | (15.15 | ) %* | | | 7.77 | %* |
Ratios/Supplemental Data | | | | | | | | | | | | | | | | | | | | | | | | |
Net assets, end of period (000’s omitted) | | | $2,257 | | | | $2,515 | | | | $3,856 | | | | $6,226 | | | | $13,666 | | | | $27,303 | |
Ratio to average net assets of: | | | | | | | | | | | | | | | | | | | | | | | | |
Expenses, net of waivers/reimbursements | | | 1.60 | %(e) | | | 1.60 | % | | | 1.60 | %(f) | | | 1.60 | % | | | 1.60 | % | | | 2.28 | % |
Expenses, before waivers/reimbursements | | | 2.16 | %(e) | | | 2.21 | % | | | 2.30 | %(f) | | | 2.49 | % | | | 2.41 | % | | | 2.28 | % |
Expenses, before waivers/reimbursements excluding interest expense | | | 2.16 | %(e) | | | 2.21 | % | | | 2.30 | %(f) | | | 2.49 | % | | | 2.41 | % | | | 2.28 | % |
Net investment income | | | 1.32 | %(b)(e) | | | 2.06 | %(b) | | | 2.15 | %(f) | | | 3.66 | % | | | 3.43 | % | | | 2.93 | % |
Portfolio turnover rate | | | 115 | % | | | 78 | % | | | 54 | % | | | 86 | % | | | 81 | % | | | 134 | % |
See footnote summary on page 70.
| | |
| 64 | | • ALLIANCEBERNSTEIN UNCONSTRAINED BOND FUND |
Financial Highlights
Selected Data For A Share Of Capital Stock Outstanding Throughout Each Period
| | | | | | | | | | | | | | | | | | | | | | | | |
| | | Class C | |
| | | Six Months
Ended
April 30,
2012
(unaudited) | | | Year Ended October 31, | |
| | | | 2011 | | | 2010 | | | 2009 | | | 2008 | | | 2007 | |
| | | | |
| | | | | | | | | | | | | | | | | | | | | | | | |
Net asset value, beginning of period | | | $ 8.33 | | | | $ 8.50 | | | | $ 8.10 | | | | $ 7.40 | | | | $ 9.02 | | | | $ 8.63 | |
| | | | | | | | | | | | |
Income From Investment Operations | | | | | | | | | | | | | | | | | | | | | | | | |
Net investment income(a) | | | .06 | (b) | | | .19 | (b) | | | .18 | | | | .26 | | | | .29 | | | | .27 | |
Net realized and unrealized gain (loss) on investment and foreign currency transactions | | | .49 | | | | (.13 | ) | | | .39 | | | | .71 | | | | (1.61 | ) | | | .39 | |
Contributions from Adviser | | | – 0 | – | | | – 0 | – | | | – 0 | – | | | – 0 | – | | | .00 | (c) | | | – 0 | – |
| | | | |
Net increase (decrease) in net asset value from operations | | | .55 | | | | .06 | | | | .57 | | | | .97 | | | | (1.32 | ) | | | .66 | |
| | | | |
Less: Dividends and Distributions | | | | | | | | | | | | | | | | | | | | | | | | |
Dividends from net investment income | | | (.04 | ) | | | (.23 | ) | | | (.17 | ) | | | (.23 | ) | | | (.30 | ) | | | (.27 | ) |
Tax return of capital | | | – 0 | – | | | – 0 | – | | | – 0 | – | | | (.04 | ) | | | – 0 | – | | | – 0 | – |
| | | | |
Total dividends and distributions | | | (.04 | ) | | | (.23 | ) | | | (.17 | ) | | | (.27 | ) | | | (.30 | ) | | | (.27 | ) |
| | | | |
Net asset value, end of period | | | $ 8.84 | | | | $ 8.33 | | | | $ 8.50 | | | | $ 8.10 | | | | $ 7.40 | | | | $ 9.02 | |
| | | | |
Total Return | | | | | | | | | | | | | | | | | | | | | | | | |
Total investment return based on net asset value(d) | | | 6.58 | %* | | | 0.66 | %* | | | 7.13 | %* | | | 13.50 | %* | | | (15.05 | )%* | | | 7.69 | %* |
Ratios/Supplemental Data | | | | | | | | | | | | | | | | | | | | | | | | |
Net assets, end of period (000’s omitted) | | | $11,559 | | | | $11,332 | | | | $13,236 | | | | $14,376 | | | | $11,245 | | | | $15,208 | |
Ratio to average net assets of: | | | | | | | | | | | | | | | | | | | | | | | | |
Expenses, net of waivers/reimbursements | | | 1.60 | %(e) | | | 1.60 | % | | | 1.60 | %(f) | | | 1.60 | % | | | 1.60 | % | | | 2.20 | % |
Expenses, before waivers/reimbursements | | | 2.13 | %(e) | | | 2.15 | % | | | 2.26 | %(f) | | | 2.39 | % | | | 2.36 | % | | | 2.20 | % |
Expenses, before waivers/reimbursements excluding interest expense | | | 2.13 | %(e) | | | 2.15 | % | | | 2.26 | %(f) | | | 2.39 | % | | | 2.36 | % | | | 2.20 | % |
Net investment income | | | 1.33 | %(b)(e) | | | 2.27 | %(b) | | | 2.13 | %(f) | | | 3.53 | % | | | 3.44 | % | | | 3.03 | % |
Portfolio turnover rate | | | 115 | % | | | 78 | % | | | 54 | % | | | 86 | % | | | 81 | % | | | 134 | % |
See footnote summary on page 70.
| | | | |
| ALLIANCEBERNSTEIN UNCONSTRAINED BOND FUND • | | | 65 | |
Financial Highlights
Selected Data For A Share Of Capital Stock Outstanding Throughout Each Period
| | | | | | | | | | | | | | | | | | | | | | | | |
| | | Advisor Class | |
| | | Six Months
Ended
April 30,
2012
(unaudited) | | | Year Ended October 31, | |
| | | | 2011 | | | 2010 | | | 2009 | | | 2008 | | | 2007 | |
| | | | |
| | | | | | | | | | | | | | | | | | | | | | | | |
Net asset value, beginning of period | | | $ 8.33 | | | | $ 8.49 | | | | $ 8.09 | | | | $ 7.39 | | | | $ 9.02 | | | | $ 8.62 | |
| | | | | | | | | | | | |
Income From Investment Operations | | | | | | | | | | | | | | | | | | | | | | | | |
Net investment income(a) | | | .10 | (b) | | | .32 | (b) | | | .26 | | | | .32 | | | | .38 | | | | .37 | |
Net realized and unrealized gain (loss) on investment and foreign currency transactions | | | .48 | | | | (.17 | ) | | | .39 | | | | .72 | | | | (1.63 | ) | | | .39 | |
Contributions from Adviser | | | – 0 | – | | | – 0 | – | | | – 0 | – | | | – 0 | – | | | .00 | (c) | | | – 0 | – |
| | | | |
Net increase (decrease) in net asset value from operations | | | .58 | | | | .15 | | | | .65 | | | | 1.04 | | | | (1.25 | ) | | | .76 | |
| | | | |
Less: Dividends and Distributions | | | | | | | | | | | | | | | | | | | | | | | | |
Dividends from net investment income | | | (.08 | ) | | | (.31 | ) | | | (.25 | ) | | | (.30 | ) | | | (.38 | ) | | | (.36 | ) |
Tax return of capital | | | – 0 | – | | | – 0 | – | | | – 0 | – | | | (.04 | ) | | | – 0 | – | | | – 0 | – |
| | | | |
Total dividends and distributions | | | (.08 | ) | | | (.31 | ) | | | (.25 | ) | | | (.34 | ) | | | (.38 | ) | | | (.36 | ) |
| | | | |
Net asset value, end of period | | | $ 8.83 | | | | $ 8.33 | | | | $ 8.49 | | | | $ 8.09 | | | | $ 7.39 | | | | $ 9.02 | |
| | | | |
Total Return | | | | | | | | | | | | | | | | | | | | | | | | |
Total investment return based on net asset value(d) | | | 6.98 | %* | | | 1.79 | %* | | | 8.21 | %* | | | 14.64 | %* | | | (14.31 | )%* | | | 8.89 | %* |
Ratios/Supplemental Data | | | | | | | | | | | | | | | | | | | | | | | | |
Net assets, end of period (000’s omitted) | | | $39,216 | | | | $46,740 | | | | $12,660 | | | | $12,255 | | | | $3,756 | | | | $5,529 | |
Ratio to average net assets of: | | | | | | | | | | | | | | | | | | | | | | | | |
Expenses, net of waivers/reimbursements | | | .60 | %(e) | | | .60 | % | | | .60 | %(f) | | | .60 | % | | | .60 | % | | | 1.14 | % |
Expenses, before waivers/reimbursements | | | 1.11 | %(e) | | | 1.14 | % | | | 1.23 | %(f) | | | 1.28 | % | | | 1.33 | % | | | 1.14 | % |
Expenses, before waivers/reimbursements excluding interest expense | | | 1.11 | %(e) | | | 1.14 | % | | | 1.23 | %(f) | | | 1.28 | % | | | 1.33 | % | | | 1.14 | % |
Net investment income | | | 2.35 | %(b)(e) | | | 3.81 | %(b) | | | 3.14 | %(f) | | | 4.39 | % | | | 4.42 | % | | | 4.00 | % |
Portfolio turnover rate | | | 115 | % | | | 78 | % | | | 54 | % | | | 86 | % | | | 81 | % | | | 134 | % |
See footnote summary on page 70.
| | |
| 66 | | • ALLIANCEBERNSTEIN UNCONSTRAINED BOND FUND |
Financial Highlights
Selected Data For A Share Of Capital Stock Outstanding Throughout Each Period
| | | | | | | | | | | | | | | | | | | | | | | | |
| | | Class R | |
| | | Six Months
Ended
April 30,
2012
(unaudited) | | | Year Ended October 31, | |
| | | | 2011 | | | 2010 | | | 2009 | | | 2008 | | | 2007 | |
| | | | |
| | | | | | | | | | | | | | | | | | | | | | | | |
Net asset value, beginning of period | | | $ 8.31 | | | | $ 8.47 | | | | $ 8.07 | | | | $ 7.37 | | | | $ 8.99 | | | | $ 8.61 | |
| | | | | | | | | | | | |
Income From Investment Operations | | | | | | | | | | | | | | | | | | | | | | | | |
Net investment income(a) | | | .08 | (b) | | | .25 | (b) | | | .22 | | | | .30 | | | | .34 | | | | .35 | |
Net realized and unrealized gain (loss) on investment and foreign currency transactions | | | .48 | | | | (.14 | ) | | | .39 | | | | .70 | | | | (1.62 | ) | | | .34 | |
Contributions from Adviser | | | – 0 | – | | | – 0 | – | | | – 0 | – | | | – 0 | – | | | .00 | (c) | | | – 0 | – |
| | | | |
Net increase (decrease) in net asset value from operations | | | .56 | | | | .11 | | | | .61 | | | | 1.00 | | | | (1.28 | ) | | | .69 | |
| | | | |
Less: Dividends and Distributions | | | | | | | | | | | | | | | | | | | | | | | | |
Dividends from net investment income | | | (.06 | ) | | | (.27 | ) | | | (.21 | ) | | | (.26 | ) | | | (.34 | ) | | | (.31 | ) |
Tax return of capital | | | – 0 | – | | | – 0 | – | | | – 0 | – | | | (.04 | ) | | | – 0 | – | | | – 0 | – |
| | | | |
Total dividends and distributions | | | (.06 | ) | | | (.27 | ) | | | (.21 | ) | | | (.30 | ) | | | (.34 | ) | | | (.31 | ) |
| | | | |
Net asset value, end of period | | | $ 8.81 | | | | $ 8.31 | | | | $ 8.47 | | | | $ 8.07 | | | | $ 7.37 | | | | $ 8.99 | |
| | | | |
Total Return | | | | | | | | | | | | | | | | | | | | | | | | |
Total investment return based on net asset value(d) | | | 6.73 | %* | | | 1.29 | %* | | | 7.68 | %* | | | 14.12 | %* | | | (14.65 | )%* | | | 8.15 | %* |
Ratios/Supplemental Data | | | | | | | | | | | | | | | | | | | | | | | | |
Net assets, end of period (000’s omitted) | | | $1,071 | | | | $871 | | | | $516 | | | | $364 | | | | $252 | | | | $187 | |
Ratio to average net assets of: | | | | | | | | | | | | | | | | | | | | | | | | |
Expenses, net of waivers/reimbursements | | | 1.10 | %(e) | | | 1.10 | % | | | 1.10 | %(f) | | | 1.10 | % | | | 1.10 | % | | | 1.58 | % |
Expenses, before waivers/reimbursements | | | 1.80 | %(e) | | | 1.84 | % | | | 1.88 | %(f) | | | 1.96 | % | | | 1.88 | % | | | 1.58 | % |
Expenses, before waivers/reimbursements excluding interest expense | | | 1.80 | %(e) | | | 1.84 | % | | | 1.88 | %(f) | | | 1.96 | % | | | 1.88 | % | | | 1.58 | % |
Net investment income | | | 1.78 | %(b)(e) | | | 2.98 | %(b) | | | 2.61 | %(f) | | | 4.02 | % | | | 3.98 | % | | | 4.08 | % |
Portfolio turnover rate | | | 115 | % | | | 78 | % | | | 54 | % | | | 86 | % | | | 81 | % | | | 134 | % |
See footnote summary on page 70.
| | | | |
| ALLIANCEBERNSTEIN UNCONSTRAINED BOND FUND • | | | 67 | |
Financial Highlights
Selected Data For A Share Of Capital Stock Outstanding Throughout Each Period
| | | | | | | | | | | | | | | | | | | | | | | | |
| | | Class K | |
| | | Six Months
Ended
April 30,
2012
(unaudited) | | | Year Ended October 31, | |
| | | | 2011 | | | 2010 | | | 2009 | | | 2008 | | | 2007 | |
| | | | |
| | | | | | | | | | | | | | | | | | | | | | | | |
Net asset value, beginning of period | | | $ 8.34 | | | | $ 8.50 | | | | $ 8.10 | | | | $ 7.39 | | | | $ 9.00 | | | | $ 8.61 | |
| | | | | | | | | | | | |
Income From Investment Operations | | | | | | | | | | | | | | | | | | | | | | | | |
Net investment income(a) | | | .09 | (b) | | | .24 | (b) | | | .23 | | | | .32 | | | | .38 | | | | .32 | |
Net realized and unrealized gain (loss) on investment and foreign currency transactions | | | .48 | | | | (.11 | ) | | | .41 | | | | .71 | | | | (1.63 | ) | | | .40 | |
Contributions from Adviser | | | – 0 | – | | | – 0 | – | | | – 0 | – | | | – 0 | – | | | .00 | (c) | | | – 0 | – |
| | | | |
Net increase (decrease) in net asset value from operations | | | .57 | | | | .13 | | | | .64 | | | | 1.03 | | | | (1.25 | ) | | | .72 | |
| | | | |
Less: Dividends and Distributions | | | | | | | | | | | | | | | | | | | | | | | | |
Dividends from net investment income | | | (.07 | ) | | | (.29 | ) | | | (.24 | ) | | | (.28 | ) | | | (.36 | ) | | | (.33 | ) |
Tax return of capital | | | – 0 | – | | | – 0 | – | | | – 0 | – | | | (.04 | ) | | | – 0 | – | | | – 0 | – |
| | | | |
Total dividends and distributions | | | (.07 | ) | | | (.29 | ) | | | (.24 | ) | | | (.32 | ) | | | (.36 | ) | | | (.33 | ) |
| | | | |
Net asset value, end of period | | | $ 8.84 | | | | $ 8.34 | | | | $ 8.50 | | | | $ 8.10 | | | | $ 7.39 | | | | $ 9.00 | |
| | | | |
Total Return | | | | | | | | | | | | | | | | | | | | | | | | |
Total investment return based on net asset value(d) | | | 6.83 | %* | | | 1.54 | %* | | | 8.00 | %* | | | 14.45 | %* | | | (14.28 | )%* | | | 8.46 | %* |
Ratios/Supplemental Data | | | | | | | | | | | | | | | | | | | | | | | | |
Net assets, end of period (000’s omitted) | | | $44 | | | | $120 | | | | $205 | | | | $25 | | | | $21 | | | | $57 | |
Ratio to average net assets of: | | | | | | | | | | | | | | | | | | | | | | | | |
Expenses, net of waivers/reimbursements | | | .85 | %(e) | | | .85 | % | | | .85 | %(f) | | | .85 | % | | | .85 | % | | | 1.59 | % |
Expenses, before waivers/reimbursements | | | 1.45 | %(e) | | | 1.50 | % | | | 1.29 | %(f) | | | 1.68 | % | | | 1.53 | % | | | 1.59 | % |
Expenses, before waivers/reimbursements excluding interest expense | | | 1.45 | %(e) | | | 1.50 | % | | | 1.29 | %(f) | | | 1.68 | % | | | 1.53 | % | | | 1.59 | % |
Net investment income | | | 2.15 | %(b)(e) | | | 2.78 | %(b) | | | 2.73 | %(f) | | | 4.29 | % | | | 4.02 | % | | | 3.47 | % |
Portfolio turnover rate | | | 115 | % | | | 78 | % | | | 54 | % | | | 86 | % | | | 81 | % | | | 134 | % |
See footnote summary on page 70.
| | |
| 68 | | • ALLIANCEBERNSTEIN UNCONSTRAINED BOND FUND |
Financial Highlights
Selected Data For A Share Of Capital Stock Outstanding Throughout Each Period
| | | | | | | | | | | | | | | | | | | | | | | | |
| | | Class I | |
| | | Six Months
Ended
April 30,
2012
(unaudited) | | | Year Ended October 31, | |
| | | | 2011 | | | 2010 | | | 2009 | | | 2008 | | | 2007 | |
| | | | |
| | | | | | | | | | | | | | | | | | | | | | | | |
Net asset value, beginning of period | | | $ 8.31 | | | | $ 8.48 | | | | $ 8.08 | | | | $ 7.38 | | | | $ 9.00 | | | | $ 8.61 | |
| | | | | | | | | | | | |
Income From Investment Operations | | | | | | | | | | | | | | | | | | | | | | | | |
Net investment income(a) | | | .10 | (b) | | | .28 | (b) | | | .26 | | | | .34 | | | | .38 | | | | .36 | |
Net realized and unrealized gain (loss) on investment and foreign currency transactions | | | .49 | | | | (.14 | ) | | | .40 | | | | .70 | | | | (1.62 | ) | | | .40 | |
Contributions from Adviser | | | – 0 | – | | | – 0 | – | | | – 0 | – | | | – 0 | – | | | .00 | (c) | | | – 0 | – |
| | | | |
Net increase (decrease) in net asset value from operations | | | .59 | | | | .14 | | | | .66 | | | | 1.04 | | | | (1.24 | ) | | | .76 | |
| | | | |
Less: Dividends and Distributions | | | | | | | | | | | | | | | | | | | | | | | | |
Dividends from net investment income | | | (.08 | ) | | | (.31 | ) | | | (.26 | ) | | | (.30 | ) | | | (.38 | ) | | | (.37 | ) |
Tax return of capital | | | – 0 | – | | | – 0 | – | | | – 0 | – | | | (.04 | ) | | | – 0 | – | | | – 0 | – |
| | | | |
Total dividends and distributions | | | (.08 | ) | | | (.31 | ) | | | (.26 | ) | | | (.34 | ) | | | (.38 | ) | | | (.37 | ) |
| | | | |
Net asset value, end of period | | | $ 8.82 | | | | $ 8.31 | | | | $ 8.48 | | | | $ 8.08 | | | | $ 7.38 | | | | $ 9.00 | |
| | | | |
Total Return | | | | | | | | | | | | | | | | | | | | | | | | |
Total investment return based on net asset value(d) | | | 7.12 | %* | | | 1.69 | %* | | | 8.26 | %* | | | 14.69 | %* | | | (14.21 | )%* | | | 8.92 | %* |
Ratios/Supplemental Data | | | | | | | | | | | | | | | | | | | | | | | | |
Net assets, end of period (000’s omitted) | | | $10 | | | | $9 | | | | $10 | | | | $9 | | | | $8 | | | | $10 | |
Ratio to average net assets of: | | | | | | | | | | | | | | | | | | | | | | | | |
Expenses, net of waivers/reimbursements | | | .60 | %(e) | | | .60 | % | | | .60 | %(f) | | | .60 | % | | | .60 | % | | | 1.14 | % |
Expenses, before waivers/reimbursements | | | 1.09 | %(e) | | | 1.17 | % | | | 1.18 | %(f) | | | 1.25 | % | | | 1.28 | % | | | 1.14 | % |
Expenses, before waivers/reimbursements excluding interest expense | | | 1.09 | %(e) | | | 1.17 | % | | | 1.18 | %(f) | | | 1.25 | % | | | 1.28 | % | | | 1.14 | % |
Net investment income | | | 2.31 | %(b)(e) | | | 3.35 | %(b) | | | 3.13 | %(f) | | | 4.57 | % | | | 4.45 | % | | | 4.06 | % |
Portfolio turnover rate | | | 115 | % | | | 78 | % | | | 54 | % | | | 86 | % | | | 81 | % | | | 134 | % |
See footnote summary on page 70.
| | | | |
| ALLIANCEBERNSTEIN UNCONSTRAINED BOND FUND • | | | 69 | |
Financial Highlights
| (a) | | Based on average shares outstanding. |
| (b) | | Net of expenses waived/reimbursed by the Adviser. |
| (c) | | Amount is less than $.005. |
| (d) | | Total investment return is calculated assuming an initial investment made at the net asset value at the beginning of the period, reinvestment of all dividends and distributions at net asset value during the period, and redemption on the last day of the period. Initial sales charges or contingent deferred sales charges are not reflected in the calculation of total investment return. Total return does not reflect the deduction of taxes that a shareholder would pay on fund distributions or the redemption of fund shares. Total investment return calculated for a period of less than one year is not annualized. |
| (f) | | The ratio includes expenses attributable to costs of proxy solicitation. |
| * | | Includes the impact of proceeds received and credited to the Fund resulting from the class action settlements, which enhanced the performance of each share class for the six months ended April 30, 2012 and the years ended October 31, 2011, October 31, 2010, October 31, 2009, October 31, 2008, and October 31, 2007, by 0.01%, 0.08%, 0.55%, 0.57%, 0.81% and 4.31%, respectively. |
See notes to financial statements.
| | |
| 70 | | • ALLIANCEBERNSTEIN UNCONSTRAINED BOND FUND |
Financial Highlights
BOARD OF DIRECTORS
| | |
William H. Foulk, Jr.(1), Chairman John H. Dobkin(1) Michael J. Downey(1) D. James Guzy(1) Nancy P. Jacklin(1) | | Robert M. Keith, President and Chief Executive Officer Garry L. Moody(1) Marshall C. Turner, Jr.(1) Earl D. Weiner(1) |
OFFICERS
| | |
Philip L. Kirstein, Senior Vice President and Independent Compliance Officer Paul J. DeNoon(2), Vice President Joel J. McKoan(2), Vice President Michael L. Mon(2), Vice President Douglas J. Peebles(2) , Vice President | | Matthew S. Sheridan(2) , Vice President Emilie D. Wrapp, Secretary Joseph J. Mantineo, Treasurer and Chief Financial Officer Stephen M. Woetzel, Controller |
| | |
Principal Underwriter AllianceBernstein Investments, Inc. 1345 Avenue of the Americas New York, NY 10105 Custodian and Accounting Agent Brown Brothers Harriman & Co. 40 Water Street Boston, MA 02109 Legal Counsel Seward & Kissel LLP One Battery Park Plaza New York, NY 10004 | | Transfer Agent AllianceBernstein Investor Services, Inc. P.O. Box 786003 San Antonio, TX 78278-6003 Toll-Free (800) 221-5672 Independent Registered Public Accounting Firm Ernst & Young LLP 5 Times Square New York, NY 10036 |
| (1) | | Member of the Audit Committee, the Governance and Nominating Committee and the Independent Directors Committee. Mr. Foulk is the sole member of the Fair Value Pricing Committee. |
| (2) | | The day-to-day management of, and investment decisions for, the Fund’s portfolio are made by the Global Fixed Income Investment Team and the Global Credit Investment Team. Messrs. DeNoon, McKoan, Mon, Peebles and Sheridan are the investment professionals with the most significant responsibility for the day-to-day management of the Fund’s portfolio. |
| | | | |
| ALLIANCEBERNSTEIN UNCONSTRAINED BOND FUND • | | | 71 | |
Board of Directors
Information Regarding the Review and Approval of the Fund’s Advisory Agreement
The disinterested directors (the “directors”) of AllianceBernstein Unconstrained Bond Fund, Inc. (formerly named AllianceBernstein Diversified Yield Fund, Inc.) (the “Fund”) unanimously approved the continuance of the Fund’s Advisory Agreement with the Adviser at a meeting held on November 1-3, 2011.
Prior to approval of the continuance of the Advisory Agreement, the directors had requested from the Adviser, and received and evaluated, extensive materials. They reviewed the proposed continuance of the Advisory Agreement with the Adviser and with experienced counsel who are independent of the Adviser, who advised on the relevant legal standards. The directors also reviewed an independent evaluation prepared by the Fund’s Senior Officer (who is also the Fund’s Independent Compliance Officer) of the reasonableness of the advisory fee in the Advisory Agreement, in which the Senior Officer concluded that the contractual fee for the Fund was reasonable. The directors also discussed the proposed continuance in private sessions with counsel and the Fund’s Senior Officer.
The directors considered their knowledge of the nature and quality of the services provided by the Adviser to the Fund gained from their experience as directors or trustees of most of the registered investment companies advised by the Adviser, their overall confidence in the Adviser’s integrity and competence they have gained from that experience, the Adviser’s initiative in identifying and raising potential issues with the directors and its responsiveness, frankness and attention to concerns raised by the directors in the past, including the Adviser’s willingness to consider and implement organizational and operational changes designed to improve investment results and the services provided to the AllianceBernstein Funds. The directors noted that they have four regular meetings each year, at each of which they receive presentations from the Adviser on the investment results of the Fund and review extensive materials and information presented by the Adviser.
The directors also considered all other factors they believed relevant, including the specific matters discussed below. In their deliberations, the directors did not identify any particular information that was all-important or controlling, and different directors may have attributed different weights to the various factors. The directors determined that the selection of the Adviser to manage the Fund and the overall arrangements between the Fund and the Adviser, as provided in the Advisory Agreement, including the advisory fee, were fair and reasonable in light of the services performed, expenses incurred and such other matters as the directors considered relevant in the exercise of their business judgment. The material factors and conclusions that formed the basis for the directors’ determinations included the following:
| | |
| 72 | | • ALLIANCEBERNSTEIN UNCONSTRAINED BOND FUND |
Nature, Extent and Quality of Services Provided
The directors considered the scope and quality of services provided by the Adviser under the Advisory Agreement, including the quality of the investment research capabilities of the Adviser and the other resources it has dedicated to performing services for the Fund. They also noted the professional experience and qualifications of the Fund’s portfolio management team and other senior personnel of the Adviser. The directors also considered that the Advisory Agreement provides that the Fund will reimburse the Adviser for the cost to it of providing certain clerical, accounting, administrative and other services provided at the Fund’s request by employees of the Adviser or its affiliates. Requests for these reimbursements are approved by the directors on a quarterly basis and, to the extent requested and paid, result in a higher rate of total compensation from the Fund to the Adviser than the fee rate stated in the Fund’s Advisory Agreement. The directors noted that the methodology used to determine the reimbursement amounts had been reviewed by an independent consultant retained by the Fund’s Senior Officer. The quality of administrative and other services, including the Adviser’s role in coordinating the activities of the Fund’s other service providers, also were considered. The directors concluded that, overall, they were satisfied with the nature, extent and quality of services provided to the Fund under the Advisory Agreement.
Costs of Services Provided and Profitability
The directors reviewed a schedule of the revenues, expenses and related notes indicating the profitability of the Fund to the Adviser for calendar years 2009 and 2010 that had been prepared with an expense allocation methodology arrived at in consultation with an independent consultant retained by the Fund’s Senior Officer. The directors reviewed the assumptions and methods of allocation used by the Adviser in preparing fund-specific profitability data and noted that there are a number of potentially acceptable allocation methodologies for information of this type. The directors noted that the profitability information reflected all revenues and expenses of the Adviser’s relationship with the Fund, including those relating to its subsidiaries which provide transfer agency and distribution services to the Fund. The directors recognized that it is difficult to make comparisons of profitability with advisory contracts for unaffiliated funds because comparative information is not generally publicly available and is affected by numerous factors. The directors focused on the profitability of the Adviser’s relationship with the Fund before taxes and distribution expenses. The directors noted that the Adviser’s relationship with the Fund was not profitable to it in 2009 or 2010.
Fall-Out Benefits
The directors considered the other benefits to the Adviser and its affiliates from their relationships with the Fund, including but not limited to, benefits relating to 12b-1 fees and sales charges received by the Fund’s principal underwriter (which is a wholly owned subsidiary of the Adviser) in respect of certain classes
| | | | |
| ALLIANCEBERNSTEIN UNCONSTRAINED BOND FUND • | | | 73 | |
of the Fund’s shares and transfer agency fees paid by the Fund to a wholly owned subsidiary of the Adviser. The directors recognized that the Fund’s unprofitability to the Adviser would be exacerbated without these benefits. The directors understood that the Adviser also might derive reputational and other benefits from its association with the Fund.
Investment Results
In addition to the information reviewed by the directors in connection with the meeting, the directors receive detailed performance information for the Fund at each regular Board meeting during the year. At the November 2011 meeting, the directors reviewed information prepared by Lipper showing performance of the Class A Shares of the Fund as compared with that of a group of similar funds selected by Lipper (the “Performance Group”) and as compared with a broader array of funds selected by Lipper (the “Performance Universe”), and information prepared by the Adviser showing performance of the Class A Shares as compared with the Barclays Capital Global Aggregate Bond Index (USD hedged) (the “Barclays Index”) and the Bank of America (BofA) Merrill Lynch (ML) 3-month US Treasury Bill Index (the “BofA ML Index”), in each case for the 1-, 3-, 5- and 10-year periods ended July 31, 2011. The directors noted that the Fund was in the 5th quintile of the Performance Group and the Performance Universe for the 1-, 3-, 5- and 10-year periods. The Fund outperformed the Barclays Index in the 1- and 10-year periods but lagged that index in the 3- and 5-year periods and outperformed the BofA ML Index in all periods. The directors also noted that they had approved (i) effective November 2007, modifications to the Fund’s investment policy guidelines and a name change to AllianceBernstein Diversified Yield Fund, and (ii) effective February 2011, a new investment policy and a name change to AllianceBernstein Unconstrained Bond Fund. The directors discussed with the Adviser the reasons for the Fund’s performance. Based on their review and their discussion with the Adviser, the directors retained confidence in the Adviser’s ability to advise the Fund. The directors determined to continue to monitor closely the Fund’s performance.
Advisory Fees and Other Expenses
The directors considered the advisory fee rate paid by the Fund to the Adviser and information prepared by Lipper concerning advisory fee rates paid by other funds in the same Lipper category as the Fund at a common asset level. The directors recognized that it is difficult to make comparisons of advisory fees because there are variations in the services that are included in the fees paid by other funds.
The directors also considered the fees the Adviser charges other clients pursuing a substantially similar investment style. For this purpose, they reviewed the relevant fee information from the Adviser’s Form ADV and the evaluation from the Fund’s Senior Officer. The directors noted that the institutional fee schedule had breakpoints at lower asset levels than those in the fee schedule applicable to the
| | |
| 74 | | • ALLIANCEBERNSTEIN UNCONSTRAINED BOND FUND |
Fund and that the application of the institutional fee schedule to the level of assets of the Fund would result in a fee rate lower than the rate being paid by the Fund. The directors noted that the Adviser may, in some cases, agree to fee rates with large institutional clients that are lower than those reviewed by the directors and that they had previously discussed with the Adviser its policies in respect of such arrangements.
The Adviser reviewed with the directors the significantly greater scope of the services it provides to the Fund relative to institutional clients. The Adviser also noted that because mutual funds are constantly issuing and redeeming shares, they are more difficult to manage than an institutional account, where the assets tend to be relatively stable. In light of the substantial differences in services rendered by the Adviser to institutional clients as compared to funds such as the Fund, the directors considered these fee comparisons inapt and did not place significant weight on them in their deliberations.
The directors also considered the total expense ratio of the Class A shares of the Fund in comparison to the fees and expenses of funds within two comparison groups created by Lipper: an Expense Group and an Expense Universe. Lipper described an Expense Group as a representative sample of funds similar to the Fund and an Expense Universe as a broader group, consisting of all funds in the investment classification/objective with a similar load type as the Fund. The Class A expense ratio of the Fund was based on the Fund’s latest fiscal year and reflected fee waivers and/or expense reimbursements as a result of an undertaking by the Adviser. The directors noted that it was likely that the expense ratios of some of the other funds in the Fund’s Lipper category were lowered by waivers or reimbursements by those funds’ investment advisers, which in some cases might be voluntary or temporary. The directors view the expense ratio information as relevant to their evaluation of the Adviser’s services because the Adviser is responsible for coordinating services provided to the Fund by others.
The directors noted that, at the Fund’s current size, its contractual effective advisory fee rate of 50 basis points was lower than the Expense Group median. The directors noted that the administrative expense reimbursement was 11 basis points in the Fund’s latest fiscal year, and that as a result the rate of total compensation received by the Adviser pursuant to the Advisory Agreement was about the same as the Expense Group median. The directors noted that the Fund’s total expense ratio, which reflected a cap by the Adviser, was lower than the Expense Group and the Expense Universe medians. The directors concluded that the Fund’s expense ratio was satisfactory.
Economies of Scale
The directors noted that the advisory fee schedule for the Fund contains breakpoints that reduce the fee rates on assets above specified levels. The directors took into consideration prior presentations by an independent consultant on
| | | | |
| ALLIANCEBERNSTEIN UNCONSTRAINED BOND FUND • | | | 75 | |
economies of scale in the mutual fund industry and for the AllianceBernstein Funds, and by the Adviser concerning certain of its views on economies of scale. The directors also had requested and received from the Adviser certain updates on economies of scale at the May 2011 meetings. The directors believe that economies of scale may be realized (if at all) by the Adviser across a variety of products and services, and not only in respect of a single fund. The directors noted that there is no established methodology for establishing breakpoints that give effect to the fund-specific services provided by a fund’s adviser and to the economies of scale that an adviser may realize in its overall mutual fund business or those components of it which directly or indirectly affect a fund’s operations. The directors observed that in the mutual fund industry as a whole, as well as among funds similar to the Fund, there is no uniformity or pattern in the fees and asset levels at which breakpoints (if any) apply. The directors also noted that the advisory agreements for many funds do not have breakpoints at all. Having taken these factors into account, the directors concluded that the Fund’s shareholders would benefit from a sharing of economies of scale in the event the Fund’s net assets exceed a breakpoint in the future.
| | |
| 76 | | • ALLIANCEBERNSTEIN UNCONSTRAINED BOND FUND |
THE FOLLOWING IS NOT PART OF THE SHAREHOLDER REPORT OR THE FINANCIAL STATEMENTS
SUMMARY OF SENIOR OFFICER’S EVALUATION OF INVESTMENT ADVISORY AGREEMENT1
The following is a summary of the evaluation of the Investment Advisory Agreement between AllianceBernstein L.P. (the “Adviser”) and The AllianceBernstein Unconstrained Bond Fund2 (the “Fund”),3 prepared by Philip L. Kirstein, the Senior Officer of the Fund for the Directors of the Fund, as required by the August 2004 agreement between the Adviser and the New York State Attorney General (the “NYAG”). The Senior Officer’s evaluation of the Investment Advisory Agreement is not meant to diminish the responsibility or authority of the Board of Directors to perform its duties pursuant to Section 15 of the Investment Company Act of 1940 (the “40 Act”) and applicable state law. The purpose of the summary is to provide shareholders with a synopsis of the independent evaluation of the reasonableness of the advisory fees proposed to be paid by the Fund which was provided to the Directors in connection with their review of the proposed approval of the continuance of the Investment Advisory Agreement.
The Senior Officer’s evaluation considered the following factors:
| | 1. | Advisory fees charged to institutional and other clients of the Adviser for like services; |
| | 2. | Advisory fees charged by other mutual fund companies for like services; |
| | 3. | Costs to the Adviser and its affiliates of supplying services pursuant to the advisory agreement, excluding any intra-corporate profit; |
| | 4. | Profit margins of the Adviser and its affiliates from supplying such services; |
| | 5. | Possible economies of scale as the Fund grows larger; and |
| | 6. | Nature and quality of the Adviser’s services including the performance of the Fund. |
These factors, with the exception of the first factor, are generally referred to as the “Gartenberg factors,” which were articulated by the United States Court of Appeals for the Second Circuit in 1982. Gartenberg v. Merrill Lynch Asset Management, Inc., 694 F. 2d 923 (2d Cir. 1982). On March 30, 2010, the Supreme Court held the Gartenberg decision was correct in its basic formulation
| 1 | | The information in the fee evaluation was completed on October 20, 2011 and discussed with the Board of Directors on November 1-3, 2011. |
| 2 | | Prior to February 3, 2011, the Fund was known as AllianceBernstein Diversified Yield Fund, Inc. |
| 3 | | Future references to the Fund do not include “AllianceBernstein.” References in the fee summary pertaining to performance and expense ratios refer to Class A shares of the Fund. |
| | | | |
| ALLIANCEBERNSTEIN UNCONSTRAINED BOND FUND • | | | 77 | |
of what §36(b) requires: to face liability under §36(b), “an investment adviser must charge a fee that is so disproportionately large that it bears no reasonable relationship to the services rendered and could not have been the product of arm’s length bargaining.” Jones v. Harris Associates L.P., 130 S. Ct. 1418 (2010). In Jones, the Court stated the Gartenberg approach fully incorporates the correct understanding of fiduciary duty within the context of section 36(b) and noted with approval that “Gartenberg insists that all relevant circumstances be taken into account” and “uses the range of fees that might result from arm’s length bargaining as the benchmark for reviewing challenged fees.”4
ADVISORY FEES, NET ASSETS, & EXPENSE RATIOS
The Adviser proposed that the Fund pay the advisory fee set forth in the table below for receiving the services to be provided pursuant to the Investment Advisory Agreement. The fee schedule below, implemented in January 2004 in consideration of the Adviser’s settlement with the NYAG in December 2003, is based on a master schedule that contemplates eight categories of funds with almost all funds in each category having the same advisory fee schedule.5 Also shown are the Fund’s net assets on September 30, 2011.
| | | | | | |
| Category | | Advisory Fee6 | | September 30, 2011 Net Assets
($MM) | |
| High Income | | 50 bp on 1st $2.5 billion 45 bp on next $2.5 billion 40 bp on the balance | | $ | 99.9 | |
The Fund’s Investment Advisory Agreement provides for the Adviser to be reimbursed for certain clerical, legal, accounting, administrative and other services provided to the Fund. During the Fund’s most recently completed fiscal year, the Adviser received $88,288 (0.11% of the Fund’s average daily net assets) for providing such services.
The Adviser has agreed to waive that portion of its advisory fees and/or reimburse the Fund for that portion of the Fund’ total operating expenses to the degree necessary to limit the Fund’s expense ratio to the amounts set forth below for the Fund’s current fiscal year. The waiver agreement is terminable by the Adviser at the end of the Fund’ fiscal year upon at least 60 days written
| 4 | | Jones v. Harris at 1427. |
| 5 | | Most of the AllianceBernstein Mutual Funds, which the Adviser manages, were affected by the Adviser’s settlement with the NYAG. |
| 6 | | The advisory fees are based on the Fund’s average daily adjusted total assets (i.e. the average daily value of total assets minus the sum of accrued liabilities other than the principal amount of money borrowed). |
| | |
| 78 | | • ALLIANCEBERNSTEIN UNCONSTRAINED BOND FUND |
notice. In addition, set forth below are the gross expense ratios of the Fund, annualized for the most recent semi-annual period:7
| | | | | | | | | | | | |
| Fund | | Expense Cap Pursuant to
Expense Limitation
Undertaking | | | Gross Expense
Ratio
(4/30/11)8 | | | Fiscal
Year End |
| Unconstrained Bond Fund, Inc. | | Advisor
Class A Class B Class C Class R Class K Class I | |
| 0.60
0.90 1.60 1.60 1.10 0.85 0.60 | %
% % % % % % | |
| 1.07
1.41 2.18 2.12 1.77 1.48 1.17 | %
% % % % % % | | October 31 |
| I. | ADVISORY FEES CHARGED TO INSTITUTIONAL AND OTHER CLIENTS |
The advisory fees charged to investment companies which the Adviser manages and sponsors are normally higher than those charged to similar sized institutional accounts, including pension plans and sub-advised investment companies. The fee differential reflects, among other things, different services provided to such clients, and different liabilities assumed. Services provided by the Adviser to the Fund that are not provided to non-investment company clients and sub-advised investment companies include providing office space and personnel to serve as Fund Officers, who among other responsibilities make the certifications required under the Sarbanes–Oxley Act of 2002, and coordinating with and monitoring the Fund’s third party service providers such as Fund counsel, auditors, custodians, transfer agents and pricing services. The accounting, administrative, legal and compliance requirements for the Fund are more costly than those for institutional assets due to the greater complexities and time required for investment companies, although as previously noted, the Adviser is reimbursed for providing some of these services. Also, retail mutual funds managed by the Adviser are widely held. Servicing the Fund’ investors is more time consuming and labor intensive compared to institutional clients since the Adviser needs to communicate with a more extensive network of financial intermediaries and shareholders. The Adviser also believes that it incurs substantial entrepreneurial risk when offering a new mutual fund since establishing a new mutual fund requires a large upfront investment and it may take a long time for the fund to achieve profitability since the fund must be priced to scale from inception in order to be competitive and assets are acquired one account at a time. In addition, managing the cash flow of an investment company may be more difficult than managing that of a stable pool of assets, such as an institutional account with little cash movement in either direction, particularly, if a fund is in net redemption and the Adviser is frequently forced to sell securities to raise cash for redemptions. However, managing a fund with positive cash flow may be easier at times than managing a stable pool of assets. Finally, in recent years, investment advisers have been sued by institutional clients and have
| 7 | | Semi-annual total expense ratios are unaudited. |
| | | | |
| ALLIANCEBERNSTEIN UNCONSTRAINED BOND FUND • | | | 79 | |
suffered reputational damage both by the attendant publicity and outcomes other than complete victories. Accordingly, the legal and reputational risks associated with institutional accounts are greater than previously thought, although still not equal to those related to the mutual fund industry.
Notwithstanding the Adviser’s view that managing an investment company is not comparable to managing other institutional accounts because the services provided are different, the Supreme Court has indicated consideration should be given to the advisory fees charged to institutional accounts with a similar investment style as the Fund.9 In addition to the AllianceBernstein Institutional fee schedule, set forth below is what would have been the effective advisory fee of the Fund had the AllianceBernstein Institutional fee schedule been applicable to the Fund versus the Fund’s advisory fee based on September 30, 2011 net assets.10
| | | | | | | | | | | | |
| Fund | | Net Assets 9/30/11 ($MM) | | AllianceBernstein
Institutional Fee Schedule | | Effective
AB Inst.
Adv. Fee (%) | | | Fund Advisory Fee (%) | |
| Unconstrained Bond Fund, Inc. | | $99.9 | | Diversified Yield Schedule 40 bp on 1st $50 million 25 bp on the balance Minimum Account Size: $50m | | | 0.325% | | | | 0.500% | |
The Adviser represented that it does not sub-advise any registered investment companies of other fund families with a substantially similar investment style as the Fund.
| II. | MANAGEMENT FEES CHARGED BY OTHER MUTUAL FUND COMPANIES FOR LIKE SERVICES. |
Lipper, Inc. (“Lipper”), an analytical service that is not affiliated with the Adviser, compared the fees charged to the Fund with fees charged to other investment companies for similar services offered by other investment advisers.11 Lipper’s analysis included the comparison of the Fund’s contractual management
| 9 | | The Supreme Court stated that “courts may give such comparisons the weight that they merit in light of the similarities and differences between the services that the clients in question require, but the courts must be wary of inapt comparisons.” Among the significant differences the Supreme Court noted that may exist between services provided to mutual funds and institutional accounts are “higher marketing costs.” Jones v. Harris at 1428. |
| 10 | | The Adviser has indicated that with respect to institutional accounts with assets greater than $300 million, it will negotiate a fee schedule. Discounts that are negotiated vary based upon each client relationship. |
| 11 | | The Supreme Court cautioned against accepting mutual fund fee comparisons without careful scrutiny since “these comparisons are problematic because these fees, like those challenged, may not be the product of negotiations conducted at arm’s length.” Jones v. Harris at 1429. |
| | |
| 80 | | • ALLIANCEBERNSTEIN UNCONSTRAINED BOND FUND |
fee, estimated at the approximate current asset level of the Fund, to the median of the Fund’s Lipper Expense Group (“EG”)12 and the Fund’s contractual management fee ranking.13
Lipper describes an EG as a representative sample of comparable funds. Lipper’s standard methodology for screening funds to be included in an EG entails the consideration of several fund criteria, including fund type, investment classification/objective, load type and similar 12b-1/non-12b-1 service fees, asset (size) comparability, expense components and attributes. An EG will typically consist of seven to twenty funds.
| | | | | | | | | | | | |
| Fund | | Contractual Management Fee (%)14 | | | Lipper Exp. Group Median (%) | | | Lipper Group Rank | |
| Unconstrained Bond Fund, Inc. | | | 0.500 | | | | 0.600 | | | | 2/11 | |
Lipper also compared the Fund’s total expense ratio to the medians of the Fund’s EG and Lipper Expense Universe (“EU”). The EU is a broader group compared to the EG, consisting of all funds that have the same investment classifications/objective and load type as the subject Fund.
| | | | | | | | | | | | | | | | | | | | |
| Fund | | Expense Ratio (%)15 | | | Lipper Exp. Group Median (%) | | | Lipper Group Rank | | | Lipper Exp. Universe Median (%) | | | Lipper Universe Rank | |
| Unconstrained Bond Fund, Inc. | | | 0.899 | | | | 1.149 | | | | 2/11 | | | | 1.026 | | | | 5/33 | |
Based on this analysis, the Fund has equally favorable rankings on a management fee basis and on a total expense basis.
| 12 | | Lipper does not consider average account size when constructing EGs. Funds with relatively small average account sizes tend to have higher transfer agent expense ratio than comparable sized funds that have relatively large average account sizes. Note that there are limitations on Lipper expense category data because different funds categorize expenses differently. |
| 13 | | The contractual management fee is calculated by Lipper using the Fund’s contractual management fee rate at a hypothetical asset level. The hypothetical asset level is based on the combined net assets of all classes of the Fund, rounded up to the next $25 million. Lipper’s total expense ratio information is based on the most recent annual report except as otherwise noted. A ranking of “1” would mean that the Fund had the lowest effective fee rate in the Lipper peer group. |
| 14 | | The contractual management fee does not reflect any expense reimbursements made by the Fund to the Adviser for certain clerical, legal, accounting, administrative, and other services. In addition, the contractual management fee does not reflect any advisory fee waivers or expense reimbursements made by the Adviser that would effectively reduce the actual effective management fee. |
| 15 | | Most recently completed fiscal year Class A share total expense ratio. |
| | | | |
| ALLIANCEBERNSTEIN UNCONSTRAINED BOND FUND • | | | 81 | |
| III. | COSTS TO THE ADVISER AND ITS AFFILIATES OF SUPPLYING SERVICES PURSUANT TO THE MANAGEMENT FEE ARRANGEMENT, EXCLUDING ANY INTRA-CORPORATE PROFIT. |
The Adviser utilizes two profitability reporting systems, which operate independently but are aligned with each other, to estimate the Adviser’s profitability in connection with investment advisory services provided to the Fund. The Senior Officer has retained a consultant to provide independent advice regarding the alignment of the two profitability systems as well as the methodologies and allocations utilized by both profitability systems. See Section IV for additional discussion.
| IV. | PROFIT MARGINS OF THE ADVISER AND ITS AFFILIATES FOR SUPPLYING SUCH SERVICES. |
The Fund’s profitability information, prepared by the Adviser for the Board of Directors, was reviewed by the Senior Officer and the consultant. The Adviser’s profitability from providing investment advisory services to the Fund was less negative during calendar year 2010, relative to 2009.
In addition to the Adviser’s direct profits from managing the Fund, certain of the Adviser’s affiliates have business relationships with the Fund and may earn a profit from providing other services to the Fund. The courts have referred to this type of business opportunity as “fall-out benefits” to the Adviser and indicated that such benefits should be factored into the evaluation of the total relationship between the Fund and the Adviser. Neither case law nor common business practice precludes the Adviser’s affiliates from earning a reasonable profit on this type of relationship provided the affiliates’ charges and services are competitive and the relationship otherwise complies with the 40 Act restrictions. These affiliates provide transfer agent and distribution services to the Fund and receive transfer agent fees, Rule 12b-1 payments, front-end sales loads and contingent deferred sales charges (“CDSC”).
AllianceBernstein Investments, Inc. (“ABI”), an affiliate of the Adviser, is the Fund’s principal underwriter. ABI and the Adviser have disclosed in the Fund’s prospectus that they may make revenue sharing payments from their own resources, in addition to resources derived from sales loads and Rule 12b-1 fees, to firms that sell shares of the Fund. In 2010, ABI paid approximately 0.04% of the average monthly assets of the AllianceBernstein Mutual Funds or approximately $13.8 million for distribution services and educational support (revenue sharing payments).
During the Fund’s most recently completed fiscal year, ABI received from the Fund $3,898, $323,331 and $9,893 in front-end sales charges, Rule 12b-1 and CDSC fees, respectively.
Fees and reimbursements for out of pocket expenses charged by AllianceBernstein Investor Services, Inc. (“ABIS”), the affiliated transfer agent
| | |
| 82 | | • ALLIANCEBERNSTEIN UNCONSTRAINED BOND FUND |
for the Fund, are based on the level of the network account and the class of shares held by the account. ABIS also receives a fee per shareholder sub-account for each account maintained by an intermediary on an omnibus basis. ABIS received $42,536 in net fees from the Fund during the Fund’s most recently completed fiscal year:
| V. | POSSIBLE ECONOMIES OF SCALE |
The Adviser has indicated that economies of scale are being shared with shareholders through fee structures,16 subsidies and enhancement to services. Based on some of the professional literature that has considered economies of scale in the mutual fund industry, it is thought that to the extent economies of scale exist, they may more often exist across a fund family as opposed to a specific fund. This is because the costs incurred by the Adviser, such as investment research or technology for trading or compliance systems can be spread across a greater asset base as the fund family increases in size. It is also possible that as the level of services required to operate a successful investment company has increased over time, and advisory firms make such investments in their business to provide services, there may be a sharing of economies of scale without a reduction in advisory fees.
In February 2008, an independent consultant, retained by the Senior Officer, provided the Board of Directors an update of the Deli17 study on advisory fees and various fund characteristics.18 The independent consultant first reiterated the results of his previous two dimensional comparison analysis (fund size and family size) with the Board of Directors.19 The independent consultant then discussed the results of the regression model that was utilized to study the effects of various factors on advisory fees. The regression model output indicated that the bulk of the variation in fees predicted were explained by various factors, but substantially by fund AUM, family AUM, index fund indicator and investment style. The independent consultant also compared the advisory fees of the
| 16 | | Fee structures include fee reductions, pricing at scale and breakpoints in advisory fee schedules. |
| 17 | | The Deli study, originally published in 2002 based on 1997 data and updated for the February 2008 Presentation, may be of diminished value due to the age of the data used in the presentation and the changes experienced in the industry over the last four years. |
| 18 | | As mentioned previously, the Supreme Court cautioned against accepting mutual fund fee comparisons without careful scrutiny since the fees may not be the product of negotiations conducted at arm’s length. See Jones V. Harris at 1429. |
| 19 | | The two dimensional analysis showed patterns of lower advisory fees for funds with larger asset sizes and funds from larger family sizes compared to funds with smaller asset sizes and funds from smaller family sizes, which according to the independent consultant is indicative of a sharing of economies of scale and scope. However, in less liquid and active markets, such is not the case, as the empirical analysis showed potential for diseconomies of scale in those markets. The empirical analysis also showed diminishing economies of scale and scope as funds surpassed a certain high level of assets. |
| | | | |
| ALLIANCEBERNSTEIN UNCONSTRAINED BOND FUND • | | | 83 | |
AllianceBernstein Mutual Funds to similar funds managed by 19 other large asset managers, regardless of the fund size and each Adviser’s proportion of mutual fund assets to non-mutual fund assets.
| VI. | NATURE AND QUALITY OF THE ADVISER’S SERVICES, INCLUDING THE PERFORMANCE OF THE FUND |
With assets under management of approximately $402 billion as of September 30, 2011, the Adviser has the investment experience to manage and provide non-investment services (described in Section I) to the Fund.
The information prepared by Lipper shows the 1, 3, 5 and 10 year performance rankings20 of the Fund relative to its Lipper Performance Group (“PG”) and Lipper Performance Universe (“PU”)21 for the periods ended July 31, 2011.22
| | | | | | | | | | | | | | | | | | | | |
| | | Fund
Return
(%) | | | PG
Median
(%) | | | PU
Median (%) | | | PG
Rank | | | PU
Rank | |
| Unconstrained Bond Fund, Inc. | | | | | | | | | | | | | | | | | | | | |
1 year | | | 4.51 | | | | 7.59 | | | | 8.65 | | | | 10/11 | | | | 33/37 | |
3 year | | | 4.02 | | | | 8.71 | | | | 9.46 | | | | 9/10 | | | | 31/32 | |
5 year | | | 3.67 | | | | 6.65 | | | | 7.43 | | | | 6/7 | | | | 24/25 | |
10 year | | | 5.14 | | | | 6.73 | | | | 7.80 | | | | 5/5 | | | | 22/22 | |
Set forth below are the 1, 3, 5 and 10 year and since inception performance returns of the Fund (in bold)23 versus its benchmarks.24 Fund and benchmark volatility and reward-to-variability ratio (“Sharpe Ratio”) information is also shown.25
| 20 | | The performance returns and rankings of the Fund are for the Fund’ Class A shares. It should be noted that performance returns of the Fund were provided by Lipper. |
| 21 | | The Fund’s PG is identical to the Fund’s EG. The Fund’s PU is not identical to the Fund’s EU as the criteria for including/excluding a fund from a PU is somewhat different from that of an EU. |
| 22 | | The current Lipper investment classification/objective dictates the PG and PU throughout the life of the Fund even if a Fund had a different investment classification/objective at a different point in time. |
| 23 | | The performance returns and risk measures shown in the table are for the Class A shares of the Fund. |
| 24 | | The Adviser provided Fund and benchmark performance return information for periods through July 31, 2011. |
| 25 | | Fund and benchmark volatility and Sharpe Ratio information was obtained through Lipper LANA, a database maintained by Lipper. Volatility is a statistical measure of the tendency of a market price or yield to vary over time. A Sharpe Ratio is a risk adjusted measure of return that divides a fund’s return in excess of the riskless return by the fund’s standard deviation. A fund with a greater volatility would be viewed as more risky than a fund with equivalent performance but lower volatility; for that reason, a greater return would be demanded for the more risky fund. A fund with a higher Sharpe Ratio would be regarded as better performing than a fund with a lower Sharpe Ratio. |
| | |
| 84 | | • ALLIANCEBERNSTEIN UNCONSTRAINED BOND FUND |
| | | | | | | | | | | | | | | | | | | | | | | | | | | | | | | | |
| | | Periods Ending July 31, 2011 | |
| | | Annualized Performance | | | Since
Inception
(%) | | | Annualized | | | Risk Period (Year) | |
| | | 1 Year
(%) | | | 3 Year
(%) | | | 5 Year
(%) | | | 10 Year
(%) | | | | Volatility (%) | | | Sharpe (%) | | |
| Unconstrained Bond Fund, Inc. | | | 4.51 | | | | 3.94 | | | | 3.62 | | | | 5.11 | | | | 6.24 | | | | 5.89 | | | | 0.52 | | | | 10 | |
| Bank of America Merrill Lynch 3-Month U.S. Treasury Bill Index | | | 0.14 | | | | 0.36 | | | | 1.91 | | | | 2.09 | | | | N/A | | | | 0.52 | | | | N/A | | | | 10 | |
| Barclays Capital Global Aggregate Bond Index (USD hedged) | | | 2.39 | | | | 5.71 | | | | 5.29 | | | | 4.96 | | | | N/A | | | | | | | | | | | | | |
| Inception Date: January 9, 1996 | | | | | | | | | | | | | |
CONCLUSION:
Based on the factors discussed above the Senior Officer’s conclusion is that the proposed advisory fee for the Fund is reasonable and within the range of what would have been negotiated at arm’s length in light of all the surrounding circumstances. This conclusion in respect of the Fund is based on an evaluation of all of these factors and no single factor was dispositive.
Dated: November 28, 2011
| | | | |
| ALLIANCEBERNSTEIN UNCONSTRAINED BOND FUND • | | | 85 | |
THIS PAGE IS NOT PART OF THE SHAREHOLDER REPORT OR THE FINANCIAL STATEMENTS
ALLIANCEBERNSTEIN FAMILY OF FUNDS
Wealth Strategies Funds
Balanced Wealth Strategy
Conservative Wealth Strategy
Wealth Appreciation Strategy
Tax-Managed Balanced Wealth Strategy
Tax-Managed Conservative Wealth Strategy
Tax-Managed Wealth Appreciation Strategy
Asset Allocation/Multi-Asset
Dynamic All Market Fund
Emerging Markets Multi-Asset
International Portfolio
Real Asset Strategy
Tax-Managed International Portfolio
Growth Funds
Domestic
Growth Fund
Large Cap Growth Fund
Select U.S. Equity Portfolio
Small Cap Growth Portfolio
Small/Mid Cap Growth Fund
U.S. Strategic Research Portfolio
Global & International
Global Thematic Growth Fund
International Discovery Equity Portfolio
International Focus 40 Portfolio
International Growth Fund
Value Funds
Domestic
Core Opportunities Fund
Equity Income Fund
Growth & Income Fund
Small/Mid Cap Value Fund
Value Fund
Global & International
Global Real Estate Investment Fund
Global Value Fund
International Value Fund
Taxable Bond Funds
Bond Inflation Strategy
Global Bond Fund
High Income Fund
Intermediate Bond Portfolio
Limited Duration High Income Portfolio
Short Duration Portfolio
Unconstrained Bond Fund
Municipal Bond Funds
| | |
Arizona California High Income Massachusetts Michigan Minnesota Municipal Bond Inflation Strategy | | National New Jersey New York Ohio Pennsylvania Virginia |
Intermediate Municipal Bond Funds
Intermediate California
Intermediate Diversified
Intermediate New York
Closed-End Funds
Alliance California Municipal Income Fund
Alliance New York Municipal Income Fund
AllianceBernstein Global High Income Fund
AllianceBernstein Income Fund
AllianceBernstein National Municipal Income Fund
Alternatives
Market Neutral Strategy-Global
Market Neutral Strategy-U.S.
Balanced
Balanced Shares
Retirement Strategies Funds
| | | | |
2000 Retirement Strategy | | 2020 Retirement Strategy | | 2040 Retirement Strategy |
2005 Retirement Strategy | | 2025 Retirement Strategy | | 2045 Retirement Strategy |
2010 Retirement Strategy | | 2030 Retirement Strategy | | 2050 Retirement Strategy |
2015 Retirement Strategy | | 2035 Retirement Strategy | | 2055 Retirement Strategy |
We also offer Exchange Reserves,* which serves as the money market fund exchange vehicle for the AllianceBernstein mutual funds.
Investors should consider the investment objectives, risks, charges and expenses of the Fund carefully before investing. For copies of our prospectus or summary prospectus, which contain this and other information, visit us online at www.alliancebernstein.com or contact your AllianceBernstein investments representative. Please read the prospectus and/or summary prospectus carefully before investing.
| * | An investment in the Fund is not a deposit in a bank and is not insured or guaranteed by the Federal Deposit Insurance Corporation or any other government agency. Although the Fund seeks to preserve the value of your investment at $1.00 per share, it is possible to lose money by investing in the Fund. |
| | |
| 86 | | • ALLIANCEBERNSTEIN UNCONSTRAINED BOND FUND |
AllianceBernstein Family of Funds
NOTES
| | | | |
| ALLIANCEBERNSTEIN UNCONSTRAINED BOND FUND • | | | 87 | |
NOTES
| | |
| 88 | | • ALLIANCEBERNSTEIN UNCONSTRAINED BOND FUND |
NOTES
| | | | |
| ALLIANCEBERNSTEIN UNCONSTRAINED BOND FUND • | | | 89 | |
NOTES
| | |
| 90 | | • ALLIANCEBERNSTEIN UNCONSTRAINED BOND FUND |
NOTES
| | | | |
| ALLIANCEBERNSTEIN UNCONSTRAINED BOND FUND • | | | 91 | |
NOTES
| | |
| 92 | | • ALLIANCEBERNSTEIN UNCONSTRAINED BOND FUND |
ALLIANCEBERNSTEIN UNCONSTRAINED BOND FUND
1345 Avenue of the Americas
New York, NY 10105
800.221.5672
| | |
| |
| UB-0152-0412 | |  |
ITEM 2. CODE OF ETHICS.
Not applicable when filing a semi-annual report to shareholders.
ITEM 3. AUDIT COMMITTEE FINANCIAL EXPERT.
Not applicable when filing a semi-annual report to shareholders.
ITEM 4. PRINCIPAL ACCOUNTANT FEES AND SERVICES.
Not applicable when filing a semi-annual report to shareholders.
ITEM 5. AUDIT COMMITTEE OF LISTED REGISTRANTS.
Not applicable to the registrant.
ITEM 6. SCHEDULE OF INVESTMENTS.
Please see Schedule of Investments contained in the Report to Shareholders included under Item 1 of this Form N-CSR.
ITEM 7. DISCLOSURE OF PROXY VOTING POLICIES AND PROCEDURES FOR CLOSED-END MANAGEMENT INVESTMENT COMPANIES.
Not applicable to the registrant.
ITEM 8. PORTFOLIO MANAGERS OF CLOSED-END MANAGEMENT INVESTMENT COMPANIES.
Not applicable to the registrant.
ITEM 9. PURCHASES OF EQUITY SECURITIES BY CLOSED-END MANAGEMENT INVESTMENT COMPANY AND AFFILIATED PURCHASERS.
Not applicable to the registrant.
ITEM 10. SUBMISSION OF MATTERS TO A VOTE OF SECURITY HOLDERS.
There have been no material changes to the procedures by which shareholders may recommend nominees to the Fund’s Board of Directors since the Fund last provided disclosure in response to this item.
ITEM 11. CONTROLS AND PROCEDURES.
(a) The registrant’s principal executive officer and principal financial officer have concluded that the registrant’s disclosure controls and procedures (as defined in Rule 30a-2(c) under the Investment Company Act of 1940, as amended) are effective at the reasonable assurance level based on their evaluation of these controls and procedures as of a date within 90 days of the filing date of this document.
(b) There were no changes in the registrant’s internal controls over financial reporting that occurred during the second fiscal quarter of the period that has materially affected, or is reasonably likely to materially affect, the registrant’s internal control over financial reporting.
ITEM 12. EXHIBITS.
The following exhibits are attached to this Form N-CSR:
| | |
EXHIBIT NO. | | DESCRIPTION OF EXHIBIT |
| |
| 12 (b) (1) | | Certification of Principal Executive Officer Pursuant to Section 302 of the Sarbanes-Oxley Act of 2002 |
| |
| 12 (b) (2) | | Certification of Principal Financial Officer Pursuant to Section 302 of the Sarbanes-Oxley Act of 2002 |
| |
| 12 (c) | | Certification of Principal Executive Officer and Principal Financial Officer Pursuant to Section 906 of the Sarbanes-Oxley Act of 2002 |
SIGNATURES
Pursuant to the requirements of the Securities Exchange Act of 1934 and the Investment Company Act of 1940, the registrant has duly caused this report to be signed on its behalf by the undersigned, thereunto duly authorized.
(Registrant): AllianceBernstein Unconstrained Bond Fund, Inc.
| | |
| By: | | /s/ Robert M. Keith |
| | Robert M. Keith President |
| |
| Date: | | January 11, 2013 |
Pursuant to the requirements of the Securities Exchange Act of 1934 and the Investment Company Act of 1940, this report has been signed below by the following persons on behalf of the registrant and in the capacities and on the dates indicated.
| | |
| By: | | /s/ Robert M. Keith |
| | Robert M. Keith President |
| |
| Date: | | January 11, 2013 |
| | |
| By: | | /s/ Joseph J. Mantineo |
| | Joseph J. Mantineo Treasurer and Chief Financial Officer |
| |
| Date: | | January 11, 2013 |