
Globix Corporation
September 2005
New York City
Peter Stevenson – CEO • Robert Dennerlein – CFO
AMEX Listed: GEX
1

Forward Looking Information and Pro Forma Statements
“This presentation contains forward-looking information
that is subject to various risks, including risks
described in the most recent Annual Report on Form
10-K of Globix Corporation and other documents filed
by Globix with the SEC.”
2

Overview of Globix
2005 Highlights:
Closed merger with NEON Communication
Listed on American Stock Exchange: GEX
Continued reduction of long-term debt
$12.5M of LT debt converted to equity as of March 05
11% senior notes down to $68 million
Achieving synergies from the merger
Approximately $1.5 million in quarterly cost reductions
Integrated network and facility organizations
Moving Globix 3rd party circuits onto the Neon network
3
Revenue:
$114 (LTM) MM
Employees:
~350
Customers:
~1,500
Major Locations:
New York, NY
Boston MA
London, England
Atlanta, GA
Fairfield, NJ
Reston, VA
Santa Clara, CA
Infrastructure:
POPs:
170+
Current Data Centers:
9
Colocation Facilities:
16
Telecom/Data Center Space:
139,000+ sq. feet
Fiber Miles:
220,000+
Route Miles:
5,000+
What We Do:
Network Services
Hosting and Server Solutions:
- Managed Hosting
- Collocation
- Security
- Applications Management
- IP Connectivity
Media Services
Customers:
Small-Midsize Businesses
Divisions of Fortune 1000
Carriers (e.g. Mobile, PTTs)

Globix is…
…and all the
other Parts too.
A company
with Backbone .
Apps
Media
Security
IP Infrastructure
Data Centers
Network Services
Optical Networking
4

Network Access Point
Access POP’s
Data Center
Managed Hosting including security, applications management,
traditional collocation services, and data back-up
Managed Media Services
Dedicated Internet access
The Globix IP Network Backbone
5
SIX
Seattle
Santa Clara
Los Angeles
Atlanta
Chicago
Ashburn, VA
New York
NYIIX
Washington, DC
Boston
LINX
LONAP
Packet
Exchange
Band-X
London
AMS-IX
SFINX
Paris
Frankfurt
DE-CIX

The Globix Optical Network
Owned & Operated
5,000 Route Miles
Power Company ROW
170+ Buildings On Net
16 Colocation Facilities
Substantial Capacity
Mid-Atlantic Expansion:
South Jersey
North Jersey
Phila Metro
Serves the Nations largest Carriers
Ashburn
VA
McLean/Vienna
MD
Owings Mills
Washington, DC
Baltimore
Rising Sun
DE
Hammonton
Little Egg Harbor
Chester Springs
PA
Hellertown
Philadelphia
NJ
Freehold
New Brunswick
Piscataway
Elizabeth
Newark
New York City
Plainfield
Somerville
Morristown
Rochelle Park/
Hackensack
Suffern
Monroe
New Paltz
Albany
NY
Wappingers Falls
Spackenkill
Poughkeepsie
CT
Greenwich
Stamford
Bridgeport
New Haven
Springfield
New London
Hartford
Brattleboro
VT
MA
Worcester
Waltham/Newton
Keene
Cranston
Warwick
Providence
RI
Brockton
Framingham
Quincy
Boston/Cambridge
Salem
Lawrence
Manchester
Portsmouth
Dover
ME
NH
Portland
Nashua
Burlington
White Plains
Asmonk
Croton-on-Hudson
Elmsford
Greenburgh
Mahopac
Mt. Kisco
Ossining
Peekskill
Putnum Valley
Yorktown Heights
Tarrytown
NEON COLOCATION/CENTRAL
OFFICE
CENTRAL OFFICE
POINT OF PRESENCE
METRO
RING
Northeast and Mid-Atlantic U.S.
6

Outlook for Network Services
Wireless carriers continue to build out their networks
43.1% total carrier growth is expected from wireless providers from 1999 to 2008
Market for carrier fiber services is expected to reach $19.7B in 2008*
…Globix is uniquely positioned and taking advantage of this trend
Wireless carriers represented 56% of FYQ3 sales bookings and
35% of monthly recurring revenue
Enterprise sector continues to demand more bandwidth
Enterprise customers now represent 8% of our network services monthly recurring revenue, up
from 0% in 2001
Network expansion is planned in line with demand
Primarily in the mid-Atlantic region
63 new points of presence (POPs) added in last 7 Quarters
Customers continue to accept multi-year contracts
Terms up to 7 years
42 months average term ytd. 2005
Currently serve 102 network services customers with an ARPU of $43k/mo.**
* Gartner Market Research Report; Forecast: Mobile Data Services, North America, 1999 - 2008
**ARPU (Average Revenue Per Unit) = average contracted monthly recurring revenue
for the period divided by the average number of contracted customers for the period, data is for FY Q3
7

Hosting used to be:
Collocation
Rack Space
Power
Internet Connectivity
…but customer needs are changing
Managed hosting
Security and backup
Management of customer’s applications
Completely outsourced applications (Digital Asset Management and Email)
Monitoring
Hosting for high density servers
Hosting gets a new look
Yr/Yr Revenue Growth
Managed Services: 8%
Q3 2004 - $4.9
Q3 2005 - $5.3
Hosting: 16%
Q3 2004 - $6.1
Q3 2005 - $7.1
8

Pro forma Combined Globix & NEON
$0.6**
$16.8
$12.3
$29.1
Q2
3/30/05
$2.2
($0.2)
$1.8
Adjusted
EBITDA*
$16.0
$13.2
$29.2
$16.5
$12.3
$28.8
$16.0
$12.2
$28.2
Globix
NEON
Revenue
Q3
6/30/05
Q1
12/31/04
Q4
9/30/04
Notes:
- Pro forma combines Globix and NEON stand-alone financials
- Adjusted EBITDA: See Appendix
*Includes $2.0 Million of merger related costs recorded in Neon's results.
** Includes approximately $0.8 Million of one time litigation expense.
9
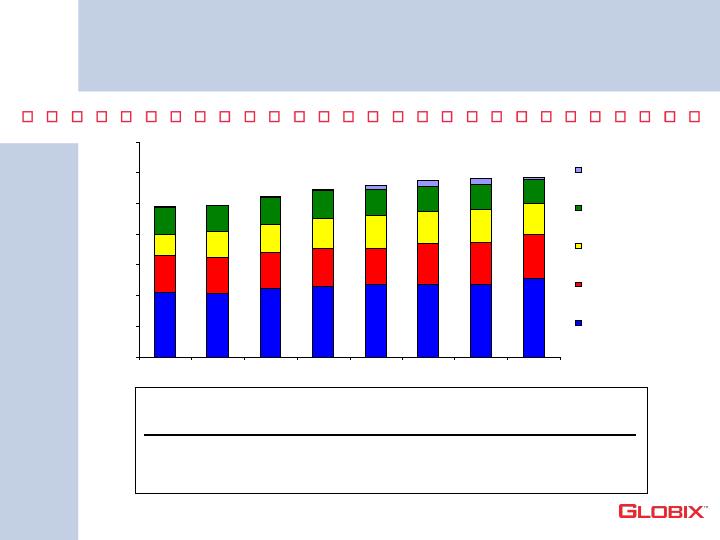
Pro forma Revenue Trends by service
$0
$5
$10
$15
$20
$25
$30
$35
Q4 2003
Q1 2004
Q2 2004
Q3 2004
Q4 2004
Q1 2005
Q2 2005
Q3 2005
Hardware,
Software, DSL
and Other
Network Services
and Internet
Access
Managed
Services
Internet Hosting
and Co-Location
10.6
10.4
11.2
11.6
11.8
11.9
11.9
12.8
6.0
5.9
5.8
6.1
5.9
6.5
6.7
7.1
3.3
4.2
4.6
5.3
5.4
5.5
5.2
4.4
4.2
4.5
4.5
4.3
4.0
4.0
3.8
4.9
Bandwidth
Services
Q403
1,457
$2,700
Q304
1,369
$3,300
Q305
1,318
$3,700
Millions
10
Hosting Group
Customers
ARPU

Moving Forward
Focus sales in product growth areas:
Network services for wireless communications
Managed server services including managed hosting, security,
applications management and professional services
Media services
Continue to eliminate costs through integration
synergies and operational efficiencies
Build brand awareness and position Globix as the
leader in providing seamless, reliable and tailored
network services, managed server solutions and
media services.
11

Appendix
* Adjusted EBITDA: We believe Adjusted EBITDA may be useful to investors as a
performance measure and may help them understand our cash resources and
requirements. In addition, we use Adjusted EBITDA in our internal business planning
process, in setting company performance goals and for incentive compensation
purposes. Adjusted EBITDA does not represent cash flow from operations, as defined
under U.S. generally accepted accounting principles, and is not a measure of
operating profitability or net income. Our computation of Adjusted EBITDA may differ
from those used by other companies should not be considered comparable.
Qtr end
9/30/2004
Qtr end
12/31/2004
Qtr end
3/31/2004
Qtr end
6/30/2004
Loss from operations
(4,631)
(28,933)
(6,205)
(4,011)
Loss on impairment of assets
-
22,000
-
-
Depreciation/amortization
6,239
6,480
6,581
5,985
Non cash comp (stock)
23
23
3
7
Rental income
211
212
208
212
Adjusted EBITDA
1,842
(218)
587
2,193
12

Appendix
****Globix Corporation
2004 Adjusted
EBITDA Trend
(Adjusted EBITDA
Reconciliation)
NEON
Communications Inc
2004 EBITDA Trend
(Adjusted EBITDA
Reconciliation)
Qtr end
Qtr end
Qtr end
Qtr end
6/30/2004
9/30/2004
12/31/2004
3/31/2005
Loss from operations
(3,595)
(3,344)
(4,015)
(4,582)
Loss on impairment of assets
0
0
0
0
Depreciation/amortization
3,519
3,465
3,543
3,626
Non cash comp (stock)
(13)
23
23
3
Rental income
224
211
212
208
Adjusted EBITDA
135
355
(237)
(745)
Qtr end
Qtr end
Qtr end
Qtr end
6/30/2004
9/30/2004
12/31/2004
3/31/2005
Loss from operations
(1,391)
(1,287)
(24,918)
(1,623)
Depreciation/amortization
2,629
2,774
2,937
2,955
Loss on impairment of assets
0
0
22,000
0
Adjusted EBITDA
1,238
1,487
19
1,332
13