
Globix Corporation
SG Cowen & Co.
32nd Annual
Fall Technology Conference
September 9, 2004
Boston
Peter Stevenson
CEO
1

Globix History
1989
1996
1998
2001
2003
2004
Initial Public Offering
Constructed high-speed fiber optic backbone. Launched media
services & managed services offering
Upgraded to Tier 1 IP network
Purchased Aptegrity to extend managed service capabilities
Merger negotiated with Neon to expand product offerings & improve
economics
Founded
2002
Emerged from 30 days pre-packaged bankruptcy in April 2002
2
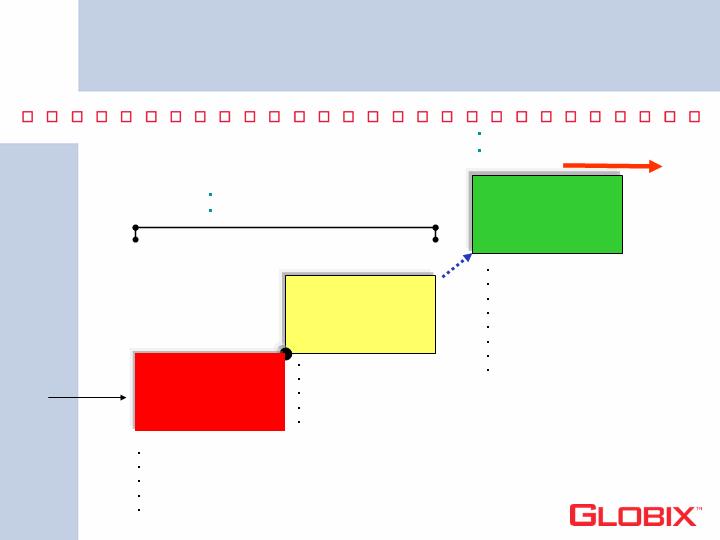
Globix Strategic Business Plan
Tough Decisions
Strengthen Internal Control
2003
Focus on sales
Re-establish customer care
Continue tight cash/cost control
Re-sign clients
Maximize Assets
Phase 2
“Stabilize”
Phase 3
“Grow”
2004
Refine Company Strategy
Grow What We Have
Expand services
Expand coverage, sensibly
Target new revenue markets
Continue driving non-essential costs out
Drive Cash Flow
Reduce LT Debt
Foundation Established
M & A Opportunities
Phase 1
“Triage”
2002
Drive costs down/out
Minimize cap-ex
Preserve cash
Clean customer base
Finance driven effort
Bankruptcy
3

Globix “Today”
Leading provider of application, media & infrastructure
management services
$62+ million revenue and ~$140 million in assets
1,350+ customers including Visa, A&E & Pfizer
$74M 11% Senior Notes including accrued interest
World-class, results-driven professionals
250 employees worldwide
91% dedicated to engineering & sales functions
Passionate about superior service
24/7 expert operations & customer service
100% service level agreement guarantee
Owner/Operator: Tier 1 IP network & data centers
5 world-class data centers plus co-location facilities
Top 10 worldwide tier-1 IP network
4
5
Client
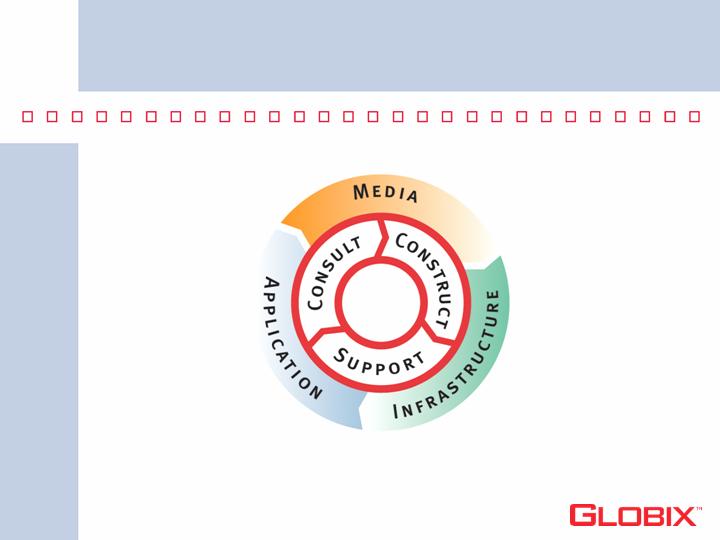
More than Hosting – Flexible Solutions…
Management for
off-the-shelf &
custom
applications
Reliable, scalable & secure
network, hosting & data
center capabilities
Services for the creation,
production & delivery of
rich media
6
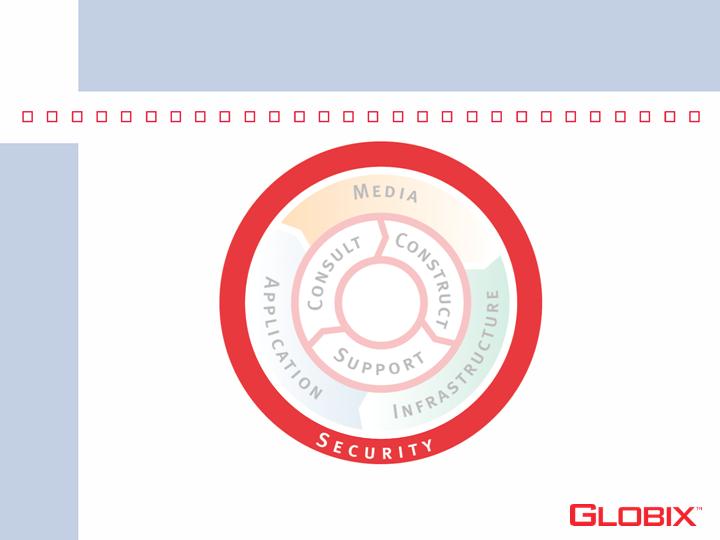
Prompt remediation •
C&A Auditing •
Strict policies •
Integrated solutions •
• Vigilant Monitoring
• Advanced systems
• Proven processes
….Shielded with Risk management
• Expertise

Globix operating results overview
540
(4,216)
(30,047)
(59,582)
Adjusted
EBITDA***
62,916
60,177
81,996
104,210
Revenue
LQA**
2003
2002
2001
** LQA = the last reported quarter of 2004 (quarter ended June 30, 2004) annualized.
***Adjusted EBITDA = Loss from operations adjusted to exclude loss on impairment of assets, restructuring
& other charges (credits), depreciation & amortization, other operating income, non-cash stock based
compensation & to include rental income.
Year over Year trend
7

Globix operating results overview
(1,562)
135
(436)
(1,261)
Adjusted
EBITDA***
45,143
15,729
15,029
14,385
Revenue
YTD
2004
Q3
6/30/ 2004
Q2
3/31/ 2004
Q1
12/31/ 2003
***Adjusted EBITDA = Loss from operations adjusted to exclude loss on impairment of assets, restructuring & other
charges (credits), depreciation & amortization, other operating income, non-cash stock based compensation & to
include rental income.
2004 Adjusted EBITDA Trend
8

Major Event: Merger with NEON
Merger announced July 19, 2004
Merger consistent with Globix strategy
Expands product offering
Positions us for growth in dense N.E. and Mid Atlantic regions
Creates larger & profitable company
Provides a diversified revenue base
Continues to de-leverage Company
NEON – Organic 19% 2 Year CAGR - Revenue
Provider of advanced optical networking solutions
95% Carrier Customers, 5% Enterprise Clients
Fiber infrastructure and access points throughout high density telecom corridor Northeast & Mid-
Atlantic markets
220,000+ fiber miles & 160 POPs
NEON has 9 transport services today
Extensive Client list
9
10
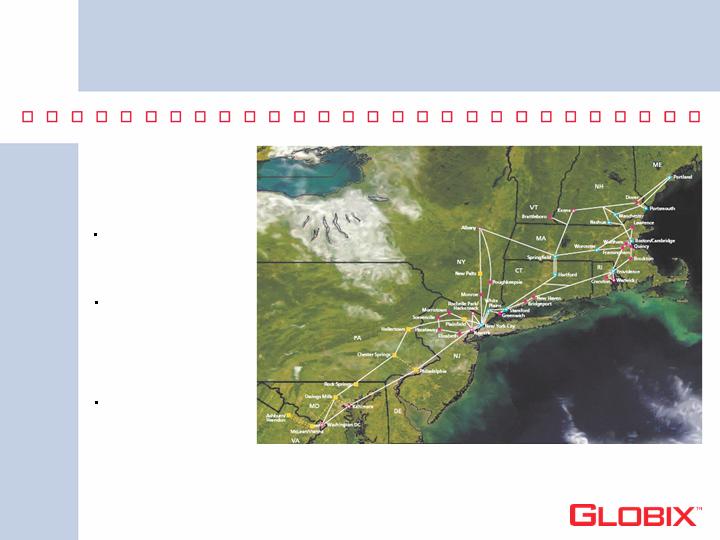
The NEON Network:
A Well-Traveled
Route.
Nation’s busiest
telecommunications
corridor
12-state, $87-billion
market encompasses
28 % of the nation’s
communications
market
Extends from New
England, New York
City and the north
Atlantic coast into
Virginia
Current Neon Network

Globix “Tomorrow”
Leading provider of application, media & infrastructure
management services
$100+ million revenue and $275 million in assets
1,450+ customers
$63M 11% Senior Notes including accrued interest
~$22M cash and investments
World-class, results-driven professionals
Approx 380 employees worldwide at close
89% dedicated to engineering & sales functions
Passionate about superior service
100% service level agreement guarantee
Owner/Operator: Tier 1 IP network, transport network & data
centers
10+ world-class data center plus co-location facilities
Top 10 worldwide tier-1 IP network and 220,000 mile fiber network
11

Combined Globix & Neon
34,321
37,703
36,415
Cash
1,373
233
(656)
Adjusted
EBITDA*
*
27,735
26,545
25,137
Revenue
Q3
6/30/04
Q2
3/31/04
Q1
12/31/03
**Adjusted EBITDA = Loss from operations adjusted to exclude loss on
impairment of assets, restructuring & other charges (credits), depreciation &
amortization, other operating income, non-cash stock based compensation & to
include rental income.
Synergies
associated with
the merger should
be accretive to
quarterly EBITDA
by approximately
$1.25 to $2.0 MM
12

New Capital Structure
$63.0 MM (includes accrued interest)
Senior Notes
1.3 MM Outstanding
Warrants
4.1 MM Outstanding
3.3 MM Vested
Options
$10.2 MM liquidation value
Preferred Stock
53.2 MM shares
Common Stock (Fully Diluted)
Capital Structure
13

The Coming Months
Continue Organic Growth Focus
Close NEON Transaction (Q404)
HSR Review Complete
S-4 filing imminent
Apply for Listing on Major Exchange
Plan for Merger Integration, Synergies &
Selling Opportunities
14

Q & A
Thank You
15

Appendix
135
(436)
(1,261)
Adjusted EBITDA
224
270
140
Rental income
(13)
(21)
34
Non cash comp (stock compensation)
0
0
0
Other operating income
3,519
3,473
3,371
Depreciation/amortization
0
0
0
Restructuring & other charges (credits)
0
659
17,313
Loss on impairment of assets
(3,595)
(4,817)
(22,119)
Loss from operations
Qtr end
6/30/04
Qtr end
3/31/04
Qtr end
12/31/03
Globix Corporation
2004 Adjusted EBITDA Trend
(Adjusted EBITDA Reconciliation)
1,238
669
605
Adjusted EBITDA
0
0
0
Rental income
0
0
0
Non cash comp (stock compensation)
0
0
0
Other operating income
2,629
2,508
2,426
Depreciation/amortization
0
0
0
Restructuring & other charges (credits)
0
0
0
Loss on impairment of assets
(1,391)
(1,839)
(1,821)
Loss from operations
Qtr end
6/30/04
Qtr end
3/31/04
Qtr end
12/31/03
NEON Communications Inc
2004 Adjusted EBITDA Trend
(Adjusted EBITDA Reconciliation)
16

Appendix
1,373
233
(656)
Adjusted EBITDA
224
270
140
Rental income
(13)
(21)
34
Non cash comp (stock compensation)
0
0
0
Other operating income
6,148
5,981
5,797
Depreciation/amortization
0
0
0
Restructuring & other charges (credits)
0
659
17,313
Loss on impairment of assets
(4,986)
(6,656)
(23,940)
Loss from operations
Qtr end
6/30/04
Qtr end
3/31/04
Qtr end
12/31/03
Combined Globix & NEON
2004 Adjusted EBITDA Trend
(Adjusted EBITDA Reconciliation)
(4,216)
27
0
(345)
15,523
(1,020)
0
(18,401)
2003
(30,047)
30
7,027
0
34,175
24,834
2,578
(98,691)
2002
(59,582)
0
1,638
0
36,657
56,109
3,500
(157,486)
2001
Adjusted EBITDA
Rental income
Non cash comp (stock compensation)
Other operating income
Depreciation/amortization
Restructuring & other charges (credits)
Loss on impairment of assets
Loss from operations
Globix Corporation
Year Over Year Trend
(Adjusted EBITDA Reconciliation)
17