Exhibit 99.(c)(3)
| May 14, 2007 Confidential Presentation to: The Special Committee of 21st Century Insurance Group |
| Table of Contents Agenda I. Introduction II. Valuation Summary III. DCF Methodology and Detail Appendices A. Comparables B. Discount Rates C. Estimates and Historical Financials |
| Introduction |
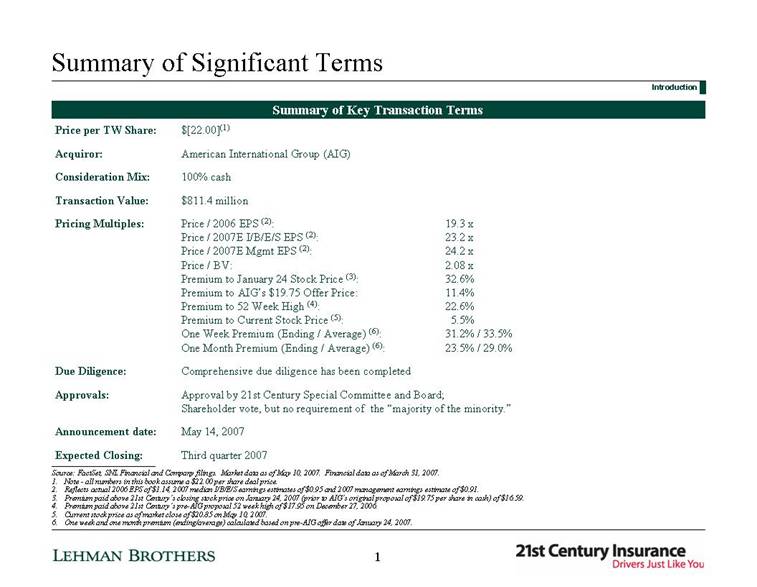
| Summary of Significant Terms Summary of Key Transaction Terms Introduction ___________________________ Source: FactSet, SNL Financial and Company filings. Market data as of May 10, 2007. Financial data as of March 31, 2007. 1. Note - all numbers in this book assume a $22.00 per share deal price. 2. Reflects actual 2006 EPS of $1.14, 2007 median I/B/E/S earnings estimates of $0.95 and 2007 management earnings estimate of $0.91. 3. Premium paid above 21st Century’s closing stock price on January 24, 2007 (prior to AIG’s original proposal of $19.75 per share in cash) of $16.59. 4. Premium paid above 21st Century’s pre-AIG proposal 52 week high of $17.95 on December 27, 2006. 5. Current stock price as of market close of $20.85 on May 10, 2007. 6. One week and one month premium (ending/average) calculated based on pre-AIG offer date of January 24, 2007. May 14, 2007 Announcement date: American International Group (AIG) Acquiror: $[22.00](1) Price per TW Share: Third quarter 2007 Expected Closing: Approval by 21st Century Special Committee and Board; Shareholder vote, but no requirement of the “majority of the minority.” Approvals: Comprehensive due diligence has been completed Due Diligence: 19.3 x 23.2 x 24.2 x 2.08 x 32.6% 11.4% 22.6% 5.5% 31.2% / 33.5% 23.5% / 29.0% Price / 2006 EPS (2): Price / 2007E I/B/E/S EPS (2): Price / 2007E Mgmt EPS (2): Price / BV: Premium to January 24 Stock Price (3): Premium to AIG’s $19.75 Offer Price: Premium to 52 Week High (4): Premium to Current Stock Price (5): One Week Premium (Ending / Average) (6): One Month Premium (Ending / Average) (6): Pricing Multiples: $811.4 million Transaction Value: 100% cash Consideration Mix: 1 |
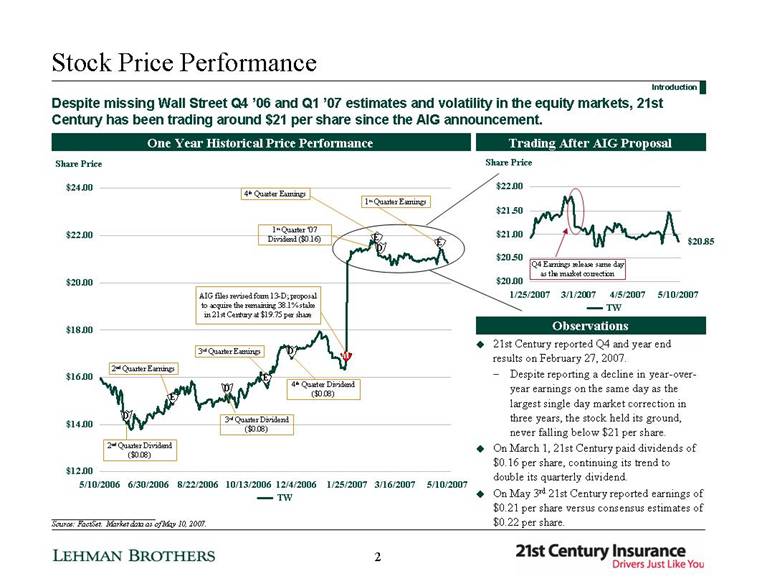
| Stock Price Performance Despite missing Wall Street Q4 ’06 and Q1 ’07 estimates and volatility in the equity markets, 21st Century has been trading around $21 per share since the AIG announcement. Introduction One Year Historical Price Performance Trading After AIG Proposal Q4 Earnings release same day as the market correction Observations 21st Century reported Q4 and year end results on February 27, 2007. Despite reporting a decline in year-over-year earnings on the same day as the largest single day market correction in three years, the stock held its ground, never falling below $21 per share. On March 1, 21st Century paid dividends of $0.16 per share, continuing its trend to double its quarterly dividend. On May 3rd 21st Century reported earnings of $0.21 per share versus consensus estimates of $0.22 per share. 4th Quarter Dividend ($0.08) 3rd Quarter Earnings 2nd Quarter Earnings 3rd Quarter Dividend ($0.08) 2nd Quarter Dividend ($0.08) 4th Quarter Earnings 1st Quarter ‘07 Dividend ($0.16) $20.85 ___________________________ Source: FactSet. Market data as of May 10, 2007. AIG files revised form 13-D; proposal to acquire the remaining 38.1% stake in 21st Century at $19.75 per share 1st Quarter Earnings 2 D D D D E E E M E 5/10/2006 6/30/2006 8/22/2006 10/13/2006 12/4/2006 1/25/2007 3/16/2007 5/10/2007 $12.00 $14.00 $16.00 $18.00 $20.00 $22.00 $24.00 Share Price TW 1/25/2007 3/1/2007 4/5/2007 5/10/2007 $20.00 $20.50 $21.00 $21.50 $22.00 Share Price TW |
| Comparable Company Valuation 21st Century has, for years, traded at a significant premium valuation to its peers. Introduction Historical Average Price to Forward Earnings by Company ___________________________ Source: FactSet and SNL Financial. Market Data as of May 10,2007. Note: Historical Average Price to Forward Earnings calculated as average annual price divided by forward mean earnings estimate. 1. Personal Lines Comps include: Allstate (ALL), Commerce Group (CGI), Mercury General (MCY), Progressive (PGR), Safeco (SAF), State Auto Financial Corp (STFC) and Hanover Insurance Group (THG). P/Es for the comp set uses median values. (1) 3 14.9x 13.8x 11.5x 9.1x 11.0x 15.7x 13.3x 12.3x 8.3x 10.5x 21.9x 12.4x 13.1x 9.2x 10.8x 0.0x 5.0x 10.0x 15.0x 20.0x 25.0x TW PGR MCY ALL Personal Lines Comps P/E 2005 2006 Current |

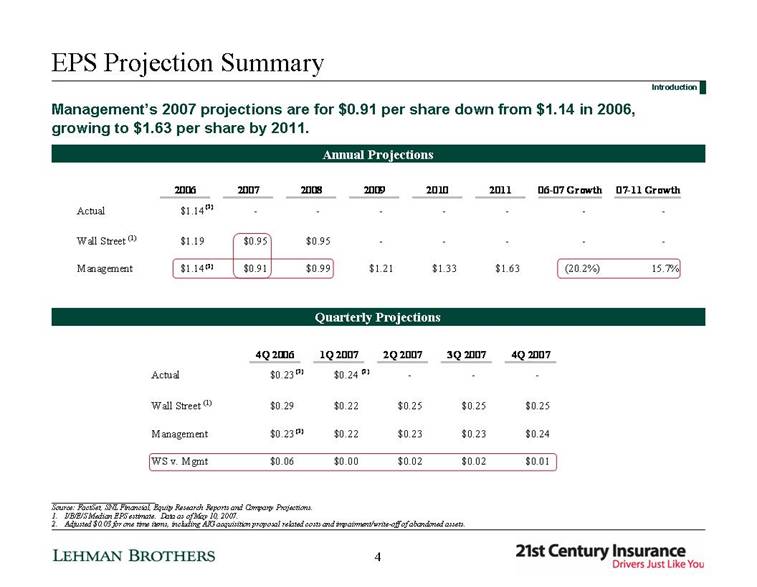
| EPS Projection Summary Annual Projections Quarterly Projections ___________________________ Source: FactSet, SNL Financial, Equity Research Reports and Company Projections. 1. I/B/E/S Median EPS estimate. Data as of May 10, 2007. 2. Adjusted $0.03 for one time items, including AIG acquisition proposal related costs and impairment/write-off of abandoned assets. Management’s 2007 projections are for $0.91 per share down from $1.14 in 2006, growing to $1.63 per share by 2011. Introduction 4 2006 2007 2008 2009 2010 2011 06-07 Growth 07-11 Growth Actual $1.14 - - - - - - - Wall Street (1) $1.19 $0.95 $0.95 - - - - - Management $1.14 $0.91 $0.99 $1.21 $1.33 $1.63 (20.2%) 15.7% (2) (2) 4Q 2006 1Q 2007 2Q 2007 3Q 2007 4Q 2007 Actual $0.23 $0.24 - - - Wall Street (1) $0.29 $0.22 $0.25 $0.25 $0.25 Management $0.23 $0.22 $0.23 $0.23 $0.24 WS v. Mgmt $0.06 $0.00 $0.02 $0.02 $0.01 (2) (2) (2) |
| Valuation Summary |
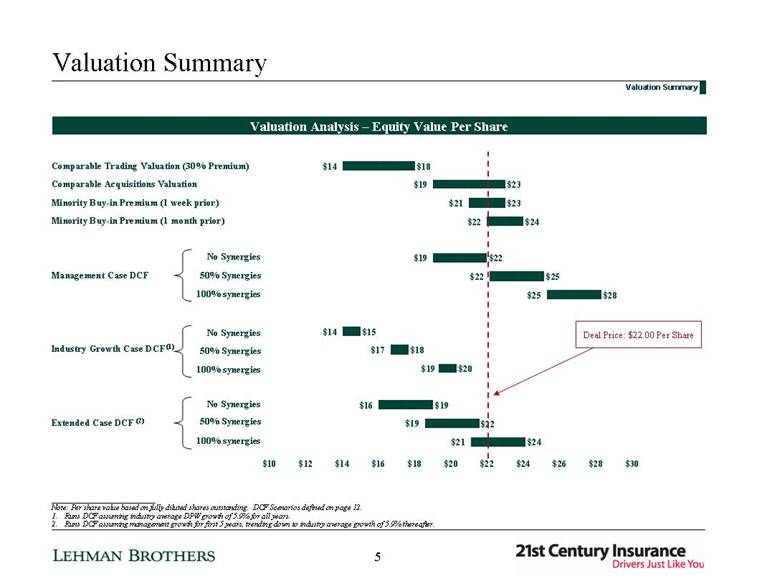
| Valuation Summary Valuation Analysis – Equity Value Per Share Valuation Summary ___________________________ Note: Per share value based on fully diluted shares outstanding. DCF Scenarios defined on page 12. 1. Runs DCF assuming industry average DPW growth of 5.9% for all years. 2. Runs DCF assuming management growth for first 5 years, trending down to industry average growth of 5.9% thereafter. Deal Price: $22.00 Per Share Management Case DCF Industry Growth Case DCF (1) Extended Case DCF (2) Comparable Trading Valuation (30% Premium) Comparable Acquisitions Valuation Minority Buy-in Premium (1 week prior) Minority Buy-in Premium (1 month prior) No Synergies 50% Synergies 100% synergies 5 $21 $19 $16 $17 $14 $25 $22 $19 $22 $21 $19 $14 3 3 3 1 1 3 3 3 2 2 4 4 $24 $19 $20 $18 $15 $28 $25 $22 $24 $23 $23 $18 $19 $10 $12 $14 $16 $18 $20 $22 $24 $26 $28 $30 |
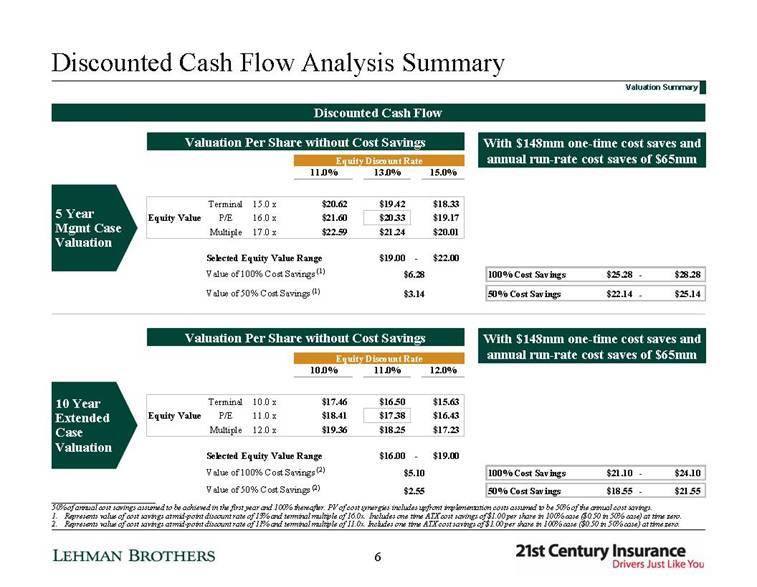
| Discounted Cash Flow Analysis Summary Valuation Summary 5 Year Mgmt Case Valuation 10 Year Extended Case Valuation With $148mm one-time cost saves and annual run-rate cost saves of $65mm Valuation Per Share without Cost Savings Valuation Per Share without Cost Savings With $148mm one-time cost saves and annual run-rate cost saves of $65mm Discounted Cash Flow ___________________________ 50% of annual cost savings assumed to be achieved in the first year and 100% thereafter. PV of cost synergies includes upfront implementation costs assumed to be 50% of the annual cost savings. 1. Represents value of cost savings at mid-point discount rate of 13% and terminal multiple of 16.0x. Includes one time ATX cost savings of $1.00 per share in 100% case ($0.50 in 50% case) at time zero. 2. Represents value of cost savings at mid-point discount rate of 11% and terminal multiple of 11.0x. Includes one time ATX cost savings of $1.00 per share in 100% case ($0.50 in 50% case) at time zero. 6 Equity Discount Rate 11.0% 13.0% 15.0% Terminal 15.0 x $20.62 $19.42 $18.33 Equity Value P/E 16.0 x $21.60 $20.33 $19.17 Multiple 17.0 x $22.59 $21.24 $20.01 Selected Equity Value Range $19.00 - $22.00 Value of 100% Cost Savings (1) $6.28 100% Cost Savings $25.28 - $28.28 Value of 50% Cost Savings (1) $3.14 50% Cost Savings $22.14 - $25.14 Equity Discount Rate 10.0% 11.0% 12.0% Terminal 10.0 x $17.46 $16.50 $15.63 Equity Value P/E 11.0 x $18.41 $17.38 $16.43 Multiple 12.0 x $19.36 $18.25 $17.23 Selected Equity Value Range $16.00 - $19.00 Value of 100% Cost Savings (2) $5.10 100% Cost Savings $21.10 - $24.10 Value of 50% Cost Savings (2) $2.55 50% Cost Savings $18.55 - $21.55 |
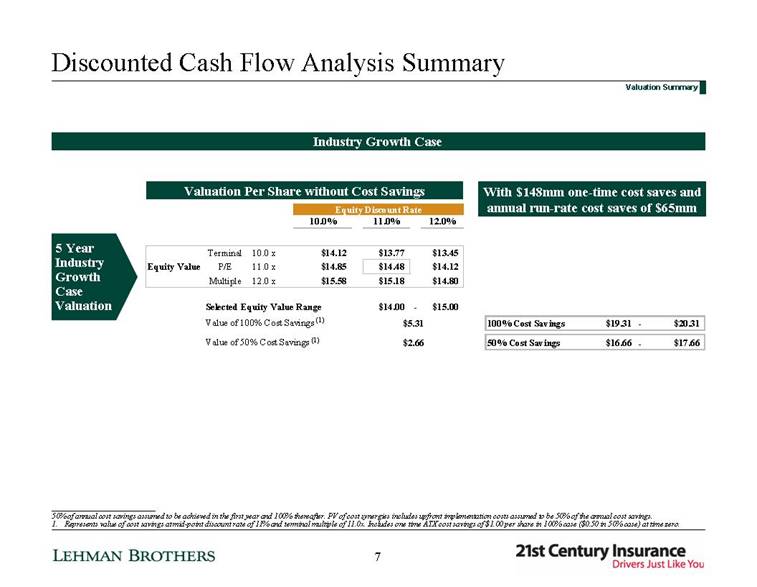
| Discounted Cash Flow Analysis Summary Valuation Summary ___________________________ 50% of annual cost savings assumed to be achieved in the first year and 100% thereafter. PV of cost synergies includes upfront implementation costs assumed to be 50% of the annual cost savings. 1. Represents value of cost savings at mid-point discount rate of 11% and terminal multiple of 11.0x. Includes one time ATX cost savings of $1.00 per share in 100% case ($0.50 in 50% case) at time zero. With $148mm one-time cost saves and annual run-rate cost saves of $65mm Valuation Per Share without Cost Savings Industry Growth Case 5 Year Industry Growth Case Valuation 7 Equity Discount Rate 10.0% 11.0% 12.0% Terminal 10.0 x $14.12 $13.77 $13.45 Equity Value P/E 11.0 x $14.85 $14.48 $14.12 Multiple 12.0 x $15.58 $15.18 $14.80 Selected Equity Value Range $14.00 - $15.00 Value of 100% Cost Savings (1) $5.31 100% Cost Savings $19.31 - $20.31 Value of 50% Cost Savings (1) $2.66 50% Cost Savings $16.66 - $17.66 |
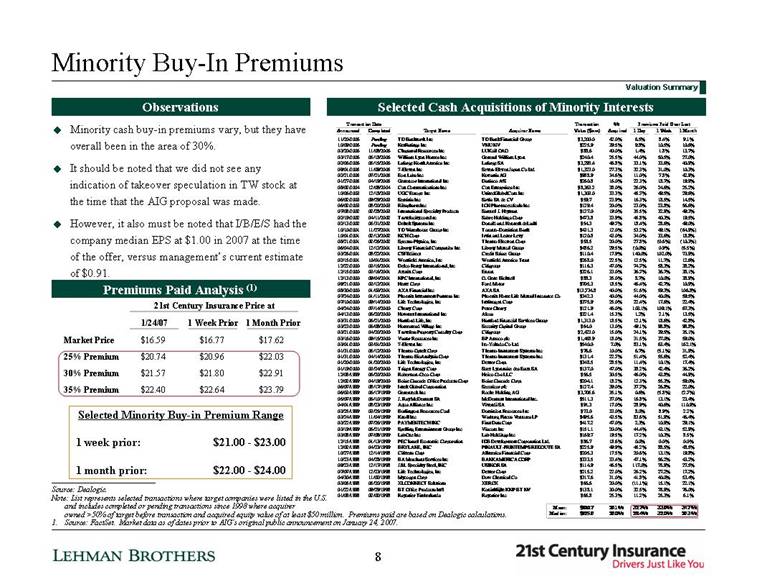
| Minority Buy-In Premiums Minority cash buy-in premiums vary, but they have overall been in the area of 30%. It should be noted that we did not see any indication of takeover speculation in TW stock at the time that the AIG proposal was made. However, it also must be noted that I/B/E/S had the company median EPS at $1.00 in 2007 at the time of the offer, versus management’s current estimate of $0.91. Observations Selected Cash Acquisitions of Minority Interests ___________________________ Source: Dealogic. Note: List represents selected transactions where target companies were listed in the U.S. and includes completed or pending transactions since 1998 where acquirer owned >50% of target before transaction and acquired equity value of at least $50 million. Premiums paid are based on Dealogic calculations. 1. Source: FactSet. Market data as of dates prior to AIG’s original public announcement on January 24, 2007. Valuation Summary Premiums Paid Analysis (1) Selected Minority Buy-in Premium Range 1 week prior: $21.00 - $23.00 1 month prior: $22.00 - $24.00 8 Transaction Date Transaction % Premiums Paid Over Last Announced Completed Target Name Acquirer Name Value ($mm) 1 Day 1 Week 1 Month 11/20/2006 Pending TD Banknorth Inc TD Bank Financial Group $3,200.0 42.0% 6.5% 8.4% 9.1% 10/09/2006 Pending NetRatings Inc VNU NV $225.9 39.5% 9.8% 10.5% 10.6% 03/20/2006 11/08/2006 Chaparral Resources Inc LUKoil OAO $88.6 40.0% 1.4% 1.8% 13.7% 03/17/2006 05/18/2006 William Lyon Homes Inc General William Lyon $240.4 25.5% 44.0% 50.5% 27.0% 02/06/2006 05/15/2006 Lafarge North America Inc Lafarge SA $3,293.4 46.8% 33.1% 33.6% 40.9% 09/01/2005 11/09/2005 7-Eleven Inc Seven-Eleven Japan Co Ltd $1,323.0 27.3% 32.3% 31.0% 10.3% 02/21/2005 07/21/2005 Eon Labs Inc Novartis AG $988.9 34.6% 11.0% 7.8% 42.9% 01/27/2005 04/19/2005 Genencor International Inc Danisco A/S $260.8 16.0% 22.3% 18.7% 19.9% 08/02/2004 12/08/2004 Cox Communications Inc Cox Enterprises Inc $8,363.2 38.0% 26.0% 24.6% 25.2% 10/06/2003 12/18/2003 UGC Europe Inc UnitedGlobalCom Inc $1,303.0 33.3% 45.7% 49.5% 29.6% 06/02/2003 09/29/2003 Seminis Inc Savia SA de CV $59.7 23.9% 16.3% 18.5% 14.5% 06/02/2003 08/20/2003 Ribapharm Inc ICN Pharmaceuticals Inc $129.4 20.0% 23.0% 23.8% 56.6% 07/08/2002 02/28/2003 International Specialty Products Samuel J. Heyman $127.0 19.0% 35.5% 32.9% 49.3% 02/19/2002 04/11/2002 Travelocity.com Inc Sabre Holdings Corp $473.8 33.9% 45.8% 40.3% 19.5% 02/13/2002 05/31/2002 Deltek Systems Inc Donald and Kenneth deLaski $54.3 49.7% 18.4% 28.6% 49.0% 10/10/2001 11/27/2001 TD Waterhouse Group Inc Toronto-Dominion Bank $431.3 12.0% 53.2% 49.1% (64.9%) 10/01/2001 02/13/2002 NCH Corp Irvin and Lester Levy $120.8 43.0% 34.0% 33.6% 18.8% 08/21/2001 02/26/2002 Spectra-Physics, Inc Thermo Electron Corp $58.5 20.0% 27.8% (0.6%) (10.3%) 06/04/2001 12/12/2001 Liberty Financial Companies Inc Liberty Mutual Group $486.2 29.5% (0.0%) 0.9% (6.5%) 03/26/2001 08/22/2001 CSFBdirect Credit Suisse Group $110.4 17.9% 140.0% 102.0% 73.9% 02/15/2001 10/01/2001 Westfield America, Inc Westfield America Trust $268.0 22.5% 12.5% 11.7% 12.6% 12/22/2000 03/15/2001 Delco Remy International, Inc Citigroup $116.3 47.0% 74.7% 58.3% 38.2% 12/15/2000 03/16/2001 Azurix Corp Enron $326.1 33.0% 36.7% 36.7% 38.1% 12/13/2000 09/04/2001 NPC International, Inc O. Gene Bicknell $88.3 35.0% 8.7% 10.0% 38.9% 09/21/2000 03/12/2001 Hertz Corp Ford Motor $705.3 18.5% 46.4% 42.7% 10.9% 08/30/2000 01/03/2001 AXA Financial Inc AXA SA $13,734.8 40.0% 51.6% 59.3% 106.8% 07/24/2000 01/11/2001 Phoenix Investment Partners Inc Phoenix Home Life Mutual Insurance Co $342.3 40.0% 44.0% 40.0% 59.5% 07/10/2000 09/14/2000 Life Technologies, Inc Invitrogen Corp $375.9 25.0% 22.4% 17.6% 22.4% 04/24/2000 07/14/2000 Cherry Corp Peter Cherry $121.9 46.0% 103.1% 109.1% 67.3% 04/13/2000 06/20/2000 Howmet International Inc Alcoa $321.4 15.3% 1.2% 2.1% 13.5% 03/31/2000 06/21/2000 Hartford Life, Inc Hartford Financial Services Group $1,313.0 18.5% 12.1% 18.6% 42.8% 03/23/2000 06/08/2000 Homestead Village Inc Security Capital Group $64.0 13.0% 49.1% 98.8% 98.8% 03/21/2000 04/20/2000 Travelers Property Casualty Corp Citigroup $2,423.0 15.0% 24.1% 39.5% 35.1% 03/16/2000 09/15/2000 Vastar Resources Inc BP Amoco plc $1,458.9 18.0% 31.5% 37.0% 59.0% 03/01/2000 03/01/2000 7-Eleven Inc Ito-Yokado Co Ltd $540.0 7.0% 83.1% 63.4% 162.1% 01/31/2000 05/12/2000 Thermo Optek Corp Thermo Instrument Systems Inc $76.6 10.0% 6.7% (5.1%) 31.9% 01/31/2000 04/14/2000 Thermo BioAnalysis Corp Thermo Instrument Systems Inc $131.4 22.7% 51.4% 55.6% 52.4% 01/20/2000 01/20/2000 Life Technologies, Inc Dexter Corp. $348.5 28.5% 11.4% 10.1% 17.4% 01/19/2000 03/24/2000 Trigen Energy Corp Suez Lyonnaise des Eaux SA $137.0 47.0% 38.2% 42.4% 36.2% 12/08/1999 06/20/2000 Robertson-Ceco Corp Heico Cos LLC $56.5 30.5% 46.0% 43.8% 44.9% 12/02/1999 04/19/2000 Boise Cascade Office Products Corp Boise Cascade Corp. $204.1 18.2% 12.3% 55.3% 59.0% 06/07/1999 08/17/1999 Intek Global Corporation Securicor plc $127.4 39.0% 37.7% 26.8% 22.0% 06/03/1999 06/17/1999 Genentech Inc Roche Holding AG $3,705.6 35.1% 0.6% (5.8%) (2.7%) 05/07/1999 06/10/1999 J. Ray McDermott SA McDermott International Inc. $511.3 37.0% 16.8% 13.1% 23.4% 04/01/1999 08/23/1999 Aqua Alliance Inc Vivendi SA $91.3 17.0% 28.9% 40.6% 110.9% 03/25/1999 03/25/1999 Burlington Resources Coal Dominion Resources Inc $73.0 33.0% 8.0% 8.9% 2.2% 03/24/1999 11/04/1999 Knoll Inc Warburg Pincus Ventures LP $495.6 43.5% 83.6% 51.9% 46.4% 03/22/1999 07/26/1999 PAYMENTECH INC First Data Corp $417.2 47.0% 2.3% 10.9% 29.1% 03/19/1999 06/21/1999 Spelling Entertainment Group Inc Viacom Inc $151.1 20.0% 44.4% 43.1% 52.9% 03/08/1999 07/08/1999 LabOne Inc Lab Holdings Inc $169.7 19.5% 17.2% 10.3% 8.5% 12/15/1998 01/13/1999 PEC Israel Economic Corporation IDB Development Corporation Ltd. $86.7 18.6% 0.0% 0.0% 0.0% 12/02/1998 04/23/1999 BRYLANE, INC PINAULT-PRINTEMPS-REDOUTE SA $225.9 49.9% 45.2% 88.5% 48.5% 10/27/1998 12/14/1998 Citizens Corp Allmerica Financial Corp $205.3 17.5% 20.6% 13.1% 19.8% 10/23/1998 04/28/1999 BA Merchant Services Inc BANKAMERICA CORP $333.5 33.4% 47.1% 56.2% 43.2% 09/23/1998 12/17/1998 J&L Specialty Steel, INC USINOR SA $114.9 46.5% 117.0% 75.9% 27.5% 07/07/1998 12/23/1998 Life Technologies, Inc Dexter Corp $215.2 22.0% 26.2% 27.2% 17.2% 04/30/1998 11/02/1998 Mycogen Corp Dow Chemical Co $317.6 31.0% 41.8% 40.0% 53.4% 03/05/1998 05/20/1998 XLCONNECT Solutions XEROX $66.6 20.0% (11.1%) 15.1% 22.1% 01/22/1998 09/29/1998 BT Office Products Int'l Koninklijke KNP BT NV $138.1 30.0% 32.5% 78.9% 76.0% 01/08/1998 02/02/1998 Rayonier Timberlands Rayonier Inc $65.8 25.3% 11.2% 25.3% 6.1% Mean: $866.7 29.1% 32.7% 33.9% 34.7% Median: $225.9 29.0% 28.4% 32.0% 29.3% 21st Century Insurance Price at 1/24/07 1 Week Prior 1 Month Prior Market Price $16.59 $16.77 $17.62 25% Premium $20.74 $20.96 $22.03 30% Premium $21.57 $21.80 $22.91 35% Premium $22.40 $22.64 $23.79 Acquired |
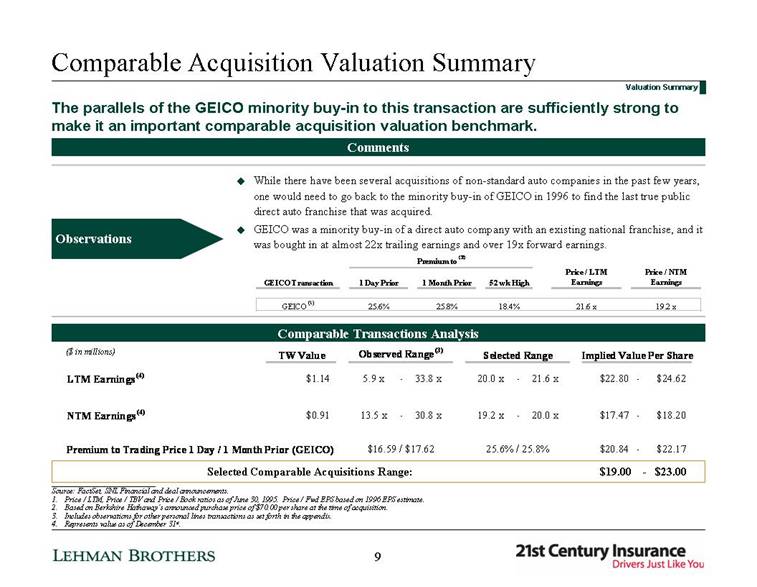
| Comparable Acquisition Valuation Summary The parallels of the GEICO minority buy-in to this transaction are sufficiently strong to make it an important comparable acquisition valuation benchmark. Valuation Summary Comparable Transactions Analysis Comments While there have been several acquisitions of non-standard auto companies in the past few years, one would need to go back to the minority buy-in of GEICO in 1996 to find the last true public direct auto franchise that was acquired. GEICO was a minority buy-in of a direct auto company with an existing national franchise, and it was bought in at almost 22x trailing earnings and over 19x forward earnings. Observations ___________________________ Source: FactSet, SNL Financial and deal announcements. 1. Price / LTM, Price / TBV and Price / Book ratios as of June 30, 1995. Price / Fwd EPS based on 1996 EPS estimate. 2. Based on Berkshire Hathaway’s announced purchase price of $70.00 per share at the time of acquisition. 3. Includes observations for other personal lines transactions as set forth in the appendix. 4. Represents value as of December 31st. 9 Premium to (2) GEICO Transaction 1 Day Prior 1 Month Prior 52 wk High Price / LTM Earnings Price / NTM Earnings GEICO (1) 25.6% 25.8% 18.4% 21.6 x 19.2 x ($ in millions) TW Value Observed Range (3) Selected Range Implied Value Per Share LTM Earnings (4) $1.14 5.9 x - 33.8 x 20.0 x - 21.6 x $22.80 - $24.62 NTM Earnings (4) $0.91 13.5 x - 30.8 x 19.2 x - 20.0 x $17.47 - $18.20 Premium to Trading Price 1 Day / 1 Month Prior (GEICO) $16.59 / $17.62 25.6% / 25.8% $20.84 - $22.17 Selected Comparable Acquisitions Range: $19.00 - $23.00 |
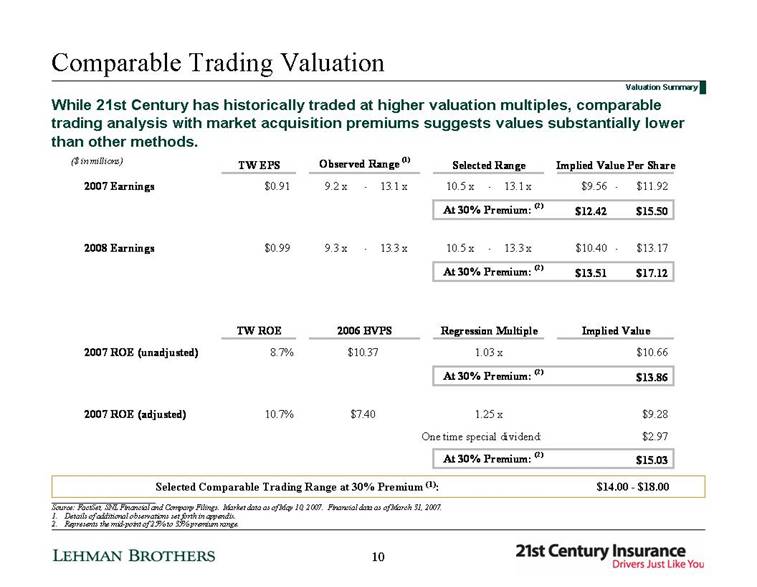
| Comparable Trading Valuation While 21st Century has historically traded at higher valuation multiples, comparable trading analysis with market acquisition premiums suggests values substantially lower than other methods. Valuation Summary ___________________________ Source: FactSet, SNL Financial and Company Filings. Market data as of May 10, 2007. Financial data as of March 31, 2007. 1. Details of additional observations set forth in appendix. 2. Represents the mid-point of 25% to 35% premium range. Selected Comparable Trading Range at 30% Premium (1): $14.00 - $18.00 10 ($ in millions) TW EPS Observed Range (1) Selected Range Implied Value Per Share 2007 Earnings $0.91 9.2 x - 13.1 x 10.5 x - 13.1 x $9.56 - $11.92 At 30% Premium: (2) $12.42 $15.50 2008 Earnings $0.99 9.3 x - 13.3 x 10.5 x - 13.3 x $10.40 - $13.17 At 30% Premium: (2) $13.51 $17.12 TW ROE 2006 BVPS Regression Multiple Implied Value 2007 ROE (unadjusted) 8.7% $10.37 1.03 x $10.66 At 30% Premium: (2) $13.86 2007 ROE (adjusted) 10.7% $7.40 1.25 x $9.28 One time special dividend: $2.97 At 30% Premium: (2) $15.03 |
| DCF Methodology and Detail |
| For this analysis, we have used $65.0 million in annual pre-tax cost synergies plus $147.8 million in one time pre-tax cost savings at time zero based on revised cost savings amounts provided by management, outlined on page 16 of this book. 50% of annual cost savings assumed to be achieved in the first year and 100% thereafter. Present value of the annual cost synergies include upfront implementation costs (assumed to be 50% of the annual cost savings). Value of cost savings have been calculated separately and the values at 50% and 100% to the seller have been added to the stand alone DCF. We have created three valuation scenarios, adjusted as explained above. The Management Case is based on a five year time horizon that utilizes management’s five year projections. The Industry Growth Case uses the management case combined ratios, but is based on a five year time horizon that utilizes an industry average 6% growth rate for all years. In the Extended Case Scenario, we use management projections for the first five years. Then, for years six to ten, premium growth is gradually reduced to industry average 6% while the combined ratio is maintained level with management’s projection for 2012. We modeled a discounted cash flow analysis based on management’s projections. We have made a few adjustments to these projections: One time dividend at time zero of excess capital. Retain cash flow to maintain a 2.5x premiums to surplus ratio in all periods. Maintain 15% debt / capital ratio in all periods. Investment income has been modified to reflect above items. Scenarios Cost Savings Projections Discounted Cash Flow Analysis DCF Methodology and Detail 11 |
| The Management Case DCF uses a terminal multiple range of 15x to 17x. This range is in line with where the Company has traded over the last few years. While the highest 2007 multiple for a personal lines company other than 21st Century is Mercury General (13.1x), we note that over time, 21st Century has traded at a material premium to its peers, in part due to future growth prospects. The Industry Growth Case and Extended Case DCF use terminal multiples within the peer group range, albeit at the higher end of such range. This reflects growth rates closer to industry averages in the terminal year. The longer DCF period places long term growth more in line with peers. For the Management Case DCF, there is a material increase in anticipated earnings growth from ’07 to ’11 (15.7%), especially in the context of the first projection year showing a decline of about 20% from the prior year. As a result, we have enlarged our discount rate range. At the low end, we remain at 11% based on cost of capital analysis. At the high end, we have extended the range up to 15% to reflect the increased return a buyer might require for an the increased risk in achieving the aggressive projections. For the Industry Growth Case DCF, we have used a discount rate range of 10% to 12%, reflecting lower volatility and risk associated with utilizing industry averages. For the Extended Case DCF, we have used a discount rate range of 10% to 12%. Terminal Multiple Discount Rate Discounted Cash Flow Analysis DCF Methodology and Detail 12 |
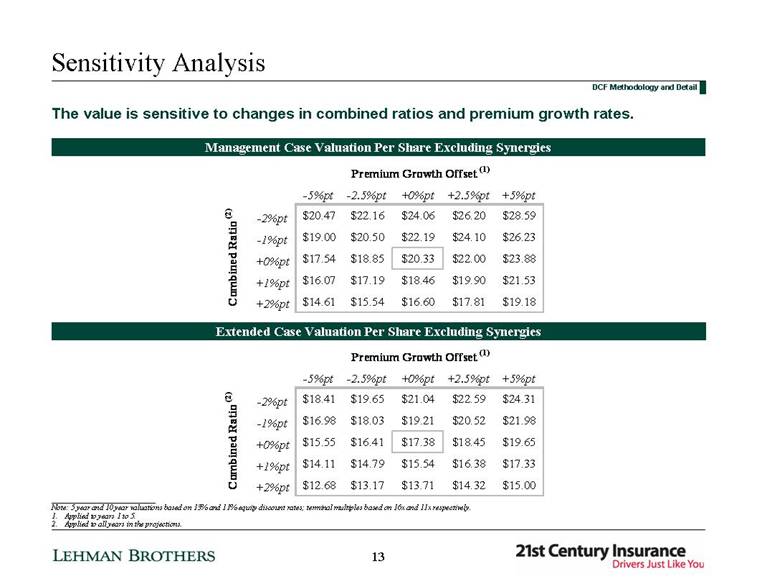
| Sensitivity Analysis DCF Methodology and Detail Management Case Valuation Per Share Excluding Synergies The value is sensitive to changes in combined ratios and premium growth rates. Extended Case Valuation Per Share Excluding Synergies ___________________________ Note: 5 year and 10 year valuations based on 13% and 11% equity discount rates; terminal multiples based on 16x and 11x respectively. 1. Applied to years 1 to 5. 2. Applied to all years in the projections. 13 Premium Growth Offset (1) -5%pt -2.5%pt +0%pt +2.5%pt +5%pt -2%pt $20.47 $22.16 $24.06 $26.20 $28.59 -1%pt $19.00 $20.50 $22.19 $24.10 $26.23 +0%pt $17.54 $18.85 $20.33 $22.00 $23.88 +1%pt $16.07 $17.19 $18.46 $19.90 $21.53 +2%pt $14.61 $15.54 $16.60 $17.81 $19.18 Combined Ratio (2) Premium Growth Offset (1) -5%pt -2.5%pt +0%pt +2.5%pt +5%pt -2%pt $18.41 $19.65 $21.04 $22.59 $24.31 -1%pt $16.98 $18.03 $19.21 $20.52 $21.98 +0%pt $15.55 $16.41 $17.38 $18.45 $19.65 +1%pt $14.11 $14.79 $15.54 $16.38 $17.33 +2%pt $12.68 $13.17 $13.71 $14.32 $15.00 Combined Ratio (2) |
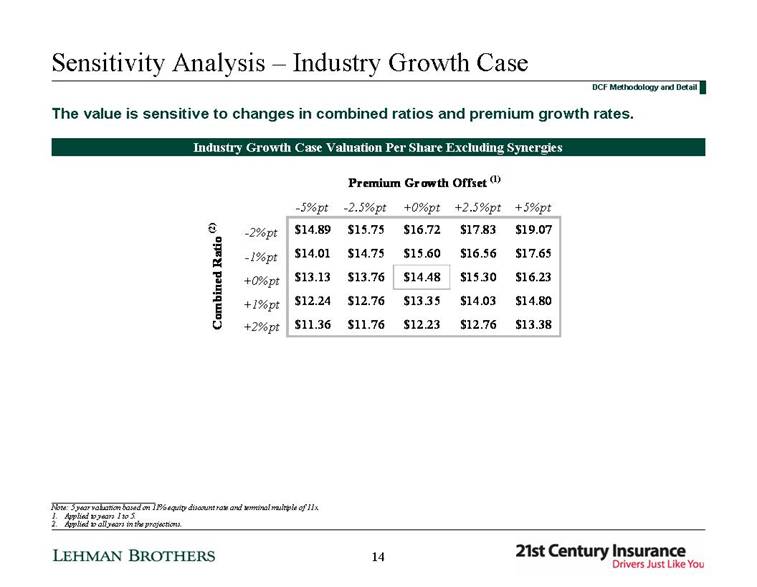
| Sensitivity Analysis – Industry Growth Case DCF Methodology and Detail Industry Growth Case Valuation Per Share Excluding Synergies The value is sensitive to changes in combined ratios and premium growth rates. ___________________________ Note: 5 year valuation based on 11% equity discount rate and terminal multiple of 11x. 1. Applied to years 1 to 5. 2. Applied to all years in the projections. 14 Premium Growth Offset (1) -5%pt -2.5%pt +0%pt +2.5%pt +5%pt -2%pt $14.89 $15.75 $16.72 $17.83 $19.07 -1%pt $14.01 $14.75 $15.60 $16.56 $17.65 +0%pt $13.13 $13.76 $14.48 $15.30 $16.23 +1%pt $12.24 $12.76 $13.35 $14.03 $14.80 +2%pt $11.36 $11.76 $12.23 $12.76 $13.38 Combined Ratio (2) |
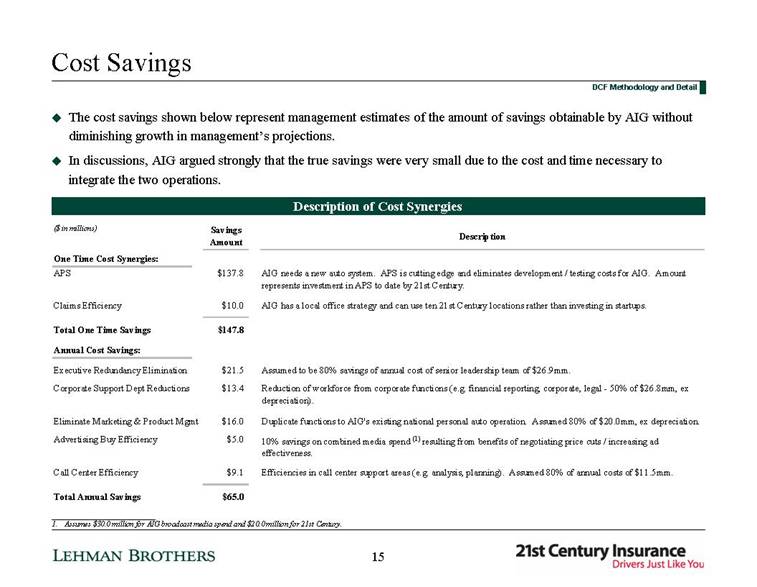
| Cost Savings The cost savings shown below represent management estimates of the amount of savings obtainable by AIG without diminishing growth in management’s projections. In discussions, AIG argued strongly that the true savings were very small due to the cost and time necessary to integrate the two operations. DCF Methodology and Detail Description of Cost Synergies ___________________________ 1. Assumes $30.0 million for AIG broadcast media spend and $20.0 million for 21st Century. 15 ($ in millions) Savings Amount Description One Time Cost Synergies: APS $137.8 AIG needs a new auto system. APS is cutting edge and eliminates development / testing costs for AIG. Amount represents investment in APS to date by 21st Century. Claims Efficiency $10.0 AIG has a local office strategy and can use ten 21st Century locations rather than investing in startups. Total One Time Savings $147.8 Annual Cost Savings: Executive Redundancy Elimination $21.5 Assumed to be 80% savings of annual cost of senior leadership team of $26.9mm. Corporate Support Dept Reductions $13.4 Reduction of workforce from corporate functions (e.g. financial reporting, corporate, legal - 50% of $26.8mm, ex depreciation). Eliminate Marketing & Product Mgmt $16.0 Duplicate functions to AIG's existing national personal auto operation. Assumed 80% of $20.0mm, ex depreciation. Advertising Buy Efficiency $5.0 10% savings on combined media spend (1) resulting from benefits of negotiating price cuts / increasing ad effectiveness. Call Center Efficiency $9.1 Efficiencies in call center support areas (e.g. analysis, planning). Assumed 80% of annual costs of $11.5mm. Total Annual Savings $65.0 |
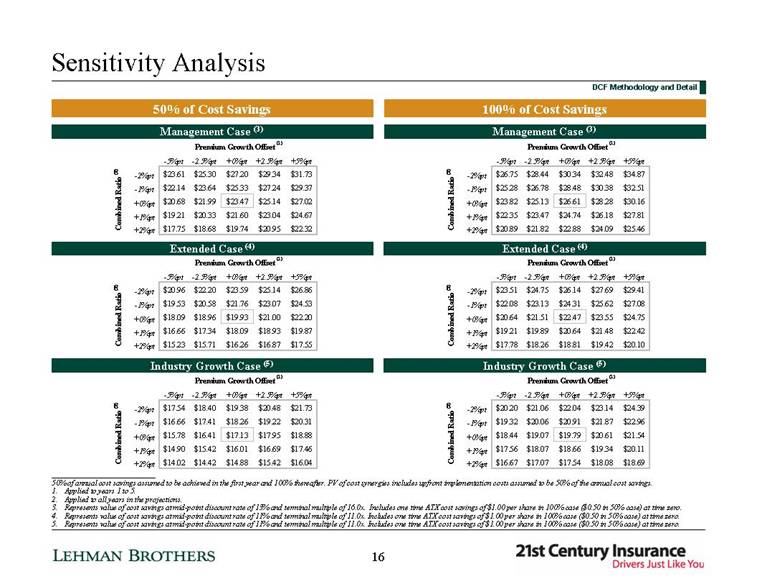
| Sensitivity Analysis DCF Methodology and Detail Extended Case (4) Industry Growth Case (5) Management Case (3) 50% of Cost Savings 100% of Cost Savings ___________________________ 50% of annual cost savings assumed to be achieved in the first year and 100% thereafter. PV of cost synergies includes upfront implementation costs assumed to be 50% of the annual cost savings. Applied to years 1 to 5. Applied to all years in the projections. Represents value of cost savings at mid-point discount rate of 13% and terminal multiple of 16.0x. Includes one time ATX cost savings of $1.00 per share in 100% case ($0.50 in 50% case) at time zero. Represents value of cost savings at mid-point discount rate of 11% and terminal multiple of 11.0x. Includes one time ATX cost savings of $1.00 per share in 100% case ($0.50 in 50% case) at time zero. Represents value of cost savings at mid-point discount rate of 11% and terminal multiple of 11.0x. Includes one time ATX cost savings of $1.00 per share in 100% case ($0.50 in 50% case) at time zero. Extended Case (4) Industry Growth Case (5) Management Case (3) 16 Premium Growth Offset (1) -5%pt -2.5%pt +0%pt +2.5%pt +5%pt -2%pt $20.96 $22.20 $23.59 $25.14 $26.86 -1%pt $19.53 $20.58 $21.76 $23.07 $24.53 +0%pt $18.09 $18.96 $19.93 $21.00 $22.20 +1%pt $16.66 $17.34 $18.09 $18.93 $19.87 +2%pt $15.23 $15.71 $16.26 $16.87 $17.55 Combined Ratio (2) Premium Growth Offset (1) -5%pt -2.5%pt +0%pt +2.5%pt +5%pt -2%pt $23.61 $25.30 $27.20 $29.34 $31.73 -1%pt $22.14 $23.64 $25.33 $27.24 $29.37 +0%pt $20.68 $21.99 $23.47 $25.14 $27.02 +1%pt $19.21 $20.33 $21.60 $23.04 $24.67 +2%pt $17.75 $18.68 $19.74 $20.95 $22.32 Combined Ratio (2) Premium Growth Offset (1) -5%pt -2.5%pt +0%pt +2.5%pt +5%pt -2%pt $20.20 $21.06 $22.04 $23.14 $24.39 -1%pt $19.32 $20.06 $20.91 $21.87 $22.96 +0%pt $18.44 $19.07 $19.79 $20.61 $21.54 +1%pt $17.56 $18.07 $18.66 $19.34 $20.11 +2%pt $16.67 $17.07 $17.54 $18.08 $18.69 Combined Ratio (2) Premium Growth Offset (1) -5%pt -2.5%pt +0%pt +2.5%pt +5%pt -2%pt $23.51 $24.75 $26.14 $27.69 $29.41 -1%pt $22.08 $23.13 $24.31 $25.62 $27.08 +0%pt $20.64 $21.51 $22.47 $23.55 $24.75 +1%pt $19.21 $19.89 $20.64 $21.48 $22.42 +2%pt $17.78 $18.26 $18.81 $19.42 $20.10 Combined Ratio (2) Premium Growth Offset (1) -5%pt -2.5%pt +0%pt +2.5%pt +5%pt -2%pt $17.54 $18.40 $19.38 $20.48 $21.73 -1%pt $16.66 $17.41 $18.26 $19.22 $20.31 +0%pt $15.78 $16.41 $17.13 $17.95 $18.88 +1%pt $14.90 $15.42 $16.01 $16.69 $17.46 +2%pt $14.02 $14.42 $14.88 $15.42 $16.04 Combined Ratio (2) Premium Growth Offset (1) -5%pt -2.5%pt +0%pt +2.5%pt +5%pt -2%pt $26.75 $28.44 $30.34 $32.48 $34.87 -1%pt $25.28 $26.78 $28.48 $30.38 $32.51 +0%pt $23.82 $25.13 $26.61 $28.28 $30.16 +1%pt $22.35 $23.47 $24.74 $26.18 $27.81 +2%pt $20.89 $21.82 $22.88 $24.09 $25.46 Combined Ratio (2) |
| Appendices |
| Comparables |
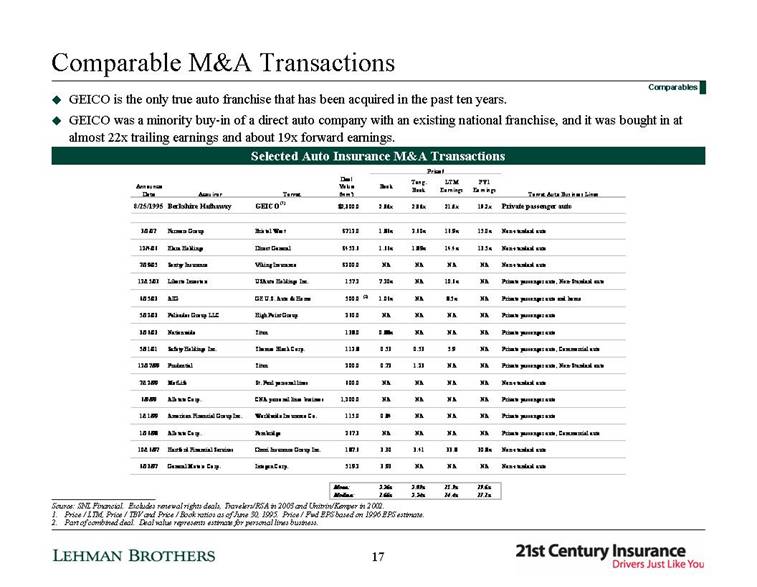
| Comparable M&A Transactions Selected Auto Insurance M&A Transactions ___________________________ Source: SNL Financial. Excludes renewal rights deals, Travelers/RSA in 2003 and Unitrin/Kemper in 2002. Price / LTM, Price / TBV and Price / Book ratios as of June 30, 1995. Price / Fwd EPS based on 1996 EPS estimate. Part of combined deal. Deal value represents estimate for personal lines business. Comparables GEICO is the only true auto franchise that has been acquired in the past ten years. GEICO was a minority buy-in of a direct auto company with an existing national franchise, and it was bought in at almost 22x trailing earnings and about 19x forward earnings. 17 Price / Deal Announce Value Date Acquiror Target (mm) Target Auto Business Lines 8/25/1995 Berkshire Hathaway GEICO (1) $2,300.0 2.86x 2.86x 21.6x 19.2x Private passenger auto 3/2/07 Farmers Group Bristol West $712.0 1.86x 2.60x 16.9x 15.0x Non-standard auto 12/4/06 Elara Holdings Direct General $452.6 1.66x 1.89x 14.4x 13.5x Non-standard auto 7/29/05 Sentry Insurance Viking Insurance $200.0 NA NA NA NA Non-standard auto 12/15/03 Liberte Investors USAuto Holdings Inc. 157.2 7.20x NA 10.6x NA Private passenger auto, Non-Standard auto 6/25/03 AIG GE U.S. Auto & Home 500.0 (2) 1.06x NA 8.5x NA Private passenger auto and home 5/22/03 Palisades Group LLC High Point Group 260.0 NA NA NA NA Private passenger auto 3/26/03 Nationwide Titan 138.0 0.88x NA NA NA Private passenger auto 5/31/01 Safety Holdings Inc. Thomas Black Corp. 112.8 0.53 0.53 5.9 NA Private passenger auto, Commercial auto 12/27/99 Prudential Titan 200.0 0.73 1.23 NA NA Private passenger auto, Non-Standard auto 7/12/99 MetLife St. Paul personal lines 600.0 NA NA NA NA Non-standard auto 6/9/99 Allstate Corp. CNA personal lines business 1,200.0 NA NA NA NA Private passenger auto 1/11/99 American Financial Group Inc. Worldwide Insurance Co. 115.0 0.84 NA NA NA Private passenger auto 1/26/98 Allstate Corp. Pembridge 267.3 NA NA NA NA Private passenger auto, Commercial auto 10/16/97 Hartford Financial Services Omni Insurance Group Inc. 187.6 3.30 3.41 33.8 30.8x Non-standard auto 6/23/97 General Motors Corp. Integon Corp. 519.2 3.93 NA NA NA Non-standard auto 2.26x 2.09x 15.9x 19.6x 1.66x 2.24x 14.4x 17.1x Book Tang. Book LTM Earnings FY1 Earnings Median: Mean: |
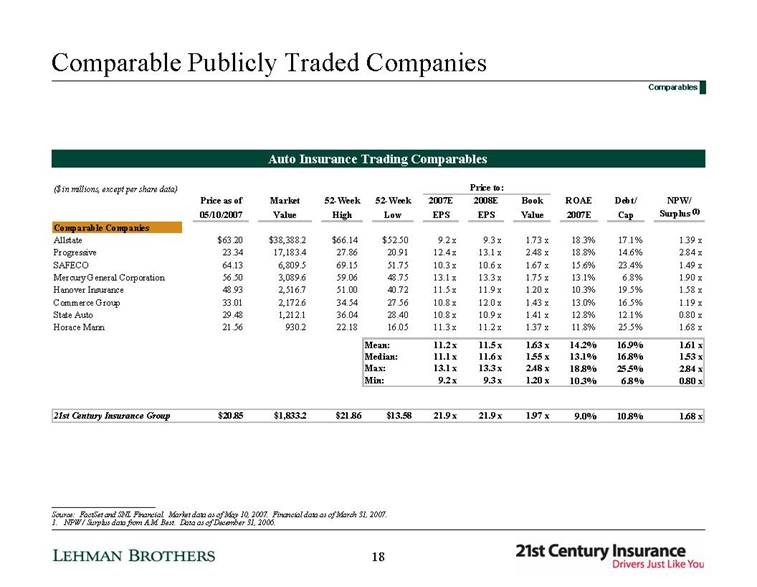
| Comparable Publicly Traded Companies Comparables Auto Insurance Trading Comparables ___________________________ Source: FactSet and SNL Financial. Market data as of May 10, 2007. Financial data as of March 31, 2007. 1. NPW / Surplus data from A.M. Best. Data as of December 31, 2006. 18 ($ in millions, except per share data) Price to: Price as of Market 52-Week 52-Week 2007E 2008E Book ROAE Debt/ NPW/ 05/10/2007 Value High Low EPS EPS Value 2007E Cap Surplus (1) Comparable Companies Allstate $63.20 $38,388.2 $66.14 $52.50 9.2 x 9.3 x 1.73 x 18.3% 17.1% 1.39 x Progressive 23.34 17,183.4 27.86 20.91 12.4 x 13.1 x 2.48 x 18.8% 14.6% 2.84 x SAFECO 64.13 6,809.5 69.15 51.75 10.3 x 10.6 x 1.67 x 15.6% 23.4% 1.49 x Mercury General Corporation 56.50 3,089.6 59.06 48.75 13.1 x 13.3 x 1.75 x 13.1% 6.8% 1.90 x Hanover Insurance 48.93 2,516.7 51.00 40.72 11.5 x 11.9 x 1.20 x 10.3% 19.5% 1.58 x Commerce Group 33.01 2,172.6 34.54 27.56 10.8 x 12.0 x 1.43 x 13.0% 16.5% 1.19 x State Auto 29.48 1,212.1 36.04 28.40 10.8 x 10.9 x 1.41 x 12.8% 12.1% 0.80 x Horace Mann 21.56 930.2 22.18 16.05 11.3 x 11.2 x 1.37 x 11.8% 25.5% 1.68 x Mean: 11.2 x 11.5 x 1.63 x 14.2% 16.9% 1.61 x Median: 11.1 x 11.6 x 1.55 x 13.1% 16.8% 1.53 x Max: 13.1 x 13.3 x 2.48 x 18.8% 25.5% 2.84 x Min: 9.2 x 9.3 x 1.20 x 10.3% 6.8% 0.80 x 21st Century Insurance Group $20.85 $1,833.2 $21.86 $13.58 21.9 x 21.9 x 1.97 x 9.0% 10.8% 1.68 x |
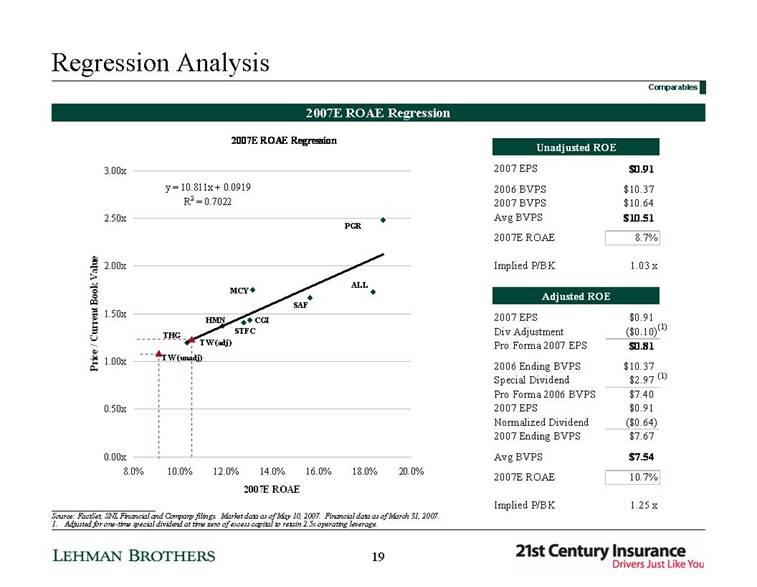
| Regression Analysis Comparables 2007E ROAE Regression ___________________________ Source: FactSet, SNL Financial and Company filings. Market data as of May 10, 2007. Financial data as of March 31, 2007. 1. Adjusted for one-time special dividend at time zero of excess capital to retain 2.5x operating leverage. (1) (1) 19 2007E ROAE Regression TW y = 10.811x + 0.0919 R 2 = 0.7022 0.00x 0.50x 1.00x 1.50x 2.00x 2.50x 3.00x 8.0% 10.0% 12.0% 14.0% 16.0% 18.0% 20.0% 2007E ROAE Price / Current Book Value ALL SAF TW (unadj) MCY PGR THG STFC HMN CGI TW (adj) Unadjusted ROE 2007 EPS $0.91 2006 BVPS $10.37 2007 BVPS $10.64 Avg BVPS $10.51 2007E ROAE 8.7% Implied P/BK 1.03 x Adjusted ROE 2007 EPS $0.91 Div Adjustment ($0.10) Pro Forma 2007 EPS $0.81 2006 Ending BVPS $10.37 Special Dividend $2.97 Pro Forma 2006 BVPS $7.40 2007 EPS $0.91 Normalized Dividend ($0.64) 2007 Ending BVPS $7.67 Avg BVPS $7.54 2007E ROAE 10.7% Implied P/BK 1.25 x |
| Discount Rates |
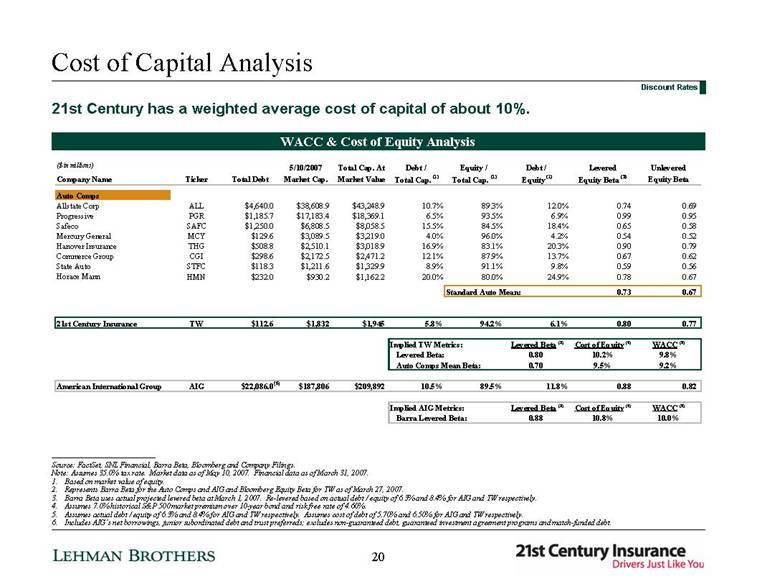
| Cost of Capital Analysis WACC & Cost of Equity Analysis ___________________________ Source: FactSet, SNL Financial, Barra Beta, Bloomberg and Company Filings. Note: Assumes 35.0% tax rate. Market data as of May 10, 2007. Financial data as of March 31, 2007. 1. Based on market value of equity. 2. Represents Barra Beta for the Auto Comps and AIG and Bloomberg Equity Beta for TW as of March 27, 2007. 3. Barra Beta uses actual projected levered beta at March 1, 2007. Re-levered based on actual debt / equity of 6.3% and 8.4% for AIG and TW respectively. 4. Assumes 7.0% historical S&P 500 market premium over 10-year bond and risk free rate of 4.60%. 5. Assumes actual debt / equity of 6.3% and 8.4% for AIG and TW respectively. Assumes cost of debt of 5.70% and 6.50% for AIG and TW respectively. 6. Includes AIG’s net borrowings, junior subordinated debt and trust preferreds; excludes non-guaranteed debt, guaranteed investment agreement programs and match-funded debt. 21st Century has a weighted average cost of capital of about 10%. Discount Rates 20 ($ in millions) 5/10/2007 Total Cap. At Debt / Equity / Debt / Levered Unlevered Company Name Ticker Total Debt Market Cap. Market Value Total Cap. (1) Total Cap. (1) Equity (1) Equity Beta (2) Equity Beta Auto Comps Allstate Corp ALL $4,640.0 $38,608.9 $43,248.9 10.7% 89.3% 12.0% 0.74 0.69 Progressive PGR $1,185.7 $17,183.4 $18,369.1 6.5% 93.5% 6.9% 0.99 0.95 Safeco SAFC $1,250.0 $6,808.5 $8,058.5 15.5% 84.5% 18.4% 0.65 0.58 Mercury General MCY $129.6 $3,089.5 $3,219.0 4.0% 96.0% 4.2% 0.54 0.52 Hanover Insurance THG $508.8 $2,510.1 $3,018.9 16.9% 83.1% 20.3% 0.90 0.79 Commerce Group CGI $298.6 $2,172.5 $2,471.2 12.1% 87.9% 13.7% 0.67 0.62 State Auto STFC $118.3 $1,211.6 $1,329.9 8.9% 91.1% 9.8% 0.59 0.56 Horace Mann HMN $232.0 $930.2 $1,162.2 20.0% 80.0% 24.9% 0.78 0.67 Standard Auto Mean: 0.73 0.67 21st Century Insurance TW $112.6 $1,832 $1,945 5.8% 94.2% 6.1% 0.80 0.77 Implied TW Metrics: Levered Beta (3) Cost of Equity (4) WACC (5) Levered Beta: 0.80 10.2% 9.8% Auto Comps Mean Beta: 0.70 9.5% 9.2% American International Group AIG $22,086.0 $187,806 $209,892 10.5% 89.5% 11.8% 0.88 0.82 Implied AIG Metrics: Levered Beta (3) Cost of Equity (4) WACC (5) Barra Levered Beta: 0.88 10.8% 10.0% (6) |
| Estimates and Historical Financials |
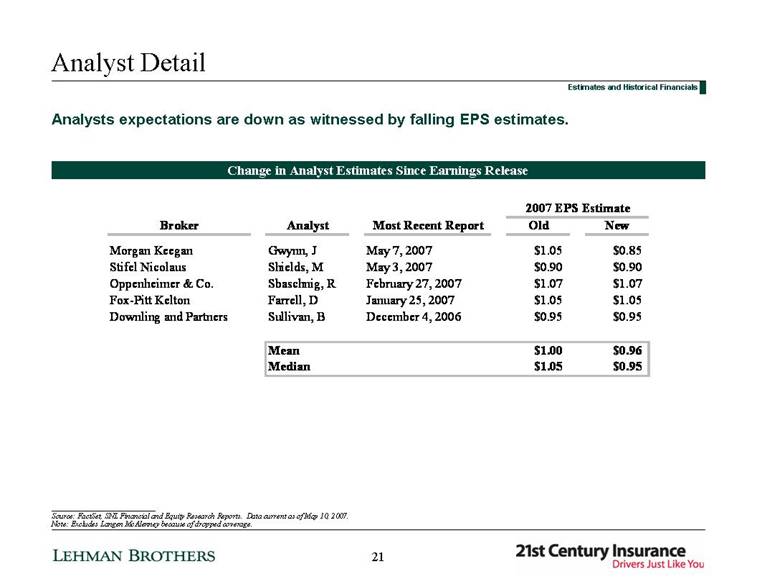
| Analyst Detail Estimates and Historical Financials Change in Analyst Estimates Since Earnings Release Analysts expectations are down as witnessed by falling EPS estimates. ___________________________ Source: FactSet, SNL Financial and Equity Research Reports. Data current as of May 10, 2007. Note: Excludes Langen McAlenney because of dropped coverage. 21 2007 EPS Estimate Broker Analyst Most Recent Report Old New Morgan Keegan Gwynn, J May 7, 2007 $1.05 $0.85 Stifel Nicolaus Shields, M May 3, 2007 $0.90 $0.90 Oppenheimer & Co. Sbaschnig, R February 27, 2007 $1.07 $1.07 Fox-Pitt Kelton Farrell, D January 25, 2007 $1.05 $1.05 Downling and Partners Sullivan, B December 4, 2006 $0.95 $0.95 Mean $1.00 $0.96 Median $1.05 $0.95 |
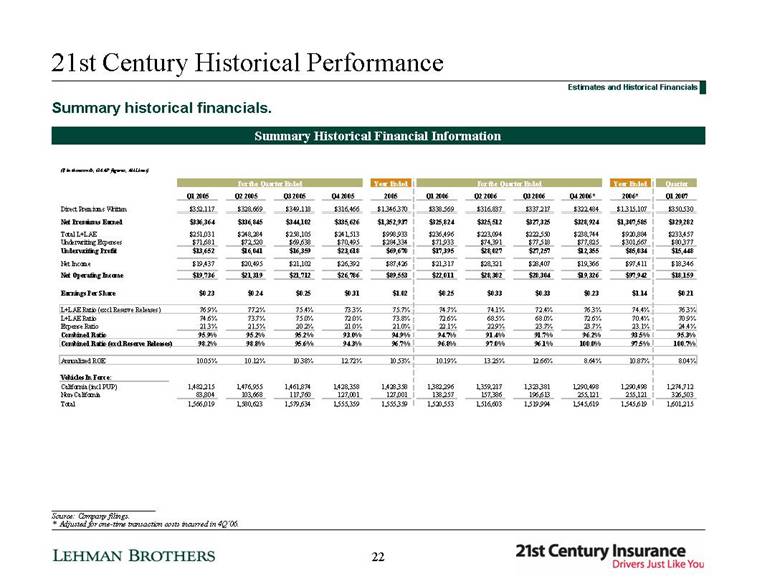
| 21st Century Historical Performance Summary historical financials. Estimates and Historical Financials Summary Historical Financial Information ___________________________ Source: Company filings. * Adjusted for one-time transaction costs incurred in 4Q’06. 22 ($ in thousands, GAAP figures, All Lines) For the Quarter Ended Year Ended For the Quarter Ended Year Ended Quarter Q1 2005 Q2 2005 Q3 2005 Q4 2005 2005 Q1 2006 Q2 2006 Q3 2006 Q4 2006* 2006* Q1 2007 Direct Premiums Written $352,117 $328,669 $349,118 $316,466 $1,346,370 $338,569 $316,837 $337,217 $322,484 $1,315,107 $350,530 Net Premiums Earned $336,364 $336,845 $344,102 $335,626 $1,352,937 $325,824 $325,512 $327,325 $328,924 $1,307,585 $329,282 Total L+LAE $251,031 $248,284 $258,105 $241,513 $998,933 $236,496 $223,094 $222,550 $238,744 $920,884 $233,457 Underwriting Expenses $71,681 $72,520 $69,638 $70,495 $284,334 $71,933 $74,391 $77,518 $77,825 $301,667 $80,377 Underwriting Profit $13,652 $16,041 $16,359 $23,618 $69,670 $17,395 $28,027 $27,257 $12,355 $85,034 $15,448 Net Income $19,437 $20,495 $21,102 $26,392 $87,426 $21,317 $28,321 $28,407 $19,366 $97,411 $18,346 Net Operating Income $19,736 $21,319 $21,712 $26,786 $89,553 $22,011 $28,302 $28,304 $19,326 $97,942 $18,159 Earnings Per Share $0.23 $0.24 $0.25 $0.31 $1.02 $0.25 $0.33 $0.33 $0.23 $1.14 $0.21 L+LAE Ratio (excl Reserve Releases) 76.9% 77.2% 75.4% 73.3% 75.7% 74.7% 74.1% 72.4% 76.3% 74.4% 76.3% L+LAE Ratio 74.6% 73.7% 75.0% 72.0% 73.8% 72.6% 68.5% 68.0% 72.6% 70.4% 70.9% Expense Ratio 21.3% 21.5% 20.2% 21.0% 21.0% 22.1% 22.9% 23.7% 23.7% 23.1% 24.4% Combined Ratio 95.9% 95.2% 95.2% 93.0% 94.9% 94.7% 91.4% 91.7% 96.2% 93.5% 95.3% Combined Ratio (excl Reserve Releases) 98.2% 98.8% 95.6% 94.3% 96.7% 96.8% 97.0% 96.1% 100.0% 97.5% 100.7% Annualized ROE 10.05% 10.12% 10.38% 12.72% 10.53% 10.19% 13.25% 12.66% 8.64% 10.87% 8.04% Vehicles In Force: California (incl PUP) 1,482,215 1,476,955 1,461,874 1,428,358 1,428,358 1,382,296 1,359,217 1,323,381 1,290,498 1,290,498 1,274,712 Non-California 83,804 103,668 117,760 127,001 127,001 138,257 157,386 196,613 255,121 255,121 326,503 Total 1,566,019 1,580,623 1,579,634 1,555,359 1,555,359 1,520,553 1,516,603 1,519,994 1,545,619 1,545,619 1,601,215 |