                                  UNITED STATES
                       SECURITIES AND EXCHANGE COMMISSION
                             Washington, D.C. 20549

                                   FORM N-CSR

                   CERTIFIED SHAREHOLDER REPORT OF REGISTERED
                         MANAGEMENT INVESTMENT COMPANIES


Investment Company Act file number                811-0816
                                   ---------------------------------------------


                    AMERICAN CENTURY MUTUAL FUNDS, INC.
- --------------------------------------------------------------------------------
               (Exact name of registrant as specified in charter)


               4500 MAIN STREET, KANSAS CITY, MISSOURI     64111
- --------------------------------------------------------------------------------
               (Address of principal executive offices) (Zip code)


      CHARLES A. ETHERINGTON, 4500 MAIN STREET, KANSAS CITY, MISSOURI 64111
- --------------------------------------------------------------------------------
                     (Name and address of agent for service)


Registrant's telephone number, including area code:       816-531-5575
                                                    ----------------------------

Date of fiscal year end:          10-31
                          ------------------------------------------------------

Date of reporting period:         04-30-2008
                          ------------------------------------------------------


ITEM 1.  REPORTS TO STOCKHOLDERS.


[front cover]

SEMIANNUAL REPORT
APRIL 30, 2008

[american century investments logo and text logo ®]

AMERICAN CENTURY INVESTMENTS

ULTRA® FUND


PRESIDENT'S LETTER

JONATHAN THOMAS

[photo of Jonathan Thomas]

Dear Investor,

At American Century Investments®, we are committed to helping you reach your
financial goals. Your success is the ultimate measure of our performance.
That's why we focus on achieving superior investment results and building
long-term relationships with investors like you.

Part of that relationship is to clearly communicate investment results and
what influenced them. To help you monitor your investment with us, we take
pride in providing you with the semiannual report for the American Century®
Ultra Fund for the six months ended April 30, 2008. We also recommend
americancentury.com, where we provide company news, quarterly portfolio
commentaries, investment views, and other useful information.

As noted on the website, 2008 marks the 50th anniversary of American Century
Investments. Since 1958, we've worked to make wise decisions with your
interests as our guide. Fifty years also means that we've met the challenges
of previous economic downturns. As we've crossed those hurdles and earned your
trust, our assets under management have grown to nearly $100 billion, putting
us in the top 5% of our industry. This growth has given us the resources to
offer a wide array of financial products and services, including a
well-diversified line-up of portfolios that provide you with many choices in
these uncertain times.

Though our offerings are diverse, they share several key qualities, including
our disciplined investment approach and active, team-based management. Strict
adherence to our processes and long-term strategies allows us to stay focused
during volatile periods. Investors in our portfolios also benefit from the sum
of our investment teams' expertise as they share research and information.

We'll continue to work hard to earn your trust. Thank you for your continued
support.

Sincerely,

/s/Jonathan Thomas

Jonathan S. Thomas
President and Chief Executive Officer
American Century Investments


TABLE OF CONTENTS

     Market Perspective. . . . . . . . . . . . . . . . . . . . . . . . . .      2
      U.S. Stock Index Returns . . . . . . . . . . . . . . . . . . . . . .      2

ULTRA

     Performance . . . . . . . . . . . . . . . . . . . . . . . . . . . . .      3
     Portfolio Commentary. . . . . . . . . . . . . . . . . . . . . . . . .      5
      Top Ten Holdings . . . . . . . . . . . . . . . . . . . . . . . . . .      5
      Top Five Industries. . . . . . . . . . . . . . . . . . . . . . . . .      6
      Types of Investments in Portfolio. . . . . . . . . . . . . . . . . .      6
     Shareholder Fee Example . . . . . . . . . . . . . . . . . . . . . . .      7
     Schedule of Investments . . . . . . . . . . . . . . . . . . . . . . .      9

FINANCIAL STATEMENTS

     Statement of Assets and Liabilities . . . . . . . . . . . . . . . . .     13
     Statement of Operations . . . . . . . . . . . . . . . . . . . . . . .     15
     Statement of Changes in Net Assets. . . . . . . . . . . . . . . . . .     16
     Notes to Financial Statements . . . . . . . . . . . . . . . . . . . .     17
     Financial Highlights. . . . . . . . . . . . . . . . . . . . . . . . .     22

OTHER INFORMATION

     Additional Information. . . . . . . . . . . . . . . . . . . . . . . .     28
     Index Definitions . . . . . . . . . . . . . . . . . . . . . . . . . .     29

The opinions expressed in the Market Perspective and the Portfolio Commentary
reflect those of the portfolio management team as of the date of the report,
and do not necessarily represent the opinions of American Century or any other
person in the American Century organization. Any such opinions are subject to
change at any time based upon market or other conditions and American Century
disclaims any responsibility to update such opinions. These opinions may not
be relied upon as investment advice and, because investment decisions made by
American Century funds are based on numerous factors, may not be relied upon
as an indication of trading intent on behalf of any American Century fund.
Security examples are used for representational purposes only and are not
intended as recommendations to purchase or sell securities. Performance
information for comparative indices and securities is provided to American
Century by third party vendors. To the best of American Century's knowledge,
such information is accurate at the time of printing.


MARKET PERSPECTIVE

[photo of Chief Investment Officer]

By Steve Lurito, Chief Investment Officer, U.S. Growth Equity

VOLATILITY UP, STOCKS DOWN

The six months ended April 30, 2008 saw stocks produce negative returns as
market volatility surged in the wake of the subprime credit crisis. In terms
of the economy, tighter credit and the slumping housing market hurt consumer
spending and confidence, leading many economists to suggest we're already in
recession. Meanwhile, mounting losses hurt the banks, brokers, and other big
institutional players important for the functioning of the financial markets.

Facing dual economic and financial crises, the Federal Reserve (the Fed) took
a series of extraordinary steps, slashing interest rates and acting as a
lender of last resort not only for banks, but also major brokers. That helped
stocks rebound, with many analysts suggesting that the mid-March buy-out of
investment bank Bear Stearns--in a deal arranged by the Fed--put a floor under
the market.

RETURNS BY SIZE, STYLE MIXED

Performance by size and style was mixed (see the accompanying table),
reflecting the volatile trading during the period, when corporate earnings
estimates were revised down sharply. Looking at returns by sector, energy
shares were the only segment to produce positive results during the six
months. At the other end of the spectrum, credit-related losses took a big
bite out of earnings for financials stocks, which performed worst. Consumer
discretionary shares also lagged badly, as did information technology stocks,
which suffered from poor pricing and demand trends for chips and some
consumer-related tech goods.

OPPORTUNITY AMID VOLATILITY

Despite the uncertainty surrounding the economy, we think growth-oriented
stocks can perform well relative to value as proven earnings growth becomes
scarce during economic slowdowns. And while we don't see an end to market
volatility anytime soon, we view this dynamic as a natural part of the
investing cycle--and one that presents us with opportunities to build
positions in what we believe are high-quality companies trading at attractive
prices. Indeed, investors should rest assured that we're finding no shortage
of companies demonstrating sustained earnings growth and business improvement.

U.S. Stock Index Returns
For the six months ended April 30, 2008*
RUSSELL 1000 INDEX (LARGE-CAP)        -9.54%
Russell 1000 Growth Index             -9.28%
Russell 1000 Value Index              -9.83%
RUSSELL MIDCAP INDEX                  -8.77%
Russell Midcap Growth Index           -8.44%
Russell Midcap Value Index            -9.20%
RUSSELL 2000 INDEX (SMALL-CAP)       -12.92%
Russell 2000 Growth Index            -14.14%
Russell 2000 Value Index             -11.55%

* Total returns for periods less than one year are not annualized.


- ------
2


PERFORMANCE
Ultra

Total Returns as of April 30, 2008
                                                 Average Annual Returns
                                                       10          Since      Inception
                      6 months(1)   1 year   5 years    years    Inception      Date

INVESTOR CLASS          -10.73%     5.99%     7.50%     2.58%     12.30%       11/2/81

RUSSELL 1000 GROWTH
INDEX(2)                -9.28%      -0.23%    9.52%     1.66%    11.07%(3)       --

S&P 500 INDEX(2)        -9.64%      -4.68%    10.62%    3.89%    12.64%(3)       --

Institutional Class     -10.64%     6.20%     7.71%     2.78%      5.49%      11/14/96

A Class(4)
 No sales
 charge*                -10.83%     5.75%     7.24%     2.33%      5.34%
 With sales
 charge*                -15.95%     -0.33%    5.98%     1.72%      4.81%       10/2/96

B Class
 No sales
 charge*                -11.15%       --        --       --      -6.04%(1)
 With sales
 charge*                -16.15%       --        --       --     -11.04%(1)     9/28/07

C Class
 No sales
 charge*                -11.16%     4.95%     6.46%      --        2.61%
 With sales
 charge*                -11.82%     4.95%     6.46%      --        2.61%      10/29/01

R Class                 -10.96%     5.47%       --       --        5.11%       8/29/03

* Sales charges include initial sales charges and contingent deferred sales
charges (CDSCs), as applicable. A Class shares have a 5.75% maximum initial
sales charge for equity funds and may be subject to a maximum CDSC of 1.00%. B
Class shares redeemed within six years of purchase are subject to a CDSC that
declines from 5.00% during the first year after purchase to 0.00% the sixth
year after purchase. C Class shares redeemed within 12 months of purchase are
subject to a maximum CDSC of 1.00%. The SEC requires that mutual funds provide
performance information net of maximum sales charges in all cases where
charges could be applied.

(1) Total returns for periods less than one year are not annualized.

(2) Data provided by Lipper Inc. -- A Reuters Company. ©2008 Reuters. All
rights reserved. Any copying, republication or redistribution of Lipper
content, including by caching, framing or similar means, is expressly
prohibited without the prior written consent of Lipper. Lipper shall not be
liable for any errors or delays in the content, or for any actions taken in
reliance thereon.

  The data contained herein has been obtained from company reports, financial
reporting services, periodicals and other resources believed to be reliable.
Although carefully verified, data on compilations is not guaranteed by Lipper
and may be incomplete. No offer or solicitations to buy or sell any of the
securities herein is being made by Lipper.

(3) Since 10/31/81, the date nearest the Investor Class's inception for which
data are available.

(4) Prior to September 4, 2007, the A Class was referred to as the Advisor
Class. Performance, with sales charge, prior to that date has been adjusted to
reflect the A Class's current sales charge.

Data presented reflect past performance. Past performance is no guarantee of
future results. Current performance may be higher or lower than the
performance shown. Investment return and principal value will fluctuate, and
redemption value may be more or less than original cost. To obtain performance
data current to the most recent month end, please call 1-800-345-2021 or visit
americancentury.com. International investing involves special risks, such as
political instability and currency fluctuations.

Unless otherwise indicated, performance reflects Investor Class shares;
performance for other share classes will vary due to differences in fee
structure. For information about other share classes available, please consult
the prospectus. Data assumes reinvestment of dividends and capital gains, and
none of the charts reflect the deduction of taxes that a shareholder would pay
on fund distributions or the redemption of fund shares. Returns for the
indices are provided for comparison. The fund's total returns include
operating expenses (such as transaction costs and management fees) that reduce
returns, while the total returns of the indices do not.


- ------
3


Ultra

Growth of $10,000 Over 10 Years

$10,000 investment made April 30, 1998
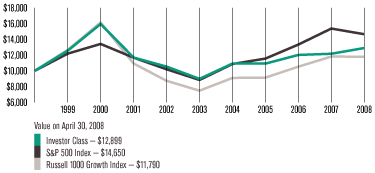
One-Year Returns Over 10 Years
Periods ended April 30
1999 2000 2001 2002 2003 2004 2005 2006 2007 2008
Investor
Class 25.52% 27.06% -26.70% -9.83% -14.79% 21.64% -0.07% 10.09% 1.24% 5.99%
Russell
1000
Growth
Index 26.53% 27.58% -32.25% -20.10% -14.35% 21.65% 0.40% 15.18% 12.25% -0.23%
S&P 500
Index 21.82% 10.13% -12.97% -12.63% -13.31% 22.88% 6.34% 15.42% 15.24% -4.68%
Data presented reflect past performance. Past performance is no guarantee of
future results. Current performance may be higher or lower than the
performance shown. Investment return and principal value will fluctuate, and
redemption value may be more or less than original cost. To obtain performance
data current to the most recent month end, please call 1-800-345-2021 or visit
americancentury.com. International investing involves special risks, such as
political instability and currency fluctuations.
Unless otherwise indicated, performance reflects Investor Class shares;
performance for other share classes will vary due to differences in fee
structure. For information about other share classes available, please consult
the prospectus. Data assumes reinvestment of dividends and capital gains, and
none of the charts reflect the deduction of taxes that a shareholder would pay
on fund distributions or the redemption of fund shares. Returns for the
indices are provided for comparison. The fund's total returns include
operating expenses (such as transaction costs and management fees) that reduce
returns, while the total returns of the indices do not.
- ------
4
PORTFOLIO COMMENTARY
Ultra
Portfolio Managers: Tom Telford and Steve Lurito
PERFORMANCE SUMMARY
Ultra returned -10.73%* for the six months ended April 30, 2008, trailing the
- -9.28% return of its benchmark, the Russell 1000 Growth Index. The S&P 500
Index, a broad measure of the stock market, returned -9.64%.
The six-month period was a challenging one for both the overall equity market
and the fund as economic and market conditions changed dramatically. The
factors that helped Ultra outperform the Russell 1000 Growth Index by a wide
margin in 2007 reversed in the first four months of 2008--large-cap growth
stocks lost ground to large-cap value issues, momentum stocks fell out of
favor, market volatility increased, and the leading sectors from 2007 were
among the worst performers in early 2008. The shifting landscape also had a
negative impact on the fund's foreign holdings, creating a further drag on
performance.
Given these significant headwinds, the fund held up reasonably well compared
with its benchmark and the broad market indexes. One goal of the process
improvements we implemented over the past 18 months was to avoid straying too
far from the benchmark when our investment approach is not in favor, and we
believe we were successful in that regard during the period.
TECHNOLOGY DETRACTED
Virtually all of the fund's underperformance during the six-month period
resulted from our information technology holdings. Technology was one of the
worst-performing sectors in the benchmark index, so our overweight position in
the sector hurt relative results. Stock selection also detracted from
performance compared with the index, particularly among software makers and
internet services providers.
The most significant individual detractor was online advertising and search
company Google, which was one of the fund's largest holdings during the
period. Google reported disappointing earnings in early 2008, which led to
concerns that the economic slowdown was having a detrimental impact on
internet advertising. However, online advertising is still the fastest-growing
segment of the ad industry, and Google continues to increase its market share,
so we remain confident in the company's long-term prospects.
Economic concerns hit other high-growth holdings within the technology sector,
including video game maker Nintendo and handheld device maker Research In
Motion (RIM). We sold Nintendo and reduced our position in RIM during the
period.
Top Ten Holdings as of April 30, 2008
% of net % of net
assets as of assets as of
4/30/08 10/31/07
Microsoft Corporation 3.9% 1.1%
Cisco Systems Inc. 3.2% 3.7%
Intel Corp. 2.8% 2.9%
Apple Inc. 2.3% 3.5%
Hewlett-Packard Co. 2.2% 2.6%
Emerson Electric Co. 2.1% 2.0%
Union Pacific Corp. 1.9% --
International Business Machines Corp. 1.9% 1.6%
Google Inc. Cl A 1.9% 4.3%
Wal-Mart Stores, Inc. 1.8% --
* All fund returns referenced in this commentary are for Investor Class
shares. Total returns for periods less than one year are not annualized.
- ------
5
Ultra
MIXED RESULTS IN CONSUMER DISCRETIONARY
Although the portfolio's consumer discretionary stocks outperformed their
counterparts in the benchmark index, some of the fund's best and worst
relative performance contributors came from this sector. Stock selection among
restaurants was the key to the overall outperformance of the fund's consumer
discretionary holdings, led by fast-food companies McDonald's and Yum! Brands
(owner of the Taco Bell, KFC, and Pizza Hut chains). Both companies benefited
from strong results in their international businesses--McDonald's in Europe,
Yum! in China.
One of portfolio's worst relative performers also came from this
sector--private education firm Apollo Group. Rising recruitment costs cut into
profit margins, and enrollment was hurt by the credit crunch, which made it
more difficult for students to get education loans.
ENERGY OUTPERFORMED
Stock selection and an overweight in energy--the best-performing sector in the
benchmark index--added value to relative performance during the period. In
2007, we built positions in a number of energy companies that focused on
natural gas, for several reasons: (1) a wide differential between oil and
natural gas prices, (2) accelerating production as more natural gas reserves
were discovered, and (3) an increase in the development of new natural-gas
power plants.
This approach proved successful as four of the top ten relative performance
contributors were energy stocks with an emphasis on natural gas, including XTO
Energy, Apache, EOG Resources, and Noble Energy.
A LOOK AHEAD
The recent market volatility and shift away from momentum-style investing
created a difficult environment for our investment approach. However, we
remain confident that our process of identifying large companies with
improving business fundamentals, accelerating growth, and price momentum will
generate outperformance over the long term compared with the Russell 1000
Growth Index.
Top Five Industries as of April 30, 2008
% of net % of net
assets as of assets as of
4/30/08 10/31/07
Semiconductors &
Semiconductor Equipment 6.8% 5.8%
Oil, Gas & Consumable Fuels 6.8% 3.9%
Communications Equipment 6.6% 7.4%
Software 5.3% 5.6%
Capital Markets 4.8% 3.8%
Types of Investments in Portfolio
% of net % of net
assets as of assets as of
4/30/08 10/31/07
Domestic Common Stocks 90.4% 87.4%
Foreign Common Stocks(1) 7.9% 11.6%
TOTAL COMMON STOCKS 98.3% 99.0%
Temporary Cash Investments 2.5% 2.3%
Other Assets and Liabilities(2) (0.8)% (1.3)%
(1) Includes depositary shares, dual listed securities and foreign ordinary
shares.
(2) Includes securities lending collateral and other assets and liabilities.
- ------
6
SHAREHOLDER FEE EXAMPLE (UNAUDITED)
Fund shareholders may incur two types of costs: (1) transaction costs,
including sales charges (loads) on purchase payments and redemption/exchange
fees; and (2) ongoing costs, including management fees; distribution and
service (12b-1) fees; and other fund expenses. This example is intended to
help you understand your ongoing costs (in dollars) of investing in your fund
and to compare these costs with the ongoing cost of investing in other mutual
funds.
The example is based on an investment of $1,000 made at the beginning of the
period and held for the entire period from November 1, 2007 to April 30, 2008.
ACTUAL EXPENSES
The table provides information about actual account values and actual expenses
for each class. You may use the information, together with the amount you
invested, to estimate the expenses that you paid over the period. First,
identify the share class you own. Then simply divide your account value by
$1,000 (for example, an $8,600 account value divided by $1,000 = 8.6), then
multiply the result by the number under the heading "Expenses Paid During
Period" to estimate the expenses you paid on your account during this period.
If you hold Investor Class shares of any American Century fund, or
Institutional Class shares of the American Century Diversified Bond Fund, in
an American Century account (i.e., not a financial intermediary or retirement
plan account), American Century may charge you a $12.50 semiannual account
maintenance fee if the value of those shares is less than $10,000. We will
redeem shares automatically in one of your accounts to pay the $12.50 fee. In
determining your total eligible investment amount, we will include your
investments in all PERSONAL ACCOUNTS (including American Century Brokerage
accounts) registered under your Social Security number. PERSONAL ACCOUNTS
include individual accounts, joint accounts, UGMA/UTMA accounts, personal
trusts, Coverdell Education Savings Accounts and IRAs (including traditional,
Roth, Rollover, SEP-, SARSEP- and SIMPLE-IRAs), and certain other retirement
accounts. If you have only business, business retirement, employer-sponsored
or American Century Brokerage accounts, you are currently not subject to this
fee. We will not charge the fee as long as you choose to manage your accounts
exclusively online. If you are subject to the Account Maintenance Fee, your
account value could be reduced by the fee amount.
HYPOTHETICAL EXAMPLE FOR COMPARISON PURPOSES
The table also provides information about hypothetical account values and
hypothetical expenses based on the actual expense ratio of each class of your
fund and an assumed rate of return of 5% per year before expenses, which is
not the actual return of a fund's share class. The hypothetical account values
and expenses may not be used to estimate the actual ending account balance or
expenses you paid for the period. You may use this information to compare the
ongoing costs of investing in your fund and other funds. To do so, compare
this 5% hypothetical example with the 5% hypothetical examples that appear in
the shareholder reports of the other funds.
Please note that the expenses shown in the table are meant to highlight your
ongoing costs only and do not reflect any transactional costs, such as sales
charges (loads) or redemption/exchange fees. Therefore, the table is useful in
comparing ongoing costs only, and will not help you determine the relative
total costs of owning different funds. In addition, if these transactional
costs were included, your costs would have been higher.
- ------
7
Beginning Expenses Paid
Account Ending During Period* Annualized
Value Account Value 11/1/07 - Expense
11/1/07 4/30/08 4/30/08 Ratio*
ACTUAL
Investor Class $1,000 $892.70 $4.66 0.99%
Institutional Class $1,000 $893.60 $3.72 0.79%
A Class $1,000 $891.70 $5.83 1.24%
B Class $1,000 $888.50 $9.34 1.99%
C Class $1,000 $888.40 $9.34 1.99%
R Class $1,000 $890.40 $7.00 1.49%
HYPOTHETICAL
Investor Class $1,000 $1,019.94 $4.97 0.99%
Institutional Class $1,000 $1,020.93 $3.97 0.79%
A Class $1,000 $1,018.70 $6.22 1.24%
B Class $1,000 $1,014.97 $9.97 1.99%
C Class $1,000 $1,014.97 $9.97 1.99%
R Class $1,000 $1,017.45 $7.47 1.49%
* Expenses are equal to the class's annualized expense ratio listed in the
table above, multiplied by the average account value over the period,
multiplied by 182, the number of days in the most recent fiscal half-year,
divided by 366, to reflect the one-half year period.
- ------
8
SCHEDULE OF INVESTMENTS
Ultra
APRIL 30, 2008 (UNAUDITED)
Shares Value
Common Stocks -- 98.3%
AEROSPACE & DEFENSE -- 4.1%
1,019,000 Lockheed Martin Corp. $ 108,054,760
2,182,000 Raytheon Co. 139,582,540
1,361,000 United Technologies Corp. 98,631,670
--------------
346,268,970
--------------
BEVERAGES -- 2.8%
2,133,000 Coca-Cola Co. (The) 125,569,710
1,624,000 PepsiCo, Inc. 111,292,720
--------------
236,862,430
--------------
BIOTECHNOLOGY -- 2.7%
498,883 Genentech, Inc.(1) 34,023,821
1,127,000 Genzyme Corp.(1) 79,284,450
2,249,000 Gilead Sciences, Inc.(1) 116,408,240
--------------
229,716,511
--------------
CAPITAL MARKETS -- 4.8%
2,573,000 Bank of New York Mellon Corp. (The) 112,002,690
5,369,000 Charles Schwab Corp. (The) 115,970,400
466,000 Goldman Sachs Group, Inc. (The) 89,178,420
1,792,000 Morgan Stanley 87,091,200
--------------
404,242,710
--------------
CHEMICALS -- 2.6%
473,000 Celanese Corp., Series A 21,166,750
539,000 Johnson Matthey plc ORD 21,441,959
1,136,000 Monsanto Co. 129,526,720
162,000 Syngenta AG ORD 48,406,063
--------------
220,541,492
--------------
COMMERCIAL SERVICES & SUPPLIES -- 0.4%
1,548,000 Robert Half International Inc. 36,687,600
--------------
COMMUNICATIONS EQUIPMENT -- 6.6%
10,568,000 Cisco Systems Inc.(1) 270,963,520
4,249,000 Corning Inc. 113,490,790
1,915,000 Nokia Oyj ADR 57,584,050
1,425,000 QUALCOMM Inc. 61,545,750
413,000 Research In Motion Ltd.(1) 50,233,190
--------------
553,817,300
--------------
COMPUTERS & PERIPHERALS -- 4.5%
1,095,000 Apple Inc.(1) 190,475,250
3,941,000 Hewlett-Packard Co. 182,665,350
--------------
373,140,600
--------------
CONSTRUCTION & ENGINEERING -- 1.0%
543,000 Fluor Corp. 83,008,410
--------------
Shares Value
CONSUMER FINANCE -- 0.5%
2,340,000 Discover Financial Services $ 42,611,400
--------------
DIVERSIFIED FINANCIAL SERVICES -- 1.6%
514,000 Bank of America Corp. 19,295,560
11,277 CME Group Inc. 5,158,664
298,000 Deutsche Boerse AG ORD 43,848,725
1,398,000 JPMorgan Chase & Co. 66,614,700
--------------
134,917,649
--------------
ELECTRICAL EQUIPMENT -- 2.9%
2,350,000 ABB Ltd. ORD 72,237,884
3,298,000 Emerson Electric Co. 172,353,480
--------------
244,591,364
--------------
ENERGY EQUIPMENT & SERVICES -- 3.5%
706,000 National Oilwell Varco, Inc.(1) 48,325,700
951,000 Schlumberger Ltd. 95,623,050
1,025,000 Transocean Inc.(1) 151,146,500
--------------
295,095,250
--------------
FOOD & STAPLES RETAILING -- 2.7%
997,000 Costco Wholesale Corp. 71,036,250
2,635,000 Wal-Mart Stores, Inc. 152,777,300
--------------
223,813,550
--------------
FOOD PRODUCTS -- 2.4%
571,000 Archer-Daniels-Midland Co. 25,158,260
276,000 Nestle SA ORD 132,430,972
1,334,000 Unilever N.V. CVA 44,999,448
--------------
202,588,680
--------------
HEALTH CARE EQUIPMENT & SUPPLIES -- 3.4%
1,430,000 Baxter International Inc. 89,117,600
1,035,000 Becton, Dickinson & Co. 92,529,000
2,071,000 Medtronic, Inc. 100,816,280
--------------
282,462,880
--------------
HEALTH CARE PROVIDERS & SERVICES -- 1.9%
1,727,919 Express Scripts, Inc.(1) 120,988,888
821,165 Medco Health Solutions Inc.(1) 40,680,514
--------------
161,669,402
--------------
HOTELS, RESTAURANTS & LEISURE -- 2.8%
2,482,000 McDonald's Corp. 147,877,560
2,183,000 Yum! Brands, Inc. 88,804,440
--------------
236,682,000
--------------
HOUSEHOLD PRODUCTS -- 1.7%
1,437,000 Colgate-Palmolive Co. 101,595,900
621,000 Procter & Gamble Co. (The) 41,638,050
--------------
143,233,950
--------------
- ------
9
Ultra
Shares Value
INDUSTRIAL CONGLOMERATES -- 0.7%
929,000 Textron Inc. $ 56,678,290
--------------
INSURANCE -- 1.2%
1,460,000 Aflac Inc. 97,338,200
--------------
INTERNET SOFTWARE & SERVICES -- 1.9%
273,000 Google Inc. Cl A(1) 156,781,170
--------------
IT SERVICES -- 3.6%
2,013,000 Accenture Ltd. Cl A 75,588,150
1,334,000 International Business Machines Corp. 161,013,800
2,946,000 Western Union Co. (The) 67,758,000
--------------
304,359,950
--------------
LIFE SCIENCES TOOLS & SERVICES -- 0.8%
1,128,000 Thermo Fisher Scientific Inc.(1) 65,277,360
--------------
MACHINERY -- 3.2%
1,277,000 Caterpillar Inc. 104,560,760
1,010,000 Deere & Co. 84,910,700
244,000 Eaton Corp. 21,432,960
407,000 Illinois Tool Works Inc. 21,282,030
443,195 Parker-Hannifin Corp. 35,389,121
--------------
267,575,571
--------------
MEDIA -- 1.1%
1,331,000 Viacom Inc. Cl B(1) 51,163,640
1,321,000 Walt Disney Co. (The) 42,840,030
--------------
94,003,670
--------------
METALS & MINING -- 2.4%
549,000 Alcoa Inc. 19,094,220
1,140,000 BHP Billiton Ltd. ORD 45,448,324
852,000 Cia Vale do Rio Doce ADR 33,296,160
495,000 Freeport-McMoRan Copper & Gold, Inc. 56,306,249
409,000 Rio Tinto plc ORD 48,087,253
--------------
202,232,206
--------------
MULTILINE RETAIL -- 2.4%
623,000 J.C. Penney Co., Inc. 26,477,500
1,232,000 Kohl's Corp.(1) 60,183,200
2,055,000 Nordstrom, Inc. 72,459,300
800,000 Target Corp. 42,504,000
--------------
201,624,000
--------------
OIL, GAS & CONSUMABLE FUELS -- 6.8%
479,000 Apache Corp. 64,511,720
666,000 Chevron Corp. 64,035,900
331,000 EOG Resources Inc. 43,188,880
Shares Value
456,000 Exxon Mobil Corp. $ 42,439,920
643,000 Hess Corp. 68,286,600
882,000 Noble Energy Inc. 76,734,000
771,000 Occidental Petroleum Corp. 64,154,910
447,000 Range Resources Corporation 29,671,860
1,880,000 XTO Energy Inc. 116,296,800
--------------
569,320,590
--------------
PHARMACEUTICALS -- 2.7%
1,592,000 Abbott Laboratories 83,978,000
1,288,000 Johnson & Johnson 86,411,920
1,451,000 Merck & Co., Inc. 55,196,040
--------------
225,585,960
--------------
ROAD & RAIL -- 1.9%
1,122,000 Union Pacific Corp. 162,903,180
--------------
SEMICONDUCTORS & SEMICONDUCTOR EQUIPMENT -- 6.8%
2,279,000 Applied Materials, Inc. 42,526,140
2,338,000 ASML Holding N.V. ORD 66,927,498
10,389,000 Intel Corp. 231,259,140
2,069,000 MEMC Electronic Materials Inc.(1) 130,284,930
1,360,000 Microchip Technology Inc.(2) 49,980,000
1,488,865 Varian Semiconductor Equipment Associates,
Inc.(1) 54,537,125
--------------
575,514,833
--------------
SOFTWARE -- 5.3%
11,532,000 Microsoft Corporation 328,892,640
5,398,000 Oracle Corp.(1) 112,548,300
--------------
441,440,940
--------------
SPECIALTY RETAIL -- 2.2%
2,195,000 Home Depot, Inc. (The) 63,216,000
1,897,000 Staples, Inc. 41,164,900
2,470,000 TJX Companies, Inc. (The) 79,583,400
--------------
183,964,300
--------------
TEXTILES, APPAREL & LUXURY GOODS -- 0.8%
1,058,000 NIKE, Inc. Cl B 70,674,400
--------------
TOBACCO -- 1.3%
2,218,000 Philip Morris International Inc.(1) 113,184,540
--------------
TRADING COMPANIES & DISTRIBUTORS -- 0.3%
250,000 Grainger (W.W.), Inc. 21,677,500
--------------
TOTAL COMMON STOCKS
(Cost $7,229,458,047) 8,262,088,808
--------------
- ------
10
Ultra
Value
Temporary Cash Investments -- 2.5%
Repurchase Agreement, Goldman Sachs Group, Inc. (The),
(collateralized by various U.S. Treasury obligations, 5.50%,
8/15/28, valued at 206,066,707), in a joint trading account at
1.90%, dated 4/30/08, due 5/1/08 (Delivery value $202,210,672) $ 202,200,000
Repurchase Agreement, Morgan Stanley Group, Inc.,
(collateralized by various U.S. Treasury obligations, 7.875%
- -- 8.75%, 8/15/20-2/15/21, valued at 8,464,998), in a joint
trading account at 1.90%, dated 4/30/08, due 5/1/08 (Delivery
value $8,300,438) 8,300,000
--------------
TOTAL TEMPORARY CASH INVESTMENTS
(Cost $210,500,000) 210,500,000
--------------
Temporary Cash Investments -- Securities Lending Collateral(3) -- 0.1%
Repurchase Agreement, Barclays Capital Inc., (collateralized
by various U.S. Government Agency obligations in a pooled
account at the lending agent), 1.98%, dated 4/30/08, due
5/1/08 (Delivery value $1,289,031) 1,288,960
Repurchase Agreement, BNP Paribas Securities Corp.,
(collateralized by various U.S. Government Agency obligations
in a pooled account at the lending agent), 1.99%, dated
4/30/08, due 5/1/08 (Delivery value $1,400,077) 1,400,000
Value
Repurchase Agreement, Deutsche Bank Securities Inc.,
(collateralized by various U.S. Government Agency obligations
in a pooled account at the lending agent), 1.97%, dated
4/30/08, due 5/1/08 (Delivery value $1,400,077) $ 1,400,000
Repurchase Agreement, Lehman Brothers Inc. / Lehman Brothers
Commercial Paper Inc., (collateralized by various U.S.
Government Agency obligations in a pooled account at the
lending agent), 2.39%, dated 4/30/08, due 5/1/08 (Delivery
value $1,400,093) 1,400,000
Repurchase Agreement, Morgan Stanley & Co. Inc.,
(collateralized by various U.S. Government Agency obligations
in a pooled account at the lending agent), 1.97%, dated
4/30/08, due 5/1/08 (Delivery value $1,400,077) 1,400,000
--------------
TOTAL TEMPORARY CASH INVESTMENTS -- SECURITIES LENDING
COLLATERAL
(Cost $6,888,960) 6,888,960
--------------
TOTAL INVESTMENT SECURITIES -- 100.9%
(Cost $7,446,847,007) 8,479,477,768
--------------
OTHER ASSETS AND LIABILITIES -- (0.9)% (73,264,112)
--------------
TOTAL NET ASSETS -- 100.0% $8,406,213,656
==============
Forward Foreign Currency Exchange Contracts
Unrealized Gain
Contracts to Sell Settlement Date Value (Loss)
25,593,000 AUD for USD 5/30/08 $ 24,049,240 $(121,065)
129,540,000 CHF for USD 5/30/08 125,116,071 342,754
49,831,845 Euro for USD 5/30/08 77,730,772 152,914
24,654,532 GBP for USD 5/30/08 48,944,914 179,836
------------ ----------
$275,840,997 $ 554,439
============ ==========
(Value on Settlement Date $276,395,436)
- ------
11
Ultra
Notes to Schedule of Investments
ADR = American Depositary Receipt
AUD = Australian Dollar
CHF = Swiss Franc
CVA = Certificaten Van Aandelen
GBP = British Pound
ORD = Foreign Ordinary Share
USD = United States Dollar
(1) Non-income producing.
(2) Security, or a portion thereof, was on loan as of April 30, 2008.
(3) Investments represent purchases made by the lending agent with cash
collateral received through securities lending transactions.
See Notes to Financial Statements.
- ------
12
STATEMENT OF ASSETS AND LIABILITIES
APRIL 30, 2008 (UNAUDITED)
ASSETS
Investment securities, at value (cost of $7,439,958,047) --
including $6,706,471 of securities on loan $8,472,588,808
Investments made with cash collateral received for securities on
loan, at value (cost of $6,888,960) 6,888,960
--------------
Total investment securities, at value (cost of $7,446,847,007) 8,479,477,768
Receivable for investments sold 325,020,906
Receivable for forward foreign currency exchange contracts 675,504
Dividends and interest receivable 6,164,320
--------------
8,811,338,498
--------------
LIABILITIES
Disbursements in excess of demand deposit cash 7,584,356
Payable for collateral received for securities on loan 6,888,960
Payable for investments purchased 383,697,865
Payable for capital shares redeemed 3,826
Payable for forward foreign currency exchange contracts 121,065
Accrued management fees 6,791,843
Distribution fees payable 996
Service fees (and distribution fees -- A Class and R Class)
payable 35,931
--------------
405,124,842
--------------
NET ASSETS $8,406,213,656
==============
See Notes to Financial Statements.
- ------
13
APRIL 30, 2008 (UNAUDITED)
NET ASSETS CONSIST OF:
Capital (par value and paid-in surplus) $6,636,334,241
Undistributed net investment income 20,147,377
Undistributed net realized gain on investment and foreign
currency transactions 716,569,025
Net unrealized appreciation on investments and translation of
assets and liabilities in foreign currencies 1,033,163,013
--------------
$8,406,213,656
==============
INVESTOR CLASS, $0.01 PAR VALUE
Net assets $8,125,897,590
Shares outstanding 360,113,427
Net asset value per share $22.56
INSTITUTIONAL CLASS, $0.01 PAR VALUE
Net assets $111,174,317
Shares outstanding 4,824,915
Net asset value per share $23.04
A CLASS, $0.01 PAR VALUE
Net assets $162,044,910
Shares outstanding 7,378,248
Net asset value per share $21.96
Maximum offering price (net asset value divided by 0.9425) $23.30
B CLASS, $0.01 PAR VALUE
Net assets $43,897
Shares outstanding 1,958
Net asset value per share $22.42
C CLASS, $0.01 PAR VALUE
Net assets $1,582,561
Shares outstanding 76,368
Net asset value per share $20.72
R CLASS, $0.01 PAR VALUE
Net assets $5,470,381
Shares outstanding 249,735
Net asset value per share $21.90
See Notes to Financial Statements.
- ------
14
STATEMENT OF OPERATIONS
FOR THE SIX MONTHS ENDED APRIL 30, 2008 (UNAUDITED)
INVESTMENT INCOME (LOSS)
INCOME:
Dividends (net of foreign taxes withheld of $1,001,963) $ 58,765,558
Interest 2,962,045
Securities lending, net 1,200,233
----------------
62,927,836
----------------
EXPENSES:
Management fees 44,284,993
Distribution fees:
B Class 154
C Class 6,649
Service fees:
B Class 51
C Class 2,216
Distribution and service fees:
A Class 229,243
R Class 14,096
Directors' fees and expenses 106,559
Other expenses 11,711
----------------
44,655,672
----------------
NET INVESTMENT INCOME (LOSS) 18,272,164
----------------
REALIZED AND UNREALIZED GAIN (LOSS)
Net realized gain (loss) on investment and foreign currency
transactions 728,695,749
Change in net unrealized appreciation (depreciation) on
investments and translation of assets and liabilities in
foreign currencies (1,841,590,735)
----------------
NET REALIZED AND UNREALIZED GAIN (LOSS) (1,112,894,986)
----------------
NET INCREASE (DECREASE) IN NET ASSETS RESULTING FROM OPERATIONS $(1,094,622,822)
================
See Notes to Financial Statements.
- ------
15
STATEMENT OF CHANGES IN NET ASSETS
SIX MONTHS ENDED APRIL 30, 2008 (UNAUDITED) AND YEAR ENDED OCTOBER 31, 2007
Increase (Decrease) in Net Assets 2008 2007
OPERATIONS
Net investment income (loss) $ 18,272,164 $ (4,015,646)
Net realized gain (loss) 728,695,749 3,112,565,031
Change in net unrealized appreciation
(depreciation) (1,841,590,735) (479,633,923)
--------------- ---------------
Net increase (decrease) in net assets
resulting from operations (1,094,622,822) 2,628,915,462
--------------- ---------------
DISTRIBUTIONS TO SHAREHOLDERS
From net realized gains:
Investor Class (2,312,270,157) (903,904,830)
Institutional Class (65,091,994) (69,893,181)
A Class (50,919,711) (26,545,325)
B Class (11,669) --
C Class (533,319) (210,990)
R Class (1,501,522) (578,901)
--------------- ---------------
Decrease in net assets from distributions (2,430,328,372) (1,001,133,227)
--------------- ---------------
CAPITAL SHARE TRANSACTIONS
Net increase (decrease) in net assets from
capital share transactions 1,297,028,370 (5,966,539,859)
--------------- ---------------
NET INCREASE (DECREASE) IN NET ASSETS (2,227,922,824) (4,338,757,624)
NET ASSETS
Beginning of period 10,634,136,480 14,972,894,104
--------------- ---------------
End of period $ 8,406,213,656 $10,634,136,480
=============== ===============
Undistributed net investment income $20,147,377 $1,874,213
=============== ===============
See Notes to Financial Statements.
- ------
16
NOTES TO FINANCIAL STATEMENTS
APRIL 30, 2008 (UNAUDITED)
1. ORGANIZATION AND SUMMARY OF SIGNIFICANT ACCOUNTING POLICIES
ORGANIZATION -- American Century Mutual Funds, Inc. (the corporation) is
registered under the Investment Company Act of 1940 (the 1940 Act) as an
open-end management investment company. Ultra Fund (the fund) is one fund in a
series issued by the corporation. The fund is diversified under the 1940 Act.
The fund's investment objective is to seek long-term capital growth. The fund
pursues this objective by investing primarily in equity securities of large
companies, but may invest in companies of any size. The following is a summary
of the fund's significant accounting policies.
MULTIPLE CLASS -- The fund is authorized to issue the Investor Class, the
Institutional Class, the A Class, the B Class, the C Class and the R Class.
The A Class may incur an initial sales charge. The A Class, the B Class, and
the C Class may be subject to a contingent deferred sales charge. The share
classes differ principally in their respective sales charges and distribution
and shareholder servicing expenses and arrangements. All shares of the fund
represent an equal pro rata interest in the net assets of the class to which
such shares belong, and have identical voting, dividend, liquidation and other
rights and the same terms and conditions, except for class specific expenses
and exclusive rights to vote on matters affecting only individual classes.
Income, non-class specific expenses, and realized and unrealized capital gains
and losses of the fund are allocated to each class of shares based on their
relative net assets. Sale of the B Class commenced on September 28, 2007.
SECURITY VALUATIONS -- Securities traded primarily on a principal securities
exchange are valued at the last reported sales price, or at the mean of the
latest bid and asked prices where no last sales price is available. Depending
on local convention or regulation, securities traded over-the-counter are
valued at the mean of the latest bid and asked prices, the last sales price,
or the official close price. Debt securities not traded on a principal
securities exchange are valued through a commercial pricing service or at the
mean of the most recent bid and asked prices. Discount notes may be valued
through a commercial pricing service or at amortized cost, which approximates
fair value. Securities traded on foreign securities exchanges and
over-the-counter markets are normally completed before the close of business
on days that the New York Stock Exchange (the Exchange) is open and may also
take place on days when the Exchange is not open. If an event occurs after the
value of a security was established but before the net asset value per share
was determined that was likely to materially change the net asset value, that
security would be valued as determined in accordance with procedures adopted
by the Board of Directors. If the fund determines that the market price of a
portfolio security is not readily available, or that the valuation methods
mentioned above do not reflect the security's fair value, such security is
valued as determined by the Board of Directors or its designee, in accordance
with procedures adopted by the Board of Directors, if such determination would
materially impact a fund's net asset value. Certain other circumstances may
cause the fund to use alternative procedures to value a security such as: a
security has been declared in default; trading in a security has been halted
during the trading day; or there is a foreign market holiday and no trading
will commence.
SECURITY TRANSACTIONS -- For financial reporting purposes, security
transactions are accounted for as of the trade date. Net realized gains and
losses are determined on the identified cost basis, which is also used for
federal income tax purposes.
INVESTMENT INCOME -- Dividend income less foreign taxes withheld, if any, is
recorded as of the ex-dividend date. Interest income is recorded on the
accrual basis and includes accretion of discounts and amortization of premiums.
SECURITIES ON LOAN -- The fund may lend portfolio securities through its
lending agent to certain approved borrowers in order to earn additional
income. The income earned, net of any rebates or fees, is included in the
Statement of Operations. The fund continues to recognize any gain or loss in
the market price of the securities loaned and records any interest earned or
dividends declared.
- ------
17
FOREIGN CURRENCY TRANSACTIONS -- All assets and liabilities initially
expressed in foreign currencies are translated into U.S. dollars at prevailing
exchange rates at period end. Purchases and sales of investment securities,
dividend and interest income, and certain expenses are translated at the rates
of exchange prevailing on the respective dates of such transactions. For
assets and liabilities, other than investments in securities, net realized and
unrealized gains and losses from foreign currency translations arise from
changes in currency exchange rates.
Net realized and unrealized foreign currency exchange gains or losses
occurring during the holding period of investment securities are a component
of realized gain (loss) on investment transactions and unrealized appreciation
(depreciation) on investments, respectively. Certain countries may impose
taxes on the contract amount of purchases and sales of foreign currency
contracts in their currency. The fund records the foreign tax expense, if any,
as a reduction to the net realized gain (loss) on foreign currency
transactions.
FORWARD FOREIGN CURRENCY EXCHANGE CONTRACTS -- The fund may enter into forward
foreign currency exchange contracts to facilitate transactions of securities
denominated in a foreign currency or to hedge the fund's exposure to foreign
currency exchange rate fluctuations. The net U.S. dollar value of foreign
currency underlying all contractual commitments held by the fund and the
resulting unrealized appreciation or depreciation are determined daily using
prevailing exchange rates. The fund bears the risk of an unfavorable change in
the foreign currency exchange rate underlying the forward contract.
Additionally, losses may arise if the counterparties do not perform under the
contract terms.
REPURCHASE AGREEMENTS -- The fund may enter into repurchase agreements with
institutions that American Century Investment Management, Inc. (ACIM) (the
investment advisor) has determined are creditworthy pursuant to criteria
adopted by the Board of Directors. Each repurchase agreement is recorded at
cost. The fund requires that the collateral, represented by securities,
received in a repurchase transaction be transferred to the custodian in a
manner sufficient to enable the fund to obtain those securities in the event
of a default under the repurchase agreement. ACIM monitors, on a daily basis,
the securities transferred to ensure the value, including accrued interest, of
the securities under each repurchase agreement is equal to or greater than
amounts owed to the fund under each repurchase agreement.
JOINT TRADING ACCOUNT -- Pursuant to an Exemptive Order issued by the
Securities and Exchange Commission, the fund, along with other registered
investment companies having management agreements with ACIM or American
Century Global Investment Management, Inc. (ACGIM), may transfer uninvested
cash balances into a joint trading account. These balances are invested in one
or more repurchase agreements that are collateralized by U.S. Treasury or
Agency obligations.
INCOME TAX STATUS -- It is the fund's policy to distribute substantially all
net investment income and net realized gains to shareholders and to otherwise
qualify as a regulated investment company under provisions of the Internal
Revenue Code. The fund is no longer subject to examination by tax authorities
for years prior to 2004. At this time, management has not identified any
uncertain tax positions for which it is reasonably possible that the total
amounts of unrecognized tax benefits will significantly change in the next
twelve months. Accordingly, no provision has been made for federal or state
income taxes. Interest and penalties associated with any federal or state
income tax obligations, if any, are recorded as interest expense.
DISTRIBUTIONS TO SHAREHOLDERS -- Distributions to shareholders are recorded on
the ex-dividend date. Distributions from net investment income and net
realized gains, if any, are generally declared and paid annually.
INDEMNIFICATIONS -- Under the corporation's organizational documents, its
officers and directors are indemnified against certain liabilities arising out
of the performance of their duties to the fund. In addition, in the normal
course of business, the fund enters into contracts that provide general
indemnifications. The fund's maximum exposure under these arrangements is
unknown as this would involve future claims that may be made against the fund.
The risk of material loss from such claims is considered by management to be
remote.
USE OF ESTIMATES -- The financial statements are prepared in conformity with
accounting principles generally accepted in the United States of America,
which may require management to make certain estimates and assumptions at the
date of the financial statements. Actual results could differ from these
estimates.
- ------
18
2. FEES AND TRANSACTIONS WITH RELATED PARTIES
MANAGEMENT FEES -- The corporation has entered into a Management Agreement
with ACIM, under which ACIM provides the fund with investment advisory and
management services in exchange for a single, unified management fee (the fee)
per class. The Agreement provides that all expenses of the fund, except
brokerage commissions, taxes, interest, fees and expenses of those directors
who are not considered "interested persons" as defined in the 1940 Act
(including counsel fees) and extraordinary expenses, will be paid by ACIM. The
fee is computed and accrued daily based on the daily net assets of each
specific class of shares of the fund and paid monthly in arrears. For funds
with a stepped fee schedule, the rate of the fee is determined by applying a
fee rate calculation formula. This formula takes into account all of the
investment advisor's assets under management in the fund's investment strategy
(strategy assets) to calculate the appropriate fee rate for the fund. The
strategy assets include the fund's assets and the assets of other clients of
the investment advisor that are not in the American Century family of funds,
but that have the same investment team and investment strategy. The annual
management fee schedule ranges from 0.80% to 1.00% for the Investor Class, A
Class, B Class, C Class and R Class. The Institutional Class is 0.20% less at
each point within the range. The effective annual management fee for each
class of the fund for the six months ended April 30, 2008 was 0.99% for the
Investor Class, A Class, B Class, C Class and R Class, and 0.79% for the
Institutional Class.
DISTRIBUTION AND SERVICE FEES -- The Board of Directors has adopted a separate
Master Distribution and Individual Shareholder Services Plan for each of the A
Class, B Class, C Class and R Class (collectively the plans), pursuant to Rule
12b-1 of the 1940 Act. The plans provide that the A Class will pay American
Century Investment Services, Inc. (ACIS) an annual distribution and service
fee of 0.25%. The plans provide that the B Class and the C Class will each pay
ACIS an annual distribution fee of 0.75% and service fee of 0.25%. The plans
provide that the R Class will pay ACIS an annual distribution and service fee
of 0.50%. The fees are computed and accrued daily based on each class's daily
net assets and paid monthly in arrears. The distribution fee provides
compensation for expenses incurred in connection with distributing shares of
the classes including, but not limited to, payments to brokers, dealers, and
financial institutions that have entered into sales agreements with respect to
shares of the fund. The service fee provides compensation for individual
shareholder services rendered by broker/dealers or other independent financial
intermediaries. Fees incurred under the plans during the six months ended
April 30, 2008, are detailed in the Statement of Operations.
RELATED PARTIES -- Certain officers and directors of the corporation are also
officers and/or directors, and, as a group, controlling stockholders of
American Century Companies, Inc. (ACC), the parent of the corporation's
investment advisor, ACIM, the distributor of the corporation, ACIS, and the
corporation's transfer agent, American Century Services, LLC.
The fund is eligible to invest in a money market fund for temporary purposes,
which is managed by J.P. Morgan Investment Management, Inc. (JPMIM). JPMIM is
a wholly owned subsidiary of JPMorgan Chase & Co. (JPM). JPM is an equity
investor in ACC. The fund has a securities lending agreement with JPMorgan
Chase Bank (JPMCB). Prior to December 12, 2007, the fund had a bank line of
credit agreement with JPMCB. JPMCB is a custodian of the fund and a wholly
owned subsidiary of JPM.
3. INVESTMENT TRANSACTIONS
Purchases and sales of investment securities, excluding short-term
investments, for the six months ended April 30, 2008, were $6,222,158,799 and
$7,339,726,134, respectively.
- ------
19
4. CAPITAL SHARE TRANSACTIONS
Transactions in shares of the fund were as follows:
Six months ended April 30, 2008 Year ended October 31, 2007(1)
Shares Amount Shares Amount
INVESTOR
CLASS/SHARES
AUTHORIZED 3,500,000,000 3,500,000,000
============= =============
Sold 9,788,489 $ 244,018,771 15,640,310 $ 449,268,460
Issued in
reinvestment of
distributions 91,021,431 2,229,114,850 31,578,213 862,400,995
Redeemed (41,353,602) (1,053,852,767) (218,773,176) (6,268,934,963)
------------- --------------- ------------- ----------------
59,456,318 1,419,280,854 (171,554,653) (4,957,265,508)
------------- --------------- ------------- ----------------
INSTITUTIONAL
CLASS/SHARES
AUTHORIZED 200,000,000 200,000,000
============= =============
Sold 1,138,670 28,471,102 5,102,384 149,551,045
Issued in
reinvestment of
distributions 2,567,071 64,151,093 2,452,199 67,876,857
Redeemed (8,445,238) (218,091,699) (35,145,354) (1,017,687,602)
------------- --------------- ------------- ----------------
(4,739,497) (125,469,504) (27,590,771) (800,259,700)
------------- --------------- ------------- ----------------
A CLASS/SHARES
AUTHORIZED 100,000,000 100,000,000
============= =============
Sold 1,018,371 24,625,139 1,553,608 44,553,790
Issued in
reinvestment of
distributions 2,076,111 49,536,018 961,764 25,823,362
Redeemed (2,880,008) (72,870,470) (9,767,093) (274,240,889)
------------- --------------- ------------- ----------------
214,474 1,290,687 (7,251,721) (203,863,737)
------------- --------------- ------------- ----------------
B CLASS/SHARES
AUTHORIZED 50,000,000 50,000,000
============= =============
Sold 772 24,250 790 25,000
Issued in
reinvestment of
distributions 478 11,669 -- --
Redeemed (82) (1,808) -- --
------------- --------------- ------------- ----------------
1,168 34,111 790 25,000
------------- --------------- ------------- ----------------
C CLASS/SHARES
AUTHORIZED 50,000,000 50,000,000
============= =============
Sold 15,284 334,603 7,068 191,037
Issued in
reinvestment of
distributions 22,734 513,343 7,494 194,552
Redeemed (29,154) (653,464) (69,636) (1,880,114)
------------- --------------- ------------- ----------------
8,864 194,482 (55,074) (1,494,525)
------------- --------------- ------------- ----------------
R CLASS/SHARES
AUTHORIZED 50,000,000 50,000,000
============= =============
Sold 77,064 1,926,896 81,270 2,326,954
Issued in
reinvestment of
distributions 56,879 1,354,849 20,532 551,893
Redeemed (66,225) (1,584,005) (236,741) (6,560,236)
------------- --------------- ------------- ----------------
67,718 1,697,740 (134,939) (3,681,389)
------------- --------------- ------------- ----------------
Net increase
(decrease) 55,009,045 $ 1,297,028,370 (206,586,368) $(5,966,539,859)
============= =============== ============= ================
(1) September 28, 2007 (commencement of sale) through October 31, 2007 for the
B Class.
5. SECURITIES LENDING
As of April 30, 2008, securities in the fund valued at $6,706,471 were on loan
through the lending agent, JPMCB, to certain approved borrowers. JPMCB
receives and maintains collateral in the form of cash and/or acceptable
securities as approved by ACIM. Cash collateral is invested in authorized
investments by the lending agent in a pooled account. The value of cash
collateral received at period end is disclosed in the Statement of Assets and
Liabilities and investments made with the cash by the lending agent are listed
in the Schedule of Investments. Any deficiencies or excess of collateral must
be delivered or transferred by the member firms no later than the close of
business on the next business day. The total market value of all collateral
received, at this date, was $6,888,960. The fund's risks in securities lending
are that the borrower may not provide additional collateral when required or
return the securities when due. If the borrower defaults, receipt of the
collateral by the fund may be delayed or limited.
- ------
20
6. BANK LINE OF CREDIT
Effective December 12, 2007, the fund, along with certain other funds managed
by ACIM or ACGIM, has a $500,000,000 unsecured bank line of credit agreement
with Bank of America, N.A. Prior to December 12, 2007, the fund, along with
certain other funds managed by ACIM or ACGIM, had a $500,000,000 unsecured
bank line of credit agreement with JPMCB. The fund may borrow money for
temporary or emergency purposes to fund shareholder redemptions. Borrowings
under the agreement, which is subject to annual renewal, bear interest at the
Federal Funds rate plus 0.40%. The fund did not borrow from the line during
the six months ended April 30, 2008.
7. RISK FACTORS
There are certain risks involved in investing in foreign securities. These
risks include those resulting from future adverse political, social, and
economic developments, fluctuations in currency exchange rates, the possible
imposition of exchange controls, and other foreign laws or restrictions.
8. FEDERAL TAX INFORMATION
The book-basis character of distributions made during the year from net
investment income or net realized gains may differ from their ultimate
characterization for federal income tax purposes. These differences reflect
the differing character of certain income items and net realized gains and
losses for financial statement and tax purposes, and may result in
reclassification among certain capital accounts on the financial statements.
As of April 30, 2008, the components of investments for federal income tax
purposes were as follows:
Federal tax cost of investments $7,459,343,269
==============
Gross tax appreciation of investments $1,229,408,651
Gross tax depreciation of investments (209,274,152)
--------------
Net tax appreciation (depreciation) of investments $1,020,134,499
==============
The difference between book-basis and tax-basis cost and unrealized
appreciation (depreciation) is attributable primarily to the tax deferral of
losses on wash sales.
9. RECENTLY ISSUED ACCOUNTING STANDARDS
The Financial Accounting Standards Board (FASB) issued Statement of Financial
Accounting Standards No. 157, "Fair Value Measurements" (FAS 157), in
September 2006, which is effective for fiscal years beginning after November
15, 2007. FAS 157 defines fair value, establishes a framework for measuring
fair value and expands the required financial statement disclosures about fair
value measurements. Management is currently evaluating the impact that
adopting FAS 157 will have on the financial statement disclosures.
In March 2008, the FASB issued Statement of Financial Accounting Standards No.
161, "Disclosures about Derivative Instruments and Hedging Activities -- an
amendment of FASB Statement No. 133" (FAS 161). FAS 161 is effective for
fiscal years beginning after November 15, 2008. FAS 161 amends and expands
disclosures about derivative instruments and hedging activities. FAS 161
requires qualitative disclosures about the objectives and strategies of
derivative instruments, quantitative disclosures about the fair value amounts
of and gains and losses on derivative instruments, and disclosures of
credit-risk-related contingent features in hedging activities. Management is
currently evaluating the impact that adopting FAS 161 will have on the
financial statement disclosures.
- ------
21
FINANCIAL HIGHLIGHTS
Ultra
Investor Class
For a Share Outstanding Throughout the Years Ended October 31 (except as noted)
2008(1) 2007 2006 2005 2004 2003
PER-SHARE DATA
Net Asset Value,
Beginning of Period $33.48 $28.55 $29.02 $27.17 $26.01 $21.83
------ ------ ------ ------ ------ ------
Income From
Investment Operations
Net Investment
Income (Loss)(2) 0.05 (0.01) (0.06) 0.02 (0.05) (0.02)
Net Realized and
Unrealized Gain
(Loss) (3.03) 6.95 (0.37) 1.83 1.21 4.26
------ ------ ------ ------ ------ ------
Total From
Investment
Operations (2.98) 6.94 (0.43) 1.85 1.16 4.24
------ ------ ------ ------ ------ ------
Distributions
From Net
Investment Income -- -- (0.04) -- -- (0.06)
From Net Realized
Gains (7.94) (2.01) -- -- -- --
------ ------ ------ ------ ------ ------
Total
Distributions (7.94) (2.01) (0.04) -- -- (0.06)
------ ------ ------ ------ ------ ------
Net Asset Value, End
of Period $22.56 $33.48 $28.55 $29.02 $27.17 $26.01
====== ====== ====== ====== ====== ======
TOTAL RETURN(3) (10.73)% 25.89% (1.51)% 6.81% 4.46% 19.50%
RATIOS/SUPPLEMENTAL DATA
Ratio of Operating
Expenses to Average
Net Assets 0.99%(4) 0.99% 0.99% 0.99% 0.99% 1.00%
Ratio of Net
Investment Income
(Loss) to Average Net
Assets 0.41%(4) (0.04)% (0.15)% 0.09% (0.20)% (0.09)%
Portfolio Turnover
Rate 70% 93% 62% 33% 34% 82%
Net Assets, End of
Period (in millions) $8,126 $10,066 $13,482 $18,904 $20,708 $21,341
(1) Six months ended April 30, 2008 (unaudited).
(2) Computed using average shares outstanding throughout the period.
(3) Total return assumes reinvestment of net investment income and capital
gains distributions, if any. Total returns for periods less than one year are
not annualized. The total return of the classes may not precisely reflect the
class expense differences because of the impact of calculating the net asset
value to two decimal places. If net asset values were calculated to three
decimal places, the total return differences would more closely reflect the
class expense differences. The calculation of net asset values to two decimal
places is made in accordance with SEC guidelines and does not result in any
gain or loss of value between one class and another.
(4) Annualized.
See Notes to Financial Statements.
- ------
22
Ultra
Institutional Class
For a Share Outstanding Throughout the Years Ended October 31 (except as noted)
2008(1) 2007 2006 2005 2004 2003
PER-SHARE DATA
Net Asset Value,
Beginning of
Period $33.98 $28.90 $29.38 $27.44 $26.22 $22.02
------ ------ ------ ------ ------ ------
Income From
Investment
Operations
Net
Investment
Income
(Loss)(2) 0.09 0.05 --(3) 0.07 --(3) 0.02
Net Realized
and
Unrealized
Gain (Loss) (3.09) 7.04 (0.38) 1.87 1.22 4.29
------ ------ ------ ------ ------ ------
Total From
Investment
Operations (3.00) 7.09 (0.38) 1.94 1.22 4.31
------ ------ ------ ------ ------ ------
Distributions
From Net
Investment
Income -- -- (0.10) -- -- (0.11)
From Net
Realized
Gains (7.94) (2.01) -- -- -- --
------ ------ ------ ------ ------ ------
Total
Distributions (7.94) (2.01) (0.10) -- -- (0.11)
------ ------ ------ ------ ------ ------
Net Asset Value,
End of Period $23.04 $33.98 $28.90 $29.38 $27.44 $26.22
====== ====== ====== ====== ====== ======
TOTAL RETURN(4) (10.64)% 26.14% (1.33)% 7.07% 4.65% 19.66%
RATIOS/SUPPLEMENTAL DATA
Ratio of
Operating
Expenses to
Average Net Assets 0.79%(5) 0.79% 0.79% 0.79% 0.79% 0.80%
Ratio of Net
Investment Income
(Loss) to Average
Net Assets 0.61%(5) 0.16% 0.05% 0.29% 0.00% 0.11%
Portfolio
Turnover Rate 70% 93% 62% 33% 34% 82%
Net Assets, End
of Period (in
thousands) $111,174 $325,035 $1,073,767 $1,460,343 $1,055,145 $822,333
(1) Six months ended April 30, 2008 (unaudited).
(2) Computed using average shares outstanding throughout the period.
(3) Per-share amount was less than $0.005.
(4) Total return assumes reinvestment of net investment income and capital
gains distributions, if any. Total returns for periods less than one year are
not annualized. The total return of the classes may not precisely reflect the
class expense differences because of the impact of calculating the net asset
value to two decimal places. If net asset values were calculated to three
decimal places, the total return differences would more closely reflect the
class expense differences. The calculation of net asset values to two decimal
places is made in accordance with SEC guidelines and does not result in any
gain or loss of value between one class and another.
(5) Annualized.
See Notes to Financial Statements.
- ------
23
Ultra
A Class(1)
For a Share Outstanding Throughout the Years Ended October 31 (except as noted)
2008(2) 2007 2006 2005 2004 2003
PER-SHARE DATA
Net Asset Value,
Beginning of
Period $32.83 $28.11 $28.61 $26.85 $25.77 $21.62
------ ------ ------ ------ ------ ------
Income From
Investment
Operations
Net
Investment
Income
(Loss)(3) 0.02 (0.08) (0.13) (0.05) (0.12) (0.08)
Net Realized
and
Unrealized
Gain (Loss) (2.95) 6.81 (0.37) 1.81 1.20 4.24
------ ------ ------ ------ ------ ------
Total From
Investment
Operations (2.93) 6.73 (0.50) 1.76 1.08 4.16
------ ------ ------ ------ ------ ------
Distributions
From Net
Investment
Income -- -- -- -- -- (0.01)
From Net
Realized
Gains (7.94) (2.01) -- -- -- --
------ ------ ------ ------ ------ ------
Total
Distributions (7.94) (2.01) -- -- -- (0.01)
------ ------ ------ ------ ------ ------
Net Asset Value,
End of Period $21.96 $32.83 $28.11 $28.61 $26.85 $25.77
====== ====== ====== ====== ====== ======
TOTAL RETURN(4) (10.83)% 25.56% (1.75)% 6.55% 4.19% 19.24%
RATIOS/SUPPLEMENTAL DATA
Ratio of
Operating
Expenses to
Average Net
Assets 1.24%(5) 1.24% 1.24% 1.24% 1.24% 1.25%
Ratio of Net
Investment
Income (Loss) to
Average Net
Assets 0.16%(5) (0.29)% (0.40)% (0.16)% (0.45)% (0.34)%
Portfolio
Turnover Rate 70% 93% 62% 33% 34% 82%
Net Assets, End
of Period (in
thousands) $162,045 $235,217 $405,173 $639,792 $738,032 $643,144
(1) Prior to September 4, 2007, the A Class was referred to as the Advisor
Class.
(2) Six months ended April 30, 2008 (unaudited).
(3) Computed using average shares outstanding throughout the period.
(4) Total return assumes reinvestment of net investment income and capital
gains distributions, if any, and does not reflect applicable sales charges.
Total returns for periods less than one year are not annualized. The total
return of the classes may not precisely reflect the class expense differences
because of the impact of calculating the net asset value to two decimal
places. If net asset values were calculated to three decimal places, the total
return differences would more closely reflect the class expense differences.
The calculation of net asset values to two decimal places is made in
accordance with SEC guidelines and does not result in any gain or loss of
value between one class and another.
(5) Annualized.
See Notes to Financial Statements.
- ------
24
Ultra
B Class
For a Share Outstanding Throughout the Periods Indicated
2008(1) 2007(2)
PER-SHARE DATA
Net Asset Value, Beginning of Period $33.45 $31.63
------ ------
Income From Investment Operations
Net Investment Income (Loss)(3) (0.08) (0.04)
Net Realized and Unrealized Gain (Loss) (3.01) 1.86
------ ------
Total From Investment Operations (3.09) 1.82
------ ------
Distributions
From Net Realized Gains (7.94) --
------ ------
Net Asset Value, End of Period $22.42 $33.45
====== ======
TOTAL RETURN(4) (11.15)% 5.75%
RATIOS/SUPPLEMENTAL DATA
Ratio of Operating Expenses to Average Net Assets 1.99%(5) 1.99%(5)
Ratio of Net Investment Income (Loss) to Average Net
Assets (0.59)%(5) (1.53)%(5)
Portfolio Turnover Rate 70% 93%(6)
Net Assets, End of Period (in thousands) $44 $26
(1) Six months ended April 30, 2008 (unaudited).
(2) September 28, 2007 (commencement of sale) through October 31, 2007.
(3) Computed using average shares outstanding throughout the period.
(4) Total return assumes reinvestment of net investment income and capital
gains distributions, if any, and does not reflect applicable sales charges.
Total returns for periods less than one year are not annualized. The total
return of the classes may not precisely reflect the class expense differences
because of the impact of calculating the net asset value to two decimal
places. If net asset values were calculated to three decimal places, the total
return differences would more closely reflect the class expense differences.
The calculation of net asset values to two decimal places is made in
accordance with SEC guidelines and does not result in any gain or loss of
value between one class and another.
(5) Annualized.
(6) Portfolio turnover is calculated at the fund level. Percentage indicated
was calculated for the year ended October 31, 2007.
See Notes to Financial Statements.
- ------
25
Ultra
C Class
For a Share Outstanding Throughout the Years Ended October 31 (except as noted)
2008(1) 2007 2006 2005 2004 2003
PER-SHARE DATA
Net Asset Value,
Beginning of Period $31.54 $27.26 $27.96 $26.44 $25.57 $21.59
------ ------ ------ ------ ------ ------
Income From
Investment
Operations
Net Investment
Income
(Loss)(2) (0.07) (0.29) (0.34) (0.26) (0.32) (0.26)
Net Realized
and Unrealized
Gain (Loss) (2.81) 6.58 (0.36) 1.78 1.19 4.24
------ ------ ------ ------ ------ ------
Total From
Investment
Operations (2.88) 6.29 (0.70) 1.52 0.87 3.98
------ ------ ------ ------ ------ ------
Distributions
From Net
Realized Gains (7.94) (2.01) -- -- -- --
------ ------ ------ ------ ------ ------
Net Asset Value,
End of Period $20.72 $31.54 $27.26 $27.96 $26.44 $25.57
====== ====== ====== ====== ====== ======
TOTAL RETURN(3) (11.16)% 24.64% (2.50)% 5.75% 3.40% 18.43%
RATIOS/SUPPLEMENTAL DATA
Ratio of Operating
Expenses to Average
Net Assets 1.99%(4) 1.99% 1.99% 1.99% 1.99% 2.00%
Ratio of Net
Investment Income
(Loss) to Average
Net Assets (0.59)%(4) (1.04)% (1.15)% (0.91)% (1.20)% (1.09)%
Portfolio Turnover
Rate 70% 93% 62% 33% 34% 82%
Net Assets, End of
Period (in
thousands) $1,583 $2,129 $3,342 $5,601 $4,836 $2,232
(1) Six months ended April 30, 2008 (unaudited).
(2) Computed using average shares outstanding throughout the period.
(3) Total return assumes reinvestment of net investment income and capital
gains distributions, if any, and does not reflect applicable sales charges.
Total returns for periods less than one year are not annualized. The total
return of the classes may not precisely reflect the class expense differences
because of the impact of calculating the net asset value to two decimal
places. If net asset values were calculated to three decimal places, the total
return differences would more closely reflect the class expense differences.
The calculation of net asset values to two decimal places is made in
accordance with SEC guidelines and does not result in any gain or loss of
value between one class and another.
(4) Annualized.
See Notes to Financial Statements.
- ------
26
Ultra
R Class
For a Share Outstanding Throughout the Years Ended October 31 (except as noted)
2008(1) 2007 2006 2005 2004 2003(2)
PER-SHARE DATA
Net Asset
Value,
Beginning of
Period $32.80 $28.15 $28.72 $27.01 $25.99 $24.87
------ ------ ------ ------ ------ ------
Income From
Investment
Operations
Net
Investment
Income
(Loss)(3) (0.01) (0.15) (0.21) (0.12) (0.22) (0.04)
Net Realized
and
Unrealized
Gain (Loss) (2.95) 6.81 (0.36) 1.83 1.24 1.16
------ ------ ------ ------ ------ ------
Total From
Investment
Operations (2.96) 6.66 (0.57) 1.71 1.02 1.12
------ ------ ------ ------ ------ ------
Distributions
From Net
Realized
Gains (7.94) (2.01) -- -- -- --
------ ------ ------ ------ ------ ------
Net Asset
Value, End of
Period $21.90 $32.80 $28.15 $28.72 $27.01 $25.99
====== ====== ====== ====== ====== ======
TOTAL RETURN(4) (10.96)% 25.26% (1.98)% 6.33% 3.92% 4.50%
RATIOS/SUPPLEMENTAL DATA
Ratio of
Operating
Expenses to
Average Net
Assets 1.49%(5) 1.49% 1.49% 1.44%(6) 1.49% 1.50%(5)
Ratio of Net
Investment
Income (Loss)
to Average Net
Assets (0.09)%(5) (0.54)% (0.65)% (0.36)%(6) (0.70)% (0.81)%(5)
Portfolio
Turnover Rate 70% 93% 62% 33% 34% 82%(7)
Net Assets, End
of Period (in
thousands) $5,470 $5,971 $8,922 $8,367 $4,545 $3
(1) Six months ended April 30, 2008 (unaudited).
(2) August 29, 2003 (commencement of sale) through October 31, 2003.
(3) Computed using average shares outstanding throughout the period.
(4) Total return assumes reinvestment of net investment income and capital
gains distributions, if any. Total returns for periods less than one year are
not annualized. The total return of the classes may not precisely reflect the
class expense differences because of the impact of calculating the net asset
value to two decimal places. If net asset values were calculated to three
decimal places, the total return differences would more closely reflect the
class expense differences. The calculation of net asset values to two decimal
places is made in accordance with SEC guidelines and does not result in any
gain or loss of value between one class and another.
(5) Annualized.
(6) During the year ended October 31, 2005, the class received a partial
reimbursement of its distribution and service fee. Had fees not been
reimbursed the ratio of operating expenses to average net assets and ratio of
net investment income (loss) to average net assets would have been 1.49% and
(0.41)%, respectively.
(7) Portfolio turnover is calculated at the fund level. Percentage indicated
was calculated for the year ended October 31, 2003.
See Notes to Financial Statements.
- ------
27
ADDITIONAL INFORMATION
RETIREMENT ACCOUNT INFORMATION
As required by law, any distributions you receive from an IRA or certain
403(b), 457 and qualified plans [those not eligible for rollover to an IRA or
to another qualified plan] are subject to federal income tax withholding,
unless you elect not to have withholding apply. Tax will be withheld on the
total amount withdrawn even though you may be receiving amounts that are not
subject to withholding, such as nondeductible contributions. In such case,
excess amounts of withholding could occur. You may adjust your withholding
election so that a greater or lesser amount will be withheld.
If you don't want us to withhold on this amount, you must notify us to not
withhold the federal income tax. Even if you plan to roll over the amount you
withdraw to another tax-deferred account, the withholding rate still applies
to the withdrawn amount unless we have received notice not to withhold federal
income tax prior to the withdrawal. You may notify us in writing or in certain
situations by telephone or through other electronic means. You have the right
to revoke your withholding election at any time and any election you make may
remain in effect until revoked by filing a new election.
Remember, even if you elect not to have income tax withheld, you are liable
for paying income tax on the taxable portion of your withdrawal. If you elect
not to have income tax withheld or you don't have enough income tax withheld,
you may be responsible for payment of estimated tax. You may incur penalties
under the estimated tax rules if your withholding and estimated tax payments
are not sufficient.
State tax will be withheld if, at the time of your distribution, your address
is within one of the mandatory withholding states and you have federal income
tax withheld. State taxes will be withheld from your distribution in
accordance with the respective state rules.
PROXY VOTING GUIDELINES
American Century Investment Management, Inc., the fund's investment advisor,
is responsible for exercising the voting rights associated with the securities
purchased and/or held by the fund. A description of the policies and
procedures the advisor uses in fulfilling this responsibility is available
without charge, upon request, by calling 1-800-345-2021. It is also available
on American Century Investments' website at americancentury.com and on the
Securities and Exchange Commission's website at sec.gov. Information regarding
how the investment advisor voted proxies relating to portfolio securities
during the most recent 12-month period ended June 30 is available on the
"About Us" page at americancentury.com. It is also available at sec.gov.
QUARTERLY PORTFOLIO DISCLOSURE
The fund files its complete schedule of portfolio holdings with the Securities
and Exchange Commission (SEC) for the first and third quarters of each fiscal
year on Form N-Q. The fund's Form N-Q is available on the SEC's website at
sec.gov, and may be reviewed and copied at the SEC's Public Reference Room in
Washington, DC. Information on the operation of the Public Reference Room may
be obtained by calling 1-800-SEC-0330. The fund also makes its complete
schedule of portfolio holdings for the most recent quarter of its fiscal year
available on its website at americancentury.com and, upon request, by calling
1-800-345-2021.
- ------
28
INDEX DEFINITIONS
The following indices are used to illustrate investment market, sector, or
style performance or to serve as fund performance comparisons. They are not
investment products available for purchase.
The RUSSELL 1000® INDEX is a market-capitalization weighted, large-cap index
created by Frank Russell Company to measure the performance of the 1,000
largest of the 3,000 largest publicly traded U.S. companies, based on total
market capitalization.
The RUSSELL 1000® GROWTH INDEX measures the performance of those Russell 1000
Index companies (the 1,000 largest of the 3,000 largest publicly traded U.S.
companies, based on total market capitalization) with higher price-to-book
ratios and higher forecasted growth values.
The RUSSELL 1000® VALUE INDEX measures the performance of those Russell 1000
Index companies (the 1,000 largest of the 3,000 largest publicly traded U.S.
companies, based on total market capitalization) with lower price-to-book
ratios and lower forecasted growth values.
The RUSSELL 2000® INDEX is a market-capitalization weighted index created by
Frank Russell Company to measure the performance of the 2,000 smallest of the
3,000 largest publicly traded U.S. companies, based on total market
capitalization.
The RUSSELL 2000® GROWTH INDEX measures the performance of those Russell 2000
Index companies (the 2,000 smallest of the 3,000 largest publicly traded U.S.
companies, based on total market capitalization) with higher price-to-book
ratios and higher forecasted growth values.
The RUSSELL 2000® VALUE INDEX measures the performance of those Russell 2000
Index companies (the 2,000 smallest of the 3,000 largest publicly traded U.S.
companies, based on total market capitalization) with lower price-to-book
ratios and lower forecasted growth values.
The RUSSELL MIDCAP® INDEX measures the performance of the 800 smallest of the
1,000 largest publicly traded U.S. companies, based on total market
capitalization.
The RUSSELL MIDCAP® GROWTH INDEX measures the performance of those Russell
Midcap Index companies (the 800 smallest of the 1,000 largest publicly traded
U.S. companies, based on total market capitalization) with higher
price-to-book ratios and higher forecasted growth values.
The RUSSELL MIDCAP® VALUE INDEX measures the performance of those Russell
Midcap Index companies (the 800 smallest of the 1,000 largest publicly traded
U.S. companies, based on total market capitalization) with lower price-to-book
ratios and lower forecasted growth values.
The S&P 500 INDEX is a market value-weighted index of the stocks of 500
publicly traded U.S. companies chosen for market size, liquidity, and industry
group representation that are considered to be leading firms in dominant
industries. Each stock's weight in the index is proportionate to its market
value. Created by Standard & Poor's, it is considered to be a broad measure of
U.S. stock market performance.
- ------
29
NOTES
- ------
30
NOTES
- ------
31
NOTES
- ------
32
[back cover]
[american century investments logo and text logo ®]
CONTACT US
AMERICANCENTURY.COM
AUTOMATED INFORMATION LINE. . . . . . . . . . . . . . . . . 1-800-345-8765
INVESTOR SERVICES REPRESENTATIVE. . . . . . . . . . . . . . 1-800-345-2021 or
816-531-5575
INVESTORS USING ADVISORS. . . . . . . . . . . . . . . . . . 1-800-378-9878
BUSINESS, NOT-FOR-PROFIT, EMPLOYER-SPONSORED RETIREMENT PLANS .
.. . . . . . . . . . . . . . . . . . . . . . . . . . 1-800-345-3533
BANKS AND TRUST COMPANIES, BROKER-DEALERS,
FINANCIAL PROFESSIONALS, INSURANCE COMPANIES. . . . . . . . 1-800-345-6488
TELECOMMUNICATIONS DEVICE FOR THE DEAF. . . . . . . . . . . 1-800-634-4113
AMERICAN CENTURY MUTUAL FUNDS, INC.
INVESTMENT ADVISOR:
American Century Investment Management, Inc.
Kansas City, Missouri
This report and the statements it contains are submitted for the general
information of our shareholders. The report is not authorized for distribution to
prospective investors unless preceded or accompanied by an effective prospectus.
American Century Investments
P.O. Box 419200
Kansas City, MO 64141-6200
PRSRT STD
U.S. POSTAGE PAID
AMERICAN CENTURY
COMPANIES
American Century Investment Services, Inc., Distributor
©2008 American Century Proprietary Holdings, Inc. All rights reserved.
0806
CL-SAN-60502S
[front cover]
SEMIANNUAL REPORT
APRIL 30, 2008
[american century investments logo and text logo ®]
AMERICAN CENTURY INVESTMENTS
GROWTH FUND
VISTA(SM) FUND
PRESIDENT'S LETTER
JONATHAN THOMAS
[photo of Jonathan Thomas]
Dear Investor,
At American Century Investments®, we are committed to helping you reach your
financial goals. Your success is the ultimate measure of our performance.
That's why we focus on achieving superior investment results and building
long-term relationships with investors like you.
Part of that relationship is to clearly communicate investment results and
what influenced them. To help you monitor your investment with us, we take
pride in providing you with the semiannual report for the American Century®
Growth and Vista funds for the six months ended April 30, 2008. We also
recommend americancentury.com, where we provide company news, quarterly
portfolio commentaries, investment views, and other useful information.
As noted on the website, 2008 marks the 50th anniversary of American Century
Investments. Since 1958, we've worked to make wise decisions with your
interests as our guide. Fifty years also means that we've met the challenges
of previous economic downturns. As we've crossed those hurdles and earned your
trust, our assets under management have grown to nearly $100 billion, putting
us in the top 5% of our industry. This growth has given us the resources to
offer a wide array of financial products and services, including a
well-diversified line-up of portfolios that provide you with many choices in
these uncertain times.
Though our offerings are diverse, they share several key qualities, including
our disciplined investment approach and active, team-based management. Strict
adherence to our processes and long-term strategies allows us to stay focused
during volatile periods. Investors in our portfolios also benefit from the sum
of our investment teams' expertise as they share research and information.
We'll continue to work hard to earn your trust. Thank you for your continued
support.
Sincerely,
/s/Jonathan S. Thomas
Jonathan S. Thomas
President and Chief Executive Officer
American Century Investments
TABLE OF CONTENTS
Market Perspective . . . . . . . . . . . . . . . . . . . . . . . . . 2
U.S. Stock Index Returns. . . . . . . . . . . . . . . . . . . . . . 2
GROWTH
Performance. . . . . . . . . . . . . . . . . . . . . . . . . . . . . 3
Portfolio Commentary . . . . . . . . . . . . . . . . . . . . . . . . 5
Top Ten Holdings. . . . . . . . . . . . . . . . . . . . . . . . . . 5
Top Five Industries . . . . . . . . . . . . . . . . . . . . . . . . 6
Types of Investments in Portfolio . . . . . . . . . . . . . . . . . 6
Schedule of Investments. . . . . . . . . . . . . . . . . . . . . . . 7
VISTA
Performance. . . . . . . . . . . . . . . . . . . . . . . . . . . . . 10
Portfolio Commentary . . . . . . . . . . . . . . . . . . . . . . . . 12
Top Ten Holdings. . . . . . . . . . . . . . . . . . . . . . . . . . 12
Top Five Industries . . . . . . . . . . . . . . . . . . . . . . . . 13
Types of Investments in Portfolio . . . . . . . . . . . . . . . . . 13
Schedule of Investments. . . . . . . . . . . . . . . . . . . . . . . 14
Shareholder Fee Examples . . . . . . . . . . . . . . . . . . . . . . 17
FINANCIAL STATEMENTS
Statement of Assets and Liabilities. . . . . . . . . . . . . . . . . 19
Statement of Operations. . . . . . . . . . . . . . . . . . . . . . . 21
Statement of Changes in Net Assets . . . . . . . . . . . . . . . . . 22
Notes to Financial Statements. . . . . . . . . . . . . . . . . . . . 23
Financial Highlights . . . . . . . . . . . . . . . . . . . . . . . . 29
OTHER INFORMATION
Additional Information . . . . . . . . . . . . . . . . . . . . . . . 37
Index Definitions. . . . . . . . . . . . . . . . . . . . . . . . . . 38
The opinions expressed in the Market Perspective and each of the Portfolio
Commentaries reflect those of the portfolio management team as of the date of
the report, and do not necessarily represent the opinions of American Century
or any other person in the American Century organization. Any such opinions
are subject to change at any time based upon market or other conditions and
American Century disclaims any responsibility to update such opinions. These
opinions may not be relied upon as investment advice and, because investment
decisions made by American Century funds are based on numerous factors, may
not be relied upon as an indication of trading intent on behalf of any
American Century fund. Security examples are used for representational
purposes only and are not intended as recommendations to purchase or sell
securities. Performance information for comparative indices and securities is
provided to American Century by third party vendors. To the best of American
Century's knowledge, such information is accurate at the time of printing.
MARKET PERSPECTIVE
[photo of Chief Investment Officer]
By Steve Lurito, Chief Investment Officer, U.S. Growth Equity
VOLATILITY UP, STOCKS DOWN
The six months ended April 30, 2008 saw stocks produce negative returns as
market volatility surged in the wake of the subprime credit crisis. In terms
of the economy, tighter credit and the slumping housing market hurt consumer
spending and confidence, leading many economists to suggest we're already in
recession. Meanwhile, mounting losses hurt the banks, brokers, and other big
institutional players important for the functioning of the financial markets.
Facing dual economic and financial crises, the Federal Reserve (the Fed) took
a series of extraordinary steps, slashing interest rates and acting as a
lender of last resort not only for banks, but also major brokers. That helped
stocks rebound, with many analysts suggesting that the mid-March buy-out of
investment bank Bear Stearns--in a deal arranged by the Fed--put a floor under
the market.
RETURNS BY SIZE, STYLE MIXED
Performance by size and style was mixed (see the accompanying table),
reflecting the volatile trading during the period, when corporate earnings
estimates were revised down sharply. Looking at returns by sector, energy
shares were the only segment to produce positive results during the six
months. At the other end of the spectrum, credit-related losses took a big
bite out of earnings for financials stocks, which performed worst. Consumer
discretionary shares also lagged badly, as did information technology stocks,
which suffered from poor pricing and demand trends for chips and some
consumer-related tech goods.
OPPORTUNITY AMID VOLATILITY
Despite the uncertainty surrounding the economy, we think growth-oriented
stocks can perform well relative to value as proven earnings growth becomes
scarce during economic slowdowns. And while we don't see an end to market
volatility anytime soon, we view this dynamic as a natural part of the
investing cycle--and one that presents us with opportunities to build
positions in what we believe are high-quality companies trading at attractive
prices. Indeed, investors should rest assured that we're finding no shortage
of companies demonstrating sustained earnings growth and business improvement.
U.S. Stock Index Returns
For the six months ended April 30, 2008*
RUSSELL 1000 INDEX (LARGE-CAP) -9.54%
Russell 1000 Growth Index -9.28%
Russell 1000 Value Index -9.83%
RUSSELL MIDCAP INDEX -8.77%
Russell Midcap Growth Index -8.44%
Russell Midcap Value Index -9.20%
RUSSELL 2000 INDEX (SMALL-CAP) -12.92%
Russell 2000 Growth Index -14.14%
Russell 2000 Value Index -11.55%
* Total returns for periods less than one year are not annualized.
- ------
2
PERFORMANCE
Growth
Total Returns as of April 30, 2008
Average Annual Returns
6 1 5 10 Since Inception
months(1) year years years Inception Date
INVESTOR CLASS -6.11% 7.31% 10.82% 3.52% 14.49% 6/30/71(2)
RUSSELL 1000
GROWTH INDEX(3) -9.28% -0.23% 9.52% 1.66% N/A(4) --
Institutional Class -6.06% 7.50% 11.03% 3.73% 5.86% 6/16/97
Advisor Class -6.22% 7.06% 10.55% 3.24% 5.89% 6/4/97
R Class -6.37% 6.79% -- -- 8.92% 8/29/03
(1) Total returns for periods less than one year are not annualized.
(2) Although the fund's actual inception date was 10/31/58, this inception
date corresponds with the investment advisor's implementation of its current
investment philosophy and practices.
(3) Data provided by Lipper Inc. -- A Reuters Company. ©2008 Reuters. All
rights reserved. Any copying, republication or redistribution of Lipper
content, including by caching, framing or similar means, is expressly
prohibited without the prior written consent of Lipper. Lipper shall not be
liable for any errors or delays in the content, or for any actions taken in
reliance thereon.
Lipper Fund Performance -- Performance data is total return and is
preliminary and subject to revision.
The data contained herein has been obtained from company reports, financial
reporting services, periodicals and other resources believed to be reliable.
Although carefully verified, data on compilations is not guaranteed by Lipper
and may be incomplete. No offer or solicitations to buy or sell any of the
securities herein is being made by Lipper.
(4) Benchmark began 12/29/78.
Data presented reflect past performance. Past performance is no guarantee of
future results. Current performance may be higher or lower than the
performance shown. Investment return and principal value will fluctuate, and
redemption value may be more or less than original cost. To obtain performance
data current to the most recent month end, please call 1-800-345-2021 or visit
americancentury.com.
Unless otherwise indicated, performance reflects Investor Class shares;
performance for other share classes will vary due to differences in fee
structure. For information about other share classes available, please consult
the prospectus. Data assumes reinvestment of dividends and capital gains, and
none of the charts reflect the deduction of taxes that a shareholder would pay
on fund distributions or the redemption of fund shares. Returns for the index
are provided for comparison. The fund's total returns include operating
expenses (such as transaction costs and management fees) that reduce returns,
while the total returns of the index do not.
- ------
3
Growth
Growth of $10,000 Over 10 Years
$10,000 investment made April 30, 1998
One-Year Returns Over 10 Years
Periods ended April 30
1999 2000 2001 2002 2003 2004 2005 2006 2007 2008
Investor
Class 24.48% 32.16% -27.72% -15.05% -16.33% 17.74% 4.99% 13.10% 11.49% 7.31%
Russell
1000
Growth
Index 26.53% 27.58% -32.25% -20.10% -14.35% 21.65% 0.40% 15.18% 12.25% -0.23%
Data presented reflect past performance. Past performance is no guarantee of
future results. Current performance may be higher or lower than the
performance shown. Investment return and principal value will fluctuate, and
redemption value may be more or less than original cost. To obtain performance
data current to the most recent month end, please call 1-800-345-2021 or visit
americancentury.com.
Unless otherwise indicated, performance reflects Investor Class shares;
performance for other share classes will vary due to differences in fee
structure. For information about other share classes available, please consult
the prospectus. Data assumes reinvestment of dividends and capital gains, and
none of the charts reflect the deduction of taxes that a shareholder would pay
on fund distributions or the redemption of fund shares. Returns for the index
are provided for comparison. The fund's total returns include operating
expenses (such as transaction costs and management fees) that reduce returns,
while the total returns of the index do not.
- ------
4
PORTFOLIO COMMENTARY
Growth
Portfolio Managers: Greg Woodhams and Prescott LeGard
PERFORMANCE SUMMARY
Growth returned -6.11%* during the six months ended April 30, 2008. By
comparison, the Russell 1000 Growth Index and Lipper Large-Cap Growth Funds
category average returned -9.28% and -10.15%,** respectively. Better measures
of the portfolio's performance are its longer-term results compared with the
index, which can be seen on page 3.
Overall, performance was driven by holdings in the energy sector; materials
and consumer staples also made positive contributions. Information technology
holdings were the leading detractors. In terms of Growth's performance
relative to the Russell 1000 Growth Index, outperformance was driven by stock
selection among health care and consumer discretionary stocks; holdings in the
consumer staples, financials, and energy sectors were other notable
contributors. Stock picks in information technology detracted most from
relative results.
HEALTH CARE LED CONTRIBUTORS
Health care stocks contributed most to the portfolio's return relative to the
benchmark. Performance was driven by positioning in the pharmaceutical
industry. Growth had no exposure to Merck, and managers eliminated
Schering-Plough at the end of 2007 after sizable gains. This helped relative
results after both stocks suffered in March from questions about the efficacy
of a jointly marketed cholesterol drug.
Positioning in health care equipment & supplies firms was another source of
relative strength. The leading contributor to return in this space was Becton
Dickinson, which benefited from increased usage around the world of its safety
devices that reduce accidents and infection among patients and caregivers.
CONSUMER DISCRETIONARY HELPED
In the consumer discretionary sector, outperformance was a result of stock
selection in the specialty retail and internet & catalog retailing segments.
It also helped to underweight stocks in the hotels, restaurants & leisure
category. Key contributions in the sector came from specialty retailers Urban
Outfitters and The TJX Companies. Internet travel portal priceline.com was
another leading contributor, helped by the acquisition of overseas vacation
properties and growth in its international business.
Top Ten Holdings as of April 30, 2008
% of net % of net
assets as of assets as of
4/30/08 10/31/07
Apple Inc. 3.4% 4.1%
Honeywell International Inc. 2.5% 1.2%
QUALCOMM Inc. 2.5% 0.9%
Emerson Electric Co. 2.4% 1.9%
Becton, Dickinson & Co. 2.3% 2.3%
Microsoft Corp. 2.2% 3.7%
Apache Corp. 2.2% 2.0%
Coca-Cola Co. (The) 2.2% 2.6%
BorgWarner, Inc. 2.2% 2.0%
Devon Energy Corp. 2.2% 1.8%
*All fund returns referenced in this commentary are for Investor Class
shares. Total returns for periods less than one year are not annualized.
**The Lipper Large-Cap Growth Funds category average returns for the one-,
five- and 10-year periods ended April 30, 2008 were 1.73%, 9.15% and 2.79%,
respectively.
- ------
5
Growth
OTHER KEY CONTRIBUTORS
Three of the five largest contributors to portfolio performance were oil & gas
exploration and production firms Devon Energy, Apache, and XTO Energy. These
companies benefited from surging oil prices and reserve growth in the U.S. and
overseas. These shares also saw demand from investors who wanted exposure to
the energy sector but preferred to avoid the big, integrated firms that are
less closely tied to the price of oil and are seeing declining margins in
their refining businesses.
IT, INDUSTRIALS DETRACTED
Stock selection among information technology stocks detracted most from
relative return, led by holdings in the software, internet software &
services, and IT services industries. Indeed, the sector was home to the five
largest individual detractors from relative performance, led by enterprise
software firm VMWare. This overweight position was eliminated after the firm
gave a surprisingly poor profit forecast. The number-two detractor was IBM,
which reported good results and bought back stock during the period. The
portfolio had no exposure to the stock.
With the exception of utilities (a tiny portion of the fund and index),
industrials was the only other sector to detract from relative performance, as
it hurt to be significantly underweight the road & rail and air freight
industries. The leading detractor in the sector was an overweight position in
Continental Airlines, as investors worried about the effects of rising fuel
costs and a slowing economy. We eliminated the position during the period.
OUTLOOK
The investment process focuses on large companies exhibiting sustainable
improvement in their businesses. We believe that owning such companies will
generate outperformance over time versus the Russell 1000 Growth Index and the
other funds in the large-growth peer group.
As a result, the portfolio's sector and industry selection are primarily a
result of identifying what we believe to be superior individual securities. As
of April 30, 2008, we found opportunity in the health care sector, the
portfolio's largest overweight position. The most notable sector underweight
was in information technology shares.
Top Five Industries as of April 30, 2008
% of net % of net
assets as of assets as of
4/30/08 10/31/07
Health Care Equipment & Supplies 8.2% 8.8%
Communications Equipment 8.1% 7.2%
Aerospace & Defense 6.4% 3.1%
Oil, Gas & Consumable Fuels 6.4% 7.1%
Semiconductors &
Semiconductor Equipment 5.7% 3.4%
Types of Investments in Portfolio
% of net % of net
assets as of assets as of
4/30/08 10/31/07
Domestic Common Stocks 93.1% 95.1%
Foreign Common Stocks(1) 6.3% 4.3%
TOTAL COMMON STOCKS 99.4% 99.4%
Temporary Cash Investments 0.5% 0.7%
Other Assets and Liabilities(2) 0.1% (0.1)%
(1) Includes depositary shares, dual listed securities and foreign ordinary
shares.
(2) Includes securities lending collateral and other assets and liabilities.
- ------
6
SCHEDULE OF INVESTMENTS
Growth
APRIL 30, 2008 (UNAUDITED)
Shares Value
Common Stocks -- 99.4%
AEROSPACE & DEFENSE -- 6.4%
1,802,100 Honeywell International Inc. $ 107,044,740
1,276,300 Raytheon Co. 81,644,911
1,135,800 United Technologies Corp. 82,311,426
-------------
271,001,077
-------------
AUTO COMPONENTS -- 2.2%
1,843,400 BorgWarner, Inc. 90,603,110
-------------
BEVERAGES -- 3.9%
1,579,000 Coca-Cola Co. (The) 92,955,730
1,064,500 PepsiCo, Inc. 72,950,185
-------------
165,905,915
-------------
BIOTECHNOLOGY -- 1.4%
277,800 Genentech, Inc.(1) 18,945,960
788,100 Gilead Sciences, Inc.(1) 40,792,056
-------------
59,738,016
-------------
BUILDING PRODUCTS -- 0.3%
615,300 Masco Corp. 11,204,613
-------------
CAPITAL MARKETS -- 3.6%
2,656,700 Invesco Ltd. 68,144,355
586,400 Northern Trust Corp. 43,458,104
1,217,000 Waddell & Reed Financial, Inc. Cl A 41,207,620
-------------
152,810,079
-------------
CHEMICALS -- 1.7%
639,400 Monsanto Co. 72,904,388
-------------
COMMUNICATIONS EQUIPMENT -- 8.1%
1,761,700 ADC Telecommunications, Inc.(1) 24,699,034
466,700 Ciena Corp.(1) 15,779,127
2,549,300 Cisco Systems Inc.(1) 65,364,052
2,582,000 Corning Inc. 68,965,220
3,020,700 JDS Uniphase Corp.(1) 43,226,217
2,459,800 QUALCOMM Inc. 106,238,769
130,000 Research In Motion Ltd.(1) 15,811,900
-------------
340,084,319
-------------
COMPUTERS & PERIPHERALS -- 4.6%
817,900 Apple Inc.(1) 142,273,705
2,490,800 Dell Inc.(1) 46,403,604
348,300 EMC Corp.(1) 5,363,820
-------------
194,041,129
-------------
Shares Value
DIVERSIFIED FINANCIAL SERVICES -- 1.2%
53,000 CME Group Inc. $24,244,850
171,700 IntercontinentalExchange Inc.(1) 26,639,255
-------------
50,884,105
-------------
ELECTRIC UTILITIES -- 0.5%
302,000 FPL Group, Inc. 20,019,580
-------------
ELECTRICAL EQUIPMENT -- 4.1%
1,268,600 Cooper Industries, Ltd. Cl A 53,775,954
1,916,500 Emerson Electric Co. 100,156,290
57,700 First Solar Inc.(1) 16,847,823
-------------
170,780,067
-------------
ELECTRONIC EQUIPMENT & INSTRUMENTS -- 0.8%
3,320,900 Flextronics International Ltd.(1) 34,504,151
-------------
ENERGY EQUIPMENT & SERVICES -- 3.0%
407,600 Helmerich & Payne, Inc. 21,908,500
460,000 Schlumberger Ltd. 46,253,000
399,200 Transocean Inc.(1) 58,866,032
-------------
127,027,532
-------------
FOOD & STAPLES RETAILING -- 4.0%
1,086,400 Costco Wholesale Corp. 77,406,000
1,543,800 Wal-Mart Stores, Inc. 89,509,524
-------------
166,915,524
-------------
FOOD PRODUCTS -- 0.8%
68,600 Nestle SA ORD 32,915,814
-------------
HEALTH CARE EQUIPMENT & SUPPLIES -- 8.2%
1,129,000 Baxter International Inc. 70,359,280
1,069,400 Becton, Dickinson & Co. 95,604,360
472,100 C.R. Bard, Inc. 44,457,657
1,088,200 DENTSPLY International Inc. 42,298,334
228,400 Gen-Probe Inc.(1) 12,872,624
192,800 Idexx Laboratories, Inc.(1) 10,256,960
97,200 Intuitive Surgical Inc.(1) 28,116,072
872,000 Medtronic, Inc. 42,448,960
-------------
346,414,247
-------------
HEALTH CARE PROVIDERS & SERVICES -- 1.0%
358,000 Laboratory Corp. of America Holdings(1) 27,071,960
401,400 VCA Antech Inc.(1) 12,993,318
-------------
40,065,278
-------------
HOTELS, RESTAURANTS & LEISURE -- 1.3%
1,589,500 Darden Restaurants, Inc. 56,554,410
-------------
- ------
7
Growth
Shares Value
HOUSEHOLD DURABLES -- 0.8%
628,500 KB Home(2) $14,141,250
266,400 Mohawk Industries Inc.(1) 20,297,016
-------------
34,438,266
-------------
HOUSEHOLD PRODUCTS -- 1.3%
803,700 Procter & Gamble Co. (The) 53,888,085
-------------
INDUSTRIAL CONGLOMERATES -- 0.4%
464,100 General Electric Co. 15,176,070
-------------
INSURANCE -- 1.1%
862,300 Chubb Corp. 45,676,031
-------------
INTERNET & CATALOG RETAIL -- 0.6%
175,400 priceline.com Inc.(1) 22,388,056
-------------
INTERNET SOFTWARE & SERVICES -- 0.9%
65,900 Google Inc. Cl A(1) 37,845,711
-------------
IT SERVICES -- 1.2%
267,100 Global Payments Inc. 11,821,846
485,800 Visa Inc. Cl A(1) 40,540,010
-------------
52,361,856
-------------
LIFE SCIENCES TOOLS & SERVICES -- 2.3%
133,000 Illumina, Inc.(1) 10,359,370
518,700 QIAGEN N.V.(1)(2) 11,520,327
1,324,000 Thermo Fisher Scientific Inc.(1) 76,619,880
-------------
98,499,577
-------------
MACHINERY -- 3.0%
205,900 Caterpillar Inc. 16,859,092
808,500 Eaton Corp. 71,018,640
388,300 Valmont Industries, Inc. 38,232,018
-------------
126,109,750
-------------
MEDIA -- 1.9%
2,065,700 Viacom Inc. Cl B(1) 79,405,508
-------------
METALS & MINING -- 1.6%
589,400 Freeport-McMoRan Copper & Gold, Inc. 67,044,250
-------------
MULTILINE RETAIL -- 1.1%
2,112,900 Family Dollar Stores, Inc. 45,216,060
-------------
OIL, GAS & CONSUMABLE FUELS -- 6.4%
692,900 Apache Corp. 93,319,772
798,200 Devon Energy Corp. 90,515,880
84,100 EOG Resources Inc. 10,973,368
1,207,700 XTO Energy Inc. 74,708,322
-------------
269,517,342
-------------
Shares Value
PHARMACEUTICALS -- 3.3%
1,480,200 Allergan, Inc. $83,438,874
822,400 Novo Nordisk AS B Shares ORD(2) 56,697,037
-------------
140,135,911
-------------
REAL ESTATE INVESTMENT TRUSTS (REITS) -- 0.6%
227,200 Digital Realty Trust Inc. 8,804,000
468,300 Weingarten Realty Investors 17,275,587
-------------
26,079,587
-------------
ROAD & RAIL -- 0.4%
114,700 Union Pacific Corp. 16,653,293
-------------
SEMICONDUCTORS & SEMICONDUCTOR EQUIPMENT -- 5.7%
1,136,500 Altera Corp. 24,184,720
926,000 Applied Materials, Inc. 17,279,160
3,540,700 Intel Corp. 78,815,982
2,075,700 Linear Technology Corp.(2) 72,566,472
308,900 MEMC Electronic Materials Inc.(1) 19,451,433
1,082,300 Xilinx, Inc. 26,808,571
-------------
239,106,338
-------------
SOFTWARE -- 4.4%
372,200 Electronic Arts Inc.(1) 19,157,134
3,307,000 Microsoft Corp. 94,315,640
1,668,900 Oracle Corp.(1) 34,796,565
524,200 Salesforce.com Inc.(1) 34,979,866
-------------
183,249,205
-------------
SPECIALTY RETAIL -- 3.8%
711,400 Advance Auto Parts, Inc. 24,671,352
2,229,200 Lowe's Companies, Inc. 56,153,548
502,500 TJX Companies, Inc. (The) 16,190,550
1,884,700 Urban Outfitters Inc.(1) 64,550,975
-------------
161,566,425
-------------
WIRELESS TELECOMMUNICATION SERVICES -- 1.5%
1,395,400 American Tower Corp. Cl A(1) 60,588,268
-------------
TOTAL COMMON STOCKS
(Cost $3,628,643,125) 4,179,318,943
-------------
- ------
8
Growth
Value
Temporary Cash Investments -- 0.5%
Repurchase Agreement, Bank of America Securities, LLC,
(collateralized by various U.S. Treasury obligations, 0.625%,
4/15/13, valued at $20,412,462), in a joint trading account at
1.92%, dated 4/30/08, due 5/1/08 (Delivery value $20,001,067)
(Cost $20,000,000) $ 20,000,000
--------------
Temporary Cash Investments - Securities
Lending Collateral(3) -- 0.4%
Repurchase Agreement, Barclays Capital Inc., (collateralized
by various U.S. Government Agency obligations in a pooled
account at the lending agent), 1.98%, dated 4/30/08, due
5/1/08 (Delivery value $3,046,616) 3,046,448
Repurchase Agreement, BNP Paribas Securities Corp.,
(collateralized by various U.S. Government Agency obligations
in a pooled account at the lending agent), 1.99%, dated
4/30/08, due 5/1/08 (Delivery value $3,250,180) 3,250,000
Repurchase Agreement, Deutsche Bank Securities Inc.,
(collateralized by various U.S. Government Agency obligations
in a pooled account at the lending agent), 1.97%, dated
4/30/08, due 5/1/08 (Delivery value $3,250,178) 3,250,000
Value
Repurchase Agreement, Lehman Brothers Inc. / Lehman Brothers
Commercial Paper Inc., (collateralized by various U.S.
Government Agency obligations in a pooled account at the
lending agent), 2.39%, dated 4/30/08, due 5/1/08 (Delivery
value $3,250,216) $3,250,000
Repurchase Agreement, Morgan Stanley & Co. Inc.,
(collateralized by various U.S. Government Agency obligations
in a pooled account at the lending agent), 1.97%, dated
4/30/08, due 5/1/08 (Delivery value $3,250,178) 3,250,000
--------------
TOTAL TEMPORARY CASH INVESTMENTS - SECURITIES
LENDING COLLATERAL
(Cost $16,046,448) 16,046,448
--------------
TOTAL INVESTMENT SECURITIES -- 100.3%
(Cost $3,664,689,573) 4,215,365,391
--------------
OTHER ASSETS AND LIABILITIES -- (0.3)% (12,403,979)
--------------
TOTAL NET ASSETS -- 100.0% $4,202,961,412
==============
Forward Foreign Currency Exchange Contracts
Settlement Unrealized
Contracts to Sell Date Value Gain (Loss)
23,577,820 CHF for USD 5/30/08 $22,772,612 $62,385
177,309,440 DKK for USD 5/30/08 37,110,019 19,018
------------- ------------
$59,882,631 $81,403
============= ============
(Value on Settlement Date $59,964,034)
Notes to Schedule of Investments
CHF = Swiss Franc
DKK = Danish Krone
ORD = Foreign Ordinary Share
USD = United States Dollar
(1) Non-income producing.
(2) Security, or a portion thereof, was on loan as of April 30, 2008.
(3) Investments represent purchases made by the lending agent with cash
collateral received through securities lending transactions.
See Notes to Financial Statements.
- ------
9
PERFORMANCE
Vista
Total Returns as of April 30, 2008
Average Annual Returns
6 1 5 10 Since Inception
months(1) year years years Inception Date
INVESTOR CLASS -12.31% 11.11% 18.19% 9.05% 11.02% 11/25/83
RUSSELL MIDCAP
GROWTH INDEX(2) -8.44% -1.93% 15.29% 5.75% N/A(3) --
Institutional
Class -12.23% 11.32% 18.39% 9.26% 8.03% 11/14/96
Advisor Class -12.44% 10.80% 17.90% 8.79% 6.83% 10/2/96
R Class -12.55% 10.55% -- -- 12.38% 7/29/05
(1) Total returns for periods less than one year are not annualized.
(2) Data provided by Lipper Inc. -- A Reuters Company. ©2008 Reuters. All
rights reserved. Any copying, republication or redistribution of Lipper
content, including by caching, framing or similar means, is expressly
prohibited without the prior written consent of Lipper. Lipper shall not be
liable for any errors or delays in the content, or for any actions taken in
reliance thereon.
The data contained herein has been obtained from company reports, financial
reporting services, periodicals and other resources believed to be reliable.
Although carefully verified, data on compilations is not guaranteed by Lipper
and may be incomplete. No offer or solicitations to buy or sell any of the
securities herein is being made by Lipper.
(3) Benchmark began 12/31/85.
Data presented reflect past performance. Past performance is no guarantee of
future results. Current performance may be higher or lower than the
performance shown. Investment return and principal value will fluctuate, and
redemption value may be more or less than original cost. To obtain performance
data current to the most recent month end, please call 1-800-345-2021 or visit
americancentury.com. International investing special risks, such as political
instability and currency fluctuations.
Unless otherwise indicated, performance reflects Investor Class shares;
performance for other share classes will vary due to differences in fee
structure. For information about other share classes available, please consult
the prospectus. Data assumes reinvestment of dividends and capital gains, and
none of the charts reflect the deduction of taxes that a shareholder would pay
on fund distributions or the redemption of fund shares. Returns for the index
are provided for comparison. The fund's total returns include operating
expenses (such as transaction costs and management fees) that reduce returns,
while the total returns of the index do not.
- ------
10
Vista
Growth of $10,000 Over 10 Years
$10,000 investment made April 30, 1998

One-Year Returns Over 10 Years
Periods ended April 30
1999 2000 2001 2002 2003 2004 2005 2006 2007 2008
Investor
Class -15.78% 125.22% -22.00% -15.93% -17.07% 43.43% 2.10% 31.13% 8.17% 11.11%
Russell
Midcap
Growth
Index 12.33% 53.02% -29.47% -15.01% -16.67% 36.14% 7.05% 28.27% 11.13% -1.93%
Data presented reflect past performance. Past performance is no guarantee of
future results. Current performance may be higher or lower than the
performance shown. Investment return and principal value will fluctuate, and
redemption value may be more or less than original cost. To obtain performance
data current to the most recent month end, please call 1-800-345-2021 or visit
americancentury.com. International investing special risks, such as political
instability and currency fluctuations.
Unless otherwise indicated, performance reflects Investor Class shares;
performance for other share classes will vary due to differences in fee
structure. For information about other share classes available, please consult
the prospectus. Data assumes reinvestment of dividends and capital gains, and
none of the charts reflect the deduction of taxes that a shareholder would pay
on fund distributions or the redemption of fund shares. Returns for the index
are provided for comparison. The fund's total returns include operating
expenses (such as transaction costs and management fees) that reduce returns,
while the total returns of the index do not.
- ------
11
PORTFOLIO COMMENTARY
Vista
Portfolio Managers: Glenn Fogle and Brad Eixmann
In February, David Hollond left the Vista team to focus on the American
Century Giftrust, Heritage and VP Capital Appreciation funds.
PERFORMANCE SUMMARY
Vista returned -12.31%* for the six months ended April 30, 2008,
underperforming the -8.44% return of its benchmark, the Russell Midcap Growth
Index.
As discussed in the Market Perspective on page 2, equity markets generally
declined during the reporting period, as the subprime-mortgage-driven credit
crisis spread to other areas of the economy, and rising energy and commodity
prices increased inflation concerns. In this environment, mid-cap stocks
outpaced their large- and small-cap counterparts, and mid-cap growth-oriented
shares outperformed mid-cap value stocks.
Within the portfolio, effective security selection and an overweight
allocation to the materials sector contributed positively to the portfolio's
relative performance. But it wasn't enough to overcome the detrimental effect
of individual security selection within the energy, information technology,
and consumer discretionary sectors and an underweight position in energy.
Vista also maintained a significant allocation to foreign holdings. During the
reporting period, these holdings detracted from portfolio returns.
CONSUMER DISCRETIONARY LAGGED
The consumer discretionary group also weighed on Vista's performance. The
portfolio has benefited in the past from a stake in the hotels, restaurants
and leisure group, where we focused on several casinos and makers of slot
machines. During the reporting period, though, this group--including holding
Las Vegas Sands--suffered traffic declines and detracted from performance.
INDUSTRIALS CONTRIBUTED, BUT CERTAIN HOLDINGS LAGGED
Within the industrials sector, the portfolio held an overweight position in
machinery company Flowserve. A maker of pumps, seals, and valves to end users
in the oil and gas, power, chemicals, and water industries, Flowserve was the
largest contributor to portfolio performance for the reporting period as its
share price gained 58%.
Also in the industrials sector, we maintained an overweight position in the
aerospace and defense industry. Holdings within this group have contributed
significantly to portfolio gains in the past, benefiting from a replacement
cycle and expanding orders
Top Ten Holdings as of April 30, 2008
% of net % of net
assets as of assets as of
4/30/08 10/31/07
Owens-Illinois Inc. 5.1% 2.2%
Flowserve Corp. 3.8% 1.2%
Thermo Fisher Scientific Inc. 3.0% 3.4%
Monsanto Co. 2.8% 2.1%
SBA Communications Corp. Cl A 2.5% 2.4%
MasterCard Inc. Cl A 2.4% 0.9%
AGCO Corp. 2.3% 2.5%
Medco Health Solutions Inc. 2.2% 2.0%
Aflac Inc. 2.2% --
Express Scripts, Inc. 2.2% 2.9%
*All fund returns referenced in this commentary are for Investor Class shares.
Total returns for periods less than one year are not annualized.
- ------
12
Vista
in global aviation. But during the reporting period, this group lost ground
amid market volatility and investor nervousness. BE Aerospace and Precision
Castparts, in particular, declined 19% and 21%, respectively, and detracted
from portfolio performance.
MATERIALS CONTRIBUTED
A higher standard of living in emerging-market countries, lower availability
of farmland, and greater global focus on biofuels translated into growing
global demand for agriculture. This increased demand in turn led to a
corresponding rise in commodities prices that benefited select chemicals
companies within the materials sector during the reporting period.
Notably, Monsanto--a producer of corn seed--benefited from escalating corn
prices. Not a constituent of the benchmark, Monsanto was a substantial
contributor to relative performance. Also within the materials sector,
agricultural chemicals company Mosaic was a contributor to absolute and
relative portfolio returns as the company continued to benefit from secularly
higher demand in the fertilizer market.
Owens-Illinois--Vista's largest holding--was a meaningful positive contributor
to performance, as the packaging giant was one of the rare companies to
sharply exceed earnings estimates in the reporting period. For the first
quarter of 2008 in particular, the company's earnings more than tripled as it
benefited from increased prices, an improved product mix, and manufacturing
efficiencies.
OUTLOOK
Our investment process focuses on medium-sized and smaller companies with
accelerating earnings growth rates and share-price momentum. We believe that
active investing in such companies will generate outperformance over time
compared with the Russell Midcap Growth Index.
Despite the volatility and the market's tilt away from momentum-style
investing during the course of the reporting period, we find the current
environment accommodating to our disciplined, consistent style. Our process of
identifying companies with accelerating growth and price momentum continues to
identify opportunities, particularly among companies with exposure to
commodities in the global economy.
Top Five Industries as of April 30, 2008
% of net % of net
assets as of assets as of
4/30/08 10/31/07
Semiconductors &
Semiconductor Equipment 7.9% 6.2%
Machinery 7.4% 5.3%
Oil, Gas & Consumable Fuels 6.2% --
Chemicals 6.0% 3.8%
Specialty Retail 5.2% 5.2%
Types of Investments in Portfolio
% of net % of net
assets as of assets as of
4/30/08 10/31/07
Domestic Common Stocks 83.3% 87.8%
Foreign Common Stocks(1) 14.4% 10.1%
TOTAL COMMON STOCKS 97.7% 97.9%
Temporary Cash Investments 6.0% 2.8%
Other Assets and Liabilities (3.7)% (0.7)%
(1) Includes depositary shares, dual listed securities and foreign ordinary
shares.
- ------
13
SCHEDULE OF INVESTMENTS
Vista
APRIL 30, 2008 (UNAUDITED)
Shares Value
Common Stocks -- 97.7%
AEROSPACE & DEFENSE -- 3.6%
306,000 Alliant Techsystems Inc.(1) $33,586,560
1,489,000 BE Aerospace, Inc.(1) 60,096,040
207,000 Precision Castparts Corp. 24,334,920
--------------
118,017,520
--------------
AUTO COMPONENTS -- 0.8%
1,706,000 ArvinMeritor, Inc. 25,487,640
--------------
BIOTECHNOLOGY -- 3.3%
585,000 Alexion Pharmaceuticals Inc.(1) 41,172,300
1,211,000 BioMarin Pharmaceutical Inc.(1) 44,153,060
678,000 CSL Ltd. ORD 25,443,942
--------------
110,769,302
--------------
CAPITAL MARKETS -- 2.0%
168,000 BlackRock, Inc. 33,900,720
408,000 FCStone Group, Inc.(1) 16,899,360
222,000 Northern Trust Corp. 16,452,420
--------------
67,252,500
--------------
CHEMICALS -- 6.0%
288,000 Intrepid Potash, Inc.(1) 13,677,120
807,000 Monsanto Co. 92,014,140
245,000 Mosaic Co. (The)(1) 30,014,950
208,000 Syngenta AG ORD 62,150,994
--------------
197,857,204
--------------
COMMERCIAL BANKS -- 0.5%
209,000 Credicorp Ltd. 16,795,240
--------------
COMMERCIAL SERVICES & SUPPLIES -- 1.6%
813,000 FTI Consulting, Inc.(1) 52,032,000
--------------
COMMUNICATIONS EQUIPMENT -- 0.5%
1,191,000 JDS Uniphase Corp.(1) 17,043,210
--------------
COMPUTERS & PERIPHERALS -- 0.6%
122,000 Apple Inc.(1) 21,221,900
--------------
CONSTRUCTION & ENGINEERING -- 3.8%
1,077,000 Foster Wheeler Ltd.(1) 68,594,130
1,541,000 Quanta Services, Inc.(1) 40,898,140
316,000 Shaw Group Inc. (The)(1) 15,616,720
--------------
125,108,990
--------------
CONTAINERS & PACKAGING -- 5.1%
3,083,000 Owens-Illinois Inc.(1) 170,027,450
--------------
Shares Value
DIVERSIFIED CONSUMER SERVICES -- 0.9%
377,000 DeVry Inc. $21,489,000
108,000 ITT Educational Services Inc.(1) 8,279,280
--------------
29,768,280
--------------
DIVERSIFIED FINANCIAL SERVICES -- 0.2%
142,289 Nasdaq Stock Market, Inc. (The)(1) 5,186,434
--------------
ELECTRICAL EQUIPMENT -- 3.6%
197,000 First Solar Inc.(1) 57,522,030
1,279,000 JA Solar Holdings Co., Ltd. ADR(1) 30,708,790
301,000 Vestas Wind Systems AS ORD(1) 33,050,585
--------------
121,281,405
--------------
ELECTRONIC EQUIPMENT & INSTRUMENTS -- 0.2%
178,982 Molex Inc. 5,079,509
--------------
ENERGY EQUIPMENT & SERVICES -- 4.4%
118,000 Core Laboratories N.V.(1) 14,783,040
566,394 Dresser-Rand Group Inc.(1) 20,713,029
352,000 Helmerich & Payne, Inc. 18,920,000
873,000 Patterson-UTI Energy Inc. 24,391,620
829,000 Weatherford International Ltd.(1) 66,875,430
--------------
145,683,119
--------------
HEALTH CARE PROVIDERS & SERVICES -- 4.9%
437,000 Community Health Systems Inc.(1) 16,400,610
1,028,866 Express Scripts, Inc.(1) 72,041,197
1,492,000 Medco Health Solutions Inc.(1) 73,913,680
--------------
162,355,487
--------------
HOTELS, RESTAURANTS & LEISURE -- 0.9%
181,179 Panera Bread Co. Cl A(1) 9,468,415
596,000 WMS Industries Inc.(1) 21,569,240
--------------
31,037,655
--------------
HOUSEHOLD DURABLES -- 0.5%
453,000 Tupperware Brands Corp. 17,848,200
--------------
INDUSTRIAL CONGLOMERATES -- 1.0%
620,000 McDermott International, Inc.(1) 33,219,600
--------------
INSURANCE -- 2.2%
1,108,000 Aflac Inc. 73,870,360
--------------
INTERNET & CATALOG RETAIL -- 1.0%
257,000 priceline.com Inc.(1) 32,803,480
--------------
14
- ------
Vista
Shares Value
INTERNET SOFTWARE & SERVICES -- 1.2%
484,000 Mercadolibre Inc.(1) $24,480,720
469,000 VeriSign, Inc.(1) 16,907,450
--------------
41,388,170
--------------
IT SERVICES -- 2.4%
281,000 MasterCard Inc. Cl A 78,162,960
--------------
LIFE SCIENCES TOOLS & SERVICES -- 5.1%
198,000 Covance Inc.(1) 16,590,420
362,000 Invitrogen Corp.(1) 33,872,340
825,000 Parexel International Corp.(1) 20,955,000
1,711,000 Thermo Fisher Scientific Inc.(1) 99,015,571
--------------
170,433,331
--------------
MACHINERY -- 7.4%
1,285,183 AGCO Corp.(1) 77,278,054
335,000 Bucyrus International, Inc. 42,186,550
1,029,000 Flowserve Corp. 127,688,610
--------------
247,153,214
--------------
METALS & MINING -- 3.1%
330,000 Agnico-Eagle Mines Ltd. 20,608,500
417,000 Cia Siderurgica Nacional SA ADR 17,993,550
207,000 Cleveland-Cliffs Inc. 33,202,800
111,000 Mechel OAO ADR(1) 16,183,800
698,000 Timminco Ltd. ORD(1) 13,523,534
--------------
101,512,184
--------------
OIL, GAS & CONSUMABLE FUELS -- 6.2%
1,008,000 Alpha Natural Resources, Inc.(1) 49,039,200
615,000 Consol Energy Inc. 49,790,400
270,000 Foundation Coal Holdings, Inc. 16,194,600
708,000 Quicksilver Resources Inc.(1) 29,374,920
765,000 Southwestern Energy Co.(1) 32,367,150
341,000 Ultra Petroleum Corp.(1) 28,326,870
--------------
205,093,140
--------------
PERSONAL PRODUCTS -- 1.4%
611,000 Avon Products, Inc. 23,841,220
528,000 Herbalife Ltd. 23,115,840
--------------
46,957,060
--------------
ROAD & RAIL -- 2.6%
679,000 CSX Corp. 42,743,050
576,000 Kansas City Southern Industries, Inc.(1) 25,966,080
132,000 Union Pacific Corp. 19,165,080
--------------
87,874,210
--------------
Shares Value
SEMICONDUCTORS & SEMICONDUCTOR EQUIPMENT -- 7.9%
1,159,000 Altera Corp. $24,663,520
882,000 Applied Materials, Inc. 16,458,120
618,000 Broadcom Corp. Cl A(1) 16,043,280
567,000 Intersil Corp. Cl A 15,150,240
482,000 Linear Technology Corp. 16,850,720
846,000 MEMC Electronic Materials Inc.(1) 53,272,619
1,394,000 Microsemi Corp.(1) 34,153,000
3,338,000 PMC-Sierra, Inc.(1) 25,936,260
2,502,000 Teradyne, Inc.(1) 33,251,580
1,019,000 Xilinx, Inc. 25,240,630
--------------
261,019,969
--------------
SOFTWARE -- 3.3%
2,340,000 Activision, Inc.(1) 63,297,000
757,997 Informatica Corp.(1) 12,097,632
492,000 McAfee Inc.(1) 16,359,000
30,000 Nintendo Co., Ltd. ORD 16,471,946
--------------
108,225,578
--------------
SPECIALTY RETAIL -- 5.2%
688,000 Aeropostale Inc.(1) 21,871,520
1,098,000 GameStop Corp. Cl A(1) 60,433,920
371,000 Guess?, Inc. 14,201,880
331,000 J. Crew Group Inc.(1) 15,722,500
215,305 Tractor Supply Co.(1) 7,656,246
1,535,000 Urban Outfitters Inc.(1) 52,573,750
--------------
172,459,816
--------------
TEXTILES, APPAREL & LUXURY GOODS -- 0.2%
56,000 Deckers Outdoor Corp.(1) 7,731,920
--------------
TOBACCO -- 0.2%
147,707 UST Inc. 7,691,103
--------------
WIRELESS TELECOMMUNICATION SERVICES -- 3.9%
857,000 MetroPCS Communications, Inc.(1) 16,831,480
686,163 NII Holdings, Inc.(1) 31,385,096
2,546,000 SBA Communications Corp. Cl A(1) 82,337,640
--------------
130,554,216
--------------
TOTAL COMMON STOCKS
(Cost $2,585,529,811) 3,246,003,356
--------------
- ------
15
Vista
Value
Temporary Cash Investments -- 6.0%
Repurchase Agreement, Credit Suisse First Boston, Inc.,
(collateralized by various U.S. Treasury obligations,
7.25%, 8/15/22, valued at $35,296,159), in a joint
trading account at 1.87%, dated 4/30/08, due 5/1/08
(Delivery value $34,601,797) $34,600,000
Repurchase Agreement, Morgan Stanley Group, Inc.,
(collateralized by various U.S. Treasury obligations,
7.875%-8.75%, 8/15/20-2/15/21, valued at $168,994,003),
in a joint trading account at 1.90%, dated 4/30/08, due
5/1/08 (Delivery value $165,708,745) 165,700,000
--------------
Value
TOTAL TEMPORARY CASH INVESTMENTS
(Cost $200,300,000) $200,300,000
--------------
TOTAL INVESTMENT SECURITIES -- 103.7%
(Cost $2,785,829,811) 3,446,303,356
--------------
OTHER ASSETS AND LIABILITIES -- (3.7)% (123,470,929)
--------------
TOTAL NET ASSETS -- 100.0% $3,322,832,427
==============
Forward Foreign Currency Exchange Contracts
Settlement Unrealized
Contracts to Sell Date Value Gain (Loss)
16,272,000 AUD for USD 5/30/08 $ 15,290,479 $(85,013)
10,525,840 CAD for USD 5/30/08 10,444,673 (91,410)
50,710,400 CHF for USD 5/30/08 48,978,586 133,312
123,771,200 DKK for USD 5/30/08 25,904,721 8,972
864,000,000 JPY for USD 5/30/08 8,323,080 (9,645)
-------------- ------------
$108,941,539 $(43,784)
============== ============
(Value on Settlement Date $108,897,755)
Notes to Schedule of Investments
ADR = American Depositary Receipt
AUD = Australian Dollar
CAD = Canadian Dollar
CHF = Swiss Franc
DKK = Danish Krone
JPY = Japanese Yen
ORD = Foreign Ordinary Share
USD = United States Dollar
(1) Non-income producing.
See Notes to Financial Statements.
- ------
16
SHAREHOLDER FEE EXAMPLES (UNAUDITED)
Fund shareholders may incur two types of costs: (1) transaction costs,
including sales charges (loads) on purchase payments and redemption/exchange
fees; and (2) ongoing costs, including management fees; distribution and
service (12b-1) fees; and other fund expenses. This example is intended to
help you understand your ongoing costs (in dollars) of investing in your fund
and to compare these costs with the ongoing cost of investing in other mutual
funds.
The example is based on an investment of $1,000 made at the beginning of the
period and held for the entire period from November 1, 2007 to April 30, 2008.
ACTUAL EXPENSES
The table provides information about actual account values and actual expenses
for each class. You may use the information, together with the amount you
invested, to estimate the expenses that you paid over the period. First,
identify the share class you own. Then simply divide your account value by
$1,000 (for example, an $8,600 account value divided by $1,000 = 8.6), then
multiply the result by the number under the heading "Expenses Paid During
Period" to estimate the expenses you paid on your account during this period.
If you hold Investor Class shares of any American Century fund, or
Institutional Class shares of the American Century Diversified Bond Fund, in
an American Century account (i.e., not a financial intermediary or retirement
plan account), American Century may charge you a $12.50 semiannual account
maintenance fee if the value of those shares is less than $10,000. We will
redeem shares automatically in one of your accounts to pay the $12.50 fee. In
determining your total eligible investment amount, we will include your
investments in all PERSONAL ACCOUNTS (including American Century Brokerage
accounts) registered under your Social Security number. PERSONAL ACCOUNTS
include individual accounts, joint accounts, UGMA/UTMA accounts, personal
trusts, Coverdell Education Savings Accounts and IRAs (including traditional,
Roth, Rollover, SEP-, SARSEP- and SIMPLE-IRAs), and certain other retirement
accounts. If you have only business, business retirement, employer-sponsored
or American Century Brokerage accounts, you are currently not subject to this
fee. We will not charge the fee as long as you choose to manage your accounts
exclusively online. If you are subject to the Account Maintenance Fee, your
account value could be reduced by the fee amount.
HYPOTHETICAL EXAMPLE FOR COMPARISON PURPOSES
The table also provides information about hypothetical account values and
hypothetical expenses based on the actual expense ratio of each class of your
fund and an assumed rate of return of 5% per year before expenses, which is
not the actual return of a fund's share class. The hypothetical account values
and expenses may not be used to estimate the actual ending account balance or
expenses you paid for the period. You may use this information to compare the
ongoing costs of investing in your fund and other funds. To do so, compare
this 5% hypothetical example with the 5% hypothetical examples that appear in
the shareholder reports of the other funds.
Please note that the expenses shown in the table are meant to highlight your
ongoing costs only and do not reflect any transactional costs, such as sales
charges (loads) or redemption/exchange fees. Therefore, the table is useful in
comparing ongoing costs only, and will not help you determine the relative
total costs of owning different funds. In addition, if these transactional
costs were included, your costs would have been higher.
- ------
17
Expenses Paid
Beginning Ending During Period* Annualized
Account Account Value 11/1/07 - Expense
Value 11/1/07 4/30/08 4/30/08 Ratio*
Growth
ACTUAL
Investor Class $1,000 $938.90 $4.82 1.00%
Institutional
Class $1,000 $939.40 $3.86 0.80%
Advisor Class $1,000 $937.80 $6.02 1.25%
R Class $1,000 $936.30 $7.22 1.50%
HYPOTHETICAL
Investor Class $1,000 $1,019.89 $5.02 1.00%
Institutional
Class $1,000 $1,020.89 $4.02 0.80%
Advisor Class $1,000 $1,018.65 $6.27 1.25%
R Class $1,000 $1,017.40 $7.52 1.50%
Vista
ACTUAL
Investor Class $1,000 $876.90 $4.67 1.00%
Institutional
Class $1,000 $877.70 $3.73 0.80%
Advisor Class $1,000 $875.60 $5.83 1.25%
R Class $1,000 $874.50 $6.99 1.50%
HYPOTHETICAL
Investor Class $1,000 $1,019.89 $5.02 1.00%
Institutional
Class $1,000 $1,020.89 $4.02 0.80%
Advisor Class $1,000 $1,018.65 $6.27 1.25%
R Class $1,000 $1,017.40 $7.52 1.50%
*Expenses are equal to the class's annualized expense ratio listed in the
table above, multiplied by the average account value over the period,
multiplied by 182, the number of days in the most recent fiscal half-year,
divided by 366, to reflect the one-half year period.
- ------
18
STATEMENT OF ASSETS AND LIABILITIES
APRIL 30, 2008 (UNAUDITED)
Growth Vista
ASSETS
Investment securities, at value (cost of
$3,648,643,125 and $2,785,829,811,
respectively) -- including $14,783,978 and $-
of securities on loan, respectively $4,199,318,943 $3,446,303,356
Investments made with cash collateral received
for securities on loan, at value (cost of
$16,046,448 and $-, respectively) 16,046,448 --
-------------- --------------
Total investment securities, at value (cost of
$3,664,689,573 and $2,785,829,811, respectively) 4,215,365,391 3,446,303,356
Cash 319,615 --
Receivable for investments sold 63,626,319 90,162,098
Receivable for forward foreign currency
exchange contracts 81,403 142,284
Dividends and interest receivable 2,152,702 1,575,688
-------------- --------------
4,281,545,430 3,538,183,426
-------------- --------------
LIABILITIES
Disbursements in excess of demand deposit cash -- 437,405
Payable for collateral received for securities
on loan 16,046,448 --
Payable for investments purchased 59,161,619 212,139,684
Payable for forward foreign currency exchange
contracts -- 186,068
Accrued management fees 3,336,075 2,513,923
Distribution and service fees payable 39,876 73,919
-------------- --------------
78,584,018 215,350,999
-------------- --------------
NET ASSETS $4,202,961,412 $3,322,832,427
============== ==============
See Notes to Financial Statements.
- ------
19
APRIL 30, 2008 (UNAUDITED)
Growth Vista
NET ASSETS CONSIST OF:
Capital (par value and paid-in surplus) $3,736,714,896 $2,597,501,654
Accumulated undistributed net investment income
(loss) 2,882,630 (9,310,463)
Accumulated undistributed net realized gain
(loss) on investment and foreign currency
transactions (87,431,387) 74,246,695
Net unrealized appreciation on investments and
translation of assets and liabilities in
foreign currencies 550,795,273 660,394,541
-------------- --------------
$4,202,961,412 $3,322,832,427
============== ==============
INVESTOR CLASS, $0.01 PAR VALUE
Net assets $3,788,574,027 $2,736,353,695
Shares outstanding 150,909,035 141,666,046
Net asset value per share $25.11 $19.32
INSTITUTIONAL CLASS, $0.01 PAR VALUE
Net assets $219,695,923 $223,281,051
Shares outstanding 8,679,813 11,299,826
Net asset value per share $25.31 $19.76
ADVISOR CLASS, $0.01 PAR VALUE
Net assets $191,606,545 $355,466,318
Shares outstanding 7,752,834 18,894,566
Net asset value per share $24.71 $18.81
R CLASS, $0.01 PAR VALUE
Net assets $3,084,917 $7,731,363
Shares outstanding 124,968 406,141
Net asset value per share $24.69 $19.04
See Notes to Financial Statements.
- ------
20
STATEMENT OF OPERATIONS
FOR THE SIX MONTHS ENDED APRIL 30, 2008 (UNAUDITED)
Growth Vista
INVESTMENT INCOME (LOSS)
INCOME:
Dividends (net of foreign taxes withheld of
$245,995 and $219,608, respectively) $ 23,350,851 $ 5,752,578
Interest 432,214 956,489
Securities lending, net 222,148 --
-------------- --------------
24,005,213 6,709,067
-------------- --------------
EXPENSES:
Management fees 20,517,152 15,647,138
Distribution fees:
Advisor Class 40,572 --
C Class 939 4,185
Service fees:
Advisor Class 40,572 --
C Class 313 1,395
Distribution and service fees:
Advisor Class 199,064 443,419
R Class 6,875 12,293
Directors' fees and expenses 50,645 40,013
Other expenses 7,167 7,628
-------------- --------------
20,863,299 16,156,071
-------------- --------------
NET INVESTMENT INCOME (LOSS) 3,141,914 (9,447,004)
-------------- --------------
REALIZED AND UNREALIZED GAIN (LOSS)
NET REALIZED GAIN (LOSS) ON:
Investment transactions 87,981,960 88,141,860
Foreign currency transactions (4,361,337) (8,335,880)
-------------- --------------
83,620,623 79,805,980
-------------- --------------
CHANGE IN NET UNREALIZED APPRECIATION
(DEPRECIATION) ON:
Investments (371,232,653) (520,746,634)
Translation of assets and liabilities in
foreign currencies 268,452 170,627
-------------- --------------
(370,964,201) (520,576,007)
-------------- --------------
NET REALIZED AND UNREALIZED GAIN (LOSS) (287,343,578) (440,770,027)
-------------- --------------
NET INCREASE (DECREASE) IN NET ASSETS RESULTING
FROM OPERATIONS $(284,201,664) $(450,217,031)
============== ==============
See Notes to Financial Statements.
- ------
21
STATEMENT OF CHANGES IN NET ASSETS
SIX MONTHS ENDED APRIL 30, 2008 (UNAUDITED) AND YEAR ENDED OCTOBER 31, 2007
Growth Vista
Increase
(Decrease) in Net
Assets 2008 2007 2008 2007
OPERATIONS
Net investment
income (loss) $3,141,914 $8,565,562 $(9,447,004) $(16,538,483)
Net realized gain
(loss) 83,620,623 737,622,135 79,805,980 328,007,590
Change in net
unrealized
appreciation
(depreciation) (370,964,201) 215,035,112 (520,576,007) 795,623,414
-------------- -------------- --------------- ---------------
Net increase
(decrease) in net
assets resulting
from operations (284,201,664) 961,222,809 (450,217,031) 1,107,092,521
-------------- -------------- --------------- ---------------
DISTRIBUTIONS TO SHAREHOLDERS
From net
investment income:
Investor
Class (5,142,411) (2,635,083) -- --
Institutional
Class (895,366) (2,056,902) -- --
From net realized
gains:
Investor
Class -- -- (254,880,472) (15,549,310)
Institutional
Class -- -- (21,928,910) (1,008,670)
Advisor Class -- -- (35,302,295) (1,649,953)
C Class -- -- -- (26,987)
R Class -- -- (388,974) (2,660)
-------------- -------------- --------------- ---------------
Decrease in net
assets from
distributions (6,037,777) (4,691,985) (312,500,651) (18,237,580)
-------------- -------------- --------------- ---------------
CAPITAL SHARE TRANSACTIONS
Net increase
(decrease) in net
assets
from capital
share transactions (134,890,981) (1,121,480,853) 519,814,571 165,576,023
-------------- -------------- --------------- ---------------
NET INCREASE
(DECREASE) IN NET
ASSETS (425,130,422) (164,950,029) (242,903,111) 1,254,430,964
NET ASSETS
Beginning of
period 4,628,091,834 4,793,041,863 3,565,735,538 2,311,304,574
-------------- -------------- --------------- ---------------
End of period $4,202,961,412 $4,628,091,834 $3,322,832,427 $3,565,735,538
============== ============== =============== ===============
Accumulated
undistributed
net investment
income (loss) $2,882,630 $5,778,262 $(9,310,463) $135,602
============== ============== =============== ===============
See Notes to Financial Statements.
- ------
22
NOTES TO FINANCIAL STATEMENTS
APRIL 30, 2008 (UNAUDITED)
1. ORGANIZATION AND SUMMARY OF SIGNIFICANT ACCOUNTING POLICIES
ORGANIZATION -- American Century Mutual Funds, Inc. (the corporation) is
registered under the Investment Company Act of 1940 (the 1940 Act) as an
open-end management investment company. Growth Fund (Growth) and Vista Fund
(Vista) (collectively, the funds) are two funds in a series issued by the
corporation. The funds are diversified under the 1940 Act. The funds'
investment objective is to seek long-term capital growth. The funds pursue
this objective by investing primarily in equity securities. Growth generally
invests in larger-sized companies that management believes will increase in
value but may purchase companies of any size. Vista generally invests in
companies that are medium-sized and smaller at the time of purchase that
management believes will increase in value. The following is a summary of the
funds' significant accounting policies.
MULTIPLE CLASS -- The funds are authorized to issue the Investor Class, the
Institutional Class, the Advisor Class and the R Class. Prior to December 3,
2007, the funds were authorized to issue the C Class (see Note 9). The share
classes differ principally in their respective distribution and shareholder
servicing expenses and arrangements. All shares of each fund represent an
equal pro rata interest in the net assets of the class to which such shares
belong, and have identical voting, dividend, liquidation and other rights and
the same terms and conditions, except for class specific expenses and
exclusive rights to vote on matters affecting only individual classes. Income,
non-class specific expenses, and realized and unrealized capital gains and
losses of the funds are allocated to each class of shares based on their
relative net assets.
SECURITY VALUATIONS -- Securities traded primarily on a principal securities
exchange are valued at the last reported sales price, or at the mean of the
latest bid and asked prices where no last sales price is available. Depending
on local convention or regulation, securities traded over-the-counter are
valued at the mean of the latest bid and asked prices, the last sales price,
or the official close price. Debt securities not traded on a principal
securities exchange are valued through a commercial pricing service or at the
mean of the most recent bid and asked prices. Discount notes may be valued
through a commercial pricing service or at amortized cost, which approximates
fair value. Securities traded on foreign securities exchanges and
over-the-counter markets are normally completed before the close of business
on days that the New York Stock Exchange (the Exchange) is open and may also
take place on days when the Exchange is not open. If an event occurs after the
value of a security was established but before the net asset value per share
was determined that was likely to materially change the net asset value, that
security would be valued as determined in accordance with procedures adopted
by the Board of Directors. If the funds determine that the market price of a
portfolio security is not readily available, or that the valuation methods
mentioned above do not reflect the security's fair value, such security is
valued as determined by the Board of Directors or its designee, in accordance
with procedures adopted by the Board of Directors, if such determination would
materially impact a fund's net asset value. Certain other circumstances may
cause the funds to use alternative procedures to value a security such as: a
security has been declared in default; trading in a security has been halted
during the trading day; or there is a foreign market holiday and no trading
will commence.
SECURITY TRANSACTIONS -- For financial reporting purposes, security
transactions are accounted for as of the trade date. Net realized gains and
losses are determined on the identified cost basis, which is also used for
federal income tax purposes.
INVESTMENT INCOME -- Dividend income less foreign taxes withheld, if any, is
recorded as of the ex-dividend date. Interest income is recorded on the
accrual basis and includes accretion of discounts and amortization of premiums.
SECURITIES ON LOAN -- Growth may lend portfolio securities through its lending
agent to certain approved borrowers in order to earn additional income. The
income earned, net of any rebates or fees, is included in the Statement of
Operations. Growth continues to recognize any gain or loss in the market price
of the securities loaned and records any interest earned or dividends
declared.
FOREIGN CURRENCY TRANSACTIONS -- All assets and liabilities initially
expressed in foreign currencies are translated into U.S. dollars at prevailing
exchange rates at period end. Purchases and sales of investment securities,
dividend and interest income, and certain expenses are translated at the rates
of exchange prevailing on the respective dates of such transactions. For
assets and liabilities, other than investments in securities, net realized and
unrealized gains and losses from foreign currency translations arise from
changes in currency exchange rates.
- ------
23
Net realized and unrealized foreign currency exchange gains or losses
occurring during the holding period of investment securities are a component
of realized gain (loss) on investment transactions and unrealized appreciation
(depreciation) on investments, respectively. Certain countries may impose
taxes on the contract amount of purchases and sales of foreign currency
contracts in their currency. The funds record the foreign tax expense, if any,
as a reduction to the net realized gain (loss) on foreign currency
transactions.
FORWARD FOREIGN CURRENCY EXCHANGE CONTRACTS -- The funds may enter into
forward foreign currency exchange contracts to facilitate transactions of
securities denominated in a foreign currency or to hedge the funds' exposure
to foreign currency exchange rate fluctuations. The net U.S. dollar value of
foreign currency underlying all contractual commitments held by the funds and
the resulting unrealized appreciation or depreciation are determined daily
using prevailing exchange rates. The funds bear the risk of an unfavorable
change in the foreign currency exchange rate underlying the forward contract.
Additionally, losses may arise if the counterparties do not perform under the
contract terms.
REPURCHASE AGREEMENTS -- The funds may enter into repurchase agreements with
institutions that American Century Investment Management, Inc. (ACIM) (the
investment advisor) has determined are creditworthy pursuant to criteria
adopted by the Board of Directors. Each repurchase agreement is recorded at
cost. Each fund requires that the collateral, represented by securities,
received in a repurchase transaction be transferred to the custodian in a
manner sufficient to enable each fund to obtain those securities in the event
of a default under the repurchase agreement. ACIM monitors, on a daily basis,
the securities transferred to ensure the value, including accrued interest, of
the securities under each repurchase agreement is equal to or greater than
amounts owed to each fund under each repurchase agreement.
JOINT TRADING ACCOUNT -- Pursuant to an Exemptive Order issued by the
Securities and Exchange Commission, each fund, along with other registered
investment companies having management agreements with ACIM or American
Century Global Investment Management, Inc. (ACGIM), may transfer uninvested
cash balances into a joint trading account. These balances are invested in one
or more repurchase agreements that are collateralized by U.S. Treasury or
Agency obligations.
INCOME TAX STATUS -- It is each fund's policy to distribute substantially all
net investment income and net realized gains to shareholders and to otherwise
qualify as a regulated investment company under provisions of the Internal
Revenue Code. The funds are no longer subject to examination by tax
authorities for years prior to 2004. At this time, management has not
identified any uncertain tax positions for which it is reasonably possible
that the total amounts of unrecognized tax benefits will significantly change
in the next twelve months. Accordingly, no provision has been made for federal
or state income taxes. Interest and penalties associated with any federal or
state income tax obligations, if any, are recorded as interest expense.
DISTRIBUTIONS TO SHAREHOLDERS -- Distributions to shareholders are recorded on
the ex-dividend date. Distributions from net investment income and net
realized gains, if any, are generally declared and paid annually.
INDEMNIFICATIONS -- Under the corporation's organizational documents, its
officers and directors are indemnified against certain liabilities arising out
of the performance of their duties to the funds. In addition, in the normal
course of business, the funds enter into contracts that provide general
indemnifications. The funds' maximum exposure under these arrangements is
unknown as this would involve future claims that may be made against the
funds. The risk of material loss from such claims is considered by management
to be remote.
USE OF ESTIMATES -- The financial statements are prepared in conformity with
accounting principles generally accepted in the United States of America,
which may require management to make certain estimates and assumptions at the
date of the financial statements. Actual results could differ from these
estimates.
- ------
24
2. FEES AND TRANSACTIONS WITH RELATED PARTIES
On September 25, 2007, the Advisor Class shareholders of Growth approved a
change to the class's fee structure. The change was approved by the Board of
Directors on November 29, 2006 and March 7, 2007. Effective December 3, 2007,
the fee structure change resulted in an increase of 0.25% in the unified
management fee and a simultaneous decrease of 0.25% in the total distribution
and service fee, resulting in no change to the total operation expense ratio
of the class.
MANAGEMENT FEES -- The corporation has entered into a Management Agreement
with ACIM, under which ACIM provides the funds with investment advisory and
management services in exchange for a single, unified management fee (the fee)
per class. The Agreement provides that all expenses of the funds, except
brokerage commissions, taxes, interest, fees and expenses of those directors
who are not considered "interested persons" as defined in the 1940 Act
(including counsel fees) and extraordinary expenses, will be paid by ACIM. The
fee is computed and accrued daily based on the daily net assets of each
specific class of shares of each fund and paid monthly in arrears. For funds
with a stepped fee schedule, the rate of the fee is determined by applying a
fee rate calculation formula. This formula takes into account all of the
investment advisor's assets under management in each fund's investment
strategy (strategy assets) to calculate the appropriate fee rate for each
fund. The strategy assets include each fund's assets and the assets of other
clients of the investment advisor that are not in the American Century family
of funds, but that have the same investment team and investment strategy. The
annual management fee schedule for Growth ranges from 0.80% to 1.00% for the
Investor Class, Advisor Class, C Class and R Class. Prior to December 3, 2007,
the Advisor Class was 0.25% less at each point within the range for Growth.
The annual management fee schedule for Vista is 1.00% for the Investor Class,
Advisor Class, C Class and R Class. The Institutional Class is 0.20% less at
each point within the range for the funds.
The effective annual management fee for each class of each fund for the six
months ended April 30, 2008, was as follows:
Growth Vista
Investor 1.00% 1.00%
Institutional 0.80% 0.80%
Advisor 0.95% 1.00%
R 1.00% 1.00%
DISTRIBUTION AND SERVICE FEES -- The Board of Directors has adopted a separate
Master Distribution and Individual Shareholder Services Plan for each of the
Advisor Class, C Class and R Class (collectively the plans), pursuant to Rule
12b-1 of the 1940 Act. The plans provide that the Advisor Class will pay
American Century Investment Services, Inc. (ACIS) an annual distribution and
service fee of 0.25%. Prior to December 3, 2007, the Board of Directors had
adopted a Master Distribution and Shareholder Services Plan, pursuant to Rule
12b-1 of the 1940 Act, which provided that the Advisor Class of Growth would
pay ACIS an annual distribution fee of 0.25% and service fee of 0.25%. The
plans provide that the C Class will pay ACIS an annual distribution fee of
0.75% and service fee of 0.25%. The plans provide that the R Class will pay
ACIS an annual distribution and service fee of 0.50%. The fees are computed
and accrued daily based on each class's daily net assets and paid monthly in
arrears. The distribution fee provides compensation for expenses incurred in
connection with distributing shares of the classes including, but not limited
to, payments to brokers, dealers, and financial institutions that have entered
into sales agreements with respect to shares of the funds. The service fee
provides compensation for shareholder and administrative services rendered by
ACIS, its affiliates or independent third party providers for Advisor Class
shares and for individual shareholder services rendered by broker/dealers or
other independent financial intermediaries for C Class and R Class shares.
Fees incurred under the plans during the six months ended April 30, 2008, are
detailed in the Statement of Operations.
- ------
25
RELATED PARTIES -- Certain officers and directors of the corporation are also
officers and/or directors, and, as a group, controlling stockholders of
American Century Companies, Inc. (ACC), the parent of the corporation's
investment advisor, ACIM, the distributor of the corporation, ACIS, and the
corporation's transfer agent, American Century Services, LLC.
The funds are eligible to invest in a money market fund for temporary
purposes, which is managed by J.P. Morgan Investment Management, Inc. (JPMIM).
JPMIM is a wholly owned subsidiary of JPMorgan Chase & Co. (JPM). JPM is an
equity investor in ACC. Growth has a securities lending agreement with
JPMorgan Chase Bank (JPMCB). Prior to December 12, 2007, the funds had a bank
line of credit agreement with JPMCB. JPMCB is a custodian of the funds and a
wholly owned subsidiary of JPM.
3. INVESTMENT TRANSACTIONS
Investment transactions, excluding short-term investments, for the six months
ended April 30, 2008, were as follows:
Growth Vista
Purchases $2,823,751,101 $2,390,859,537
Proceeds from sales $2,959,881,027 $2,200,830,601
4. CAPITAL SHARE TRANSACTIONS
Transactions in shares of the funds were as follows:
Six months ended Year ended
April 30, 2008 October 31, 2007
Shares Amount Shares Amount
Growth
INVESTOR
CLASS/SHARES
AUTHORIZED 800,000,000 800,000,000
============ ============
Sold 6,508,654 $162,059,917 16,976,807 $399,134,867
Issued in
reinvestment of
distributions 177,027 4,567,294 108,333 2,425,571
Redeemed (10,077,675) (249,365,499) (42,268,248) (1,005,443,921)
------------ -------------- ------------ ---------------
(3,391,994) (82,738,288) (25,183,108) (603,883,483)
------------ -------------- ------------ ----------------
INSTITUTIONAL
CLASS/SHARES
AUTHORIZED 150,000,000 150,000,000
============ ============
Sold 584,118 14,655,059 10,007,473 248,497,432
Issued in
reinvestment of
distributions 34,450 895,366 91,175 2,056,902
Redeemed (2,471,951) (64,799,453) (33,807,486) (861,252,969)
------------ -------------- ------------ ----------------
(1,853,383) (49,249,028) (23,708,838) (610,698,635)
------------ -------------- ------------ ----------------
ADVISOR
CLASS/SHARES
AUTHORIZED 310,000,000 210,000,000
============ ============
Sold 820,023 19,860,167 5,728,920 134,469,921
Issued in
connection with
reclassification
(Note 9) 61,986 1,519,904 -- --
Redeemed (974,454) (23,621,851) (1,847,995) (43,503,786)
------------ -------------- ------------ ----------------
(92,445) (2,241,780) 3,880,925 90,966,135
------------ -------------- ------------ ----------------
C CLASS/SHARES
AUTHORIZED N/A 100,000,000
============ ============
Sold 117 2,858 33,264 762,257
Redeemed in
connection with
reclassification
(Note 9) (61,986) (1,519,904) -- --
Redeemed (1,377) (32,865) (15,025) (349,075)
------------ -------------- ------------ ----------------
(63,246) (1,549,911) 18,239 413,182
------------ -------------- ------------ ----------------
R CLASS/SHARES
AUTHORIZED 50,000,000 50,000,000
============ ============
Sold 47,411 1,192,268 94,157 2,147,094
Redeemed (12,833) (304,242) (18,497) (425,146)
------------ -------------- ------------ ----------------
34,578 888,026 75,660 1,721,948
------------ -------------- ------------ ----------------
Net increase
(decrease) (5,366,490) $(134,890,981) (44,917,122) $(1,121,480,853)
============ ============== ============ ================
- ------
26
Six months Year ended
ended April 30, 2008 October 31, 2007
Shares Amount Shares Amount
Vista
INVESTOR CLASS/SHARES
AUTHORIZED 800,000,000 800,000,000
============ ============
Sold 25,942,056 $519,349,344 29,032,048 $594,313,388
Issued in reinvestment
of distributions 10,942,317 228,584,994 817,264 14,040,588
Redeemed (15,716,686) (307,738,175) (29,523,877) (567,312,331)
------------ ------------ ------------ -------------
21,167,687 440,196,163 325,435 41,041,645
------------ ------------ ------------ -------------
INSTITUTIONAL
CLASS/SHARES AUTHORIZED 80,000,000 80,000,000
============ ============
Sold 3,550,443 71,917,037 5,631,084 115,870,016
Issued in reinvestment
of distributions 1,026,634 21,928,910 57,617 1,008,292
Redeemed (3,571,953) (74,662,332) (3,345,045) (63,192,246)
------------ ------------ ------------ -------------
1,005,124 19,183,615 2,343,656 53,686,062
------------ ------------ ------------ -------------
ADVISOR CLASS/SHARES
AUTHORIZED 310,000,000 210,000,000
============ ============
Sold 5,219,735 102,929,100 7,905,928 161,043,591
Issued in
connection with
reclassification (Note
9) 298,623 6,537,776 -- --
Issued in reinvestment
of distributions 1,717,908 34,993,776 96,989 1,632,335
Redeemed (4,402,621) (83,120,534) (5,081,285) (95,833,752)
------------ ------------ ------------ -------------
2,833,645 61,340,118 2,921,632 66,842,174
------------ ------------ ------------ -------------
C CLASS/SHARES
AUTHORIZED N/A 100,000,000
============ ============
Sold 6,353 139,449 197,808 3,787,658
Issued in reinvestment
of distributions -- -- 1,736 25,006
Redeemed in connection
with
reclassification (Note
9) (298,623) (6,537,776) -- --
Redeemed (30,349) (630,821) (69,921) (1,288,863)
------------ ------------ ------------ -------------
(322,619) (7,029,148) 129,623 2,523,801
------------ ------------ ------------ -------------
R CLASS/SHARES
AUTHORIZED 10,000,000 10,000,000
============ ============
Sold 355,935 7,066,620 189,380 3,673,020
Issued in reinvestment
of distributions 18,855 388,974 -- --
Redeemed (68,687) (1,331,771) (110,041) (2,190,679)
------------ ------------ ------------ -------------
306,103 6,123,823 79,339 1,482,341
------------ ------------ ------------ -------------
Net increase (decrease) 24,989,940 $519,814,571 5,799,685 $165,576,023
============ ============= ============ =============
5. SECURITIES LENDING
As of April 30, 2008, securities in Growth valued at $14,783,978 were on loan
through the lending agent, JPMCB, to certain approved borrowers. JPMCB
receives and maintains collateral in the form of cash and/or acceptable
securities as approved by ACIM. Cash collateral is invested in authorized
investments by the lending agent in a pooled account. The value of cash
collateral received at period end is disclosed in the Statement of Assets and
Liabilities and investments made with the cash by the lending agent are listed
in the Schedule of Investments. Any deficiencies or excess of collateral must
be delivered or transferred by the member firms no later than the close of
business on the next business day. The total market value of all collateral
received for Growth, at this date, was $16,046,448. Growth's risks in
securities lending are that the borrower may not provide additional collateral
when required or return the securities when due. If the borrower defaults,
receipt of the collateral by the Growth may be delayed or limited.
- ------
27
6. BANK LINE OF CREDIT
Effective December 12, 2007, the funds, along with certain other funds managed
by ACIM or ACGIM, have a $500,000,000 unsecured bank line of credit agreement
with Bank of America, N.A. Prior to December 12, 2007, the funds, along with
certain other funds managed by ACIM or ACGIM, had a $500,000,000 unsecured
bank line of credit agreement with JPMCB. The funds may borrow money for
temporary or emergency purposes to fund shareholder redemptions. Borrowings
under the agreement, which is subject to annual renewal, bear interest at the
Federal Funds rate plus 0.40%. The funds did not borrow from the line during
the six months ended April 30, 2008.
7. RISK FACTORS
There are certain risks involved in investing in foreign securities. These
risks include those resulting from future adverse political, social, and
economic developments, fluctuations in currency exchange rates, the possible
imposition of exchange controls, and other foreign laws or restrictions.
8. FEDERAL TAX INFORMATION
The book-basis character of distributions made during the year from net
investment income or net realized gains may differ from their ultimate
characterization for federal income tax purposes. These differences reflect
the differing character of certain income items and net realized gains and
losses for financial statement and tax purposes, and may result in
reclassification among certain capital accounts on the financial statements.
As of April 30, 2008, the components of investments for federal income tax
purposes were as follows:
Growth Vista
Federal tax cost of investments $3,687,182,133 $2,791,072,126
============== ===============
Gross tax appreciation of investments $621,370,715 $690,235,461
Gross tax depreciation of investments (93,187,457) (35,004,231)
-------------- ---------------
Net tax appreciation (depreciation)
of investments $528,183,258 $655,231,230
============== ===============
The difference between book-basis and tax-basis cost and unrealized
appreciation (depreciation) is attributable primarily to the tax deferral of
losses on wash sales.
As of October 31, 2007, Growth had accumulated capital losses of $(168,744),
which represent net capital loss carryovers that may be used to offset future
realized capital gains for federal income tax purposes. Growth's capital loss
carryovers expire in 2010.
9. CORPORATE EVENT
On July 27, 2007, the C Class shareholders of each fund approved a
reclassification of C Class shares into Advisor Class shares of that fund. The
change was approved by the Board of Directors on November 29, 2006 and March
7, 2007. The reclassification was effective December 3, 2007.
10. RECENTLY ISSUED ACCOUNTING STANDARDS
The Financial Accounting Standards Board (FASB) issued Statement of Financial
Accounting Standards No. 157, "Fair Value Measurements" (FAS 157), in
September 2006, which is effective for fiscal years beginning after November
15, 2007. FAS 157 defines fair value, establishes a framework for measuring
fair value and expands the required financial statement disclosures about fair
value measurements. Management is currently evaluating the impact that
adopting FAS 157 will have on the financial statement disclosures.
In March 2008, the FASB issued Statement of Financial Accounting Standards No.
161, "Disclosures about Derivative Instruments and Hedging Activities -- an
amendment of FASB Statement No. 133" (FAS 161). FAS 161 is effective for
fiscal years beginning after November 15, 2008. FAS 161 amends and expands
disclosures about derivative instruments and hedging activities. FAS 161
requires qualitative disclosures about the objectives and strategies of
derivative instruments, quantitative disclosures about the fair value amounts
of and gains and losses on derivative instruments, and disclosures of
credit-risk-related contingent features in hedging activities. Management is
currently evaluating the impact that adopting FAS 161 will have on the
financial statement disclosures.
- ------
28
FINANCIAL HIGHLIGHTS
Growth
Investor Class
For a Share Outstanding Throughout the Years Ended October 31
(except as noted)
2008(1) 2007 2006 2005 2004 2003
PER-SHARE DATA
Net Asset Value,
Beginning of Period $26.78 $21.99 $19.80 $18.43 $17.26 $14.80
-------- ------ ------ ------ ------- ------
Income From
Investment Operations
Net Investment
Income (Loss)(2) 0.02 0.04 0.02 0.08 (0.01) 0.01
Net Realized and
Unrealized Gain
(Loss) (1.66) 4.76 2.26 1.30 1.18 2.45
-------- ------ ------ ------ ------- ------
Total From
Investment Operations (1.64) 4.80 2.28 1.38 1.17 2.46
-------- ------ ------ ------ ------- ------
Distributions
From Net
Investment Income (0.03) (0.01) (0.09) (0.01) -- --
-------- ------ ------ ------ ------- ------
Net Asset Value,
End of Period $25.11 $26.78 $21.99 $19.80 $18.43 $17.26
======== ====== ====== ====== ======= ======
TOTAL RETURN(3) (6.11)% 21.86% 11.51% 7.47% 6.78% 16.62%
RATIOS/SUPPLEMENTAL DATA
Ratio of Operating
Expenses to Average Net
Assets 1.00%(4) 1.00% 1.00% 1.00% 1.00% 1.00%
Ratio of Net Investment
Income (Loss) to
Average Net Assets 0.15%(4) 0.15% 0.09% 0.38% (0.07)% 0.05%
Portfolio
Turnover Rate 67% 112% 127% 77% 131% 159%
Net Assets,
End of Period
(in millions) $3,789 $4,133 $3,946 $4,008 $4,176 $4,350
(1) Six months ended April 30, 2008 (unaudited).
(2) Computed using average shares outstanding throughout the period.
(3) Total return assumes reinvestment of net investment income and capital
gains distributions, if any. Total returns for periods less than one year are
not annualized. The total return of the classes may not precisely reflect the
class expense differences because of the impact of calculating the net asset
values to two decimal places. If net asset values were calculated to three
decimal places, the total return differences would more closely reflect the
class expense differences. The calculation of net asset values to two decimal
places is made in accordance with SEC guidelines and does not result in any
gain or loss of value between one class and another.
(4) Annualized.
See Notes to Financial Statements.
- ------
29
Growth
Institutional Class
For a Share Outstanding Throughout the Years Ended October 31
(except as noted)
2008(1) 2007 2006 2005 2004 2003
PER-SHARE DATA
Net Asset Value,
Beginning of
Period $27.03 $22.19 $19.98 $18.59 $17.38 $14.87
-------- -------- -------- -------- -------- --------
Income From
Investment
Operations
Net
Investment
Income
(Loss)(2) 0.04 0.09 0.06 0.11 0.02 0.04
Net Realized
and
Unrealized
Gain (Loss) (1.68) 4.81 2.27 1.33 1.19 2.47
-------- -------- -------- -------- -------- --------
Total From
Investment
Operations (1.64) 4.90 2.33 1.44 1.21 2.51
-------- -------- -------- -------- -------- --------
Distributions
From Net
Investment
Income (0.08) (0.06) (0.12) (0.05) -- --
-------- -------- -------- -------- -------- --------
Net Asset
Value,
End of Period $25.31 $27.03 $22.19 $19.98 $18.59 $17.38
======== ======== ======== ======== ======== ========
TOTAL RETURN(3) (6.06)% 22.13% 11.70% 7.72% 6.96% 16.88%
RATIOS/SUPPLEMENTAL DATA
Ratio of
Operating
Expenses to
Average Net
Assets 0.80%(4) 0.80% 0.80% 0.80% 0.80% 0.80%
Ratio of Net
Investment
Income (Loss) to
Average Net
Assets 0.35%(4) 0.35% 0.29% 0.58% 0.13% 0.25%
Portfolio
Turnover Rate 67% 112% 127% 77% 131% 159%
Net Assets, End
of Period
(in thousands) $219,696 $284,695 $759,816 $689,983 $685,090 $618,569
(1) Six months ended April 30, 2008 (unaudited).
(2) Computed using average shares outstanding throughout the period.
(3) Total return assumes reinvestment of net investment income and capital
gains distributions, if any. Total returns for periods less than one year are
not annualized. The total return of the classes may not precisely reflect the
class expense differences because of the impact of calculating the net asset
values to two decimal places. If net asset values were calculated to three
decimal places, the total return differences would more closely reflect the
class expense differences. The calculation of net asset values to two decimal
places is made in accordance with SEC guidelines and does not result in any
gain or loss of value between one class and another.
(4) Annualized.
See Notes to Financial Statements.
- ------
30
Growth
Advisor Class
For a Share Outstanding Throughout the Years Ended October 31 (except as noted)
2008(1) 2007 2006 2005 2004 2003
PER-SHARE DATA
Net Asset Value,
Beginning of Period $26.36 $21.68 $19.53 $18.22 $17.11 $14.70
---------- -------- ------- ------- ------- -------
Income From
Investment
Operations
Net Investment
Income
(Loss)(2) (0.01) (0.04) (0.03) 0.02 (0.06) (0.03)
Net Realized
and
Unrealized
Gain (Loss) (1.64) 4.72 2.22 1.29 1.17 2.44
---------- -------- ------- ------- ------- -------
Total From
Investment
Operations (1.65) 4.68 2.19 1.31 1.11 2.41
---------- -------- ------- ------- ------- -------
Distributions
From Net
Investment
Income -- -- (0.04) -- -- --
---------- -------- ------- ------- ------- -------
Net Asset Value,
End of Period $24.71 $26.36 $21.68 $19.53 $18.22 $17.11
========== ======== ======= ======= ======= =======
TOTAL RETURN(3) (6.22)% 21.59% 11.23% 7.19% 6.49% 16.39%
RATIOS/SUPPLEMENTAL DATA
Ratio of Operating
Expenses to
Average Net Assets 1.25%(4) 1.25% 1.25% 1.25% 1.25% 1.25%
Ratio of Net
Investment Income
(Loss) to
Average Net Assets (0.10)%(4) (0.10)% (0.16)% 0.13% (0.32)% (0.20)%
Portfolio Turnover
Rate 67% 112% 127% 77% 131% 159%
Net Assets, End of
Period
(in thousands) $191,607 $206,837 $85,953 $86,303 $76,962 $55,010
(1) Six months ended April 30, 2008 (unaudited).
(2) Computed using average shares outstanding throughout the period.
(3) Total return assumes reinvestment of net investment income and capital
gains distributions, if any. Total returns for periods less than one year are
not annualized. Total returns are calculated based on the net asset value on
the last business day. The total return of the classes may not precisely
reflect the class expense differences because of the impact of calculating the
net asset values to two decimal places. If net asset values were calculated to
three decimal places, the total return differences would more closely reflect
the class expense differences. The calculation of net asset values to two
decimal places is made in accordance with SEC guidelines and does not result
in any gain or loss of value between one class and another.
(4) Annualized.
See Notes to Financial Statements.
- ------
31
Growth
R Class
For a Share Outstanding Throughout the Years Ended October 31
(except as noted)
2008(1) 2007 2006 2005 2004 2003(2)
PER-SHARE DATA
Net Asset Value,
Beginning of
Period $26.37 $21.74 $19.59 $18.32 $17.25 $16.56
---------- ------- ------- ------- ------- ----------
Income From
Investment
Operations
Net
Investment
Income
(Loss)(3) (0.04) (0.10) (0.11) (0.07) (0.13) (0.02)
Net Realized
and
Unrealized
Gain (Loss) (1.64) 4.73 2.26 1.34 1.20 0.71
---------- ------- ------- ------- ------- ----------
Total From
Investment
Operations (1.68) 4.63 2.15 1.27 1.07 0.69
---------- ------- ------- ------- ------- ----------
Net Asset Value,
End of Period $24.69 $26.37 $21.74 $19.59 $18.32 $17.25
========== ======= ======= ======= ======= ==========
TOTAL RETURN(4) (6.37)% 21.30% 10.97% 6.93% 6.20% 4.17%
RATIOS/SUPPLEMENTAL DATA
Ratio of
Operating
Expenses to
Average Net
Assets 1.50%(5) 1.50% 1.50% 1.50% 1.50% 1.50%(5)
Ratio of Net
Investment
Income (Loss) to
Average Net
Assets (0.35)%(5) (0.35)% (0.41)% (0.12)% (0.57)% (0.58)%(5)
Portfolio
Turnover Rate 67% 112% 127% 77% 131% 159%(6)
Net Assets, End
of Period
(in thousands) $3,085 $2,383 $298 $49 $12 $3
(1) Six months ended April 30, 2008 (unaudited).
(2) August 29, 2003 (commencement of sale) through October 31, 2003.
(3) Computed using average shares outstanding throughout the period.
(4) Total return assumes reinvestment of net investment income and capital
gains distributions, if any. Total returns for periods less than one year are
not annualized. The total return of the classes may not precisely reflect the
class expense differences because of the impact of calculating the net asset
value to two decimal places. If net asset values were calculated to three
decimal places, the total return differences would more closely reflect the
class expense differences. The calculation of net asset values to two decimal
places is made in accordance with SEC guidelines and does not result in any
gain or loss of value between one class and another.
(5) Annualized.
(6) Portfolio turnover is calculated at the fund level. Percentage indicated
was calculated for the year ended October 31, 2003.
See Notes to Financial Statements.
- ------
32
Vista
Investor Class
For a Share Outstanding Throughout the Years Ended October 31
(except as noted)
2008(1) 2007 2006 2005 2004 2003
PER-SHARE DATA
Net Asset Value,
Beginning of Period $24.24 $16.35 $14.99 $13.14 $11.97 $9.25
---------- ------- ------- ------- ------- -------
Income From
Investment
Operations
Net Investment
Income
(Loss)(2) (0.06) (0.12) (0.04) (0.04) (0.06) (0.06)
Net Realized
and
Unrealized Gain
(Loss) (2.77) 8.14 1.40 1.89 1.23 2.78
---------- ------- ------- ------- ------- -------
Total From
Investment
Operations (2.83) 8.02 1.36 1.85 1.17 2.72
---------- ------- ------- ------- ------- -------
Distributions
From Net
Realized Gains (2.09) (0.13) -- -- -- --
---------- ------- ------- ------- ------- -------
Net Asset Value,
End of Period $19.32 $24.24 $16.35 $14.99 $13.14 $11.97
========== ======= ======= ======= ======= =======
TOTAL RETURN(3) (12.31)% 49.39% 9.07% 14.08% 9.77% 29.41%
RATIOS/SUPPLEMENTAL DATA
Ratio of Operating
Expenses to Average
Net Assets 1.00%(4) 1.00% 1.00% 1.00% 1.00% 1.00%
Ratio of Net
Investment Income
(Loss) to
Average Net Assets (0.58)%(4) (0.60)% (0.23)% (0.26)% (0.48)% (0.57)%
Portfolio Turnover
Rate 70% 121% 234% 284% 255% 280%
Net Assets, End of
Period
(in millions) $2,736 $2,921 $1,965 $1,902 $1,418 $1,240
(1) Six months ended April 30, 2008 (unaudited).
(2) Computed using average shares outstanding throughout the period.
(3) Total return assumes reinvestment of net investment income and capital
gains distributions, if any. Total returns for periods less than one year are
not annualized. The total return of the classes may not precisely reflect the
class expense differences because of the impact of calculating the net asset
values to two decimal places. If net asset values were calculated to three
decimal places, the total return differences would more closely reflect the
class expense differences. The calculation of net asset values to two decimal
places is made in accordance with SEC guidelines and does not result in any
gain or loss of value between one class and another.
(4) Annualized.
See Notes to Financial Statements.
- ------
33
Vista
Institutional Class
For a Share Outstanding Throughout the Years Ended October 31
(except as noted)
2008(1) 2007 2006 2005 2004 2003
PER-SHARE DATA
Net Asset Value,
Beginning of
Period $24.72 $16.64 $15.22 $13.32 $12.11 $9.34
---------- -------- -------- ------- ------- -------
Income From
Investment
Operations
Net
Investment
Income
(Loss)(2) (0.04) (0.08) (0.01) (0.01) (0.04) (0.03)
Net Realized
and
Unrealized
Gain (Loss) (2.83) 8.29 1.43 1.91 1.25 2.80
---------- -------- -------- ------- ------- -------
Total From
Investment
Operations (2.87) 8.21 1.42 1.90 1.21 2.77
---------- -------- -------- ------- ------- -------
Distributions
From Net
Realized
Gains (2.09) (0.13) -- -- -- --
---------- -------- -------- ------- ------- -------
Net Asset Value,
End of Period $19.76 $24.72 $16.64 $15.22 $13.32 $12.11
========== ======== ======== ======= ======== =======
TOTAL RETURN(3) (12.23)% 49.68% 9.33% 14.26% 9.99% 29.66%
RATIOS/SUPPLEMENTAL DATA
Ratio of
Operating
Expenses to
Average Net
Assets 0.80%(4) 0.80% 0.80% 0.80% 0.80% 0.80%
Ratio of Net
Investment
Income (Loss) to
Average Net
Assets (0.38)%(4) (0.40)% (0.03)% (0.06)% (0.28)% (0.37)%
Portfolio
Turnover Rate 70% 121% 234% 284% 255% 280%
Net Assets, End
of Period
(in thousands) $223,281 $254,528 $132,325 $98,439 $42,747 $34,177
(1) Six months ended April 30, 2008 (unaudited).
(2) Computed using average shares outstanding throughout the period.
(3) Total return assumes reinvestment of net investment income and capital
gains distributions, if any. Total returns for periods less than one year are
not annualized. The total return of the classes may not precisely reflect the
class expense differences because of the impact of calculating the net asset
values to two decimal places. If net asset values were calculated to three
decimal places, the total return differences would more closely reflect the
class expense differences. The calculation of net asset values to two decimal
places is made in accordance with SEC guidelines and does not result in any
gain or loss of value between one class and another.
(4) Annualized.
See Notes to Financial Statements.
- ------
34
Vista
Advisor Class
For a Share Outstanding Throughout the Years Ended October 31
(except as noted)
2008(1) 2007 2006 2005 2004 2003
PER-SHARE DATA
Net Asset Value,
Beginning of Period $23.69 $16.03 $14.73 $12.95 $11.82 $9.15
---------- ------- ------- ------- ------- -------
Income From
Investment
Operations
Net Investment
Income
(Loss)(2) (0.08) (0.16) (0.08) (0.08) (0.11) (0.08)
Net Realized and
Unrealized Gain
(Loss) (2.71) 7.95 1.38 1.86 1.24 2.75
---------- ------- ------- ------- ------- -------
Total From
Investment
Operations (2.79) 7.79 1.30 1.78 1.13 2.67
---------- ------- ------- ------- ------- -------
Distributions
From Net
Realized Gains (2.09) (0.13) -- -- -- --
---------- ------- ------- ------- ------- -------
Net Asset Value,
End of Period $18.81 $23.69 $16.03 $14.73 $12.95 $11.82
========== ======= ======= ======= ======= =======
TOTAL RETURN(3) (12.44)% 48.94% 8.83% 13.75% 9.56% 29.18%
RATIOS/SUPPLEMENTAL DATA
Ratio of Operating
Expenses to Average
Net Assets 1.25%(4) 1.25% 1.25% 1.25% 1.25% 1.25%
Ratio of Net
Investment Income
(Loss) to
Average Net Assets (0.83)%(4) (0.85)% (0.48)% (0.51)% (0.73)% (0.82)%
Portfolio Turnover
Rate 70% 121% 234% 284% 255% 280%
Net Assets, End of
Period
(in thousands) $355,466 $380,555 $210,576 $190,635 $106,750 $17,060
(1) Six months ended April 30, 2008 (unaudited).
(2) Computed using average shares outstanding throughout the period.
(3) Total return assumes reinvestment of net investment income and capital
gains distributions, if any. Total returns for periods less than one year are
not annualized. The total return of the classes may not precisely reflect the
class expense differences because of the impact of calculating the net asset
values to two decimal places. If net asset values were calculated to three
decimal places, the total return differences would more closely reflect the
class expense differences. The calculation of net asset values to two decimal
places is made in accordance with SEC guidelines and does not result in any
gain or loss of value between one class and another.
(4) Annualized.
See Notes to Financial Statements.
- ------
35
Vista
R Class
For a Share Outstanding Throughout the Years Ended October 31
(except as noted)
2008(1) 2007 2006 2005(2)
PER-SHARE DATA
Net Asset Value, Beginning of Period $23.98 $16.25 $14.97 $15.32
---------- ------- ------- ----------
Income From Investment Operations
Net Investment
Income (Loss)(3) (0.10) (0.21) (0.16) (0.04)
Net Realized and
Unrealized Gain (Loss) (2.75) 8.07 1.44 (0.31)
---------- ------- ------- ----------
Total From
Investment Operations (2.85) 7.86 1.28 (0.35)
---------- ------- ------- ----------
Distributions
From Net Realized Gains (2.09) (0.13) -- --
---------- ------- ------- ----------
Net Asset Value, End of Period $19.04 $23.98 $16.25 $14.97
========== ======= ======= ==========
TOTAL RETURN(4) (12.55)% 48.71% 8.55% (2.28)%
RATIOS/SUPPLEMENTAL DATA
Ratio of Operating Expenses to
Average Net Assets 1.50%(5) 1.50% 1.50% 1.50%(5)
Ratio of Net Investment Income
(Loss) to Average Net Assets (1.08)%(5) (1.10)% (0.73)% (0.92)%(5)
Portfolio Turnover Rate 70% 121% 234% 284%(6)
Net Assets, End of Period (in
thousands) $7,731 $2,398 $337 $24
(1) Six months ended April 30, 2008 (unaudited).
(2) July 29, 2005 (commencement of sale) through October 31, 2005.
(3) Computed using average shares outstanding throughout the period.
(4) Total return assumes reinvestment of net investment income and capital
gains distributions, if any. Total returns for periods less than one year are
not annualized. The total return of the classes may not precisely reflect the
class expense differences because of the impact of calculating the net asset
values to two decimal places. If net asset values were calculated to three
decimal places, the total return differences would more closely reflect the
class expense differences. The calculation of net asset values to two decimal
places is made in accordance with SEC guidelines and does not result in any
gain or loss of value between one class and another.
(5) Annualized.
(6) Portfolio turnover is calculated at the fund level. Percentage indicated
was calculated for the year ended October 31, 2005.
See Notes to Financial Statements.
- ------
36
ADDITIONAL INFORMATION
RETIREMENT ACCOUNT INFORMATION
As required by law, any distributions you receive from an IRA or certain
403(b), 457 and qualified plans [those not eligible for rollover to an IRA or
to another qualified plan] are subject to federal income tax withholding,
unless you elect not to have withholding apply. Tax will be withheld on the
total amount withdrawn even though you may be receiving amounts that are not
subject to withholding, such as nondeductible contributions. In such case,
excess amounts of withholding could occur. You may adjust your withholding
election so that a greater or lesser amount will be withheld.
If you don't want us to withhold on this amount, you must notify us to not
withhold the federal income tax. Even if you plan to roll over the amount you
withdraw to another tax-deferred account, the withholding rate still applies
to the withdrawn amount unless we have received notice not to withhold federal
income tax prior to the withdrawal. You may notify us in writing or in certain
situations by telephone or through other electronic means. You have the right
to revoke your withholding election at any time and any election you make may
remain in effect until revoked by filing a new election.
Remember, even if you elect not to have income tax withheld, you are liable
for paying income tax on the taxable portion of your withdrawal. If you elect
not to have income tax withheld or you don't have enough income tax withheld,
you may be responsible for payment of estimated tax. You may incur penalties
under the estimated tax rules if your withholding and estimated tax payments
are not sufficient.
State tax will be withheld if, at the time of your distribution, your address
is within one of the mandatory withholding states and you have federal income
tax withheld. State taxes will be withheld from your distribution in
accordance with the respective state rules.
PROXY VOTING GUIDELINES
American Century Investment Management, Inc., the funds' investment advisor,
is responsible for exercising the voting rights associated with the securities
purchased and/or held by the funds. A description of the policies and
procedures the advisor uses in fulfilling this responsibility is available
without charge, upon request, by calling 1-800-345-2021. It is also available
on American Century Investments' website at americancentury.com and on the
Securities and Exchange Commission's website at sec.gov. Information regarding
how the investment advisor voted proxies relating to portfolio securities
during the most recent 12-month period ended June 30 is available on the
"About Us" page at americancentury.com. It is also available at sec.gov.
QUARTERLY PORTFOLIO DISCLOSURE
The funds file their complete schedule of portfolio holdings with the
Securities and Exchange Commission (SEC) for the first and third quarters of
each fiscal year on Form N-Q. The funds' Forms N-Q are available on the SEC's
website at sec.gov, and may be reviewed and copied at the SEC's Public
Reference Room in Washington, DC. Information on the operation of the Public
Reference Room may be obtained by calling 1-800-SEC-0330. The funds also make
their complete schedule of portfolio holdings for the most recent quarter of
their fiscal year available on their website at americancentury.com and, upon
request, by calling 1-800-345-2021.
- ------
37
INDEX DEFINITIONS
The following indices are used to illustrate investment market, sector, or
style performance or to serve as fund performance comparisons. They are not
investment products available for purchase.
The RUSSELL 1000® INDEX is a market-capitalization weighted, large-cap index
created by Frank Russell Company to measure the performance of the 1,000
largest of the 3,000 largest publicly traded U.S. companies, based on total
market capitalization.
The RUSSELL 1000® GROWTH INDEX measures the performance of those Russell 1000
Index companies (the 1,000 largest of the 3,000 largest publicly traded U.S.
companies, based on total market capitalization) with higher price-to-book
ratios and higher forecasted growth values.
The RUSSELL 1000® VALUE INDEX measures the performance of those Russell 1000
Index companies (the 1,000 largest of the 3,000 largest publicly traded U.S.
companies, based on total market capitalization) with lower price-to-book
ratios and lower forecasted growth values.
The RUSSELL 2000® INDEX is a market-capitalization weighted index created by
Frank Russell Company to measure the performance of the 2,000 smallest of the
3,000 largest publicly traded U.S. companies, based on total market
capitalization.
The RUSSELL 2000® GROWTH INDEX measures the performance of those Russell 2000
Index companies (the 2,000 smallest of the 3,000 largest publicly traded U.S.
companies, based on total market capitalization) with higher price-to-book
ratios and higher forecasted growth values.
The RUSSELL 2000® VALUE INDEX measures the performance of those Russell 2000
Index companies (the 2,000 smallest of the 3,000 largest publicly traded U.S.
companies, based on total market capitalization) with lower price-to-book
ratios and lower forecasted growth values.
The RUSSELL MIDCAP® INDEX measures the performance of the 800 smallest of the
1,000 largest publicly traded U.S. companies, based on total market
capitalization.
The RUSSELL MIDCAP® GROWTH INDEX measures the performance of those Russell
Midcap Index companies (the 800 smallest of the 1,000 largest publicly traded
U.S. companies, based on total market capitalization) with higher
price-to-book ratios and higher forecasted growth values.
The RUSSELL MIDCAP® VALUE INDEX measures the performance of those Russell
Midcap Index companies (the 800 smallest of the 1,000 largest publicly traded
U.S. companies, based on total market capitalization) with lower price-to-book
ratios and lower forecasted growth values.
- ------
38
[blank page]
[back cover]
[american century investments logo and text logo ®]
CONTACT US
AMERICANCENTURY.COM
AUTOMATED INFORMATION LINE . . . . . . . . . . . . . 1-800-345-8765
1-800-345-2021 or
INVESTOR SERVICES REPRESENTATIVE . . . . . . . . . . 816-531-5575
BUSINESS, NOT-FOR-PROFIT, EMPLOYER-SPONSORED
RETIREMENT PLANS . . . . . . . . . . . . . . . . . . 1-800-345-3533
BANKS AND TRUST COMPANIES, BROKER-DEALERS,
FINANCIAL PROFESSIONALS, INSURANCE COMPANIES . . . . 1-800-345-6488
TELECOMMUNICATIONS DEVICE FOR THE DEAF . . . . . . . 1-800-634-4113
AMERICAN CENTURY MUTUAL FUNDS, INC.
INVESTMENT ADVISOR:
American Century Investment Management, Inc.
Kansas City, Missouri
This report and the statements it contains are submitted for the general
information of our shareholders. The report is not authorized for distribution
to prospective investors unless preceded or accompanied by an effective
prospectus.
American Century Investments
P.O. Box 419200 PRSRT STD
Kansas City, MO 64141-6200 U.S. POSTAGE PAID
AMERICAN CENTURY
COMPANIES
American Century Investment Services, Inc., Distributor
©2008 American Century Proprietary Holdings, Inc. All rights reserved.
0806
CL-SAN-60504S
[front cover]
SEMIANNUAL REPORT
APRIL 30, 2008
[american century investments logo and text logo ®]
AMERICAN CENTURY INVESTMENTS
GIFTRUST® FUND
PRESIDENT'S LETTER
JONATHAN THOMAS
[photo of Jonathan Thomas]
Dear Investor,
At American Century Investments®, we are committed to helping you reach your
financial goals. Your success is the ultimate measure of our performance.
That's why we focus on achieving superior investment results and building
long-term relationships with investors like you.
Part of that relationship is to clearly communicate investment results and
what influenced them. To help you monitor your investment with us, we take
pride in providing you with the semiannual report for the American Century®
Giftrust Fund for the six months ended April 30, 2008. We also recommend
americancentury.com, where we provide company news, quarterly portfolio
commentaries, investment views, and other useful information.
As noted on the website, 2008 marks the 50th anniversary of American Century
Investments. Since 1958, we've worked to make wise decisions with your
interests as our guide. Fifty years also means that we've met the challenges
of previous economic downturns. As we've crossed those hurdles and earned your
trust, our assets under management have grown to nearly $100 billion, putting
us in the top 5% of our industry. This growth has given us the resources to
offer a wide array of financial products and services, including a
well-diversified line-up of portfolios that provide you with many choices in
these uncertain times.
Though our offerings are diverse, they share several key qualities, including
our disciplined investment approach and active, team-based management. Strict
adherence to our processes and long-term strategies allows us to stay focused
during volatile periods. Investors in our portfolios also benefit from the sum
of our investment teams' expertise as they share research and information.
We'll continue to work hard to earn your trust. Thank you for your continued
support.
Sincerely,
/s/Jonathan Thomas
Jonathan S. Thomas
President and Chief Executive Officer
American Century Investments
TABLE OF CONTENTS
Market Perspective. . . . . . . . . . . . . . . . . . . . . . . . . . 2
U.S. Stock Index Returns . . . . . . . . . . . . . . . . . . . . . . 2
GIFTRUST
Performance . . . . . . . . . . . . . . . . . . . . . . . . . . . . . 3
Portfolio Commentary. . . . . . . . . . . . . . . . . . . . . . . . . 5
Top Ten Holdings . . . . . . . . . . . . . . . . . . . . . . . . . . 5
Top Five Industries. . . . . . . . . . . . . . . . . . . . . . . . . 6
Types of Investments in Portfolio. . . . . . . . . . . . . . . . . . 6
Shareholder Fee Example . . . . . . . . . . . . . . . . . . . . . . . 7
Schedule of Investments . . . . . . . . . . . . . . . . . . . . . . . 9
FINANCIAL STATEMENTS
Statement of Assets and Liabilities . . . . . . . . . . . . . . . . . 12
Statement of Operations . . . . . . . . . . . . . . . . . . . . . . . 13
Statement of Changes in Net Assets. . . . . . . . . . . . . . . . . . 14
Notes to Financial Statements . . . . . . . . . . . . . . . . . . . . 15
Financial Highlights. . . . . . . . . . . . . . . . . . . . . . . . . 18
OTHER INFORMATION
Additional Information. . . . . . . . . . . . . . . . . . . . . . . . 19
Index Definitions . . . . . . . . . . . . . . . . . . . . . . . . . . 20
The opinions expressed in the Market Perspective and the Portfolio Commentary
reflect those of the portfolio management team as of the date of the report,
and do not necessarily represent the opinions of American Century or any other
person in the American Century organization. Any such opinions are subject to
change at any time based upon market or other conditions and American Century
disclaims any responsibility to update such opinions. These opinions may not
be relied upon as investment advice and, because investment decisions made by
American Century funds are based on numerous factors, may not be relied upon
as an indication of trading intent on behalf of any American Century fund.
Security examples are used for representational purposes only and are not
intended as recommendations to purchase or sell securities. Performance
information for comparative indices and securities is provided to American
Century by third party vendors. To the best of American Century's knowledge,
such information is accurate at the time of printing.
MARKET PERSPECTIVE
[photo of Chief Investment Officer]
By Steve Lurito, Chief Investment Officer, U.S. Growth Equity
VOLATILITY UP, STOCKS DOWN
The six months ended April 30, 2008 saw stocks produce negative returns as
market volatility surged in the wake of the subprime credit crisis. In terms
of the economy, tighter credit and the slumping housing market hurt consumer
spending and confidence, leading many economists to suggest we're already in
recession. Meanwhile, mounting losses hurt the banks, brokers, and other big
institutional players important for the functioning of the financial markets.
Facing dual economic and financial crises, the Federal Reserve (the Fed) took
a series of extraordinary steps, slashing interest rates and acting as a
lender of last resort not only for banks, but also major brokers. That helped
stocks rebound, with many analysts suggesting that the mid-March buy-out of
investment bank Bear Stearns--in a deal arranged by the Fed--put a floor under
the market.
RETURNS BY SIZE, STYLE MIXED
Performance by size and style was mixed (see the accompanying table),
reflecting the volatile trading during the period, when corporate earnings
estimates were revised down sharply. Looking at returns by sector, energy
shares were the only segment to produce positive results during the six
months. At the other end of the spectrum, credit-related losses took a big
bite out of earnings for financials stocks, which performed worst. Consumer
discretionary shares also lagged badly, as did information technology stocks,
which suffered from poor pricing and demand trends for chips and some
consumer-related tech goods.
OPPORTUNITY AMID VOLATILITY
Despite the uncertainty surrounding the economy, we think growth-oriented
stocks can perform well relative to value as proven earnings growth becomes
scarce during economic slowdowns. And while we don't see an end to market
volatility anytime soon, we view this dynamic as a natural part of the
investing cycle--and one that presents us with opportunities to build
positions in what we believe are high-quality companies trading at attractive
prices. Indeed, investors should rest assured that we're finding no shortage
of companies demonstrating sustained earnings growth and business improvement.
U.S. Stock Index Returns
For the six months ended April 30, 2008*
RUSSELL 1000 INDEX (LARGE-CAP) -9.54%
Russell 1000 Growth Index -9.28%
Russell 1000 Value Index -9.83%
RUSSELL MIDCAP INDEX -8.77%
Russell Midcap Growth Index -8.44%
Russell Midcap Value Index -9.20%
RUSSELL 2000 INDEX (SMALL-CAP) -12.92%
Russell 2000 Growth Index -14.14%
Russell 2000 Value Index -11.55%
* Total returns for periods less than one year are not annualized.
- ------
2
PERFORMANCE
Giftrust
Total Returns as of April 30, 2008
Average Annual Returns
6 Since Inception
months(1) 1 year 5 years 10 years Inception Date
GIFTRUST -7.99% 16.46% 19.77%(2) 4.66%(2) 12.98%(2) 11/25/83
RUSSELL MIDCAP
GROWTH INDEX(3) -8.44% -1.93% 15.29% 5.75% --(4) --
(1) Total returns for periods less than one year are not annualized.
(2) Returns would have been lower if management fees had not been waived from
2/1/04 to 7/31/04.
(3) Data provided by Lipper Inc. -- A Reuters Company. ©2008 Reuters. All
rights reserved. Any copying, republication or redistribution of Lipper
content, including by caching, framing or similar means, is expressly
prohibited without the prior written consent of Lipper. Lipper shall not be
liable for any errors or delays in the content, or for any actions taken in
reliance thereon.
The data contained herein has been obtained from company reports, financial
reporting services, periodicals and other resources believed to be reliable.
Although carefully verified, data on compilations is not guaranteed by Lipper
and may be incomplete. No offer or solicitations to buy or sell any of the
securities herein is being made by Lipper.
(4) Benchmark began 12/31/85.
Data presented reflect past performance. Past performance is no guarantee of
future results. Current performance may be higher or lower than the
performance shown. Investment return and principal value will fluctuate, and
redemption value may be more or less than original cost. To obtain performance
data current to the most recent month end, please call 1-800-345-2021 or visit
americancentury.com. The fund's investment process may result in high
portfolio turnover, high commission costs and high capital gains
distributions. In addition, its investment approach may involve higher
volatility and risk. International investing involves special risks, such as
political instability and currency fluctuations. Investing in emerging markets
may accentuate these risks.
Data assumes reinvestment of dividends and capital gains, and none of the
charts reflect the deduction of taxes that a shareholder would pay on fund
distributions or the redemption of fund shares. Returns for the index are
provided for comparison. The fund's total returns include operating expenses
(such as transaction costs and management fees) that reduce returns, while the
total returns of the index do not.
- ------
3
Giftrust
Growth of $10,000 Over 10 Years
$10,000 investment made April 30, 1998
One-Year Returns Over 10 Years
Periods ended April 30
1999 2000 2001 2002 2003 2004 2005 2006 2007 2008
Giftrust -21.02% 113.18% -42.37% -14.35% -23.04% 19.73%* 3.48%* 47.22% 16.13% 16.46%
Russell
Midcap
Growth
Index 12.33% 53.02% -29.47% -15.01% -16.67% 36.14% 7.05% 28.27% 11.13% -1.93%
* Returns would have been lower, along with the ending value, if management
fees had not been waived from 2/1/04 to 7/31/04.
Data presented reflect past performance. Past performance is no guarantee of
future results. Current performance may be higher or lower than the
performance shown. Investment return and principal value will fluctuate, and
redemption value may be more or less than original cost. To obtain performance
data current to the most recent month end, please call 1-800-345-2021 or visit
americancentury.com. The fund's investment process may result in high
portfolio turnover, high commission costs and high capital gains
distributions. In addition, its investment approach may involve higher
volatility and risk. International investing involves special risks, such as
political instability and currency fluctuations. Investing in emerging markets
may accentuate these risks.
Data assumes reinvestment of dividends and capital gains, and none of the
charts reflect the deduction of taxes that a shareholder would pay on fund
distributions or the redemption of fund shares. Returns for the index are
provided for comparison. The fund's total returns include operating expenses
(such as transaction costs and management fees) that reduce returns, while the
total returns of the index do not.
- ------
4
PORTFOLIO COMMENTARY
Giftrust
Portfolio Managers: David Hollond and Greg Walsh
In February 2008, Glenn Fogle left the Giftrust team to focus on the American
Century Vista Fund.
PERFORMANCE SUMMARY
Giftrust returned -7.99%* for the six months ended April 30, 2008, compared
with the -8.44% return of its benchmark, the Russell Midcap Growth Index.
Giftrust has also produced returns in excess of its benchmark for the longer
investment periods of one and five years.
As discussed in the Market Perspective on page 2, equity markets generally
declined during the reporting period, as the subprime-mortgage-driven credit
crisis spread to other areas of the economy, and rising energy and commodity
prices increased inflation concerns. In this environment, both growth and
value stocks lost ground across the capitalization spectrum.
Giftrust derived relative gains from effective stock selection in the
materials and industrials sectors. An overweight allocation to the materials
sector also boosted gains. Offsetting those positive contributions, poor stock
selection in the energy and consumer discretionary sectors, as well as an
underweight position in energy, weighed on Giftrust's performance.
In spite of the poor performance of foreign stocks during the reporting
period, the portfolio derived gains from its 18% stake in foreign holdings.
MATERIALS GAINED
A higher standard of living in emerging-market countries, lower availability
of farmland, and greater global focus on biofuels translated into growing
global demand for agriculture. This increased demand has in turn driven up
commodities prices that benefited select chemicals companies within the
materials sector during the reporting period.
Notably, agricultural chemicals company K+S AG's share price gained 101% for
the reporting period as the company continued to benefit from higher demand in
the fertilizer market. Monsanto, which is a producer of corn seed, benefited
from escalating corn prices. Since neither of these were components of the
benchmark, both companies were substantial contributors to relative
performance.
Also in the materials sector, Owens-Illinois--Giftrust's largest holding at
period end--was a meaningful positive contributor to performance, as the
bottling company was one of the rare companies to sharply exceed earnings
estimates in the reporting period. For the first quarter of 2008 in
particular, the company's earnings more than tripled as it benefited from
increased prices, an improved product mix, and manufacturing efficiencies.
Top Ten Holdings as of April 30, 2008
% of net % of net
assets as of assets as of
4/30/08 10/31/07
Owens-Illinois Inc. 5.0% 2.6%
Flowserve Corp. 3.9% 2.3%
CSL Ltd. ORD 3.6% 2.2%
Monsanto Co. 3.2% 3.1%
Nintendo Co., Ltd. ORD 2.6% 4.5%
Express Scripts, Inc. 2.4% 1.8%
PetroHawk Energy Corp. 2.3% --
Urban Outfitters Inc. 2.1% --
Vestas Wind Systems AS ORD 2.0% 0.6%
Invitrogen Corp. 1.8% 1.5%
* Total returns for periods less than one year are not annualized.
- ------
5
Giftrust
INDUSTRIALS CONTRIBUTED, BUT CERTAIN HOLDINGS LAGGED
Within the industrials sector, the portfolio held an overweight position in
machinery company Flowserve. A maker of pumps, seals, and valves used by the
oil and gas, power, chemicals, and water industries, Flowserve was the largest
contributor to portfolio performance for the reporting period as its share
price gained 58%.
Giftrust also benefited from an overweight position in the electrical
equipment industry, where we focused on companies involved with alternative
energy. Within this emerging group, we have succeeded in selecting some of the
largest beneficiaries of increasing demand. Notably, an overweight stake in
First Solar aided absolute and relative gains as the manufacturer of solar
modules saw its share price surge 84%.
Elsewhere in the industrials sector, we maintained an overweight position in
the aerospace and defense industry. Holdings within this group have
contributed significantly to portfolio gains in the past, benefiting from a
replacement cycle and expanding orders in global aviation. During the
reporting period, though, this group lost ground amid market volatility and
profit-taking. BE Aerospace, in particular, declined 19% and detracted from
portfolio performance.
CONSUMER DISCRETIONARY DETRACTED
The consumer discretionary group also weighed on Giftrust's performance. An
overweight stake in ITT Educational Services hindered performance as the
private education company suffered from the fallout from the credit crunch. As
with the subprime mortgage industry, private education firms experienced a
loss of liquidity as investors shied away from student loans.
OUTLOOK
Giftrust's investment process focuses on medium-sized companies with
accelerating revenue and earnings growth rates and share price momentum. We
believe that active investing in such companies will generate outperformance
over time compared with the Russell Midcap Growth Index. Despite the
volatility and the market's tilt away from momentum-style investing during the
course of the reporting period, we will remain focused on our time-tested
process.
Top Five Industries as of April 30, 2008
% of net % of net
assets as of assets as of
4/30/08 10/31/07
Chemicals 6.9% 3.7%
Machinery 6.1% 5.3%
Software 6.1% 5.7%
Biotechnology 5.9% 3.7%
Semiconductors &
Semiconductor Equipment 5.7% 6.1%
Types of Investments in Portfolio
% of net % of net
assets as of assets as of
4/30/08 10/31/07
Domestic Common Stocks 81.5% 86.0%
Foreign Common Stocks(1) 18.1% 13.4%
TOTAL COMMON STOCKS 99.6% 99.4%
Temporary Cash Investments 0.9% 0.2%
Other Assets and Liabilities (0.5)% 0.4%
(1) Includes depositary shares, dual listed securities and foreign ordinary
shares.
- ------
6
SHAREHOLDER FEE EXAMPLE (UNAUDITED)
Fund shareholders may incur two types of costs: (1) transaction costs,
including sales charges (loads) on purchase payments and redemption/exchange
fees; and (2) ongoing costs, including management fees; distribution and
service (12b-1) fees; and other fund expenses. This example is intended to
help you understand your ongoing costs (in dollars) of investing in your fund
and to compare these costs with the ongoing cost of investing in other mutual
funds.
The example is based on an investment of $1,000 made at the beginning of the
period and held for the entire period from November 1, 2007 to April 30, 2008.
ACTUAL EXPENSES
The table provides information about actual account values and actual expenses
for each class. You may use the information, together with the amount you
invested, to estimate the expenses that you paid over the period. First,
identify the share class you own. Then simply divide your account value by
$1,000 (for example, an $8,600 account value divided by $1,000 = 8.6), then
multiply the result by the number under the heading "Expenses Paid During
Period" to estimate the expenses you paid on your account during this period.
If you hold Investor Class shares of any American Century fund, or
Institutional Class shares of the American Century Diversified Bond Fund, in
an American Century account (i.e., not a financial intermediary or retirement
plan account), American Century may charge you a $12.50 semiannual account
maintenance fee if the value of those shares is less than $10,000. We will
redeem shares automatically in one of your accounts to pay the $12.50 fee. In
determining your total eligible investment amount, we will include your
investments in all PERSONAL ACCOUNTS (including American Century Brokerage
accounts) registered under your Social Security number. PERSONAL ACCOUNTS
include individual accounts, joint accounts, UGMA/UTMA accounts, personal
trusts, Coverdell Education Savings Accounts and IRAs (including traditional,
Roth, Rollover, SEP-, SARSEP- and SIMPLE-IRAs), and certain other retirement
accounts. If you have only business, business retirement, employer-sponsored
or American Century Brokerage accounts, you are currently not subject to this
fee. We will not charge the fee as long as you choose to manage your accounts
exclusively online. If you are subject to the Account Maintenance Fee, your
account value could be reduced by the fee amount.
HYPOTHETICAL EXAMPLE FOR COMPARISON PURPOSES
The table also provides information about hypothetical account values and
hypothetical expenses based on the actual expense ratio of each class of your
fund and an assumed rate of return of 5% per year before expenses, which is
not the actual return of a fund's share class. The hypothetical account values
and expenses may not be used to estimate the actual ending account balance or
expenses you paid for the period. You may use this information to compare the
ongoing costs of investing in your fund and other funds. To do so, compare
this 5% hypothetical example with the 5% hypothetical examples that appear in
the shareholder reports of the other funds.
Please note that the expenses shown in the table are meant to highlight your
ongoing costs only and do not reflect any transactional costs, such as sales
charges (loads) or redemption/exchange fees. Therefore, the table is useful in
comparing ongoing costs only, and will not help you determine the relative
total costs of owning different funds. In addition, if these transactional
costs were included, your costs would have been higher.
- ------
7
Beginning Ending Expenses Paid
Account Value Account Value During Period* Annualized
11/1/07 4/30/08 11/1/07 - 4/30/08 Expense Ratio*
Actual $1,000 $920.10 $4.77 1.00%
Hypothetical $1,000 $1,019.89 $5.02 1.00%
* Expenses are equal to the fund's annualized expense ratio listed in the
table above, multiplied by the average account value over the period,
multiplied by 182, the number of days in the most recent fiscal half-year,
divided by 366, to reflect the one-half year period.
- ------
8
SCHEDULE OF INVESTMENTS
Giftrust
APRIL 30, 2008 (UNAUDITED)
Shares Value
Common Stocks -- 99.6%
AEROSPACE & DEFENSE -- 3.3%
125,100 Alliant Techsystems Inc.(1) $ 13,730,980
479,465 BE Aerospace, Inc.(1) 19,351,207
76,803 Precision Castparts Corp. 9,028,961
--------------
42,111,148
--------------
BEVERAGES -- 0.9%
184,396 Central European Distribution Corp.(1) 11,233,404
--------------
BIOTECHNOLOGY -- 5.9%
528,100 BioMarin Pharmaceutical Inc.(1) 19,254,526
159,700 Celgene Corp.(1) 9,923,758
1,226,097 CSL Ltd. ORD 46,012,893
--------------
75,191,177
--------------
CAPITAL MARKETS -- 2.0%
190,650 Janus Capital Group Inc. 5,349,639
221,900 Raymond James Financial, Inc. 6,384,063
406,400 Waddell & Reed Financial, Inc. Cl A 13,760,704
--------------
25,494,406
--------------
CHEMICALS -- 6.9%
174,400 Celanese Corp., Series A 7,804,400
58,316 CF Industries Holdings, Inc. 7,796,849
49,400 K+S AG ORD 20,798,324
352,440 Monsanto Co. 40,185,209
85,400 Mosaic Co. (The)(1) 10,462,354
--------------
87,047,136
--------------
COMMERCIAL BANKS -- 0.5%
179,400 BB&T Corporation 6,151,626
--------------
COMMERCIAL SERVICES & SUPPLIES -- 1.4%
175,200 Copart, Inc.(1) 7,160,424
170,000 FTI Consulting, Inc.(1) 10,880,000
--------------
18,040,424
--------------
COMMUNICATIONS EQUIPMENT -- 2.0%
446,400 JDS Uniphase Corp.(1) 6,387,984
153,100 Research In Motion Ltd.(1) 18,621,553
--------------
25,009,537
--------------
COMPUTERS & PERIPHERALS -- 2.1%
114,130 Apple Inc.(1) 19,852,914
404,100 QLogic Corp.(1) 6,449,436
--------------
26,302,350
--------------
Shares Value
CONSTRUCTION & ENGINEERING -- 1.4%
177,204 Foster Wheeler Ltd.(1) $ 11,286,123
212,100 KBR, Inc. 6,116,964
--------------
17,403,087
--------------
CONTAINERS & PACKAGING -- 5.5%
235,800 Crown Holdings Inc.(1) 6,328,872
1,159,600 Owens-Illinois Inc.(1) 63,951,940
--------------
70,280,812
--------------
DISTRIBUTORS -- 0.8%
456,300 LKQ Corp.(1) 9,929,088
--------------
DIVERSIFIED -- 0.8%
390,900 Financial Select Sector SPDR Fund 10,335,396
--------------
DIVERSIFIED CONSUMER SERVICES -- 1.0%
60,300 Capella Education Co.(1) 3,888,747
112,783 DeVry Inc. 6,428,631
14,300 Strayer Education, Inc. 2,655,367
--------------
12,972,745
--------------
DIVERSIFIED FINANCIAL SERVICES -- 0.5%
170,900 Nasdaq Stock Market, Inc. (The)(1) 6,229,305
--------------
ELECTRICAL EQUIPMENT -- 4.5%
204,473 Energy Conversion Devices Inc.(1) 6,663,775
43,838 First Solar Inc.(1) 12,800,258
482,400 JA Solar Holdings Co., Ltd. ADR(1) 11,582,424
236,200 Vestas Wind Systems AS ORD(1) 25,935,375
--------------
56,981,832
--------------
ELECTRONIC EQUIPMENT & INSTRUMENTS -- 0.7%
226,973 Dolby Laboratories Inc. Cl A(1) 9,112,966
--------------
ENERGY EQUIPMENT & SERVICES -- 4.4%
148,490 Cameron International Corp.(1) 7,310,163
183,800 Dresser-Rand Group Inc.(1) 6,721,566
262,300 Hercules Offshore Inc.(1) 6,914,228
95,000 National Oilwell Varco, Inc.(1) 6,502,750
216,200 Patterson-UTI Energy Inc. 6,040,628
210,100 Seadrill Ltd. 6,399,194
190,700 Weatherford International Ltd.(1) 15,383,769
--------------
55,272,298
--------------
FOOD PRODUCTS -- 1.0%
110,800 Bunge Ltd. 12,641,172
--------------
- ------
9
Giftrust
Shares Value
HEALTH CARE EQUIPMENT & SUPPLIES -- 1.9%
23,000 Intuitive Surgical Inc.(1) $ 6,652,980
362,000 Varian Medical Systems, Inc.(1) 16,970,560
--------------
23,623,540
--------------
HEALTH CARE PROVIDERS & SERVICES -- 3.3%
433,400 Express Scripts, Inc.(1) 30,346,668
239,600 Medco Health Solutions Inc.(1) 11,869,784
--------------
42,216,452
--------------
HOTELS, RESTAURANTS & LEISURE -- 2.2%
98,083 Bally Technologies, Inc.(1) 3,304,416
184,566 International Game Technology 6,411,823
64,500 Panera Bread Co. Cl A(1) 3,370,770
415,100 WMS Industries Inc.(1) 15,022,469
--------------
28,109,478
--------------
INDUSTRIAL CONGLOMERATES -- 2.2%
409,700 McDermott International, Inc.(1) 21,951,726
90,600 Walter Industries Inc. 6,284,016
--------------
28,235,742
--------------
INSURANCE -- 0.3%
65,769 Assurant, Inc. 4,274,985
--------------
INTERNET & CATALOG RETAIL -- 1.6%
160,108 priceline.com Inc.(1) 20,436,185
--------------
INTERNET SOFTWARE & SERVICES -- 0.7%
92,800 Equinix Inc.(1) 8,390,976
--------------
IT SERVICES -- 1.4%
63,100 MasterCard Inc. Cl A 17,551,896
--------------
LIFE SCIENCES TOOLS & SERVICES -- 3.7%
125,885 Covance Inc.(1) 10,547,904
244,580 Invitrogen Corp.(1) 22,885,351
291,600 Parexel International Corp.(1) 7,406,640
112,000 Thermo Fisher Scientific Inc.(1) 6,481,440
--------------
47,321,335
--------------
MACHINERY -- 6.1%
312,300 AGCO Corp.(1) 18,778,599
401,441 Flowserve Corp. 49,814,814
114,900 Joy Global Inc. 8,531,325
--------------
77,124,738
--------------
MEDIA -- 1.3%
227,488 Liberty Global, Inc. Series A(1) 8,050,800
239,100 Liberty Global, Inc. Series C(1) 7,938,120
--------------
15,988,920
--------------
METALS & MINING -- 0.7%
135,900 Agnico-Eagle Mines Ltd. 8,486,955
--------------
Shares Value
MULTILINE RETAIL -- 0.3%
135,700 Big Lots, Inc.(1) $ 3,667,971
--------------
OIL, GAS & CONSUMABLE FUELS -- 5.2%
259,900 Alpha Natural Resources, Inc.(1) 12,644,135
218,800 Arena Resources Inc.(1) 9,824,120
47,800 Patriot Coal Corp.(1) 3,157,190
45,200 Peabody Energy Corp. 2,763,076
1,215,900 PetroHawk Energy Corp.(1) 28,743,876
221,800 Quicksilver Resources Inc.(1) 9,202,482
--------------
66,334,879
--------------
PERSONAL PRODUCTS -- 0.7%
214,300 Avon Products, Inc. 8,361,986
--------------
REAL ESTATE INVESTMENT TRUSTS (REITS) -- 0.5%
152,400 Plum Creek Timber Co. Inc. 6,224,016
--------------
ROAD & RAIL -- 1.9%
171,500 CSX Corp. 10,795,925
231,300 Norfolk Southern Corp. 13,780,854
--------------
24,576,779
--------------
SEMICONDUCTORS & SEMICONDUCTOR EQUIPMENT -- 5.7%
332,400 Intersil Corp. Cl A 8,881,728
249,000 Linear Technology Corp. 8,705,040
492,200 Marvell Technology Group Ltd.(1) 6,373,990
227,616 MEMC Electronic Materials Inc.(1) 14,332,980
244,400 Microchip Technology Inc. 8,981,700
506,000 Semiconductor HOLDRs Trust 15,468,420
108,589 Varian Semiconductor Equipment
Associates, Inc.(1) 3,977,615
228,300 Xilinx, Inc. 5,654,991
--------------
72,376,464
--------------
SOFTWARE -- 6.1%
674,671 Activision, Inc.(1) 18,249,851
120,100 Electronic Arts Inc.(1) 6,181,547
175,400 McAfee Inc.(1) 5,832,050
60,400 Nintendo Co., Ltd. ORD 33,163,517
132,700 Ubisoft Entertainment SA ORD(1) 13,387,548
--------------
76,814,513
--------------
SPECIALTY RETAIL -- 5.5%
398,922 GameStop Corp. Cl A(1) 21,956,667
213,600 Guess?, Inc. 8,176,608
829,600 Pier 1 Imports, Inc.(1) 6,470,880
189,700 Ross Stores, Inc. 6,353,053
787,800 Urban Outfitters Inc.(1) 26,982,150
--------------
69,939,358
--------------
- ------
10
Giftrust
Shares Value
TEXTILES, APPAREL & LUXURY GOODS -- 1.7%
80,100 Phillips-Van Heusen Corp. $ 3,381,021
233,200 Polo Ralph Lauren Corp. 14,463,064
110,900 Warnaco Group Inc. (The)(1) 5,116,926
--------------
22,961,011
--------------
WIRELESS TELECOMMUNICATION SERVICES -- 1.0%
162,500 MetroPCS Communications, Inc.(1) 3,191,500
218,200 NII Holdings, Inc.(1) 9,980,468
--------------
13,171,968
--------------
TOTAL COMMON STOCKS
(Cost $983,063,460) 1,263,930,056
--------------
Value
Temporary Cash Investments -- 0.9%
Repurchase Agreement, Bank of America Securities, LLC,
(collateralized by various U.S. Treasury obligations, 0.625%,
4/15/13, valued at $11,022,730), in a joint trading account at
1.92%, dated 4/30/08, due 5/1/08 (Delivery value $10,800,576)
(Cost $10,800,000) $ 10,800,000
--------------
TOTAL INVESTMENT SECURITIES -- 100.5%
(Cost $993,863,460) 1,274,730,056
--------------
OTHER ASSETS AND LIABILITIES -- (0.5)% (6,456,402)
--------------
TOTAL NET ASSETS -- 100.0% $1,268,273,654
==============
Forward Foreign Currency Exchange Contracts
Unrealized Gain
Contracts to Sell Settlement Date Value (Loss)
24,298,365 AUD for USD 5/30/08 $22,832,698 $(114,941)
62,474,900 DKK for USD 5/30/08 13,075,698 4,216
11,076,094 Euro for
USD 5/30/08 17,277,172 33,988
1,763,055,000 JPY for USD 5/30/08 16,983,852 (36,158)
16,125,175 NOK for USD 5/30/08 3,159,743 569
----------- ----------
$73,329,163 $(112,326)
=========== ==========
(Value on Settlement Date $73,216,837)
Notes to Schedule of Investments
ADR = American Depositary Receipt
AUD = Australian Dollar
DKK = Danish Krone
HOLDRs = Holding Company Depositary Receipts
JPY = Japanese Yen
NOK = Norwegian Krona
ORD = Foreign Ordinary Share
SPDR = Standard and Poor's Depositary Receipt
USD = United States Dollar
(1) Non-income producing.
See Notes to Financial Statements.
- ------
11
STATEMENT OF ASSETS AND LIABILITIES
APRIL 30, 2008 (UNAUDITED)
ASSETS
Investment securities, at value (cost of $993,863,460) $1,274,730,056
Cash 9,527
Receivable for investments sold 34,555,795
Receivable for forward foreign currency exchange contracts 38,773
Dividends and interest receivable 818,432
--------------
1,310,152,583
--------------
LIABILITIES
Payable for investments purchased 40,703,799
Payable for forward foreign currency exchange contracts 151,099
Accrued management fees 1,024,031
--------------
41,878,929
--------------
NET ASSETS $1,268,273,654
==============
CAPITAL SHARES, $0.01 PAR VALUE
Authorized 200,000,000
==============
Outstanding 43,705,535
==============
NET ASSET VALUE PER SHARE $29.02
==============
NET ASSETS CONSIST OF:
Capital (par value and paid-in surplus) $ 935,712,713
Accumulated net investment loss (3,481,879)
Undistributed net realized gain on investment and foreign
currency transactions 55,322,616
Net unrealized appreciation on investments and translation of
assets and liabilities in foreign currencies 280,720,204
--------------
$1,268,273,654
==============
See Notes to Financial Statements.
- ------
12
STATEMENT OF OPERATIONS
FOR THE SIX MONTHS ENDED APRIL 30, 2008 (UNAUDITED)
INVESTMENT INCOME (LOSS)
INCOME:
Dividends (net of foreign taxes withheld of $54,326) $ 2,588,789
Interest 227,835
--------------
2,816,624
--------------
EXPENSES:
Management fees 6,402,548
Directors' fees and expenses 14,538
Other expenses 3,722
--------------
6,420,808
--------------
NET INVESTMENT INCOME (LOSS) (3,604,184)
--------------
REALIZED AND UNREALIZED GAIN (LOSS)
NET REALIZED GAINS (LOSS) ON:
Investment transactions 65,459,485
Foreign currency transactions (5,536,867)
--------------
59,922,618
--------------
CHANGE IN NET UNREALIZED APPRECIATION (DEPRECIATION) ON:
Investments (169,461,777)
Translation of assets and liabilities in foreign currencies 107,707
--------------
(169,354,070)
--------------
NET REALIZED AND UNREALIZED GAIN (LOSS) (109,431,452)
--------------
NET INCREASE (DECREASE) IN NET ASSETS RESULTING FROM OPERATIONS $(113,035,636)
==============
See Notes to Financial Statements.
- ------
13
STATEMENT OF CHANGES IN NET ASSETS
SIX MONTHS ENDED APRIL 30, 2008 (UNAUDITED) AND YEAR ENDED OCTOBER 31, 2007
Increase (Decrease) in Net Assets 2008 2007
OPERATIONS
Net investment income (loss) $ (3,604,184) $ (6,683,330)
Net realized gain (loss) 59,922,618 252,077,446
Change in net unrealized appreciation
(depreciation) (169,354,070) 286,275,760
-------------- --------------
Net increase (decrease) in net assets resulting
from operations (113,035,636) 531,669,876
-------------- --------------
CAPITAL SHARE TRANSACTIONS
Proceeds from shares sold 5,980,357 11,497,937
Payments for shares redeemed (45,884,987) (106,533,236)
-------------- --------------
Net increase (decrease) in net assets from
capital share transactions (39,904,630) (95,035,299)
-------------- --------------
NET INCREASE (DECREASE) IN NET ASSETS (152,940,266) 436,634,577
NET ASSETS
Beginning of period 1,421,213,920 984,579,343
-------------- --------------
End of period $1,268,273,654 $1,421,213,920
============== ==============
Accumulated undistributed net investment income
(loss) $(3,481,879) $122,505
============== ==============
TRANSACTIONS IN SHARES OF THE FUND
Sold 206,730 468,391
Redeemed (1,578,669) (4,291,934)
-------------- --------------
Net increase (decrease) in shares of the fund (1,371,939) (3,823,543)
============== ==============
See Notes to Financial Statements.
- ------
14
NOTES TO FINANCIAL STATEMENTS
APRIL 30, 2008 (UNAUDITED)
1. ORGANIZATION AND SUMMARY OF SIGNIFICANT ACCOUNTING POLICIES
ORGANIZATION -- American Century Mutual Funds, Inc. (the corporation) is
registered under the Investment Company Act of 1940 (the 1940 Act) as an
open-end management investment company. Giftrust Fund (the fund) is one fund
in a series issued by the corporation. The fund is diversified under the 1940
Act. The fund's investment objective is to seek long-term capital growth. The
fund pursues its objective by investing primarily in equity securities of
medium-sized and smaller companies that management believes will increase in
value over time. The following is a summary of the fund's significant
accounting policies.
SECURITY VALUATIONS -- Securities traded primarily on a principal securities
exchange are valued at the last reported sales price, or at the mean of the
latest bid and asked prices where no last sales price is available. Depending
on local convention or regulation, securities traded over-the-counter are
valued at the mean of the latest bid and asked prices, the last sales price,
or the official close price. Debt securities not traded on a principal
securities exchange are valued through a commercial pricing service or at the
mean of the most recent bid and asked prices. Securities traded on foreign
securities exchanges and over-the-counter markets are normally completed
before the close of business on days that the New York Stock Exchange (the
Exchange) is open and may also take place on days when the Exchange is not
open. If an event occurs after the value of a security was established but
before the net asset value per share was determined that was likely to
materially change the net asset value, that security would be valued as
determined in accordance with procedures adopted by the Board of Directors. If
the fund determines that the market price of a portfolio security is not
readily available, or that the valuation methods mentioned above do not
reflect the security's fair value, such security is valued as determined by
the Board of Directors or its designee, in accordance with procedures adopted
by the Board of Directors, if such determination would materially impact a
fund's net asset value. Certain other circumstances may cause the fund to use
alternative procedures to value a security such as: a security has been
declared in default; trading in a security has been halted during the trading
day; or there is a foreign market holiday and no trading will commence.
SECURITY TRANSACTIONS -- For financial reporting purposes, security
transactions are accounted for as of the trade date. Net realized gains and
losses are determined on the identified cost basis, which is also used for
federal income tax purposes. Certain countries impose taxes on realized gains
on the sale of securities registered in their country. The fund records the
foreign tax expense, if any, on an accrual basis. The realized and unrealized
tax provision reduces the net realized gain (loss) on investment transactions
and net unrealized appreciation (depreciation) on investments, respectively.
INVESTMENT INCOME -- Dividend income less foreign taxes withheld, if any, is
recorded as of the ex-dividend date. Distributions received on securities that
represent a return of capital or capital gain are recorded as a reduction of
cost of investments and/or as a realized gain. The fund estimates the
components of distributions received that may be considered nontaxable
distributions or capital gain distributions for income tax purposes. Interest
income is recorded on the accrual basis and includes accretion of discounts
and amortization of premiums.
FOREIGN CURRENCY TRANSACTIONS -- All assets and liabilities initially
expressed in foreign currencies are translated into U.S. dollars at prevailing
exchange rates at period end. Purchases and sales of investment securities,
dividend and interest income, and certain expenses are translated at the rates
of exchange prevailing on the respective dates of such transactions. For
assets and liabilities, other than investments in securities, net realized and
unrealized gains and losses from foreign currency translations arise from
changes in currency exchange rates.
Net realized and unrealized foreign currency exchange gains or losses
occurring during the holding period of investment securities are a component
of realized gain (loss) on investment transactions and unrealized appreciation
(depreciation) on investments, respectively. Certain countries may impose
taxes on the contract amount of purchases and sales of foreign currency
contracts in their currency. The fund records the foreign tax expense, if any,
as a reduction to the net realized gain (loss) on foreign currency
transactions.
FORWARD FOREIGN CURRENCY EXCHANGE CONTRACTS -- The fund may enter into forward
foreign currency exchange contracts to facilitate transactions of securities
denominated in a foreign currency or to hedge the fund's exposure to foreign
currency exchange rate fluctuations. The net U.S. dollar value of foreign
currency underlying all contractual commitments held by the fund and the
resulting unrealized appreciation or depreciation are determined daily using
prevailing exchange rates. The fund bears the risk of an unfavorable change in
the foreign currency exchange rate underlying the forward contract.
Additionally, losses may arise if the counterparties do not perform under the
contract terms.
- ------
15
REPURCHASE AGREEMENTS -- The fund may enter into repurchase agreements with
institutions that American Century Investment Management, Inc. (ACIM) (the
investment advisor) has determined are creditworthy pursuant to criteria
adopted by the Board of Directors. Each repurchase agreement is recorded at
cost. The fund requires that the collateral, represented by securities,
received in a repurchase transaction be transferred to the custodian in a
manner sufficient to enable the fund to obtain those securities in the event
of a default under the repurchase agreement. ACIM monitors, on a daily basis,
the securities transferred to ensure the value, including accrued interest, of
the securities under each repurchase agreement is equal to or greater than
amounts owed to the fund under each repurchase agreement.
JOINT TRADING ACCOUNT -- Pursuant to an Exemptive Order issued by the
Securities and Exchange Commission, the fund, along with other registered
investment companies having management agreements with ACIM or American
Century Global Investment Management, Inc. (ACGIM), may transfer uninvested
cash balances into a joint trading account. These balances are invested in one
or more repurchase agreements that are collateralized by U.S. Treasury or
Agency obligations.
INCOME TAX STATUS -- It is the fund's policy to distribute substantially all
net investment income and net realized gains to shareholders and to otherwise
qualify as a regulated investment company under provisions of the Internal
Revenue Code. The fund is no longer subject to examination by tax authorities
for years prior to 2004. At this time, management has not identified any
uncertain tax positions for which it is reasonably possible that the total
amounts of unrecognized tax benefits will significantly change in the next
twelve months. Accordingly, no provision has been made for federal or state
income taxes. Interest and penalties associated with any federal or state
income tax obligations, if any, are recorded as interest expense.
DISTRIBUTIONS TO SHAREHOLDERS -- Distributions to shareholders are recorded on
the ex-dividend date. Distributions from net investment income and net
realized gains, if any, are generally declared and paid annually.
INDEMNIFICATIONS -- Under the corporation's organizational documents, its
officers and directors are indemnified against certain liabilities arising out
of the performance of their duties to the fund. In addition, in the normal
course of business, the fund enters into contracts that provide general
indemnifications. The fund's maximum exposure under these arrangements is
unknown as this would involve future claims that may be made against the fund.
The risk of material loss from such claims is considered by management to be
remote.
USE OF ESTIMATES -- The financial statements are prepared in conformity with
accounting principles generally accepted in the United States of America,
which may require management to make certain estimates and assumptions at the
date of the financial statements. Actual results could differ from these
estimates.
2. FEES AND TRANSACTIONS WITH RELATED PARTIES
MANAGEMENT FEES -- The corporation has entered into a Management Agreement
with ACIM, under which ACIM provides the fund with investment advisory and
management services in exchange for a single, unified management fee (the
fee). The Agreement provides that all expenses of the fund, except brokerage
commissions, taxes, interest, fees and expenses of those directors who are not
considered "interested persons" as defined in the 1940 Act (including counsel
fees) and extraordinary expenses, will be paid by ACIM. The fee is computed
and accrued daily based on the daily net assets of the fund and paid monthly
in arrears. The annual management fee for the fund is 1.00%.
RELATED PARTIES -- Certain officers and directors of the corporation are also
officers and/or directors, and, as a group, controlling stockholders of
American Century Companies, Inc. (ACC), the parent of the corporation's
investment advisor, ACIM, the distributor of the corporation, American Century
Investment Services, Inc., and the corporation's transfer agent, American
Century Services, LLC.
The fund is eligible to invest in a money market fund for temporary purposes,
which is managed by J.P. Morgan Investment Management, Inc. (JPMIM). JPMIM is
a wholly owned subsidiary of JPMorgan Chase & Co. (JPM). JPM is an equity
investor in ACC. Prior to December 12, 2007, the fund had a bank line of
credit agreement with JPMorgan Chase Bank (JPMCB). JPMCB is a custodian of the
fund and a wholly owned subsidiary of JPM.
- ------
16
3. INVESTMENT TRANSACTIONS
Purchases and sales of investment securities, excluding short-term
investments, for the six months ended April 30, 2008, were $983,746,840 and
$1,029,260,353, respectively.
4. BANK LINE OF CREDIT
Effective December 12, 2007, the fund, along with certain other funds managed
by ACIM or ACGIM, has a $500,000,000 unsecured bank line of credit agreement
with Bank of America, N.A. Prior to December 12, 2007, the fund, along with
certain other funds managed by ACIM or ACGIM, had a $500,000,000 unsecured
bank line of credit agreement with JPMCB. The fund may borrow money for
temporary or emergency purposes to fund shareholder redemptions. Borrowings
under the agreement, which is subject to annual renewal, bear interest at the
Federal Funds rate plus 0.40%. The fund did not borrow from the line during
the six months ended April 30, 2008.
5. RISK FACTORS
The fund's investment process may result in high portfolio turnover, high
commission costs and high capital gains distributions. In addition, its
investment approach may involve higher volatility and risk. There are certain
risks involved in investing in foreign securities. These risks include those
resulting from future adverse political, social, and economic developments,
fluctuations in currency exchange rates, the possible imposition of exchange
controls, and other foreign laws or restrictions. Investing in emerging
markets may accentuate these risks.
6. FEDERAL TAX INFORMATION
The book-basis character of distributions made during the year from net
investment income or net realized gains may differ from their ultimate
characterization for federal income tax purposes. These differences reflect
the differing character of certain income items and net realized gains and
losses for financial statement and tax purposes, and may result in
reclassification among certain capital accounts on the financial statements.
As of April 30, 2008, the components of investments for federal income tax
purposes were as follows:
Federal tax cost of investments $998,022,963
=============
Gross tax appreciation of investments $291,190,991
Gross tax depreciation of investments (14,483,898)
-------------
Net tax appreciation (depreciation) of investments $ 276,707,093
=============
The difference between book-basis and tax-basis cost and unrealized
appreciation (depreciation) is attributable primarily to the tax deferral of
losses on wash sales.
As of October 31, 2007, the fund had accumulated capital losses of
$(2,183,412), which represent net capital loss carryovers that may be used to
offset future realized capital gains for federal income tax purposes. The
capital loss carryovers expire in 2010.
7. RECENTLY ISSUED ACCOUNTING STANDARDS
The Financial Accounting Standards Board (FASB) issued Statement of Financial
Accounting Standards No. 157, "Fair Value Measurements" (FAS 157), in
September 2006, which is effective for fiscal years beginning after November
15, 2007. FAS 157 defines fair value, establishes a framework for measuring
fair value and expands the required financial statement disclosures about fair
value measurements. Management is currently evaluating the impact that
adopting FAS 157 will have on the financial statement disclosures.
In March 2008, the FASB issued Statement of Financial Accounting Standards No.
161, "Disclosures about Derivative Instruments and Hedging Activities -- an
amendment of FASB Statement No. 133" (FAS 161). FAS 161 is effective for
fiscal years beginning after November 15, 2008. FAS 161 amends and expands
disclosures about derivative instruments and hedging activities. FAS 161
requires qualitative disclosures about the objectives and strategies of
derivative instruments, quantitative disclosures about the fair value amounts
of and gains and losses on derivative instruments, and disclosures of
credit-risk-related contingent features in hedging activities. Management is
currently evaluating the impact that adopting FAS 161 will have on the
financial statement disclosures.
- ------
17
FINANCIAL HIGHLIGHTS
Giftrust
For a Share Outstanding Throughout the Years Ended October 31 (except as noted)
2008(1) 2007 2006 2005 2004 2003
PER-SHARE DATA
Net Asset
Value,
Beginning of
Period $31.53 $20.13 $17.28 $13.81 $14.04 $11.88
------ ------ ------ ------ -------- --------
Income From
Investment
Operations
Net
Investment
Income
(Loss) (0.08) (0.14) (0.05) (0.08) (0.01)(2) (0.07)(2)
Net
Realized
and
Unrealized
Gain
(Loss) (2.43) 11.54 2.90 3.55 (0.22) 2.23
------ ------ ------ ------ -------- --------
Total From
Investment
Operations (2.51) 11.40 2.85 3.47 (0.23) 2.16
------ ------ ------ ------ -------- --------
Net Asset
Value, End of
Period $29.02 $31.53 $20.13 $17.28 $13.81 $14.04
====== ====== ====== ====== ======== ========
TOTAL RETURN(3) (7.99)% 56.63% 16.49% 25.13% (1.64)% 18.18%
RATIOS/SUPPLEMENTAL DATA
Ratio of
Operating
Expenses to
Average Net
Assets 1.00%(4) 1.00% 1.00% 1.00% 0.49%(5) 1.00%
Ratio of Net
Investment
Income (Loss)
to Average Net
Assets (0.56)%(4) (0.57)% (0.22)% (0.46)% (0.09)%(5) (0.55)%
Portfolio
Turnover Rate 77% 147% 229% 223% 260% 140%
Net Assets,
End of Period
(in millions) $1,268 $1,421 $985 $927 $865 $896
(1) For the six months ended April 30, 2008 (unaudited).
(2) Computed using average shares outstanding throughout the period.
(3) Total return assumes reinvestment of net investment income and capital
gains distributions, if any. Total returns for periods less than one year are
not annualized. Total returns are calculated based on the net asset value on
the last business day.
(4) Annualized.
(5) During a portion of the year ended October 31, 2004, the investment
advisor voluntarily agreed to waive its management fee. The waiver was in
effect from February 1, 2004 through July 31, 2004. Had fees not been waived
the ratio of operating expenses to average net assets and the ratio of net
investment income (loss) to average net assets would have been 1.00% and
(0.60)%, respectively.
See Notes to Financial Statements.
- ------
18
ADDITIONAL INFORMATION
PROXY VOTING GUIDELINES
American Century Investment Management, Inc., the fund's investment advisor,
is responsible for exercising the voting rights associated with the securities
purchased and/or held by the fund. A description of the policies and
procedures the advisor uses in fulfilling this responsibility is available
without charge, upon request, by calling 1-800-345-2021. It is also available
on American Century Investments' website at americancentury.com and on the
Securities and Exchange Commission's website at sec.gov. Information regarding
how the investment advisor voted proxies relating to portfolio securities
during the most recent 12-month period ended June 30 is available on the
"About Us" page at americancentury.com. It is also available at sec.gov.
QUARTERLY PORTFOLIO DISCLOSURE
The fund files its complete schedule of portfolio holdings with the Securities
and Exchange Commission (SEC) for the first and third quarters of each fiscal
year on Form N-Q. The fund's Form N-Q is available on the SEC's website at
sec.gov, and may be reviewed and copied at the SEC's Public Reference Room in
Washington, DC. Information on the operation of the Public Reference Room may
be obtained by calling 1-800-SEC-0330. The fund also makes its complete
schedule of portfolio holdings for the most recent quarter of its fiscal year
available on its website at americancentury.com and, upon request, by calling
1-800-345-2021.
- ------
19
INDEX DEFINITIONS
THE FOLLOWING INDICES ARE USED TO ILLUSTRATE INVESTMENT MARKET, SECTOR, OR
STYLE PERFORMANCE OR TO SERVE AS FUND PERFORMANCE COMPARISONS. They are not
investment products available for purchase.
THE RUSSELL 1000® INDEX IS A MARKET-CAPITALIZATION WEIGHTED, LARGE-CAP INDEX
CREATED BY FRANK RUSSELL COMPANY TO MEASURE THE PERFORMANCE OF THE 1,000
LARGEST OF THE 3,000 LARGEST PUBLICLY TRADED U.S. companies, based on total
market capitalization.
THE RUSSELL 1000® GROWTH INDEX MEASURES THE PERFORMANCE OF THOSE RUSSELL 1000
INDEX COMPANIES (THE 1,000 LARGEST OF THE 3,000 LARGEST PUBLICLY TRADED U.S.
companies, based on total market capitalization) with higher price-to-book
ratios and higher forecasted growth values.
THE RUSSELL 1000® VALUE INDEX MEASURES THE PERFORMANCE OF THOSE RUSSELL 1000
INDEX COMPANIES (THE 1,000 LARGEST OF THE 3,000 LARGEST PUBLICLY TRADED U.S.
companies, based on total market capitalization) with lower price-to-book
ratios and lower forecasted growth values.
THE RUSSELL 2000® INDEX IS A MARKET-CAPITALIZATION WEIGHTED INDEX CREATED BY
FRANK RUSSELL COMPANY TO MEASURE THE PERFORMANCE OF THE 2,000 SMALLEST OF THE
3,000 LARGEST PUBLICLY TRADED U.S. companies, based on total market
capitalization.
THE RUSSELL 2000® GROWTH INDEX MEASURES THE PERFORMANCE OF THOSE RUSSELL 2000
INDEX COMPANIES (THE 2,000 SMALLEST OF THE 3,000 LARGEST PUBLICLY TRADED U.S.
companies, based on total market capitalization) with higher price-to-book
ratios and higher forecasted growth values.
THE RUSSELL 2000® VALUE INDEX MEASURES THE PERFORMANCE OF THOSE RUSSELL 2000
INDEX COMPANIES (THE 2,000 SMALLEST OF THE 3,000 LARGEST PUBLICLY TRADED U.S.
companies, based on total market capitalization) with lower price-to-book
ratios and lower forecasted growth values.
THE RUSSELL MIDCAP® INDEX MEASURES THE PERFORMANCE OF THE 800 SMALLEST OF THE
1,000 LARGEST PUBLICLY TRADED U.S. companies, based on total market
capitalization.
THE RUSSELL MIDCAP® GROWTH INDEX MEASURES THE PERFORMANCE OF THOSE RUSSELL
MIDCAP INDEX COMPANIES (THE 800 SMALLEST OF THE 1,000 LARGEST PUBLICLY TRADED
U.S. companies, based on total market capitalization) with higher
price-to-book ratios and higher forecasted growth values.
THE RUSSELL MIDCAP® VALUE INDEX MEASURES THE PERFORMANCE OF THOSE RUSSELL
MIDCAP INDEX COMPANIES (THE 800 SMALLEST OF THE 1,000 LARGEST PUBLICLY TRADED
U.S. companies, based on total market capitalization) with lower price-to-book
ratios and lower forecasted growth values.
- ------
20
[back cover]
[american century investments logo and text logo ®]
CONTACT US
AMERICANCENTURY.COM
AUTOMATED INFORMATION LINE . . . . . . . . . . . . . . . . 1-800-345-8765
INVESTOR SERVICES REPRESENTATIVE . . . . . . . . . . . . . 1-800-345-2021
or 816-531-5575
BUSINESS, NOT-FOR-PROFIT, EMPLOYER-SPONSORED RETIREMENT PLANS.
.. . . . . . . . . . . . . . . . . . . . . . . . . . 1-800-345-3533
BANKS AND TRUST COMPANIES, BROKER-DEALERS,
FINANCIAL PROFESSIONALS, INSURANCE COMPANIES . . . . . . . 1-800-345-6488
TELECOMMUNICATIONS DEVICE FOR THE DEAF . . . . . . . . . . 1-800-634-4113
AMERICAN CENTURY MUTUAL FUNDS, INC.
INVESTMENT ADVISOR:
American Century Investment Management, Inc.
Kansas City, Missouri
This report and the statements it contains are submitted for the general
information of our shareholders. The report is not authorized for distribution to
prospective investors unless preceded or accompanied by an effective prospectus.
American Century Investments
P.O. Box 419200
Kansas City, MO 64141-6200
PRSRT STD
U.S. POSTAGE PAID
AMERICAN CENTURY
COMPANIES
American Century Investment Services, Inc., Distributor
©2008 American Century Proprietary Holdings, Inc. All rights reserved.
0806
CL-SAN-60500S
[front cover]
SEMIANNUAL REPORT
APRIL 30, 2008
[american century investments logo and text logo ®]
AMERICAN CENTURY INVESTMENTS
SELECT FUND
CAPITAL GROWTH FUND
FOCUSED GROWTH FUND
FUNDAMENTAL EQUITY FUND
PRESIDENT'S LETTER
[photo of Jonathan Thomas]
JONATHAN THOMAS
Dear Investor,
At American Century Investments®, we are committed to helping you reach your
financial goals. Your success is the ultimate measure of our performance.
That's why we focus on achieving superior investment results and building
long-term relationships with investors like you.
Part of that relationship is to clearly communicate investment results and
what influenced them. To help you monitor your investment with us, we take
pride in providing you with the semiannual report for the American Century®
Select, Capital Growth, Focused Growth, and Fundamental Equity funds for the
six months ended April 30, 2008. We also recommend americancentury.com, where
we provide company news, quarterly portfolio commentaries, investment views,
and other useful information.
As noted on the website, 2008 marks the 50th anniversary of American Century
Investments. Since 1958, we've worked to make wise decisions with your
interests as our guide. Fifty years also means that we've met the challenges
of previous economic downturns. As we've crossed those hurdles and earned your
trust, our assets under management have grown to nearly $100 billion, putting
us in the top 5% of our industry. This growth has given us the resources to
offer a wide array of financial products and services, including a
well-diversified line-up of portfolios that provide you with many choices in
these uncertain times.
Though our offerings are diverse, they share several key qualities, including
our disciplined investment approach and active, team-based management. Strict
adherence to our processes and long-term strategies allows us to stay focused
during volatile periods. Investors in our portfolios also benefit from the sum
of our investment teams' expertise as they share research and information.
We'll continue to work hard to earn your trust. Thank you for your continued
support.
Sincerely,
/s/Jonathan Thomas
Jonathan S. Thomas
President and Chief Executive Officer
American Century Investments
TABLE OF CONTENTS
Market Perspective. . . . . . . . . . . . . . . . . . . . . . . . . . 2
U.S. Stock Index Returns . . . . . . . . . . . . . . . . . . . . . . 2
SELECT
Performance . . . . . . . . . . . . . . . . . . . . . . . . . . . . . 3
Portfolio Commentary. . . . . . . . . . . . . . . . . . . . . . . . . 5
Top Ten Holdings . . . . . . . . . . . . . . . . . . . . . . . . . . 5
Top Five Industries and Types of Investments in Portfolio. . . . . . 6
Schedule of Investments . . . . . . . . . . . . . . . . . . . . . . . 7
CAPITAL GROWTH
Performance . . . . . . . . . . . . . . . . . . . . . . . . . . . . . 10
Portfolio Commentary. . . . . . . . . . . . . . . . . . . . . . . . . 12
Top Ten Holdings . . . . . . . . . . . . . . . . . . . . . . . . . . 12
Top Five Industries and Types of Investments in Portfolio. . . . . . 13
Schedule of Investments . . . . . . . . . . . . . . . . . . . . . . . 14
FOCUSED GROWTH
Performance . . . . . . . . . . . . . . . . . . . . . . . . . . . . . 17
Portfolio Commentary. . . . . . . . . . . . . . . . . . . . . . . . . 19
Top Ten Holdings . . . . . . . . . . . . . . . . . . . . . . . . . . 19
Top Five Industries and Types of Investments in Portfolio. . . . . . 20
Schedule of Investments . . . . . . . . . . . . . . . . . . . . . . . 21
FUNDAMENTAL EQUITY
Performance . . . . . . . . . . . . . . . . . . . . . . . . . . . . . 24
Portfolio Commentary. . . . . . . . . . . . . . . . . . . . . . . . . 26
Top Ten Holdings . . . . . . . . . . . . . . . . . . . . . . . . . . 26
Top Five Industries and Types of Investments in Portfolio. . . . . . 27
Schedule of Investments . . . . . . . . . . . . . . . . . . . . . . . 28
Shareholder Fee Examples. . . . . . . . . . . . . . . . . . . . . . . 31
FINANCIAL STATEMENTS
Statement of Assets and Liabilities . . . . . . . . . . . . . . . . . 34
Statement of Operations . . . . . . . . . . . . . . . . . . . . . . . 36
Statement of Changes in Net Assets. . . . . . . . . . . . . . . . . . 37
Notes to Financial Statements . . . . . . . . . . . . . . . . . . . . 39
Financial Highlights. . . . . . . . . . . . . . . . . . . . . . . . . 48
OTHER INFORMATION
Additional Information. . . . . . . . . . . . . . . . . . . . . . . . 72
Index Definitions . . . . . . . . . . . . . . . . . . . . . . . . . . 73
The opinions expressed in the Market Perspective and each of the Portfolio
Commentaries reflect those of the portfolio management team as of the date of
the report, and do not necessarily represent the opinions of American Century
or any other person in the American Century organization. Any such opinions
are subject to change at any time based upon market or other conditions and
American Century disclaims any responsibility to update such opinions. These
opinions may not be relied upon as investment advice and, because investment
decisions made by American Century funds are based on numerous factors, may
not be relied upon as an indication of trading intent on behalf of any
American Century fund. Security examples are used for representational
purposes only and are not intended as recommendations to purchase or sell
securities. Performance information for comparative indices and securities is
provided to American Century by third party vendors. To the best of American
Century's knowledge, such information is accurate at the time of printing.
MARKET PERSPECTIVE
[photo of chief investment officer]
By Steve Lurito, Chief Investment Officer, U.S. Growth Equity
VOLATILITY UP, STOCKS DOWN
The six months ended April 30, 2008 saw stocks produce negative returns as
market volatility surged in the wake of the subprime credit crisis. In terms
of the economy, tighter credit and the slumping housing market hurt consumer
spending and confidence, leading many economists to suggest we're already in
recession. Meanwhile, mounting losses hurt the banks, brokers, and other big
institutional players important for the functioning of the financial markets.
Facing dual economic and financial crises, the Federal Reserve (the Fed) took
a series of extraordinary steps, slashing interest rates and acting as a
lender of last resort not only for banks, but also major brokers. That helped
stocks rebound, with many analysts suggesting that the mid-March buy-out of
investment bank Bear Stearns -- in a deal arranged by the Fed -- put a floor
under the market.
RETURNS BY SIZE, STYLE MIXED
Performance by size and style was mixed (see the accompanying table),
reflecting the volatile trading during the period, when corporate earnings
estimates were revised down sharply. Looking at returns by sector, energy
shares were the only segment to produce positive results during the six
months. At the other end of the spectrum, credit-related losses took a big
bite out of earnings for financials stocks, which performed worst. Consumer
discretionary shares also lagged badly, as did information technology stocks,
which suffered from poor pricing and demand trends for chips and some
consumer-related tech goods.
OPPORTUNITY AMID VOLATILITY
Despite the uncertainty surrounding the economy, we think growth-oriented
stocks can perform well relative to value as proven earnings growth becomes
scarce during economic slowdowns. And while we don't see an end to market
volatility anytime soon, we view this dynamic as a natural part of the
investing cycle -- and one that presents us with opportunities to build
positions in what we believe are high-quality companies trading at attractive
prices. Indeed, investors should rest assured that we're finding no shortage
of companies demonstrating sustained earnings growth and business improvement.
U.S. Stock Index Returns
For the six months ended April 30, 2008*
RUSSELL 1000 INDEX (LARGE-CAP) -9.54%
Russell 1000 Growth Index -9.28%
Russell 1000 Value Index -9.83%
RUSSELL MIDCAP INDEX -8.77%
Russell Midcap Growth Index -8.44%
Russell Midcap Value Index -9.20%
RUSSELL 2000 INDEX (SMALL-CAP) -12.92%
Russell 2000 Growth Index -14.14%
Russell 2000 Value Index -11.55%
*Total returns for periods less than one year are not annualized.
- ------
2
PERFORMANCE
Select
Total Returns as of April 30, 2008
Average Annual Returns
6 Since Inception
months(1) 1 year 5 years 10 years Inception Date
INVESTOR CLASS -9.41% 4.80% 7.36% 2.17% 13.12% 6/30/71(2)
RUSSELL 1000 GROWTH
INDEX(3) -9.28% -0.23% 9.52% 1.66% N/A(4) --
Institutional Class -9.32% 5.00% 7.56% 2.38% 5.58% 3/13/97
A Class(5)
No sales charge* -9.55% 4.54% 7.09% 1.92% 3.40%
With sales charge* -14.75% -1.48% 5.84% 1.32% 2.83% 8/8/97
B Class
No sales charge* -9.88% 3.71% 6.28% -- 7.38%
With sales charge* -14.88% -0.29% 6.12% -- 7.24% 1/31/03
C Class
No sales charge* -9.87% 3.74% 6.28% -- 7.40%
With sales charge* -10.70% 3.74% 6.28% -- 7.40% 1/31/03
R Class -9.65% 4.27% -- -- 3.21% 7/29/05
* Sales charges include initial sales charges and contingent deferred sales
charges (CDSCs), as applicable. A Class shares have a 5.75% maximum initial
sales charge for equity funds and may be subject to a maximum CDSC of 1.00%. B
Class shares redeemed within six years of purchase are subject to a CDSC that
declines from 5.00% during the first year after purchase to 0.00% the sixth
year after purchase. C Class shares redeemed within 12 months of purchase are
subject to a maximum CDSC of 1.00%. The SEC requires that mutual funds provide
performance information net of maximum sales charges in all cases where
charges could be applied.
(1) Total returns for periods less than one year are not annualized.
(2) Although the fund's actual inception date was 10/31/58, this inception
date corresponds with the investment advisor's implementation of its current
investment philosophy and practices.
(3) Data provided by Lipper Inc. -- A Reuters Company. ©2008 Reuters. All
rights reserved. Any copying, republication or redistribution of Lipper
content, including by caching, framing or similar means, is expressly
prohibited without the prior written consent of Lipper. Lipper shall not be
liable for any errors or delays in the content, or for any actions taken in
reliance thereon.
The data contained herein has been obtained from company reports, financial
reporting services, periodicals and other resources believed to be reliable.
Although carefully verified, data on compilations is not guaranteed by Lipper
and may be incomplete. No offer or solicitations to buy or sell any of the
securities herein is being made by Lipper.
(4) Benchmark began 12/29/78.
(5) Prior to September 4, 2007, the A Class was referred to as the Advisor
Class. Performance, with sales charge, prior to that date has been adjusted to
reflect the A Class's current sales charge.
Data presented reflect past performance. Past performance is no guarantee of
future results. Current performance may be higher or lower than the
performance shown. Investment return and principal value will fluctuate, and
redemption value may be more or less than original cost. To obtain performance
data current to the most recent month end, please call 1-800-345-2021 or visit
americancentury.com. International investing involves special risks, such as
political instability and currency fluctuations.
Unless otherwise indicated, performance reflects Investor Class shares;
performance for other share classes will vary due to differences in fee
structure. For information about other share classes available, please consult
the prospectus. Data assumes reinvestment of dividends and capital gains, and
none of the charts reflect the deduction of taxes that a shareholder would pay
on fund distributions or the redemption of fund shares. Returns for the index
are provided for comparison. The fund's total returns include operating
expenses (such as transaction costs and management fees) that reduce returns,
while the total returns of the index do not.
- ------
3
Select
Growth of $10,000 Over 10 Years
$10,000 investment made April 30, 1998
One-Year Returns Over 10 Years
Periods ended April 30
1999 2000 2001 2002 2003 2004 2005 2006 2007 2008
Investor
Class 28.41% 13.38% -17.52% -15.63% -14.23% 19.70% -1.08% 7.37% 7.06% 4.80%
Russell
1000
Growth
Index 26.53% 27.58% -32.25% -20.10% -14.35% 21.65% 0.40% 15.18% 12.25% -0.23%
Data presented reflect past performance. Past performance is no guarantee of
future results. Current performance may be higher or lower than the
performance shown. Investment return and principal value will fluctuate, and
redemption value may be more or less than original cost. To obtain performance
data current to the most recent month end, please call 1-800-345-2021 or visit
americancentury.com. International investing involves special risks, such as
political instability and currency fluctuations.
Unless otherwise indicated, performance reflects Investor Class shares;
performance for other share classes will vary due to differences in fee
structure. For information about other share classes available, please consult
the prospectus. Data assumes reinvestment of dividends and capital gains, and
none of the charts reflect the deduction of taxes that a shareholder would pay
on fund distributions or the redemption of fund shares. Returns for the index
are provided for comparison. The fund's total returns include operating
expenses (such as transaction costs and management fees) that reduce returns,
while the total returns of the index do not.
- ------
4
PORTFOLIO COMMENTARY
Select
Portfolio Managers: Keith Lee and Michael Li
PERFORMANCE SUMMARY
Select returned -9.41%* for the six months ended April 30, 2008, compared with
the -9.28% return of its benchmark, the Russell 1000 Growth Index, and the
- -9.64%** return of the S&P 500 Index, a broader market measure.
As discussed in the Market Perspective on page 2, equity markets generally
declined during the reporting period, as the subprime-mortgage-driven credit
crisis spread to other areas of the economy, and rising energy and commodity
prices increased inflation concerns. In this environment, both growth and
value stocks lost ground across the capitalization spectrum.
Although the portfolio underperformed its benchmark for the reporting period,
it did derive gains relative to the benchmark in several sectors. Notably,
stock selection in the materials, consumer discretionary, and financials
sectors yielded relative strength. Those successes, though, were not enough to
overcome the detrimental effects of poor stock selection in the information
technology sector and a slight overweight allocation and stock selection in
the health care sector.
INFORMATION TECHNOLOGY LED DECLINE
Within the information technology sector, portfolio overweight EMC was
negatively affected by lower-than-expected growth guidance from its software
subsidiary VMware. Although it delivered disappointing performance results for
the reporting period, EMC remains a large holding in the portfolio as its
long-term growth outlook and competitive position remain intact.
An overweight stake in eBay also detracted from Select's performance as growth
in the company's core ecommerce Web site continued to decelerate due to a
deteriorating competitive position and a general maturation of the business.
Given these trends, eBay is no longer a portfolio holding.
HEALTH CARE LAGGED
The health care sector was home to Select's most significant detractor from
performance. Portfolio overweight Schering-Plough substantially underperformed
due to cautious reviews of its cholesterol-lowering drug Vytorin by the
American College of Cardiology and New England Journal of Medicine. Although
we had previously viewed market concerns over this drug as unsubstantiated,
the Select team ultimately exited the position given this new development.
Top Ten Holdings as of April 30, 2008
% of net % of net
assets as of assets as of
4/30/08 10/31/07
Microsoft Corp. 3.4% 2.4%
Cisco Systems Inc. 2.7% 3.4%
Apple Inc. 2.6% 2.2%
Transocean Inc.(1) 2.6% 2.6%
Occidental Petroleum Corp. 2.4% 2.1%
General Dynamics Corp. 2.4% 2.1%
Thermo Fisher Scientific Inc. 2.3% 2.1%
CVS/Caremark Corp. 2.3% 2.1%
MEMC Electronic Materials Inc. 2.3% 4.1%
Emerson Electric Co. 2.3% 2.0%
(1) Transocean Inc. acquired GlobalSantaFe Corp. on 11/27/07.
* All fund returns referenced in this commentary are for Investor Class
shares. Total returns for periods less than one year are not annualized.
** The S&P 500 Index returns for the one-, five- and 10-year periods ended
April 30, 2008, were 8.23%, 10.62% and 3.89%, respectively.
- ------
5
Select
MATERIALS LED PERFORMANCE
The portfolio's overweight allocation to the materials sector reflected a
focus on the chemicals group. Here, a stake in Mosaic yielded the largest
positive contribution to absolute and relative portfolio returns as its share
price climbed 76%. The fertilizer company continued to benefit from secularly
higher demand in the fertilizer market, driven by a higher standard of living
in emerging-market countries, a lower availability of farmland and a greater
global focus on biofuels.
ALTERNATIVE ENERGY HOLDINGS GAINED
Alternative energy demand continued to drive up the share price for portfolio
holding Vestas Wind Systems AS (Vestas). Denmark-based Vestas develops wind
power systems that harness wind energy to create electricity. Its share price
climbed 23% in the reporting period as oil prices continued to rise and global
demand for clean energy accelerated.
Strong electricity infrastructure spending and increasing demand for
energy-efficient technologies also helped electric power company ABB Ltd. to
contribute positively to Select's performance. Not constituents of the
benchmark, both Vestas and ABB boosted relative portfolio returns.
AVOIDING PITFALLS HELPED
The financials sector continued to feel the adverse effects of the subprime
mortgage market implosion and related credit crunch during the reporting
period. Although the portfolio's exposure to the sector detracted from
absolute returns, effective selection within the group resulted in strength
relative to the benchmark. In particular, Select altogether avoided the
diversified financial services, consumer finance, and thrifts and mortgage
finance industries, which dragged down benchmark returns.
OUTLOOK
The reporting period was a difficult time for large-capitalization, growth and
momentum-oriented investment styles. The Select fund's investment process,
which emphasizes these characteristics, remained focused on the fundamental
business prospects of its portfolio investments, regardless of short-term
volatility. Going forward, we remain confident in our investment belief that
stocks which exhibit high quality, accelerating fundamentals, positive
relative strength, and attractive valuations will outperform in the long term.
Top Five Industries as of April 30, 2008
% of net % of net
assets as of assets as of
4/30/08 10/31/07
Software 7.3% 6.1%
Electrical Equipment 7.0% 7.4%
Computers & Peripherals 6.9% 7.7%
Semiconductors & Semiconductor Equipment 6.8% 7.3%
Capital Markets 5.0% 3.8%
Types of Investments in Portfolio
% of net % of net
assets as of assets as of
4/30/08 10/31/07
Domestic Common Stocks 84.4% 86.7%
Foreign Common Stocks(1) 13.1% 12.0%
TOTAL COMMON STOCKS 97.5% 98.7%
Temporary Cash Investments 2.0% 1.7%
Other Assets and Liabilities(2) 0.5% (0.4)%
(1) Includes depositary shares, dual listed securities and foreign ordinary
shares.
(2) Includes securities lending collateral and other assets and liabilities.
- ------
6
SCHEDULE OF INVESTMENTS
Select
APRIL 30, 2008 (UNAUDITED)
Shares Value
Common Stocks -- 97.5%
AEROSPACE & DEFENSE -- 3.4%
626,175 General Dynamics Corp. $ 56,618,746
379,602 Rockwell Collins 23,956,682
--------------
80,575,428
--------------
BEVERAGES -- 4.6%
791,544 Coca-Cola Co. (The) 46,598,195
1,242,497 Diageo plc ORD 25,529,445
563,566 PepsiCo, Inc. 38,621,178
--------------
110,748,818
--------------
BIOTECHNOLOGY -- 4.5%
779,817 Genzyme Corp.(1) 54,860,126
1,021,186 Gilead Sciences, Inc.(1) 52,856,587
--------------
107,716,713
--------------
CAPITAL MARKETS -- 5.0%
1,100,642 Bank of New York Mellon Corp. (The) 47,910,946
350,954 Franklin Resources, Inc. 33,393,273
859,612 Invesco Ltd. 22,049,048
332,190 Morgan Stanley 16,144,434
--------------
119,497,701
--------------
CHEMICALS -- 4.4%
311,780 Air Products and Chemicals, Inc. 30,688,505
198,581 Monsanto Co. 22,642,206
413,934 Mosaic Co. (The)(1) 50,711,054
--------------
104,041,765
--------------
COMMUNICATIONS EQUIPMENT -- 2.7%
2,498,677 Cisco Systems Inc.(1) 64,066,078
--------------
COMPUTERS & PERIPHERALS -- 6.9%
360,991 Apple Inc.(1) 62,794,385
3,178,148 EMC Corp.(1) 48,943,479
1,136,618 Hewlett-Packard Co. 52,682,244
--------------
164,420,108
--------------
CONSTRUCTION & ENGINEERING -- 1.1%
420,871 Foster Wheeler Ltd.(1) 26,805,274
--------------
ELECTRIC UTILITIES -- 2.0%
470,117 Edison International 24,526,004
280,939 Exelon Corporation 24,014,666
--------------
48,540,670
--------------
Shares Value
ELECTRICAL EQUIPMENT -- 7.0%
1,724,651 ABB Ltd. ADR $ 52,895,046
1,054,479 Emerson Electric Co. 55,107,073
285,071 Q-Cells AG ORD(1) 33,394,106
235,516 Vestas Wind Systems AS ORD(1) 25,860,271
--------------
167,256,496
--------------
ENERGY EQUIPMENT & SERVICES -- 4.8%
399,373 National Oilwell Varco, Inc.(1) 27,337,082
266,685 Schlumberger Ltd. 26,815,177
418,057 Transocean Inc.(1) 61,646,685
--------------
115,798,944
--------------
FOOD & STAPLES RETAILING -- 4.4%
1,384,146 CVS/Caremark Corp. 55,877,974
832,677 Wal-Mart Stores, Inc. 48,278,612
--------------
104,156,586
--------------
FOOD PRODUCTS -- 1.0%
698,170 Unilever N.V. New York Shares 23,416,622
--------------
HEALTH CARE EQUIPMENT & SUPPLIES -- 2.6%
805,897 Baxter International Inc. 50,223,501
437,569 Hologic, Inc.(1) 12,772,639
--------------
62,996,140
--------------
HEALTH CARE PROVIDERS & SERVICES -- 3.7%
530,969 Aetna Inc. 23,150,248
447,901 Henry Schein, Inc.(1) 24,800,278
509,291 Medco Health Solutions Inc.(1) 25,230,277
485,215 UnitedHealth Group Inc. 15,832,565
--------------
89,013,368
--------------
HOTELS, RESTAURANTS & LEISURE -- 4.4%
873,021 McDonald's Corp. 52,014,591
1,309,373 Yum! Brands, Inc. 53,265,294
--------------
105,279,885
--------------
HOUSEHOLD PRODUCTS -- 1.7%
568,728 Colgate-Palmolive Co. 40,209,070
--------------
INSURANCE -- 1.6%
583,447 Aflac Inc. 38,898,411
--------------
INTERNET & CATALOG RETAIL -- 1.7%
250,110 Amazon.com, Inc.(1) 19,666,149
858,841 Expedia Inc.(1) 21,694,324
--------------
41,360,473
--------------
- ------
7
Select
Shares Value
INTERNET SOFTWARE & SERVICES -- 1.9%
676,239 Alibaba.com Ltd. ORD(1) $ 1,249,507
75,955 Google Inc. Cl A(1) 43,620,196
--------------
44,869,703
--------------
LIFE SCIENCES TOOLS & SERVICES -- 2.3%
968,966 Thermo Fisher Scientific Inc.(1) 56,074,062
--------------
MACHINERY -- 0.8%
229,656 Parker-Hannifin Corp. 18,338,032
--------------
MEDIA -- 1.8%
1,293,270 Walt Disney Co. (The) 41,940,746
--------------
METALS & MINING -- 1.7%
355,977 Freeport-McMoRan Copper & Gold, Inc. 40,492,384
--------------
MULTILINE RETAIL -- 0.6%
264,184 Kohl's Corp.(1) 12,905,388
--------------
OIL, GAS & CONSUMABLE FUELS -- 2.4%
702,263 Occidental Petroleum Corp. 58,435,304
--------------
PHARMACEUTICALS -- 0.8%
326,277 Allergan, Inc. 18,392,234
--------------
SEMICONDUCTORS & SEMICONDUCTOR EQUIPMENT -- 6.8%
478,399 ASML Holding N.V. ORD 13,694,631
1,922,898 Intel Corp. 42,803,709
1,439,773 Linear Technology Corp. 50,334,464
889,124 MEMC Electronic Materials Inc.(1) 55,988,139
--------------
162,820,943
--------------
SOFTWARE -- 7.3%
681,474 Adobe Systems Inc.(1) 25,412,165
2,864,712 Microsoft Corp. 81,701,587
81,100 Nintendo Co., Ltd. ORD 44,529,161
1,155,407 Oracle Corp.(1) 24,090,236
--------------
175,733,149
--------------
Shares Value
SPECIALTY RETAIL -- 1.0%
715,627 TJX Companies, Inc. (The) $ 23,057,502
--------------
TOBACCO -- 1.9%
649,784 Altria Group Inc. 12,995,680
649,784 Philip Morris International Inc.(1) 33,158,478
--------------
46,154,158
--------------
TRANSPORTATION INFRASTRUCTURE -- 0.7%
1,516,313 China Merchants Holdings International Co.
Ltd. ORD 7,782,599
11,039,000 Hopewell Highway Infrastructure Ltd. ORD 8,796,242
--------------
16,578,841
--------------
TOTAL COMMON STOCKS
(Cost $2,003,261,298) 2,330,590,996
--------------
Temporary Cash Investments -- 2.0%
Repurchase Agreement, Bank of America Securities, LLC,
(collateralized by various U.S. Treasury obligations, 0.625%,
4/15/13, valued at $40,212,551), in a joint trading account at
1.92%, dated 4/30/08, due 5/1/08 (Delivery value $39,402,101) 39,400,000
Repurchase Agreement, Deutsche Bank Securities, Inc.,
(collateralized by various U.S. Treasury obligations, 3.125%,
4/15/09, valued at $8,976,448), in a joint trading account at
1.92%, dated 4/30/08, due 5/1/08 (Delivery value $8,800,469) 8,800,000
--------------
TOTAL TEMPORARY CASH INVESTMENTS
(Cost $48,200,000) 48,200,000
--------------
TOTAL INVESTMENT SECURITIES -- 99.5%
(Cost $2,051,461,298) 2,378,790,996
--------------
OTHER ASSETS AND LIABILITIES -- 0.5% 12,176,434
--------------
TOTAL NET ASSETS -- 100.0% $2,390,967,430
==============
- ------
8
Select
Forward Foreign Currency Exchange Contracts
Unrealized
Contracts to Sell Settlement Date Value Gain (Loss)
90,791,418 DKK for USD 5/30/08 $19,002,210 $ 9,191
22,315,290 Euro for USD 5/30/08 34,808,760 68,477
9,570,333 GBP for USD 5/30/08 18,999,312 62,112
2,347,845,000 JPY for USD 5/30/08 22,617,247 (48,151)
------------ ------------
$95,427,529 $ 91,629
============ ============
(Value on Settlement Date $95,519,158)
Notes to Schedule of Investments
ADR = American Depositary Receipt
DKK = Danish Krone
GBP = British Pound
JPY = Japanese Yen
ORD = Foreign Ordinary Share
USD = United States Dollar
(1) Non-income producing.
See Notes to Financial Statements.
- ------
9
PERFORMANCE
Capital Growth
Total Returns as of April 30, 2008
Average Annual
Returns
Since Inception
6 months(1) 1 year Inception Date
A CLASS
No sales charge* -6.26% 6.99% 7.27%
With sales charge* -11.64% 0.80% 5.76% 2/27/04
RUSSELL 1000 GROWTH INDEX(2) -9.28% -0.23% 5.62% --
Investor Class -6.15% 7.20% 8.42% 7/29/05
Institutional Class -6.12% 7.42% 8.63% 7/29/05
B Class
No sales charge* -6.60% 6.14% 6.47%
With sales charge* -11.60% 2.14% 6.07% 2/27/04
C Class
No sales charge* -6.60% 6.14% 6.47%
With sales charge* -7.46% 6.14% 6.47% 2/27/04
R Class -6.38% 6.68% 7.89% 7/29/05
* Sales charges include initial sales charges and contingent deferred sales
charges (CDSCs), as applicable. A Class shares have a 5.75% maximum initial
sales charge for equity funds and may be subject to a maximum CDSC of 1.00%. B
Class shares redeemed within six years of purchase are subject to a CDSC that
declines from 5.00% during the first year after purchase to 0.00% the sixth
year after purchase. C Class shares redeemed within 12 months of purchase are
subject to a maximum CDSC of 1.00%. The SEC requires that mutual funds provide
performance information net of maximum sales charges in all cases where
charges could be applied.
(1) Total returns for periods less than one year are not annualized.
(2) Data provided by Lipper Inc. -- A Reuters Company. ©2008 Reuters. All
rights reserved. Any copying, republication or redistribution of Lipper
content, including by caching, framing or similar means, is expressly
prohibited without the prior written consent of Lipper. Lipper shall not be
liable for any errors or delays in the content, or for any actions taken in
reliance thereon.
The data contained herein has been obtained from company reports, financial
reporting services, periodicals and other resources believed to be reliable.
Although carefully verified, data on compilations is not guaranteed by Lipper
and may be incomplete. No offer or solicitations to buy or sell any of the
securities herein is being made by Lipper.
Data presented reflect past performance. Past performance is no guarantee of
future results. Current performance may be higher or lower than the
performance shown. Investment return and principal value will fluctuate, and
redemption value may be more or less than original cost. To obtain performance
data current to the most recent month end, please call 1-800-345-2021 or visit
americancentury.com.
Unless otherwise indicated, performance reflects A Class shares; performance
for other share classes will vary due to differences in fee structure. For
information about other share classes available, please consult the
prospectus. Data assumes reinvestment of dividends and capital gains, and none
of the charts reflect the deduction of taxes that a shareholder would pay on
fund distributions or the redemption of fund shares. Returns for the index are
provided for comparison. The fund's total returns include operating expenses
(such as transaction costs and management fees) that reduce returns, while the
total returns of the index do not.
- ------
10
Capital Growth
Growth of $10,000 Over Life of Class
$10,000 investment made February 27, 2004
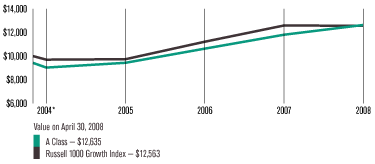
One-Year Returns Over Life of Class
Periods ended April 30
2004* 2005 2006 2007 2008
A Class (no sales charge) -4.20% 4.49% 12.69% 11.08% 6.99%
Russell 1000 Growth Index -3.00% 0.40% 15.18% 12.25% -0.23%
* From 2/27/04, the A Class's inception date. Not annualized. Capital Growth A
Class's initial investment is $9,425 to reflect the maximum 5.75% initial
sales charge.
Data presented reflect past performance. Past performance is no guarantee of
future results. Current performance may be higher or lower than the
performance shown. Investment return and principal value will fluctuate, and
redemption value may be more or less than original cost. To obtain performance
data current to the most recent month end, please call 1-800-345-2021 or visit
americancentury.com.
Unless otherwise indicated, performance reflects A Class shares; performance
for other share classes will vary due to differences in fee structure. For
information about other share classes available, please consult the
prospectus. Data assumes reinvestment of dividends and capital gains, and none
of the charts reflect the deduction of taxes that a shareholder would pay on
fund distributions or the redemption of fund shares. Returns for the index are
provided for comparison. The fund's total returns include operating expenses
(such as transaction costs and management fees) that reduce returns, while the
total returns of the index do not.
- ------
11
PORTFOLIO COMMENTARY
Capital Growth
Portfolio Managers: Greg Woodhams and Prescott LeGard
PERFORMANCE SUMMARY
Capital Growth returned -6.26%* during the six months ended April 30, 2008. By
comparison, the Russell 1000 Growth Index returned -9.28%, while the average
return for the Lipper Large-Cap Growth Funds category was -10.15%.** Better
measures of the portfolio's performance are its longer-term results compared
with the index, which can be seen on page 10.
Looking at the portfolio's absolute return, performance was driven by holdings
in the energy sector; materials and consumer staples also made positive
contributions. Information technology holdings were the leading detractors. In
terms of Capital Growth's performance relative to the Russell 1000 Growth
Index, outperformance was driven by stock selection among health care and
consumer discretionary stocks; holdings in the consumer staples, financials,
and energy sectors were other notable contributors. Stock picks in information
technology detracted most from relative results.
HEALTH CARE LED CONTRIBUTORS
Health care stocks contributed most to the portfolio's return relative to the
benchmark. Performance was driven by positioning in the pharmaceutical
industry. Capital Growth had no exposure to Merck, and managers eliminated
Schering-Plough at the end of 2007 after sizable gains. This helped relative
results after both stocks suffered in March from questions about the efficacy
of a jointly marketed cholesterol drug.
Positioning in health care equipment & supplies firms was another source of
relative strength. The leading contributor to return in this space was Becton
Dickinson, which benefited from increased usage around the world of its safety
devices that reduce accidents and infection among patients and caregivers.
CONSUMER DISCRETIONARY HELPED
In the consumer discretionary sector, outperformance was a result of stock
selection in the specialty retail and internet & catalog retailing segments.
It also helped to underweight stocks in the hotels, restaurants & leisure
category. Key contributions in the sector came from specialty retailers Urban
Outfitters and The TJX Companies. Internet travel portal priceline.com was
another leading contributor, helped by the acquisition of overseas vacation
properties and growth in its international business.
Top Ten Holdings as of April 30, 2008
% of net % of net
assets as of assets as of
4/30/08 10/31/07
Apple Inc. 3.3% 4.1%
Honeywell International Inc. 2.5% 1.1%
QUALCOMM Inc. 2.5% 0.8%
Emerson Electric Co. 2.3% 1.9%
Becton, Dickinson & Co. 2.2% 2.3%
Microsoft Corp. 2.2% 3.7%
Apache Corp. 2.2% 2.0%
Coca-Cola Co. (The) 2.2% 2.6%
Devon Energy Corp. 2.1% 1.8%
BorgWarner, Inc. 2.1% 2.0%
* All fund returns referenced in this commentary are for A Class shares and
are not reduced by sales charges. A Class shares are subject to a maximum
sales charge of 5.75%. Had the sales charge been applied, returns would be
lower than those shown. Total returns for periods less than one year are not
annualized.
** The Lipper Large-Cap Growth Funds average returns for the one-year and
since inception periods ended April 30, 2008, were 1.73% and 5.68%,
respectively.
- ------
12
Capital Growth
OTHER KEY CONTRIBUTORS
Three of the five largest contributors to portfolio performance were oil & gas
exploration and production firms Devon Energy, Apache, and XTO Energy. These
companies benefited from surging oil prices and reserve growth in the U.S. and
overseas. These shares also saw demand from investors who wanted exposure to
the energy sector but preferred to avoid the big, integrated firms that are
less closely tied to the price of oil and are seeing declining margins in
their refining businesses.
IT, INDUSTRIALS DETRACTED
Stock selection among information technology stocks detracted most from
relative return, led by holdings in the software, internet software &
services, and IT services industries. Indeed, the sector was home to the five
largest individual detractors from relative performance, led by enterprise
software firm VMWare. This overweight position was eliminated after the firm
gave a surprisingly poor profit forecast. The number-two detractor was IBM,
which reported good results and bought back stock during the period. The
portfolio had no exposure to the stock.
With the exception of utilities (a tiny portion of the fund and index),
industrials was the only other sector to detract from relative performance, as
it hurt to be significantly underweight the road & rail and air freight
industries. The leading detractor in the sector was an overweight position in
Continental Airlines, as investors worried about the effects of rising fuel
costs and a slowing economy. We eliminated the position.
OUTLOOK
The investment process focuses on large companies exhibiting sustainable
improvement in their businesses. We believe that owning such companies will
generate outperformance over time versus the Russell 1000 Growth Index and the
other funds in the large-growth peer group.
As a result, the portfolio's sector and industry selection are primarily a
result of identifying what we believe to be superior individual securities. As
of April 30, 2008, we found opportunity in the health care sector, the
portfolio's largest overweight position. The most notable sector underweight
was in information technology shares.
Top Five Industries as of April 30, 2008
% of net % of net
assets as of assets as of
4/30/08 10/31/07
Health Care Equipment & Supplies 8.0% 8.8%
Communications Equipment 7.9% 7.1%
Aerospace & Defense 6.3% 3.1%
Oil, Gas & Consumable Fuels 6.3% 7.1%
Semiconductors & Semiconductor Equipment 5.5% 3.4%
Types of Investments in Portfolio
% of net % of net
assets as of assets as of
4/30/08 10/31/07
Domestic Common Stocks 91.8% 95.2%
Foreign Common Stocks(1) 6.1% 4.3%
TOTAL COMMON STOCKS 97.9% 99.5%
Other Assets and Liabilities(2) 2.1% 0.5%
(1) Includes depositary shares, dual listed securities and foreign ordinary
shares.
(2) Includes securities lending collateral and other assets and liabilities.
- ------
13
SCHEDULE OF INVESTMENTS
Capital Growth
APRIL 30, 2008 (UNAUDITED)
Shares Value
Common Stocks -- 97.9%
AEROSPACE & DEFENSE -- 6.3%
3,348 Honeywell International Inc. $ 198,872
2,371 Raytheon Co. 151,673
2,110 United Technologies Corp. 152,912
-----------
503,457
-----------
AUTO COMPONENTS -- 2.1%
3,424 BorgWarner, Inc. 168,290
-----------
BEVERAGES -- 3.9%
2,933 Coca-Cola Co. (The) 172,665
1,988 PepsiCo, Inc. 136,238
-----------
308,903
-----------
BIOTECHNOLOGY -- 1.4%
499 Genentech, Inc.(1) 34,032
1,472 Gilead Sciences, Inc.(1) 76,191
-----------
110,223
-----------
BUILDING PRODUCTS -- 0.2%
1,072 Masco Corp. 19,521
-----------
CAPITAL MARKETS -- 3.5%
4,921 Invesco Ltd. 126,224
1,066 Northern Trust Corp. 79,001
2,209 Waddell & Reed Financial, Inc. Cl A 74,797
-----------
280,022
-----------
CHEMICALS -- 1.7%
1,188 Monsanto Co. 135,456
-----------
COMMUNICATIONS EQUIPMENT -- 7.9%
3,170 ADC Telecommunications, Inc.(1) 44,443
872 Ciena Corp.(1) 29,482
4,762 Cisco Systems Inc.(1) 122,098
4,832 Corning Inc. 129,063
5,465 JDS Uniphase Corp.(1) 78,204
4,557 QUALCOMM Inc. 196,816
227 Research In Motion Ltd.(1) 27,610
-----------
627,716
-----------
COMPUTERS & PERIPHERALS -- 4.5%
1,515 Apple Inc.(1) 263,534
4,661 Dell Inc.(1) 86,834
652 EMC Corp.(1) 10,041
-----------
360,409
-----------
DIVERSIFIED -- 1.1%
1,523 iShares Russell 1000 Growth Index Fund 87,512
-----------
Shares Value
DIVERSIFIED FINANCIAL SERVICES -- 1.2%
99 CME Group Inc. $ 45,288
321 IntercontinentalExchange Inc.(1) 49,803
-----------
95,091
-----------
ELECTRIC UTILITIES -- 0.5%
561 FPL Group, Inc. 37,189
-----------
ELECTRICAL EQUIPMENT -- 3.9%
2,311 Cooper Industries, Ltd. Cl A 97,963
3,560 Emerson Electric Co. 186,046
108 First Solar Inc.(1) 31,535
-----------
315,544
-----------
ELECTRONIC EQUIPMENT & INSTRUMENTS -- 0.8%
6,024 Flextronics International Ltd.(1) 62,589
-----------
ENERGY EQUIPMENT & SERVICES -- 2.9%
761 Helmerich & Payne, Inc. 40,904
835 Schlumberger Ltd. 83,959
742 Transocean Inc.(1) 109,415
-----------
234,278
-----------
FOOD & STAPLES RETAILING -- 3.9%
2,018 Costco Wholesale Corp. 143,783
2,884 Wal-Mart Stores, Inc. 167,214
-----------
310,997
-----------
FOOD PRODUCTS -- 0.8%
128 Nestle SA ORD 61,417
-----------
HEALTH CARE EQUIPMENT & SUPPLIES -- 8.0%
2,098 Baxter International Inc. 130,747
1,988 Becton, Dickinson & Co. 177,726
858 C.R. Bard, Inc. 80,798
2,033 DENTSPLY International Inc. 79,023
372 Gen-Probe Inc.(1) 20,966
312 Idexx Laboratories, Inc.(1) 16,598
181 Intuitive Surgical Inc.(1) 52,356
1,620 Medtronic, Inc. 78,862
-----------
637,076
-----------
HEALTH CARE PROVIDERS & SERVICES -- 0.9%
639 Laboratory Corp. of America Holdings(1) 48,321
700 VCA Antech Inc.(1) 22,659
-----------
70,980
-----------
- ------
14
Capital Growth
Shares Value
HOTELS, RESTAURANTS & LEISURE -- 1.3%
2,969 Darden Restaurants, Inc. $ 105,637
-----------
HOUSEHOLD DURABLES -- 0.7%
1,095 KB Home(2) 24,638
464 Mohawk Industries Inc.(1)(2) 35,352
-----------
59,990
-----------
HOUSEHOLD PRODUCTS -- 1.3%
1,504 Procter & Gamble Co. (The) 100,843
-----------
INDUSTRIAL CONGLOMERATES -- 0.3%
863 General Electric Co. 28,220
-----------
INSURANCE -- 1.1%
1,602 Chubb Corp. 84,858
-----------
INTERNET & CATALOG RETAIL -- 0.5%
309 priceline.com Inc.(1)(2) 39,441
-----------
INTERNET SOFTWARE & SERVICES -- 0.9%
122 Google Inc. Cl A(1) 70,063
-----------
IT SERVICES -- 1.2%
500 Global Payments Inc. 22,130
909 Visa Inc. Cl A(1) 75,856
-----------
97,986
-----------
LIFE SCIENCES TOOLS & SERVICES -- 2.3%
236 Illumina, Inc.(1) 18,382
879 QIAGEN N.V.(1) 19,523
2,459 Thermo Fisher Scientific Inc.(1) 142,302
-----------
180,207
-----------
MACHINERY -- 2.9%
362 Caterpillar Inc. 29,641
1,502 Eaton Corp. 131,935
725 Valmont Industries, Inc. 71,384
-----------
232,960
-----------
MEDIA -- 1.8%
3,837 Viacom Inc. Cl B(1) 147,494
-----------
METALS & MINING -- 1.6%
1,095 Freeport-McMoRan Copper & Gold, Inc. 124,556
-----------
MULTILINE RETAIL -- 1.0%
3,927 Family Dollar Stores, Inc. 84,038
-----------
OIL, GAS & CONSUMABLE FUELS -- 6.3%
1,297 Apache Corp. 174,679
1,494 Devon Energy Corp. 169,420
145 EOG Resources Inc. 18,920
2,260 XTO Energy Inc. 139,804
-----------
502,823
-----------
Shares Value
PHARMACEUTICALS -- 3.3%
2,750 Allergan, Inc. $ 155,018
1,536 Novo Nordisk AS B Shares ORD 105,893
-----------
260,911
-----------
REAL ESTATE INVESTMENT TRUSTS (REITS) -- 0.6%
421 Digital Realty Trust Inc. 16,314
876 Weingarten Realty Investors 32,315
-----------
48,629
-----------
ROAD & RAIL -- 0.4%
212 Union Pacific Corp. 30,780
-----------
SEMICONDUCTORS & SEMICONDUCTOR EQUIPMENT -- 5.5%
2,105 Altera Corp. 44,794
1,629 Applied Materials, Inc. 30,397
6,577 Intel Corp. 146,404
3,856 Linear Technology Corp. 134,806
578 MEMC Electronic Materials Inc.(1) 36,397
2,005 Xilinx, Inc. 49,664
-----------
442,462
-----------
SOFTWARE -- 4.2%
647 Electronic Arts Inc.(1) 33,301
6,189 Microsoft Corp. 176,510
3,123 Oracle Corp.(1) 65,115
974 Salesforce.com Inc.(1) 64,995
-----------
339,921
-----------
SPECIALTY RETAIL -- 3.8%
1,318 Advance Auto Parts, Inc. 45,708
4,141 Lowe's Companies, Inc. 104,312
931 TJX Companies, Inc. (The) 29,997
3,528 Urban Outfitters Inc.(1) 120,834
-----------
300,851
-----------
WIRELESS TELECOMMUNICATION SERVICES -- 1.4%
2,606 American Tower Corp. Cl A(1) 113,153
-----------
TOTAL COMMON STOCKS
(Cost $7,093,008) 7,822,493
-----------
- ------
15
Capital Growth
Value
Temporary Cash Investments -- Securities Lending Collateral(3) -- 1.3%
Repurchase Agreement, Barclays Capital Inc., (collateralized
by various U.S. Government Agency obligations in a pooled
account at the lending agent), 1.98%, dated 4/30/08, due
5/1/08 (Delivery value $22,496) $ 22,495
Repurchase Agreement, BNP Paribas Securities Corp.,
(collateralized by various U.S. Government Agency
obligations in a pooled account at the lending agent),
1.99%, dated 4/30/08, due 5/1/08 (Delivery value $20,001) 20,000
Repurchase Agreement, Deutsche Bank Securities Inc.,
(collateralized by various U.S. Government Agency
obligations in a pooled account at the lending agent),
1.97%, dated 4/30/08, due 5/1/08 (Delivery value $20,001) 20,000
Value
Repurchase Agreement, Lehman Brothers Inc. / Lehman Brothers
Commercial Paper Inc., (collateralized by various U.S.
Government Agency obligations in a pooled account at the
lending agent), 2.39%, dated 4/30/08, due 5/1/08 (Delivery
value $20,001) $ 20,000
Repurchase Agreement, Morgan Stanley & Co. Inc.,
(collateralized by various U.S. Government Agency
obligations in a pooled account at the lending agent),
1.97%, dated 4/30/08, due 5/1/08 (Delivery value $20,001) 20,000
-----------
TOTAL TEMPORARY CASH INVESTMENTS -- SECURITIES LENDING
COLLATERAL
(Cost $102,495) 102,495
-----------
TOTAL INVESTMENT SECURITIES -- 99.2%
(Cost $7,195,503) 7,924,988
-----------
OTHER ASSETS AND LIABILITIES -- 0.8% 60,542
-----------
TOTAL NET ASSETS -- 100.0% $ 7,985,530
===========
Forward Foreign Currency Exchange Contracts
Unrealized
Contracts to Sell Settlement Date Value Gain (Loss)
44,083 CHF for USD 5/30/08 $ 42,578 $113
333,230 DKK for USD 5/30/08 69,743 22
-------- --------
$112,321 $135
======== ========
(Value on Settlement Date $112,456)
Notes to Schedule of Investments
CHF = Swiss Franc
DKK = Danish Krone
ORD = Foreign Ordinary Share
USD = United States Dollar
(1) Non-income producing.
(2) Security, or a portion thereof, was on loan as of April 30, 2008.
(3) Investments represent purchases made by the lending agent with cash
collateral received through securities lending transactions.
See Notes to Financial Statements.
- ------
16
PERFORMANCE
Focused Growth
Total Returns as of April 30, 2008
Average Annual
Returns
Since Inception
6 months(1) 1 year Inception Date
INVESTOR CLASS -3.94% 4.74% 8.05% 2/28/05
RUSSELL 1000 GROWTH INDEX(2)(3) -9.28% -0.23% 7.09% --
BLENDED INDEX -9.45% -2.47% 6.82% --
S&P 500 INDEX(2) -9.64% -4.68% 6.53% --
Institutional Class -3.89% -- -1.29%(1) 9/28/07
A Class
No sales charge* -4.11% -- -1.59%(1)
With sales charge* -9.63% -- -7.27%(1) 9/28/07
B Class
No sales charge* -4.48% -- -2.05%(1)
With sales charge* -9.48% -- -7.05%(1) 9/28/07
C Class
No sales charge* -4.48% -- -2.05%(1)
With sales charge* -5.33% -- -2.92%(1) 9/28/07
R Class -4.20% -- -1.69%(1) 9/28/07
* Sales charges include initial sales charges and contingent deferred sales
charges (CDSCs), as applicable. A Class shares have a 5.75% maximum initial
sales charge for equity funds and may be subject to a maximum CDSC of 1.00%. B
Class shares redeemed within six years of purchase are subject to a CDSC that
declines from 5.00% during the first year after purchase to 0.00% the sixth
year after purchase. C Class shares redeemed within 12 months of purchase are
subject to a maximum CDSC of 1.00%. The SEC requires that mutual funds provide
performance information net of maximum sales charges in all cases where
charges could be applied.
(1) Total returns for periods less than one year are not annualized.
(2) Data provided by Lipper Inc. -- A Reuters Company. ©2008 Reuters. All
rights reserved. Any copying, republication or redistribution of Lipper
content, including by caching, framing or similar means, is expressly
prohibited without the prior written consent of Lipper. Lipper shall not be
liable for any errors or delays in the content, or for any actions taken in
reliance thereon.
The data contained herein has been obtained from company reports, financial
reporting services, periodicals and other resources believed to be reliable.
Although carefully verified, data on compilations is not guaranteed by Lipper
and may be incomplete. No offer or solicitations to buy or sell any of the
securities herein is being made by Lipper.
(3) In March of 2008, the fund's benchmark changed from the blended index to
the Russell 1000 Growth Index. The fund's investment advisor believes this
index better represents the fund's portfolio composition.
Data presented reflect past performance. Past performance is no guarantee of
future results. Current performance may be higher or lower than the
performance shown. Investment return and principal value will fluctuate, and
redemption value may be more or less than original cost. To obtain performance
data current to the most recent month end, please call 1-800-345-2021 or visit
americancentury.com. The fund's investment approach may also result in high
portfolio turnover, which could mean high transaction costs, affecting both
performance and capital gains tax liabilities to investors.
Unless otherwise indicated, performance reflects Investor Class shares;
performance for other share classes will vary due to differences in fee
structure. For information about other share classes available, please consult
the prospectus. Data assumes reinvestment of dividends and capital gains, and
none of the charts reflect the deduction of taxes that a shareholder would pay
on fund distributions or the redemption of fund shares. Returns for the
indices are provided for comparison. The fund's total returns include
operating expenses (such as transaction costs and management fees) that reduce
returns, while the total returns of the indices do not.
- ------
17
Focused Growth
Growth of $10,000 Over Life of Class
$10,000 investment made February 28, 2005
One-Year Returns Over Life of Class
Periods ended April 30
2005* 2006 2007 2008
Investor Class -3.50% 17.00% 8.08% 4.74%
Russell 1000 Growth Index -3.69% 15.18% 12.25% -0.23%
Blended index -3.66% 15.31% 13.75% -2.47%
S&P 500 Index -3.63% 15.42% 15.24% -4.68%
*From 2/28/05, the Investor Class's inception date. Not annualized.
Data presented reflect past performance. Past performance is no guarantee of
future results. Current performance may be higher or lower than the
performance shown. Investment return and principal value will fluctuate, and
redemption value may be more or less than original cost. To obtain performance
data current to the most recent month end, please call 1-800-345-2021 or visit
americancentury.com. The fund's investment approach may also result in high
portfolio turnover, which could mean high transaction costs, affecting both
performance and capital gains tax liabilities to investors.
Unless otherwise indicated, performance reflects Investor Class shares;
performance for other share classes will vary due to differences in fee
structure. For information about other share classes available, please consult
the prospectus. Data assumes reinvestment of dividends and capital gains, and
none of the charts reflect the deduction of taxes that a shareholder would pay
on fund distributions or the redemption of fund shares. Returns for the
indices are provided for comparison. The fund's total returns include
operating expenses (such as transaction costs and management fees) that reduce
returns, while the total returns of the indices do not.
- ------
18
PORTFOLIO COMMENTARY
Focused Growth
Portfolio Managers: Greg Woodhams and Joe Reiland
PERFORMANCE SUMMARY
Focused Growth returned -3.94%* during the six months ended April 30, 2008. By
comparison, the Russell 1000 Growth Index returned -9.28%, while the average
return for the Lipper Large-Cap Growth Funds category was -10.15%.** Better
measures of the portfolio's performance are its longer-term results compared
with the index, which can be seen on page 17.
Looking at the portfolio's absolute return, performance was driven by holdings
in the energy sector. Information technology holdings were the leading
detractors. In terms of Focused Growth's return relative to the Russell 1000
Growth Index, outperformance was driven by selection among health care shares.
Stock picks in the energy, consumer discretionary, and financials sectors also
contributed. Positioning in the consumer staples and materials sectors
detracted most from relative results.
HEALTH CARE LED CONTRIBUTORS
Health care stocks contributed most to the portfolio's return relative to the
benchmark, led by health care equipment & supplies firms. The leading
contributor to return for the six months was Becton Dickinson, which benefited
from increased usage around the world of its safety devices that reduce
accidents and infection among patients and caregivers. Other key contributors
here were Baxter International, Alcon, and DENTSPLY International.
Performance also benefited from positioning in the pharmaceutical industry,
led by an overweight in Novo Nordisk AS, which gained share in insulin analogs
around the world. In addition, the portfolio had no exposure to Merck and an
underweight position in Schering-Plough. This helped relative results after
both stocks suffered from questions about the efficacy of a jointly marketed
cholesterol drug.
ENERGY COMPANIES WERE KEY
The top three contributors to performance for the period were oil & gas
exploration and production firms Apache, Devon Energy, and XTO Energy. They
benefited from surging oil prices and reserve growth in the U.S. and overseas.
These shares also saw demand from investors who wanted exposure to the energy
sector but preferred to avoid the big, integrated firms that are less closely
tied to the price of oil and are seeing declining margins in their refining
businesses.
Top Ten Holdings as of April 30, 2008
% of net % of net
assets as of assets as of
4/30/08 10/31/07
Apple Inc. 4.5% 3.6%
QUALCOMM Inc. 3.2% 0.7%
Honeywell International Inc. 3.1% 1.1%
Proctor & Gamble Co. (The) 3.0% 0.8%
Costco Wholesale Corp. 3.0% --
United Technologies Corp. 2.9% 3.7%
Apache Corp. 2.8% 4.3%
Baxter International Inc. 2.8% 3.9%
BorgWarner, Inc. 2.8% 3.5%
Invesco Ltd. 2.8% --
* All fund returns referenced in this commentary are for Investor Class
shares. Total returns for periods less than one year are not annualized.
** The Lipper Large-Cap Growth Funds average returns for the one-year and
since inception periods ended April 30, 2008, were 1.73% and 8.28%,
respectively.
- ------
19
Focused Growth
OTHER SOURCES OF STRENGTH
In the consumer discretionary sector, outperformance was a result of stock
selection among specialty retail names, led by The TJX Companies and Urban
Outfitters. It also helped to underweight stocks in the hotels, restaurants &
leisure category. Internet travel portal priceline.com was another leading
contributor in the sector, helped by the acquisition of overseas vacation
properties and growth in its international business.
In the financials sector, the key theme explaining the portfolio's
outperformance was an overweight to asset managers and other capital-market
related names. At the same time, it helped to underweight the poor-performing
consumer finance and diversified financial services industries. The leading
contributor in this sector was financial services firm Northern Trust, which
reported record earnings during the period on strength in its custody bank,
investment management, and foreign exchange trading arms.
LEADING DETRACTORS
The portfolio's underweight position in the defensive consumer staples sector
detracted from performance, as these stocks held up relatively well during a
difficult period for equities. In particular, the portfolio had no exposure to
Wal-Mart, making this stock the leading detractor from relative results. It
was a similar story in materials, as the portfolio was underweight one of only
two sectors in the index to have a positive return.
OUTLOOK
The investment process focuses on large companies exhibiting sustainable
improvement in their businesses. We believe that owning such companies will
generate outperformance over time versus the Russell 1000 Growth Index and the
other funds in the large-growth peer group.
As a result, the portfolio's sector and industry selection are primarily a
result of identifying what we believe to be superior individual securities. As
of April 30, 2008, we found opportunity in the industrial sector, the
portfolio's largest overweight position. The most notable sector underweight
was in information technology shares.
Top Five Industries as of April 30, 2008
% of net % of net
assets as of assets as of
4/30/08 10/31/07
Health Care Equipment & Supplies 8.5% 14.2%
Aerospace & Defense 8.3% 4.8%
Communications Equipment 7.5% 6.7%
Oil, Gas & Consumable Fuels 7.0% 10.9%
Capital Markets 5.9% 5.8%
Types of Investments in Portfolio
% of net % of net
assets as of assets as of
4/30/08 10/31/07
Domestic Common Stocks 92.1% 94.0%
Foreign Common Stocks(1) 5.8% 4.1%
TOTAL COMMON STOCKS 97.9% 98.1%
Temporary Cash Investments 3.0% 0.7%
Other Assets and Liabilities(2) (0.9)% 1.2%
(1) Includes depositary shares, dual listed securities and foreign ordinary
shares.
(2) Includes securities lending collateral and other assets and liabilities.
- ------
20
SCHEDULE OF INVESTMENTS
Focused Growth
APRIL 30, 2008 (UNAUDITED)
Shares Value
Common Stocks -- 97.9%
AEROSPACE & DEFENSE -- 8.3%
6,918 Honeywell International Inc. $ 410,930
4,863 Raytheon Co. 311,086
5,337 United Technologies Corp. 386,772
------------
1,108,788
------------
AUTO COMPONENTS -- 2.8%
7,554 BorgWarner, Inc. 371,279
------------
BEVERAGES -- 1.7%
3,758 Coca-Cola Co. (The) 221,233
------------
BIOTECHNOLOGY -- 1.3%
3,384 Gilead Sciences, Inc.(1) 175,156
------------
CAPITAL MARKETS -- 5.9%
14,455 Invesco Ltd. 370,771
4,695 Northern Trust Corp. 347,946
2,082 Waddell & Reed Financial, Inc. Cl A 70,497
------------
789,214
------------
CHEMICALS -- 0.4%
500 Monsanto Co. 57,010
------------
COMMUNICATIONS EQUIPMENT -- 7.5%
9,480 ADC Telecommunications, Inc.(1) 132,910
2,213 Ciena Corp.(1) 74,822
2,461 Corning Inc. 65,733
19,614 JDS Uniphase Corp.(1) 280,676
9,981 QUALCOMM Inc. 431,079
130 Research In Motion Ltd.(1) 15,812
------------
1,001,032
------------
COMPUTERS & PERIPHERALS -- 5.1%
3,429 Apple Inc.(1) 596,474
5,387 EMC Corp.(1) 82,960
------------
679,434
------------
ELECTRIC UTILITIES -- 0.4%
880 FPL Group, Inc. 58,335
------------
ELECTRICAL EQUIPMENT -- 5.2%
7,884 Cooper Industries, Ltd. Cl A 334,203
6,745 Emerson Electric Co. 352,493
------------
686,696
------------
ELECTRONIC EQUIPMENT & INSTRUMENTS -- 0.7%
9,050 Flextronics International Ltd.(1) 94,030
------------
ENERGY EQUIPMENT & SERVICES -- 1.5%
1,326 Transocean Inc.(1) 195,532
------------
Shares Value
FOOD & STAPLES RETAILING -- 3.0%
5,620 Costco Wholesale Corp. $ 400,425
------------
HEALTH CARE EQUIPMENT & SUPPLIES -- 8.5%
6,013 Baxter International Inc. 374,731
3,789 Becton, Dickinson & Co. 338,737
1,495 C.R. Bard, Inc. 140,784
6,406 DENTSPLY International Inc. 249,001
69 Intuitive Surgical Inc.(1) 19,959
------------
1,123,212
------------
HOTELS, RESTAURANTS & LEISURE -- 2.7%
10,002 Darden Restaurants, Inc. 355,871
------------
HOUSEHOLD DURABLES -- 0.4%
2,504 KB Home(2) 56,340
------------
HOUSEHOLD PRODUCTS -- 3.0%
5,999 Procter & Gamble Co. (The) 402,233
------------
INSURANCE -- 2.6%
6,517 Chubb Corp. 345,205
------------
INTERNET & CATALOG RETAIL -- 0.5%
489 priceline.com Inc.(1)(2) 62,416
------------
IT SERVICES -- 0.4%
666 Visa Inc. Cl A(1) 55,578
------------
LIFE SCIENCES TOOLS & SERVICES -- 2.7%
6,140 Thermo Fisher Scientific Inc.(1) 355,322
------------
MACHINERY -- 2.6%
3,888 Eaton Corp. 341,522
------------
MEDIA -- 2.7%
9,262 Viacom Inc. Cl B(1) 356,031
------------
METALS & MINING -- 2.5%
2,963 Freeport-McMoRan Copper & Gold, Inc. 337,041
------------
MULTILINE RETAIL -- 1.7%
10,303 Family Dollar Stores, Inc. 220,484
------------
OIL, GAS & CONSUMABLE FUELS -- 7.0%
2,796 Apache Corp. 376,566
3,218 Devon Energy Corp. 364,921
3,004 XTO Energy Inc. 185,827
------------
927,314
------------
PHARMACEUTICALS -- 3.8%
3,790 Allergan, Inc. 213,642
4,202 Novo Nordisk AS B Shares ORD(2) 289,690
------------
503,332
------------
- ------
21
Focused Growth
Shares Value
SEMICONDUCTORS & SEMICONDUCTOR EQUIPMENT -- 5.7%
12,837 Intel Corp. $ 285,752
10,040 Linear Technology Corp. 350,998
1,863 MEMC Electronic Materials Inc.(1) 117,313
------------
754,063
------------
SOFTWARE -- 4.1%
4,196 Microsoft Corp. 119,670
11,494 Oracle Corp.(1) 239,650
2,832 Salesforce.com Inc.(1) 188,979
------------
548,299
------------
SPECIALTY RETAIL -- 2.6%
3,552 TJX Companies, Inc. (The) 114,445
6,797 Urban Outfitters Inc.(1) 232,798
------------
347,243
------------
WIRELESS TELECOMMUNICATION SERVICES -- 0.6%
1,807 American Tower Corp. Cl A(1) 78,460
------------
TOTAL COMMON STOCKS
(Cost $12,106,897) 13,008,130
------------
Principal Amount
Temporary Cash Investments -- 3.0%
$400,000 FHLB Discount Notes, 1.75%, 5/1/08(3)
(Cost $400,000) 400,000
------------
Value
Temporary Cash Investments --
Securities Lending Collateral(4) -- 2.0%
Repurchase Agreement, Barclays Capital Inc.,
(collateralized by various U.S. Government Agency
obligations in a pooled account at the lending
agent), 1.98%, dated 4/30/08, due 5/1/08 (Delivery
value $64,257) $64,253
Repurchase Agreement, BNP Paribas Securities Corp.,
(collateralized by various U.S. Government Agency
obligations in a pooled account at the lending
agent), 1.99%, dated 4/30/08, due 5/1/08 (Delivery
value $50,003) 50,000
Repurchase Agreement, Deutsche Bank Securities Inc.,
(collateralized by various U.S. Government Agency
obligations in a pooled account at the lending
agent), 1.97%, dated 4/30/08, due 5/1/08 (Delivery
value $50,003) 50,000
Repurchase Agreement, Lehman Brothers Inc. / Lehman
Brothers Commercial Paper Inc., (collateralized by
various U.S. Government Agency obligations in a
pooled account at the lending agent), 2.39%, dated
4/30/08, due 5/1/08 (Delivery value $50,003) 50,000
Repurchase Agreement, Morgan Stanley & Co. Inc.,
(collateralized by various U.S. Government Agency
obligations in a pooled account at the lending
agent), 1.97%, dated 4/30/08, due 5/1/08 (Delivery
value $50,003) 50,000
------------
TOTAL TEMPORARY CASH INVESTMENTS -- SECURITIES
LENDING COLLATERAL
(Cost $264,253) 264,253
------------
TOTAL INVESTMENT SECURITIES -- 102.9%
(Cost $12,771,150) 13,672,383
------------
OTHER ASSETS AND LIABILITIES -- (2.9)% (390,116)
------------
TOTAL NET ASSETS -- 100.0% $ 13,282,267
============
- ------
22
Focused Growth
Forward Foreign Currency Exchange Contracts
Contracts to Sell Settlement Date Value Unrealized Gain (Loss)
905,951 DKK for USD 5/30/08 $189,611 $97
========= =========
(Value on Settlement Date $189,708)
Notes to Schedule of Investments
DKK = Danish Krone
FHLB = Federal Home Loan Bank
ORD = Foreign Ordinary Share
USD = United States Dollar
(1) Non-income producing.
(2) Security, or a portion thereof, was on loan as of April 30, 2008.
(3) The rate indicated is the yield to maturity at purchase.
(4) Investments represent purchases made by the lending agent with cash
collateral received through securities lending transactions.
See Notes to Financial Statements.
- ------
23
PERFORMANCE
Fundamental Equity
Total Returns as of April 30, 2008
Average Annual
Returns
Since Inception
6 months(1) 1 year Inception Date
A CLASS
No sales charge* -8.91% -1.34% 12.49%
With sales charge* -14.12% -7.01% 10.56% 11/30/04
S&P 500 INDEX(2) -9.64% -4.68% 6.96% --
Investor Class -8.79% -1.09% 12.50% 7/29/05
Institutional Class -8.73% -0.90% 12.69% 7/29/05
B Class
No sales charge* -9.26% -2.10% 11.63%
With sales charge* -14.26% -6.10% 10.95% 11/30/04
C Class
No sales charge* -9.32% -2.10% 11.63%
With sales charge* -10.21% -2.10% 11.63% 11/30/04
R Class -9.10% -1.66% 11.90% 7/29/05
* Sales charges include initial sales charges and contingent deferred sales
charges (CDSCs), as applicable. A Class shares have a 5.75% maximum initial
sales charge for equity funds and may be subject to a maximum CDSC of 1.00%. B
Class shares redeemed within six years of purchase are subject to a CDSC that
declines from 5.00% during the first year after purchase to 0.00% the sixth
year after purchase. C Class shares redeemed within 12 months of purchase are
subject to a maximum CDSC of 1.00%. The SEC requires that mutual funds provide
performance information net of maximum sales charges in all cases where
charges could be applied.
(1) Total returns for periods less than one year are not annualized.
(2) Data provided by Lipper Inc. -- A Reuters Company. ©2008 Reuters. All
rights reserved. Any copying, republication or redistribution of Lipper
content, including by caching, framing or similar means, is expressly
prohibited without the prior written consent of Lipper. Lipper shall not be
liable for any errors or delays in the content, or for any actions taken in
reliance thereon.
The data contained herein has been obtained from company reports, financial
reporting services, periodicals and other resources believed to be reliable.
Although carefully verified, data on compilations is not guaranteed by Lipper
and may be incomplete. No offer or solicitations to buy or sell any of the
securities herein is being made by Lipper.
Data presented reflect past performance. Past performance is no guarantee of
future results. Current performance may be higher or lower than the
performance shown. Investment return and principal value will fluctuate, and
redemption value may be more or less than original cost. To obtain performance
data current to the most recent month end, please call 1-800-345-2021 or visit
americancentury.com. Fund performance to date was affected by investments in
initial public offerings (IPOs), non-U.S. stocks, and small- and mid-cap
stocks. IPOs and smaller stocks may have less impact on the fund's performance
as its assets grow. Performance over a longer period of time is more
meaningful than short-term performance. .
Unless otherwise indicated, performance reflects A Class shares; performance
for other share classes will vary due to differences in fee structure. For
information about other share classes available, please consult the
prospectus. Data assumes reinvestment of dividends and capital gains, and none
of the charts reflect the deduction of taxes that a shareholder would pay on
fund distributions or the redemption of fund shares. Returns for the index are
provided for comparison. The fund's total returns include operating expenses
(such as transaction costs and management fees) that reduce returns, while the
total returns of the index do not.
- ------
24
Fundamental Equity
Growth of $10,000 Over Life of Class
$10,000 investment made November 30, 2004
One-Year Returns Over Life of Class
Periods ended April 30
2005* 2006 2007 2008
A Class (no sales charge) -0.20% 23.97% 22.49% -1.34%
S&P 500 Index -0.74% 15.42% 15.24% -4.68%
* From 11/30/04, the A Class's inception date. Not annualized. Fundamental
Equity A Class's initial investment is $9,425 to reflect the maximum 5.75%
initial sales charge.
Data presented reflect past performance. Past performance is no guarantee of
future results. Current performance may be higher or lower than the
performance shown. Investment return and principal value will fluctuate, and
redemption value may be more or less than original cost. To obtain performance
data current to the most recent month end, please call 1-800-345-2021 or visit
americancentury.com. Fund performance to date was affected by investments in
initial public offerings (IPOs), non-U.S. stocks, and small- and mid-cap
stocks. IPOs and smaller stocks may have less impact on the fund's performance
as its assets grow. Performance over a longer period of time is more
meaningful than short-term performance.
Unless otherwise indicated, performance reflects A Class shares; performance
for other share classes will vary due to differences in fee structure. For
information about other share classes available, please consult the
prospectus. Data assumes reinvestment of dividends and capital gains, and none
of the charts reflect the deduction of taxes that a shareholder would pay on
fund distributions or the redemption of fund shares. Returns for the index are
provided for comparison. The fund's total returns include operating expenses
(such as transaction costs and management fees) that reduce returns, while the
total returns of the index do not.
- ------
25
PORTFOLIO COMMENTARY
Fundamental Equity
In June 2008, Gregory J. Woodhams, E.A. Prescott LeGard, Justin M. Brown and
Joe Reiland were named portfolio managers on the fund following the departure
of Jerry Sullivan and Rob Brookby.
PERFORMANCE SUMMARY
Fundamental Equity returned -8.91%* for the six months ended April 30, 2008.
Its benchmark, the S&P 500 Index, returned -9.64% for the same time frame.
As discussed in the Market Perspective on page 2, equity markets generally
declined during the reporting period, as the subprime-mortgage-driven credit
crisis spread to other areas of the economy, and rising energy and commodity
prices increased inflation concerns. In this environment, both growth and
value stocks lost ground across the capitalization spectrum.
Although Fundamental Equity delivered negative absolute results for the
reporting period, it outperformed its benchmark. Effective security selection
accounted for the bulk of relative strength. In particular, individual
holdings within the consumer discretionary and financials sectors contributed
to relative performance. An underweight allocation to financials further aided
relative performance. Holdings in the industrials sector, as well as an
overweight allocation to the sector, weighed on absolute and relative returns.
The portfolio also derived gains from initial public offerings during the
reporting period. Although several of these positions detracted slightly from
portfolio gains, the group significantly contributed to relative performance.
INDUSTRIALS LAGGED
Electronic components-maker Belden hindered absolute and relative performance
as its share price lost 42%. The company's first-quarter earnings profit fell
40% and missed analysts' estimates as healthy foreign business failed to
compensate for weak sales in North America.
Elsewhere in the industrials sector, the portfolio maintained an overweight
stake in the aerospace and defense industry. Although these holdings
collectively detracted from absolute returns, they aided Fundamental Equity's
performance relative to the benchmark.
TECHNOLOGY DETRACTED
A stake in Avnet -- a substantial contributor to relative gains in the
previous reporting period -- dragged down returns. The distributor of
electronic components, which is not a benchmark constituent, weighed on
relative performance as its share price slumped 37%.
Top Ten Holdings as of April 30, 2008
% of net % of net
assets as of assets as of
4/30/08 10/31/07
Chevron Corp. 3.1% 2.7%
Exxon Mobil Corp. 3.1% 1.9%
General Electric Co. 2.8% 3.5%
JPMorgan Chase & Co. 2.3% 1.1%
Bank of America Corp. 2.0% 2.6%
AT&T Inc. 2.0% 2.2%
Honeywell International Inc. 1.9% 1.9%
International Business Machines Corp. 1.8% 2.0%
Procter & Gamble Co. (The) 1.8% 0.8%
Wal-Mart Stores, Inc. 1.8% 0.8%
* All fund returns referenced in this commentary are for A Class shares and
are not reduced by sales charges. A Class shares are subject to a maximum
sales charge of 5.75%. Had the sales charge been applied, returns would be
lower than those shown. Total returns for periods less than one year are not
annualized.
- ------
26
Fundamental Equity
CONSUMER DISCRETIONARY PICKS LED GAINS
Within the consumer discretionary sector, Fundamental Equity benefited from
security selection within the hotels, restaurants, and leisure group and the
specialty retail group. In particular, restaurant giant Darden Restaurants
contributed to relative strength. The owner of casual restaurants -- including
Red Lobster and Olive Garden -- saw its share price rise as it announced
earnings that exceeded analysts' estimates.
FINANCIALS, ENERGY AIDED RELATIVE STRENGTH
Although the portfolio's holdings in the financials sector declined, stock
selection and an underweight stake helped Fundamental Equity to outperform its
benchmark within the sector. The most significant relative advantage came from
avoiding the thrifts and mortgage finance industry altogether, a group whose
constituents declined an average 47% within the benchmark for the reporting
period. But that advantage was partially offset by an overweight stake in
Wachovia Corporation, whose share price tumbled 34%.
Stock selection within the energy sector also accounted for a portion of
Fundamental Equity's relative strength. Within the energy sector, the
portfolio derived its relative gains from the oil, gas and consumable fuels
industry. Here, a stake in SandRidge Energy, a newly-issued security during
the reporting period, aided performance as the natural gas exploration
company's share price climbed 73% following its initial public offering in
November 2007. An overweight position in Chevron also contributed to relative
strength as the diversified oil company continued to benefit from rising oil
prices during the period.
OUTLOOK
Fundamental Equity seeks large, established companies that we believe are
attractively valued relative to their prospects for earnings growth and income
production. Our focus on bellwether large-cap stocks should put the portfolio
in position for solid returns for the foreseeable future despite short-term
market volatility. We will also continue to look for investment opportunities
outside the large-company arena.
Top Five Industries as of April 30, 2008
% of net % of net
assets as of assets as of
4/30/08 10/31/07
Oil, Gas & Consumable Fuels 9.9% 8.2%
Aerospace & Defense 6.0% 6.2%
Pharmaceuticals 5.6% 2.9%
Diversified Financial Services 4.9% 5.8%
Capital Markets 4.6% 3.0%
Types of Investments in Portfolio
% of net % of net
assets as of assets as of
4/30/08 10/31/07
Domestic Common Stocks 92.6% 91.1%
Foreign Common Stocks(1) 5.5% 7.0%
TOTAL COMMON STOCKS 98.1% 98.1%
Temporary Cash Investments 2.8% 1.8%
Other Assets and Liabilities(2) (0.9)% 0.1%
(1) Includes depositary shares, dual listed securities and foreign ordinary
shares.
(2) Includes securities lending collateral and other assets and liabilities.
- ------
27
SCHEDULE OF INVESTMENTS
Fundamental Equity
APRIL 30, 2008 (UNAUDITED)
Shares Value
Common Stocks -- 98.1%
AEROSPACE & DEFENSE -- 6.0%
37,500 General Dynamics Corp. $ 3,390,751
142,500 Honeywell International Inc. 8,464,500
58,500 Lockheed Martin Corp. 6,203,340
58,000 Raytheon Co. 3,710,260
65,000 United Technologies Corp. 4,710,550
------------
26,479,401
------------
AIR FREIGHT & LOGISTICS -- 0.7%
40,500 United Parcel Service, Inc. Cl B 2,932,605
------------
AUTO COMPONENTS -- 1.1%
100,000 Johnson Controls, Inc. 3,526,000
56,662 Tenneco Inc.(1) 1,449,414
------------
4,975,414
------------
BEVERAGES -- 2.2%
44,000 Anheuser-Busch Companies, Inc. 2,164,800
61,000 Coca-Cola Enterprises Inc. 1,372,500
92,000 PepsiCo, Inc. 6,304,760
------------
9,842,060
------------
BIOTECHNOLOGY -- 0.8%
22,000 Biotech HOLDRs(SM) Trust(2) 3,575,000
------------
CAPITAL MARKETS -- 4.6%
73,000 Ameriprise Financial Inc. 3,466,770
24,000 Deutsche Bank AG ORD 2,884,897
23,300 Goldman Sachs Group, Inc. (The) 4,458,921
166,000 Invesco Ltd. 4,257,900
72,500 Merrill Lynch & Co., Inc. 3,612,675
100,000 NGP Capital Resources Co. 1,613,000
------------
20,294,163
------------
CHEMICALS -- 2.8%
89,000 du Pont (E.I.) de Nemours & Co. 4,352,991
69,000 International Flavors & Fragrances Inc. 3,147,090
2,552 Intrepid Potash, Inc.(1) 121,194
19,700 Monsanto Co. 2,246,194
40,044 PPG Industries, Inc. 2,457,500
------------
12,324,969
------------
COMMERCIAL BANKS -- 2.1%
152,000 Marshall & Ilsley Corp. 3,796,960
189,350 Wachovia Corp. 5,519,553
------------
9,316,513
------------
Shares Value
COMMERCIAL SERVICES & SUPPLIES -- 0.7%
91,000 Republic Services, Inc. $ 2,892,890
------------
COMMUNICATIONS EQUIPMENT -- 2.1%
306,000 Cisco Systems Inc.(1) 7,845,840
27,000 QUALCOMM Inc. 1,166,130
------------
9,011,970
------------
COMPUTERS & PERIPHERALS -- 2.2%
25,000 Apple Inc.(1) 4,348,750
117,000 Hewlett-Packard Co. 5,422,950
------------
9,771,700
------------
CONSTRUCTION & ENGINEERING -- 0.2%
17,500 Shaw Group Inc. (The)(1) 864,850
------------
CONTAINERS & PACKAGING -- 0.7%
109,500 Crown Holdings Inc.(1) 2,938,980
------------
DIVERSIFIED -- 1.6%
75,000 iShares Russell 1000 Growth Index Fund 4,309,500
60,000 PowerShares QQQ Trust 2,832,600
------------
7,142,100
------------
DIVERSIFIED FINANCIAL SERVICES -- 4.9%
239,500 Bank of America Corp. 8,990,830
157,000 Bovespa Holding SA ORD 2,385,229
209,000 JPMorgan Chase & Co. 9,958,850
------------
21,334,909
------------
DIVERSIFIED TELECOMMUNICATION SERVICES -- 2.0%
230,000 AT&T Inc. 8,903,300
------------
ELECTRIC UTILITIES -- 1.2%
184,500 Duke Energy Corp. 3,378,195
70,782 Pepco Holdings, Inc. 1,763,180
------------
5,141,375
------------
ELECTRICAL EQUIPMENT -- 0.4%
58,014 Belden Inc. 1,957,392
------------
ELECTRONIC EQUIPMENT & INSTRUMENTS -- 0.6%
108,010 Avnet, Inc.(1) 2,828,782
------------
ENERGY EQUIPMENT & SERVICES -- 2.9%
101,500 Halliburton Co. 4,659,865
28,000 Schlumberger Ltd. 2,815,400
15,000 Transocean Inc.(1) 2,211,900
36,000 Weatherford International Ltd.(1) 2,904,120
------------
12,591,285
------------
- ------
28
Fundamental Equity
Shares Value
FOOD & STAPLES RETAILING -- 3.1%
135,000 CVS/Caremark Corp. $ 5,449,950
137,000 Wal-Mart Stores, Inc. 7,943,260
------------
13,393,210
------------
FOOD PRODUCTS -- 3.2%
102,000 General Mills, Inc. 6,160,800
117,000 H.J. Heinz Co. 5,506,020
82,000 Kraft Foods Inc. Cl A 2,593,660
------------
14,260,480
------------
HEALTH CARE EQUIPMENT & SUPPLIES -- 2.7%
120,500 Baxter International Inc. 7,509,559
4,906,513 Golden Meditech Co. Ltd. ORD 1,699,858
94,839 STERIS Corp. 2,627,989
------------
11,837,406
------------
HEALTH CARE PROVIDERS & SERVICES -- 2.1%
59,300 Aetna Inc. 2,585,480
40,000 Humana Inc.(1) 1,911,600
57,000 McKesson Corp. 2,970,840
59,500 UnitedHealth Group Inc. 1,941,485
------------
9,409,405
------------
HOTELS, RESTAURANTS & LEISURE -- 3.0%
89,000 Carnival Corporation 3,575,130
100,000 Darden Restaurants, Inc. 3,558,000
58,000 McDonald's Corp. 3,455,640
67,500 Yum! Brands, Inc. 2,745,900
------------
13,334,670
------------
HOUSEHOLD PRODUCTS -- 2.3%
29,857 Kimberly-Clark Corp. 1,910,549
119,000 Procter & Gamble Co. (The) 7,978,950
------------
9,889,499
------------
INDUSTRIAL CONGLOMERATES -- 3.4%
32,396 3M Co. 2,491,252
374,000 General Electric Co. 12,229,800
------------
14,721,052
------------
INSURANCE -- 4.0%
81,500 Ace, Ltd. 4,913,635
163,000 American International Group, Inc. 7,530,600
500 Berkshire Hathaway Inc. Cl B(1) 2,228,500
119,000 Unum Group 2,761,990
------------
17,434,725
------------
INTERNET SOFTWARE & SERVICES -- 1.0%
7,500 Google Inc. Cl A(1) 4,307,175
------------
Shares Value
IT SERVICES -- 2.9%
55,500 Accenture Ltd. Cl A $ 2,084,025
67,000 International Business Machines Corp. 8,086,900
115,000 Western Union Co. (The) 2,645,000
------------
12,815,925
------------
LIFE SCIENCES TOOLS & SERVICES -- 1.1%
87,000 Thermo Fisher Scientific Inc.(1) 5,034,690
------------
MACHINERY -- 1.6%
58,000 Eaton Corp. 5,094,720
24,000 Parker-Hannifin Corp. 1,916,400
------------
7,011,120
------------
MEDIA -- 1.7%
75,000 Omnicom Group Inc. 3,580,500
124,000 Walt Disney Co. (The) 4,021,320
------------
7,601,820
------------
METALS & MINING -- 0.7%
39,500 Nucor Corp. 2,982,250
------------
MULTI-UTILITIES -- 1.5%
115,922 Sempra Energy 6,569,300
------------
MULTILINE RETAIL -- 0.8%
70,000 Target Corp. 3,719,100
------------
OIL, GAS & CONSUMABLE FUELS -- 9.9%
142,000 Chevron Corp. 13,653,299
40,500 Devon Energy Corp. 4,592,700
144,500 Exxon Mobil Corp. 13,448,615
91,000 Marathon Oil Corp. 4,146,870
66,500 Occidental Petroleum Corp. 5,533,465
44,000 SandRidge Energy, Inc.(1) 1,987,920
------------
43,362,869
------------
PHARMACEUTICALS -- 5.6%
138,000 Abbott Laboratories 7,279,500
53,000 Eli Lilly & Co. 2,551,420
112,000 Johnson & Johnson 7,514,080
125,000 Noven Pharmaceuticals Inc.(1) 1,137,500
137,000 Pfizer Inc. 2,755,070
75,000 Wyeth 3,335,250
------------
24,572,820
------------
SEMICONDUCTORS & SEMICONDUCTOR EQUIPMENT -- 2.0%
462,000 Atmel Corp.(1) 1,718,640
222,000 Intel Corp. 4,941,720
50,000 NVIDIA Corp.(1) 1,027,500
30,000 Texas Instruments Inc. 874,800
------------
8,562,660
------------
- ------
29
Fundamental Equity
Shares Value
SOFTWARE -- 3.0%
201,351 Microsoft Corp. $ 5,742,531
355,000 Oracle Corp.(1) 7,401,750
------------
13,144,281
------------
SPECIALTY RETAIL -- 0.6%
63,000 Best Buy Co., Inc. 2,710,260
------------
TEXTILES, APPAREL & LUXURY GOODS -- 0.5%
29,500 NIKE, Inc. Cl B 1,970,600
------------
TOBACCO -- 1.6%
99,000 Altria Group Inc. 1,980,000
95,000 Philip Morris International Inc.(1) 4,847,850
------------
6,827,850
------------
TOTAL COMMON STOCKS
(Cost $427,878,662) 430,592,825
------------
Temporary Cash Investments -- 2.8%
Repurchase Agreement, Bank of America Securities, LLC,
(collateralized by various U.S. Treasury obligations, 0.625%,
4/15/13, valued at $12,553,664), in a joint trading account at
1.92%, dated 4/30/08, due 5/1/08 (Delivery value $12,300,656)
(Cost $12,300,000) 12,300,000
------------
Temporary Cash Investments - Securities Lending Collateral(3) -- 0.8%
Repurchase Agreement, Barclays Capital Inc., (collateralized by
various U.S. Government Agency obligations in a pooled account at
the lending agent), 1.98%, dated 4/30/08, due 5/1/08 (Delivery
value $774,418) 774,375
Shares Value
Repurchase Agreement, BNP Paribas Securities Corp.,
(collateralized by various U.S. Government Agency obligations in a
pooled account at the lending agent), 1.99%, dated 4/30/08, due
5/1/08 (Delivery value $700,039) $700,000
Repurchase Agreement, Deutsche Bank Securities Inc.,
(collateralized by various U.S. Government Agency obligations in a
pooled account at the lending agent), 1.97%, dated 4/30/08, due
5/1/08 (Delivery value $700,038) 700,000
Repurchase Agreement, Lehman Brothers Inc. / Lehman Brothers
Commercial Paper Inc., (collateralized by various U.S. Government
Agency obligations in a pooled account at the lending agent),
2.39%, dated 4/30/08, due 5/1/08 (Delivery value $700,046) 700,000
Repurchase Agreement, Morgan Stanley & Co. Inc., (collateralized
by various U.S. Government Agency obligations in a pooled account
at the lending agent), 1.97%, dated 4/30/08, due 5/1/08 (Delivery
value $700,038) 700,000
------------
TOTAL TEMPORARY CASH INVESTMENTS -- SECURITIES LENDING COLLATERAL
(Cost $3,574,375) 3,574,375
------------
TOTAL INVESTMENT SECURITIES -- 101.7%
(Cost $443,753,037) 446,467,200
------------
OTHER ASSETS AND LIABILITIES -- (1.7)% (7,407,443)
------------
TOTAL NET ASSETS -- 100.0% $439,059,757
============
Forward Foreign Currency Exchange Contracts
Contracts to Sell Settlement Date Value Unrealized Gain (Loss)
921,240 Euro for USD 5/30/08 $1,437,007 $2,627
========== ==========
(Value on Settlement Date $1,439,634)
Notes to Schedule of Investments
HOLDRs = Holding Company Depositary Receipts
ORD = Foreign Ordinary Share
USD = United States Dollar
(1) Non-income producing.
(2) Security, or a portion thereof, was on loan as of April 30, 2008.
(3) Investments represent purchases made by the lending agent with cash
collateral received through securities lending transactions.
See Notes to Financial Statements.
- ------
30
SHAREHOLDER FEE EXAMPLES (UNAUDITED)
Fund shareholders may incur two types of costs: (1) transaction costs,
including sales charges (loads) on purchase payments and redemption/exchange
fees; and (2) ongoing costs, including management fees; distribution and
service (12b-1) fees; and other fund expenses. This example is intended to
help you understand your ongoing costs (in dollars) of investing in your fund
and to compare these costs with the ongoing cost of investing in other mutual
funds.
The example is based on an investment of $1,000 made at the beginning of the
period and held for the entire period from November 1, 2007 to April 30, 2008.
ACTUAL EXPENSES
The table provides information about actual account values and actual expenses
for each class. You may use the information, together with the amount you
invested, to estimate the expenses that you paid over the period. First,
identify the share class you own. Then simply divide your account value by
$1,000 (for example, an $8,600 account value divided by $1,000 = 8.6), then
multiply the result by the number under the heading "Expenses Paid During
Period" to estimate the expenses you paid on your account during this period.
If you hold Investor Class shares of any American Century fund, or
Institutional Class shares of the American Century Diversified Bond Fund, in
an American Century account (i.e., not a financial intermediary or retirement
plan account), American Century may charge you a $12.50 semiannual account
maintenance fee if the value of those shares is less than $10,000. We will
redeem shares automatically in one of your accounts to pay the $12.50 fee. In
determining your total eligible investment amount, we will include your
investments in all PERSONAL ACCOUNTS (including American Century Brokerage
accounts) registered under your Social Security number. PERSONAL ACCOUNTS
include individual accounts, joint accounts, UGMA/UTMA accounts, personal
trusts, Coverdell Education Savings Accounts and IRAs (including traditional,
Roth, Rollover, SEP-, SARSEP- and SIMPLE-IRAs), and certain other retirement
accounts. If you have only business, business retirement, employer-sponsored
or American Century Brokerage accounts, you are currently not subject to this
fee. We will not charge the fee as long as you choose to manage your accounts
exclusively online. If you are subject to the Account Maintenance Fee, your
account value could be reduced by the fee amount.
HYPOTHETICAL EXAMPLE FOR COMPARISON PURPOSES
The table also provides information about hypothetical account values and
hypothetical expenses based on the actual expense ratio of each class of your
fund and an assumed rate of return of 5% per year before expenses, which is
not the actual return of a fund's share class. The hypothetical account values
and expenses may not be used to estimate the actual ending account balance or
expenses you paid for the period. You may use this information to compare the
ongoing costs of investing in your fund and other funds. To do so, compare
this 5% hypothetical example with the 5% hypothetical examples that appear in
the shareholder reports of the other funds.
Please note that the expenses shown in the table are meant to highlight your
ongoing costs only and do not reflect any transactional costs, such as sales
charges (loads) or redemption/exchange fees. Therefore, the table is useful in
comparing ongoing costs only, and will not help you determine the relative
total costs of owning different funds. In addition, if these transactional
costs were included, your costs would have been higher.
- ------
31
Beginning Ending Expenses Paid
Account Account During Period*
Value Value 11/1/07 - Annualized
11/1/07 4/30/08 4/30/08 Expense Ratio*
Select
ACTUAL
Investor Class $1,000 $905.90 $4.74 1.00%
Institutional Class $1,000 $906.80 $3.79 0.80%
A Class $1,000 $904.50 $5.92 1.25%
B Class $1,000 $901.20 $9.45 2.00%
C Class $1,000 $901.30 $9.45 2.00%
R Class $1,000 $903.50 $7.10 1.50%
HYPOTHETICAL
Investor Class $1,000 $1,019.89 $5.02 1.00%
Institutional Class $1,000 $1,020.89 $4.02 0.80%
A Class $1,000 $1,018.65 $6.27 1.25%
B Class $1,000 $1,014.92 $10.02 2.00%
C Class $1,000 $1,014.92 $10.02 2.00%
R Class $1,000 $1,017.40 $7.52 1.50%
Capital Growth
ACTUAL
Investor Class $1,000 $938.50 $4.87 1.01%
Institutional Class $1,000 $938.80 $3.90 0.81%
A Class $1,000 $937.40 $6.07 1.26%
B Class $1,000 $934.00 $9.67 2.01%
C Class $1,000 $934.00 $9.67 2.01%
R Class $1,000 $936.20 $7.27 1.51%
HYPOTHETICAL
Investor Class $1,000 $1,019.84 $5.07 1.01%
Institutional Class $1,000 $1,020.84 $4.07 0.81%
A Class $1,000 $1,018.60 $6.32 1.26%
B Class $1,000 $1,014.87 $10.07 2.01%
C Class $1,000 $1,014.87 $10.07 2.01%
R Class $1,000 $1,017.35 $7.57 1.51%
* Expenses are equal to the class's annualized expense ratio listed in the
table above, multiplied by the average account value over the period,
multiplied by 182, the number of days in the most recent fiscal half-year,
divided by 366, to reflect the one-half year period.
- ------
32
Beginning Ending Expenses Paid
Account Account During Period*
Value Value 11/1/07 - Annualized
11/1/07 4/30/08 4/30/08 Expense Ratio*
Focused Growth
ACTUAL
Investor Class $1,000 $960.60 $4.87 1.00%
Institutional Class $1,000 $961.10 $3.90 0.80%
A Class $1,000 $958.90 $6.09 1.25%
B Class $1,000 $955.20 $9.72 2.00%
C Class $1,000 $955.20 $9.72 2.00%
R Class $1,000 $958.00 $7.30 1.50%
HYPOTHETICAL
Investor Class $1,000 $1,019.89 $5.02 1.00%
Institutional Class $1,000 $1,020.89 $4.02 0.80%
A Class $1,000 $1,018.65 $6.27 1.25%
B Class $1,000 $1,014.92 $10.02 2.00%
C Class $1,000 $1,014.92 $10.02 2.00%
R Class $1,000 $1,017.40 $7.52 1.50%
Fundamental Equity
ACTUAL
Investor Class $1,000 $912.10 $4.80 1.01%
Institutional Class $1,000 $912.70 $3.85 0.81%
A Class $1,000 $910.90 $5.99 1.26%
B Class $1,000 $907.40 $9.53 2.01%
C Class $1,000 $906.80 $9.53 2.01%
R Class $1,000 $909.00 $7.17 1.51%
HYPOTHETICAL
Investor Class $1,000 $1,019.84 $5.07 1.01%
Institutional Class $1,000 $1,020.84 $4.07 0.81%
A Class $1,000 $1,018.60 $6.32 1.26%
B Class $1,000 $1,014.87 $10.07 2.01%
C Class $1,000 $1,014.87 $10.07 2.01%
R Class $1,000 $1,017.35 $7.57 1.51%
* Expenses are equal to the class's annualized expense ratio listed in the
table above, multiplied by the average account value over the period,
multiplied by 182, the number of days in the most recent fiscal half-year,
divided by 366, to reflect the one-half year period.
- ------
33
STATEMENT OF ASSETS AND LIABILITIES
APRIL 30, 2008 (UNAUDITED)
Capital Focused Fundamental
Select Growth Growth Equity
ASSETS
Investment securities
- -- at value (cost of
$2,051,461,298,
$7,093,008,
$12,506,897 and
$440,178,662,
respectively) --
including $-,
$99,430, $259,942 and
$3,499,770 of
securities on loan,
respectively $2,378,790,996 $7,822,493 $13,408,130 $442,892,825
Investments made with
cash collateral
received for
securities on loan,
at value (cost of $-,
$102,495, $264,253
and $3,574,375,
respectively) -- 102,495 264,253 3,574,375
-------------- ---------- ----------- ------------
Total investment
securities, at value
(cost of
$2,051,461,298,
$7,195,503,
$12,771,150 and
$443,753,037,
respectively) 2,378,790,996 7,924,988 13,672,383 446,467,200
Cash -- 211,374 2,515 1,746,637
Receivable for
investments sold 27,275,674 111,149 219,166 3,793,326
Receivable for
forward foreign
currency exchange
contracts 139,780 135 97 2,627
Receivable for
capital shares sold 150 200 -- 670,215
Dividends and
interest receivable 2,166,989 3,623 5,363 319,269
-------------- ---------- ----------- ------------
2,408,373,589 8,251,469 13,899,524 452,999,274
-------------- ---------- ----------- ------------
LIABILITIES
Disbursements in
excess of demand
deposit cash 329,252 -- -- --
Payable for
collateral received
for securities on loan -- 102,495 264,253 3,574,375
Payable for
investments purchased 15,095,920 155,141 342,605 9,827,085
Payable for forward
foreign currency
exchange contracts 48,151 -- -- --
Payable for capital
shares redeemed -- -- -- 99,197
Accrued management
fees 1,921,969 6,089 10,297 343,302
Distribution fees
payable 3,158 1,098 61 21,756
Service fees (and
distribution fees --
A Class and R Class)
payable 7,709 1,116 41 73,802
-------------- ---------- ----------- ------------
17,406,159 265,939 617,257 13,939,517
-------------- ---------- ----------- ------------
NET ASSETS $2,390,967,430 $7,985,530 $13,282,267 $439,059,757
=============== ========== =========== ============
See Notes to Financial Statements.
- ------
34
APRIL 30, 2008 (UNAUDITED)
Capital Focused Fundamental
Select Growth Growth Equity
NET ASSETS CONSIST OF:
Capital (par value and
paid-in surplus) $1,999,816,806 $7,406,418 $12,260,618 $444,694,922
Accumulated
undistributed net
investment income
(loss) 1,062,173 (6,049) 3,339 340,719
Accumulated
undistributed net
realized gain (loss)
on investment and
foreign currency
transactions 62,682,951 (144,495) 116,980 (8,691,436)
Net unrealized
appreciation on
investments and
translation of assets
and liabilities in
foreign currencies 327,405,500 729,656 901,330 2,715,552
-------------- ---------- ----------- ------------
$2,390,967,430 $7,985,530 $13,282,267 $439,059,757
============== ========== =========== ============
INVESTOR CLASS, $0.01
PAR VALUE
Net assets $2,210,282,240 $2,172,065 $13,063,637 $60,085,719
Shares outstanding 57,889,683 176,497 1,193,155 4,342,615
Net asset value per
share $38.18 $12.31 $10.95 $13.84
INSTITUTIONAL CLASS,
$0.01 PAR VALUE
Net assets $143,096,611 $31,404 $24,673 $1,902,338
Shares outstanding 3,708,993 2,537 2,256 137,433
Net asset value per
share $38.58 $12.38 $10.94 $13.84
A CLASS, $0.01 PAR
VALUE
Net assets $32,401,429 $3,734,171 $61,985 $339,862,877
Shares outstanding 860,735 305,579 5,654 24,574,388
Net asset value per
share $37.64 $12.22 $10.96 $13.83
Maximum offering price
(net asset value
divided by 0.9425) $39.94 $12.97 $11.63 $14.67
B CLASS, $0.01 PAR
VALUE
Net assets $4,384,451 $997,818 $24,500 $5,656,321
Shares outstanding 119,864 84,530 2,226 412,875
Net asset value per
share $36.58 $11.80 $11.01 $13.70
C CLASS, $0.01 PAR
VALUE
Net assets $773,800 $993,881 $82,900 $31,075,514
Shares outstanding 21,131 84,195 7,532 2,267,513
Net asset value per
share $36.62 $11.80 $11.01 $13.70
R CLASS, $0.01 PAR
VALUE
Net assets $28,899 $56,191 $24,572 $476,988
Shares outstanding 763 4,635 2,238 34,554
Net asset value per
share $37.85 $12.12 $10.98 $13.80
See Notes to Financial Statements.
- ------
35
STATEMENT OF OPERATIONS
FOR THE SIX MONTHS ENDED APRIL 30, 2008 (UNAUDITED)
Capital Focused Fundamental
Select Growth Growth Equity
INVESTMENT INCOME (LOSS)
INCOME:
Dividends (net of
foreign taxes withheld
of $112,511, $421,
$668 and $748,
respectively) $ 12,147,667 $ 35,783 $ 67,760 $ 3,604,044
Interest 593,520 1,477 4,092 86,063
Securities lending, net 60,366 1,163 509 30,378
-------------- ---------- ---------- -------------
12,801,553 38,423 72,361 3,720,485
-------------- ---------- ---------- -------------
EXPENSES:
Management fees 12,121,440 32,139 62,460 1,808,486
Distribution fees:
B Class 17,568 3,258 89 19,432
C Class 3,233 2,858 268 101,500
Service fees:
B Class 5,856 1,086 30 6,477
C Class 1,077 953 89 33,833
Distribution and
service fees:
A Class 45,495 3,928 38 343,324
R Class 72 95 60 1,147
Directors' fees and
expenses 28,626 141 144 7,652
Other expenses 5,701 14 19 521
-------------- ---------- ---------- -------------
12,229,068 44,472 63,197 2,322,372
-------------- ---------- ---------- -------------
NET INVESTMENT INCOME
(LOSS) 572,485 (6,049) 9,164 1,398,113
-------------- ---------- ---------- -------------
REALIZED AND
UNREALIZED GAIN (LOSS)
NET REALIZED GAIN
(LOSS) ON:
Investment transactions 71,605,803 (112,888) 133,443 (8,502,805)
Foreign currency
transactions (2,505,635) (6,663) (17,118) (115,383)
-------------- ---------- ---------- -------------
69,100,168 (119,551) 116,325 (8,618,188)
-------------- ---------- ---------- -------------
CHANGE IN NET
UNREALIZED
APPRECIATION
(DEPRECIATION) ON:
Investments (328,969,020) (246,596) (696,609) (22,564,564)
Translation of assets
and liabilities in
foreign currencies 698,109 331 1,012 19,597
-------------- ---------- ---------- -------------
(328,270,911) (246,265) (695,597) (22,544,967)
-------------- ---------- ---------- -------------
NET REALIZED AND
UNREALIZED GAIN (LOSS) (259,170,743) (365,816) (579,272) (31,163,155)
-------------- ---------- ---------- -------------
NET INCREASE
(DECREASE) IN NET
ASSETS RESULTING FROM
OPERATIONS $(258,598,258) $(371,865) $(570,108) $(29,765,042)
============== ========== ========== =============
See Notes to Financial Statements.
- ------
36
STATEMENT OF CHANGES IN NET ASSETS
SIX MONTHS ENDED APRIL 30, 2008 (UNAUDITED) AND YEAR ENDED OCTOBER 31, 2007
Select Capital Growth
Increase (Decrease)
in Net Assets 2008 2007 2008 2007
OPERATIONS
Net investment income
(loss) $572,485 $ 2,931,467 $ (6,049) $ (19,033)
Net realized gain
(loss) 69,100,168 199,860,391 (119,551) 481,849
Change in net
unrealized
appreciation
(depreciation) (328,270,911) 461,001,866 (246,265) 544,596
-------------- -------------- ---------- ----------
Net increase
(decrease) in net
assets resulting from
operations (258,598,258) 663,793,724 (371,865) 1,007,412
-------------- -------------- ---------- ----------
DISTRIBUTIONS TO
SHAREHOLDERS
From net investment
income:
Investor Class -- (10,981,848) -- --
Institutional
Class -- (951,224) -- --
A Class -- (39,351) -- --
A Class (old)
(Note 9) -- (47,590) -- --
R Class -- -- -- --
From net realized
gains:
Investor Class (182,640,492) (39,672,127) (106,995) (1,045)
Institutional
Class (12,086,566) (2,344,204) (2,469) (331)
A Class (3,075,006) (343,121) (239,050) (27,475)
A Class (old)
(Note 9) -- (414,970) -- --
B Class (404,171) (92,435) (71,895) (11,734)
C Class (75,080) (19,786) (55,027) (10,342)
R Class (2,305) (381) (2,746) (331)
-------------- -------------- ---------- ----------
Decrease in net
assets from
distributions (198,283,620) (54,907,037) (478,182) (51,258)
-------------- -------------- ---------- ----------
CAPITAL SHARE
TRANSACTIONS
Net increase
(decrease) in net
assets from capital
share transactions 79,784,496 (622,635,475) 2,896,109 896,296
-------------- -------------- ---------- ----------
NET INCREASE
(DECREASE) IN NET
ASSETS (377,097,382) (13,748,788) 2,046,062 1,852,450
NET ASSETS
Beginning of period 2,768,064,812 2,781,813,600 5,939,468 4,087,018
-------------- -------------- ---------- ----------
End of period $2,390,967,430 $2,768,064,812 $7,985,530 $5,939,468
============== ============== ========== ==========
Accumulated
undistributed net
investment income
(loss) $1,062,173 $489,688 $(6,049) --
============== ============== ========== ==========
See Notes to Financial Statements.
- ------
37
SIX MONTHS ENDED APRIL 30, 2008 (UNAUDITED) AND YEAR ENDED OCTOBER 31, 2007
Focused Growth Fundamental Equity
Increase (Decrease) in
Net Assets 2008 2007 2008 2007
OPERATIONS
Net investment income
(loss) $ 9,164 $ 45,727 $ 1,398,113 $ 1,103,561
Net realized gain (loss) 116,325 1,532,515 (8,618,188) 8,179,496
Change in net
unrealized appreciation
(depreciation) (695,597) 418,442 (22,544,967) 22,198,609
----------- ----------- ------------ ------------
Net increase (decrease)
in net assets resulting
from operations (570,108) 1,996,684 (29,765,042) 31,481,666
----------- ----------- ------------ ------------
DISTRIBUTIONS TO
SHAREHOLDERS
From net investment
income:
Investor Class (7,155) (54,114) (460,415) (24,444)
Institutional Class (63) -- (2,800) (256)
A Class -- -- (1,508,022) (137,443)
R Class -- -- (1,563) (4)
From net realized gains:
Investor Class (1,516,407) (299,286) (1,329,674) (59,454)
Institutional Class (2,904) -- (6,528) (447)
A Class (2,856) -- (6,205,227) (657,564)
B Class (2,673) -- (119,040) (25,167)
C Class (7,928) -- (598,169) (83,263)
R Class (2,795) -- (11,182) (489)
----------- ----------- ------------ ------------
Decrease in net assets
from distributions (1,542,781) (353,400) (10,242,620) (988,531)
----------- ----------- ------------ ------------
CAPITAL SHARE
TRANSACTIONS
Net increase (decrease)
in net assets from
capital share
transactions 1,835,713 (3,920,671) 148,679,336 252,655,161
----------- ----------- ------------ ------------
NET INCREASE (DECREASE)
IN NET ASSETS (277,176) (2,277,387) 108,671,674 283,148,296
NET ASSETS
Beginning of period 13,559,443 15,836,830 330,388,083 47,239,787
----------- ----------- ------------ ------------
End of period $13,282,267 $13,559,443 $439,059,757 $330,388,083
=========== =========== ============ ============
Undistributed net
investment income $3,339 $1,393 $340,719 $915,406
=========== =========== ============ ============
See Notes to Financial Statements.
- ------
38
NOTES TO FINANCIAL STATEMENTS
APRIL 30, 2008 (UNAUDITED)
1. ORGANIZATION AND SUMMARY OF SIGNIFICANT ACCOUNTING POLICIES
ORGANIZATION -- American Century Mutual Funds, Inc. (the corporation) is
registered under the Investment Company Act of 1940 (the 1940 Act) as an
open-end management investment company. Select Fund (Select), Capital Growth
Fund (Capital Growth), Focused Growth Fund (Focused Growth) and Fundamental
Equity Fund (Fundamental Equity) (collectively, the funds) are four funds in a
series issued by the corporation. The funds are diversified under the 1940
Act. Prior to March 1, 2008, Focused Growth was nondiversified. The funds'
investment objective is to seek long-term capital growth. Income is a
secondary objective of Fundamental Equity. Select, Capital Growth and Focused
Growth pursue this objective by purchasing stocks of larger-sized companies
that management believes will increase in value over time. Fundamental Equity
looks for common stocks that management believes are attractively priced
relative to the companies' earnings growth potential and dividend yields. The
following is a summary of the funds' significant accounting policies.
MULTIPLE CLASS -- The funds are authorized to issue the Investor Class, the
Institutional Class, the A Class, the B Class, the C Class and the R Class.
The A Class may incur an initial sales charge. The A Class, B Class and C
Class may be subject to a contingent deferred sales charge. The share classes
differ principally in their respective sales charges and distribution and
shareholder servicing expenses and arrangements. All shares of each fund
represent an equal pro rata interest in the net assets of the class to which
such shares belong, and have identical voting, dividend, liquidation and other
rights and the same terms and conditions, except for class specific expenses
and exclusive rights to vote on matters affecting only individual classes.
Income, non-class specific expenses, and realized and unrealized capital gains
and losses of the funds are allocated to each class of shares based on their
relative net assets. Sale of Focused Growth's Institutional Class, A Class, B
Class, C Class and R Class commenced on September 28, 2007.
SECURITY VALUATIONS -- Securities traded primarily on a principal securities
exchange are valued at the last reported sales price, or at the mean of the
latest bid and asked prices where no last sales price is available. Depending
on local convention or regulation, securities traded over-the-counter are
valued at the mean of the latest bid and asked prices, the last sales price,
or the official close price. Debt securities not traded on a principal
securities exchange are valued through a commercial pricing service or at the
mean of the most recent bid and asked prices. Discount notes may be valued
through a commercial pricing service or at amortized cost, which approximates
fair value. Securities traded on foreign securities exchanges and
over-the-counter markets are normally completed before the close of business
on days that the New York Stock Exchange (the Exchange) is open and may also
take place on days when the Exchange is not open. If an event occurs after the
value of a security was established but before the net asset value per share
was determined that was likely to materially change the net asset value, that
security would be valued as determined in accordance with procedures adopted
by the Board of Directors. If the funds determine that the market price of a
portfolio security is not readily available, or that the valuation methods
mentioned above do not reflect the security's fair value, such security is
valued as determined by the Board of Directors or its designee, in accordance
with procedures adopted by the Board of Directors, if such determination would
materially impact a fund's net asset value. Certain other circumstances may
cause the funds to use alternative procedures to value a security such as: a
security has been declared in default; trading in a security has been halted
during the trading day; or there is a foreign market holiday and no trading
will commence.
SECURITY TRANSACTIONS -- For financial reporting purposes, security
transactions are accounted for as of the trade date. Net realized gains and
losses are determined on the identified cost basis, which is also used for
federal income tax purposes.
INVESTMENT INCOME -- Dividend income less foreign taxes withheld, if any, is
recorded as of the ex-dividend date. Interest income is recorded on the
accrual basis and includes accretion of discounts and amortization of
premiums.
SECURITIES ON LOAN -- The funds may lend portfolio securities through their
lending agent to certain approved borrowers in order to earn additional
income. The income earned, net of any rebates or fees, is included in the
Statement of Operations. The funds continue to recognize any gain or loss in
the market price of the securities loaned and record any interest earned or
dividends declared.
EXCHANGE TRADED FUNDS -- The funds may invest in exchange traded funds (ETFs).
ETFs are a type of index fund bought and sold on a securities exchange. An ETF
trades like common stock and represents a fixed portfolio of securities
designed to track the performance and dividend yield of a particular
- ------
39
domestic or foreign market index. A fund may purchase an ETF to temporarily
gain exposure to a portion of the U.S. or a foreign market while awaiting
purchase of underlying securities. The risks of owning an ETF generally
reflect the risks of owning the underlying securities they are designed to
track, although the lack of liquidity on an ETF could result in it being more
volatile. Additionally, ETFs have management fees, which increase their cost.
FOREIGN CURRENCY TRANSACTIONS -- All assets and liabilities initially
expressed in foreign currencies are translated into U.S. dollars at prevailing
exchange rates at period end. Purchases and sales of investment securities,
dividend and interest income, and certain expenses are translated at the rates
of exchange prevailing on the respective dates of such transactions. For
assets and liabilities, other than investments in securities, net realized and
unrealized gains and losses from foreign currency translations arise from
changes in currency exchange rates.
Net realized and unrealized foreign currency exchange gains or losses
occurring during the holding period of investment securities are a component
of realized gain (loss) on investment transactions and unrealized appreciation
(depreciation) on investments, respectively. Certain countries may impose
taxes on the contract amount of purchases and sales of foreign currency
contracts in their currency. The funds record the foreign tax expense, if any,
as a reduction to the net realized gain (loss) on foreign currency
transactions.
FORWARD FOREIGN CURRENCY EXCHANGE CONTRACTS -- The funds may enter into
forward foreign currency exchange contracts to facilitate transactions of
securities denominated in a foreign currency or to hedge the funds' exposure
to foreign currency exchange rate fluctuations. The net U.S. dollar value of
foreign currency underlying all contractual commitments held by the funds and
the resulting unrealized appreciation or depreciation are determined daily
using prevailing exchange rates. The funds bear the risk of an unfavorable
change in the foreign currency exchange rate underlying the forward contract.
Additionally, losses may arise if the counterparties do not perform under the
contract terms.
REPURCHASE AGREEMENTS -- The funds may enter into repurchase agreements with
institutions that American Century Investment Management, Inc. (ACIM) (the
investment advisor) has determined are creditworthy pursuant to criteria
adopted by the Board of Directors. Each repurchase agreement is recorded at
cost. Each fund requires that the collateral, represented by securities,
received in a repurchase transaction be transferred to the custodian in a
manner sufficient to enable each fund to obtain those securities in the event
of a default under the repurchase agreement. ACIM monitors, on a daily basis,
the securities transferred to ensure the value, including accrued interest, of
the securities under each repurchase agreement is equal to or greater than
amounts owed to each fund under each repurchase agreement.
JOINT TRADING ACCOUNT -- Pursuant to an Exemptive Order issued by the
Securities and Exchange Commission, each fund, along with other registered
investment companies having management agreements with ACIM or American
Century Global Investment Management, Inc. (ACGIM), may transfer uninvested
cash balances into a joint trading account. These balances are invested in one
or more repurchase agreements that are collateralized by U.S. Treasury or
Agency obligations.
INCOME TAX STATUS -- It is each fund's policy to distribute substantially all
net investment income and net realized gains to shareholders and to otherwise
qualify as a regulated investment company under provisions of the Internal
Revenue Code. The funds are no longer subject to examination by tax
authorities for years prior to 2004. At this time, management has not
identified any uncertain tax positions for which it is reasonably possible
that the total amounts of unrecognized tax benefits will significantly change
in the next twelve months. Accordingly, no provision has been made for federal
or state income taxes. Interest and penalties associated with any federal or
state income tax obligations, if any, are recorded as interest expense.
DISTRIBUTIONS TO SHAREHOLDERS -- Distributions to shareholders are recorded on
the ex-dividend date. Distributions from net investment income and net
realized gains, if any, are generally declared and paid annually.
INDEMNIFICATIONS -- Under the corporation's organizational documents, its
officers and directors are indemnified against certain liabilities arising out
of the performance of their duties to the funds. In addition, in the normal
course of business, the funds enter into contracts that provide general
indemnifications. The funds' maximum exposure under these arrangements is
unknown as this would involve future claims that may be made against the
funds. The risk of material loss from such claims is considered by management
to be remote.
- ------
40
USE OF ESTIMATES -- The financial statements are prepared in conformity with
accounting principles generally accepted in the United States of America,
which may require management to make certain estimates and assumptions at the
date of the financial statements. Actual results could differ from these
estimates.
2. FEES AND TRANSACTIONS WITH RELATED PARTIES
MANAGEMENT FEES -- The corporation has entered into a Management Agreement
with ACIM, under which ACIM provides the funds with investment advisory and
management services in exchange for a single, unified management fee (the fee)
per class. The Agreement provides that all expenses of the funds, except
brokerage commissions, taxes, interest, fees and expenses of those directors
who are not considered "interested persons" as defined in the 1940 Act
(including counsel fees) and extraordinary expenses, will be paid by ACIM. The
fee is computed and accrued daily based on the daily net assets of each
specific class of shares of each fund and paid monthly in arrears. For funds
with a stepped fee schedule, the rate of the fee is determined by applying a
fee rate calculation formula. This formula takes into account all of the
investment advisor's assets under management in each fund's investment
strategy (strategy assets) to calculate the appropriate fee rate for each
fund. The strategy assets include each fund's assets and the assets of other
clients of the investment advisor that are not in the American Century family
of funds, but that have the same investment team and investment strategy. The
annual management fee schedule for the funds ranges from 0.800% to 1.000% for
the Investor Class, A Class, B Class, C Class and R Class. The Institutional
Class is 0.200% less at each point within the range. The effective annual
management fee for each class of the funds for the six months ended April 30,
2008, was 1.00% for the Investor Class, A Class, B Class, C Class and R Class
and 0.80% for the Institutional Class.
DISTRIBUTION AND SERVICE FEES -- The Board of Directors has adopted a separate
Master Distribution and Individual Shareholder Services Plan for each of the A
Class, B Class, C Class and R Class (collectively the plans), pursuant to Rule
12b-1 of the 1940 Act. The plans provide that the A Class will pay American
Century Investment Services, Inc. (ACIS) an annual distribution and service
fee of 0.25%. The plans provide that the B Class and C Class will each pay
ACIS an annual distribution fee of 0.75% and service fee of 0.25%. The plans
provide that the R Class will pay ACIS an annual distribution and service fee
of 0.50%. The fees are computed and accrued daily based on each class's daily
net assets and paid monthly in arrears. The distribution fee provides
compensation for expenses incurred in connection with distributing shares of
the classes including, but not limited to, payments to brokers, dealers, and
financial institutions that have entered into sales agreements with respect to
shares of the funds. The service fee provides compensation for individual
shareholder services rendered by broker/dealers or other independent financial
intermediaries. Fees incurred under the plans during the six months ended
April 30, 2008, are detailed in the Statement of Operations.
RELATED PARTIES -- Certain officers and directors of the corporation are also
officers and/or directors, and, as a group, controlling stockholders of
American Century Companies, Inc. (ACC), the parent of the corporation's
investment advisor, ACIM, the distributor of the corporation, ACIS, and the
corporation's transfer agent, American Century Services, LLC.
The funds are eligible to invest in a money market fund for temporary
purposes, which is managed by J.P. Morgan Investment Management, Inc. (JPMIM).
JPMIM is a wholly owned subsidiary of JPMorgan Chase & Co. (JPM). JPM is an
equity investor in ACC. The funds have a securities lending agreement with
JPMorgan Chase Bank (JPMCB). Prior to December 12, 2007, the funds had a bank
line of credit agreement with JPMCB. JPMCB is a custodian of the funds and a
wholly owned subsidiary of JPM.
3. INVESTMENT TRANSACTIONS
Investment transactions, excluding short-term investments, for the six months
ended April 30, 2008, were as follows:
Capital Focused Fundamental
Select Growth Growth Equity
Purchases $801,695,413 $6,847,508 $9,348,579 $230,102,091
Proceeds from sales $998,941,570 $4,576,272 $9,074,215 $92,091,399
- ------
41
4. CAPITAL SHARE TRANSACTIONS
Transactions in shares of the funds were as follows:
Six months ended Year ended
April 30, 2008 October 31, 2007
Shares Amount Shares Amount
Select
INVESTOR
CLASS/SHARES
AUTHORIZED 300,000,000 300,000,000
=========== ===========
Sold 814,312 $ 32,030,902 1,250,472 $ 48,790,315
Issued in
reinvestment of
distributions 4,320,701 174,988,384 1,304,522 48,241,214
Redeemed (3,191,032) (126,022,388) (17,717,923) (685,347,731)
----------- ------------ ------------ --------------
1,943,981 80,996,898 (15,162,929) (588,316,202)
----------- ------------ ------------ --------------
INSTITUTIONAL
CLASS/SHARES
AUTHORIZED 40,000,000 40,000,000
=========== ===========
Sold 30,105 1,167,747 353,624 13,609,415
Issued in
reinvestment of
distributions 295,584 12,086,426 88,501 3,294,898
Redeemed (279,795) (11,046,309) (849,574) (32,045,945)
----------- ------------ ------------ --------------
45,894 2,207,864 (407,449) (15,141,632)
----------- ------------ ------------ --------------
A CLASS/SHARES
AUTHORIZED 75,000,000 75,000,000
=========== ===========
Sold 71,278 2,784,094 148,523 5,577,259
Issued in
connection with
reclassification
(Note 9) -- -- 506,351 20,436,277
Issued in
reinvestment of
distributions 75,309 3,009,333 9,421 344,992
Redeemed (235,328) (8,919,767) (314,140) (12,073,334)
----------- ------------ ------------ --------------
(88,741) (3,126,340) 350,155 14,285,194
----------- ------------ ------------ --------------
A CLASS
(OLD)/SHARES
AUTHORIZED N/A N/A
=========== ===========
Sold 37,196 1,415,182
Issued in
reinvestment of
distributions 12,149 447,803
Redeemed in
connection with
reclassification
(Note 9) (506,351) (20,436,277)
Redeemed (330,339) (12,574,066)
----------- ------------ ------------ --------------
(787,345) (31,147,358)
----------- ------------ ------------ --------------
B CLASS/SHARES
AUTHORIZED 25,000,000 25,000,000
=========== ===========
Sold 2,132 79,142 7,203 268,506
Issued in
reinvestment of
distributions 9,553 372,090 2,401 86,511
Redeemed (18,236) (696,525) (50,198) (1,890,695)
----------- ------------ ------------ --------------
(6,551) (245,293) (40,594) (1,535,678)
----------- ------------ ------------ --------------
C CLASS/SHARES
AUTHORIZED 25,000,000 25,000,000
=========== ===========
Sold 438 17,020 714 26,450
Issued in
reinvestment of
distributions 1,459 56,859 426 15,353
Redeemed (3,490) (125,171) (22,109) (823,182)
----------- ------------ ------------ --------------
(1,593) (51,292) (20,969) (781,379)
----------- ------------ ------------ --------------
R CLASS/SHARES
AUTHORIZED 50,000,000 50,000,000
=========== ===========
Sold 9 354 54 2,087
Issued in
reinvestment of
distributions 57 2,305 10 381
Redeemed -- -- (23) (888)
----------- ------------ ------------ --------------
66 2,659 41 1,580
----------- ------------ ------------ --------------
Net increase
(decrease) 1,893,056 $ 79,784,496 (16,069,090) $(622,635,475)
=========== ============ ============ ==============
- ------
42
Six months ended Year ended
April 30, 2008 October 31, 2007
Shares Amount Shares Amount
Capital Growth
INVESTOR CLASS/SHARES
AUTHORIZED 300,000,000 300,000,000
=========== ===========
Sold 101,766 $1,295,699 78,738 $ 1,095,962
Issued in reinvestment of
distributions 8,465 106,995 88 1,045
Redeemed (13,853) (177,164) (5,954) (79,017)
----------- ---------- ----------- ----------
96,378 1,225,530 72,872 1,017,990
----------- ---------- ----------- ----------
INSTITUTIONAL CLASS/SHARES
AUTHORIZED 50,000,000 50,000,000
=========== ===========
Issued in reinvestment of
distributions 195 2,469 27 331
----------- ---------- ----------- ----------
A CLASS/SHARES AUTHORIZED 100,000,000 100,000,000
=========== ===========
Sold 91,559 1,099,254 123,502 1,513,050
Issued in reinvestment of
distributions 16,251 204,109 2,022 23,962
Redeemed (26,652) (324,711) (84,101) (1,089,133)
----------- ---------- ----------- ----------
81,158 978,652 41,423 447,879
----------- ---------- ----------- ----------
B CLASS/SHARES AUTHORIZED 100,000,000 100,000,000
=========== ===========
Sold 24,143 286,282 27,689 332,104
Issued in reinvestment of
distributions 5,124 62,361 990 11,480
Redeemed (7,699) (88,433) (48,876) (626,062)
----------- ---------- ----------- ----------
21,568 260,210 (20,197) (282,478)
----------- ---------- ----------- ----------
C CLASS/SHARES AUTHORIZED 100,000,000 100,000,000
=========== ===========
Sold 45,267 540,401 20,884 259,074
Issued in reinvestment of
distributions 2,288 27,845 809 9,388
Redeemed (13,969) (164,340) (43,150) (558,908)
----------- ---------- ----------- ----------
33,586 403,906 (21,457) (290,446)
----------- ---------- ----------- ----------
R CLASS/SHARES AUTHORIZED 60,000,000 60,000,000
=========== ===========
Sold 1,961 23,562 195 2,713
Issued in reinvestment of
distributions 220 2,746 28 331
Redeemed (83) (966) (2) (24)
----------- ---------- ----------- ----------
2,098 25,342 221 3,020
----------- ---------- ----------- ----------
Net increase (decrease) 234,983 $2,896,109 72,889 $ 896,296
=========== ========== =========== ==========
- ------
43
Six months ended Year ended
April 30, 2008 October 31, 2007(1)
Shares Amount Shares Amount
Focused Growth
INVESTOR CLASS/SHARES
AUTHORIZED 50,000,000 50,000,000
========== ==========
Sold 181,666 $ 2,014,610 252,879 $ 2,955,714
Issued in reinvestment of
distributions 136,093 1,498,382 29,862 339,826
Redeemed (159,887) (1,743,164) (633,768) (7,391,198)
---------- ----------- ---------- ------------
157,872 1,769,828 (351,027) (4,095,658)
---------- ----------- ---------- ------------
INSTITUTIONAL CLASS/SHARES
AUTHORIZED 10,000,000 10,000,000
========== ==========
Sold -- -- 1,986 25,000
Issued in reinvestment of
distributions 270 2,967 -- --
---------- ----------- ---------- ------------
270 2,967 1,986 25,000
---------- ----------- ---------- ------------
A CLASS/SHARES AUTHORIZED 10,000,000 10,000,000
========== ==========
Sold 3,409 36,663 1,986 25,000
Issued in reinvestment of
distributions 259 2,856 -- --
---------- ----------- ---------- ------------
3,668 39,519 1,986 25,000
---------- ----------- ---------- ------------
B CLASS/SHARES AUTHORIZED 10,000,000 10,000,000
========== ==========
Sold -- -- 1,986 25,000
Issued in reinvestment of
distributions 240 2,673 -- --
---------- ----------- ---------- ------------
240 2,673 1,986 25,000
---------- ----------- ---------- ------------
C CLASS/SHARES AUTHORIZED 10,000,000 10,000,000
========== ==========
Sold 926 10,003 5,892 74,987
Issued in reinvestment of
distributions 714 7,928 -- --
---------- ----------- ---------- ------------
1,640 17,931 5,892 74,987
---------- ----------- ---------- ------------
R CLASS/SHARES AUTHORIZED 10,000,000 10,000,000
========== ==========
Sold -- -- 1,986 25,000
Issued in reinvestment of
distributions 252 2,795 -- --
---------- ----------- ---------- ------------
252 2,795 1,986 25,000
---------- ----------- ---------- ------------
Net increase (decrease) 163,942 $ 1,835,713 (337,191) $(3,920,671)
========== =========== ========== ============
(1) September 28, 2007 (commencement of sale) through October 31, 2007 for the
Institutional Class, A Class, B Class, C Class and R Class.
- ------
44
Six months ended Year ended
April 30, 2008 October 31, 2007
Shares Amount Shares Amount
Fundamental Equity
INVESTOR CLASS/SHARES
AUTHORIZED 200,000,000 200,000,000
=========== ===========
Sold 1,711,660 $ 23,822,312 3,715,748 $ 53,813,021
Issued in reinvestment
of distributions 110,977 1,604,732 5,867 77,738
Redeemed (917,956) (12,539,990) (581,646) (8,716,197)
----------- ------------ ----------- ------------
904,681 12,887,054 3,139,969 45,174,562
----------- ------------ ----------- ------------
INSTITUTIONAL
CLASS/SHARES AUTHORIZED 50,000,000 50,000,000
=========== ===========
Sold 119,132 1,616,621 15,790 209,743
Issued in reinvestment
of distributions 86 1,242 53 703
----------- ------------ ----------- ------------
119,218 1,617,863 15,843 210,446
----------- ------------ ----------- ------------
A CLASS/SHARES
AUTHORIZED 50,000,000 50,000,000
=========== ===========
Sold 10,498,557 145,761,716 13,689,196 198,932,845
Issued in reinvestment
of distributions 519,284 7,514,042 58,553 776,411
Redeemed (2,179,439) (30,126,558) (915,776) (13,379,165)
----------- ------------ ----------- ------------
8,838,402 123,149,200 12,831,973 186,330,091
----------- ------------ ----------- ------------
B CLASS/SHARES
AUTHORIZED 50,000,000 50,000,000
=========== ===========
Sold 119,822 1,685,955 224,752 3,219,435
Issued in reinvestment
of distributions 6,509 93,530 1,357 17,871
Redeemed (29,891) (403,918) (27,247) (393,576)
----------- ------------ ----------- ------------
96,440 1,375,567 198,862 2,843,730
----------- ------------ ----------- ------------
C CLASS/SHARES
AUTHORIZED 50,000,000 50,000,000
=========== ===========
Sold 833,897 11,615,733 1,308,090 18,834,090
Issued in reinvestment
of distributions 21,262 305,742 3,892 51,300
Redeemed (175,690) (2,367,264) (79,354) (1,139,749)
----------- ------------ ----------- ------------
679,469 9,554,211 1,232,628 17,745,641
----------- ------------ ----------- ------------
R CLASS/SHARES
AUTHORIZED 60,000,000 60,000,000
=========== ===========
Sold 10,066 141,454 33,938 472,163
Issued in reinvestment
of distributions 882 12,745 37 493
Redeemed (4,475) (58,758) (8,262) (121,965)
----------- ------------ ----------- ------------
6,473 95,441 25,713 350,691
----------- ------------ ----------- ------------
Net increase (decrease) 10,644,683 $148,679,336 17,444,988 $252,655,161
=========== ============ =========== ============
- ------
45
5. SECURITIES LENDING
As of April 30, 2008, securities in Capital Growth, Focused Growth and
Fundamental Equity valued at $99,430, $259,942 and $3,499,770, respectively,
were on loan through the lending agent, JPMCB, to certain approved borrowers.
As of April 30, 2008, Select did not have any securities on loan. JPMCB
receives and maintains collateral in the form of cash and/or acceptable
securities as approved by ACIM. Cash collateral is invested in authorized
investments by the lending agent in a pooled account. The value of cash
collateral received at period end is disclosed in the Statement of Assets and
Liabilities and investments made with the cash by the lending agent are listed
in the Schedule of Investments. Any deficiencies or excess of collateral must
be delivered or transferred by the member firms no later than the close of
business on the next business day. The total market value of all collateral
received for Capital Growth, Focused Growth and Fundamental Equity, at this
date, was $102,495, $264,253 and $3,574,375, respectively. The funds' risks in
securities lending are that the borrower may not provide additional collateral
when required or return the securities when due. If the borrower defaults,
receipt of the collateral by the funds may be delayed or limited.
6. BANK LINE OF CREDIT
Effective December 12, 2007, the funds, along with certain other funds managed
by ACIM or ACGIM, have a $500,000,000 unsecured bank line of credit agreement
with Bank of America, N.A. Prior to December 12, 2007, the funds, along with
certain other funds managed by ACIM or ACGIM, had a $500,000,000 unsecured
bank line of credit agreement with JPMCB. The funds may borrow money for
temporary or emergency purposes to fund shareholder redemptions. Borrowings
under the agreement, which is subject to annual renewal, bear interest at the
Federal Funds rate plus 0.40%. The funds did not borrow from the line during
the six months ended April 30, 2008.
7. RISK FACTORS
There are certain risks involved in investing in foreign securities. These
risks include those resulting from future adverse political, social, and
economic developments, fluctuations in currency exchange rates, the possible
imposition of exchange controls, and other foreign laws or restrictions.
Focused Growth's investment process may result in high portfolio turnover,
high commission costs and high capital gains distributions. In addition, its
investment approach may involve higher volatility and risk.
Fundamental Equity's performance may be affected by investments in initial
public offerings (IPOs). The impact of IPO's on a fund's performance depends
on the strength of the IPO market and the size of the fund. IPOs may have less
impact on a fund's performance as its assets grow.
8. FEDERAL TAX INFORMATION
The book-basis character of distributions made during the year from net
investment income or net realized gains may differ from their ultimate
characterization for federal income tax purposes. These differences reflect
the differing character of certain income items and net realized gains and
losses for financial statement and tax purposes, and may result in
reclassification among certain capital accounts on the financial statements.
As of April 30, 2008, the components of investments for federal income tax
purposes were as follows:
Capital Focused Fundamental
Select Growth Growth Equity
Federal tax
cost of
investments $2,056,901,794 $7,294,425 $12,834,649 $444,988,787
============== =========== =========== ============
Gross tax
appreciation
of investments $367,841,283 $ 847,090 $1,083,171 $ 26,622,847
Gross tax
depreciation
of investments (45,952,081) (216,527) (245,437) (25,144,434)
-------------- ----------- ----------- ------------
Net tax
appreciation
(depreciation)
of investments $321,889,202 $ 630,563 $ 837,734 $ 1,478,413
============== =========== =========== ============
The difference between book-basis and tax-basis cost and unrealized
appreciation (depreciation) is attributable primarily to the tax deferral of
losses on wash sales.
- ------
46
9. CORPORATE EVENT
On July 27, 2007, the A Class (old) shareholders of Select approved a
reclassification of A Class (old) shares into Advisor Class shares. The change
was approved by the Board of Directors on November 29, 2006 and March 7, 2007.
The reclassification was effective on September 4, 2007. Subsequent to the
reclassification, the Advisor Class was renamed A Class.
10. RECENTLY ISSUED ACCOUNTING STANDARDS
The Financial Accounting Standards Board (FASB) issued Statement of Financial
Accounting Standards No. 157, "Fair Value Measurements" (FAS 157), in
September 2006, which is effective for fiscal years beginning after November
15, 2007. FAS 157 defines fair value, establishes a framework for measuring
fair value and expands the required financial statement disclosures about fair
value measurements. Management is currently evaluating the impact that
adopting FAS 157 will have on the financial statement disclosures.
In March 2008, the FASB issued Statement of Financial Accounting Standards No.
161, "Disclosures about Derivative Instruments and Hedging Activities -- an
amendment of FASB Statement No. 133" (FAS 161). FAS 161 is effective for
fiscal years beginning after November 15, 2008. FAS 161 amends and expands
disclosures about derivative instruments and hedging activities. FAS 161
requires qualitative disclosures about the objectives and strategies of
derivative instruments, quantitative disclosures about the fair value amounts
of and gains and losses on derivative instruments, and disclosures of
credit-risk-related contingent features in hedging activities. Management is
currently evaluating the impact that adopting FAS 161 will have on the
financial statement disclosures.
- ------
47
FINANCIAL HIGHLIGHTS
Select
Investor Class
For a Share Outstanding Throughout the Years Ended October 31
(except as noted)
2008(1) 2007 2006 2005 2004 2003
PER-SHARE DATA
Net Asset Value,
Beginning of Period $45.58 $36.22 $37.04 $34.80 $33.77 $28.91
------- ------- ------- ------- ------- -------
Income From
Investment
Operations
Net Investment
Income (Loss)(2) 0.01 0.04 0.21 0.15 --(3) 0.01
Net Realized and
Unrealized Gain
(Loss) (4.11) 10.06 (0.77) 2.17 1.03 4.92
------- ------- ------- ------- ------- -------
Total From
Investment
Operations (4.10) 10.10 (0.56) 2.32 1.03 4.93
------- ------- ------- ------- ------- -------
Distributions
From Net
Investment Income -- (0.16) (0.26) (0.08) -- (0.07)
From Net
Realized Gains (3.30) (0.58) -- -- -- --
------- ------- ------- ------- ------- -------
Total
Distributions (3.30) (0.74) (0.26) (0.08) -- (0.07)
------- ------- ------- ------- ------- -------
Net Asset Value,
End of Period $38.18 $45.58 $36.22 $37.04 $34.80 $33.77
======= ======= ======= ======= ======= =======
TOTAL RETURN(4) (9.41)% 28.37% (1.55)% 6.67% 3.05% 17.11%
RATIOS/SUPPLEMENTAL DATA
Ratio of
Operating
Expenses
to Average Net
Assets 1.00%(5) 1.00% 1.00% 1.00% 1.00% 1.00%
Ratio of Net
Investment
Income (Loss)
to Average
Net Assets 0.04%(5) 0.11% 0.57% 0.42% (0.01)% 0.03%
Portfolio
Turnover Rate 33% 79% 206% 55% 48% 84%
Net Assets,
End of Period
(in millions) $2,210 $2,550 $2,576 $3,329 $3,565 $3,828
(1) Six months ended April 30, 2008 (unaudited).
(2) Computed using average shares outstanding throughout the period.
(3) Per-share amount was less than $0.005.
(4) Total return assumes reinvestment of net investment income and capital
gains distributions, if any. Total returns for periods less than one year are
not annualized. The total return of the classes may not precisely reflect the
class expense differences because of the impact of calculating the net asset
values to two decimal places. If net asset values were calculated to three
decimal places, the total return differences would more closely reflect the
class expense differences. The calculation of net asset values to two decimal
places is made in accordance with SEC guidelines and does not result in any
gain or loss of value between one class and another.
(5) Annualized.
See Notes to Financial Statements.
- ------
48
Select
Institutional Class
For a Share Outstanding Throughout the Years Ended October 31
(except as noted)
2008(1) 2007 2006 2005 2004 2003
PER-SHARE DATA
Net Asset
Value,
Beginning
of Period $45.98 $36.53 $37.35 $35.09 $33.99 $29.10
-------- -------- -------- -------- -------- --------
Income From
Investment
Operations
Net
Investment
Income
(Loss)(2) 0.05 0.12 0.30 0.24 0.07 0.07
Net Realized
and
Unrealized
Gain (Loss) (4.15) 10.15 (0.78) 2.18 1.03 4.95
-------- -------- -------- -------- -------- --------
Total From
Investment
Operations (4.10) 10.27 (0.48) 2.42 1.10 5.02
-------- -------- -------- -------- -------- --------
Distributions
From Net
Investment
Income -- (0.24) (0.34) (0.16) -- (0.13)
From Net
Realized
Gains (3.30) (0.58) -- -- -- --
-------- -------- -------- -------- -------- --------
Total
Distributions (3.30) (0.82) (0.34) (0.16) -- (0.13)
-------- -------- -------- -------- -------- --------
Net Asset
Value,
End of Period $38.58 $45.98 $36.53 $37.35 $35.09 $33.99
======== ======== ======== ======== ======== ========
TOTAL RETURN(3) (9.32)% 28.63% (1.35)% 6.87% 3.24% 17.34%
RATIOS/SUPPLEMENTAL DATA
Ratio of
Operating
Expenses
to Average
Net Assets 0.80%(4) 0.80% 0.80% 0.80% 0.80% 0.80%
Ratio of Net
Investment
Income (Loss)
to Average
Net Assets 0.24%(4) 0.31% 0.77% 0.62% 0.19% 0.23%
Portfolio
Turnover Rate 33% 79% 206% 55% 48% 84%
Net Assets,
End of Period
(in thousands) $143,097 $168,441 $148,717 $198,212 $234,815 $229,596
(1) Six months ended April 30, 2008 (unaudited).
(2) Computed using average shares outstanding throughout the period.
(3) Total return assumes reinvestment of net investment income and capital
gains distributions, if any. Total returns for periods less than one year are
not annualized. The total return of the classes may not precisely reflect the
class expense differences because of the impact of calculating the net asset
values to two decimal places. If net asset values were calculated to three
decimal places, the total return differences would more closely reflect the
class expense differences. The calculation of net asset values to two decimal
places is made in accordance with SEC guidelines and does not result in any
gain or loss of value between one class and another.
(4) Annualized.
See Notes to Financial Statements.
- ------
49
Select
A Class(1)
For a Share Outstanding Throughout the Years Ended October 31
(except as noted)
2008(2) 2007 2006 2005 2004 2003
PER-SHARE DATA
Net Asset Value,
Beginning of
Period $45.05 $35.80 $36.63 $34.43 $33.49 $28.66
------- ------- ------- ------- ------- -------
Income From
Investment
Operations
Net Investment
Income
(Loss)(3) (0.04) (0.09) 0.12 0.04 (0.09) (0.07)
Net Realized
and
Unrealized
Gain (Loss) (4.07) 9.99 (0.76) 2.16 1.03 4.90
------- ------- ------- ------- ------- -------
Total From
Investment
Operations (4.11) 9.90 (0.64) 2.20 0.94 4.83
------- ------- ------- ------- ------- -------
Distributions
From Net
Investment
Income -- (0.07) (0.19) -- -- --(4)
From Net
Realized Gains (3.30) (0.58) -- -- -- --
------- ------- ------- ------- ------- -------
Total
Distributions (3.30) (0.65) (0.19) -- -- --(4)
------- ------- ------- ------- ------- -------
Net Asset Value,
End of Period $37.64 $45.05 $35.80 $36.63 $34.43 $33.49
======= ======= ======= ======= ======= =======
TOTAL RETURN(5) (9.55)% 28.07% (1.79)% 6.39% 2.81% 16.86%
RATIOS/SUPPLEMENTAL DATA
Ratio of
Operating
Expenses
to Average
Net Assets 1.25%(6) 1.25% 1.25% 1.25% 1.25% 1.25%
Ratio of Net
Investment
Income (Loss)
to Average
Net Assets (0.21)%(6) (0.14)% 0.32% 0.17% (0.26)% (0.22)%
Portfolio
Turnover Rate 33% 79% 206% 55% 48% 84%
Net Assets, End of
Period
(in thousands) $32,401 $42,770 $21,455 $27,741 $22,626 $29,152
(1) Prior to September 4, 2007, the A Class was referred to as the Advisor
Class.
(2) Six months ended April 30, 2008 (unaudited).
(3) Computed using average shares outstanding throughout the period.
(4) Per-share amount was less than $0.005.
(5) Total return assumes reinvestment of net investment income and capital
gains distributions, if any, and does not reflect applicable sales charges.
Total returns for periods less than one year are not annualized. The total
return of the classes may not precisely reflect the class expense differences
because of the impact of calculating the net asset values to two decimal
places. If net asset values were calculated to three decimal places, the total
return differences would more closely reflect the class expense differences.
The calculation of net asset values to two decimal places is made in
accordance with SEC guidelines and does not result in any gain or loss of
value between one class and another.
(6) Annualized.
See Notes to Financial Statements.
- ------
50
Select
B Class
For a Share Outstanding Throughout the Years Ended October 31
(except as noted)
2008(1) 2007 2006 2005 2004 2003(2)
PER-SHARE DATA
Net Asset
Value,
Beginning
of Period $44.03 $35.21 $36.12 $34.21 $33.53 $27.75
------- ------- ------- ------- ------- -------
Income From
Investment
Operations
Net
Investment
Income
(Loss)(3) (0.18) (0.34) (0.12) (0.22) (0.35) (0.31)
Net Realized
and
Unrealized
Gain (Loss) (3.97) 9.74 (0.79) 2.13 1.03 6.09
------- ------- ------- ------- ------- -------
Total From
Investment
Operations (4.15) 9.40 (0.91) 1.91 0.68 5.78
------- ------- ------- ------- ------- -------
Distributions
From Net
Realized
Gains (3.30) (0.58) -- -- -- --
------- ------- ------- ------- ------- -------
Net Asset Value,
End of Period $36.58 $44.03 $35.21 $36.12 $34.21 $33.53
======= ======= ======= ======= ======= =======
TOTAL RETURN(4) (9.88)% 27.07% (2.52)% 5.58% 2.03% 20.83%
RATIOS/SUPPLEMENTAL DATA
Ratio of
Operating
Expenses
to Average
Net Assets 2.00%(5) 2.00% 2.00% 2.00% 2.00% 2.00%(5)
Ratio of Net
Investment
Income (Loss)
to Average
Net Assets (0.96)%(5) (0.89)% (0.43)% (0.58)% (1.01)% (1.28)%(5)
Portfolio
Turnover Rate 33% 79% 206% 55% 48% 84%(6)
Net Assets,
End of Period
(in
thousands) $4,384 $5,567 $5,880 $2,501 $2,273 $1,032
(1) Six months ended April 30, 2008 (unaudited).
(2) January 31, 2003 (commencement of sale) through October 31, 2003.
(3) Computed using average shares outstanding throughout the period.
(4) Total return assumes reinvestment of net investment income and capital
gains distributions, if any, and does not reflect applicable sales charges.
Total returns for periods less than one year are not annualized. The total
return of the classes may not precisely reflect the class expense differences
because of the impact of calculating the net asset values to two decimal
places. If net asset values were calculated to three decimal places, the total
return differences would more closely reflect the class expense differences.
The calculation of net asset values to two decimal places is made in
accordance with SEC guidelines and does not result in any gain or loss of
value between one class and another.
(5) Annualized.
(6) Portfolio turnover is calculated at the fund level. Percentage indicated
was calculated for the year ended October 31, 2003.
See Notes to Financial Statements.
- ------
51
Select
C Class
For a Share Outstanding Throughout the Years Ended October 31
(except as noted)
2008(1) 2007 2006 2005 2004 2003(2)
PER-SHARE DATA
Net Asset
Value,
Beginning
of Period $44.07 $35.24 $36.15 $34.23 $33.56 $27.75
------- ------- ------- ------- ------- -------
Income From
Investment
Operations
Net
Investment
Income
(Loss)(3) (0.18) (0.34) (0.16) (0.22) (0.36) (0.31)
Net Realized
and
Unrealized
Gain (Loss) (3.97) 9.75 (0.75) 2.14 1.03 6.12
------- ------- ------- ------- ------- -------
Total From
Investment
Operations (4.15) 9.41 (0.91) 1.92 0.67 5.81
------- ------- ------- ------- ------- -------
Distributions
From Net
Realized
Gains (3.30) (0.58) -- -- -- --
------- ------- ------- ------- ------- -------
Net Asset
Value,
End of Period $36.62 $44.07 $35.24 $36.15 $34.23 $33.56
======= ======= ======= ======= ======= =======
TOTAL RETURN(4) (9.87)% 27.07% (2.52)% 5.58% 2.03% 20.94%
RATIOS/SUPPLEMENTAL DATA
Ratio of
Operating
Expenses
to Average
Net Assets 2.00%(5) 2.00% 2.00% 2.00% 2.00% 2.00%(5)
Ratio of Net
Investment
Income (Loss)
to Average
Net Assets (0.96)%(5) (0.89)% (0.43)% (0.58)% (1.01)% (1.28)%(5)
Portfolio
Turnover Rate 33% 79% 206% 55% 48% 84%(6)
Net Assets,
End of Period
(in
thousands) $774 $1,001 $1,540 $3,511 $3,733 $1,136
(1) Six months ended April 30, 2008 (unaudited).
(2) January 31, 2003 (commencement of sale) through October 31, 2003.
(3) Computed using average shares outstanding throughout the period.
(4) Total return assumes reinvestment of net investment income and capital
gains distributions, if any, and does not reflect applicable sales charges.
Total returns for periods less than one year are not annualized. The total
return of the classes may not precisely reflect the class expense differences
because of the impact of calculating the net asset values to two decimal
places. If net asset values were calculated to three decimal places, the total
return differences would more closely reflect the class expense differences.
The calculation of net asset values to two decimal places is made in
accordance with SEC guidelines and does not result in any gain or loss of
value between one class and another.
(5) Annualized.
(6) Portfolio turnover is calculated at the fund level. Percentage indicated
was calculated for the year ended October 31, 2003.
See Notes to Financial Statements.
- ------
52
Select
R Class
For a Share Outstanding Throughout the Years Ended October 31
(except as noted)
2008(1) 2007 2006 2005(2)
PER-SHARE DATA
Net Asset Value, Beginning
of Period $45.33 $36.05 $37.00 $38.34
------- ------- ------- -------
Income From Investment
Operations
Net Investment Income (Loss)(3) (0.09) (0.15) 0.03 (0.05)
Net Realized and
Unrealized Gain (Loss) (4.09) 10.01 (0.77) (1.29)
------- ------- ------- -------
Total From
Investment Operations (4.18) 9.86 (0.74) (1.34)
------- ------- ------- -------
Distributions
From Net Investment Income -- -- (0.21) --
From Net Realized Gains (3.30) (0.58) -- --
------- ------- ------- -------
Total Distributions (3.30) (0.58) (0.21) --
------- ------- ------- -------
Net Asset Value, End of Period $37.85 $45.33 $36.05 $37.00
======= ======= ======= =======
TOTAL RETURN(4) (9.65)% 27.72% (2.04)% (3.50)%
RATIOS/SUPPLEMENTAL DATA
Ratio of Operating Expenses
to Average Net Assets 1.50%(5) 1.50% 1.50% 1.50%(5)
Ratio of Net Investment Income
(Loss) to Average Net Assets (0.46)%(5) (0.39)% 0.07% (0.50)%(5)
Portfolio Turnover Rate 33% 79% 206% 55%(6)
Net Assets, End of Period
(in thousands) $29 $32 $24 $24
(1) Six months ended April 30, 2008 (unaudited).
(2) July 29, 2005 (commencement of sale) through October 31, 2005.
(3) Computed using average shares outstanding throughout the period.
(4) Total return assumes reinvestment of net investment income and capital
gains distributions, if any. Total returns for periods less than one year are
not annualized. The total return of the classes may not precisely reflect the
class expense differences because of the impact of calculating the net asset
values to two decimal places. If net asset values were calculated to three
decimal places, the total return differences would more closely reflect the
class expense differences. The calculation of net asset values to two decimal
places is made in accordance with SEC guidelines and does not result in any
gain or loss of value between one class and another.
(5) Annualized.
(6) Portfolio turnover is calculated at the fund level. Percentage indicated
was calculated for the year ended October 31, 2005.
See Notes to Financial Statements.
- ------
53
Capital Growth
Investor Class
For a Share Outstanding Throughout the Years Ended October 31
(except as noted)
2008(1) 2007 2006 2005(2)
PER-SHARE DATA
Net Asset Value, Beginning of Period $14.21 $11.81 $10.60 $10.80
------- ------- ------- -------
Income From Investment Operations
Net Investment Income (Loss)(3) 0.01 --(4) --(4) --(4)
Net Realized and Unrealized
Gain (Loss) (0.86) 2.54 1.21 (0.20)
------- ------- ------- -------
Total From Investment Operations (0.85) 2.54 1.21 (0.20)
------- ------- ------- -------
Distributions
From Net Realized Gains (1.05) (0.14) -- --
------- ------- ------- -------
Net Asset Value, End of Period $12.31 $14.21 $11.81 $10.60
======= ======= ======= =======
TOTAL RETURN(5) (6.15)% 21.77% 11.42% (1.85)%
RATIOS/SUPPLEMENTAL DATA
Ratio of Operating Expenses
to Average Net Assets 1.01%(6) 1.01% 1.00% 1.00%(6)
Ratio of Net Investment Income
(Loss) to Average Net Assets 0.19%(6) 0.15% 0.05% (0.12)%(6)
Portfolio Turnover Rate 71% 160% 140% 110%(7)
Net Assets, End of Period
(in thousands) $2,172 $1,139 $86 $25
(1) Six months ended April 30, 2008 (unaudited).
(2) July 29, 2005 (commencement of sale) through October 31, 2005.
(3) Computed using average shares outstanding throughout the period.
(4) Per-share amount was less than $0.005.
(5) Total return assumes reinvestment of net investment income and capital
gains distributions, if any. Total returns for periods less than one year are
not annualized. The total return of the classes may not precisely reflect the
class expense differences because of the impact of calculating the net asset
values to two decimal places. If net asset values were calculated to three
decimal places, the total return differences would more closely reflect the
class expense differences. The calculation of net asset values to two decimal
places is made in accordance with SEC guidelines and does not result in any
gain or loss of value between one class and another.
(6) Annualized.
(7) Portfolio turnover is calculated at the fund level. Percentage indicated
was calculated for the year ended October 31, 2005.
See Notes to Financial Statements.
- ------
54
Capital Growth
Institutional Class
For a Share Outstanding Throughout the Years Ended October 31
(except as noted)
2008(1) 2007 2006 2005(2)
PER-SHARE DATA
Net Asset Value, Beginning of Period $14.28 $11.84 $10.61 $10.80
------- ------- ------- -------
Income From Investment Operations
Net Investment Income (Loss)(3) 0.02 0.04 0.03 --(4)
Net Realized and Unrealized
Gain (Loss) (0.87) 2.54 1.20 (0.19)
------- ------- ------- -------
Total From Investment Operations (0.85) 2.58 1.23 (0.19)
------- ------- ------- -------
Distributions
From Net Realized Gains (1.05) (0.14) -- --
------- ------- ------- -------
Net Asset Value, End of Period $12.38 $14.28 $11.84 $10.61
======= ======= ======= =======
TOTAL RETURN(5) (6.12)% 22.06% 11.59% (1.76)%
RATIOS/SUPPLEMENTAL DATA
Ratio of Operating Expenses
to Average Net Assets 0.81%(6) 0.81% 0.80% 0.80%(6)
Ratio of Net Investment Income (Loss)
to Average Net Assets 0.39%(6) 0.35% 0.25% 0.08%(6)
Portfolio Turnover Rate 71% 160% 140% 110%(7)
Net Assets, End of Period
(in thousands) $31 $33 $27 $25
(1) Six months ended April 30, 2008 (unaudited).
(2) July 29, 2005 (commencement of sale) through October 31, 2005.
(3) Computed using average shares outstanding throughout the period.
(4) Per-share amount was less than $0.005.
(5) Total return assumes reinvestment of net investment income and capital
gains distributions, if any. Total returns for periods less than one year are
not annualized. The total return of the classes may not precisely reflect the
class expense differences because of the impact of calculating the net asset
values to two decimal places. If net asset values were calculated to three
decimal places, the total return differences would more closely reflect the
class expense differences. The calculation of net asset values to two decimal
places is made in accordance with SEC guidelines and does not result in any
gain or loss of value between one class and another.
(6) Annualized.
(7) Portfolio turnover is calculated at the fund level. Percentage indicated
was calculated for the year ended October 31, 2005.
See Notes to Financial Statements.
- ------
55
Capital Growth
A Class
For a Share Outstanding Throughout the Years Ended October 31
(except as noted)
2008(1) 2007 2006 2005 2004(2)
PER-SHARE DATA
Net Asset Value,
Beginning of Period $14.13 $11.78 $10.59 $9.89 $10.00
------- ------- ------- ------- -------
Income From
Investment Operations
Net Investment
Income (Loss)(3) --(4) (0.01) (0.02) --(4) (0.03)
Net Realized and
Unrealized Gain (Loss) (0.86) 2.50 1.21 0.70 (0.08)
------- ------- ------- ------- -------
Total From
Investment Operations (0.86) 2.49 1.19 0.70 (0.11)
------- ------- ------- ------- -------
Distributions
From Net
Realized Gains (1.05) (0.14) -- -- --
------- ------- ------- ------- -------
Net Asset Value,
End of Period $12.22 $14.13 $11.78 $10.59 $9.89
======= ======= ======= ======= =======
TOTAL RETURN(5) (6.26)% 21.40% 11.24% 7.08% (1.10)%
RATIOS/SUPPLEMENTAL DATA
Ratio of Operating
Expenses
to Average Net Assets 1.26%(6) 1.26% 1.25% 1.27% 1.25%(6)
Ratio of Net Investment
Income (Loss)
to Average Net Assets (0.06)%(6) (0.10)% (0.20)% (0.03)% (0.43)%(6)
Portfolio Turnover Rate 71% 160% 140% 110% 87%
Net Assets, End of
Period (in thousands) $3,734 $3,171 $2,155 $1,216 $692
(1) Six months ended April 30, 2008 (unaudited).
(2) February 27, 2004 (fund inception) through October 31, 2004.
(3) Computed using average shares outstanding throughout the period.
(4) Per-share amount was less than $0.005.
(5) Total return assumes reinvestment of net investment income and capital
gains distributions, if any, and does not reflect applicable sales charges.
Total returns for periods less than one year are not annualized. The total
return of the classes may not precisely reflect the class expense differences
because of the impact of calculating the net asset values to two decimal
places. If net asset values were calculated to three decimal places, the total
return differences would more closely reflect the class expense differences.
The calculation of net asset values to two decimal places is made in
accordance with SEC guidelines and does not result in any gain or loss of
value between one class and another.
(6) Annualized.
See Notes to Financial Statements.
- ------
56
Capital Growth
B Class
For a Share Outstanding Throughout the Years Ended October 31 (except as noted)
2008(1) 2007 2006 2005 2004(2)
PER-SHARE DATA
Net Asset Value,
Beginning of Period $13.74 $11.54 $10.46 $9.84 $10.00
------- ------- ------- ------- -------
Income From Investment
Operations
Net Investment
Income (Loss)(3) (0.05) (0.10) (0.10) (0.08) (0.08)
Net Realized and
Unrealized Gain (Loss) (0.84) 2.44 1.18 0.70 (0.08)
------- ------- ------- ------- -------
Total From
Investment Operations (0.89) 2.34 1.08 0.62 (0.16)
------- ------- ------- ------- -------
Distributions
From Net
Realized Gains (1.05) (0.14) -- -- --
------- ------- ------- ------- -------
Net Asset Value,
End of Period $11.80 $13.74 $11.54 $10.46 $9.84
======= ======= ======= ======= =======
TOTAL RETURN(4) (6.60)% 20.54% 10.33% 6.30% (1.60)%
RATIOS/SUPPLEMENTAL DATA
Ratio of Operating
Expenses
to Average Net Assets 2.01%(5) 2.01% 2.00% 2.02% 2.00%(5)
Ratio of Net Investment
Income (Loss)
to Average Net Assets (0.81)%(5) (0.85)% (0.95)% (0.78)% (1.17)%(5)
Portfolio Turnover Rate 71% 160% 140% 110% 87%
Net Assets, End of
Period (in thousands) $998 $865 $960 $772 $450
(1) Six months ended April 30, 2008 (unaudited).
(2) February 27, 2004 (fund inception) through October 31, 2004.
(3) Computed using average shares outstanding throughout the period.
(4) Total return assumes reinvestment of net investment income and capital
gains distributions, if any, and does not reflect applicable sales charges.
Total returns for periods less than one year are not annualized. The total
return of the classes may not precisely reflect the class expense differences
because of the impact of calculating the net asset values to two decimal
places. If net asset values were calculated to three decimal places, the total
return differences would more closely reflect the class expense differences.
The calculation of net asset values to two decimal places is made in
accordance with SEC guidelines and does not result in any gain or loss of
value between one class and another.
(5) Annualized.
See Notes to Financial Statements.
- ------
57
Capital Growth
C Class
For a Share Outstanding Throughout the Years Ended October 31
(except as noted)
2008(1) 2007 2006 2005 2004(2)
PER-SHARE DATA
Net Asset Value, Beginning
of Period $13.74 $11.54 $10.46 $9.84 $10.00
------- ------- ------- ------- -------
Income From
Investment Operations
Net Investment
Income (Loss)(3) (0.05) (0.10) (0.10) (0.08) (0.08)
Net Realized and
Unrealized Gain (Loss) (0.84) 2.44 1.18 0.70 (0.08)
------- ------- ------- ------- -------
Total From
Investment Operations (0.89) 2.34 1.08 0.62 (0.16)
------- ------- ------- ------- -------
Distributions
From Net
Realized Gains (1.05) (0.14) -- -- --
------- ------- ------- ------- -------
Net Asset Value,
End of Period $11.80 $13.74 $11.54 $10.46 $9.84
======= ======= ======= ======= =======
TOTAL RETURN(4) (6.60)% 20.54% 10.33% 6.30% (1.60)%
RATIOS/SUPPLEMENTAL DATA
Ratio of Operating
Expenses
to Average Net Assets 2.01%(5) 2.01% 2.00% 2.02% 2.00%(5)
Ratio of Net Investment
Income (Loss)
to Average Net Assets (0.81)%(5) (0.85)% (0.95)% (0.78)% (1.18)%(5)
Portfolio Turnover Rate 71% 160% 140% 110% 87%
Net Assets, End of
Period (in thousands) $994 $695 $832 $609 $343
(1) Six months ended April 30, 2008 (unaudited).
(2) February 27, 2004 (fund inception) through October 31, 2004.
(3) Computed using average shares outstanding throughout the period.
(4) Total return assumes reinvestment of net investment income and capital
gains distributions, if any, and does not reflect applicable sales charges.
Total returns for periods less than one year are not annualized. The total
return of the classes may not precisely reflect the class expense differences
because of the impact of calculating the net asset values to two decimal
places. If net asset values were calculated to three decimal places, the total
return differences would more closely reflect the class expense differences.
The calculation of net asset values to two decimal places is made in
accordance with SEC guidelines and does not result in any gain or loss of
value between one class and another.
(5) Annualized.
See Notes to Financial Statements.
- ------
58
Capital Growth
R Class
For a Share Outstanding Throughout the Years Ended October 31
(except as noted)
2008(1) 2007 2006 2005(2)
PER-SHARE DATA
Net Asset Value,
Beginning of Period $14.05 $11.74 $10.59 $10.80
------- ------- ------- -------
Income From Investment Operations
Net Investment Income (Loss)(3) (0.02) (0.04) (0.05) (0.02)
Net Realized and
Unrealized Gain (Loss) (0.86) 2.49 1.20 (0.19)
------- ------- ------- -------
Total From
Investment Operations (0.88) 2.45 1.15 (0.21)
------- ------- ------- -------
Distributions
From Net Realized Gains (1.05) (0.14) -- --
------- ------- ------- -------
Net Asset Value, End of Period $12.12 $14.05 $11.74 $10.59
======= ======= ======= =======
TOTAL RETURN(4) (6.38)% 21.13% 10.86% (1.94)%
RATIOS/SUPPLEMENTAL DATA
Ratio of Operating Expenses
to Average Net Assets 1.51%(5) 1.51% 1.50% 1.50%(5)
Ratio of Net Investment Income
(Loss) to Average Net Assets (0.31)%(5) (0.35)% (0.45)% (0.62)%(5)
Portfolio Turnover Rate 71% 160% 140% 110%(6)
Net Assets, End of Period
(in thousands) $56 $36 $27 $25
(1) Six months ended April 30, 2008 (unaudited).
(2) July 29, 2005 (commencement of sale) through October 31, 2005.
(3) Computed using average shares outstanding throughout the period.
(4) Total return assumes reinvestment of net investment income and capital
gains distributions, if any. Total returns for periods less than one year are
not annualized. The total return of the classes may not precisely reflect the
class expense differences because of the impact of calculating the net asset
values to two decimal places. If net asset values were calculated to three
decimal places, the total return differences would more closely reflect the
class expense differences. The calculation of net asset values to two decimal
places is made in accordance with SEC guidelines and does not result in any
gain or loss of value between one class and another.
(5) Annualized.
(6) Portfolio turnover is calculated at the fund level. Percentage indicated
was calculated for the year ended October 31, 2005.
See Notes to Financial Statements.
- ------
59
Focused Growth
Investor Class
For a Share Outstanding Throughout the Years Ended October 31
(except as noted)
2008(1) 2007 2006 2005(2)
PER-SHARE DATA
Net Asset Value, Beginning of Period $12.92 $11.42 $10.53 $10.00
------- ------- ------- -------
Income From Investment Operations
Net Investment Income (Loss)(3) 0.01 0.04 0.01 --(4)
Net Realized and Unrealized
Gain (Loss) (0.51) 1.73 0.95 0.53
------- ------- ------- -------
Total From Investment Operations (0.50) 1.77 0.96 0.53
------- ------- ------- -------
Distributions
From Net Investment Income (0.01) (0.04) --(4) --
From Net Realized Gains (1.46) (0.23) (0.07) --
------- ------- ------- -------
Total Distributions (1.47) (0.27) (0.07) --
------- ------- ------- -------
Net Asset Value, End of Period $10.95 $12.92 $11.42 $10.53
======= ======= ======= =======
TOTAL RETURN(5) (3.94)% 15.78% 9.13% 5.30%
RATIOS/SUPPLEMENTAL DATA
Ratio of Operating Expenses
to Average Net Assets 1.00%(6) 1.00% 1.00% 1.00%(6)
Ratio of Net Investment Income
(Loss) to Average Net Assets 0.16%(6) 0.33% 0.07% 0.00%(6)
Portfolio Turnover Rate 74% 275% 313% 95%
Net Assets, End of Period
(in thousands) $13,064 $13,381 $15,837 $12,175
(1) Six months ended April 30, 2008 (unaudited).
(2) February 28, 2005 (fund inception) through October 31, 2005.
(3) Computed using average shares outstanding throughout the period.
(4) Per-share amount was less than $0.005.
(5) Total return assumes reinvestment of net investment income and capital
gains distributions, if any. Total returns for periods less than one year are
not annualized. The total return of the classes may not precisely reflect the
class expense differences because of the impact of calculating the net asset
values to two decimal places. If net asset values were calculated to three
decimal places, the total return differences would more closely reflect the
class expense differences. The calculation of net asset values to two decimal
places is made in accordance with SEC guidelines and does not result in any
gain or loss of value between one class and another.
(6) Annualized.
See Notes to Financial Statements.
- ------
60
Focused Growth
Institutional Class
For a Share Outstanding Throughout the Periods Indicated
2008(1) 2007(2)
PER-SHARE DATA
Net Asset Value, Beginning of Period $12.93 $12.59
------- -------
Income From Investment Operations
Net Investment Income (Loss)(3) 0.02 --(4)
Net Realized and Unrealized Gain (Loss) (0.52) 0.34
------- -------
Total From Investment Operations (0.50) 0.34
------- -------
Distributions
From Net Investment Income (0.03) --
From Net Realized Gains (1.46) --
------- -------
Total Distributions (1.49) --
------- -------
Net Asset Value, End of Period $10.94 $12.93
======= =======
TOTAL RETURN(5) (3.89)% 2.70%
RATIOS/SUPPLEMENTAL DATA
Ratio of Operating Expenses to Average Net Assets 0.80%(6) 0.80%(6)
Ratio of Net Investment Income (Loss)
to Average Net Assets 0.36%(6) (0.40)%(6)
Portfolio Turnover Rate 74% 275%(7)
Net Assets, End of Period (in thousands) $25 $26
(1) Six months ended April 30, 2008 (unaudited).
(2) September 28, 2007 (commencement of sale) through October 31, 2007.
(3) Computed using average shares outstanding throughout the period.
(4) Per-share amount was less than $0.005.
(5) Total return assumes reinvestment of net investment income and capital
gains distributions, if any. Total returns for periods less than one year are
not annualized. The total return of the classes may not precisely reflect the
class expense differences because of the impact of calculating the net asset
values to two decimal places. If net asset values were calculated to three
decimal places, the total return differences would more closely reflect the
class expense differences. The calculation of net asset values to two decimal
places is made in accordance with SEC guidelines and does not result in any
gain or loss of value between one class and another.
(6) Annualized.
(7) Portfolio turnover is calculated at the fund level. Percentage indicated
was calculated for the year ended October 31, 2007.
See Notes to Financial Statements.
- ------
61
Focused Growth
A Class
For a Share Outstanding Throughout the Periods Indicated
2008(1) 2007(2)
PER-SHARE DATA
Net Asset Value, Beginning of Period $12.92 $12.59
------- -------
Income From Investment Operations
Net Investment Income (Loss)(3) (0.01) (0.01)
Net Realized and Unrealized Gain (Loss) (0.51) 0.34
------- -------
Total From Investment Operations (0.52) 0.33
------- -------
Distributions
From Net Realized Gains (1.44) --
------- -------
Net Asset Value, End of Period $10.96 $12.92
======= =======
TOTAL RETURN(4) (4.11)% 2.62%
RATIOS/SUPPLEMENTAL DATA
Ratio of Operating Expenses to Average Net Assets 1.25%(5) 1.25%(5)
Ratio of Net Investment Income (Loss)
to Average Net Assets (0.09)%(5) (0.85)%(5)
Portfolio Turnover Rate 74% 275%(6)
Net Assets, End of Period (in thousands) $62 $26
(1) Six months ended April 30, 2008 (unaudited).
(2) September 28, 2007 (commencement of sale) through October 31, 2007.
(3) Computed using average shares outstanding throughout the period.
(4) Total return assumes reinvestment of net investment income and capital
gains distributions, if any, and does not reflect applicable sales charges.
Total returns for periods less than one year are not annualized. The total
return of the classes may not precisely reflect the class expense differences
because of the impact of calculating the net asset values to two decimal
places. If net asset values were calculated to three decimal places, the total
return differences would more closely reflect the class expense differences.
The calculation of net asset values to two decimal places is made in
accordance with SEC guidelines and does not result in any gain or loss of
value between one class and another.
(5) Annualized.
(6) Portfolio turnover is calculated at the fund level. Percentage indicated
was calculated for the year ended October 31, 2007.
See Notes to Financial Statements.
- ------
62
Focused Growth
B Class
For a Share Outstanding Throughout the Periods Indicated
2008(1) 2007(2)
PER-SHARE DATA
Net Asset Value, Beginning of Period $12.91 $12.59
------- -------
Income From Investment Operations
Net Investment Income (Loss)(3) (0.05) (0.02)
Net Realized and Unrealized Gain (Loss) (0.50) 0.34
------- -------
Total From Investment Operations (0.55) 0.32
------- -------
Distributions
From Net Realized Gains (1.35) --
------- -------
Net Asset Value, End of Period $11.01 $12.91
======= =======
TOTAL RETURN(4) (4.48)% 2.54%
RATIOS/SUPPLEMENTAL DATA
Ratio of Operating Expenses to Average Net Assets 2.00%(5) 2.00%(5)
Ratio of Net Investment Income (Loss)
to Average Net Assets (0.84)%(5) (1.60)%(5)
Portfolio Turnover Rate 74% 275%(6)
Net Assets, End of Period (in thousands) $25 $26
(1) Six months ended April 30, 2008 (unaudited).
(2) September 28, 2007 (commencement of sale) through October 31, 2007.
(3) Computed using average shares outstanding throughout the period.
(4) Total return assumes reinvestment of net investment income and capital
gains distributions, if any, and does not reflect applicable sales charges.
Total returns for periods less than one year are not annualized. The total
return of the classes may not precisely reflect the class expense differences
because of the impact of calculating the net asset values to two decimal
places. If net asset values were calculated to three decimal places, the total
return differences would more closely reflect the class expense differences.
The calculation of net asset values to two decimal places is made in
accordance with SEC guidelines and does not result in any gain or loss of
value between one class and another.
(5) Annualized.
(6) Portfolio turnover is calculated at the fund level. Percentage indicated
was calculated for the year ended October 31, 2007.
See Notes to Financial Statements.
- ------
63
Focused Growth
C Class
For a Share Outstanding Throughout the Periods Indicated
2008(1) 2007(2)
PER-SHARE DATA
Net Asset Value, Beginning of Period $12.91 $12.59
------- -------
Income From Investment Operations
Net Investment Income (Loss)(3) (0.05) (0.02)
Net Realized and Unrealized Gain (Loss) (0.50) 0.34
------- -------
Total From Investment Operations (0.55) 0.32
------- -------
Distributions
From Net Realized Gains (1.35) --
------- -------
Net Asset Value, End of Period $11.01 $12.91
======= =======
TOTAL RETURN(4) (4.48)% 2.54%
RATIOS/SUPPLEMENTAL DATA
Ratio of Operating Expenses to Average Net Assets 2.00%(5) 2.00%(5)
Ratio of Net Investment Income (Loss)
to Average Net Assets (0.84)%(5) (1.52)%(5)
Portfolio Turnover Rate 74% 275%(6)
Net Assets, End of Period (in thousands) $83 $76
(1) Six months ended April 30, 2008 (unaudited).
(2) September 28, 2007 (commencement of sale) through October 31, 2007.
(3) Computed using average shares outstanding throughout the period.
(4) Total return assumes reinvestment of net investment income and capital
gains distributions, if any, and does not reflect applicable sales charges.
Total returns for periods less than one year are not annualized. The total
return of the classes may not precisely reflect the class expense differences
because of the impact of calculating the net asset values to two decimal
places. If net asset values were calculated to three decimal places, the total
return differences would more closely reflect the class expense differences.
The calculation of net asset values to two decimal places is made in
accordance with SEC guidelines and does not result in any gain or loss of
value between one class and another.
(5) Annualized.
(6) Portfolio turnover is calculated at the fund level. Percentage indicated
was calculated for the year ended October 31, 2007.
See Notes to Financial Statements.
- ------
64
Focused Growth
R Class
For a Share Outstanding Throughout the Periods Indicated
2008(1) 2007(2)
PER-SHARE DATA
Net Asset Value, Beginning of Period $12.92 $12.59
------- -------
Income From Investment Operations
Net Investment Income (Loss)(3) (0.02) (0.01)
Net Realized and Unrealized Gain (Loss) (0.51) 0.34
------- -------
Total From Investment Operations (0.53) 0.33
------- -------
Distributions
From Net Realized Gains (1.41) --
------- -------
Net Asset Value, End of Period $10.98 $12.92
======= =======
TOTAL RETURN(4) (4.20)% 2.62%
RATIOS/SUPPLEMENTAL DATA
Ratio of Operating Expenses to Average Net Assets 1.50%(5) 1.50%(5)
Ratio of Net Investment Income (Loss)
to Average Net Assets (0.34)%(5) (1.10)%(5)
Portfolio Turnover Rate 74% 275%(6)
Net Assets, End of Period (in thousands) $25 $26
(1) Six months ended April 30, 2008 (unaudited).
(2) September 28, 2007 (commencement of sale) through October 31, 2007.
(3) Computed using average shares outstanding throughout the period.
(4) Total return assumes reinvestment of net investment income and capital
gains distributions, if any. Total returns for periods less than one year are
not annualized. The total return of the classes may not precisely reflect the
class expense differences because of the impact of calculating the net asset
values to two decimal places. If net asset values were calculated to three
decimal places, the total return differences would more closely reflect the
class expense differences. The calculation of net asset values to two decimal
places is made in accordance with SEC guidelines and does not result in any
gain or loss of value between one class and another.
(5) Annualized.
(6) Portfolio turnover is calculated at the fund level. Percentage indicated
was calculated for the year ended October 31, 2007.
See Notes to Financial Statements.
- ------
65
Fundamental Equity
Investor Class
For a Share Outstanding Throughout the Years Ended October 31
(except as noted)
2008(1) 2007 2006 2005(2)
PER-SHARE DATA
Net Asset Value, Beginning of Period $15.68 $12.88 $11.04 $10.88
------- ------- ------- -------
Income From Investment Operations
Net Investment Income (Loss)(3) 0.07 0.14 0.08 0.02
Net Realized and Unrealized
Gain (Loss) (1.43) 2.93 2.12 0.14
------- ------- ------- -------
Total From Investment Operations (1.36) 3.07 2.20 0.16
------- ------- ------- -------
Distributions
From Net Investment Income (0.12) (0.08) -- --
From Net Realized Gains (0.36) (0.19) (0.36) --
------- ------- ------- -------
Total Distributions (0.48) (0.27) (0.36) --
------- ------- ------- -------
Net Asset Value, End of Period $13.84 $15.68 $12.88 $11.04
======= ======= ======= =======
TOTAL RETURN(4) (8.79)% 24.18% 20.37% 1.47%
RATIOS/SUPPLEMENTAL DATA
Ratio of Operating Expenses
to Average Net Assets 1.01%(5) 1.00% 1.00% 1.00%(5)
Ratio of Net Investment
Income (Loss)
to Average Net Assets 1.05%(5) 0.99% 0.74% 0.59%(5)
Portfolio Turnover Rate 26% 82% 174% 101%(6)
Net Assets, End of Period
(in thousands) $60,086 $53,908 $3,836 $25
(1) Six months ended April 30, 2008 (unaudited).
(2) July 29, 2005 (commencement of sale) through October 31, 2005.
(3) Computed using average shares outstanding throughout the period.
(4) Total return assumes reinvestment of net investment income and capital
gains distributions, if any. Total returns for periods less than one year are
not annualized. The total return of the classes may not precisely reflect the
class expense differences because of the impact of calculating the net asset
values to two decimal places. If net asset values were calculated to three
decimal places, the total return differences would more closely reflect the
class expense differences. The calculation of net asset values to two decimal
places is made in accordance with SEC guidelines and does not result in any
gain or loss of value between one class and another.
(5) Annualized.
(6) Portfolio turnover is calculated at the fund level. Percentage indicated
was calculated for the period November 30, 2004 (fund inception) through
October 31, 2005.
See Notes to Financial Statements.
- ------
66
Fundamental Equity
Institutional Class
For a Share Outstanding Throughout the Years Ended October 31
(except as noted)
2008(1) 2007 2006 2005(2)
PER-SHARE DATA
Net Asset Value, Beginning of Period $15.70 $12.90 $11.05 $10.88
------- ------- ------- -------
Income From Investment Operations
Net Investment Income (Loss)(3) 0.07 0.19 0.12 0.02
Net Realized and Unrealized
Gain (Loss) (1.42) 2.91 2.10 0.15
------- ------- ------- -------
Total From Investment Operations (1.35) 3.10 2.22 0.17
------- ------- ------- -------
Distributions
From Net Investment Income (0.15) (0.11) -- --
From Net Realized Gains (0.36) (0.19) (0.37) --
------- ------- ------- -------
Total Distributions (0.51) (0.30) (0.37) --
------- ------- ------- -------
Net Asset Value, End of Period $13.84 $15.70 $12.90 $11.05
======= ======= ======= =======
TOTAL RETURN(4) (8.73)% 24.43% 20.51% 1.56%
RATIOS/SUPPLEMENTAL DATA
Ratio of Operating Expenses
to Average Net Assets 0.81%(5) 0.80% 0.80% 0.80%(5)
Ratio of Net Investment Income (Loss)
to Average Net Assets 1.25%(5) 1.19% 0.94% 0.79%(5)
Portfolio Turnover Rate 26% 82% 174% 101%(6)
Net Assets, End of Period
(in thousands) $1,902 $286 $31 $25
(1) Six months ended April 30, 2008 (unaudited).
(2) July 29, 2005 (commencement of sale) through October 31, 2005.
(3) Computed using average shares outstanding throughout the period.
(4) Total return assumes reinvestment of net investment income and capital
gains distributions, if any. Total returns for periods less than one year are
not annualized. The total return of the classes may not precisely reflect the
class expense differences because of the impact of calculating the net asset
values to two decimal places. If net asset values were calculated to three
decimal places, the total return differences would more closely reflect the
class expense differences. The calculation of net asset values to two decimal
places is made in accordance with SEC guidelines and does not result in any
gain or loss of value between one class and another.
(5) Annualized.
(6) Portfolio turnover is calculated at the fund level. Percentage indicated
was calculated for the period November 30, 2004 (fund inception) through
October 31, 2005.
See Notes to Financial Statements.
- ------
67
Fundamental Equity
A Class
For a Share Outstanding Throughout the Years Ended October 31
(except as noted)
2008(1) 2007 2006 2005(2)
PER-SHARE DATA
Net Asset Value,
Beginning of Period $15.65 $12.85 $11.03 $10.00
------- ------- ------- -------
Income From Investment Operations
Net Investment Income (Loss)(3) 0.06 0.11 0.06 0.02
Net Realized and Unrealized
Gain (Loss) (1.43) 2.92 2.11 1.01
------- ------- ------- -------
Total From Investment Operations (1.37) 3.03 2.17 1.03
------- ------- ------- -------
Distributions
From Net Investment Income (0.09) (0.04) -- --
From Net Realized Gains (0.36) (0.19) (0.35) --
------- ------- ------- -------
Total Distributions (0.45) (0.23) (0.35) --
------- ------- ------- -------
Net Asset Value, End of Period $13.83 $15.65 $12.85 $11.03
======= ======= ======= =======
TOTAL RETURN(4) (8.91)% 23.88% 20.12% 10.30%
RATIOS/SUPPLEMENTAL DATA
Ratio of Operating Expenses
to Average Net Assets 1.26%(5) 1.25% 1.25% 1.28%(5)
Ratio of Net Investment Income
(Loss) to Average Net Assets 0.80%(5) 0.74% 0.49% 0.17%(5)
Portfolio Turnover Rate 26% 82% 174% 101%
Net Assets, End of Period
(in thousands) $339,863 $246,322 $37,314 $1,636
(1) Six months ended April 30, 2008 (unaudited).
(2) November 30, 2004 (fund inception) through October 31, 2005.
(3) Computed using average shares outstanding throughout the period.
(4) Total return assumes reinvestment of net investment income and capital
gains distributions, if any, and does not reflect applicable sales charges.
Total returns for periods less than one year are not annualized. The total
return of the classes may not precisely reflect the class expense differences
because of the impact of calculating the net asset values to two decimal
places. If net asset values were calculated to three decimal places, the total
return differences would more closely reflect the class expense differences.
The calculation of net asset values to two decimal places is made in
accordance with SEC guidelines and does not result in any gain or loss of
value between one class and another.
(5) Annualized.
See Notes to Financial Statements.
- ------
68
Fundamental Equity
B Class
For a Share Outstanding Throughout the Years Ended October 31
(except as noted)
2008(1) 2007 2006 2005(2)
PER-SHARE DATA
Net Asset Value,
Beginning of Period $15.45 $12.74 $10.96 $10.00
------- ------- ------- -------
Income From Investment Operations
Net Investment Income (Loss)(3) --(4) 0.01 (0.02) (0.06)
Net Realized and Unrealized
Gain (Loss) (1.42) 2.89 2.07 1.02
------- ------- ------- -------
Total From Investment Operations (1.42) 2.90 2.05 0.96
------- ------- ------- -------
Distributions
From Net Realized Gains (0.33) (0.19) (0.27) --
------- ------- ------- -------
Net Asset Value, End of Period $13.70 $15.45 $12.74 $10.96
======= ======= ======= =======
TOTAL RETURN(5) (9.26)% 23.01% 19.04% 9.60%
RATIOS/SUPPLEMENTAL DATA
Ratio of Operating Expenses
to Average Net Assets 2.01%(6) 2.00% 2.00% 2.03%(6)
Ratio of Net Investment Income
(Loss) to Average Net Assets 0.05%(6) (0.01)% (0.26)% (0.58)%(6)
Portfolio Turnover Rate 26% 82% 174% 101%
Net Assets, End of Period
(in thousands) $5,656 $4,889 $1,498 $469
(1) Six months ended April 30, 2008 (unaudited).
(2) November 30, 2004 (fund inception) through October 31, 2005.
(3) Computed using average shares outstanding throughout the period.
(4) Per-share amount was less than $0.005.
(5) Total return assumes reinvestment of net investment income and capital
gains distributions, if any, and does not reflect applicable sales charges.
Total returns for periods less than one year are not annualized. The total
return of the classes may not precisely reflect the class expense differences
because of the impact of calculating the net asset values to two decimal
places. If net asset values were calculated to three decimal places, the total
return differences would more closely reflect the class expense differences.
The calculation of net asset values to two decimal places is made in
accordance with SEC guidelines and does not result in any gain or loss of
value between one class and another.
(6) Annualized.
See Notes to Financial Statements.
- ------
69
Fundamental Equity
C Class
For a Share Outstanding Throughout the Years Ended October 31
(except as noted)
2008(1) 2007 2006 2005(2)
PER-SHARE DATA
Net Asset Value,
Beginning of Period $15.46 $12.75 $10.96 $10.00
------- ------- ------- -------
Income From Investment Operations
Net Investment Income (Loss)(3) --(4) --(4) (0.03) (0.06)
Net Realized and Unrealized
Gain (Loss) (1.43) 2.90 2.09 1.02
------- ------- ------- -------
Total From Investment Operations (1.43) 2.90 2.06 0.96
------- ------- ------- -------
Distributions
From Net Realized Gains (0.33) (0.19) (0.27) --
------- ------- ------- -------
Net Asset Value, End of Period $13.70 $15.46 $12.75 $10.96
======= ======= ======= =======
TOTAL RETURN(5) (9.32)% 22.99% 19.13% 9.60%
RATIOS/SUPPLEMENTAL DATA
Ratio of Operating Expenses
to Average Net Assets 2.01%(6) 2.00% 2.00% 2.03%(6)
Ratio of Net Investment Income
(Loss) to Average Net Assets 0.05%(6) (0.01)% (0.26)% (0.58)%(6)
Portfolio Turnover Rate 26% 82% 174% 101%
Net Assets, End of Period
(in thousands) $31,076 $24,544 $4,530 $693
(1) Six months ended April 30, 2008 (unaudited).
(2) November 30, 2004 (fund inception) through October 31, 2005.
(3) Computed using average shares outstanding throughout the period.
(4) Per-share amount was less than $0.005.
(5) Total return assumes reinvestment of net investment income and capital
gains distributions, if any, and does not reflect applicable sales charges.
Total returns for periods less than one year are not annualized. The total
return of the classes may not precisely reflect the class expense differences
because of the impact of calculating the net asset values to two decimal
places. If net asset values were calculated to three decimal places, the total
return differences would more closely reflect the class expense differences.
The calculation of net asset values to two decimal places is made in
accordance with SEC guidelines and does not result in any gain or loss of
value between one class and another.
(6) Annualized.
See Notes to Financial Statements.
- ------
70
Fundamental Equity
R Class
For a Share Outstanding Throughout the Years Ended October 31
(except as noted)
2008(1) 2007 2006 2005(2)
PER-SHARE DATA
Net Asset Value, Beginning of Period $15.61 $12.81 $11.03 $10.88
------- ------- ------- -------
Income From Investment Operations
Net Investment Income (Loss)(3) 0.04 0.09 0.04 --(4)
Net Realized and Unrealized
Gain (Loss) (1.44) 2.90 2.08 0.15
------- ------- ------- -------
Total From Investment Operations (1.40) 2.99 2.12 0.15
------- ------- ------- -------
Distributions
From Net Investment Income (0.05) --(4) -- --
From Net Realized Gains (0.36) (0.19) (0.34) --
------- ------- ------- -------
Total Distributions (0.41) (0.19) (0.34) --
------- ------- ------- -------
Net Asset Value, End of Period $13.80 $15.61 $12.81 $11.03
======= ======= ======= =======
TOTAL RETURN(5) (9.10)% 23.60% 19.67% 1.38%
RATIOS/SUPPLEMENTAL DATA
Ratio of Operating Expenses
to Average Net Assets 1.51%(6) 1.50% 1.50% 1.50%(6)
Ratio of Net Investment Income (Loss)
to Average Net Assets 0.55%(6) 0.49% 0.24% 0.09%(6)
Portfolio Turnover Rate 26% 82% 174% 101%(7)
Net Assets, End of Period
(in thousands) $477 $438 $30 $25
(1) Six months ended April 30, 2008 (unaudited).
(2) July 29, 2005 (commencement of sale) through October 31, 2005.
(3) Computed using average shares outstanding throughout the period.
(4) Per-share amount was less than $0.005.
(5) Total return assumes reinvestment of net investment income and capital
gains distributions, if any. Total returns for periods less than one year are
not annualized. The total return of the classes may not precisely reflect the
class expense differences because of the impact of calculating the net asset
values to two decimal places. If net asset values were calculated to three
decimal places, the total return differences would more closely reflect the
class expense differences. The calculation of net asset values to two decimal
places is made in accordance with SEC guidelines and does not result in any
gain or loss of value between one class and another.
(6) Annualized.
(7) Portfolio turnover is calculated at the fund level. Percentage indicated
was calculated for the period November 30, 2004 (fund inception) through
October 31, 2005.
See Notes to Financial Statements.
- ------
71
ADDITIONAL INFORMATION
RETIREMENT ACCOUNT INFORMATION
As required by law, any distributions you receive from an IRA or certain
403(b), 457 and qualified plans [those not eligible for rollover to an IRA or
to another qualified plan] are subject to federal income tax withholding,
unless you elect not to have withholding apply. Tax will be withheld on the
total amount withdrawn even though you may be receiving amounts that are not
subject to withholding, such as nondeductible contributions. In such case,
excess amounts of withholding could occur. You may adjust your withholding
election so that a greater or lesser amount will be withheld.
If you don't want us to withhold on this amount, you must notify us to not
withhold the federal income tax. Even if you plan to roll over the amount you
withdraw to another tax-deferred account, the withholding rate still applies
to the withdrawn amount unless we have received notice not to withhold federal
income tax prior to the withdrawal. You may notify us in writing or in certain
situations by telephone or through other electronic means. You have the right
to revoke your withholding election at any time and any election you make may
remain in effect until revoked by filing a new election.
Remember, even if you elect not to have income tax withheld, you are liable
for paying income tax on the taxable portion of your withdrawal. If you elect
not to have income tax withheld or you don't have enough income tax withheld,
you may be responsible for payment of estimated tax. You may incur penalties
under the estimated tax rules if your withholding and estimated tax payments
are not sufficient.
State tax will be withheld if, at the time of your distribution, your address
is within one of the mandatory withholding states and you have federal income
tax withheld. State taxes will be withheld from your distribution in
accordance with the respective state rules.
PROXY VOTING GUIDELINES
American Century Investment Management, Inc., the funds' investment advisor,
is responsible for exercising the voting rights associated with the securities
purchased and/or held by the funds. A description of the policies and
procedures the advisor uses in fulfilling this responsibility is available
without charge, upon request, by calling 1-800-345-2021. It is also available
on American Century Investments' website at americancentury.com and on the
Securities and Exchange Commission's website at sec.gov. Information regarding
how the investment advisor voted proxies relating to portfolio securities
during the most recent 12-month period ended June 30 is available on the
"About Us" page at americancentury.com. It is also available at sec.gov.
QUARTERLY PORTFOLIO DISCLOSURE
The funds file their complete schedule of portfolio holdings with the
Securities and Exchange Commission (SEC) for the first and third quarters of
each fiscal year on Form N-Q. The funds' Forms N-Q are available on the SEC's
website at sec.gov, and may be reviewed and copied at the SEC's Public
Reference Room in Washington, DC. Information on the operation of the Public
Reference Room may be obtained by calling 1-800-SEC-0330. The funds also make
their complete schedule of portfolio holdings for the most recent quarter of
their fiscal year available on their website at americancentury.com and, upon
request, by calling 1-800-345-2021.
- ------
72
INDEX DEFINITIONS
The following indices are used to illustrate investment market, sector, or
style performance or to serve as fund performance comparisons. They are not
investment products available for purchase.
The BLENDED INDEX was the benchmark for Focused Growth from February 2005
through February 2008. It combines two widely known indices, the S&P 500 Index
and the Russell 1000 Growth Index, which are both weighted at 50%.
The RUSSELL 1000® INDEX is a market-capitalization weighted, large-cap index
created by Frank Russell Company to measure the performance of the 1,000
largest of the 3,000 largest publicly traded U.S. companies, based on total
market capitalization.
The RUSSELL 1000® GROWTH INDEX measures the performance of those Russell 1000
Index companies (the 1,000 largest of the 3,000 largest publicly traded U.S.
companies, based on total market capitalization) with higher price-to-book
ratios and higher forecasted growth values.
The RUSSELL 1000® VALUE INDEX measures the performance of those Russell 1000
Index companies (the 1,000 largest of the 3,000 largest publicly traded U.S.
companies, based on total market capitalization) with lower price-to-book
ratios and lower forecasted growth values.
The RUSSELL 2000® INDEX is a market-capitalization weighted index created by
Frank Russell Company to measure the performance of the 2,000 smallest of the
3,000 largest publicly traded U.S. companies, based on total market
capitalization.
The RUSSELL 2000® GROWTH INDEX measures the performance of those Russell 2000
Index companies (the 2,000 smallest of the 3,000 largest publicly traded U.S.
companies, based on total market capitalization) with higher price-to-book
ratios and higher forecasted growth values.
The RUSSELL 2000® VALUE INDEX measures the performance of those Russell 2000
Index companies (the 2,000 smallest of the 3,000 largest publicly traded U.S.
companies, based on total market capitalization) with lower price-to-book
ratios and lower forecasted growth values.
The RUSSELL MIDCAP® INDEX measures the performance of the 800 smallest of the
1,000 largest publicly traded U.S. companies, based on total market
capitalization.
The RUSSELL MIDCAP® GROWTH INDEX measures the performance of those Russell
Midcap Index companies (the 800 smallest of the 1,000 largest publicly traded
U.S. companies, based on total market capitalization) with higher
price-to-book ratios and higher forecasted growth values.
The RUSSELL MIDCAP® VALUE INDEX measures the performance of those Russell
Midcap Index companies (the 800 smallest of the 1,000 largest publicly traded
U.S. companies, based on total market capitalization) with lower price-to-book
ratios and lower forecasted growth values.
The S&P 500 INDEX is a market value-weighted index of the stocks of 500
publicly traded U.S. companies chosen for market size, liquidity, and industry
group representation that are considered to be leading firms in dominant
industries. Each stock's weight in the index is proportionate to its market
value. Created by Standard & Poor's, it is considered to be a broad measure of
U.S. stock market performance.
- ------
73
NOTES
- ------
74
NOTES
- ------
75
NOTES
- ------
76
[back cover]
[american century investments logo and text logo ®]
CONTACT US
AMERICANCENTURY.COM
AUTOMATED INFORMATION LINE . . . . . . . . . . . . . . . 1-800-345-8765
INVESTOR SERVICES REPRESENTATIVE . . . . . . . . . . . . 1-800-345-2021 or
816-531-5575
INVESTORS USING ADVISORS . . . . . . . . . . . . . . . . 1-800-378-9878
BUSINESS, NOT-FOR-PROFIT, EMPLOYER-SPONSORED
RETIREMENT PLANS . . . . . . . . . . . . . . . . . . . . 1-800-345-3533
BANKS AND TRUST COMPANIES, BROKER-DEALERS,
FINANCIAL PROFESSIONALS, INSURANCE COMPANIES . . . . . . 1-800-345-6488
TELECOMMUNICATIONS DEVICE FOR THE DEAF . . . . . . . . . 1-800-634-4113
AMERICAN CENTURY MUTUAL FUNDS, INC.
INVESTMENT ADVISOR:
American Century Investment Management, Inc.
Kansas City, Missouri
This report and the statements it contains are submitted for the general
information of our shareholders. The report is not authorized for distribution to
prospective investors unless preceded or accompanied by an effective prospectus.
American Century Investments
P.O. Box 419200
Kansas City, MO 64141-6200
PRSRT STD
U.S. POSTAGE PAID
AMERICAN CENTURY
COMPANIES
American Century Investment Services, Inc., Distributor
©2008 American Century Proprietary Holdings, Inc. All rights reserved.
0806
CL-SAN-60498S
[front cover]
SEMIANNUAL REPORT
APRIL 30, 2008
[american century investments logo and text logo ®]
AMERICAN CENTURY INVESTMENTS
HERITAGE FUND
NEW OPPORTUNITIES II FUND
PRESIDENT'S LETTER
JONATHAN THOMAS
[photo of Jonathan Thomas]
Dear Investor,
At American Century Investments®, we are committed to helping you reach your
financial goals. Your success is the ultimate measure of our performance.
That's why we focus on achieving superior investment results and building
long-term relationships with investors like you.
Part of that relationship is to clearly communicate investment results and
what influenced them. To help you monitor your investment with us, we take
pride in providing you with the semiannual report for the American Century®
Heritage and New Opportunities II funds for the six months ended April 30,
2008. We also recommend americancentury.com, where we provide company news,
quarterly portfolio commentaries, investment views, and other useful
information.
As noted on the website, 2008 marks the 50th anniversary of American Century
Investments. Since 1958, we've worked to make wise decisions with your
interests as our guide. Fifty years also means that we've met the challenges
of previous economic downturns. As we've crossed those hurdles and earned your
trust, our assets under management have grown to nearly $100 billion, putting
us in the top 5% of our industry. This growth has given us the resources to
offer a wide array of financial products and services, including a
well-diversified line-up of portfolios that provide you with many choices in
these uncertain times.
Though our offerings are diverse, they share several key qualities, including
our disciplined investment approach and active, team-based management. Strict
adherence to our processes and long-term strategies allows us to stay focused
during volatile periods. Investors in our portfolios also benefit from the sum
of our investment teams' expertise as they share research and information.
We'll continue to work hard to earn your trust. Thank you for your continued
support.
Sincerely,
/s/ Jonathan S. Thomas
Jonathan S. Thomas
President and Chief Executive Officer
American Century Investments
TABLE OF CONTENTS
Market Perspective . . . . . . . . . . . . . . . . . . . . . . . . . 2
U.S. Stock Index Returns. . . . . . . . . . . . . . . . . . . . . . 2
HERITAGE
Performance. . . . . . . . . . . . . . . . . . . . . . . . . . . . . 3
Portfolio Commentary . . . . . . . . . . . . . . . . . . . . . . . . 5
Top Ten Holdings. . . . . . . . . . . . . . . . . . . . . . . . . . 5
Top Five Industries . . . . . . . . . . . . . . . . . . . . . . . . 6
Types of Investments in Portfolio . . . . . . . . . . . . . . . . . 6
Schedule of Investments. . . . . . . . . . . . . . . . . . . . . . . 7
NEW OPPORTUNITIES II
Performance. . . . . . . . . . . . . . . . . . . . . . . . . . . . . 10
Portfolio Commentary . . . . . . . . . . . . . . . . . . . . . . . . 12
Top Ten Holdings. . . . . . . . . . . . . . . . . . . . . . . . . . 12
Top Five Industries . . . . . . . . . . . . . . . . . . . . . . . . 13
Types of Investments in Portfolio . . . . . . . . . . . . . . . . . 13
Schedule of Investments. . . . . . . . . . . . . . . . . . . . . . . 14
Shareholder Fee Examples . . . . . . . . . . . . . . . . . . . . . . 17
FINANCIAL STATEMENTS
Statement of Assets and Liabilities. . . . . . . . . . . . . . . . . 19
Statement of Operations. . . . . . . . . . . . . . . . . . . . . . . 21
Statement of Changes in Net Assets . . . . . . . . . . . . . . . . . 22
Notes to Financial Statements. . . . . . . . . . . . . . . . . . . . 23
Financial Highlights . . . . . . . . . . . . . . . . . . . . . . . . 30
OTHER INFORMATION
Additional Information . . . . . . . . . . . . . . . . . . . . . . . 42
Index Definitions. . . . . . . . . . . . . . . . . . . . . . . . . . 43
The opinions expressed in the Market Perspective and each of the Portfolio
Commentaries reflect those of the portfolio management team as of the date of
the report, and do not necessarily represent the opinions of American Century
or any other person in the American Century organization. Any such opinions
are subject to change at any time based upon market or other conditions and
American Century disclaims any responsibility to update such opinions. These
opinions may not be relied upon as investment advice and, because investment
decisions made by American Century funds are based on numerous factors, may
not be relied upon as an indication of trading intent on behalf of any
American Century fund. Security examples are used for representational
purposes only and are not intended as recommendations to purchase or sell
securities. Performance information for comparative indices and securities is
provided to American Century by third party vendors. To the best of American
Century's knowledge, such information is accurate at the time of printing.
MARKET PERSPECTIVE
[photo of Chief Investment Officer]
By Steve Lurito, Chief Investment Officer, U.S. Growth Equity
VOLATILITY UP, STOCKS DOWN
The six months ended April 30, 2008 saw stocks produce negative returns as
market volatility surged in the wake of the subprime credit crisis. In terms
of the economy, tighter credit and the slumping housing market hurt consumer
spending and confidence, leading many economists to suggest we're already in
recession. Meanwhile, mounting losses hurt the banks, brokers, and other big
institutional players important for the functioning of the financial markets.
Facing dual economic and financial crises, the Federal Reserve (the Fed) took
a series of extraordinary steps, slashing interest rates and acting as a
lender of last resort not only for banks, but also major brokers. That helped
stocks rebound, with many analysts suggesting that the mid-March buy-out of
investment bank Bear Stearns--in a deal arranged by the Fed--put a floor under
the market.
RETURNS BY SIZE, STYLE MIXED
Performance by size and style was mixed (see the accompanying table),
reflecting the volatile trading during the period, when corporate earnings
estimates were revised down sharply. Looking at returns by sector, energy
shares were the only segment to produce positive results during the six
months. At the other end of the spectrum, credit-related losses took a big
bite out of earnings for financials stocks, which performed worst. Consumer
discretionary shares also lagged badly, as did information technology stocks,
which suffered from poor pricing and demand trends for chips and some
consumer-related tech goods.
OPPORTUNITY AMID VOLATILITY
Despite the uncertainty surrounding the economy, we think growth-oriented
stocks can perform well relative to value as proven earnings growth becomes
scarce during economic slowdowns. And while we don't see an end to market
volatility anytime soon, we view this dynamic as a natural part of the
investing cycle--and one that presents us with opportunities to build
positions in what we believe are high-quality companies trading at attractive
prices. Indeed, investors should rest assured that we're finding no shortage
of companies demonstrating sustained earnings growth and business improvement.
U.S. Stock Index Returns
For the six months ended April 30, 2008*
RUSSELL 1000 INDEX (LARGE-CAP) -9.54%
Russell 1000 Growth Index -9.28%
Russell 1000 Value Index -9.83%
RUSSELL MIDCAP INDEX -8.77%
Russell Midcap Growth Index -8.44%
Russell Midcap Value Index -9.20%
RUSSELL 2000 INDEX (SMALL-CAP) -12.92%
Russell 2000 Growth Index -14.14%
Russell 2000 Value Index -11.55%
*Total returns for periods less than one year are not annualized.
- ------
2
PERFORMANCE
Heritage
Total Returns as of April 30, 2008
Average Annual Returns
6 10 Since Inception
months(1) 1 year 5 years years Inception Date
INVESTOR CLASS -7.96% 16.35% 20.13% 9.29% 13.19% 11/10/87
RUSSELL MIDCAP
GROWTH INDEX(2) -8.44% -1.93% 15.29% 5.75% 11.81%(3) --
RUSSELL MIDCAP
INDEX(2) -8.77% -6.34% 16.20% 8.33% 13.30%(3) --
Institutional Class -7.87% 16.59% 20.34% 9.53% 10.56% 6/16/97
A Class(4)
No sales
charge* -8.08% 16.10% 19.82% 9.02% 9.65%
With sales
charge* -13.35% 9.43% 18.40% 8.38% 9.05% 7/11/97
B Class
No sales
charge* -8.46% -- -- -- -2.93%(1)
With sales
charge* -13.46% -- -- -- -7.93%(1) 9/28/07
C Class
No sales
charge* -8.44% 15.20% 18.95% -- 8.01%
With sales
charge* -9.31% 15.20% 18.95% -- 8.01% 6/26/01
R Class -8.23% -- -- -- -2.65%(1) 9/28/07
*Sales charges include initial sales charges and contingent deferred sales
charges (CDSCs), as applicable. A Class shares have a 5.75% maximum initial
sales charge for equity funds and may be subject to a maximum CDSC of 1.00%. B
Class shares redeemed within six years of purchase are subject to a CDSC that
declines from 5.00% during the first year after purchase to 0.00% the sixth
year after purchase. C Class shares redeemed within 12 months of purchase are
subject to a maximum CDSC of 1.00%. The SEC requires that mutual funds provide
performance information net of maximum sales charges in all cases where
charges could be applied.
(1) Total returns for periods less than one year are not annualized.
(2) Data provided by Lipper Inc. - A Reuters Company. ©2008 Reuters. All
rights reserved. Any copying, republication or redistribution of Lipper
content, including by caching, framing or similar means, is expressly
prohibited without the prior written consent of Lipper. Lipper shall not be
liable for any errors or delays in the content, or for any actions taken in
reliance thereon.
The data contained herein has been obtained from company reports, financial
reporting services, periodicals and other resources believed to be reliable.
Although carefully verified, data on compilations is not guaranteed by Lipper
and may be incomplete. No offer or solicitations to buy or sell any of the
securities herein is being made by Lipper.
(3) Since 10/31/87, the date nearest the Investor Class's inception for which
data are available.
(4) Prior to September 4, 2007, the A Class was referred to as the Advisor
Class. Performance, with sales charge, prior to that date has been adjusted to
reflect the A Class's current sales charge.
Data presented reflect past performance. Past performance is no guarantee of
future results. Current performance may be higher or lower than the
performance shown. Investment return and principal value will fluctuate, and
redemption value may be more or less than original cost. To obtain performance
data current to the most recent month end, please call 1-800-345-2021 or visit
americancentury.com. International investing involves special risks, such as
political instability and currency fluctuations. Investing in emerging markets
may accentuate these risks.
Unless otherwise indicated, performance reflects Investor Class shares;
performance for other share classes will vary due to differences in fee
structure. For information about other share classes available, please consult
the prospectus. Data assumes reinvestment of dividends and capital gains, and
none of the charts reflect the deduction of taxes that a shareholder would pay
on fund distributions or the redemption of fund shares. Returns for the
indices are provided for comparison. The fund's total returns include
operating expenses (such as transaction costs and management fees) that reduce
returns, while the total returns of the indices do not.
- ------
3
Heritage
Growth of $10,000 Over 10 Years
$10,000 investment made April 30, 1998
One-Year Returns Over 10 Years
Periods ended April 30
1999 2000 2001 2002 2003 2004 2005 2006 2007 2008
Investor Class -6.05% 54.89% -7.92% -9.34% -19.98% 20.31% 4.61% 47.33% 16.06% 16.35%
Russell
Midcap
Growth
Index 12.33% 53.02% -29.47% -15.01% -16.67% 36.14% 7.05% 28.27% 11.13% -1.93%
Russell
Midcap
Index 5.93% 16.01% 0.29% -0.70% -14.13% 35.45% 14.62% 26.42% 15.24% -6.34%
Data presented reflect past performance. Past performance is no guarantee of
future results. Current performance may be higher or lower than the
performance shown. Investment return and principal value will fluctuate, and
redemption value may be more or less than original cost. To obtain performance
data current to the most recent month end, please call 1-800-345-2021 or visit
americancentury.com. International investing involves special risks, such as
political instability and currency fluctuations. Investing in emerging markets
may accentuate these risks.
Unless otherwise indicated, performance reflects Investor Class shares;
performance for other share classes will vary due to differences in fee
structure. For information about other share classes available, please consult
the prospectus. Data assumes reinvestment of dividends and capital gains, and
none of the charts reflect the deduction of taxes that a shareholder would pay
on fund distributions or the redemption of fund shares. Returns for the
indices are provided for comparison. The fund's total returns include
operating expenses (such as transaction costs and management fees) that reduce
returns, while the total returns of the indices do not.
- ------
4
PORTFOLIO COMMENTARY
Heritage
Portfolio Managers: David Hollond and Greg Walsh
In February 2008, Glen Fogle left the Heritage team to focus on the American
Century Vista, NT Vista and VP Vista funds.
PERFORMANCE SUMMARY
Heritage returned -7.96%* for the six months ended April 30, 2008, surpassing
the -8.44% return of the portfolio's benchmark, the Russell Midcap Growth
Index. As of April 30, 2008, Heritage has also produced returns in excess of
its benchmark for the longer investment periods of one, five, and ten years.
As discussed in the Market Perspective on page 2, equity markets generally
declined during the reporting period, as the subprime-mortgage-driven credit
crisis spread to other areas of the economy, and rising energy and commodity
prices increased inflation concerns. In this environment, both growth and
value stocks lost ground across the capitalization spectrum.
Heritage derived relative gains from effective stock selection in the
materials and industrials sectors. An overweight allocation to the materials
sector also boosted gains. Offsetting those positive contributions, poor stock
selection in the energy and consumer discretionary sectors, as well as an
underweight position in energy, weighed on Heritage's performance.
In spite of the poor overall performance of foreign stocks during the
reporting period, the portfolio derived gains from its 18% stake in foreign
holdings.
MATERIALS GAINED
A higher standard of living in emerging-market countries, lower availability
of farmland, and greater global focus on biofuels translated into growing
global demand for agriculture. That increased demand has in turn driven up
commodities prices that benefited select chemicals companies within the
materials sector during the reporting period.
Notably, agricultural chemicals company K+S AG's share price gained 101% for
the reporting period as the company continued to benefit from higher demand in
the fertilizer market. Monsanto, which is a producer of corn seed, benefited
from escalating corn prices. Since neither of these companies were components
of the benchmark, both companies were substantial contributors to relative
outperformance.
Also in the materials sector, Owens-Illinois--Heritage's largest holding at
period end--was a meaningful positive contributor to performance, as the
bottling company was one of the rare companies to sharply exceed earnings
estimates in the reporting
Top Ten Holdings as of April 30, 2008
% of net % of net
assets as of assets as of
4/30/08 10/31/07
Owens-Illinois Inc. 5.0% 2.6%
Flowserve Corp. 3.9% 2.3%
CSL Ltd. ORD 3.6% 2.2%
Monsanto Co. 3.2% 3.0%
Nintendo Co., Ltd. ORD 2.6% 4.0%
Express Scripts, Inc. 2.4% 1.7%
PetroHawk Energy Corp. 2.3% --
Urban Outfitters Inc. 2.1% --
Vestas Wind Systems AS ORD 2.0% 0.6%
Invitrogen Corp. 1.8% 1.5%
*All fund returns referenced in this commentary are for Investor Class shares.
Total returns for periods less than one year are not annualized.
- ------
5
Heritage
period. For the first quarter of 2008 in particular, the company's earnings
more than tripled as it benefited from increased prices, an improved product
mix, and manufacturing efficiencies.
INDUSTRIALS CONTRIBUTED, BUT CERTAIN HOLDINGS LAGGED
Within the industrials sector, the portfolio held an overweight position in
machinery company Flowserve. A maker of pumps, seals, and valves to end users
in the oil and gas, power, chemicals, and water industries, Flowserve was the
largest contributor to portfolio performance for the reporting period as its
share price gained 58%.
Heritage also benefited from an overweight position in the electrical
equipment industry, where we focused on companies involved with alternative
energy. Within this emerging group, we have succeeded in selecting some of the
largest beneficiaries of increasing demand. Notably, an overweight stake in
First Solar aided absolute and relative gains as the manufacturer of solar
modules saw its share price surge 84%.
Elsewhere in the industrials sector, we maintained an overweight position in
the aerospace and defense industry. Holdings within this group have
contributed significantly to portfolio gains in the past, benefiting from a
replacement cycle and expanding orders in global aviation. During the
reporting period, though, this group lost ground amid market volatility and
profit-taking. BE Aerospace, in particular, declined 19% and detracted from
portfolio performance.
CONSUMER DISCRETIONARY DETRACTED
The consumer discretionary group also weighed on Heritage's performance. An
overweight stake in ITT Educational Services hindered performance as the
private education company suffered from the fallout from the credit crunch. As
with the subprime mortgage industry, private education firms experienced a
loss of liquidity as investors shied away from student loans.
OUTLOOK
Heritage's investment process focuses on medium-sized companies with
accelerating revenue and earnings growth rates and share price momentum. We
believe that active investing in such companies will generate outperformance
over time compared with the Russell Midcap Growth Index. Despite the
volatility and the market's tilt away from momentum-style investing during the
course of the reporting period, we will remain focused on our time-tested
process.
Top Five Industries as of April 30, 2008
% of net % of net
assets as of assets as of
4/30/08 10/31/07
Chemicals 6.8% 3.5%
Machinery 6.1% 5.3%
Software 6.0% 5.5%
Biotechnology 5.9% 3.8%
Semiconductors &
Semiconductor Equipment 5.7% 6.3%
Types of Investments in Portfolio
% of net % of net
assets as of assets as of
4/30/08 10/31/07
Domestic Common Stocks 81.1% 86.0%
Foreign Common Stocks(1) 18.1% 13.0%
TOTAL COMMON STOCKS 99.2% 99.0%
Temporary Cash Investments 1.7% 1.0%
Other Assets and Liabilities (0.9)% --(2)
(1) Includes depositary shares, dual listed securities and foreign ordinary
shares.
(2) Category is less than 0.05% of total net assets.
- ------
6
SCHEDULE OF INVESTMENTS
Heritage
APRIL 30, 2008 (UNAUDITED)
Shares Value
Common Stocks -- 99.2%
AEROSPACE & DEFENSE -- 3.3%
274,200 Alliant Techsystems Inc.(1) $30,096,196
1,050,651 BE Aerospace, Inc.(1) 42,404,274
169,352 Precision Castparts Corp. 19,909,021
-------------
92,409,491
-------------
BEVERAGES -- 0.9%
402,480 Central European Distribution Corp.(1) 24,519,082
-------------
BIOTECHNOLOGY -- 5.9%
1,156,600 BioMarin Pharmaceutical Inc.(1) 42,169,636
346,500 Celgene Corp.(1) 21,531,510
2,681,800 CSL Ltd. ORD 100,642,425
-------------
164,343,571
-------------
CAPITAL MARKETS -- 1.9%
415,725 Janus Capital Group Inc. 11,665,244
483,600 Raymond James Financial, Inc. 13,913,172
886,700 Waddell & Reed Financial, Inc. Cl A 30,023,662
-------------
55,602,078
-------------
CHEMICALS -- 6.8%
378,200 Celanese Corp., Series A 16,924,450
127,739 CF Industries Holdings, Inc. 17,078,704
108,300 K+S AG ORD 45,596,326
768,430 Monsanto Co. 87,616,389
186,900 Mosaic Co. (The)(1) 22,897,119
-------------
190,112,988
-------------
COMMERCIAL BANKS -- 0.5%
389,500 BB&T Corporation 13,355,955
-------------
COMMERCIAL SERVICES & SUPPLIES -- 1.4%
383,300 Copart, Inc.(1) 15,665,471
370,500 FTI Consulting, Inc.(1) 23,712,000
-------------
39,377,471
-------------
COMMUNICATIONS EQUIPMENT -- 1.9%
969,200 JDS Uniphase Corp.(1) 13,869,252
333,900 Research In Motion Ltd.(1) 40,612,257
-------------
54,481,509
-------------
COMPUTERS & PERIPHERALS -- 2.1%
250,027 Apple Inc.(1) 43,492,197
880,500 QLogic Corp.(1) 14,052,780
-------------
57,544,977
-------------
Shares Value
CONSTRUCTION & ENGINEERING -- 1.4%
387,380 Foster Wheeler Ltd.(1) $24,672,232
456,200 KBR, Inc. 13,156,808
-------------
37,829,040
-------------
CONTAINERS & PACKAGING -- 5.5%
514,300 Crown Holdings Inc.(1) 13,803,812
2,539,600 Owens-Illinois Inc.(1) 140,058,940
-------------
153,862,752
-------------
DISTRIBUTORS -- 0.8%
988,100 LKQ Corp.(1) 21,501,056
-------------
DIVERSIFIED -- 0.8%
856,600 Financial Select Sector SPDR Fund 22,648,504
-------------
DIVERSIFIED CONSUMER SERVICES -- 1.0%
129,700 Capella Education Co.(1) 8,364,353
245,951 DeVry Inc. 14,019,207
30,700 Strayer Education, Inc. 5,700,683
-------------
28,084,243
-------------
DIVERSIFIED FINANCIAL SERVICES -- 0.5%
372,500 Nasdaq Stock Market, Inc. (The)(1) 13,577,625
-------------
ELECTRICAL EQUIPMENT -- 4.5%
442,881 Energy Conversion Devices Inc.(1) 14,433,492
96,088 First Solar Inc.(1) 28,056,735
1,058,900 JA Solar Holdings Co., Ltd. ADR(1) 25,424,189
515,000 Vestas Wind Systems AS ORD(1) 56,548,342
-------------
124,462,758
-------------
ELECTRONIC EQUIPMENT & INSTRUMENTS -- 0.7%
492,123 Dolby Laboratories Inc. Cl A(1) 19,758,738
-------------
ENERGY EQUIPMENT & SERVICES -- 4.3%
303,758 Cameron International Corp.(1) 14,954,006
400,500 Dresser-Rand Group Inc.(1) 14,646,285
568,800 Hercules Offshore Inc.(1) 14,993,568
200,500 National Oilwell Varco, Inc.(1) 13,724,225
470,300 Patterson-UTI Energy Inc. 13,140,182
455,700 Seadrill Ltd. 13,879,642
413,500 Weatherford International Ltd.(1) 33,357,046
-------------
118,694,954
-------------
FOOD PRODUCTS -- 1.0%
242,600 Bunge Ltd. 27,678,234
-------------
- ------
7
Heritage
Shares Value
HEALTH CARE EQUIPMENT & SUPPLIES -- 1.9%
49,900 Intuitive Surgical Inc.(1) $14,434,074
794,300 Varian Medical Systems, Inc.(1) 37,236,784
-------------
51,670,858
-------------
HEALTH CARE PROVIDERS & SERVICES -- 3.3%
947,000 Express Scripts, Inc.(1) 66,308,940
520,200 Medco Health Solutions Inc.(1) 25,770,708
-------------
92,079,648
-------------
HOTELS, RESTAURANTS & LEISURE -- 2.2%
213,910 Bally Technologies, Inc.(1) 7,206,628
400,410 International Game Technology 13,910,243
141,300 Panera Bread Co. Cl A(1) 7,384,338
906,000 WMS Industries Inc.(1) 32,788,140
-------------
61,289,349
-------------
INDUSTRIAL CONGLOMERATES -- 2.2%
897,190 McDermott International, Inc.(1) 48,071,440
196,700 Walter Industries Inc. 13,643,112
-------------
61,714,552
-------------
INSURANCE -- 0.3%
144,699 Assurant, Inc. 9,405,435
-------------
INTERNET & CATALOG RETAIL -- 1.6%
352,041 priceline.com Inc.(1) 44,934,513
-------------
INTERNET SOFTWARE & SERVICES -- 0.7%
203,100 Equinix Inc.(1) 18,364,302
-------------
IT SERVICES -- 1.4%
138,100 MasterCard Inc. Cl A 38,413,896
-------------
LIFE SCIENCES TOOLS & SERVICES -- 3.7%
275,765 Covance Inc.(1) 23,106,349
536,200 Invitrogen Corp.(1) 50,172,234
627,200 Parexel International Corp.(1) 15,930,880
244,200 Thermo Fisher Scientific Inc.(1) 14,131,854
-------------
103,341,317
-------------
MACHINERY -- 6.1%
681,100 AGCO Corp.(1) 40,954,543
879,649 Flowserve Corp. 109,155,645
247,200 Joy Global Inc. 18,354,600
-------------
168,464,788
-------------
MEDIA -- 1.3%
496,036 Liberty Global, Inc. Series A(1) 17,554,714
521,400 Liberty Global, Inc. Series C(1) 17,310,480
-------------
34,865,194
-------------
METALS & MINING -- 0.7%
299,500 Agnico-Eagle Mines Ltd. 18,703,775
-------------
MULTILINE RETAIL -- 0.3%
293,000 Big Lots, Inc.(1) 7,919,790
-------------
Shares Value
OIL, GAS & CONSUMABLE FUELS -- 5.2%
567,400 Alpha Natural Resources, Inc.(1) $27,604,010
472,800 Arena Resources Inc.(1) 21,228,720
103,900 Patriot Coal Corp.(1) 6,862,595
98,400 Peabody Energy Corp. 6,015,192
2,658,900 PetroHawk Energy Corp.(1) 62,856,396
485,900 Quicksilver Resources Inc.(1) 20,159,991
-------------
144,726,904
-------------
PERSONAL PRODUCTS -- 0.7%
464,000 Avon Products, Inc. 18,105,280
-------------
REAL ESTATE INVESTMENT TRUSTS (REITS) -- 0.5%
333,400 Plum Creek Timber Co. Inc. 13,616,056
-------------
ROAD & RAIL -- 1.9%
372,300 CSX Corp. 23,436,285
498,400 Norfolk Southern Corp. 29,694,672
-------------
53,130,957
-------------
SEMICONDUCTORS & SEMICONDUCTOR EQUIPMENT -- 5.7%
713,500 Intersil Corp. Cl A 19,064,720
544,100 Linear Technology Corp. 19,021,736
1,073,400 Marvell Technology Group Ltd.(1) 13,900,530
498,033 MEMC Electronic Materials Inc.(1) 31,361,138
537,100 Microchip Technology Inc. 19,738,425
1,107,400 Semiconductor HOLDRs Trust 33,853,218
237,593 Varian Semiconductor Equipment Associates, Inc.(1) 8,703,032
500,000 Xilinx, Inc. 12,385,000
-------------
158,027,799
-------------
SOFTWARE -- 6.0%
1,477,574 Activision, Inc.(1) 39,968,377
260,400 Electronic Arts Inc.(1) 13,402,788
378,400 McAfee Inc.(1) 12,581,800
132,300 Nintendo Co., Ltd. ORD 72,641,281
289,600 Ubisoft Entertainment SA ORD(1) 29,216,533
-------------
167,810,779
-------------
SPECIALTY RETAIL -- 5.5%
873,156 GameStop Corp. Cl A(1) 48,058,506
460,800 Guess?, Inc. 17,639,424
1,797,900 Pier 1 Imports, Inc.(1) 14,023,620
411,200 Ross Stores, Inc. 13,771,088
1,724,400 Urban Outfitters Inc.(1) 59,060,700
-------------
152,553,338
-------------
- ------
8
Heritage
Shares Value
TEXTILES, APPAREL & LUXURY GOODS -- 1.8%
172,900 Phillips-Van Heusen Corp. $ 7,298,109
512,300 Polo Ralph Lauren Corp. 31,772,846
240,500 Warnaco Group Inc. (The)(1) 11,096,670
-------------
50,167,625
-------------
WIRELESS TELECOMMUNICATION SERVICES -- 1.0%
354,300 MetroPCS Communications, Inc.(1) 6,958,452
475,800 NII Holdings, Inc.(1) 21,763,092
-------------
28,721,544
-------------
TOTAL COMMON STOCKS
(Cost $2,148,810,928) 2,757,872,725
-------------
Value
Temporary Cash Investments -- 1.7%
Repurchase Agreement, Bank of America Securities, LLC,
(collateralized by various U.S. Treasury obligations, 0.625%,
4/15/13, valued at $48,887,847), in a joint
trading account at 1.92%, dated 4/30/08, due 5/1/08
(Delivery value $47,902,555)
(Cost $47,900,000) $ 47,900,000
--------------
TOTAL INVESTMENT SECURITIES -- 100.9%
(Cost $2,196,710,928) 2,805,772,725
--------------
OTHER ASSETS AND LIABILITIES -- (0.9)% (25,345,918)
--------------
TOTAL NET ASSETS -- 100.0% $2,780,426,807
==============
Forward Foreign Currency Exchange Contracts
Unrealized
Contracts to Sell Settlement Date Value Gain (Loss)
52,965,550 AUD for USD 5/30/08 $ 49,770,689 $(250,548)
136,217,500 DKK for USD 5/30/08 28,509,672 9,191
24,077,068 Euro for USD 5/30/08 37,556,889 73,883
3,830,085,000 JPY for USD 5/30/08 36,895,953 (78,550)
34,974,975 NOK for USD 5/30/08 6,853,378 1,235
------------- -------------
$159,586,581 $(244,789)
============= =============
(Value on Settlement Date $159,341,792)
Notes to Schedule of Investments
ADR = American Depositary Receipt
AUD = Australian Dollar
DKK = Danish Krone
HOLDRs = Holding Company Depositary Receipts
JPY = Japanese Yen
NOK = Norwegian Krona
ORD = Foreign Ordinary Share
SPDR = Standard and Poor's Depositary Receipt
USD = United States Dollar
(1) Non-income producing.
See Notes to Financial Statements.
- ------
9
PERFORMANCE
New Opportunities II
Total Returns as of April 30, 2008
Average Annual Returns
Since Inception
6 months(1) 1 year 5 years Inception Date
INVESTOR CLASS -16.02% -1.11% 17.10% 9.16% 6/1/01
RUSSELL 2000
GROWTH INDEX(2) -14.14% -6.71% 13.32% 3.45% --
Institutional
Class -15.90% -- -- -4.10%(1) 5/18/07
A Class
No sales
charge* -16.11% -1.25% 16.80% 16.01%
With sales
charge* -20.92% -6.97% 15.44% 14.73% 1/31/03
B Class
No sales
charge* -16.43% -2.02% 15.94% 15.15%
With sales
charge* -21.43% -6.02% 15.83% 15.04% 1/31/03
C Class
No sales
charge* -16.46% -2.01% 15.97%(3) 15.22%(3)
With sales
charge* -17.29% -2.01% 15.97%(3) 15.22%(3) 1/31/03
R Class -16.23% -- -- -12.52%(1) 9/28/07
* Sales charges include initial sales charges and contingent deferred sales
charges (CDSCs), as applicable. A Class shares have a 5.75% maximum initial
sales charge for equity funds and may be subject to a maximum CDSC of 1.00%. B
Class shares redeemed within six years of purchase are subject to a CDSC that
declines from 5.00% during the first year after purchase to 0.00% the sixth
year after purchase. C Class shares redeemed within 12 months of purchase are
subject to a maximum CDSC of 1.00%. The SEC requires that mutual funds provide
performance information net of maximum sales charges in all cases where
charges could be applied.
(1) Total returns for periods less than one year are not annualized.
(2) Data provided by Lipper Inc. - A Reuters Company. ©2008 Reuters. All
rights reserved. Any copying, republication or redistribution of Lipper
content, including by caching, framing or similar means, is expressly
prohibited without the prior written consent of Lipper. Lipper shall not be
liable for any errors or delays in the content, or for any actions taken in
reliance thereon.
The data contained herein has been obtained from company reports, financial
reporting services, periodicals and other resources believed to be reliable.
Although carefully verified, data on compilations is not guaranteed by Lipper
and may be incomplete. No offer or solicitations to buy or sell any of the
securities herein is being made by Lipper.
(3) Class returns would have been lower if distribution and service fees had
not been waived from 2/1/03 to 6/30/03.
Data presented reflect past performance. Past performance is no guarantee of
future results. Current performance may be higher or lower than the
performance shown. Investment return and principal value will fluctuate, and
redemption value may be more or less than original cost. To obtain performance
data current to the most recent month end, please call 1-800-345-2021 or visit
americancentury.com. Historically, small company stocks have been more
volatile than the stocks of larger, more established companies. The fund's
investment process may involve high portfolio turnover, high commission costs
and high capital gains distributions. In addition, its investment approach may
involve higher volatility and risk. The fund's performance may be affected by
investments in initial public offerings.
Unless otherwise indicated, performance reflects Investor Class shares;
performance for other share classes will vary due to differences in fee
structure. For information about other share classes available, please consult
the prospectus. Data assumes reinvestment of dividends and capital gains, and
none of the charts reflect the deduction of taxes that a shareholder would pay
on fund distributions or the redemption of fund shares. Returns for the index
are provided for comparison. The fund's total returns include operating
expenses (such as transaction costs and management fees) that reduce returns,
while the total returns of the index do not.
- ------
10
New Opportunities II
Growth of $10,000 Over Life of Class
$10,000 investment made June 1, 2001
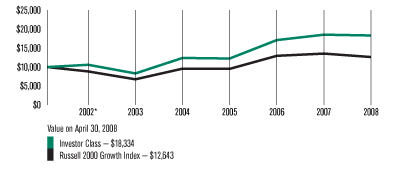
One-Year Returns Over Life of Class
Periods ended April 30
2002* 2003 2004 2005 2006 2007 2008
Investor Class 6.00% -21.51% 49.04% -1.18% 39.69% 8.31% -1.11%
Russell 2000
Growth Index -11.57% -23.50% 41.57% -0.55% 36.13% 4.53% -6.71%
* From 6/1/01, the Investor Class's inception date. Not annualized.
Data presented reflect past performance. Past performance is no guarantee of
future results. Current performance may be higher or lower than the
performance shown. Investment return and principal value will fluctuate, and
redemption value may be more or less than original cost. To obtain performance
data current to the most recent month end, please call 1-800-345-2021 or visit
americancentury.com. Historically, small company stocks have been more
volatile than the stocks of larger, more established companies. The fund's
investment process may involve high portfolio turnover, high commission costs
and high capital gains distributions. In addition, its investment approach may
involve higher volatility and risk. The fund's performance may be affected by
investments in initial public offerings.
Unless otherwise indicated, performance reflects Investor Class shares;
performance for other share classes will vary due to differences in fee
structure. For information about other share classes available, please consult
the prospectus. Data assumes reinvestment of dividends and capital gains, and
none of the charts reflect the deduction of taxes that a shareholder would pay
on fund distributions or the redemption of fund shares. Returns for the index
are provided for comparison. The fund's total returns include operating
expenses (such as transaction costs and management fees) that reduce returns,
while the total returns of the index do not.
- ------
11
PORTFOLIO COMMENTARY
New Opportunities II
Portfolio Managers: Stafford Southwick and Matthew Ferretti
PERFORMANCE SUMMARY
New Opportunities II returned -16.02%* for the six months ended April 30,
2008, trailing the -14.14% return of its benchmark, the Russell 2000 Growth
Index.
The fund's return reflected the underperformance of small-cap stocks in
general, and small-cap growth issues in particular. Furthermore, our
investment approach faced considerable headwinds--investors shifted away from
momentum stocks, market volatility increased sharply, and sector rotation
accelerated as many of the best-performing sectors from 2007 fell out of favor
in early 2008.
Our investment style often lags in this kind of transitional environment, and
the six-month period was no exception. Despite this recent underperformance,
however, the fund's long-term returns remain robust (see pages 10-11 for
historical performance information).
TECHNOLOGY LAGGED
Stock selection in the information technology sector was the main factor
behind the fund's underperformance of its benchmark. Stock choices among
electronic equipment manufacturers and software companies had the biggest
negative impact. The most significant underperformer was Synaptics, which
makes touchpads for laptops, MP3 players, and other mobile devices. Concerns
about weaker consumer spending and lost market share sent the stock sharply
lower in early 2008, and we eliminated it from the portfolio.
Brightpoint, the leading distributor of wireless devices, was another
technology stock hurt by the slowdown in consumer spending, both domestically
and overseas. In addition, one of the company's largest customers, Motorola,
struggled during the period as its market share deteriorated.
INDUSTRIALS DETRACTED
The portfolio's industrial stocks also lagged their counterparts in the
benchmark index. Some of the portfolio's biggest winners in 2007 were dry bulk
carriers--large ships that carry dry goods such as iron ore and coal across
oceans. Strong demand for dry goods led to a shortage of ship capacity,
causing day rates to rise sharply. However, day rates peaked in late 2007 and
then dropped substantially amid a seasonal slowdown and annual contract
negotiations between China and the leading dry goods exporters.
Top Ten Holdings as of April 30, 2008
% of net % of net
assets as of assets as of
4/30/08 10/31/07
Darling International Inc. 2.0% 1.3%
priceline.com Inc. 1.9% 1.9%
Tupperware Brands Corp. 1.7% 1.1%
CyberSource Corp. 1.7% --
Chimera Investment Corp 1.6% --
ManTech International Corp. Cl A 1.6% 0.9%
Syniverse Holdings, Inc. 1.5% 1.1%
Sybase, Inc. 1.5% --
PerkinElmer, Inc. 1.5% 1.0%
Perrigo Co. 1.5% --
* All fund returns referenced in this commentary are for Investor Class
shares. Total returns for periods less than one year are not annualized.
- ------
12
New Opportunities II
Fund holdings DryShips, Diana Shipping, and Eagle Bulk Shipping slumped during
the period, and although we reduced our positions in each of these stocks, we
continue to own them as day rates have begun to recover.
CONSUMER AND ENERGY STOCKS ADDED VALUE
On the positive side, the portfolio's consumer and energy stocks contributed
favorably to performance relative to the Russell 2000 Growth Index. Among
consumer stocks, the top contributor was Darling International, which renders
animal by-products and recycles used cooking oil into useable oils and
proteins for the agricultural industry. Darling's profit margins expanded as
commodity prices surged.
Household products maker Tupperware Brands and online travel agent
priceline.com were also major contributors. Tupperware reported strong profit
growth thanks to its substantial international business and expansion into
emerging markets. Priceline enjoyed strong growth in its European hotel
reservation unit and gained market share domestically by eliminating booking
fees.
Six of the top ten relative performance contributors came from the energy
sector. The top contributors were companies with an emphasis on natural gas,
whose price surged during the period. Winners included Cabot Oil & Gas, Forest
Oil, and Encore Acquisition.
IPOS CONTRIBUTED FAVORABLY
We participated in 16 initial public offerings (IPOs) during the period, and
overall they added value to portfolio performance. The best performers
included energy exploration and production company Approach Resources and
Chinese advertising services provider VisionChina Media.
OUTLOOK
After fearing the worst over the last six months, the stock market has started
to price in better credit and economic conditions. Consequently, we have
recently pursued investment opportunities in the technology, financials, and
consumer discretionary sectors. As always, we continue to seek out companies
with improving business fundamentals, accelerating earnings and revenue
growth, and price momentum.
Top Five Industries as of April 30, 2008
% of net % of net
assets as of assets as of
4/30/08 10/31/07
Oil, Gas & Consumable Fuels 6.9% 5.3%
Commercial Banks 5.6% 0.9%
Chemicals 5.2% 6.3%
Internet Software & Services 4.7% 3.2%
IT Services 4.3% 2.2%
Types of Investments in Portfolio
% of net % of net
assets as of assets as of
4/30/08 10/31/07
Domestic Common Stocks 91.8% 88.0%
Foreign Common Stocks(1) 7.1% 7.7%
TOTAL COMMON STOCKS 98.9% 95.7%
Temporary Cash Investments 0.8% 4.9%
Other Assets and Liabilities 0.3% (0.6)%
(1) Includes depositary shares, dual listed securities and foreign ordinary
shares
- ------
13
SCHEDULE OF INVESTMENTS
New Opportunities II
APRIL 30, 2008 (UNAUDITED)
Shares Value
Common Stocks -- 98.9%
AEROSPACE & DEFENSE -- 3.7%
40,462 Alliant Techsystems Inc.(1) $4,441,109
97,870 Curtiss-Wright Corp. 4,647,846
126,540 Esterline Technologies Corp.(1) 7,043,217
193,135 Orbital Sciences Corp.(1) 5,197,263
------------
21,329,435
------------
AUTO COMPONENTS -- 0.7%
270,435 Exide Technologies(1) 3,945,647
------------
BEVERAGES -- 1.4%
121,458 Central European Distribution Corp.(1) 7,399,221
------------
BIOTECHNOLOGY -- 3.5%
35,596 Alexion Pharmaceuticals Inc.(1) 2,505,246
77,919 BioMarin Pharmaceutical Inc.(1) 2,840,927
249,114 Cubist Pharmaceuticals Inc.(1) 4,822,847
157,114 Emergent Biosolutions Inc.(1) 1,478,443
109,287 Martek Biosciences Corp.(1) 3,853,460
12,681 Myriad Genetics Inc.(1) 526,769
19,444 Onyx Pharmaceuticals, Inc.(1) 683,651
55,151 OSI Pharmaceuticals Inc.(1) 1,910,982
18,176 United Therapeutics Corp.(1) 1,535,872
------------
20,158,197
------------
CAPITAL MARKETS -- 1.9%
108,709 Investment Technology Group Inc.(1) 5,246,296
158,963 Waddell & Reed Financial, Inc. Cl A 5,382,488
------------
10,628,784
------------
CHEMICALS -- 5.2%
112,231 Airgas Inc. 5,401,678
124,509 Calgon Carbon Corp.(1) 1,774,253
153,455 Koppers Holdings Inc. 7,433,359
48,385 OM Group, Inc.(1) 2,649,563
108,398 SGL Carbon AG ORD(1) 7,416,382
127,167 Terra Industries Inc.(1) 4,814,543
------------
29,489,778
------------
COMMERCIAL BANKS -- 5.6%
305,180 BancorpSouth Inc. 7,333,474
62,346 First Financial Bankshares Inc. 2,804,947
249,692 FirstMerit Corp. 5,123,679
352,181 Fulton Financial Corp. 4,391,697
98,083 Hancock Holding Co. 4,047,885
Shares Value
82,920 Independent Bank Corp. $2,423,752
158,691 Oriental Financial Group 2,983,391
182,448 Sterling Bancorp 2,993,972
------------
32,102,797
------------
COMMERCIAL SERVICES & SUPPLIES -- 2.8%
58,754 Copart, Inc.(1) 2,401,276
96,648 FTI Consulting, Inc.(1) 6,185,472
84,255 IHS Inc. Cl A(1) 5,565,043
125,422 Knoll Inc. 1,632,994
------------
15,784,785
------------
CONSUMER FINANCE -- 0.8%
381,740 EZCORP, Inc. Cl A(1) 4,634,324
------------
CONTAINERS & PACKAGING -- 0.7%
63,013 Greif, Inc. Cl A 4,070,640
------------
DISTRIBUTORS -- 1.4%
112,352 DXP Enterprises Inc.(1) 4,636,767
141,641 LKQ Corp.(1) 3,082,108
------------
7,718,875
------------
DIVERSIFIED CONSUMER SERVICES -- 1.1%
113,989 DeVry Inc. 6,497,373
------------
ELECTRICAL EQUIPMENT -- 2.8%
111,168 American Superconductor Corp.(1) 2,810,327
249,905 EnerSys(1) 5,847,777
197,188 GrafTech International Ltd.(1) 3,874,744
83,911 Powell Industries, Inc.(1) 3,530,136
------------
16,062,984
------------
ELECTRONIC EQUIPMENT & INSTRUMENTS -- 2.9%
293,456 Brightpoint Inc.(1) 2,688,057
254,919 Cognex Corp. 6,423,958
71,524 FARO Technologies, Inc.(1) 2,520,506
34,801 Itron Inc.(1) 3,239,277
108,203 Orbotech Ltd.(1) 1,898,963
------------
16,770,761
------------
ENERGY EQUIPMENT & SERVICES -- 3.3%
53,246 Dril-Quip Inc.(1) 3,043,541
90,612 Exterran Holdings, Inc.(1) 6,051,976
98,548 Natural Gas Services Group Inc.(1) 2,453,845
671,943 Parker Drilling Co.(1) 5,388,983
25,849 W-H Energy Services Inc.(1) 1,997,869
------------
18,936,214
------------
FOOD & STAPLES RETAILING -- 1.0%
119,033 Andersons Inc. (The) 5,410,050
------------
- ------
14
New Opportunities II
Shares Value
FOOD PRODUCTS -- 2.5%
195,610 Cosan Ltd. Cl A(1) $2,593,789
752,585 Darling International Inc.(1) 11,491,973
------------
14,085,762
------------
GAS UTILITIES -- 0.5%
58,264 Northwest Natural Gas Co. 2,614,306
------------
HEALTH CARE EQUIPMENT & SUPPLIES -- 2.9%
58,451 Kinetic Concepts Inc.(1) 2,318,167
200,565 Merit Medical Systems Inc.(1) 2,950,311
112,454 NuVasive, Inc.(1) 4,290,120
212,412 Zoll Medical Corp.(1) 7,090,312
------------
16,648,910
------------
HEALTH CARE PROVIDERS & SERVICES -- 2.1%
92,482 Amsurg Corp.(1) 2,361,990
119,190 CardioNet, Inc.(1) 2,753,289
130,428 IPC The Hospitalist Co., Inc.(1) 3,061,145
136,310 Providence Service Corp. (The)(1) 3,835,764
------------
12,012,188
------------
HOTELS, RESTAURANTS & LEISURE -- 1.4%
283,883 Burger King Holdings, Inc. 7,920,336
------------
HOUSEHOLD DURABLES -- 1.7%
245,113 Tupperware Brands Corp. 9,657,452
------------
INDUSTRIAL CONGLOMERATES -- 0.4%
33,544 Walter Industries Inc. 2,326,612
------------
INSURANCE -- 0.6%
523,700 Amil Participacoes SA ORD 3,182,533
------------
INTERNET & CATALOG RETAIL -- 1.9%
86,569 priceline.com Inc.(1) 11,049,667
------------
INTERNET SOFTWARE & SERVICES -- 4.7%
1,136,136 Art Technology Group, Inc.(1) 4,067,367
575,721 AsiaInfo Holdings, Inc.(1) 7,006,524
18,665 Equinix Inc.(1) 1,687,689
226,856 Switch & Data Facilities Co. Inc.(1) 3,434,600
120,958 Vocus Inc.(1) 3,361,423
356,828 Websense Inc.(1) 6,940,305
------------
26,497,908
------------
IT SERVICES -- 4.3%
116,125 CACI International Inc.(1) 5,820,185
527,478 CyberSource Corp.(1) 9,573,726
190,661 ManTech International Corp. Cl A(1) 9,107,876
------------
24,501,787
------------
Shares Value
LIFE SCIENCES TOOLS & SERVICES -- 3.7%
28,525 Illumina, Inc.(1) $2,221,812
128,735 Kendle International Inc.(1) 5,495,697
187,637 Parexel International Corp.(1) 4,765,980
319,842 PerkinElmer, Inc. 8,495,004
------------
20,978,493
------------
MACHINERY -- 3.0%
39,091 Bucyrus International, Inc. 4,922,730
34,855 Key Technology, Inc.(1) 1,074,231
34,065 Middleby Corp. (The)(1) 2,137,579
42,672 Valmont Industries, Inc. 4,201,485
114,082 Westinghouse Air Brake Technologies Corp. 4,891,836
------------
17,227,861
------------
MARINE -- 2.2%
151,742 Diana Shipping Inc. 4,606,887
107,333 Eagle Bulk Shipping Inc. 3,158,810
88,247 Kirby Corporation(1) 4,839,466
------------
12,605,163
------------
MEDIA -- 2.1%
337,254 Valassis Communications Inc.(1) 4,789,006
204,090 VisionChina Media Inc. ADR(1) 3,010,328
249,449 World Wrestling Entertainment, Inc. Cl A 4,402,775
------------
12,202,109
------------
METALS & MINING -- 0.6%
56,141 Compass Minerals International Inc. 3,536,883
------------
OIL, GAS & CONSUMABLE FUELS -- 6.9%
37,707 Alpha Natural Resources, Inc.(1) 1,834,446
264,338 Approach Resources Inc.(1) 5,009,205
90,821 Cabot Oil & Gas Corp. 5,174,072
83,775 Concho Resources Inc.(1) 2,309,677
153,256 Encore Acquisition Co.(1) 6,993,071
130,046 Forest Oil Corp.(1) 7,663,610
45,629 Foundation Coal Holdings, Inc. 2,736,827
63,635 Quicksilver Resources Inc.(1) 2,640,216
370,720 TXCO Resources, Inc.(1) 4,737,802
------------
39,098,926
------------
PERSONAL PRODUCTS -- 1.7%
167,190 American Oriental Bioengineering Inc.(1) 1,608,368
81,058 Herbalife Ltd. 3,548,719
153,327 Inter Parfums, Inc. 4,440,350
------------
9,597,437
------------
- ------
15
New Opportunities II
Shares Value
PHARMACEUTICALS -- 1.5%
203,203 Perrigo Co. $8,329,291
------------
REAL ESTATE INVESTMENT TRUSTS (REITS) -- 4.3%
108,714 American Campus Communities Inc. 3,319,038
332,481 Capstead Mortgage Corp. 4,289,005
671,943 Chimera Investment Corp. 9,319,849
96,317 Hatteras Financial Corp.(1) 2,434,894
406,583 U-Store-It Trust 4,907,457
------------
24,270,243
------------
ROAD & RAIL -- 0.3%
56,146 J.B. Hunt Transport Services, Inc. 1,907,280
------------
SEMICONDUCTORS & SEMICONDUCTOR EQUIPMENT -- 2.4%
172,570 Amkor Technology Inc.(1) 1,648,044
343,064 Anadigics, Inc.(1) 3,828,594
326,570 Microsemi Corp.(1) 8,000,965
------------
13,477,603
------------
SOFTWARE -- 3.3%
238,045 Lawson Software Inc.(1) 1,901,980
165,978 Magma Design Automation, Inc.(1) 1,548,575
111,800 MICROS Systems, Inc.(1) 3,985,670
265,587 NetScout Systems, Inc.(1) 2,655,870
293,951 Sybase, Inc.(1) 8,648,038
------------
18,740,133
------------
SPECIALTY RETAIL -- 2.0%
148,533 Aeropostale Inc.(1) 4,721,864
201,423 Dress Barn Inc.(1) 2,711,154
118,411 hhgregg, Inc.(1) 1,216,081
371,919 Pier 1 Imports, Inc.(1) 2,900,968
------------
11,550,067
------------
Shares Value
TEXTILES, APPAREL & LUXURY GOODS -- 1.1%
20,539 Deckers Outdoor Corp.(1) $2,835,820
220,069 Maidenform Brands, Inc.(1) 3,279,028
------------
6,114,848
------------
WATER UTILITIES -- 0.5%
231,989 Cascal N.V.(1) 2,811,707
------------
WIRELESS TELECOMMUNICATION SERVICES -- 1.5%
555,900 Syniverse Holdings, Inc.(1) 8,733,189
------------
TOTAL COMMON STOCKS
(Cost $498,830,536) 562,618,559
------------
Temporary Cash Investments -- 0.8%
Repurchase Agreement, Bank of America Securities, LLC,
(collateralized by various U.S. Treasury obligations, 0.625%,
4/15/13, valued at $4,592,804), in a joint trading account at
1.92%, dated 4/30/08, due 5/1/08 (Delivery value $4,500,240)
(Cost $4,500,000) 4,500,000
------------
TOTAL INVESTMENT SECURITIES -- 99.7%
(Cost $503,330,536) 567,118,559
------------
OTHER ASSETS AND LIABILITIES -- 0.3% 1,715,173
------------
TOTAL NET ASSETS -- 100.0% $568,833,732
============
Notes to Schedule of Investments
ADR = American Depositary Receipt
ORD = Foreign Ordinary Share
(1) Non-income producing.
See Notes to Financial Statements.
- ------
16
SHAREHOLDER FEE EXAMPLES (UNAUDITED)
Fund shareholders may incur two types of costs: (1) transaction costs,
including sales charges (loads) on purchase payments and redemption/exchange
fees; and (2) ongoing costs, including management fees; distribution and
service (12b-1) fees; and other fund expenses. This example is intended to
help you understand your ongoing costs (in dollars) of investing in your fund
and to compare these costs with the ongoing cost of investing in other mutual
funds.
The example is based on an investment of $1,000 made at the beginning of the
period and held for the entire period from November 1, 2007 to April 30, 2008.
ACTUAL EXPENSES
The table provides information about actual account values and actual expenses
for each class. You may use the information, together with the amount you
invested, to estimate the expenses that you paid over the period. First,
identify the share class you own. Then simply divide your account value by
$1,000 (for example, an $8,600 account value divided by $1,000 = 8.6), then
multiply the result by the number under the heading "Expenses Paid During
Period" to estimate the expenses you paid on your account during this period.
If you hold Investor Class shares of any American Century fund, or
Institutional Class shares of the American Century Diversified Bond Fund, in
an American Century account (i.e., not a financial intermediary or retirement
plan account), American Century may charge you a $12.50 semiannual account
maintenance fee if the value of those shares is less than $10,000. We will
redeem shares automatically in one of your accounts to pay the $12.50 fee. In
determining your total eligible investment amount, we will include your
investments in all PERSONAL ACCOUNTS (including American Century Brokerage
accounts) registered under your Social Security number. PERSONAL ACCOUNTS
include individual accounts, joint accounts, UGMA/UTMA accounts, personal
trusts, Coverdell Education Savings Accounts and IRAs (including traditional,
Roth, Rollover, SEP-, SARSEP- and SIMPLE-IRAs), and certain other retirement
accounts. If you have only business, business retirement, employer-sponsored
or American Century Brokerage accounts, you are currently not subject to this
fee. We will not charge the fee as long as you choose to manage your accounts
exclusively online. If you are subject to the Account Maintenance Fee, your
account value could be reduced by the fee amount.
HYPOTHETICAL EXAMPLE FOR COMPARISON PURPOSES
The table also provides information about hypothetical account values and
hypothetical expenses based on the actual expense ratio of each class of your
fund and an assumed rate of return of 5% per year before expenses, which is
not the actual return of a fund's share class. The hypothetical account values
and expenses may not be used to estimate the actual ending account balance or
expenses you paid for the period. You may use this information to compare the
ongoing costs of investing in your fund and other funds. To do so, compare
this 5% hypothetical example with the 5% hypothetical examples that appear in
the shareholder reports of the other funds.
Please note that the expenses shown in the table are meant to highlight your
ongoing costs only and do not reflect any transactional costs, such as sales
charges (loads) or redemption/exchange fees. Therefore, the table is useful in
comparing ongoing costs only, and will not help you determine the relative
total costs of owning different funds. In addition, if these transactional
costs were included, your costs would have been higher.
- ------
17
Beginning Expenses Paid
Account Ending During Period* Annualized
Value Account Value 11/1/07 - Expense
11/1/07 4/30/08 4/30/08 Ratio*
Heritage
ACTUAL
Investor Class $1,000 $920.40 $4.77 1.00%
Institutional Class $1,000 $921.30 $3.82 0.80%
A Class $1,000 $919.20 $5.96 1.25%
B Class $1,000 $915.40 $9.52 2.00%
C Class $1,000 $915.60 $9.53 2.00%
R Class $1,000 $917.70 $7.15 1.50%
HYPOTHETICAL
Investor Class $1,000 $1,019.89 $5.02 1.00%
Institutional Class $1,000 $1,020.89 $4.02 0.80%
A Class $1,000 $1,018.65 $6.27 1.25%
B Class $1,000 $1,014.92 $10.02 2.00%
C Class $1,000 $1,014.92 $10.02 2.00%
R Class $1,000 $1,017.40 $7.52 1.50%
New Opportunities II
ACTUAL
Investor Class $1,000 $839.80 $6.27 1.37%
Institutional Class $1,000 $841.00 $5.36 1.17%
A Class $1,000 $838.90 $7.41 1.62%
B Class $1,000 $835.70 $10.82 2.37%
C Class $1,000 $835.40 $10.82 2.37%
R Class $1,000 $837.70 $8.54 1.87%
HYPOTHETICAL
Investor Class $1,000 $1,018.05 $6.87 1.37%
Institutional Class $1,000 $1,019.05 $5.87 1.17%
A Class $1,000 $1,016.81 $8.12 1.62%
B Class $1,000 $1,013.08 $11.86 2.37%
C Class $1,000 $1,013.08 $11.86 2.37%
R Class $1,000 $1,015.56 $9.37 1.87%
* Expenses are equal to the class's annualized expense ratio listed in the
table above, multiplied by the average account value over the period,
multiplied by 182, the number of days in the most recent fiscal half-year,
divided by 366, to reflect the one-half year period.
- ------
18
STATEMENT OF ASSETS AND LIABILITIES
APRIL 30, 2008 (UNAUDITED)
New
Heritage Opportunities II
ASSETS
Investment securities, at value
(cost of $2,196,710,928 and $503,330,536,
respectively) $2,805,772,725 $567,118,559
Cash 4,978,016 1,232,763
Receivable for investments sold 61,191,217 16,643,619
Receivable for forward foreign
currency exchange contracts 84,309 --
Receivable for capital shares sold 301,949 134,271
Dividends and interest receivable 1,756,813 83,824
-------------- ----------------
2,874,085,029 585,213,036
-------------- ----------------
LIABILITIES
Payable for investments purchased 90,913,288 15,579,682
Payable for forward foreign currency exchange
contracts 329,098 --
Payable for capital shares redeemed 118,668 149,257
Accrued management fees 2,190,694 597,879
Distribution fees payable 19,056 12,401
Service fees (and distribution fees -
A Class and R Class) payable 87,418 40,085
-------------- ----------------
93,658,222 16,379,304
-------------- ----------------
NET ASSETS $2,780,426,807 $568,833,732
============== ================
See Notes to Financial Statements.
- ------
19
APRIL 30, 2008 (UNAUDITED)
New
Heritage Opportunities II
NET ASSETS CONSIST OF:
Capital (par value and paid-in surplus) $2,165,299,262 $740,239,790
Accumulated net investment loss (7,855,594) (1,749,559)
Accumulated undistributed net realized gain
(loss) on investment and foreign currency
transactions 14,234,494 (233,444,512)
Net unrealized appreciation on
investments and translation of assets
and liabilities in foreign currencies 608,748,645 63,788,013
-------------- ---------------
$2,780,426,807 $568,833,732
============== ===============
INVESTOR CLASS, $0.01 PAR VALUE
Net assets $2,146,568,507 $277,718,113
Shares outstanding 107,224,590 35,427,505
Net asset value per share $20.02 $7.84
INSTITUTIONAL CLASS, $0.01 PAR VALUE
Net assets $184,071,668 $91,827,265
Shares outstanding 9,027,968 11,688,583
Net asset value per share $20.39 $7.86
A CLASS, $0.01 PAR VALUE
Net assets $416,910,512 $178,491,709
Shares outstanding 21,303,216 22,918,197
Net asset value per share $19.57 $7.79
Maximum offering price
(net asset value divided by 0.9425) $20.76 $8.27
B CLASS, $0.01 PAR VALUE
Net assets $930,301 $3,844,635
Shares outstanding 46,735 502,065
Net asset value per share $19.91 $7.66
C CLASS, $0.01 PAR VALUE
Net assets $31,754,068 $16,922,319
Shares outstanding 1,710,498 2,200,258
Net asset value per share $18.56 $7.69
R CLASS, $0.01 PAR VALUE
Net assets $191,751 $29,691
Shares outstanding 9,606 3,798
Net asset value per share $19.96 $7.82
See Notes to Financial Statements.
- ------
20
STATEMENT OF OPERATIONS
FOR THE SIX MONTHS ENDED APRIL 30, 2008 (UNAUDITED)
New
Heritage Opportunities II
INVESTMENT INCOME (LOSS)
INCOME:
Dividends (net of foreign taxes withheld of
$116,715 and $-, respectively) $5,578,119 $1,861,093
Interest 619,866 234,741
-------------- ----------------
6,197,985 2,095,834
-------------- ----------------
EXPENSES:
Management fees 13,617,803 3,510,577
Distribution fees:
B Class 1,686 14,961
C Class 100,371 59,764
Service fees:
B Class 562 4,987
C Class 33,457 19,921
Distribution and service fees:
A Class 433,574 225,564
R Class 358 67
Directors' fees and expenses 35,280 8,403
Other expenses 5,165 1,149
-------------- ----------------
14,228,256 3,845,393
-------------- ----------------
NET INVESTMENT INCOME (LOSS) (8,030,271) (1,749,559)
-------------- ----------------
REALIZED AND UNREALIZED GAIN (LOSS)
NET REALIZED GAIN (LOSS) ON:
Investment transactions 36,734,919 (53,702,297)
Foreign currency transactions (11,825,773) (10,996)
-------------- ----------------
24,909,146 (53,713,293)
-------------- ----------------
CHANGE IN NET UNREALIZED APPRECIATION
(DEPRECIATION) ON:
Investments (274,941,723) (36,319,477)
Translation of assets and liabilities in
foreign currencies 211,939 2,294
-------------- ----------------
(274,729,784) (36,317,183)
-------------- ----------------
NET REALIZED AND UNREALIZED GAIN (LOSS) (249,820,638) (90,030,476)
-------------- ----------------
NET INCREASE (DECREASE) IN NET ASSETS
RESULTING FROM OPERATIONS $(257,850,909) $(91,780,035)
============== ================
See Notes to Financial Statements.
- ------
21
STATEMENT OF CHANGES IN NET ASSETS
SIX MONTHS ENDED APRIL 30, 2008(UNAUDITED) AND YEAR ENDED OCTOBER 31, 2007
Heritage New Opportunities II
Increase (Decrease) in
Net Assets 2008 2007 2008 2007
OPERATIONS
Net investment income
(loss) $ (8,030,271) $ (9,933,053) $ (1,749,559) $ (2,884,400)
Net realized gain (loss) 24,909,146 146,268,289 (53,713,293) 27,531,246
Change in net unrealized
appreciation
(depreciation) (274,729,784) 661,025,727 (36,317,183) 75,883,152
-------------- -------------- ------------ ------------
Net increase
(decrease) in net
assets resulting
from operations (257,850,909) 797,360,963 (91,780,035) 100,529,998
-------------- -------------- ------------ ------------
DISTRIBUTIONS TO SHAREHOLDERS
From net
realized gains:
Investor
Class (116,021,745) (69,993,372) (2,300,951) (4,743,191)
Institutional
Class (7,340,538) (3,848,774) (540,870) --
A Class (16,474,408) (4,359,065) (1,726,801) (6,550,114)
B Class (12,405) -- (39,168) (271,092)
C Class (1,359,296) (167,371) (150,324) (370,839)
R Class (1,228) -- (229) --
-------------- -------------- ------------ ------------
Decrease in net assets
from distributions (141,209,620) (78,368,582) (4,758,343) (11,935,236)
-------------- -------------- ------------ ------------
CAPITAL SHARE TRANSACTIONS
Net increase (decrease)
in net assets from
capital share
transactions 231,674,882 1,074,154,725 120,303,303 323,948,017
-------------- -------------- ------------ ------------
NET INCREASE (DECREASE)
IN NET ASSETS (167,385,647) 1,793,147,106 23,764,925 412,542,779
NET ASSETS
Beginning of period 2,947,812,454 1,154,665,348 545,068,807 132,526,028
-------------- -------------- ------------ ------------
End of period $2,780,426,807 $2,947,812,454 $568,833,732 $545,068,807
============== ============== ============ ============
Accumulated
undistributed net
investment income (loss) $(7,855,594) $174,677 $(1,749,559) --
============== ============== ============ ============
See Notes to Financial Statements.
- ------
22
NOTES TO FINANCIAL STATEMENTS
APRIL 30, 2008 (UNAUDITED)
1. ORGANIZATION AND SUMMARY OF SIGNIFICANT ACCOUNTING POLICIES
ORGANIZATION -- American Century Mutual Funds, Inc. (the corporation) is
registered under the Investment Company Act of 1940 (the 1940 Act) as an
open-end management investment company. Heritage Fund (Heritage) and New
Opportunities II Fund (New Opportunities II) (collectively, the funds) are two
funds in a series issued by the corporation. The funds are diversified under
the 1940 Act. The funds' investment objective is to seek long-term capital
growth. Heritage pursues its objective by investing in companies that are
medium-sized and smaller at the time of purchase that management believes will
increase in value over time. New Opportunities II pursues its objective by
investing in companies that are smaller-sized at the time of purchase that
management believes will increase in value over time. The following is a
summary of the funds' significant accounting policies.
MULTIPLE CLASS -- The funds are authorized to issue the Investor Class, the
Institutional Class, the A Class, the B Class, the C Class and the R Class.
The A Class may incur an initial sales charge. The A Class, B Class and C
Class may be subject to a contingent deferred sales charge. The share classes
differ principally in their respective sales charges and distribution and
shareholder servicing expenses and arrangements. All shares of each fund
represent an equal pro rata interest in the net assets of the class to which
such shares belong, and have identical voting, dividend, liquidation and other
rights and the same terms and conditions, except for class specific expenses
and exclusive rights to vote on matters affecting only individual classes.
Income, non-class specific expenses, and realized and unrealized capital gains
and losses of the funds are allocated to each class of shares based on their
relative net assets. Sale of Heritage's B Class and R Class commenced on
September 28, 2007. Sale of New Opportunities II's Institutional Class and R
Class commenced on May 18, 2007 and September 28, 2007, respectively.
SECURITY VALUATIONS -- Securities traded primarily on a principal securities
exchange are valued at the last reported sales price, or at the mean of the
latest bid and asked prices where no last sales price is available. Depending
on local convention or regulation, securities traded over-the-counter are
valued at the mean of the latest bid and asked prices, the last sales price,
or the official close price. Debt securities not traded on a principal
securities exchange are valued through a commercial pricing service or at the
mean of the most recent bid and asked prices. Securities traded on foreign
securities exchanges and over-the-counter markets are normally completed
before the close of business on days that the New York Stock Exchange (the
Exchange) is open and may also take place on days when the Exchange is not
open. If an event occurs after the value of a security was established but
before the net asset value per share was determined that was likely to
materially change the net asset value, that security would be valued as
determined in accordance with procedures adopted by the Board of Directors. If
the funds determine that the market price of a portfolio security is not
readily available, or that the valuation methods mentioned above do not
reflect the security's fair value, such security is valued as determined by
the Board of Directors or its designee, in accordance with procedures adopted
by the Board of Directors, if such determination would materially impact a
fund's net asset value. Certain other circumstances may cause the funds to use
alternative procedures to value a security such as: a security has been
declared in default; trading in a security has been halted during the trading
day; or there is a foreign market holiday and no trading will commence.
SECURITY TRANSACTIONS -- For financial reporting purposes, security
transactions are accounted for as of the trade date. Net realized gains and
losses are determined on the identified cost basis, which is also used for
federal income tax purposes. Certain countries impose taxes on realized gains
on the sale of securities registered in their country. The funds record the
foreign tax expense, if any, on an accrual basis. The realized and unrealized
tax provision reduces the net realized gain (loss) on investment transactions
and net unrealized appreciation (depreciation) on investments, respectively.
INVESTMENT INCOME -- Dividend income less foreign taxes withheld, if any, is
recorded as of the ex-dividend date. Distributions received on securities that
represent a return of capital or capital gain are recorded as a reduction of
cost of investments and/or as a realized gain. The funds estimate the
components of distributions received that may be considered nontaxable
distributions or capital gain distributions for income tax purposes. Interest
income is recorded on the accrual basis and includes accretion of discounts
and amortization of premiums.
- ------
23
FOREIGN CURRENCY TRANSACTIONS -- All assets and liabilities initially
expressed in foreign currencies are translated into U.S. dollars at prevailing
exchange rates at period end. Purchases and sales of investment securities,
dividend and interest income, and certain expenses are translated at the rates
of exchange prevailing on the respective dates of such transactions. For
assets and liabilities, other than investments in securities, net realized and
unrealized gains and losses from foreign currency translations arise from
changes in currency exchange rates.
Net realized and unrealized foreign currency exchange gains or losses
occurring during the holding period of investment securities are a component
of realized gain (loss) on investment transactions and unrealized appreciation
(depreciation) on investments, respectively. Certain countries may impose
taxes on the contract amount of purchases and sales of foreign currency
contracts in their currency. The funds record the foreign tax expense, if any,
as a reduction to the net realized gain (loss) on foreign currency
transactions.
FORWARD FOREIGN CURRENCY EXCHANGE CONTRACTS -- The funds may enter into
forward foreign currency exchange contracts to facilitate transactions of
securities denominated in a foreign currency or to hedge the funds' exposure
to foreign currency exchange rate fluctuations. The net U.S. dollar value of
foreign currency underlying all contractual commitments held by the funds and
the resulting unrealized appreciation or depreciation are determined daily
using prevailing exchange rates. The funds bear the risk of an unfavorable
change in the foreign currency exchange rate underlying the forward contract.
Additionally, losses may arise if the counterparties do not perform under the
contract terms.
REPURCHASE AGREEMENTS -- The funds may enter into repurchase agreements with
institutions that American Century Investment Management, Inc. (ACIM) (the
investment advisor) has determined are creditworthy pursuant to criteria
adopted by the Board of Directors. Each repurchase agreement is recorded at
cost. Each fund requires that the collateral, represented by securities,
received in a repurchase transaction be transferred to the custodian in a
manner sufficient to enable each fund to obtain those securities in the event
of a default under the repurchase agreement. ACIM monitors, on a daily basis,
the securities transferred to ensure the value, including accrued interest, of
the securities under each repurchase agreement is equal to or greater than
amounts owed to each fund under each repurchase agreement.
JOINT TRADING ACCOUNT -- Pursuant to an Exemptive Order issued by the
Securities and Exchange Commission, each fund, along with other registered
investment companies having management agreements with ACIM or American
Century Global Investment Management, Inc. (ACGIM), may transfer uninvested
cash balances into a joint trading account. These balances are invested in one
or more repurchase agreements that are collateralized by U.S. Treasury or
Agency obligations.
INCOME TAX STATUS -- It is each fund's policy to distribute substantially all
net investment income and net realized gains to shareholders and to otherwise
qualify as a regulated investment company under provisions of the Internal
Revenue Code. The funds are no longer subject to examination by tax
authorities for years prior to 2004. At this time, management has not
identified any uncertain tax positions for which it is reasonably possible
that the total amounts of unrecognized tax benefits will significantly change
in the next twelve months. Accordingly, no provision has been made for federal
or state income taxes. Interest and penalties associated with any federal or
state income tax obligations, if any, are recorded as interest expense.
DISTRIBUTIONS TO SHAREHOLDERS -- Distributions to shareholders are recorded on
the ex-dividend date. Distributions from net investment income and net
realized gains, if any, are generally declared and paid annually.
REDEMPTION -- New Opportunities II may impose a 2.00% redemption fee on shares
held less than 180 days. The fee may not be applicable to all classes. The
redemption fee is recorded as a reduction in the cost of shares redeemed. The
redemption fee is retained by the fund and helps cover transaction costs that
long-term investors may bear when a fund sells securities to meet investor
redemptions.
INDEMNIFICATIONS -- Under the corporation's organizational documents, its
officers and directors are indemnified against certain liabilities arising out
of the performance of their duties to the funds. In addition, in the normal
course of business, the funds enter into contracts that provide general
indemnifications. The funds' maximum exposure under these arrangements is
unknown as this would involve future claims that may be made against the
funds. The risk of material loss from such claims is considered by management
to be remote.
- ------
24
USE OF ESTIMATES -- The financial statements are prepared in conformity with
accounting principles generally accepted in the United States of America,
which may require management to make certain estimates and assumptions at the
date of the financial statements. Actual results could differ from these
estimates.
2. FEES AND TRANSACTIONS WITH RELATED PARTIES
MANAGEMENT FEES -- The corporation has entered into a Management Agreement
with ACIM, under which ACIM provides the funds with investment advisory and
management services in exchange for a single, unified management fee (the fee)
per class. The Agreement provides that all expenses of the funds, except
brokerage commissions, taxes, interest, fees and expenses of those directors
who are not considered "interested persons" as defined in the 1940 Act
(including counsel fees) and extraordinary expenses, will be paid by ACIM. The
fee is computed and accrued daily based on the daily net assets of each
specific class of shares of each fund and paid monthly in arrears. For funds
with a stepped fee schedule, the rate of the fee is determined by applying a
fee rate calculation formula. This formula takes into account all of the
investment advisor's assets under management in each fund's investment
strategy (strategy assets) to calculate the appropriate fee rate for each
fund. The strategy assets include each fund's assets and the assets of other
clients of the investment advisor that are not in the American Century family
of funds, but that have the same investment team and investment strategy. The
annual management fee schedule for each class of Heritage is 1.00% for the
Investor Class, A Class, B Class, C Class and R Class and 0.80% for the
Institutional Class. The annual management fee schedule for New Opportunities
II ranges from 1.10% to 1.50% for the Investor Class, A Class, B Class, C
Class and R Class. The Institutional Class of New Opportunities II is 0.20%
less at each point within the range.
The effective annual management fee for each class of each fund for the six
months ended April 30, 2008 was as follows:
Investor, A, B, C, & R Institutional
Heritage 1.00% 0.80%
New Opportunities II 1.37% 1.17%
DISTRIBUTION AND SERVICE FEES -- The Board of Directors has adopted a separate
Master Distribution and Individual Shareholder Services Plan for each of the A
Class, B Class, C Class and R Class (collectively the plans), pursuant to Rule
12b-1 of the 1940 Act. The plans provide that the A Class will pay American
Century Investment Services, Inc. (ACIS) an annual distribution and service
fee of 0.25%. The plans provide that the B Class and the C Class will each pay
ACIS an annual distribution fee of 0.75% and service fee of 0.25%. The plans
provide that the R Class will pay ACIS an annual distribution and service fee
of 0.50%. The fees are computed and accrued daily based on each class's daily
net assets and paid monthly in arrears. The distribution fee provides
compensation for expenses incurred in connection with distributing shares of
the classes including, but not limited to, payments to brokers, dealers, and
financial institutions that have entered into sales agreements with respect to
shares of the funds. The service fee provides compensation for individual
shareholder services rendered by broker/dealers or other independent financial
intermediaries. Fees incurred under the plans during the six months ended
April 30, 2008, are detailed in the Statement of Operations.
RELATED PARTIES -- Certain officers and directors of the corporation are also
officers and/or directors, and, as a group, controlling stockholders of
American Century Companies, Inc. (ACC), the parent of the corporation's
investment advisor, ACIM, the distributor of the corporation, ACIS, and the
corporation's transfer agent, American Century Services, LLC.
The funds are eligible to invest in a money market fund for temporary
purposes, which is managed by J.P. Morgan Investment Management, Inc. (JPMIM).
JPMIM is a wholly owned subsidiary of JPMorgan Chase & Co. (JPM). JPM is an
equity investor in ACC. Prior to December 12, 2007, the funds had a bank line
of credit agreement with JPMorgan Chase Bank (JPMCB). JPMCB is a custodian of
the funds and a wholly owned subsidiary of JPM.
- ------
25
3. INVESTMENT TRANSACTIONS
Investment transactions, excluding short-term investments, for the six months
ended April 30, 2008, were as follows:
Heritage New Opportunities II
Purchases $2,164,769,299 $500,725,496
Proceeds from sales $2,085,621,630 $369,781,128
4. CAPITAL SHARE TRANSACTIONS
Transactions in shares of the funds were as follows:
Six months ended Year ended
April 30, 2008 October 31, 2007(1)
Shares Amount Shares Amount
Heritage
INVESTOR
CLASS/SHARES
AUTHORIZED 400,000,000 400,000,000
============= ============
Sold 18,511,196 $380,806,721 55,747,908 $1,085,083,773
Issued in
reinvestment of
distributions 5,127,806 109,324,825 4,258,562 67,285,282
Redeemed (24,955,723) (491,410,360) (18,034,415) (331,684,372)
------------ ------------- ------------ --------------
(1,316,721) (1,278,814) 41,972,055 820,684,683
------------ ------------- ------------ --------------
INSTITUTIONAL
CLASS/SHARES
AUTHORIZED 40,000,000 40,000,000
============= ============
Sold 2,821,353 58,347,579 4,242,050 81,839,322
Issued in
reinvestment of
distributions 335,375 7,277,632 209,986 3,366,082
Redeemed (844,071) (16,667,270) (1,347,922) (25,109,011)
------------ ------------- ------------ --------------
2,312,657 48,957,941 3,104,114 60,096,393
------------ ------------- ------------ --------------
A CLASS/SHARES
AUTHORIZED 100,000,000 100,000,000
============= ============
Sold 11,396,578 227,687,126 11,013,744 210,428,398
Issued in
reinvestment of
distributions 779,666 16,263,842 280,594 4,352,011
Redeemed (3,910,150) (74,775,612) (2,042,060) (37,629,295)
------------ ------------- ------------ --------------
8,266,094 169,175,356 9,252,278 177,151,114
------------ ------------- ------------ --------------
B CLASS/SHARES
AUTHORIZED 35,000,000 35,000,000
============= ============
Sold 45,800 918,234 3,651 80,038
Issued in
reinvestment of
distributions 537 11,416 -- --
Redeemed (3,253) (64,736) -- --
------------ ------------- ------------ --------------
43,084 864,914 3,651 80,038
------------ ------------- ------------ --------------
C CLASS/SHARES
AUTHORIZED 35,000,000 35,000,000
============= ============
Sold 941,421 18,102,176 920,436 17,272,099
Issued in
reinvestment of
distributions 60,851 1,207,291 10,254 152,781
Redeemed (307,578) (5,529,268) (72,875) (1,307,383)
------------ ------------- ------------ --------------
694,694 13,780,199 857,815 16,117,497
------------ ------------- ------------ --------------
R CLASS/SHARES
AUTHORIZED 30,000,000 30,000,000
============= ============
Sold 13,101 266,307 1,162 25,000
Issued in
reinvestment of
distributions 58 1,228 -- --
Redeemed (4,715) (92,249) -- --
------------ ------------- ------------ --------------
8,444 175,286 1,162 25,000
------------ ------------- ------------ --------------
Net increase
(decrease) 10,008,252 $231,674,882 55,191,075 $1,074,154,725
============= ============= ============ ==============
(1) September 28, 2007 (commencement of sale) through October 31, 2007 for the
B Class and R Class.
- ------
26
Six months ended Year ended
April 30, 2008 October 31, 2007(1)
Shares Amount Shares Amount
New Opportunities II
INVESTOR
CLASS/SHARES
AUTHORIZED 165,000,000 165,000,000
=========== ============
Sold 5,108,828 $37,343,878 16,509,991 $136,035,975
Issued in
connection with
acquisition
(Note 8) -- -- 11,629,055 90,241,770
Issued in
reinvestment of
distributions 192,298 1,651,841 485,199 3,454,628
Redeemed (2,058,586) (16,381,486)(2) (3,170,120) (26,089,511)(3)
----------- --------------- ------------ ---------------
3,242,540 22,614,233 25,454,125 203,642,862
----------- --------------- ------------ ---------------
INSTITUTIONAL
CLASS/SHARES
AUTHORIZED 50,000,000 50,000,000
=========== ============
Sold 10,397,159 88,009,472 1,988,404 17,346,574
Issued in
reinvestment of
distributions 7,845 67,466 -- --
Redeemed (665,779) (5,269,549)(4) (39,046) (344,012)(5)
----------- --------------- ------------ ---------------
9,739,225 82,807,389 1,949,358 17,002,562
----------- --------------- ------------ ---------------
A CLASS/SHARES
AUTHORIZED 100,000,000 100,000,000
=========== ============
Sold 4,151,572 33,664,020 3,296,265 29,060,351
Issued in
connection with
acquisition
(Note 8) -- -- 13,909,669 107,660,863
Issued in
reinvestment of
distributions 193,819 1,655,219 908,837 6,452,744
Redeemed (3,037,181) (24,095,550)(6) (6,173,894) (49,631,241)(7)
----------- --------------- ------------ ---------------
1,308,210 11,223,689 11,940,877 93,542,717
----------- --------------- ------------ ---------------
B CLASS/SHARES
AUTHORIZED 20,000,000 20,000,000
=========== ============
Sold 50,651 407,448 76,866 633,968
Issued in
reinvestment of
distributions 4,508 37,960 36,631 258,250
Redeemed (44,832) (340,483) (73,135) (565,516)
----------- --------------- ------------ ---------------
10,327 104,925 40,362 326,702
----------- --------------- ------------ ---------------
C CLASS/SHARES
AUTHORIZED 20,000,000 20,000,000
=========== ============
Sold 651,927 5,250,099 629,498 5,317,298
Issued in
connection with
acquisition
(Note 8) -- -- 903,113 6,962,989
Issued in
reinvestment of
distributions 13,136 111,133 35,779 253,319
Redeemed (230,836) (1,816,808) (390,349) (3,125,432)
----------- --------------- ------------ ---------------
434,227 3,544,424 1,178,041 9,408,174
----------- --------------- ------------ ---------------
R CLASS/SHARES
AUTHORIZED 20,000,000 20,000,000
=========== ============
Sold 1,037 8,708 2,772 25,000
Issued in
reinvestment of
distributions 27 229 -- --
Redeemed (38) (294) -- --
----------- --------------- ------------ ---------------
1,026 8,643 2,772 25,000
----------- --------------- ------------ ---------------
Net increase
(decrease) 14,735,555 $120,303,303 40,565,535 $323,948,017
=========== =============== ============ ===============
(1) May 18, 2007 and September 28, 2007 (commencement of sale) through October
31, 2007 for Institutional Class and R Class, respectively.
(2) Net of redemption fees of $93,572.
(3) Net of redemption fees of $26,104.
(4) Net of redemption fees of $5,316.
(5) Net of redemption fees of $5,237.
(6) Net of redemption fees of $5,242.
(7) Net of redemption fees of $7,198.
- ------
27
5. BANK LINE OF CREDIT
Effective December 12, 2007, the funds, along with certain other funds managed
by ACIM or ACGIM, have a $500,000,000 unsecured bank line of credit agreement
with Bank of America, N.A. Prior to December 12, 2007, the funds, along with
certain other funds managed by ACIM or ACGIM, had a $500,000,000 unsecured
bank line of credit agreement with JPMCB. The funds may borrow money for
temporary or emergency purposes to fund shareholder redemptions. Borrowings
under the agreement, which is subject to annual renewal, bear interest at the
Federal Funds rate plus 0.40%. The funds did not borrow from the line during
the six months ended April 30, 2008.
6. RISK FACTORS
There are certain risks involved in investing in foreign securities. These
risks include those resulting from future adverse political, social, and
economic developments, fluctuations in currency exchange rates, the possible
imposition of exchange controls, and other foreign laws or restrictions.
Investing in emerging markets may accentuate these risks.
New Opportunities II's performance may be affected by investments in initial
public offerings (IPOs). The impact of IPOs on a fund's performance depends on
the strength of the IPO market and the size of the fund. IPOs may have less
impact on a fund's performance as its assets grow.
New Opportunities II concentrates its investments in common stocks of small
companies. Because of this, New Opportunities II may be subject to greater
risk and market fluctuations than a fund investing in larger, more established
companies.
New Opportunities II's investment process may result in high portfolio
turnover, high commission costs and high capital gains distributions. In
addition, its investment approach may involve higher volatility and risk.
7. FEDERAL TAX INFORMATION
The book-basis character of distributions made during the year from net
investment income or net realized gains may differ from their ultimate
characterization for federal income tax purposes. These differences reflect
the differing character of certain income items and net realized gains and
losses for financial statement and tax purposes, and may result in
reclassification among certain capital accounts on the financial statements.
As of April 30, 2008, the components of investments for federal income tax
purposes were as follows:
New
Heritage Opportunities II
Federal tax cost of investments $2,204,981,144 $506,918,510
=============== =================
Gross tax appreciation of investments $632,177,267 $72,630,957
Gross tax depreciation of investments (31,385,686) (12,430,908)
--------------- -----------------
Net tax appreciation (depreciation)
of investments $600,791,581 $60,200,049
=============== =================
The difference between book-basis and tax-basis cost and unrealized
appreciation (depreciation) is attributable primarily to the tax deferral of
losses on wash sales.
As of October 31, 2007, New Opportunities II had accumulated capital losses of
$(178,872,880), which represent net capital loss carryovers that may be used
to offset future realized capital gains for federal income tax purposes. The
capital loss carryovers for New Opportunities II expire as follows:
2011 2012 2013 2014
$(13,145,846) $(19,655,453) $(42,248,002) $(103,823,579)
- ------
28
8. REORGANIZATION NOTE
On August 30, 2006, the Board of Directors of Kopp Emerging Growth (Emerging
Growth), one fund in a series issued by Kopp Funds, Inc., approved a plan of
reorganization (the reorganization) pursuant to which New Opportunities II
acquired all of the assets of Emerging Growth in exchange for shares of equal
value of New Opportunities II and the assumption by New Opportunities II of
all liabilities of Emerging Growth. The financial statements and performance
history of New Opportunities II will be carried over in the
post-reorganization. The reorganization was approved by shareholders of
Emerging Growth on January 12, 2007. The reorganization was effective at the
close of business on February 23, 2007.
The acquisition was accomplished by a tax-free exchange of shares. On February
23, 2007, Emerging Growth exchanged its shares for shares of New Opportunities
II as follows:
Shares Shares
Original Fund/Class Exchanged New Fund/Class Received
Emerging Growth -- New Opportunities II --
Investor Class 8,812,902 Investor Class 11,629,055
Emerging Growth -- New Opportunities II --
A Class 10,913,968 A Class 13,909,669
Emerging Growth -- New Opportunities II --
C Class 743,919 C Class 903,113
The net assets of Emerging Growth and New Opportunities II immediately before
the acquisition were $204,865,622 and $157,082,448, respectively. Emerging
Growth's unrealized appreciation of $9,092,774 was combined with that of New
Opportunities II. Immediately after the acquisition, the combined net assets
were $361,948,070. New Opportunities II acquired capital loss carryovers of
$(198,135,391) from Emerging Growth.
9. RECENTLY ISSUED ACCOUNTING STANDARDS
The Financial Accounting Standards Board (FASB) issued Statement of Financial
Accounting Standards No. 157, "Fair Value Measurements" (FAS 157), in
September 2006, which is effective for fiscal years beginning after November
15, 2007. FAS 157 defines fair value, establishes a framework for measuring
fair value and expands the required financial statement disclosures about fair
value measurements. Management is currently evaluating the impact that
adopting FAS 157 will have on the financial statement disclosures.
In March 2008, the FASB issued Statement of Financial Accounting Standards No.
161, "Disclosures about Derivative Instruments and Hedging Activities -- an
amendment of FASB Statement No. 133" (FAS 161). FAS 161 is effective for
fiscal years beginning after November 15, 2008. FAS 161 amends and expands
disclosures about derivative instruments and hedging activities. FAS 161
requires qualitative disclosures about the objectives and strategies of
derivative instruments, quantitative disclosures about the fair value amounts
of and gains and losses on derivative instruments, and disclosures of
credit-risk-related contingent features in hedging activities. Management is
currently evaluating the impact that adopting FAS 161 will have on the
financial statement disclosures.
- ------
29
FINANCIAL HIGHLIGHTS
Heritage
Investor Class
For a Share Outstanding Throughout the Years Ended October 31 (except as noted)
2008(1) 2007 2006 2005 2004 2003
PER-SHARE DATA
Net Asset Value,
Beginning of Period $22.83 $15.58 $13.48 $10.76 $10.78 $9.11
---------- ------- ------- ------- ------- -------
Income From
Investment
Operations
Net Investment
Income
(Loss)(2) (0.06) (0.10) (0.03) (0.06) (0.05) (0.04)
Net Realized
and
Unrealized
Gain (Loss) (1.69) 8.42 2.22 2.78 0.03 1.71
---------- ------- ------- ------- ------- -------
Total From
Investment
Operations (1.75) 8.32 2.19 2.72 (0.02) 1.67
---------- ------- ------- ------- ------- -------
Distributions
From Net
Realized Gains (1.06) (1.07) (0.09) -- -- --
---------- ------- ------- ------- ------- -------
Net Asset Value,
End of Period $20.02 $22.83 $15.58 $13.48 $10.76 $10.78
========== ======= ======= ======= ======= =======
TOTAL RETURN(3) (7.96)% 56.41% 16.26% 25.16% (0.09)% 18.33%
RATIOS/SUPPLEMENTAL DATA
Ratio of Operating
Expenses to Average
Net Assets 1.00%(4) 1.00% 1.00% 1.00% 1.00% 1.00%
Ratio of Net
Investment Income
(Loss) to Average
Net Assets (0.55)%(4) (0.56)% (0.22)% (0.46)% (0.44)% (0.39)%
Portfolio Turnover
Rate 76% 128% 230% 236% 264% 129%
Net Assets, End of
Period
(in millions) $2,147 $2,478 $1,037 $801 $1,148 $1,227
(1) Six months ended April 30, 2008 (unaudited).
(2) Computed using average shares outstanding throughout the period.
(3) Total return assumes reinvestment of net investment income and capital
gains distributions, if any. Total returns for periods less than one year are
not annualized. The total return of the classes may not precisely reflect the
class expense differences because of the impact of calculating the net asset
values to two decimal places. If net asset values were calculated to three
decimal places, the total return differences would more closely reflect the
class expense differences. The calculation of net asset values to two decimal
places is made in accordance with SEC guidelines and does not result in any
gain or loss of value between one class and another.
(4) Annualized.
See Notes to Financial Statements.
- ------
30
Heritage
Institutional Class
For a Share Outstanding Throughout the Years Ended October 31
(except as noted)
2008(1) 2007 2006 2005 2004 2003
PER-SHARE DATA
Net Asset Value,
Beginning of
Period $23.21 $15.80 $13.63 $10.87 $10.86 $9.17
---------- -------- ------- ------- ------- -------
Income From
Investment
Operations
Net
Investment
Income
(Loss)(2) (0.03) (0.07) --(3) (0.03) (0.03) (0.01)
Net Realized
and
Unrealized
Gain (Loss) (1.73) 8.55 2.26 2.79 0.04 1.70
---------- -------- ------- ------- ------- -------
Total From
Investment
Operations (1.76) 8.48 2.26 2.76 0.01 1.69
---------- -------- ------- ------- ------- -------
Distributions
From Net
Realized
Gains (1.06) (1.07) (0.09) -- -- --
---------- -------- ------- ------- ------- -------
Net Asset Value,
End of Period $20.39 $23.21 $15.80 $13.63 $10.87 $10.86
========= ======== ======= ======= ======== ========
TOTAL RETURN(4) (7.87)% 56.66% 16.59% 25.39% 0.09% 18.43%
RATIOS/SUPPLEMENTAL DATA
Ratio of
Operating
Expenses to
Average Net
Assets 0.80%(5) 0.80% 0.80% 0.80% 0.80% 0.80%
Ratio of Net
Investment
Income (Loss) to
Average Net
Assets (0.35)%(5) (0.36)% (0.02)% (0.26)% (0.24)% (0.19)%
Portfolio
Turnover Rate 76% 128% 230% 236% 264% 129%
Net Assets, End
of Period
(in thousands) $184,072 $155,885 $57,039 $43,192 $58,259 $73,735
(1) Six months ended April 30, 2008 (unaudited).
(2) Computed using average shares outstanding throughout the period.
(3) Per-share amount was less than $0.005.
(4) Total return assumes reinvestment of net investment income and capital
gains distributions, if any. Total returns for periods less than one year are
not annualized. The total return of the classes may not precisely reflect the
class expense differences because of the impact of calculating the net asset
values to two decimal places. If net asset values were calculated to three
decimal places, the total return differences would more closely reflect the
class expense differences. The calculation of net asset values to two decimal
places is made in accordance with SEC guidelines and does not result in any
gain or loss of value between one class and another.
(5) Annualized.
See Notes to Financial Statements.
- ------
31
Heritage
A Class(1)
For a Share Outstanding Throughout the Years Ended October 31
(except as noted)
2008(2) 2007 2006 2005 2004 2003
PER-SHARE DATA
Net Asset Value,
Beginning of Period $22.37 $15.32 $13.29 $10.64 $10.68 $9.05
---------- -------- ------- ------- ------- -------
Income From
Investment
Operations
Net Investment
Income
(Loss)(3) (0.08) (0.15) (0.08) (0.09) (0.07) (0.06)
Net Realized
and
Unrealized
Gain (Loss) (1.66) 8.27 2.20 2.74 0.03 1.69
---------- -------- ------- ------- ------- -------
Total From
Investment
Operations (1.74) 8.12 2.12 2.65 (0.04) 1.63
---------- -------- ------- ------- ------- -------
Distributions
From Net
Realized Gains (1.06) (1.07) (0.09) -- -- --
---------- -------- ------- ------- ------- -------
Net Asset Value,
End of Period $19.57 $22.37 $15.32 $13.29 $10.64 $10.68
========== ======== ======= ======= ======= =======
TOTAL RETURN(4) (8.08)% 56.05% 15.96% 24.91% (0.37)% 18.01%
RATIOS/SUPPLEMENTAL DATA
Ratio of Operating
Expenses to
Average Net Assets 1.25%(5) 1.25% 1.25% 1.25% 1.25% 1.25%
Ratio of Net
Investment Income
(Loss) to
Average Net Assets (0.80)%(5) (0.81)% (0.47)% (0.71)% (0.69)% (0.64)%
Portfolio Turnover
Rate 76% 128% 230% 236% 264% 129%
Net Assets, End of
Period
(in thousands) $416,911 $291,674 $57,995 $19,953 $15,623 $13,668
(1) Prior to September 4, 2007, the A Class was referred to as the Advisor
Class.
(2) Six months ended April 30, 2008 (unaudited).
(3) Computed using average shares outstanding throughout the period.
(4) Total return assumes reinvestment of net investment income and capital
gains distributions, if any, and does not reflect applicable sales charges..
Total returns for periods less than one year are not annualized. The total
return of the classes may not precisely reflect the class expense differences
because of the impact of calculating the net asset values to two decimal
places. If net asset values were calculated to three decimal places, the total
return differences would more closely reflect the class expense differences.
The calculation of net asset values to two decimal places is made in
accordance with SEC guidelines and does not result in any gain or loss of
value between one class and another.
(5) Annualized.
See Notes to Financial Statements.
- ------
32
Heritage
B Class
For a Share Outstanding Throughout the Periods Indicated
2008(1) 2007(2)
PER-SHARE DATA
Net Asset Value, Beginning of Period $22.82 $21.52
---------- ---------
Income From Investment Operations
Net Investment Income (Loss)(3) (0.14) (0.03)
Net Realized and Unrealized Gain (Loss) (1.71) 1.33
---------- ---------
Total From Investment Operations (1.85) 1.30
---------- ---------
Distributions
From Net Realized Gains (1.06) --
---------- ---------
Net Asset Value, End of Period $19.91 $22.82
========== =========
TOTAL RETURN(4) (8.46)% 6.04%
RATIOS/SUPPLEMENTAL DATA
Ratio of Operating Expenses
to Average Net Assets 2.00%(5) 2.00%(5)
Ratio of Net Investment Income (Loss)
to Average Net Assets (1.55)%(5) (1.81)%(5)
Portfolio Turnover Rate 76% 128%(6)
Net Assets, End of Period (in thousands) $930 $83
(1) Six months ended April 30, 2008 (unaudited).
(2) September 28, 2007 (commencement of sale) through October 31, 2007.
(3) Computed using average shares outstanding throughout the period.
(4) Total return assumes reinvestment of net investment income and capital
gains distributions, if any, and does not reflect applicable sales charges.
Total returns for periods less than one year are not annualized. The total
return of the classes may not precisely reflect the class expense differences
because of the impact of calculating the net asset values to two decimal
places. If net asset values were calculated to three decimal places, the total
return differences would more closely reflect the class expense differences.
The calculation of net asset values to two decimal places is made in
accordance with SEC guidelines and does not result in any gain or loss of
value between one class and another.
(5) Annualized.
(6) Portfolio turnover is calculated at the fund level. Percentage indicated
was calculated for the year ended October 31, 2007.
See Notes to Financial Statements.
- ------
33
Heritage
C Class
For a Share Outstanding Throughout the Years Ended October 31
(except as noted)
2008(1) 2007 2006 2005 2004 2003
PER-SHARE DATA
Net Asset Value,
Beginning of Period $21.35 $14.77 $12.91 $10.41 $10.54 $8.99
---------- ------- ------- ------- ------- -------
Income From
Investment
Operations
Net Investment
Income
(Loss)(2) (0.15) (0.29) (0.18) (0.17) (0.15) (0.13)
Net Realized
and
Unrealized Gain
(Loss) (1.58) 7.94 2.13 2.67 0.02 1.68
---------- ------- ------- ------- ------- -------
Total From
Investment
Operations (1.73) 7.65 1.95 2.50 (0.13) 1.55
---------- ------- ------- ------- ------- -------
Distributions
From Net
Realized Gains (1.06) (1.07) (0.09) -- -- --
---------- ------- ------- ------- ------- -------
Net Asset Value,
End of Period $18.56 $21.35 $14.77 $12.91 $10.41 $10.54
========== ======= ======= ======= ======= =======
TOTAL RETURN(3) (8.44)% 54.88% 15.11% 24.02% (1.23)% 17.24%
RATIOS/SUPPLEMENTAL DATA
Ratio of Operating
Expenses to Average
Net Assets 2.00%(4) 2.00% 2.00% 2.00% 2.00% 2.00%
Ratio of Net
Investment Income
(Loss) to Average
Net Assets (1.55)%(4) (1.56)% (1.22)% (1.46)% (1.44)% (1.39)%
Portfolio Turnover
Rate 76% 128% 230% 236% 264% 129%
Net Assets, End of
Period
(in thousands) $31,754 $21,692 $2,334 $898 $889 $872
(1) Six months ended April 30, 2008 (unaudited).
(2) Computed using average shares outstanding throughout the period.
(3) Total return assumes reinvestment of net investment income and capital
gains distributions, if any, and does not reflect applicable sales charges.
Total returns for periods less than one year are not annualized. The total
return of the classes may not precisely reflect the class expense differences
because of the impact of calculating the net asset values to two decimal
places. If net asset values were calculated to three decimal places, the total
return differences would more closely reflect the class expense differences.
The calculation of net asset values to two decimal places is made in
accordance with SEC guidelines and does not result in any gain or loss of
value between one class and another.
(4) Annualized.
See Notes to Financial Statements.
- ------
34
Heritage
R Class
For a Share Outstanding Throughout the Periods Indicated
2008(1) 2007(2)
PER-SHARE DATA
Net Asset Value, Beginning of Period $22.83 $21.52
--------- ----------
Income From Investment Operations
Net Investment Income (Loss)(3) (0.10) (0.02)
Net Realized and Unrealized Gain (Loss) (1.71) 1.33
--------- ----------
Total From Investment Operations (1.81) 1.31
--------- ----------
Distributions
From Net Realized Gains (1.06) --
--------- ----------
Net Asset Value, End of Period $19.96 $22.83
========= ==========
TOTAL RETURN(4) (8.23)% 6.09%
RATIOS/SUPPLEMENTAL DATA
Ratio of Operating Expenses to Average
Net Assets 1.50%(5) 1.50%(5)
Ratio of Net Investment Income (Loss)
to Average Net Assets (1.05)%(5) (1.22)%(5)
Portfolio Turnover Rate 76% 128%(6)
Net Assets, End of Period (in thousands) $192 $27
(1) Six months ended April 30, 2008 (unaudited).
(2) September 28, 2007 (commencement of sale) through October 31, 2007.
(3) Computed using average shares outstanding throughout the period.
(4) Total return assumes reinvestment of net investment income and capital
gains distributions, if any. Total returns for periods less than one year are
not annualized. The total return of the classes may not precisely reflect the
class expense differences because of the impact of calculating the net asset
values to two decimal places. If net asset values were calculated to three
decimal places, the total return differences would more closely reflect the
class expense differences. The calculation of net asset values to two decimal
places is made in accordance with SEC guidelines and does not result in any
gain or loss of value between one class and another.
(5) Annualized.
(6) Portfolio turnover is calculated at the fund level. Percentage indicated
was calculated for the year ended October 31, 2007.
See Notes to Financial Statements.
- ------
35
New Opportunities II
Investor Class
For a Share Outstanding Throughout the Years Ended October 31
(except as noted)
2008(1) 2007 2006 2005 2004 2003
PER-SHARE DATA
Net Asset Value,
Beginning of Period $9.42 $7.63 $6.75 $6.29 $5.75 $4.15
-------- -------- ------- ------- ------- -------
Income From
Investment
Operations
Net Investment
Income
(Loss)(2) (0.02) (0.05) (0.06) (0.06) (0.07) (0.05)
Net Realized
and
Unrealized
Gain (Loss) (1.48) 2.52 1.16 0.69 0.61 1.65
-------- -------- ------- ------- ------- -------
Total From
Investment
Operations (1.50) 2.47 1.10 0.63 0.54 1.60
-------- -------- ------- ------- ------- -------
Distributions
From Net
Realized Gains (0.08) (0.68) (0.22) (0.17) -- --
-------- -------- ------- ------- ------- -------
Net Asset Value,
End of Period $7.84 $9.42 $7.63 $6.75 $6.29 $5.75
======== ======== ======= ======= ======= =======
TOTAL RETURN(3) (16.02)% 35.22% 16.52% 10.14% 9.39% 38.55%
RATIOS/SUPPLEMENTAL DATA
Ratio of Operating
Expenses to
Average Net Assets 1.37%(4) 1.41% 1.50% 1.50% 1.50% 1.50%
Ratio of Net
Investment Income
(Loss) to
Average Net Assets (0.57)%(4) (0.70)% (0.80)% (0.93)% (1.09)% (1.11)%
Portfolio Turnover
Rate 71% 204% 299% 269% 255% 236%
Net Assets, End of
Period
(in thousands) $277,718 $303,189 $51,336 $43,157 $38,917 $32,512
(1) Six months ended April 30, 2008 (unaudited).
(2) Computed using average shares outstanding throughout the period.
(3) Total return assumes reinvestment of net investment income and capital
gains distributions, if any. Total returns for periods less than one year are
not annualized. The total return of the classes may not precisely reflect the
class expense differences because of the impact of calculating the net asset
values to two decimal places. If net asset values were calculated to three
decimal places, the total return differences would more closely reflect the
class expense differences. The calculation of net asset values to two decimal
places is made in accordance with SEC guidelines and does not result in any
gain or loss of value between one class and another.
(4) Annualized.
See Notes to Financial Statements.
- ------
36
New Opportunities II
Institutional Class
For a Share Outstanding Throughout the Periods Indicated
2008(1) 2007(2)
PER-SHARE DATA
Net Asset Value, Beginning of Period $9.43 $8.27
--------- ----------
Income From Investment Operations
Net Investment Income (Loss)(3) (0.01) (0.03)
Net Realized and Unrealized Gain (Loss) (1.48) 1.19
--------- ----------
Total From Investment Operations (1.49) 1.16
--------- ----------
Distributions
From Net Realized Gains (0.08) --
--------- ----------
Net Asset Value, End of Period $7.86 $9.43
========= ==========
TOTAL RETURN(4) (15.90)% 14.03%
RATIOS/SUPPLEMENTAL DATA
Ratio of Operating Expenses to
Average Net Assets 1.17%(5) 1.21%(5)
Ratio of Net Investment Income (Loss)
to Average Net Assets (0.37)%(5) (0.65)%(5)
Portfolio Turnover Rate 71% 204%(6)
Net Assets, End of Period (in thousands) $91,827 $18,384
(1) Six months ended April 30, 2008 (unaudited).
(2) May 18, 2007 (commencement of sale) through October 31, 2007.
(3) Computed using average shares outstanding throughout the period.
(4) Total return assumes reinvestment of net investment income and capital
gains distributions, if any. Total returns for periods less than one year are
not annualized. The total return of the classes may not precisely reflect the
class expense differences because of the impact of calculating the net asset
values to two decimal places. If net asset values were calculated to three
decimal places, the total return differences would more closely reflect the
class expense differences. The calculation of net asset values to two decimal
places is made in accordance with SEC guidelines and does not result in any
gain or loss of value between one class and another.
(5) Annualized.
(6) Portfolio turnover is calculated at the fund level. Percentage indicated
was calculated for the year ended October 31, 2007.
See Notes to Financial Statements.
- ------
37
New Opportunities II
A Class
For a Share Outstanding Throughout the Years Ended October 31
(except as noted)
2008(1) 2007 2006 2005 2004 2003(2)
PER-SHARE DATA
Net Asset Value,
Beginning of Period $9.37 $7.59 $6.72 $6.26 $5.74 $4.15
--------- ------- ------ ------ ------ ---------
Income From
Investment
Operations
Net Investment
Income
(Loss)(3) (0.03) (0.07) (0.08) (0.08) (0.08) (0.05)
Net
Realized
and
Unrealized
Gain (Loss) (1.47) 2.51 1.16 0.70 0.60 1.64
--------- ------- ------ ------ ------ ---------
Total From
Investment
Operations (1.50) 2.44 1.08 0.62 0.52 1.59
--------- ------- ------ ------ ------ ---------
Distributions
From Net
Realized
Gains (0.08) (0.66) (0.21) (0.16) -- --
--------- ------- ------ ------ ------ ---------
Net Asset Value, End
of Period $7.79 $9.37 $7.59 $6.72 $6.26 $5.74
========= ======== ====== ====== ====== =========
TOTAL RETURN(4) (16.11)% 34.91% 16.22% 9.91% 9.06% 38.31%
RATIOS/SUPPLEMENTAL DATA
Ratio of Operating
Expenses to Average
Net Assets 1.62%(5) 1.66% 1.75% 1.75% 1.75% 1.75%(5)
Ratio of Net
Investment Income
(Loss) to Average Net
Assets (0.82)%(5) (0.95)% (1.05)% (1.18)% (1.34)% (1.47)%(5)
Portfolio
Turnover Rate 71% 204% 299% 269% 255% 236%(6)
Net Assets, End of
Period
(in thousands) $178,492 $202,515 $73,383 $47,937 $20,337 $891
(1) Six months ended April 30, 2008 (unaudited).
(2) January 31, 2003 (commencement of sale) through October 31, 2003.
(3) Computed using average shares outstanding throughout the period.
(4) Total return assumes reinvestment of net investment income and capital
gains distributions, if any, and does not reflect applicable sales charges.
Total returns for periods less than one year are not annualized. The total
return of the classes may not precisely reflect the class expense differences
because of the impact of calculating the net asset values to two decimal
places. If net asset values were calculated to three decimal places, the total
return differences would more closely reflect the class expense differences.
The calculation of net asset values to two decimal places is made in
accordance with SEC guidelines and does not result in any gain or loss of
value between one class and another.
(5) Annualized.
(6) Portfolio turnover is calculated at the fund level. Percentage indicated
was calculated for the year ended October 31, 2003.
See Notes to Financial Statements.
- ------
38
New Opportunities II
B Class
For a Share Outstanding Throughout the Years Ended October 31
(except as noted)
2008(1) 2007 2006 2005 2004 2003(2)
PER-SHARE DATA
Net Asset Value,
Beginning of
Period $9.25 $7.49 $6.63 $6.18 $5.71 $4.15
---------- ------- ------- ------- ------- ---------
Income From
Investment
Operations
Net
Investment
Income
(Loss)(3) (0.06) (0.13) (0.14) (0.13) (0.13) (0.08)
Net Realized
and
Unrealized
Gain (Loss) (1.45) 2.49 1.15 0.69 0.60 1.64
---------- ------- ------- ------- ------- ---------
Total From
Investment
Operations (1.51) 2.36 1.01 0.56 0.47 1.56
---------- ------- ------- ------- ------- ---------
Distributions
From Net
Realized
Gains (0.08) (0.60) (0.15) (0.11) -- --
---------- ------- ------- ------- ------- ---------
Net Asset Value,
End of Period $7.66 $9.25 $7.49 $6.63 $6.18 $5.71
========== ======= ======= ======= ======= =========
TOTAL RETURN(4) (16.43)% 33.84% 15.46% 9.03% 8.23% 37.59%
RATIOS/SUPPLEMENTAL DATA
Ratio of
Operating
Expenses to
Average Net
Assets 2.37%(5) 2.41% 2.50% 2.50% 2.50% 2.50%(5)
Ratio of Net
Investment
Income (Loss) to
Average Net
Assets (1.57)%(5) (1.70)% (1.80)% (1.93)% (2.09)% (2.20)%(5)
Portfolio
Turnover Rate 71% 204% 299% 269% 255% 236%(6)
Net Assets, End
of Period
(in thousands) $3,845 $4,549 $3,383 $2,367 $1,163 $215
(1) Six months ended April 30, 2008 (unaudited).
(2) January 31, 2003 (commencement of sale) through October 31, 2003.
(3) Computed using average shares outstanding throughout the period.
(4) Total return assumes reinvestment of net investment income and capital
gains distributions, if any, and does not reflect applicable sales charges.
Total returns for periods less than one year are not annualized. The total
return of the classes may not precisely reflect the class expense differences
because of the impact of calculating the net asset values to two decimal
places. If net asset values were calculated to three decimal places, the total
return differences would more closely reflect the class expense differences.
The calculation of net asset values to two decimal places is made in
accordance with SEC guidelines and does not result in any gain or loss of
value between one class and another.
(5) Annualized.
(6) Portfolio turnover is calculated at the fund level. Percentage indicated
was calculated for the year ended October 31, 2003.
See Notes to Financial Statements.
- ------
39
New Opportunities II
C Class
For a Share Outstanding Throughout the Years Ended October 31
(except as noted)
2008(1) 2007 2006 2005 2004 2003(2)
PER-SHARE DATA
Net Asset Value,
Beginning of Period $9.29 $7.52 $6.66 $6.20 $5.73 $4.15
--------- ------ ------ ------ ------ -----------
Income From
Investment
Operations
Net Investment
Income
(Loss)(3) (0.06) (0.13) (0.14) (0.13) (0.13) (0.07)
Net
Realized
and
Unrealized
Gain (Loss) (1.46) 2.50 1.15 0.70 0.60 1.65
--------- ------ ------ ------ ------ -----------
Total From
Investment
Operations (1.52) 2.37 1.01 0.57 0.47 1.58
--------- ------ ------ ------ ------ -----------
Distributions
From Net
Realized
Gains (0.08) (0.60) (0.15) (0.11) -- --
--------- ------ ------ ------ ------ -----------
Net Asset Value,
End of Period $7.69 $9.29 $7.52 $6.66 $6.20 $5.73
========= ====== ====== ====== ====== ============
TOTAL RETURN(4) (16.46)% 34.02% 15.24% 9.16% 8.20% 38.07%
RATIOS/SUPPLEMENTAL DATA
Ratio of Operating
Expenses to Average
Net Assets 2.37%(5) 2.41% 2.50% 2.50% 2.50% 2.22%(5)(6)
Ratio of Net
Investment Income
(Loss) to Average
Net Assets (1.57)%(5) (1.70)% (1.80)% (1.93)% (2.09)% (1.97)%(5)(6)
Portfolio Turnover
Rate 71% 204% 299% 269% 255% 236%(7)
Net Assets, End of
Period
(in thousands) $16,922 $16,406 $4,424 $3,414 $1,294 $34
(1) Six months ended April 30, 2008 (unaudited).
(2) January 31, 2003 (commencement of sale) through October 31, 2003.
(3) Computed using average shares outstanding throughout the period.
(4) Total return assumes reinvestment of net investment income and capital
gains distributions, if any, and does not reflect applicable sales charges.
Total returns for periods less than one year are not annualized. The total
return of the classes may not precisely reflect the class expense differences
because of the impact of calculating the net asset values to two decimal
places. If net asset values were calculated to three decimal places, the total
return differences would more closely reflect the class expense differences.
The calculation of net asset values to two decimal places is made in
accordance with SEC guidelines and does not result in any gain or loss of
value between one class and another.
(5) Annualized.
(6) During a portion of the period ended October 31, 2003, the distributor
agreed to voluntarily waive its distribution and service fees. Had fees not
been waived the annualized ratio of operating expenses to average net assets
and the annualized ratio of net investment income (loss) to average net assets
would have been 2.50% and (2.25)%, respectively.
(7) Portfolio turnover is calculated at the fund level. Percentage indicated
was calculated for the year ended October 31, 2003.
See Notes to Financial Statements.
- ------
40
New Opportunities II
R Class
For a Share Outstanding Throughout the Periods Indicated
2008(1) 2007(2)
PER-SHARE DATA
Net Asset Value, Beginning of Period $9.42 $9.02
--------- ---------
Income From Investment Operations
Net Investment Income (Loss)(3) (0.04) (0.01)
Net Realized and Unrealized Gain (Loss) (1.48) 0.41
--------- ---------
Total From Investment Operations (1.52) 0.40
--------- ---------
Distributions
From Net Realized Gains (0.08) --
--------- ---------
Net Asset Value, End of Period $7.82 $9.42
========= =========
TOTAL RETURN(4) (16.23)% 4.43%
RATIOS/SUPPLEMENTAL DATA
Ratio of Operating Expenses to
Average Net Assets 1.87%(5) 1.91%(5)
Ratio of Net Investment Income (Loss)
to Average Net Assets (1.07)%(5) (1.61)%(5)
Portfolio Turnover Rate 71% 204%(6)
Net Assets, End of Period (in thousands) $30 $26
(1) Six months ended April 30, 2008 (unaudited).
(2) September 28, 2007 (commencement of sale) through October 31, 2007.
(3) Computed using average shares outstanding throughout the period.
(4) Total return assumes reinvestment of net investment income and capital
gains distributions, if any. Total returns for periods less than one year are
not annualized. The total return of the classes may not precisely reflect the
class expense differences because of the impact of calculating the net asset
values to two decimal places. If net asset values were calculated to three
decimal places, the total return differences would more closely reflect the
class expense differences. The calculation of net asset values to two decimal
places is made in accordance with SEC guidelines and does not result in any
gain or loss of value between one class and another.
(5) Annualized.
(6) Portfolio turnover is calculated at the fund level. Percentage indicated
was calculated for the year ended October 31, 2007.
See Notes to Financial Statements.
- ------
41
ADDITIONAL INFORMATION
RETIREMENT ACCOUNT INFORMATION
As required by law, any distributions you receive from an IRA or certain
403(b), 457 and qualified plans [those not eligible for rollover to an IRA or
to another qualified plan] are subject to federal income tax withholding,
unless you elect not to have withholding apply. Tax will be withheld on the
total amount withdrawn even though you may be receiving amounts that are not
subject to withholding, such as nondeductible contributions. In such case,
excess amounts of withholding could occur. You may adjust your withholding
election so that a greater or lesser amount will be withheld.
If you don't want us to withhold on this amount, you must notify us to not
withhold the federal income tax. Even if you plan to roll over the amount you
withdraw to another tax-deferred account, the withholding rate still applies
to the withdrawn amount unless we have received notice not to withhold federal
income tax prior to the withdrawal. You may notify us in writing or in certain
situations by telephone or through other electronic means. You have the right
to revoke your withholding election at any time and any election you make may
remain in effect until revoked by filing a new election.
Remember, even if you elect not to have income tax withheld, you are liable
for paying income tax on the taxable portion of your withdrawal. If you elect
not to have income tax withheld or you don't have enough income tax withheld,
you may be responsible for payment of estimated tax. You may incur penalties
under the estimated tax rules if your withholding and estimated tax payments
are not sufficient.
State tax will be withheld if, at the time of your distribution, your address
is within one of the mandatory withholding states and you have federal income
tax withheld. State taxes will be withheld from your distribution in
accordance with the respective state rules.
PROXY VOTING GUIDELINES
American Century Investment Management, Inc., the funds' investment advisor,
is responsible for exercising the voting rights associated with the securities
purchased and/or held by the funds. A description of the policies and
procedures the advisor uses in fulfilling this responsibility is available
without charge, upon request, by calling 1-800-345-2021. It is also available
on American Century Investments' website at americancentury.com and on the
Securities and Exchange Commission's website at sec.gov. Information regarding
how the investment advisor voted proxies relating to portfolio securities
during the most recent 12-month period ended June 30 is available on the
"About Us" page at americancentury.com. It is also available at sec.gov.
QUARTERLY PORTFOLIO DISCLOSURE
The funds file their complete schedule of portfolio holdings with the
Securities and Exchange Commission (SEC) for the first and third quarters of
each fiscal year on Form N-Q. The funds' Forms N-Q are available on the SEC's
website at sec.gov, and may be reviewed and copied at the SEC's Public
Reference Room in Washington, DC. Information on the operation of the Public
Reference Room may be obtained by calling 1-800-SEC-0330. The funds also make
their complete schedule of portfolio holdings for the most recent quarter of
their fiscal year available on their website at americancentury.com and, upon
request, by calling 1-800-345-2021.
- ------
42
INDEX DEFINITIONS
The following indices are used to illustrate investment market, sector, or
style performance or to serve as fund performance comparisons. They are not
investment products available for purchase.
The RUSSELL 1000® INDEX is a market-capitalization weighted, large-cap index
created by Frank Russell Company to measure the performance of the 1,000
largest of the 3,000 largest publicly traded U.S. companies, based on total
market capitalization.
The RUSSELL 1000® GROWTH INDEX measures the performance of those Russell 1000
Index companies (the 1,000 largest of the 3,000 largest publicly traded U.S.
companies, based on total market capitalization) with higher price-to-book
ratios and higher forecasted growth values.
The RUSSELL 1000® VALUE INDEX measures the performance of those Russell 1000
Index companies (the 1,000 largest of the 3,000 largest publicly traded U.S.
companies, based on total market capitalization) with lower price-to-book
ratios and lower forecasted growth values.
The RUSSELL 2000® INDEX Is a market-capitalization weighted index created by
Frank Russell Company to measure the performance of the 2,000 smallest of the
3,000 largest publicly traded U.S. companies, based on total market
capitalization.
The RUSSELL 2000® GROWTH INDEX measures the performance of those Russell 2000
Index companies (the 2,000 smallest of the 3,000 largest publicly traded U.S.
companies, based on total market capitalization) with higher price-to-book
ratios and higher forecasted growth values.
The RUSSELL 2000® VALUE INDEX measures the performance of those Russell 2000
Index companies (the 2,000 smallest of the 3,000 largest publicly traded U.S.
companies, based on total market capitalization) with lower price-to-book
ratios and lower forecasted growth values.
The RUSSELL MIDCAP® INDEX measures the performance of the 800 smallest of the
1,000 largest publicly traded U.S. companies, based on total market
capitalization.
The RUSSELL MIDCAP® GROWTH INDEX measures the performance of those Russell
Midcap Index companies (the 800 smallest of the 1,000 largest publicly traded
U.S. companies, based on total market capitalization) with higher
price-to-book ratios and higher forecasted growth values.
The RUSSELL MIDCAP® VALUE INDEX measures the performance of those Russell
Midcap Index companies with lower price-to-book ratios and lower forecasted
growth values.
- ------
43
NOTES
- ------
44
[blank page]
[back cover]
[american century investments logo and text logo ®]
CONTACT US
AMERICANCENTURY.COM
AUTOMATED INFORMATION LINE. . . . . . . . . . . . . . . . . . . 1-800-345-8765
INVESTOR SERVICES REPRESENTATIVE . . . . . . . . . . . . . . . 1-800-345-2021 or
816-531-5575
INVESTORS USING ADVISORS. . . . . . . . . . . . . . . . . . . . 1-800-378-9878
BUSINESS, NOT-FOR-PROFIT,
EMPLOYER-SPONSORED RETIREMENT PLANS . . . . . . . . . . . . . . 1-800-345-3533
BANKS AND TRUST COMPANIES, BROKER-DEALERS,
FINANCIAL PROFESSIONALS, INSURANCE COMPANIES. . . . . . . . . . 1-800-345-6488
TELECOMMUNICATIONS DEVICE FOR THE DEAF. . . . . . . . . . . . . 1-800-634-4113
AMERICAN CENTURY MUTUAL FUNDS, INC.
INVESTMENT ADVISOR:
American Century Investment Management, Inc.
Kansas City, Missouri
American Century Investments
P.O. Box 419200 PRSRT STD
Kansas City, MO 64141-6200 U.S. POSTAGE PAID
AMERICAN CENTURY
COMPANIES
American Century Investment Services, Inc., Distributor
©2008 American Century Proprietary Holdings, Inc. All rights reserved.
0806
CL-SAN-60507S
[front cover]
SEMIANNUAL REPORT
APRIL 30, 2008
[american century investments logo and text logo ®]
AMERICAN CENTURY INVESTMENTS
NEW OPPORTUNITIES FUND
PRESIDENT'S LETTER
JONATHAN THOMAS
[photo of Jonathan Thomas]
Dear Investor,
At American Century Investments®, we are committed to helping you reach your
financial goals. Your success is the ultimate measure of our performance.
That's why we focus on achieving superior investment results and building
long-term relationships with investors like you.
Part of that relationship is to clearly communicate investment results and
what influenced them. To help you monitor your investment with us, we take
pride in providing you with the semiannual report for the American Century®
New Opportunities Fund for the six months ended April 30, 2008. We also
recommend americancentury.com, where we provide company news, quarterly
portfolio commentaries, investment views, and other useful information.
As noted on the website, 2008 marks the 50th anniversary of American Century
Investments. Since 1958, we've worked to make wise decisions with your
interests as our guide. Fifty years also means that we've met the challenges
of previous economic downturns. As we've crossed those hurdles and earned your
trust, our assets under management have grown to nearly $100 billion, putting
us in the top 5% of our industry. This growth has given us the resources to
offer a wide array of financial products and services, including a
well-diversified line-up of portfolios that provide you with many choices in
these uncertain times.
Though our offerings are diverse, they share several key qualities, including
our disciplined investment approach and active, team-based management. Strict
adherence to our processes and long-term strategies allows us to stay focused
during volatile periods. Investors in our portfolios also benefit from the sum
of our investment teams' expertise as they share research and information.
We'll continue to work hard to earn your trust. Thank you for your continued
support.
Sincerely,
/s/Jonathan Thomas
Jonathan S. Thomas
President and Chief Executive Officer
American Century Investments
TABLE OF CONTENTS
Market Perspective. . . . . . . . . . . . . . . . . . . . . . . . . . 2
U.S. Stock Index Returns . . . . . . . . . . . . . . . . . . . . . . 2
NEW OPPORTUNITIES
Performance . . . . . . . . . . . . . . . . . . . . . . . . . . . . . 3
Portfolio Commentary. . . . . . . . . . . . . . . . . . . . . . . . . 5
Top Ten Holdings . . . . . . . . . . . . . . . . . . . . . . . . . . 5
Top Five Industries. . . . . . . . . . . . . . . . . . . . . . . . . 6
Types of Investments in Portfolio. . . . . . . . . . . . . . . . . . 6
Shareholder Fee Example . . . . . . . . . . . . . . . . . . . . . . . 7
Schedule of Investments . . . . . . . . . . . . . . . . . . . . . . . 9
FINANCIAL STATEMENTS
Statement of Assets and Liabilities . . . . . . . . . . . . . . . . . 12
Statement of Operations . . . . . . . . . . . . . . . . . . . . . . . 13
Statement of Changes in Net Assets. . . . . . . . . . . . . . . . . . 14
Notes to Financial Statements . . . . . . . . . . . . . . . . . . . . 15
Financial Highlights. . . . . . . . . . . . . . . . . . . . . . . . . 19
OTHER INFORMATION
Additional Information. . . . . . . . . . . . . . . . . . . . . . . . 20
Index Definitions . . . . . . . . . . . . . . . . . . . . . . . . . . 21
The opinions expressed in the Market Perspective and the Portfolio Commentary
reflect those of the portfolio management team as of the date of the report,
and do not necessarily represent the opinions of American Century or any other
person in the American Century organization. Any such opinions are subject to
change at any time based upon market or other conditions and American Century
disclaims any responsibility to update such opinions. These opinions may not
be relied upon as investment advice and, because investment decisions made by
American Century funds are based on numerous factors, may not be relied upon
as an indication of trading intent on behalf of any American Century fund.
Security examples are used for representational purposes only and are not
intended as recommendations to purchase or sell securities. Performance
information for comparative indices and securities is provided to American
Century by third party vendors. To the best of American Century's knowledge,
such information is accurate at the time of printing.
MARKET PERSPECTIVE
[photo of Chief Investment Officer]
By Steve Lurito, Chief Investment Officer, U.S. Growth Equity
VOLATILITY UP, STOCKS DOWN
The six months ended April 30, 2008 saw stocks produce negative returns as
market volatility surged in the wake of the subprime credit crisis. In terms
of the economy, tighter credit and the slumping housing market hurt consumer
spending and confidence, leading many economists to suggest we're already in
recession. Meanwhile, mounting losses hurt the banks, brokers, and other big
institutional players important for the functioning of the financial markets.
Facing dual economic and financial crises, the Federal Reserve (the Fed) took
a series of extraordinary steps, slashing interest rates and acting as a
lender of last resort not only for banks, but also major brokers. That helped
stocks rebound, with many analysts suggesting that the mid-March buy-out of
investment bank Bear Stearns -- in a deal arranged by the Fed -- put a floor
under the market.
RETURNS BY SIZE, STYLE MIXED
Performance by size and style was mixed (see the accompanying table),
reflecting the volatile trading during the period, when corporate earnings
estimates were revised down sharply. Looking at returns by sector, energy
shares were the only segment to produce positive results during the six
months. At the other end of the spectrum, credit-related losses took a big
bite out of earnings for financials stocks, which performed worst. Consumer
discretionary shares also lagged badly, as did information technology stocks,
which suffered from poor pricing and demand trends for chips and some
consumer-related tech goods.
OPPORTUNITY AMID VOLATILITY
Despite the uncertainty surrounding the economy, we think growth-oriented
stocks can perform well relative to value as proven earnings growth becomes
scarce during economic slowdowns. And while we don't see an end to market
volatility anytime soon, we view this dynamic as a natural part of the
investing cycle -- and one that presents us with opportunities to build
positions in what we believe are high-quality companies trading at attractive
prices. Indeed, investors should rest assured that we're finding no shortage
of companies demonstrating sustained earnings growth and business improvement.
U.S. Stock Index Returns
For the six months ended April 30, 2008*
RUSSELL 1000 INDEX (LARGE-CAP) -9.54%
Russell 1000 Growth Index -9.28%
Russell 1000 Value Index -9.83%
RUSSELL MIDCAP INDEX -8.77%
Russell Midcap Growth Index -8.44%
Russell Midcap Value Index -9.20%
RUSSELL 2000 INDEX (SMALL-CAP) -12.92%
Russell 2000 Growth Index -14.14%
Russell 2000 Value Index -11.55%
*Total returns for periods less than one year are not annualized.
- ------
2
PERFORMANCE
New Opportunities
Total Returns as of April 30, 2008
Average Annual Returns
6 Since Inception
months(1) 1 year 5 years 10 years Inception Date
NEW
OPPORTUNITIES -16.08% -1.50% 12.91% 6.80% 7.72% 12/26/96
RUSSELL 2000
GROWTH INDEX(2) -14.14% -6.71% 13.32% 2.20% 4.12%(3) --
(1) Total returns for periods less than one year are not annualized.
(2) Data provided by Lipper Inc. - A Reuters Company. ©2008 Reuters. All
rights reserved. Any copying, republication or redistribution of Lipper
content, including by caching, framing or similar means, is expressly
prohibited without the prior written consent of Lipper. Lipper shall not be
liable for any errors or delays in the content, or for any actions taken in
reliance thereon.
The data contained herein has been obtained from company reports, financial
reporting services, periodicals and other resources believed to be reliable.
Although carefully verified, data on compilations is not guaranteed by Lipper
and may be incomplete. No offer or solicitations to buy or sell any of the
securities herein is being made by Lipper.
(3) Since 12/31/96, the date nearest the fund's inception for which data are
available.
Data presented reflect past performance. Past performance is no guarantee of
future results. Current performance may be higher or lower than the
performance shown. Investment return and principal value will fluctuate, and
redemption value may be more or less than original cost. To obtain performance
data current to the most recent month end, please call 1-800-345-2021 or visit
americancentury.com. Historically, small company stocks have been more
volatile than the stocks of larger, more established companies. The fund's
investment process may result in high portfolio turnover, high commission
costs and high capital gains distributions. In addition, its investment
approach may involve higher volatility and risk. The fund's performance may be
affected by investments in initial public offerings.
Data assumes reinvestment of dividends and capital gains, and none of the
charts reflect the deduction of taxes that a shareholder would pay on fund
distributions or the redemption of fund shares. Returns for the index are
provided for comparison. The fund's total returns include operating expenses
(such as transaction costs and management fees) that reduce returns, while the
total returns of the index do not.
- ------
3
New Opportunities
Growth of $10,000 Over 10 Years
$10,000 investment made April 30, 1998

One-Year Returns Over 10 Years
Periods ended April 30
1999 2000 2001 2002 2003 2004 2005 2006 2007 2008
New
Opportunities 5.15% 172.82% -46.30% -7.32% -26.32% 29.85% -3.73% 42.24% 4.88% -1.50%
Russell 2000
Growth Index -3.77% 31.39% -24.85% -8.52% -23.50% 41.57% -0.55% 36.13% 4.53% -6.71%
Data presented reflect past performance. Past performance is no guarantee of
future results. Current performance may be higher or lower than the
performance shown. Investment return and principal value will fluctuate, and
redemption value may be more or less than original cost. To obtain performance
data current to the most recent month end, please call 1-800-345-2021 or visit
americancentury.com. Historically, small company stocks have been more
volatile than the stocks of larger, more established companies. The fund's
investment process may result in high portfolio turnover, high commission
costs and high capital gains distributions. In addition, its investment
approach may involve higher volatility and risk. The fund's performance may be
affected by investments in initial public offerings.
Data assumes reinvestment of dividends and capital gains, and none of the
charts reflect the deduction of taxes that a shareholder would pay on fund
distributions or the redemption of fund shares. Returns for the index are
provided for comparison. The fund's total returns include operating expenses
(such as transaction costs and management fees) that reduce returns, while the
total returns of the index do not.
- ------
4
PORTFOLIO COMMENTARY
New Opportunities
Portfolio Managers: Stafford Southwick and Matthew Ferretti
PERFORMANCE SUMMARY
New Opportunities returned -16.08%* for the six months ended April 30, 2008,
trailing the -14.14% return of its benchmark, the Russell 2000 Growth Index.
The fund's return reflected the underperformance of small-cap stocks in
general, and small-cap growth issues in particular. Furthermore, our
investment approach faced considerable headwinds -- investors shifted away
from momentum stocks, market volatility increased sharply, and sector rotation
accelerated as many of the best-performing sectors from 2007 fell out of favor
in early 2008.
Our investment style often lags in this kind of transitional environment, and
the six-month period was no exception. Despite this recent underperformance,
however, the fund's long-term returns remain robust (see pages 3-4 for
historical performance information).
TECHNOLOGY LAGGED
Stock selection in the information technology sector was the main factor
behind the fund's underperformance of its benchmark. Stock choices among
electronic equipment manufacturers and software companies had the biggest
negative impact. The most significant underperformer was Brightpoint, the
leading distributor of wireless devices. The slowdown in consumer spending,
both domestically and overseas, weighed on the stock. In addition, one of the
company's largest customers, Motorola, struggled during the period as its
market share deteriorated.
Another technology stock hurt by weaker consumer spending was Synaptics, which
makes touchpads for laptops, MP3 players, and other mobile devices. A loss of
market share sent the stock sharply lower in early 2008, and we eliminated it
from the portfolio.
INDUSTRIALS DETRACTED
The portfolio's industrial stocks also lagged their counterparts in the
benchmark index. Some of the portfolio's biggest winners in 2007 were dry bulk
carriers -- large ships that carry dry goods such as iron ore and coal across
oceans. Strong demand for dry goods led to a shortage of ship capacity,
causing day rates to rise sharply. However, day rates peaked in late 2007 and
then dropped substantially amid a seasonal slowdown and annual contract
negotiations between China and the leading dry goods exporters.
Top Ten Holdings as of April 30, 2008
% of net
% of net assets as of
assets as of 4/30/08 10/31/07
Darling International Inc. 2.0% 1.3%
priceline.com Inc. 2.0% 1.9%
Tupperware Brands Corp. 1.7% 1.1%
Chimera Investment Corp. 1.7% --
CyberSource Corp. 1.7% --
ManTech International Corp. Cl A 1.7% 0.8%
Syniverse Holdings, Inc. 1.5% 1.1%
Sybase, Inc. 1.5% --
PerkinElmer, Inc. 1.5% 1.0%
Perrigo Co. 1.5% --
*Total returns for periods less than one year are not annualized.
- ------
5
New Opportunities
Fund holdings DryShips, Diana Shipping, and Eagle Bulk Shipping slumped during
the period, and although we reduced our positions in each of these stocks, we
continue to own them as day rates have begun to recover.
CONSUMER AND ENERGY STOCKS ADDED VALUE
On the positive side, the portfolio's consumer and energy stocks contributed
favorably to performance relative to the Russell 2000 Growth Index. Among
consumer stocks, the top contributor was Darling International, which renders
animal by-products and recycles used cooking oil into useable oils and
proteins for the agricultural industry. Darling's profit margins expanded as
commodity prices surged.
Household products maker Tupperware Brands and online travel agent
priceline.com were also major contributors. Tupperware reported strong profit
growth thanks to its substantial international business and expansion into
emerging markets. Priceline.com enjoyed strong growth in its European hotel
reservation unit and gained market share domestically by eliminating booking
fees.
Six of the top ten relative performance contributors came from the energy
sector. The top contributors were companies with an emphasis on natural gas,
whose price surged during the period. Winners included Cabot Oil & Gas, Forest
Oil, and Encore Acquisition.
IPOS CONTRIBUTED FAVORABLY
We participated in 16 initial public offerings (IPOs) during the period, and
overall they added value to portfolio performance. The best performers
included energy exploration and production company Approach Resources and
Chinese advertising services provider VisionChina Media.
OUTLOOK
After fearing the worst over the last six months, the stock market has started
to price in better credit and economic conditions. Consequently, we have
recently pursued investment opportunities in the technology, financials, and
consumer discretionary sectors. As always, we continue to seek out companies
with improving business fundamentals, accelerating earnings and revenue
growth, and price momentum.
Top Five Industries as of April 30, 2008
% of net
% of net assets as of
assets as of 4/30/08 10/31/07
Oil, Gas & Consumable Fuels 6.8% 5.2%
Commercial Banks 5.6% 0.9%
Chemicals 5.3% 6.4%
Internet Software & Services 4.6% 3.3%
IT Services 4.4% 2.1%
Types of Investments in Portfolio
% of net
% of net assets as of
assets as of 4/30/08 10/31/07
Domestic Common Stocks 91.8% 88.3%
Foreign Common Stocks(1) 7.2% 7.7%
TOTAL COMMON STOCKS 99.0% 96.0%
Temporary Cash Investments 0.5% 4.4%
Other Assets and Liabilities 0.5% (0.4)%
(1) Includes depositary shares, dual listed securities and foreign ordinary
shares.
- ------
6
SHAREHOLDER FEE EXAMPLE (UNAUDITED)
Fund shareholders may incur two types of costs: (1) transaction costs,
including sales charges (loads) on purchase payments and redemption/exchange
fees; and (2) ongoing costs, including management fees; distribution and
service (12b-1) fees; and other fund expenses. This example is intended to
help you understand your ongoing costs (in dollars) of investing in your fund
and to compare these costs with the ongoing cost of investing in other mutual
funds.
The example is based on an investment of $1,000 made at the beginning of the
period and held for the entire period from November 1, 2007 to April 30, 2008.
ACTUAL EXPENSES
The table provides information about actual account values and actual expenses
for each class. You may use the information, together with the amount you
invested, to estimate the expenses that you paid over the period. First,
identify the share class you own. Then simply divide your account value by
$1,000 (for example, an $8,600 account value divided by $1,000 = 8.6), then
multiply the result by the number under the heading "Expenses Paid During
Period" to estimate the expenses you paid on your account during this period.
If you hold Investor Class shares of any American Century fund, or
Institutional Class shares of the American Century Diversified Bond Fund, in
an American Century account (i.e., not a financial intermediary or retirement
plan account), American Century may charge you a $12.50 semiannual account
maintenance fee if the value of those shares is less than $10,000. We will
redeem shares automatically in one of your accounts to pay the $12.50 fee. In
determining your total eligible investment amount, we will include your
investments in all PERSONAL ACCOUNTS (including American Century Brokerage
accounts) registered under your Social Security number. PERSONAL ACCOUNTS
include individual accounts, joint accounts, UGMA/UTMA accounts, personal
trusts, Coverdell Education Savings Accounts and IRAs (including traditional,
Roth, Rollover, SEP-, SARSEP- and SIMPLE-IRAs), and certain other retirement
accounts. If you have only business, business retirement, employer-sponsored
or American Century Brokerage accounts, you are currently not subject to this
fee. We will not charge the fee as long as you choose to manage your accounts
exclusively online. If you are subject to the Account Maintenance Fee, your
account value could be reduced by the fee amount.
HYPOTHETICAL EXAMPLE FOR COMPARISON PURPOSES
The table also provides information about hypothetical account values and
hypothetical expenses based on the actual expense ratio of each class of your
fund and an assumed rate of return of 5% per year before expenses, which is
not the actual return of a fund's share class. The hypothetical account values
and expenses may not be used to estimate the actual ending account balance or
expenses you paid for the period. You may use this information to compare the
ongoing costs of investing in your fund and other funds. To do so, compare
this 5% hypothetical example with the 5% hypothetical examples that appear in
the shareholder reports of the other funds.
- ------
7
Please note that the expenses shown in the table are meant to highlight your
ongoing costs only and do not reflect any transactional costs, such as sales
charges (loads) or redemption/exchange fees. Therefore, the table is useful in
comparing ongoing costs only, and will not help you determine the relative
total costs of owning different funds. In addition, if these transactional
costs were included, your costs would have been higher.
Ending
Beginning Account Expenses Paid
Account Value During Period* Annualized
Value 11/1/07 4/30/08 11/1/07 - 4/30/08 Expense Ratio*
Actual $1,000 $839.20 $6.86 1.50%
Hypothetical $1,000 $1,017.40 $7.52 1.50%
*Expenses are equal to the fund's annualized expense ratio listed in the table
above, multiplied by the average account value over the period, multiplied by
182, the number of days in the most recent fiscal half-year, divided by 366,
to reflect the one-half year period.
- ------
8
SCHEDULE OF INVESTMENTS
New Opportunities
APRIL 30, 2008 (UNAUDITED)
Shares Value
Common Stocks -- 99.0%
AEROSPACE & DEFENSE -- 3.9%
16,361 Alliant Techsystems Inc.(1) $ 1,795,783
37,404 Curtiss-Wright Corp. 1,776,316
53,132 Esterline Technologies Corp.(1) 2,957,327
76,724 Orbital Sciences Corp.(1) 2,064,643
------------
8,594,069
------------
AUTO COMPONENTS -- 0.7%
98,256 Exide Technologies(1) 1,433,555
------------
BEVERAGES -- 1.3%
47,128 Central European Distribution Corp.(1) 2,871,038
------------
BIOTECHNOLOGY -- 3.5%
13,705 Alexion Pharmaceuticals Inc.(1) 964,558
29,419 BioMarin Pharmaceutical Inc.(1) 1,072,617
96,040 Cubist Pharmaceuticals Inc.(1) 1,859,333
57,347 Emergent Biosolutions Inc.(1) 539,635
40,247 Martek Biosciences Corp.(1) 1,419,109
5,040 Myriad Genetics Inc.(1) 209,362
7,294 Onyx Pharmaceuticals, Inc.(1) 256,457
21,224 OSI Pharmaceuticals Inc.(1) 735,412
6,595 United Therapeutics Corp.(1) 557,278
------------
7,613,761
------------
CAPITAL MARKETS -- 1.9%
42,919 Investment Technology Group Inc.(1) 2,071,271
63,675 Waddell & Reed Financial, Inc. Cl A 2,156,035
------------
4,227,306
------------
CHEMICALS -- 5.3%
44,202 Airgas Inc. 2,127,442
48,774 Calgon Carbon Corp.(1) 695,030
60,985 Koppers Holdings Inc. 2,954,113
17,231 OM Group, Inc.(1) 943,570
43,437 SGL Carbon AG ORD(1) 2,971,876
50,599 Terra Industries Inc.(1) 1,915,678
------------
11,607,709
------------
COMMERCIAL BANKS -- 5.6%
118,247 BancorpSouth Inc. 2,841,476
23,168 First Financial Bankshares Inc. 1,042,328
95,749 FirstMerit Corp. 1,964,769
136,568 Fulton Financial Corp. 1,703,003
37,491 Hancock Holding Co. 1,547,254
Shares Value
30,440 Independent Bank Corp. $ 889,761
59,945 Oriental Financial Group 1,126,966
66,342 Sterling Bancorp 1,088,672
------------
12,204,229
------------
COMMERCIAL SERVICES & SUPPLIES -- 2.9%
22,877 Copart, Inc.(1) 934,983
39,008 FTI Consulting, Inc.(1) 2,496,512
33,456 IHS Inc. Cl A(1) 2,209,769
46,624 Knoll Inc. 607,044
------------
6,248,308
------------
CONSUMER FINANCE -- 0.8%
146,069 EZCORP, Inc. Cl A(1) 1,773,278
------------
CONTAINERS & PACKAGING -- 0.7%
24,535 Greif, Inc. Cl A 1,584,961
------------
DISTRIBUTORS -- 1.4%
42,754 DXP Enterprises Inc.(1) 1,764,458
54,300 LKQ Corp.(1) 1,181,568
------------
2,946,026
------------
DIVERSIFIED CONSUMER SERVICES -- 1.2%
43,882 DeVry Inc. 2,501,274
------------
ELECTRICAL EQUIPMENT -- 2.8%
41,945 American Superconductor Corp.(1) 1,060,370
97,141 EnerSys(1) 2,273,100
73,839 GrafTech International Ltd.(1) 1,450,936
32,307 Powell Industries, Inc.(1) 1,359,155
------------
6,143,561
------------
ELECTRONIC EQUIPMENT & INSTRUMENTS -- 2.9%
112,785 Brightpoint Inc.(1) 1,033,111
97,300 Cognex Corp. 2,451,960
26,977 FARO Technologies, Inc.(1) 950,669
13,164 Itron Inc.(1) 1,225,305
39,631 Orbotech Ltd.(1) 695,524
------------
6,356,569
------------
ENERGY EQUIPMENT & SERVICES -- 3.2%
19,661 Dril-Quip Inc.(1) 1,123,823
34,558 Exterran Holdings, Inc.(1) 2,308,129
34,329 Natural Gas Services Group Inc.(1) 854,792
255,954 Parker Drilling Co.(1) 2,052,751
9,539 W-H Energy Services Inc.(1) 737,269
------------
7,076,764
------------
FOOD & STAPLES RETAILING -- 0.9%
45,540 Andersons Inc. (The) 2,069,793
------------
- ------
9
New Opportunities
Shares Value
FOOD PRODUCTS -- 2.5%
74,864 Cosan Ltd. Cl A(1) $ 992,697
289,561 Darling International Inc.(1) 4,421,596
------------
5,414,293
------------
GAS UTILITIES -- 0.5%
22,859 Northwest Natural Gas Co. 1,025,683
------------
HEALTH CARE EQUIPMENT & SUPPLIES -- 2.9%
22,600 Kinetic Concepts Inc.(1) 896,316
75,997 Merit Medical Systems Inc.(1) 1,117,916
44,745 NuVasive, Inc.(1) 1,707,022
80,653 Zoll Medical Corp.(1) 2,692,197
------------
6,413,451
------------
HEALTH CARE PROVIDERS & SERVICES -- 2.1%
33,984 Amsurg Corp.(1) 867,951
46,572 CardioNet, Inc.(1) 1,075,813
49,876 IPC The Hospitalist Co., Inc.(1) 1,170,590
51,709 Providence Service Corp. (The)(1) 1,455,092
------------
4,569,446
------------
HOTELS, RESTAURANTS & LEISURE -- 1.4%
108,974 Burger King Holdings, Inc. 3,040,375
------------
HOUSEHOLD DURABLES -- 1.7%
97,077 Tupperware Brands Corp. 3,824,834
------------
INDUSTRIAL CONGLOMERATES -- 0.4%
12,352 Walter Industries Inc. 856,735
------------
INSURANCE -- 0.6%
208,400 Amil Participacoes SA ORD 1,266,450
------------
INTERNET & CATALOG RETAIL -- 2.0%
34,196 priceline.com Inc.(1) 4,364,777
------------
INTERNET SOFTWARE & SERVICES -- 4.6%
439,631 Art Technology Group, Inc.(1) 1,573,879
218,084 AsiaInfo Holdings, Inc.(1) 2,654,082
7,217 Equinix Inc.(1) 652,561
85,862 Switch & Data Facilities Co. Inc.(1) 1,299,951
45,767 Vocus Inc.(1) 1,271,865
136,257 Websense Inc.(1) 2,650,199
------------
10,102,537
------------
IT SERVICES -- 4.4%
46,070 CACI International Inc.(1) 2,309,028
202,534 CyberSource Corp.(1) 3,675,993
76,904 ManTech International Corp. Cl A(1) 3,673,704
------------
9,658,725
------------
Shares Value
LIFE SCIENCES TOOLS & SERVICES -- 3.7%
9,937 Illumina, Inc.(1) $ 773,993
49,477 Kendle International Inc.(1) 2,112,173
75,779 Parexel International Corp.(1) 1,924,787
122,988 PerkinElmer, Inc. 3,266,561
------------
8,077,514
------------
MACHINERY -- 3.0%
14,947 Bucyrus International, Inc. 1,882,276
12,058 Key Technology, Inc.(1) 371,628
13,317 Middleby Corp. (The)(1) 835,642
16,429 Valmont Industries, Inc. 1,617,599
43,072 Westinghouse Air Brake Technologies Corp. 1,846,927
------------
6,554,072
------------
MARINE -- 2.2%
57,710 Diana Shipping Inc. 1,752,076
39,111 Eagle Bulk Shipping Inc. 1,151,037
33,724 Kirby Corporation(1) 1,849,423
------------
4,752,536
------------
MEDIA -- 2.1%
125,369 Valassis Communications Inc.(1) 1,780,239
76,173 VisionChina Media Inc. ADR(1) 1,123,552
96,041 World Wrestling Entertainment, Inc. Cl A 1,695,124
------------
4,598,915
------------
METALS & MINING -- 0.6%
20,918 Compass Minerals International Inc. 1,317,834
------------
OIL, GAS & CONSUMABLE FUELS -- 6.8%
12,436 Alpha Natural Resources, Inc.(1) 605,011
102,092 Approach Resources Inc.(1) 1,934,643
34,967 Cabot Oil & Gas Corp. 1,992,070
30,242 Concho Resources Inc.(1) 833,772
59,005 Encore Acquisition Co.(1) 2,692,398
50,069 Forest Oil Corp.(1) 2,950,566
17,000 Foundation Coal Holdings, Inc. 1,019,660
24,500 Quicksilver Resources Inc.(1) 1,016,505
141,052 TXCO Resources, Inc.(1) 1,802,645
------------
14,847,270
------------
PERSONAL PRODUCTS -- 1.7%
62,221 American Oriental Bioengineering Inc.(1) 598,566
30,810 Herbalife Ltd. 1,348,862
57,519 Inter Parfums, Inc. 1,665,750
------------
3,613,178
------------
- ------
10
New Opportunities
Shares Value
PHARMACEUTICALS -- 1.5%
79,659 Perrigo Co. $ 3,265,222
------------
REAL ESTATE INVESTMENT TRUSTS (REITS) -- 4.3%
41,101 American Campus Communities Inc. 1,254,814
121,828 Capstead Mortgage Corp. 1,571,581
266,135 Chimera Investment Corp. 3,691,292
37,173 Hatteras Financial Corp.(1) 939,733
152,981 U-Store-It Trust 1,846,481
------------
9,303,901
------------
ROAD & RAIL -- 0.3%
21,772 J.B. Hunt Transport Services, Inc. 739,595
------------
SEMICONDUCTORS &
SEMICONDUCTOR EQUIPMENT -- 2.4%
61,859 Amkor Technology Inc.(1) 590,753
130,169 Anadigics, Inc.(1) 1,452,686
126,268 Microsemi Corp.(1) 3,093,566
------------
5,137,005
------------
SOFTWARE -- 3.3%
89,087 Lawson Software Inc.(1) 711,805
61,770 Magma Design Automation, Inc.(1) 576,314
42,438 MICROS Systems, Inc.(1) 1,512,915
100,827 NetScout Systems, Inc.(1) 1,008,270
112,904 Sybase, Inc.(1) 3,321,636
------------
7,130,940
------------
SPECIALTY RETAIL -- 2.0%
56,964 Aeropostale Inc.(1) 1,810,886
76,578 Dress Barn Inc.(1) 1,030,740
45,823 hhgregg, Inc.(1) 470,602
140,329 Pier 1 Imports, Inc.(1) 1,094,566
------------
4,406,794
------------
Shares Value
TEXTILES, APPAREL & LUXURY GOODS -- 1.0%
7,580 Deckers Outdoor Corp.(1) $ 1,046,571
82,299 Maidenform Brands, Inc.(1) 1,226,255
------------
2,272,826
------------
WATER UTILITIES -- 0.5%
94,564 Cascal N.V.(1) 1,146,116
------------
WIRELESS TELECOMMUNICATION SERVICES -- 1.5%
215,391 Syniverse Holdings, Inc.(1) 3,383,793
------------
TOTAL COMMON STOCKS
(Cost $193,756,847) 216,337,018
------------
Temporary Cash Investments -- 0.5%
Repurchase Agreement, Bank of America Securities, LLC,
(collateralized by various U.S. Treasury obligations, 0.625%,
4/15/13, valued at $1,224,748), in a joint trading account at
1.92%, dated 4/30/08, due 5/1/08 (Delivery value $1,200,064) (Cost
$1,200,000) 1,200,000
------------
TOTAL INVESTMENT SECURITIES -- 99.5%
(Cost $194,956,847) 217,537,018
------------
OTHER ASSETS AND LIABILITIES -- 0.5% 1,034,539
------------
TOTAL NET ASSETS -- 100.0% $218,571,557
============
Notes to Schedule of Investments
ADR = American Depositary Receipt
ORD = Foreign Ordinary Share
(1) Non-income producing.
See Notes to Financial Statements.
- ------
11
STATEMENT OF ASSETS AND LIABILITIES
APRIL 30, 2008 (UNAUDITED)
ASSETS
Investment securities, at value (cost of $194,956,847) $217,537,018
Cash 100,095
Receivable for investments sold 6,737,331
Dividends and interest receivable 33,809
-------------
224,408,253
-------------
LIABILITIES
Payable for investments purchased 5,571,512
Accrued management fees 265,184
-------------
5,836,696
-------------
NET ASSETS $218,571,557
=============
CAPITAL SHARES, $0.01 PAR VALUE
Authorized 300,000,000
=============
Outstanding 30,340,538
=============
NET ASSET VALUE PER SHARE $7.20
=============
NET ASSETS CONSIST OF:
Capital (par value and paid-in surplus) $277,562,373
Accumulated net investment loss (855,202)
Accumulated net realized loss on investment
and foreign currency transactions (80,715,781)
Net unrealized appreciation on investments and translation of
assets and liabilities in foreign currencies 22,580,167
-------------
$218,571,557
=============
See Notes to Financial Statements.
- ------
12
STATEMENT OF OPERATIONS
FOR THE SIX MONTHS ENDED APRIL 30, 2008 (UNAUDITED)
INVESTMENT INCOME (LOSS)
INCOME:
Dividends $ 793,788
Interest 71,289
-------------
865,077
-------------
EXPENSES:
Management fees 1,715,288
Directors' fees and expenses 2,647
Other expenses 2,344
-------------
1,720,279
-------------
NET INVESTMENT INCOME (LOSS) (855,202)
-------------
REALIZED AND UNREALIZED GAIN (LOSS)
Net realized gain (loss) on investment and
foreign currency transactions (14,211,030)
Change in net unrealized appreciation (depreciation)
on investments and translation of assets and
liabilities in foreign currencies (27,924,205)
-------------
NET REALIZED AND UNREALIZED GAIN (LOSS) (42,135,235)
-------------
NET INCREASE (DECREASE) IN NET ASSETS
RESULTING FROM OPERATIONS $(42,990,437)
=============
See Notes to Financial Statements.
- ------
13
STATEMENT OF CHANGES IN NET ASSETS
SIX MONTHS ENDED APRIL 30, 2008 (UNAUDITED) AND YEAR ENDED OCTOBER 31, 2007
Increase (Decrease) in Net Assets 2008 2007
OPERATIONS
Net investment income (loss) $ (855,202) $ (2,081,598)
Net realized gain (loss) (14,211,030) 53,831,813
Change in net unrealized
appreciation (depreciation) (27,924,205) 20,464,068
------------- -------------
Net increase (decrease) in net assets
resulting from operations (42,990,437) 72,214,283
------------- -------------
CAPITAL SHARE TRANSACTIONS
Proceeds from shares sold 7,663,607 15,958,764
Payments for shares redeemed(1) (16,530,105) (65,620,583)
------------- -------------
Net increase (decrease) in net assets
from capital share transactions (8,866,498) (49,661,819)
------------- -------------
NET INCREASE (DECREASE) IN NET ASSETS (51,856,935) 22,552,464
NET ASSETS
Beginning of period 270,428,492 247,876,028
------------- -------------
End of period $218,571,557 $270,428,492
============= =============
Accumulated net investment loss $(855,202) --
============= =============
TRANSACTIONS IN SHARES OF THE FUND
Sold 1,022,095 2,133,906
Redeemed (2,210,030) (9,110,565)
------------- -------------
Net increase (decrease) in
shares of the fund (1,187,935) (6,976,659)
============= =============
(1) Net of redemption fees of $14,916 and $11,866, respectively.
See Notes to Financial Statements.
- ------
14
NOTES TO FINANCIAL STATEMENTS
APRIL 30, 2008 (UNAUDITED)
1. ORGANIZATION AND SUMMARY OF SIGNIFICANT ACCOUNTING POLICIES
ORGANIZATION -- American Century Mutual Funds, Inc. (the corporation) is
registered under the Investment Company Act of 1940 (the 1940 Act) as an
open-end management investment company. New Opportunities Fund (the fund) is
one fund in a series issued by the corporation. The fund is diversified under
the 1940 Act. The fund's investment objective is to seek long-term capital
growth. The fund pursues its objective by investing primarily in common stocks
of smaller-sized companies that management believes will increase in value
over time. The following is a summary of the fund's significant accounting
policies.
SECURITY VALUATIONS -- Securities traded primarily on a principal securities
exchange are valued at the last reported sales price, or at the mean of the
latest bid and asked prices where no last sales price is available. Depending
on local convention or regulation, securities traded over-the-counter are
valued at the mean of the latest bid and asked prices, the last sales price,
or the official close price. Debt securities not traded on a principal
securities exchange are valued through a commercial pricing service or at the
mean of the most recent bid and asked prices. Discount notes may be valued
through a commercial pricing service or at amortized cost, which approximates
fair value. Securities traded on foreign securities exchanges and
over-the-counter markets are normally completed before the close of business
on days that the New York Stock Exchange (the Exchange) is open and may also
take place on days when the Exchange is not open. If an event occurs after the
value of a security was established but before the net asset value per share
was determined that was likely to materially change the net asset value, that
security would be valued as determined in accordance with procedures adopted
by the Board of Directors. If the fund determines that the market price of a
portfolio security is not readily available, or that the valuation methods
mentioned above do not reflect the security's fair value, such security is
valued as determined by the Board of Directors or its designee, in accordance
with procedures adopted by the Board of Directors, if such determination would
materially impact a fund's net asset value. Certain other circumstances may
cause the fund to use alternative procedures to value a security such as: a
security has been declared in default; trading in a security has been halted
during the trading day; or there is a foreign market holiday and no trading
will commence.
SECURITY TRANSACTIONS -- For financial reporting purposes, security
transactions are accounted for as of the trade date. Net realized gains and
losses are determined on the identified cost basis, which is also used for
federal income tax purposes.
INVESTMENT INCOME -- Dividend income less foreign taxes withheld, if any, is
recorded as of the ex-dividend date. Interest income is recorded on the
accrual basis and includes accretion of discounts and amortization of premiums.
FOREIGN CURRENCY TRANSACTIONS -- All assets and liabilities initially
expressed in foreign currencies are translated into U.S. dollars at prevailing
exchange rates at period end. Purchases and sales of investment securities,
dividend and interest income, and certain expenses are translated at the rates
of exchange prevailing on the respective dates of such transactions. For
assets and liabilities, other than investments in securities, net realized and
unrealized gains and losses from foreign currency translations arise from
changes in currency exchange rates.
Net realized and unrealized foreign currency exchange gains or losses
occurring during the holding period of investment securities are a component
of realized gain (loss) on investment transactions and unrealized appreciation
(depreciation) on investments, respectively. Certain countries may impose
taxes on the contract amount of purchases and sales of foreign currency
contracts in their currency. The fund records the foreign tax expense, if any,
as a reduction to the net realized gain (loss) on foreign currency
transactions.
REPURCHASE AGREEMENTS -- The fund may enter into repurchase agreements with
institutions that American Century Investment Management, Inc. (ACIM) (the
investment advisor) has determined are creditworthy pursuant to criteria
adopted by the Board of Directors. Each repurchase agreement is recorded at
cost. The fund requires that the collateral, represented by securities,
received in a repurchase transaction be transferred to the custodian in a
manner sufficient to enable the fund to obtain those securities in the event
of a default under the repurchase agreement. ACIM monitors, on a daily basis,
the securities transferred to ensure the value, including accrued interest, of
the securities under each repurchase agreement is equal to or greater than
amounts owed to the fund under each repurchase agreement.
- ------
15
JOINT TRADING ACCOUNT -- Pursuant to an Exemptive Order issued by the
Securities and Exchange Commission, the fund, along with other registered
investment companies having management agreements with ACIM or American
Century Global Investment Management, Inc. (ACGIM), may transfer uninvested
cash balances into a joint trading account. These balances are invested in one
or more repurchase agreements that are collateralized by U.S. Treasury or
Agency obligations.
EXCHANGE TRADED FUNDS -- The fund may invest in exchange traded funds (ETFs).
ETFs are a type of index fund bought and sold on a securities exchange. An ETF
trades like common stock and represents a fixed portfolio of securities
designed to track the performance and dividend yield of a particular domestic
or foreign market index. A fund may purchase an ETF to temporarily gain
exposure to a portion of the U.S. or a foreign market while awaiting purchase
of underlying securities. The risks of owning an ETF generally reflect the
risks of owning the underlying securities they are designed to track, although
the lack of liquidity on an ETF could result in it being more volatile.
Additionally, ETFs have management fees, which increase their cost.
INCOME TAX STATUS -- It is the fund's policy to distribute substantially all
net investment income and net realized gains to shareholders and to otherwise
qualify as a regulated investment company under provisions of the Internal
Revenue Code. The fund is no longer subject to examination by tax authorities
for years prior to 2004. At this time, management has not identified any
uncertain tax positions for which it is reasonably possible that the total
amounts of unrecognized tax benefits will significantly change in the next
twelve months. Accordingly, no provision has been made for federal or state
income taxes. Interest and penalties associated with any federal or state
income tax obligations, if any, are recorded as interest expense.
DISTRIBUTIONS TO SHAREHOLDERS -- Distributions to shareholders are recorded on
the ex-dividend date. Distributions from net investment income and net
realized gains, if any, are generally declared and paid annually.
REDEMPTION -- The fund may impose a 2.00% redemption fee on shares held less
than 180 days. The redemption fee is recorded as a reduction in the cost of
shares redeemed. The redemption fee is retained by the fund and helps cover
transaction costs that long-term investors may bear when a fund sells
securities to meet investor redemptions.
INDEMNIFICATIONS -- Under the corporation's organizational documents, its
officers and directors are indemnified against certain liabilities arising out
of the performance of their duties to the fund. In addition, in the normal
course of business, the fund enters into contracts that provide general
indemnifications. The fund's maximum exposure under these arrangements is
unknown as this would involve future claims that may be made against the fund.
The risk of material loss from such claims is considered by management to be
remote.
USE OF ESTIMATES -- The financial statements are prepared in conformity with
accounting principles generally accepted in the United States of America,
which may require management to make certain estimates and assumptions at the
date of the financial statements. Actual results could differ from these
estimates.
2. FEES AND TRANSACTIONS WITH RELATED PARTIES
MANAGEMENT FEES -- The corporation has entered into a Management Agreement
with ACIM, under which ACIM provides the fund with investment advisory and
management services in exchange for a single, unified management fee (the
fee). The Agreement provides that all expenses of the fund, except brokerage
commissions, taxes, interest, fees and expenses of those directors who are not
considered "interested persons" as defined in the 1940 Act (including counsel
fees) and extraordinary expenses, will be paid by ACIM. The fee is computed
and accrued daily based on the daily net assets of the fund and paid monthly
in arrears. For funds with a stepped fee schedule, the rate of the fee is
determined by applying a fee rate calculation formula. This formula takes into
account all of the investment advisor's assets under management in the fund's
investment strategy (strategy assets) to calculate the appropriate fee rate
for the fund. The strategy assets include the fund's assets and the assets of
other clients of the investment advisor that are not in the American Century
family of funds, but that have the same investment team and investment
strategy. The annual management fee schedule for the fund ranges from 1.10% to
1.50%. The effective annual management fee for the fund for the six months
ended April 30, 2008 was 1.50%.
- ------
16
RELATED PARTIES -- Certain officers and directors of the corporation are also
officers and/or directors, and, as a group, controlling stockholders of
American Century Companies, Inc. (ACC), the parent of the corporation's
investment advisor, ACIM, the distributor of the corporation, American Century
Investment Services, Inc., and the corporation's transfer agent, American
Century Services, LLC.
The fund is eligible to invest in a money market fund for temporary purposes,
which is managed by J.P. Morgan Investment Management, Inc. (JPMIM). JPMIM is
a wholly owned subsidiary of JPMorgan Chase & Co. (JPM). JPM is an equity
investor in ACC. Prior to December 12, 2007, the fund had a bank line of
credit agreement with JPMorgan Chase Bank (JPMCB). JPMCB is a custodian of the
fund and a wholly owned subsidiary of JPM.
3. INVESTMENT TRANSACTIONS
Purchases and sales of investment securities, excluding short-term
investments, for the six months ended April 30, 2008, were $178,294,928 and
$179,174,960, respectively.
4. BANK LINE OF CREDIT
Effective December 12, 2007, the fund, along with certain other funds managed
by ACIM or ACGIM, has a $500,000,000 unsecured bank line of credit agreement
with Bank of America, N.A. Prior to December 12, 2007, the fund, along with
certain other funds managed by ACIM or ACGIM, had a $500,000,000 unsecured
bank line of credit agreement with JPMCB. The fund may borrow money for
temporary or emergency purposes to fund shareholder redemptions. Borrowings
under the agreement, which is subject to annual renewal, bear interest at the
Federal Funds rate plus 0.40%. The fund did not borrow from the line during
the six months ended April 30, 2008.
5. RISK FACTORS
The fund concentrates its investments in common stocks of small companies.
Because of this, the fund may be subject to greater risk and market
fluctuations than a fund investing in larger, more established companies. The
fund's investment process may result in high portfolio turnover, high
commission costs and high capital gains distributions. In addition, its
investment approach may involve higher volatility and risk. The fund's
performance may be affected by investments in initial public offerings (IPOs).
The impact of IPOs on a fund's performance depends on the strength of the IPO
market and the size of the fund. IPOs may have less impact on a fund's
performance as its assets grow.
6. FEDERAL TAX INFORMATION
The book-basis character of distributions made during the year from net
investment income or net realized gains may differ from their ultimate
characterization for federal income tax purposes. These differences reflect
the differing character of certain income items and net realized gains and
losses for financial statement and tax purposes, and may result in
reclassification among certain capital accounts on the financial statements.
As of April 30, 2008, the components of investments for federal income tax
purposes were as follows:
Federal tax cost of investments $195,189,220
=============
Gross tax appreciation of investments $27,991,558
Gross tax depreciation of investments (5,643,760)
-------------
Net tax appreciation (depreciation) of investments $22,347,798
=============
The difference between book-basis and tax-basis cost and unrealized
appreciation (depreciation) is attributable primarily to the tax deferral of
losses on wash sales.
As of October 31, 2007, the fund had accumulated capital losses of $(66,365),
which represent net capital loss carryovers that may be used to offset future
realized capital gains for federal income tax purposes. Capital loss
carryovers of $(28,666) and $(37,699) expire in 2008 and 2009, respectively.
- ------
17
7. RECENTLY ISSUED ACCOUNTING STANDARDS
The Financial Accounting Standards Board (FASB) issued Statement of Financial
Accounting Standards No. 157, "Fair Value Measurements" (FAS 157), in
September 2006, which is effective for fiscal years beginning after November
15, 2007. FAS 157 defines fair value, establishes a framework for measuring
fair value and expands the required financial statement disclosures about fair
value measurements. Management is currently evaluating the impact that
adopting FAS 157 will have on the financial statement disclosures.
In March 2008, the FASB issued Statement of Financial Accounting Standards No.
161, "Disclosures about Derivative Instruments and Hedging Activities -- an
amendment of FASB Statement No. 133" (FAS 161). FAS 161 is effective for
fiscal years beginning after November 15, 2008. FAS 161 amends and expands
disclosures about derivative instruments and hedging activities. FAS 161
requires qualitative disclosures about the objectives and strategies of
derivative instruments, quantitative disclosures about the fair value amounts
of and gains and losses on derivative instruments, and disclosures of
credit-risk-related contingent features in hedging activities. Management is
currently evaluating the impact that adopting FAS 161 will have on the
financial statement disclosures.
- ------
18
FINANCIAL HIGHLIGHTS
New Opportunities
For a Share Outstanding Throughout the Years Ended October 31 (except as noted)
2008(1) 2007 2006 2005 2004 2003
PER-SHARE DATA
Net Asset Value,
Beginning of Period $8.58 $6.44 $5.63 $5.06 $5.06 $4.01
-------- -------- -------- -------- -------- --------
Income From
Investment Operations
Net Investment
Income (Loss) (0.03) (0.07) (0.06) (0.06) (0.06) (0.04)
Net Realized
and Unrealized
Gain (Loss) (1.35) 2.21 0.87 0.63 0.06 1.09
-------- -------- -------- -------- -------- --------
Total From
Investment
Operations (1.38) 2.14 0.81 0.57 -- 1.05
-------- -------- -------- -------- -------- --------
Net Asset Value,
End of Period $7.20 $8.58 $6.44 $5.63 $5.06 $5.06
======== ======== ======== ======== ======== ========
TOTAL RETURN(2) (16.08)% 33.23% 14.39% 11.26% 0.00% 26.18%
RATIOS/SUPPLEMENTAL DATA
Ratio of Operating
Expenses to Average
Net Assets 1.50%(3) 1.50% 1.50% 1.50% 1.49% 1.50%
Ratio of Net
Investment
Income (Loss)
to Average
Net Assets (0.75)%(3) (0.83)% (0.84)% (0.98)% (1.04)% (0.98)%
Portfolio Turnover
Rate 79% 201% 298% 260% 269% 217%
Net Assets,
End of Period
(in thousands) $218,572 $270,428 $247,876 $240,464 $273,555 $318,226
(1) For the six months ended April 30, 2008 (unaudited).
(2) Total return assumes reinvestment of net investment income and capital
gains distributions, if any. Total returns for periods less than one year are
not annualized.
(3) Annualized
See Notes to Financial Statements.
- ------
19
ADDITIONAL INFORMATION
RETIREMENT ACCOUNT INFORMATION
As required by law, any distributions you receive from an IRA or certain
403(b), 457 and qualified plans [those not eligible for rollover to an IRA or
to another qualified plan] are subject to federal income tax withholding,
unless you elect not to have withholding apply. Tax will be withheld on the
total amount withdrawn even though you may be receiving amounts that are not
subject to withholding, such as nondeductible contributions. In such case,
excess amounts of withholding could occur. You may adjust your withholding
election so that a greater or lesser amount will be withheld.
If you don't want us to withhold on this amount, you must notify us to not
withhold the federal income tax. Even if you plan to roll over the amount you
withdraw to another tax-deferred account, the withholding rate still applies
to the withdrawn amount unless we have received notice not to withhold federal
income tax prior to the withdrawal. You may notify us in writing or in certain
situations by telephone or through other electronic means. You have the right
to revoke your withholding election at any time and any election you make may
remain in effect until revoked by filing a new election.
Remember, even if you elect not to have income tax withheld, you are liable
for paying income tax on the taxable portion of your withdrawal. If you elect
not to have income tax withheld or you don't have enough income tax withheld,
you may be responsible for payment of estimated tax. You may incur penalties
under the estimated tax rules if your withholding and estimated tax payments
are not sufficient.
State tax will be withheld if, at the time of your distribution, your address
is within one of the mandatory withholding states and you have federal income
tax withheld. State taxes will be withheld from your distribution in
accordance with the respective state rules.
PROXY VOTING GUIDELINES
American Century Investment Management, Inc., the fund's investment advisor,
is responsible for exercising the voting rights associated with the securities
purchased and/or held by the fund. A description of the policies and
procedures the advisor uses in fulfilling this responsibility is available
without charge, upon request, by calling 1-800-345-2021. It is also available
on American Century Investments' website at americancentury.com and on the
Securities and Exchange Commission's website at sec.gov. Information regarding
how the investment advisor voted proxies relating to portfolio securities
during the most recent 12-month period ended June 30 is available on the
"About Us" page at americancentury.com. It is also available at sec.gov.
QUARTERLY PORTFOLIO DISCLOSURE
The fund files its complete schedule of portfolio holdings with the Securities
and Exchange Commission (SEC) for the first and third quarters of each fiscal
year on Form N-Q. The fund's Form N-Q is available on the SEC's website at
sec.gov, and may be reviewed and copied at the SEC's Public Reference Room in
Washington, DC. Information on the operation of the Public Reference Room may
be obtained by calling 1-800-SEC-0330. The fund also makes its complete
schedule of portfolio holdings for the most recent quarter of its fiscal year
available on its website at americancentury.com and, upon request, by calling
1-800-345-2021.
- ------
20
INDEX DEFINITIONS
The following indices are used to illustrate investment market, sector, or
style performance or to serve as fund performance comparisons. They are not
investment products available for purchase.
The RUSSELL 1000® INDEX is a market-capitalization weighted, large-cap index
created by Frank Russell Company to measure the performance of the 1,000
largest of the 3,000 largest publicly traded U.S. companies, based on total
market capitalization.
The RUSSELL 1000® GROWTH INDEX measures the performance of those Russell 1000
Index companies (the 1,000 largest of the 3,000 largest publicly traded U.S.
companies, based on total market capitalization) with higher price-to-book
ratios and higher forecasted growth values.
The RUSSELL 1000® VALUE INDEX measures the performance of those Russell 1000
Index companies (the 1,000 largest of the 3,000 largest publicly traded U.S.
companies, based on total market capitalization) with lower price-to-book
ratios and lower forecasted growth values.
The RUSSELL 2000® INDEX is a market-capitalization weighted index created by
Frank Russell Company to measure the performance of the 2,000 smallest of the
3,000 largest publicly traded U.S. companies, based on total market
capitalization.
The RUSSELL 2000® GROWTH INDEX measures the performance of those Russell 2000
Index companies (the 2,000 smallest of the 3,000 largest publicly traded U.S.
companies, based on total market capitalization) with higher price-to-book
ratios and higher forecasted growth values.
The RUSSELL 2000® VALUE INDEX measures the performance of those Russell 2000
Index companies (the 2,000 smallest of the 3,000 largest publicly traded U.S.
companies, based on total market capitalization) with lower price-to-book
ratios and lower forecasted growth values.
The RUSSELL MIDCAP® INDEX measures the performance of the 800 smallest of the
1,000 largest publicly traded U.S. companies, based on total market
capitalization.
The RUSSELL MIDCAP® GROWTH INDEX measures the performance of those Russell
Midcap Index companies (the 800 smallest of the 1,000 largest publicly traded
U.S. companies, based on total market capitalization) with higher
price-to-book ratios and higher forecasted growth values.
The RUSSELL MIDCAP® VALUE INDEX measures the performance of those Russell
Midcap Index companies (the 800 smallest of the 1,000 largest publicly traded
U.S. companies, based on total market capitalization) with lower price-to-book
ratios and lower forecasted growth values.
- ------
21
NOTES
- ------
22
NOTES
- ------
23
NOTES
- ------
24
[back cover]
[american century investments logo and text logo ®]
CONTACT US
AMERICANCENTURY.COM
AUTOMATED INFORMATION LINE . . . . . . . . . . . . . . . 1-800-345-8765
INVESTOR SERVICES REPRESENTATIVE . . . . . . . . . . . . 1-800-345-2021 or
816-531-5575
BUSINESS, NOT-FOR-PROFIT, EMPLOYER-SPONSORED
RETIREMENT PLANS . . . . . . . . . . . . . . . . . . . . 1-800-345-3533
BANKS AND TRUST COMPANIES, BROKER-DEALERS,
FINANCIAL PROFESSIONALS, INSURANCE COMPANIES . . . . . . 1-800-345-6488
TELECOMMUNICATIONS DEVICE FOR THE DEAF . . . . . . . . . 1-800-634-4113
AMERICAN CENTURY MUTUAL FUNDS, INC.
INVESTMENT ADVISOR:
American Century Investment Management, Inc.
Kansas City, Missouri
This report and the statements it contains are submitted for the general
information of our shareholders. The report is not authorized for distribution to
prospective investors unless preceded or accompanied by an effective prospectus.
American Century Investments
P.O. Box 419200
Kansas City, MO 64141-6200
PRSRT STD
U.S. POSTAGE PAID
AMERICAN CENTURY
COMPANIES
American Century Investment Services, Inc., Distributor
©2008 American Century Proprietary Holdings, Inc. All rights reserved.
0806
CL-SAN-60501S
[front cover]
SEMIANNUAL REPORT
APRIL 30, 2008
[american century investments logo and text logo ®]
AMERICAN CENTURY INVESTMENTS
BALANCED FUND
PRESIDENT'S LETTER
JONATHAN THOMAS
[photo of Jonathan Thomas]
Dear Investor,
At American Century Investments®, we are committed to helping you reach your
financial goals. Your success is the ultimate measure of our performance.
That's why we focus on achieving superior investment results and building
long-term relationships with investors like you.
Part of that relationship is to clearly communicate investment results and
what influenced them. To help you monitor your investment with us, we take
pride in providing you with the semiannual report for the American Century®
Balanced Fund for the six months ended April 30, 2008. We also recommend
americancentury.com, where we provide company news, quarterly portfolio
commentaries, investment views, and other useful information.
As noted on the website, 2008 marks the 50th anniversary of American Century
Investments. Since 1958, we've worked to make wise decisions with your
interests as our guide. Fifty years also means that we've met the challenges
of previous economic downturns. As we've crossed those hurdles and earned your
trust, our assets under management have grown to nearly $100 billion, putting
us in the top 5% of our industry. This growth has given us the resources to
offer a wide array of financial products and services, including a
well-diversified line-up of portfolios that provide you with many choices in
these uncertain times.
Though our offerings are diverse, they share several key qualities, including
our disciplined investment approach and active, team-based management. Strict
adherence to our processes and long-term strategies allows us to stay focused
during volatile periods. Investors in our portfolios also benefit from the sum
of our investment teams' expertise as they share research and information.
We'll continue to work hard to earn your trust. Thank you for your continued
support.
Sincerely,
/s/Jonathan Thomas
Jonathan S. Thomas
President and Chief Executive Officer
American Century Investments
TABLE OF CONTENTS
Market Perspective. . . . . . . . . . . . . . . . . . . . . . . . . . 2
U.S Market Returns . . . . . . . . . . . . . . . . . . . . . . . . . 2
BALANCED
Performance . . . . . . . . . . . . . . . . . . . . . . . . . . . . . 3
Portfolio Commentary. . . . . . . . . . . . . . . . . . . . . . . . . 5
Top Ten Stock Holdings . . . . . . . . . . . . . . . . . . . . . . . 5
Top Five Stock Industries. . . . . . . . . . . . . . . . . . . . . . 5
Key Fixed-Income Portfolio Statistics. . . . . . . . . . . . . . . . 6
Types of Investments in Portfolio. . . . . . . . . . . . . . . . . . 6
Shareholder Fee Example . . . . . . . . . . . . . . . . . . . . . . . 7
Schedule of Investments . . . . . . . . . . . . . . . . . . . . . . . 9
FINANCIAL STATEMENTS
Statement of Assets and Liabilities . . . . . . . . . . . . . . . . . 21
Statement of Operations . . . . . . . . . . . . . . . . . . . . . . . 22
Statement of Changes in Net Assets. . . . . . . . . . . . . . . . . . 23
Notes to Financial Statements . . . . . . . . . . . . . . . . . . . . 24
Financial Highlights. . . . . . . . . . . . . . . . . . . . . . . . . 29
OTHER INFORMATION
Additional Information. . . . . . . . . . . . . . . . . . . . . . . . 31
Index Definitions . . . . . . . . . . . . . . . . . . . . . . . . . . 32
The opinions expressed in the Market Perspective and the Portfolio Commentary
reflect those of the portfolio management team as of the date of the report,
and do not necessarily represent the opinions of American Century or any other
person in the American Century organization. Any such opinions are subject to
change at any time based upon market or other conditions and American Century
disclaims any responsibility to update such opinions. These opinions may not
be relied upon as investment advice and, because investment decisions made by
American Century funds are based on numerous factors, may not be relied upon
as an indication of trading intent on behalf of any American Century fund.
Security examples are used for representational purposes only and are not
intended as recommendations to purchase or sell securities. Performance
information for comparative indices and securities is provided to American
Century by third party vendors. To the best of American Century's knowledge,
such information is accurate at the time of printing.
MARKET PERSPECTIVE
[photo of Chief Investment Officer]
By John Schniedwind, Chief Investment Officer, Quantitative Equity
ROUGH SAILING FOR STOCKS
U.S. stocks fell for the six months ended April 30, 2008, as financial market
volatility increased considerably. Losses from the meltdown in the subprime
lending industry and liquidity crunch in the credit markets were more
pervasive and substantial than originally anticipated. Tighter lending
standards brought an end to the easy credit that fueled the merger and
leveraged buy-out boom of the past few years, and the economy threatened to
tip into recession amid sluggish job growth and weaker consumer spending.
The Federal Reserve (the Fed) responded aggressively, cutting short-term
interest rates five times during the six-month period and injecting liquidity
into the financial system to provide some relief to the credit markets. But
the Fed's game plan was complicated by persistently high energy and food
prices, which led to concerns about rising inflation.
Stocks fell steadily through mid-March, but then recovered somewhat over the
last six weeks of the period as improving economic data and
better-than-expected first-quarter earnings reports helped ease some of the
market's economic and credit fears.
BONDS ADVANCED
In contrast to the stock market's swoon, the U.S. bond market enjoyed positive
returns for the six-month period. Bonds continued to attract investor demand
amid the worsening credit crunch and recession fears. The Fed's interest rate
cuts -- lowering the federal funds rate from 4.5% to 2.0%, its lowest level
since December 2004 -- also boosted the bond market.
Short-term bonds benefited the most from the Fed's rate cuts. The two-year
Treasury note yield fell from 3.95% to 2.29% for the six months, though it
fell as low as 1.35% in mid-March. The decline in longer-term yields was more
modest -- the 10-year Treasury bond yield slid from 4.47% to 3.77% --
reflecting the inflation concerns sparked by record-high energy and commodity
prices.
Increased demand for high-quality bonds contributed to the outperformance of
Treasury and government agency bonds, as well as higher-quality
mortgage-backed securities. The upheaval in the credit markets weighed on
corporate bonds, which posted the weakest returns during the period.
U.S. Market Returns
For the six months ended April 30, 2008*
STOCK INDICES
Russell 1000 Index (large-cap) -9.54%
Russell Midcap Index -8.77%
Russell 2000 Index (small-cap) -12.92%
CITIGROUP U.S. BOND MARKET INDICES
Broad Investment-Grade (multi-sector) 4.43%
Treasury 5.84%
Agency 5.43%
Mortgage (mortgage-backed) 4.66%
Credit (investment-grade corporate) 2.20%
*Total returns for periods less than one year are not annualized.
- ------
2
PERFORMANCE
Balanced
Total Returns as of April 30, 2008
Average Annual Returns
6 10 Since Inception
months(1) 1 year 5 years years Inception Date
INVESTOR CLASS -3.64% -1.12% 8.20% 4.52% 8.62% 10/20/88
BLENDED INDEX(2) -4.08% 0.20% 8.28% 5.07% 9.80%(3) --
S&P 500 INDEX(4) -9.64% -4.68% 10.62% 3.89% 10.98%(3) --
CITIGROUP US BROAD
INVESTMENT-GRADE
BOND INDEX 4.43% 7.36% 4.53% 6.03% 7.45%(3) --
Institutional Class -3.48% -0.86% 8.41% -- 3.52% 5/1/00
(1) Total returns for periods less than one year are not annualized.
(2) See Index Definitions page.
(3) Since 10/31/88, the date nearest the Investor Class's inception for which
data are available.
(4) Data provided by Lipper Inc. - A Reuters Company. ©2008 Reuters. All
rights reserved. Any copying, republication or redistribution of Lipper
content, including by caching, framing or similar means, is expressly
prohibited without the prior written consent of Lipper. Lipper shall not be
liable for any errors or delays in the content, or for any actions taken in
reliance thereon.
The data contained herein has been obtained from company reports, financial
reporting services, periodicals and other resources believed to be reliable.
Although carefully verified, data on compilations is not guaranteed by Lipper
and may be incomplete. No offer or solicitations to buy or sell any of the
securities herein is being made by Lipper.
Data presented reflect past performance. Past performance is no guarantee of
future results. Current performance may be higher or lower than the
performance shown. Investment return and principal value will fluctuate, and
redemption value may be more or less than original cost. To obtain performance
data current to the most recent month end, please call 1-800-345-2021 or visit
americancentury.com. As interest rates rise, bond values will decline.
International investing involves special risks, such as political instability
and currency fluctuations.
Unless otherwise indicated, performance reflects Investor Class shares;
performance for other share classes will vary due to differences in fee
structure. For information about other share classes available, please consult
the prospectus. Data assumes reinvestment of dividends and capital gains, and
none of the charts reflect the deduction of taxes that a shareholder would pay
on fund distributions or the redemption of fund shares. Returns for the
indices are provided for comparison. The fund's total returns include
operating expenses (such as transaction costs and management fees) that reduce
returns, while the total returns of the indices do not.
- ------
3
Balanced
Growth of $10,000 Over 10 Years
$10,000 investment made April 30, 1998
One-Year Returns Over 10 Years
Periods ended April 30
1999 2000 2001 2002 2003 2004 2005 2006 2007 2008
Investor Class 10.05% 8.16% -4.25% -5.14% -2.95% 14.98% 7.23% 9.43% 11.20% -1.12%
Blended index 16.04% 6.76% -3.14% -4.54% -3.83% 14.17% 6.07% 9.40% 12.11% 0.20%
S&P 500 Index 21.82% 10.13% -12.97% -12.63% -13.31% 22.88% 6.34% 15.42% 15.24% -4.68%
Citigroup
US Broad
Investment-Grade
Bond Index 6.30% 1.17% 12.38% 7.85% 10.45% 1.88% 5.39% 0.78% 7.41% 7.36%
Data presented reflect past performance. Past performance is no guarantee of
future results. Current performance may be higher or lower than the
performance shown. Investment return and principal value will fluctuate, and
redemption value may be more or less than original cost. To obtain performance
data current to the most recent month end, please call 1-800-345-2021 or visit
americancentury.com. As interest rates rise, bond values will decline.
International investing involves special risks, such as political instability
and currency fluctuations.
Unless otherwise indicated, performance reflects Investor Class shares;
performance for other share classes will vary due to differences in fee
structure. For information about other share classes available, please consult
the prospectus. Data assumes reinvestment of dividends and capital gains, and
none of the charts reflect the deduction of taxes that a shareholder would pay
on fund distributions or the redemption of fund shares. Returns for the
indices are provided for comparison. The fund's total returns include
operating expenses (such as transaction costs and management fees) that reduce
returns, while the total returns of the indices do not.
- ------
4
PORTFOLIO COMMENTARY
Balanced
Equity Portfolio Managers: Bill Martin and Tom Vaiana
Fixed-Income Portfolio Managers: Dave MacEwen, Bob Gahagan, Jeff Houston,
Hando Aguilar, Brian Howell, John Walsh, Dan Schiffman, Jim Platz, and Seth
Plunkett
PERFORMANCE SUMMARY
Balanced returned -3.64%* for the six months ended April 30, 2008, compared
with the -4.08% return of its benchmark (a blended index consisting of 60% S&P
500 Index and 40% Citigroup US Broad Investment-Grade [BIG] Bond Index).
The negative returns for both the fund and its performance benchmark reflected
a sharp decline in stocks and positive results for bonds. However, the fund
held up better as both the equity and fixed-income portions of the portfolio
outperformed their respective components in the benchmark. (It's worth noting
that the fund's results reflected operating expenses, while the benchmark's
return did not.)
STOCK COMPONENT OUTPERFORMED
Balanced's stock portfolio declined for the six-month period but outpaced the
S&P 500 thanks to favorable stock selection in six of ten market sectors.
The bulk of the outperformance came from the portfolio's financials and
materials stocks. The top contributor in the financials sector was investment
bank JPMorgan Chase, which was rewarded for buying competitor Bear Stearns
when it was on the brink of bankruptcy. Chemicals stocks were responsible for
the bulk of the outperformance in the materials sector, led by agricultural
chemicals maker Mosaic, which produces fertilizer and its raw materials.
Mosaic benefited from strong demand for agricultural products and rising
commodity prices.
The health care sector generated mixed results. Medical instruments maker
Becton Dickinson performed well, reporting solid earnings as cost management
efforts helped offset higher raw materials prices. However, health care
services provider Humana was the portfolio's biggest individual detractor. The
company lowered its earnings forecast for 2008, citing higher-than-expected
costs in its Medicare prescription drug program.
Holdings in the consumer and energy sectors detracted from relative
performance. Among consumer stocks, satellite television provider DISH Network
was the most significant detractor, falling as subscriber growth decreased
sharply. In the energy
Balanced's Top Ten Stock Holdings as of April 30, 2008
% of equity % of S&P 500
holdings Index
Exxon Mobil Corp. 5.5% 4.1%
International Business
Machines Corp. 2.7% 1.4%
Johnson & Johnson 2.6% 1.6%
JPMorgan Chase & Co. 2.6% 1.3%
ConocoPhillips 2.4% 1.1%
Hewlett-Packard Co. 2.0% 1.0%
General Electric Co. 1.8% 2.7%
AT&T Inc. 1.8% 1.9%
Microsoft Corp. 1.8% 1.9%
McDonald's Corp. 1.7% 0.6%
Balanced's Top Five Stock Industries as of April 30, 2008
% of equity % of S&P 500
holdings Index
Oil, Gas & Consumable Fuels 11.9% 11.1%
IT Services 5.9% 2.3%
Pharmaceuticals 5.3% 5.9%
Computers & Peripherals 4.5% 3.1%
Specialty Retail 3.9% 1.6%
*All fund returns referenced in this commentary are for Investor Class shares.
Total returns for periods less than one year are not annualized.
- ------
5
Balanced
sector, the underperformance stemmed from underweight positions in energy
production companies that focus on natural gas.
FIXED-INCOME BOOSTED RESULTS
The portfolio's bond component enjoyed positive performance for the six-month
period, outperforming the Citigroup BIG Index.
Several factors contributed to the bond component's outperformance of its
benchmark. An overweight position in Treasury bonds and an underweight
position in corporate bonds added value as Treasury securities outperformed
corporate bonds by a considerable margin. We also avoided exposure to
subprime-related securities.
The bond portion was positioned to benefit from a steeper yield curve -- that
is, when the gap between short- and long-term interest rates widens. This
strategy paid off as the gap between the yields of the two-year and ten-year
Treasury securities widened from about 50 basis points (0.50% -- a basis point
equals 0.01%) to nearly 150 basis points during the six-month period.
The portfolio held modest positions in municipal bonds and Treasury
inflation-protected securities (TIPS), both of which contributed favorably to
performance. Problems among municipal bond insurers caused municipal bond
yields to rise substantially, providing a temporary window of opportunity.
TIPS benefited from persistently high energy and commodity prices.
More recently, we have pared back our overweight position in Treasury bonds
after their strong performance over the past 12 months. Instead, we have
looked for bargains among downtrodden segments of the market, adding
selectively to our holdings of corporate and mortgage-backed securities.
OUTLOOK
The stock and bond markets are likely to face more volatility in the coming
months. Although signs of modest economic improvement surfaced toward the end
of the six-month period, it is a small step on the long road to a meaningful
recovery. In addition, it is not clear whether we've seen the worst of the
subprime fallout or an upper boundary on commodity prices, both of which
represent further challenges for the economy, the credit markets, and the
Federal Reserve.
Our focus will remain on our disciplined investment approach, which will allow
us to take advantage of investment opportunities that may arise in this
uncertain market environment.
Key Fixed-Income Portfolio Statistics
As of As of
4/30/08 10/31/07
Weighted Average Maturity 4.2 years 4.5 years
Average Duration (Effective) 4.7 years 5.0 years
Types of Investments in Portfolio
% of fund % of fund
investments investments
as of as of
4/30/08 10/31/07
Common Stocks 50.8% 52.8%
Mortgage- & Asset-Backed Securities 21.5% 18.2%
Corporate Bonds 8.2% 5.8%
U.S. Treasury Securities 8.2% 9.0%
Municipals Securities 1.8% 0.1%
U.S. Government Agency Securities 0.2% 2.4%
Sovereign Goernments & Agencies 0.1% 0.1%
Temporary Cash Investments 2.7% 1.7%
Temporary Cash Investments -
Securities Lending Collateral 6.5% 9.9%
- ------
6
SHAREHOLDER FEE EXAMPLE (UNAUDITED)
Fund shareholders may incur two types of costs: (1) transaction costs,
including sales charges (loads) on purchase payments and redemption/exchange
fees; and (2) ongoing costs, including management fees; distribution and
service (12b-1) fees; and other fund expenses. This example is intended to
help you understand your ongoing costs (in dollars) of investing in your fund
and to compare these costs with the ongoing cost of investing in other mutual
funds.
The example is based on an investment of $1,000 made at the beginning of the
period and held for the entire period from November 1, 2007 to April 30, 2008.
ACTUAL EXPENSES
The table provides information about actual account values and actual expenses
for each class. You may use the information, together with the amount you
invested, to estimate the expenses that you paid over the period. First,
identify the share class you own. Then simply divide your account value by
$1,000 (for example, an $8,600 account value divided by $1,000 = 8.6), then
multiply the result by the number under the heading "Expenses Paid During
Period" to estimate the expenses you paid on your account during this period.
If you hold Investor Class shares of any American Century fund, or
Institutional Class shares of the American Century Diversified Bond Fund, in
an American Century account (i.e., not a financial intermediary or retirement
plan account), American Century may charge you a $12.50 semiannual account
maintenance fee if the value of those shares is less than $10,000. We will
redeem shares automatically in one of your accounts to pay the $12.50 fee. In
determining your total eligible investment amount, we will include your
investments in all PERSONAL ACCOUNTS (including American Century Brokerage
accounts) registered under your Social Security number. PERSONAL ACCOUNTS
include individual accounts, joint accounts, UGMA/UTMA accounts, personal
trusts, Coverdell Education Savings Accounts and IRAs (including traditional,
Roth, Rollover, SEP-, SARSEP- and SIMPLE-IRAs), and certain other retirement
accounts. If you have only business, business retirement, employer-sponsored
or American Century Brokerage accounts, you are currently not subject to this
fee. We will not charge the fee as long as you choose to manage your accounts
exclusively online. If you are subject to the Account Maintenance Fee, your
account value could be reduced by the fee amount.
HYPOTHETICAL EXAMPLE FOR COMPARISON PURPOSES
The table also provides information about hypothetical account values and
hypothetical expenses based on the actual expense ratio of each class of your
fund and an assumed rate of return of 5% per year before expenses, which is
not the actual return of a fund's share class. The hypothetical account values
and expenses may not be used to estimate the actual ending account balance or
expenses you paid for the period. You may use this information to compare the
ongoing costs of investing in your fund and other funds. To do so, compare
this 5% hypothetical example with the 5% hypothetical examples that appear in
the shareholder reports of the other funds.
Please note that the expenses shown in the table are meant to highlight your
ongoing costs only and do not reflect any transactional costs, such as sales
charges (loads) or redemption/exchange fees. Therefore, the table is useful in
comparing ongoing costs only, and will not help you determine the relative
total costs of owning different funds. In addition, if these transactional
costs were included, your costs would have been higher.
- ------
7
Beginning Ending Expenses Paid Annualized
Account Account Value During Period* Expense
Value 11/1/07 4/30/08 11/1/07 - 4/30/08 Ratio*
ACTUAL
Investor Class $1,000 $963.60 $4.39 0.90%
Institutional
Class $1,000 $965.20 $3.42 0.70%
HYPOTHETICAL
Investor Class $1,000 $1,020.39 $4.52 0.90%
Institutional
Class $1,000 $1,021.38 $3.52 0.70%
*Expenses are equal to the class's annualized expense ratio listed in the
table above, multiplied by the average account value over the period,
multiplied by 182, the number of days in the most recent fiscal half-year,
divided by 366, to reflect the one-half year period.
- ------
8
SCHEDULE OF INVESTMENTS
Balanced
APRIL 30, 2008 (UNAUDITED)
Shares/Principal Amount Value
Common Stocks -- 56.5%
AEROSPACE & DEFENSE -- 1.4%
62,391 Boeing Co. $ 5,293,686
25,913 Lockheed Martin Corp. 2,747,815
------------
8,041,501
------------
AIR FREIGHT & LOGISTICS -- 0.6%
4,373 C.H. Robinson Worldwide Inc. 274,100
7,966 FedEx Corp. 763,700
30,771 United Parcel Service, Inc. Cl B 2,228,128
------------
3,265,928
------------
AIRLINES(1)
20,776 Southwest Airlines Co. 275,074
------------
AUTOMOBILES -- 0.1%
35,894 Ford Motor Co.(2)(3) 296,484
------------
BEVERAGES -- 1.9%
90,364 Anheuser-Busch Companies, Inc. 4,445,908
26,077 Coca-Cola Co. (The) 1,535,153
120,277 Coca-Cola Enterprises Inc. 2,706,233
32,192 PepsiCo, Inc. 2,206,118
------------
10,893,412
------------
BIOTECHNOLOGY -- 1.1%
100,506 Amgen Inc.(2) 4,208,186
26,711 Cephalon, Inc.(2) 1,667,034
7,673 Gilead Sciences, Inc.(2) 397,154
------------
6,272,374
------------
BUILDING PRODUCTS -- 0.1%
9,824 Armstrong World Industries, Inc. 349,636
------------
CAPITAL MARKETS -- 2.1%
8,532 Goldman Sachs Group, Inc. (The) 1,632,769
34,377 Knight Capital Group, Inc. Cl A(2) 643,194
95,025 Morgan Stanley 4,618,215
21,807 Northern Trust Corp. 1,616,117
53,389 State Street Corp. 3,851,482
------------
12,361,777
------------
CHEMICALS -- 0.9%
8,248 Celanese Corp., Series A 369,098
5,494 CF Industries Holdings, Inc. 734,548
7,508 du Pont (E.I.) de Nemours & Co. 367,216
15,403 Monsanto Co. 1,756,250
11,304 Mosaic Co. (The)(2) 1,384,853
Shares/Principal Amount Value
20,343 Terra Industries Inc.(2) $ 770,186
------------
5,382,151
------------
COMMERCIAL BANKS -- 1.0%
48,081 Royal Bank of Canada 2,299,714
117,401 Wells Fargo & Co. 3,492,680
------------
5,792,394
------------
COMMERCIAL SERVICES & SUPPLIES -- 0.1%
2,633 Allied Waste Industries Inc.(2) 32,544
19,882 R.R. Donnelley & Sons Co. 609,185
3,636 Watson Wyatt Worldwide, Inc. Cl A 213,142
------------
854,871
------------
COMMUNICATIONS EQUIPMENT -- 0.3%
46,504 Cisco Systems Inc.(2) 1,192,363
28,141 Corning Inc. 751,646
------------
1,944,009
------------
COMPUTERS & PERIPHERALS -- 2.5%
24,665 Apple Inc.(2) 4,290,477
142,700 Hewlett-Packard Co. 6,614,145
7,568 Lexmark International, Inc. Cl A(2) 237,560
93,393 Seagate Technology 1,762,326
32,878 Sun Microsystems, Inc.(2) 514,869
45,357 Western Digital Corp.(2) 1,314,899
------------
14,734,276
------------
CONSTRUCTION & ENGINEERING -- 0.3%
20,093 Chicago Bridge & Iron Company New York Shares 800,505
3,261 EMCOR Group Inc.(2) 81,721
7,170 Fluor Corp. 1,096,078
------------
1,978,304
------------
CONSUMER FINANCE -- 1.5%
24,802 American Express Co. 1,190,992
68,127 Capital One Financial Corp. 3,610,731
213,360 Discover Financial Services 3,885,286
------------
8,687,009
------------
CONTAINERS & PACKAGING -- 0.2%
10,956 Owens-Illinois Inc.(2) 604,223
24,795 Rock-Tenn Co. Cl A 841,295
------------
1,445,518
------------
DIVERSIFIED FINANCIAL SERVICES -- 2.1%
92,324 Bank of America Corp. 3,465,843
15,132 Citigroup Inc. 382,386
177,230 JPMorgan Chase & Co. 8,445,009
------------
12,293,238
------------
- ------
9
Balanced
Shares/Principal Amount Value
DIVERSIFIED TELECOMMUNICATION SERVICES -- 1.4%
151,463 AT&T Inc. $ 5,863,132
2,748 CenturyTel Inc. 89,173
1,039 FairPoint Communications, Inc. 9,569
55,120 Verizon Communications Inc. 2,121,018
------------
8,082,892
------------
ELECTRIC UTILITIES -- 1.2%
32,166 Duke Energy Corp. 588,959
7,879 Edison International 411,047
40,549 Entergy Corp. 4,657,459
4,188 Exelon Corp. 357,990
16,773 FPL Group, Inc. 1,111,882
------------
7,127,337
------------
ELECTRICAL EQUIPMENT -- 0.2%
23,985 Emerson Electric Co. 1,253,456
------------
ELECTRONIC EQUIPMENT & INSTRUMENTS -- 0.8%
32,962 Celestica Inc.(2) 308,854
112,723 Tyco Electronics Ltd. 4,216,967
------------
4,525,821
------------
ENERGY EQUIPMENT & SERVICES -- 1.4%
22,250 FMC Technologies Inc.(2) 1,495,200
33,825 Halliburton Co. 1,552,906
46,638 National Oilwell Varco, Inc.(2) 3,192,372
18,268 Schlumberger Ltd. 1,836,847
901 Transocean Inc.(2) 132,861
------------
8,210,186
------------
FOOD & STAPLES RETAILING -- 1.1%
32,604 Safeway Inc. 1,030,286
49,500 SYSCO Corp. 1,513,215
71,621 Wal-Mart Stores, Inc. 4,152,586
------------
6,696,087
------------
FOOD PRODUCTS -- 0.6%
20,024 Flowers Foods Inc. 518,421
35,317 General Mills, Inc. 2,133,147
20,404 Hormel Foods Corp. 804,122
------------
3,455,690
------------
GAS UTILITIES -- 0.2%
19,540 ONEOK, Inc. 940,265
------------
HEALTH CARE EQUIPMENT & SUPPLIES -- 1.5%
72,513 Baxter International Inc. 4,519,010
48,390 Becton, Dickinson & Co. 4,326,066
------------
8,845,076
------------
HEALTH CARE PROVIDERS & SERVICES -- 0.4%
7,612 Express Scripts, Inc.(2) 532,992
63,093 Health Net Inc.(2) 1,847,994
------------
2,380,986
------------
Shares/Principal Amount Value
HEALTH CARE TECHNOLOGY -- 0.1%
22,802 IMS Health Inc. $ 564,350
------------
HOTELS, RESTAURANTS & LEISURE -- 1.4%
7,865 Choice Hotels International Inc. 271,264
94,051 McDonald's Corp. 5,603,558
51,232 Yum! Brands, Inc. 2,084,118
------------
7,958,940
------------
HOUSEHOLD DURABLES(1)
5,756 Tupperware Brands Corp. 226,786
------------
HOUSEHOLD PRODUCTS -- 0.9%
12,415 Colgate-Palmolive Co. 877,741
64,588 Procter & Gamble Co. (The) 4,330,625
------------
5,208,366
------------
INDEPENDENT POWER PRODUCERS & ENERGY TRADERS -- 0.7%
149,966 Reliant Energy, Inc.(2) 3,860,125
------------
INDUSTRIAL CONGLOMERATES -- 1.9%
183,193 General Electric Co. 5,990,410
28,570 McDermott International, Inc.(2) 1,530,781
79,030 Tyco International Ltd. 3,697,814
------------
11,219,005
------------
INSURANCE -- 1.9%
33,615 Ace, Ltd. 2,026,648
38,746 Arch Capital Group Ltd.(2) 2,737,404
24,033 Aspen Insurance Holdings Ltd. 624,618
33,723 Axis Capital Holdings Ltd. 1,143,547
32,723 MetLife, Inc. 1,991,195
18,393 Travelers Companies, Inc. (The) 927,007
68,504 Unum Group 1,589,978
------------
11,040,397
------------
INTERNET & CATALOG RETAIL -- 0.2%
11,168 Amazon.com, Inc.(2) 878,140
------------
INTERNET SOFTWARE & SERVICES -- 0.7%
34,550 eBay Inc.(2) 1,081,070
5,338 Google Inc. Cl A(2) 3,065,560
------------
4,146,630
------------
IT SERVICES -- 3.3%
113,698 Accenture Ltd. Cl A 4,269,360
7,874 Computer Sciences Corp.(2) 343,228
12,962 Hewitt Associates Inc. Cl A(2) 531,442
74,364 International Business Machines Corp. 8,975,735
19,820 Metavante Technologies Inc.(2) 467,157
10,074 Visa Inc. Cl A(2) 840,675
169,486 Western Union Co. (The) 3,898,178
------------
19,325,775
------------
- ------
10
Balanced
Shares/Principal Amount Value
LEISURE EQUIPMENT & PRODUCTS -- 0.1%
11,216 Polaris Industries Inc.(3) $ 522,105
------------
LIFE SCIENCES TOOLS & SERVICES -- 0.1%
4,760 Invitrogen Corp.(2) 445,393
------------
MACHINERY -- 1.0%
44,521 Caterpillar Inc. 3,645,379
23,136 Deere & Co. 1,945,044
3,805 Flowserve Corp. 472,162
------------
6,062,585
------------
MEDIA -- 0.9%
92,528 Comcast Corp. Cl A 1,901,450
9,787 DIRECTV Group, Inc. (The)(2) 241,152
62,161 DISH Network Corp. Cl A(2) 1,854,884
6,277 Omnicom Group Inc. 299,664
20,018 Viacom Inc. Cl B(2) 769,492
------------
5,066,642
------------
METALS & MINING -- 0.6%
29,674 Freeport-McMoRan Copper & Gold, Inc. 3,375,417
1,480 Southern Copper Corp.(3) 169,845
------------
3,545,262
------------
MULTI-UTILITIES(1)
1,233 Public Service Enterprise Group Inc. 54,141
------------
MULTILINE RETAIL -- 0.2%
34,008 Big Lots, Inc.(2) 919,236
------------
OFFICE ELECTRONICS -- 0.3%
143,908 Xerox Corp. 2,010,395
------------
OIL, GAS & CONSUMABLE FUELS -- 6.7%
53,203 Chevron Corp. 5,115,468
91,935 ConocoPhillips 7,920,200
195,904 Exxon Mobil Corp. 18,232,786
37,532 Occidental Petroleum Corp. 3,123,038
28,135 Stone Energy Corp.(2) 1,714,547
16,583 Sunoco, Inc. 769,617
28,486 Valero Energy Corp. 1,391,541
18,782 W&T Offshore Inc. 768,184
------------
39,035,381
------------
PHARMACEUTICALS -- 3.0%
77,529 Eli Lilly & Co. 3,732,246
22,611 Forest Laboratories, Inc.(2) 784,828
126,611 Johnson & Johnson 8,494,332
16,557 Merck & Co., Inc. 629,828
126,475 Pfizer Inc. 2,543,412
49,949 Schering-Plough Corp. 919,561
11,007 Sepracor Inc.(2) 237,201
------------
17,341,408
------------
Shares/Principal Amount Value
ROAD & RAIL -- 0.5%
7,965 Burlington Northern Santa Fe Corp. $ 816,811
11,758 CSX Corp. 740,166
10,452 Norfolk Southern Corp. 622,730
6,952 Union Pacific Corp. 1,009,361
------------
3,189,068
------------
SEMICONDUCTORS & SEMICONDUCTOR EQUIPMENT -- 1.8%
125,759 Amkor Technology Inc.(2) 1,200,998
59,376 Intel Corp. 1,321,710
82,214 National Semiconductor Corp. 1,676,343
82,673 NVIDIA Corp.(2) 1,698,930
128,607 Texas Instruments Inc. 3,750,181
------------
9,648,162
------------
SOFTWARE -- 2.2%
55,228 Adobe Systems Inc.(2) 2,059,452
205,309 Microsoft Corp. 5,855,412
76,030 Oracle Corp.(2) 1,585,226
177,457 Symantec Corp.(2) 3,055,810
------------
12,555,900
------------
SPECIALTY RETAIL -- 2.2%
34,277 AutoZone, Inc.(2) 4,138,948
35,591 Best Buy Co., Inc. 1,531,125
132,281 Gap, Inc. (The) 2,463,072
97,190 RadioShack Corp. 1,350,941
106,276 TJX Companies, Inc. (The) 3,424,213
------------
12,908,299
------------
THRIFTS & MORTGAGE FINANCE -- 0.1%
82,475 Countrywide Financial Corp. 476,705
7,199 Fannie Mae 203,732
------------
680,437
------------
TOBACCO -- 0.7%
38,345 Altria Group Inc. 766,900
38,345 Philip Morris International Inc.(2) 1,956,745
21,724 Universal Corp. 1,394,464
------------
4,118,109
------------
TOTAL COMMON STOCKS
(Cost $295,044,344) 328,916,789
------------
U.S. Government Agency Mortgage-Backed Securities(4) -- 12.8%
$ 98,917 FHLMC, 7.00%, 10/1/12(5) 103,829
2,122,936 FHLMC, 4.50%, 1/1/19(5) 2,109,647
129,475 FHLMC, 6.50%, 1/1/28 135,548
1,085,900 FHLMC, 5.50%, 12/1/33(5) 1,096,788
279,321 FHLMC, 6.50%, 7/1/47(5) 286,217
- ------
11
Balanced
Shares/Principal Amount Value
$16,458,092 FNMA, 6.00%, settlement date 5/13/08(6) $16,825,832
5,390,000 FNMA, 6.50%, settlement date 5/13/08(6) 5,577,809
68,289 FNMA, 6.00%, 2/1/09 69,450
14,373 FNMA, 6.50%, 5/1/11 14,940
146,702 FNMA, 7.50%, 11/1/11 153,162
1,083 FNMA, 6.50%, 10/1/12 1,126
6,493 FNMA, 6.50%, 5/1/13 6,752
11,866 FNMA, 6.50%, 5/1/13 12,341
29,392 FNMA, 6.50%, 6/1/13 30,568
14,273 FNMA, 6.50%, 6/1/13 14,844
4,034 FNMA, 6.50%, 6/1/13 4,195
30,550 FNMA, 6.50%, 6/1/13 31,772
4,484 FNMA, 6.50%, 6/1/13 4,661
102,597 FNMA, 6.00%, 1/1/14 106,107
363,925 FNMA, 6.00%, 4/1/14(5) 376,374
853,556 FNMA, 4.50%, 5/1/19(5) 848,104
1,665,147 FNMA, 4.50%, 5/1/19(5) 1,654,512
3,231,977 FNMA, 5.00%, 9/1/20(5) 3,257,290
28,133 FNMA, 6.50%, 1/1/28 29,422
129,787 FNMA, 7.00%, 1/1/28 138,293
159,389 FNMA, 6.50%, 1/1/29(5) 166,594
191,595 FNMA, 7.50%, 7/1/29(5) 206,879
76,863 FNMA, 7.50%, 9/1/30 82,859
132,317 FNMA, 6.50%, 9/1/31 138,090
40,105 FNMA, 7.00%, 9/1/31 42,702
250,145 FNMA, 6.50%, 1/1/32(5) 260,826
475,100 FNMA, 7.00%, 6/1/32(5) 505,265
237,876 FNMA, 6.50%, 8/1/32(5) 248,033
1,524,915 FNMA, 5.50%, 6/1/33(5) 1,538,775
1,993,748 FNMA, 5.50%, 7/1/33(5) 2,011,869
1,625,285 FNMA, 5.50%, 8/1/33(5) 1,640,057
982,866 FNMA, 5.50%, 9/1/33(5) 991,799
5,004,967 FNMA, 5.00%, 11/1/33(5) 4,934,017
7,115,243 FNMA, 5.50%, 1/1/34(5) 7,179,913
4,834,369 FNMA, 4.50%, 9/1/35(5) 4,609,634
5,536,378 FNMA, 5.00%, 2/1/36(5) 5,449,246
2,481,029 FNMA, 5.50%, 4/1/36(5) 2,499,317
3,568,881 FNMA, 6.50%, 8/1/37(5) 3,665,173
135,905 FNMA, 6.50%, 6/1/47 139,303
480,300 FNMA, 6.50%, 8/1/47(5) 492,308
357,907 FNMA, 6.50%, 8/1/47(5) 366,855
784,992 FNMA, 6.50%, 9/1/47(5) 804,617
414,403 FNMA, 6.50%, 9/1/47(5) 424,763
58,363 FNMA, 6.50%, 9/1/47 59,822
563,608 FNMA, 6.50%, 9/1/47(5) 577,698
446,038 FNMA, 6.50%, 9/1/47(5) 457,189
Shares/Principal Amount Value
$ 212,042 GNMA, 7.00%, 4/20/26(5) $ 227,399
112,231 GNMA, 7.50%, 8/15/26 120,929
34,795 GNMA, 7.00%, 2/15/28 37,307
76,661 GNMA, 7.50%, 2/15/28 82,550
57,964 GNMA, 7.00%, 12/15/28 62,150
15,885 GNMA, 8.00%, 12/15/29 17,401
248,330 GNMA, 7.00%, 5/15/31(5) 265,864
1,534,434 GNMA, 5.50%, 11/15/32(5) 1,560,316
------------
TOTAL U.S. GOVERNMENT AGENCY MORTGAGE-BACKED SECURITIES
(Cost $74,049,601) 74,757,102
------------
Corporate Bonds -- 9.1%
AEROSPACE & DEFENSE -- 0.3%
262,000 Honeywell International Inc., 5.30%, 3/15/17(5) 267,272
230,000 Honeywell International Inc., 5.30%, 3/1/18(5) 234,838
378,000 Lockheed Martin Corp., 6.15%, 9/1/36(5) 387,990
530,000 United Technologies Corp., 4.375%, 5/1/10(5) 536,540
454,000 United Technologies Corp., 6.05%, 6/1/36(5) 471,868
------------
1,898,508
------------
AUTOMOBILES -- 0.1%
260,000 DaimlerChrysler N.A. Holding Corp., 5.875%,
3/15/11(5) 266,104
330,000 DaimlerChrysler N.A. Holding Corp., 6.50%,
11/15/13(5) 345,302
------------
611,406
------------
BEVERAGES -- 0.4%
580,000 Coca-Cola Co. (The), 5.35%, 11/15/17(5) 603,028
460,000 Diageo Capital plc, 5.75%, 10/23/17(5) 470,287
280,000 PepsiCo, Inc., 4.65%, 2/15/13(5) 286,271
421,000 SABMiller plc, 4.25%, 8/15/08 (Acquired 1/6/04,
Cost $427,829)(5)(7) 422,047
670,000 SABMiller plc, 6.20%, 7/1/11 (Acquired 6/27/06,
Cost $669,524)(5)(7) 691,858
------------
2,473,491
------------
CAPITAL MARKETS -- 0.3%
331,000 Merrill Lynch & Co., Inc., 4.25%, 2/8/10(5) 323,703
609,000 Merrill Lynch & Co., Inc., 4.79%, 8/4/10(5) 595,671
560,000 Merrill Lynch & Co., Inc., 6.875%, 4/25/18 565,985
------------
1,485,359
------------
- ------
12
Balanced
Shares/Principal Amount Value
CHEMICALS -- 0.1%
$ 340,000 Air Products and Chemicals, Inc., 4.15%, 2/1/13(5) $ 334,884
240,000 Rohm and Haas Co., 5.60%, 3/15/13(5) 244,008
------------
578,892
------------
COMMERCIAL BANKS -- 0.6%
320,000 Fifth Third Bancorp, 6.25%, 5/1/13 323,331
450,000 PNC Bank N.A., 4.875%, 9/21/17(5) 408,077
290,000 PNC Bank N.A., 6.00%, 12/7/17(5) 284,380
328,000 PNC Funding Corp., 5.125%, 12/14/10(5) 328,272
110,000 SunTrust Bank, 7.25%, 3/15/18 116,138
373,000 Wachovia Bank N.A., 4.80%, 11/1/14(5) 359,777
583,000 Wachovia Bank N.A., 4.875%, 2/1/15(5) 562,305
516,000 Wells Fargo & Co., 4.625%, 8/9/10(5) 524,105
350,000 Wells Fargo & Co., 4.375%, 1/31/13(5) 346,747
------------
3,253,132
------------
COMMERCIAL SERVICES & SUPPLIES(1)
230,000 Pitney Bowes, Inc., 5.75%, 9/15/17(5) 232,552
------------
COMPUTERS & PERIPHERALS -- 0.1%
560,000 Hewlett-Packard Co., 4.50%, 3/1/13(5) 565,410
------------
CONSUMER FINANCE -- 0.1%
250,000 American Express Centurion Bank, 4.375%,
7/30/09(5) 250,187
300,000 American Express Centurion Bank, 5.55%,
10/17/12(5) 300,753
------------
550,940
------------
DIVERSIFIED FINANCIAL SERVICES -- 1.0%
820,000 Bank of America Corp., 4.375%, 12/1/10(5) 826,392
550,000 Bank of America Corp., 4.90%, 5/1/13(5) 551,804
550,000 Bank of America Corp., 5.65%, 5/1/18(5) 551,447
420,000 Bank of America N.A., 5.30%, 3/15/17(5) 415,521
360,000 Bank of America N.A., 6.00%, 10/15/36(5) 357,313
330,000 Citigroup Inc., 5.50%, 4/11/13(5) 332,508
402,000 Citigroup Inc., 5.00%, 9/15/14(5) 383,849
Shares/Principal Amount Value
$ 220,000 General Electric Capital Corp., 4.80%, 5/1/13 $ 221,200
340,000 General Electric Capital Corp., 6.125%, 2/22/11(5) 356,827
450,000 General Electric Capital Corp., 5.625%, 9/15/17(5) 459,648
220,000 John Deere Capital Corp., 4.50%, 4/3/13(5) 219,891
532,000 John Deere Capital Corp., 5.50%, 4/13/17(5) 539,396
320,000 Pearson Dollar Finance Two plc, 6.25%, 5/6/18
(Acquired 4/29/08, Cost $319,411)(7) 325,856
450,000 Pricoa Global Funding I, 5.40%, 10/18/12
(Acquired 10/11/07, Cost $449,105)(5)(7) 456,025
------------
5,997,677
------------
DIVERSIFIED TELECOMMUNICATION SERVICES -- 0.7%
517,000 AT&T Corp., 7.30%, 11/15/11(5) 556,620
350,000 AT&T Inc., 6.80%, 5/15/36(5) 369,542
70,000 BellSouth Corp., 6.875%, 10/15/31 72,703
350,000 British Telecommunications plc, 5.95%, 1/15/18(5) 351,652
219,000 Embarq Corp., 7.08%, 6/1/16(5) 217,765
120,000 Qwest Corp., 7.875%, 9/1/11(5) 123,600
200,000 Qwest Corp., 7.50%, 10/1/14(5) 202,000
490,000 Telecom Italia Capital SA, 4.00%, 1/15/10(5) 481,692
280,000 Telefonica Emisiones SAU, 7.05%, 6/20/36(5) 307,297
304,000 Verizon Communications Inc., 5.55%, 2/15/16(5) 307,337
230,000 Verizon Communications Inc., 5.50%, 2/15/18(5) 231,292
220,000 Verizon Communications Inc., 6.10%, 4/15/18(5) 231,307
216,000 Verizon Communications Inc., 6.25%, 4/1/37(5) 217,428
350,000 Verizon Communications Inc., 6.40%, 2/15/38(5) 357,971
------------
4,028,206
------------
ELECTRIC UTILITIES -- 0.3%
420,000 Carolina Power & Light Co., 5.15%, 4/1/15(5) 424,256
401,000 Cleveland Electric Illuminating Co. (The), 5.70%,
4/1/17(5) 385,450
266,000 Florida Power Corp., 4.50%, 6/1/10(5) 270,185
230,000 Florida Power Corp., 6.35%, 9/15/37(5) 243,672
345,000 Southern California Edison Co., 5.625%, 2/1/36(5) 334,376
- ------
13
Balanced
Shares/Principal Amount Value
$ 190,000 Toledo Edison Co. (The), 6.15%, 5/15/37 $170,269
------------
1,828,208
------------
ELECTRICAL EQUIPMENT -- 0.1%
320,000 Rockwell Automation, Inc., 6.25%, 12/1/37(5) 319,767
------------
FOOD & STAPLES RETAILING -- 0.4%
330,000 CVS Caremark Corp., 5.75%, 6/1/17(5) 335,226
460,000 SYSCO Corp., 4.20%, 2/12/13(5) 456,933
449,000 Wal-Mart Stores, Inc., 4.125%, 7/1/10(5) 454,620
220,000 Wal-Mart Stores, Inc., 4.25%, 4/15/13(5) 221,234
468,000 Wal-Mart Stores, Inc., 5.875%, 4/5/27(5) 471,743
330,000 Wal-Mart Stores, Inc., 6.50%, 8/15/37(5) 351,876
220,000 Wal-Mart Stores, Inc., 6.20%, 4/15/38(5) 224,991
------------
2,516,623
------------
FOOD PRODUCTS -- 0.4%
690,000 Cadbury Schweppes U.S. Finance LLC, 3.875%,
10/1/08 (Acquired 6/14/05-10/17/06, Cost
$676,184)(5)(7) 688,576
350,000 Cargill Inc., 5.20%, 1/22/13 (Acquired 1/16/08,
Cost $349,710)(5)(7) 349,899
170,000 General Mills, Inc., 5.65%, 9/10/12 175,228
220,000 Kellogg Co., 6.60%, 4/1/11(5) 233,339
320,000 Kellogg Co., 5.125%, 12/3/12(5) 326,786
330,000 Kraft Foods Inc., 6.00%, 2/11/13(5) 340,918
------------
2,114,746
------------
HEALTH CARE EQUIPMENT & SUPPLIES -- 0.3%
710,000 Baxter Finco BV, 4.75%, 10/15/10(5) 722,549
500,000 Baxter International Inc., 5.90%, 9/1/16(5) 524,219
230,000 Baxter International Inc., 6.25%, 12/1/37(5) 236,126
------------
1,482,894
------------
HOTELS, RESTAURANTS & LEISURE -- 0.3%
560,000 McDonald's Corp., 5.35%, 3/1/18(5) 569,583
230,000 McDonald's Corp., 6.30%, 10/15/37(5) 236,405
540,000 Royal Caribbean Cruises Ltd., 7.00%, 6/15/13(5) 514,350
Shares/Principal Amount Value
$ 230,000 Yum! Brands, Inc., 6.875%, 11/15/37(5) $226,281
------------
1,546,619
------------
HOUSEHOLD PRODUCTS -- 0.1%
230,000 Kimberly-Clark Corp., 6.125%, 8/1/17(5) 246,738
320,000 Procter & Gamble Co. (The), 5.55%, 3/5/37(5) 318,832
------------
565,570
------------
INDUSTRIAL CONGLOMERATES -- 0.2%
1,208,000 General Electric Co., 5.00%, 2/1/13(5) 1,234,108
230,000 General Electric Co., 5.25%, 12/6/17(5) 229,491
------------
1,463,599
------------
INSURANCE -- 0.5%
560,000 Allstate Financial Global Funding, 4.25%, 9/10/08
(Acquired 9/3/03,Cost $558,902)(5)(7) 561,411
423,000 Hartford Financial Services Group Inc. (The),
5.375%, 3/15/17(5) 413,658
230,000 Hartford Financial Services Group Inc. (The),
6.30%, 3/15/18(5) 238,609
460,000 Lincoln National Corp., 6.30%, 10/9/37(5) 439,576
750,000 MetLife Global Funding I, 5.125%, 4/10/13
(Acquired 4/7/08-4/8/08, Cost $750,669)(5)(7) 751,086
320,000 Prudential Financial, Inc., 6.00%, 12/1/17(5) 323,457
270,000 Prudential Financial, Inc., 5.40%, 6/13/35(5) 228,290
230,000 Travelers Companies, Inc. (The), 6.25%, 6/15/37(5) 226,196
------------
3,182,283
------------
MACHINERY -- 0.1%
230,000 Atlas Copco AB, 5.60%, 5/22/17 (Acquired 5/15/07,
Cost $229,897)(5)(7) 231,224
230,000 Caterpillar Financial Services Corp., 4.85%,
12/7/12(5) 233,285
------------
464,509
------------
MEDIA -- 0.4%
489,000 Comcast Corp., 5.90%, 3/15/16(5) 495,891
271,000 News America Holdings, 7.75%, 1/20/24(5) 291,549
680,000 Rogers Cable Inc., 6.25%, 6/15/13(5) 692,805
- ------
14
Balanced
Shares/Principal Amount Value
$ 650,000 Time Warner Cable Inc., 5.40%, 7/2/12(5) $ 654,589
195,000 Time Warner Inc., 5.50%, 11/15/11(5) 193,416
70,000 Time Warner Inc., 7.625%, 4/15/31 75,376
------------
2,403,626
------------
METALS & MINING(1)
197,000 Xstrata Finance Canada Ltd., 5.80%, 11/15/16
(Acquired 11/8/06, Cost $196,513)(5)(7) 189,394
------------
MULTI-UTILITIES -- 0.4%
230,000 CenterPoint Energy Resources Corp., 6.125%,
11/1/17(5) 232,154
330,000 CenterPoint Energy Resources Corp., 6.25%,
2/1/37(5) 306,390
454,000 Consolidated Edison Co. of New York, Inc., Series
2006 C, 5.50%, 9/15/16(5) 456,261
258,000 Dominion Resources Inc., 4.75%, 12/15/10(5) 261,126
460,000 NSTAR Electric Co., 5.625%, 11/15/17(5) 473,699
270,000 Pacific Gas and Electric Co., 6.05%, 3/1/34(5) 269,622
163,000 Pacific Gas and Electric Co., 5.80%, 3/1/37 157,242
220,000 Pacific Gas and Electric Co., 6.35%, 2/15/38(5) 228,723
------------
2,385,217
------------
MULTILINE RETAIL -- 0.2%
175,000 Federated Retail Holdings, Inc., 5.35%, 3/15/12 163,252
240,000 Kohl's Corp., 6.875%, 12/15/37(5) 220,746
600,000 Macy's Retail Holdings, Inc., 5.875%, 1/15/13(5) 567,930
------------
951,928
------------
OIL, GAS & CONSUMABLE FUELS -- 0.6%
260,000 Canadian Natural Resources Ltd., 5.70%, 5/15/17(5) 261,379
230,000 Canadian Natural Resources Ltd., 6.75%, 2/1/39(5) 241,053
450,000 Enbridge Energy Partners, L.P., 6.50%, 4/15/18
(Acquired 3/31/08, Cost $447,597)(5)(7) 456,753
785,000 Enterprise Products Operating L.P., 4.95%,
6/1/10(5) 788,701
260,000 Enterprise Products Operating L.P., 6.30%,
9/15/17(5) 265,594
340,000 Nexen Inc., 6.40%, 5/15/37(5) 333,836
613,000 Premcor Refining Group Inc. (The), 6.125%,
5/1/11(5) 633,375
Shares/Principal Amount Value
$ 270,000 Tesoro Corp., 6.25%, 11/1/12(3)(5) $ 259,200
200,000 Tesoro Corp., 6.50%, 6/1/17(5) 184,500
120,000 TransCanada PipeLines Ltd., 6.20%, 10/15/37 115,755
342,000 XTO Energy Inc., 5.30%, 6/30/15(5) 343,268
272,000 XTO Energy Inc., 6.10%, 4/1/36(5) 265,049
110,000 XTO Energy Inc., 6.375%, 6/15/38(5) 111,487
------------
4,259,950
------------
PHARMACEUTICALS -- 0.5%
450,000 Abbott Laboratories, 5.875%, 5/15/16(5) 475,309
230,000 Abbott Laboratories, 6.15%, 11/30/37(5) 240,134
1,020,000 AstraZeneca plc, 5.40%, 9/15/12(5) 1,058,092
360,000 AstraZeneca plc, 5.90%, 9/15/17(5) 382,191
532,000 Wyeth, 5.95%, 4/1/37(5) 529,419
------------
2,685,145
------------
REAL ESTATE INVESTMENT TRUSTS (REITS) -- 0.1%
490,000 ProLogis, 5.625%, 11/15/16(5) 457,080
------------
ROAD & RAIL -- 0.1%
340,000 Union Pacific Corp., 5.75%, 11/15/17(5) 345,098
------------
SOFTWARE -- 0.3%
254,000 Intuit Inc., 5.75%, 3/15/17(5) 246,695
545,000 Oracle Corp., 5.00%, 1/15/11(5) 557,923
1,110,000 Oracle Corp., 5.75%, 4/15/18(5) 1,133,102
------------
1,937,720
------------
SPECIALTY RETAIL(1)
230,000 Lowe's Companies, Inc., 5.60%, 9/15/12(5) 237,628
------------
WIRELESS TELECOMMUNICATION SERVICES -- 0.1%
313,000 Vodafone Group plc, 5.625%, 2/27/17(5) 315,154
------------
TOTAL CORPORATE BONDS
(Cost $53,005,808) 53,328,331
------------
U.S. Treasury Securities -- 9.1%
1,640,000 U.S. Treasury Bonds, 8.125%, 8/15/19(5) 2,234,244
1,165,000 U.S. Treasury Bonds, 8.125%, 8/15/21(3)(5) 1,616,984
4,000,000 U.S. Treasury Bonds, 7.125%, 2/15/23(3)(5) 5,195,940
310,000 U.S. Treasury Bonds, 6.25%, 5/15/30(3)(5) 386,289
- ------
15
Balanced
Shares/Principal Amount Value
$ 929,000 U.S. Treasury Bonds, 4.75%, 2/15/37(3)(5) $ 969,571
8,134,633 U.S. Treasury Inflation Indexed Bonds, 2.375%,
1/15/27(5) 8,580,134
2,642,971 U.S. Treasury Inflation Indexed Notes, 3.00%,
7/15/12(5) 2,900,663
5,842,407 U.S. Treasury Inflation Indexed Notes, 2.00%,
1/15/14(5) 6,169,675
1,010,390 U.S. Treasury Inflation Indexed Notes, 1.625%,
1/15/18(5) 1,025,073
5,500,000 U.S. Treasury Notes, 4.625%, 10/31/11(3)(5) 5,866,526
7,000,000 U.S. Treasury Notes, 4.125%, 8/31/12(3)(5) 7,337,974
9,750,000 U.S. Treasury Notes, 3.125%, 4/30/13(3)(5) 9,794,948
1,005,000 U.S. Treasury Notes, 3.50%, 2/15/18(3)(5) 984,901
------------
TOTAL U.S. TREASURY SECURITIES
(Cost $51,801,091) 53,062,922
------------
Collateralized Mortgage Obligations(4) -- 8.9%
2,287,999 Banc of America Alternative Loan Trust, Series
2007-2, Class 2A4, 5.75%, 6/25/37(5) 2,152,763
11,431,226 Banc of America Commercial Mortgage Inc. STRIPS -
COUPON, Series 2004-1, Class XP, VRN, 0.64%,
5/1/08 173,652
2,169,000 Banc of America Commercial Mortgage Inc., Series
2004-2, Class A3 SEQ, 4.05%, 11/10/38(5) 2,136,007
900,000 Banc of America Commercial Mortgage Inc., Series
2006-6, Class A3 SEQ, 5.37%, 12/10/16(5) 866,788
2,330,000 Banc of America Commercial Mortgage Inc., Series
2007-4, Class A3 SEQ, 5.81%, 8/10/14(5) 2,270,415
16,394,428 Bear Stearns Commercial Mortgage Securities Trust
STRIPS - COUPON, Series 2004 T16, Class X2, VRN,
0.75%, 5/1/08 379,679
1,344,952 Bear Stearns Commercial Mortgage Securities
Trust, Series 2006 BBA7, Class A1, VRN, 2.83%,
5/15/08, resets monthly off the 1-month LIBOR
plus 0.11% with no caps (Acquired 6/5/06, Cost
$1,344,952)(5)(7) 1,281,918
2,900,000 Bear Stearns Commercial Mortgage Securities
Trust, Series 2006 PW14, Class A4 SEQ, 5.20%,
12/1/38(5) 2,800,617
Shares/Principal Amount Value
$ 75,055 Commercial Mortgage Pass-Through Certificates,
Series 2005 F10A, Class A1, VRN, 2.82%, 5/15/08,
resets monthly off the 1-month LIBOR plus 0.10%
with no caps (Acquired 3/18/05, Cost $75,055)(7) $72,885
4,713,344 Countrywide Home Loan Mortgage Pass-Through
Trust, Series 2007-16, Class A1, 6.50%,
10/25/37(5) 4,554,222
500,000 Credit Suisse First Boston Mortgage Securities
Corp., Series 2000 C1, Class B, VRN, 7.57%,
5/11/08(5) 528,760
800,000 Credit Suisse First Boston Mortgage Securities
Corp., Series 2001 CK3, Class A4 SEQ, 6.53%,
6/15/34(5) 830,711
1,000,000 Credit Suisse First Boston Mortgage Securities
Corp., Series 2002 CKN2, Class A3 SEQ, 6.13%,
4/15/37(5) 1,038,442
5,000,000 Credit Suisse First Boston Mortgage Securities
Corp., Series 2002 CKP1, Class B, 6.57%,
12/15/35(5) 5,231,430
1,434,064 Credit Suisse First Boston Mortgage Securities
Corp., Series 2003 AR28, Class 2A1, 4.41%,
12/25/33(5) 1,436,840
1,200,000 Credit Suisse Mortgage Capital Certificates,
Series 2007 TF2A, Class A1, VRN, 2.90%, 5/15/08,
resets monthly off the 1-month LIBOR plus 0.18%
with no caps (Acquired 7/24/07, Cost
$1,200,000)(5)(7) 1,146,529
260,942 FHLMC, Series 77, Class H, 8.50%, 9/15/20(5) 282,521
368,497 FHLMC, Series 2541, Class EA, 5.00%, 3/1/16(5) 372,553
1,573,484 FHLMC, Series 2567, Class OD, 5.00%, 8/15/15(5) 1,593,892
1,200,000 FHLMC, Series 2926, Class EW SEQ, 5.00%,
1/15/25(5) 1,185,018
743,577 FHLMC, Series 2937, Class KA, 4.50%, 12/15/14(5) 748,028
2,617,178 FNMA, Series 2005-63, Class HA SEQ, 5.00%,
4/25/23(5) 2,663,640
1,660,000 Greenwich Capital Commercial Funding Corp.,
Series 2005 GG3, Class A2 SEQ, 4.31%, 8/10/42(5) 1,649,090
- ------
16
Balanced
Shares/Principal Amount Value
$ 309,978 Greenwich Capital Commercial Funding Corp.,
Series 2006 FL4A, Class A1, VRN, 2.83%, 5/5/08,
resets monthly off the 1-month LIBOR plus 0.09%
with no caps (Acquired 12/14/06, Cost
$309,977)(5)(7) $ 290,413
293,563 GS Mortgage Securities Corp. II, Series 2007 EOP,
Class A1 VRN, 2.83%, 5/6/08, resets monthly off
the 1-month LIBOR plus 0.09% with no caps(5) 271,846
1,382,796 J.P. Morgan Mortgage Trust, Series 2005 A8, Class
6A2, 5.13%, 11/25/35(5) 1,360,543
3,200,000 LB-UBS Commercial Mortgage Trust, Series 2003 C3,
Class A3 SEQ, 3.85%, 5/15/27(5) 3,095,834
900,000 LB-UBS Commercial Mortgage Trust, Series 2004 C1,
Class A2 SEQ, 3.62%, 1/15/29(5) 891,653
1,000,000 LB-UBS Commercial Mortgage Trust, Series 2004 C4,
Class A2, 4.57%, 6/15/29(5) 1,000,183
1,309,211 LB-UBS Commercial Mortgage Trust, Series 2005 C2,
Class A2 SEQ, 4.82%, 4/15/30(5) 1,310,206
3,000,000 LB-UBS Commercial Mortgage Trust, Series 2005 C3,
Class A3 SEQ, 4.65%, 7/30/30(5) 2,954,076
400,000 LB-UBS Commercial Mortgage Trust, Series 2006 C1,
Class A4 SEQ, 5.16%, 2/15/31(5) 389,011
256,287 Lehman Brothers Floating Rate Commercial Mortgage
Trust, Series 2006 LLFA, Class A1, VRN, 2.80%,
5/15/08, resets monthly off the 1-month LIBOR
plus 0.08% with no caps (Acquired 8/7/06, Cost
$256,287)(5)(7) 241,520
98,865 MASTR Alternative Loans Trust, Series 2003-8,
Class 4A1, 7.00%, 12/25/33 96,746
816,208 Merrill Lynch Floating Trust, Series 2006-1,
Class A1, VRN, 2.79%, 5/15/08, resets monthly off
the 1-month LIBOR plus 0.07% with no caps
(Acquired 10/31/06, Cost $816,208)(5)(7) 765,530
835,569 Thornburg Mortgage Securities Trust, Series
2006-5, Class A1, VRN, 3.02%, 5/27/08, resets
monthly off the 1-month LIBOR plus 0.12% with no
caps(5) 782,119
Shares/Principal Amount Value
$ 875,000 Washington Mutual Mortgage Pass-Through
Certificates, Series 2005 AR4, Class A3, 4.59%,
4/25/35(5) $874,822
2,408,129 Wells Fargo Mortgage Backed Securities Trust,
Series 2007-11, Class A19 SEQ, 6.00%, 8/25/37(5) 2,361,103
------------
TOTAL COLLATERALIZED MORTGAGE OBLIGATIONS
(Cost $52,678,166) 52,082,005
------------
Municipal Securities -- 2.0%
3,700,000 Clark County School District GO, Series 2004 D,
(Building Bonds), 5.00%, 12/15/14, Prerefunded at
100% of Par (MBIA)(5)(8) 4,080,915
3,600,000 Clark County School District GO, Series 2005 C,
(Building Bonds), 5.00%, 12/15/15, Prerefunded at
100% of Par (FSA)(5)(8) 3,993,084
800,000 Illinois GO, (Taxable Pension), 5.10%, 6/1/33(5) 780,608
2,700,000 Massachusetts GO, Series 2005 C, 5.00%, 9/1/15,
Prerefunded at 100% of Par(5)(8) 2,986,038
------------
TOTAL MUNICIPAL SECURITIES
(Cost $11,610,191) 11,840,645
------------
Adjustable-Rate U.S. Government Agency Mortgage-Backed Securities(4) -- 1.7%
1,896,463 FHLMC, 6.80%, 8/1/36(5) 1,939,387
2,477,766 FHLMC, 6.00%, 11/1/36(5) 2,538,379
1,563,085 FNMA, 6.50%, 5/1/36(5) 1,607,434
1,063,735 FNMA, 6.42%, 9/1/36(5) 1,094,047
1,170,548 FNMA, 6.45%, 9/1/36(5) 1,210,789
1,349,228 FNMA, 5.97%, 6/1/37(5) 1,379,259
------------
TOTAL ADJUSTABLE-RATE U.S. GOVERNMENT AGENCY
MORTGAGE-BACKED SECURITIES
(Cost $9,719,213) 9,769,295
------------
Asset-Backed Securities(4) -- 0.5%
361,000 Accredited Mortgage Loan Trust, Series 2006-2,
Class A1, VRN, 2.94%, 5/27/08, resets monthly off
the 1-month LIBOR plus 0.04% with no caps(5) 355,983
1,000,000 CNH Equipment Trust, Series 2007 C, Class A3A
SEQ, 5.21%, 12/15/11(5) 1,001,007
- ------
17
Balanced
Shares/Principal Amount Value
$ 460,598 Long Beach Mortgage Loan Trust, Series 2006-6,
Class 2A1, VRN, 2.94%, 5/27/08, resets monthly
off the 1-month LIBOR plus 0.04% with no caps(5) $ 457,031
373,373 SLM Student Loan Trust, Series 2006-5, Class A2,
VRN, 2.91%, 7/25/08, resets quarterly off the
3-month LIBOR minus 0.01% with no caps(5) 370,903
194,657 SLM Student Loan Trust, Series 2006-10, Class A2,
VRN, 2.93%, 7/25/08, resets quarterly off the
3-month LIBOR plus 0.01% with no caps(5) 193,793
249,918 Soundview Home Equity Loan Trust, Series 2006-3,
Class A1, VRN, 2.94%, 5/27/08, resets monthly off
the 1-month LIBOR plus 0.04% with no caps(5) 249,071
------------
TOTAL ASSET-BACKED SECURITIES
(Cost $2,639,464) 2,627,788
------------
U.S. Government Agency Securities -- 0.2%
1,200,000 FHLMC, 2.875%, 4/30/10(3)(5)
(Cost $1,211,348) 1,202,450
------------
Sovereign Governments & Agencies -- 0.1%
145,000 Hydro Quebec, 8.40%, 1/15/22 195,180
575,000 Province of Quebec, 5.00%, 7/17/09(5) 588,410
------------
TOTAL SOVEREIGN GOVERNMENTS & AGENCIES
(Cost $749,765) 783,590
------------
Temporary Cash Investments -- 3.0%
10,000,000 FHLB Discount Notes, 1.75%, 5/1/08(5)(9) 10,000,000
Repurchase Agreement, Credit Suisse First Boston, Inc.,
(collateralized by various U.S. Treasury obligations, 7.25%,
8/15/22, valued at $7,650,901), in a joint trading account at
1.87%, dated 4/30/08, due 5/1/08 (Delivery value $7,500,390)(5) 7,500,000
------------
TOTAL TEMPORARY CASH INVESTMENTS
(Cost $17,500,000) 17,500,000
------------
Value
Temporary Cash Investments - Securities Lending Collateral(10) -- 7.2%
Repurchase Agreement, Barclays Capital Inc., (collateralized by
various U.S. Government Agency obligations in a pooled account at
the lending agent), 1.98%, dated 4/30/08, due 5/1/08 (Delivery
value $8,166,393) $ 8,165,944
Repurchase Agreement, BNP Paribas Securities Corp.,
(collateralized by various U.S. Government Agency obligations in
a pooled account at the lending agent), 1.99%, dated 4/30/08, due
5/1/08 (Delivery value $8,500,470) 8,500,000
Repurchase Agreement, Deutsche Bank Securities Inc.,
(collateralized by various U.S. Government Agency obligations in
a pooled account at the lending agent), 1.97%, dated 4/30/08, due
5/1/08 (Delivery value $8,500,465) 8,500,000
Repurchase Agreement, Lehman Brothers Inc. /Lehman Brothers
Commercial Paper Inc., (collateralized by various U.S. Government
Agency obligations in a pooled account at the lending agent),
2.39%, dated 4/30/08, due 5/1/08 (Delivery value $8,500,564) 8,500,000
Repurchase Agreement, Morgan Stanley & Co. Inc., (collateralized
by various U.S. Government Agency obligations in a pooled account
at the lending agent), 1.97%, dated 4/30/08, due 5/1/08 (Delivery
value $8,500,465) 8,500,000
------------
TOTAL TEMPORARY CASH INVESTMENTS - SECURITIES
LENDING COLLATERAL
(Cost $42,165,944) 42,165,944
------------
TOTAL INVESTMENT SECURITIES -- 111.1%
(Cost $612,174,935) 648,036,861
------------
OTHER ASSETS AND LIABILITIES -- (11.1)% (64,954,653)
------------
TOTAL NET ASSETS -- 100.0% $583,082,208
============
- ------
18
Balanced
Futures Contracts
Expiration Underlying Face Amount Unrealized
Contracts Purchased Date at Value Gain (Loss)
653 U.S. Treasury
2-Year Notes June 2008 $138,884,938 $ (7,593)
141 U.S. Treasury
5-Year Notes June 2008 15,789,797 (157,066)
------------ ------------
$154,674,735 $(164,659)
============ ============
Underlying Face Amount Unrealized
Contracts Sold Expiration Date at Value Gain (Loss)
56 U.S. Long Bond June 2008 $ 6,545,875 $ 42,763
355 U.S. Treasury
10-Year Notes June 2008 41,113,437 65,352
------------ ------------
$47,659,312 $108,115
============ ============
Swap Agreements
Notional Unrealized
Amount Description of Agreement Expiration Date Gain (Loss)
CREDIT DEFAULT
$9,700,000 Pay quarterly a fixed rate equal June 2012 $273,637
to 0.35% multiplied by the
notional amount and receive from
Barclays Bank plc upon each
default event of one of the
issues of Dow Jones CDX N.A.
Investment Grade 8, par value of
the proportional notional amount.
1,130,000 Pay quarterly a fixed rate equal December 2012 (4,305)
to 0.40% multiplied by the
notional amount and receive from
Bank of America N.A. upon each
default event of FHLMC, par value
of the proportional notional
amount of FHLMC, VRN, 5.08%,
2/7/11.
1,295,000 Pay quarterly a fixed rate equal September 2012 30,422
to 0.63% multiplied by the
notional amount and receive from
Deutsche Bank AG upon each
default event of Morgan Stanley,
par value of the proportional
notional amount of Morgan
Stanley, 6.60%, 4/1/12.
1,100,000 Pay quarterly a fixed rate equal December 2012 13,284
to 0.72% multiplied by the
notional amount and receive from
Deutsche Bank AG upon each
default event of Barclays Bank
plc, par value of the
proportional notional amount of
Barclays Bank plc, VRN, 4.57%,
10/27/08.
580,000 Pay quarterly a fixed rate equal December 2012 5,968
to 0.73% multiplied by the
notional amount and receive from
Barclays Bank plc upon each
default event of American
International Group, Inc., par
value of the proportional
notional amount of American
International Group, Inc., 4.25%,
5/15/13.
580,000 Pay quarterly a fixed rate equal December 2012 453
to 2.45% multiplied by the
notional amount and receive from
Bank of America N.A. upon each
default event of Toll Brothers,
Inc., par value of the
proportional notional amount of
Toll Brothers Finance Corp.,
6.875%, 11/15/12.
580,000 Pay quarterly a fixed rate equal December 2012 (8,904)
to 2.85% multiplied by the
notional amount and receive from
Barclays Bank plc upon each
default event of Toll Brothers,
Inc., par value of the
proportional notional amount of
Toll Brothers Finance Corp.,
6.875%, 11/15/12.
240,000 Pay quarterly a fixed rate equal March 2013 (1,915)
to 0.70% multiplied by the
notional amount and receive from
Barclays Bank plc upon each
default event of Rohm & Haas
Company, par value of the
proportional notional amount of
Rohm & Haas Company, 7.85%,
7/15/29.
2,650,000 Pay quarterly a fixed rate equal March 2017 37,082
to 0.12% multiplied by the
notional amount and receive from
Barclays Bank plc upon each
default event of Pfizer Inc., par
value of the proportional
notional amount of Pfizer Inc.,
4.65%, 3/1/18.
1,290,000 Pay quarterly a fixed rate equal September 2017 38,508
to 0.64% multiplied by the
notional amount and receive from
Deutsche Bank AG upon each
default event of JPMorgan Chase &
Co., par value of the
proportional notional amount of
JPMorgan Chase & Co., 6.75%,
2/1/11.
------------
$384,230
============
- ------
19
Balanced
Notes to Schedule of Investments
CDX = Credit Derivative Indexes
FHLB = Federal Home Loan Bank
FHLMC = Federal Home Loan Mortgage Corporation
FNMA = Federal National Mortgage Association
FSA = Financial Security Assurance, Inc.
GNMA = Government National Mortgage Association
GO = General Obligation
LB-UBS = Lehman Brothers Inc. -- UBS AG
LIBOR = London Interbank Offered Rate
MASTR = Mortgage Asset Securitization Transactions, Inc.
MBIA = MBIA Insurance Corporation
resets = The frequency with which a security's coupon changes, based on
current market conditions or an underlying index. The more frequently a
security resets, the less risk the investor is taking that the coupon will
vary significantly from current market rates.
SEQ = Sequential Payer
STRIPS = Separate Trading of Registered Interest and Principal of Securities
VRN = Variable Rate Note. Interest reset date is indicated. Rate shown is
effective April 30, 2008.
(1) Industry is less than 0.05% of total net assets.
(2) Non-income producing.
(3) Security, or a portion thereof, was on loan as of April 30, 2008.
(4) Final maturity indicated, unless otherwise noted.
(5) Security, or a portion thereof, has been segregated for forward
commitments, futures contracts and/or swap agreements.
(6) Forward commitment.
(7) Security was purchased under Rule 144A of the Securities Act of 1933 or is
a private placement and, unless registered under the Act or exempted from
registration, may only be sold to qualified institutional investors. The
aggregate value of restricted securities at April 30, 2008, was $8,922,924,
which represented 1.5% of total net assets.
(8) Escrowed to maturity in U.S. government securities or state and local
government securities.
(9) The rate indicated is the yield to maturity at purchase.
(10) Investments represent purchases made by the lending agent with cash
collateral received through securities lending transactions.
See Notes to Financial Statements.
- ------
20
STATEMENT OF ASSETS AND LIABILITIES
APRIL 30, 2008 (UNAUDITED)
ASSETS
Investment securities, at value (cost of $570,008,991) --
including $42,924,236 of securities on loan $605,870,917
Investments made with cash collateral received for securities on
loan, at value (cost of $42,165,944) 42,165,944
-------------
Total investment securities, at value (cost of $612,174,935) 648,036,861
Cash 73,287
Cash collateral received for securities on loan 1,894
Receivable for investments sold 10,918,230
Receivable for variation margin on futures contracts 110,028
Unrealized appreciation on swap agreements 399,354
Dividends and interest receivable 2,052,271
-------------
661,591,925
-------------
LIABILITIES
Payable for collateral received for securities on loan 42,167,838
Payable for investments purchased 35,899,450
Unrealized depreciation on swap agreements 15,124
Accrued management fees 427,305
-------------
78,509,717
-------------
NET ASSETS $583,082,208
=============
NET ASSETS CONSIST OF:
Capital (par value and paid-in surplus) $546,491,986
Undistributed net investment income 1,330,944
Accumulated net realized loss on investment transactions (938,445)
Net unrealized appreciation on investments 36,197,723
-------------
$583,082,208
=============
INVESTOR CLASS, $0.01 PAR VALUE
Net assets $574,913,147
Shares outstanding 36,985,830
Net asset value per share $15.54
INSTITUTIONAL CLASS, $0.01 PAR VALUE
Net assets $8,169,061
Shares outstanding 525,458
Net asset value per share $15.55
See Notes to Financial Statements.
- ------
21
STATEMENT OF OPERATIONS
FOR THE SIX MONTHS ENDED APRIL 30, 2008 (UNAUDITED)
INVESTMENT INCOME (LOSS)
INCOME:
Interest $ 6,377,256
Dividends (net of foreign taxes withheld of $14,612) 3,112,031
Securities lending, net 144,118
-------------
9,633,405
-------------
EXPENSES:
Management fees 2,671,496
Distribution and service fees -- Advisor Class 2,761
Directors' fees and expenses 6,861
Other expenses 651
-------------
2,681,769
-------------
NET INVESTMENT INCOME (LOSS) 6,951,636
-------------
REALIZED AND UNREALIZED GAIN (LOSS)
NET REALIZED GAIN (LOSS) ON:
Investment transactions (2,929,988)
Futures and swaps transactions 2,636,530
-------------
(293,458)
-------------
CHANGE IN NET UNREALIZED APPRECIATION (DEPRECIATION) ON:
Investments (30,492,955)
Futures and swaps 360,113
-------------
(30,132,842)
-------------
NET REALIZED AND UNREALIZED GAIN (LOSS) (30,426,300)
-------------
NET INCREASE (DECREASE) IN NET ASSETS
RESULTING FROM OPERATIONS $(23,474,664)
=============
See Notes to Financial Statements.
- ------
22
STATEMENT OF CHANGES IN NET ASSETS
SIX MONTHS ENDED APRIL 30, 2008 (UNAUDITED) AND YEAR ENDED OCTOBER 31, 2007
Increase (Decrease) in Net Assets 2008 2007
OPERATIONS
Net investment income (loss) $ 6,951,636 $ 13,585,777
Net realized gain (loss) (293,458) 41,026,936
Change in net unrealized
appreciation (depreciation) (30,132,842) 1,286,437
------------- -------------
Net increase (decrease) in net assets
resulting from operations (23,474,664) 55,899,150
------------- -------------
DISTRIBUTIONS TO SHAREHOLDERS
From net investment income:
Investor Class (6,934,467) (13,376,037)
Institutional Class (51,881) (31,846)
Advisor Class -- (278,770)
From net realized gains:
Investor Class (40,498,231) (24,593,629)
Institutional Class (82,676) (48,992)
Advisor Class -- (617,315)
------------- -------------
Decrease in net assets from distributions (47,567,255) (38,946,589)
------------- -------------
CAPITAL SHARE TRANSACTIONS
Net increase (decrease) in net assets
from capital share transactions 3,365,070 (20,109,153)
------------- -------------
NET INCREASE (DECREASE) IN NET ASSETS (67,676,849) (3,156,592)
NET ASSETS
Beginning of period 650,759,057 653,915,649
------------- -------------
End of period $583,082,208 $650,759,057
============= =============
Undistributed net investment income $1,330,944 $1,445,049
============= =============
See Notes to Financial Statements.
- ------
23
NOTES TO FINANCIAL STATEMENTS
APRIL 30, 2008 (UNAUDITED)
1. ORGANIZATION AND SUMMARY OF SIGNIFICANT ACCOUNTING POLICIES
ORGANIZATION -- American Century Mutual Funds, Inc. (the corporation) is
registered under the Investment Company Act of 1940 (the 1940 Act) as an
open-end management investment company. Balanced Fund (the fund) is one fund
in a series issued by the corporation. The fund is diversified under the 1940
Act. The fund's investment objective is to seek long-term capital growth and
current income. The fund pursues its objective by investing approximately 60%
of its assets in equity securities and the remainder in bonds and other
fixed-income securities. The following is a summary of the fund's significant
accounting policies.
MULTIPLE CLASS -- The fund is authorized to issue the Investor Class and the
Institutional Class. Prior to December 3, 2007, the fund was authorized to
issue the Advisor Class (see Note 9). The share classes differ principally in
their respective distribution and shareholder servicing expenses and
arrangements. All shares of the fund represent an equal pro rata interest in
the net assets of the class to which such shares belong, and have identical
voting, dividend, liquidation and other rights and the same terms and
conditions, except for class specific expenses and exclusive rights to vote on
matters affecting only individual classes. Income, non-class specific
expenses, and realized and unrealized capital gains and losses of the fund are
allocated to each class of shares based on their relative net assets.
SECURITY VALUATIONS -- Securities traded primarily on a principal securities
exchange are valued at the last reported sales price, or at the mean of the
latest bid and asked prices where no last sales price is available. Depending
on local convention or regulation, securities traded over-the-counter are
valued at the mean of the latest bid and asked prices, the last sales price,
or the official close price. Debt securities not traded on a principal
securities exchange are valued through a commercial pricing service or at the
mean of the most recent bid and asked prices. Discount notes may be valued
through a commercial pricing service or at amortized cost, which approximates
fair value. Securities traded on foreign securities exchanges and
over-the-counter markets are normally completed before the close of business
on days that the New York Stock Exchange (the Exchange) is open and may also
take place on days when the Exchange is not open. If an event occurs after the
value of a security was established but before the net asset value per share
was determined that was likely to materially change the net asset value, that
security would be valued as determined in accordance with procedures adopted
by the Board of Directors. If the fund determines that the market price of a
portfolio security is not readily available, or that the valuation methods
mentioned above do not reflect the security's fair value, such security is
valued as determined by the Board of Directors or its designee, in accordance
with procedures adopted by the Board of Directors, if such determination would
materially impact a fund's net asset value. Certain other circumstances may
cause the fund to use alternative procedures to value a security such as: a
security has been declared in default; trading in a security has been halted
during the trading day; or there is a foreign market holiday and no trading
will commence.
SECURITY TRANSACTIONS -- For financial reporting purposes, security
transactions are accounted for as of the trade date. Net realized gains and
losses are determined on the identified cost basis, which is also used for
federal income tax purposes.
INVESTMENT INCOME -- Dividend income less foreign taxes withheld, if any, is
recorded as of the ex-dividend date. Interest income is recorded on the
accrual basis and includes paydown gain (loss) and accretion of discounts and
amortization of premiums.
SECURITIES ON LOAN -- The fund may lend portfolio securities through its
lending agent to certain approved borrowers in order to earn additional
income. The income earned, net of any rebates or fees, is included in the
Statement of Operations. The fund continues to recognize any gain or loss in
the market price of the securities loaned and records any interest earned or
dividends declared.
FUTURES CONTRACTS -- The fund may enter into futures contracts in order to
manage the fund's exposure to changes in market conditions. One of the risks
of entering into futures contracts is the possibility that the change in value
of the contract may not correlate with the changes in value of the underlying
securities. Upon entering into a futures contract, the fund is required to
deposit either cash or securities in an amount equal to a certain percentage
of the contract value (initial margin). Subsequent payments (variation margin)
are made or received daily, in cash, by the fund. The variation margin is
equal to the daily change in the contract value and is recorded as unrealized
gains and losses. The fund recognizes a realized gain or loss when the
contract is closed or expires. Net realized and unrealized gains or losses
occurring during the holding period of futures contracts are a component of
realized gain (loss) on futures and swaps transactions and unrealized
appreciation (depreciation) on futures and swaps, respectively.
- ------
24
WHEN-ISSUED AND FORWARD COMMITMENTS -- The fund may engage in securities
transactions on a when-issued or forward commitment basis. In these
transactions, the securities' prices and yields are fixed on the date of the
commitment. In a when-issued transaction, the payment and delivery are
scheduled for a future date and during this period, securities are subject to
market fluctuations. In a forward commitment transaction, the fund may sell a
security and at the same time make a commitment to purchase the same security
at a future date at a specified price. Conversely, the fund may purchase a
security and at the same time make a commitment to sell the same security at a
future date at a specified price. These types of transactions are executed
simultaneously in what are known as "roll" transactions. The fund will
segregate cash, cash equivalents or other appropriate liquid securities on its
records in amounts sufficient to meet the purchase price. The fund accounts
for "roll" transactions as purchases and sales; as such these transactions may
increase portfolio turnover.
SWAP AGREEMENTS -- The fund may enter into swap agreements in order to attempt
to obtain or preserve a particular return or spread at a lower cost than
obtaining a return or spread through purchases and/or sales of instruments in
other markets; protect against currency fluctuations; attempt to manage
duration to protect against any increase in the price of securities the fund
anticipates purchasing at a later date; or gain exposure to certain markets in
the most economical way possible. A basic swap agreement is a contract in
which two parties agree to exchange the returns earned or realized on
predetermined investments or instruments. Credit default swaps enable an
investor to buy/sell protection against a credit event of a specific issuer.
The seller of credit protection against a security or basket of securities
receives an up-front or periodic payment to compensate against potential
default events. The fund may enhance returns by selling protection or attempt
to mitigate credit risk by buying protection. The fund will segregate cash,
cash equivalents or other appropriate liquid securities on its records in
amounts sufficient to meet requirements. Unrealized gains are reported as an
asset and unrealized losses are reported as a liability on the Statement of
Assets and Liabilities. Swap agreements are valued daily and changes in value,
including the periodic amounts of interest to be paid or received on swaps,
are recorded as unrealized appreciation (depreciation) on futures and swaps.
Realized gain or loss is recorded upon receipt or payment of a periodic
settlement or termination of swap agreements. The risks of entering into swap
agreements include the possible lack of liquidity, failure of the counterparty
to meet its obligations, and that there may be unfavorable changes in the
underlying investments and instruments.
REPURCHASE AGREEMENTS -- The fund may enter into repurchase agreements with
institutions that American Century Investment Management, Inc. (ACIM) (the
investment advisor) has determined are creditworthy pursuant to criteria
adopted by the Board of Directors. Each repurchase agreement is recorded at
cost. The fund requires that the collateral, represented by securities,
received in a repurchase transaction be transferred to the custodian in a
manner sufficient to enable the fund to obtain those securities in the event
of a default under the repurchase agreement. ACIM monitors, on a daily basis,
the securities transferred to ensure the value, including accrued interest, of
the securities under each repurchase agreement is equal to or greater than
amounts owed to the fund under each repurchase agreement.
JOINT TRADING ACCOUNT -- Pursuant to an Exemptive Order issued by the
Securities and Exchange Commission, the fund, along with other registered
investment companies having management agreements with ACIM or American
Century Global Investment Management, Inc. (ACGIM), may transfer uninvested
cash balances into a joint trading account. These balances are invested in one
or more repurchase agreements that are collateralized by U.S. Treasury or
Agency obligations.
INCOME TAX STATUS -- It is the fund's policy to distribute substantially all
net investment income and net realized gains to shareholders and to otherwise
qualify as a regulated investment company under provisions of the Internal
Revenue Code. The fund is no longer subject to examination by tax authorities
for years prior to 2004. At this time, management has not identified any
uncertain tax positions for which it is reasonably possible that the total
amounts of unrecognized tax benefits will significantly change in the next
twelve months. Accordingly, no provision has been made for federal or state
income taxes. Interest and penalties associated with any federal or state
income tax obligations, if any, are recorded as interest expense.
DISTRIBUTIONS TO SHAREHOLDERS -- Distributions to shareholders are recorded on
the ex-dividend date. Distributions from net investment income are declared
and paid quarterly. Distributions from net realized gains, if any, are
generally declared and paid annually.
- ------
25
INDEMNIFICATIONS -- Under the corporation's organizational documents, its
officers and directors are indemnified against certain liabilities arising out
of the performance of their duties to the fund. In addition, in the normal
course of business, the fund enters into contracts that provide general
indemnifications. The fund's maximum exposure under these arrangements is
unknown as this would involve future claims that may be made against the fund.
The risk of material loss from such claims is considered by management to be
remote.
USE OF ESTIMATES -- The financial statements are prepared in conformity with
accounting principles generally accepted in the United States of America,
which may require management to make certain estimates and assumptions at the
date of the financial statements. Actual results could differ from these
estimates.
2. FEES AND TRANSACTIONS WITH RELATED PARTIES
MANAGEMENT FEES -- The corporation has entered into a Management Agreement
with ACIM, under which ACIM provides the fund with investment advisory and
management services in exchange for a single, unified management fee (the fee)
per class. The Agreement provides that all expenses of the fund, except
brokerage commissions, taxes, interest, fees and expenses of those directors
who are not considered "interested persons" as defined in the 1940 Act
(including counsel fees) and extraordinary expenses, will be paid by ACIM. The
fee is computed and accrued daily based on the daily net assets of the
specific class of shares of the fund and paid monthly in arrears. For funds
with a stepped fee schedule, the rate of the fee is determined by applying a
fee rate calculation formula. This formula takes into account all of the
investment advisor's assets under management in the fund's investment strategy
(strategy assets) to calculate the appropriate fee rate for the fund. The
strategy assets include the fund's assets and the assets of other clients of
the investment advisor that are not in the American Century family of funds,
but that have the same investment team and investment strategy. The annual
management fee schedule for the fund ranges from 0.80% to 0.90% for the
Investor Class and Advisor Class. The Institutional Class is 0.20% less at
each point within the range. The effective annual management fee for the six
months ended April 30, 2008 was 0.90% and 0.70%, for the Investor Class and
Institutional Class, respectively.
DISTRIBUTION AND SERVICE FEES -- The Board of Directors has adopted a Master
Distribution and Individual Shareholder Services Plan (the plan) for the
Advisor Class, pursuant to Rule 12b-1 of the 1940 Act. The plan provides that
the Advisor Class will pay American Century Investment Services, Inc. (ACIS)
an annual distribution and service fee equal to 0.25%. The fees are computed
and accrued daily based on the Advisor Class's daily net assets and paid
monthly in arrears. The distribution fee provides compensation for expenses
incurred in connection with distributing shares of the Advisor Class
including, but not limited to, payments to brokers, dealers, and financial
institutions that have entered into sales agreements with respect to shares of
the fund. The service fee provides compensation for shareholder and
administrative services rendered by ACIS, its affiliates or independent third
party providers. Fees incurred under the plan during the six months ended
April 30, 2008, are detailed in the Statement of Operations.
RELATED PARTIES -- Certain officers and directors of the corporation are also
officers and/or directors, and, as a group, controlling stockholders of
American Century Companies, Inc. (ACC), the parent of the corporation's
investment advisor, ACIM, the distributor of the corporation, ACIS, and the
corporation's transfer agent, American Century Services, LLC.
The fund is eligible to invest in a money market fund for temporary purposes,
which is managed by J.P. Morgan Investment Management, Inc. (JPMIM). JPMIM is
a wholly owned subsidiary of JPMorgan Chase & Co. (JPM). JPM is an equity
investor in ACC. The fund has a securities lending agreement with JPMorgan
Chase Bank (JPMCB). Prior to December 12, 2007, the fund had a bank line of
credit agreement with JPMCB. JPMCB is a custodian of the fund and a wholly
owned subsidiary of JPM.
3. INVESTMENT TRANSACTIONS
Purchases of investment securities, excluding short-term investments, for the
six months ended April 30, 2008, totaled $420,509,857, of which $188,243,800
represented U.S. Treasury and Agency obligations. Sales of investment
securities, excluding short-term investments, for the six months ended April
30, 2008, totaled $461,387,380, of which $228,461,292 represented U.S.
Treasury and Agency obligations.
- ------
26
4. CAPITAL SHARE TRANSACTIONS
Transactions in shares of the fund were as follows:
Six months ended Year ended
April 30, 2008 October 31, 2007
Shares Amount Shares Amount
INVESTOR CLASS/
SHARES AUTHORIZED 250,000,000 200,000,000
=========== ===========
Sold 1,534,630 $ 24,119,468 3,006,468 $ 51,143,165
Issued in connection
with
reclassification
(Note 9) 732,507 12,525,159 -- --
Issued in
reinvestment of
distributions 2,927,632 46,311,449 2,197,817 36,858,846
Redeemed (4,629,943) (73,649,597) (6,167,002) (105,041,020)
----------- ------------- ----------- -------------
564,826 9,306,479 (962,717) (17,039,009)
----------- ------------- ----------- -------------
INSTITUTIONAL
CLASS/SHARES
AUTHORIZED 15,000,000 15,000,000
Sold 498,420 7,695,663 26,034 443,053
Issued in
reinvestment of
distributions 8,600 134,557 4,818 80,838
Redeemed (58,144) (901,336) (26,339) (453,631)
----------- ------------- ----------- -------------
448,876 6,928,884 4,513 70,260
----------- ------------- ----------- -------------
ADVISOR CLASS/
SHARES AUTHORIZED N/A 50,000,000
=========== ===========
Sold 5,330 90,447 203,936 3,468,589
Issued in
reinvestment of
distributions -- -- 46,532 776,513
Redeemed in
connection with
reclassification
(Note 9) (732,507) (12,525,159) -- --
Redeemed (25,768) (435,581) (430,742) (7,385,506)
----------- ------------- ----------- -------------
(752,945) (12,870,293) (180,274) (3,140,404)
----------- ------------- ----------- -------------
Net increase
(decrease) 260,757 $ 3,365,070 (1,138,478) $(20,109,153)
=========== ============= =========== =============
5. SECURITIES LENDING
As of April 30, 2008, securities in the fund valued at $42,924,236 were on
loan through the lending agent, JPMCB, to certain approved borrowers. JPMCB
receives and maintains collateral in the form of cash and/or acceptable
securities as approved by ACIM. Cash collateral is invested in authorized
investments by the lending agent in a pooled account. The value of cash
collateral received at period end is disclosed in the Statement of Assets and
Liabilities and investments made with the cash by the lending agent are listed
in the Schedule of Investments. Any deficiencies or excess of collateral must
be delivered or transferred by the member firms no later than the close of
business on the next business day. The total market value of all collateral
received, at this date, was $43,833,697. The fund's risks in securities
lending are that the borrower may not provide additional collateral when
required or return the securities when due. If the borrower defaults, receipt
of the collateral by the fund may be delayed or limited.
6. BANK LINE OF CREDIT
Effective December 12, 2007, the fund, along with certain other funds managed
by ACIM or ACGIM, has a $500,000,000 unsecured bank line of credit agreement
with Bank of America, N.A. Prior to December 12, 2007, the fund, along with
certain other funds managed by ACIM or ACGIM, had a $500,000,000 unsecured
bank line of credit agreement with JPMCB. The fund may borrow money for
temporary or emergency purposes to fund shareholder redemptions. Borrowings
under the agreement, which is subject to annual renewal, bear interest at the
Federal Funds rate plus 0.40%. The fund did not borrow from the line during
the six months ended April 30, 2008.
7. RISK FACTORS
There are certain risks involved in investing in foreign securities. These
risks include those resulting from future adverse political, social, and
economic developments, fluctuations in currency exchange rates, the possible
imposition of exchange controls, and other foreign laws or restrictions.
- ------
27
8. FEDERAL TAX INFORMATION
The book-basis character of distributions made during the year from net
investment income or net realized gains may differ from their ultimate
characterization for federal income tax purposes. These differences reflect
the differing character of paydown losses, interest on swap agreements,
certain income items and net realized gains and losses for financial statement
and tax purposes, and may result in reclassification among certain capital
accounts on the financial statements.
As of April 30, 2008, the components of investments for federal income tax
purposes were as follows:
Federal tax cost of investments $614,651,132
=============
Gross tax appreciation of investments $ 47,877,482
Gross tax depreciation of investments (14,491,753)
-------------
Net tax appreciation (depreciation) of investments $ 33,385,729
=============
The difference between book-basis and tax-basis cost and unrealized
appreciation (depreciation) is attributable primarily to the tax deferral of
losses on wash sales.
9. CORPORATE EVENT
On July 27, 2007, the Advisor Class shareholders of the fund approved a
reclassification of Advisor Class shares into Investor Class shares. The
change was approved by the Board of Directors on November 29, 2006 and March
7, 2007. The reclassification was effective on December 3, 2007.
10. RECENTLY ISSUED ACCOUNTING STANDARDS
The Financial Accounting Standards Board (FASB) issued Statement of Financial
Accounting Standards No. 157, "Fair Value Measurements" (FAS 157), in
September 2006, which is effective for fiscal years beginning after November
15, 2007. FAS 157 defines fair value, establishes a framework for measuring
fair value and expands the required financial statement disclosures about fair
value measurements. Management is currently evaluating the impact that
adopting FAS 157 will have on the financial statement disclosures.
In March 2008, the FASB issued Statement of Financial Accounting Standards No.
161, "Disclosures about Derivative Instruments and Hedging Activities -- an
amendment of FASB Statement No. 133" (FAS 161). FAS 161 is effective for
fiscal years beginning after November 15, 2008. FAS 161 amends and expands
disclosures about derivative instruments and hedging activities. FAS 161
requires qualitative disclosures about the objectives and strategies of
derivative instruments, quantitative disclosures about the fair value amounts
of and gains and losses on derivative instruments, and disclosures of
credit-risk-related contingent features in hedging activities. Management is
currently evaluating the impact that adopting FAS 161 will have on the
financial statement disclosures.
- ------
28
FINANCIAL HIGHLIGHTS
Balanced
Investor Class
For a Share Outstanding Throughout the Years Ended October 31 (except as noted)
2008(1) 2007 2006 2005 2004 2003
PER-SHARE DATA
Net Asset Value,
Beginning of Period $17.47 $17.03 $16.52 $15.73 $14.77 $12.98
------- ------- ------- ------- ------- -------
Income From
Investment Operations
Net Investment
Income (Loss)(2) 0.18 0.35 0.35 0.31 0.26 0.27
Net Realized
and Unrealized
Gain (Loss) (0.81) 1.11 1.40 0.77 0.98 1.77
------- ------- ------- ------- ------- -------
Total From
Investment
Operations (0.63) 1.46 1.75 1.08 1.24 2.04
------- ------- ------- ------- ------- -------
Distributions
From Net
Investment Income (0.18) (0.36) (0.35) (0.29) (0.28) (0.25)
From Net
Realized Gains (1.12) (0.66) (0.89) -- -- --
------- ------- ------- ------- ------- -------
Total
Distributions (1.30) (1.02) (1.24) (0.29) (0.28) (0.25)
------- ------- ------- ------- ------- -------
Net Asset Value,
End of Period $15.54 $17.47 $17.03 $16.52 $15.73 $14.77
======= ======= ======= ======= ======= =======
TOTAL RETURN(3) (3.64)% 8.92% 11.04% 6.89% 8.46% 15.92%
RATIOS/SUPPLEMENTAL DATA
Ratio of Operating
Expenses to
Average Net Assets 0.90%(4) 0.90% 0.90% 0.90% 0.90% 0.90%
Ratio of Net
Investment Income
(Loss) to Average Net
Assets 2.34%(4) 2.08% 2.13% 1.89% 1.65% 1.96%
Portfolio
Turnover Rate 72% 161% 197% 206% 204% 133%
Net Assets,
End of Period
(in millions) $575 $636 $637 $615 $595 $583
(1) Six months ended April 30, 2008 (unaudited).
(2) Computed using average shares outstanding throughout the period.
(3) Total return assumes reinvestment of net investment income and capital
gains distributions, if any. Total returns for periods less than one year are
not annualized. The total return of the classes may not precisely reflect the
class expense differences because of the impact of calculating the net asset
values to two decimal places. If net asset values were calculated to three
decimal places, the total return differences would more closely reflect the
class expense differences. The calculation of net asset values to two decimal
places is made in accordance with SEC guidelines and does not result in any
gain or loss of value between one class and another.
(4) Annualized.
See Notes to Financial Statements.
- ------
29
Balanced
Institutional Class
For a Share Outstanding Throughout the Years Ended October 31 (except as noted)
2008(1) 2007 2006 2005 2004 2003
PER-SHARE DATA
Net Asset Value,
Beginning of Period $17.47 $17.04 $16.53 $15.73 $14.78 $12.99
------- ------- ------- ------- ------- -------
Income From
Investment Operations
Net Investment
Income (Loss)(2) 0.19 0.39 0.38 0.33 0.28 0.41
Net Realized
and Unrealized
Gain (Loss) (0.79) 1.09 1.40 0.80 0.98 1.66
------- ------- ------- ------- ------- -------
Total From
Investment
Operations (0.60) 1.48 1.78 1.13 1.26 2.07
------- ------- ------- ------- ------- -------
Distributions
From Net
Investment Income (0.20) (0.39) (0.38) (0.33) (0.31) (0.28)
From Net
Realized Gains (1.12) (0.66) (0.89) -- -- --
------- ------- ------- ------- ------- -------
Total
Distributions (1.32) (1.05) (1.27) (0.33) (0.31) (0.28)
------- ------- ------- ------- ------- -------
Net Asset Value,
End of Period $15.55 $17.47 $17.04 $16.53 $15.73 $14.78
======= ======= ======= ======= ======= =======
TOTAL RETURN(3) (3.48)% 9.07% 11.26% 7.17% 8.61% 16.13%
RATIOS/SUPPLEMENTAL DATA
Ratio of Operating
Expenses to
Average Net Assets 0.70%(4) 0.70% 0.70% 0.70% 0.70% 0.70%
Ratio of Net
Investment Income
(Loss) to Average Net
Assets 2.54%(4) 2.28% 2.33% 2.09% 1.85% 2.16%
Portfolio
Turnover Rate 72% 161% 197% 206% 204% 133%
Net Assets,
End of Period
(in thousands) $8,169 $1,338 $1,228 $1,237 $225 $155
(1) Six months ended April 30, 2008 (unaudited).
(2) Computed using average shares outstanding throughout the period.
(3) Total return assumes reinvestment of net investment income and capital
gains distributions, if any. Total returns for periods less than one year are
not annualized. The total return of the classes may not precisely reflect the
class expense differences because of the impact of calculating the net asset
values to two decimal places. If net asset values were calculated to three
decimal places, the total return differences would more closely reflect the
class expense differences. The calculation of net asset values to two decimal
places is made in accordance with SEC guidelines and does not result in any
gain or loss of value between one class and another.
(4) Annualized.
See Notes to Financial Statements.
- ------
30
ADDITIONAL INFORMATION
RETIREMENT ACCOUNT INFORMATION
As required by law, any distributions you receive from an IRA or certain
403(b), 457 and qualified plans [those not eligible for rollover to an IRA or
to another qualified plan] are subject to federal income tax withholding,
unless you elect not to have withholding apply. Tax will be withheld on the
total amount withdrawn even though you may be receiving amounts that are not
subject to withholding, such as nondeductible contributions. In such case,
excess amounts of withholding could occur. You may adjust your withholding
election so that a greater or lesser amount will be withheld.
If you don't want us to withhold on this amount, you must notify us to not
withhold the federal income tax. Even if you plan to roll over the amount you
withdraw to another tax-deferred account, the withholding rate still applies
to the withdrawn amount unless we have received notice not to withhold federal
income tax prior to the withdrawal. You may notify us in writing or in certain
situations by telephone or through other electronic means. You have the right
to revoke your withholding election at any time and any election you make may
remain in effect until revoked by filing a new election.
Remember, even if you elect not to have income tax withheld, you are liable
for paying income tax on the taxable portion of your withdrawal. If you elect
not to have income tax withheld or you don't have enough income tax withheld,
you may be responsible for payment of estimated tax. You may incur penalties
under the estimated tax rules if your withholding and estimated tax payments
are not sufficient.
State tax will be withheld if, at the time of your distribution, your address
is within one of the mandatory withholding states and you have federal income
tax withheld. State taxes will be withheld from your distribution in
accordance with the respective state rules.
PROXY VOTING GUIDELINES
American Century Investment Management, Inc., the fund's investment advisor,
is responsible for exercising the voting rights associated with the securities
purchased and/or held by the fund. A description of the policies and
procedures the advisor uses in fulfilling this responsibility is available
without charge, upon request, by calling 1-800-345-2021. It is also available
on American Century Investments' website at americancentury.com and on the
Securities and Exchange Commission's website at sec.gov. Information regarding
how the investment advisor voted proxies relating to portfolio securities
during the most recent 12-month period ended June 30 is available on the
"About Us" page at americancentury.com. It is also available at sec.gov.
QUARTERLY PORTFOLIO DISCLOSURE
The fund files its complete schedule of portfolio holdings with the Securities
and Exchange Commission (SEC) for the first and third quarters of each fiscal
year on Form N-Q. The fund's Form N-Q is available on the SEC's website at
sec.gov, and may be reviewed and copied at the SEC's Public Reference Room in
Washington, DC. Information on the operation of the Public Reference Room may
be obtained by calling 1-800-SEC-0330. The fund also makes its complete
schedule of portfolio holdings for the most recent quarter of its fiscal year
available on its website at americancentury.com and, upon request, by calling
1-800-345-2021.
- ------
31
INDEX DEFINITIONS
The following indices are used to illustrate investment market, sector, or
style performance or to serve as fund performance comparisons. They are not
investment products available for purchase.
The BLENDED INDEX is considered the benchmark for Balanced. It combines two
widely known indices in proportion to the asset mix of the fund. Accordingly,
60% of the index is represented by the S&P 500 Index, which reflects the
approximately 60% of the fund's assets invested in stocks. The blended index's
remaining 40% is represented by the Citigroup US Broad Investment-Grade Bond
Index, which reflects the roughly 40% of the fund's assets invested in
fixed-income securities.
The CITIGROUP AGENCY INDEX is a market-capitalization-weighted index that
includes US government sponsored agencies with a remaining maturity of at
least one year.
The CITIGROUP CREDIT INDEX includes US and non-US corporate securities and
non-US sovereign and provincial securities.
The CITIGROUP MORTGAGE INDEX measures the mortgage component of the US BIG
Bond Index, comprising 30- and 15-year GNMA, FNMA, and FHLMC pass-throughs and
FNMA and FHLMC balloon mortgages.
The CITIGROUP TREASURY INDEX is comprised of US Treasury securities with an
amount outstanding of at least $5 billion and a remaining maturity of at least
one year.
The CITIGROUP US BROAD INVESTMENT-GRADE (BIG) BOND INDEX is a market-
capitalization-weighted index that includes fixed-rate Treasury, government-
sponsored, mortgage, asset-backed, and investment-grade issues with a maturity
of one year or longer.
The RUSSELL 1000® INDEX is a market-capitalization weighted, large-cap index
created by Frank Russell Company to measure the performance of the 1,000
largest publicly traded U.S. companies, based on total market capitalization.
The RUSSELL 2000® INDEX is a market-capitalization weighted index created by
Frank Russell Company to measure the performance of the 2,000 smallest of the
3,000 largest publicly traded U.S. companies, based on total market
capitalization.
The RUSSELL MIDCAP® INDEX measures the performance of the 800 smallest of the
1,000 largest publicly traded U.S. companies, based on total market
capitalization.
The S&P 500 INDEX is a market value-weighted index of the stocks of 500
publicly traded U.S. companies chosen for market size, liquidity, and industry
group representation that are considered to be leading firms in dominant
industries. Each stock's weight in the index is proportionate to its market
value. Created by Standard & Poor's, it is considered to be a broad measure of
U.S. stock market performance.
- ------
32
[back cover]
[american century investments logo and text logo ®]
CONTACT US
AMERICANCENTURY.COM
AUTOMATED INFORMATION LINE . . . . . . . . . . . . . . 1-800-345-8765
INVESTOR SERVICES REPRESENTATIVE . . . . . . . . . . . 1-800-345-2021 or
816-531-5575
BUSINESS, NOT-FOR-PROFIT, EMPLOYER-SPONSORED
RETIREMENT PLANS . . . . . . . . . . . . . . . . . . . 1-800-345-3533
BANKS AND TRUST COMPANIES, BROKER-DEALERS,
FINANCIAL PROFESSIONALS, INSURANCE COMPANIES . . . . . 1-800-345-6488
TELECOMMUNICATIONS DEVICE FOR THE DEAF . . . . . . . . 1-800-634-4113
AMERICAN CENTURY MUTUAL FUNDS, INC.
INVESTMENT ADVISOR:
American Century Investment Management, Inc.
Kansas City, Missouri
This report and the statements it contains are submitted for the general
information of our shareholders. The report is not authorized for distribution
to prospective investors unless preceded or accompanied by an effective
prospectus.
American Century Investments
P.O. Box 419200
Kansas City, MO 64141-6200
PRSRT STD
U.S. POSTAGE PAID
AMERICAN CENTURY
COMPANIES
American Century Investment Services, Inc., Distributor
©2008 American Century Proprietary Holdings, Inc. All rights reserved.
0806
CL-SAN-60497S
[front cover]
SEMIANNUAL REPORT
APRIL 30, 2008
[american century investments logo and text logo ®]
AMERICAN CENTURY INVESTMENTS
VEEDOT® FUND
PRESIDENT'S LETTER
JONATHAN THOMAS
[photo of Jonathan Thomas]
Dear Investor,
At American Century Investments®, we are committed to helping you reach your
financial goals. Your success is the ultimate measure of our performance.
That's why we focus on achieving superior investment results and building
long-term relationships with investors like you.
Part of that relationship is to clearly communicate investment results and
what influenced them. To help you monitor your investment with us, we take
pride in providing you with the semiannual report for the American Century®
Veedot Fund for the six months ended April 30, 2008. We also recommend
americancentury.com, where we provide company news, quarterly portfolio
commentaries, investment views, and other useful information.
As noted on the website, 2008 marks the 50th anniversary of American Century
Investments. Since 1958, we've worked to make wise decisions with your
interests as our guide. Fifty years also means that we've met the challenges
of previous economic downturns. As we've crossed those hurdles and earned your
trust, our assets under management have grown to nearly $100 billion, putting
us in the top 5% of our industry. This growth has given us the resources to
offer a wide array of financial products and services, including a
well-diversified line-up of portfolios that provide you with many choices in
these uncertain times.
Though our offerings are diverse, they share several key qualities, including
our disciplined investment approach and active, team-based management. Strict
adherence to our processes and long-term strategies allows us to stay focused
during volatile periods. Investors in our portfolios also benefit from the sum
of our investment teams' expertise as they share research and information.
We'll continue to work hard to earn your trust. Thank you for your continued
support.
Sincerely,
/s/Jonathan Thomas
Jonathan S. Thomas
President and Chief Executive Officer
American Century Investments
TABLE OF CONTENTS
Market Perspective. . . . . . . . . . . . . . . . . . . . . . . . . . 2
U.S. Stock Index Returns . . . . . . . . . . . . . . . . . . . . . . 2
VEEDOT
Performance . . . . . . . . . . . . . . . . . . . . . . . . . . . . . 3
Portfolio Commentary. . . . . . . . . . . . . . . . . . . . . . . . . 5
Top Ten Holdings . . . . . . . . . . . . . . . . . . . . . . . . . . 5
Top Five Industries. . . . . . . . . . . . . . . . . . . . . . . . . 6
Types of Investments in Portfolio. . . . . . . . . . . . . . . . . . 6
Shareholder Fee Example . . . . . . . . . . . . . . . . . . . . . . . 7
Schedule of Investments . . . . . . . . . . . . . . . . . . . . . . . 9
FINANCIAL STATEMENTS
Statement of Assets and Liabilities . . . . . . . . . . . . . . . . . 12
Statement of Operations . . . . . . . . . . . . . . . . . . . . . . . 13
Statement of Changes in Net Assets. . . . . . . . . . . . . . . . . . 14
Notes to Financial Statements . . . . . . . . . . . . . . . . . . . . 15
Financial Highlights. . . . . . . . . . . . . . . . . . . . . . . . . 19
OTHER INFORMATION
Additional Information. . . . . . . . . . . . . . . . . . . . . . . . 21
Index Definitions . . . . . . . . . . . . . . . . . . . . . . . . . . 22
The opinions expressed in the Market Perspective and the Portfolio Commentary
reflect those of the portfolio management team as of the date of the report,
and do not necessarily represent the opinions of American Century or any other
person in the American Century organization. Any such opinions are subject to
change at any time based upon market or other conditions and American Century
disclaims any responsibility to update such opinions. These opinions may not
be relied upon as investment advice and, because investment decisions made by
American Century funds are based on numerous factors, may not be relied upon
as an indication of trading intent on behalf of any American Century fund.
Security examples are used for representational purposes only and are not
intended as recommendations to purchase or sell securities. Performance
information for comparative indices and securities is provided to American
Century by third party vendors. To the best of American Century's knowledge,
such information is accurate at the time of printing.
MARKET PERSPECTIVE
[photo of Chief Investment Officer]
By Steve Lurito, Chief Investment Officer, U.S. Growth Equity
VOLATILITY UP, STOCKS DOWN
The six months ended April 30, 2008 saw stocks produce negative returns as
market volatility surged in the wake of the subprime credit crisis. In terms
of the economy, tighter credit and the slumping housing market hurt consumer
spending and confidence, leading many economists to suggest we're already in
recession. Meanwhile, mounting losses hurt the banks, brokers, and other big
institutional players important for the functioning of the financial markets.
Facing dual economic and financial crises, the Federal Reserve (the Fed) took
a series of extraordinary steps, slashing interest rates and acting as a
lender of last resort not only for banks, but also major brokers. That helped
stocks rebound, with many analysts suggesting that the mid-March buy-out of
investment bank Bear Stearns--in a deal arranged by the Fed--put a floor under
the market.
RETURNS BY SIZE, STYLE MIXED
Performance by size and style was mixed (see the accompanying table),
reflecting the volatile trading during the period, when corporate earnings
estimates were revised down sharply. Looking at returns by sector, energy
shares were the only segment to produce positive results during the six
months. At the other end of the spectrum, credit-related losses took a big
bite out of earnings for financials stocks, which performed worst. Consumer
discretionary shares also lagged badly, as did information technology stocks,
which suffered from poor pricing and demand trends for chips and some
consumer-related tech goods.
OPPORTUNITY AMID VOLATILITY
Despite the uncertainty surrounding the economy, we think growth-oriented
stocks can perform well relative to value as proven earnings growth becomes
scarce during economic slowdowns. And while we don't see an end to market
volatility anytime soon, we view this dynamic as a natural part of the
investing cycle--and one that presents us with opportunities to build
positions in what we believe are high-quality companies trading at attractive
prices. Indeed, investors should rest assured that we're finding no shortage
of companies demonstrating sustained earnings growth and business improvement.
U.S. Stock Index Returns
For the six months ended April 30, 2008*
RUSSELL 1000 INDEX (LARGE-CAP) -9.54%
Russell 1000 Growth Index -9.28%
Russell 1000 Value Index -9.83%
RUSSELL MIDCAP INDEX -8.77%
Russell Midcap Growth Index -8.44%
Russell Midcap Value Index -9.20%
RUSSELL 2000 INDEX (SMALL-CAP) -12.92%
Russell 2000 Growth Index -14.14%
Russell 2000 Value Index -11.55%
* Total returns for periods less than one year are not annualized.
- ------
2
PERFORMANCE
Veedot
Total Returns as of April 30, 2008
Average Annual Returns
Since Inception
6 months(1) 1 year 5 years Inception Date
INVESTOR CLASS -15.78% 10.34% 15.54% 5.41% 11/30/99
RUSSELL 3000 INDEX(2) -9.82% -5.16% 11.40% 2.50% --
Institutional Class -15.78% 10.49% 15.74% 3.35% 8/1/00
(1) Total returns for periods less than one year are not annualized.
(2) Data provided by Lipper Inc. -- A Reuters Company. ©2008 Reuters. All
rights reserved. Any copying, republication or redistribution of Lipper
content, including by caching, framing or similar means, is expressly
prohibited without the prior written consent of Lipper. Lipper shall not be
liable for any errors or delays in the content, or for any actions taken in
reliance thereon.
The data contained herein has been obtained from company reports, financial
reporting services, periodicals and other resources believed to be reliable.
Although carefully verified, data on compilations is not guaranteed by Lipper
and may be incomplete. No offer or solicitations to buy or sell any of the
securities herein is being made by Lipper.
Data presented reflect past performance. Past performance is no guarantee of
future results. Current performance may be higher or lower than the
performance shown. Investment return and principal value will fluctuate, and
redemption value may be more or less than original cost. To obtain performance
data current to the most recent month end, please call 1-800-345-2021 or visit
americancentury.com. The fund's investment process may involve high portfolio
turnover, high commission costs and high capital gains distributions. In
addition, its investment approach may involve higher volatility and risk.
International investing involves special risks, such as political instability
and currency fluctuations. Investing in emerging markets may accentuate these
risks.
Unless otherwise indicated, performance reflects Investor Class shares;
performance for other share classes will vary due to differences in fee
structure. For information about other share classes available, please consult
the prospectus. Data assumes reinvestment of dividends and capital gains, and
none of the charts reflect the deduction of taxes that a shareholder would pay
on fund distributions or the redemption of fund shares. Returns for the index
are provided for comparison. The fund's total returns include operating
expenses (such as transaction costs and management fees) that reduce returns,
while the total returns of the index do not.
- ------
3
Veedot
Growth of $10,000 Over Life of Class
$10,000 investment made November 30, 1999
One-Year Returns Over Life of Class
Periods ended April 30
2000* 2001 2002 2003 2004 2005 2006 2007 2008
Investor
Class 35.20% -26.18% -4.21% -20.92% 32.28% 0.20% 28.94% 9.29% 10.34%
Russell
3000 Index 7.32% -12.96% -10.73% -13.99% 25.11% 6.97% 18.08% 14.48% -5.16%
* From 11/30/99, the Investor Class's inception date. Not annualized.
Data presented reflect past performance. Past performance is no guarantee of
future results. Current performance may be higher or lower than the
performance shown. Investment return and principal value will fluctuate, and
redemption value may be more or less than original cost. To obtain performance
data current to the most recent month end, please call 1-800-345-2021 or visit
americancentury.com. The fund's investment process may involve high portfolio
turnover, high commission costs and high capital gains distributions. In
addition, its investment approach may involve higher volatility and risk.
International investing involves special risks, such as political instability
and currency fluctuations. Investing in emerging markets may accentuate these
risks.
Unless otherwise indicated, performance reflects Investor Class shares;
performance for other share classes will vary due to differences in fee
structure. For information about other share classes available, please consult
the prospectus. Data assumes reinvestment of dividends and capital gains, and
none of the charts reflect the deduction of taxes that a shareholder would pay
on fund distributions or the redemption of fund shares. Returns for the index
are provided for comparison. The fund's total returns include operating
expenses (such as transaction costs and management fees) that reduce returns,
while the total returns of the index do not.
- ------
4
PORTFOLIO COMMENTARY
Veedot
Portfolio Manager: John Small, Jr.
PERFORMANCE SUMMARY
Veedot returned -15.78%* for the six months ended April 30, 2008, compared
with its benchmark, the Russell 3000 Index, which returned -9.82% for the
period.
As discussed in the Market Perspective on page 2, equity markets generally
declined during the reporting period, as the subprime-mortgage crisis spread
to other areas of the economy, and rising energy and commodity prices
increased inflation concerns. In this environment, mid-cap stocks outpaced
their large- and small-cap counterparts, while growth-oriented shares
outperformed value stocks in both the large- and mid-cap spaces.
Amid the volatility, Veedot's highly systematic investment process struggled
with a difficult environment that weighed on performance relative to benchmark
returns. Stock selection in the information technology, industrials, and
consumer discretionary sectors, as well as an overweight allocation to the
information technology sector accounted for the bulk of Veedot's poor absolute
and relative performance. Slightly curtailing those losses, effective stock
selection in the materials sector yielded positive absolute and relative
results.
Veedot also maintained a significant allocation to foreign holdings. During
the reporting period, these holdings collectively detracted from portfolio
returns.
TECHNOLOGY DETRACTED
The information technology sector represented Veedot's largest absolute and
relative sector weakness, as many technology companies saw a retracing of
share price in the face of profit-taking. China Finance Online, which operates
online, subscription-based information services on Chinese investment markets,
was a significant positive contributor to portfolio returns in the past. The
company, whose share price tumbled 47%, is not represented in the benchmark.
Blue Coat Systems, a maker of proxy server appliances, was a meaningful
contributor to gains in previous periods, but lost ground in the current
reporting period. Blue Coat, whose share price slid 48%, was one of several
overweight holdings in the communications equipment industry to weigh on
relative performance.
Top Ten Holdings as of April 30, 2008
% of net % of net
assets as of assets as of
4/30/08 10/31/07
Lindsay Corp.(1) 2.6% 1.0%
Sohu.com Inc. 2.1% 1.5%
Research In Motion Ltd. 1.9% 1.6%
Badger Meter Inc. 1.7% 1.0%
Cal-Maine Foods, Inc. 1.7% 1.1%
Mosaic Co. (The) 1.6% 1.5%
Republic Bancorp, Inc. Cl A 1.5% --
ICON plc ADR 1.5% 1.0%
Central European Distribution Corp. 1.4% --
Metalico, Inc. 1.4% 1.0%
(1) Formerly Lindsay Manufacturing Co.
* All fund returns referenced in this commentary are for Investor Class
shares. Total returns for periods less than one year are not annualized.
- ------
5
Veedot
INDUSTRIALS SANK, BUT CERTAIN HOLDINGS HELPED
Within the industrials sector, Veedot maintained an overweight stake in
shipping companies that are not represented in the benchmark. Meaningful
contributors to performance in the past amid escalating spot dry bulk shipping
prices, these companies collectively detracted from absolute and relative
gains in the reporting period. DryShips and TBS International, in particular,
weighed on relative returns as their share prices sank 30% and 36%,
respectively.
Elsewhere in industrials, select holdings aided portfolio performance.
Overweight stakes in the machinery industry benefited from increased demand
for agriculture machinery and irrigation systems. Lindsay Corp., a maker of
agriculture irrigation systems, was the largest single positive contributor to
Veedot's performance as its share price gained 112%.
MATERIALS HELPED
Veedot's overweight in materials reflected a focus on the chemicals industry.
This group has benefited as a higher standard of living in emerging-market
countries, lower availability of farmland, and greater global focus on
biofuels has translated into growing global demand for agriculture. That
increased demand has in turn led to a corresponding rise in commodities prices
and demand for fertilizer.
Fertilizer company Mosaic, in particular, was a contributor to absolute and
relative portfolio returns as the company continued to benefit from higher
demand in the fertilizer market. Mosaic, whose share price climbed 76%, is not
a benchmark constituent. An overweight stake in nitrogen and phosphate
fertilizer maker CF Industries also yielded absolute and relative strength as
its share price gained 52%.
OUTLOOK
Using a systematic and technically-driven process, Veedot focuses on finding
companies whose fundamental characteristics meet strict requirements for
accelerating earnings and revenue growth. Such companies must also have
historical stock price performance that suggests impending share price
appreciation.
Despite the volatility and the market's tilt away from momentum-style
investing during the course of the reporting period, we find the current
environment accommodating to our disciplined, consistent style. Our systematic
process of identifying companies with accelerating growth and price momentum
continues to identify opportunities across industry sectors.
Top Five Industries as of April 30, 2008
% of net % of net
assets as of assets as of
4/30/08 10/31/07
Oil, Gas & Consumable Fuels 16.6% 0.9%
Machinery 9.4% 7.3%
Energy Equipment & Services 8.6% 3.0%
Metals & Mining 5.1% 7.2%
IT Services 4.5% 2.8%
Types of Investments in Portfolio
% of net % of net
assets as of assets as of
4/30/08 10/31/07
Domestic Common Stocks 78.0% 68.3%
Foreign Common Stocks(1) 18.6% 29.8%
TOTAL COMMON STOCKS 96.6% 98.1%
Temporary Cash Investments 5.6% 3.1%
Other Assets and Liabilities (2.2)% (1.2)%
(1) Includes depositary shares, dual listed securities and foreign ordinary
shares.
- ------
6
SHAREHOLDER FEE EXAMPLE (UNAUDITED)
Fund shareholders may incur two types of costs: (1) transaction costs,
including sales charges (loads) on purchase payments and redemption/exchange
fees; and (2) ongoing costs, including management fees; distribution and
service (12b-1) fees; and other fund expenses. This example is intended to
help you understand your ongoing costs (in dollars) of investing in your fund
and to compare these costs with the ongoing cost of investing in other mutual
funds.
The example is based on an investment of $1,000 made at the beginning of the
period and held for the entire period from November 1, 2007 to April 30, 2008.
ACTUAL EXPENSES
The table provides information about actual account values and actual expenses
for each class. You may use the information, together with the amount you
invested, to estimate the expenses that you paid over the period. First,
identify the share class you own. Then simply divide your account value by
$1,000 (for example, an $8,600 account value divided by $1,000 = 8.6), then
multiply the result by the number under the heading "Expenses Paid During
Period" to estimate the expenses you paid on your account during this period.
If you hold Investor Class shares of any American Century fund, or
Institutional Class shares of the American Century Diversified Bond Fund, in
an American Century account (i.e., not a financial intermediary or retirement
plan account), American Century may charge you a $12.50 semiannual account
maintenance fee if the value of those shares is less than $10,000. We will
redeem shares automatically in one of your accounts to pay the $12.50 fee. In
determining your total eligible investment amount, we will include your
investments in all PERSONAL ACCOUNTS (including American Century Brokerage
accounts) registered under your Social Security number. PERSONAL ACCOUNTS
include individual accounts, joint accounts, UGMA/UTMA accounts, personal
trusts, Coverdell Education Savings Accounts and IRAs (including traditional,
Roth, Rollover, SEP-, SARSEP- and SIMPLE-IRAs), and certain other retirement
accounts. If you have only business, business retirement, employer-sponsored
or American Century Brokerage accounts, you are currently not subject to this
fee. We will not charge the fee as long as you choose to manage your accounts
exclusively online. If you are subject to the Account Maintenance Fee, your
account value could be reduced by the fee amount.
HYPOTHETICAL EXAMPLE FOR COMPARISON PURPOSES
The table also provides information about hypothetical account values and
hypothetical expenses based on the actual expense ratio of each class of your
fund and an assumed rate of return of 5% per year before expenses, which is
not the actual return of a fund's share class. The hypothetical account values
and expenses may not be used to estimate the actual ending account balance or
expenses you paid for the period. You may use this information to compare the
ongoing costs of investing in your fund and other funds. To do so, compare
this 5% hypothetical example with the 5% hypothetical examples that appear in
the shareholder reports of the other funds.
Please note that the expenses shown in the table are meant to highlight your
ongoing costs only and do not reflect any transactional costs, such as sales
charges (loads) or redemption/exchange fees. Therefore, the table is useful in
comparing ongoing costs only, and will not help you determine the relative
total costs of owning different funds. In addition, if these transactional
costs were included, your costs would have been higher.
- ------
7
Beginning Expenses Paid
Account Ending During Period* Annualized
Value Account Value 11/1/07 - Expense
11/1/07 4/30/08 4/30/08 Ratio*
ACTUAL
Investor Class $1,000 $842.20 $5.77 1.26%
Institutional Class $1,000 $842.20 $4.86 1.06%
HYPOTHETICAL
Investor Class $1,000 $1,018.60 $6.32 1.26%
Institutional Class $1,000 $1,019.59 $5.32 1.06%
* Expenses are equal to the class's annualized expense ratio listed in the
table above, multiplied by the average account value over the period,
multiplied by 182, the number of days in the most recent fiscal half-year,
divided by 366, to reflect the one-half year period.
- ------
8
SCHEDULE OF INVESTMENTS
Veedot
APRIL 30, 2008 (UNAUDITED)
Shares Value
Common Stocks -- 96.6%
AUTO COMPONENTS -- 2.3%
113,500 ArvinMeritor, Inc. $ 1,695,690
140,500 Exide Technologies(1) 2,049,895
------------
3,745,585
------------
BEVERAGES -- 2.6%
37,000 Central European Distribution Corp.(1) 2,254,040
35,000 Coca-Cola Co. (The) 2,060,450
------------
4,314,490
------------
CAPITAL MARKETS -- 1.1%
101,000 Knight Capital Group, Inc. Cl A(1) 1,889,710
------------
CHEMICALS -- 2.8%
21,000 Mosaic Co. (The)(1) 2,572,710
11,500 Potash Corp. of Saskatchewan 2,115,425
------------
4,688,135
------------
COMMERCIAL BANKS -- 2.7%
106,500 Republic Bancorp, Inc. Cl A 2,463,345
60,500 Simmons First National Corp. Cl A 1,936,605
------------
4,399,950
------------
COMMERCIAL SERVICES & SUPPLIES -- 2.7%
34,000 FTI Consulting, Inc.(1) 2,176,000
173,500 Metalico, Inc.(1) 2,248,560
------------
4,424,560
------------
COMMUNICATIONS EQUIPMENT -- 1.9%
25,500 Research In Motion Ltd.(1) 3,101,565
------------
COMPUTERS & PERIPHERALS -- 1.0%
60,000 Western Digital Corp.(1) 1,739,400
------------
DISTRIBUTORS -- 1.0%
74,500 LKQ Corp.(1) 1,621,120
------------
DIVERSIFIED TELECOMMUNICATION SERVICES -- 1.0%
62,000 Chunghwa Telecom Co. Ltd. ADR 1,581,620
------------
ELECTRIC UTILITIES -- 1.1%
71,500 Hawaiian Electric Industries, Inc. 1,758,185
------------
ELECTRICAL EQUIPMENT -- 1.0%
75,000 Encore Wire Corp. 1,695,000
------------
ENERGY EQUIPMENT & SERVICES -- 8.6%
65,000 Acergy SA ADR 1,600,950
34,000 Bristow Group Inc.(1) 1,793,500
Shares Value
29,500 Gulfmark Offshore Inc.(1) $ 1,764,100
50,500 Nabors Industries Ltd.(1) 1,895,770
69,000 Natural Gas Services Group Inc.(1) 1,718,100
25,500 Oceaneering International, Inc.(1) 1,702,890
68,000 Patterson-UTI Energy Inc. 1,899,920
48,000 Willbros Group, Inc.(1) 1,732,320
------------
14,107,550
------------
FOOD PRODUCTS -- 2.7%
92,500 Cal-Maine Foods, Inc. 2,733,375
64,500 Flowers Foods Inc. 1,669,905
------------
4,403,280
------------
HEALTH CARE EQUIPMENT & SUPPLIES -- 3.4%
41,500 Covidien Ltd. 1,937,635
66,500 Neogen Corp.(1) 1,671,145
60,500 Zoll Medical Corp.(1) 2,019,490
------------
5,628,270
------------
HEALTH CARE PROVIDERS & SERVICES -- 2.3%
54,500 CorVel Corp.(1) 1,793,050
304,500 Tenet Healthcare Corp.(1) 1,948,800
------------
3,741,850
------------
INTERNET SOFTWARE & SERVICES -- 3.0%
151,000 SkillSoft plc ADR(1) 1,517,550
50,500 Sohu.com Inc.(1) 3,491,065
------------
5,008,615
------------
IT SERVICES -- 4.5%
95,500 CyberSource Corp.(1) 1,733,325
15,500 International Business Machines Corp. 1,870,850
36,500 ManTech International Corp. Cl A(1) 1,743,605
7,500 MasterCard Inc. Cl A 2,086,200
------------
7,433,980
------------
LIFE SCIENCES TOOLS & SERVICES -- 1.5%
34,000 ICON plc ADR(1) 2,448,000
------------
MACHINERY -- 9.4%
31,500 Axsys Technologies, Inc.(1) 1,718,325
54,500 Badger Meter Inc. 2,837,815
43,500 Chart Industries Inc.(1) 1,767,840
22,000 Deere & Co. 1,849,540
41,000 Lindsay Corp. 4,268,920
23,000 Middleby Corp. (The)(1) 1,443,250
16,000 Valmont Industries, Inc. 1,575,360
------------
15,461,050
------------
- ------
9
Veedot
Shares Value
METALS & MINING -- 5.1%
33,000 Barrick Gold Corp. $ 1,274,460
13,000 Cleveland-Cliffs Inc. 2,085,200
23,000 Nucor Corp. 1,736,500
3,500 Rio Tinto plc ADR 1,645,000
19,500 Schnitzer Steel Industries, Inc. Cl A 1,716,000
------------
8,457,160
------------
OIL, GAS & CONSUMABLE FUELS -- 16.6%
14,500 Apache Corp. 1,952,860
33,000 Arch Coal Inc. 1,892,880
85,500 BPZ Resources, Inc.(1) 1,665,540
88,500 Callon Petroleum Co.(1) 1,770,000
35,500 Chesapeake Energy Corp. 1,835,350
32,000 Cimarex Energy Co. 1,993,600
49,500 Denbury Resources Inc.(1) 1,512,720
16,000 EOG Resources Inc. 2,087,680
106,000 GeoResources, Inc.(1) 1,571,980
17,500 Hess Corp. 1,858,500
55,500 Mariner Energy Inc.(1) 1,529,580
47,000 Southwestern Energy Co.(1) 1,988,570
30,500 Stone Energy Corp.(1) 1,858,670
44,500 W&T Offshore Inc. 1,820,050
26,000 Whiting Petroleum Corp.(1) 1,989,520
------------
27,327,500
------------
PERSONAL PRODUCTS -- 0.9%
33,000 Herbalife Ltd. 1,444,740
------------
PHARMACEUTICALS -- 1.0%
33,500 Teva Pharmaceutical Industries Ltd. ADR 1,567,130
------------
ROAD & RAIL -- 3.5%
41,500 Arkansas Best Corp. 1,638,420
34,500 CSX Corp. 2,171,775
28,500 Ryder System, Inc. 1,951,395
------------
5,761,590
------------
SEMICONDUCTORS & SEMICONDUCTOR EQUIPMENT -- 2.0%
78,000 Altera Corp. 1,659,840
114,000 Volterra Semiconductor Corp.(1) 1,716,840
------------
3,376,680
------------
SOFTWARE -- 2.2%
55,000 MICROS Systems, Inc.(1) 1,960,750
48,500 Shanda Interactive Entertainment Ltd. ADR(1) 1,663,065
------------
3,623,815
------------
Shares Value
SPECIALTY RETAIL -- 3.1%
210,000 Pier 1 Imports, Inc.(1) $ 1,638,000
52,500 Urban Outfitters Inc.(1) 1,798,125
463,000 Wet Seal, Inc. (The) Cl A(1) 1,606,610
------------
5,042,735
------------
TEXTILES, APPAREL & LUXURY GOODS -- 0.9%
23,000 NIKE, Inc. Cl B 1,536,400
------------
THRIFTS & MORTGAGE FINANCE -- 0.7%
142,977 United Community Financial Corp. 1,173,841
------------
TOBACCO -- 2.0%
28,000 Universal Corp. 1,797,320
29,000 UST Inc. 1,510,030
------------
3,307,350
------------
TRADING COMPANIES & DISTRIBUTORS -- 1.0%
38,000 Watsco, Inc. 1,724,060
------------
WIRELESS TELECOMMUNICATION SERVICES -- 1.0%
74,000 Partner Communications Co. Ltd. ADR 1,721,980
------------
TOTAL COMMON STOCKS
(Cost $138,850,261) 159,256,896
------------
Temporary Cash Investments -- 5.6%
Repurchase Agreement, Credit Suisse First Boston, Inc.,
(collateralized by various U.S. Treasury obligations, 7.25%,
8/15/22, valued at $1,122,132), in a joint trading account at
1.87%, dated 4/30/08, due 5/1/08 (Delivery value $1,100,057) 1,100,000
Repurchase Agreement, Morgan Stanley Group, Inc., (collateralized
by various U.S. Treasury obligations, 7.875%-8.750%,
8/15/20-2/15/21, valued at $8,363,010), in a joint trading account
at 1.90%, dated 4/30/08, due 5/1/08 (Delivery value $8,200,433) 8,200,000
------------
TOTAL TEMPORARY CASH INVESTMENTS
(Cost $9,300,000) 9,300,000
------------
TOTAL INVESTMENT SECURITIES -- 102.2%
(Cost $148,150,261) 168,556,896
------------
OTHER ASSETS AND LIABILITIES -- (2.2)% (3,643,873)
------------
TOTAL NET ASSETS -- 100.0% $164,913,023
============
- ------
10
Veedot
Notes to Schedule of Investments
ADR = American Depositary Receipt
(1) Non-income producing.
See Notes to Financial Statements.
- ------
11
STATEMENT OF ASSETS AND LIABILITIES
APRIL 30, 2008 (UNAUDITED)
ASSETS
Investment securities, at value (cost of $148,150,261) $168,556,896
Cash 58,628
Receivable for investments sold 5,250,993
Dividends and interest receivable 104,154
-------------
173,970,671
-------------
LIABILITIES
Payable for investments purchased 8,891,777
Accrued management fees 165,871
-------------
9,057,648
-------------
NET ASSETS $ 164,913,023
=============
NET ASSETS CONSIST OF:
Capital (par value and paid-in surplus) $ 183,717,266
Accumulated net investment loss (229,708)
Accumulated net realized loss on investment transactions (38,981,170)
Net unrealized appreciation on investments 20,406,635
-------------
$ 164,913,023
=============
INVESTOR CLASS, $0.01 PAR VALUE
Net assets $157,631,247
Shares outstanding 20,251,038
Net asset value per share $7.78
INSTITUTIONAL CLASS, $0.01 PAR VALUE
Net assets $7,281,776
Shares outstanding 921,510
Net asset value per share $7.90
See Notes to Financial Statements.
- ------
12
STATEMENT OF OPERATIONS
FOR THE SIX MONTHS ENDED APRIL 30, 2008 (UNAUDITED)
INVESTMENT INCOME (LOSS)
INCOME:
Dividends (net of foreign taxes withheld of $36,275) $ 756,515
Interest 66,306
-------------
822,821
-------------
EXPENSES:
Management fees 1,048,560
Directors' fees and expenses 1,948
Other expenses 2,021
-------------
1,052,529
-------------
NET INVESTMENT INCOME (LOSS) (229,708)
-------------
REALIZED AND UNREALIZED GAIN (LOSS)
Net realized gain (loss) on investment transactions (2,479,155)
Change in net unrealized appreciation (depreciation) on
investments (29,988,418)
-------------
NET REALIZED AND UNREALIZED GAIN (LOSS) (32,467,573)
-------------
NET INCREASE (DECREASE) IN NET ASSETS RESULTING FROM OPERATIONS $(32,697,281)
=============
See Notes to Financial Statements.
- ------
13
STATEMENT OF CHANGES IN NET ASSETS
SIX MONTHS ENDED APRIL 30, 2008 (UNAUDITED) AND YEAR ENDED OCTOBER 31, 2007
Increase (Decrease) in Net Assets 2008 2007
OPERATIONS
Net investment income (loss) $ (229,708) $ (281,699)
Net realized gain (loss) (2,479,155) 33,343,183
Change in net unrealized appreciation (depreciation) (29,988,418) 35,640,640
------------ ------------
Net increase (decrease) in net assets resulting
from operations (32,697,281) 68,702,124
------------ ------------
CAPITAL SHARE TRANSACTIONS
Net increase (decrease) in net assets from capital
share transactions (6,682,821) (30,019,917)
------------ ------------
NET INCREASE (DECREASE) IN NET ASSETS (39,380,102) 38,682,207
NET ASSETS
Beginning of period 204,293,125 165,610,918
------------ ------------
End of period $164,913,023 $204,293,125
============ ============
Accumulated net investment loss $(229,708) --
============ ============
See Notes to Financial Statements.
- ------
14
NOTES TO FINANCIAL STATEMENTS
APRIL 30, 2008 (UNAUDITED)
1. ORGANIZATION AND SUMMARY OF SIGNIFICANT ACCOUNTING POLICIES
ORGANIZATION -- American Century Mutual Funds, Inc. (the corporation) is
registered under the Investment Company Act of 1940 (the 1940 Act) as an
open-end management investment company. Veedot Fund (the fund) is one fund in
a series issued by the corporation. The fund is nondiversified under the 1940
Act. The fund's investment objective is to seek long-term capital growth. The
fund pursues its objective by investing primarily in common stocks that
management believes to have better than average prospects for appreciation.
The fund uses an approach to common stock investing developed by American
Century Investments. This approach relies heavily on quantitative tools to
identify attractive investment opportunities, regardless of company size,
industry type or geographic location, on a disciplined, consistent basis. The
following is a summary of the fund's significant accounting policies.
MULTIPLE CLASS -- The fund is authorized to issue the Investor Class and the
Institutional Class. The share classes differ principally in their respective
distribution and shareholder servicing expenses and arrangements. All shares
of the fund represent an equal pro rata interest in the net assets of the
class to which such shares belong, and have identical voting, dividend,
liquidation and other rights and the same terms and conditions, except for
class specific expenses and exclusive rights to vote on matters affecting only
individual classes. Income, non-class specific expenses, and realized and
unrealized capital gains and losses of the fund are allocated to each class of
shares based on their relative net assets.
SECURITY VALUATIONS -- Securities traded primarily on a principal securities
exchange are valued at the last reported sales price, or at the mean of the
latest bid and asked prices where no last sales price is available. Depending
on local convention or regulation, securities traded over-the-counter are
valued at the mean of the latest bid and asked prices, the last sales price,
or the official close price. Debt securities not traded on a principal
securities exchange are valued through a commercial pricing service or at the
mean of the most recent bid and asked prices. Discount notes may be valued
through a commercial pricing service or at amortized cost, which approximates
fair value. Securities traded on foreign securities exchanges and
over-the-counter markets are normally completed before the close of business
on days that the New York Stock Exchange (the Exchange) is open and may also
take place on days when the Exchange is not open. If an event occurs after the
value of a security was established but before the net asset value per share
was determined that was likely to materially change the net asset value, that
security would be valued as determined in accordance with procedures adopted
by the Board of Directors. If the fund determines that the market price of a
portfolio security is not readily available, or that the valuation methods
mentioned above do not reflect the security's fair value, such security is
valued as determined by the Board of Directors or its designee, in accordance
with procedures adopted by the Board of Directors, if such determination would
materially impact a fund's net asset value. Certain other circumstances may
cause the fund to use alternative procedures to value a security such as: a
security has been declared in default; trading in a security has been halted
during the trading day; or there is a foreign market holiday and no trading
will commence.
SECURITY TRANSACTIONS -- For financial reporting purposes, security
transactions are accounted for as of the trade date. Net realized gains and
losses are determined on the identified cost basis, which is also used for
federal income tax purposes.
INVESTMENT INCOME -- Dividend income less foreign taxes withheld, if any, is
recorded as of the ex-dividend date. Interest income is recorded on the
accrual basis and includes accretion of discounts and amortization of premiums.
FOREIGN CURRENCY TRANSACTIONS -- All assets and liabilities initially
expressed in foreign currencies are translated into U.S. dollars at prevailing
exchange rates at period end. Purchases and sales of investment securities,
dividend and interest income, and certain expenses are translated at the rates
of exchange prevailing on the respective dates of such transactions. For
assets and liabilities, other than investments in securities, net realized and
unrealized gains and losses from foreign currency translations arise from
changes in currency exchange rates.
- ------
15
Net realized and unrealized foreign currency exchange gains or losses
occurring during the holding period of investment securities are a component
of realized gain (loss) on investment transactions and unrealized appreciation
(depreciation) on investments, respectively. Certain countries may impose
taxes on the contract amount of purchases and sales of foreign currency
contracts in their currency. The fund records the foreign tax expense, if any,
as a reduction to the net realized gain (loss) on foreign currency
transactions.
REPURCHASE AGREEMENTS -- The fund may enter into repurchase agreements with
institutions that American Century Investment Management, Inc. (ACIM) (the
investment advisor) has determined are creditworthy pursuant to criteria
adopted by the Board of Directors. Each repurchase agreement is recorded at
cost. The fund requires that the collateral, represented by securities,
received in a repurchase transaction be transferred to the custodian in a
manner sufficient to enable the fund to obtain those securities in the event
of a default under the repurchase agreement. ACIM monitors, on a daily basis,
the securities transferred to ensure the value, including accrued interest, of
the securities under each repurchase agreement is equal to or greater than
amounts owed to the fund under each repurchase agreement.
JOINT TRADING ACCOUNT -- Pursuant to an Exemptive Order issued by the
Securities and Exchange Commission, the fund, along with other registered
investment companies having management agreements with ACIM or American
Century Global Investment Management, Inc. (ACGIM), may transfer uninvested
cash balances into a joint trading account. These balances are invested in one
or more repurchase agreements that are collateralized by U.S. Treasury or
Agency obligations.
INCOME TAX STATUS -- It is the fund's policy to distribute substantially all
net investment income and net realized gains to shareholders and to otherwise
qualify as a regulated investment company under provisions of the Internal
Revenue Code. The fund is no longer subject to examination by tax authorities
for years prior to 2004. At this time, management has not identified any
uncertain tax positions for which it is reasonably possible that the total
amounts of unrecognized tax benefits will significantly change in the next
twelve months. Accordingly, no provision has been made for federal or state
income taxes. Interest and penalties associated with any federal or state
income tax obligations, if any, are recorded as interest expense.
DISTRIBUTIONS TO SHAREHOLDERS -- Distributions to shareholders are recorded on
the ex-dividend date. Distributions from net investment income and net
realized gains, if any, are generally declared and paid annually.
REDEMPTION -- The fund may impose a 2.00% redemption fee on shares held less
than 180 days. The redemption fee is recorded as a reduction in the cost of
shares redeemed. The redemption fee is retained by the fund and helps cover
transaction costs that long-term investors may bear when a fund sells
securities to meet investor redemptions. Prior to March 1, 2007, the fund
imposed a 2.00% redemption fee on shares held less than 5 years.
INDEMNIFICATIONS -- Under the corporation's organizational documents, its
officers and directors are indemnified against certain liabilities arising out
of the performance of their duties to the fund. In addition, in the normal
course of business, the fund enters into contracts that provide general
indemnifications. The fund's maximum exposure under these arrangements is
unknown as this would involve future claims that may be made against the fund.
The risk of material loss from such claims is considered by management to be
remote.
USE OF ESTIMATES -- The financial statements are prepared in conformity with
accounting principles generally accepted in the United States of America,
which may require management to make certain estimates and assumptions at the
date of the financial statements. Actual results could differ from these
estimates.
2. FEES AND TRANSACTIONS WITH RELATED PARTIES
MANAGEMENT FEES -- The corporation has entered into a Management Agreement
with ACIM, under which ACIM provides the fund with investment advisory and
management services in exchange for a single, unified management fee (the fee)
per class. The Agreement provides that all expenses of the fund, except
brokerage commissions, taxes, interest, fees and expenses of those directors
who are not considered "interested persons" as defined in the 1940 Act
(including counsel fees) and extraordinary expenses, will be paid by ACIM. The
fee is computed and accrued daily based on the daily net assets of the
specific class of shares of the fund and paid monthly in arrears. For funds
with a stepped fee schedule, the rate of the fee is determined by applying a
fee rate calculation formula. This formula
- ------
16
takes into account all of the investment advisor's assets under management in
the fund's investment strategy (strategy assets) to calculate the appropriate
fee rate for the fund. The strategy assets include the fund's assets and the
assets of other clients of the investment advisor that are not in the American
Century family of funds, but that have the same investment team and investment
strategy. The annual management fee schedule for the fund ranges from 1.00% to
1.25% for the Investor Class. The Institutional Class is 0.20% less at each
point within the range. The effective annual management fee for each class of
the fund for the six months ended April 30, 2008, was 1.25% and 1.05% for the
Investor Class and Institutional Class, respectively.
RELATED PARTIES -- Certain officers and directors of the corporation are also
officers and/or directors, and, as a group, controlling stockholders of
American Century Companies, Inc. (ACC), the parent of the corporation's
investment advisor, ACIM, the distributor of the corporation, American Century
Investment Services, Inc., and the corporation's transfer agent, American
Century Services, LLC.
The fund is eligible to invest in a money market fund for temporary purposes,
which is managed by J.P. Morgan Investment Management, Inc. (JPMIM). JPMIM is
a wholly owned subsidiary of JPMorgan Chase & Co. (JPM). JPM is an equity
investor in ACC. Prior to December 12, 2007, the fund had a bank line of
credit agreement with JPMorgan Chase Bank (JPMCB). JPMCB is a custodian of the
fund and a wholly owned subsidiary of JPM.
3. INVESTMENT TRANSACTIONS
Purchases and sales of investment securities, excluding short-term
investments, for the six months ended April 30, 2008, were $209,055,837 and
$216,992,230, respectively.
4. CAPITAL SHARE TRANSACTIONS
Transactions in shares of the fund were as follows:
Six months ended April 30,
2008 Year ended October 31, 2007
Shares Amount Shares Amount
INVESTOR
CLASS/SHARES
AUTHORIZED 200,000,000 200,000,000
=========== ===========
Sold 893,698 $ 7,198,628 2,809,737 $ 23,058,182
Redeemed (1,729,129) (13,435,393)(1) (6,725,943) (47,100,091)(2)
----------- --------------- ----------- ---------------
(835,431) (6,236,765) (3,916,206) (24,041,909)
----------- --------------- ----------- ---------------
INSTITUTIONAL
CLASS/SHARES
AUTHORIZED 100,000,000 100,000,000
=========== ===========
Sold 66,827 536,699 146,901 1,160,072
Redeemed (124,437) (982,755)(3) (965,925) (7,138,080)(4)
----------- --------------- ----------- ---------------
(57,610) (446,056) (819,024) (5,978,008)
----------- --------------- ----------- ---------------
Net increase
(decrease) (893,041) $ (6,682,821) (4,735,230) $ (30,019,917)
=========== =============== =========== ===============
(1) Net of redemption fees of $44,425.
(2) Net of redemption fees of $62,403.
(3) Net of redemption fees of $9,353.
(4) Net of redemption fees of $9,817.
5. BANK LINE OF CREDIT
Effective December 12, 2007, the fund, along with certain other funds managed
by ACIM or ACGIM, has a $500,000,000 unsecured bank line of credit agreement
with Bank of America, N.A. Prior to December 12, 2007, the fund, along with
certain other funds managed by ACIM or ACGIM, had a $500,000,000 unsecured
bank line of credit agreement with JPMCB. The fund may borrow money for
temporary or emergency purposes to fund shareholder redemptions. Borrowings
under the agreement, which is subject to annual renewal, bear interest at the
Federal Funds rate plus 0.40%. The fund did not borrow from the line during
the six months ended April 30, 2008.
- ------
17
6. RISK FACTORS
The fund's investment process may involve high portfolio turnover, high
commission costs and high capital gains distributions. In addition, its
investment approach may involve higher volatility and risk. There are certain
risks involved in investing in foreign securities. These risks include those
resulting from future adverse political, social, and economic developments,
fluctuations in currency exchange rates, the possible imposition of exchange
controls, and other foreign laws or restrictions. Investing in emerging
markets may accentuate these risks.
7. FEDERAL TAX INFORMATION
The book-basis character of distributions made during the year from net
investment income or net realized gains may differ from their ultimate
characterization for federal income tax purposes. These differences reflect
the differing character of certain income items and net realized gains and
losses for financial statement and tax purposes, and may result in
reclassification among certain capital accounts on the financial statements.
As of April 30, 2008, the components of investments for federal income tax
purposes were as follows:
Federal tax cost of investments $148,396,090
============
Gross tax appreciation of investments $22,245,222
Gross tax depreciation of investments (2,084,416)
------------
Net tax appreciation (depreciation) of investments $20,160,806
============
The difference between book-basis and tax-basis cost and unrealized
appreciation (depreciation) is attributable primarily to the tax deferral of
losses on wash sales.
As of October 31, 2007, the fund had $(36,502,015) of accumulated capital
losses, which represent net capital loss carryovers that may be used to offset
future realized capital gains for federal income tax purposes. Capital loss
carryovers of $(4,184,563) and $(32,317,452) expire in 2009 and 2010,
respectively.
8. RECENTLY ISSUED ACCOUNTING STANDARDS
The Financial Accounting Standards Board (FASB) issued Statement of Financial
Accounting Standards No. 157, "Fair Value Measurements" (FAS 157), in
September 2006, which is effective for fiscal years beginning after November
15, 2007. FAS 157 defines fair value, establishes a framework for measuring
fair value and expands the required financial statement disclosures about fair
value measurements. Management is currently evaluating the impact that
adopting FAS 157 will have on the financial statement disclosures.
In March 2008, the FASB issued Statement of Financial Accounting Standards No.
161, "Disclosures about Derivative Instruments and Hedging Activities -- an
amendment of FASB Statement No. 133" (FAS 161). FAS 161 is effective for
fiscal years beginning after November 15, 2008. FAS 161 amends and expands
disclosures about derivative instruments and hedging activities. FAS 161
requires qualitative disclosures about the objectives and strategies of
derivative instruments, quantitative disclosures about the fair value amounts
of and gains and losses on derivative instruments, and disclosures of
credit-risk-related contingent features in hedging activities. Management is
currently evaluating the impact that adopting FAS 161 will have on the
financial statement disclosures.
- ------
18
FINANCIAL HIGHLIGHTS
Veedot
Investor Class
For a Share Outstanding Throughout the Years Ended October 31 (except as noted)
2008(1) 2007 2006 2005 2004 2003
PER-SHARE DATA
Net Asset
Value,
Beginning of
Period $9.25 $6.17 $5.57 $5.06 $4.99 $3.77
------ ----- ----- ----- ----- -----
Income From
Investment
Operations
Net
Investment
Income
(Loss)(2) (0.01) (0.01) (0.02) (0.03) (0.03) (0.03)
Net
Realized
and
Unrealized
Gain
(Loss) (1.46) 3.09 0.62 0.53 0.09 1.24
------ ----- ----- ----- ----- -----
Total From
Investment
Operations (1.47) 3.08 0.60 0.50 0.06 1.21
------ ----- ----- ----- ----- -----
Redemption
Fees(2) --(3) --(3) --(3) 0.01 0.01 0.01
------ ----- ----- ----- ----- -----
Net Asset
Value, End of
Period $7.78 $9.25 $6.17 $5.57 $5.06 $4.99
====== ===== ===== ===== ===== =====
TOTAL RETURN(4) (15.78)% 49.92% 10.77% 10.08% 1.40% 32.36%
RATIOS/SUPPLEMENTAL DATA
Ratio of
Operating
Expenses to
Average Net
Assets 1.26%(5) 1.25% 1.45% 1.50% 1.50% 1.50%
Ratio of Net
Investment
Income (Loss)
to Average Net
Assets (0.29)%(5) (0.18)% (0.39)% (0.51)% (0.57)% (0.68)%
Portfolio
Turnover Rate 127% 207% 330% 399% 344% 415%
Net Assets,
End of Period
(in thousands) $157,631 $195,105 $154,374 $178,078 $219,618 $228,724
(1) Six months ended April 30, 2008 (unaudited).
(2) Computed using average shares outstanding throughout the period.
(3) Per-share amount was less than $0.005.
(4) Total return assumes reinvestment of net investment income and capital
gains distributions, if any, and does not reflect applicable redemption fees.
Total returns for periods less than one year are not annualized. Total returns
are calculated based on the net asset value on the last business day. The
total return of the classes may not precisely reflect the class expense
differences because of the impact of calculating the net asset values to two
decimal places. If net asset values were calculated to three decimal places,
the total return differences would more closely reflect the class expense
differences. The calculation of net asset values to two decimal places is made
in accordance with SEC guidelines and does not result in any gain or loss of
value between one class and another.
(5) Annualized.
See Notes to Financial Statements.
- ------
19
Veedot
Institutional Class
For a Share Outstanding Throughout the Years Ended October 31 (except as noted)
2008(1) 2007 2006 2005 2004 2003
PER-SHARE DATA
Net Asset Value,
Beginning of Period $9.38 $6.25 $5.63 $5.10 $5.02 $3.79
------ ----- ------ ----- ----- -----
Income From
Investment Operations
Net Investment
Income (Loss)(2) --(3) --(3) (0.01) (0.02) (0.02) (0.02)
Net Realized and
Unrealized Gain
(Loss) (1.48) 3.13 0.63 0.54 0.09 1.24
------ ----- ------ ----- ----- -----
Total From
Investment
Operations (1.48) 3.13 0.62 0.52 0.07 1.22
------ ----- ------ ----- ----- -----
Redemption Fees(2) --(3) --(3) --(3) 0.01 0.01 0.01
------ ----- ------ ----- ----- -----
Net Asset Value, End
of Period $7.90 $9.38 $6.25 $5.63 $5.10 $5.02
====== ===== ====== ===== ===== =====
TOTAL RETURN(4) (15.78)% 50.08% 11.01% 10.39% 1.59% 32.45%
RATIOS/SUPPLEMENTAL DATA
Ratio of Operating
Expenses to Average
Net Assets 1.06%(5) 1.05% 1.25% 1.30% 1.30% 1.30%
Ratio of Net
Investment Income
(Loss) to Average
Net Assets (0.09)%(5) 0.02% (0.19)% (0.31)% (0.37)% (0.48)%
Portfolio Turnover
Rate 127% 207% 330% 399% 344% 415%
Net Assets, End of
Period (in thousands) $7,282 $9,188 $11,237 $11,440 $12,400 $12,458
(1) Six months ended April 30, 2008 (unaudited).
(2) Computed using average shares outstanding throughout the period.
(3) Per-share amount was less than $0.005.
(4) Total return assumes reinvestment of net investment income and capital
gains distributions, if any, and does not reflect applicable redemption fees.
Total returns for periods less than one year are not annualized. The total
return of the classes may not precisely reflect the class expense differences
because of the impact of calculating the net asset values to two decimal
places. If net asset values were calculated to three decimal places, the total
return differences would more closely reflect the class expense differences.
The calculation of net asset values to two decimal places is made in
accordance with SEC guidelines and does not result in any gain or loss of
value between one class and another.
(5) Annualized.
See Notes to Financial Statements.
- ------
20
ADDITIONAL INFORMATION
RETIREMENT ACCOUNT INFORMATION
As required by law, any distributions you receive from an IRA or certain
403(b), 457 and qualified plans [those not eligible for rollover to an IRA or
to another qualified plan] are subject to federal income tax withholding,
unless you elect not to have withholding apply. Tax will be withheld on the
total amount withdrawn even though you may be receiving amounts that are not
subject to withholding, such as nondeductible contributions. In such case,
excess amounts of withholding could occur. You may adjust your withholding
election so that a greater or lesser amount will be withheld.
If you don't want us to withhold on this amount, you must notify us to not
withhold the federal income tax. Even if you plan to roll over the amount you
withdraw to another tax-deferred account, the withholding rate still applies
to the withdrawn amount unless we have received notice not to withhold federal
income tax prior to the withdrawal. You may notify us in writing or in certain
situations by telephone or through other electronic means. You have the right
to revoke your withholding election at any time and any election you make may
remain in effect until revoked by filing a new election.
Remember, even if you elect not to have income tax withheld, you are liable
for paying income tax on the taxable portion of your withdrawal. If you elect
not to have income tax withheld or you don't have enough income tax withheld,
you may be responsible for payment of estimated tax. You may incur penalties
under the estimated tax rules if your withholding and estimated tax payments
are not sufficient.
State tax will be withheld if, at the time of your distribution, your address
is within one of the mandatory withholding states and you have federal income
tax withheld. State taxes will be withheld from your distribution in
accordance with the respective state rules.
PROXY VOTING GUIDELINES
American Century Investment Management, Inc., the fund's investment advisor,
is responsible for exercising the voting rights associated with the securities
purchased and/or held by the fund. A description of the policies and
procedures the advisor uses in fulfilling this responsibility is available
without charge, upon request, by calling 1-800-345-2021. It is also available
on American Century Investments' website at americancentury.com and on the
Securities and Exchange Commission's website at sec.gov. Information regarding
how the investment advisor voted proxies relating to portfolio securities
during the most recent 12-month period ended June 30 is available on the
"About Us" page at americancentury.com. It is also available at sec.gov.
QUARTERLY PORTFOLIO DISCLOSURE
The fund files its complete schedule of portfolio holdings with the Securities
and Exchange Commission (SEC) for the first and third quarters of each fiscal
year on Form N-Q. The fund's Form N-Q is available on the SEC's website at
sec.gov, and may be reviewed and copied at the SEC's Public Reference Room in
Washington, DC. Information on the operation of the Public Reference Room may
be obtained by calling 1-800-SEC-0330. The fund also makes its complete
schedule of portfolio holdings for the most recent quarter of its fiscal year
available on its website at americancentury.com and, upon request, by calling
1-800-345-2021.
- ------
21
INDEX DEFINITIONS
The following indices are used to illustrate investment market, sector, or
style performance or to serve as fund performance comparisons. They are not
investment products available for purchase.
The RUSSELL 1000® INDEX is a market-capitalization weighted, large-cap index
created by Frank Russell Company to measure the performance of the 1,000
largest of the 3,000 largest publicly traded U.S. companies, based on total
market capitalization.
The RUSSELL 1000® GROWTH INDEX measures the performance of those Russell 1000
Index companies (the 1,000 largest of the 3,000 largest publicly traded U.S.
companies, based on total market capitalization) with higher price-to-book
ratios and higher forecasted growth values.
The RUSSELL 1000® VALUE INDEX measures the performance of those Russell 1000
Index companies (the 1,000 largest of the 3,000 largest publicly traded U.S.
companies, based on total market capitalization) with lower price-to-book
ratios and lower forecasted growth values.
The RUSSELL 2000® INDEX is a market-capitalization weighted index created by
Frank Russell Company to measure the performance of the 2,000 smallest of the
3,000 largest publicly traded U.S. companies, based on total market
capitalization.
The RUSSELL 2000® GROWTH INDEX measures the performance of those Russell 2000
Index companies (the 2,000 smallest of the 3,000 largest publicly traded U.S.
companies, based on total market capitalization) with higher price-to-book
ratios and higher forecasted growth values.
The RUSSELL 2000® VALUE INDEX measures the performance of those Russell 2000
Index companies (the 2,000 smallest of the 3,000 largest publicly traded U.S.
companies, based on total market capitalization) with lower price-to-book
ratios and lower forecasted growth values.
The RUSSELL 3000® INDEX measures the performance of the 3,000 largest U.S.
companies based on total market capitalization, which represents approximately
98% of the investable U.S. equity market.
The RUSSELL MIDCAP® INDEX measures the performance of the 800 smallest of the
1,000 largest publicly traded U.S. companies, based on total market
capitalization.
The RUSSELL MIDCAP® GROWTH INDEX measures the performance of those Russell
Midcap Index companies (the 800 smallest of the 1,000 largest publicly traded
U.S. companies, based on total market capitalization) with higher
price-to-book ratios and higher forecasted growth values.
The RUSSELL MIDCAP® VALUE INDEX measures the performance of those Russell
Midcap Index companies (the 800 smallest of the 1,000 largest publicly traded
U.S. companies, based on total market capitalization) with lower price-to-book
ratios and lower forecasted growth values.
- ------
22
NOTES
- ------
23
NOTES
- ------
24
[back cover]
[american century investments logo and text logo ®]
CONTACT US
AMERICANCENTURY.COM
AUTOMATED INFORMATION LINE. . . . . . . . . . . . . . . . . 1-800-345-8765
INVESTOR SERVICES REPRESENTATIVE. . . . . . . . . . . . . . 1-800-345-2021
or 816-531-5575
BUSINESS, NOT-FOR-PROFIT, EMPLOYER-SPONSORED RETIREMENT PLANS .
.. . . . . . . . . . . . . . . . . . . . . . . . . . 1-800-345-3533
BANKS AND TRUST COMPANIES, BROKER-DEALERS,
FINANCIAL PROFESSIONALS, INSURANCE COMPANIES. . . . . . . . 1-800-345-6488
TELECOMMUNICATIONS DEVICE FOR THE DEAF. . . . . . . . . . . 1-800-634-4113
AMERICAN CENTURY MUTUAL FUNDS, INC.
INVESTMENT ADVISOR:
American Century Investment Management, Inc.
Kansas City, Missouri
This report and the statements it contains are submitted for the general
information of our shareholders. The report is not authorized for distribution to
prospective investors unless preceded or accompanied by an effective prospectus.
American Century Investments
P.O. Box 419200
Kansas City, MO 64141-6200
PRSRT STD
U.S. POSTAGE PAID
AMERICAN CENTURY
COMPANIES
American Century Investment Services, Inc., Distributor
©2008 American Century Proprietary Holdings, Inc. All rights reserved.
0806
CL-SAN-60503S
[front cover]
SEMIANNUAL REPORT
APRIL 30, 2008
[american century investments logo and text logo ®]
AMERICAN CENTURY INVESTMENTS
CAPITAL VALUE FUND
PRESIDENT'S LETTER
[photo of Jonathan Thomas]
JONATHAN THOMAS
Dear Investor,
At American Century Investments®, we are committed to helping you reach your
financial goals. Your success is the ultimate measure of our performance.
That's why we focus on achieving superior investment results and building
long-term relationships with investors like you.
Part of that relationship is to clearly communicate investment results and
what influenced them. To help you monitor your investment with us, we take
pride in providing you with the semiannual report for the American Century®
Capital Value Fund for the six months ended April 30, 2008. We also recommend
americancentury.com, where we provide company news, quarterly portfolio
commentaries, investment views, and other useful information.
As noted on the website, 2008 marks the 50th anniversary of American Century
Investments. Since 1958, we've worked to make wise decisions with your
interests as our guide. Fifty years also means that we've met the challenges
of previous economic downturns. As we've crossed those hurdles and earned your
trust, our assets under management have grown to nearly $100 billion, putting
us in the top 5% of our industry. This growth has given us the resources to
offer a wide array of financial products and services, including a
well-diversified line-up of portfolios that provide you with many choices in
these uncertain times.
Though our offerings are diverse, they share several key qualities, including
our disciplined investment approach and active, team-based management. Strict
adherence to our processes and long-term strategies allows us to stay focused
during volatile periods. Investors in our portfolios also benefit from the sum
of our investment teams' expertise as they share research and information.
We'll continue to work hard to earn your trust. Thank you for your continued
support.
Sincerely,
/s/Jonathan Thomas
Jonathan S. Thomas
President and Chief Executive Officer
American Century Investments
TABLE OF CONTENTS
Market Perspective. . . . . . . . . . . . . . . . . . . . . . . . . . 2
U.S. Stock Index Returns . . . . . . . . . . . . . . . . . . . . . . 2
CAPITAL VALUE
Performance . . . . . . . . . . . . . . . . . . . . . . . . . . . . . 3
Portfolio Commentary. . . . . . . . . . . . . . . . . . . . . . . . . 5
Top Ten Holdings . . . . . . . . . . . . . . . . . . . . . . . . . . 5
Top Five Industries. . . . . . . . . . . . . . . . . . . . . . . . . 6
Types of Investments in Portfolio. . . . . . . . . . . . . . . . . . 6
Shareholder Fee Example . . . . . . . . . . . . . . . . . . . . . . . 7
Schedule of Investments . . . . . . . . . . . . . . . . . . . . . . . 9
FINANCIAL STATEMENTS
Statement of Assets and Liabilities . . . . . . . . . . . . . . . . . 12
Statement of Operations . . . . . . . . . . . . . . . . . . . . . . . 13
Statement of Changes in Net Assets. . . . . . . . . . . . . . . . . . 14
Notes to Financial Statements . . . . . . . . . . . . . . . . . . . . 15
Financial Highlights. . . . . . . . . . . . . . . . . . . . . . . . . 19
OTHER INFORMATION
Additional Information. . . . . . . . . . . . . . . . . . . . . . . . 22
Index Definitions . . . . . . . . . . . . . . . . . . . . . . . . . . 23
The opinions expressed in the Market Perspective and the Portfolio Commentary
reflect those of the portfolio management team as of the date of the report,
and do not necessarily represent the opinions of American Century or any other
person in the American Century organization. Any such opinions are subject to
change at any time based upon market or other conditions and American Century
disclaims any responsibility to update such opinions. These opinions may not
be relied upon as investment advice and, because investment decisions made by
American Century funds are based on numerous factors, may not be relied upon
as an indication of trading intent on behalf of any American Century fund.
Security examples are used for representational purposes only and are not
intended as recommendations to purchase or sell securities. Performance
information for comparative indices and securities is provided to American
Century by third party vendors. To the best of American Century's knowledge,
such information is accurate at the time of printing.
MARKET PERSPECTIVE
[photo of chief investment officer]
By Phil Davidson, Chief Investment Officer, U.S. Value Equity
A CHALLENGING PERIOD FOR STOCKS
The six months ended April 30, 2008, were a difficult time for the U.S. equity
market. Fallout from a meltdown in the subprime lending industry, a liquidity
crunch in the credit markets, and a notable slowdown in the U.S. economy put
downward pressure on stocks, which declined steadily for much of the six-month
period. In particular, the first three months of 2008 marked the worst
quarterly performance for the major stock indexes in nearly six years.
However, the market bottomed in mid-March and staged a modest recovery during
the last six weeks of the period. Credit and economic fears eased somewhat as
economic data appeared to improve and a number of bellwether companies
reported earnings that exceeded expectations.
VALUE STOCKS HELD THEIR OWN
Value stocks kept pace with growth issues during the period, trailing slightly
among large- and mid-cap shares and outperforming in the small-cap segment of
the market (see the accompanying table). This performance was noteworthy
because value-oriented stocks often underperform in a slowing economic
environment as investors seek out the steady growth rates of high-quality
growth companies.
In addition, financials stocks, which make up a meaningful portion of the
value stock universe, were hit the hardest by the subprime turmoil and credit
crunch. Many of the country's largest financial institutions faced substantial
subprime-related write-downs and credit losses, resulting in steep markdowns
in their share prices. Financials stocks slumped despite the Federal Reserve's
efforts to shore up the financial system with an aggressive program of
short-term interest rate cuts and injections of liquidity.
Nonetheless, value stocks held up well relative to growth shares, pointing up
the importance of downside protection in a highly volatile market environment.
In addition, good security selection became increasingly important, which
plays to our strengths -- rigorous analysis and thorough research to separate
companies with weaker business models from those that are fundamentally sound.
U.S. Stock Index Returns
For the six months ended April 30, 2008*
RUSSELL 1000 INDEX (LARGE-CAP) -9.54%
Russell 1000 Growth Index -9.28%
Russell 1000 Value Index -9.83%
RUSSELL MIDCAP INDEX -8.77%
Russell Midcap Growth Index -8.44%
Russell Midcap Value Index -9.20%
RUSSELL 2000 INDEX (SMALL-CAP) -12.92%
Russell 2000 Growth Index -14.14%
Russell 2000 Value Index -11.55%
*Total returns for periods less than one year are not annualized.
- ------
2
PERFORMANCE
Capital Value
Total Returns as of April 30, 2008
Average Annual
Returns
5 Since Inception
6 months(1) 1 year years Inception Date
INVESTOR CLASS -11.06% -10.34% 10.75% 6.45% 3/31/99
Return After-Tax on
Distributions(2) -11.82% -11.12% 10.32% 6.00%
Return After-Tax on
Distributions and
Sale of Shares(2) -6.09% -5.62% 9.38% 5.49%
RUSSELL 1000 VALUE
INDEX(3) -9.83% -8.97% 12.85% 6.09% --
Institutional Class -10.97% -10.16% 10.97% 6.41% 3/1/02
Return After-Tax on
Distributions(2) -11.77% -10.96% 10.50% 5.95%
Return After-Tax on
Distributions and
Sale of Shares(2) -6.00% -5.46% 9.57% 5.49%
Advisor Class -11.19% -10.58% -- 9.90% 5/14/03
Return After-Tax on
Distributions(2) -11.93% -11.32% -- 9.50%
Return After-Tax on
Distributions and
Sale of Shares(2) -6.22% -5.82% -- 8.62%
(1) Total returns for periods less than one year are not annualized.
(2) After-tax returns are calculated using the historical highest individual
federal marginal income tax rates, and do not reflect the impact of state and
local taxes. Actual after-tax returns depend on an investor's tax situation
and may differ from those shown. After-tax returns shown are not relevant to
investors who hold their fund shares through tax-deferred arrangements such as
401(k) plans or individual retirement accounts.
(3) Data provided by Lipper Inc. - A Reuters Company. ©2008 Reuters. All
rights reserved. Any copying, republication or redistribution of Lipper
content, including by caching, framing or similar means, is expressly
prohibited without the prior written consent of Lipper. Lipper shall not be
liable for any errors or delays in the content, or for any actions taken in
reliance thereon.
The data contained herein has been obtained from company reports, financial
reporting services, periodicals and other resources believed to be reliable.
Although carefully verified, data on compilations is not guaranteed by Lipper
and may be incomplete. No offer or solicitations to buy or sell any of the
securities herein is being made by Lipper.
Data presented reflect past performance. Past performance is no guarantee of
future results. Current performance may be higher or lower than the
performance shown. Investment return and principal value will fluctuate, and
redemption value may be more or less than original cost. To obtain performance
data current to the most recent month end, please call 1-800-345-2021 or visit
americancentury.com.
Unless otherwise indicated, performance reflects Investor Class shares;
performance for other share classes will vary due to differences in fee
structure. For information about other share classes available, please consult
the prospectus. Data assumes reinvestment of dividends and capital gains.
Returns for the index are provided for comparison. The fund's total returns
include operating expenses (such as transaction costs and management fees)
that reduce returns, while the total returns of the index do not.
- ------
3
Capital Value
Growth of $10,000 Over Life of Class
$10,000 investment made March 31, 1999
One-Year Returns Over Life of Class
Periods ended April 30
1999* 2000 2001 2002 2003 2004 2005 2006 2007 2008
Investor Class 10.20% -6.71% 16.92% 0.21% -12.11% 26.67% 10.31% 13.69% 17.03% -10.34%
Russell 1000
Value Index 9.34% -3.88% 6.43% -3.91% -13.01% 26.26% 13.92% 18.31% 18.15% -8.97%
* From 3/31/99, the Investor Class's inception date. Not annualized.
Data presented reflect past performance. Past performance is no guarantee of
future results. Current performance may be higher or lower than the
performance shown. Investment return and principal value will fluctuate, and
redemption value may be more or less than original cost. To obtain performance
data current to the most recent month end, please call 1-800-345-2021 or visit
americancentury.com.
Unless otherwise indicated, performance reflects Investor Class shares;
performance for other share classes will vary due to differences in fee
structure. For information about other share classes available, please consult
the prospectus. Data assumes reinvestment of dividends and capital gains, and
none of the charts reflect the deduction of taxes that a shareholder would pay
on fund distributions or the redemption of fund shares. Returns for the index
are provided for comparison. The fund's total returns include operating
expenses (such as transaction costs and management fees) that reduce returns,
while the total returns of the index do not.
- ------
4
PORTFOLIO COMMENTARY
Capital Value
Portfolio Managers: Chuck Ritter and Brendan Healy
PERFORMANCE SUMMARY
Capital Value returned -11.06%(1) for the six months ended April 30, 2008. By
comparison, its benchmark, the Russell 1000 Value Index, returned -9.83%,
while the broader market, as measured by the S&P 500 Index, returned
- -9.64%.(2) The portfolio's return reflects operating expenses, while the
indices' returns do not. The median return for Morningstar's Large Cap Value
category (whose performance, like Capital Value's, reflects fund operating
expenses) was -10.34%.(3)
Capital Value's performance for the period was hampered by the volatile,
challenging market environment described in the Market Perspective on page 2.
In addition, the portfolio faced headwinds as growth stocks outperformed value
in both the large- and mid-cap spaces. For part of the period, investors
favored companies that were already strong performers, a momentum bias that
did not fit well with the portfolio's investment approach of seeking stocks
that are undervalued by the market. In spite of these negative factors,
Capital Value benefited from strong security selection. Although positions in
energy and financials stocks detracted, investments in the information
technology, industrials, and consumer staples sectors contributed to relative
performance.
The portfolio's relative performance for the reporting period deviated from
its longer-term results. Since Capital Value's inception on March 31, 1999,
the portfolio has produced an average annualized return of 6.45%, topping the
returns for Morningstar's Large Cap Value category median, the Russell 1000
Value Index, and the S&P 500 Index for that period (see performance
information on pages 3-4).
ENERGY SLOWED PROGRESS
Capital Value's position in the energy sector contributed to performance on an
absolute basis, though it underperformed in relative terms as energy stocks
provided the strongest results for the Russell 1000 Value Index. Our valuation
work led us to emphasize internationally integrated oil and gas suppliers --
stocks that advanced, though not as strongly as the stocks of companies that
specialized in oil and gas exploration and production.
FINANCIALS DETRACTED
Financials stocks -- the portfolio's largest sector position, but a relative
underweight nonetheless -- contributed to the portfolio's underperformance
versus
Top Ten Holdings as of April 30, 2008
% of % of
net assets net assets
as of as of
4/30/08 10/31/07
Exxon Mobil Corp. 5.5% 5.3%
General Electric Co. 4.7% 2.5%
AT&T Inc. 3.8% 3.2%
Chevron Corp. 3.7% 3.3%
Bank of America Corp. 3.3% 3.2%
Royal Dutch Shell plc ADR 2.9% 3.2%
JPMorgan Chase & Co. 2.9% 2.5%
Johnson & Johnson 2.8% 1.9%
Pfizer Inc. 2.7% 1.8%
ConocoPhillips 2.6% 2.2%
(1) All fund returns referenced in this commentary are for Investor Class
shares. Total returns for periods less than one year are not annualized.
(2) The S&P 500 Index returned -4.68%, 10.62% and 2.48% on an average
annualized basis for the one-year, five-year and since inception periods ended
April 30, 2008, respectively.
(3) The median returns for Morningstar's Large Cap Value category were -8.57%,
11.15% and 5.20% on an average annualized basis for the one-year, five-year
and since inception periods ended April 30, 2008, respectively. ©2008
Morningstar, Inc. All Rights Reserved. The information contained herein: (1)
is proprietary to Morningstar and/or its content providers; (2) may not be
copied or distributed; and (3) is not warranted to be accurate, complete or
timely. Neither Morningstar nor its content providers are responsible for any
damages or losses arising from any use of this information.
- ------
5
Capital Value
the benchmark. Many financials firms lagged as the fallout in the subprime
sector continued. Two of our top detractors were Freddie Mac, a
stockholder-owned corporation chartered by Congress to keep money flowing to
mortgage lenders in support of home ownership; and Citigroup, the diversified
global financial services company. Both stocks declined on news of
bigger-than-expected losses resulting from housing weakness and the
deterioration of mortgage credit.
INFORMATION TECHNOLOGY BOOSTED RESULTS
On the positive side, our security selection in information technology -- a
sector that underperformed for the benchmark -- added value. A significant
holding was leading technology company International Business Machines (IBM),
which has benefited from a diverse product mix, strategic acquisitions, and
cost efficiencies. Despite economic headwinds, the company reported
better-than-expected results driven by growth in U.S. and overseas markets.
Near the end of the period, IBM also declared a 25% increase in its quarterly
dividend.
INDUSTRIALS ADDED TO PERFORMANCE
Our complement of industrial stocks lifted relative results. A key holding was
Caterpillar, the world's leading manufacturer of heavy-duty construction
equipment. The company's stock benefited from strong international results --
as commodity prices increased, Caterpillar was well-positioned in energy and
mining markets, especially in developing regions.
CONSUMER STAPLES PROVIDED TOP CONTRIBUTOR
In consumer staples, our smaller-than-the-benchmark position added value, but
security selection was even more meaningful. A significant holding was
retailer Wal-Mart Stores. Higher prices at the pump and falling home prices
are putting pressure on consumers -- making the Wal-Mart low-price strategy
particularly appealing to lower-income households.
OUTLOOK
We continue to be bottom-up investment managers, evaluating each company
individually and building our portfolio one stock at a time. As of April 30,
2008, the portfolio was broadly diversified, with ongoing overweight positions
in the information technology and health care sectors. Our valuation work is
also directing us toward smaller relative weightings in consumer staples and
utilities stocks. In addition, we are still finding value opportunities among
mega-cap stocks and have maintained our bias toward them.
Top Five Industries as of April 30, 2008
% of % of
net assets net assets
as of as of
4/30/08 10/31/07
Oil, Gas & Consumable Fuels 15.1% 14.4%
Pharmaceuticals 9.2% 7.9%
Diversified Financial Services 8.5% 9.8%
Diversified Telecommunication Services 6.1% 4.7%
Commercial Banks 5.9% 5.7%
Types of Investments in Portfolio
% of % of
net assets net assets
as of as of
4/30/08 10/31/07
Common Stocks 98.9% 99.4%
Temporary Cash Investments 0.9% 0.5%
Other Assets and Liabilities(1) 0.2% 0.1%
(1) Includes securities lending collateral and other assets and liabilities.
- ------
6
SHAREHOLDER FEE EXAMPLE (UNAUDITED)
Fund shareholders may incur two types of costs: (1) transaction costs,
including sales charges (loads) on purchase payments and redemption/exchange
fees; and (2) ongoing costs, including management fees; distribution and
service (12b-1) fees; and other fund expenses. This example is intended to
help you understand your ongoing costs (in dollars) of investing in your fund
and to compare these costs with the ongoing cost of investing in other mutual
funds.
The example is based on an investment of $1,000 made at the beginning of the
period and held for the entire period from November 1, 2007 to April 30, 2008.
ACTUAL EXPENSES
The table provides information about actual account values and actual expenses
for each class. You may use the information, together with the amount you
invested, to estimate the expenses that you paid over the period. First,
identify the share class you own. Then simply divide your account value by
$1,000 (for example, an $8,600 account value divided by $1,000 = 8.6), then
multiply the result by the number under the heading "Expenses Paid During
Period" to estimate the expenses you paid on your account during this period.
If you hold Investor Class shares of any American Century fund, or
Institutional Class shares of the American Century Diversified Bond Fund, in
an American Century account (i.e., not a financial intermediary or retirement
plan account), American Century may charge you a $12.50 semiannual account
maintenance fee if the value of those shares is less than $10,000. We will
redeem shares automatically in one of your accounts to pay the $12.50 fee. In
determining your total eligible investment amount, we will include your
investments in all PERSONAL ACCOUNTS (including American Century Brokerage
accounts) registered under your Social Security number. PERSONAL ACCOUNTS
include individual accounts, joint accounts, UGMA/UTMA accounts, personal
trusts, Coverdell Education Savings Accounts and IRAs (including traditional,
Roth, Rollover, SEP-, SARSEP- and SIMPLE-IRAs), and certain other retirement
accounts. If you have only business, business retirement, employer-sponsored
or American Century Brokerage accounts, you are currently not subject to this
fee. We will not charge the fee as long as you choose to manage your accounts
exclusively online. If you are subject to the Account Maintenance Fee, your
account value could be reduced by the fee amount.
HYPOTHETICAL EXAMPLE FOR COMPARISON PURPOSES
The table also provides information about hypothetical account values and
hypothetical expenses based on the actual expense ratio of each class of your
fund and an assumed rate of return of 5% per year before expenses, which is
not the actual return of a fund's share class. The hypothetical account values
and expenses may not be used to estimate the actual ending account balance or
expenses you paid for the period. You may use this information to compare the
ongoing costs of investing in your fund and other funds. To do so, compare
this 5% hypothetical example with the 5% hypothetical examples that appear in
the shareholder reports of the other funds.
Please note that the expenses shown in the table are meant to highlight your
ongoing costs only and do not reflect any transactional costs, such as sales
charges (loads) or redemption/exchange fees. Therefore, the table is useful in
comparing ongoing costs only, and will not help you determine the relative
total costs of owning different funds. In addition, if these transactional
costs were included, your costs would have been higher.
- ------
7
Beginning Expenses Paid
Account Ending During Period* Annualized
Value Account Value 11/1/07 - Expense
11/1/07 4/30/08 4/30/08 Ratio*
ACTUAL
Investor Class $1,000 $889.40 $5.17 1.10%
Institutional Class $1,000 $890.30 $4.23 0.90%
Advisor Class $1,000 $888.10 $6.34 1.35%
HYPOTHETICAL
Investor Class $1,000 $1,019.39 $5.52 1.10%
Institutional Class $1,000 $1,020.39 $4.52 0.90%
Advisor Class $1,000 $1,018.15 $6.77 1.35%
*Expenses are equal to the class's annualized expense ratio listed in the
table above, multiplied by the average account value over the period,
multiplied by 182, the number of days in the most recent fiscal half-year,
divided by 366, to reflect the one-half year period.
- ------
8
SCHEDULE OF INVESTMENTS
Capital Value
APRIL 30, 2008 (UNAUDITED)
Shares Value
Common Stocks -- 98.9%
AEROSPACE & DEFENSE -- 1.1%
54,700 Northrop Grumman Corp. $ 4,024,279
------------
BEVERAGES -- 2.0%
83,000 Coca-Cola Co. (The) 4,886,210
67,200 Pepsi Bottling Group Inc. 2,265,312
------------
7,151,522
------------
BIOTECHNOLOGY -- 0.5%
44,800 Amgen Inc.(1) 1,875,776
------------
CAPITAL MARKETS -- 3.1%
43,300 Bank of New York Mellon Corp. (The) 1,884,849
101,500 Merrill Lynch & Co., Inc. 5,057,745
92,300 Morgan Stanley 4,485,780
------------
11,428,374
------------
CHEMICALS -- 2.3%
91,300 du Pont (E.I.) de Nemours & Co. 4,465,483
60,900 PPG Industries, Inc. 3,737,433
------------
8,202,916
------------
COMMERCIAL BANKS -- 5.9%
25,300 Fifth Third Bancorp 542,179
128,200 National City Corp.(2) 807,660
39,800 PNC Financial Services Group 2,760,130
127,000 U.S. Bancorp 4,304,030
193,200 Wachovia Corp. 5,631,780
252,300 Wells Fargo & Co. 7,505,925
------------
21,551,704
------------
COMMERCIAL SERVICES & SUPPLIES -- 1.7%
33,200 Avery Dennison Corp. 1,599,908
75,600 R.R. Donnelley & Sons Co. 2,316,384
65,900 Waste Management, Inc. 2,378,990
------------
6,295,282
------------
COMMUNICATIONS EQUIPMENT -- 0.3%
99,100 Motorola, Inc. 987,036
------------
COMPUTERS & PERIPHERALS -- 1.2%
96,900 Hewlett-Packard Co. 4,491,315
------------
CONSUMER FINANCE -- 0.3%
59,400 Discover Financial Services 1,081,674
------------
DIVERSIFIED CONSUMER SERVICES -- 0.7%
119,500 H&R Block, Inc. 2,613,465
Shares Value
DIVERSIFIED FINANCIAL SERVICES -- 8.5%
317,000 Bank of America Corp. $ 11,900,180
343,900 Citigroup Inc. 8,690,353
218,900 JPMorgan Chase & Co. 10,430,585
------------
31,021,118
------------
DIVERSIFIED TELECOMMUNICATION SERVICES -- 6.1%
360,419 AT&T Inc. 13,951,819
26,600 Embarq Corp. 1,105,762
187,500 Verizon Communications Inc. 7,215,000
------------
22,272,581
------------
ELECTRIC UTILITIES -- 2.7%
64,900 Exelon Corp. 5,547,652
92,100 PPL Corp. 4,422,642
------------
9,970,294
------------
ENERGY EQUIPMENT & SERVICES -- 0.5%
25,100 National Oilwell Varco, Inc.(1) 1,718,095
------------
FOOD & STAPLES RETAILING -- 2.6%
99,400 Kroger Co. (The) 2,708,650
79,200 Wal-Mart Stores, Inc. 4,592,016
65,400 Walgreen Co. 2,279,190
------------
9,579,856
------------
FOOD PRODUCTS -- 0.9%
93,000 Unilever N.V. New York Shares 3,119,220
------------
HEALTH CARE EQUIPMENT & SUPPLIES -- 0.7%
53,800 Medtronic, Inc. 2,618,984
------------
HEALTH CARE PROVIDERS & SERVICES -- 0.3%
23,700 Quest Diagnostics Inc. 1,189,266
------------
HOTELS, RESTAURANTS & LEISURE -- 0.4%
12,800 Darden Restaurants, Inc. 455,424
19,100 McDonald's Corp. 1,137,978
------------
1,593,402
------------
HOUSEHOLD DURABLES -- 0.7%
116,800 Newell Rubbermaid Inc. 2,397,904
------------
INDEPENDENT POWER PRODUCERS & ENERGY TRADERS -- 0.8%
62,400 NRG Energy Inc.(1) 2,742,480
------------
INDUSTRIAL CONGLOMERATES -- 5.4%
522,100 General Electric Co. 17,072,670
50,900 Tyco International Ltd. 2,381,611
------------
19,454,281
------------
- ------
9
Capital Value
Shares Value
INSURANCE -- 5.9%
91,400 Allstate Corp. $ 4,602,904
141,841 American International Group, Inc. 6,553,054
58,100 Hartford Financial Services Group Inc. (The) 4,140,787
65,900 Loews Corp. 2,775,049
20,300 Marsh & McLennan Companies, Inc. 560,077
41,600 Torchmark Corp. 2,693,184
------------
21,325,055
------------
IT SERVICES -- 1.8%
19,400 Electronic Data Systems Corp. 360,064
34,000 Fiserv, Inc.(1) 1,718,700
36,600 International Business Machines Corp. 4,417,620
------------
6,496,384
------------
MACHINERY -- 3.3%
40,100 Caterpillar Inc. 3,283,388
8,000 Deere & Co. 672,560
55,200 Dover Corp. 2,730,744
65,200 Ingersoll-Rand Company Ltd. Cl A 2,893,576
31,200 Parker-Hannifin Corp. 2,491,320
------------
12,071,588
------------
MEDIA -- 3.2%
42,447 CBS Corp. Cl B 979,252
117,200 Gannett Co., Inc. 3,354,264
269,500 Time Warner Inc. 4,002,075
84,900 Viacom Inc. Cl B(1) 3,263,556
------------
11,599,147
------------
METALS & MINING -- 0.8%
37,600 Nucor Corp. 2,838,800
------------
MULTILINE RETAIL -- 0.6%
47,200 Kohl's Corp.(1) 2,305,720
------------
OFFICE ELECTRONICS -- 0.6%
148,900 Xerox Corp. 2,080,133
------------
OIL, GAS & CONSUMABLE FUELS -- 15.1%
140,900 Chevron Corp. 13,547,535
110,600 ConocoPhillips 9,528,190
8,900 Devon Energy Corp. 1,009,260
215,000 Exxon Mobil Corp. 20,010,051
133,300 Royal Dutch Shell plc ADR 10,705,323
------------
54,800,359
------------
PAPER & FOREST PRODUCTS -- 1.2%
65,400 Weyerhaeuser Co. 4,177,752
------------
Shares Value
PHARMACEUTICALS -- 9.2%
62,900 Abbott Laboratories $ 3,317,975
56,400 Eli Lilly & Co. 2,715,096
150,000 Johnson & Johnson 10,063,500
74,900 Merck & Co., Inc. 2,849,196
490,000 Pfizer Inc. 9,853,900
103,300 Wyeth 4,593,751
------------
33,393,418
------------
ROAD & RAIL -- 0.2%
45,400 YRC Worldwide Inc.(1)(2) 737,750
------------
SEMICONDUCTORS & SEMICONDUCTOR EQUIPMENT -- 0.8%
67,400 Applied Materials, Inc. 1,257,684
80,300 Intel Corp. 1,787,478
------------
3,045,162
------------
SOFTWARE -- 1.7%
126,300 Microsoft Corp. 3,602,076
115,300 Oracle Corp.(1) 2,404,005
------------
6,006,081
------------
SPECIALTY RETAIL -- 2.6%
58,400 Best Buy Co., Inc. 2,512,368
86,700 Gap, Inc. (The) 1,614,354
95,100 Home Depot, Inc. (The) 2,738,880
113,500 Staples, Inc. 2,462,950
------------
9,328,552
------------
TEXTILES, APPAREL & LUXURY GOODS -- 0.6%
30,700 VF Corp. 2,283,466
------------
THRIFTS & MORTGAGE FINANCE -- 1.3%
92,000 Freddie Mac 2,291,720
100,600 MGIC Investment Corp.(2) 1,310,818
98,900 Washington Mutual, Inc.(2) 1,215,481
------------
4,818,019
------------
TOBACCO -- 0.9%
51,500 Altria Group Inc. 1,030,000
46,800 Philip Morris International Inc.(1) 2,388,204
------------
3,418,204
------------
WIRELESS TELECOMMUNICATION SERVICES -- 0.4%
167,600 Sprint Nextel Corp. 1,339,124
------------
TOTAL COMMON STOCKS
(Cost $296,353,909) 359,445,538
------------
- ------
10
Capital Value
Principal Amount Value
Temporary Cash Investments -- 0.9%
$ 3,300,000 FHLB Discount Notes, 1.75%, 5/1/08(3)
(Cost $3,300,000) $ 3,300,000
------------
Temporary Cash Investments -- Securities Lending Collateral(4) -- 1.0%
Repurchase Agreement, Barclays Capital Inc.,
(collateralized by various U.S. Government Agency
obligations in a pooled account at the lending agent),
1.98%, dated 4/30/08, due 5/1/08 (Delivery value
$998,218) 998,163
Repurchase Agreement, BNP Paribas Securities Corp.,
(collateralized by various U.S. Government Agency
obligations in a pooled account at the lending agent),
1.99%, dated 4/30/08, due 5/1/08 (Delivery value
$700,039) 700,000
Repurchase Agreement, Deutsche Bank Securities Inc.,
(collateralized by various U.S. Government Agency
obligations in a pooled account at the lending agent),
1.97%, dated 4/30/08, due 5/1/08 (Delivery value
$700,038) 700,000
Repurchase Agreement, Lehman Brothers Inc. / Lehman
Brothers Commercial Paper Inc., (collateralized by
various U.S. Government Agency obligations in a pooled
account at the lending agent), 2.39%, dated 4/30/08, due
5/1/08 (Delivery value $700,046) 700,000
Repurchase Agreement, Morgan Stanley & Co. Inc.,
(collateralized by various U.S. Government Agency
obligations in a pooled account at the lending agent),
1.97%, dated 4/30/08, due 5/1/08 (Delivery value
$700,038) 700,000
------------
TOTAL TEMPORARY CASH INVESTMENTS -- SECURITIES LENDING
COLLATERAL
(Cost $3,798,163) 3,798,163
------------
Principal Amount Value
TOTAL INVESTMENT SECURITIES -- 100.8%
(Cost $303,452,072) $366,543,701
------------
OTHER ASSETS AND LIABILITIES -- (0.8)% (2,932,748)
------------
TOTAL NET ASSETS -- 100.0% $363,610,953
============
Notes to Schedule of Investments
ADR = American Depositary Receipt
FHLB = Federal Home Loan Bank
(1) Non-income producing.
(2) Security, or a portion thereof, was on loan as of April 30, 2008.
(3) The rate indicated is the yield to maturity at purchase.
(4) Investments represent purchases made by the lending agent with cash
collateral received through securities lending transactions.
See Notes to Financial Statements.
- ------
11
STATEMENT OF ASSETS AND LIABILITIES
APRIL 30, 2008 (UNAUDITED)
ASSETS
Investment securities, at value (cost of $299,653,909) --
including $3,599,372 of securities on loan $362,745,538
Investments made with cash collateral received for securities on
loan, at value (cost of $3,798,163) 3,798,163
------------
Total investment securities, at value (cost of $303,452,072) 366,543,701
Receivable for investments sold 1,519,031
Dividends and interest receivable 396,229
------------
368,458,961
------------
LIABILITIES
Disbursements in excess of demand deposit cash 200,298
Payable for collateral received on securities on loan 3,798,163
Payable for investments purchased 518,084
Accrued management fees 329,086
Distribution and service fees payable 2,377
------------
4,848,008
------------
NET ASSETS $363,610,953
============
NET ASSETS CONSIST OF:
Capital (par value and paid-in surplus) $284,865,832
Undistributed net investment income 1,911,007
Undistributed net realized gain on investment transactions 13,742,485
Net unrealized appreciation on investments 63,091,629
------------
$363,610,953
============
INVESTOR CLASS, $0.01 PAR VALUE
Net assets $335,512,818
Shares outstanding 45,593,640
Net asset value per share $7.36
INSTITUTIONAL CLASS, $0.01 PAR VALUE
Net assets $16,568,433
Shares outstanding 2,250,558
Net asset value per share $7.36
ADVISOR CLASS, $0.01 PAR VALUE
Net assets $11,529,702
Shares outstanding 1,568,347
Net asset value per share $7.35
See Notes to Financial Statements.
- ------
12
STATEMENT OF OPERATIONS
FOR THE SIX MONTHS ENDED APRIL 30, 2008 (UNAUDITED)
INVESTMENT INCOME (LOSS)
INCOME:
Dividends (net of foreign taxes withheld of $25,321) $ 5,737,145
Interest 49,435
Securities lending, net 55,121
-------------
5,841,701
-------------
EXPENSES:
Management fees 2,227,812
Distribution fees -- Advisor Class 3,033
Service fees -- Advisor Class 3,033
Distribution and service fees -- Advisor Class 13,165
Directors' fees and expenses 5,012
Other expenses 726
-------------
2,252,781
-------------
NET INVESTMENT INCOME (LOSS) 3,588,920
-------------
REALIZED AND UNREALIZED GAIN (LOSS)
Net realized gain (loss) on investment transactions 14,062,127
Change in net unrealized appreciation (depreciation) on
investments (72,866,330)
-------------
NET REALIZED AND UNREALIZED GAIN (LOSS) (58,804,203)
-------------
NET INCREASE (DECREASE) IN NET ASSETS RESULTING FROM OPERATIONS $(55,215,283)
=============
See Notes to Financial Statements.
- ------
13
STATEMENT OF CHANGES IN NET ASSETS
SIX MONTHS ENDED APRIL 30, 2008 (UNAUDITED) AND YEAR ENDED OCTOBER 31, 2007
Increase (Decrease) in Net Assets 2008 2007
OPERATIONS
Net investment income (loss) $ 3,588,920 $ 8,188,675
Net realized gain (loss) 14,062,127 18,769,164
Change in net unrealized appreciation
(depreciation) (72,866,330) 22,105,599
------------- ------------
Net increase (decrease) in net assets resulting
from operations (55,215,283) 49,063,438
------------- ------------
DISTRIBUTIONS TO SHAREHOLDERS
From net investment income:
Investor Class (6,799,465) (7,057,821)
Institutional Class (437,453) (534,336)
Advisor Class (195,244) (212,420)
From net realized gains:
Investor Class (17,205,248) (6,173,467)
Institutional Class (986,976) (410,071)
Advisor Class (582,280) (225,243)
------------- ------------
Decrease in net assets from distributions (26,206,666) (14,613,358)
------------- ------------
CAPITAL SHARE TRANSACTIONS
Net increase (decrease) in net assets from capital
share transactions (60,516,244) (43,818,329)
------------- ------------
NET INCREASE (DECREASE) IN NET ASSETS (141,938,193) (9,368,249)
NET ASSETS
Beginning of period 505,549,146 514,917,395
------------- ------------
End of period $363,610,953 $505,549,146
============= ============
Undistributed net investment income $1,911,007 $5,754,249
============= ============
See Notes to Financial Statements.
- ------
14
NOTES TO FINANCIAL STATEMENTS
APRIL 30, 2008 (UNAUDITED)
1. ORGANIZATION AND SUMMARY OF SIGNIFICANT ACCOUNTING POLICIES
ORGANIZATION -- American Century Mutual Funds, Inc. (the corporation) is
registered under the Investment Company Act of 1940 (the 1940 Act) as an
open-end management investment company. Capital Value Fund (the fund) is one
fund in a series issued by the corporation. The fund is diversified under the
1940 Act. The fund's investment objective is to seek long-term capital growth.
The fund pursues its objective by investing primarily in common stocks that
management believes to be undervalued at the time of purchase. The fund also
seeks to minimize the impact of federal income taxes on shareholder returns by
attempting to minimize taxable distributions to shareholders. The following is
a summary of the fund's significant accounting policies.
MULTIPLE CLASS -- The fund is authorized to issue the Investor Class, the
Institutional Class and the Advisor Class. The share classes differ
principally in their respective distribution and shareholder servicing
expenses and arrangements. All shares of the fund represent an equal pro rata
interest in the net assets of the class to which such shares belong, and have
identical voting, dividend, liquidation and other rights and the same terms
and conditions, except for class specific expenses and exclusive rights to
vote on matters affecting only individual classes. Income, non-class specific
expenses, and realized and unrealized capital gains and losses of the fund are
allocated to each class of shares based on their relative net assets.
SECURITY VALUATIONS -- Securities traded primarily on a principal securities
exchange are valued at the last reported sales price, or at the mean of the
latest bid and asked prices where no last sales price is available. Depending
on local convention or regulation, securities traded over-the-counter are
valued at the mean of the latest bid and asked prices, the last sales price,
or the official close price. Debt securities not traded on a principal
securities exchange are valued through a commercial pricing service or at the
mean of the most recent bid and asked prices. Discount notes may be valued
through a commercial pricing service or at amortized cost, which approximates
fair value. Securities traded on foreign securities exchanges and
over-the-counter markets are normally completed before the close of business
on days that the New York Stock Exchange (the Exchange) is open and may also
take place on days when the Exchange is not open. If an event occurs after the
value of a security was established but before the net asset value per share
was determined that was likely to materially change the net asset value, that
security would be valued as determined in accordance with procedures adopted
by the Board of Directors. If the fund determines that the market price of a
portfolio security is not readily available, or that the valuation methods
mentioned above do not reflect the security's fair value, such security is
valued as determined by the Board of Directors or its designee, in accordance
with procedures adopted by the Board of Directors, if such determination would
materially impact a fund's net asset value. Certain other circumstances may
cause the fund to use alternative procedures to value a security such as: a
security has been declared in default; trading in a security has been halted
during the trading day; or there is a foreign market holiday and no trading
will commence.
SECURITY TRANSACTIONS -- For financial reporting purposes, security
transactions are accounted for as of the trade date. Net realized gains and
losses are determined on the identified cost basis, which is also used for
federal income tax purposes.
INVESTMENT INCOME -- Dividend income less foreign taxes withheld, if any, is
recorded as of the ex-dividend date. Interest income is recorded on the
accrual basis and includes accretion of discounts and amortization of
premiums.
SECURITIES ON LOAN -- The fund may lend portfolio securities through its
lending agent to certain approved borrowers in order to earn additional
income. The income earned, net of any rebates or fees, is included in the
Statement of Operations. The fund continues to recognize any gain or loss in
the market price of the securities loaned and records any interest earned or
dividends declared.
- ------
15
REPURCHASE AGREEMENTS -- The fund may enter into repurchase agreements with
institutions that American Century Investment Management, Inc. (ACIM) (the
investment advisor) has determined are creditworthy pursuant to criteria
adopted by the Board of Directors. Each repurchase agreement is recorded at
cost. The fund requires that the collateral, represented by securities,
received in a repurchase transaction be transferred to the custodian in a
manner sufficient to enable the fund to obtain those securities in the event
of a default under the repurchase agreement. ACIM monitors, on a daily basis,
the securities transferred to ensure the value, including accrued interest, of
the securities under each repurchase agreement is equal to or greater than
amounts owed to the fund under each repurchase agreement.
JOINT TRADING ACCOUNT -- Pursuant to an Exemptive Order issued by the
Securities and Exchange Commission, the fund, along with other registered
investment companies having management agreements with ACIM or American
Century Global Investment Management, Inc. (ACGIM), may transfer uninvested
cash balances into a joint trading account. These balances are invested in one
or more repurchase agreements that are collateralized by U.S. Treasury or
Agency obligations.
INCOME TAX STATUS -- It is the fund's policy to distribute substantially all
net investment income and net realized gains to shareholders and to otherwise
qualify as a regulated investment company under provisions of the Internal
Revenue Code. The fund is no longer subject to examination by tax authorities
for years prior to 2004. At this time, management has not identified any
uncertain tax positions for which it is reasonably possible that the total
amounts of unrecognized tax benefits will significantly change in the next
twelve months. Accordingly, no provision has been made for federal or state
income taxes. Interest and penalties associated with any federal or state
income tax obligations, if any, are recorded as interest expense.
DISTRIBUTIONS TO SHAREHOLDERS -- Distributions to shareholders are recorded on
the ex-dividend date. Distributions from net investment income and net
realized gains, if any, are generally declared and paid annually.
INDEMNIFICATIONS -- Under the corporation's organizational documents, its
officers and directors are indemnified against certain liabilities arising out
of the performance of their duties to the fund. In addition, in the normal
course of business, the fund enters into contracts that provide general
indemnifications. The fund's maximum exposure under these arrangements is
unknown as this would involve future claims that may be made against the fund.
The risk of material loss from such claims is considered by management to be
remote.
USE OF ESTIMATES -- The financial statements are prepared in conformity with
accounting principles generally accepted in the United States of America,
which may require management to make certain estimates and assumptions at the
date of the financial statements. Actual results could differ from these
estimates.
2. FEES AND TRANSACTIONS WITH RELATED PARTIES
On September 25, 2007, the Advisor Class shareholders of the fund approved a
change to the class's fee structure. The change was approved by the Board of
Directors on November 29, 2006 and March 7, 2007. Effective December 3, 2007,
the fee structure change resulted in an increase of 0.25% in the unified
management fee and a simultaneous decrease of 0.25% in the total distribution
and service fee, resulting in no change to the total operating expense ratio
of the class.
MANAGEMENT FEES -- The corporation has entered into a Management Agreement
with ACIM, under which ACIM provides the fund with investment advisory and
management services in exchange for a single, unified management fee (the fee)
per class. The Agreement provides that all expenses of the fund, except
brokerage commissions, taxes, interest, fees and expenses of those directors
who are not considered "interested persons" as defined in the 1940 Act
(including counsel fees) and extraordinary expenses, will be paid by ACIM. The
fee is computed and accrued daily based on the daily net assets of the
specific class of shares of the fund and paid monthly in arrears. For funds
with a stepped fee schedule, the rate of the fee is determined by applying a
fee rate calculation formula. This formula takes into account all of the
investment advisor's assets under management in the fund's investment strategy
(strategy assets) to calculate the appropriate fee rate for the fund. The
strategy assets include the fund's assets and the assets of other clients of
the investment advisor that are not in the American Century family of funds,
but that have the same investment team and investment strategy. The annual
management fee schedule for the fund ranges from 0.90% to 1.10% for the
Investor Class and Advisor Class. The Institutional Class is 0.20% less at
each point within the range. Prior to December 3, 2007, the Advisor Class was
0.25% less at each point within the range. The effective annual management fee
for each class of the fund for the six months ended April 30, 2008, was 1.10%,
0.90% and 1.05% for the Investor Class, Institutional Class and Advisor Class,
respectively.
- ------
16
DISTRIBUTION AND SERVICE FEES -- The Board of Directors has adopted a Master
Distribution and Individual Shareholder Services Plan (the plan) for the
Advisor Class, pursuant to Rule 12b-1 of the 1940 Act. The plan provides that
the Advisor Class will pay American Century Investment Services, Inc. (ACIS)
an annual distribution and service fee of 0.25%. Prior to December 3, 2007,
the Board of Directors had adopted a Master Distribution and Shareholder
Services Plan for the Advisor Class, pursuant to Rule 12b-1 of the 1940 Act,
which provided that the Advisor Class would pay ACIS an annual distribution
fee of 0.25% and an annual service fee of 0.25%. The fees are computed and
accrued daily based on the Advisor Class's daily net assets and paid monthly
in arrears. The distribution fee provides compensation for expenses incurred
in connection with distributing shares of the Advisor Class including, but not
limited to, payments to brokers, dealers, and financial institutions that have
entered into sales agreements with respect to shares of the fund. The service
fee provides compensation for shareholder and administrative services rendered
by ACIS, its affiliates or independent third party providers. Fees incurred
under the plan during the six months ended April 30, 2008, are detailed in the
Statement of Operations.
RELATED PARTIES -- Certain officers and directors of the corporation are also
officers and/or directors, and, as a group, controlling stockholders of
American Century Companies, Inc. (ACC), the parent of the corporation's
investment advisor, ACIM, the distributor of the corporation, ACIS, and the
corporation's transfer agent, American Century Services, LLC.
The fund is eligible to invest in a money market fund for temporary purposes,
which is managed by J.P. Morgan Investment Management, Inc. (JPMIM). JPMIM is
a wholly owned subsidiary of JPMorgan Chase & Co. (JPM). JPM is an equity
investor in ACC. The fund has a securities lending agreement with JPMorgan
Chase Bank (JPMCB). Prior to December 12, 2007, the fund had a bank line of
credit agreement with JPMCB. JPMCB is a custodian of the fund and a wholly
owned subsidiary of JPM.
3. INVESTMENT TRANSACTIONS
Purchases and sales of investment securities, excluding short-term
investments, for the six months ended April 30, 2008, were $40,154,857 and
$124,302,327, respectively.
4. CAPITAL SHARE TRANSACTIONS
Transactions in shares of the fund were as follows:
Six months ended April 30, 2008 Year ended October 31, 2007
Shares Amount Shares Amount
INVESTOR
CLASS/SHARES
AUTHORIZED 200,000,000 200,000,000
============ ============
Sold 2,514,138 $ 18,751,782 8,504,945 $ 72,228,943
Issued in
reinvestment of
distributions 2,618,751 20,190,572 1,397,652 11,684,374
Redeemed (12,116,851) (90,387,633) (14,030,687) (120,606,257)
------------ ------------- ------------ -------------
(6,983,962) (51,445,279) (4,128,090) (36,692,940)
------------ ------------- ------------ -------------
INSTITUTIONAL
CLASS/SHARES
AUTHORIZED 15,000,000 15,000,000
============ ============
Sold 16,259 122,900 252,381 2,101,512
Issued in
reinvestment of
distributions 155,264 1,195,532 112,065 936,867
Redeemed (1,115,605) (8,396,337) (947,069) (8,137,849)
------------ ------------- ------------ -------------
(944,082) (7,077,905) (582,623) (5,099,470)
------------ ------------- ------------ -------------
ADVISOR
CLASS/SHARES
AUTHORIZED 50,000,000 50,000,000
============ ============
Sold 89,200 662,003 297,016 2,529,461
Issued in
reinvestment of
distributions 100,040 771,305 52,056 435,187
Redeemed (454,825) (3,426,368) (581,695) (4,990,567)
------------ ------------- ------------ -------------
(265,585) (1,993,060) (232,623) (2,025,919)
------------ ------------- ------------ -------------
Net increase
(decrease) (8,193,629) $(60,516,244) (4,943,336) $(43,818,329)
============ ============= ============ ============
- ------
17
5. SECURITIES LENDING
As of April 30, 2008, securities in the fund valued at $3,599,372 were on loan
through the lending agent, JPMCB, to certain approved borrowers. JPMCB
receives and maintains collateral in the form of cash and/or acceptable
securities as approved by ACIM. Cash collateral is invested in authorized
investments by the lending agent in a pooled account. The value of cash
collateral received at period end is disclosed in the Statement of Assets and
Liabilities and investments made with the cash by the lending agent are listed
in the Schedule of Investments. Any deficiencies or excess of collateral must
be delivered or transferred by the member firms no later than the close of
business on the next business day. The total market value of all collateral
received, at this date, was $3,798,163. The fund's risks in securities lending
are that the borrower may not provide additional collateral when required or
return the securities when due. If the borrower defaults, receipt of the
collateral by the fund may be delayed or limited.
6. BANK LINE OF CREDIT
Effective December 12, 2007, the fund, along with certain other funds managed
by ACIM or ACGIM, has a $500,000,000 unsecured bank line of credit agreement
with Bank of America, N.A. Prior to December 12, 2007, the fund, along with
certain other funds managed by ACIM or ACGIM, had a $500,000,000 unsecured
bank line of credit agreement with JPMCB. The fund may borrow money for
temporary or emergency purposes to fund shareholder redemptions. Borrowings
under the agreement, which is subject to annual renewal, bear interest at the
Federal Funds rate plus 0.40%. The fund did not borrow from the line during
the six months ended April 30, 2008.
7. FEDERAL TAX INFORMATION
The book-basis character of distributions made during the year from net
investment income or net realized gains may differ from their ultimate
characterization for federal income tax purposes. These differences reflect
the differing character of certain income items and net realized gains and
losses for financial statement and tax purposes, and may result in
reclassification among certain capital accounts on the financial statements.
As of April 30, 2008, the components of investments for federal income tax
purposes were as follows:
Federal tax cost of investments $303,830,694
============
Gross tax appreciation of investments $ 86,303,577
Gross tax depreciation of investments (23,590,570)
------------
Net tax appreciation (depreciation) of investments $ 62,713,007
============
The difference between book-basis and tax-basis cost and unrealized
appreciation (depreciation) is attributable primarily to the tax deferral of
losses on wash sales.
8. RECENTLY ISSUED ACCOUNTING STANDARDS
The Financial Accounting Standards Board (FASB) issued Statement of Financial
Accounting Standards No. 157, "Fair Value Measurements" (FAS 157), in
September 2006, which is effective for fiscal years beginning after November
15, 2007. FAS 157 defines fair value, establishes a framework for measuring
fair value and expands the required financial statement disclosures about fair
value measurements. Management is currently evaluating the impact that
adopting FAS 157 will have on the financial statement disclosures.
In March 2008, the FASB issued Statement of Financial Accounting Standards No.
161, "Disclosures about Derivative Instruments and Hedging Activities -- an
amendment of FASB Statement No. 133" (FAS 161). FAS 161 is effective for
fiscal years beginning after November 15, 2008. FAS 161 amends and expands
disclosures about derivative instruments and hedging activities. FAS 161
requires qualitative disclosures about the objectives and strategies of
derivative instruments, quantitative disclosures about the fair value amounts
of and gains and losses on derivative instruments, and disclosures of
credit-risk-related contingent features in hedging activities. Management is
currently evaluating the impact that adopting FAS 161 will have on the
financial statement disclosures.
- ------
18
FINANCIAL HIGHLIGHTS
Capital Value
Investor Class
For a Share Outstanding Throughout the Years Ended October 31 (except as noted)
2008(1) 2007 2006 2005 2004 2003
PER-SHARE DATA
Net Asset Value,
Beginning of
Period $8.78 $8.23 $7.15 $6.61 $5.86 $4.88
-------- -------- -------- -------- -------- -------
Income From
Investment
Operations
Net
Investment
Income
(Loss)(2) 0.07 0.13 0.12 0.10 0.09 0.08
Net Realized
and
Unrealized
Gain (Loss) (1.02) 0.65 1.14 0.51 0.72 0.97
-------- -------- -------- -------- -------- -------
Total From
Investment
Operations (0.95) 0.78 1.26 0.61 0.81 1.05
-------- -------- -------- -------- -------- -------
Distributions
From Net
Investment
Income (0.13) (0.12) (0.10) (0.07) (0.06) (0.07)
From Net
Realized
Gains (0.34) (0.11) (0.08) -- -- --
-------- -------- -------- -------- -------- -------
Total
Distributions (0.47) (0.23) (0.18) (0.07) (0.06) (0.07)
-------- -------- -------- -------- -------- -------
Net Asset Value,
End of Period $7.36 $8.78 $8.23 $7.15 $6.61 $5.86
======== ======== ======== ======== ======== =======
TOTAL RETURN(3) (11.06)% 9.66% 18.03% 9.29% 13.94% 21.67%
RATIOS/SUPPLEMENTAL DATA
Ratio of
Operating
Expenses to
Average Net Assets 1.10%(4) 1.10% 1.10% 1.10% 1.10% 1.10%
Ratio of Net
Investment Income
(Loss) to Average
Net Assets 1.76%(4) 1.52% 1.55% 1.42% 1.44% 1.54%
Portfolio
Turnover Rate 10% 15% 16% 28% 15% 22%
Net Assets, End
of Period (in
thousands) $335,513 $461,413 $466,803 $458,354 $255,504 $91,960
(1) Six months ended April 30, 2008 (unaudited).
(2) Computed using average shares outstanding throughout the period.
(3) Total return assumes reinvestment of net investment income and capital
gains distributions, if any. Total returns for periods less than one year are
not annualized. The total return of the classes may not precisely reflect the
class expense differences because of the impact of calculating the net asset
values to two decimal places. If net asset values were calculated to three
decimal places, the total return differences would more closely reflect the
class expense differences. The calculation of net asset values to two decimal
places is made in accordance with SEC guidelines and does not result in any
gain or loss of value between one class and another.
(4) Annualized.
See Notes to Financial Statements.
- ------
19
Capital Value
Institutional Class
For a Share Outstanding Throughout the Years Ended October 31 (except as noted)
2008(1) 2007 2006 2005 2004 2003
PER-SHARE DATA
Net Asset Value,
Beginning of Period $8.79 $8.24 $7.16 $6.62 $5.87 $4.88
-------- ------- ------- ------- ------- -------
Income From
Investment Operations
Net Investment
Income (Loss)(2) 0.07 0.15 0.13 0.12 0.10 0.09
Net Realized and
Unrealized Gain
(Loss) (1.01) 0.65 1.15 0.51 0.72 0.97
-------- ------- ------- ------- ------- -------
Total From
Investment
Operations (0.94) 0.80 1.28 0.63 0.82 1.06
-------- ------- ------- ------- ------- -------
Distributions
From Net
Investment Income (0.15) (0.14) (0.12) (0.09) (0.07) (0.07)
From Net Realized
Gains (0.34) (0.11) (0.08) -- -- --
-------- ------- ------- ------- ------- -------
Total
Distributions (0.49) (0.25) (0.20) (0.09) (0.07) (0.07)
-------- ------- ------- ------- ------- -------
Net Asset Value, End
of Period $7.36 $8.79 $8.24 $7.16 $6.62 $5.87
======== ======= ======= ======= ======= =======
TOTAL RETURN(3) (10.97)% 9.88% 18.24% 9.50% 14.15% 22.07%
RATIOS/SUPPLEMENTAL DATA
Ratio of Operating
Expenses to Average
Net Assets 0.90%(4) 0.90% 0.90% 0.90% 0.90% 0.90%
Ratio of Net
Investment Income
(Loss) to Average Net
Assets 1.96%(4) 1.72% 1.75% 1.62% 1.64% 1.74%
Portfolio Turnover
Rate 10% 15% 16% 28% 15% 22%
Net Assets, End of
Period (in thousands) $16,568 $28,077 $31,141 $37,523 $23,449 $11,244
(1) Six months ended April 30, 2008 (unaudited).
(2) Computed using average shares outstanding throughout the period.
(3) Total return assumes reinvestment of net investment income and capital
gains distributions, if any. Total returns for periods less than one year are
not annualized. The total return of the classes may not precisely reflect the
class expense differences because of the impact of calculating the net asset
values to two decimal places. If net asset values were calculated to three
decimal places, the total return differences would more closely reflect the
class expense differences. The calculation of net asset values to two decimal
places is made in accordance with SEC guidelines and does not result in any
gain or loss of value between one class and another.
(4) Annualized.
See Notes to Financial Statements.
- ------
20
Capital Value
Advisor Class
For a Share Outstanding Throughout the Years Ended October 31 (except as noted)
2008(1) 2007 2006 2005 2004 2003(2)
PER-SHARE DATA
Net Asset Value,
Beginning of Period $8.76 $8.21 $7.14 $6.60 $5.86 $5.19
-------- ------- ------- ------- ------ --------
Income From
Investment Operations
Net Investment
Income (Loss)(3) 0.06 0.11 0.10 0.08 0.08 0.03
Net Realized and
Unrealized Gain
(Loss) (1.02) 0.65 1.13 0.52 0.71 0.64
-------- ------- ------- ------- ------ --------
Total From
Investment
Operations (0.96) 0.76 1.23 0.60 0.79 0.67
-------- ------- ------- ------- ------ --------
Distributions
From Net
Investment Income (0.11) (0.10) (0.08) (0.06) (0.05) --
From Net Realized
Gains (0.34) (0.11) (0.08) -- -- --
-------- ------- ------- ------- ------ --------
Total
Distributions (0.45) (0.21) (0.16) (0.06) (0.05) --
-------- ------- ------- ------- ------ --------
Net Asset Value, End
of Period $7.35 $8.76 $8.21 $7.14 $6.60 $5.86
======== ======= ======= ======= ====== ========
TOTAL RETURN(4) (11.19)% 9.40% 17.62% 9.04% 13.60% 12.91%
RATIOS/SUPPLEMENTAL DATA
Ratio of Operating
Expenses to Average
Net Assets 1.35%(5) 1.35% 1.35% 1.35% 1.35% 1.35%(5)
Ratio of Net
Investment Income
(Loss) to Average Net
Assets 1.51%(5) 1.27% 1.30% 1.17% 1.19% 1.03%(5)
Portfolio Turnover
Rate 10% 15% 16% 28% 15% 22%(6)
Net Assets, End of
Period (in thousands) $11,530 $16,059 $16,973 $14,744 $8,023 $201
(1) Six months ended April 30, 2008 (unaudited).
(2) May 14, 2003 (commencement of sale) through October 31, 2003.
(3) Computed using average shares outstanding throughout the period.
(4) Total return assumes reinvestment of net investment income and capital
gains distributions, if any. Total returns for periods less than one year are
not annualized. The total return of the classes may not precisely reflect the
class expense differences because of the impact of calculating the net asset
values to two decimal places. If net asset values were calculated to three
decimal places, the total return differences would more closely reflect the
class expense differences. The calculation of net asset values to two decimal
places is made in accordance with SEC guidelines and does not result in any
gain or loss of value between one class and another.
(5) Annualized.
(6) Portfolio turnover is calculated at the fund level. Percentage indicated
was calculated for the year ended October 31, 2003.
See Notes to Financial Statements.
- ------
21
ADDITIONAL INFORMATION
RETIREMENT ACCOUNT INFORMATION
As required by law, any distributions you receive from an IRA or certain
403(b), 457 and qualified plans [those not eligible for rollover to an IRA or
to another qualified plan] are subject to federal income tax withholding,
unless you elect not to have withholding apply. Tax will be withheld on the
total amount withdrawn even though you may be receiving amounts that are not
subject to withholding, such as nondeductible contributions. In such case,
excess amounts of withholding could occur. You may adjust your withholding
election so that a greater or lesser amount will be withheld.
If you don't want us to withhold on this amount, you must notify us to not
withhold the federal income tax. Even if you plan to roll over the amount you
withdraw to another tax-deferred account, the withholding rate still applies
to the withdrawn amount unless we have received notice not to withhold federal
income tax prior to the withdrawal. You may notify us in writing or in certain
situations by telephone or through other electronic means. You have the right
to revoke your withholding election at any time and any election you make may
remain in effect until revoked by filing a new election.
Remember, even if you elect not to have income tax withheld, you are liable
for paying income tax on the taxable portion of your withdrawal. If you elect
not to have income tax withheld or you don't have enough income tax withheld,
you may be responsible for payment of estimated tax. You may incur penalties
under the estimated tax rules if your withholding and estimated tax payments
are not sufficient.
State tax will be withheld if, at the time of your distribution, your address
is within one of the mandatory withholding states and you have federal income
tax withheld. State taxes will be withheld from your distribution in
accordance with the respective state rules.
PROXY VOTING GUIDELINES
American Century Investment Management, Inc., the fund's investment advisor,
is responsible for exercising the voting rights associated with the securities
purchased and/or held by the fund. A description of the policies and
procedures the advisor uses in fulfilling this responsibility is available
without charge, upon request, by calling 1-800-345-2021. It is also available
on American Century Investments' website at americancentury.com and on the
Securities and Exchange Commission's website at sec.gov. Information regarding
how the investment advisor voted proxies relating to portfolio securities
during the most recent 12-month period ended June 30 is available on the
"About Us" page at americancentury.com. It is also available at sec.gov.
QUARTERLY PORTFOLIO DISCLOSURE
The fund files its complete schedule of portfolio holdings with the Securities
and Exchange Commission (SEC) for the first and third quarters of each fiscal
year on Form N-Q. The fund's Form N-Q is available on the SEC's website at
sec.gov, and may be reviewed and copied at the SEC's Public Reference Room in
Washington, DC. Information on the operation of the Public Reference Room may
be obtained by calling 1-800-SEC-0330. The fund also makes its complete
schedule of portfolio holdings for the most recent quarter of its fiscal year
available on its website at americancentury.com and, upon request, by calling
1-800-345-2021.
- ------
22
INDEX DEFINITIONS
The following indices are used to illustrate investment market, sector, or
style performance or to serve as fund performance comparisons. They are not
investment products available for purchase.
The RUSSELL 1000® INDEX is a market-capitalization weighted, large-cap index
created by Frank Russell Company to measure the performance of the 1,000
largest of the 3,000 largest publicly traded U.S. companies, based on total
market capitalization.
The RUSSELL 1000® GROWTH INDEX measures the performance of those Russell 1000
Index companies (the 1,000 largest of the 3,000 largest publicly traded U.S.
companies, based on total market capitalization) with higher price-to-book
ratios and higher forecasted growth values.
The RUSSELL 1000® VALUE INDEX measures the performance of those Russell 1000
Index companies (the 1,000 largest of the 3,000 largest publicly traded U.S.
companies, based on total market capitalization) with lower price-to-book
ratios and lower forecasted growth values.
The RUSSELL 2000® INDEX is a market-capitalization weighted index created by
Frank Russell Company to measure the performance of the 2,000 smallest of the
3,000 largest publicly traded U.S. companies, based on total market
capitalization.
The RUSSELL 2000® GROWTH INDEX measures the performance of those Russell 2000
Index companies (the 2,000 smallest of the 3,000 largest publicly traded U.S.
companies, based on total market capitalization) with higher price-to-book
ratios and higher forecasted growth values.
The RUSSELL 2000® VALUE INDEX measures the performance of those Russell 2000
Index companies (the 2,000 smallest of the 3,000 largest publicly traded U.S.
companies, based on total market capitalization) with lower price-to-book
ratios and lower forecasted growth values.
The RUSSELL MIDCAP® INDEX measures the performance of the 800 smallest of the
1,000 largest publicly traded U.S. companies, based on total market
capitalization.
The RUSSELL MIDCAP® GROWTH INDEX measures the performance of those Russell
Midcap Index companies (the 800 smallest of the 1,000 largest publicly traded
U.S. companies, based on total market capitalization) with higher
price-to-book ratios and higher forecasted growth values.
The RUSSELL MIDCAP® VALUE INDEX measures the performance of those Russell
Midcap Index companies (the 800 smallest of the 1,000 largest publicly traded
U.S. companies, based on total market capitalization) with lower price-to-book
ratios and lower forecasted growth values.
The S&P 500 INDEX is a market value-weighted index of the stocks of 500
publicly traded U.S. companies chosen for market size, liquidity, and industry
group representation that are considered to be leading firms in dominant
industries. Each stock's weight in the index is proportionate to its market
value. Created by Standard & Poor's, it is considered to be a broad measure of
U.S. stock market performance.
- ------
23
NOTES
- ------
24
[back cover]
[american century investments logo and text logo ®]
CONTACT US
AMERICANCENTURY.COM
AUTOMATED INFORMATION LINE . . . . . . . . . . . . . . . 1-800-345-8765
INVESTOR SERVICES REPRESENTATIVE . . . . . . . . . . . . 1-800-345-2021 or
816-531-5575
BUSINESS, NOT-FOR-PROFIT, EMPLOYER-SPONSORED RETIREMENT
PLANS. . . . . . . . . . . . . . . . . . . . . . . . . . 1-800-345-3533
BANKS AND TRUST COMPANIES, BROKER-DEALERS,
FINANCIAL PROFESSIONALS, INSURANCE COMPANIES . . . . . . 1-800-345-6488
TELECOMMUNICATIONS DEVICE FOR THE DEAF . . . . . . . . . 1-800-634-4113
AMERICAN CENTURY MUTUAL FUNDS, INC.
INVESTMENT ADVISOR:
American Century Investment Management, Inc.
Kansas City, Missouri
This report and the statements it contains are submitted for the general
information of our shareholders. The report is not authorized for distribution to
prospective investors unless preceded or accompanied by an effective prospectus.
American Century Investment Services, Inc., Distributor
©2008 American Century Proprietary Holdings, Inc. All rights reserved.
0806
CL-SAN-60499N
[front cover]
SEMIANNUAL REPORT
APRIL 30, 2008
[american century investments logo and text logo ®]
AMERICAN CENTURY INVESTMENTS
NT GROWTH FUND
NT VISTA(SM) FUND
PRESIDENT'S LETTER
[photo of Jonathan Thomas]
JONATHAN THOMAS
Dear Investor,
At American Century Investments®, we are committed to helping you reach your
financial goals. Your success is the ultimate measure of our performance.
That's why we focus on achieving superior investment results and building
long-term relationships with investors like you.
Part of that relationship is to clearly communicate investment results and
what influenced them. To help you monitor your investment with us, we take
pride in providing you with the semiannual report for the American Century® NT
Growth and NT Vista funds for the six months ended April 30, 2008. We also
recommend americancentury.com, where we provide company news, quarterly
portfolio commentaries, investment views, and other useful information.
As noted on the website, 2008 marks the 50th anniversary of American Century
Investments. Since 1958, we've worked to make wise decisions with your
interests as our guide. Fifty years also means that we've met the challenges
of previous economic downturns. As we've crossed those hurdles and earned your
trust, our assets under management have grown to nearly $100 billion, putting
us in the top 5% of our industry. This growth has given us the resources to
offer a wide array of financial products and services, including a
well-diversified line-up of portfolios that provide you with many choices in
these uncertain times.
Though our offerings are diverse, they share several key qualities, including
our disciplined investment approach and active, team-based management. Strict
adherence to our processes and long-term strategies allows us to stay focused
during volatile periods. Investors in our portfolios also benefit from the sum
of our investment teams' expertise as they share research and information.
We'll continue to work hard to earn your trust. Thank you for your continued
support.
Sincerely,
/s/Jonathan Thomas
Jonathan S. Thomas
President and Chief Executive Officer
American Century Investments
TABLE OF CONTENTS
Market Perspective. . . . . . . . . . . . . . . . . . . . . . . . . . 2
U.S. Stock Index Returns . . . . . . . . . . . . . . . . . . . . . . 2
NT GROWTH
Performance . . . . . . . . . . . . . . . . . . . . . . . . . . . . . 3
Portfolio Commentary. . . . . . . . . . . . . . . . . . . . . . . . . 5
Top Ten Holdings . . . . . . . . . . . . . . . . . . . . . . . . . . 5
Top Five Industries. . . . . . . . . . . . . . . . . . . . . . . . . 6
Types of Investments in Portfolio. . . . . . . . . . . . . . . . . . 6
Schedule of Investments . . . . . . . . . . . . . . . . . . . . . . . 7
NT VISTA
Performance . . . . . . . . . . . . . . . . . . . . . . . . . . . . . 10
Portfolio Commentary. . . . . . . . . . . . . . . . . . . . . . . . . 12
Top Ten Holdings . . . . . . . . . . . . . . . . . . . . . . . . . . 12
Top Five Industries. . . . . . . . . . . . . . . . . . . . . . . . . 13
Types of Investments in Portfolio. . . . . . . . . . . . . . . . . . 13
Schedule of Investments . . . . . . . . . . . . . . . . . . . . . . . 14
Shareholder Fee Examples. . . . . . . . . . . . . . . . . . . . . . . 17
FINANCIAL STATEMENTS
Statement of Assets and Liabilities . . . . . . . . . . . . . . . . . 19
Statement of Operations . . . . . . . . . . . . . . . . . . . . . . . 20
Statement of Changes in Net Assets. . . . . . . . . . . . . . . . . . 21
Notes to Financial Statements . . . . . . . . . . . . . . . . . . . . 22
Financial Highlights. . . . . . . . . . . . . . . . . . . . . . . . . 26
OTHER INFORMATION
Additional Information. . . . . . . . . . . . . . . . . . . . . . . . 28
Index Definitions . . . . . . . . . . . . . . . . . . . . . . . . . . 29
The opinions expressed in the Market Perspective and each of the Portfolio
Commentaries reflect those of the portfolio management team as of the date of
the report, and do not necessarily represent the opinions of American Century
or any other person in the American Century organization. Any such opinions
are subject to change at any time based upon market or other conditions and
American Century disclaims any responsibility to update such opinions. These
opinions may not be relied upon as investment advice and, because investment
decisions made by American Century funds are based on numerous factors, may
not be relied upon as an indication of trading intent on behalf of any
American Century fund. Security examples are used for representational
purposes only and are not intended as recommendations to purchase or sell
securities. Performance information for comparative indices and securities is
provided to American Century by third party vendors. To the best of American
Century's knowledge, such information is accurate at the time of printing.
MARKET PERSPECTIVE
[photo of chief investment officer]
Steve Lurito, Chief Investment Officer,
U.S. Growth Equity
VOLATILITY UP, STOCKS DOWN
The six months ended April 30, 2008 saw stocks produce negative returns as
market volatility surged in the wake of the subprime credit crisis. In terms
of the economy, tighter credit and the slumping housing market hurt consumer
spending and confidence, leading many economists to suggest we're already in
recession. Meanwhile, mounting losses hurt the banks, brokers, and other big
institutional players important for the functioning of the financial markets.
Facing dual economic and financial crises, the Federal Reserve (the Fed) took
a series of extraordinary steps, slashing interest rates and acting as a
lender of last resort not only for banks, but also major brokers. That helped
stocks rebound, with many analysts suggesting that the mid-March buy-out of
investment bank Bear Stearns -- in a deal arranged by the Fed -- put a floor
under the market.
RETURNS BY SIZE, STYLE MIXED
Performance by size and style was mixed (see the accompanying table),
reflecting the volatile trading during the period, when corporate earnings
estimates were revised down sharply. Looking at returns by sector, energy
shares were the only segment to produce positive results during the six
months. At the other end of the spectrum, credit-related losses took a big
bite out of earnings for financials stocks, which performed worst. Consumer
discretionary shares also lagged badly, as did information technology stocks,
which suffered from poor pricing and demand trends for chips and some
consumer-related tech goods.
OPPORTUNITY AMID VOLATILITY
Despite the uncertainty surrounding the economy, we think growth-oriented
stocks can perform well relative to value as proven earnings growth becomes
scarce during economic slowdowns. And while we don't see an end to market
volatility anytime soon, we view this dynamic as a natural part of the
investing cycle -- and one that presents us with opportunities to build
positions in what we believe are high-quality companies trading at attractive
prices. Indeed, investors should rest assured that we're finding no shortage
of companies demonstrating sustained earnings growth and business improvement.
U.S. Stock Index Returns
For the six months ended April 30, 2008*
RUSSELL 1000 INDEX (LARGE-CAP) -9.54%
Russell 1000 Growth Index -9.28%
Russell 1000 Value Index -9.83%
RUSSELL MIDCAP INDEX -8.77%
Russell Midcap Growth Index -8.44%
Russell Midcap Value Index -9.20%
RUSSELL 2000 INDEX (SMALL-CAP) -12.92%
Russell 2000 Growth Index -14.14%
Russell 2000 Value Index -11.55%
*Total returns for periods less than one year are not annualized.
- ------
2
PERFORMANCE
NT Growth
Total Returns as of April 30, 2008
Average Annual
Returns
Since Inception
6 months(1) 1 year Inception Date
INSTITUTIONAL CLASS -6.02% 7.51% 10.30% 5/12/06
RUSSELL 1000 GROWTH
INDEX(2) -9.28% -0.23% 6.83% --
(1) Total returns for periods less than one year are not annualized.
(2) Data provided by Lipper Inc. -- A Reuters Company. ©2008 Reuters. All
rights reserved. Any copying, republication or redistribution of Lipper
content, including by caching, framing or similar means, is expressly
prohibited without the prior written consent of Lipper. Lipper shall not be
liable for any errors or delays in the content, or for any actions taken in
reliance thereon.
Lipper Fund Performance -- Performance data is total return and is
preliminary and subject to revision.
The data contained herein has been obtained from company reports, financial
reporting services, periodicals and other resources believed to be reliable.
Although carefully verified, data on compilations is not guaranteed by Lipper
and may be incomplete. No offer or solicitations to buy or sell any of the
securities herein is being made by Lipper.
Data presented reflect past performance. Past performance is no guarantee of
future results. Current performance may be higher or lower than the
performance shown. Investment return and principal value will fluctuate, and
redemption value may be more or less than original cost. To obtain performance
data current to the most recent month end, please call 1-800-345-2021 or visit
americancentury.com.
Data assumes reinvestment of dividends and capital gains, and none of the
charts reflect the deduction of taxes that a shareholder would pay on fund
distributions or the redemption of fund shares. Returns for the index are
provided for comparison. The fund's total returns include operating expenses
(such as transaction costs and management fees) that reduce returns, while the
total returns of the index do not.
- ------
3
NT Growth
Growth of $10,000 Over Life of Class
$10,000 investment made May 12, 2006
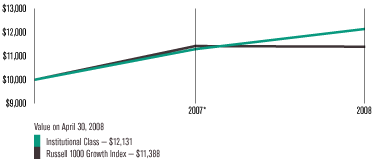
One-Year Returns Over Life of Class
Periods ended April 30
2007* 2008
Institutional Class 12.83% 7.51%
Russell 1000 Growth Index 14.14% -0.23%
*From 5/12/06, the Institutional Class's inception date. Not annualized.
Data presented reflect past performance. Past performance is no guarantee of
future results. Current performance may be higher or lower than the
performance shown. Investment return and principal value will fluctuate, and
redemption value may be more or less than original cost. To obtain performance
data current to the most recent month end, please call 1-800-345-2021 or visit
americancentury.com.
Data assumes reinvestment of dividends and capital gains, and none of the
charts reflect the deduction of taxes that a shareholder would pay on fund
distributions or the redemption of fund shares. Returns for the index are
provided for comparison. The fund's total returns include operating expenses
(such as transaction costs and management fees) that reduce returns, while the
total returns of the index do not.
- ------
4
PORTFOLIO COMMENTARY
NT Growth
Portfolio Managers: Greg Woodhams and Prescott LeGard
PERFORMANCE SUMMARY
NT Growth returned -6.02%* during the six months ended April 30, 2008. By
comparison, the Russell 1000 Growth Index and Lipper Large-Cap Growth Funds
category average returned -9.28% and -10.15%**, respectively. Better measures
of the portfolio's performance are its longer-term results compared with the
index, which can be seen on page 3.
Overall, performance was driven by holdings in the energy sector; materials
and consumer staples also made positive contributions. Information technology
holdings were the leading detractors. In terms of NT Growth's performance
relative to the Russell 1000 Growth Index, outperformance was driven by stock
selection among health care and consumer discretionary stocks; holdings in the
consumer staples, financials, and energy sectors were other notable
contributors. Stock picks in information technology detracted most from
relative results.
HEALTH CARE LED CONTRIBUTORS
Health care stocks contributed most to the portfolio's return relative to the
benchmark. Performance was driven by positioning in the pharmaceutical
industry. In particular, NT Growth had no exposure to Merck, and managers
eliminated Schering-Plough at the end of 2007 after sizable gains. This helped
relative results after both stocks suffered in March from questions about the
efficacy of a jointly marketed cholesterol drug.
Positioning in health care equipment & supplies firms was another source of
relative strength. The leading contributor to return in this space was Becton
Dickinson, which benefited from increased usage around the world of its safety
devices that reduce accidents and infection among patients and caregivers.
CONSUMER DISCRETIONARY HELPED
In the consumer discretionary sector, outperformance was a result of stock
selection in the specialty retail and internet & catalog retailing segments.
It also helped to underweight stocks in the hotels, restaurants & leisure
category. Key contributions in the sector came from specialty retailers Urban
Outfitters and The TJX Companies. Internet travel portal priceline.com was
another leading contributor, helped by the acquisition of overseas vacation
properties and growth in its international business.
Top Ten Holdings as of April 30, 2008
% of % of
net assets net assets
as of as of
4/30/08 10/31/07
Apple Inc. 3.4% 4.0%
Honeywell International Inc. 2.5% 1.2%
QUALCOMM Inc. 2.5% 0.9%
Emerson Electric Co. 2.4% 1.9%
Becton, Dickinson & Co. 2.3% 2.3%
Microsoft Corp. 2.2% 3.7%
Apache Corp. 2.2% 1.9%
Coca-Cola Co. (The) 2.2% 2.6%
BorgWarner, Inc. 2.2% 2.0%
Devon Energy Corp. 2.2% 1.8%
*Total returns for periods less than one year are not annualized.
**The Lipper Large-Cap Growth Funds category average return for the one-year
period ended April 30, 2008 was 1.73%.
- ------
5
NT Growth
OTHER KEY CONTRIBUTORS
Three of the five largest contributors to portfolio performance were oil & gas
exploration and production firms Devon Energy, Apache, and XTO Energy. These
companies benefited from surging oil prices and reserve growth in the U.S. and
overseas. These shares also saw demand from investors who wanted exposure to
the energy sector but preferred to avoid the big, integrated firms that are
less closely tied to the price of oil and are seeing declining margins in
their refining businesses.
IT, INDUSTRIALS DETRACTED
Stock selection among information technology stocks detracted most from
relative return, led by holdings in the software, internet software &
services, and IT services industries. Indeed, the sector was home to the five
largest individual detractors from relative performance, led by enterprise
software firm VMWare. This overweight position was eliminated after the firm
gave a surprisingly poor profit forecast. The number-two detractor was IBM,
which reported good results and bought back stock during the period. The
portfolio had no exposure to the stock.
With the exception of utilities (a tiny portion of the fund and index),
industrials was the only other sector to detract from relative performance, as
it hurt to be significantly underweight the road & rail and air freight
industries. The leading detractor in the sector was an overweight position in
Continental Airlines, as investors worried about the effects of rising fuel
costs and a slowing economy. We eliminated the position during the period.
OUTLOOK
The investment process focuses on large companies exhibiting sustainable
improvement in their businesses. We believe that owning such companies will
generate outperformance over time versus the Russell 1000 Growth Index and the
other funds in the large-growth peer group.
As a result, the portfolio's sector and industry selection are primarily a
result of identifying what we believe to be superior individual securities. As
of April 30, 2008, we found opportunity in the health care sector, the
portfolio's largest overweight position. The most notable sector underweight
was in information technology shares.
Top Five Industries as of April 30, 2008
% of % of
net assets net assets
as of as of
4/30/08 10/31/07
Health Care Equipment & Supplies 8.2% 8.8%
Communications Equipment 8.0% 7.2%
Aerospace & Defense 6.4% 3.1%
Oil, Gas & Consumable Fuels 6.4% 7.1%
Semiconductors & Semiconductor Equipment 5.7% 3.4%
Types of Investments in Portfolio
% of % of
net assets net assets
as of as of
4/30/08 10/31/07
Domestic Common Stocks 93.1% 94.9%
Foreign Common Stocks(1) 6.3% 4.3%
TOTAL COMMON STOCKS 99.4% 99.2%
Temporary Cash Investments 0.8% --
Other Assets and Liabilities(2) (0.2)% 0.8%
(1) Includes depositary shares, dual listed securities and foreign ordinary
shares.
(2) Includes securities lending collateral and other assets and liabilities.
- ------
6
SCHEDULE OF INVESTMENTS
NT Growth
APRIL 30, 2008 (UNAUDITED)
Shares Value
Common Stocks -- 99.4%
AEROSPACE & DEFENSE -- 6.4%
41,400 Honeywell International Inc. $ 2,459,160
29,400 Raytheon Co. 1,880,718
26,100 United Technologies Corp. 1,891,467
-----------
6,231,345
-----------
AUTO COMPONENTS -- 2.2%
42,500 BorgWarner, Inc. 2,088,875
-----------
BEVERAGES -- 3.9%
36,200 Coca-Cola Co. (The) 2,131,094
24,600 PepsiCo, Inc. 1,685,838
-----------
3,816,932
-----------
BIOTECHNOLOGY -- 1.4%
6,300 Genentech, Inc.(1) 429,660
17,900 Gilead Sciences, Inc.(1) 926,504
-----------
1,356,164
-----------
BUILDING PRODUCTS -- 0.3%
13,700 Masco Corp. 249,477
-----------
CAPITAL MARKETS -- 3.6%
61,000 Invesco Ltd. 1,564,650
13,500 Northern Trust Corp. 1,000,485
27,900 Waddell & Reed Financial, Inc. Cl A 944,694
-----------
3,509,829
-----------
CHEMICALS -- 1.7%
14,800 Monsanto Co. 1,687,496
-----------
COMMUNICATIONS EQUIPMENT -- 8.0%
40,600 ADC Telecommunications, Inc.(1) 569,212
10,700 Ciena Corp.(1) 361,767
58,400 Cisco Systems Inc.(1) 1,497,376
59,400 Corning Inc. 1,586,574
68,900 JDS Uniphase Corp.(1) 985,959
56,400 QUALCOMM Inc. 2,435,916
2,900 Research In Motion Ltd.(1) 352,727
-----------
7,789,531
-----------
COMPUTERS & PERIPHERALS -- 4.6%
18,800 Apple Inc.(1) 3,270,260
56,800 Dell Inc.(1) 1,058,184
8,000 EMC Corp.(1) 123,200
-----------
4,451,644
-----------
DIVERSIFIED -- 0.5%
8,800 iShares Russell 1000 Growth Index Fund 505,648
-----------
Shares Value
DIVERSIFIED FINANCIAL SERVICES -- 1.2%
1,200 CME Group Inc. $ 548,940
3,900 IntercontinentalExchange Inc.(1) 605,085
-----------
1,154,025
-----------
ELECTRIC UTILITIES -- 0.5%
6,900 FPL Group, Inc. 457,401
-----------
ELECTRICAL EQUIPMENT -- 4.0%
29,200 Cooper Industries, Ltd. Cl A 1,237,788
44,200 Emerson Electric Co. 2,309,892
1,300 First Solar Inc.(1) 379,587
-----------
3,927,267
-----------
ELECTRONIC EQUIPMENT & INSTRUMENTS -- 0.8%
76,100 Flextronics International Ltd.(1) 790,679
-----------
ENERGY EQUIPMENT & SERVICES -- 3.0%
9,400 Helmerich & Payne, Inc. 505,250
10,500 Schlumberger Ltd. 1,055,775
9,200 Transocean Inc.(1) 1,356,632
-----------
2,917,657
-----------
FOOD & STAPLES RETAILING -- 4.0%
25,000 Costco Wholesale Corp. 1,781,250
35,400 Wal-Mart Stores, Inc. 2,052,492
-----------
3,833,742
-----------
FOOD PRODUCTS -- 0.8%
1,600 Nestle SA ORD 767,716
-----------
HEALTH CARE EQUIPMENT & SUPPLIES -- 8.2%
25,800 Baxter International Inc. 1,607,856
24,500 Becton, Dickinson & Co. 2,190,300
10,900 C.R. Bard, Inc. 1,026,453
24,700 DENTSPLY International Inc. 960,089
5,100 Gen-Probe Inc.(1) 287,436
4,300 Idexx Laboratories, Inc.(1) 228,760
2,200 Intuitive Surgical Inc.(1) 636,372
20,100 Medtronic, Inc. 978,468
-----------
7,915,734
-----------
HEALTH CARE PROVIDERS & SERVICES -- 0.9%
8,100 Laboratory Corp. of America Holdings(1) 612,522
9,000 VCA Antech Inc.(1) 291,330
-----------
903,852
-----------
- ------
7
NT Growth
Shares Value
HOTELS, RESTAURANTS & LEISURE -- 1.3%
36,600 Darden Restaurants, Inc. $ 1,302,228
-----------
HOUSEHOLD DURABLES -- 0.8%
14,000 KB Home(2) 315,000
6,000 Mohawk Industries Inc.(1)(2) 457,140
-----------
772,140
-----------
HOUSEHOLD PRODUCTS -- 1.3%
18,500 Procter & Gamble Co. (The) 1,240,425
-----------
INDUSTRIAL CONGLOMERATES -- 0.4%
10,600 General Electric Co. 346,620
-----------
INSURANCE -- 1.1%
19,700 Chubb Corp. 1,043,510
-----------
INTERNET & CATALOG RETAIL -- 0.5%
4,000 priceline.com Inc.(1)(2) 510,560
-----------
INTERNET SOFTWARE & SERVICES -- 0.9%
1,500 Google Inc. Cl A(1) 861,435
-----------
IT SERVICES -- 1.3%
6,200 Global Payments Inc. 274,412
11,172 Visa Inc. Cl A(1) 932,303
-----------
1,206,715
-----------
LIFE SCIENCES TOOLS & SERVICES -- 2.3%
3,000 Illumina, Inc.(1) 233,670
11,400 QIAGEN N.V.(1) 253,194
30,500 Thermo Fisher Scientific Inc.(1) 1,765,035
-----------
2,251,899
-----------
MACHINERY -- 3.0%
4,600 Caterpillar Inc. 376,648
18,500 Eaton Corp. 1,625,040
8,857 Valmont Industries, Inc. 872,060
-----------
2,873,748
-----------
MEDIA -- 1.9%
47,700 Viacom Inc. Cl B(1) 1,833,588
-----------
METALS & MINING -- 1.6%
13,600 Freeport-McMoRan Copper & Gold, Inc. 1,547,000
-----------
MULTILINE RETAIL -- 1.1%
48,500 Family Dollar Stores, Inc. 1,037,900
-----------
OIL, GAS & CONSUMABLE FUELS -- 6.4%
16,000 Apache Corp. 2,154,880
18,400 Devon Energy Corp. 2,086,560
1,900 EOG Resources Inc. 247,912
27,850 XTO Energy Inc. 1,722,801
-----------
6,212,153
-----------
Shares Value
PHARMACEUTICALS -- 3.3%
34,100 Allergan, Inc. $ 1,922,217
18,900 Novo Nordisk AS B Shares ORD(2) 1,302,984
-----------
3,225,201
-----------
REAL ESTATE INVESTMENT TRUSTS (REITS) -- 0.6%
5,200 Digital Realty Trust Inc. 201,500
10,800 Weingarten Realty Investors 398,412
-----------
599,912
-----------
ROAD & RAIL -- 0.4%
2,600 Union Pacific Corp. 377,494
-----------
SEMICONDUCTORS & SEMICONDUCTOR EQUIPMENT -- 5.7%
26,100 Altera Corp. 555,408
20,800 Applied Materials, Inc. 388,128
81,300 Intel Corp. 1,809,738
47,700 Linear Technology Corp. 1,667,592
7,100 MEMC Electronic Materials Inc.(1) 447,087
24,800 Xilinx, Inc. 614,296
-----------
5,482,249
-----------
SOFTWARE -- 4.3%
8,500 Electronic Arts Inc.(1) 437,495
76,100 Microsoft Corp. 2,170,372
38,400 Oracle Corp.(1) 800,640
12,100 Salesforce.com Inc.(1) 807,433
-----------
4,215,940
-----------
SPECIALTY RETAIL -- 3.8%
16,300 Advance Auto Parts, Inc. 565,284
51,200 Lowe's Companies, Inc. 1,289,728
11,500 TJX Companies, Inc. (The) 370,530
43,400 Urban Outfitters Inc.(1) 1,486,450
-----------
3,711,992
-----------
WIRELESS TELECOMMUNICATION SERVICES -- 1.4%
32,100 American Tower Corp. Cl A(1) 1,393,782
-----------
TOTAL COMMON STOCKS
(Cost $86,639,995) 96,401,505
-----------
- ------
8
NT Growth
Value
Temporary Cash Investments -- 0.8%
Repurchase Agreement, Bank of America Securities,
LLC, (collateralized by various U.S. Treasury
obligations, 0.625%, 4/15/13, valued at $816,498),
in a joint trading account at 1.92%, dated 4/30/08,
due 5/1/08 (Delivery value $800,043) (Cost
$800,000) $ 800,000
-----------
Temporary Cash Investments -- Securities Lending Collateral(3) --
1.5%
Repurchase Agreement, Barclays Capital Inc.,
(collateralized by various U.S. Government Agency
obligations in a pooled account at the lending
agent), 1.98%, dated 4/30/08, due 5/1/08 (Delivery
value $300,093) 300,076
Repurchase Agreement, BNP Paribas Securities Corp.,
(collateralized by various U.S. Government Agency
obligations in a pooled account at the lending
agent), 1.99%, dated 4/30/08, due 5/1/08 (Delivery
value $285,016) 285,000
Repurchase Agreement, Deutsche Bank Securities
Inc., (collateralized by various U.S. Government
Agency obligations in a pooled account at the
lending agent), 1.97%, dated 4/30/08, due 5/1/08
(Delivery value $285,016) 285,000
Value
Repurchase Agreement, Lehman Brothers Inc. / Lehman
Brothers Commercial Paper Inc., (collateralized by
various U.S. Government Agency obligations in a
pooled account at the lending agent), 2.39%, dated
4/30/08, due 5/1/08 (Delivery value $285,019) $ 285,000
Repurchase Agreement, Morgan Stanley & Co. Inc.,
(collateralized by various U.S. Government Agency
obligations in a pooled account at the lending
agent), 1.97%, dated 4/30/08, due 5/1/08 (Delivery
value $285,016) 285,000
-----------
TOTAL TEMPORARY CASH INVESTMENTS -- SECURITIES
LENDING COLLATERAL
(Cost $1,440,076) 1,440,076
-----------
TOTAL INVESTMENT SECURITIES -- 101.7%
(Cost $88,880,071) 98,641,581
-----------
OTHER ASSETS AND LIABILITIES -- (1.7)% (1,656,316)
-----------
TOTAL NET ASSETS -- 100.0% $96,985,265
===========
Forward Foreign Currency Exchange Contracts
Settlement Unrealized
Contracts to Sell Date Value Gain (Loss)
549,920 CHF for USD 5/30/08 $ 531,140 $ 1,455
4,074,840 DKK for USD 5/30/08 852,844 395
---------- ----------
$1,383,984 $ 1,850
========== ==========
(Value on Settlement Date $1,385,834)
Notes to Schedule of Investments
CHF = Swiss Franc
DKK = Danish Krone
ORD = Foreign Ordinary Share
USD = United States Dollar
(1) Non-income producing.
(2) Security, or a portion thereof, was on loan as of April 30, 2008.
(3) Investments represent purchases made by the lending agent with cash
collateral received through securities lending transactions.
See Notes to Financial Statements.
- ------
9
PERFORMANCE
NT Vista
Total Returns as of April 30, 2008
Average Annual
Returns
Since Inception
6 months(1) 1 year Inception Date
INSTITUTIONAL CLASS -12.25% 11.21% 8.66% 5/12/06
RUSSELL MIDCAP GROWTH
INDEX(2) -8.44% -1.93% 5.20% --
(1) Total returns for periods less than one year are not annualized.
(2) Data provided by Lipper Inc. - A Reuters Company. ©2008 Reuters. All
rights reserved. Any copying, republication or redistribution of Lipper
content, including by caching, framing or similar means, is expressly
prohibited without the prior written consent of Lipper. Lipper shall not be
liable for any errors or delays in the content, or for any actions taken in
reliance thereon.
The data contained herein has been obtained from company reports, financial
reporting services, periodicals and other resources believed to be reliable.
Although carefully verified, data on compilations is not guaranteed by Lipper
and may be incomplete. No offer or solicitations to buy or sell any of the
securities herein is being made by Lipper.
Data presented reflect past performance. Past performance is no guarantee of
future results. Current performance may be higher or lower than the
performance shown. Investment return and principal value will fluctuate, and
redemption value may be more or less than original cost. To obtain performance
data current to the most recent month end, please call 1-800-345-2021 or visit
americancentury.com. International investing involves special risks, such as
political instability and currency fluctuations.
Data assumes reinvestment of dividends and capital gains, and none of the
charts reflect the deduction of taxes that a shareholder would pay on fund
distributions or the redemption of fund shares. Returns for the index are
provided for comparison. The fund's total returns include operating expenses
(such as transaction costs and management fees) that reduce returns, while the
total returns of the index do not.
- ------
10
NT Vista
Growth of $10,000 Over Life of Class
$10,000 investment made May 12, 2006
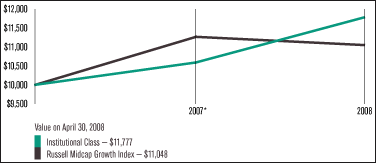
One-Year Returns Over Life of Class
Periods ended April 30
2007* 2008
Institutional Class 5.90% 11.21%
Russell Midcap Growth Index 12.66% -1.93%
*From 5/12/06, the Institutional Class's inception date. Not annualized.
Data presented reflect past performance. Past performance is no guarantee of
future results. Current performance may be higher or lower than the
performance shown. Investment return and principal value will fluctuate, and
redemption value may be more or less than original cost. To obtain performance
data current to the most recent month end, please call 1-800-345-2021 or visit
americancentury.com. International investing involves special risks, such as
political instability and currency fluctuations.
Data assumes reinvestment of dividends and capital gains, and none of the
charts reflect the deduction of taxes that a shareholder would pay on fund
distributions or the redemption of fund shares. Returns for the index are
provided for comparison. The fund's total returns include operating expenses
(such as transaction costs and management fees) that reduce returns, while the
total returns of the index do not.
- ------
11
PORTFOLIO COMMENTARY
NT Vista
Portfolio Managers: Glenn Fogle and Brad Eixmann
In February, David Hollond left the NT Vista team to focus on the American
Century Giftrust, Heritage and VP Capital Appreciation funds.
PERFORMANCE SUMMARY
NT Vista returned -12.25%* for the six months ended April 30, 2008, lagging
the -8.44% return of its benchmark, the Russell Midcap Growth Index.
As discussed in the Market Perspective on page 2, equity markets generally
declined during the reporting period, as the subprime-mortgage-driven credit
crisis spread to other areas of the economy, and rising energy and commodity
prices increased inflation concerns. In this environment, mid-cap stocks
outpaced their large- and small-cap counterparts, and mid-cap growth-oriented
shares outperformed mid-cap value stocks.
Within the portfolio, effective security selection and an overweight
allocation to the materials sector contributed positively to the portfolio's
relative performance. But it wasn't enough to overcome the detrimental effect
of individual security selection within the energy, information technology,
and consumer discretionary sectors and an underweight position in energy.
NT Vista also maintained a significant allocation to foreign holdings. During
the reporting period, these holdings detracted from portfolio returns.
CONSUMER DISCRETIONARY LAGGED
The consumer discretionary group also weighed on NT Vista's performance. The
portfolio has benefited in the past from a stake in the hotels, restaurants
and leisure group, where we focused on several casinos and makers of slot
machines. During the reporting period, though, this group -- including holding
Las Vegas Sands -- suffered traffic declines and detracted from performance.
INDUSTRIALS CONTRIBUTED, BUT CERTAIN HOLDINGS LAGGED
In the industrials sector, the portfolio held an overweight position in
machinery company Flowserve. A maker of pumps, seals, and valves to end users
in the oil and gas, power, chemicals, and water industries, Flowserve was the
largest contributor to portfolio performance for the reporting period as its
share price gained 58%.
Elsewhere within the industrials sector, we maintained an overweight position
in the aerospace and defense industry. Holdings within this group have
contributed significantly to portfolio gains in the past, benefiting from a
replacement cycle and expanding orders in global aviation. But during the
reporting period, this group lost
Top Ten Holdings as of April 30, 2008
% of % of
net assets net assets
as of as of
4/30/08 10/31/07
Owens-Illinois Inc. 5.4% 2.2%
Flowserve Corp. 3.8% 1.2%
Thermo Fisher Scientific Inc. 3.0% 3.4%
Monsanto Co. 2.8% 2.1%
SBA Communications Corp. Cl A 2.5% 2.4%
MasterCard Inc. Cl A 2.3% 0.9%
AGCO Corp. 2.3% 2.5%
Medco Health Solutions Inc. 2.2% 2.1%
Express Scripts, Inc. 2.2% 2.9%
Aflac Inc. 2.2% --
*Total returns for periods less than one year are not annualized.
- ------
12
NT Vista
ground amid market volatility and investor nervousness. BE Aerospace and
Precision Castparts, in particular, declined 19% and 21%, respectively, and
detracted from portfolio performance.
MATERIALS CONTRIBUTED
A higher standard of living in emerging-market countries, lower availability
of farmland, and greater global focus on biofuels translated into growing
global demand for agriculture. This increased demand in turn led to a
corresponding rise in commodities prices that benefited select chemicals
companies within the materials sector during the reporting period.
Notably, Monsanto -- a producer of genetically modified corn seed -- benefited
from escalating corn prices. Not a constituent of the benchmark, Monsanto was
a substantial contributor to relative performance. Also within the materials
sector, fertilizer company Mosaic was a contributor to absolute and relative
portfolio returns as the company continued to benefit from secularly higher
demand in the fertilizer market.
Owens-Illinois -- NT Vista's largest holding -- was a meaningful positive
contributor to performance, as the packaging giant was one of the rare
companies to sharply exceed earnings estimates in the reporting period. For
the first quarter of 2008 in particular, the company's earnings more than
tripled as it benefited from increased prices, an improved product mix, and
manufacturing efficiencies.
OUTLOOK
Our investment process focuses on medium-sized and smaller companies with
accelerating earnings growth rates and share-price momentum. We believe that
active investing in such companies will generate outperformance over time
compared with the Russell Midcap Growth Index.
Despite the volatility and the market's tilt away from momentum-style
investing during the course of the reporting period, we find the current
environment accommodating to our disciplined, consistent style. Our process of
identifying companies with accelerating growth and price momentum continues to
identify opportunities, particularly among companies with exposure to
commodities in the global economy.
Top Five Industries as of April 30, 2008
% of % of
net assets net assets
as of as of
4/30/08 10/31/07
Semiconductors & Semiconductor Equipment 7.8% 6.2%
Machinery 7.4% 5.4%
Chemicals 6.0% 3.8%
Oil, Gas & Consumable Fuels 5.9% --
Containers & Packaging 5.4% 2.2%
Types of Investments in Portfolio
% of % of
net assets net assets
as of as of
4/30/08 10/31/07
Domestic Common Stocks 82.7% 88.1%
Foreign Common Stocks(1) 14.4% 10.2%
TOTAL COMMON STOCKS 97.1% 98.3%
Temporary Cash Investments 2.0% --
Other Assets and Liabilities 0.9% 1.7%
(1) Includes depositary shares, dual listed securities and foreign ordinary
shares.
- ------
13
SCHEDULE OF INVESTMENTS
NT Vista
APRIL 30, 2008 (UNAUDITED)
Shares Value
Common Stocks -- 97.1%
AEROSPACE & DEFENSE -- 3.3%
4,100 Alliant Techsystems Inc.(1) $ 450,016
20,321 BE Aerospace, Inc.(1) 820,156
1,991 Precision Castparts Corp. 234,062
-----------
1,504,234
-----------
AUTO COMPONENTS -- 0.8%
23,300 ArvinMeritor, Inc. 348,102
-----------
BIOTECHNOLOGY -- 3.3%
8,000 Alexion Pharmaceuticals Inc.(1) 563,040
16,700 BioMarin Pharmaceutical Inc.(1) 608,882
9,100 CSL Ltd. ORD 341,504
-----------
1,513,426
-----------
CAPITAL MARKETS -- 2.0%
2,300 BlackRock, Inc. 464,117
5,800 FCStone Group, Inc.(1) 240,236
3,000 Northern Trust Corp. 222,330
-----------
926,683
-----------
CHEMICALS -- 6.0%
3,946 Intrepid Potash, Inc.(1) 187,396
11,070 Monsanto Co. 1,262,200
3,400 Mosaic Co. (The)(1) 416,534
2,853 Syngenta AG ORD 852,485
-----------
2,718,615
-----------
COMMERCIAL BANKS -- 0.5%
2,800 Credicorp Ltd. 225,008
-----------
COMMERCIAL SERVICES & SUPPLIES -- 1.6%
11,300 FTI Consulting, Inc.(1) 723,200
-----------
COMMUNICATIONS EQUIPMENT -- 0.5%
16,200 JDS Uniphase Corp.(1) 231,822
-----------
COMPUTERS & PERIPHERALS -- 0.7%
1,700 Apple Inc.(1) 295,715
-----------
CONSTRUCTION & ENGINEERING -- 3.7%
14,740 Foster Wheeler Ltd.(1) 938,791
20,106 Quanta Services, Inc.(1) 533,613
4,400 Shaw Group Inc. (The)(1) 217,448
-----------
1,689,852
-----------
CONTAINERS & PACKAGING -- 5.4%
44,100 Owens-Illinois Inc.(1) 2,432,116
-----------
Shares Value
DIVERSIFIED CONSUMER SERVICES -- 0.9%
5,200 DeVry Inc. $ 296,400
1,500 ITT Educational Services Inc.(1) 114,990
-----------
411,390
-----------
DIVERSIFIED FINANCIAL SERVICES -- 0.2%
2,052 Nasdaq Stock Market, Inc. (The)(1) 74,795
-----------
ELECTRICAL EQUIPMENT -- 3.8%
2,800 First Solar Inc.(1) 817,572
18,300 JA Solar Holdings Co., Ltd. ADR(1) 439,383
4,100 Vestas Wind Systems AS ORD(1) 450,191
-----------
1,707,146
-----------
ELECTRONIC EQUIPMENT & INSTRUMENTS -- 0.2%
2,435 Molex Inc. 69,105
-----------
ENERGY EQUIPMENT & SERVICES -- 4.3%
1,706 Core Laboratories N.V.(1) 213,728
7,696 Dresser-Rand Group Inc.(1) 281,443
4,800 Helmerich & Payne, Inc. 258,000
11,700 Patterson-UTI Energy Inc. 326,898
11,000 Weatherford International Ltd.(1) 887,369
-----------
1,967,438
-----------
HEALTH CARE PROVIDERS & SERVICES -- 4.9%
5,900 Community Health Systems Inc.(1) 221,427
14,432 Express Scripts, Inc.(1) 1,010,529
20,400 Medco Health Solutions Inc.(1) 1,010,616
-----------
2,242,572
-----------
HOTELS, RESTAURANTS & LEISURE -- 0.9%
2,486 Panera Bread Co. Cl A(1) 129,918
7,820 WMS Industries Inc.(1) 283,006
-----------
412,924
-----------
HOUSEHOLD DURABLES -- 0.5%
6,100 Tupperware Brands Corp. 240,340
-----------
INDUSTRIAL CONGLOMERATES -- 1.0%
8,492 McDermott International, Inc.(1) 455,001
-----------
- ------
14
NT Vista
Shares Value
INSURANCE -- 2.2%
15,000 Aflac Inc. $ 1,000,050
-----------
INTERNET & CATALOG RETAIL -- 1.0%
3,500 priceline.com Inc.(1) 446,740
-----------
INTERNET SOFTWARE & SERVICES -- 1.2%
6,700 Mercadolibre Inc.(1) 338,886
6,000 VeriSign, Inc.(1) 216,300
-----------
555,186
-----------
IT SERVICES -- 2.3%
3,800 MasterCard Inc. Cl A 1,057,008
-----------
LIFE SCIENCES TOOLS & SERVICES -- 5.2%
2,700 Covance Inc.(1) 226,233
5,000 Invitrogen Corp.(1) 467,850
11,800 Parexel International Corp.(1) 299,720
23,400 Thermo Fisher Scientific Inc.(1) 1,354,158
-----------
2,347,961
-----------
MACHINERY -- 7.4%
17,514 AGCO Corp.(1) 1,053,117
4,600 Bucyrus International, Inc. 579,278
14,000 Flowserve Corp. 1,737,260
-----------
3,369,655
-----------
METALS & MINING -- 3.1%
4,500 Agnico-Eagle Mines Ltd. 281,025
5,900 Cia Siderurgica Nacional SA ADR 254,585
2,800 Cleveland-Cliffs Inc. 449,120
1,500 Mechel OAO ADR(1) 218,700
9,600 Timminco Ltd. ORD(1) 185,997
-----------
1,389,427
-----------
OIL, GAS & CONSUMABLE FUELS -- 5.9%
12,800 Alpha Natural Resources, Inc.(1) 622,720
7,800 Consol Energy Inc. 631,488
3,700 Foundation Coal Holdings, Inc. 221,926
9,700 Quicksilver Resources Inc.(1) 402,453
10,200 Southwestern Energy Co.(1) 431,562
4,600 Ultra Petroleum Corp.(1) 382,122
-----------
2,692,271
-----------
PERSONAL PRODUCTS -- 1.4%
8,300 Avon Products, Inc. 323,866
7,500 Herbalife Ltd. 328,350
-----------
652,216
-----------
Shares Value
ROAD & RAIL -- 2.5%
8,900 CSX Corp. $ 560,255
7,600 Kansas City Southern Industries, Inc.(1) 342,608
1,700 Union Pacific Corp. 246,823
-----------
1,149,686
-----------
SEMICONDUCTORS & SEMICONDUCTOR EQUIPMENT -- 7.8%
15,500 Altera Corp. 329,840
10,500 Applied Materials, Inc. 195,930
8,500 Broadcom Corp. Cl A(1) 220,660
7,700 Intersil Corp. Cl A 205,744
6,700 Linear Technology Corp. 234,232
12,000 MEMC Electronic Materials Inc.(1) 755,641
19,500 Microsemi Corp.(1) 477,750
44,500 PMC-Sierra, Inc.(1) 345,765
34,200 Teradyne, Inc.(1) 454,518
13,300 Xilinx, Inc. 329,441
-----------
3,549,521
-----------
SOFTWARE -- 3.3%
32,000 Activision, Inc.(1) 865,600
10,803 Informatica Corp.(1) 172,416
6,700 McAfee Inc.(1) 222,775
400 Nintendo Co., Ltd. ORD 219,626
-----------
1,480,417
-----------
SPECIALTY RETAIL -- 5.2%
8,900 Aeropostale Inc.(1) 282,931
15,700 GameStop Corp. Cl A(1) 864,128
5,300 Guess?, Inc. 202,884
4,700 J. Crew Group, Inc.(1) 223,250
3,090 Tractor Supply, Co.(1) 109,880
20,200 Urban Outfitters Inc.(1) 691,850
-----------
2,374,923
-----------
TEXTILES, APPAREL & LUXURY GOODS -- 0.2%
570 Deckers Outdoor Corp.(1) 78,700
-----------
WIRELESS TELECOMMUNICATION SERVICES -- 3.9%
11,700 MetroPCS Communications, Inc.(1) 229,788
9,364 NII Holdings, Inc.(1) 428,309
34,702 SBA Communications Corp. Cl A(1) 1,122,263
-----------
1,780,360
-----------
TOTAL COMMON STOCKS
(Cost $35,539,058) 44,113,605
-----------
- ------
15
NT Vista
Value
Temporary Cash Investments -- 2.0%
Repurchase Agreement, Bank of America Securities,
LLC, (collateralized by various U.S. Treasury
obligations, 0.625%, 4/15/13, valued at $918,561),
in a joint trading account at 1.92%, dated 4/30/08,
due 5/1/08 (Delivery value $900,048) (Cost $900,000) $ 900,000
-----------
TOTAL INVESTMENT SECURITIES -- 99.1%
(Cost $36,439,058) $45,013,605
-----------
OTHER ASSETS AND LIABILITIES -- 0.9% 417,393
-----------
TOTAL NET ASSETS -- 100.0% $45,430,998
===========
Forward Foreign Currency Exchange Contracts
Settlement Unrealized
Contracts to Sell Date Value Gain (Loss)
215,670 AUD for USD 5/30/08 $ 202,661 $ (1,020)
147,840 CAD for USD 5/30/08 146,700 (1,296)
695,561 CHF for USD 5/30/08 671,807 1,885
1,685,920 DKK for USD 5/30/08 352,855 170
11,340,000 JPY for USD 5/30/08 109,240 (90)
---------- ----------
$1,483,263 $ (351)
========== ==========
(Value on Settlement Date $1,482,912)
Notes to Schedule of Investments
ADR = American Depositary Receipt
AUD = Australian Dollar
CAD = Canadian Dollar
CHF = Swiss Franc
DKK = Danish Krone
JPY = Japanese Yen
ORD = Foreign Ordinary Share
USD = United States Dollar
(1) Non-income producing.
See Notes to Financial Statements.
- ------
16
SHAREHOLDER FEE EXAMPLES (UNAUDITED)
Fund shareholders may incur two types of costs: (1) transaction costs,
including sales charges (loads) on purchase payments and redemption/exchange
fees; and (2) ongoing costs, including management fees; distribution and
service (12b-1) fees; and other fund expenses. This example is intended to
help you understand your ongoing costs (in dollars) of investing in your fund
and to compare these costs with the ongoing cost of investing in other mutual
funds.
The example is based on an investment of $1,000 made at the beginning of the
period and held for the entire period from November 1, 2007 to April 30, 2008.
ACTUAL EXPENSES
The table provides information about actual account values and actual expenses
for each class. You may use the information, together with the amount you
invested, to estimate the expenses that you paid over the period. First,
identify the share class you own. Then simply divide your account value by
$1,000 (for example, an $8,600 account value divided by $1,000 = 8.6), then
multiply the result by the number under the heading "Expenses Paid During
Period" to estimate the expenses you paid on your account during this period.
If you hold Investor Class shares of any American Century fund, or
Institutional Class shares of the American Century Diversified Bond Fund, in
an American Century account (i.e., not a financial intermediary or retirement
plan account), American Century may charge you a $12.50 semiannual account
maintenance fee if the value of those shares is less than $10,000. We will
redeem shares automatically in one of your accounts to pay the $12.50 fee. In
determining your total eligible investment amount, we will include your
investments in all PERSONAL ACCOUNTS (including American Century Brokerage
accounts) registered under your Social Security number. PERSONAL ACCOUNTS
include individual accounts, joint accounts, UGMA/UTMA accounts, personal
trusts, Coverdell Education Savings Accounts and IRAs (including traditional,
Roth, Rollover, SEP-, SARSEP- and SIMPLE-IRAs), and certain other retirement
accounts. If you have only business, business retirement, employer-sponsored
or American Century Brokerage accounts, you are currently not subject to this
fee. We will not charge the fee as long as you choose to manage your accounts
exclusively online. If you are subject to the Account Maintenance Fee, your
account value could be reduced by the fee amount.
HYPOTHETICAL EXAMPLE FOR COMPARISON PURPOSES
The table also provides information about hypothetical account values and
hypothetical expenses based on the actual expense ratio of each class of your
fund and an assumed rate of return of 5% per year before expenses, which is
not the actual return of a fund's share class. The hypothetical account values
and expenses may not be used to estimate the actual ending account balance or
expenses you paid for the period. You may use this information to compare the
ongoing costs of investing in your fund and other funds. To do so, compare
this 5% hypothetical example with the 5% hypothetical examples that appear in
the shareholder reports of the other funds.
Please note that the expenses shown in the table are meant to highlight your
ongoing costs only and do not reflect any transactional costs, such as sales
charges (loads) or redemption/exchange fees. Therefore, the table is useful in
comparing ongoing costs only, and will not help you determine the relative
total costs of owning different funds. In addition, if these transactional
costs were included, your costs would have been higher.
- ------
17
Ending Expenses Paid
Beginning Account During Period*
Account Value Value 11/1/07 - Annualized Expense
11/1/07 4/30/08 4/30/08 Ratio*
NT Growth -- Institutional Class
Actual $1,000 $939.80 $3.86 0.80%
Hypothetical $1,000 $1,020.89 $4.02 0.80%
NT Vista -- Institutional Class
Actual $1,000 $877.50 $3.78 0.81%
Hypothetical $1,000 $1,020.84 $4.07 0.81%
*Expenses are equal to the class's annualized expense ratio listed in the
table above, multiplied by the average account value over the period,
multiplied by 182, the number of days in the most recent fiscal half-year,
divided by 366, to reflect the one-half year period.
- ------
18
STATEMENT OF ASSETS AND LIABILITIES
APRIL 30, 2008 (UNAUDITED)
NT Growth NT Vista
ASSETS
Investment securities, at value (cost of $87,439,995
and $36,439,058, respectively) -- including
$1,401,099 and $-- of securities on loan, respectively $97,201,505 $45,013,605
Investments made with cash collateral received for
securities on loan, at value (cost of $1,440,076 and
$--, respectively) 1,440,076 --
----------- -----------
Total investment securities, at value (cost of
$88,880,071 and $36,439,058, respectively) 98,641,581 45,013,605
Cash 37,415 87,030
Receivable for investments sold 1,413,592 1,327,879
Receivable for forward foreign currency exchange
contracts 1,850 2,055
Dividends and interest receivable 46,311 22,249
----------- -----------
100,140,749 46,452,818
----------- -----------
LIABILITIES
Payable for collateral received for securities on loan 1,440,076 --
Payable for investments purchased 1,654,366 990,555
Payable for forward foreign currency exchange
contracts -- 2,406
Accrued management fees 61,042 28,859
----------- -----------
3,155,484 1,021,820
----------- -----------
NET ASSETS $96,985,265 $45,430,998
=========== ===========
INSTITUTIONAL CLASS CAPITAL SHARES, $0.01 PAR VALUE
Authorized 100,000,000 100,000,000
=========== ===========
Outstanding 8,417,265 3,867,317
=========== ===========
NET ASSET VALUE PER SHARE $11.52 $11.75
=========== ===========
NET ASSETS CONSIST OF:
Capital (par value and paid-in surplus) $87,208,509 $37,100,328
Accumulated undistributed net investment income (loss) 112,284 (69,336)
Accumulated net realized loss on investment and
foreign currency transactions (99,417) (173,556)
Net unrealized appreciation on investments and
translation of assets and liabilities in foreign
currencies 9,763,889 8,573,562
----------- -----------
$96,985,265 $45,430,998
=========== ===========
See Notes to Financial Statements.
- ------
19
STATEMENT OF OPERATIONS
FOR THE SIX MONTHS ENDED APRIL 30, 2008 (UNAUDITED)
NT Growth NT Vista
INVESTMENT INCOME (LOSS)
INCOME:
Dividends (net of foreign taxes withheld of $5,342
and $3,149, respectively) $ 476,111 $ 71,438
Interest 15,075 22,257
Securities lending, net 14,080 --
------------ ------------
505,266 93,695
------------ ------------
EXPENSES:
Management fees 337,706 162,161
Directors' fees and expenses 957 457
Other expenses 965 2,334
------------ ------------
339,628 164,952
------------ ------------
NET INVESTMENT INCOME (LOSS) 165,638 (71,257)
------------ ------------
REALIZED AND UNREALIZED GAIN (LOSS)
NET REALIZED GAIN (LOSS) ON:
Investments transactions 213,951 83,940
Foreign currency transactions (88,079) (91,038)
------------ ------------
125,872 (7,098)
------------ ------------
CHANGE IN NET UNREALIZED APPRECIATION
(DEPRECIATION) ON:
Investments (4,842,405) (4,803,082)
Translation of assets and liabilities in foreign
currencies 5,296 2,247
------------ ------------
(4,837,109) (4,800,835)
------------ ------------
NET REALIZED AND UNREALIZED GAIN (LOSS) (4,711,237) (4,807,933)
------------ ------------
NET INCREASE (DECREASE) IN NET ASSETS RESULTING
FROM OPERATIONS $(4,545,599) $(4,879,190)
============ ============
See Notes to Financial Statements.
- ------
20
STATEMENT OF CHANGES IN NET ASSETS
SIX MONTHS ENDED APRIL 30, 2008 (UNAUDITED) AND YEAR ENDED OCTOBER 31, 2007
NT Growth NT Vista
Increase (Decrease) in
Net Assets 2008 2007 2008 2007
OPERATIONS
Net investment income
(loss) $ 165,638 $ 252,008 $ (71,257) $ (123,658)
Net realized gain (loss) 125,872 4,588,508 (7,098) 3,240,562
Change in net
unrealized appreciation
(depreciation) (4,837,109) 10,299,415 (4,800,835) 11,596,277
----------- ------------ ----------- ------------
Net increase (decrease)
in net assets resulting
from operations (4,545,599) 15,139,931 (4,879,190) 14,713,181
----------- ------------ ----------- ------------
DISTRIBUTIONS TO SHAREHOLDERS
From net investment
income (194,614) (175,726) -- --
From net realized gains (3,783,853) -- (87,218) --
----------- ------------ ----------- ------------
Decrease in net assets
from distributions (3,978,467) (175,726) (87,218) --
=========== ============ =========== ============
CAPITAL SHARE TRANSACTIONS
Proceeds from shares
sold 23,822,586 31,876,693 11,847,269 16,758,304
Payments for shares
redeemed (6,759,069) (17,377,762) (6,102,086) (12,497,498)
----------- ------------ ----------- ------------
Net increase (decrease)
in net assets from
capital share
transactions 17,063,517 14,498,931 5,745,183 4,260,806
----------- ------------ ----------- ------------
NET INCREASE (DECREASE)
IN NET ASSETS 8,539,451 29,463,136 778,775 18,973,987
NET ASSETS
Beginning of period 88,445,814 58,982,678 44,652,223 25,678,236
----------- ------------ ----------- ------------
End of period $96,985,265 $88,445,814 $45,430,998 $44,652,223
=========== ============ =========== ============
Accumulated
undistributed net
investment income (loss) $112,284 $141,260 $(69,336) $1,921
=========== ============ =========== ============
TRANSACTIONS IN SHARES OF THE FUNDS
Sold 2,099,436 2,849,265 1,017,464 1,590,776
Redeemed (555,385) (1,555,417) (477,205) (1,118,215)
----------- ------------ ----------- ------------
Net increase (decrease)
in shares of the funds 1,544,051 1,293,848 540,259 472,561
=========== ============ =========== ============
See Notes to Financial Statements.
- ------
21
NOTES TO FINANCIAL STATEMENTS
APRIL 30, 2008 (UNAUDITED)
1. ORGANIZATION AND SUMMARY OF SIGNIFICANT ACCOUNTING POLICIES
ORGANIZATION -- American Century Mutual Funds, Inc. (the corporation) is
registered under the Investment Company Act of 1940 (the 1940 Act) as an
open-end management investment company. NT Growth Fund (NT Growth) and NT
Vista Fund (NT Vista) (collectively, the funds) are two funds in a series
issued by the corporation. The funds are diversified under the 1940 Act. The
funds' investment objective is to seek long-term capital growth. The funds
pursue this objective by investing primarily in equity securities. NT Growth
generally invests in larger-sized companies that management believes will
increase in value but may purchase companies of any size. NT Vista generally
invests in companies that are medium-sized and smaller at the time of purchase
that management believes will increase in value. The funds are not permitted
to invest in any securities issued by companies assigned the Global Industry
Classification Standard for the tobacco industry. The following is a summary
of the funds' significant accounting policies.
SECURITY VALUATIONS -- Securities traded primarily on a principal securities
exchange are valued at the last reported sales price, or at the mean of the
latest bid and asked prices where no last sales price is available. Depending
on local convention or regulation, securities traded over-the-counter are
valued at the mean of the latest bid and asked prices, the last sales price,
or the official close price. Debt securities not traded on a principal
securities exchange are valued through a commercial pricing service or at the
mean of the most recent bid and asked prices. Discount notes may be valued
through a commercial pricing service or at amortized cost, which approximates
fair value. Securities traded on foreign securities exchanges and
over-the-counter markets are normally completed before the close of business
on days that the New York Stock Exchange (the Exchange) is open and may also
take place on days when the Exchange is not open. If an event occurs after the
value of a security was established but before the net asset value per share
was determined that was likely to materially change the net asset value, that
security would be valued as determined in accordance with procedures adopted
by the Board of Directors. If the funds determine that the market price of a
portfolio security is not readily available, or that the valuation methods
mentioned above do not reflect the security's fair value, such security is
valued as determined by the Board of Directors or its designee, in accordance
with procedures adopted by the Board of Directors, if such determination would
materially impact a fund's net asset value. Certain other circumstances may
cause the funds to use alternative procedures to value a security such as: a
security has been declared in default; trading in a security has been halted
during the trading day; or there is a foreign market holiday and no trading
will commence.
SECURITY TRANSACTIONS -- For financial reporting purposes, security
transactions are accounted for as of the trade date. Net realized gains and
losses are determined on the identified cost basis, which is also used for
federal income tax purposes.
INVESTMENT INCOME -- Dividend income less foreign taxes withheld, if any, is
recorded as of the ex-dividend date. Interest income is recorded on the
accrual basis and includes accretion of discounts and amortization of premiums.
FOREIGN CURRENCY TRANSACTIONS -- All assets and liabilities initially
expressed in foreign currencies are translated into U.S. dollars at prevailing
exchange rates at period end. Purchases and sales of investment securities,
dividend and interest income, and certain expenses are translated at the rates
of exchange prevailing on the respective dates of such transactions. For
assets and liabilities, other than investments in securities, net realized and
unrealized gains and losses from foreign currency translations arise from
changes in currency exchange rates.
Net realized and unrealized foreign currency exchange gains or losses
occurring during the holding period of investment securities are a component
of realized gain (loss) on investment transactions and unrealized appreciation
(depreciation) on investments, respectively. Certain countries may impose
taxes on the contract amount of purchases and sales of foreign currency
contracts in their currency. The funds record the foreign tax expense, if any,
as a reduction to the net realized gain (loss) on foreign currency
transactions.
- ------
22
FORWARD FOREIGN CURRENCY EXCHANGE CONTRACTS -- The funds may enter into
forward foreign currency exchange contracts to facilitate transactions of
securities denominated in a foreign currency or to hedge the funds' exposure
to foreign currency exchange rate fluctuations. The net U.S. dollar value of
foreign currency underlying all contractual commitments held by the funds and
the resulting unrealized appreciation or depreciation are determined daily
using prevailing exchange rates. The funds bear the risk of an unfavorable
change in the foreign currency exchange rate underlying the forward contract.
Additionally, losses may arise if the counterparties do not perform under the
contract terms.
SECURITIES ON LOAN -- NT Growth may lend portfolio securities through its
lending agent to certain approved borrowers in order to earn additional
income. The income earned, net of any rebates or fees, is included in the
Statement of Operations. NT Growth continues to recognize any gain or loss in
the market price of the securities loaned and records any interest earned or
dividends declared.
REPURCHASE AGREEMENTS -- The funds may enter into repurchase agreements with
institutions that American Century Investment Management, Inc. (ACIM) (the
investment advisor) has determined are creditworthy pursuant to criteria
adopted by the Board of Directors. Each repurchase agreement is recorded at
cost. Each fund requires that the collateral, represented by securities,
received in a repurchase transaction be transferred to the custodian in a
manner sufficient to enable each fund to obtain those securities in the event
of a default under the repurchase agreement. ACIM monitors, on a daily basis,
the securities transferred to ensure the value, including accrued interest, of
the securities under each repurchase agreement is equal to or greater than
amounts owed to each fund under each repurchase agreement.
JOINT TRADING ACCOUNT -- Pursuant to an Exemptive Order issued by the
Securities and Exchange Commission, each fund, along with other registered
investment companies having management agreements with ACIM or American
Century Global Investment Management, Inc. (ACGIM), may transfer uninvested
cash balances into a joint trading account. These balances are invested in one
or more repurchase agreements that are collateralized by U.S. Treasury or
Agency obligations.
INCOME TAX STATUS -- It is each fund's policy to distribute substantially all
net investment income and net realized gains to shareholders and to otherwise
qualify as a regulated investment company under provisions of the Internal
Revenue Code. At this time, management has not identified any uncertain tax
positions for which it is reasonably possible that the total amounts of
unrecognized tax benefits will significantly change in the next twelve months.
Accordingly, no provision has been made for federal or state income taxes.
Interest and penalties associated with any federal or state income tax
obligations, if any, are recorded as interest expense.
DISTRIBUTIONS TO SHAREHOLDERS -- Distributions to shareholders are recorded on
the ex-dividend date. Distributions from net investment income and net
realized gains, if any, are generally declared and paid annually.
INDEMNIFICATIONS -- Under the corporation's organizational documents, its
officers and directors are indemnified against certain liabilities arising out
of the performance of their duties to the funds. In addition, in the normal
course of business, the funds enter into contracts that provide general
indemnifications. The funds' maximum exposure under these arrangements is
unknown as this would involve future claims that may be made against the
funds. The risk of material loss from such claims is considered by management
to be remote.
USE OF ESTIMATES -- The financial statements are prepared in conformity with
accounting principles generally accepted in the United States of America,
which may require management to make certain estimates and assumptions at the
date of the financial statements. Actual results could differ from these
estimates.
2. FEES AND TRANSACTIONS WITH RELATED PARTIES
MANAGEMENT FEES -- The corporation has entered into a Management Agreement
with ACIM, under which ACIM provides the funds with investment advisory and
management services in exchange for a single, unified management fee (the
fee). The Agreement provides that all expenses of the funds, except brokerage
commissions, taxes, interest, fees and expenses of those directors who are not
considered "interested persons" as defined in the 1940 Act (including counsel
fees) and extraordinary expenses, will be paid by ACIM. The fee is computed
and accrued daily based on the daily net assets of each fund and paid monthly
in arrears. For funds with a stepped fee schedule, the rate of the fee is
determined by applying a fee rate calculation formula. This formula takes into
account all
- ------
23
of the investment advisor's assets under management in each fund's investment
strategy (strategy assets) to calculate the appropriate fee rate for each
fund. The strategy assets include each fund's assets and the assets of other
clients of the investment advisor that are not in the American Century family
of funds, but that have the same investment team and investment strategy. The
annual management fee schedule for NT Growth ranges from 0.60% to 0.80%. The
effective annual management fee for NT Growth for the six months ended April
30, 2008 was 0.80%. The annual management fee for NT Vista is 0.80%.
RELATED PARTIES -- Certain officers and directors of the corporation are also
officers and/or directors, and, as a group, controlling stockholders of
American Century Companies, Inc. (ACC), the parent of the corporation's
investment advisor, ACIM, the distributor of the corporation, American Century
Investment Services, Inc., and the corporation's transfer agent, American
Century Services, LLC. The funds are wholly owned, in aggregate, by various
funds in a series issued by American Century Asset Allocation Portfolios, Inc.
(ACAAP). ACAAP does not invest in the funds for the purpose of exercising
management or control.
The funds are eligible to invest in a money market fund for temporary
purposes, which is managed by J.P. Morgan Investment Management, Inc. (JPMIM).
JPMIM is a wholly owned subsidiary of JPMorgan Chase & Co. (JPM). JPM is an
equity investor in ACC. NT Growth has a securities lending agreement with
JPMorgan Chase Bank (JPMCB). Prior to December 12, 2007, the funds had a bank
line of credit agreement with JPMCB. JPMCB is a custodian of the funds and a
wholly owned subsidiary of JPM.
3. INVESTMENT TRANSACTIONS
Investment transactions, excluding short-term investments, for the six months
ended April 30, 2008, were as follows:
NT Growth NT Vista
Purchases $77,595,306 $37,346,595
Proceeds from sales $64,218,985 $32,395,943
4. SECURITIES LENDING
As of April 30, 2008, securities in NT Growth valued at $1,401,099 were on
loan through the lending agent, JPMCB, to certain approved borrowers. JPMCB
receives and maintains collateral in the form of cash and/or acceptable
securities as approved by ACIM. Cash collateral is invested in authorized
investments by the lending agent in a pooled account. The value of cash
collateral received at period end is disclosed in the Statement of Assets and
Liabilities and investments made with the cash by the lending agent are listed
in the Schedule of Investments. Any deficiencies or excess of collateral must
be delivered or transferred by the member firms no later than the close of
business on the next business day. The total market value of all collateral
received for NT Growth, at this date, was $1,440,076. NT Growth's risks in
securities lending are that the borrower may not provide additional collateral
when required or return the securities when due. If the borrower defaults,
receipt of the collateral by the NT Growth may be delayed or limited.
5. BANK LINE OF CREDIT
Effective December 12, 2007, the funds, along with certain other funds managed
by ACIM or ACGIM, have a $500,000,000 unsecured bank line of credit agreement
with Bank of America, N.A. Prior to December 12, 2007, the funds, along with
certain other funds managed by ACIM or ACGIM, had a $500,000,000 unsecured
bank line of credit agreement with JPMCB. The funds may borrow money for
temporary or emergency purposes to fund shareholder redemptions. Borrowings
under the agreement, which is subject to annual renewal, bear interest at the
Federal Funds rate plus 0.40%. The funds did not borrow from the line during
the six months ended April 30, 2008.
6. RISK FACTORS
There are certain risks involved in investing in foreign securities. These
risks include those resulting from future adverse political, social, and
economic developments, fluctuations in currency exchange rates, the possible
imposition of exchange controls, and other foreign laws or restrictions.
- ------
24
7. FEDERAL TAX INFORMATION
The book-basis character of distributions made during the year from net
investment income or net realized gains may differ from their ultimate
characterization for federal income tax purposes. These differences reflect
the differing character of certain income items and net realized gains and
losses for financial statement and tax purposes, and may result in
reclassification among certain capital accounts on the financial statements.
As of April 30, 2008, the components of investments for federal income tax
purposes were as follows:
NT Growth NT Vista
Federal tax cost of investments $90,073,477 $36,751,606
=========== ===========
Gross tax appreciation of investments $11,086,735 $8,820,192
Gross tax depreciation of investments (2,518,631) (558,193)
----------- -----------
Net tax appreciation (depreciation) of investments $8,568,104 $8,261,999
=========== ===========
The difference between book-basis and tax-basis cost and unrealized
appreciation (depreciation) is attributable primarily to the tax deferral of
losses on wash sales.
8. RECENTLY ISSUED ACCOUNTING STANDARDS
The Financial Accounting Standards Board (FASB) issued Statement of Financial
Accounting Standards No. 157, "Fair Value Measurements" (FAS 157), in
September 2006, which is effective for fiscal years beginning after November
15, 2007. FAS 157 defines fair value, establishes a framework for measuring
fair value and expands the required financial statement disclosures about fair
value measurements. Management is currently evaluating the impact that
adopting FAS 157 will have on the financial statement disclosures.
In March 2008, the FASB issued Statement of Financial Accounting Standards No.
161, "Disclosures about Derivative Instruments and Hedging Activities -- an
amendment of FASB Statement No. 133" (FAS 161). FAS 161 is effective for
fiscal years beginning after November 15, 2008. FAS 161 amends and expands
disclosures about derivative instruments and hedging activities. FAS 161
requires qualitative disclosures about the objectives and strategies of
derivative instruments, quantitative disclosures about the fair value amounts
of and gains and losses on derivative instruments, and disclosures of
credit-risk-related contingent features in hedging activities. Management is
currently evaluating the impact that adopting FAS 161 will have on the
financial statement disclosures.
- ------
25
FINANCIAL HIGHLIGHTS
NT Growth
For a Share Outstanding Throughout the Years Ended October 31 (except as noted)
2008(1) 2007 2006(2)
PER-SHARE DATA
Net Asset Value, Beginning of Period $12.87 $10.57 $10.00
-------- ------- --------
Income From Investment Operations
Net Investment Income (Loss) 0.02 0.04 0.01
Net Realized and Unrealized Gain (Loss) (0.78) 2.29 0.56
-------- ------- --------
Total From Investment Operations (0.76) 2.33 0.57
-------- ------- --------
Distributions
From Net Investment Income (0.03) (0.03) --
From Net Realized Gains (0.56) -- --
-------- ------- --------
Total Distributions (0.59) (0.03) --
-------- ------- --------
Net Asset Value, End of Period $11.52 $12.87 $10.57
======== ======= ========
TOTAL RETURN(3) (6.02)% 22.12% 5.70%
RATIOS/SUPPLEMENTAL DATA
Ratio of Operating Expenses to Average Net Assets 0.80%(4) 0.80% 0.80%(4)
Ratio of Net Investment Income (Loss) to Average
Net Assets 0.39%(4) 0.35% 0.36%(4)
Portfolio Turnover Rate 75% 140% 57%
Net Assets, End of Period (in thousands) $96,985 $88,446 $58,983
(1) Six months ended April 30, 2008 (unaudited).
(2) May 12, 2006 (fund inception) through October 31, 2006.
(3) Total return assumes reinvestment of net investment income and capital
gains distributions, if any. Total returns for periods less than one year are
not annualized.
(4) Annualized.
See Notes to Financial Statements.
- ------
26
NT Vista
For a Share Outstanding Throughout the Years Ended October 31 (except as noted)
2008(1) 2007 2006(2)
PER-SHARE DATA
Net Asset Value, Beginning of Period $13.42 $9.00 $10.00
-------- ------- --------
Income From Investment Operations
Net Investment Income (Loss) (0.02) (0.04) (0.01)
Net Realized and Unrealized Gain (Loss) (1.62) 4.46 (0.99)
-------- ------- --------
Total From Investment Operations (1.64) 4.42 (1.00)
-------- ------- --------
Distributions
From Net Realized Gains (0.03) -- --
-------- ------- --------
Net Asset Value, End of Period $11.75 $13.42 $9.00
======== ======= ========
TOTAL RETURN(3) (12.25)% 49.11% (10.00)%
RATIOS/SUPPLEMENTAL DATA
Ratio of Operating Expenses to Average Net
Assets 0.81%(4) 0.80% 0.80%(4)
Ratio of Net Investment Income (Loss) to
Average Net Assets (0.35)%(4) (0.36)% (0.27)%(4)
Portfolio Turnover Rate 82% 147% 109%
Net Assets, End of Period (in thousands) $45,431 $44,652 $25,678
(1) Six months ended April 30, 2008 (unaudited).
(2) May 12, 2006 (fund inception) through October 31, 2006.
(3) Total return assumes reinvestment of net investment income and capital
gains distributions, if any. Total returns for periods less than one year are
not annualized.
(4) Annualized.
See Notes to Financial Statements.
- ------
27
ADDITIONAL INFORMATION
RETIREMENT ACCOUNT INFORMATION
As required by law, any distributions you receive from an IRA or certain
403(b), 457 and qualified plans [those not eligible for rollover to an IRA or
to another qualified plan] are subject to federal income tax withholding,
unless you elect not to have withholding apply. Tax will be withheld on the
total amount withdrawn even though you may be receiving amounts that are not
subject to withholding, such as nondeductible contributions. In such case,
excess amounts of withholding could occur. You may adjust your withholding
election so that a greater or lesser amount will be withheld.
If you don't want us to withhold on this amount, you must notify us to not
withhold the federal income tax. Even if you plan to roll over the amount you
withdraw to another tax-deferred account, the withholding rate still applies
to the withdrawn amount unless we have received notice not to withhold federal
income tax prior to the withdrawal. You may notify us in writing or in certain
situations by telephone or through other electronic means. You have the right
to revoke your withholding election at any time and any election you make may
remain in effect until revoked by filing a new election.
Remember, even if you elect not to have income tax withheld, you are liable
for paying income tax on the taxable portion of your withdrawal. If you elect
not to have income tax withheld or you don't have enough income tax withheld,
you may be responsible for payment of estimated tax. You may incur penalties
under the estimated tax rules if your withholding and estimated tax payments
are not sufficient.
State tax will be withheld if, at the time of your distribution, your address
is within one of the mandatory withholding states and you have federal income
tax withheld. State taxes will be withheld from your distribution in
accordance with the respective state rules.
PROXY VOTING GUIDELINES
American Century Investment Management, Inc., the funds' investment advisor,
is responsible for exercising the voting rights associated with the securities
purchased and/or held by the funds. A description of the policies and
procedures the advisor uses in fulfilling this responsibility is available
without charge, upon request, by calling 1-800-345-2021. It is also available
on American Century Investments' website at americancentury.com and on the
Securities and Exchange Commission's website at sec.gov. Information regarding
how the investment advisor voted proxies relating to portfolio securities
during the most recent 12-month period ended June 30 is available on the
"About Us" page at americancentury.com. It is also available at sec.gov.
QUARTERLY PORTFOLIO DISCLOSURE
The funds file their complete schedule of portfolio holdings with the
Securities and Exchange Commission (SEC) for the first and third quarters of
each fiscal year on Form N-Q. The funds' Forms N-Q are available on the SEC's
website at sec.gov, and may be reviewed and copied at the SEC's Public
Reference Room in Washington, DC. Information on the operation of the Public
Reference Room may be obtained by calling 1-800-SEC-0330. The funds also make
their complete schedule of portfolio holdings for the most recent quarter of
their fiscal year available on their website at americancentury.com and, upon
request, by calling 1-800-345-2021.
- ------
28
INDEX DEFINITIONS
The following indices are used to illustrate investment market, sector, or
style performance or to serve as fund performance comparisons. They are not
investment products available for purchase.
The RUSSELL 1000® INDEX is a market-capitalization weighted, large-cap index
created by Frank Russell Company to measure the performance of the 1,000
largest of the 3,000 largest publicly traded U.S. companies, based on total
market capitalization.
The RUSSELL 1000® GROWTH INDEX measures the performance of those Russell 1000
Index companies (the 1,000 largest of the 3,000 largest publicly traded U.S.
companies, based on total market capitalization) with higher price-to-book
ratios and higher forecasted growth values.
The RUSSELL 1000® VALUE INDEX measures the performance of those Russell 1000
Index companies (the 1,000 largest of the 3,000 largest publicly traded U.S.
companies, based on total market capitalization) with lower price-to-book
ratios and lower forecasted growth values.
The RUSSELL 2000® INDEX is a market-capitalization weighted index created by
Frank Russell Company to measure the performance of the 2,000 smallest of the
3,000 largest publicly traded U.S. companies, based on total market
capitalization.
The RUSSELL 2000® GROWTH INDEX measures the performance of those Russell 2000
Index companies (the 2,000 smallest of the 3,000 largest publicly traded U.S.
companies, based on total market capitalization) with higher price-to-book
ratios and higher forecasted growth values.
The RUSSELL 2000® VALUE INDEX measures the performance of those Russell 2000
Index companies (the 2,000 smallest of the 3,000 largest publicly traded U.S.
companies, based on total market capitalization) with lower price-to-book
ratios and lower forecasted growth values.
The RUSSELL MIDCAP® INDEX measures the performance of the 800 smallest of the
1,000 largest publicly traded U.S. companies, based on total market
capitalization.
The RUSSELL MIDCAP® GROWTH INDEX measures the performance of those Russell
Midcap Index companies (the 800 smallest of the 1,000 largest publicly traded
U.S. companies, based on total market capitalization) with higher
price-to-book ratios and higher forecasted growth values.
The RUSSELL MIDCAP® VALUE INDEX measures the performance of those Russell
Midcap Index companies (the 800 smallest of the 1,000 largest publicly traded
U.S. companies, based on total market capitalization) with lower price-to-book
ratios and lower forecasted growth values.
- ------
29
NOTES
- ------
30
NOTES
- ------
31
NOTES
- ------
32
[back cover]
[american century investments logo and text logo ®]
CONTACT US
AMERICANCENTURY.COM
AUTOMATED INFORMATION LINE . . . . . . . . . . . . . . 1-800-345-8765
INVESTOR SERVICES REPRESENTATIVE . . . . . . . . . . . 1-800-345-2021 or
816-531-5575
BUSINESS, NOT-FOR-PROFIT, EMPLOYER-SPONSORED RETIREMENT
PLANS . . . . . . . . . . . . . . . . . . . 1-800-345-3533
BANKS AND TRUST COMPANIES, BROKER-DEALERS,
FINANCIAL PROFESSIONALS, INSURANCE COMPANIES . . . . . 1-800-345-6488
TELECOMMUNICATIONS DEVICE FOR THE DEAF . . . . . . . . 1-800-634-4113
AMERICAN CENTURY MUTUAL FUNDS, INC.
INVESTMENT ADVISOR:
American Century Investment Management, Inc.
Kansas City, Missouri
This report and the statements it contains are submitted for the general
information of our shareholders. The report is not authorized for distribution to
prospective investors unless preceded or accompanied by an effective prospectus.
American Century Investment Services, Inc., Distributor
©2008 American Century Proprietary Holdings, Inc. All rights reserved.
0806
CL-SAN-60506N
[front cover]
SEMIANNUAL REPORT
APRIL 30, 2008
[american century investments logo and text logo ®]
AMERICAN CENTURY INVESTMENTS
AMERICAN CENTURY-MASON STREET MID CAP GROWTH FUND
AMERICAN CENTURY-MASON STREET SMALL CAP GROWTH FUND
PRESIDENT'S LETTER
[photo of Jonathan Thomas]
JONATHAN THOMAS
Dear Investor,
At American Century Investments®, we are committed to helping you reach your
financial goals. Your success is the ultimate measure of our performance.
That's why we focus on achieving superior investment results and building
long-term relationships with investors like you.
Part of that relationship is to clearly communicate investment results and
what influenced them. To help you monitor your investment with us, we take
pride in providing you with the semiannual report for the American
Century®-Mason Street Mid Cap Growth and Small Cap Growth funds for the six
months ended April 30, 2008. We also recommend americancentury.com, where we
provide company news, quarterly portfolio commentaries, investment views, and
other useful information.
As noted on the website, 2008 marks the 50th anniversary of American Century
Investments. Since 1958, we've worked to make wise decisions with your
interests as our guide. Fifty years also means that we've met the challenges
of previous economic downturns. As we've crossed those hurdles and earned your
trust, our assets under management have grown to nearly $100 billion, putting
us in the top 5% of our industry. This growth has given us the resources to
offer a wide array of financial products and services, including a
well-diversified line-up of portfolios that provide you with many choices in
these uncertain times.
Though our offerings are diverse, they share several key qualities, including
our disciplined investment approach and active, team-based management. Strict
adherence to our processes and long-term strategies allows us to stay focused
during volatile periods. Investors in our portfolios also benefit from the sum
of our investment teams' expertise as they share research and information.
We'll continue to work hard to earn your trust. Thank you for your continued
support.
Sincerely,
/s/Jonathan Thomas
Jonathan S. Thomas
President and Chief Executive Officer
American Century Investments
TABLE OF CONTENTS
Market Perspective. . . . . . . . . . . . . . . . . . . . . . . . . . 2
U.S. Stock Index Returns . . . . . . . . . . . . . . . . . . . . . . 2
MID CAP GROWTH
Performance . . . . . . . . . . . . . . . . . . . . . . . . . . . . . 3
Portfolio Commentary. . . . . . . . . . . . . . . . . . . . . . . . . 5
Top Ten Holdings . . . . . . . . . . . . . . . . . . . . . . . . . . 5
Top Five Industries. . . . . . . . . . . . . . . . . . . . . . . . . 6
Types of Investments in Portfolio. . . . . . . . . . . . . . . . . . 6
Schedule of Investments . . . . . . . . . . . . . . . . . . . . . . . 7
SMALL CAP GROWTH
Performance . . . . . . . . . . . . . . . . . . . . . . . . . . . . . 10
Portfolio Commentary. . . . . . . . . . . . . . . . . . . . . . . . . 12
Top Ten Holdings . . . . . . . . . . . . . . . . . . . . . . . . . . 12
Top Five Industries. . . . . . . . . . . . . . . . . . . . . . . . . 13
Types of Investments in Portfolio. . . . . . . . . . . . . . . . . . 13
Schedule of Investments . . . . . . . . . . . . . . . . . . . . . . . 14
Shareholder Fee Examples. . . . . . . . . . . . . . . . . . . . . . . 17
FINANCIAL STATEMENTS
Statement of Assets and Liabilities . . . . . . . . . . . . . . . . . 19
Statement of Operations . . . . . . . . . . . . . . . . . . . . . . . 21
Statement of Changes in Net Assets. . . . . . . . . . . . . . . . . . 22
Notes to Financial Statements . . . . . . . . . . . . . . . . . . . . 23
Financial Highlights. . . . . . . . . . . . . . . . . . . . . . . . . 29
OTHER INFORMATION
Additional Information. . . . . . . . . . . . . . . . . . . . . . . . 41
Index Definitions . . . . . . . . . . . . . . . . . . . . . . . . . . 42
The opinions expressed in the Market Perspective and each of the Portfolio
Commentaries reflect those of the portfolio management team as of the date of
the report, and do not necessarily represent the opinions of American Century
or any other person in the American Century organization. Any such opinions
are subject to change at any time based upon market or other conditions and
American Century disclaims any responsibility to update such opinions. These
opinions may not be relied upon as investment advice and, because investment
decisions made by American Century funds are based on numerous factors, may
not be relied upon as an indication of trading intent on behalf of any
American Century fund. Security examples are used for representational
purposes only and are not intended as recommendations to purchase or sell
securities. Performance information for comparative indices and securities is
provided to American Century by third party vendors. To the best of American
Century's knowledge, such information is accurate at the time of printing.
MARKET PERSPECTIVE
[photo of Chief Investment Officer]
By Steve Lurito, Chief Investment Officer, U.S. Growth Equity
VOLATILITY UP, STOCKS DOWN
The six months ended April 30, 2008 saw stocks produce negative returns as
market volatility surged in the wake of the subprime credit crisis. In terms
of the economy, tighter credit and the slumping housing market hurt consumer
spending and confidence, leading many economists to suggest we're already in
recession. Meanwhile, mounting losses hurt the banks, brokers, and other big
institutional players important for the functioning of the financial markets.
Facing dual economic and financial crises, the Federal Reserve (the Fed) took
a series of extraordinary steps, slashing interest rates and acting as a
lender of last resort not only for banks, but also major brokers. That helped
stocks rebound, with many analysts suggesting that the mid-March buy-out of
investment bank Bear Stearns -- in a deal arranged by the Fed -- put a floor
under the market.
RETURNS BY SIZE, STYLE MIXED
Performance by size and style was mixed (see the accompanying table),
reflecting the volatile trading during the period, when corporate earnings
estimates were revised down sharply. Looking at returns by sector, energy
shares were the only segment to produce positive results during the six
months. At the other end of the spectrum, credit-related losses took a big
bite out of earnings for financials stocks, which performed worst. Consumer
discretionary shares also lagged badly, as did information technology stocks,
which suffered from poor pricing and demand trends for chips and some
consumer-related tech goods.
OPPORTUNITY AMID VOLATILITY
Despite the uncertainty surrounding the economy, we think growth-oriented
stocks can perform well relative to value as proven earnings growth becomes
scarce during economic slowdowns. And while we don't see an end to market
volatility anytime soon, we view this dynamic as a natural part of the
investing cycle -- and one that presents us with opportunities to build
positions in what we believe are high-quality companies trading at attractive
prices. Indeed, investors should rest assured that we're finding no shortage
of companies demonstrating sustained earnings growth and business improvement.
U.S. Stock Index Returns
For the six months ended April 30, 2008*
RUSSELL 1000 INDEX (LARGE-CAP) -9.54%
Russell 1000 Growth Index -9.28%
Russell 1000 Value Index -9.83%
RUSSELL MIDCAP INDEX -8.77%
Russell Midcap Growth Index -8.44%
Russell Midcap Value Index -9.20%
RUSSELL 2000 INDEX (SMALL-CAP) -12.92%
Russell 2000 Growth Index -14.14%
Russell 2000 Value Index -11.55%
*Total returns for periods less than one year are not annualized.
- ------
2
PERFORMANCE
Mid Cap Growth
Total Returns as of April 30, 2008
Average Annual Returns
6 10 Since Inception
months(1) 1 year 5 years years Inception Date
A CLASS(2)
No sales charge* -9.00% 3.97% 11.17% 5.81% 9.37%
With sales charge* -14.24% -1.99% 9.87% 5.18% 8.79% 3/31/97
RUSSELL MIDCAP GROWTH
INDEX(3) -8.44% -1.93% 15.29% 5.75% 8.71% --
S&P MIDCAP
400 INDEX(3) -6.95% -2.76% 15.20% 9.64% 12.82% --
Investor Class -8.89% 4.25% -- -- 3.72% 4/3/06
Institutional Class -8.80% 4.46% -- -- 3.92% 4/3/06
B Class(2)
No sales charge* -9.32% 3.28% 10.47% 5.11% 8.65%
With sales charge* -14.32% -0.72% 10.33% 5.11% 8.65% 3/31/97
C Class
No sales charge* -9.31% 3.22% -- -- 2.69%
With sales charge* -10.13% 3.22% -- -- 2.69% 4/3/06
R Class -9.11% 3.70% -- -- 3.19% 4/3/06
*Sales charges include initial sales charges and contingent deferred sales
charges (CDSCs), as applicable. A Class shares have a 5.75% maximum initial
sales charge for equity funds and may be subject to a maximum CDSC of 1.00%. B
Class shares redeemed within six years of purchase are subject to a CDSC that
declines from 5.00% during the first year after purchase to 0.00% the sixth
year after purchase. C Class shares redeemed within 12 months of purchase are
subject to a maximum CDSC of 1.00%. The SEC requires that mutual funds provide
performance information net of maximum sales charges in all cases where
charges could be applied.
Mid Cap Growth acquired all the net assets of the Mason Street Aggressive
Growth Stock Fund on March 31, 2006, pursuant to a plan of reorganization
approved by the acquired fund's shareholders on March 15, 2006. Performance
information prior to April 1, 2006, is that of the Mason Street Aggressive
Growth Stock Fund.
(1) Total returns for periods less than one year are not annualized.
(2) Class returns would have been lower if fees had not been waived.
(3) Data provided by Lipper Inc. - A Reuters Company. ©2008 Reuters. All
rights reserved. Any copying, republication or redistribution of Lipper
content, including by caching, framing or similar means, is expressly
prohibited without the prior written consent of Lipper. Lipper shall not be
liable for any errors or delays in the content, or for any actions taken in
reliance thereon.
The data contained herein has been obtained from company reports, financial
reporting services, periodicals and other resources believed to be reliable.
Although carefully verified, data on compilations is not guaranteed by Lipper
and may be incomplete. No offer or solicitations to buy or sell any of the
securities herein is being made by Lipper.
Data presented reflect past performance. Past performance is no guarantee of
future results. Current performance may be higher or lower than the
performance shown. Investment return and principal value will fluctuate, and
redemption value may be more or less than original cost. To obtain performance
data current to the most recent month end, please call 1-800-345-2021 or visit
americancentury.com.
Unless otherwise indicated, performance reflects A Class shares; performance
for other share classes will vary due to differences in fee structure. For
information about other share classes available, please consult the
prospectus. Data assumes reinvestment of dividends and capital gains, and none
of the charts reflect the deduction of taxes that a shareholder would pay on
fund distributions or the redemption of fund shares. Returns for the indices
are provided for comparison. The fund's total returns include operating
expenses (such as transaction costs and management fees) that reduce returns,
while the total returns of the indices do not.
- ------
3
Mid Cap Growth
Growth of $10,000 Over 10 Years
$10,000 investment made April 30, 1998*
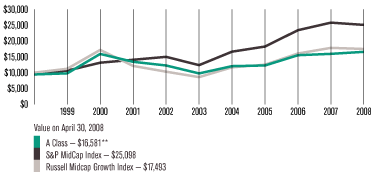
One-Year Returns Over 10 Years
Periods ended April 30
1999 2000 2001 2002 2003 2004 2005 2006 2007 2008
A Class (no sales
charge)** 3.76% 62.75% -15.64% -8.63% -20.47% 23.58% 1.74% 26.45% 2.79% 3.97%
Russell Midcap
Growth Index 12.33% 53.02% -29.47% -15.01% -16.67% 36.14% 7.05% 28.27% 11.13% -1.93%
S&P MidCap
400 Index 6.43% 23.52% 7.04% 6.57% -17.51% 34.45% 9.74% 28.32% 10.19% -2.76%
*Mid Cap Growth A Class's initial investment is $9,425 to reflect the maximum
5.75% initial sales charge.
**Class returns would have been lower, along with ending value, if fees had
not been waived.
Data presented reflect past performance. Past performance is no guarantee of
future results. Current performance may be higher or lower than the
performance shown. Investment return and principal value will fluctuate, and
redemption value may be more or less than original cost. To obtain performance
data current to the most recent month end, please call 1-800-345-2021 or visit
americancentury.com.
Unless otherwise indicated, performance reflects A Class shares; performance
for other share classes will vary due to differences in fee structure. For
information about other share classes available, please consult the
prospectus. Data assumes reinvestment of dividends and capital gains, and none
of the charts reflect the deduction of taxes that a shareholder would pay on
fund distributions or the redemption of fund shares. Returns for the indices
are provided for comparison. The fund's total returns include operating
expenses (such as transaction costs and management fees) that reduce returns,
while the total returns of the indices do not.
- ------
4
PORTFOLIO COMMENTARY
Mid Cap Growth
Portfolio Managers: Jill Grueninger and Curt Ludwick
PERFORMANCE SUMMARY
Mid Cap Growth returned -9.00%* during the six months ended April 30, 2008. By
comparison, the Russell MidCap Growth Index returned -8.44%. See page 3 for
additional performance comparisons.
The portfolio's absolute return was driven by the stock market's negative
results, led by information technology shares. The story is much the same when
looking at performance relative to the benchmark -- information technology
holdings were by far the leading detractors, while industrials and energy
holdings contributed most.
INFORMATION TECHNOLOGY LAGGED
Stock selection in the information technology sector was the leading detractor
from performance compared with the index. Holdings in the IT services,
internet software & services, and communications equipment industries were all
notable sources of weakness.
Five of the top-10 individual detractors for the six months resided in this
sector, led by electronic payment processor VeriFone Holdings, which re-stated
earnings, taking a hit to growth and margins. Elsewhere in the sector,
overweight positions in computer networking company Foundry Networks, internet
advertiser ValueClick, and e-commerce software firm Digital River were notable
detractors. These stocks are all good examples of a trend evident in the
broader market -- generally speaking, high-momentum, high-valuation stocks
that were winners for much of 2007 sold off aggressively in December and into
the first quarter of 2008.
OTHER DETRACTORS
Chinese advertiser Focus Media Holdings was another notable detractor for the
six-month reporting period that had been a leading contributor in 2007. The
stock's success left it vulnerable to the sell-off that swept global markets
during the last several months, so when the company reported a slowdown in its
cell phone ad business, skittish traders bailed on the stock.
Another key detractor was an overweight position in bond insurer MBIA. We
thought the company would benefit from the re-pricing of risk in the bond
market -- the more conscious investors are of risk, the more demand and
pricing power bond insurers should enjoy. Unfortunately, the firm experienced
significant losses relating to the
Top Ten Holdings as of April 30, 2008
% of % of
net assets net assets
as of as of
4/30/08 10/31/07
DaVita Inc. 2.9% 3.0%
Amphenol Corp. Cl A 2.7% 1.9%
GameStop Corp. Cl A 2.2% 2.6%
Express Scripts, Inc. 2.2% 2.2%
Owens-Illinois Inc. 2.2% 1.3%
Psychiatric Solutions, Inc. 2.1% 1.6%
ValueClick Inc. 2.0% 2.2%
Activision, Inc. 2.0% 1.6%
Microchip Technology Inc. 2.0% 1.6%
Cameron International Corp. 1.9% 2.4%
*All fund returns referenced in this commentary are for A Class shares and are
not reduced by sales charges. A Class shares are subject to a maximum sales
charge of 5.75%. Had the sales charge been applied, returns would be lower
than those shown. Total returns for periods less than one year are not
annualized.
- ------
5
Mid Cap Growth
subprime mortgage crisis. That had the big credit rating agencies, such as
Standard & Poor's and Moody's, reconsidering the company's AAA rating,
limiting MBIA's future business prospects.
INDUSTRIALS CONTRIBUTED MOST
Industrial shares were the leading contributors to relative performance, led
by positioning in the road & rail and air freight & logistics industries, as
these shares rebounded after a difficult 2007. The leading contributor in this
space was shipping and logistics firm C.H. Robinson Worldwide, which saw
improvement across virtually all aspects of its business for the first quarter
of 2008. It also benefited performance relative to the benchmark to avoid the
poor-performing airline segment, which suffered from rising fuel costs and
worries about exposure to a slowing economy.
OTHER NOTABLE CONTRIBUTORS
The portfolio also enjoyed positive contributions from energy and materials
shares, the two sectors where our stock selection was most effective. The
portfolio's energy holdings included overweight positions in Southwest Energy,
Range Resources, and SandRidge Energy -- three of the top-10 contributors for
the period -- which were aided by surging natural gas prices and industry
spending on exploration and production. The leading contributor in the
materials sector was an overweight position in Owens-Illinois. The world's
biggest glass bottle maker continued to make progress on its turnaround, and
has benefited from shuttering excess capacity in the packaging industry.
OUTLOOK
Our investment process focuses on medium- and small-sized companies that we
believe are well managed, have solid growth in revenue and earnings, and have
strong financial characteristics. We believe that strategy will generate
outperformance over time versus the Russell MidCap Growth Index and our
mid-cap growth peer group.
Despite the sharp volatility in the market in recent months, we're finding no
shortage of companies that meet our investment criteria. As of April 30, 2008,
we were finding opportunities in the health care and information technology
segments.
Top Five Industries as of April 30, 2008
% of % of
net assets net assets
as of as of
4/30/08 10/31/07
Health Care Providers & Services 9.1% 10.3%
Energy Equipment & Services 7.2% 7.4%
Oil, Gas & Consumable Fuels 6.0% 2.0%
Software 5.0% 5.6%
Capital Markets 4.9% 5.0%
Types of Investments in Portfolio
% of % of
net assets net assets
as of as of
4/30/08 10/31/07
Domestic Common Stocks and Futures 88.9% 91.2%
Foreign Common Stocks(1) 6.8% 5.6%
TOTAL EQUITY EXPOSURE 95.7% 96.8%
Short-Term Investments 3.2% 3.0%
Other Assets and Liabilities 1.1% 0.2%
(1) Includes depositary shares, dual listed securities and foreign ordinary
shares.
- ------
6
SCHEDULE OF INVESTMENTS
Mid Cap Growth
APRIL 30, 2008 (UNAUDITED)
Shares Value
Common Stocks -- 94.2%
AEROSPACE & DEFENSE -- 2.0%
13,500 L-3 Communications Holdings, Inc. $ 1,504,575
84,400 Spirit AeroSystems Holdings Inc. Cl A(1) 2,461,948
------------
3,966,523
------------
AIR FREIGHT & LOGISTICS -- 2.9%
58,400 C.H. Robinson Worldwide Inc. 3,660,512
43,220 Expeditors International of Washington, Inc. 2,013,620
------------
5,674,132
------------
BIOTECHNOLOGY -- 1.2%
35,800 Celgene Corp.(1) 2,224,612
------------
CAPITAL MARKETS -- 4.9%
76,820 Investment Technology Group Inc.(1) 3,707,333
26,900 Northern Trust Corp. 1,993,559
2,300 Raymond James Financial, Inc. 66,171
48,700 SEI Investments Co. 1,133,249
45,900 T. Rowe Price Group Inc. 2,687,904
------------
9,588,216
------------
CHEMICALS -- 1.3%
27,630 Praxair, Inc. 2,522,895
------------
COMMERCIAL SERVICES & SUPPLIES -- 4.3%
122,100 Corrections Corp. of America(1) 3,113,550
41,450 Monster Worldwide Inc.(1) 1,008,479
85,200 Ritchie Bros. Auctioneers Inc. 2,125,740
40,880 Stericycle Inc.(1) 2,182,174
------------
8,429,943
------------
COMMUNICATIONS EQUIPMENT -- 0.9%
140,900 Foundry Networks, Inc.(1) 1,793,657
------------
COMPUTERS & PERIPHERALS -- 0.8%
65,800 NetApp, Inc.(1) 1,592,360
------------
CONSTRUCTION & ENGINEERING -- 0.7%
22,400 Foster Wheeler Ltd.(1) 1,426,656
------------
CONTAINERS & PACKAGING -- 2.2%
77,800 Owens-Illinois Inc.(1) 4,290,670
------------
DIVERSIFIED CONSUMER SERVICES -- 2.3%
18,900 Apollo Group, Inc. Cl A(1) 962,010
60,000 DeVry Inc. 3,420,000
------------
4,382,010
------------
DIVERSIFIED FINANCIAL SERVICES -- 1.9%
2,060 CME Group Inc. 942,347
10,112 IntercontinentalExchange Inc.(1) 1,568,877
Shares Value
11,700 Nymex Holdings Inc. $ 1,083,420
------------
3,594,644
------------
ELECTRONIC EQUIPMENT & INSTRUMENTS -- 2.7%
111,920 Amphenol Corp. Cl A 5,168,466
------------
ENERGY EQUIPMENT & SERVICES -- 7.2%
76,200 Cameron International Corp.(1) 3,751,326
21,800 Diamond Offshore Drilling, Inc. 2,733,938
52,100 Nabors Industries Ltd.(1) 1,955,834
40,000 National Oilwell Varco, Inc.(1) 2,738,000
36,800 Smith International, Inc. 2,815,568
------------
13,994,666
------------
FOOD & STAPLES RETAILING -- 0.8%
39,000 Longs Drug Stores Corp. 1,562,340
------------
HEALTH CARE EQUIPMENT & SUPPLIES -- 4.5%
109,270 Immucor, Inc.(1) 2,948,105
7,800 Intuitive Surgical Inc.(1) 2,256,228
29,000 Mentor Corp. 848,830
27,700 Mettler-Toledo International, Inc.(1) 2,638,702
------------
8,691,865
------------
HEALTH CARE PROVIDERS & SERVICES -- 9.1%
108,700 DaVita Inc.(1) 5,696,967
61,600 Express Scripts, Inc.(1) 4,313,232
38,515 Pediatrix Medical Group, Inc.(1) 2,619,790
115,395 Psychiatric Solutions, Inc.(1) 4,005,360
35,580 VCA Antech Inc.(1) 1,151,725
------------
17,787,074
------------
HOTELS, RESTAURANTS & LEISURE -- 2.3%
73,700 International Game Technology 2,560,338
74,200 Jack in the Box Inc.(1) 1,984,850
------------
4,545,188
------------
INSURANCE -- 1.4%
80,300 Assured Guaranty Ltd. 2,030,787
62,000 MBIA Inc. 644,800
------------
2,675,587
------------
INTERNET SOFTWARE & SERVICES -- 2.0%
195,980 ValueClick Inc.(1) 3,909,801
------------
IT SERVICES -- 4.7%
17,000 Alliance Data Systems Corp.(1) 975,970
57,260 Cognizant Technology Solutions Corp. Cl A(1) 1,846,635
72,100 Global Payments Inc. 3,191,146
70,710 NeuStar, Inc. Cl A(1) 1,945,232
98,200 VeriFone Holdings Inc.(1) 1,098,858
------------
9,057,841
------------
- ------
7
Mid Cap Growth
Shares Value
LIFE SCIENCES TOOLS & SERVICES -- 1.3%
45,200 Charles River Laboratories(1) $ 2,623,860
------------
MACHINERY -- 2.1%
49,000 Harsco Corp. 2,907,170
32,300 Manitowoc Co., Inc. (The) 1,221,586
------------
4,128,756
------------
MEDIA -- 1.6%
85,800 Focus Media Holding Ltd. ADR(1) 3,165,162
------------
METALS & MINING -- 1.4%
25,700 SPDR S&P Metals & Mining ETF 1,960,910
52,900 Titanium Metals Corp. 806,196
------------
2,767,106
------------
MULTILINE RETAIL -- 2.8%
87,000 Dollar Tree, Inc.(1) 2,749,200
38,200 Kohl's Corp.(1) 1,866,070
70,500 Saks Inc.(1) 917,205
------------
5,532,475
------------
OIL, GAS & CONSUMABLE FUELS -- 6.0%
33,700 Equitable Resources Inc. 2,236,669
51,630 Range Resources Corporation 3,427,199
52,400 SandRidge Energy, Inc.(1) 2,367,432
88,400 Southwestern Energy Co.(1) 3,740,204
------------
11,771,504
------------
PERSONAL PRODUCTS -- 1.1%
97,600 Bare Escentuals Inc.(1) 2,226,256
------------
ROAD & RAIL -- 2.4%
63,010 J.B. Hunt Transport Services, Inc. 2,140,450
143,500 Knight Transportation Inc. 2,438,065
------------
4,578,515
------------
SEMICONDUCTORS & SEMICONDUCTOR EQUIPMENT -- 4.8%
44,200 Broadcom Corp. Cl A(1) 1,147,432
34,550 KLA-Tencor Corp. 1,509,144
105,397 Microchip Technology Inc. 3,873,340
58,700 NVIDIA Corp.(1) 1,206,285
39,800 Varian Semiconductor Equipment Associates, Inc.(1) 1,457,874
------------
9,194,075
------------
Shares Value
SOFTWARE -- 5.0%
144,297 Activision, Inc.(1) $ 3,903,233
24,900 Autodesk, Inc.(1) 946,200
40,338 Citrix Systems, Inc.(1) 1,321,070
59,400 FactSet Research Systems Inc. 3,565,782
------------
9,736,285
------------
SPECIALTY RETAIL -- 4.5%
121,700 Collective Brands, Inc.(1) 1,505,429
78,900 GameStop Corp. Cl A(1) 4,342,656
32,170 O'Reilly Automotive Inc.(1) 928,748
57,600 Urban Outfitters Inc.(1) 1,972,800
------------
8,749,633
------------
TRADING COMPANIES & DISTRIBUTORS -- 1.1%
44,300 MSC Industrial Direct Co. Cl A 2,160,068
------------
TOTAL COMMON STOCKS
(Cost $157,732,159) 183,512,841
------------
Principal Amount
Short-Term Investments -- 3.2%
$2,000,000 ConAgra Foods, Inc., 3.08%, 5/2/08 (Acquired
4/18/08, Cost $1,997,604)(2)(3) 1,999,698
1,800,000 Devon Energy Corp., 2.87%, 5/1/08(3) 1,799,865
500,000 FNMA Discount Notes, 2.72%, 5/21/08(3) 499,493
2,000,000 Viacom Inc., 3.25%, 5/14/08 (Acquired 4/30/08, Cost
$1,997,472)(2)(3) 1,997,762
------------
TOTAL SHORT-TERM INVESTMENTS
(Cost $6,296,727) 6,296,818
------------
Short-Term Investments -- Segregated for Futures Contracts -- 1.5%
3,000,000 New Center Asset Trust, 3.05%, 5/29/08(3)
(Cost $2,992,883) 2,992,536
------------
TOTAL INVESTMENT SECURITIES -- 98.9%
(Cost $167,021,769) 192,802,195
------------
OTHER ASSETS AND LIABILITIES -- 1.1% 2,013,146
------------
TOTAL NET ASSETS -- 100.0% $194,815,341
============
- ------
8
Mid Cap Growth
Futures Contracts
Expiration Underlying Face Unrealized
Contracts Purchased Date Amount at Value Gain (Loss)
6 S&P MidCap 400
Index Futures June 2008 $2,515,500 $182,066
============ ============
Notes to Schedule of Investments
ADR = American Depositary Receipt
ETF = Exchange Traded Fund
FNMA = Federal National Mortgage Association
SPDR = Standard and Poor's Depositary Receipt
(1) Non-income producing.
(2) Security was purchased under Rule 144A or Section 4(2) of the Securities
Act of 1933 or is a private placement and, unless registered under the Act or
exempted from registration, may only be sold to qualified institutional
investors. The aggregate value of restricted securities at April 30, 2008, was
$3,997,460, which represented 2.1% of total net assets.
(3) The rate indicated is the yield to maturity at purchase.
See Notes to Financial Statements.
- ------
9
PERFORMANCE
Small Cap Growth
Total Returns as of April 30, 2008
Average Annual
Returns
6 Since Inception
months(1) 1 year 5 years Inception Date
A CLASS(2)
No sales charge* -21.79% -10.78% 10.40% 9.13%
With sales charge* -26.28% -15.88% 9.10% 8.40% 7/12/99
RUSSELL 2000
GROWTH INDEX(3) -14.14% -6.71% 13.32% 2.15%(4) --
S&P SMALLCAP
600 INDEX(3) -11.60% -9.04% 14.73% 9.22%(4) --
Investor Class -21.73% -10.62% -- -4.95% 4/3/06
Institutional Class -21.65% -10.46% -- -4.76% 4/3/06
B Class(2)
No sales charge* -22.03% -11.31% 9.71% 8.45%
With sales charge* -27.03% -15.31% 9.57% 8.45% 7/12/99
C Class
No sales charge* -22.15% -11.57% -- -5.93%
With sales charge* -22.80% -11.57% -- -5.93% 4/3/06
R Class -21.94% -11.10% -- -5.44% 4/3/06
*Sales charges include initial sales charges and contingent deferred sales
charges (CDSCs), as applicable. A Class shares have a 5.75% maximum initial
sales charge for equity funds and may be subject to a maximum CDSC of 1.00%. B
Class shares redeemed within six years of purchase are subject to a CDSC that
declines from 5.00% during the first year after purchase to 0.00% the sixth
year after purchase. C Class shares redeemed within 12 months of purchase are
subject to a maximum CDSC of 1.00%. The SEC requires that mutual funds provide
performance information net of maximum sales charges in all cases where
charges could be applied.
Small Cap Growth acquired all the net assets of the Mason Street Small Cap
Growth Stock Fund on March 31, 2006, pursuant to a plan of reorganization
approved by the acquired fund's shareholders on March 23, 2006. Performance
information prior to April 1, 2006, is that of the Mason Street Small Cap
Growth Stock Fund.
(1) Total returns for periods less than one year are not annualized.
(2) Class returns would have been lower if fees had not been waived.
(3) Data provided by Lipper Inc. - A Reuters Company. ©2008 Reuters. All
rights reserved. Any copying, republication or redistribution of Lipper
content, including by caching, framing or similar means, is expressly
prohibited without the prior written consent of Lipper. Lipper shall not be
liable for any errors or delays in the content, or for any actions taken in
reliance thereon.
The data contained herein has been obtained from company reports, financial
reporting services, periodicals and other resources believed to be reliable.
Although carefully verified, data on compilations is not guaranteed by Lipper
and may be incomplete. No offer or solicitations to buy or sell any of the
securities herein is being made by Lipper.
(4) Since 7/14/99, the date nearest the A Class's inception for which data are
available.
Data presented reflect past performance. Past performance is no guarantee of
future results. Current performance may be higher or lower than the
performance shown. Investment return and principal value will fluctuate, and
redemption value may be more or less than original cost. To obtain performance
data current to the most recent month end, please call 1-800-345-2021 or visit
americancentury.com.
Historically, small company stocks have been more volatile than the stocks of
larger, more established companies.
Unless otherwise indicated, performance reflects A Class shares; performance
for other share classes will vary due to differences in fee structure. For
information about other share classes available, please consult the
prospectus. Data assumes reinvestment of dividends and capital gains, and none
of the charts reflect the deduction of taxes that a shareholder would pay on
fund distributions or the redemption of fund shares. Returns for the indices
are provided for comparison. The fund's total returns include operating
expenses (such as transaction costs and management fees) that reduce returns,
while the total returns of the indices do not.
- ------
10
Small Cap Growth
Growth of $10,000 Over Life of Class
$10,000 investment made July 12, 1999
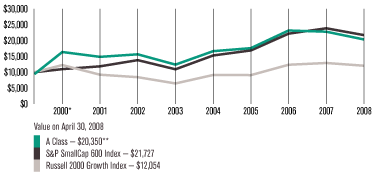
One-Year Returns Over Life of Class
Periods ended April 30
2000* 2001 2002 2003 2004 2005 2006 2007 2008
A Class (no sales
charge)** 73.88% -9.33% 5.41% -20.83% 34.30% 5.76% 31.66% -1.65% -10.78%
Russell 2000
Growth Index 22.64% -24.85% -8.52% -23.50% 41.57% -0.55% 36.13% 4.53% -6.71%
S&P SmallCap 600
Index 9.74% 8.09% 16.54% -20.95% 39.94% 10.43% 31.39% 7.65% -9.04%
*From 7/12/99, the A Class's inception date. Index data from 7/14/99, the date
nearest the A Class's inception for which data are available. Not annualized.
Small Cap Growth A Class's initial investment is $9,425 to reflect the maximum
5.75% initial sales charge.
**Class returns would have been lower, along with ending value, if fees had
not been waived.
Data presented reflect past performance. Past performance is no guarantee of
future results. Current performance may be higher or lower than the
performance shown. Investment return and principal value will fluctuate, and
redemption value may be more or less than original cost. To obtain performance
data current to the most recent month end, please call 1-800-345-2021 or visit
americancentury.com.
Historically, small company stocks have been more volatile than the stocks of
larger, more established companies.
Unless otherwise indicated, performance reflects A Class shares; performance
for other share classes will vary due to differences in fee structure. For
information about other share classes available, please consult the
prospectus. Data assumes reinvestment of dividends and capital gains, and none
of the charts reflect the deduction of taxes that a shareholder would pay on
fund distributions or the redemption of fund shares. Returns for the indices
are provided for comparison. The fund's total returns include operating
expenses (such as transaction costs and management fees) that reduce returns,
while the total returns of the indices do not.
- ------
11
PORTFOLIO COMMENTARY
Small Cap Growth
Portfolio Managers: Bill Walker and Andy Eng
PERFORMANCE SUMMARY
Small Cap Growth returned -21.79%* during the six months ended April 30, 2008.
By comparison, the Russell 2000 Growth Index returned -14.14%. See page 10 for
additional performance comparisons.
As measured by the Russell indexes, shown on page 2, small-cap growth stocks
were the poorest-performing segment of the market. Within the small-cap space,
only energy shares produced a positive return, and information technology (IT)
stocks performed worst. That goes a long way toward explaining the performance
of the portfolio, whose largest industry exposure was to small-cap technology
companies. Indeed, IT was by far the leading detractor from absolute and
relative results. Consumer discretionary and financial shares were also
notable detractors. In terms of positive contributors, stock selection aided
relative performance across a number of sectors, led by industrial and
consumer staples shares.
IT STOCKS DETRACTED MOST
Stock selection in the information technology sector detracted most from
performance. Holdings in the internet software & services, software,
communications equipment, and electronic equipment industries detracted most
from relative results. Indeed, the sector was home to six of the top-10
individual detractors.
The general theme explaining the underperformance was company- or
product-specific issues that led to disappointing revenues and/or profits.
Examples of significant detractors that fit this model are computer products
reseller InsightEnterprises and SiRF Technology, which makes chips for global
positioning devices. Insight reported disappointing third-quarter results,
pushing out revenues into future quarters and seeing higher costs as the
company continued to work to digest a late-2006 acquisition. SiRF
underperformed as business conditions deteriorated, missing earnings targets,
and losing market share. Other notable detractors in the sector were positions
in Riverbed Technology, Limelight Networks, Aruba Networks, and ComScore.
CONSUMER DISCRETIONARY, FINANCIALS LAGGED
The consumer discretionary and financials sectors were other key areas of
weakness because of stock selection. In the consumer discretionary space,
positions in the textiles, apparel, and luxury goods, and hotels, restaurants,
and leisure industries
Top Ten Holdings as of April 30, 2008
% of % of
net assets net assets
as of as of
4/30/08 10/31/07
Oceaneering International, Inc. 1.9% 1.4%
ICON plc ADR 1.8% --
Bucyrus International, Inc. 1.7% 1.1%
Arena Resources Inc. 1.7% --
Sohu.com Inc. 1.7% 1.5%
Pediatrix Medical Group, Inc. 1.7% 1.4%
Axsys Technologies, Inc. 1.6% 0.9%
Central European Distribution Corp. 1.5% 1.3%
Warnaco Group Inc. (The) 1.5% --
Masimo Corp. 1.5% 0.9%
*All fund returns referenced in this commentary are for A Class shares and are
not reduced by sales charges. A Class shares are subject to a maximum sales
charge of 5.75%. Had the sales charge been applied or if distribution and
service fees had not been waived, returns would be lower than those shown.
Total returns for periods less than one year are not annualized.
- ------
12
Small Cap Growth
detracted most. The leading detractor in this space was fitness, spa, and
resort operator Life Time Fitness, which experienced slower enrollment growth
and guided future business expectations lower.
Financials detracted behind an underweight position and stock selection among
real estate investment trusts. REITs rebounded after a difficult 2007, and we
were underrepresented in the industry. What's more, one of the stocks we did
hold in this space underperformed -- MFA Mortgage Investments. The stock sold
off after news of liquidity problems at a competitor; however, we believe MFA
itself remains a well-capitalized, attractive business.
LEADING CONTRIBUTORS
Industrial shares were far and away the leading contributors to relative
performance, driven primarily by holdings in the machinery, trading companies
and distributors, commercial services and supplies, and road and rail
industries. The sector was home to six of the 10 largest contributors, led by
Axsys Technologies, which provides optical equipment for military uses. The
firm saw orders increase, leading to better-than-expected earnings and
guidance for future quarters. Other leading contributors in the sector were
UAP Holding, Bucyrus International, Knight Transportation, LKQ, and IHS.
Stock selection also added value in the consumer staples sector, which was
home to top-10 contributor Central European Distribution. The Polish vodka
company benefited from an acquisition that gives it distribution rights for
some leading brands in Russia.
OUTLOOK
Our disciplined investment process focuses on what we believe to be
well-managed, high-quality, fast-growing, attractively valued small-cap
companies. Because we build the portfolio stock by stock, our sector and
industry allocations reflect where we're finding the best growth opportunities
at a given time. Despite the poor performance and extreme volatility evident
in the IT sector, we continue to believe these shares present us with the most
dynamic growth opportunities going forward. As a result, our largest sector
overweight as of April 30, 2008, was in IT. The most notable sector
underweights were in consumer discretionary and health care stocks.
Top Five Industries as of April 30, 2008
% of % of
net assets net assets
as of as of
4/30/08 10/31/07
Internet Software & Services 9.2% 12.6%
Software 7.4% 7.9%
Health Care Equipment & Supplies 6.9% 7.6%
Energy Equipment & Services 5.5% 5.0%
Machinery 5.5% 3.1%
Types of Investments in Portfolio
% of % of
net assets net assets
as of as of
4/30/08 10/31/07
Domestic Common Stocks and Futures 86.1% 88.7%
Foreign Common Stocks(1) 9.1% 8.8%
TOTAL EQUITY EXPOSURE 95.2% 97.5%
Short-Term Investments 3.8% 3.7%
Other Assets and Liabilities 1.0% (1.2)%
(1) Includes depositary shares, dual listed securities and foreign ordinary
shares.
- ------
13
SCHEDULE OF INVESTMENTS
Small Cap Growth
APRIL 30, 2008 (UNAUDITED)
Shares Value
Common Stocks -- 95.2%
AEROSPACE & DEFENSE -- 2.2%
5,732 AeroVironment, Inc.(1) $ 137,052
8,275 Astronics Corp.(1) 147,295
10,730 TransDigm Group, Inc.(1) 407,418
------------
691,765
------------
AIR FREIGHT & LOGISTICS -- 0.5%
5,197 Hub Group Inc. Cl A(1) 169,890
------------
BEVERAGES -- 1.5%
7,980 Central European Distribution Corp.(1) 486,142
------------
BIOTECHNOLOGY -- 2.0%
12,797 BioMarin Pharmaceutical Inc.(1) 466,579
9,016 Cepheid(1) 176,443
------------
643,022
------------
CAPITAL MARKETS -- 3.1%
6,323 FCStone Group, Inc.(1) 261,899
6,798 Investment Technology Group Inc.(1) 328,071
15,769 KBW, Inc.(1) 374,356
------------
964,326
------------
CHEMICALS -- 1.0%
6,275 Airgas Inc. 302,016
------------
COMMERCIAL BANKS -- 0.4%
13,296 Boston Private Financial Holdings, Inc. 123,653
------------
COMMERCIAL SERVICES & SUPPLIES -- 4.5%
3,656 Advisory Board Co. (The)(1) 170,443
9,331 Cornell Companies, Inc.(1) 212,000
10,952 Corrections Corp. of America(1) 279,276
4,700 Hill International Inc.(1) 67,915
5,645 IHS Inc. Cl A(1) 372,852
9,992 Team, Inc.(1) 297,062
------------
1,399,548
------------
COMMUNICATIONS EQUIPMENT -- 2.2%
27,272 Comtech Group Inc.(1) 355,081
15,064 F5 Networks, Inc.(1) 340,898
------------
695,979
------------
CONTAINERS & PACKAGING -- 0.9%
5,178 Silgan Holdings Inc. 275,884
------------
DISTRIBUTORS -- 1.0%
14,260 LKQ Corp.(1) 310,298
------------
Shares Value
DIVERSIFIED -- 1.5%
11,830 Financial Select Sector SPDR Fund $ 312,785
4,500 KBW Regional Banking ETF(1) 156,645
------------
469,430
------------
DIVERSIFIED CONSUMER SERVICES -- 4.1%
10,597 American Public Education Inc.(1) 341,329
7,362 Capella Education Co.(1) 474,775
6,431 New Oriental Education & Technology Group Inc.
ADR(1) 482,712
------------
1,298,816
------------
DIVERSIFIED TELECOMMUNICATION SERVICES -- 0.8%
31,924 PAETEC Holding Corp.(1) 246,134
------------
ELECTRIC UTILITIES -- 1.5%
8,420 ITC Holdings Corp. 469,668
------------
ELECTRICAL EQUIPMENT -- 0.5%
6,898 Polypore International, Inc.(1) 161,482
------------
ELECTRONIC EQUIPMENT & INSTRUMENTS -- 1.2%
24,249 Mellanox Technologies, Ltd.(1) 363,008
------------
ENERGY EQUIPMENT & SERVICES -- 5.5%
3,901 Dril-Quip Inc.(1) 222,981
8,752 Oceaneering International, Inc.(1) 584,460
6,729 T-3 Energy Services Inc.(1) 355,291
14,728 TETRA Technologies, Inc.(1) 239,477
4,298 W-H Energy Services Inc.(1) 332,192
------------
1,734,401
------------
HEALTH CARE EQUIPMENT & SUPPLIES -- 6.9%
13,440 Hologic, Inc.(1) 392,314
16,658 Masimo Corp.(1) 485,580
12,662 Meridian Bioscience Inc. 340,988
11,910 NuVasive, Inc.(1) 454,367
22,794 Thoratec Corp.(1) 364,476
10,148 TranS1 Inc.(1) 132,431
------------
2,170,156
------------
HEALTH CARE PROVIDERS & SERVICES -- 4.4%
12,193 Genoptix, Inc.(1) 334,454
7,788 Pediatrix Medical Group, Inc.(1) 529,740
11,714 Providence Service Corp. (The)(1) 329,632
5,247 Psychiatric Solutions, Inc.(1) 182,123
------------
1,375,949
------------
- ------
14
Small Cap Growth
Shares Value
HEALTH CARE TECHNOLOGY -- 1.4%
23,929 Phase Forward Inc.(1) $ 440,294
------------
HOTELS, RESTAURANTS & LEISURE -- 2.9%
3,230 Life Time Fitness Inc.(1) 117,411
7,931 Red Robin Gourmet Burgers Inc.(1) 325,805
12,796 WMS Industries Inc.(1) 463,087
------------
906,303
------------
INTERNET SOFTWARE & SERVICES -- 9.2%
3,755 Bankrate, Inc.(1) 196,161
16,461 comScore, Inc.(1) 310,619
4,967 DealerTrack Holdings Inc.(1) 95,565
7,034 Omniture, Inc.(1) 160,516
7,764 Sohu.com Inc.(1) 536,724
46,442 SonicWALL, Inc.(1) 357,139
15,697 Switch & Data Facilities Co. Inc.(1) 237,653
21,608 ValueClick Inc.(1) 431,080
10,086 VistaPrint Ltd.(1) 343,227
7,731 Vocus Inc.(1) 214,844
------------
2,883,528
------------
IT SERVICES -- 1.3%
27,134 Global Cash Access Inc.(1) 167,688
9,064 NeuStar, Inc. Cl A(1) 249,351
------------
417,039
------------
LIFE SCIENCES TOOLS & SERVICES -- 2.4%
7,630 ICON plc ADR(1) 549,360
2,699 Illumina, Inc.(1) 210,225
------------
759,585
------------
MACHINERY -- 5.5%
9,052 Axsys Technologies, Inc.(1) 493,787
4,329 Bucyrus International, Inc. 545,150
5,397 Kaydon Corp. 282,641
10,100 Titan Machinery Inc.(1) 183,921
2,199 Valmont Industries, Inc. 216,514
------------
1,722,013
------------
MEDIA -- 0.4%
7,910 Dolan Media Co.(1) 137,159
------------
METALS & MINING -- 1.5%
6,072 SPDR S&P Metals & Mining ETF 463,294
------------
MULTILINE RETAIL -- 0.9%
9,430 Dollar Tree, Inc.(1) 297,988
------------
Shares Value
OIL, GAS & CONSUMABLE FUELS -- 3.9%
12,132 Arena Resources Inc.(1) $ 544,727
4,565 Carrizo Oil & Gas Inc.(1) 289,832
5,032 Petroleum Development Corp.(1) 378,557
------------
1,213,116
------------
PERSONAL PRODUCTS -- 0.9%
11,813 Alberto-Culver Co. 297,333
------------
PHARMACEUTICALS -- 0.4%
14,448 Obagi Medical Products Inc.(1) 115,728
------------
REAL ESTATE INVESTMENT TRUSTS (REITS) -- 1.5%
7,198 Digital Realty Trust Inc. 278,923
25,900 MFA Mortgage Investments, Inc. 181,041
------------
459,964
------------
ROAD & RAIL -- 0.5%
9,170 Knight Transportation Inc. 155,798
------------
SEMICONDUCTORS & SEMICONDUCTOR EQUIPMENT -- 4.9%
23,301 Advanced Energy Industries, Inc.(1) 326,214
9,131 Atheros Communications, Inc.(1) 243,067
5,100 Diodes Inc.(1) 137,904
11,656 Netlogic Microsystems Inc.(1) 382,200
21,500 RF Micro Devices, Inc.(1) 72,455
6,186 Rubicon Technology, Inc.(1) 136,463
11,574 Tessera Technologies Inc.(1) 234,258
------------
1,532,561
------------
SOFTWARE -- 7.4%
7,707 Blackboard Inc.(1) 266,200
9,597 Concur Technologies, Inc.(1) 318,045
18,588 Glu Mobile Inc.(1) 87,178
16,729 Macrovision Corp.(1) 263,984
20,977 Synchronoss Technologies, Inc.(1) 437,789
14,794 Taleo Corp. Cl A(1) 288,483
13,090 Ultimate Software Group Inc.(1) 429,220
26,017 VanceInfo Technologies Inc. ADR(1) 222,706
------------
2,313,605
------------
SPECIALTY RETAIL -- 1.6%
13,029 Dick's Sporting Goods, Inc.(1) 372,629
8,860 Ulta Salon, Cosmetics & Fragrance, Inc.(1) 125,369
------------
497,998
------------
- ------
15
Small Cap Growth
Shares Value
TEXTILES, APPAREL & LUXURY GOODS -- 1.5%
10,530 Warnaco Group Inc. (The)(1) $ 485,854
------------
THRIFTS & MORTGAGE FINANCE -- 0.5%
8,578 Encore Bancshares, Inc.(1) 150,287
------------
WIRELESS TELECOMMUNICATION SERVICES -- 0.9%
47,516 Centennial Communications Corp.(1) 287,947
------------
TOTAL COMMON STOCKS
(Cost $26,991,104) 29,888,961
------------
Principal Amount Value
Short-Term Investments -- 3.8%
$1,000,000 Devon Energy Corp., 2.87%, 5/1/08(2) $ 999,925
200,000 FNMA Discount Notes, 2.72%, 5/21/08(2) 199,797
------------
TOTAL SHORT-TERM INVESTMENTS
(Cost $1,199,698) 1,199,722
------------
TOTAL INVESTMENT SECURITIES -- 99.0%
(Cost $28,190,802) 31,088,683
------------
OTHER ASSETS AND LIABILITIES -- 1.0% 295,921
------------
TOTAL NET ASSETS -- 100.0% $31,384,604
============
Notes to Schedule of Investments
ADR = American Depositary Receipt
ETF = Exchange Traded Fund
FNMA = Federal National Mortgage Association
SPDR = Standard and Poor's Depositary Receipt
(1) Non-income producing.
(2) The rate indicated is the yield to maturity at purchase.
See Notes to Financial Statements.
- ------
16
SHAREHOLDER FEE EXAMPLES (UNAUDITED)
Fund shareholders may incur two types of costs: (1) transaction costs,
including sales charges (loads) on purchase payments and redemption/exchange
fees; and (2) ongoing costs, including management fees; distribution and
service (12b-1) fees; and other fund expenses. This example is intended to
help you understand your ongoing costs (in dollars) of investing in your fund
and to compare these costs with the ongoing cost of investing in other mutual
funds.
The example is based on an investment of $1,000 made at the beginning of the
period and held for the entire period from November 1, 2007 to April 30, 2008.
ACTUAL EXPENSES
The table provides information about actual account values and actual expenses
for each class. You may use the information, together with the amount you
invested, to estimate the expenses that you paid over the period. First,
identify the share class you own. Then simply divide your account value by
$1,000 (for example, an $8,600 account value divided by $1,000 = 8.6), then
multiply the result by the number under the heading "Expenses Paid During
Period" to estimate the expenses you paid on your account during this period.
If you hold Investor Class shares of any American Century fund, or
Institutional Class shares of the American Century Diversified Bond Fund, in
an American Century account (i.e., not a financial intermediary or retirement
plan account), American Century may charge you a $12.50 semiannual account
maintenance fee if the value of those shares is less than $10,000. We will
redeem shares automatically in one of your accounts to pay the $12.50 fee. In
determining your total eligible investment amount, we will include your
investments in all PERSONAL ACCOUNTS (including American Century Brokerage
accounts) registered under your Social Security number. PERSONAL ACCOUNTS
include individual accounts, joint accounts, UGMA/UTMA accounts, personal
trusts, Coverdell Education Savings Accounts and IRAs (including traditional,
Roth, Rollover, SEP-, SARSEP- and SIMPLE-IRAs), and certain other retirement
accounts. If you have only business, business retirement, employer-sponsored
or American Century Brokerage accounts, you are currently not subject to this
fee. We will not charge the fee as long as you choose to manage your accounts
exclusively online. If you are subject to the Account Maintenance Fee, your
account value could be reduced by the fee amount.
HYPOTHETICAL EXAMPLE FOR COMPARISON PURPOSES
The table also provides information about hypothetical account values and
hypothetical expenses based on the actual expense ratio of each class of your
fund and an assumed rate of return of 5% per year before expenses, which is
not the actual return of a fund's share class. The hypothetical account values
and expenses may not be used to estimate the actual ending account balance or
expenses you paid for the period. You may use this information to compare the
ongoing costs of investing in your fund and other funds. To do so, compare
this 5% hypothetical example with the 5% hypothetical examples that appear in
the shareholder reports of the other funds.
Please note that the expenses shown in the table are meant to highlight your
ongoing costs only and do not reflect any transactional costs, such as sales
charges (loads) or redemption/exchange fees. Therefore, the table is useful in
comparing ongoing costs only, and will not help you determine the relative
total costs of owning different funds. In addition, if these transactional
costs were included, your costs would have been higher.
- ------
17
Beginning Ending
Account Account Expenses Paid Annualized
Value Value During Period(1) Expense
11/1/07 4/30/08 11/1/07 - 4/30/08 Ratio(1)
Mid Cap Growth
ACTUAL
Investor Class $1,000 $911.10 $4.99 1.05%
Institutional Class $1,000 $912.00 $4.04 0.85%
A Class $1,000 $910.00 $6.17 1.30%
B Class
(after waiver)(2) $1,000 $906.80 $9.34 1.97%
B Class
(before waiver) $1,000 $906.80(3) $9.72 2.05%
C Class $1,000 $906.90 $9.72 2.05%
R Class $1,000 $908.90 $7.36 1.55%
HYPOTHETICAL
Investor Class $1,000 $1,019.64 $5.27 1.05%
Institutional Class $1,000 $1,020.64 $4.27 0.85%
A Class $1,000 $1,018.40 $6.52 1.30%
B Class
(after waiver)(2) $1,000 $1,015.07 $9.87 1.97%
B Class
(before waiver) $1,000 $1,014.67 $10.27 2.05%
C Class $1,000 $1,014.67 $10.27 2.05%
R Class $1,000 $1,017.16 $7.77 1.55%
Small Cap Growth
ACTUAL
Investor Class $1,000 $782.70 $5.76 1.30%
Institutional Class $1,000 $783.50 $4.88 1.10%
A Class
(after waiver)(2) $1,000 $782.10 $6.29 1.42%
A Class
(before waiver) $1,000 $782.10(3) $6.87 1.55%
B Class
(after waiver)(2) $1,000 $779.70 $9.25 2.09%
B Class
(before waiver) $1,000 $779.70(3) $10.18 2.30%
C Class $1,000 $778.50 $10.17 2.30%
R Class $1,000 $780.60 $7.97 1.80%
HYPOTHETICAL
Investor Class $1,000 $1,018.40 $6.52 1.30%
Institutional Class $1,000 $1,019.39 $5.52 1.10%
A Class
(after waiver)(2) $1,000 $1,017.80 $7.12 1.42%
A Class
(before waiver) $1,000 $1,017.16 $7.77 1.55%
B Class
(after waiver)(2) $1,000 $1,014.47 $10.47 2.09%
B Class
(before waiver) $1,000 $1,013.43 $11.51 2.30%
C Class $1,000 $1,013.43 $11.51 2.30%
R Class $1,000 $1,015.91 $9.02 1.80%
(1) Expenses are equal to the class's annualized expense ratio listed in the
table above, multiplied by the average account value over the period,
multiplied by 182, the number of days in the most recent fiscal half-year,
divided by 366, to reflect the one-half year period.
(2) During the six months ended April 30, 2008, the distributor waived a
portion of its distribution and service fees.
(3) Ending account value assumes the return earned after waiver. The return
would have been lower had fees not been waived and may have resulted in a
lower ending account value.
- ------
18
STATEMENT OF ASSETS AND LIABILITIES
APRIL 30, 2008 (UNAUDITED)
Small Cap
Mid Cap Growth Growth
ASSETS
Investment securities, at value (cost of
$167,021,769 and $28,190,802, respectively) $192,802,195 $31,088,683
Cash 145,090 98,782
Receivable for investments sold 2,242,643 639,658
Receivable for capital shares sold 6,783 22,591
Dividends and interest receivable 47,504 3,102
------------ ------------
195,244,215 31,852,816
------------ ------------
LIABILITIES
Payable for investments purchased 267,829 416,069
Payable for capital shares redeemed 5,351 11,409
Payable for variation margin
on futures contracts 8,101 --
Accrued management fees 138,202 32,941
Distribution fees payable 3,020 2,679
Service fees (and distribution fees --
A Class and R Class) payable 6,371 5,114
------------ ------------
428,874 468,212
------------ ------------
NET ASSETS $194,815,341 $31,384,604
============ ============
See Notes to Financial Statements.
- ------
19
APRIL 30, 2008 (UNAUDITED)
Small Cap
Mid Cap Growth Growth
NET ASSETS CONSIST OF:
Capital (par value and paid-in surplus) $164,863,475 $32,619,272
Accumulated net investment loss (277,174) (186,416)
Accumulated undistributed net realized
gain (loss) on investment transactions 4,266,548 (3,946,133)
Net unrealized appreciation
on investments 25,962,492 2,897,881
------------ ------------
$194,815,341 $31,384,604
============ ============
INVESTOR CLASS, $0.01 PAR VALUE
Net assets $1,925,017 $1,825,391
Shares outstanding 141,407 153,455
Net asset value per share $13.61 $11.90
INSTITUTIONAL CLASS, $0.01 PAR VALUE
Net assets $161,561,690 $4,811,626
Shares outstanding 11,815,253 402,413
Net asset value per share $13.67 $11.96
A CLASS, $0.01 PAR VALUE
Net assets $26,261,514 $20,343,482
Shares outstanding 1,940,689 1,715,099
Net asset value per share $13.53 $11.86
Maximum offering price
(net asset value divided by 0.9425) $14.36 $12.58
B CLASS, $0.01 PAR VALUE
Net assets $4,842,664 $4,186,217
Shares outstanding 390,100 377,877
Net asset value per share $12.41 $11.08
C CLASS, $0.01 PAR VALUE
Net assets $131,389 $129,383
Shares outstanding 9,880 11,151
Net asset value per share $13.30 $11.60
R CLASS, $0.01 PAR VALUE
Net assets $93,067 $88,505
Shares outstanding 6,918 7,533
Net asset value per share $13.45 $11.75
See Notes to Financial Statements.
- ------
20
STATEMENT OF OPERATIONS
FOR THE SIX MONTHS ENDED APRIL 30, 2008 (UNAUDITED)
Small Cap
Mid Cap Growth Growth
INVESTMENT INCOME (LOSS)
INCOME:
Dividends $ 444,280 $ 46,633
Interest 195,869 32,141
------------- -------------
640,149 78,774
------------- -------------
EXPENSES:
Management fees 855,951 229,827
Distribution fees:
B Class 19,100 18,301
C Class 509 510
Service fees:
B Class 6,367 6,100
C Class 170 170
Distribution and service fees:
A Class 34,187 29,887
R Class 248 160
Directors' fees and expenses 2,643 828
Other expenses 302 61
------------- -------------
919,477 285,844
------------- -------------
Amount waived (2,154) (20,654)
------------- -------------
917,323 265,190
------------- -------------
NET INVESTMENT INCOME (LOSS) (277,174) (186,416)
------------- -------------
REALIZED AND UNREALIZED GAIN (LOSS)
NET REALIZED GAIN (LOSS) ON:
Investment transactions 5,755,985 (2,521,606)
Futures transactions (448,470) (66,268)
------------- -------------
5,307,515 (2,587,874)
------------- -------------
CHANGE IN NET UNREALIZED
APPRECIATION (DEPRECIATION) ON:
Investments (24,259,925) (7,030,110)
Futures 53,926 (14,930)
------------- -------------
(24,205,999) (7,045,040)
------------- -------------
NET REALIZED AND UNREALIZED GAIN (LOSS) (18,898,484) (9,632,914)
------------- -------------
NET INCREASE (DECREASE) IN NET ASSETS RESULTING
FROM OPERATIONS $(19,175,658) $(9,819,330)
============= =============
See Notes to Financial Statements.
- ------
21
STATEMENT OF CHANGES IN NET ASSETS
SIX MONTHS ENDED APRIL 30, 2008 (UNAUDITED) AND YEAR ENDED OCTOBER 31, 2007
Mid Cap Growth Small Cap Growth
Increase (Decrease) in
Net Assets 2008 2007 2008 2007
OPERATIONS
Net investment income
(loss) $ (277,174) $ (205,937) $ (186,416) $ (394,903)
Net realized
gain (loss) 5,307,515 20,994,253 (2,587,874) 7,363,154
Change in net
unrealized appreciation
(depreciation) (24,205,999) 26,844,008 (7,045,040) 1,941,390
------------ ------------ ------------ ------------
Net increase (decrease)
in net assets resulting
from operations (19,175,658) 47,632,324 (9,819,330) 8,909,641
------------ ------------ ------------ ------------
DISTRIBUTIONS TO SHAREHOLDERS
From net
realized gains:
Investor Class (157,129) (17,063) (169,076) (34,247)
Institutional Class (16,583,729) (7,634,579) (1,221,199) (100,277)
A Class (2,936,941) (1,979,362) (4,523,300) (2,404,950)
B Class (596,144) (373,134) (972,995) (410,373)
C Class (14,246) (7,699) (26,021) (7,151)
R Class (10,685) (1,280) (6,517) (1,413)
------------ ------------ ------------ ------------
Decrease in net assets
from distributions (20,298,874) (10,013,117) (6,919,108) (2,958,411)
------------ ------------ ------------ ------------
CAPITAL SHARE TRANSACTIONS
Net increase (decrease)
in net assets from
capital share
transactions 17,664,857 (3,715,693) 1,957,210 (10,361,918)
------------ ------------ ------------ ------------
NET INCREASE (DECREASE)
IN
NET ASSETS (21,809,675) 33,903,514 (14,781,228) (4,410,688)
NET ASSETS
Beginning of period 216,625,016 182,721,502 46,165,832 50,576,520
------------ ------------ ------------ ------------
End of period $194,815,341 $216,625,016 $ 31,384,604 $ 46,165,832
============ ============ ============ ============
Accumulated net
investment loss $(277,174) -- $(186,416) --
============ ============ ============ ============
See Notes to Financial Statements.
- ------
22
NOTES TO FINANCIAL STATEMENTS
APRIL 30, 2008 (UNAUDITED)
1. ORGANIZATION AND SUMMARY OF SIGNIFICANT ACCOUNTING POLICIES
ORGANIZATION -- American Century Mutual Funds, Inc. (the corporation) is
registered under the Investment Company Act of 1940 (the 1940 Act) as an
open-end management investment company. American Century-Mason Street Mid Cap
Growth Fund (Mid Cap Growth) and American Century-Mason Street Small Cap
Growth Fund (Small Cap Growth) (the funds) are two funds in a series issued by
the corporation. The funds are diversified under the 1940 Act. The funds'
investment objective is to seek long-term capital growth. Mid Cap Growth
invests primarily in stocks of mid-sized companies. Small Cap Growth invests
primarily in stocks of smaller market capitalization companies. The following
is a summary of the funds' significant accounting policies.
MULTIPLE CLASS -- The funds are authorized to issue the Investor Class, the
Institutional Class, the A Class, the B Class, the C Class and the R Class.
The A Class may incur an initial sales charge. The A Class, B Class and C
Class may be subject to a contingent deferred sales charge. The share classes
differ principally in their respective sales charges and distribution and
shareholder servicing expenses and arrangements. All shares of each fund
represent an equal pro rata interest in the net assets of the class to which
such shares belong, and have identical voting, dividend, liquidation and other
rights and the same terms and conditions, except for class specific expenses
and exclusive rights to vote on matters affecting only individual classes.
Income, non-class specific expenses, and realized and unrealized capital gains
and losses of the funds are allocated to each class of shares based on their
relative net assets.
SECURITY VALUATIONS -- Securities traded primarily on a principal securities
exchange are valued at the last reported sales price, or at the mean of the
latest bid and asked prices where no last sales price is available. Depending
on local convention or regulation, securities traded over-the-counter are
valued at the mean of the latest bid and asked prices, the last sales price,
or the official close price. Debt securities not traded on a principal
securities exchange are valued through a commercial pricing service or at the
mean of the most recent bid and asked prices. Debt securities maturing within
60 days may be valued at cost, plus or minus any amortized discount or
premium. Discount notes may be valued through a commercial pricing service or
at amortized cost, which approximates fair value. Securities traded on foreign
securities exchanges and over-the-counter markets are normally completed
before the close of business on days that the New York Stock Exchange (the
Exchange) is open and may also take place on days when the Exchange is not
open. If an event occurs after the value of a security was established but
before the net asset value per share was determined that was likely to
materially change the net asset value, that security would be valued as
determined in accordance with procedures adopted by the Board of Directors. If
the funds determine that the market price of a portfolio security is not
readily available, or that the valuation methods mentioned above do not
reflect the security's fair value, such security is valued as determined by
the Board of Directors or its designee, in accordance with procedures adopted
by the Board of Directors, if such determination would materially impact a
fund's net asset value. Certain other circumstances may cause the funds to use
alternative procedures to value a security such as: a security has been
declared in default; trading in a security has been halted during the trading
day; or there is a foreign market holiday and no trading will commence.
SECURITY TRANSACTIONS -- For financial reporting purposes, security
transactions are accounted for as of the trade date. Net realized gains and
losses are determined on the identified cost basis, which is also used for
federal income tax purposes.
INVESTMENT INCOME -- Dividend income less foreign taxes withheld, if any, is
recorded as of the ex-dividend date. Distributions received on securities that
represent a return of capital or capital gain are recorded as a reduction of
cost of investments and/or as a realized gain. The funds estimate the
components of distributions received that may be considered nontaxable
distributions or capital gain distributions for income tax purposes. Interest
income is recorded on the accrual basis and includes accretion of discounts
and amortization of premiums.
FUTURES CONTRACTS -- The funds may enter into futures contracts in order to
manage the funds' exposure to changes in market conditions. One of the risks
of entering into futures contracts is the possibility that the change in value
of the contract may not correlate with the changes in value of the underlying
securities. Upon entering into a futures contract, the funds are required to
deposit either cash or securities in an amount equal to a certain percentage
of the contract value (initial margin). Subsequent payments (variation margin)
are made or received daily, in cash, by the funds. The variation margin is
equal to the daily change in the contract value and is recorded as unrealized
gains
- ------
23
and losses. The funds recognize a realized gain or loss when the contract is
closed or expires. Net realized and unrealized gains or losses occurring
during the holding period of futures contracts are a component of realized
gain (loss) on futures transactions and unrealized appreciation (depreciation)
on futures, respectively.
INCOME TAX STATUS -- It is each fund's policy to distribute substantially all
net investment income and net realized gains to shareholders and to otherwise
qualify as a regulated investment company under provisions of the Internal
Revenue Code. The funds are no longer subject to examination by tax
authorities for years prior to 2004. At this time, management has not
identified any uncertain tax positions for which it is reasonably possible
that the total amounts of unrecognized tax benefits will significantly change
in the next twelve months. Accordingly, no provision has been made for federal
or state income taxes. Interest and penalties associated with any federal or
state income tax obligations, if any, are recorded as interest expense.
DISTRIBUTIONS TO SHAREHOLDERS -- Distributions to shareholders are recorded on
the ex-dividend date. Distributions from net investment income and net
realized gains, if any, are generally declared and paid annually.
INDEMNIFICATIONS -- Under the corporation's organizational documents, its
officers and directors are indemnified against certain liabilities arising out
of the performance of their duties to the funds. In addition, in the normal
course of business, the funds enter into contracts that provide general
indemnifications. The funds' maximum exposure under these arrangements is
unknown as this would involve future claims that may be made against the
funds. The risk of material loss from such claims is considered by management
to be remote.
USE OF ESTIMATES -- The financial statements are prepared in conformity with
accounting principles generally accepted in the United States of America,
which may require management to make certain estimates and assumptions at the
date of the financial statements. Actual results could differ from these
estimates.
2. FEES AND TRANSACTIONS WITH RELATED PARTIES
MANAGEMENT FEES -- The corporation has entered into a Management Agreement
with American Century Investment Management, Inc. (ACIM) (the investment
advisor), under which ACIM provides the funds with investment advisory and
management services in exchange for a single, unified management fee (the fee)
per class. The Agreement provides that all expenses of the funds, except
brokerage commissions, taxes, interest, fees and expenses of those directors
who are not considered "interested persons" as defined in the 1940 Act
(including counsel fees) and extraordinary expenses, will be paid by ACIM. The
fee is computed and accrued daily based on the daily net assets of each
specific class of shares of each fund and paid monthly in arrears. For funds
with a stepped fee schedule, the rate of the fee is determined by applying a
fee rate calculation formula. This formula takes into account all of the
investment advisor's assets under management in each fund's investment
strategy (strategy assets) to calculate the appropriate fee rate for each
fund. The strategy assets include each fund's assets and the assets of other
clients of the investment advisor that are not in the American Century family
of funds, but that have the same investment team and investment strategy. The
annual management fee schedule for Mid Cap Growth ranges from 1.00% to 1.05%
for the Investor Class, A Class, B Class, C Class and R Class. The annual
management fee schedule for Small Cap Growth ranges from 1.10% to 1.30% for
the Investor Class, A Class, B Class, C Class and R Class. The Institutional
Class is 0.20% less at each point within the range.
The effective annual management fee for each class of each fund for the six
months ended April 30, 2008, was as follows:
Investor, A, B, C & R Institutional
Mid Cap Growth 1.05% 0.85%
Small Cap Growth 1.30% 1.10%
ACIM has entered into a Subadvisory Agreement with Mason Street Advisors LLC
(the subadvisor) on behalf of the funds. The subadvisor makes investment
decisions for the funds in accordance with the funds' investment objectives,
policies, and restrictions under the supervision of ACIM and the Board of
Directors. ACIM pays all costs associated with retaining Mason Street as the
subadvisor of the funds.
- ------
24
DISTRIBUTION AND SERVICE FEES -- The Board of Directors has adopted a separate
Master Distribution and Individual Shareholder Services Plan for each of the A
Class, B Class, C Class and R Class (collectively the plans), pursuant to Rule
12b-1 of the 1940 Act. The plans provide that the A Class and the R Class will
pay American Century Investment Services, Inc. (ACIS) an annual distribution
and service fee of 0.25% for the A Class and 0.50% for the R Class. The plans
provide that the B Class and C Class will each pay ACIS an annual distribution
fee of 0.75% and service fee of 0.25%. The fees are computed and accrued daily
based on each class's daily net assets and paid monthly in arrears. The
distribution fee provides compensation for expenses incurred in connection
with distributing shares of the classes including, but not limited to,
payments to brokers, dealers, and financial institutions that have entered
into sales agreements with respect to shares of the funds. The service fee
provides compensation for individual shareholder services rendered by
broker/dealers or other independent financial intermediaries. ACIS voluntarily
waived a portion of the distribution and service fees through March 31, 2008,
by 0.10% for the B Class of Mid Cap Growth and by 0.15% and 0.25% for the A
Class and B Class of Small Cap Growth, respectively. The total amount of the
waivers for the six months ended April 30, 2008, was as follows:
A B
Mid Cap Growth -- $2,154
Small Cap Growth $15,421 $5,233
Fees incurred under the plans during the six months ended April 30, 2008, are
detailed in the Statement of Operations.
RELATED PARTIES -- Certain officers and directors of the corporation are also
officers and/or directors, and, as a group, controlling stockholders of
American Century Companies, Inc. (ACC), the parent of the corporation's
investment advisor, ACIM, the distributor of the corporation, ACIS, and the
corporation's transfer agent, American Century Services, LLC.
Prior to December 12, 2007, the funds had a bank line of credit agreement with
JPMorgan Chase Bank (JPMCB). JPMCB is a custodian of the funds and a wholly
owned subsidiary of JPMorgan Chase & Co. (JPM). JPM is an equity investor in
ACC.
3. INVESTMENT TRANSACTIONS
Investment transactions, excluding short-term investments, for the six months
ended April 30, 2008, were as follows:
Mid Cap Growth Small Cap Growth
Purchases $39,250,157 $20,655,458
Proceeds from sales $40,810,857 $24,434,858
- ------
25
4. CAPITAL SHARE TRANSACTIONS
Transactions in shares of the funds were as follows:
Six months ended Year ended
April 30, 2008 October 31, 2007
Shares Amount Shares Amount
Mid Cap Growth
INVESTOR CLASS/
SHARES AUTHORIZED 55,000,000 55,000,000
=========== ===========
Sold 92,873 $ 1,337,014 53,696 $ 861,276
Issued in reinvestment
of distributions 11,084 157,061 1,253 17,063
Redeemed (29,209) (389,565) (10,923) (161,735)
----------- ------------ ----------- -------------
74,748 1,104,510 44,026 716,604
----------- ------------ ----------- -------------
INSTITUTIONAL CLASS/
SHARES AUTHORIZED 50,000,000 50,000,000
=========== ===========
Issued in reinvestment
of distributions 1,166,226 16,582,782 559,720 7,634,579
----------- ------------ ----------- -------------
A CLASS/
SHARES AUTHORIZED 20,000,000 20,000,000
=========== ===========
Sold 117,688 1,604,996 356,472 5,183,353
Issued in reinvestment
of distributions 205,493 2,897,444 141,971 1,929,392
Redeemed (328,671) (4,541,709) (1,221,667) (17,603,091)
----------- ------------ ----------- -------------
(5,490) (39,269) (723,224) (10,490,346)
----------- ------------ ----------- -------------
B CLASS/
SHARES AUTHORIZED 10,000,000 10,000,000
=========== ===========
Sold 5,556 70,683 36,843 481,205
Issued in reinvestment
of distributions 45,603 591,014 29,049 368,634
Redeemed (50,839) (639,825) (190,268) (2,543,506)
----------- ------------ ----------- -------------
320 21,872 (124,376) (1,693,667)
----------- ------------ ----------- -------------
C CLASS/
SHARES AUTHORIZED 10,000,000 10,000,000
=========== ===========
Sold 1,158 15,080 6,298 91,015
Issued in reinvestment
of distributions 764 10,607 365 4,935
Redeemed (2,477) (33,967) (3,551) (49,016)
----------- ------------ ----------- -------------
(555) (8,280) 3,112 46,934
----------- ------------ ----------- -------------
R CLASS/
SHARES AUTHORIZED 10,000,000 10,000,000
=========== ===========
Sold 401 5,353 6,832 95,371
Issued in reinvestment
of distributions 762 10,685 94 1,280
Redeemed (1,076) (12,796) (1,786) (26,448)
----------- ------------ ----------- -------------
87 3,242 5,140 70,203
----------- ------------ ----------- -------------
Net increase (decrease) 1,235,336 $17,664,857 (235,602) $(3,715,693)
=========== ============ =========== =============
- ------
26
Six months ended Year ended
April 30, 2008 October 31, 2007
Shares Amount Shares Amount
Small Cap Growth
INVESTOR CLASS/
SHARES AUTHORIZED 55,000,000 55,000,000
=========== ===========
Sold 117,790 $ 1,485,277 24,900 $ 414,030
Issued in reinvestment
of distributions 12,377 169,076 2,202 34,247
Redeemed (31,867) (390,450) (8,573) (138,996)
----------- ------------ ----------- -------------
98,300 1,263,903 18,529 309,281
----------- ------------ ----------- -------------
INSTITUTIONAL CLASS/
SHARES AUTHORIZED 50,000,000 50,000,000
=========== ===========
Sold 60,188 757,530 432,499 6,911,741
Issued in reinvestment
of distributions 27,389 375,778 2,388 37,213
Redeemed (134,262) (1,734,408) (58,457) (946,327)
----------- ------------ ----------- -------------
(46,685) (601,100) 376,430 6,002,627
----------- ------------ ----------- -------------
A CLASS/
SHARES AUTHORIZED 20,000,000 20,000,000
=========== ===========
Sold 121,994 1,610,628 278,465 4,485,744
Issued in reinvestment
of distributions 318,209 4,337,860 145,027 2,253,726
Redeemed (397,007) (5,012,639) (1,360,627) (22,092,686)
----------- ------------ ----------- -------------
43,196 935,849 (937,135) (15,353,216)
----------- ------------ ----------- -------------
B CLASS/
SHARES AUTHORIZED 10,000,000 10,000,000
=========== ===========
Sold 5,643 66,111 19,279 290,474
Issued in reinvestment
of distributions 73,823 941,984 26,709 395,563
Redeemed (62,291) (738,633) (134,473) (2,051,933)
----------- ------------ ----------- -------------
17,175 269,462 (88,485) (1,365,896)
----------- ------------ ----------- -------------
C CLASS/
SHARES AUTHORIZED 10,000,000 10,000,000
=========== ===========
Sold 1,470 16,797 3,989 62,568
Issued in reinvestment
of distributions 1,945 26,021 447 6,897
Redeemed (1,721) (19,974) (2,361) (37,369)
----------- ------------ ----------- -------------
1,694 22,844 2,075 32,096
----------- ------------ ----------- -------------
R CLASS/
SHARES AUTHORIZED 10,000,000 10,000,000
=========== ===========
Sold 4,737 60,037 816 12,595
Issued in reinvestment
of distributions 482 6,517 91 1,413
Redeemed (26) (302) (50) (818)
----------- ------------ ----------- -------------
5,193 66,252 857 13,190
----------- ------------ ----------- -------------
Net increase (decrease) 118,873 $ 1,957,210 (627,729) $(10,361,918)
=========== ============ =========== =============
5. BANK LINE OF CREDIT
Effective December 12, 2007, the funds, along with certain other funds managed
by ACIM or American Century Global Investment Management, Inc. (ACGIM), have a
$500,000,000 unsecured bank line of credit agreement with Bank of America,
N.A. Prior to December 12, 2007, the funds, along with certain other funds
managed by ACIM or ACGIM, had a $500,000,000 unsecured bank line of credit
agreement with JPMCB. The funds may borrow money for temporary or emergency
purposes to fund shareholder redemptions. Borrowings under the agreement,
which is subject to annual renewal, bear interest at the Federal Funds rate
plus 0.40%. The funds did not borrow from the line during the six months ended
April 30, 2008.
- ------
27
6. RISK FACTORS
Small Cap Growth concentrates its investments in common stocks of small
companies. Because of this, Small Cap Growth may be subject to greater risk
and market fluctuations than a fund investing in larger, more established
companies.
Small Cap Growth's performance may be affected by investments in initial
public offerings (IPOs). The impact of IPOs on a fund's performance depends on
the strength of the IPO market and the size of the fund. IPOs may have less
impact on a fund's performance as its assets grow.
7. FEDERAL TAX INFORMATION
The book-basis character of distributions made during the year from net
investment income or net realized gains may differ from their ultimate
characterization for federal income tax purposes. These differences reflect
the differing character of certain income items and net realized gains and
losses for financial statement and tax purposes, and may result in
reclassification among certain capital accounts on the financial statements.
As of April 30, 2008, the components of investments for federal income tax
purposes were as follows:
Mid Cap Growth Small Cap Growth
Federal tax cost of investments $167,042,202 $28,564,693
============= =============
Gross tax appreciation of investments $ 38,395,603 $ 4,822,551
Gross tax depreciation of investments (12,635,610) (2,298,561)
------------- -------------
Net tax appreciation (depreciation)
of investments $ 25,759,993 $ 2,523,990
============= =============
The difference between book-basis and tax-basis cost and unrealized
appreciation (depreciation) is attributable primarily to the tax deferral of
losses on wash sales.
8. RECENTLY ISSUED ACCOUNTING STANDARDS
The Financial Accounting Standards Board (FASB) issued Statement of Financial
Accounting Standards No. 157, "Fair Value Measurements" (FAS 157), in
September 2006, which is effective for fiscal years beginning after November
15, 2007. FAS 157 defines fair value, establishes a framework for measuring
fair value and expands the required financial statement disclosures about fair
value measurements. Management is currently evaluating the impact that
adopting FAS 157 will have on the financial statement disclosures.
In March 2008, the FASB issued Statement of Financial Accounting Standards No.
161, "Disclosures about Derivative Instruments and Hedging Activities -- an
amendment of FASB Statement No. 133" (FAS 161). FAS 161 is effective for
fiscal years beginning after November 15, 2008. FAS 161 amends and expands
disclosures about derivative instruments and hedging activities. FAS 161
requires qualitative disclosures about the objectives and strategies of
derivative instruments, quantitative disclosures about the fair value amounts
of and gains and losses on derivative instruments, and disclosures of
credit-risk-related contingent features in hedging activities. Management is
currently evaluating the impact that adopting FAS 161 will have on the
financial statement disclosures.
- ------
28
FINANCIAL HIGHLIGHTS
Mid Cap Growth
Investor Class
For a Share Outstanding Throughout the Years Ended October 31 (except as noted)
2008(1) 2007 2006(2)
PER-SHARE DATA
Net Asset Value, Beginning of Period $16.58 $13.76 $14.78
-------- -------- --------
Income From Investment Operations
Net Investment Income (Loss)(3) (0.03) (0.03) (0.01)
Net Realized and Unrealized
Gain (Loss) (1.38) 3.61 (1.01)
-------- -------- --------
Total From Investment Operations (1.41) 3.58 (1.02)
-------- -------- --------
Distributions
From Net Realized Gains (1.56) (0.76) --
-------- -------- --------
Net Asset Value, End of Period $13.61 $16.58 $13.76
======== ======== ========
TOTAL RETURN(4) (8.89)% 27.19% (6.90)%
RATIOS/SUPPLEMENTAL DATA
Ratio of Operating Expenses
to Average Net Assets 1.05%(5) 1.05% 1.05%(5)
Ratio of Net Investment Income (Loss)
to Average Net Assets (0.39)%(5) (0.19)% (0.19)%(5)
Portfolio Turnover Rate 21% 77% 52%
Net Assets, End of Period
(in thousands) $1,925 $1,105 $311
(1) Six months ended April 30, 2008 (unaudited).
(2) April 3, 2006 (commencement of sale) through October 31, 2006.
(3) Computed using average shares outstanding throughout the period.
(4) Total return assumes reinvestment of net investment income and capital
gains distributions, if any. Total returns for periods less than one year are
not annualized. The total return of the classes may not precisely reflect the
class expense differences because of the impact of calculating the net asset
values to two decimal places. If net asset values were calculated to three
decimal places, the total return differences would more closely reflect the
class expense differences. The calculation of net asset values to two decimal
places is made in accordance with SEC guidelines and does not result in any
gain or loss of value between one class and another.
(5) Annualized.
See Notes to Financial Statements.
- ------
29
Mid Cap Growth
Institutional Class
For a Share Outstanding Throughout the Years Ended October 31 (except as noted)
2008(1) 2007 2006(2)
PER-SHARE DATA
Net Asset Value, Beginning of Period $16.63 $13.78 $14.78
-------- -------- --------
Income From Investment Operations
Net Investment Income (Loss)(3) (0.01) --(4) --(4)
Net Realized and Unrealized
Gain (Loss) (1.39) 3.61 (1.00)
-------- -------- --------
Total From Investment Operations (1.40) 3.61 (1.00)
-------- -------- --------
Distributions
From Net Realized Gains (1.56) (0.76) --
-------- -------- --------
Net Asset Value, End of Period $13.67 $16.63 $13.78
======== ======== ========
TOTAL RETURN(5) (8.80)% 27.38% (6.77)%
RATIOS/SUPPLEMENTAL DATA
Ratio of Operating Expenses
to Average Net Assets 0.85%(6) 0.85% 0.85%(6)
Ratio of Net Investment Income (Loss)
to Average Net Assets (0.19)%(6) 0.01% 0.01%(6)
Portfolio Turnover Rate 21% 77% 52%
Net Assets, End of Period
(in thousands) $161,562 $177,128 $138,986
(1) Six months ended April 30, 2008 (unaudited).
(2) April 3, 2006 (commencement of sale) through October 31, 2006.
(3) Computed using average shares outstanding throughout the period.
(4) Per-share amount was less than $0.005.
(5) Total return assumes reinvestment of net investment income and capital
gains distributions, if any. Total returns for periods less than one year are
not annualized. The total return of the classes may not precisely reflect the
class expense differences because of the impact of calculating the net asset
values to two decimal places. If net asset values were calculated to three
decimal places, the total return differences would more closely reflect the
class expense differences. The calculation of net asset values to two decimal
places is made in accordance with SEC guidelines and does not result in any
gain or loss of value between one class and another.
(6) Annualized.
See Notes to Financial Statements.
- ------
30
Mid Cap Growth
A Class
For a Share Outstanding Throughout the Years Ended October 31 (except as noted)
2008(1) 2007 2006(2) 2006 2005 2004 2003
PER-SHARE DATA
Net Asset Value,
Beginning of Period $16.51 $13.74 $14.83 $13.50 $12.78 $9.83 $12.93
-------- -------- -------- -------- -------- -------- --------
Income From
Investment
Operations
Net Investment
Income
(Loss)(3) (0.04) (0.06) (0.04) (0.01) (0.10) (0.09) (0.09)
Net Realized
and Unrealized
Gain (Loss) (1.38) 3.59 (1.05) 2.65 0.82 3.04 (3.01)
-------- -------- -------- -------- -------- -------- --------
Total From
Investment
Operations (1.42) 3.53 (1.09) 2.64 0.72 2.95 (3.10)
-------- -------- -------- -------- -------- -------- --------
Distributions
From Net
Realized Gains (1.56) (0.76) -- (1.31) -- -- --
-------- -------- -------- -------- -------- -------- --------
Net Asset Value,
End of Period $13.53 $16.51 $13.74 $14.83 $13.50 $12.78 $9.83
======== ======== ======== ======== ======== ======== ========
TOTAL RETURN(4) (9.00)% 26.85% (7.35)% 20.28% 5.63% 30.01% (23.98)%
RATIOS/SUPPLEMENTAL DATA
Ratio of Operating
Expenses to
Average Net Assets 1.30%(5) 1.30% 1.30%(5) 1.29% 1.30%(6) 1.30%(6) 1.30%(6)
Ratio of Operating
Expenses to
Average Net Assets
(Before Expense
Waiver) 1.30%(5) 1.30% 1.30%(5) 1.29% 1.36% 1.40% 1.55%
Ratio of Net
Investment Income
(Loss) to Average
Net Assets (0.64)%(5) (0.44)% (0.44)%(5) (0.08)% (0.79)%(6) (0.74)%(6) (0.86)%(6)
Ratio of Net
Investment Income
(Loss) to Average
Net Assets (Before
Expense Waiver) (0.64)%(5) (0.44)% (0.44)%(5) (0.08)% (0.85)% (0.84)% (1.11)%
Portfolio Turnover
Rate 21% 77% 52% 89% 70% 72% 35%
Net Assets,
End of Period (in
thousands) $26,262 $32,134 $36,675 $193,019 $163,069 $148,862 $105,728
(1) Six months ended April 30, 2008 (unaudited).
(2) April 1, 2006 through October 31, 2006. The fund's fiscal year end was
changed from March 31 to October 31, resulting in a seven-month annual
reporting period. For the years before October 31, 2006, the fund's fiscal
year end was March 31.
(3) Computed using average shares outstanding throughout the period.
(4) Total return assumes reinvestment of net investment income and capital
gains distributions, if any, and does not reflect applicable sales charges.
Total returns for periods less than one year are not annualized. The total
return of the classes may not precisely reflect the class expense differences
because of the impact of calculating the net asset values to two decimal
places. If net asset values were calculated to three decimal places, the total
return differences would more closely reflect the class expense differences.
The calculation of net asset values to two decimal places is made in
accordance with SEC guidelines and does not result in any gain or loss of
value between one class and another.
(5) Annualized.
(6) The investment advisor voluntarily agreed to waive fees and absorb certain
operating expenses.
See Notes to Financial Statements.
- ------
31
Mid Cap Growth
B Class
For a Share Outstanding Throughout the Years Ended October 31 (except as noted)
2008(1) 2007 2006(2) 2006 2005 2004 2003
PER-SHARE DATA
Net Asset Value,
Beginning of
Period $15.33 $12.89 $13.96 $12.86 $12.25 $9.49 $12.55
-------- -------- -------- -------- -------- -------- --------
Income From
Investment
Operations
Net
Investment
Income
(Loss)(3) (0.08) (0.15) (0.08) (0.10) (0.18) (0.16) (0.16)
Net Realized
and
Unrealized
Gain (Loss) (1.28) 3.35 (0.99) 2.51 0.79 2.92 (2.90)
-------- -------- -------- -------- -------- -------- --------
Total From
Investment
Operations (1.36) 3.20 (1.07) 2.41 0.61 2.76 (3.06)
-------- -------- -------- -------- -------- -------- --------
Distributions
From Net
Realized
Gains (1.56) (0.76) -- (1.31) -- -- --
-------- -------- -------- -------- -------- -------- --------
Net Asset Value,
End of Period $12.41 $15.33 $12.89 $13.96 $12.86 $12.25 $9.49
======== ======== ======== ======== ======== ======== ========
TOTAL RETURN(4) (9.32)% 26.02% (7.66)% 19.48% 4.98% 29.08% (24.38)%
RATIOS/SUPPLEMENTAL DATA
Ratio of
Operating
Expenses to
Average Net Assets 1.97%(5)(6) 1.95%(6) 1.95%(5)(6) 1.95%(7) 1.95%(7) 1.95%(7) 1.95%(7)
Ratio of
Operating
Expenses to
Average Net
Assets (Before
Expense Waiver) 2.05%(5) 2.05% 2.05%(5) 2.02% 2.04% 2.05% 2.20%
Ratio of Net
Investment Income
(Loss) to Average
Net Assets (1.31)%(5)(6) (1.09)%(6) (1.09)%(5)(6) (0.78)%(7) (1.44)%(7) (1.40)%(7) (1.52)%(7)
Ratio of Net
Investment Income
(Loss) to Average
Net Assets
(Before Expense
Waiver) (1.39)%(5) (1.19)% (1.19)%(5) (0.85)% (1.53)% (1.50)% (1.77)%
Portfolio
Turnover Rate 21% 77% 52% 89% 70% 72% 35%
Net Assets, End
of Period (in
thousands) $4,843 $5,975 $6,626 $9,032 $9,839 $10,128 $7,978
(1) Six months ended April 30, 2008 (unaudited).
(2) April 1, 2006 through October 31, 2006. The fund's fiscal year end was
changed from March 31 to October 31, resulting in a seven-month annual
reporting period. For the years before October 31, 2006, the fund's fiscal
year end was March 31.
(3) Computed using average shares outstanding throughout the period.
(4) Total return assumes reinvestment of net investment income and capital
gains distributions, if any, and does not reflect applicable sales charges.
Total returns for periods less than one year are not annualized. The total
return of the classes may not precisely reflect the class expense differences
because of the impact of calculating the net asset values to two decimal
places. If net asset values were calculated to three decimal places, the total
return differences would more closely reflect the class expense differences.
The calculation of net asset values to two decimal places is made in
accordance with SEC guidelines and does not result in any gain or loss of
value between one class and another.
(5) Annualized.
(6) Effective April 1, 2006, the distributor voluntarily waived a portion of
its distribution and service fees.
(7) The investment advisor voluntarily agreed to waive fees and absorb certain
operating expenses.
See Notes to Financial Statements.
- ------
32
Mid Cap Growth
C Class
For a Share Outstanding Throughout the Years Ended October 31 (except as noted)
2008(1) 2007 2006(2)
PER-SHARE DATA
Net Asset Value, Beginning of Period $16.31 $13.68 $14.78
-------- -------- --------
Income From Investment Operations
Net Investment Income (Loss)(3) (0.09) (0.17) (0.10)
Net Realized and Unrealized
Gain (Loss) (1.36) 3.56 (1.00)
-------- -------- --------
Total From Investment Operations (1.45) 3.39 (1.10)
-------- -------- --------
Distributions
From Net Realized Gains (1.56) (0.76) --
-------- -------- --------
Net Asset Value, End of Period $13.30 $16.31 $13.68
======== ======== ========
TOTAL RETURN(4) (9.31)% 25.90% (7.44)%
RATIOS/SUPPLEMENTAL DATA
Ratio of Operating Expenses to
Average Net Assets 2.05%(5) 2.05% 2.05%(5)
Ratio of Net Investment Income (Loss)
to Average Net Assets (1.39)%(5) (1.19)% (1.19)%(5)
Portfolio Turnover Rate 21% 77% 52%
Net Assets, End of Period
(in thousands) $131 $170 $100
(1) Six months ended April 30, 2008 (unaudited).
(2) April 3, 2006 (commencement of sale) through October 31, 2006.
(3) Computed using average shares outstanding throughout the period.
(4) Total return assumes reinvestment of net investment income and capital
gains distributions, if any, and does not reflect applicable sales charges.
Total returns for periods less than one year are not annualized. The total
return of the classes may not precisely reflect the class expense differences
because of the impact of calculating the net asset values to two decimal
places. If net asset values were calculated to three decimal places, the total
return differences would more closely reflect the class expense differences.
The calculation of net asset values to two decimal places is made in
accordance with SEC guidelines and does not result in any gain or loss of
value between one class and another.
(5) Annualized.
See Notes to Financial Statements.
- ------
33
Mid Cap Growth
R Class
For a Share Outstanding Throughout the Years Ended October 31 (except as noted)
2008(1) 2007 2006(2)
PER-SHARE DATA
Net Asset Value, Beginning of Period $16.44 $13.72 $14.78
-------- -------- --------
Income From Investment Operations
Net Investment Income (Loss)(3) (0.06) (0.10) (0.06)
Net Realized and Unrealized
Gain (Loss) (1.37) 3.58 (1.00)
-------- -------- --------
Total From Investment Operations (1.43) 3.48 (1.06)
-------- -------- --------
Distributions
From Net Realized Gains (1.56) (0.76) --
-------- -------- --------
Net Asset Value, End of Period $13.45 $16.44 $13.72
======== ======== ========
TOTAL RETURN(4) (9.11)% 26.51% (7.17)%
RATIOS/SUPPLEMENTAL DATA
Ratio of Operating Expenses
to Average Net Assets 1.55%(5) 1.55% 1.55%(5)
Ratio of Net Investment Income (Loss)
to Average Net Assets (0.89)%(5) (0.69)% (0.69)%(5)
Portfolio Turnover Rate 21% 77% 52%
Net Assets, End of Period (in thousands) $93 $112 $23
(1) Six months ended April 30, 2008 (unaudited).
(2) April 3, 2006 (commencement of sale) through October 31, 2006.
(3) Computed using average shares outstanding throughout the period.
(4) Total return assumes reinvestment of net investment income and capital
gains distributions, if any. Total returns for periods less than one year are
not annualized. The total return of the classes may not precisely reflect the
class expense differences because of the impact of calculating the net asset
values to two decimal places. If net asset values were calculated to three
decimal places, the total return differences would more closely reflect the
class expense differences. The calculation of net asset values to two decimal
places is made in accordance with SEC guidelines and does not result in any
gain or loss of value between one class and another.
(5) Annualized.
See Notes to Financial Statements.
- ------
34
Small Cap Growth
Investor Class
For a Share Outstanding Throughout the Years Ended October 31 (except as noted)
2008(1) 2007 2006(2)
PER-SHARE DATA
Net Asset Value, Beginning of Period $18.26 $16.03 $16.86
-------- -------- --------
Income From Investment Operations
Net Investment Income (Loss)(3) (0.05) (0.11) (0.06)
Net Realized and Unrealized
Gain (Loss) (3.55) 3.29 (0.77)
-------- -------- --------
Total From Investment Operations (3.60) 3.18 (0.83)
-------- -------- --------
Distributions
From Net Realized Gains (2.76) (0.95) --
-------- -------- --------
Net Asset Value, End of Period $11.90 $18.26 $16.03
======== ======== ========
TOTAL RETURN(4) (21.73)% 20.93% (4.92)%
RATIOS/SUPPLEMENTAL DATA
Ratio of Operating Expenses
to Average Net Assets 1.30%(5) 1.30% 1.30%(5)
Ratio of Net Investment Income (Loss)
to Average Net Assets (0.87)%(5) (0.66)% (0.80)%(5)
Portfolio Turnover Rate 60% 119% 42%
Net Assets, End of Period (in thousands) $1,825 $1,007 $587
(1) Six months ended April 30, 2008 (unaudited).
(2) April 3, 2006 (commencement of sale) through October 31, 2006.
(3) Computed using average shares outstanding throughout the period.
(4) Total return assumes reinvestment of net investment income and capital
gains distributions, if any. Total returns for periods less than one year are
not annualized. The total return of the classes may not precisely reflect the
class expense differences because of the impact of calculating the net asset
values to two decimal places. If net asset values were calculated to three
decimal places, the total return differences would more closely reflect the
class expense differences. The calculation of net asset values to two decimal
places is made in accordance with SEC guidelines and does not result in any
gain or loss of value between one class and another.
(5) Annualized.
See Notes to Financial Statements.
- ------
35
Small Cap Growth
Institutional Class
For a Share Outstanding Throughout the Years Ended October 31 (except as noted)
2008(1) 2007 2006(2)
PER-SHARE DATA
Net Asset Value, Beginning of Period $18.33 $16.05 $16.86
-------- -------- --------
Income From Investment Operations
Net Investment Income (Loss)(3) (0.04) (0.08) (0.05)
Net Realized and Unrealized
Gain (Loss) (3.57) 3.31 (0.76)
-------- -------- --------
Total From Investment Operations (3.61) 3.23 (0.81)
-------- -------- --------
Distributions
From Net Realized Gains (2.76) (0.95) --
-------- -------- --------
Net Asset Value, End of Period $11.96 $18.33 $16.05
======== ======== ========
TOTAL RETURN(4) (21.65)% 21.16% (4.80)%
RATIOS/SUPPLEMENTAL DATA
Ratio of Operating Expenses
to Average Net Assets 1.10%(5) 1.10% 1.10%(5)
Ratio of Net Investment Income (Loss)
to Average Net Assets (0.67)%(5) (0.46)% (0.60)%(5)
Portfolio Turnover Rate 60% 119% 42%
Net Assets, End of Period (in thousands) $4,812 $8,230 $1,166
(1) Six months ended April 30, 2008 (unaudited).
(2) April 3, 2006 (commencement of sale) through October 31, 2006.
(3) Computed using average shares outstanding throughout the period.
(4) Total return assumes reinvestment of net investment income and capital
gains distributions, if any. Total returns for periods less than one year are
not annualized. The total return of the classes may not precisely reflect the
class expense differences because of the impact of calculating the net asset
values to two decimal places. If net asset values were calculated to three
decimal places, the total return differences would more closely reflect the
class expense differences. The calculation of net asset values to two decimal
places is made in accordance with SEC guidelines and does not result in any
gain or loss of value between one class and another.
(5) Annualized.
See Notes to Financial Statements.
- ------
36
Small Cap Growth
A Class
For a Share Outstanding Throughout the Years Ended October 31 (except as noted)
2008(1) 2007 2006(2) 2006 2005 2004 2003
PER-SHARE DATA
Net Asset Value,
Beginning of
Period $18.23 $16.02 $17.02 $15.27 $14.38 $10.11 $13.38
-------- -------- -------- -------- -------- -------- --------
Income From
Investment
Operations
Net
Investment
Income
(Loss)(3) (0.07) (0.12) (0.08) (0.14) (0.15) (0.15) (0.12)
Net Realized
and
Unrealized
Gain (Loss) (3.54) 3.28 (0.92) 3.53 1.75 4.42 (3.15)
-------- -------- -------- -------- -------- -------- --------
Total From
Investment
Operations (3.61) 3.16 (1.00) 3.39 1.60 4.27 (3.27)
-------- -------- -------- -------- -------- -------- --------
Distributions
From Net
Realized
Gains (2.76) (0.95) -- (1.64) (0.71) -- --
-------- -------- -------- -------- -------- -------- --------
Net Asset Value,
End of Period $11.86 $18.23 $16.02 $17.02 $15.27 $14.38 $10.11
======== ======== ======== ======== ======== ======== ========
TOTAL RETURN(4) (21.79)% 20.75% (5.88)% 23.08% 10.99% 42.24% (24.44)%
RATIOS/SUPPLEMENTAL DATA
Ratio of
Operating
Expenses to
Average Net Assets 1.42%(5)(6) 1.40%(6) 1.40%(5)(6) 1.40%(7) 1.40%(7) 1.40%(7) 1.40%(7)
Ratio of
Operating
Expenses to
Average Net
Assets (Before
Expense Waiver) 1.55%(5) 1.55% 1.55%(5) 1.86% 2.03% 2.21% 2.29%
Ratio of Net
Investment Income
(Loss) to Average
Net Assets (0.99)%(5)(6) (0.76)%(6) (0.90)%(5)(6) (0.82)%(7) (1.05)%(7) (1.16)%(7) (1.10)%(7)
Ratio of Net
Investment Income
(Loss) to Average
Net Assets
(Before Expense
Waiver) (1.12)%(5) (0.91)% (1.05)%(5) (1.28)% (1.68)% (1.97)% (1.99)%
Portfolio
Turnover Rate 60% 119% 42% 81% 86% 98% 49%
Net Assets, End
of Period (in
thousands) $20,343 $30,483 $41,798 $55,085 $33,791 $23,914 $14,623
(1) Six months ended April 30, 2008 (unaudited).
(2) April 1, 2006 through October 31, 2006. The fund's fiscal year end was
changed from March 31 to October 31, resulting in a seven-month annual
reporting period. For the years before October 31, 2006, the fund's fiscal
year end was March 31.
(3) Computed using average shares outstanding throughout the period.
(4) Total return assumes reinvestment of net investment income and capital
gains distributions, if any, and does not reflect applicable sales charges.
Total returns for periods less than one year are not annualized. The total
return of the classes may not precisely reflect the class expense differences
because of the impact of calculating the net asset values to two decimal
places. If net asset values were calculated to three decimal places, the total
return differences would more closely reflect the class expense differences.
The calculation of net asset values to two decimal places is made in
accordance with SEC guidelines and does not result in any gain or loss of
value between one class and another.
(5) Annualized.
(6) Effective April 1, 2006, the distributor voluntarily waived a portion of
its distribution and service fees.
(7) The investment advisor voluntarily agreed to waive fees and absorb certain
operating expenses.
See Notes to Financial Statements.
- ------
37
Small Cap Growth
B Class
For a Share Outstanding Throughout the Years Ended October 31 (except as noted)
2008(1) 2007 2006(2) 2006 2005 2004 2003
PER-SHARE DATA
Net Asset Value,
Beginning of
Period $17.28 $15.32 $16.34 $14.81 $14.06 $9.95 $13.25
-------- -------- -------- -------- -------- -------- --------
Income From
Investment
Operations
Net
Investment
Income
(Loss)(3) (0.10) (0.22) (0.14) (0.24) (0.24) (0.23) (0.19)
Net Realized
and
Unrealized
Gain (Loss) (3.34) 3.13 (0.88) 3.41 1.70 4.34 (3.11)
-------- -------- -------- -------- -------- -------- --------
Total From
Investment
Operations (3.44) 2.91 (1.02) 3.17 1.46 4.11 (3.30)
-------- -------- -------- -------- -------- -------- --------
Distributions
From Net
Realized
Gains (2.76) (0.95) -- (1.64) (0.71) -- --
-------- -------- -------- -------- -------- -------- --------
Net Asset Value,
End of Period $11.08 $17.28 $15.32 $16.34 $14.81 $14.06 $9.95
======== ======== ======== ======== ======== ======== ========
TOTAL RETURN(4) (22.03)% 20.02% (6.24)% 22.29% 10.23% 41.31% (24.91)%
RATIOS/SUPPLEMENTAL DATA
Ratio of
Operating
Expenses to
Average
Net Assets 2.09%(5)(6) 2.05%(6) 2.05%(5)(6) 2.05%(7) 2.05%(7) 2.05%(7) 2.05%(7)
Ratio of
Operating
Expenses to
Average Net
Assets (Before
Expense Waiver) 2.30%(5) 2.30% 2.30%(5) 2.51% 2.68% 2.86% 2.94%
Ratio of Net
Investment Income
(Loss) to Average
Net Assets (1.66)%(5)(6) (1.41)%(6) (1.55)%(5)(6) (1.48)%(7) (1.70)%(7) (1.81)%(7) (1.74)%(7)
Ratio of Net
Investment Income
(Loss) to Average
Net Assets
(Before Expense
Waiver) (1.87)%(5) (1.66)% (1.80)%(5) (1.94)% (2.33)% (2.62)% (2.63)%
Portfolio
Turnover Rate 60% 119% 42% 81% 86% 98% 49%
Net Assets, End
of Period (in
thousands) $4,186 $6,233 $6,884 $8,284 $6,986 $6,066 $3,674
(1) Six months ended April 30, 2008 (unaudited).
(2) April 1, 2006 through October 31, 2006. The fund's fiscal year end was
changed from March 31 to October 31, resulting in a seven-month annual
reporting period. For the years before October 31, 2006, the fund's fiscal
year end was March 31.
(3) Computed using average shares outstanding throughout the period.
(4) Total return assumes reinvestment of net investment income and capital
gains distributions, if any, and does not reflect applicable sales charges.
Total returns for periods less than one year are not annualized. The total
return of the classes may not precisely reflect the class expense differences
because of the impact of calculating the net asset values to two decimal
places. If net asset values were calculated to three decimal places, the total
return differences would more closely reflect the class expense differences.
The calculation of net asset values to two decimal places is made in
accordance with SEC guidelines and does not result in any gain or loss of
value between one class and another.
(5) Annualized.
(6) Effective April 1, 2006, the distributor voluntarily waived a portion of
its distribution and service fees.
(7) The investment advisor voluntarily agreed to waive fees and absorb certain
operating expenses.
See Notes to Financial Statements.
- ------
38
Small Cap Growth
C Class
For a Share Outstanding Throughout the Years Ended October 31 (except as noted)
2008(1) 2007 2006(2)
PER-SHARE DATA
Net Asset Value, Beginning of Period $17.97 $15.94 $16.86
-------- -------- --------
Income From Investment Operations
Net Investment Income (Loss)(3) (0.12) (0.27) (0.16)
Net Realized and Unrealized
Gain (Loss) (3.49) 3.25 (0.76)
-------- -------- --------
Total From Investment Operations (3.61) 2.98 (0.92)
-------- -------- --------
Distributions
From Net Realized Gains (2.76) (0.95) --
-------- -------- --------
Net Asset Value, End of Period $11.60 $17.97 $15.94
======== ======== ========
TOTAL RETURN(4) (22.15)% 19.67% (5.46)%
RATIOS/SUPPLEMENTAL DATA
Ratio of Operating Expenses
to Average Net Assets 2.30%(5) 2.30% 2.30%(5)
Ratio of Net Investment Income (Loss)
to Average Net Assets (1.87)%(5) (1.66)% (1.80)%(5)
Portfolio Turnover Rate 60% 119% 42%
Net Assets, End of Period (in thousands) $129 $170 $118
(1) Six months ended April 30, 2008 (unaudited).
(2) April 3, 2006 (commencement of sale) through October 31, 2006.
(3) Computed using average shares outstanding throughout the period.
(4) Total return assumes reinvestment of net investment income and capital
gains distributions, if any, and does not reflect applicable sales charges.
Total returns for periods less than one year are not annualized. The total
return of the classes may not precisely reflect the class expense differences
because of the impact of calculating the net asset values to two decimal
places. If net asset values were calculated to three decimal places, the total
return differences would more closely reflect the class expense differences.
The calculation of net asset values to two decimal places is made in
accordance with SEC guidelines and does not result in any gain or loss of
value between one class and another.
(5) Annualized.
See Notes to Financial Statements.
- ------
39
Small Cap Growth
R Class
For a Share Outstanding Throughout the Years Ended October 31 (except as noted)
2008(1) 2007 2006(2)
PER-SHARE DATA
Net Asset Value, Beginning of Period $18.12 $15.98 $16.86
-------- -------- --------
Income From Investment Operations
Net Investment Income (Loss)(3) (0.08) (0.19) (0.12)
Net Realized and Unrealized
Gain (Loss) (3.53) 3.28 (0.76)
-------- -------- --------
Total From Investment Operations (3.61) 3.09 (0.88)
-------- -------- --------
Distributions
From Net Realized Gains (2.76) (0.95) --
-------- -------- --------
Net Asset Value, End of Period $11.75 $18.12 $15.98
======== ======== ========
TOTAL RETURN(4) (21.94)% 20.34% (5.22)%
RATIOS/SUPPLEMENTAL DATA
Ratio of Operating Expenses
to Average Net Assets 1.80%(5) 1.80% 1.80%(5)
Ratio of Net Investment Income (Loss)
to Average Net Assets (1.37)%(5) (1.16)% (1.30)%(5)
Portfolio Turnover Rate 60% 119% 42%
Net Assets, End of Period (in thousands) $89 $42 $24
(1) Six months ended April 30, 2008 (unaudited).
(2) April 3, 2006 (commencement of sale) through October 31, 2006.
(3) Computed using average shares outstanding throughout the period.
(4) Total return assumes reinvestment of net investment income and capital
gains distributions, if any. Total returns for periods less than one year are
not annualized. The total return of the classes may not precisely reflect the
class expense differences because of the impact of calculating the net asset
values to two decimal places. If net asset values were calculated to three
decimal places, the total return differences would more closely reflect the
class expense differences. The calculation of net asset values to two decimal
places is made in accordance with SEC guidelines and does not result in any
gain or loss of value between one class and another.
(5) Annualized.
See Notes to Financial Statements.
- ------
40
ADDITIONAL INFORMATION
RETIREMENT ACCOUNT INFORMATION
As required by law, any distributions you receive from an IRA or certain
403(b), 457 and qualified plans [those not eligible for rollover to an IRA or
to another qualified plan] are subject to federal income tax withholding,
unless you elect not to have withholding apply. Tax will be withheld on the
total amount withdrawn even though you may be receiving amounts that are not
subject to withholding, such as nondeductible contributions. In such case,
excess amounts of withholding could occur. You may adjust your withholding
election so that a greater or lesser amount will be withheld.
If you don't want us to withhold on this amount, you must notify us to not
withhold the federal income tax. Even if you plan to roll over the amount you
withdraw to another tax-deferred account, the withholding rate still applies
to the withdrawn amount unless we have received notice not to withhold federal
income tax prior to the withdrawal. You may notify us in writing or in certain
situations by telephone or through other electronic means. You have the right
to revoke your withholding election at any time and any election you make may
remain in effect until revoked by filing a new election.
Remember, even if you elect not to have income tax withheld, you are liable
for paying income tax on the taxable portion of your withdrawal. If you elect
not to have income tax withheld or you don't have enough income tax withheld,
you may be responsible for payment of estimated tax. You may incur penalties
under the estimated tax rules if your withholding and estimated tax payments
are not sufficient.
State tax will be withheld if, at the time of your distribution, your address
is within one of the mandatory withholding states and you have federal income
tax withheld. State taxes will be withheld from your distribution in
accordance with the respective state rules.
PROXY VOTING GUIDELINES
American Century Investment Management, Inc., the funds' investment advisor,
is responsible for exercising the voting rights associated with the securities
purchased and/or held by the funds. A description of the policies and
procedures the advisor uses in fulfilling this responsibility is available
without charge, upon request, by calling 1-800-345-2021. It is also available
on American Century Investments' website at americancentury.com and on the
Securities and Exchange Commission's website at sec.gov. Information regarding
how the investment advisor voted proxies relating to portfolio securities
during the most recent 12-month period ended June 30 is available on the
"About Us" page at americancentury.com. It is also available at sec.gov.
QUARTERLY PORTFOLIO DISCLOSURE
The funds file their complete schedule of portfolio holdings with the
Securities and Exchange Commission (SEC) for the first and third quarters of
each fiscal year on Form N-Q. The funds' Forms N-Q are available on the SEC's
website at sec.gov, and may be reviewed and copied at the SEC's Public
Reference Room in Washington, DC. Information on the operation of the Public
Reference Room may be obtained by calling 1-800-SEC-0330. The funds also make
their complete schedule of portfolio holdings for the most recent quarter of
their fiscal year available on their website at americancentury.com and, upon
request, by calling 1-800-345-2021.
- ------
41
INDEX DEFINITIONS
The following indices are used to illustrate investment market, sector, or
style performance or to serve as fund performance comparisons. They are not
investment products available for purchase.
The RUSSELL 1000® INDEX is a market-capitalization weighted, large-cap index
created by Frank Russell Company to measure the performance of the 1,000
largest of the 3,000 largest publicly traded U.S. companies, based on total
market capitalization.
The RUSSELL 1000® GROWTH INDEX measures the performance of those Russell 1000
Index companies (the 1,000 largest of the 3,000 largest publicly traded U.S.
companies, based on total market capitalization) with higher price-to-book
ratios and higher forecasted growth values.
The RUSSELL 1000® VALUE INDEX measures the performance of those Russell 1000
Index companies (the 1,000 largest of the 3,000 largest publicly traded U.S.
companies, based on total market capitalization) with lower price-to-book
ratios and lower forecasted growth values.
The RUSSELL 2000® INDEX is a market-capitalization weighted index created by
Frank Russell Company to measure the performance of the 2,000 smallest of the
3,000 largest publicly traded U.S. companies, based on total market
capitalization.
The RUSSELL 2000® GROWTH INDEX measures the performance of those Russell 2000
Index companies (the 2,000 smallest of the 3,000 largest publicly traded U.S.
companies, based on total market capitalization) with higher price-to-book
ratios and higher forecasted growth values.
The RUSSELL 2000® VALUE INDEX measures the performance of those Russell 2000
Index companies (the 2,000 smallest of the 3,000 largest publicly traded U.S.
companies, based on total market capitalization) with lower price-to-book
ratios and lower forecasted growth values.
The RUSSELL MIDCAP® INDEX measures the performance of the 800 smallest of the
1,000 largest publicly traded U.S. companies, based on total market
capitalization.
The RUSSELL MIDCAP® GROWTH INDEX measures the performance of those Russell
Midcap Index companies (the 800 smallest of the 1,000 largest publicly traded
U.S. companies, based on total market capitalization) with higher
price-to-book ratios and higher forecasted growth values.
The RUSSELL MIDCAP® VALUE INDEX measures the performance of those Russell
Midcap Index companies (the 800 smallest of the 1,000 largest publicly traded
U.S. companies, based on total market capitalization) with lower price-to-book
ratios and lower forecasted growth values.
The S&P MIDCAP 400 INDEX, a capitalization-weighted index consisting of 400
domestic stocks, measures the performance of the mid-size company segment of
the U.S. market.
The S&P SMALLCAP 600 INDEX, a capitalization-weighted index consisting of 600
domestic stocks, measures the small company segment of the U.S. market.
- ------
42
NOTES
- ------
43
NOTES
- ------
44
[back cover]
[american century investments logo and text logo ®]
CONTACT US
AMERICANCENTURY.COM
AUTOMATED INFORMATION LINE . . . . . . . . . . . . . . . 1-800-345-8765
INVESTOR SERVICES REPRESENTATIVE . . . . . . . . . . . . 1-800-345-2021 or
816-531-5575
INVESTORS USING ADVISORS . . . . . . . . . . . . . . . . 1-800-378-9878
BUSINESS, NOT-FOR-PROFIT, EMPLOYER-SPONSORED
RETIREMENT PLANS . . . . . . . . . . . . . . . . . . . . 1-800-345-3533
BANKS AND TRUST COMPANIES, BROKER-DEALERS,
FINANCIAL PROFESSIONALS, INSURANCE COMPANIES . . . . . . 1-800-345-6488
TELECOMMUNICATIONS DEVICE FOR THE DEAF . . . . . . . . . 1-800-634-4113
AMERICAN CENTURY MUTUAL FUNDS, INC.
INVESTMENT ADVISOR:
American Century Investment Management, Inc.
Kansas City, Missouri
This report and the statements it contains are submitted for the general
information of our shareholders. The report is not authorized for distribution to
prospective investors unless preceded or accompanied by an effective prospectus.
American Century Investment Services, Inc., Distributor
©2008 American Century Proprietary Holdings, Inc. All rights reserved.
0806
CL-SAN-60505N
ITEM 2. CODE OF ETHICS.
Not applicable for semiannual report filings.
ITEM 3. AUDIT COMMITTEE FINANCIAL EXPERT.
Not applicable for semiannual report filings.
ITEM 4. PRINCIPAL ACCOUNTANT FEES AND SERVICES.
Not applicable for semiannual report filings.
ITEM 5. AUDIT COMMITTEE OF LISTED REGISTRANTS.
Not applicable.
ITEM 6. INVESTMENTS.
(a) The schedule of investments is included as part of the report to
stockholders filed under Item 1 of this Form.
(b) Not applicable.
ITEM 7. DISCLOSURE OF PROXY VOTING POLICIES AND PROCEDURES FOR CLOSED-END
MANAGEMENT INVESTMENT COMPANIES.
Not applicable.
ITEM 8. PORTFOLIO MANAGERS OF CLOSED-END MANAGEMENT INVESTMENT COMPANIES.
Not applicable.
ITEM 9. PURCHASES OF EQUITY SECURITIES BY CLOSED-END MANAGEMENT INVESTMENT
COMPANY AND AFFILIATED PURCHASERS.
Not applicable.
ITEM 10. SUBMISSION OF MATTERS TO A VOTE OF SECURITY HOLDERS.
During the reporting period, there were no material changes to the procedures by
which shareholders may recommend nominees to the registrant's board.
ITEM 11. CONTROLS AND PROCEDURES.
(a) The registrant's principal executive officer and principal financial
officer have concluded that the registrant's disclosure controls and
procedures (as defined in Rule 30a-3(c) under the Investment Company Act of
1940) are effective based on their evaluation of these controls and
procedures as of a date within 90 days of the filing date of this report.
(b) There were no changes in the registrant's internal control over financial
reporting (as defined in Rule 30a-3(d) under the Investment Company Act of
1940) that occurred during the registrant's second fiscal quarter of the
period covered by this report that have materially affected, or are
reasonably likely to materially affect, the registrant's internal control
over financial reporting.
ITEM 12. EXHIBITS.
(a)(1) Not applicable for semiannual report filings.
(a)(2) Separate certifications by the registrant's principal executive officer
and principal financial officer, pursuant to Section 302 of the
Sarbanes-Oxley Act of 2002 and Rule 30a-2(a) under the Investment
Company Act of 1940, are filed and attached hereto as Exhibit
99.302CERT.
(a)(3) Not applicable.
(b) A certification by the registrant's chief executive officer and chief
financial officer, pursuant to Section 906 of the Sarbanes-Oxley Act of
2002, is furnished and attached hereto as Exhibit 99.906CERT.
SIGNATURES
Pursuant to the requirements of the Securities Exchange Act of 1934 and the
Investment Company Act of 1940, the registrant has duly caused this report to be
signed on its behalf by the undersigned, thereunto duly authorized.
Registrant: AMERICAN CENTURY MUTUAL FUNDS, INC.
By: /s/ Jonathan S. Thomas
--------------------------------------------------
Name: Jonathan S. Thomas
Title: President
Date: June 24, 2008
Pursuant to the requirements of the Securities Exchange Act of 1934 and the
Investment Company Act of 1940, this report has been signed below by the
following persons on behalf of the registrant and in the capacities and on the
dates indicated.
By: /s/ Jonathan S. Thomas
---------------------------------------------------
Name: Jonathan S. Thomas
Title: President
(principal executive officer)
Date: June 24, 2008
By: /s/ Robert J. Leach
---------------------------------------------------
Name: Robert J. Leach
Title: Vice President, Treasurer, and
Chief Financial Officer
(principal financial officer)
Date: June 24, 2008