UNITED STATES
SECURITIES AND EXCHANGE COMMISSION
Washington, D.C. 20549
FORM N-CSR
CERTIFIED SHAREHOLDER REPORT OF REGISTERED
MANAGEMENT INVESTMENT COMPANIES
|
| | | | | | |
| Investment Company Act file number | 811-00816 |
| | |
| AMERICAN CENTURY MUTUAL FUNDS, INC. |
| (Exact name of registrant as specified in charter) |
| | |
| 4500 MAIN STREET, KANSAS CITY, MISSOURI | 64111 |
| (Address of principal executive offices) | (Zip Code) |
| | |
CHARLES A. ETHERINGTON 4500 MAIN STREET, KANSAS CITY, MISSOURI 64111 |
| (Name and address of agent for service) |
| | |
| Registrant’s telephone number, including area code: | 816-531-5575 |
| | |
| Date of fiscal year end: | 10-31 |
| | |
| Date of reporting period: | 10-31-2014 |
ITEM 1. REPORTS TO STOCKHOLDERS.
|
| |
| ANNUAL REPORT | OCTOBER 31, 2014 |
All Cap Growth Fund
|
| |
| President’s Letter | |
| Performance | |
| Portfolio Commentary | |
| Fund Characteristics | |
| Shareholder Fee Example | |
| Schedule of Investments | |
| Statement of Assets and Liabilities | |
| Statement of Operations | |
| Statement of Changes in Net Assets | |
| Notes to Financial Statements | |
| Financial Highlights | |
| Report of Independent Registered Public Accounting Firm | |
| Management | |
| Approval of Management Agreement | |
| Additional Information | |
Any opinions expressed in this report reflect those of the author as of the date of the report, and do not necessarily represent the opinions of American Century Investments® or any other person in the American Century Investments organization. Any such opinions are subject to change at any time based upon market or other conditions and American Century Investments disclaims any responsibility to update such opinions. These opinions may not be relied upon as investment advice and, because investment decisions made by American Century Investments funds are based on numerous factors, may not be relied upon as an indication of trading intent on behalf of any American Century Investments fund. Security examples are used for representational purposes only and are not intended as recommendations to purchase or sell securities. Performance information for comparative indices and securities is provided to American Century Investments by third party vendors. To the best of American Century Investments’ knowledge, such information is accurate at the time of printing.
|
| |
| Dear Investor:
Thank you for reviewing this annual report for the 12 months ended October 31, 2014. It provides investment performance and portfolio information for the reporting period, plus longer-term historical performance data.
Annual reports remain important vehicles for conveying information about fund returns, including market and economic factors that affected performance during the reporting period. For additional, updated investment and market insights, we encourage you to visit our website, americancentury.com. |
| Jonathan Thomas |
Favorable Fiscal Year for U.S. Stocks and Bonds
Mostly stimulative monetary policies by central banks and expectations of longer-term economic improvement, interspersed with concerns about nearer-term weaker-than-expected global economic data and geopolitical conflicts, helped drive financial market returns during the reporting period. We believe the combination of longer-term optimism about U.S. economic growth, low costs of capital, and continued central bank stimulus (even as the U.S. Federal Reserve’s latest monthly bond purchase program ended) helped persuade investors to seek risk and yield, which benefited U.S. stocks and bonds. The S&P 500 Index gained 17.27% during the 12 months. The 30-year U.S. Treasury bond was close behind, returning 15.44%, according to Barclays. U.S. real estate investment trusts (REITs), whose shares combine performance attributes of stocks and bonds, benefited from both—the MSCI U.S. REIT Index advanced 19.19%.
U.S. market benchmark returns generally outpaced their non-U.S. counterparts. The U.S. was perceived by investors as a relative bastion of growth, stability, and potentially attractive yields compared with most of the rest of the world, so capital flows generally favored U.S. assets. These capital flows, along with weaker-than-expected global growth, lower-than-expected global inflation, and falling commodity and energy prices, helped keep long-term interest rates and other corporate costs low. U.S. stocks just completed a solid third-quarter earnings reporting season, though questions remain about next year’s revenues, given this year’s slowdown in global economic growth and concerns about how far it could extend into 2015.
We believe continuing global economic and geopolitical uncertainties could continue to support the relative appeal of U.S. assets in coming months. But the end of the U.S. Federal Reserve’s monthly bond-buying program and the still-looming possibility of higher interest rates in 2015 point to potential U.S. market volatility ahead. In this environment, we continue to believe in a disciplined, diversified, long-term investment approach, using professionally managed stock and bond portfolios for meeting financial goals. We appreciate your continued trust in us.
Sincerely,
Jonathan Thomas
President and Chief Executive Officer
American Century Investments
|
| | | | | | |
| Total Returns as of October 31, 2014 |
| | | | Average Annual Returns | |
| | Ticker Symbol | 1 year | 5 years | 10 years | Since Inception | Inception Date |
| Investor Class | TWGTX | 11.50% | 15.99% | 12.27% | 11.60% | 11/25/83 |
| Russell 3000 Growth Index | — | 16.39% | 17.51% | 9.08% | 10.01%(1) | — |
| Institutional Class | ACAJX | 11.71% | — | — | 19.67% | 9/30/11 |
| A Class | ACAQX | | | | | 9/30/11 |
| No sales charge* | | 11.22% | — | — | 19.15% | |
| With sales charge* | | 4.83% | — | — | 16.89% | |
| C Class | ACAHX | 10.40% | — | — | 18.25% | 9/30/11 |
| R Class | ACAWX | 10.93% | — | — | 18.84% | 9/30/11 |
| |
| * | Sales charges include initial sales charges and contingent deferred sales charges (CDSCs), as applicable. A Class shares have a 5.75% maximum initial sales charge and may be subject to a maximum CDSC of 1.00%. C Class shares redeemed within 12 months of purchase are subject to a maximum CDSC of 1.00%. The SEC requires that mutual funds provide performance information net of maximum sales charges in all cases where charges could be applied. |
| |
| (1) | Since November 30, 1983, the date nearest the Investor Class’s inception for which data are available. |
Data presented reflect past performance. Past performance is no guarantee of future results. Current performance may be higher or lower than the performance shown. Investment return and principal value will fluctuate, and redemption value may be more or less than original cost. Data assumes reinvestment of dividends and capital gains, and none of the charts reflect the deduction of taxes that a shareholder would pay on fund distributions or the redemption of fund shares. To obtain performance data current to the most recent month end, please call 1-800-345-2021 or visit americancentury.com. For additional information about the fund, please consult the prospectus.
|
|
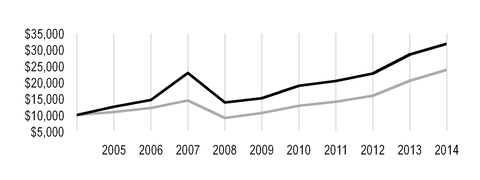
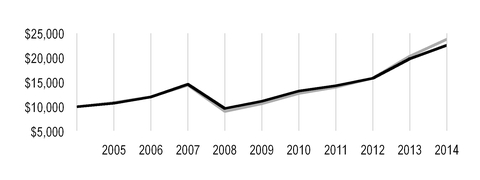
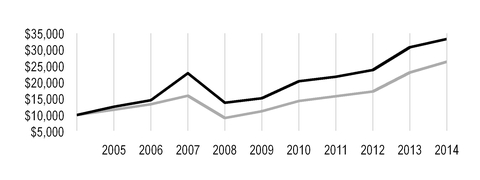
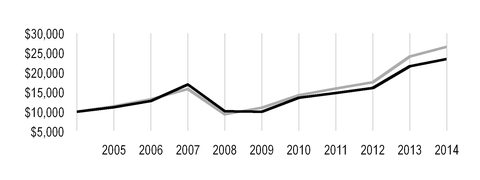
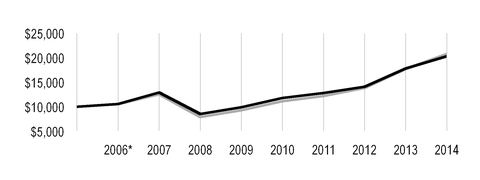
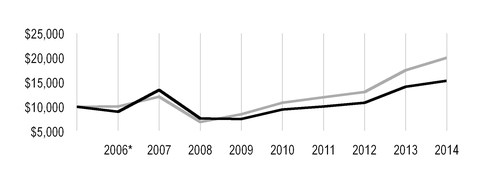
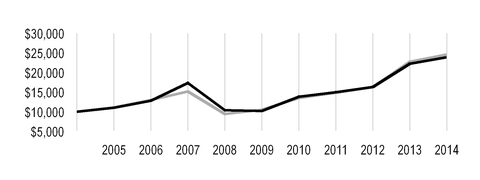
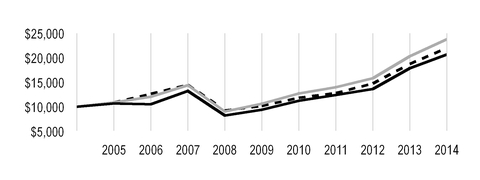
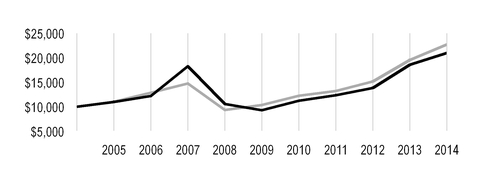
| Growth of $10,000 Over 10 Years |
| $10,000 investment made October 31, 2004 |
| Performance for other share classes will vary due to differences in fee structure. |
|
| |
| Value on October 31, 2014 |
| | Investor Class — $31,843 |
| |
| | Russell 3000 Growth Index — $23,863 |
| |
|
| | | | |
| Total Annual Fund Operating Expenses |
| Investor Class | Institutional Class | A Class | C Class | R Class |
| 1.00% | 0.80% | 1.25% | 2.00% | 1.50% |
The total annual fund operating expenses shown is as stated in the fund’s prospectus current as of the date of this report. The prospectus may vary from the expense ratio shown elsewhere in this report because it is based on a different time period, includes acquired fund fees and expenses, and, if applicable, does not include fee waivers or expense reimbursements.
Data presented reflect past performance. Past performance is no guarantee of future results. Current performance may be higher or lower than the performance shown. Investment return and principal value will fluctuate, and redemption value may be more or less than original cost. Data assumes reinvestment of dividends and capital gains, and none of the charts reflect the deduction of taxes that a shareholder would pay on fund distributions or the redemption of fund shares. To obtain performance data current to the most recent month end, please call 1-800-345-2021 or visit americancentury.com. For additional information about the fund, please consult the prospectus.
Portfolio Managers: David Hollond, Michael Orndorff, and Marcus Scott
Performance Summary
All Cap Growth returned 11.50%* for the 12 months ended October 31, 2014, lagging the 16.39% return of the portfolio’s benchmark, the Russell 3000 Growth Index.
U.S. stock indices delivered solid returns during the reporting period. Within the Russell 3000 Growth Index, all sectors posted positive returns on a total-return basis. Health care was the top-performing sector, gaining more than 33%. Information technology also performed well and outpaced the benchmark average. Energy was the weakest sector, posting only a modest gain. Telecommunication services and consumer discretionary stocks registered single-digit returns as well.
All Cap Growth received positive contributions from most sectors, with information technology the top contributor. Energy was the only sector to post negative absolute returns. Stock decisions in the consumer discretionary, consumer staples, and health care sectors were key performance detractors relative to the Russell index. Stock selection in the financials sector aided results versus the benchmark.
Consumer Stocks Led Detractors
Stock choices in the consumer discretionary and consumer staples sectors detracted from relative results. Specialty-flooring retailer Lumber Liquidators failed to rebound from lower-than-expected first-quarter same-store sales caused by severe winter weather. The company also reported a shortage in hardwood flooring inventory. The stock was eliminated from the portfolio. The apparel and home goods company TJX also announced softer-than-expected same-store sales as a result of last year’s harsh winter weather. Twenty-First Century Fox detracted. The entertainment and media giant has been doing well at the box office but headwinds include its continued investment in cable television and slowing advertisement spending, which has affected media companies generally. We sold out of our position in Whole Foods Market, whose margins will likely be constrained by its price-reduction strategy as it seeks a larger market share in an increasingly competitive space.
The health care sector also detracted versus the benchmark, largely due to positioning in the pharmaceuticals industry, where we did not own several strong performers that are components of the benchmark.
LinkedIn was a major individual relative detractor. The social media employment site has seen some deceleration of growth in its user base and provided weaker-than-expected guidance for 2014. We believe that there is room for growth, however, as the company has no competition, a large, traditional job search market to disrupt, new product opportunities, and expansion potential.
Not owning Microsoft detracted from results as the company is generating market excitement over its new CEO’s plans to cut costs. Lighter-than-benchmark exposure to Apple hampered performance as the stock rose strongly on anticipation of and release of new products.
| |
| * | All fund returns referenced in this commentary are for Investor Class shares. Performance for other share classes will vary due to differences in fee structure; when Investor Class performance exceeds that of the fund’s benchmark, other share classes may not. See page 3 for returns for all share classes. |
Financials Stocks Aided Results
The fund benefited from positioning in the financials sector, primarily among capital markets firms. Morgan Stanley was a key contributor in the sector, helped by strong merger and acquisition and IPO markets. The company reported higher margins from its wealth management business following its buyout of Smith Barney. Avoiding some weaker capital markets names was also positive.
In the information technology sector, Electronic Arts was a key contributor. The video game maker reported better-than-expected revenues and earnings and is well positioned to benefit from next-generation game consoles like Xbox One, which is creating increased demand for games that can use the new technology.
Although stock decisions among health care stocks generally detracted, Gilead Sciences was a significant relative contributor. The stock appreciated on better-than-expected earnings, resulting from strong sales of the biotechnology company’s hepatitis C drug, Sovaldi. Gilead reported positive phase III trial results for TAF, a drug that would be used in the company’s HIV blends. The fund’s holding of Canadian Pacific Railway, which is not in the index, was another key contributor. Canadian Pacific’s new CEO has significantly improved margins through a more efficient network, which has also allowed the firm to pursue shareholder-friendly uses of its cash, such as repurchasing stock.
Outlook
All Cap Growth’s investment process focuses on companies of all capitalization sizes with accelerating earnings growth rates and share price momentum. The fund’s positioning remains largely stock specific. As of October 31, 2014, the largest overweight was in health care, while the largest underweights were in materials and telecommunication services. Current investment themes include stocks of companies benefiting from the Affordable Care Act, which has given a lift to health care providers. We are also finding opportunities in companies that benefit from the secular shift toward natural and organic foods.
|
| |
| OCTOBER 31, 2014 | |
| Top Ten Holdings | % of net assets |
| Google, Inc.* | 5.3% |
| Apple, Inc. | 5.2% |
| Electronic Arts, Inc. | 4.1% |
| Gilead Sciences, Inc. | 3.5% |
| Comcast Corp., Class A | 3.3% |
| Alliance Data Systems Corp. | 2.7% |
| Schlumberger Ltd. | 2.6% |
| Facebook, Inc., Class A | 2.5% |
| Twenty-First Century Fox, Inc. | 2.4% |
| Actavis plc | 2.3% |
| *Includes all classes of the issuer. | |
| | |
| Top Five Industries | % of net assets |
| Internet Software and Services | 9.0% |
| Media | 6.8% |
| Software | 6.5% |
| Biotechnology | 6.5% |
| Technology Hardware, Storage and Peripherals | 5.2% |
| | |
| Types of Investments in Portfolio | % of net assets |
| Common Stocks | 98.9% |
| Temporary Cash Investments | 0.7% |
| Other Assets and Liabilities | 0.4% |
Fund shareholders may incur two types of costs: (1) transaction costs, including sales charges (loads) on purchase payments and redemption/exchange fees; and (2) ongoing costs, including management fees; distribution and service (12b-1) fees; and other fund expenses. This example is intended to help you understand your ongoing costs (in dollars) of investing in your fund and to compare these costs with the ongoing cost of investing in other mutual funds.
The example is based on an investment of $1,000 made at the beginning of the period and held for the entire period from May 1, 2014 to October 31, 2014.
Actual Expenses
The table provides information about actual account values and actual expenses for each class. You may use the information, together with the amount you invested, to estimate the expenses that you paid over the period. First, identify the share class you own. Then simply divide your account value by $1,000 (for example, an $8,600 account value divided by $1,000 = 8.6), then multiply the result by the number under the heading “Expenses Paid During Period” to estimate the expenses you paid on your account during this period.
If you hold Investor Class shares of any American Century Investments fund, or Institutional Class shares of the American Century Diversified Bond Fund, in an American Century Investments account (i.e., not a financial intermediary or retirement plan account), American Century Investments may charge you a $12.50 semiannual account maintenance fee if the value of those shares is less than $10,000. We will redeem shares automatically in one of your accounts to pay the $12.50 fee. In determining your total eligible investment amount, we will include your investments in all personal accounts (including American Century Investments Brokerage accounts) registered under your Social Security number. Personal accounts include individual accounts, joint accounts, UGMA/UTMA accounts, personal trusts, Coverdell Education Savings Accounts and IRAs (including traditional, Roth, Rollover, SEP-, SARSEP- and SIMPLE-IRAs), and certain other retirement accounts. If you have only business, business retirement, employer-sponsored or American Century Investments Brokerage accounts, you are currently not subject to this fee. If you are subject to the Account Maintenance Fee, your account value could be reduced by the fee amount.
Hypothetical Example for Comparison Purposes
The table also provides information about hypothetical account values and hypothetical expenses based on the actual expense ratio of each class of your fund and an assumed rate of return of 5% per year before expenses, which is not the actual return of a fund’s share class. The hypothetical account values and expenses may not be used to estimate the actual ending account balance or expenses you paid for the period. You may use this information to compare the ongoing costs of investing in your fund and other funds. To do so, compare this 5% hypothetical example with the 5% hypothetical examples that appear in the shareholder reports of the other funds.
Please note that the expenses shown in the table are meant to highlight your ongoing costs only and do not reflect any transactional costs, such as sales charges (loads) or redemption/exchange fees. Therefore, the table is useful in comparing ongoing costs only, and will not help you determine the relative total costs of owning different funds. In addition, if these transactional costs were included, your costs would have been higher.
|
| | | | |
| Beginning
Account Value
5/1/14 | Ending
Account Value
10/31/14 | Expenses Paid
During Period(1)5/1/14 - 10/31/14 | Annualized
Expense Ratio(1) |
| Actual | | | | |
| Investor Class | $1,000 | $1,100.90 | $5.30 | 1.00% |
| Institutional Class | $1,000 | $1,101.90 | $4.24 | 0.80% |
| A Class | $1,000 | $1,099.60 | $6.62 | 1.25% |
| C Class | $1,000 | $1,095.50 | $10.56 | 2.00% |
| R Class | $1,000 | $1,098.00 | $7.93 | 1.50% |
| Hypothetical | | | | |
| Investor Class | $1,000 | $1,020.16 | $5.09 | 1.00% |
| Institutional Class | $1,000 | $1,021.17 | $4.08 | 0.80% |
| A Class | $1,000 | $1,018.90 | $6.36 | 1.25% |
| C Class | $1,000 | $1,015.12 | $10.16 | 2.00% |
| R Class | $1,000 | $1,017.64 | $7.63 | 1.50% |
| |
| (1) | Expenses are equal to the class's annualized expense ratio listed in the table above, multiplied by the average account value over the period, multiplied by 184, the number of days in the most recent fiscal half-year, divided by 365, to reflect the one-half year period. |
OCTOBER 31, 2014
|
| | | | | |
| | Shares | Value |
| COMMON STOCKS — 98.9% | | |
| Aerospace and Defense — 0.8% | | |
Esterline Technologies Corp.(1) | 78,692 |
| $ | 9,215,620 |
|
| Air Freight and Logistics — 1.2% | | |
| FedEx Corp. | 76,417 |
| 12,792,206 |
|
| Airlines — 1.1% | | |
| American Airlines Group, Inc. | 77,545 |
| 3,206,486 |
|
Spirit Airlines, Inc.(1) | 123,646 |
| 9,039,759 |
|
| | | 12,246,245 |
|
| Banks — 1.8% | | |
| Bank of America Corp. | 349,377 |
| 5,995,309 |
|
| East West Bancorp, Inc. | 121,527 |
| 4,467,333 |
|
SVB Financial Group(1) | 79,649 |
| 8,919,891 |
|
| | | 19,382,533 |
|
| Beverages — 2.4% | | |
| Brown-Forman Corp., Class B | 82,457 |
| 7,641,290 |
|
Constellation Brands, Inc., Class A(1) | 203,671 |
| 18,644,044 |
|
| | | 26,285,334 |
|
| Biotechnology — 6.5% | | |
Alexion Pharmaceuticals, Inc.(1) | 55,096 |
| 10,543,171 |
|
Biogen Idec, Inc.(1) | 42,100 |
| 13,517,468 |
|
Gilead Sciences, Inc.(1) | 344,029 |
| 38,531,248 |
|
Regeneron Pharmaceuticals, Inc.(1) | 21,970 |
| 8,650,028 |
|
| | | 71,241,915 |
|
| Building Products — 0.3% | | |
| Fortune Brands Home & Security, Inc. | 76,955 |
| 3,328,304 |
|
| Capital Markets — 2.2% | | |
| Charles Schwab Corp. (The) | 354,400 |
| 10,160,648 |
|
| Morgan Stanley | 409,445 |
| 14,310,103 |
|
| | | 24,470,751 |
|
| Chemicals — 2.0% | | |
| Monsanto Co. | 192,643 |
| 22,161,651 |
|
| Communications Equipment — 1.4% | | |
Palo Alto Networks, Inc.(1) | 28,997 |
| 3,064,983 |
|
| QUALCOMM, Inc. | 162,613 |
| 12,766,747 |
|
| | | 15,831,730 |
|
| Construction and Engineering — 0.5% | | |
Quanta Services, Inc.(1) | 156,888 |
| 5,346,743 |
|
| Consumer Finance — 0.9% | | |
| Discover Financial Services | 153,880 |
| 9,814,466 |
|
| Distributors — 1.3% | | |
LKQ Corp.(1) | 501,463 |
| 14,326,798 |
|
| Electrical Equipment — 0.6% | | |
| Acuity Brands, Inc. | 43,779 |
| 6,104,106 |
|
| Electronic Equipment, Instruments and Components — 0.3% | | |
| TE Connectivity Ltd. | 53,441 |
| 3,266,848 |
|
|
| | | | | |
| | Shares | Value |
| Energy Equipment and Services — 4.9% | | |
| Halliburton Co. | 431,865 |
| $ | 23,813,036 |
|
| Schlumberger Ltd. | 285,788 |
| 28,195,844 |
|
Weatherford International plc(1) | 147,602 |
| 2,423,625 |
|
| | | 54,432,505 |
|
| Food and Staples Retailing — 2.6% | | |
| Costco Wholesale Corp. | 185,133 |
| 24,691,188 |
|
United Natural Foods, Inc.(1) | 60,290 |
| 4,100,926 |
|
| | | 28,792,114 |
|
| Food Products — 3.7% | | |
Hain Celestial Group, Inc. (The)(1) | 91,166 |
| 9,868,719 |
|
| Hershey Co. (The) | 87,436 |
| 8,385,987 |
|
| Mondelez International, Inc., Class A | 625,030 |
| 22,038,558 |
|
| | | 40,293,264 |
|
| Health Care Equipment and Supplies — 2.5% | | |
Intuitive Surgical, Inc.(1) | 10,490 |
| 5,200,942 |
|
| Teleflex, Inc. | 200,387 |
| 22,868,164 |
|
| | | 28,069,106 |
|
| Health Care Providers and Services — 3.5% | | |
| AmerisourceBergen Corp. | 113,862 |
| 9,724,953 |
|
HCA Holdings, Inc.(1) | 92,209 |
| 6,459,240 |
|
| McKesson Corp. | 69,400 |
| 14,116,654 |
|
Team Health Holdings, Inc.(1) | 125,762 |
| 7,865,156 |
|
| | | 38,166,003 |
|
| Hotels, Restaurants and Leisure — 2.2% | | |
Chipotle Mexican Grill, Inc.(1) | 13,454 |
| 8,583,652 |
|
Panera Bread Co., Class A(1) | 32,228 |
| 5,209,334 |
|
| Starbucks Corp. | 144,810 |
| 10,941,844 |
|
| | | 24,734,830 |
|
| Household Durables — 0.5% | | |
| Harman International Industries, Inc. | 34,447 |
| 3,697,541 |
|
Mohawk Industries, Inc.(1) | 15,004 |
| 2,131,168 |
|
| | | 5,828,709 |
|
| Household Products — 0.7% | | |
| Procter & Gamble Co. (The) | 81,700 |
| 7,129,959 |
|
| Internet and Catalog Retail — 2.1% | | |
Priceline Group, Inc. (The)(1) | 12,098 |
| 14,592,729 |
|
TripAdvisor, Inc.(1) | 101,667 |
| 9,013,796 |
|
| | | 23,606,525 |
|
| Internet Software and Services — 9.0% | | |
Alibaba Group Holding Ltd. ADR(1) | 26,591 |
| 2,621,872 |
|
CoStar Group, Inc.(1) | 59,548 |
| 9,592,587 |
|
Facebook, Inc., Class A(1) | 372,030 |
| 27,898,530 |
|
Google, Inc., Class A(1) | 51,387 |
| 29,181,136 |
|
Google, Inc., Class C(1) | 51,387 |
| 28,729,444 |
|
LinkedIn Corp., Class A(1) | 7,176 |
| 1,643,017 |
|
| | | 99,666,586 |
|
| IT Services — 4.5% | | |
Alliance Data Systems Corp.(1) | 104,118 |
| 29,501,835 |
|
| MasterCard, Inc., Class A | 246,117 |
| 20,612,299 |
|
| | | 50,114,134 |
|
|
| | | | | |
| | Shares | Value |
| Leisure Products — 0.6% | | |
| Polaris Industries, Inc. | 43,400 |
| $ | 6,547,324 |
|
| Machinery — 3.3% | | |
| Flowserve Corp. | 231,330 |
| 15,728,127 |
|
| Ingersoll-Rand plc | 135,009 |
| 8,454,263 |
|
Middleby Corp.(1) | 141,000 |
| 12,478,500 |
|
| | | 36,660,890 |
|
| Media — 6.8% | | |
| Comcast Corp., Class A | 667,100 |
| 36,923,985 |
|
| Time Warner, Inc. | 144,508 |
| 11,484,051 |
|
| Twenty-First Century Fox, Inc. | 770,382 |
| 26,562,771 |
|
| | | 74,970,807 |
|
| Oil, Gas and Consumable Fuels — 0.5% | | |
Antero Resources Corp.(1) | 97,920 |
| 5,134,925 |
|
| Pharmaceuticals — 4.2% | | |
Actavis plc(1) | 102,523 |
| 24,886,433 |
|
| Johnson & Johnson | 95,627 |
| 10,306,678 |
|
| Zoetis, Inc. | 303,383 |
| 11,273,712 |
|
| | | 46,466,823 |
|
| Professional Services — 0.8% | | |
| Nielsen NV | 203,416 |
| 8,643,146 |
|
| Real Estate Management and Development — 0.4% | | |
| Jones Lang LaSalle, Inc. | 28,507 |
| 3,854,432 |
|
| Road and Rail — 3.5% | | |
| Canadian Pacific Railway Ltd., New York Shares | 108,317 |
| 22,495,275 |
|
| Kansas City Southern | 94,465 |
| 11,599,357 |
|
| Norfolk Southern Corp. | 44,700 |
| 4,945,608 |
|
| | | 39,040,240 |
|
| Semiconductors and Semiconductor Equipment — 1.2% | | |
| Avago Technologies Ltd. | 82,700 |
| 7,132,875 |
|
NXP Semiconductor NV(1) | 82,037 |
| 5,632,660 |
|
| | | 12,765,535 |
|
| Software — 6.5% | | |
Adobe Systems, Inc.(1) | 116,309 |
| 8,155,587 |
|
Electronic Arts, Inc.(1) | 1,093,407 |
| 44,796,885 |
|
| Intuit, Inc. | 103,725 |
| 9,128,837 |
|
Salesforce.com, Inc.(1) | 147,940 |
| 9,466,681 |
|
| | | 71,547,990 |
|
| Specialty Retail — 4.2% | | |
| Home Depot, Inc. (The) | 153,022 |
| 14,922,706 |
|
| Lowe's Cos., Inc. | 385,787 |
| 22,067,016 |
|
| Signet Jewelers Ltd. | 51,998 |
| 6,240,280 |
|
| TJX Cos., Inc. (The) | 50,531 |
| 3,199,623 |
|
| | | 46,429,625 |
|
| Technology Hardware, Storage and Peripherals — 5.2% | | |
| Apple, Inc. | 533,873 |
| 57,658,284 |
|
| Textiles, Apparel and Luxury Goods — 0.6% | | |
Kate Spade & Co.(1) | 102,662 |
| 2,785,220 |
|
| NIKE, Inc., Class B | 35,928 |
| 3,340,226 |
|
| | | 6,125,446 |
|
|
| | | | | |
| | Shares | Value |
| Tobacco — 0.5% | | |
| Philip Morris International, Inc. | 60,140 |
| $ | 5,353,061 |
|
| Wireless Telecommunication Services — 1.1% | | |
SBA Communications Corp., Class A(1) | 109,872 |
| 12,341,922 |
|
TOTAL COMMON STOCKS (Cost $771,857,201) | | 1,090,189,435 |
|
| TEMPORARY CASH INVESTMENTS — 0.7% | | |
| Repurchase Agreement, Bank of America Merrill Lynch, (collateralized by various U.S. Treasury obligations, 1.375% - 2.625%, 12/31/14 - 2/28/19, valued at $1,913,148), in a joint trading account at 0.07%, dated 10/31/14, due 11/3/14 (Delivery value $1,875,932) | | 1,875,921 |
|
| Repurchase Agreement, Credit Suisse First Boston, Inc., (collateralized by various U.S. Treasury obligations, 0.25%, 10/15/15, valued at $765,418), in a joint trading account at 0.04%, dated 10/31/14, due 11/3/14 (Delivery value $750,371) | | 750,368 |
|
| Repurchase Agreement, Goldman Sachs & Co., (collateralized by various U.S. Treasury obligations, 0.125%, 12/31/14, valued at $1,532,299), in a joint trading account at 0.03%, dated 10/31/14, due 11/3/14 (Delivery value $1,500,741) | | 1,500,737 |
|
| SSgA U.S. Government Money Market Fund, Class N | 4,127,970 |
| 4,127,970 |
|
TOTAL TEMPORARY CASH INVESTMENTS (Cost $8,254,996) | | 8,254,996 |
|
TOTAL INVESTMENT SECURITIES — 99.6% (Cost $780,112,197) | | 1,098,444,431 |
|
| OTHER ASSETS AND LIABILITIES — 0.4% | | 4,208,093 |
|
| TOTAL NET ASSETS — 100.0% | | $ | 1,102,652,524 |
|
|
| | | | | | | | | | |
| FORWARD FOREIGN CURRENCY EXCHANGE CONTRACTS |
| Currency Purchased | Currency Sold | Counterparty | Settlement Date | Unrealized Appreciation
(Depreciation) |
| USD | 19,839,677 |
| CAD | 22,262,102 |
| JPMorgan Chase Bank N.A. | 11/28/14 | $ | 99,250 |
|
|
| | |
| NOTES TO SCHEDULE OF INVESTMENTS |
| ADR | - | American Depositary Receipt |
| CAD | - | Canadian Dollar |
| USD | - | United States Dollar |
See Notes to Financial Statements.
|
|
| Statement of Assets and Liabilities |
|
| | | |
| OCTOBER 31, 2014 | |
| Assets | |
| Investment securities, at value (cost of $780,112,197) | $ | 1,098,444,431 |
|
| Foreign currency holdings, at value (cost of $69,060) | 66,516 |
|
| Receivable for investments sold | 8,573,512 |
|
| Receivable for capital shares sold | 112,101 |
|
| Unrealized appreciation on forward foreign currency exchange contracts | 99,250 |
|
| Dividends and interest receivable | 254,028 |
|
| | 1,107,549,838 |
|
| | |
| Liabilities | |
| Payable for investments purchased | 3,597,348 |
|
| Payable for capital shares redeemed | 398,484 |
|
| Accrued management fees | 892,666 |
|
| Distribution and service fees payable | 8,816 |
|
| | 4,897,314 |
|
| | |
| Net Assets | $ | 1,102,652,524 |
|
| | |
| Net Assets Consist of: | |
| Capital (par value and paid-in surplus) | $ | 633,432,184 |
|
| Accumulated net investment loss | (1,702,952 | ) |
| Undistributed net realized gain | 152,494,352 |
|
| Net unrealized appreciation | 318,428,940 |
|
| | $ | 1,102,652,524 |
|
|
| | | | | | |
| | Net Assets | Shares Outstanding | Net Asset Value Per Share |
| Investor Class, $0.01 Par Value |
| $1,079,950,335 |
| 31,113,697 |
| $34.71 |
| Institutional Class, $0.01 Par Value |
| $190,672 |
| 5,460 |
| $34.92 |
| A Class, $0.01 Par Value |
| $8,837,029 |
| 256,613 |
| $34.44* |
| C Class, $0.01 Par Value |
| $3,931,690 |
| 116,945 |
| $33.62 |
| R Class, $0.01 Par Value |
| $9,742,798 |
| 285,189 |
| $34.16 |
*Maximum offering price $36.54 (net asset value divided by 0.9425).
See Notes to Financial Statements.
|
| | | |
| YEAR ENDED OCTOBER 31, 2014 | |
| Investment Income (Loss) | |
| Income: | |
| Dividends (net of foreign taxes withheld of $43,693) | $ | 8,933,961 |
|
| Interest | 843 |
|
| | 8,934,804 |
|
| | |
| Expenses: | |
| Management fees | 10,908,205 |
|
| Distribution and service fees: | |
| A Class | 22,735 |
|
| C Class | 36,395 |
|
| R Class | 38,954 |
|
| Directors' fees and expenses | 15,580 |
|
| | 11,021,869 |
|
| | |
| Net investment income (loss) | (2,087,065 | ) |
| | |
| Realized and Unrealized Gain (Loss) | |
| Net realized gain (loss) on: | |
| Investment transactions | 162,533,177 |
|
| Foreign currency transactions | 414,924 |
|
| | 162,948,101 |
|
| | |
| Change in net unrealized appreciation (depreciation) on: | |
| Investments | (42,213,669 | ) |
| Translation of assets and liabilities in foreign currencies | (2,385 | ) |
| | (42,216,054 | ) |
| | |
| Net realized and unrealized gain (loss) | 120,732,047 |
|
| | |
| Net Increase (Decrease) in Net Assets Resulting from Operations | $ | 118,644,982 |
|
See Notes to Financial Statements.
|
|
| Statement of Changes in Net Assets |
|
| | | | | | |
| YEARS ENDED OCTOBER 31, 2014 AND OCTOBER 31, 2013 |
| Increase (Decrease) in Net Assets | October 31, 2014 | October 31, 2013 |
| Operations | | |
| Net investment income (loss) | $ | (2,087,065 | ) | $ | 3,764,116 |
|
| Net realized gain (loss) | 162,948,101 |
| 146,001,955 |
|
| Change in net unrealized appreciation (depreciation) | (42,216,054 | ) | 86,441,524 |
|
| Net increase (decrease) in net assets resulting from operations | 118,644,982 |
| 236,207,595 |
|
| | | |
| Distributions to Shareholders | | |
| From net investment income: | | |
| Investor Class | — |
| (2,987,737 | ) |
| Institutional Class | — |
| (460 | ) |
| A Class | — |
| (23,405 | ) |
| C Class | — |
| (653 | ) |
| R Class | — |
| (2,856 | ) |
| From net realized gains: | | |
| Investor Class | (135,254,248 | ) | (64,330,394 | ) |
| Institutional Class | (13,915 | ) | (8,390 | ) |
| A Class | (1,123,968 | ) | (650,947 | ) |
| C Class | (454,606 | ) | (145,569 | ) |
| R Class | (827,562 | ) | (112,134 | ) |
| Decrease in net assets from distributions | (137,674,299 | ) | (68,262,545 | ) |
| | | |
| Capital Share Transactions | | |
| Net increase (decrease) in net assets from capital share transactions (Note 5) | 22,307,155 |
| (44,384,524 | ) |
| | | |
| Net increase (decrease) in net assets | 3,277,838 |
| 123,560,526 |
|
| | | |
| Net Assets | | |
| Beginning of period | 1,099,374,686 |
| 975,814,160 |
|
| End of period | $ | 1,102,652,524 |
| $ | 1,099,374,686 |
|
| | | |
| Accumulated net investment loss | $ | (1,702,952 | ) | $ | (97,550 | ) |
See Notes to Financial Statements.
|
|
| Notes to Financial Statements |
OCTOBER 31, 2014
1. Organization
American Century Mutual Funds, Inc. (the corporation) is registered under the Investment Company Act of 1940, as amended (the 1940 Act), as an open-end management investment company and is organized as a Maryland corporation. All Cap Growth Fund (the fund) is one fund in a series issued by the corporation. The fund is diversified as defined under the 1940 Act. The fund's investment objective is to seek long-term capital growth.
The fund offers the Investor Class, the Institutional Class, the A Class, the C Class and the R Class. The A Class may incur an initial sales charge. The A Class and C Class may be subject to a contingent deferred sales charge. The share classes differ principally in their respective sales charges and distribution and shareholder servicing expenses and arrangements. The Institutional Class is made available to institutional shareholders or through financial intermediaries whose clients do not require the same level of shareholder and administrative services as shareholders of other classes. As a result, the Institutional Class is charged a lower unified management fee.
2. Significant Accounting Policies
The following is a summary of significant accounting policies consistently followed by the fund in preparation of its financial statements. The fund is an investment company and follows accounting and reporting guidance in accordance with accounting principles generally accepted in the United States of America. This may require management to make certain estimates and assumptions at the date of the financial statements. Actual results could differ from these estimates. Management evaluated the impact of events or transactions occurring through the date the financial statements were issued that would merit recognition or disclosure.
Investment Valuations — The fund determines the fair value of its investments and computes its net asset value per share at the close of regular trading (usually 4 p.m. Eastern time) on the New York Stock Exchange (NYSE) on each day the NYSE is open. The Board of Directors has adopted valuation policies and procedures to guide the investment advisor in the fund’s investment valuation process and to provide methodologies for the oversight of the fund’s pricing function.
Equity securities that are listed or traded on a domestic securities exchange are valued at the last reported sales price or at the official closing price as provided by the exchange. Equity securities traded on foreign securities exchanges are generally valued at the closing price of such securities on the exchange where primarily traded or at the close of the NYSE, if that is earlier. If no last sales price is reported, or if local convention or regulation so provides, the mean of the latest bid and asked prices may be used. Securities traded over-the-counter are valued at the mean of the latest bid and asked prices, the last sales price, or the official closing price. Equity securities initially expressed in local currencies are translated into U.S. dollars at the mean of the appropriate currency exchange rate at the close of the NYSE as provided by an independent pricing service.
Fixed income securities maturing within 60 days at the time of purchase may be valued at cost, plus or minus any amortized discount or premium or at the evaluated mean as provided by an independent pricing service. Evaluated mean prices are commonly derived through utilization of market models, which may consider, among other factors: trade data, quotations from dealers and active market makers, relevant yield curve and spread data, related sector levels, creditworthiness, trade data or market information on comparable securities, and other relevant security specific information.
Open-end management investment companies are valued at the reported net asset value per share. Repurchase agreements are valued at cost, which approximates fair value. Forward foreign currency exchange contracts are valued at the mean of the appropriate forward exchange rate at the close of the NYSE as provided by an independent pricing service.
If the fund determines that the market price for an investment is not readily available or the valuation methods mentioned above do not reflect an investment’s fair value, such investment is valued as determined in good faith by the Board of Directors or its delegate, in accordance with policies and procedures adopted by the Board of Directors. In its determination of fair value, the fund may review several factors including, but not
limited to, market information regarding the specific investment or comparable investments and correlation with other investment types, futures indices or general market indicators. Circumstances that may cause the fund to use these procedures to value an investment include, but are not limited to: an investment has been declared in default or is distressed; trading in a security has been suspended during the trading day or a security is not actively trading on its principal exchange; prices received from a regular pricing source are deemed unreliable; or there is a foreign market holiday and no trading occurred.
The fund monitors for significant events occurring after the close of an investment’s primary exchange but before the fund’s net asset value per share is determined. Significant events may include, but are not limited to: corporate announcements and transactions; governmental action and political unrest that could impact a specific investment or an investment sector; or armed conflicts, natural disasters and similar events that could affect investments in a specific country or region. The fund also monitors for significant fluctuations between domestic and foreign markets, as evidenced by the U.S. market or such other indicators that the Board of Directors, or its delegate, deems appropriate. If significant fluctuations in foreign markets are identified, the fund may apply a model-derived factor to the closing price of equity securities traded on foreign securities exchanges. The factor is based on observable market data as provided by an independent pricing service.
Security Transactions — Security transactions are accounted for as of the trade date. Net realized gains and losses are determined on the identified cost basis, which is also used for federal income tax purposes.
Investment Income — Dividend income less foreign taxes withheld, if any, is recorded as of the ex-dividend date. Distributions received on securities that represent a return of capital or long-term capital gain are recorded as a reduction of cost of investments and/or as a realized gain. The fund may estimate the components of distributions received that may be considered nontaxable distributions or long-term capital gain distributions for income tax purposes. Interest income is recorded on the accrual basis and includes accretion of discounts and amortization of premiums.
Foreign Currency Translations — All assets and liabilities initially expressed in foreign currencies are translated into U.S. dollars at prevailing exchange rates at period end. The fund may enter into spot foreign currency exchange contracts to facilitate transactions denominated in a foreign currency. Purchases and sales of investment securities, dividend and interest income, spot foreign currency exchange contracts, and expenses are translated at the rates of exchange prevailing on the respective dates of such transactions. Net realized and unrealized foreign currency exchange gains or losses related to investment securities are a component of net realized gain (loss) on investment transactions and change in net unrealized appreciation (depreciation) on investments, respectively.
Repurchase Agreements — The fund may enter into repurchase agreements with institutions that American Century Investment Management, Inc. (ACIM) (the investment advisor) has determined are creditworthy pursuant to criteria adopted by the Board of Directors. The fund requires that the collateral, represented by securities, received in a repurchase transaction be transferred to the custodian in a manner sufficient to enable the fund to obtain those securities in the event of a default under the repurchase agreement. ACIM monitors, on a daily basis, the securities transferred to ensure the value, including accrued interest, of the securities under each repurchase agreement is equal to or greater than amounts owed to the fund under each repurchase agreement.
Joint Trading Account — Pursuant to an Exemptive Order issued by the Securities and Exchange Commission, the fund, along with certain other funds in the American Century Investments family of funds, may transfer uninvested cash balances into a joint trading account. These balances are invested in one or more repurchase agreements that are collateralized by U.S. Treasury or Agency obligations.
Income Tax Status — It is the fund’s policy to distribute substantially all net investment income and net realized gains to shareholders and to otherwise qualify as a regulated investment company under provisions of the Internal Revenue Code. Accordingly, no provision has been made for income taxes. The fund files U.S. federal, state, local and non-U.S. tax returns as applicable. The fund's tax returns are subject to examination by the relevant taxing authority until expiration of the applicable statute of limitations, which is generally three years from the date of filing but can be longer in certain jurisdictions. At this time, management believes there are no uncertain tax positions which, based on their technical merit, would not be sustained upon examination and for which it is reasonably possible that the total amounts of unrecognized tax benefits will significantly change in the next twelve months.
Multiple Class — All shares of the fund represent an equal pro rata interest in the net assets of the class to which such shares belong, and have identical voting, dividend, liquidation and other rights and the same terms and conditions, except for class specific expenses and exclusive rights to vote on matters affecting only
individual classes. Income, non-class specific expenses, and realized and unrealized capital gains and losses of the fund are allocated to each class of shares based on their relative net assets.
Distributions to Shareholders — Distributions from net investment income and net realized gains, if any, are generally declared and paid annually. The fund may elect to treat a portion of its payment to a redeeming shareholder, which represents the pro rata share of undistributed net investment income and net realized gains, as a distribution for federal income tax purposes (tax equalization).
Indemnifications — Under the corporation’s organizational documents, its officers and directors are indemnified against certain liabilities arising out of the performance of their duties to the fund. In addition, in the normal course of business, the fund enters into contracts that provide general indemnifications. The maximum exposure under these arrangements is unknown as this would involve future claims that may be made against a fund. The risk of material loss from such claims is considered by management to be remote.
3. Fees and Transactions with Related Parties
Certain officers and directors of the corporation are also officers and/or directors of American Century Companies, Inc. (ACC). The corporation’s investment advisor, ACIM, the corporation's distributor, American Century Investment Services, Inc. (ACIS), and the corporation’s transfer agent, American Century Services, LLC, are wholly owned, directly or indirectly, by ACC.
Management Fees — The corporation has entered into a management agreement with ACIM, under which ACIM provides the fund with investment advisory and management services in exchange for a single, unified management fee (the fee) per class. The agreement provides that all expenses of managing and operating the fund, except distribution and service fees, brokerage expenses, taxes, interest, fees and expenses of the independent directors (including legal counsel fees), and extraordinary expenses, will be paid by ACIM. The fee is computed and accrued daily based on each class’s daily net assets and paid monthly in arrears. The annual management fee is 1.00% for the Investor Class, A Class, C Class and R Class and 0.80% for the Institutional Class.
Distribution and Service Fees — The Board of Directors has adopted a separate Master Distribution and Individual Shareholder Services Plan for each of the A Class, C Class and R Class (collectively the plans), pursuant to Rule 12b-1 of the 1940 Act. The plans provide that the A Class will pay ACIS an annual distribution and service fee of 0.25%. The plans provide that the C Class will pay ACIS an annual distribution and service fee of 1.00%, of which 0.25% is paid for individual shareholder services and 0.75% is paid for distribution services. The plans provide that the R Class will pay ACIS an annual distribution and service fee of 0.50%. The fees are computed and accrued daily based on each class’s daily net assets and paid monthly in arrears. The fees are used to pay financial intermediaries for distribution and individual shareholder services. Fees incurred under the plans during the year ended October 31, 2014 are detailed in the Statement of Operations.
Directors' Fees and Expenses — The Board of Directors is responsible for overseeing the investment advisor’s management and operations of the fund. The directors receive detailed information about the fund and its investment advisor regularly throughout the year, and meet at least quarterly with management of the investment advisor to review reports about fund operations. Fees and expenses incurred in conjunction with the directors during the year ended October 31, 2014 are detailed in the Statement of Operations. The fund’s officers do not receive compensation from the fund.
4. Investment Transactions
Purchases and sales of investment securities, excluding short-term investments, for the year ended October 31, 2014 were $606,124,724 and $731,146,406, respectively.
5. Capital Share Transactions
Transactions in shares of the fund were as follows:
|
| | | | | | | | | | |
| | Year ended October 31, 2014 | Year ended October 31, 2013 |
| | Shares | Amount | Shares | Amount |
| Investor Class/Shares Authorized | 200,000,000 |
| | 200,000,000 |
| |
| Sold | 1,162,515 |
| $ | 38,387,186 |
| 1,333,460 |
| $ | 41,078,263 |
|
| Issued in reinvestment of distributions | 4,246,173 |
| 132,055,972 |
| 2,273,872 |
| 65,874,089 |
|
| Redeemed | (4,648,558 | ) | (153,313,983 | ) | (4,842,756 | ) | (151,874,064 | ) |
| | 760,130 |
| 17,129,175 |
| (1,235,424 | ) | (44,921,712 | ) |
| Institutional Class/Shares Authorized | 25,000,000 |
| | 25,000,000 |
| |
| Sold | 2,427 |
| 80,496 |
| 3,302 |
| 101,354 |
|
| Issued in reinvestment of distributions | 446 |
| 13,915 |
| 305 |
| 8,850 |
|
| Redeemed | (485 | ) | (16,142 | ) | (2,550 | ) | (81,844 | ) |
| | 2,388 |
| 78,269 |
| 1,057 |
| 28,360 |
|
| A Class/Shares Authorized | 25,000,000 |
| | 25,000,000 |
| |
| Sold | 132,615 |
| 4,368,596 |
| 150,961 |
| 4,648,002 |
|
| Issued in reinvestment of distributions | 36,351 |
| 1,123,968 |
| 22,308 |
| 644,487 |
|
| Redeemed | (152,490 | ) | (4,957,707 | ) | (306,496 | ) | (10,032,622 | ) |
| | 16,476 |
| 534,857 |
| (133,227 | ) | (4,740,133 | ) |
| C Class/Shares Authorized | 25,000,000 |
| | 25,000,000 |
| |
| Sold | 39,397 |
| 1,268,756 |
| 38,907 |
| 1,224,286 |
|
| Issued in reinvestment of distributions | 14,564 |
| 442,613 |
| 4,234 |
| 121,389 |
|
| Redeemed | (31,993 | ) | (1,022,084 | ) | (14,351 | ) | (451,908 | ) |
| | 21,968 |
| 689,285 |
| 28,790 |
| 893,767 |
|
| R Class/Shares Authorized | 25,000,000 |
| | 25,000,000 |
| |
| Sold | 169,022 |
| 5,520,467 |
| 156,475 |
| 4,980,335 |
|
| Issued in reinvestment of distributions | 26,921 |
| 827,562 |
| 3,990 |
| 114,990 |
|
| Redeemed | (75,880 | ) | (2,472,460 | ) | (23,884 | ) | (740,131 | ) |
| | 120,063 |
| 3,875,569 |
| 136,581 |
| 4,355,194 |
|
| Net increase (decrease) | 921,025 |
| $ | 22,307,155 |
| (1,202,223 | ) | $ | (44,384,524 | ) |
6. Fair Value Measurements
The fund’s investments valuation process is based on several considerations and may use multiple inputs to determine the fair value of the investments held by the fund. In conformity with accounting principles generally accepted in the United States of America, the inputs used to determine a valuation are classified into three broad levels.
| |
| • | Level 1 valuation inputs consist of unadjusted quoted prices in an active market for identical investments. |
| |
| • | Level 2 valuation inputs consist of direct or indirect observable market data (including quoted prices for comparable investments, evaluations of subsequent market events, interest rates, prepayment speeds, credit risk, etc.). These inputs also consist of quoted prices for identical investments initially expressed in local currencies that are adjusted through translation into U.S. dollars. |
| |
| • | Level 3 valuation inputs consist of unobservable data (including a fund’s own assumptions). |
The level classification is based on the lowest level input that is significant to the fair valuation measurement. The valuation inputs are not necessarily an indication of the risks associated with investing in these securities or other financial instruments. There were no significant transfers between levels during the period.
The following is a summary of the level classifications as of period end. The Schedule of Investments provides additional information on the fund’s portfolio holdings.
|
| | | | | | | | |
| | Level 1 | Level 2 | Level 3 |
| Assets | | | |
| Investment Securities | | | |
| Common Stocks | $ | 1,090,189,435 |
| — |
| — |
|
| Temporary Cash Investments | 4,127,970 |
| $ | 4,127,026 |
| — |
|
| | $ | 1,094,317,405 |
| $ | 4,127,026 |
| — |
|
| Other Financial Instruments | | | |
| Forward Foreign Currency Exchange Contracts | — |
| $ | 99,250 |
| — |
|
7. Derivative Instruments
Foreign Currency Risk — The fund is subject to foreign currency exchange rate risk in the normal course of pursuing its investment objectives. The value of foreign investments held by a fund may be significantly affected by changes in foreign currency exchange rates. The dollar value of a foreign security generally decreases when the value of the dollar rises against the foreign currency in which the security is denominated and tends to increase when the value of the dollar declines against such foreign currency. A fund may enter into forward foreign currency exchange contracts to reduce a fund's exposure to foreign currency exchange rate fluctuations. The net U.S. dollar value of foreign currency underlying all contractual commitments held by a fund and the resulting unrealized appreciation or depreciation are determined daily. Realized gain or loss is recorded upon the termination of the contract. Net realized and unrealized gains or losses occurring during the holding period of forward foreign currency exchange contracts are a component of net realized gain (loss) on foreign currency transactions and change in net unrealized appreciation (depreciation) on translation of assets and liabilities in foreign currencies, respectively. A fund bears the risk of an unfavorable change in the foreign currency exchange rate underlying the forward contract. Additionally, losses, up to the fair value, may arise if the counterparties do not perform under the contract terms. The fund's average U.S. dollar exposure to foreign currency risk derivative instruments held during the period was $13,054,506.
The value of foreign currency risk derivative instruments as of October 31, 2014, is disclosed on the Statement of Assets and Liabilities as an asset of $99,250 in unrealized appreciation on forward foreign currency exchange contracts. For the year ended October 31, 2014, the effect of foreign currency risk derivative instruments on the Statement of Operations was $422,970 in net realized gain (loss) on foreign currency transactions and $1,700 in change in net unrealized appreciation (depreciation) on translation of assets and liabilities in foreign currencies.
8. Federal Tax Information
The tax character of distributions paid during the years ended October 31, 2014 and October 31, 2013 were as follows:
|
| | | | | | |
| | 2014 | 2013 |
| Distributions Paid From | | |
| Ordinary income | $ | 12,321,590 |
| $ | 3,015,111 |
|
| Long-term capital gains | $ | 125,352,709 |
| $ | 65,247,434 |
|
The book-basis character of distributions made during the year from net investment income or net realized gains may differ from their ultimate characterization for federal income tax purposes. These differences reflect the differing character of certain income items and net realized gains and losses for financial statement and tax purposes, and may result in reclassification among certain capital accounts on the financial statements.
As of October 31, 2014, the federal tax cost of investments and the components of distributable earnings on a tax-basis were as follows:
|
| | | |
| Federal tax cost of investments | $ | 780,170,156 |
|
| Gross tax appreciation of investments | $ | 321,854,256 |
|
| Gross tax depreciation of investments | (3,579,981 | ) |
| Net tax appreciation (depreciation) of investments | 318,274,275 |
|
Net tax appreciation (depreciation) on derivatives and translation of assets and liabilities in foreign currencies | (2,544 | ) |
| Net tax appreciation (depreciation) | $ | 318,271,731 |
|
| Undistributed ordinary income | — |
|
| Accumulated long-term gains | $ | 152,552,311 |
|
| Late-year ordinary loss deferral | $ | (1,603,702 | ) |
The difference between book-basis and tax-basis unrealized appreciation (depreciation) is attributable primarily to the realization for tax purposes of unrealized gains (losses) on certain foreign currency exchange contracts.
Loss deferrals represent certain qualified losses that the fund has elected to treat as having been incurred in the following fiscal year for federal income tax purposes.
|
| | | | | | | | | | | | | | | |
| For a Share Outstanding Throughout the Years Ended October 31 (except as noted) |
| Per-Share Data | | | | | | | | Ratios and Supplemental Data | |
| | | Income From Investment Operations: | Distributions From: | | | Ratio to Average Net Assets of: | | |
| | Net Asset
Value,
Beginning
of Period | Net
Investment
Income
(Loss)(1) | Net
Realized
and
Unrealized
Gain (Loss) | Total From
Investment
Operations | Net
Investment
Income | Net
Realized
Gains | Total
Distributions | Net Asset
Value,
End
of Period | Total
Return(2) | Operating
Expenses | Net
Investment
Income
(Loss) | Portfolio
Turnover
Rate | Net
Assets,
End of
Period
(in thousands) |
| Investor Class | | | | | | | | | | | | |
| 2014 | $35.63 | (0.06) | 3.64 | 3.58 | — | (4.50) | (4.50) | $34.71 | 11.50% | 1.00% | (0.18)% | 56% |
| $1,079,950 |
|
| 2013 | $30.44 | 0.12 | 7.22 | 7.34 | (0.10) | (2.05) | (2.15) | $35.63 | 25.72% | 1.00% | 0.38% | 60% |
| $1,081,599 |
|
| 2012 | $28.06 | 0.01 | 3.08 | 3.09 | — | (0.71) | (0.71) | $30.44 | 11.40% | 1.00% | 0.04% | 55% |
| $961,562 |
|
| 2011 | $26.07 | (0.02) | 2.01 | 1.99 | — | — | — | $28.06 | 7.63% | 1.00% | (0.08)% | 75% |
| $935,751 |
|
| 2010 | $20.86 | (0.05) | 5.26 | 5.21 | — | — | — | $26.07 | 24.98% | 1.01% | (0.22)% | 88% |
| $959,447 |
|
| Institutional Class | | | | | | | | | | | | |
| 2014 | $35.76 | —(3) | 3.66 | 3.66 | — | (4.50) | (4.50) | $34.92 | 11.71% | 0.80% | 0.02% | 56% |
| $191 |
|
| 2013 | $30.50 | 0.16 | 7.26 | 7.42 | (0.11) | (2.05) | (2.16) | $35.76 | 25.98% | 0.80% | 0.58% | 60% |
| $110 |
|
| 2012 | $28.06 | 0.09 | 3.06 | 3.15 | — | (0.71) | (0.71) | $30.50 | 11.62% | 0.80% | 0.24% | 55% |
| $61 |
|
2011(4) | $25.32 | (0.01) | 2.75 | 2.74 | — | — | — | $28.06 | 10.82% | 0.80%(5) | (0.28)%(5) | 75%(6) |
| $28 |
|
| A Class | | | | | | | | | | | | |
| 2014 | $35.47 | (0.14) | 3.61 | 3.47 | — | (4.50) | (4.50) | $34.44 | 11.22% | 1.25% | (0.43)% | 56% |
| $8,837 |
|
| 2013 | $30.36 | 0.04 | 7.19 | 7.23 | (0.07) | (2.05) | (2.12) | $35.47 | 25.42% | 1.25% | 0.13% | 60% |
| $8,517 |
|
| 2012 | $28.05 | (0.02) | 3.04 | 3.02 | — | (0.71) | (0.71) | $30.36 | 11.15% | 1.25% | (0.21)% | 55% |
| $11,334 |
|
2011(4) | $25.32 | (0.02) | 2.75 | 2.73 | — | — | — | $28.05 | 10.78% | 1.25%(5) | (0.73)%(5) | 75%(6) |
| $28 |
|
|
| | | | | | | | | | | | | | | |
| For a Share Outstanding Throughout the Years Ended October 31 (except as noted) |
| Per-Share Data | | | | | | | | Ratios and Supplemental Data | |
| | | Income From Investment Operations: | Distributions From: | | | Ratio to Average Net Assets of: | | |
| | Net Asset
Value,
Beginning
of Period | Net
Investment
Income
(Loss)(1) | Net
Realized
and
Unrealized
Gain (Loss) | Total From
Investment
Operations | Net
Investment
Income | Net
Realized
Gains | Total
Distributions | Net Asset
Value,
End
of Period | Total
Return(2) | Operating
Expenses | Net
Investment
Income
(Loss) | Portfolio
Turnover
Rate | Net
Assets,
End of
Period
(in thousands) |
| C Class | | | | | | | | | | | | |
| 2014 | $34.96 | (0.38) | 3.54 | 3.16 | — | (4.50) | (4.50) | $33.62 | 10.40% | 2.00% | (1.18)% | 56% |
| $3,932 |
|
| 2013 | $30.11 | (0.20) | 7.11 | 6.91 | (0.01) | (2.05) | (2.06) | $34.96 | 24.45% | 2.00% | (0.62)% | 60% |
| $3,321 |
|
| 2012 | $28.03 | (0.25) | 3.04 | 2.79 | — | (0.71) | (0.71) | $30.11 | 10.32% | 2.00% | (0.96)% | 55% |
| $1,993 |
|
2011(4) | $25.32 | (0.03) | 2.74 | 2.71 | — | — | — | $28.03 | 10.70% | 2.00%(5) | (1.48)%(5) | 75%(6) |
| $28 |
|
| R Class | | | | | | | | | | | | |
| 2014 | $35.30 | (0.22) | 3.58 | 3.36 | — | (4.50) | (4.50) | $34.16 | 10.93% | 1.50% | (0.68)% | 56% |
| $9,743 |
|
| 2013 | $30.27 | (0.09) | 7.22 | 7.13 | (0.05) | (2.05) | (2.10) | $35.30 | 25.12% | 1.50% | (0.12)% | 60% |
| $5,828 |
|
| 2012 | $28.04 | (0.08) | 3.02 | 2.94 | — | (0.71) | (0.71) | $30.27 | 10.86% | 1.50% | (0.46)% | 55% |
| $864 |
|
2011(4) | $25.32 | (0.02) | 2.74 | 2.72 | — | — | — | $28.04 | 10.74% | 1.50%(5) | (0.98)%(5) | 75%(6) |
| $28 |
|
|
|
| Notes to Financial Highlights |
| |
| (1) | Computed using average shares outstanding throughout the period. |
| |
| (2) | Total returns are calculated based on the net asset value of the last business day and do not reflect applicable sales charges, if any. Total returns for periods less than one year are not annualized. |
| |
| (3) | Per-share amount was less than $0.005. |
| |
| (4) | September 30, 2011 (commencement of sale) through October 31, 2011. |
| |
| (6) | Portfolio turnover is calculated at the fund level. Percentage indicated was calculated for the year ended October 31, 2011. |
See Notes to Financial Statements.
|
|
| Report of Independent Registered Public Accounting Firm |
To the Board of Directors and Shareholders of
American Century Mutual Funds, Inc.:
We have audited the accompanying statement of assets and liabilities, including the schedule of investments, of All Cap Growth Fund (the “Fund”), one of the funds constituting American Century Mutual Funds, Inc., as of October 31, 2014, and the related statement of operations for the year then ended, the statements of changes in net assets for each of the two years in the period then ended, and the financial highlights for each of the periods presented. These financial statements and financial highlights are the responsibility of the Fund's management. Our responsibility is to express an opinion on these financial statements and financial highlights based on our audits.
We conducted our audits in accordance with the standards of the Public Company Accounting Oversight Board (United States). Those standards require that we plan and perform the audit to obtain reasonable assurance about whether the financial statements and financial highlights are free of material misstatement. The Fund is not required to have, nor were we engaged to perform, an audit of its internal control over financial reporting. Our audits included consideration of internal control over financial reporting as a basis for designing audit procedures that are appropriate in the circumstances, but not for the purpose of expressing an opinion on the effectiveness of the Fund's internal control over financial reporting. Accordingly, we express no such opinion. An audit also includes examining, on a test basis, evidence supporting the amounts and disclosures in the financial statements, assessing the accounting principles used and significant estimates made by management, as well as evaluating the overall financial statement presentation. Our procedures included confirmation of securities owned as of October 31, 2014, by correspondence with the custodian and brokers; where replies were not received from brokers, we performed other auditing procedures. We believe that our audits provide a reasonable basis for our opinion.
In our opinion, the financial statements and financial highlights referred to above present fairly, in all material respects, the financial position of All Cap Growth Fund of American Century Mutual Funds, Inc. as of October 31, 2014, the results of its operations for the year then ended, the changes in its net assets for each of the two years in the period then ended, and the financial highlights for each of the periods presented, in conformity with accounting principles generally accepted in the United States of America.
DELOITTE & TOUCHE LLP
Kansas City, Missouri
December 17, 2014
The Board of Directors
The individuals listed below serve as directors of the funds. Each director will continue to serve in this capacity until death, retirement, resignation or removal from office. The board has adopted a mandatory retirement age for directors who are not “interested persons,” as that term is defined in the Investment Company Act (independent directors). Independent directors shall retire by December 31 of the year in which they reach their 75th birthday.
Mr. Thomas is an “interested person” because he currently serves as President and Chief Executive Officer of American Century Companies, Inc. (ACC), the parent company of American Century Investment Management, Inc. (ACIM or the advisor). Mr. Fink is treated as an “interested person” because of his recent employment with ACC and American Century Services, LLC (ACS). The other directors (more than three-fourths of the total number) are independent. They are not employees, directors or officers of, and have no financial interest in, ACC or any of its wholly owned, direct or indirect, subsidiaries, including ACIM, American Century Investment Services, Inc. (ACIS) and ACS, and they do not have any other affiliations, positions, or relationships that would cause them to be considered “interested persons” under the Investment Company Act. The directors serve in this capacity for seven (in the case of Mr. Thomas, 15) registered investment companies in the American Century Investments family of funds.
The following table presents additional information about the directors. The mailing address for each director is 4500 Main Street, Kansas City, Missouri 64111.
|
| | | | | |
Name
(Year of Birth) | Position(s) Held with Funds | Length of Time Served | Principal Occupation(s) During Past 5 Years | Number of American Century Portfolios Overseen by Director | Other Directorships Held During Past
5 Years |
| Independent Directors | | | | |
Thomas A. Brown
(1940) | Director | Since 1980 | Managing Member, Associated Investments, LLC (real estate investment company); Brown Cascade Properties, LLC (real estate investment company) (2001 to 2009) | 73 | None |
Andrea C. Hall
(1945) | Director | Since 1997 | Retired | 73 | None |
Jan M. Lewis
(1957) | Director | Since 2011 | Retired; President and Chief Executive Officer, Catholic Charities of Northeast Kansas (human services organization) (2006 to 2013) | 73 | None |
James A. Olson
(1942) | Director and Chairman of the Board | Since 2007 (Chairman since 2014) | Member, Plaza Belmont LLC (private equity fund manager) | 73 | Saia, Inc. (2002 to 2012) and EPR Properties (2003 to 2013) |
|
| | | | | |
Name
(Year of Birth) | Position(s) Held with Funds | Length of Time Served | Principal Occupation(s) During Past 5 Years | Number of American Century Portfolios Overseen by Director | Other Directorships Held During Past
5 Years |
| Independent Directors | | | | |
M. Jeannine Strandjord
(1945) | Director | Since 1994 | Retired | 73 | Euronet Worldwide Inc.; Charming Shoppes, Inc. (2006 to 2010); and DST Systems Inc. (1996 to 2012) |
John R. Whitten
(1946) | Director | Since 2008 | Retired | 73 | Rudolph Technologies, Inc. |
Stephen E. Yates
(1948) | Director | Since 2012 | Retired; Executive Vice President, Technology & Operations, KeyCorp. (computer services) (2004 to 2010) | 73 | Applied Industrial Technologies, Inc. (2001 to 2010) |
| Interested Directors | | | | |
Barry Fink
(1955) | Director | Since 2012 | Retired; Executive Vice President, ACC (September 2007 to February 2013); President, ACS (October 2007 to February 2013); Chief Operating Officer, ACC (September 2007 to November 2012) | 73 | None |
Jonathan S. Thomas
(1963) | Director and President | Since 2007 | President and Chief Executive Officer, ACC (March 2007 to present). Also serves as Chief Executive Officer, ACS; Executive Vice President, ACIM; Director, ACC, ACIM and other ACC subsidiaries | 118 | BioMed Valley Discoveries, Inc. |
The Statement of Additional Information has additional information about the fund's directors and is available without charge, upon request, by calling 1-800-345-2021.
Officers
The following table presents certain information about the executive officers of the funds. Each officer serves as an officer for each of the 15 investment companies in the American Century family of funds, unless otherwise noted. No officer is compensated for his or her service as an officer of the funds. The listed officers are interested persons of the funds and are appointed or re-appointed on an annual basis. The mailing address for each officer listed below is 4500 Main Street, Kansas City, Missouri 64111.
|
| | |
Name (Year of Birth) | Offices with the Funds | Principal Occupation(s) During the Past Five Years |
Jonathan S.
Thomas
(1963) | Director and
President
since 2007 | President and Chief Executive Officer, ACC (March 2007 to present). Also serves as Chief Executive Officer, ACS; Executive Vice President, ACIM; Director, ACC, ACIM and other ACC subsidiaries |
Amy D. Shelton
(1964) | Chief Compliance
Officer since 2014 | Chief Compliance Officer, American Century funds, (March 2014 to present); Chief Compliance Officer, ACIM (February 2014 to present); Chief Compliance Officer, ACIS (October 2009 to present); Vice President, Client Interactions and Marketing, ACIS (February 2013 to January 2014); Director, Client Interactions and Marketing, ACIS (June 2007 to January 2013). Also serves as Vice President, ACIS |
Charles A.
Etherington
(1957) | General Counsel
since 2007 and
Senior Vice
President since 2006 | Attorney, ACC (February 1994 to present); Vice President, ACC (November 2005 to present); General Counsel, ACC (March 2007 to present). Also serves as General Counsel, ACIM, ACS, ACIS and other ACC subsidiaries; and Senior Vice President, ACIM and ACS |
C. Jean Wade
(1964) | Vice President,
Treasurer and
Chief Financial
Officer since 2012 | Vice President, ACS (February 2000 to present) |
Robert J.
Leach
(1966) | Vice President
since 2006 and
Assistant Treasurer
since 2012 | Vice President, ACS (February 2000 to present) |
David H.
Reinmiller
(1963) | Vice President
since 2000 | Attorney, ACC (January 1994 to present); Associate General Counsel, ACC (January 2001 to present). Also serves as Vice President, ACIM and ACS |
Ward D.
Stauffer
(1960) | Secretary
since 2005 | Attorney, ACC (June 2003 to present) |
|
|
| Approval of Management Agreement |
At a meeting held on June 18, 2014, the Fund’s Board of Directors unanimously approved the renewal of the management agreement pursuant to which American Century Investment Management, Inc. (the “Advisor”) acts as the investment advisor for the Fund. Under Section 15(c) of the Investment Company Act, contracts for investment advisory services are required to be reviewed, evaluated, and approved by a majority of a fund’s directors (the “Directors”), including a majority of the independent Directors, each year.
Prior to its consideration of the renewal of the management agreement, the Board requested and reviewed extensive data and information compiled by the Advisor and certain independent providers of evaluation data concerning the Fund and the services provided to the Fund by the Advisor. This review was in addition to the oversight and evaluation undertaken by the Board and its committees on a continuous basis and the information received was supplemental to the extensive information that the Board and its committees receive and consider throughout the year.
In connection with its consideration of the renewal of the management agreement, the Board’s review and evaluation of the services provided by the Advisor included, but was not limited to, the following:
| |
| • | the nature, extent, and quality of investment management, shareholder services, and other services provided by the Advisor to the Fund; |
| |
| • | the wide range of other programs and services the Advisor provides to the Fund and its shareholders on a routine and non-routine basis; |
| |
| • | the Fund’s investment performance compared to appropriate benchmarks and/or a peer group of other mutual funds with similar investment objectives and strategies; |
| |
| • | the cost of owning the Fund compared to the cost of owning similar funds; |
| |
| • | the Advisor’s compliance policies, procedures, and regulatory experience; |
| |
| • | financial data showing the cost of services provided to the Fund, the profitability of the Fund to the Advisor, and the overall profitability of the Advisor; |
| |
| • | possible economies of scale associated with the Advisor’s management of the Fund and other accounts under its management; |
| |
| • | the services provided and charges to other investment management clients of the Advisor; |
| |
| • | acquired fund fees and expenses; and |
| |
| • | any collateral benefits derived by the Advisor from the management of the Fund. |
In keeping with its practice, the Board held two in-person meetings and one telephonic meeting to review and discuss the information provided. The independent Directors also had the benefit of the advice of their independent counsel throughout the process.
Factors Considered
The Directors considered all of the information provided by the Advisor, the independent data providers, and independent counsel, and evaluated such information for the Fund. In connection with their review, the Directors did not identify any single factor as being all-important or controlling, and each Director may have attributed different levels of importance to different factors. In deciding to renew the management agreement, the Board based its decision on a number of factors, including the following:
Nature, Extent and Quality of Services — Generally. Under the management agreement, the Advisor is responsible for providing or arranging for all services necessary for the operation of the Fund. The Board noted that under the management agreement, the Advisor provides or arranges at its own expense a wide variety of services including:
| |
| • | constructing and designing the Fund |
| |
| • | portfolio research and security selection |
| |
| • | initial capitalization/funding |
| |
| • | daily valuation of the Fund’s portfolio |
| |
| • | shareholder servicing and transfer agency, including shareholder confirmations, recordkeeping, and communications |
| |
| • | legal services (except the independent Directors’ counsel) |
| |
| • | regulatory and portfolio compliance |
| |
| • | marketing and distribution (except Rule 12b-1 plans) |
The Board noted that many of these services have expanded over time both in terms of quantity and complexity in response to shareholder demands, competition in the industry, changing distribution channels, and the changing regulatory environment.
Investment Management Services. The nature of the investment management services provided to the Fund is quite complex and allows Fund shareholders access to professional money management, instant diversification of their investments within an asset class, the opportunity to easily diversify among asset classes by investing in or exchanging among various American Century Investments funds, and liquidity. In evaluating investment performance, the Board expects the Advisor to manage the Fund in accordance with its investment objectives and approved strategies. Further, the Directors recognize that the Advisor has an obligation to monitor trading activities, and in particular to seek the best execution of fund trades, and to evaluate the use of and payment for research. In providing these services, the Advisor utilizes teams of investment professionals (portfolio managers, analysts, research assistants, and securities traders) who require extensive information technology, research, training, compliance and other systems to conduct their business. The Board, directly and through its Fund Performance Review Committee, regularly reviews investment performance information for the Fund, together with comparative information for appropriate benchmarks and/or peer groups of similarly-managed funds, over different time horizons. The Directors also review detailed performance information during the management agreement approval process. If performance concerns are identified, the Fund receives special reviews until performance improves, during which the Board discusses with the Advisor the reasons for such results (e.g., market conditions, security selection) and any efforts being undertaken to improve performance. The Fund’s performance was above its benchmark for the ten-year period and below its benchmark for the one-, three-, and five-year periods reviewed by the Board. The Board discussed the Fund’s performance with the Advisor and was satisfied with the efforts being undertaken by the Advisor. The Board found the investment management services provided by the Advisor to the Fund to be satisfactory and consistent with the management agreement.
Shareholder and Other Services. Under the management agreement, the Advisor provides the Fund with a comprehensive package of transfer agency, shareholder, and other services. The Board, directly and through various committees of the Board, regularly reviews reports and evaluations of such services at its regular meetings. These reports include, but are not limited to, information regarding the operational efficiency and accuracy of the shareholder and transfer agency services provided, staffing levels, shareholder satisfaction (as measured by external as well as internal sources), technology support, new products and services offered to Fund shareholders, securities trading activities, portfolio valuation services, auditing services, and legal and operational compliance activities. Certain aspects of shareholder and transfer agency service level efficiency
and the quality of securities trading activities are measured by independent third party providers and are presented in comparison to other fund groups not managed by the Advisor. The Board found the services provided by the Advisor to the Fund under the management agreement to be competitive and of high quality.
Costs of Services and Profitability. The Advisor provides detailed information concerning its cost of providing various services to the Fund, its profitability in managing the Fund (pre- and post-distribution), its overall profitability, and its financial condition. The Directors have reviewed with the Advisor the methodology used to prepare this financial information. The financial information regarding the Advisor is considered in evaluating the Advisor’s financial condition, its ability to continue to provide services under the management agreement, and the reasonableness of the current management fee. The Board concluded that the Advisor’s profits were reasonable in light of the services provided to the Fund.
Ethics. The Board generally considers the Advisor’s commitment to providing quality services to shareholders and to conducting its business ethically. They noted that the Advisor’s practices generally meet or exceed industry best practices.
Economies of Scale. The Board also reviewed information provided by the Advisor regarding the possible existence of economies of scale in connection with the management of the Fund. The Board concluded that economies of scale are difficult to measure and predict with precision, especially on a fund-by-fund basis. The Board concluded that the Advisor is appropriately sharing economies of scale through its competitive fee structure, offering competitive fees from fund inception, and through reinvestment in its business to provide shareholders additional content and services.
Comparison to Other Funds’ Fees. The management agreement provides that the Fund pays the Advisor a single, all-inclusive (or unified) management fee for providing all services necessary for the management and operation of the Fund, other than brokerage expenses, taxes, interest, extraordinary expenses, and the fees and expenses of the Fund’s independent directors (including their independent legal counsel) and expenses incurred in connection with the provision of shareholder services and distribution services under a plan adopted pursuant to Rule 12b-1 under the 1940 Act. Under the unified fee structure, the Advisor is responsible for providing all investment advisory, custody, audit, administrative, compliance, recordkeeping, marketing and shareholder services, or arranging and supervising third parties to provide such services. By contrast, most other funds are charged a variety of fees, including an investment advisory fee, a transfer agency fee, an administrative fee, distribution charges and other expenses. Other than their investment advisory fees and any applicable Rule 12b-1 distribution fees, all other components of the total fees charged by these other funds may be increased without shareholder approval. The Board believes the unified fee structure is a benefit to Fund shareholders because it clearly discloses to shareholders the cost of owning Fund shares, and, since the unified fee cannot be increased without a vote of Fund shareholders, it shifts to the Advisor the risk of increased costs of operating the Fund and provides a direct incentive to minimize administrative inefficiencies. Part of the Board’s analysis of fee levels involves reviewing certain evaluative data compiled by an independent provider comparing the Fund’s unified fee to the total expense ratios of its peers. The unified fee charged to shareholders of the Fund was below the median of the total expense ratios of the Fund’s peer expense universe and was within the range of its peer expense group. The Board concluded that the management fee paid by the Fund to the Advisor under the management agreement is reasonable in light of the services provided to the Fund.
Comparison to Fees and Services Provided to Other Clients of the Advisor. The Board also requested and received information from the Advisor concerning the nature of the services, fees, costs and profitability of its advisory services to advisory clients other than the Fund. They observed that these varying types of client accounts require different services and involve different regulatory and entrepreneurial risks than the management of the Fund. The Board analyzed this information and concluded that the fees charged and services provided to the Fund were reasonable by comparison.
Collateral or “Fall-Out” Benefits Derived by the Advisor. The Board considered the existence of collateral benefits the Advisor may receive as a result of its relationship with the Fund. They concluded that the Advisor’s primary business is managing mutual funds and it generally does not use fund or shareholder information to generate profits in other lines of business, and therefore does not derive any significant collateral benefits from them. The Board noted that the Advisor receives proprietary research from broker-dealers that execute fund portfolio transactions and concluded that this research is likely to benefit Fund shareholders. The Board also determined that the Advisor is able to provide investment management services to certain clients other than the Fund, at least in part, due to its existing infrastructure built to serve the fund complex. The Board concluded, however, that the assets of those other clients are not material to its analysis.
Existing Relationship. The Board also considered whether there was any reason for not continuing the existing arrangement with the Advisor. In this regard, the Board was mindful of the potential disruptions of the Fund’s operations and various risks, uncertainties, and other effects that could occur as a result of a decision not to continue such relationship. In particular, the Board recognized that most shareholders have invested in the Fund on the strength of the Advisor’s industry standing and reputation and in the expectation that the Advisor will have a continuing role in providing advisory services to the Fund.
Conclusion of the Directors. As a result of this process, the Board, including all of the independent Directors, taking into account all of the factors discussed above and the information provided by the Advisor and others, concluded that the management agreement between the Fund and the Advisor is fair and reasonable in light of the services provided and should be renewed.
Retirement Account Information
As required by law, distributions you receive from certain IRAs are subject to federal income tax withholding, unless you elect not to have withholding apply. Tax will be withheld on the total amount withdrawn even though you may be receiving amounts that are not subject to withholding, such as nondeductible contributions. In such case, excess amounts of withholding could occur. You may adjust your withholding election so that a greater or lesser amount will be withheld.
If you don’t want us to withhold on this amount, you must notify us to not withhold the federal income tax. You may notify us in writing or in certain situations by telephone or through other electronic means. For systematic withdrawals, your withholding election will remain in effect until revoked or changed by filing a new election. You have the right to revoke your election at any time.
Remember, even if you elect not to have income tax withheld, you are liable for paying income tax on the taxable portion of your withdrawal. If you elect not to have income tax withheld or you don’t have enough income tax withheld, you may be responsible for payment of estimated tax. You may incur penalties under the estimated tax rules if your withholding and estimated tax payments are not sufficient. You can reduce or defer the income tax on a distribution by directly or indirectly rolling such distribution over to another IRA or eligible plan. You should consult your tax advisor for additional information.
State tax will be withheld if, at the time of your distribution, your address is within one of the mandatory withholding states and you have federal income tax withheld (or as otherwise required by state law). State taxes will be withheld from your distribution in accordance with the respective state rules.
Distributions you receive from 403(b), 457 and qualified plans are subject to special tax and withholding rules. Your plan administrator or plan sponsor is required to provide you with a special tax notice explaining those rules at the time you request a distribution. If applicable, federal and/or state taxes may be withheld from your distribution amount.
Proxy Voting Policies
A description of the policies that the fund's investment advisor uses in exercising the voting rights associated with the securities purchased and/or held by the fund is available without charge, upon request, by calling 1-800-345-2021. It is also available on the "About Us" page of American Century Investments’ website at americancentury.com and on the Securities and Exchange Commission’s website at sec.gov. Information regarding how the investment advisor voted proxies relating to portfolio securities during the most recent 12-month period ended June 30 is available on the "About Us" page at americancentury.com. It is also available at sec.gov.
Quarterly Portfolio Disclosure
The fund files its complete schedule of portfolio holdings with the Securities and Exchange Commission (SEC) for the first and third quarters of each fiscal year on Form N-Q. The fund’s Forms N-Q are available on the SEC’s website at sec.gov, and may be reviewed and copied at the SEC’s Public Reference Room in Washington, DC. Information on the operation of the Public Reference Room may be obtained by calling 1-800-SEC-0330. The fund also makes its complete schedule of portfolio holdings for the most recent quarter of its fiscal year available on its
website at americancentury.com and, upon request, by calling 1-800-345-2021.
Other Tax Information
The following information is provided pursuant to provisions of the Internal Revenue Code.
The fund hereby designates up to the maximum amount allowable as qualified dividend income for the fiscal year ended October 31, 2014.
For corporate taxpayers, the fund hereby designates $10,871,152, or up to the maximum amount allowable, of ordinary income distributions paid during the fiscal year ended October 31, 2014 as qualified for the corporate dividends received deduction.
The fund hereby designates $12,321,590 as qualified short-term capital gain distributions for purposes of Internal Revenue Code Section 871 for the fiscal year ended October 31, 2014.
The fund hereby designates $135,863,054, or up to the maximum amount allowable, as long-term capital gain distributions for the fiscal year ended October 31, 2014.
The fund utilized earnings and profits of $10,510,345 distributed to shareholders on redemption of
shares as part of the dividends paid deduction (tax equalization).
|
| | |
| |
| | | |
| Contact Us | americancentury.com | |
| Automated Information Line | 1-800-345-8765 | |
| Investor Services Representative | 1-800-345-2021 or 816-531-5575 | |
| Investors Using Advisors | 1-800-378-9878 | |
| Business, Not-For-Profit, Employer-Sponsored Retirement Plans | 1-800-345-3533 | |
| Banks and Trust Companies, Broker-Dealers, Financial Professionals, Insurance Companies | 1-800-345-6488 | |
| Telecommunications Relay Service for the Deaf | 711 | |
| | | |
| American Century Mutual Funds, Inc. | |
| | | |
Investment Advisor: American Century Investment Management, Inc. Kansas City, Missouri | |
| | | |
| This report and the statements it contains are submitted for the general information of our shareholders. The report is not authorized for distribution to prospective investors unless preceded or accompanied by an effective prospectus. | |
| | | |
©2014 American Century Proprietary Holdings, Inc. All rights reserved.
CL-ANN-84002 1412 | |
|
| |
| ANNUAL REPORT | OCTOBER 31, 2014 |
Balanced Fund
|
| |
| President’s Letter | |
| Performance | |
| Portfolio Commentary | |
| Fund Characteristics | |
| Shareholder Fee Example | |
| Schedule of Investments | |
| Statement of Assets and Liabilities | |
| Statement of Operations | |
| Statement of Changes in Net Assets | |
| Notes to Financial Statements | |
| Financial Highlights | |
| Report of Independent Registered Public Accounting Firm | |
| Management | |
| Approval of Management Agreement | |
| Additional Information | |
Any opinions expressed in this report reflect those of the author as of the date of the report, and do not necessarily represent the opinions of American Century Investments® or any other person in the American Century Investments organization. Any such opinions are subject to change at any time based upon market or other conditions and American Century Investments disclaims any responsibility to update such opinions. These opinions may not be relied upon as investment advice and, because investment decisions made by American Century Investments funds are based on numerous factors, may not be relied upon as an indication of trading intent on behalf of any American Century Investments fund. Security examples are used for representational purposes only and are not intended as recommendations to purchase or sell securities. Performance information for comparative indices and securities is provided to American Century Investments by third party vendors. To the best of American Century Investments’ knowledge, such information is accurate at the time of printing.
|
| |
| Dear Investor:
Thank you for reviewing this annual report for the 12 months ended October 31, 2014. It provides investment performance and portfolio information for the reporting period, plus longer-term historical performance data.
Annual reports remain important vehicles for conveying information about fund returns, including market and economic factors that affected performance during the reporting period. For additional, updated investment and market insights, we encourage you to visit our website, americancentury.com. |
| Jonathan Thomas |
Favorable Fiscal Year for U.S. Stocks and Bonds
Mostly stimulative monetary policies by central banks and expectations of longer-term economic improvement, interspersed with concerns about nearer-term weaker-than-expected global economic data and geopolitical conflicts, helped drive financial market returns during the reporting period. We believe the combination of longer-term optimism about U.S. economic growth, low costs of capital, and continued central bank stimulus (even as the U.S. Federal Reserve’s latest monthly bond purchase program ended) helped persuade investors to seek risk and yield, which benefited U.S. stocks and bonds. The S&P 500 Index gained 17.27% during the 12 months. The 30-year U.S. Treasury bond was close behind, returning 15.44%, according to Barclays. U.S. real estate investment trusts (REITs), whose shares combine performance attributes of stocks and bonds, benefited from both—the MSCI U.S. REIT Index advanced 19.19%.
U.S. market benchmark returns generally outpaced their non-U.S. counterparts. The U.S. was perceived by investors as a relative bastion of growth, stability, and potentially attractive yields compared with most of the rest of the world, so capital flows generally favored U.S. assets. These capital flows, along with weaker-than-expected global growth, lower-than-expected global inflation, and falling commodity and energy prices, helped keep long-term interest rates and other corporate costs low. U.S. stocks just completed a solid third-quarter earnings reporting season, though questions remain about next year’s revenues, given this year’s slowdown in global economic growth and concerns about how far it could extend into 2015.
We believe continuing global economic and geopolitical uncertainties could continue to support the relative appeal of U.S. assets in coming months. But the end of the U.S. Federal Reserve’s monthly bond-buying program and the still-looming possibility of higher interest rates in 2015 point to potential U.S. market volatility ahead. In this environment, we continue to believe in a disciplined, diversified, long-term investment approach, using professionally managed stock and bond portfolios for meeting financial goals. We appreciate your continued trust in us.
Sincerely,
Jonathan Thomas
President and Chief Executive Officer
American Century Investments
|
| | | | | | |
| Total Returns as of October 31, 2014 | |
| | | | Average Annual Returns | |
| | Ticker Symbol | 1 year | 5 years | 10 years | Since Inception | Inception Date |
| Investor Class | TWBIX | 10.76% | 11.58% | 6.91% | 8.25% | 10/20/88 |
Blended Index(1) | — | 11.93% | 11.81% | 7.05% | 9.16%(2) | — |
| S&P 500 Index | — | 17.27% | 16.68% | 8.20% | 10.31%(2) | — |
| Barclays U.S. Aggregate Bond Index | — | 4.14% | 4.22% | 4.63% | 6.71%(2) | — |
| Institutional Class | ABINX | 10.98% | 11.79% | 7.13% | 5.22% | 5/1/00 |
| |
| (1) | The blended index combines monthly returns of two widely known indices in proportion to the asset mix of the fund. The S&P 500 Index represents 60% of the index and the remaining 40% is represented by the Barclays U.S. Aggregate Bond Index. |
| |
| (2) | Since October 31, 1988, the date nearest the Investor Class’s inception for which data are available. |
|
|
| Growth of $10,000 Over 10 Years |
| $10,000 investment made October 31, 2004 |
| Performance for other share classes will vary due to differences in fee structure. |
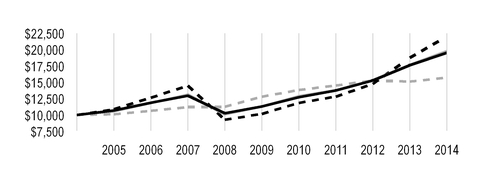
|
| |
| Value on October 31, 2014 |
| | Investor Class — $19,521 |
| |
| | Blended Index — $19,773 |
| |
| | S&P 500 Index — $22,001 |
| |
| | Barclays U.S. Aggregate Bond Index — $15,734 |
| |
|
| |
| Total Annual Fund Operating Expenses | |
| Investor Class | Institutional Class |
| 0.91% | 0.71% |
The total annual fund operating expenses shown is as stated in the fund’s prospectus current as of the date of this report. The prospectus may vary from the expense ratio shown elsewhere in this report because it is based on a different time period, includes acquired fund fees and expenses, and, if applicable, does not include fee waivers or expense reimbursements.
Data presented reflect past performance. Past performance is no guarantee of future results. Current performance may be higher or lower than the performance shown. Investment return and principal value will fluctuate, and redemption value may be more or less than original cost. Data assumes reinvestment of dividends and capital gains, and none of the charts reflect the deduction of taxes that a shareholder would pay on fund distributions or the redemption of fund shares. To obtain performance data current to the most recent month end, please call 1-800-345-2021 or visit americancentury.com. For additional information about the fund, please consult the prospectus.
Equity Portfolio Managers: Bill Martin and Claudia Musat
Fixed-Income Portfolio Managers: Dave MacEwen, Bob Gahagan, and Brian Howell
Performance Summary
Balanced returned 10.76%* for the fiscal year ended October 31, 2014. By comparison, the fund’s benchmark (a blended index consisting of 60% S&P 500 Index and 40% Barclays U.S. Aggregate Bond Index) returned 11.93%. The equity portion of Balanced underperformed the 17.27% return of the S&P 500 Index, while the fixed-income component outperformed the 4.14% return of the Barclays U.S. Aggregate Bond Index.
Financials Stocks Leading Equity Detractors
Stock selection in the financials sector was a main driver of underperformance, particularly in thrifts and mortgage finance companies and capital markets holdings. Security selection and positioning in the banking industry also weighed on results. Leading underperformers included a portfolio-only position in mortgage service provider Ocwen Financial Corporation, which fell steeply in light of possible legal action by a group of investors as well as a New York State investigation into conflicts of interest. The holding was sold due to its uncertain future. A portfolio-only position in investment management company Waddell & Reed Financial, which declined despite repeatedly beating quarterly earnings expectations on concerns over expense management and insider selling, hampered results. In spite of the recent investor skittishness surrounding the stock, we find the holding compelling given its very attractive valuation and quality insights.
Overweight positions, relative to the benchmark, in a number of retailers in the consumer discretionary sector also detracted from results. Video game retailer GameStop underperformed due to sluggish sales during the 2013 holiday season. Despite difficulty seen early in the reporting period, the holding appears attractive on strong valuation and quality factors. The fund’s position in office products superstore Staples, which fell on disappointing revenues and profits and an announcement of 225 store closings, was detrimental. Retail giant Target lagged in the wake of news about a security breach in its credit card payment system, as well as greater-than-expected cost increases associated with expansion. Both retailers were liquidated from the fund. Elsewhere in the sector, casino game equipment maker International Game Technology fell on disappointing earnings stemming from declining slot machine sales and we ultimately exited our position in the holding.
Positive contribution to results came from stock selection in the industrials, consumer staples, and energy sectors. Airline holdings, such as Southwest Airlines, were particularly beneficial. The company’s stock soared on strong revenues and earnings driven by rising traffic and declining oil prices. Among consumer staples, several poultry processors in the food products industry bolstered the fund’s gains, including an overweight position in Tyson Foods, which advanced on higher demand for poultry products and on general industry consolidation. Elsewhere in the sector, security selection in household products and beverage manufacturers also drove relative gains although no single position was a leading portfolio contributor.
* All fund returns referenced in this commentary are for Investor Class shares. Performance for other share classes will vary due to differences in fee structure; when Investor Class performance exceeds that of the fund’s benchmark, other share classes may not. See page 3 for returns for all share classes.
Energy sector holdings were also top relative performers. Drilling and rig services provider Nabors Industries rose on solid earnings and merger news during the first half of the period. Benefiting from an improving economic landscape, demand for refinery services, and rising oil prices early in the period, oil refiner Marathon Petroleum also contributed to gains. Given substantial appreciation in both stocks we opted to lock in gains and exited the positions.
Elsewhere in the fund, leading individual contributors included a portfolio-only position in apparel manufacturer Hanesbrands, whose earnings growth and announced intent to purchase French clothing manufacturer DBApparel, thereby increasing exposure in Europe, helped to drive its stock price higher. We sold out of the holding after substantial appreciation caused its valuation insights to become less attractive. Likewise, an underweight position in online retailer Amazon.com benefited the fund as concerns about the company’s profitability amid rising capital expenditures and falling margins pushed the stock price down. The position was liquidated by period-end.
Fixed-Income Portfolio Advanced
We continued to underweight, relative to the benchmark, Treasuries and government agencies in favor of spread (non-Treasury) sectors, including corporate credit and securitized sectors, throughout the 12-month period. Within the corporate allocation, security selection, combined with small, out-of-benchmark positions in high-yield securities, contributed strongly to the portfolio’s performance. Similarly, the overweight allocation and security selection within the securitized sector contributed favorably to results. In particular, our selections among traditional pass-through mortgage-backed securities, structured mortgage securities, and asset-backed securities contributed to performance.
Anticipating a gradual increase in U.S. interest rates, stemming from improving economic data and the Federal Reserve’s winding down of quantitative easing, we shortened the portfolio’s overall duration stance relative to the benchmark. This contributed favorably to performance early in the 12-month period, but the strategy detracted from results during 2014, as interest rates generally declined.
Outlook
Economic recovery in the U.S. appears to be progressing, albeit at a slower pace than during prior post-recessionary periods, and is expected to stay the course into 2015. Recent economic indicators such as improvements in consumer confidence and rising corporate profits and revenues point to a sustainable rebound, and economic growth is likely to further benefit from the ongoing recovery in the labor and housing markets. We expect interest rates and inflation to remain at current historically low levels in the near term, but longer-term increases are likely based on improving economic fundamentals and wage growth. Though a continuation of political instability in non-U.S. markets as well as the potential for rising inflation and interest rates could lead to heightened market volatility, we believe that our disciplined, objective, and systematic investment strategy, for both the equity and fixed-income components of the portfolio, is particularly beneficial during periods of volatility and we adhere to our process regardless of the market environment, allowing us to take advantage of opportunities presented by market inefficiencies.
|
| |
| OCTOBER 31, 2014 | |
| Top Ten Common Stocks | % of net assets |
| Apple, Inc. | 2.1% |
| Microsoft Corp. | 1.7% |
| Johnson & Johnson | 1.5% |
| Intel Corp. | 1.1% |
| Exxon Mobil Corp. | 1.1% |
| Pfizer, Inc. | 1.1% |
| Gilead Sciences, Inc. | 1.0% |
| Merck & Co., Inc. | 1.0% |
| Amgen, Inc. | 1.0% |
| Oracle Corp. | 0.9% |
| | |
| Top Five Common Stocks Industries | % of net assets |
| Pharmaceuticals | 4.5% |
| Oil, Gas and Consumable Fuels | 3.7% |
| Technology Hardware, Storage and Peripherals | 3.4% |
| Software | 3.3% |
| Biotechnology | 3.3% |
| | |
| Types of Investments in Portfolio | % of net assets |
| Common Stocks | 59.8% |
| Corporate Bonds | 11.1% |
| U.S. Treasury Securities | 10.9% |
| U.S. Government Agency Mortgage-Backed Securities | 10.7% |
| Collateralized Mortgage Obligations | 2.4% |
| Commercial Mortgage-Backed Securities | 2.2% |
| Asset-Backed Securities | 1.3% |
| Sovereign Governments and Agencies | 0.6% |
| Municipal Securities | 0.4% |
| U.S. Government Agency Securities | 0.1% |
| Temporary Cash Investments | 1.2% |
| Other Assets and Liabilities | (0.7)% |
| | |
| Key Fixed-Income Portfolio Statistics | |
| Weighted Average Life | 6.8 years |
| Average Duration (effective) | 5.1 years |
Fund shareholders may incur two types of costs: (1) transaction costs, including sales charges (loads) on purchase payments and redemption/exchange fees; and (2) ongoing costs, including management fees; distribution and service (12b-1) fees; and other fund expenses. This example is intended to help you understand your ongoing costs (in dollars) of investing in your fund and to compare these costs with the ongoing cost of investing in other mutual funds.
The example is based on an investment of $1,000 made at the beginning of the period and held for the entire period from May 1, 2014 to October 31, 2014.
Actual Expenses
The table provides information about actual account values and actual expenses for each class. You may use the information, together with the amount you invested, to estimate the expenses that you paid over the period. First, identify the share class you own. Then simply divide your account value by $1,000 (for example, an $8,600 account value divided by $1,000 = 8.6), then multiply the result by the number under the heading “Expenses Paid During Period” to estimate the expenses you paid on your account during this period.
If you hold Investor Class shares of any American Century Investments fund, or Institutional Class shares of the American Century Diversified Bond Fund, in an American Century Investments account (i.e., not a financial intermediary or retirement plan account), American Century Investments may charge you a $12.50 semiannual account maintenance fee if the value of those shares is less than $10,000. We will redeem shares automatically in one of your accounts to pay the $12.50 fee. In determining your total eligible investment amount, we will include your investments in all personal accounts (including American Century Investments Brokerage accounts) registered under your Social Security number. Personal accounts include individual accounts, joint accounts, UGMA/UTMA accounts, personal trusts, Coverdell Education Savings Accounts and IRAs (including traditional, Roth, Rollover, SEP-, SARSEP- and SIMPLE-IRAs), and certain other retirement accounts. If you have only business, business retirement, employer-sponsored or American Century Investments Brokerage accounts, you are currently not subject to this fee. If you are subject to the Account Maintenance Fee, your account value could be reduced by the fee amount.
Hypothetical Example for Comparison Purposes
The table also provides information about hypothetical account values and hypothetical expenses based on the actual expense ratio of each class of your fund and an assumed rate of return of 5% per year before expenses, which is not the actual return of a fund’s share class. The hypothetical account values and expenses may not be used to estimate the actual ending account balance or expenses you paid for the period. You may use this information to compare the ongoing costs of investing in your fund and other funds. To do so, compare this 5% hypothetical example with the 5% hypothetical examples that appear in the shareholder reports of the other funds.
Please note that the expenses shown in the table are meant to highlight your ongoing costs only and do not reflect any transactional costs, such as sales charges (loads) or redemption/exchange fees. Therefore, the table is useful in comparing ongoing costs only, and will not help you determine the relative total costs of owning different funds. In addition, if these transactional costs were included, your costs would have been higher.
|
| | | | |
| Beginning
Account Value
5/1/14 | Ending
Account Value
10/31/14 | Expenses Paid
During Period(1)5/1/14 - 10/31/14 |
Annualized
Expense Ratio(1) |
| Actual | | | | |
| Investor Class | $1,000 | $1,045.70 | $4.64 | 0.90% |
| Institutional Class | $1,000 | $1,046.80 | $3.61 | 0.70% |
| Hypothetical | | | | |
| Investor Class | $1,000 | $1,020.67 | $4.58 | 0.90% |
| Institutional Class | $1,000 | $1,021.68 | $3.57 | 0.70% |
| |
| (1) | Expenses are equal to the class's annualized expense ratio listed in the table above, multiplied by the average account value over the period, multiplied by 184, the number of days in the most recent fiscal half-year, divided by 365, to reflect the one-half year period. |
OCTOBER 31, 2014
|
| | | | | | |
| | Shares/Principal Amount | Value |
| COMMON STOCKS — 59.8% | | |
| Aerospace and Defense — 2.8% | | |
| Boeing Co. (The) | 29,391 |
| $ | 3,671,230 |
|
| Honeywell International, Inc. | 61,982 |
| 5,957,710 |
|
| Lockheed Martin Corp. | 31,771 |
| 6,054,599 |
|
| Northrop Grumman Corp. | 7,535 |
| 1,039,529 |
|
| Raytheon Co. | 54,895 |
| 5,702,492 |
|
| United Technologies Corp. | 19,169 |
| 2,051,083 |
|
| | | 24,476,643 |
|
| Air Freight and Logistics — 0.7% | | |
| United Parcel Service, Inc., Class B | 58,894 |
| 6,178,570 |
|
| Airlines — 0.5% | | |
| Southwest Airlines Co. | 135,372 |
| 4,667,627 |
|
| Auto Components — 0.4% | | |
| Magna International, Inc. | 37,276 |
| 3,679,514 |
|
| Banks — 2.1% | | |
| Bank of America Corp. | 278,079 |
| 4,771,835 |
|
| Citigroup, Inc. | 7,360 |
| 393,981 |
|
| JPMorgan Chase & Co. | 98,827 |
| 5,977,057 |
|
| SunTrust Banks, Inc. | 87,149 |
| 3,411,012 |
|
| Wells Fargo & Co. | 59,091 |
| 3,137,141 |
|
| | | 17,691,026 |
|
| Beverages — 0.7% | | |
| Coca-Cola Co. (The) | 9,727 |
| 407,367 |
|
| Dr Pepper Snapple Group, Inc. | 75,164 |
| 5,205,107 |
|
| PepsiCo, Inc. | 712 |
| 68,473 |
|
| | | 5,680,947 |
|
| Biotechnology — 3.3% | | |
| Amgen, Inc. | 53,273 |
| 8,639,815 |
|
Biogen Idec, Inc.(1) | 19,460 |
| 6,248,217 |
|
Celgene Corp.(1) | 39,693 |
| 4,250,723 |
|
Gilead Sciences, Inc.(1) | 78,006 |
| 8,736,672 |
|
United Therapeutics Corp.(1) | 2,548 |
| 333,712 |
|
| | | 28,209,139 |
|
| Capital Markets — 0.9% | | |
| Franklin Resources, Inc. | 68,822 |
| 3,827,191 |
|
| T. Rowe Price Group, Inc. | 11,285 |
| 926,386 |
|
| Waddell & Reed Financial, Inc., Class A | 68,595 |
| 3,274,725 |
|
| | | 8,028,302 |
|
| Chemicals — 2.4% | | |
| Albemarle Corp. | 19,164 |
| 1,118,794 |
|
|
| | | | | | |
| | Shares/Principal Amount | Value |
| Ashland, Inc. | 36,447 |
| $ | 3,938,827 |
|
| Cabot Corp. | 54,813 |
| 2,544,968 |
|
| Dow Chemical Co. (The) | 122,226 |
| 6,037,964 |
|
| E.I. du Pont de Nemours & Co. | 8,624 |
| 596,350 |
|
| Eastman Chemical Co. | 47,138 |
| 3,807,808 |
|
| International Flavors & Fragrances, Inc. | 7,867 |
| 780,013 |
|
| Olin Corp. | 25,092 |
| 608,230 |
|
| PPG Industries, Inc. | 6,839 |
| 1,393,036 |
|
| | | 20,825,990 |
|
| Commercial Services and Supplies — 0.1% | | |
| Pitney Bowes, Inc. | 44,521 |
| 1,101,450 |
|
| Communications Equipment — 1.8% | | |
| Cisco Systems, Inc. | 311,909 |
| 7,632,413 |
|
| QUALCOMM, Inc. | 99,080 |
| 7,778,771 |
|
| | | 15,411,184 |
|
| Consumer Finance — 0.5% | | |
| Cash America International, Inc. | 82,474 |
| 4,053,597 |
|
| Containers and Packaging — 0.8% | | |
| Ball Corp. | 64,605 |
| 4,162,500 |
|
| Sonoco Products Co. | 70,451 |
| 2,879,332 |
|
| | | 7,041,832 |
|
| Diversified Consumer Services — 0.5% | | |
| H&R Block, Inc. | 132,923 |
| 4,294,742 |
|
| Diversified Financial Services — 0.8% | | |
Berkshire Hathaway, Inc., Class B(1) | 19,198 |
| 2,690,792 |
|
| Voya Financial, Inc. | 104,685 |
| 4,108,886 |
|
| | | 6,799,678 |
|
| Diversified Telecommunication Services — 0.4% | | |
| AT&T, Inc. | 40,589 |
| 1,414,121 |
|
| Verizon Communications, Inc. | 40,301 |
| 2,025,125 |
|
| | | 3,439,246 |
|
| Electric Utilities — 0.3% | | |
| Entergy Corp. | 29,154 |
| 2,449,519 |
|
| Electrical Equipment — 0.7% | | |
| Emerson Electric Co. | 71,342 |
| 4,570,168 |
|
| Rockwell Automation, Inc. | 9,873 |
| 1,109,232 |
|
| | | 5,679,400 |
|
| Electronic Equipment, Instruments and Components — 0.4% | | |
| TE Connectivity Ltd. | 56,012 |
| 3,424,014 |
|
| Energy Equipment and Services — 1.8% | | |
| Baker Hughes, Inc. | 83,537 |
| 4,424,119 |
|
| National Oilwell Varco, Inc. | 50,339 |
| 3,656,625 |
|
| Schlumberger Ltd. | 75,754 |
| 7,473,890 |
|
| | | 15,554,634 |
|
|
| | | | | | |
| | Shares/Principal Amount | Value |
| Food Products — 2.5% | | |
| Archer-Daniels-Midland Co. | 115,838 |
| $ | 5,444,386 |
|
| Bunge Ltd. | 42,570 |
| 3,773,830 |
|
| Ingredion, Inc. | 35,586 |
| 2,749,019 |
|
| Kellogg Co. | 68,984 |
| 4,412,217 |
|
Pilgrim's Pride Corp.(1) | 92,281 |
| 2,621,703 |
|
| Sanderson Farms, Inc. | 19,746 |
| 1,658,269 |
|
| Tyson Foods, Inc., Class A | 17,451 |
| 704,148 |
|
| | | 21,363,572 |
|
| Gas Utilities — 0.1% | | |
| New Jersey Resources Corp. | 17,516 |
| 1,024,336 |
|
| Health Care Equipment and Supplies — 1.9% | | |
| Becton Dickinson and Co. | 38,977 |
| 5,016,340 |
|
| C.R. Bard, Inc. | 7,215 |
| 1,183,044 |
|
| Medtronic, Inc. | 90,608 |
| 6,175,841 |
|
| St. Jude Medical, Inc. | 61,806 |
| 3,966,091 |
|
| | | 16,341,316 |
|
| Health Care Providers and Services — 0.6% | | |
| Cardinal Health, Inc. | 60,359 |
| 4,736,974 |
|
| Hotels, Restaurants and Leisure — 0.9% | | |
| Las Vegas Sands Corp. | 40,636 |
| 2,529,998 |
|
| Royal Caribbean Cruises Ltd. | 48,124 |
| 3,270,988 |
|
| SeaWorld Entertainment, Inc. | 37,439 |
| 720,326 |
|
| Wyndham Worldwide Corp. | 20,089 |
| 1,560,313 |
|
| | | 8,081,625 |
|
| Household Durables — 0.4% | | |
| Newell Rubbermaid, Inc. | 64,025 |
| 2,133,953 |
|
NVR, Inc.(1) | 1,047 |
| 1,285,276 |
|
| | | 3,419,229 |
|
| Household Products — 1.5% | | |
| Energizer Holdings, Inc. | 38,148 |
| 4,678,852 |
|
| Kimberly-Clark Corp. | 47,295 |
| 5,404,400 |
|
| Procter & Gamble Co. (The) | 28,997 |
| 2,530,568 |
|
| | | 12,613,820 |
|
| Industrial Conglomerates — 0.6% | | |
| 3M Co. | 11,631 |
| 1,788,499 |
|
| General Electric Co. | 135,267 |
| 3,491,241 |
|
| | | 5,279,740 |
|
| Insurance — 2.8% | | |
| Allstate Corp. (The) | 77,195 |
| 5,006,096 |
|
| American International Group, Inc. | 112,322 |
| 6,017,089 |
|
| Amtrust Financial Services, Inc. | 76,749 |
| 3,443,728 |
|
| Aspen Insurance Holdings Ltd. | 57,119 |
| 2,492,102 |
|
| Hanover Insurance Group, Inc. (The) | 45,247 |
| 3,028,834 |
|
| RenaissanceRe Holdings Ltd. | 39,552 |
| 4,086,908 |
|
| | | 24,074,757 |
|
|
| | | | | | |
| | Shares/Principal Amount | Value |
| Internet and Catalog Retail — 0.8% | | |
| Expedia, Inc. | 16,104 |
| $ | 1,368,357 |
|
Priceline Group, Inc. (The)(1) | 4,318 |
| 5,208,415 |
|
| | | 6,576,772 |
|
| Internet Software and Services — 1.3% | | |
eBay, Inc.(1) | 106,196 |
| 5,575,290 |
|
Google, Inc., Class A(1) | 9,831 |
| 5,582,730 |
|
| | | 11,158,020 |
|
| IT Services — 1.1% | | |
| Amdocs Ltd. | 36,371 |
| 1,729,077 |
|
| International Business Machines Corp. | 48,146 |
| 7,915,203 |
|
| | | 9,644,280 |
|
| Machinery — 1.2% | | |
| Caterpillar, Inc. | 56,456 |
| 5,725,203 |
|
| Parker-Hannifin Corp. | 36,317 |
| 4,613,348 |
|
| Snap-On, Inc. | 2,711 |
| 358,232 |
|
| | | 10,696,783 |
|
| Media — 0.8% | | |
| John Wiley & Sons, Inc., Class A | 8,959 |
| 523,116 |
|
| Time Warner, Inc. | 79,370 |
| 6,307,534 |
|
| Walt Disney Co. (The) | 3,197 |
| 292,142 |
|
| | | 7,122,792 |
|
| Multi-Utilities — 0.3% | | |
| Vectren Corp. | 5,335 |
| 239,808 |
|
| Wisconsin Energy Corp. | 51,640 |
| 2,564,443 |
|
| | | 2,804,251 |
|
| Multiline Retail — 1.3% | | |
| Dillard's, Inc., Class A | 30,775 |
| 3,254,764 |
|
| Kohl's Corp. | 68,687 |
| 3,724,209 |
|
| Macy's, Inc. | 78,245 |
| 4,524,126 |
|
| | | 11,503,099 |
|
| Oil, Gas and Consumable Fuels — 3.7% | | |
| Chevron Corp. | 21,004 |
| 2,519,430 |
|
| ConocoPhillips | 63,461 |
| 4,578,711 |
|
| EOG Resources, Inc. | 54,245 |
| 5,155,987 |
|
| Exxon Mobil Corp. | 99,234 |
| 9,596,920 |
|
| Occidental Petroleum Corp. | 61,919 |
| 5,506,457 |
|
| Valero Energy Corp. | 96,035 |
| 4,810,393 |
|
| | | 32,167,898 |
|
| Pharmaceuticals — 4.5% | | |
| AbbVie, Inc. | 119,019 |
| 7,552,946 |
|
| Johnson & Johnson | 120,934 |
| 13,034,266 |
|
| Merck & Co., Inc. | 150,052 |
| 8,694,013 |
|
| Pfizer, Inc. | 315,276 |
| 9,442,516 |
|
| | | 38,723,741 |
|
|
| | | | | | |
| | Shares/Principal Amount | Value |
| Professional Services — 0.3% | | |
| Manpowergroup, Inc. | 35,442 |
| $ | 2,365,753 |
|
| Real Estate Investment Trusts (REITs) — 0.8% | | |
| Geo Group, Inc. (The) | 16,246 |
| 648,865 |
|
| Hospitality Properties Trust | 24,598 |
| 728,347 |
|
| Host Hotels & Resorts, Inc. | 192,213 |
| 4,480,485 |
|
| Pebblebrook Hotel Trust | 12,570 |
| 535,482 |
|
| Potlatch Corp. | 8,043 |
| 353,811 |
|
| Rayonier, Inc. | 16,587 |
| 555,167 |
|
| | | 7,302,157 |
|
| Real Estate Management and Development — 0.1% | | |
Altisource Portfolio Solutions SA(1) | 10,689 |
| 798,041 |
|
| Semiconductors and Semiconductor Equipment — 1.9% | | |
| Broadcom Corp., Class A | 119,958 |
| 5,023,841 |
|
| Intel Corp. | 282,324 |
| 9,601,839 |
|
| Texas Instruments, Inc. | 34,816 |
| 1,728,963 |
|
| | | 16,354,643 |
|
| Software — 3.3% | | |
| Intuit, Inc. | 35,575 |
| 3,130,956 |
|
| Microsoft Corp. | 319,095 |
| 14,981,510 |
|
| Oracle Corp. | 205,829 |
| 8,037,622 |
|
Synopsys, Inc.(1) | 63,564 |
| 2,604,853 |
|
| | | 28,754,941 |
|
| Specialty Retail — 1.6% | | |
AutoZone, Inc.(1) | 7,082 |
| 3,920,029 |
|
| Foot Locker, Inc. | 39,971 |
| 2,238,776 |
|
| GameStop Corp., Class A | 57,720 |
| 2,468,107 |
|
| Lowe's Cos., Inc. | 91,073 |
| 5,209,375 |
|
| | | 13,836,287 |
|
| Technology Hardware, Storage and Peripherals — 3.4% | | |
| Apple, Inc. | 164,159 |
| 17,729,172 |
|
| EMC Corp. | 86,448 |
| 2,483,651 |
|
| Hewlett-Packard Co. | 173,116 |
| 6,211,402 |
|
| Seagate Technology plc | 21,235 |
| 1,334,195 |
|
| Western Digital Corp. | 15,932 |
| 1,567,231 |
|
| | | 29,325,651 |
|
Textiles, Apparel and Luxury Goods† | | |
Deckers Outdoor Corp.(1) | 4,122 |
| 360,510 |
|
| Thrifts and Mortgage Finance — 0.2% | | |
| EverBank Financial Corp. | 104,093 |
| 1,993,381 |
|
TOTAL COMMON STOCKS (Cost $409,485,262) | | 517,111,423 |
|
|
| | | | | | |
| | Shares/Principal Amount | Value |
| CORPORATE BONDS — 11.1% | | |
| Aerospace and Defense — 0.1% | | |
| L-3 Communications Corp., 4.75%, 7/15/20 | $ | 220,000 |
| $ | 239,503 |
|
| Lockheed Martin Corp., 4.25%, 11/15/19 | 250,000 |
| 274,096 |
|
| Raytheon Co., 2.50%, 12/15/22 | 210,000 |
| 203,515 |
|
| United Technologies Corp., 6.05%, 6/1/36 | 250,000 |
| 319,124 |
|
| United Technologies Corp., 5.70%, 4/15/40 | 120,000 |
| 148,719 |
|
| United Technologies Corp., 4.50%, 6/1/42 | 30,000 |
| 32,149 |
|
| | | 1,217,106 |
|
Auto Components† | | |
Schaeffler Finance BV, 4.25%, 5/15/21(2) | 200,000 |
| 195,000 |
|
| Tenneco, Inc., 6.875%, 12/15/20 | 100,000 |
| 107,000 |
|
| | | 302,000 |
|
| Automobiles — 0.2% | | |
American Honda Finance Corp., 1.50%, 9/11/17(2) | 70,000 |
| 70,393 |
|
| American Honda Finance Corp., 2.125%, 10/10/18 | 150,000 |
| 151,422 |
|
Daimler Finance North America LLC, 1.30%, 7/31/15(2) | 200,000 |
| 201,150 |
|
Daimler Finance North America LLC, 2.625%, 9/15/16(2) | 210,000 |
| 216,153 |
|
| Ford Motor Co., 4.75%, 1/15/43 | 70,000 |
| 71,696 |
|
| Ford Motor Credit Co. LLC, 5.00%, 5/15/18 | 250,000 |
| 273,424 |
|
| Ford Motor Credit Co. LLC, 8.125%, 1/15/20 | 150,000 |
| 187,666 |
|
| Ford Motor Credit Co. LLC, 5.875%, 8/2/21 | 440,000 |
| 509,100 |
|
Jaguar Land Rover Automotive plc, 4.125%, 12/15/18(2) | 150,000 |
| 153,375 |
|
| | | 1,834,379 |
|
| Banks — 1.7% | | |
| Bank of America Corp., 4.50%, 4/1/15 | 260,000 |
| 264,233 |
|
| Bank of America Corp., 3.75%, 7/12/16 | 400,000 |
| 417,750 |
|
| Bank of America Corp., 6.50%, 8/1/16 | 480,000 |
| 523,672 |
|
| Bank of America Corp., 5.75%, 12/1/17 | 360,000 |
| 401,013 |
|
| Bank of America Corp., 5.625%, 7/1/20 | 110,000 |
| 125,075 |
|
| Bank of America Corp., 5.70%, 1/24/22 | 220,000 |
| 253,579 |
|
| Bank of America Corp., 4.10%, 7/24/23 | 70,000 |
| 73,128 |
|
| Bank of America Corp., MTN, 4.00%, 4/1/24 | 90,000 |
| 93,064 |
|
| Bank of America Corp., MTN, 4.20%, 8/26/24 | 330,000 |
| 332,619 |
|
| Bank of America Corp., MTN, 5.00%, 1/21/44 | 110,000 |
| 120,681 |
|
| Bank of America N.A., 5.30%, 3/15/17 | 870,000 |
| 943,887 |
|
| Bank of Nova Scotia, 2.55%, 1/12/17 | 150,000 |
| 154,689 |
|
| Barclays Bank plc, 5.14%, 10/14/20 | 200,000 |
| 217,750 |
|
| Barclays Bank plc, 3.75%, 5/15/24 | 200,000 |
| 203,041 |
|
| BB&T Corp., MTN, 3.20%, 3/15/16 | 170,000 |
| 175,472 |
|
| BB&T Corp., MTN, 2.05%, 6/19/18 | 100,000 |
| 100,795 |
|
BPCE SA, 5.15%, 7/21/24(2) | 200,000 |
| 206,147 |
|
| Branch Banking & Trust Co., 3.80%, 10/30/26 | 130,000 |
| 132,111 |
|
| Capital One Financial Corp., 1.00%, 11/6/15 | 90,000 |
| 90,255 |
|
| Citigroup, Inc., 4.45%, 1/10/17 | 100,000 |
| 106,507 |
|
| Citigroup, Inc., 5.50%, 2/15/17 | 90,000 |
| 97,864 |
|
|
| | | | | | |
| | Shares/Principal Amount | Value |
| Citigroup, Inc., 1.75%, 5/1/18 | $ | 710,000 |
| $ | 703,961 |
|
| Citigroup, Inc., 4.50%, 1/14/22 | 560,000 |
| 608,278 |
|
| Citigroup, Inc., 4.05%, 7/30/22 | 70,000 |
| 72,106 |
|
| Citigroup, Inc., 3.75%, 6/16/24 | 680,000 |
| 691,514 |
|
| Citigroup, Inc., 6.00%, 10/31/33 | 120,000 |
| 137,557 |
|
| Citigroup, Inc., 6.68%, 9/13/43 | 80,000 |
| 102,019 |
|
Commerzbank AG, 8.125%, 9/19/23(2) | 200,000 |
| 231,932 |
|
| Cooperatieve Centrale Raiffeisen-Boerenleenbank BA, 3.875%, 2/8/22 | 430,000 |
| 455,506 |
|
| Fifth Third Bancorp, 4.30%, 1/16/24 | 110,000 |
| 114,628 |
|
| Fifth Third Bank, 2.875%, 10/1/21 | 250,000 |
| 248,738 |
|
HBOS plc, MTN, 6.75%, 5/21/18(2) | 200,000 |
| 224,976 |
|
| HSBC Holdings plc, 5.10%, 4/5/21 | 230,000 |
| 260,574 |
|
| HSBC Holdings plc, 4.00%, 3/30/22 | 90,000 |
| 95,808 |
|
Intesa Sanpaolo SpA, 5.02%, 6/26/24(2) | 230,000 |
| 225,115 |
|
| JPMorgan Chase & Co., 6.00%, 1/15/18 | 520,000 |
| 586,388 |
|
| JPMorgan Chase & Co., 4.625%, 5/10/21 | 460,000 |
| 504,729 |
|
| JPMorgan Chase & Co., 3.25%, 9/23/22 | 220,000 |
| 220,599 |
|
| JPMorgan Chase & Co., 3.625%, 5/13/24 | 320,000 |
| 324,243 |
|
| JPMorgan Chase & Co., 3.875%, 9/10/24 | 220,000 |
| 219,362 |
|
| JPMorgan Chase Bank N.A., 5.875%, 6/13/16 | 250,000 |
| 269,418 |
|
| KeyCorp, MTN, 2.30%, 12/13/18 | 220,000 |
| 220,812 |
|
| KFW, 2.00%, 6/1/16 | 260,000 |
| 266,335 |
|
| KFW, 2.00%, 10/4/22 | 300,000 |
| 293,812 |
|
| Royal Bank of Scotland Group plc, 6.125%, 12/15/22 | 230,000 |
| 249,293 |
|
| Royal Bank of Scotland plc (The), 4.375%, 3/16/16 | 250,000 |
| 261,066 |
|
Standard Chartered plc, 3.95%, 1/11/23(2) | 200,000 |
| 196,520 |
|
| SunTrust Banks, Inc., 3.60%, 4/15/16 | 50,000 |
| 51,987 |
|
| U.S. Bancorp, 3.44%, 2/1/16 | 120,000 |
| 123,634 |
|
| U.S. Bancorp, MTN, 3.00%, 3/15/22 | 110,000 |
| 110,678 |
|
| U.S. Bancorp, MTN, 2.95%, 7/15/22 | 60,000 |
| 58,941 |
|
| U.S. Bancorp, MTN, 3.60%, 9/11/24 | 270,000 |
| 272,095 |
|
| Wells Fargo & Co., 3.68%, 6/15/16 | 140,000 |
| 146,396 |
|
| Wells Fargo & Co., 5.625%, 12/11/17 | 20,000 |
| 22,452 |
|
| Wells Fargo & Co., 4.125%, 8/15/23 | 200,000 |
| 208,748 |
|
| Wells Fargo & Co., MTN, 2.10%, 5/8/17 | 20,000 |
| 20,444 |
|
| Wells Fargo & Co., MTN, 4.60%, 4/1/21 | 450,000 |
| 497,595 |
|
| Wells Fargo & Co., MTN, 4.10%, 6/3/26 | 210,000 |
| 213,088 |
|
Wells Fargo & Co., MTN, 4.65%, 11/4/44(3) | 80,000 |
| 80,059 |
|
| | | 14,624,738 |
|
| Beverages — 0.2% | | |
| Anheuser-Busch InBev Worldwide, Inc., 7.75%, 1/15/19 | 460,000 |
| 558,365 |
|
| Anheuser-Busch InBev Worldwide, Inc., 2.50%, 7/15/22 | 460,000 |
| 440,757 |
|
| Coca-Cola Co. (The), 1.80%, 9/1/16 | 180,000 |
| 183,822 |
|
Pernod-Ricard SA, 2.95%, 1/15/17(2) | 180,000 |
| 185,553 |
|
| | | 1,368,497 |
|
|
| | | | | | |
| | Shares/Principal Amount | Value |
| Biotechnology — 0.1% | | |
| Amgen, Inc., 2.125%, 5/15/17 | $ | 180,000 |
| $ | 183,688 |
|
| Amgen, Inc., 4.10%, 6/15/21 | 100,000 |
| 105,969 |
|
| Amgen, Inc., 5.375%, 5/15/43 | 250,000 |
| 278,419 |
|
| Celgene Corp., 3.25%, 8/15/22 | 110,000 |
| 110,483 |
|
| Celgene Corp., 3.625%, 5/15/24 | 300,000 |
| 303,661 |
|
| Gilead Sciences, Inc., 4.40%, 12/1/21 | 220,000 |
| 241,005 |
|
| | | 1,223,225 |
|
| Capital Markets — 0.1% | | |
| Ameriprise Financial, Inc., 4.00%, 10/15/23 | 140,000 |
| 146,977 |
|
| Bear Stearns Cos. LLC (The), 6.40%, 10/2/17 | 370,000 |
| 418,927 |
|
| Jefferies Group, Inc., 5.125%, 4/13/18 | 110,000 |
| 119,408 |
|
| | | 685,312 |
|
| Chemicals — 0.2% | | |
| Ashland, Inc., 4.75%, 8/15/22 | 210,000 |
| 212,625 |
|
| Dow Chemical Co. (The), 2.50%, 2/15/16 | 110,000 |
| 112,370 |
|
| Dow Chemical Co. (The), 4.25%, 11/15/20 | 100,000 |
| 107,826 |
|
| Eastman Chemical Co., 3.60%, 8/15/22 | 198,000 |
| 201,264 |
|
| Ecolab, Inc., 4.35%, 12/8/21 | 250,000 |
| 273,746 |
|
| LyondellBasell Industries NV, 5.00%, 4/15/19 | 200,000 |
| 220,697 |
|
| Mosaic Co. (The), 4.25%, 11/15/23 | 140,000 |
| 147,067 |
|
| Mosaic Co. (The), 5.625%, 11/15/43 | 120,000 |
| 135,716 |
|
| | | 1,411,311 |
|
| Commercial Services and Supplies — 0.1% | | |
| Clean Harbors, Inc., 5.25%, 8/1/20 | 180,000 |
| 185,850 |
|
| Covanta Holding Corp., 5.875%, 3/1/24 | 150,000 |
| 155,625 |
|
| Pitney Bowes, Inc., 4.625%, 3/15/24 | 160,000 |
| 163,578 |
|
| Republic Services, Inc., 3.55%, 6/1/22 | 220,000 |
| 225,880 |
|
| | | 730,933 |
|
| Communications Equipment — 0.1% | | |
| Apple, Inc., 1.00%, 5/3/18 | 160,000 |
| 157,052 |
|
| Apple, Inc., 2.85%, 5/6/21 | 180,000 |
| 182,961 |
|
| Apple, Inc., 3.45%, 5/6/24 | 240,000 |
| 247,062 |
|
| CC Holdings GS V LLC / Crown Castle GS III Corp., 3.85%, 4/15/23 | 260,000 |
| 259,044 |
|
| Cisco Systems, Inc., 5.90%, 2/15/39 | 130,000 |
| 159,783 |
|
| | | 1,005,902 |
|
Construction Materials† | | |
| Owens Corning, 4.20%, 12/15/22 | 160,000 |
| 161,277 |
|
| Consumer Finance — 0.4% | | |
| American Express Centurion Bank, MTN, 6.00%, 9/13/17 | 250,000 |
| 281,113 |
|
| American Express Co., 1.55%, 5/22/18 | 220,000 |
| 217,231 |
|
| American Express Credit Corp., 1.30%, 7/29/16 | 180,000 |
| 181,185 |
|
| Capital One Bank USA N.A., 2.30%, 6/5/19 | 250,000 |
| 248,826 |
|
| Capital One Bank USA N.A., 3.375%, 2/15/23 | 250,000 |
| 247,934 |
|
| CIT Group, Inc., 4.25%, 8/15/17 | 470,000 |
| 484,100 |
|
|
| | | | | | |
| | Shares/Principal Amount | Value |
| CIT Group, Inc., 5.00%, 8/15/22 | $ | 90,000 |
| $ | 94,500 |
|
| Discover Bank, 2.00%, 2/21/18 | 250,000 |
| 249,098 |
|
| Equifax, Inc., 3.30%, 12/15/22 | 140,000 |
| 139,009 |
|
| GLP Capital LP / GLP Financing II, Inc., 4.875%, 11/1/20 | 420,000 |
| 438,900 |
|
| John Deere Capital Corp., MTN, 3.15%, 10/15/21 | 100,000 |
| 102,573 |
|
| PNC Bank N.A., 6.00%, 12/7/17 | 290,000 |
| 327,099 |
|
| Synchrony Financial, 3.00%, 8/15/19 | 90,000 |
| 91,049 |
|
| | | 3,102,617 |
|
| Containers and Packaging — 0.1% | | |
| Ball Corp., 6.75%, 9/15/20 | 120,000 |
| 126,300 |
|
| Ball Corp., 4.00%, 11/15/23 | 180,000 |
| 173,025 |
|
| Crown Americas LLC / Crown Americas Capital Corp. IV, 4.50%, 1/15/23 | 210,000 |
| 207,375 |
|
| Rock-Tenn Co., 3.50%, 3/1/20 | 140,000 |
| 143,252 |
|
| Rock-Tenn Co., 4.00%, 3/1/23 | 240,000 |
| 244,810 |
|
| | | 894,762 |
|
Diversified Consumer Services† | | |
| Catholic Health Initiatives, 1.60%, 11/1/17 | 45,000 |
| 45,028 |
|
| Catholic Health Initiatives, 2.95%, 11/1/22 | 110,000 |
| 107,162 |
|
| Johns Hopkins University, 4.08%, 7/1/53 | 45,000 |
| 45,860 |
|
| | | 198,050 |
|
| Diversified Financial Services — 0.9% | | |
| Ally Financial, Inc., 2.75%, 1/30/17 | 340,000 |
| 341,258 |
|
| Deutsche Bank AG, VRN, 4.30%, 5/24/23 | 200,000 |
| 194,346 |
|
| General Electric Capital Corp., 5.30%, 2/11/21 | 40,000 |
| 45,450 |
|
| General Electric Capital Corp., MTN, 2.30%, 4/27/17 | 420,000 |
| 431,521 |
|
| General Electric Capital Corp., MTN, 5.625%, 9/15/17 | 490,000 |
| 548,023 |
|
| General Electric Capital Corp., MTN, 6.00%, 8/7/19 | 870,000 |
| 1,021,318 |
|
| General Electric Capital Corp., MTN, 4.65%, 10/17/21 | 120,000 |
| 134,353 |
|
| Goldman Sachs Group, Inc. (The), 2.375%, 1/22/18 | 330,000 |
| 333,233 |
|
| Goldman Sachs Group, Inc. (The), 2.90%, 7/19/18 | 530,000 |
| 542,441 |
|
| Goldman Sachs Group, Inc. (The), 5.75%, 1/24/22 | 460,000 |
| 530,242 |
|
| Goldman Sachs Group, Inc. (The), 4.00%, 3/3/24 | 300,000 |
| 306,788 |
|
| Goldman Sachs Group, Inc. (The), 6.75%, 10/1/37 | 260,000 |
| 319,767 |
|
| Goldman Sachs Group, Inc. (The), MTN, 5.375%, 3/15/20 | 110,000 |
| 123,635 |
|
| Goldman Sachs Group, Inc. (The), MTN, 4.80%, 7/8/44 | 160,000 |
| 165,876 |
|
| Icahn Enterprises LP / Icahn Enterprises Finance Corp., 3.50%, 3/15/17 | 150,000 |
| 149,625 |
|
| Morgan Stanley, 3.70%, 10/23/24 | 60,000 |
| 60,147 |
|
| Morgan Stanley, 5.00%, 11/24/25 | 540,000 |
| 574,417 |
|
| Morgan Stanley, MTN, 6.625%, 4/1/18 | 690,000 |
| 790,770 |
|
| Morgan Stanley, MTN, 5.625%, 9/23/19 | 280,000 |
| 317,519 |
|
| Morgan Stanley, MTN, 4.35%, 9/8/26 | 70,000 |
| 70,252 |
|
| UBS AG (Stamford Branch), 5.875%, 12/20/17 | 321,000 |
| 361,838 |
|
| | | 7,362,819 |
|
| Diversified Telecommunication Services — 0.6% | | |
| AT&T, Inc., 2.625%, 12/1/22 | 290,000 |
| 276,615 |
|
|
| | | | | | |
| | Shares/Principal Amount | Value |
| AT&T, Inc., 6.55%, 2/15/39 | $ | 287,000 |
| $ | 357,789 |
|
| AT&T, Inc., 4.30%, 12/15/42 | 130,000 |
| 121,727 |
|
| British Telecommunications plc, 5.95%, 1/15/18 | 480,000 |
| 541,018 |
|
| CenturyLink, Inc., 6.00%, 4/1/17 | 60,000 |
| 64,425 |
|
| CenturyLink, Inc., Series Q, 6.15%, 9/15/19 | 140,000 |
| 152,600 |
|
Deutsche Telekom International Finance BV, 2.25%, 3/6/17(2) | 250,000 |
| 255,571 |
|
| Deutsche Telekom International Finance BV, 6.75%, 8/20/18 | 210,000 |
| 246,033 |
|
| Frontier Communications Corp., 8.25%, 4/15/17 | 160,000 |
| 180,200 |
|
| Orange SA, 4.125%, 9/14/21 | 210,000 |
| 222,604 |
|
| Telecom Italia Capital SA, 7.00%, 6/4/18 | 240,000 |
| 269,700 |
|
| Telecom Italia Capital SA, 6.00%, 9/30/34 | 120,000 |
| 118,800 |
|
| Telefonica Emisiones SAU, 5.46%, 2/16/21 | 100,000 |
| 112,347 |
|
| Verizon Communications, Inc., 3.65%, 9/14/18 | 480,000 |
| 507,910 |
|
| Verizon Communications, Inc., 4.50%, 9/15/20 | 130,000 |
| 141,253 |
|
| Verizon Communications, Inc., 5.15%, 9/15/23 | 350,000 |
| 392,091 |
|
| Verizon Communications, Inc., 5.05%, 3/15/34 | 570,000 |
| 604,464 |
|
| Verizon Communications, Inc., 4.40%, 11/1/34 | 70,000 |
| 68,581 |
|
| Verizon Communications, Inc., 4.75%, 11/1/41 | 150,000 |
| 151,704 |
|
| Verizon Communications, Inc., 6.55%, 9/15/43 | 140,000 |
| 177,000 |
|
Verizon Communications, Inc., 4.86%, 8/21/46(2) | 250,000 |
| 255,571 |
|
Verizon Communications, Inc., 5.01%, 8/21/54(2) | 139,000 |
| 143,057 |
|
| Windstream Corp., 7.875%, 11/1/17 | 60,000 |
| 67,017 |
|
| | | 5,428,077 |
|
Electrical Equipment† | | |
Belden, Inc., 5.25%, 7/15/24(2) | 180,000 |
| 177,750 |
|
Electronic Equipment, Instruments and Components† | | |
| Jabil Circuit, Inc., 7.75%, 7/15/16 | 200,000 |
| 219,750 |
|
| Jabil Circuit, Inc., 5.625%, 12/15/20 | 50,000 |
| 53,750 |
|
| | | 273,500 |
|
| Energy Equipment and Services — 0.1% | | |
| Ensco plc, 3.25%, 3/15/16 | 120,000 |
| 123,432 |
|
| Ensco plc, 4.70%, 3/15/21 | 270,000 |
| 284,693 |
|
| Schlumberger Investment SA, 3.65%, 12/1/23 | 170,000 |
| 178,161 |
|
| Transocean, Inc., 5.05%, 12/15/16 | 40,000 |
| 42,003 |
|
| Transocean, Inc., 2.50%, 10/15/17 | 140,000 |
| 138,240 |
|
| Transocean, Inc., 6.50%, 11/15/20 | 100,000 |
| 102,884 |
|
| Transocean, Inc., 6.375%, 12/15/21 | 50,000 |
| 52,362 |
|
| Weatherford International Ltd., 4.50%, 4/15/22 | 130,000 |
| 133,620 |
|
| | | 1,055,395 |
|
| Food and Staples Retailing — 0.1% | | |
| CVS Health Corp., 2.75%, 12/1/22 | 170,000 |
| 165,418 |
|
| Delhaize Group SA, 4.125%, 4/10/19 | 175,000 |
| 184,943 |
|
| Delhaize Group SA, 5.70%, 10/1/40 | 90,000 |
| 96,354 |
|
| Kroger Co. (The), 6.40%, 8/15/17 | 200,000 |
| 225,867 |
|
| Kroger Co. (The), 3.30%, 1/15/21 | 190,000 |
| 194,293 |
|
| Sysco Corp., 3.50%, 10/2/24 | 130,000 |
| 132,565 |
|
|
| | | | | | |
| | Shares/Principal Amount | Value |
| Wal-Mart Stores, Inc., 2.55%, 4/11/23 | $ | 50,000 |
| $ | 48,588 |
|
| Wal-Mart Stores, Inc., 5.625%, 4/15/41 | 110,000 |
| 137,223 |
|
| | | 1,185,251 |
|
| Food Products — 0.1% | | |
| Kellogg Co., 4.45%, 5/30/16 | 200,000 |
| 211,035 |
|
| Kraft Foods Group, Inc., 5.00%, 6/4/42 | 220,000 |
| 234,903 |
|
| Mondelez International, Inc., 4.00%, 2/1/24 | 140,000 |
| 144,698 |
|
| Mondelez International, Inc., 6.50%, 2/9/40 | 97,000 |
| 123,919 |
|
| Tyson Foods, Inc., 4.50%, 6/15/22 | 180,000 |
| 192,856 |
|
| | | 907,411 |
|
| Gas Utilities — 0.6% | | |
| Access Midstream Partners LP / ACMP Finance Corp., 5.875%, 4/15/21 | 330,000 |
| 350,625 |
|
| El Paso Pipeline Partners Operating Co. LLC, 6.50%, 4/1/20 | 210,000 |
| 241,284 |
|
Enable Midstream Partners LP, 3.90%, 5/15/24(2) | 160,000 |
| 160,248 |
|
| Enbridge Energy Partners LP, 6.50%, 4/15/18 | 130,000 |
| 149,079 |
|
| Enbridge Energy Partners LP, 5.20%, 3/15/20 | 100,000 |
| 111,532 |
|
| Enbridge, Inc., 4.50%, 6/10/44 | 120,000 |
| 118,343 |
|
| Energy Transfer Equity LP, 7.50%, 10/15/20 | 150,000 |
| 173,250 |
|
| Energy Transfer Partners LP, 4.15%, 10/1/20 | 200,000 |
| 208,732 |
|
| Energy Transfer Partners LP, 3.60%, 2/1/23 | 160,000 |
| 156,967 |
|
| Energy Transfer Partners LP, 6.50%, 2/1/42 | 180,000 |
| 208,378 |
|
| Enterprise Products Operating LLC, 3.70%, 6/1/15 | 150,000 |
| 152,507 |
|
| Enterprise Products Operating LLC, 6.30%, 9/15/17 | 300,000 |
| 341,548 |
|
| Enterprise Products Operating LLC, 4.85%, 3/15/44 | 390,000 |
| 403,220 |
|
| Enterprise Products Operating LLC, VRN, 7.03%, 1/15/18 | 140,000 |
| 155,862 |
|
| Kinder Morgan Energy Partners LP, 3.95%, 9/1/22 | 170,000 |
| 169,762 |
|
| Kinder Morgan Energy Partners LP, 6.50%, 9/1/39 | 170,000 |
| 191,967 |
|
| Kinder Morgan, Inc., 7.25%, 6/1/18 | 150,000 |
| 171,750 |
|
| Magellan Midstream Partners LP, 6.55%, 7/15/19 | 150,000 |
| 176,427 |
|
| Magellan Midstream Partners LP, 5.15%, 10/15/43 | 80,000 |
| 87,135 |
|
| MarkWest Energy Partners LP/MarkWest Energy Finance Corp., 6.75%, 11/1/20 | 60,000 |
| 63,900 |
|
| MarkWest Energy Partners LP/MarkWest Energy Finance Corp., 6.50%, 8/15/21 | 90,000 |
| 96,750 |
|
| Plains All American Pipeline LP/PAA Finance Corp., 3.65%, 6/1/22 | 310,000 |
| 317,410 |
|
| Sunoco Logistics Partners Operations LP, 3.45%, 1/15/23 | 330,000 |
| 324,424 |
|
| Targa Resources Partners LP / Targa Resources Partners Finance Corp., 4.25%, 11/15/23 | 210,000 |
| 208,950 |
|
| TransCanada PipeLines Ltd., 2.50%, 8/1/22 | 200,000 |
| 190,726 |
|
| Williams Cos., Inc. (The), 3.70%, 1/15/23 | 50,000 |
| 47,100 |
|
| Williams Cos., Inc. (The), 5.75%, 6/24/44 | 90,000 |
| 86,227 |
|
| Williams Partners LP, 4.125%, 11/15/20 | 200,000 |
| 210,588 |
|
| Williams Partners LP, 5.40%, 3/4/44 | 240,000 |
| 251,801 |
|
| | | 5,526,492 |
|
Health Care Equipment and Supplies† | | |
| Baxter International, Inc., 3.20%, 6/15/23 | 80,000 |
| 80,349 |
|
| Medtronic, Inc., 2.75%, 4/1/23 | 200,000 |
| 193,837 |
|
| | | 274,186 |
|
|
| | | | | | |
| | Shares/Principal Amount | Value |
| Health Care Providers and Services — 0.3% | | |
| Aetna, Inc., 2.75%, 11/15/22 | $ | 130,000 |
| $ | 125,570 |
|
| CHS/Community Health Systems, Inc., 5.125%, 8/15/18 | 210,000 |
| 218,925 |
|
| Express Scripts Holding Co., 2.65%, 2/15/17 | 510,000 |
| 524,951 |
|
| Express Scripts Holding Co., 7.25%, 6/15/19 | 170,000 |
| 206,070 |
|
| HCA, Inc., 3.75%, 3/15/19 | 310,000 |
| 311,550 |
|
| HCA, Inc., 7.25%, 9/15/20 | 150,000 |
| 159,375 |
|
| NYU Hospitals Center, 4.43%, 7/1/42 | 90,000 |
| 89,181 |
|
| UnitedHealth Group, Inc., 2.875%, 3/15/23 | 130,000 |
| 128,137 |
|
| UnitedHealth Group, Inc., 4.25%, 3/15/43 | 120,000 |
| 120,281 |
|
| Universal Health Services, Inc., 7.125%, 6/30/16 | 160,000 |
| 175,000 |
|
Universal Health Services, Inc., 4.75%, 8/1/22(2) | 130,000 |
| 132,519 |
|
| | | 2,191,559 |
|
| Hotels, Restaurants and Leisure — 0.1% | | |
| McDonald's Corp., MTN, 3.25%, 6/10/24 | 200,000 |
| 201,554 |
|
| Royal Caribbean Cruises Ltd., 5.25%, 11/15/22 | 160,000 |
| 168,000 |
|
| Wyndham Worldwide Corp., 2.95%, 3/1/17 | 110,000 |
| 112,742 |
|
| | | 482,296 |
|
| Household Durables — 0.1% | | |
| D.R. Horton, Inc., 3.625%, 2/15/18 | 270,000 |
| 275,737 |
|
| D.R. Horton, Inc., 5.75%, 8/15/23 | 110,000 |
| 117,563 |
|
| Lennar Corp., 4.75%, 12/15/17 | 210,000 |
| 220,500 |
|
| Lennar Corp., 4.50%, 6/15/19 | 160,000 |
| 164,000 |
|
| MDC Holdings, Inc., 5.50%, 1/15/24 | 140,000 |
| 140,350 |
|
| Toll Brothers Finance Corp., 6.75%, 11/1/19 | 100,000 |
| 113,061 |
|
TRI Pointe Holdings, Inc., 4.375%, 6/15/19(2) | 100,000 |
| 99,875 |
|
| | | 1,131,086 |
|
| Industrial Conglomerates — 0.1% | | |
Bombardier, Inc., 5.75%, 3/15/22(2) | 80,000 |
| 82,400 |
|
| General Electric Co., 5.25%, 12/6/17 | 230,000 |
| 255,998 |
|
| General Electric Co., 2.70%, 10/9/22 | 210,000 |
| 207,404 |
|
| General Electric Co., 4.125%, 10/9/42 | 130,000 |
| 131,718 |
|
| Ingersoll-Rand Luxembourg Finance SA, 3.55%, 11/1/24 | 170,000 |
| 168,021 |
|
| | | 845,541 |
|
| Insurance — 0.6% | | |
| Allstate Corp. (The), 4.50%, 6/15/43 | 80,000 |
| 84,034 |
|
| Allstate Corp. (The), VRN, 5.75%, 8/15/23 | 90,000 |
| 95,906 |
|
| American International Group, Inc., 4.875%, 6/1/22 | 550,000 |
| 614,235 |
|
| American International Group, Inc., 4.50%, 7/16/44 | 120,000 |
| 122,364 |
|
| American International Group, Inc., MTN, 5.85%, 1/16/18 | 210,000 |
| 236,837 |
|
| American International Group, Inc., VRN, 8.18%, 5/15/38 | 80,000 |
| 109,000 |
|
| Berkshire Hathaway Finance Corp., 4.25%, 1/15/21 | 140,000 |
| 154,141 |
|
| Berkshire Hathaway Finance Corp., 3.00%, 5/15/22 | 90,000 |
| 90,998 |
|
| Berkshire Hathaway, Inc., 4.50%, 2/11/43 | 220,000 |
| 229,526 |
|
| Genworth Holdings, Inc., 7.20%, 2/15/21 | 70,000 |
| 82,703 |
|
|
| | | | | | |
| | Shares/Principal Amount | Value |
| Hartford Financial Services Group, Inc. (The), 5.125%, 4/15/22 | $ | 220,000 |
| $ | 246,147 |
|
| Hartford Financial Services Group, Inc. (The), 5.95%, 10/15/36 | 50,000 |
| 60,354 |
|
Liberty Mutual Group, Inc., 4.95%, 5/1/22(2) | 60,000 |
| 65,110 |
|
Liberty Mutual Group, Inc., 4.85%, 8/1/44(2) | 210,000 |
| 211,124 |
|
| Lincoln National Corp., 6.25%, 2/15/20 | 160,000 |
| 188,114 |
|
| Markel Corp., 4.90%, 7/1/22 | 190,000 |
| 207,716 |
|
| Markel Corp., 3.625%, 3/30/23 | 100,000 |
| 100,717 |
|
| MetLife, Inc., 1.76%, 12/15/17 | 90,000 |
| 90,813 |
|
| MetLife, Inc., 4.125%, 8/13/42 | 110,000 |
| 107,406 |
|
| MetLife, Inc., 4.875%, 11/13/43 | 50,000 |
| 54,693 |
|
Metropolitan Life Global Funding I, 3.00%, 1/10/23(2) | 200,000 |
| 199,415 |
|
| Principal Financial Group, Inc., 3.30%, 9/15/22 | 70,000 |
| 70,480 |
|
| Prudential Financial, Inc., MTN, 5.375%, 6/21/20 | 70,000 |
| 79,504 |
|
| Prudential Financial, Inc., MTN, 5.625%, 5/12/41 | 220,000 |
| 254,885 |
|
| Prudential Financial, Inc., MTN, 4.60%, 5/15/44 | 190,000 |
| 194,484 |
|
TIAA Asset Management Finance Co. LLC, 4.125%, 11/1/24(2) | 120,000 |
| 120,828 |
|
| Travelers Cos., Inc. (The), 4.60%, 8/1/43 | 100,000 |
| 107,499 |
|
| Voya Financial, Inc., 5.50%, 7/15/22 | 180,000 |
| 203,180 |
|
| Voya Financial, Inc., 5.70%, 7/15/43 | 160,000 |
| 185,181 |
|
| WR Berkley Corp., 4.625%, 3/15/22 | 130,000 |
| 139,848 |
|
| WR Berkley Corp., 4.75%, 8/1/44 | 90,000 |
| 89,491 |
|
| | | 4,796,733 |
|
Internet Software and Services† | | |
| Netflix, Inc., 5.375%, 2/1/21 | 200,000 |
| 209,000 |
|
Netflix, Inc., 5.75%, 3/1/24(2) | 40,000 |
| 42,100 |
|
| | | 251,100 |
|
| IT Services — 0.1% | | |
| Fidelity National Information Services, Inc., 1.45%, 6/5/17 | 150,000 |
| 149,577 |
|
| Fidelity National Information Services, Inc., 5.00%, 3/15/22 | 100,000 |
| 105,096 |
|
| Fidelity National Information Services, Inc., 3.50%, 4/15/23 | 110,000 |
| 109,518 |
|
| Xerox Corp., 2.95%, 3/15/17 | 80,000 |
| 82,825 |
|
| | | 447,016 |
|
| Life Sciences Tools and Services — 0.1% | | |
| Thermo Fisher Scientific, Inc., 3.60%, 8/15/21 | 150,000 |
| 155,520 |
|
| Thermo Fisher Scientific, Inc., 4.15%, 2/1/24 | 180,000 |
| 188,721 |
|
| Thermo Fisher Scientific, Inc., 5.30%, 2/1/44 | 150,000 |
| 169,650 |
|
| | | 513,891 |
|
| Machinery — 0.1% | | |
| Caterpillar Financial Services Corp., MTN, 2.85%, 6/1/22 | 220,000 |
| 218,806 |
|
| Deere & Co., 5.375%, 10/16/29 | 200,000 |
| 241,006 |
|
| Oshkosh Corp., 5.375%, 3/1/22 | 290,000 |
| 297,250 |
|
| | | 757,062 |
|
| Media — 0.6% | | |
| 21st Century Fox America, Inc., 3.00%, 9/15/22 | 240,000 |
| 236,348 |
|
| 21st Century Fox America, Inc., 6.90%, 8/15/39 | 150,000 |
| 197,313 |
|
|
| | | | | | |
| | Shares/Principal Amount | Value |
21st Century Fox America, Inc., 4.75%, 9/15/44(2) | $ | 60,000 |
| $ | 62,273 |
|
| CBS Corp., 4.85%, 7/1/42 | 60,000 |
| 60,083 |
|
| Comcast Corp., 5.90%, 3/15/16 | 339,000 |
| 363,094 |
|
| Comcast Corp., 6.40%, 5/15/38 | 310,000 |
| 398,924 |
|
| Comcast Corp., 4.75%, 3/1/44 | 90,000 |
| 97,095 |
|
| DirecTV Holdings LLC/DirecTV Financing Co., Inc., 5.00%, 3/1/21 | 250,000 |
| 275,557 |
|
| DirecTV Holdings LLC/DirecTV Financing Co., Inc., 4.45%, 4/1/24 | 120,000 |
| 125,389 |
|
| Discovery Communications LLC, 5.625%, 8/15/19 | 90,000 |
| 102,312 |
|
| Discovery Communications LLC, 3.25%, 4/1/23 | 100,000 |
| 97,939 |
|
| DISH DBS Corp., 7.125%, 2/1/16 | 50,000 |
| 53,312 |
|
| Embarq Corp., 8.00%, 6/1/36 | 120,000 |
| 133,500 |
|
| Gannett Co., Inc., 5.125%, 7/15/20 | 330,000 |
| 343,200 |
|
| Interpublic Group of Cos., Inc. (The), 4.00%, 3/15/22 | 160,000 |
| 163,163 |
|
| Lamar Media Corp., 5.375%, 1/15/24 | 180,000 |
| 187,200 |
|
| NBCUniversal Media LLC, 5.15%, 4/30/20 | 90,000 |
| 102,534 |
|
| NBCUniversal Media LLC, 4.375%, 4/1/21 | 380,000 |
| 417,900 |
|
| NBCUniversal Media LLC, 2.875%, 1/15/23 | 120,000 |
| 118,955 |
|
Nielsen Finance LLC / Nielsen Finance Co., 5.00%, 4/15/22(2) | 160,000 |
| 163,200 |
|
| Omnicom Group, Inc., 3.625%, 5/1/22 | 50,000 |
| 51,303 |
|
| Time Warner Cable, Inc., 6.75%, 7/1/18 | 130,000 |
| 151,341 |
|
| Time Warner Cable, Inc., 5.50%, 9/1/41 | 70,000 |
| 79,348 |
|
| Time Warner Cable, Inc., 4.50%, 9/15/42 | 160,000 |
| 159,351 |
|
| Time Warner, Inc., 4.70%, 1/15/21 | 140,000 |
| 153,438 |
|
| Time Warner, Inc., 7.70%, 5/1/32 | 200,000 |
| 279,461 |
|
| Time Warner, Inc., 5.375%, 10/15/41 | 100,000 |
| 107,917 |
|
| Time Warner, Inc., 5.35%, 12/15/43 | 120,000 |
| 132,187 |
|
| Viacom, Inc., 4.50%, 3/1/21 | 110,000 |
| 118,839 |
|
| Viacom, Inc., 3.125%, 6/15/22 | 190,000 |
| 185,827 |
|
| Walt Disney Co. (The), MTN, 2.35%, 12/1/22 | 130,000 |
| 126,163 |
|
| | | 5,244,466 |
|
| Metals and Mining — 0.2% | | |
| ArcelorMittal, 5.75%, 8/5/20 | 120,000 |
| 127,800 |
|
| Barrick Gold Corp., 4.10%, 5/1/23 | 140,000 |
| 135,027 |
|
| Barrick North America Finance LLC, 4.40%, 5/30/21 | 230,000 |
| 236,196 |
|
| Barrick North America Finance LLC, 5.75%, 5/1/43 | 70,000 |
| 67,945 |
|
Glencore Finance Canada Ltd., 4.95%, 11/15/21(2) | 110,000 |
| 118,015 |
|
| Newmont Mining Corp., 6.25%, 10/1/39 | 80,000 |
| 80,141 |
|
| Southern Copper Corp., 5.25%, 11/8/42 | 100,000 |
| 94,272 |
|
| Steel Dynamics, Inc., 6.125%, 8/15/19 | 157,000 |
| 169,560 |
|
| Steel Dynamics, Inc., 7.625%, 3/15/20 | 140,000 |
| 148,400 |
|
| Teck Resources Ltd., 3.15%, 1/15/17 | 110,000 |
| 113,183 |
|
| Vale Overseas Ltd., 5.625%, 9/15/19 | 310,000 |
| 349,978 |
|
| Vale Overseas Ltd., 4.625%, 9/15/20 | 260,000 |
| 275,618 |
|
| Vale SA, 5.625%, 9/11/42 | 40,000 |
| 39,728 |
|
| | | 1,955,863 |
|
| Multi-Utilities — 0.6% | | |
| CenterPoint Energy Houston Electric LLC, 3.55%, 8/1/42 | 70,000 |
| 65,543 |
|
| CMS Energy Corp., 4.25%, 9/30/15 | 160,000 |
| 164,956 |
|
|
| | | | | | |
| | Shares/Principal Amount | Value |
| CMS Energy Corp., 8.75%, 6/15/19 | $ | 180,000 |
| $ | 228,669 |
|
| Consolidated Edison Co. of New York, Inc., 3.95%, 3/1/43 | 150,000 |
| 146,602 |
|
| Constellation Energy Group, Inc., 5.15%, 12/1/20 | 220,000 |
| 245,381 |
|
| Consumers Energy Co., 2.85%, 5/15/22 | 50,000 |
| 50,507 |
|
| Consumers Energy Co., 3.375%, 8/15/23 | 50,000 |
| 51,905 |
|
| Dominion Resources, Inc., 6.40%, 6/15/18 | 190,000 |
| 218,596 |
|
| Dominion Resources, Inc., 2.75%, 9/15/22 | 210,000 |
| 205,185 |
|
| Dominion Resources, Inc., 4.90%, 8/1/41 | 130,000 |
| 139,820 |
|
| Dominion Resources, Inc., VRN, 7.50%, 6/30/16 | 120,000 |
| 127,464 |
|
| DPL, Inc., 6.50%, 10/15/16 | 44,000 |
| 47,190 |
|
| Duke Energy Corp., 1.625%, 8/15/17 | 150,000 |
| 151,003 |
|
| Duke Energy Corp., 3.55%, 9/15/21 | 90,000 |
| 93,867 |
|
| Duke Energy Florida, Inc., 6.35%, 9/15/37 | 110,000 |
| 149,285 |
|
| Duke Energy Florida, Inc., 3.85%, 11/15/42 | 220,000 |
| 216,273 |
|
| Edison International, 3.75%, 9/15/17 | 130,000 |
| 137,828 |
|
| Exelon Generation Co. LLC, 4.25%, 6/15/22 | 120,000 |
| 125,390 |
|
| Exelon Generation Co. LLC, 5.60%, 6/15/42 | 70,000 |
| 75,636 |
|
| FirstEnergy Corp., 2.75%, 3/15/18 | 135,000 |
| 136,502 |
|
| FirstEnergy Corp., 4.25%, 3/15/23 | 260,000 |
| 261,074 |
|
| Georgia Power Co., 4.30%, 3/15/42 | 70,000 |
| 72,575 |
|
| IPALCO Enterprises, Inc., 5.00%, 5/1/18 | 230,000 |
| 244,950 |
|
| NextEra Energy Capital Holdings, Inc., VRN, 7.30%, 9/1/17 | 210,000 |
| 227,329 |
|
| Nisource Finance Corp., 4.45%, 12/1/21 | 70,000 |
| 75,950 |
|
| Nisource Finance Corp., 5.65%, 2/1/45 | 100,000 |
| 118,459 |
|
| PacifiCorp, 6.00%, 1/15/39 | 110,000 |
| 142,668 |
|
| Potomac Electric Power Co., 3.60%, 3/15/24 | 120,000 |
| 124,639 |
|
| Progress Energy, Inc., 3.15%, 4/1/22 | 90,000 |
| 90,827 |
|
| Public Service Company of Colorado, 4.75%, 8/15/41 | 50,000 |
| 56,122 |
|
| Sempra Energy, 6.50%, 6/1/16 | 200,000 |
| 217,556 |
|
| Sempra Energy, 2.875%, 10/1/22 | 200,000 |
| 196,445 |
|
| Southern Power Co., 5.15%, 9/15/41 | 40,000 |
| 44,593 |
|
| Virginia Electric and Power Co., 3.45%, 2/15/24 | 160,000 |
| 164,606 |
|
| Virginia Electric and Power Co., 4.45%, 2/15/44 | 80,000 |
| 84,879 |
|
| Xcel Energy, Inc., 4.80%, 9/15/41 | 50,000 |
| 54,416 |
|
| | | 4,954,690 |
|
| Multiline Retail — 0.1% | | |
| Macy's Retail Holdings, Inc., 3.625%, 6/1/24 | 540,000 |
| 538,893 |
|
| Target Corp., 4.00%, 7/1/42 | 220,000 |
| 212,119 |
|
| | | 751,012 |
|
| Oil, Gas and Consumable Fuels — 0.9% | | |
| AmeriGas Partners LP/AmeriGas Finance Corp., 6.25%, 8/20/19 | 90,000 |
| 94,500 |
|
| Anadarko Petroleum Corp., 5.95%, 9/15/16 | 80,000 |
| 86,978 |
|
| Anadarko Petroleum Corp., 6.45%, 9/15/36 | 110,000 |
| 136,021 |
|
| Apache Corp., 4.75%, 4/15/43 | 90,000 |
| 90,478 |
|
| BP Capital Markets plc, 4.50%, 10/1/20 | 100,000 |
| 109,399 |
|
| BP Capital Markets plc, 2.75%, 5/10/23 | 100,000 |
| 95,406 |
|
|
| | | | | | |
| | Shares/Principal Amount | Value |
California Resources Corp., 5.50%, 9/15/21(2) | $ | 210,000 |
| $ | 214,462 |
|
| Chesapeake Energy Corp., 4.875%, 4/15/22 | 220,000 |
| 226,105 |
|
| Chevron Corp., 2.43%, 6/24/20 | 80,000 |
| 81,097 |
|
| Cimarex Energy Co., 4.375%, 6/1/24 | 220,000 |
| 224,125 |
|
| CNOOC Nexen Finance 2014 ULC, 4.25%, 4/30/24 | 140,000 |
| 144,861 |
|
| Concho Resources, Inc., 7.00%, 1/15/21 | 330,000 |
| 357,637 |
|
| ConocoPhillips Holding Co., 6.95%, 4/15/29 | 40,000 |
| 54,146 |
|
| Continental Resources, Inc., 5.00%, 9/15/22 | 240,000 |
| 254,700 |
|
| Continental Resources, Inc., 3.80%, 6/1/24 | 190,000 |
| 187,663 |
|
| Denbury Resources, Inc., 4.625%, 7/15/23 | 20,000 |
| 18,500 |
|
| Devon Energy Corp., 1.875%, 5/15/17 | 60,000 |
| 61,158 |
|
| Devon Energy Corp., 5.60%, 7/15/41 | 140,000 |
| 159,654 |
|
| Ecopetrol SA, 4.125%, 1/16/25 | 90,000 |
| 87,975 |
|
| EOG Resources, Inc., 5.625%, 6/1/19 | 150,000 |
| 173,070 |
|
| EOG Resources, Inc., 4.10%, 2/1/21 | 130,000 |
| 141,470 |
|
| Freeport-McMoran Oil & Gas LLC / FCX Oil & Gas, Inc., 6.875%, 2/15/23 | 97,000 |
| 109,944 |
|
| Hess Corp., 6.00%, 1/15/40 | 90,000 |
| 105,456 |
|
| Marathon Petroleum Corp., 3.50%, 3/1/16 | 210,000 |
| 216,831 |
|
| Newfield Exploration Co., 6.875%, 2/1/20 | 200,000 |
| 208,500 |
|
| Newfield Exploration Co., 5.75%, 1/30/22 | 190,000 |
| 206,625 |
|
| Noble Energy, Inc., 4.15%, 12/15/21 | 290,000 |
| 309,668 |
|
| Peabody Energy Corp., 7.375%, 11/1/16 | 40,000 |
| 41,400 |
|
| Pemex Project Funding Master Trust, 6.625%, 6/15/35 | 50,000 |
| 59,250 |
|
| Petro-Canada, 6.80%, 5/15/38 | 200,000 |
| 268,993 |
|
| Petrobras Global Finance BV, 5.625%, 5/20/43 | 130,000 |
| 119,279 |
|
| Petrobras International Finance Co. SA, 5.75%, 1/20/20 | 200,000 |
| 211,626 |
|
| Petrobras International Finance Co. SA, 5.375%, 1/27/21 | 310,000 |
| 318,947 |
|
| Petroleos Mexicanos, 3.125%, 1/23/19 | 70,000 |
| 71,911 |
|
| Petroleos Mexicanos, 6.00%, 3/5/20 | 120,000 |
| 136,764 |
|
| Petroleos Mexicanos, 4.875%, 1/24/22 | 120,000 |
| 128,220 |
|
| Petroleos Mexicanos, 3.50%, 1/30/23 | 60,000 |
| 58,224 |
|
| Petroleos Mexicanos, 5.50%, 6/27/44 | 140,000 |
| 146,650 |
|
| Phillips 66, 4.30%, 4/1/22 | 250,000 |
| 268,334 |
|
| Range Resources Corp., 6.75%, 8/1/20 | 190,000 |
| 201,875 |
|
| Shell International Finance BV, 2.375%, 8/21/22 | 130,000 |
| 125,706 |
|
| Shell International Finance BV, 3.625%, 8/21/42 | 140,000 |
| 130,223 |
|
| Shell International Finance BV, 4.55%, 8/12/43 | 130,000 |
| 140,157 |
|
| Statoil ASA, 2.45%, 1/17/23 | 190,000 |
| 182,781 |
|
| Statoil ASA, 3.95%, 5/15/43 | 50,000 |
| 48,292 |
|
| Statoil ASA, 4.80%, 11/8/43 | 100,000 |
| 110,626 |
|
| Suburban Propane Partners LP/Suburban Energy Finance Corp., 7.375%, 3/15/20 | 110,000 |
| 115,225 |
|
| Suburban Propane Partners LP/Suburban Energy Finance Corp., 7.375%, 8/1/21 | 150,000 |
| 162,000 |
|
| Talisman Energy, Inc., 7.75%, 6/1/19 | 95,000 |
| 112,653 |
|
| Tesoro Corp., 5.375%, 10/1/22 | 100,000 |
| 103,500 |
|
|
| | | | | | |
| | Shares/Principal Amount | Value |
| Total Capital Canada Ltd., 2.75%, 7/15/23 | $ | 120,000 |
| $ | 116,547 |
|
| Total Capital SA, 2.125%, 8/10/18 | 140,000 |
| 142,346 |
|
| Whiting Petroleum Corp., 5.00%, 3/15/19 | 190,000 |
| 197,600 |
|
| | | 7,875,558 |
|
| Paper and Forest Products — 0.1% | | |
| Domtar Corp., 4.40%, 4/1/22 | 120,000 |
| 122,923 |
|
Georgia-Pacific LLC, 5.40%, 11/1/20(2) | 350,000 |
| 400,401 |
|
| International Paper Co., 6.00%, 11/15/41 | 130,000 |
| 150,345 |
|
| | | 673,669 |
|
| Pharmaceuticals — 0.3% | | |
| AbbVie, Inc., 1.75%, 11/6/17 | 300,000 |
| 301,064 |
|
| AbbVie, Inc., 2.90%, 11/6/22 | 100,000 |
| 97,687 |
|
| AbbVie, Inc., 4.40%, 11/6/42 | 240,000 |
| 239,025 |
|
Actavis Funding SCS, 3.85%, 6/15/24(2) | 100,000 |
| 97,482 |
|
| Actavis, Inc., 1.875%, 10/1/17 | 220,000 |
| 218,221 |
|
| Actavis, Inc., 3.25%, 10/1/22 | 200,000 |
| 192,408 |
|
| Actavis, Inc., 4.625%, 10/1/42 | 60,000 |
| 55,232 |
|
| Bristol-Myers Squibb Co., 3.25%, 8/1/42 | 80,000 |
| 68,608 |
|
Forest Laboratories, Inc., 4.875%, 2/15/21(2) | 270,000 |
| 288,232 |
|
| GlaxoSmithKline Capital plc, 2.85%, 5/8/22 | 250,000 |
| 248,155 |
|
| Merck & Co., Inc., 2.40%, 9/15/22 | 100,000 |
| 96,710 |
|
| Merck & Co., Inc., 3.60%, 9/15/42 | 140,000 |
| 131,865 |
|
| Mylan, Inc., 5.40%, 11/29/43 | 50,000 |
| 54,141 |
|
Roche Holdings, Inc., 6.00%, 3/1/19(2) | 266,000 |
| 307,644 |
|
Roche Holdings, Inc., 3.35%, 9/30/24(2) | 110,000 |
| 112,369 |
|
Roche Holdings, Inc., 7.00%, 3/1/39(2) | 70,000 |
| 102,523 |
|
| Sanofi, 4.00%, 3/29/21 | 95,000 |
| 103,054 |
|
| | | 2,714,420 |
|
| Real Estate Investment Trusts (REITs) — 0.3% | | |
| American Tower Corp., 5.05%, 9/1/20 | 130,000 |
| 141,857 |
|
| DDR Corp., 4.75%, 4/15/18 | 230,000 |
| 248,844 |
|
| Essex Portfolio LP, 3.625%, 8/15/22 | 150,000 |
| 152,921 |
|
| Essex Portfolio LP, 3.375%, 1/15/23 | 60,000 |
| 59,298 |
|
| Essex Portfolio LP, 3.25%, 5/1/23 | 50,000 |
| 48,872 |
|
| HCP, Inc., 3.75%, 2/1/16 | 200,000 |
| 207,166 |
|
| Health Care REIT, Inc., 2.25%, 3/15/18 | 50,000 |
| 50,642 |
|
| Health Care REIT, Inc., 3.75%, 3/15/23 | 130,000 |
| 129,531 |
|
| Hospitality Properties Trust, 4.65%, 3/15/24 | 350,000 |
| 357,695 |
|
| Hospitality Properties Trust, 4.50%, 3/15/25 | 140,000 |
| 139,530 |
|
| Host Hotels & Resorts LP, 3.75%, 10/15/23 | 100,000 |
| 99,171 |
|
| Kilroy Realty LP, 3.80%, 1/15/23 | 190,000 |
| 191,814 |
|
| Realty Income Corp., 4.125%, 10/15/26 | 80,000 |
| 81,446 |
|
| Reckson Operating Partnership LP, 6.00%, 3/31/16 | 125,000 |
| 132,695 |
|
| Senior Housing Properties Trust, 4.75%, 5/1/24 | 180,000 |
| 183,292 |
|
| Ventas Realty LP/Ventas Capital Corp., 3.125%, 11/30/15 | 95,000 |
| 97,413 |
|
| Ventas Realty LP/Ventas Capital Corp., 4.75%, 6/1/21 | 120,000 |
| 130,641 |
|
| | | 2,452,828 |
|
|
| | | | | | |
| | Shares/Principal Amount | Value |
| Road and Rail — 0.2% | | |
| Burlington Northern Santa Fe LLC, 3.60%, 9/1/20 | $ | 176,000 |
| $ | 185,705 |
|
| Burlington Northern Santa Fe LLC, 5.05%, 3/1/41 | 60,000 |
| 65,690 |
|
| Burlington Northern Santa Fe LLC, 4.45%, 3/15/43 | 220,000 |
| 223,685 |
|
| CSX Corp., 4.25%, 6/1/21 | 150,000 |
| 163,627 |
|
| CSX Corp., 3.40%, 8/1/24 | 180,000 |
| 181,230 |
|
| Norfolk Southern Corp., 5.75%, 4/1/18 | 40,000 |
| 45,332 |
|
| Norfolk Southern Corp., 3.25%, 12/1/21 | 200,000 |
| 205,114 |
|
Penske Truck Leasing Co. LP / PTL Finance Corp., 2.875%, 7/17/18(2) | 40,000 |
| 40,777 |
|
| Union Pacific Corp., 4.00%, 2/1/21 | 100,000 |
| 109,154 |
|
| Union Pacific Corp., 4.75%, 9/15/41 | 150,000 |
| 165,475 |
|
| | | 1,385,789 |
|
Semiconductors and Semiconductor Equipment† | | |
| Intel Corp., 1.35%, 12/15/17 | 140,000 |
| 139,751 |
|
KLA-Tencor Corp., 4.65%, 11/1/24(3) | 80,000 |
| 80,383 |
|
| | | 220,134 |
|
| Software — 0.1% | | |
Activision Blizzard, Inc., 5.625%, 9/15/21(2) | 210,000 |
| 223,913 |
|
| Intuit, Inc., 5.75%, 3/15/17 | 254,000 |
| 279,516 |
|
| Oracle Corp., 2.50%, 10/15/22 | 260,000 |
| 251,401 |
|
| Oracle Corp., 3.625%, 7/15/23 | 280,000 |
| 290,679 |
|
| Oracle Corp., 3.40%, 7/8/24 | 150,000 |
| 151,566 |
|
| | | 1,197,075 |
|
| Specialty Retail — 0.1% | | |
| Home Depot, Inc. (The), 5.95%, 4/1/41 | 360,000 |
| 457,192 |
|
| Sally Holdings LLC / Sally Capital, Inc., 6.875%, 11/15/19 | 227,000 |
| 244,593 |
|
| United Rentals North America, Inc., 5.75%, 7/15/18 | 310,000 |
| 326,275 |
|
| | | 1,028,060 |
|
| Technology Hardware, Storage and Peripherals — 0.1% | | |
| Dell, Inc., 2.30%, 9/10/15 | 90,000 |
| 90,387 |
|
| Dell, Inc., 3.10%, 4/1/16 | 40,000 |
| 40,450 |
|
| Hewlett-Packard Co., 4.30%, 6/1/21 | 290,000 |
| 304,199 |
|
| Seagate HDD Cayman, 4.75%, 6/1/23 | 310,000 |
| 321,480 |
|
| | | 756,516 |
|
| Textiles, Apparel and Luxury Goods — 0.1% | | |
| Hanesbrands, Inc., 6.375%, 12/15/20 | 280,000 |
| 298,550 |
|
| L Brands, Inc., 6.90%, 7/15/17 | 100,000 |
| 112,000 |
|
| PVH Corp., 4.50%, 12/15/22 | 210,000 |
| 210,000 |
|
| | | 620,550 |
|
| Tobacco — 0.1% | | |
| Altria Group, Inc., 2.85%, 8/9/22 | 270,000 |
| 261,998 |
|
| Philip Morris International, Inc., 4.125%, 5/17/21 | 180,000 |
| 196,197 |
|
| | | 458,195 |
|
| Wireless Telecommunication Services — 0.1% | | |
| America Movil SAB de CV, 5.00%, 3/30/20 | 110,000 |
| 121,809 |
|
|
| | | | | | |
| | Shares/Principal Amount | Value |
| America Movil SAB de CV, 3.125%, 7/16/22 | $ | 310,000 |
| $ | 305,471 |
|
| Sprint Communications, 6.00%, 12/1/16 | 150,000 |
| 159,094 |
|
Sprint Communications, 9.00%, 11/15/18(2) | 180,000 |
| 212,175 |
|
| T-Mobile USA, Inc., 6.46%, 4/28/19 | 210,000 |
| 219,450 |
|
| Vodafone Group plc, 5.625%, 2/27/17 | 110,000 |
| 120,402 |
|
| | | 1,138,401 |
|
TOTAL CORPORATE BONDS (Cost $92,591,352) | | 95,794,500 |
|
| U.S. TREASURY SECURITIES — 10.9% | | |
| U.S. Treasury Bonds, 5.50%, 8/15/28 | 420,000 |
| 560,077 |
|
| U.S. Treasury Bonds, 5.25%, 2/15/29 | 489,000 |
| 640,819 |
|
| U.S. Treasury Bonds, 5.375%, 2/15/31 | 2,900,000 |
| 3,919,985 |
|
| U.S. Treasury Bonds, 4.375%, 11/15/39 | 2,000,000 |
| 2,499,844 |
|
| U.S. Treasury Bonds, 4.375%, 5/15/41 | 1,850,000 |
| 2,326,664 |
|
| U.S. Treasury Bonds, 3.125%, 11/15/41 | 1,500,000 |
| 1,528,125 |
|
| U.S. Treasury Bonds, 2.75%, 11/15/42 | 2,180,000 |
| 2,050,222 |
|
| U.S. Treasury Bonds, 2.875%, 5/15/43 | 300,000 |
| 288,820 |
|
| U.S. Treasury Bonds, 3.125%, 8/15/44 | 1,500,000 |
| 1,518,282 |
|
| U.S. Treasury Notes, 0.25%, 5/31/15 | 5,000,000 |
| 5,005,080 |
|
| U.S. Treasury Notes, 0.375%, 11/15/15 | 1,200,000 |
| 1,202,626 |
|
| U.S. Treasury Notes, 1.375%, 11/30/15 | 1,750,000 |
| 1,772,421 |
|
| U.S. Treasury Notes, 2.125%, 12/31/15 | 8,750,000 |
| 8,944,827 |
|
| U.S. Treasury Notes, 0.375%, 1/15/16 | 700,000 |
| 701,367 |
|
| U.S. Treasury Notes, 0.50%, 6/15/16 | 3,000,000 |
| 3,007,734 |
|
| U.S. Treasury Notes, 0.625%, 12/15/16 | 7,300,000 |
| 7,310,264 |
|
| U.S. Treasury Notes, 0.50%, 7/31/17 | 500,000 |
| 495,156 |
|
| U.S. Treasury Notes, 0.75%, 10/31/17 | 1,500,000 |
| 1,490,274 |
|
| U.S. Treasury Notes, 1.875%, 10/31/17 | 3,300,000 |
| 3,389,202 |
|
| U.S. Treasury Notes, 0.875%, 1/31/18 | 4,500,000 |
| 4,469,764 |
|
| U.S. Treasury Notes, 2.625%, 4/30/18 | 875,000 |
| 918,340 |
|
| U.S. Treasury Notes, 1.375%, 7/31/18 | 11,130,000 |
| 11,170,869 |
|
| U.S. Treasury Notes, 1.375%, 9/30/18 | 2,500,000 |
| 2,503,515 |
|
| U.S. Treasury Notes, 1.25%, 10/31/18 | 2,350,000 |
| 2,339,169 |
|
| U.S. Treasury Notes, 1.25%, 11/30/18 | 3,100,000 |
| 3,082,321 |
|
| U.S. Treasury Notes, 1.375%, 11/30/18 | 200,000 |
| 199,906 |
|
| U.S. Treasury Notes, 1.625%, 7/31/19 | 2,800,000 |
| 2,806,563 |
|
| U.S. Treasury Notes, 1.625%, 8/31/19 | 11,800,000 |
| 11,816,591 |
|
| U.S. Treasury Notes, 1.50%, 10/31/19 | 3,500,000 |
| 3,481,408 |
|
| U.S. Treasury Notes, 2.125%, 9/30/21 | 1,000,000 |
| 1,006,250 |
|
| U.S. Treasury Notes, 1.75%, 5/15/23 | 2,250,000 |
| 2,166,152 |
|
TOTAL U.S. TREASURY SECURITIES (Cost $93,377,725) | | 94,612,637 |
|
U.S. GOVERNMENT AGENCY MORTGAGE-BACKED SECURITIES(4) — 10.7% |
| Adjustable-Rate U.S. Government Agency Mortgage-Backed Securities — 1.8% |
| FHLMC, VRN, 1.74%, 11/15/14 | 180,849 |
| 184,038 |
|
| FHLMC, VRN, 1.84%, 11/15/14 | 508,296 |
| 519,548 |
|
| FHLMC, VRN, 1.97%, 11/15/14 | 295,220 |
| 304,081 |
|
| FHLMC, VRN, 1.98%, 11/15/14 | 385,693 |
| 395,177 |
|
| FHLMC, VRN, 2.09%, 11/15/14 | 681,923 |
| 689,922 |
|
|
| | | | | | |
| | Shares/Principal Amount | Value |
| FHLMC, VRN, 2.26%, 11/15/14 | $ | 411,731 |
| $ | 438,369 |
|
| FHLMC, VRN, 2.35%, 11/15/14 | 868,667 |
| 872,017 |
|
| FHLMC, VRN, 2.375%, 11/15/14 | 1,177,242 |
| 1,262,501 |
|
| FHLMC, VRN, 2.40%, 11/15/14 | 183,288 |
| 196,977 |
|
| FHLMC, VRN, 2.40%, 11/15/14 | 116,024 |
| 124,236 |
|
| FHLMC, VRN, 2.56%, 11/15/14 | 107,082 |
| 112,924 |
|
| FHLMC, VRN, 2.87%, 11/15/14 | 201,047 |
| 207,275 |
|
| FHLMC, VRN, 3.24%, 11/15/14 | 111,938 |
| 118,381 |
|
| FHLMC, VRN, 3.30%, 11/15/14 | 358,972 |
| 377,944 |
|
| FHLMC, VRN, 3.80%, 11/15/14 | 204,883 |
| 216,186 |
|
| FHLMC, VRN, 3.96%, 11/15/14 | 460,218 |
| 484,704 |
|
| FHLMC, VRN, 4.08%, 11/15/14 | 183,178 |
| 193,909 |
|
| FHLMC, VRN, 4.32%, 11/15/14 | 523,052 |
| 551,497 |
|
| FHLMC, VRN, 5.10%, 11/15/14 | 86,950 |
| 93,042 |
|
| FHLMC, VRN, 5.39%, 11/15/14 | 160,387 |
| 170,156 |
|
| FHLMC, VRN, 5.77%, 11/15/14 | 307,905 |
| 327,119 |
|
| FHLMC, VRN, 5.95%, 11/15/14 | 305,612 |
| 326,957 |
|
| FHLMC, VRN, 6.12%, 11/15/14 | 165,005 |
| 176,339 |
|
| FNMA, VRN, 1.90%, 11/25/14 | 415,134 |
| 441,394 |
|
| FNMA, VRN, 1.92%, 11/25/14 | 962,042 |
| 1,014,891 |
|
| FNMA, VRN, 1.94%, 11/25/14 | 1,110,539 |
| 1,182,118 |
|
| FNMA, VRN, 1.94%, 11/25/14 | 834,580 |
| 880,025 |
|
| FNMA, VRN, 1.94%, 11/25/14 | 481,567 |
| 515,518 |
|
| FNMA, VRN, 1.94%, 11/25/14 | 648,068 |
| 691,573 |
|
| FNMA, VRN, 2.20%, 11/25/14 | 57,070 |
| 60,982 |
|
| FNMA, VRN, 2.32%, 11/25/14 | 397,640 |
| 426,028 |
|
| FNMA, VRN, 2.71%, 11/25/14 | 387,797 |
| 398,528 |
|
| FNMA, VRN, 3.34%, 11/25/14 | 117,378 |
| 126,123 |
|
| FNMA, VRN, 3.36%, 11/25/14 | 186,137 |
| 194,246 |
|
| FNMA, VRN, 3.59%, 11/25/14 | 83,159 |
| 88,851 |
|
| FNMA, VRN, 3.76%, 11/25/14 | 298,702 |
| 315,160 |
|
| FNMA, VRN, 3.92%, 11/25/14 | 248,727 |
| 262,456 |
|
| FNMA, VRN, 5.27%, 11/25/14 | 188,812 |
| 201,903 |
|
| | | 15,143,095 |
|
| Fixed-Rate U.S. Government Agency Mortgage-Backed Securities — 8.9% | |
| FHLMC, 4.50%, 1/1/19 | 234,181 |
| 247,025 |
|
| FHLMC, 6.50%, 1/1/28 | 27,505 |
| 31,453 |
|
| FHLMC, 5.50%, 12/1/33 | 230,220 |
| 257,140 |
|
| FHLMC, 5.00%, 7/1/35 | 2,180,996 |
| 2,418,416 |
|
| FHLMC, 5.50%, 1/1/38 | 281,812 |
| 314,534 |
|
| FHLMC, 6.00%, 8/1/38 | 74,590 |
| 84,502 |
|
| FHLMC, 6.50%, 7/1/47 | 7,291 |
| 8,009 |
|
FNMA, 3.00%, 11/13/14(5) | 1,750,000 |
| 1,750,065 |
|
FNMA, 4.00%, 11/13/14(5) | 4,450,000 |
| 4,724,636 |
|
| FNMA, 4.50%, 5/1/19 | 214,054 |
| 226,077 |
|
| FNMA, 4.50%, 5/1/19 | 80,730 |
| 85,206 |
|
|
| | | | | | |
| | Shares/Principal Amount | Value |
| FNMA, 5.00%, 9/1/20 | $ | 386,321 |
| $ | 412,414 |
|
| FNMA, 6.50%, 1/1/28 | 19,666 |
| 22,338 |
|
| FNMA, 6.50%, 1/1/29 | 38,542 |
| 44,888 |
|
| FNMA, 7.50%, 7/1/29 | 88,802 |
| 100,055 |
|
| FNMA, 7.50%, 9/1/30 | 22,857 |
| 27,505 |
|
| FNMA, 6.625%, 11/15/30 | 2,290,000 |
| 3,307,463 |
|
| FNMA, 5.00%, 7/1/31 | 1,215,638 |
| 1,358,573 |
|
| FNMA, 6.50%, 9/1/31 | 25,656 |
| 29,143 |
|
| FNMA, 7.00%, 9/1/31 | 13,548 |
| 15,446 |
|
| FNMA, 6.50%, 1/1/32 | 53,843 |
| 61,149 |
|
| FNMA, 6.50%, 8/1/32 | 42,149 |
| 48,833 |
|
| FNMA, 5.50%, 6/1/33 | 136,398 |
| 153,401 |
|
| FNMA, 5.50%, 7/1/33 | 231,813 |
| 260,586 |
|
| FNMA, 5.50%, 8/1/33 | 375,761 |
| 421,973 |
|
| FNMA, 5.50%, 9/1/33 | 250,547 |
| 282,893 |
|
| FNMA, 5.00%, 11/1/33 | 759,522 |
| 843,198 |
|
| FNMA, 5.00%, 4/1/35 | 1,084,668 |
| 1,203,606 |
|
| FNMA, 4.50%, 9/1/35 | 517,997 |
| 562,253 |
|
| FNMA, 5.00%, 2/1/36 | 707,890 |
| 785,178 |
|
| FNMA, 5.50%, 4/1/36 | 268,511 |
| 299,997 |
|
| FNMA, 5.50%, 5/1/36 | 518,375 |
| 580,250 |
|
| FNMA, 5.00%, 11/1/36 | 1,837,137 |
| 2,038,008 |
|
| FNMA, 5.50%, 2/1/37 | 139,606 |
| 155,742 |
|
| FNMA, 6.00%, 7/1/37 | 1,051,565 |
| 1,196,599 |
|
| FNMA, 6.50%, 8/1/37 | 208,207 |
| 244,450 |
|
| FNMA, 5.50%, 7/1/39 | 885,453 |
| 991,144 |
|
| FNMA, 5.00%, 4/1/40 | 1,948,826 |
| 2,161,501 |
|
| FNMA, 5.00%, 6/1/40 | 1,712,292 |
| 1,898,723 |
|
| FNMA, 4.50%, 8/1/40 | 2,490,219 |
| 2,709,096 |
|
| FNMA, 4.50%, 9/1/40 | 3,964,438 |
| 4,332,087 |
|
| FNMA, 3.50%, 1/1/41 | 2,180,939 |
| 2,260,307 |
|
| FNMA, 4.00%, 1/1/41 | 1,663,583 |
| 1,783,977 |
|
| FNMA, 4.50%, 1/1/41 | 1,447,839 |
| 1,574,105 |
|
| FNMA, 4.50%, 2/1/41 | 912,135 |
| 989,018 |
|
| FNMA, 4.00%, 5/1/41 | 2,152,744 |
| 2,289,772 |
|
| FNMA, 4.50%, 7/1/41 | 720,770 |
| 787,322 |
|
| FNMA, 4.50%, 9/1/41 | 817,514 |
| 889,893 |
|
| FNMA, 4.50%, 9/1/41 | 3,286,840 |
| 3,577,831 |
|
| FNMA, 4.00%, 12/1/41 | 1,781,178 |
| 1,902,973 |
|
| FNMA, 4.00%, 1/1/42 | 1,536,636 |
| 1,633,971 |
|
| FNMA, 4.00%, 1/1/42 | 1,062,529 |
| 1,129,657 |
|
| FNMA, 4.00%, 3/1/42 | 1,455,477 |
| 1,547,430 |
|
| FNMA, 3.50%, 5/1/42 | 2,701,012 |
| 2,799,487 |
|
| FNMA, 3.50%, 6/1/42 | 874,815 |
| 907,522 |
|
| FNMA, 3.50%, 9/1/42 | 2,771,467 |
| 2,872,504 |
|
| FNMA, 3.00%, 11/1/42 | 2,014,637 |
| 2,019,594 |
|
|
| | | | | | |
| | Shares/Principal Amount | Value |
| FNMA, 6.50%, 8/1/47 | $ | 43,227 |
| $ | 47,739 |
|
| FNMA, 6.50%, 8/1/47 | 32,783 |
| 36,220 |
|
| FNMA, 6.50%, 9/1/47 | 16,499 |
| 18,235 |
|
| FNMA, 6.50%, 9/1/47 | 23,963 |
| 26,492 |
|
| FNMA, 6.50%, 9/1/47 | 6,406 |
| 7,078 |
|
| FNMA, 6.50%, 9/1/47 | 110,095 |
| 121,614 |
|
| FNMA, 6.50%, 9/1/47 | 4,566 |
| 5,048 |
|
| GNMA, 7.00%, 4/20/26 | 65,922 |
| 77,014 |
|
| GNMA, 7.50%, 8/15/26 | 38,043 |
| 44,860 |
|
| GNMA, 7.00%, 2/15/28 | 12,951 |
| 13,194 |
|
| GNMA, 7.50%, 2/15/28 | 16,198 |
| 16,637 |
|
| GNMA, 7.00%, 12/15/28 | 22,155 |
| 23,134 |
|
| GNMA, 7.00%, 5/15/31 | 74,087 |
| 85,420 |
|
| GNMA, 5.50%, 11/15/32 | 264,274 |
| 295,618 |
|
| GNMA, 4.00%, 1/20/41 | 1,753,503 |
| 1,881,355 |
|
| GNMA, 4.50%, 5/20/41 | 1,040,608 |
| 1,140,032 |
|
| GNMA, 4.50%, 6/15/41 | 847,860 |
| 938,521 |
|
| GNMA, 4.00%, 12/15/41 | 1,689,571 |
| 1,808,564 |
|
| GNMA, 3.50%, 6/20/42 | 1,879,266 |
| 1,969,448 |
|
| GNMA, 3.50%, 7/20/42 | 917,436 |
| 961,462 |
|
| GNMA, 4.50%, 11/20/43 | 1,695,539 |
| 1,852,777 |
|
| | | 77,031,380 |
|
TOTAL U.S. GOVERNMENT AGENCY MORTGAGE-BACKED SECURITIES (Cost $89,899,229) | 92,174,475 |
|
COLLATERALIZED MORTGAGE OBLIGATIONS(4) — 2.4% | | |
| Private Sponsor Collateralized Mortgage Obligations — 2.1% | | |
| ABN Amro Mortgage Corp., Series 2003-4, Class A4, 5.50%, 3/25/33 | 45,661 |
| 48,139 |
|
| Adjustable Rate Mortgage Trust, Series 2004-4, Class 4A1, VRN, 2.49%, 11/1/14 | 464,713 |
| 466,244 |
|
| Banc of America Alternative Loan Trust, Series 2007-2, Class 2A4, 5.75%, 6/25/37 | 428,664 |
| 339,317 |
|
| Banc of America Mortgage Securities, Inc., Series 2003-G, Class 2A1, VRN, 2.61%, 11/1/14 | 279,900 |
| 282,240 |
|
| Banc of America Mortgage Securities, Inc., Series 2004-7, Class 7A1, 5.00%, 8/25/19 | 43,766 |
| 44,263 |
|
| Banc of America Mortgage Securities, Inc., Series 2004-E, Class 2A6 SEQ, VRN, 2.70%, 11/1/14 | 455,179 |
| 454,475 |
|
| Banc of America Mortgage Securities, Inc., Series 2005-1, Class 1A15, 5.50%, 2/25/35 | 198,760 |
| 208,108 |
|
| Citigroup Mortgage Loan Trust, Inc., Series 2004-UST1, Class A4, VRN, 2.18%, 11/1/14 | 825,852 |
| 821,579 |
|
| Citigroup Mortgage Loan Trust, Inc., Series 2005-4, Class A, VRN, 5.21%, 11/1/14 | 213,480 |
| 209,891 |
|
| Countrywide Home Loan Mortgage Pass-Through Trust, Series 2005-17, Class 1A11, 5.50%, 9/25/35 | 12,953 |
| 12,701 |
|
| Credit Suisse First Boston Mortgage Securities Corp., Series 2003-AR28, Class 2A1, VRN, 2.50%, 11/1/14 | 271,812 |
| 271,389 |
|
| First Horizon Alternative Mortgage Securities Trust, Series 2004-AA4, Class A1, VRN, 2.24%, 11/1/14 | 848,084 |
| 844,583 |
|
|
| | | | | | |
| | Shares/Principal Amount | Value |
| First Horizon Mortgage Pass-Through Trust, Series 2005-AR3, Class 4A1, VRN, 5.15%, 11/1/14 | $ | 153,376 |
| $ | 149,579 |
|
| GSR Mortgage Loan Trust, Series 2004-7, Class 3A1, VRN, 2.08%, 11/1/14 | 335,333 |
| 335,277 |
|
| GSR Mortgage Loan Trust, Series 2004-AR5, Class 3A3, VRN, 2.65%, 11/1/14 | 384,230 |
| 382,330 |
|
| GSR Mortgage Loan Trust, Series 2005-AR1, Class 3A1, VRN, 2.57%, 11/1/14 | 495,070 |
| 494,754 |
|
| GSR Mortgage Loan Trust, Series 2005-AR6, Class 2A1, VRN, 2.66%, 11/1/14 | 387,957 |
| 390,133 |
|
| JPMorgan Mortgage Trust, Series 2005-A4, Class 1A1, VRN, 5.30%, 11/1/14 | 170,677 |
| 171,763 |
|
| JPMorgan Mortgage Trust, Series 2005-A4, Class 2A1, VRN, 2.65%, 11/1/14 | 102,481 |
| 102,942 |
|
| JPMorgan Mortgage Trust, Series 2006-A3, Class 7A1, VRN, 2.92%, 11/1/14 | 519,495 |
| 530,122 |
|
JPMorgan Mortgage Trust, Series 2013-1, Class 2A2 SEQ, VRN, 2.50%, 11/1/14(2) | 207,609 |
| 205,498 |
|
| MASTR Adjustable Rate Mortgages Trust, Series 2004-13, Class 3A7, VRN, 2.64%, 11/1/14 | 726,107 |
| 741,333 |
|
| MASTR Asset Securitization Trust, Series 2003-10, Class 3A1, 5.50%, 11/25/33 | 92,338 |
| 97,244 |
|
| Merrill Lynch Mortgage Investors Trust, Series 2005-3, Class 2A, VRN, 2.13%, 11/25/14 | 347,815 |
| 345,295 |
|
| Merrill Lynch Mortgage Investors Trust, Series 2005-A2, Class A1, VRN, 2.49%, 11/1/14 | 528,943 |
| 519,414 |
|
| PHHMC Mortgage Pass-Through Certificates, Series 2007-6, Class A1, VRN, 5.52%, 11/1/14 | 79,842 |
| 80,388 |
|
| Sequoia Mortgage Trust, Series 2012-1, Class 1A1, VRN, 2.87%, 11/1/14 | 118,221 |
| 118,923 |
|
Sequoia Mortgage Trust, Series 2013-12, Class A1 SEQ, VRN, 4.00%, 11/1/14(2) | 394,261 |
| 413,223 |
|
| Structured Adjustable Rate Mortgage Loan Trust, Series 2004-6, Class 3A2, VRN, 2.39%, 11/1/14 | 346,703 |
| 353,909 |
|
| Structured Adjustable Rate Mortgage Loan Trust, Series 2004-8, Class 2A1, VRN, 2.39%, 11/1/14 | 316,132 |
| 316,687 |
|
| Thornburg Mortgage Securities Trust, Series 2004-3, Class A, VRN, 0.89%, 11/25/14 | 919,373 |
| 895,335 |
|
| WaMu Mortgage Pass-Through Certificates, Series 2005-AR3, Class A1, VRN, 2.40%, 11/1/14 | 851,938 |
| 846,748 |
|
| Wells Fargo Mortgage-Backed Securities Trust, Series 2004-4, Class A9, 5.50%, 5/25/34 | 94,154 |
| 97,394 |
|
| Wells Fargo Mortgage-Backed Securities Trust, Series 2004-K, Class 2A6, VRN, 2.62%, 11/1/14 | 139,850 |
| 140,191 |
|
| Wells Fargo Mortgage-Backed Securities Trust, Series 2004-S, Class A1, VRN, 2.62%, 11/1/14 | 274,029 |
| 280,113 |
|
| Wells Fargo Mortgage-Backed Securities Trust, Series 2004-Z, Class 2A2, VRN, 2.61%, 11/1/14 | 281,739 |
| 286,041 |
|
| Wells Fargo Mortgage-Backed Securities Trust, Series 2005-17, Class 1A1, 5.50%, 1/25/36 | 186,804 |
| 190,765 |
|
| Wells Fargo Mortgage-Backed Securities Trust, Series 2005-3, Class A12, 5.50%, 5/25/35 | 346,136 |
| 355,724 |
|
| Wells Fargo Mortgage-Backed Securities Trust, Series 2005-9, Class 2A6, 5.25%, 10/25/35 | 489,885 |
| 516,715 |
|
| Wells Fargo Mortgage-Backed Securities Trust, Series 2005-AR10, Class 1A1, VRN, 2.61%, 11/1/14 | 837,041 |
| 851,125 |
|
|
| | | | | | |
| | Shares/Principal Amount | Value |
| Wells Fargo Mortgage-Backed Securities Trust, Series 2005-AR10, Class 2A15, VRN, 2.61%, 11/1/14 | $ | 91,613 |
| $ | 93,425 |
|
| Wells Fargo Mortgage-Backed Securities Trust, Series 2005-AR10, Class 2A17, VRN, 2.61%, 11/1/14 | 610,752 |
| 614,332 |
|
| Wells Fargo Mortgage-Backed Securities Trust, Series 2005-AR14, Class A1, VRN, 5.35%, 11/1/14 | 175,157 |
| 177,440 |
|
| Wells Fargo Mortgage-Backed Securities Trust, Series 2005-AR16, Class 1A1, VRN, 2.59%, 11/1/14 | 175,680 |
| 179,521 |
|
| Wells Fargo Mortgage-Backed Securities Trust, Series 2005-AR16, Class 3A2, VRN, 2.61%, 11/1/14 | 466,241 |
| 470,401 |
|
| Wells Fargo Mortgage-Backed Securities Trust, Series 2005-AR2, Class 3A1, VRN, 2.61%, 11/1/14 | 144,673 |
| 146,900 |
|
| Wells Fargo Mortgage-Backed Securities Trust, Series 2005-AR7, Class 1A1, VRN, 5.06%, 11/1/14 | 556,497 |
| 565,928 |
|
| Wells Fargo Mortgage-Backed Securities Trust, Series 2006-10, Class A4 SEQ, 6.00%, 8/25/36 | 233,203 |
| 240,282 |
|
| Wells Fargo Mortgage-Backed Securities Trust, Series 2006-13, Class A5, 6.00%, 10/25/36 | 284,858 |
| 295,703 |
|
| Wells Fargo Mortgage-Backed Securities Trust, Series 2007-13, Class A1, 6.00%, 9/25/37 | 152,292 |
| 159,046 |
|
| Wells Fargo Mortgage-Backed Securities Trust, Series 2007-14, Class 2A2, 5.50%, 10/25/22 | 209,635 |
| 217,595 |
|
| Wells Fargo Mortgage-Backed Securities Trust, Series 2007-16, Class 1A1, 6.00%, 12/28/37 | 125,237 |
| 129,895 |
|
| Wells Fargo Mortgage-Backed Securities Trust, Series 2007-9, Class 1A8, 5.50%, 7/25/37 | 82,159 |
| 83,541 |
|
| Wells Fargo Mortgage-Backed Securities Trust, Series 2007-AR10, Class 1A1, VRN, 6.10%, 11/1/14 | 147,078 |
| 147,438 |
|
| Wells Fargo Mortgage-Backed Securities Trust, Series 2008-1, Class 4A1, 5.75%, 2/25/38 | 449,141 |
| 474,838 |
|
| | | 18,208,179 |
|
| U.S. Government Agency Collateralized Mortgage Obligations — 0.3% | |
| FHLMC, Series 2926, Class EW SEQ, 5.00%, 1/15/25 | 424,566 |
| 460,654 |
|
| FHLMC, Series 77, Class H, 8.50%, 9/15/20 | 32,029 |
| 34,176 |
|
| FNMA, Series 2014-M3, Class ASQ2, 0.56%, 3/25/16 | 1,765,974 |
| 1,765,772 |
|
| | | 2,260,602 |
|
TOTAL COLLATERALIZED MORTGAGE OBLIGATIONS (Cost $20,473,733) | | 20,468,781 |
|
COMMERCIAL MORTGAGE-BACKED SECURITIES(4) — 2.2% | | |
| Banc of America Commercial Mortgage, Inc., Series 2005-5, Class A4, VRN, 5.12%, 11/1/14 | 333,480 |
| 340,491 |
|
| Banc of America Commercial Mortgage, Inc., Series 2005-5, Class AM, VRN, 5.18%, 11/1/14 | 300,000 |
| 311,293 |
|
Bank of America Merrill Lynch Commercial Mortgage Securities Trust, Series 2012-PARK, Class A SEQ, 2.96%, 12/10/30(2) | 1,125,000 |
| 1,116,164 |
|
Bank of America Merrill Lynch Commercial Mortgage Securities Trust, Series 2014-ICTS, Class A, VRN, 0.95%, 11/15/14(2) | 825,000 |
| 823,591 |
|
BB-UBS Trust, Series 2012-SHOW, Class A SEQ, 3.43%, 11/5/36(2) | 950,000 |
| 952,242 |
|
BLCP Hotel Trust, Series 2014-CLRN, Class A, VRN, 1.10%, 11/15/14(2) | 1,400,000 |
| 1,403,427 |
|
| COMM Mortgage Trust, Series 2014-UBS5, Class AM, 4.19%, 9/10/47 | 1,025,000 |
| 1,072,201 |
|
Commercial Mortgage Pass-Through Certificates, Series 2014-BBG, Class A, VRN, 0.95%, 11/15/14(2) | 925,000 |
| 924,767 |
|
| Commercial Mortgage Pass-Through Certificates, Series 2014-CR15, Class AM SEQ, 4.43%, 2/10/47 | 675,000 |
| 723,263 |
|
|
| | | | | | |
| | Shares/Principal Amount | Value |
| Commercial Mortgage Pass-Through Certificates, Series 2014-LC17, Class AM, 4.19%, 10/10/47 | $ | 775,000 |
| $ | 811,635 |
|
| Greenwich Capital Commercial Funding Corp., Series 2005-GG3, Class A4, VRN, 4.80%, 11/1/14 | 48,958 |
| 48,933 |
|
| Greenwich Capital Commercial Funding Corp., Series 2005-GG3, Class AJ, VRN, 4.86%, 11/1/14 | 158,000 |
| 158,433 |
|
| GS Mortgage Securities Corp. II, Series 2005-GG4, Class A4 SEQ, 4.76%, 7/10/39 | 301,337 |
| 303,984 |
|
| GS Mortgage Securities Corp. II, Series 2005-GG4, Class A4A SEQ, 4.75%, 7/10/39 | 855,362 |
| 860,953 |
|
GS Mortgage Securities Corp. II, Series 2012-ALOH, Class A SEQ, 3.55%, 4/10/34(2) | 1,125,000 |
| 1,169,315 |
|
Irvine Core Office Trust, Series 2013-IRV, Class A2 SEQ, VRN, 3.17%, 11/10/14(2) | 1,575,000 |
| 1,582,958 |
|
| JPMBB Commercial Mortgage Securities Trust, Series 2014-C21, Class B, VRN, 4.34%, 11/1/14 | 475,000 |
| 496,624 |
|
| JPMorgan Chase Commercial Mortgage Securities Corp., Series 2013-C16, Class A4, 4.17%, 12/15/46 | 275,000 |
| 296,880 |
|
| JPMorgan Chase Commercial Mortgage Securities Corp., Series 2013-C16, Class AS, 4.52%, 12/15/46 | 450,000 |
| 488,290 |
|
JPMorgan Chase Commercial Mortgage Securities Corp., Series 2014-CBM, Class A, VRN, 1.06%, 11/10/14(3) | 925,000 |
| 925,000 |
|
| LB-UBS Commercial Mortgage Trust, Series 2004-C1, Class A4, SEQ, 4.57%, 1/15/31 | 45,290 |
| 46,482 |
|
| LB-UBS Commercial Mortgage Trust, Series 2004-C8, Class AJ, VRN, 4.86%, 11/15/14 | 86,238 |
| 86,343 |
|
| LB-UBS Commercial Mortgage Trust, Series 2005-C5, Class A4 SEQ, 4.95%, 9/15/30 | 608,997 |
| 618,080 |
|
| LB-UBS Commercial Mortgage Trust, Series 2005-C5, Class AM, VRN, 5.02%, 11/15/14 | 400,000 |
| 410,240 |
|
| LB-UBS Commercial Mortgage Trust, Series 2005-C7, Class AM, VRN, 5.26%, 11/15/14 | 425,000 |
| 441,534 |
|
| Morgan Stanley Bank of America Merrill Lynch Trust, Series 2012-C6, Class A4 SEQ, 2.86%, 11/15/45 | 500,000 |
| 497,309 |
|
| Morgan Stanley Capital I Trust, Series 2005-T17, Class A5 SEQ, 4.78%, 12/13/41 | 519,092 |
| 518,875 |
|
Morgan Stanley Capital I Trust, Series 2014-CPT, Class A, VRN, 3.35%, 11/13/14(2) | 800,000 |
| 826,420 |
|
Morgan Stanley Capital I Trust, Series 2014-CPT, Class C, VRN, 3.45%, 11/1/14(2) | 725,000 |
| 737,039 |
|
VNDO Mortgage Trust, Series 2013-PENN, Class C, VRN, 3.95%, 11/1/14(2) | 300,000 |
| 311,277 |
|
| Wachovia Bank Commercial Mortgage Trust, Series 2004-C15, Class A4 SEQ, 4.80%, 10/15/41 | 65,288 |
| 65,322 |
|
TOTAL COMMERCIAL MORTGAGE-BACKED SECURITIES (Cost $19,251,714) | | 19,369,365 |
|
ASSET-BACKED SECURITIES(4) — 1.3% | | |
Avis Budget Rental Car Funding AESOP LLC, Series 2012-1A, Class A SEQ, 2.05%, 8/20/16(2) | 675,000 |
| 680,359 |
|
Chesapeake Funding LLC, Series 2014-1A, Class A, VRN, 0.57%, 11/7/14(2) | 950,000 |
| 949,597 |
|
| CNH Equipment Trust, Series 2014-B, Class A2 SEQ, 0.48%, 8/15/17 | 1,100,000 |
| 1,099,803 |
|
| Dryrock Issuance Trust, Series 2014-1, Class A, VRN, 0.51%, 11/15/14 | 775,000 |
| 776,122 |
|
Enterprise Fleet Financing LLC, Series 2014-1, Class A2 SEQ, 0.87%, 9/20/19(2) | 475,000 |
| 475,476 |
|
|
| | | | | | |
| | Shares/Principal Amount | Value |
| Harley-Davidson Motorcycle Trust, Series 2014-1, Class A2B, VRN, 0.32%, 11/15/14 | $ | 1,157,286 |
| $ | 1,157,406 |
|
Hertz Fleet Lease Funding LP, Series 2014-1, Class A, VRN, 0.55%, 11/10/14(2) | 1,125,000 |
| 1,125,737 |
|
Hilton Grand Vacations Trust, Series 2013-A, Class A SEQ, 2.28%, 1/25/26(2) | 269,121 |
| 271,810 |
|
Hilton Grand Vacations Trust, Series 2014-AA, Class A SEQ, 1.77%, 11/25/26(2) | 1,302,476 |
| 1,296,432 |
|
| John Deere Owner Trust, Series 2014-A, Class A2 SEQ, 0.45%, 9/15/16 | 1,375,000 |
| 1,375,510 |
|
| John Deere Owner Trust, Series 2014-A, Class A3 SEQ, 0.92%, 4/16/18 | 675,000 |
| 675,766 |
|
MVW Owner Trust, Series 2014-1A, Class A, 2.25%, 9/20/31(2) | 700,000 |
| 704,570 |
|
TAL Advantage LLC, Series 2014-1A, Class A, 3.51%, 2/22/39(2) | 560,000 |
| 564,397 |
|
| US Airways 2013-1 Class A Pass-Through Trust, 3.95%, 5/15/27 | 170,000 |
| 171,275 |
|
TOTAL ASSET-BACKED SECURITIES (Cost $11,322,798) | | 11,324,260 |
|
| SOVEREIGN GOVERNMENTS AND AGENCIES — 0.6% | | |
| Brazil — 0.1% | | |
| Brazilian Government International Bond, 5.875%, 1/15/19 | 530,000 |
| 601,550 |
|
| Brazilian Government International Bond, 4.875%, 1/22/21 | 20,000 |
| 21,650 |
|
| Brazilian Government International Bond, 2.625%, 1/5/23 | 260,000 |
| 239,850 |
|
| | | 863,050 |
|
Canada† | | |
| Province of Ontario Canada, 1.00%, 7/22/16 | 150,000 |
| 150,751 |
|
Chile† | | |
| Chile Government International Bond, 3.25%, 9/14/21 | 100,000 |
| 104,000 |
|
| Chile Government International Bond, 3.625%, 10/30/42 | 100,000 |
| 90,850 |
|
| | | 194,850 |
|
| Colombia — 0.1% | | |
| Colombia Government International Bond, 4.375%, 7/12/21 | 310,000 |
| 331,700 |
|
| Colombia Government International Bond, 6.125%, 1/18/41 | 100,000 |
| 120,750 |
|
| | | 452,450 |
|
Italy† | | |
| Italy Government International Bond, 6.875%, 9/27/23 | 220,000 |
| 281,252 |
|
| Mexico — 0.2% | | |
| Mexico Government International Bond, 5.625%, 1/15/17 | 70,000 |
| 76,755 |
|
| Mexico Government International Bond, MTN, 5.95%, 3/19/19 | 420,000 |
| 485,100 |
|
| Mexico Government International Bond, 5.125%, 1/15/20 | 330,000 |
| 371,250 |
|
| Mexico Government International Bond, 4.00%, 10/2/23 | 100,000 |
| 104,775 |
|
| Mexico Government International Bond, 6.05%, 1/11/40 | 50,000 |
| 60,750 |
|
| Mexico Government International Bond, MTN, 4.75%, 3/8/44 | 400,000 |
| 408,200 |
|
| | | 1,506,830 |
|
Peru† | | |
| Peruvian Government International Bond, 6.55%, 3/14/37 | 70,000 |
| 89,775 |
|
| Peruvian Government International Bond, 5.625%, 11/18/50 | 170,000 |
| 193,708 |
|
| | | 283,483 |
|
| Philippines — 0.1% | | |
| Philippine Government International Bond, 4.00%, 1/15/21 | 300,000 |
| 322,125 |
|
|
| | | | | | |
| | Shares/Principal Amount | Value |
| Philippine Government International Bond, 6.375%, 10/23/34 | $ | 150,000 |
| $ | 197,250 |
|
| | | 519,375 |
|
Poland† | | |
| Poland Government International Bond, 5.125%, 4/21/21 | 140,000 |
| 158,375 |
|
| Poland Government International Bond, 3.00%, 3/17/23 | 140,000 |
| 139,055 |
|
| | | 297,430 |
|
South Africa† | | |
| South Africa Government International Bond, 4.67%, 1/17/24 | 110,000 |
| 114,950 |
|
| South Korea — 0.1% | | |
| Export-Import Bank of Korea, 3.75%, 10/20/16 | 160,000 |
| 168,446 |
|
| Korea Development Bank (The), 3.25%, 3/9/16 | 130,000 |
| 133,881 |
|
| Korea Development Bank (The), 4.00%, 9/9/16 | 110,000 |
| 115,517 |
|
| | | 417,844 |
|
Turkey† | | |
| Turkey Government International Bond, 3.25%, 3/23/23 | 200,000 |
| 187,330 |
|
Uruguay† | | |
| Uruguay Government International Bond, 4.125%, 11/20/45 | 70,000 |
| 61,635 |
|
TOTAL SOVEREIGN GOVERNMENTS AND AGENCIES (Cost $5,036,450) | | 5,331,230 |
|
| MUNICIPAL SECURITIES — 0.4% | | |
| American Municipal Power-Ohio, Inc., Rev., (Building Bonds), 5.94%, 2/15/47 | 50,000 |
| 60,903 |
|
| American Municipal Power-Ohio, Inc., Rev., (Building Bonds), 7.50%, 2/15/50 | 75,000 |
| 107,953 |
|
| Bay Area Toll Authority Toll Bridge Rev., Series 2010 S-1, (Building Bonds), 6.92%, 4/1/40 | 135,000 |
| 185,047 |
|
| California GO, (Building Bonds), 7.55%, 4/1/39 | 100,000 |
| 150,339 |
|
| California GO, (Building Bonds), 7.30%, 10/1/39 | 170,000 |
| 244,397 |
|
| California GO, (Building Bonds), 7.60%, 11/1/40 | 80,000 |
| 121,506 |
|
| Illinois GO, (Taxable Pension), 5.10%, 6/1/33 | 245,000 |
| 242,045 |
|
| Los Angeles Community College District GO, Series 2010 D, (Election of 2008), 6.68%, 8/1/36 | 100,000 |
| 132,773 |
|
| Los Angeles Department of Water & Power Rev., (Building Bonds), 5.72%, 7/1/39 | 60,000 |
| 75,011 |
|
| Metropolitan Transportation Authority Rev., Series 2010 C-1, (Building Bonds), 6.69%, 11/15/40 | 105,000 |
| 142,694 |
|
| Metropolitan Transportation Authority Rev., Series 2010 E, (Building Bonds), 6.81%, 11/15/40 | 60,000 |
| 82,529 |
|
| Missouri Highways & Transportation Commission Rev., (Building Bonds), 5.45%, 5/1/33 | 130,000 |
| 150,943 |
|
| New Jersey State Turnpike Authority Rev., Series 2009 F, (Building Bonds), 7.41%, 1/1/40 | 200,000 |
| 293,576 |
|
| New Jersey State Turnpike Authority Rev., Series 2010 A, (Building Bonds), 7.10%, 1/1/41 | 95,000 |
| 135,256 |
|
| New York GO, Series 2010 F1, (Building Bonds), 6.27%, 12/1/37 | 95,000 |
| 122,908 |
|
| Ohio Water Development Authority Pollution Control Rev., Series 2010 B-2, (Building Bonds), 4.88%, 12/1/34 | 110,000 |
| 122,210 |
|
| Oregon State Department of Transportation Highway User Tax Rev., Series 2010 A, (Building Bonds), 5.83%, 11/15/34 | 70,000 |
| 87,148 |
|
| Port Authority of New York & New Jersey Rev., 4.93%, 10/1/51 | 50,000 |
| 55,225 |
|
| Port Authority of New York & New Jersey Rev., 4.46%, 10/1/62 | 245,000 |
| 246,225 |
|
|
| | | | | | |
| | Shares/Principal Amount | Value |
| Rutgers State University Rev., Series 2010 H, (Building Bonds), 5.67%, 5/1/40 | $ | 205,000 |
| $ | 249,586 |
|
| Sacramento Municipal Utility District Electric Rev., Series 2010 W, (Building Bonds), 6.16%, 5/15/36 | 210,000 |
| 264,934 |
|
| Salt River Agricultural Improvement & Power District Electric Rev., Series 2010 A, (Building Bonds), 4.84%, 1/1/41 | 95,000 |
| 108,410 |
|
| San Francisco City & County Public Utilities Water Commission Rev., Series 2010 B, (Building Bonds), 6.00%, 11/1/40 | 105,000 |
| 132,167 |
|
| Santa Clara Valley Transportation Authority Sales Tax Rev., Series 2010 A, (Building Bonds), 5.88%, 4/1/32 | 120,000 |
| 144,289 |
|
| Texas GO, (Building Bonds), 5.52%, 4/1/39 | 50,000 |
| 63,409 |
|
| Washington GO, Series 2010 F, (Building Bonds), 5.14%, 8/1/40 | 20,000 |
| 23,906 |
|
TOTAL MUNICIPAL SECURITIES (Cost $3,110,476) | | 3,745,389 |
|
| U.S. GOVERNMENT AGENCY SECURITIES — 0.1% | | |
FNMA, 2.625%, 9/6/24 (Cost $584,684) | 590,000 |
| 588,626 |
|
| TEMPORARY CASH INVESTMENTS — 1.2% | | |
SSgA U.S. Government Money Market Fund, Class N (Cost $10,092,865) | 10,092,865 |
| 10,092,865 |
|
TOTAL INVESTMENT SECURITIES — 100.7% (Cost $755,226,288) | | 870,613,551 |
|
| OTHER ASSETS AND LIABILITIES — (0.7)% | | (5,968,699 | ) |
| TOTAL NET ASSETS — 100.0% | | $ | 864,644,852 |
|
|
| | |
| NOTES TO SCHEDULE OF INVESTMENTS |
| FHLMC | - | Federal Home Loan Mortgage Corporation |
| FNMA | - | Federal National Mortgage Association |
| GNMA | - | Government National Mortgage Association |
| GO | - | General Obligation |
| MTN | - | Medium Term Note |
| SEQ | - | Sequential Payer |
| VRN | - | Variable Rate Note. Interest reset date is indicated. Rate shown is effective at the period end. |
| |
| † | Category is less than 0.05% of total net assets. |
| |
| (2) | Restricted security exempt from registration pursuant to Rule 144A under the Securities Act of 1933. These securities may be sold without restriction to qualified institutional investors and have been deemed liquid under policies approved by the Board of Directors. The aggregate value of these securities at the period end was $22,929,647, which represented 2.7% of total net assets. |
| |
| (3) | When-issued security. The issue price and yield are fixed on the date of the commitment, but payment and delivery are scheduled for a future date. |
| |
| (4) | Final maturity date indicated, unless otherwise noted. |
| |
| (5) | Forward commitment. Settlement date is indicated. |
See Notes to Financial Statements.
|
|
| Statement of Assets and Liabilities |
|
| | | |
| OCTOBER 31, 2014 | |
| Assets | |
| Investment securities, at value (cost of $755,226,288) | $ | 870,613,551 |
|
| Receivable for investments sold | 327,964 |
|
| Receivable for capital shares sold | 260,305 |
|
| Dividends and interest receivable | 2,320,723 |
|
| | 873,522,543 |
|
| | |
| Liabilities | |
| Payable for investments purchased | 7,990,364 |
|
| Payable for capital shares redeemed | 252,975 |
|
| Accrued management fees | 634,352 |
|
| | 8,877,691 |
|
| | |
| Net Assets | $ | 864,644,852 |
|
| | |
| Net Assets Consist of: | |
| Capital (par value and paid-in surplus) | $ | 689,227,055 |
|
| Undistributed net investment income | 1,319,897 |
|
| Undistributed net realized gain | 58,710,637 |
|
| Net unrealized appreciation | 115,387,263 |
|
| | $ | 864,644,852 |
|
|
| | | | |
| | Net Assets | Shares Outstanding | Net Asset Value Per Share |
| Investor Class, $0.01 Par Value | $815,635,764 | 42,087,568 |
| $19.38 |
| Institutional Class, $0.01 Par Value | $49,009,088 | 2,527,612 |
| $19.39 |
See Notes to Financial Statements.
|
| | | |
| YEAR ENDED OCTOBER 31, 2014 | |
| Investment Income (Loss) | |
| Income: | |
| Dividends (net of foreign taxes withheld of $6,136) | $ | 9,872,326 |
|
| Interest | 8,617,307 |
|
| | 18,489,633 |
|
| Expenses: | |
| Management fees | 7,273,033 |
|
| Directors' fees and expenses | 15,600 |
|
| Other expenses | 1,798 |
|
| | 7,290,431 |
|
| | |
| Net investment income (loss) | 11,199,202 |
|
| | |
| Realized and Unrealized Gain (Loss) | |
| Net realized gain (loss) on: | |
| Investment transactions | 62,893,731 |
|
| Futures contract transactions | (352,122) |
|
| | 62,541,609 |
|
| | |
| Change in net unrealized appreciation (depreciation) on: | |
| Investments | 9,707,721 |
|
| Futures contracts | 88,954 |
|
| | 9,796,675 |
|
| | |
| Net realized and unrealized gain (loss) | 72,338,284 |
|
| | |
| Net Increase (Decrease) in Net Assets Resulting from Operations | $ | 83,537,486 |
|
See Notes to Financial Statements.
|
|
| Statement of Changes in Net Assets |
|
| | | | | | |
| YEARS ENDED OCTOBER 31, 2014 AND OCTOBER 31, 2013 |
| Increase (Decrease) in Net Assets | October 31, 2014 | October 31, 2013 |
| Operations | | |
| Net investment income (loss) | $ | 11,199,202 |
| $ | 11,602,232 |
|
| Net realized gain (loss) | 62,541,609 |
| 60,523,784 |
|
| Change in net unrealized appreciation (depreciation) | 9,796,675 |
| 26,804,162 |
|
| Net increase (decrease) in net assets resulting from operations | 83,537,486 |
| 98,930,178 |
|
| | | |
| Distributions to Shareholders | | |
| From net investment income: | | |
| Investor Class | (11,400,287) |
| (11,454,141) |
|
| Institutional Class | (817,811) |
| (788,061) |
|
| From net realized gains: | | |
| Investor Class | (54,390,743) |
| (16,097,790) |
|
| Institutional Class | (3,584,868) |
| (533,588) |
|
| Decrease in net assets from distributions | (70,193,709) |
| (28,873,580) |
|
| | | |
| Capital Share Transactions | | |
| Net increase (decrease) in net assets from capital share transactions (Note 5) | 82,774,430 |
| 69,327,289 |
|
| | | |
| Net increase (decrease) in net assets | 96,118,207 |
| 139,383,887 |
|
| | | |
| Net Assets | | |
| Beginning of period | 768,526,645 |
| 629,142,758 |
|
| End of period | $ | 864,644,852 |
| $ | 768,526,645 |
|
| | | |
| Undistributed net investment income | $ | 1,319,897 |
| $ | 1,368,993 |
|
See Notes to Financial Statements.
|
|
| Notes to Financial Statements |
OCTOBER 31, 2014
1. Organization
American Century Mutual Funds, Inc. (the corporation) is registered under the Investment Company Act of 1940, as amended (the 1940 Act), as an open-end management investment company and is organized as a Maryland corporation. Balanced Fund (the fund) is one fund in a series issued by the corporation. The fund is diversified as defined under the 1940 Act. The fund’s investment objective is to seek long-term capital growth and current income by investing approximately 60% of its assets in equity securities and the remainder in bonds and other fixed-income securities.
The fund offers the Investor Class and the Institutional Class. The share classes differ principally in their respective distribution and shareholder servicing expenses and arrangements. The Institutional Class is made available to institutional shareholders or through financial intermediaries whose clients do not require the same level of shareholder and administrative services as shareholders of other classes. As a result, the Institutional Class is charged a lower unified management fee.
2. Significant Accounting Policies
The following is a summary of significant accounting policies consistently followed by the fund in preparation of its financial statements. The fund is an investment company and follows accounting and reporting guidance in accordance with accounting principles generally accepted in the United States of America. This may require management to make certain estimates and assumptions at the date of the financial statements. Actual results could differ from these estimates. Management evaluated the impact of events or transactions occurring through the date the financial statements were issued that would merit recognition or disclosure.
Investment Valuations — The fund determines the fair value of its investments and computes its net asset value per share at the close of regular trading (usually 4 p.m. Eastern time) on the New York Stock Exchange (NYSE) on each day the NYSE is open. The Board of Directors has adopted valuation policies and procedures to guide the investment advisor in the fund’s investment valuation process and to provide methodologies for the oversight of the fund’s pricing function.
Equity securities that are listed or traded on a domestic securities exchange are valued at the last reported sales price or at the official closing price as provided by the exchange. Equity securities traded on foreign securities exchanges are generally valued at the closing price of such securities on the exchange where primarily traded or at the close of the NYSE, if that is earlier. If no last sales price is reported, or if local convention or regulation so provides, the mean of the latest bid and asked prices may be used. Securities traded over-the-counter are valued at the mean of the latest bid and asked prices, the last sales price, or the official closing price.
Fixed income securities maturing in greater than 60 days at the time of purchase are valued at the evaluated mean as provided by independent pricing services or at the mean of the most recent bid and asked prices as provided by investment dealers. Fixed income securities maturing within 60 days at the time of purchase may be valued at cost, plus or minus any amortized discount or premium or at the evaluated mean as provided by an independent pricing service. Evaluated mean prices are commonly derived through utilization of market models, which may consider, among other factors: trade data, quotations from dealers and active market makers, relevant yield curve and spread data, related sector levels, creditworthiness, trade data or market information on comparable securities, and other relevant security specific information.
Open-end management investment companies are valued at the reported net asset value per share. Exchange-traded futures contracts are valued at the settlement price as provided by the appropriate clearing corporation.
If the fund determines that the market price for an investment is not readily available or the valuation methods mentioned above do not reflect an investment’s fair value, such investment is valued as determined in good faith by the Board of Directors or its delegate, in accordance with policies and procedures adopted by the Board of Directors. In its determination of fair value, the fund may review several factors including, but not limited to, market information regarding the specific investment or comparable investments and correlation with other investment types, futures indices or general market indicators. Circumstances that may cause the
fund to use these procedures to value an investment include, but are not limited to: an investment has been declared in default or is distressed; trading in a security has been suspended during the trading day or a security is not actively trading on its principal exchange; prices received from a regular pricing source are deemed unreliable; or there is a foreign market holiday and no trading occurred.
The fund monitors for significant events occurring after the close of an investment’s primary exchange but before the fund’s net asset value per share is determined. Significant events may include, but are not limited to: corporate announcements and transactions; governmental action and political unrest that could impact a specific investment or an investment sector; or armed conflicts, natural disasters and similar events that could affect investments in a specific country or region. The fund also monitors for significant fluctuations between domestic and foreign markets, as evidenced by the U.S. market or such other indicators that the Board of Directors, or its delegate, deems appropriate. If significant fluctuations in foreign markets are identified, the fund may apply a model-derived factor to the closing price of equity securities traded on foreign securities exchanges. The factor is based on observable market data as provided by an independent pricing service.
Security Transactions — Security transactions are accounted for as of the trade date. Net realized gains and losses are determined on the identified cost basis, which is also used for federal income tax purposes.
Investment Income — Dividend income less foreign taxes withheld, if any, is recorded as of the ex-dividend date. Distributions received on securities that represent a return of capital or long-term capital gain are recorded as a reduction of cost of investments and/or as a realized gain. The fund may estimate the components of distributions received that may be considered nontaxable distributions or long-term capital gain distributions for income tax purposes. Interest income is recorded on the accrual basis and includes paydown gain (loss) and accretion of discounts and amortization of premiums. Inflation adjustments related to inflation-linked debt securities are reflected as interest income.
Forward Commitments — The fund may engage in securities transactions on a forward commitment basis. In these transactions, the securities’ prices and yields are fixed on the date of the commitment. The fund may sell a to-be-announced (TBA) security and at the same time make a commitment to purchase the same security at a future date at a specified price. Conversely, the fund may purchase a TBA security and at the same time make a commitment to sell the same security at a future date at a specified price. These types of transactions are known as “TBA roll” transactions and are accounted for as purchases and sales. The fund will segregate cash, cash equivalents or other appropriate liquid securities on its records in amounts sufficient to meet the purchase price.
Segregated Assets — In accordance with the 1940 Act, the fund segregates assets on its books and records to cover certain types of investments, including, but not limited to, futures contracts, forward commitments, when-issued securities, swap agreements and certain forward foreign currency exchange contracts. American Century Investment Management, Inc. (ACIM) (the investment advisor) monitors, on a daily basis, the securities segregated to ensure the fund designates a sufficient amount of liquid assets, marked-to-market daily. The fund may also receive assets or be required to pledge assets at the custodian bank or with a broker for margin requirements on futures contracts, forward commitments and swap agreements.
Income Tax Status — It is the fund’s policy to distribute substantially all net investment income and net realized gains to shareholders and to otherwise qualify as a regulated investment company under provisions of the Internal Revenue Code. Accordingly, no provision has been made for income taxes. The fund files U.S. federal, state, local and non-U.S. tax returns as applicable. The fund's tax returns are subject to examination by the relevant taxing authority until expiration of the applicable statute of limitations, which is generally three years from the date of filing but can be longer in certain jurisdictions. At this time, management believes there are no uncertain tax positions which, based on their technical merit, would not be sustained upon examination and for which it is reasonably possible that the total amounts of unrecognized tax benefits will significantly change in the next twelve months.
Multiple Class — All shares of the fund represent an equal pro rata interest in the net assets of the class to which such shares belong, and have identical voting, dividend, liquidation and other rights and the same terms and conditions, except for class specific expenses and exclusive rights to vote on matters affecting only individual classes. Income, non-class specific expenses, and realized and unrealized capital gains and losses of the fund are allocated to each class of shares based on their relative net assets.
Distributions to Shareholders — Distributions from net investment income, if any, are generally declared and paid quarterly. Distributions from net realized gains, if any, are generally declared and paid annually.
Indemnifications — Under the corporation’s organizational documents, its officers and directors are indemnified against certain liabilities arising out of the performance of their duties to the fund. In addition, in the normal course of business, the fund enters into contracts that provide general indemnifications. The maximum exposure under these arrangements is unknown as this would involve future claims that may be made against a fund. The risk of material loss from such claims is considered by management to be remote.
3. Fees and Transactions with Related Parties
Certain officers and directors of the corporation are also officers and/or directors of American Century Companies, Inc. (ACC). The corporation’s investment advisor, ACIM, the corporation's distributor, American Century Investment Services, Inc., and the corporation’s transfer agent, American Century Services, LLC, are wholly owned, directly or indirectly, by ACC.
Management Fees — The corporation has entered into a management agreement with ACIM, under which ACIM provides the fund with investment advisory and management services in exchange for a single, unified management fee (the fee) per class. The agreement provides that all expenses of managing and operating the fund, except distribution and service fees, brokerage expenses, taxes, interest, fees and expenses of the independent directors (including legal counsel fees), and extraordinary expenses, will be paid by ACIM. The fee is computed and accrued daily based on each class’s daily net assets and paid monthly in arrears. The rate of the fee is determined by applying a fee rate calculation formula. This formula takes into account the fund’s assets as well as certain assets, if any, of other clients of the investment advisor outside the American Century Investments family of funds (such as subadvised funds and separate accounts) that have very similar investment teams and investment strategies (strategy assets). The annual management fee schedule ranges from 0.800% to 0.900% for the Investor Class. The annual management fee schedule ranges from 0.600% to 0.700% for the Institutional Class. The effective annual management fee for each class for the year ended October 31, 2014 was 0.90% for the Investor Class and 0.70% for the Institutional Class.
Directors' Fees and Expenses — The Board of Directors is responsible for overseeing the investment advisor’s management and operations of the fund. The directors receive detailed information about the fund and its investment advisor regularly throughout the year, and meet at least quarterly with management of the investment advisor to review reports about fund operations. Fees and expenses incurred in conjunction with the directors during the year ended October 31, 2014 are detailed in the Statement of Operations. The fund’s officers do not receive compensation from the fund.
4. Investment Transactions
Purchases of investment securities, excluding short-term investments, for the year ended October 31, 2014 totaled $562,409,301, of which $93,222,782 represented U.S. Treasury and Government Agency obligations.
Sales of investment securities, excluding short-term investments, for the year ended October 31, 2014 totaled $520,199,020, of which $84,659,168 represented U.S. Treasury and Government Agency obligations.
5. Capital Share Transactions
Transactions in shares of the fund were as follows:
|
| | | | | | | | |
| | Year ended October 31, 2014 | Year ended October 31, 2013 |
| | Shares | Amount | Shares | Amount |
| Investor Class/Shares Authorized | 250,000,000 | | 250,000,000 | |
| Sold | 6,263,780 | $ | 117,386,844 |
| 7,246,923 | $ | 130,710,357 |
|
| Issued in reinvestment of distributions | 3,565,008 | 64,242,576 |
| 1,539,480 | 26,889,632 |
|
| Redeemed | (5,340,834) | (100,173,536) |
| (6,197,053) | (111,531,308) |
|
| | 4,487,954 | 81,455,884 |
| 2,589,350 | 46,068,681 |
|
| Institutional Class/Shares Authorized | 15,000,000 | | 15,000,000 | |
| Sold | 504,596 | 9,504,663 |
| 2,962,875 | 53,420,395 |
|
| Issued in reinvestment of distributions | 244,093 | 4,402,679 |
| 74,578 | 1,321,649 |
|
| Redeemed | (669,392) | (12,588,796) |
| (1,718,592) | (31,483,436) |
|
| | 79,297 | 1,318,546 |
| 1,318,861 | 23,258,608 |
|
| Net increase (decrease) | 4,567,251 | $ | 82,774,430 |
| 3,908,211 | $ | 69,327,289 |
|
6. Fair Value Measurements
The fund’s investments valuation process is based on several considerations and may use multiple inputs to determine the fair value of the investments held by the fund. In conformity with accounting principles generally accepted in the United States of America, the inputs used to determine a valuation are classified into three broad levels.
| |
| • | Level 1 valuation inputs consist of unadjusted quoted prices in an active market for identical investments. |
| |
| • | Level 2 valuation inputs consist of direct or indirect observable market data (including quoted prices for comparable investments, evaluations of subsequent market events, interest rates, prepayment speeds, credit risk, etc.). These inputs also consist of quoted prices for identical investments initially expressed in local currencies that are adjusted through translation into U.S. dollars. |
| |
| • | Level 3 valuation inputs consist of unobservable data (including a fund’s own assumptions). |
The level classification is based on the lowest level input that is significant to the fair valuation measurement. The valuation inputs are not necessarily an indication of the risks associated with investing in these securities or other financial instruments. There were no significant transfers between levels during the period.
The following is a summary of the level classifications as of period end. The Schedule of Investments provides additional information on the fund’s portfolio holdings.
|
| | | | | | | | |
| | Level 1 | Level 2 | Level 3 |
| Assets | | | |
| Investment Securities | | | |
| Common Stocks | $ | 517,111,423 |
| — |
| — |
|
| Corporate Bonds | — |
| $ | 95,794,500 |
| — |
|
| U.S. Treasury Securities | — |
| 94,612,637 |
| — |
|
| U.S. Government Agency Mortgage-Backed Securities | — |
| 92,174,475 |
| — |
|
| Collateralized Mortgage Obligations | — |
| 20,468,781 |
| — |
|
| Commercial Mortgage-Backed Securities | — |
| 19,369,365 |
| — |
|
| Asset-Backed Securities | — |
| 11,324,260 |
| — |
|
| Sovereign Governments and Agencies | — |
| 5,331,230 |
| — |
|
| Municipal Securities | — |
| 3,745,389 |
| — |
|
| U.S. Government Agency Securities | — |
| 588,626 |
| — |
|
| Temporary Cash Investments | 10,092,865 |
| — |
| — |
|
| | $ | 527,204,288 |
| $ | 343,409,263 |
| — |
|
7. Derivative Instruments
Interest Rate Risk — The fund is subject to interest rate risk in the normal course of pursuing its investment objectives. The value of bonds generally declines as interest rates rise. A fund may enter into futures contracts based on a bond index or a specific underlying security. A fund may purchase futures contracts to gain exposure to increases in market value or sell futures contracts to protect against a decline in market value. Upon entering into a futures contract, a fund will segregate cash, cash equivalents or other appropriate liquid securities on its records in amounts sufficient to meet requirements. Subsequent payments (variation margin) are made or received daily, in cash, by a fund. The variation margin is equal to the daily change in the contract value and is recorded as unrealized gains and losses. A fund recognizes a realized gain or loss when the futures contract is closed or expires. Net realized and unrealized gains or losses occurring during the holding period of futures contracts are a component of net realized gain (loss) on futures contract transactions and change in net unrealized appreciation (depreciation) on futures contracts, respectively. One of the risks of entering into futures contracts is the possibility that the change in value of the contract may not correlate with the changes in value of the underlying securities. The fund's average exposure to interest rate risk derivative instruments held during the period was 54 contracts.
At period end, the fund did not have any derivative instruments disclosed on the Statement of Assets and Liabilities. For the year ended October 31, 2014, the effect of interest rate risk derivative instruments on the
Statement of Operations was $(352,122) in net realized gain (loss) on futures contract transactions and $88,954 in change in net unrealized appreciation (depreciation) on futures contracts.
8. Federal Tax Information
The tax character of distributions paid during the years ended October 31, 2014 and October 31, 2013 were as follows:
|
| | | | | | |
| | 2014 | 2013 |
| Distributions Paid From | | |
| Ordinary income | $ | 36,593,314 |
| $ | 12,230,900 |
|
| Long-term capital gains | $ | 33,600,395 |
| $ | 16,642,680 |
|
The book-basis character of distributions made during the year from net investment income or net realized gains may differ from their ultimate characterization for federal income tax purposes. These differences reflect the differing character of certain income items and net realized gains and losses for financial statement and tax purposes, and may result in reclassification among certain capital accounts on the financial statements.
As of October 31, 2014, the federal tax cost of investments and the components of distributable earnings on a tax-basis were as follows:
|
| | | |
| Federal tax cost of investments | $ | 757,667,863 |
|
| Gross tax appreciation of investments | $ | 119,879,346 |
|
| Gross tax depreciation of investments | (6,933,658 | ) |
| Net tax appreciation (depreciation) of investments | $ | 112,945,688 |
|
| Other book-to-tax adjustments | $ | (88,045 | ) |
| Undistributed ordinary income | $ | 17,643,734 |
|
| Accumulated long-term gains | $ | 44,916,420 |
|
The difference between book-basis and tax-basis unrealized appreciation (depreciation) is attributable primarily to the tax deferral of losses on wash sales. Other book-to-tax adjustments are attributable primarily to the tax deferral of losses on straddle positions.
|
| | | | | | | | | | | | | | | |
| For a Share Outstanding Throughout the Years Ended October 31 (except as noted) | | | | | | | |
| Per-Share Data | | | | | | | | | Ratios and Supplemental Data |
| | | Income From Investment Operations: | Distributions From: | | | Ratio to Average Net Assets of: | | |
| | Net Asset
Value,
Beginning
of Period | Net
Investment
Income
(Loss)(1) | Net
Realized
and
Unrealized
Gain (Loss) | Total From
Investment
Operations | Net
Investment
Income | Net
Realized
Gains | Total
Distributions | Net Asset
Value, End
of Period | Total
Return(2) | Operating
Expenses | Net
Investment
Income
(Loss) | Portfolio
Turnover
Rate | Net
Assets,
End of
Period
(in thousands) |
| Investor Class | | | | | | | | | | | | |
| 2014 | $19.19 | 0.25 | 1.66 | 1.91 | (0.28) | (1.44) | (1.72) | $19.38 | 10.76% | 0.90% | 1.36% | 64% |
| $815,636 |
|
| 2013 | $17.41 | 0.30 | 2.25 | 2.55 | (0.31) | (0.46) | (0.77) | $19.19 | 15.21% | 0.90% | 1.64% | 81% |
| $721,523 |
|
| 2012 | $15.96 | 0.29 | 1.47 | 1.76 | (0.31) | — | (0.31) | $17.41 | 11.12% | 0.90% | 1.75% | 82% |
| $609,476 |
|
| 2011 | $15.02 | 0.29 | 0.94 | 1.23 | (0.29) | — | (0.29) | $15.96 | 8.26% | 0.90% | 1.84% | 87% |
| $511,829 |
|
| 2010 | $13.58 | 0.27 | 1.44 | 1.71 | (0.27) | — | (0.27) | $15.02 | 12.70% | 0.91% | 1.85% | 69% |
| $487,066 |
|
| Institutional Class | | | | | | | | | | | | |
| 2014 | $19.20 | 0.29 | 1.65 | 1.94 | (0.31) | (1.44) | (1.75) | $19.39 | 10.98% | 0.70% | 1.56% | 64% |
| $49,009 |
|
| 2013 | $17.41 | 0.32 | 2.28 | 2.60 | (0.35) | (0.46) | (0.81) | $19.20 | 15.49% | 0.70% | 1.84% | 81% |
| $47,004 |
|
| 2012 | $15.96 | 0.32 | 1.47 | 1.79 | (0.34) | — | (0.34) | $17.41 | 11.34% | 0.70% | 1.95% | 82% |
| $19,667 |
|
| 2011 | $15.02 | 0.32 | 0.94 | 1.26 | (0.32) | — | (0.32) | $15.96 | 8.48% | 0.70% | 2.04% | 87% |
| $9,736 |
|
| 2010 | $13.59 | 0.29 | 1.44 | 1.73 | (0.30) | — | (0.30) | $15.02 | 12.84% | 0.71% | 2.05% | 69% |
| $6,538 |
|
|
| | | | |
| Notes to Financial Highlights | | |
| |
| (1) | Computed using average shares outstanding throughout the period. |
| |
| (2) | Total returns are calculated based on the net asset value of the last business day. Total returns for periods less than one year are not annualized. |
See Notes to Financial Statements.
|
|
| Report of Independent Registered Public Accounting Firm |
To the Board of Directors and Shareholders of
American Century Mutual Funds, Inc.:
We have audited the accompanying statement of assets and liabilities, including the schedule of investments, of Balanced Fund (the “Fund”), one of the funds constituting American Century Mutual Funds, Inc., as of October 31, 2014, and the related statement of operations for the year then ended, the statements of changes in net assets for each of the two years in the period then ended, and the financial highlights for each of the periods presented. These financial statements and financial highlights are the responsibility of the Fund's management. Our responsibility is to express an opinion on these financial statements and financial highlights based on our audits.
We conducted our audits in accordance with the standards of the Public Company Accounting Oversight Board (United States). Those standards require that we plan and perform the audit to obtain reasonable assurance about whether the financial statements and financial highlights are free of material misstatement. The Fund is not required to have, nor were we engaged to perform, an audit of its internal control over financial reporting. Our audits included consideration of internal control over financial reporting as a basis for designing audit procedures that are appropriate in the circumstances, but not for the purpose of expressing an opinion on the effectiveness of the Fund's internal control over financial reporting. Accordingly, we express no such opinion. An audit also includes examining, on a test basis, evidence supporting the amounts and disclosures in the financial statements, assessing the accounting principles used and significant estimates made by management, as well as evaluating the overall financial statement presentation. Our procedures included confirmation of securities owned as of October 31, 2014, by correspondence with the custodian and brokers; where replies were not received from brokers, we performed other auditing procedures. We believe that our audits provide a reasonable basis for our opinion.
In our opinion, the financial statements and financial highlights referred to above present fairly, in all material respects, the financial position of Balanced Fund of American Century Mutual Funds, Inc. as of October 31, 2014, the results of its operations for the year then ended, the changes in its net assets for each of the two years in the period then ended, and the financial highlights for each of the periods presented, in conformity with accounting principles generally accepted in the United States of America.
DELOITTE & TOUCHE LLP
Kansas City, Missouri
December 17, 2014
The Board of Directors
The individuals listed below serve as directors of the funds. Each director will continue to serve in this capacity until death, retirement, resignation or removal from office. The board has adopted a mandatory retirement age for directors who are not “interested persons,” as that term is defined in the Investment Company Act (independent directors). Independent directors shall retire by December 31 of the year in which they reach their 75th birthday.
Mr. Thomas is an “interested person” because he currently serves as President and Chief Executive Officer of American Century Companies, Inc. (ACC), the parent company of American Century Investment Management, Inc. (ACIM or the advisor). Mr. Fink is treated as an “interested person” because of his recent employment with ACC and American Century Services, LLC (ACS). The other directors (more than three-fourths of the total number) are independent. They are not employees, directors or officers of, and have no financial interest in, ACC or any of its wholly owned, direct or indirect, subsidiaries, including ACIM, American Century Investment Services, Inc. (ACIS) and ACS, and they do not have any other affiliations, positions, or relationships that would cause them to be considered “interested persons” under the Investment Company Act. The directors serve in this capacity for seven (in the case of Mr. Thomas, 15) registered investment companies in the American Century Investments family of funds.
The following table presents additional information about the directors. The mailing address for each director is 4500 Main Street, Kansas City, Missouri 64111.
|
| | | | | |
Name
(Year of Birth) | Position(s) Held with Funds | Length of Time Served | Principal Occupation(s) During Past 5 Years | Number of American Century Portfolios Overseen by Director | Other Directorships Held During Past
5 Years |
| Independent Directors | | | | |
Thomas A. Brown
(1940) | Director | Since 1980 | Managing Member, Associated Investments, LLC (real estate investment company); Brown Cascade Properties, LLC (real estate investment company) (2001 to 2009) | 73 | None |
Andrea C. Hall
(1945) | Director | Since 1997 | Retired | 73 | None |
Jan M. Lewis
(1957) | Director | Since 2011 | Retired; President and Chief Executive Officer, Catholic Charities of Northeast Kansas (human services organization) (2006 to 2013) | 73 | None |
James A. Olson
(1942) | Director and Chairman of the Board | Since 2007 (Chairman since 2014) | Member, Plaza Belmont LLC (private equity fund manager) | 73 | Saia, Inc. (2002 to 2012) and EPR Properties (2003 to 2013) |
|
| | | | | |
Name
(Year of Birth) | Position(s) Held with Funds | Length of Time Served | Principal Occupation(s) During Past 5 Years | Number of American Century Portfolios Overseen by Director | Other Directorships Held During Past
5 Years |
| Independent Directors | | | | |
M. Jeannine Strandjord
(1945) | Director | Since 1994 | Retired | 73 | Euronet Worldwide Inc.; Charming Shoppes, Inc. (2006 to 2010); and DST Systems Inc. (1996 to 2012) |
John R. Whitten
(1946) | Director | Since 2008 | Retired | 73 | Rudolph Technologies, Inc. |
Stephen E. Yates
(1948) | Director | Since 2012 | Retired; Executive Vice President, Technology & Operations, KeyCorp. (computer services) (2004 to 2010) | 73 | Applied Industrial Technologies, Inc. (2001 to 2010) |
| Interested Directors | | | | |
Barry Fink
(1955) | Director | Since 2012 | Retired; Executive Vice President, ACC (September 2007 to February 2013); President, ACS (October 2007 to February 2013); Chief Operating Officer, ACC (September 2007 to November 2012) | 73 | None |
Jonathan S. Thomas
(1963) | Director and President | Since 2007 | President and Chief Executive Officer, ACC (March 2007 to present). Also serves as Chief Executive Officer, ACS; Executive Vice President, ACIM; Director, ACC, ACIM and other ACC subsidiaries | 118 | BioMed Valley Discoveries, Inc. |
The Statement of Additional Information has additional information about the fund's directors and is available without charge, upon request, by calling 1-800-345-2021.
Officers
The following table presents certain information about the executive officers of the funds. Each officer serves as an officer for each of the 15 investment companies in the American Century family of funds, unless otherwise noted. No officer is compensated for his or her service as an officer of the funds. The listed officers are interested persons of the funds and are appointed or re-appointed on an annual basis. The mailing address for each officer listed below is 4500 Main Street, Kansas City, Missouri 64111.
|
| | |
Name (Year of Birth) | Offices with the Funds | Principal Occupation(s) During the Past Five Years |
Jonathan S.
Thomas
(1963) | Director and
President
since 2007 | President and Chief Executive Officer, ACC (March 2007 to present). Also serves as Chief Executive Officer, ACS; Executive Vice President, ACIM; Director, ACC, ACIM and other ACC subsidiaries |
Amy D. Shelton
(1964) | Chief Compliance
Officer since 2014 | Chief Compliance Officer, American Century funds, (March 2014 to present); Chief Compliance Officer, ACIM (February 2014 to present); Chief Compliance Officer, ACIS (October 2009 to present); Vice President, Client Interactions and Marketing, ACIS (February 2013 to January 2014); Director, Client Interactions and Marketing, ACIS (June 2007 to January 2013). Also serves as Vice President, ACIS |
Charles A.
Etherington
(1957) | General Counsel
since 2007 and
Senior Vice
President since 2006 | Attorney, ACC (February 1994 to present); Vice President, ACC (November 2005 to present); General Counsel, ACC (March 2007 to present). Also serves as General Counsel, ACIM, ACS, ACIS and other ACC subsidiaries; and Senior Vice President, ACIM and ACS |
C. Jean Wade
(1964) | Vice President,
Treasurer and
Chief Financial
Officer since 2012 | Vice President, ACS (February 2000 to present) |
Robert J.
Leach
(1966) | Vice President
since 2006 and
Assistant Treasurer
since 2012 | Vice President, ACS (February 2000 to present) |
David H.
Reinmiller
(1963) | Vice President
since 2000 | Attorney, ACC (January 1994 to present); Associate General Counsel, ACC (January 2001 to present). Also serves as Vice President, ACIM and ACS |
Ward D.
Stauffer
(1960) | Secretary
since 2005 | Attorney, ACC (June 2003 to present) |
|
|
| Approval of Management Agreement |
At a meeting held on June 18, 2014, the Fund’s Board of Directors unanimously approved the renewal of the management agreement pursuant to which American Century Investment Management, Inc. (the “Advisor”) acts as the investment advisor for the Fund. Under Section 15(c) of the Investment Company Act, contracts for investment advisory services are required to be reviewed, evaluated, and approved by a majority of a fund’s directors (the “Directors”), including a majority of the independent Directors, each year.
Prior to its consideration of the renewal of the management agreement, the Board requested and reviewed extensive data and information compiled by the Advisor and certain independent providers of evaluation data concerning the Fund and the services provided to the Fund by the Advisor. This review was in addition to the oversight and evaluation undertaken by the Board and its committees on a continuous basis and the information received was supplemental to the extensive information that the Board and its committees receive and consider throughout the year.
In connection with its consideration of the renewal of the management agreement, the Board’s review and evaluation of the services provided by the Advisor included, but was not limited to, the following:
| |
| • | the nature, extent, and quality of investment management, shareholder services, and other services provided by the Advisor to the Fund; |
| |
| • | the wide range of other programs and services the Advisor provides to the Fund and its shareholders on a routine and non-routine basis; |
| |
| • | the Fund’s investment performance compared to appropriate benchmarks and/or a peer group of other mutual funds with similar investment objectives and strategies; |
| |
| • | the cost of owning the Fund compared to the cost of owning similar funds; |
| |
| • | the Advisor’s compliance policies, procedures, and regulatory experience; |
| |
| • | financial data showing the cost of services provided to the Fund, the profitability of the Fund to the Advisor, and the overall profitability of the Advisor; |
| |
| • | possible economies of scale associated with the Advisor’s management of the Fund and other accounts under its management; |
| |
| • | the services provided and charges to other investment management clients of the Advisor; |
| |
| • | acquired fund fees and expenses; and |
| |
| • | any collateral benefits derived by the Advisor from the management of the Fund. |
In keeping with its practice, the Board held two in-person meetings and one telephonic meeting to review and discuss the information provided. The independent Directors also had the benefit of the advice of their independent counsel throughout the process.
Factors Considered
The Directors considered all of the information provided by the Advisor, the independent data providers, and independent counsel, and evaluated such information for the Fund. In connection with their review, the Directors did not identify any single factor as being all-important or controlling, and each Director may have attributed different levels of importance to different factors. In deciding to renew the management agreement, the Board based its decision on a number of factors, including the following:
Nature, Extent and Quality of Services — Generally. Under the management agreement, the Advisor is responsible for providing or arranging for all services necessary for the operation of the Fund. The Board noted that under the management agreement, the Advisor provides or arranges at its own expense a wide variety of services including:
| |
| • | constructing and designing the Fund |
| |
| • | portfolio research and security selection |
| |
| • | initial capitalization/funding |
| |
| • | daily valuation of the Fund’s portfolio |
| |
| • | shareholder servicing and transfer agency, including shareholder confirmations, recordkeeping, and communications |
| |
| • | legal services (except the independent Directors’ counsel) |
| |
| • | regulatory and portfolio compliance |
| |
| • | marketing and distribution (except Rule 12b-1 plans) |
The Board noted that many of these services have expanded over time both in terms of quantity and complexity in response to shareholder demands, competition in the industry, changing distribution channels, and the changing regulatory environment.
Investment Management Services. The nature of the investment management services provided to the Fund is quite complex and allows Fund shareholders access to professional money management, instant diversification of their investments within an asset class, the opportunity to easily diversify among asset classes by investing in or exchanging among various American Century Investments funds, and liquidity. In evaluating investment performance, the Board expects the Advisor to manage the Fund in accordance with its investment objectives and approved strategies. Further, the Directors recognize that the Advisor has an obligation to monitor trading activities, and in particular to seek the best execution of fund trades, and to evaluate the use of and payment for research. In providing these services, the Advisor utilizes teams of investment professionals (portfolio managers, analysts, research assistants, and securities traders) who require extensive information technology, research, training, compliance and other systems to conduct their business. The Board, directly and through its Fund Performance Review Committee, regularly reviews investment performance information for the Fund, together with comparative information for appropriate benchmarks and/or peer groups of similarly-managed funds, over different time horizons. The Directors also review detailed performance information during the management agreement approval process. If performance concerns are identified, the Fund receives special reviews until performance improves, during which the Board discusses with the Advisor the reasons for such results (e.g., market conditions, security selection) and any efforts being undertaken to improve performance. The Fund’s performance was above its benchmark for the one-, three-, five-, and ten-year periods reviewed by the Board. The Board found the investment management services provided by the Advisor to the Fund to be satisfactory and consistent with the management agreement.
Shareholder and Other Services. Under the management agreement, the Advisor provides the Fund with a comprehensive package of transfer agency, shareholder, and other services. The Board, directly and through various committees of the Board, regularly reviews reports and evaluations of such services at its regular meetings. These reports include, but are not limited to, information regarding the operational efficiency and accuracy of the shareholder and transfer agency services provided, staffing levels, shareholder satisfaction (as measured by external as well as internal sources), technology support, new products and services offered to Fund shareholders, securities trading activities, portfolio valuation services, auditing services, and legal and operational compliance activities. Certain aspects of shareholder and transfer agency service level efficiency and the quality of securities trading activities are measured by independent third party providers and are presented in comparison to other fund groups not managed by the Advisor. The Board
found the services provided by the Advisor to the Fund under the management agreement to be competitive and of high quality.
Costs of Services and Profitability. The Advisor provides detailed information concerning its cost of providing various services to the Fund, its profitability in managing the Fund (pre- and post-distribution), its overall profitability, and its financial condition. The Directors have reviewed with the Advisor the methodology used to prepare this financial information. The financial information regarding the Advisor is considered in evaluating the Advisor’s financial condition, its ability to continue to provide services under the management agreement, and the reasonableness of the current management fee. The Board concluded that the Advisor’s profits were reasonable in light of the services provided to the Fund.
Ethics. The Board generally considers the Advisor’s commitment to providing quality services to shareholders and to conducting its business ethically. They noted that the Advisor’s practices generally meet or exceed industry best practices.
Economies of Scale. The Board also reviewed information provided by the Advisor regarding the possible existence of economies of scale in connection with the management of the Fund. The Board concluded that economies of scale are difficult to measure and predict with precision, especially on a fund-by-fund basis. The Board concluded that the Advisor is appropriately sharing economies of scale through its competitive fee structure, offering competitive fees from fund inception, and through reinvestment in its business to provide shareholders additional content and services.
Comparison to Other Funds’ Fees. The management agreement provides that the Fund pays the Advisor a single, all-inclusive (or unified) management fee for providing all services necessary for the management and operation of the Fund, other than brokerage expenses, taxes, interest, extraordinary expenses, and the fees and expenses of the Fund’s independent directors (including their independent legal counsel) and expenses incurred in connection with the provision of shareholder services and distribution services under a plan adopted pursuant to Rule 12b-1 under the 1940 Act. Under the unified fee structure, the Advisor is responsible for providing all investment advisory, custody, audit, administrative, compliance, recordkeeping, marketing and shareholder services, or arranging and supervising third parties to provide such services. By contrast, most other funds are charged a variety of fees, including an investment advisory fee, a transfer agency fee, an administrative fee, distribution charges and other expenses. Other than their investment advisory fees and any applicable Rule 12b-1 distribution fees, all other components of the total fees charged by these other funds may be increased without shareholder approval. The Board believes the unified fee structure is a benefit to Fund shareholders because it clearly discloses to shareholders the cost of owning Fund shares, and, since the unified fee cannot be increased without a vote of Fund shareholders, it shifts to the Advisor the risk of increased costs of operating the Fund and provides a direct incentive to minimize administrative inefficiencies. Part of the Board’s analysis of fee levels involves reviewing certain evaluative data compiled by an independent provider comparing the Fund’s unified fee to the total expense ratios of its peers. The unified fee charged to shareholders of the Fund was below the median of the total expense ratios of the Fund’s peer expense universe and was within the range of its peer expense group. The Board concluded that the management fee paid by the Fund to the Advisor under the management agreement is reasonable in light of the services provided to the Fund.
Comparison to Fees and Services Provided to Other Clients of the Advisor. The Board also requested and received information from the Advisor concerning the nature of the services, fees, costs and profitability of its advisory services to advisory clients other than the Fund. They observed that these varying types of client accounts require different services and involve different regulatory and entrepreneurial risks than the management of the Fund. The Board analyzed this information and concluded that the fees charged and services provided to the Fund were reasonable by comparison.
Collateral or “Fall-Out” Benefits Derived by the Advisor. The Board considered the existence of collateral benefits the Advisor may receive as a result of its relationship with the Fund. They concluded that the Advisor’s primary business is managing mutual funds and it generally does not use fund or shareholder information to generate profits in other lines of business, and therefore does not derive any significant collateral benefits from them. The Board noted that the Advisor receives proprietary research from broker-dealers that execute fund portfolio transactions and concluded that this research is likely to benefit Fund shareholders. The Board also determined that the Advisor is able to provide investment management services to certain clients other than the Fund, at least in part, due to its existing infrastructure built to serve the fund complex. The Board concluded, however, that the assets of those other clients are not material to the analysis and, where applicable, may be included with the assets of the Fund to determine breakpoints in the management fee schedule.
Existing Relationship. The Board also considered whether there was any reason for not continuing the existing arrangement with the Advisor. In this regard, the Board was mindful of the potential disruptions of the Fund’s operations and various risks, uncertainties, and other effects that could occur as a result of a decision not to continue such relationship. In particular, the Board recognized that most shareholders have invested in the Fund on the strength of the Advisor’s industry standing and reputation and in the expectation that the Advisor will have a continuing role in providing advisory services to the Fund.
Conclusion of the Directors. As a result of this process, the Board, including all of the independent Directors, taking into account all of the factors discussed above and the information provided by the Advisor and others, concluded that the management agreement between the Fund and the Advisor is fair and reasonable in light of the services provided and should be renewed.
Retirement Account Information
As required by law, distributions you receive from certain IRAs are subject to federal income tax withholding, unless you elect not to have withholding apply. Tax will be withheld on the total amount withdrawn even though you may be receiving amounts that are not subject to withholding, such as nondeductible contributions. In such case, excess amounts of withholding could occur. You may adjust your withholding election so that a greater or lesser amount will be withheld.
If you don’t want us to withhold on this amount, you must notify us to not withhold the federal income tax. You may notify us in writing or in certain situations by telephone or through other electronic means. For systematic withdrawals, your withholding election will remain in effect until revoked or changed by filing a new election. You have the right to revoke your election at any time.
Remember, even if you elect not to have income tax withheld, you are liable for paying income tax on the taxable portion of your withdrawal. If you elect not to have income tax withheld or you don’t have enough income tax withheld, you may be responsible for payment of estimated tax. You may incur penalties under the estimated tax rules if your withholding and estimated tax payments are not sufficient. You can reduce or defer the income tax on a distribution by directly or indirectly rolling such distribution over to another IRA or eligible plan. You should consult your tax advisor for additional information.
State tax will be withheld if, at the time of your distribution, your address is within one of the mandatory withholding states and you have federal income tax withheld (or as otherwise required by state law). State taxes will be withheld from your distribution in accordance with the respective state rules.
Distributions you receive from 403(b), 457 and qualified plans are subject to special tax and withholding rules. Your plan administrator or plan sponsor is required to provide you with a special tax notice explaining those rules at the time you request a distribution. If applicable, federal and/or state taxes may be withheld from your distribution amount.
Proxy Voting Policies
A description of the policies that the fund's investment advisor uses in exercising the voting rights associated with the securities purchased and/or held by the fund is available without charge, upon request, by calling 1-800-345-2021. It is also available on the "About Us" page of American Century Investments’ website at americancentury.com and on the Securities and Exchange Commission’s website at sec.gov. Information regarding how the investment advisor voted proxies relating to portfolio securities during the most recent 12-month period ended June 30 is available on the "About Us" page at americancentury.com. It is also available at sec.gov.
Quarterly Portfolio Disclosure
The fund files its complete schedule of portfolio holdings with the Securities and Exchange Commission (SEC) for the first and third quarters of each fiscal year on Form N-Q. The fund’s Forms N-Q are available on the SEC’s website at sec.gov, and may be reviewed and copied at the SEC’s Public Reference Room in Washington, DC. Information on the operation of the Public Reference Room may be obtained by calling 1-800-SEC-0330. The fund also makes its complete schedule of portfolio holdings for the most recent quarter of its fiscal year available on its
website at americancentury.com and, upon request, by calling 1-800-345-2021.
Other Tax Information
The following information is provided pursuant to provisions of the Internal Revenue Code.
The fund hereby designates up to the maximum amount allowable as qualified dividend income for the fiscal year ended October 31, 2014.
For corporate taxpayers, the fund hereby designates $9,401,148, or up to the maximum amount allowable, of ordinary income distributions paid during the fiscal year ended October 31, 2014 as qualified for the corporate dividends received deduction.
The fund hereby designates $24,414,036 as qualified short-term capital gain distributions for purposes of Internal Revenue Code Section 871 for the fiscal year ended October 31, 2014.
The fund hereby designates $33,600,395, or up to the maximum amount allowable, as long-term capital gain distributions for the fiscal year ended October 31, 2014.
|
| | |
| |
| | | |
| Contact Us | americancentury.com | |
| Automated Information Line | 1-800-345-8765 | |
| Investor Services Representative | 1-800-345-2021 or 816-531-5575 | |
| Investors Using Advisors | 1-800-378-9878 | |
| Business, Not-For-Profit, Employer-Sponsored Retirement Plans | 1-800-345-3533 | |
| Banks and Trust Companies, Broker-Dealers, Financial Professionals, Insurance Companies | 1-800-345-6488 | |
| Telecommunications Relay Service for the Deaf | 711 | |
| | | |
| American Century Mutual Funds, Inc. | |
| | | |
Investment Advisor: American Century Investment Management, Inc. Kansas City, Missouri | |
| | | |
| This report and the statements it contains are submitted for the general information of our shareholders. The report is not authorized for distribution to prospective investors unless preceded or accompanied by an effective prospectus. | |
| | | |
©2014 American Century Proprietary Holdings, Inc. All rights reserved.
CL-ANN-83996 1412 | |
|
| |
| ANNUAL REPORT | OCTOBER 31, 2014 |
Capital Value Fund
|
| |
| President’s Letter | |
| Performance | |
| Portfolio Commentary | |
| Fund Characteristics | |
| Shareholder Fee Example | |
| Schedule of Investments | |
| Statement of Assets and Liabilities | |
| Statement of Operations | |
| Statement of Changes in Net Assets | |
| Notes to Financial Statements | |
| Financial Highlights | |
| Report of Independent Registered Public Accounting Firm | |
| Management | |
| Approval of Management Agreement | |
| Additional Information | |
Any opinions expressed in this report reflect those of the author as of the date of the report, and do not necessarily represent the opinions of American Century Investments® or any other person in the American Century Investments organization. Any such opinions are subject to change at any time based upon market or other conditions and American Century Investments disclaims any responsibility to update such opinions. These opinions may not be relied upon as investment advice and, because investment decisions made by American Century Investments funds are based on numerous factors, may not be relied upon as an indication of trading intent on behalf of any American Century Investments fund. Security examples are used for representational purposes only and are not intended as recommendations to purchase or sell securities. Performance information for comparative indices and securities is provided to American Century Investments by third party vendors. To the best of American Century Investments’ knowledge, such information is accurate at the time of printing.
|
| |
| Dear Investor:
Thank you for reviewing this annual report for the 12 months ended October 31, 2014. It provides investment performance and portfolio information for the reporting period, plus longer-term historical performance data.
Annual reports remain important vehicles for conveying information about fund returns, including market and economic factors that affected performance during the reporting period. For additional, updated investment and market insights, we encourage you to visit our website, americancentury.com. |
| Jonathan Thomas |
Favorable Fiscal Year for U.S. Stocks and Bonds
Mostly stimulative monetary policies by central banks and expectations of longer-term economic improvement, interspersed with concerns about nearer-term weaker-than-expected global economic data and geopolitical conflicts, helped drive financial market returns during the reporting period. We believe the combination of longer-term optimism about U.S. economic growth, low costs of capital, and continued central bank stimulus (even as the U.S. Federal Reserve’s latest monthly bond purchase program ended) helped persuade investors to seek risk and yield, which benefited U.S. stocks and bonds. The S&P 500 Index gained 17.27% during the 12 months. The 30-year U.S. Treasury bond was close behind, returning 15.44%, according to Barclays. U.S. real estate investment trusts (REITs), whose shares combine performance attributes of stocks and bonds, benefited from both—the MSCI U.S. REIT Index advanced 19.19%.
U.S. market benchmark returns generally outpaced their non-U.S. counterparts. The U.S. was perceived by investors as a relative bastion of growth, stability, and potentially attractive yields compared with most of the rest of the world, so capital flows generally favored U.S. assets. These capital flows, along with weaker-than-expected global growth, lower-than-expected global inflation, and falling commodity and energy prices, helped keep long-term interest rates and other corporate costs low. U.S. stocks just completed a solid third-quarter earnings reporting season, though questions remain about next year’s revenues, given this year’s slowdown in global economic growth and concerns about how far it could extend into 2015.
We believe continuing global economic and geopolitical uncertainties could continue to support the relative appeal of U.S. assets in coming months. But the end of the U.S. Federal Reserve’s monthly bond-buying program and the still-looming possibility of higher interest rates in 2015 point to potential U.S. market volatility ahead. In this environment, we continue to believe in a disciplined, diversified, long-term investment approach, using professionally managed stock and bond portfolios for meeting financial goals. We appreciate your continued trust in us.
Sincerely,
Jonathan Thomas
President and Chief Executive Officer
American Century Investments
|
| | | | | | |
| Total Returns as of October 31, 2014 |
| | | | Average Annual Returns | |
| | Ticker Symbol | 1 year | 5 years | 10 years | Since Inception | Inception Date |
| Investor Class | ACTIX | 15.68%(1) | 14.69%(1) | 6.48%(1) | 6.39%(1) | 3/31/99 |
| Russell 1000 Value Index | — | 16.46% | 16.48% | 7.90% | 6.53% | — |
| Institutional Class | ACPIX | 15.86%(1) | 14.95%(1) | 6.70%(1) | 6.48%(1) | 3/1/02 |
A Class(2) | ACCVX | | | | | 5/14/03 |
| No sales charge* | | 15.32%(1) | 14.44%(1) | 6.21%(1) | 7.70%(1) | |
| With sales charge* | | 8.66%(1) | 13.10%(1) | 5.59%(1) | 7.14%(1) | |
* Sales charges include initial sales charges and contingent deferred sales charges (CDSCs), as applicable. A Class shares have a 5.75% maximum initial sales charge and may be subject to a maximum CDSC of 1.00%. The SEC requires that mutual funds provide performance information net of maximum sales charges in all cases where charges could be applied.
| |
| (1) | Returns would have been lower if a portion of the management fee had not been waived. |
| |
| (2) | Prior to March 1, 2010, the A Class was referred to as the Advisor Class and did not have a front-end sales charge. Performance has been adjusted to reflect this charge. |
Data presented reflect past performance. Past performance is no guarantee of future results. Current performance may be higher or lower than the performance shown. Investment return and principal value will fluctuate, and redemption value may be more or less than original cost. Data assumes reinvestment of dividends and capital gains, and none of the charts reflect the deduction of taxes that a shareholder would pay on fund distributions or the redemption of fund shares. To obtain performance data current to the most recent month end, please call 1-800-345-2021 or visit americancentury.com. For additional information about the fund, please consult the prospectus.
|
|
| Growth of $10,000 Over 10 Years |
| $10,000 investment made October 31, 2004 |
| Performance for other share classes will vary due to differences in fee structure. |
|
| |
| Value on October 31, 2014 |
| | Investor Class — $18,746* |
| |
| | Russell 1000 Value Index — $21,391 |
| |
*Ending value would have been lower if a portion of the management fee had not been waived.
|
| | |
| Total Annual Fund Operating Expenses |
| Investor Class | Institutional Class | A Class |
| 1.10% | 0.90% | 1.35% |
The total annual fund operating expenses shown is as stated in the fund’s prospectus current as of the date of this report. The prospectus may vary from the expense ratio shown elsewhere in this report because it is based on a different time period, includes acquired fund fees and expenses, and, if applicable, does not include fee waivers or expense reimbursements.
Data presented reflect past performance. Past performance is no guarantee of future results. Current performance may be higher or lower than the performance shown. Investment return and principal value will fluctuate, and redemption value may be more or less than original cost. Data assumes reinvestment of dividends and capital gains, and none of the charts reflect the deduction of taxes that a shareholder would pay on fund distributions or the redemption of fund shares. To obtain performance data current to the most recent month end, please call 1-800-345-2021 or visit americancentury.com. For additional information about the fund, please consult the prospectus.
Portfolio Managers: Brendan Healy and Matt Titus
Performance Summary
Capital Value returned 15.68%* for the 12 months ended October 31, 2014. By comparison, its benchmark, the Russell 1000 Value Index, returned 16.46%. The fund’s return reflects operating expenses, while the index’s returns do not.
The U.S. equity market posted strong gains during the reporting period, as corporate profit margins remain near all-time highs and revenue growth is steady. Despite the Federal Reserve (Fed) ending its asset purchasing program in October, monetary policy in the U.S. remains very accommodative. The Fed continued its stance that the decision to raise short term rates will be dependent upon both unemployment and inflation data. As labor market conditions have improved, particularly in wage growth, the Fed’s unemployment threshold has been met, but inflation remains below its 2% target. In early 2014, U.S. stocks were somewhat volatile, but still posted gains. A decline in the 10-year U.S. Treasury yield spurred a rally among yield-oriented securities and value stocks outperformed growth stocks for the first quarter. In the second quarter, U.S. stocks posted solid gains as growth continued in the U.S., albeit slowly, inflation ticked up slightly, and employment improved. U.S. stocks were relatively flat for the third quarter, as the Fed continued tapering asset purchases but kept monetary policy stimulative. The quarter was marked by increased geopolitical tensions, but U.S. economic news was mostly positive, offsetting concerns. Reports indicated strong economic growth in the U.S. over the second quarter, and consumer spending was up in August. In this environment, mid-cap stocks outperformed large-cap stocks.
Capital Value underperformed its benchmark. Positions in the information technology, energy, and utilities sectors detracted from relative performance. The portfolio benefited from investments in the industrials, consumer discretionary, consumer staples, and financials sectors.
Information Technology Detracted Overall
Though an overweight position relative to the benchmark in information technology—the strongest-performing sector in the benchmark—added to relative returns, the portfolio was hampered overall by security selection. In the semiconductors and semiconductor equipment industry, eliminating a position in Intel detracted from relative returns as investor anticipation of increased demand in the PC market drove performance for the stock. While PC sales have stabilized, improving results for the company, the team finds its valuation unattractive.
While overall security selection in the group detracted, the sector was also the source of the portfolio’s top contributor, interactive entertainment software company Electronic Arts. The company has managed the transition to new gaming consoles better than its peers.
Energy Slowed Performance
In the energy sector, stock selection and an overweight to the group detracted from relative returns. Falling oil and gas prices have had a broad dampening effect on the sector. The portfolio’s position in oil and gas exploration and production company Oasis Petroleum was a top detractor for the period. The portfolio’s overweight positions in integrated energy name Chevron and exploration and production firm Occidental Petroleum were also among top ten detractors for the period.
| |
| * | All fund returns referenced in this commentary are for Investor Class shares. Returns would have been lower if a portion of the management fee had not been waived. Performance for other share classes will vary due to differences in fee structure; when Investor Class performance exceeds that of the fund’s benchmark, other share classes may not. See page 3 for returns for all share classes. |
Utilities Dampened Results
The portfolio’s underweight to the utilities sector weighed on relative results. The team has maintained the underweight in the sector as it finds utilities susceptible to rising rates and generally overvalued in current conditions.
Industrials Contributed Positively
Stock selection in the industrials sector added significantly to relative performance. An overweight position in General Dynamics was a top contributor. The company’s stock surged in October as it announced higher than anticipated earnings and revenue, along with a backlog in orders for its ships, tanks, and business jets. Southwest Airlines stock gained steadily throughout the period with industry-leading profitability and customer satisfaction amid industry consolidation.
Consumer Discretionary Names Added Value
The portfolio benefited from selection among consumer discretionary stocks, particularly in the hotels, restaurants, and leisure industry. In the specialty retail industry, stock selection and an overweight to the segment were also helpful. Lowe’s reported strong results late in the period, despite concerns about a stall in the housing market recovery. The company showed improved margins, and the team believes the stock is still at a reasonable valuation.
Consumer Staples Boosted Results
In the consumer staples sector, stock selection added value to relative results, especially among food and staples retailing companies, where CVS Health was a top ten contributor. The company has seen growth in revenues and earnings per share and has a solid balance sheet.
Outlook
We continue to be bottom-up investment managers, evaluating each company individually and building our portfolio one stock at a time. As of October 31, 2014, Capital Value is broadly diversified, with ongoing overweight positions in the consumer discretionary, financials, and industrials sectors. Our valuation work is also directing us toward smaller relative weightings in utilities and consumer staples.
|
| |
| OCTOBER 31, 2014 | |
| Top Ten Holdings | % of net assets |
| JPMorgan Chase & Co. | 3.9% |
| Chevron Corp. | 3.8% |
| Johnson & Johnson | 3.5% |
| Wells Fargo & Co. | 3.2% |
| Exxon Mobil Corp. | 3.0% |
| Merck & Co., Inc. | 2.2% |
| Medtronic, Inc. | 2.0% |
| U.S. Bancorp | 1.9% |
| Microsoft Corp. | 1.8% |
| CVS Health Corp. | 1.7% |
| | |
| Top Five Industries | % of net assets |
| Banks | 13.9% |
| Oil, Gas and Consumable Fuels | 10.5% |
| Pharmaceuticals | 7.3% |
| Insurance | 6.7% |
| Capital Markets | 6.0% |
| | |
| Types of Investments in Portfolio | % of net assets |
| Common Stocks | 99.7% |
| Temporary Cash Investments | 0.4% |
| Other Assets and Liabilities | (0.1)% |
Fund shareholders may incur two types of costs: (1) transaction costs, including sales charges (loads) on purchase payments and redemption/exchange fees; and (2) ongoing costs, including management fees; distribution and service (12b-1) fees; and other fund expenses. This example is intended to help you understand your ongoing costs (in dollars) of investing in your fund and to compare these costs with the ongoing cost of investing in other mutual funds.
The example is based on an investment of $1,000 made at the beginning of the period and held for the entire period from May 1, 2014 to October 31, 2014.
Actual Expenses
The table provides information about actual account values and actual expenses for each class. You may use the information, together with the amount you invested, to estimate the expenses that you paid over the period. First, identify the share class you own. Then simply divide your account value by $1,000 (for example, an $8,600 account value divided by $1,000 = 8.6), then multiply the result by the number under the heading “Expenses Paid During Period” to estimate the expenses you paid on your account during this period.
If you hold Investor Class shares of any American Century Investments fund, or Institutional Class shares of the American Century Diversified Bond Fund, in an American Century Investments account (i.e., not a financial intermediary or retirement plan account), American Century Investments may charge you a $12.50 semiannual account maintenance fee if the value of those shares is less than $10,000. We will redeem shares automatically in one of your accounts to pay the $12.50 fee. In determining your total eligible investment amount, we will include your investments in all personal accounts (including American Century Investments Brokerage accounts) registered under your Social Security number. Personal accounts include individual accounts, joint accounts, UGMA/UTMA accounts, personal trusts, Coverdell Education Savings Accounts and IRAs (including traditional, Roth, Rollover, SEP-, SARSEP- and SIMPLE-IRAs), and certain other retirement accounts. If you have only business, business retirement, employer-sponsored or American Century Investments Brokerage accounts, you are currently not subject to this fee. If you are subject to the Account Maintenance Fee, your account value could be reduced by the fee amount.
Hypothetical Example for Comparison Purposes
The table also provides information about hypothetical account values and hypothetical expenses based on the actual expense ratio of each class of your fund and an assumed rate of return of 5% per year before expenses, which is not the actual return of a fund’s share class. The hypothetical account values and expenses may not be used to estimate the actual ending account balance or expenses you paid for the period. You may use this information to compare the ongoing costs of investing in your fund and other funds. To do so, compare this 5% hypothetical example with the 5% hypothetical examples that appear in the shareholder reports of the other funds.
Please note that the expenses shown in the table are meant to highlight your ongoing costs only and do not reflect any transactional costs, such as sales charges (loads) or redemption/exchange fees. Therefore, the table is useful in comparing ongoing costs only, and will not help you determine the relative total costs of owning different funds. In addition, if these transactional costs were included, your costs would have been higher.
|
| | | | |
| Beginning
Account Value
5/1/14 | Ending
Account Value
10/31/14 | Expenses Paid
During Period(1)5/1/14 - 10/31/14 | Annualized
Expense Ratio(1) |
| Actual | | | | |
| Investor Class (after waiver) | $1,000 | $1,065.90 | $5.21 | 1.00% |
| Investor Class (before waiver) | $1,000 | $1,065.90(2) | $5.73 | 1.10% |
| Institutional Class (after waiver) | $1,000 | $1,066.80 | $4.17 | 0.80% |
| Institutional Class (before waiver) | $1,000 | $1,066.80(2) | $4.69 | 0.90% |
| A Class (after waiver) | $1,000 | $1,063.80 | $6.50 | 1.25% |
| A Class (before waiver) | $1,000 | $1,063.80(2) | $7.02 | 1.35% |
| Hypothetical | | | | |
| Investor Class (after waiver) | $1,000 | $1,020.16 | $5.09 | 1.00% |
| Investor Class (before waiver) | $1,000 | $1,019.66 | $5.60 | 1.10% |
| Institutional Class (after waiver) | $1,000 | $1,021.17 | $4.08 | 0.80% |
| Institutional Class (before waiver) | $1,000 | $1,020.67 | $4.58 | 0.90% |
| A Class (after waiver) | $1,000 | $1,018.90 | $6.36 | 1.25% |
| A Class (before waiver) | $1,000 | $1,018.40 | $6.87 | 1.35% |
| |
| (1) | Expenses are equal to the class's annualized expense ratio listed in the table above, multiplied by the average account value over the period, multiplied by 184, the number of days in the most recent fiscal half-year, divided by 365, to reflect the one-half year period. |
| |
| (2) | Ending account value assumes the return earned after waiver and would have been lower if a portion of the management fee had not been waived. |
OCTOBER 31, 2014
|
| | | | |
| | Shares | Value |
| COMMON STOCKS — 99.7% | | |
| Aerospace and Defense — 5.2% | | |
| General Dynamics Corp. | 10,140 | $ | 1,417,166 |
|
| Honeywell International, Inc. | 15,920 | 1,530,231 |
|
| Huntington Ingalls Industries, Inc. | 4,080 | 431,746 |
|
| Raytheon Co. | 11,830 | 1,228,900 |
|
| Textron, Inc. | 27,210 | 1,130,031 |
|
| United Technologies Corp. | 23,570 | 2,521,990 |
|
| | | 8,260,064 |
|
| Airlines — 0.5% | | |
| Southwest Airlines Co. | 22,330 | 769,938 |
|
| Auto Components — 0.4% | | |
| Delphi Automotive plc | 9,980 | 688,420 |
|
| Automobiles — 1.2% | | |
| Ford Motor Co. | 135,370 | 1,907,363 |
|
| Banks — 13.9% | | |
| Bank of America Corp. | 81,600 | 1,400,256 |
|
| Citigroup, Inc. | 47,300 | 2,531,969 |
|
| Fifth Third Bancorp | 27,130 | 542,329 |
|
| JPMorgan Chase & Co. | 102,810 | 6,217,949 |
|
| KeyCorp | 59,710 | 788,172 |
|
| PNC Financial Services Group, Inc. (The) | 29,580 | 2,555,416 |
|
| U.S. Bancorp | 69,640 | 2,966,664 |
|
| Wells Fargo & Co. | 95,860 | 5,089,207 |
|
| | | 22,091,962 |
|
| Beverages — 0.7% | | |
| PepsiCo, Inc. | 11,710 | 1,126,151 |
|
| Biotechnology — 1.3% | | |
| Amgen, Inc. | 6,870 | 1,114,177 |
|
Gilead Sciences, Inc.(1) | 8,650 | 968,800 |
|
| | | 2,082,977 |
|
| Building Products — 0.5% | | |
| Masco Corp. | 35,950 | 793,417 |
|
| Capital Markets — 6.0% | | |
| Ameriprise Financial, Inc. | 14,760 | 1,862,269 |
|
| Bank of New York Mellon Corp. (The) | 12,220 | 473,158 |
|
| BlackRock, Inc. | 4,250 | 1,449,718 |
|
| Goldman Sachs Group, Inc. (The) | 11,790 | 2,239,982 |
|
| Invesco Ltd. | 30,890 | 1,250,118 |
|
| Morgan Stanley | 25,870 | 904,157 |
|
| State Street Corp. | 17,230 | 1,300,176 |
|
| | | 9,479,578 |
|
|
| | | | |
| | Shares | Value |
| Chemicals — 1.5% | | |
| Dow Chemical Co. (The) | 23,530 | $ | 1,162,382 |
|
| LyondellBasell Industries NV, Class A | 12,390 | 1,135,296 |
|
| | | 2,297,678 |
|
| Commercial Services and Supplies — 0.3% | | |
| Tyco International Ltd. | 10,040 | 431,017 |
|
| Communications Equipment — 1.8% | | |
| Cisco Systems, Inc. | 56,350 | 1,378,885 |
|
| QUALCOMM, Inc. | 19,620 | 1,540,366 |
|
| | | 2,919,251 |
|
| Consumer Finance — 1.4% | | |
| Capital One Financial Corp. | 21,680 | 1,794,454 |
|
Synchrony Financial(1) | 16,820 | 454,476 |
|
| | | 2,248,930 |
|
| Diversified Financial Services — 1.5% | | |
Berkshire Hathaway, Inc., Class B(1) | 17,100 | 2,396,736 |
|
| Diversified Telecommunication Services — 1.2% | | |
| AT&T, Inc. | 34,570 | 1,204,419 |
|
| CenturyLink, Inc. | 4,810 | 199,519 |
|
| Verizon Communications, Inc. | 9,520 | 478,380 |
|
| | | 1,882,318 |
|
| Electric Utilities — 2.7% | | |
| American Electric Power Co., Inc. | 11,390 | 664,492 |
|
| PPL Corp. | 37,000 | 1,294,630 |
|
| Westar Energy, Inc. | 29,370 | 1,110,480 |
|
| Xcel Energy, Inc. | 37,040 | 1,239,729 |
|
| | | 4,309,331 |
|
| Electrical Equipment — 0.8% | | |
| Eaton Corp. plc | 19,210 | 1,313,772 |
|
| Energy Equipment and Services — 2.8% | | |
| Halliburton Co. | 25,290 | 1,394,491 |
|
| National Oilwell Varco, Inc. | 20,830 | 1,513,091 |
|
| Schlumberger Ltd. | 15,870 | 1,565,734 |
|
| | | 4,473,316 |
|
| Food and Staples Retailing — 2.4% | | |
| CVS Health Corp. | 32,350 | 2,775,953 |
|
| Kroger Co. (The) | 18,900 | 1,052,919 |
|
| | | 3,828,872 |
|
| Health Care Equipment and Supplies — 3.6% | | |
| Abbott Laboratories | 55,730 | 2,429,271 |
|
| Medtronic, Inc. | 47,240 | 3,219,878 |
|
| | | 5,649,149 |
|
| Health Care Providers and Services — 2.1% | | |
| Aetna, Inc. | 23,150 | 1,910,106 |
|
| WellPoint, Inc. | 11,530 | 1,460,736 |
|
| | | 3,370,842 |
|
| Hotels, Restaurants and Leisure — 0.5% | | |
| Marriott International, Inc., Class A | 9,730 | 737,048 |
|
|
| | | | |
| | Shares | Value |
| Household Durables — 0.7% | | |
| Whirlpool Corp. | 6,250 | $ | 1,075,313 |
|
| Household Products — 1.4% | | |
| Procter & Gamble Co. (The) | 24,830 | 2,166,914 |
|
| Industrial Conglomerates — 1.4% | | |
| General Electric Co. | 88,420 | 2,282,120 |
|
| Insurance — 6.7% | | |
| Allstate Corp. (The) | 32,250 | 2,091,412 |
|
| American International Group, Inc. | 29,880 | 1,600,672 |
|
| Chubb Corp. (The) | 4,840 | 480,902 |
|
| MetLife, Inc. | 38,930 | 2,111,563 |
|
| Principal Financial Group, Inc. | 14,400 | 754,128 |
|
| Prudential Financial, Inc. | 21,570 | 1,909,808 |
|
| Travelers Cos., Inc. (The) | 16,590 | 1,672,272 |
|
| | | 10,620,757 |
|
| IT Services — 0.3% | | |
| Sabre Corp. | 30,390 | 522,708 |
|
| Machinery — 2.1% | | |
| Ingersoll-Rand plc | 29,860 | 1,869,833 |
|
| PACCAR, Inc. | 9,630 | 629,032 |
|
| Stanley Black & Decker, Inc. | 8,830 | 826,841 |
|
| | | 3,325,706 |
|
| Media — 3.4% | | |
| CBS Corp., Class B | 5,340 | 289,535 |
|
| Comcast Corp., Class A | 33,560 | 1,857,546 |
|
| Time Warner Cable, Inc. | 6,180 | 909,758 |
|
| Time Warner, Inc. | 28,830 | 2,291,120 |
|
| | | 5,347,959 |
|
| Metals and Mining — 0.2% | | |
| Freeport-McMoRan, Inc. | 10,260 | 292,410 |
|
| Multiline Retail — 1.8% | | |
| Macy's, Inc. | 34,240 | 1,979,757 |
|
| Target Corp. | 15,190 | 939,046 |
|
| | | 2,918,803 |
|
| Oil, Gas and Consumable Fuels — 10.5% | | |
| Chevron Corp. | 50,420 | 6,047,879 |
|
| Exxon Mobil Corp. | 49,380 | 4,775,540 |
|
| Imperial Oil Ltd. | 30,120 | 1,449,277 |
|
Oasis Petroleum, Inc.(1) | 19,370 | 580,325 |
|
| Occidental Petroleum Corp. | 26,380 | 2,345,973 |
|
| Total SA ADR | 25,620 | 1,534,382 |
|
| | | 16,733,376 |
|
| Paper and Forest Products — 0.9% | | |
| International Paper Co. | 27,060 | 1,369,777 |
|
| Pharmaceuticals — 7.3% | | |
Catalent, Inc.(1) | 23,701 | 616,937 |
|
| Johnson & Johnson | 52,160 | 5,621,805 |
|
|
| | | | |
| | Shares | Value |
| Merck & Co., Inc. | 60,670 | $ | 3,515,220 |
|
| Pfizer, Inc. | 63,230 | 1,893,738 |
|
| | | 11,647,700 |
|
| Real Estate Investment Trusts (REITs) — 0.8% | | |
| Brixmor Property Group, Inc. | 34,760 | 846,753 |
|
| Camden Property Trust | 6,340 | 486,088 |
|
| | | 1,332,841 |
|
| Semiconductors and Semiconductor Equipment — 2.5% | | |
| Applied Materials, Inc. | 100,490 | 2,219,824 |
|
| Microchip Technology, Inc. | 39,960 | 1,722,676 |
|
| | | 3,942,500 |
|
| Software — 4.3% | | |
Electronic Arts, Inc.(1) | 39,410 | 1,614,628 |
|
| Microsoft Corp. | 61,140 | 2,870,523 |
|
| Oracle Corp. | 59,930 | 2,340,266 |
|
| | | 6,825,417 |
|
| Specialty Retail — 1.1% | | |
| Lowe's Cos., Inc. | 31,110 | 1,779,492 |
|
| Technology Hardware, Storage and Peripherals — 0.9% | | |
| Apple, Inc. | 4,670 | 504,360 |
|
| Western Digital Corp. | 9,600 | 944,352 |
|
| | | 1,448,712 |
|
| Tobacco — 0.7% | | |
| Altria Group, Inc. | 21,300 | 1,029,642 |
|
| Trading Companies and Distributors — 0.4% | | |
United Rentals, Inc.(1) | 5,240 | 576,714 |
|
TOTAL COMMON STOCKS (Cost $101,121,240) | | 158,296,991 |
|
| TEMPORARY CASH INVESTMENTS — 0.4% | | |
| Repurchase Agreement, Bank of America Merrill Lynch, (collateralized by various U.S. Treasury obligations, 1.375% - 2.625%, 12/31/14 - 2/28/19, valued at $147,339), in a joint trading account at 0.07%, dated 10/31/14, due 11/3/14 (Delivery value $144,473) | | 144,472 |
|
| Repurchase Agreement, Credit Suisse First Boston, Inc., (collateralized by various U.S. Treasury obligations, 0.25%, 10/15/15, valued at $58,948), in a joint trading account at 0.04%, dated 10/31/14, due 11/3/14 (Delivery value $57,789) | | 57,789 |
|
| Repurchase Agreement, Goldman Sachs & Co., (collateralized by various U.S. Treasury obligations, 0.125%, 12/31/14, valued at $118,008), in a joint trading account at 0.03%, dated 10/31/14, due 11/3/14 (Delivery value $115,577) | | 115,577 |
|
| SSgA U.S. Government Money Market Fund, Class N | 317,912 | 317,912 |
|
TOTAL TEMPORARY CASH INVESTMENTS (Cost $635,750) | | 635,750 |
|
TOTAL INVESTMENT SECURITIES — 100.1% (Cost $101,756,990) | | 158,932,741 |
|
| OTHER ASSETS AND LIABILITIES — (0.1)% | | (91,625) |
|
| TOTAL NET ASSETS — 100.0% | | $ | 158,841,116 |
|
|
| | | | | | | | |
| FORWARD FOREIGN CURRENCY EXCHANGE CONTRACTS |
| Currency Purchased | Currency Sold | Counterparty | Settlement Date | Unrealized Appreciation
(Depreciation) |
| USD | 1,105,483 | CAD | 1,240,462 | JPMorgan Chase Bank N.A. | 11/28/14 | $ | 5,530 |
|
| USD | 1,253,910 | EUR | 983,472 | UBS AG | 11/28/14 | 21,283 |
|
| USD | 33,986 | EUR | 26,935 | UBS AG | 11/28/14 | 227 |
|
| | | | | | | $ | 27,040 |
|
|
| | |
| NOTES TO SCHEDULE OF INVESTMENTS |
| ADR | - | American Depositary Receipt |
| CAD | - | Canadian Dollar |
| EUR | - | Euro |
| USD | - | United States Dollar |
See Notes to Financial Statements.
|
|
| Statement of Assets and Liabilities |
|
| | | |
| OCTOBER 31, 2014 | |
| Assets | |
| Investment securities, at value (cost of $101,756,990) | $ | 158,932,741 |
|
| Foreign currency holdings, at value (cost of $27,833) | 25,643 |
|
| Receivable for capital shares sold | 95,571 |
|
| Unrealized appreciation on forward foreign currency exchange contracts | 27,040 |
|
| Dividends and interest receivable | 115,953 |
|
| | 159,196,948 |
|
| | |
| Liabilities | |
| Payable for capital shares redeemed | 226,483 |
|
| Accrued management fees | 128,532 |
|
| Distribution and service fees payable | 817 |
|
| | 355,832 |
|
| | |
| Net Assets | $ | 158,841,116 |
|
| | |
| Net Assets Consist of: | |
| Capital (par value and paid-in surplus) | $ | 92,342,457 |
|
| Undistributed net investment income | 1,704,334 |
|
| Undistributed net realized gain | 7,593,724 |
|
| Net unrealized appreciation | 57,200,601 |
|
| | $ | 158,841,116 |
|
|
| | | | | | |
| | Net Assets | Shares Outstanding | Net Asset Value Per Share |
| Investor Class, $0.01 Par Value |
| $151,714,809 |
| 15,621,931 |
| $9.71 |
| Institutional Class, $0.01 Par Value |
| $3,019,211 |
| 309,967 |
| $9.74 |
| A Class, $0.01 Par Value |
| $4,107,096 |
| 424,577 |
| $9.67* |
*Maximum offering price $10.26 (net asset value divided by 0.9425).
See Notes to Financial Statements.
|
| | | |
| YEAR ENDED OCTOBER 31, 2014 | |
| Investment Income (Loss) | |
| Income: | |
| Dividends (net of foreign taxes withheld of $15,096) | $ | 3,542,049 |
|
| Interest | 154 |
|
| | 3,542,203 |
|
| | |
| Expenses: | |
| Management fees | 1,673,695 |
|
| Distribution and service fees - A Class | 9,200 |
|
| Directors' fees and expenses | 2,133 |
|
| | 1,685,028 |
|
| Fees waived | (152,730 | ) |
| | 1,532,298 |
|
| | |
| Net investment income (loss) | 2,009,905 |
|
| | |
| Realized and Unrealized Gain (Loss) | |
| Net realized gain (loss) on: | |
| Investment transactions | 10,671,367 |
|
| Foreign currency transactions | 157,840 |
|
| | 10,829,207 |
|
| | |
| Change in net unrealized appreciation (depreciation) on: | |
| Investments | 9,243,668 |
|
| Translation of assets and liabilities in foreign currencies | (7,360 | ) |
| | 9,236,308 |
|
| | |
| Net realized and unrealized gain (loss) | 20,065,515 |
|
| | |
| Net Increase (Decrease) in Net Assets Resulting from Operations | $ | 22,075,420 |
|
See Notes to Financial Statements.
|
|
| Statement of Changes in Net Assets |
|
| | | | | | |
| YEARS ENDED OCTOBER 31, 2014 AND OCTOBER 31, 2013 |
| Increase (Decrease) in Net Assets | October 31, 2014 | October 31, 2013 |
| Operations | | |
| Net investment income (loss) | $ | 2,009,905 |
| $ | 2,240,364 |
|
| Net realized gain (loss) | 10,829,207 |
| 8,717,281 |
|
| Change in net unrealized appreciation (depreciation) | 9,236,308 |
| 19,768,371 |
|
| Net increase (decrease) in net assets resulting from operations | 22,075,420 |
| 30,726,016 |
|
| | | |
| Distributions to Shareholders | | |
| From net investment income: | | |
| Investor Class | (1,920,651 | ) | (2,047,246 | ) |
| Institutional Class | (51,046 | ) | (67,677 | ) |
| A Class | (36,557 | ) | (47,388 | ) |
| Decrease in net assets from distributions | (2,008,254 | ) | (2,162,311 | ) |
| | | |
| Capital Share Transactions | | |
| Net increase (decrease) in net assets from capital share transactions (Note 5) | (6,554,884 | ) | (7,183,934 | ) |
| | | |
| Net increase (decrease) in net assets | 13,512,282 |
| 21,379,771 |
|
| | | |
| Net Assets | | |
| Beginning of period | 145,328,834 |
| 123,949,063 |
|
| End of period | $ | 158,841,116 |
| $ | 145,328,834 |
|
| | | |
| Undistributed net investment income | $ | 1,704,334 |
| $ | 1,575,606 |
|
See Notes to Financial Statements.
|
|
Notes to Financial Statements |
OCTOBER 31, 2014
1. Organization
American Century Mutual Funds, Inc. (the corporation) is registered under the Investment Company Act of 1940, as amended (the 1940 Act), as an open-end management investment company and is organized as a Maryland corporation. Capital Value Fund (the fund) is one fund in a series issued by the corporation. The fund is diversified as defined under the 1940 Act. The fund’s investment objective is to seek long-term capital growth.
The fund offers the Investor Class, the Institutional Class and the A Class. The A Class may incur an initial sales charge. The A Class may be subject to a contingent deferred sales charge. The share classes differ principally in their respective sales charges and distribution and shareholder servicing expenses and arrangements. The Institutional Class is made available to institutional shareholders or through financial intermediaries whose clients do not require the same level of shareholder and administrative services as shareholders of other classes. As a result, the Institutional Class is charged a lower unified management fee.
2. Significant Accounting Policies
The following is a summary of significant accounting policies consistently followed by the fund in preparation of its financial statements. The fund is an investment company and follows accounting and reporting guidance in accordance with accounting principles generally accepted in the United States of America. This may require management to make certain estimates and assumptions at the date of the financial statements. Actual results could differ from these estimates. Management evaluated the impact of events or transactions occurring through the date the financial statements were issued that would merit recognition or disclosure.
Investment Valuations — The fund determines the fair value of its investments and computes its net asset value per share at the close of regular trading (usually 4 p.m. Eastern time) on the New York Stock Exchange (NYSE) on each day the NYSE is open. The Board of Directors has adopted valuation policies and procedures to guide the investment advisor in the fund’s investment valuation process and to provide methodologies for the oversight of the fund’s pricing function.
Equity securities that are listed or traded on a domestic securities exchange are valued at the last reported sales price or at the official closing price as provided by the exchange. Equity securities traded on foreign securities exchanges are generally valued at the closing price of such securities on the exchange where primarily traded or at the close of the NYSE, if that is earlier. If no last sales price is reported, or if local convention or regulation so provides, the mean of the latest bid and asked prices may be used. Securities traded over-the-counter are valued at the mean of the latest bid and asked prices, the last sales price, or the official closing price. Equity securities initially expressed in local currencies are translated into U.S. dollars at the mean of the appropriate currency exchange rate at the close of the NYSE as provided by an independent pricing service.
Fixed income securities maturing within 60 days at the time of purchase may be valued at cost, plus or minus any amortized discount or premium or at the evaluated mean as provided by an independent pricing service. Evaluated mean prices are commonly derived through utilization of market models, which may consider, among other factors: trade data, quotations from dealers and active market makers, relevant yield curve and spread data, related sector levels, creditworthiness, trade data or market information on comparable securities, and other relevant security specific information.
Open-end management investment companies are valued at the reported net asset value per share. Repurchase agreements are valued at cost, which approximates fair value. Forward foreign currency exchange contracts are valued at the mean of the appropriate forward exchange rate at the close of the NYSE as provided by an independent pricing service.
If the fund determines that the market price for an investment is not readily available or the valuation methods mentioned above do not reflect an investment’s fair value, such investment is valued as determined in good faith by the Board of Directors or its delegate, in accordance with policies and procedures adopted by the Board of Directors. In its determination of fair value, the fund may review several factors including, but not limited to, market information regarding the specific investment or comparable investments and correlation
with other investment types, futures indices or general market indicators. Circumstances that may cause the fund to use these procedures to value an investment include, but are not limited to: an investment has been declared in default or is distressed; trading in a security has been suspended during the trading day or a security is not actively trading on its principal exchange; prices received from a regular pricing source are deemed unreliable; or there is a foreign market holiday and no trading occurred.
The fund monitors for significant events occurring after the close of an investment’s primary exchange but before the fund’s net asset value per share is determined. Significant events may include, but are not limited to: corporate announcements and transactions; governmental action and political unrest that could impact a specific investment or an investment sector; or armed conflicts, natural disasters and similar events that could affect investments in a specific country or region. The fund also monitors for significant fluctuations between domestic and foreign markets, as evidenced by the U.S. market or such other indicators that the Board of Directors, or its delegate, deems appropriate. If significant fluctuations in foreign markets are identified, the fund may apply a model-derived factor to the closing price of equity securities traded on foreign securities exchanges. The factor is based on observable market data as provided by an independent pricing service.
Security Transactions — Security transactions are accounted for as of the trade date. Net realized gains and losses are determined on the identified cost basis, which is also used for federal income tax purposes.
Investment Income — Dividend income less foreign taxes withheld, if any, is recorded as of the ex-dividend date. Distributions received on securities that represent a return of capital or long-term capital gain are recorded as a reduction of cost of investments and/or as a realized gain. The fund may estimate the components of distributions received that may be considered nontaxable distributions or long-term capital gain distributions for income tax purposes. Interest income is recorded on the accrual basis and includes accretion of discounts and amortization of premiums.
Foreign Currency Translations — All assets and liabilities initially expressed in foreign currencies are translated into U.S. dollars at prevailing exchange rates at period end. The fund may enter into spot foreign currency exchange contracts to facilitate transactions denominated in a foreign currency. Purchases and sales of investment securities, dividend and interest income, spot foreign currency exchange contracts, and expenses are translated at the rates of exchange prevailing on the respective dates of such transactions. Net realized and unrealized foreign currency exchange gains or losses related to investment securities are a component of net realized gain (loss) on investment transactions and change in net unrealized appreciation (depreciation) on investments, respectively.
Repurchase Agreements — The fund may enter into repurchase agreements with institutions that American Century Investment Management, Inc. (ACIM) (the investment advisor) has determined are creditworthy pursuant to criteria adopted by the Board of Directors. The fund requires that the collateral, represented by securities, received in a repurchase transaction be transferred to the custodian in a manner sufficient to enable the fund to obtain those securities in the event of a default under the repurchase agreement. ACIM monitors, on a daily basis, the securities transferred to ensure the value, including accrued interest, of the securities under each repurchase agreement is equal to or greater than amounts owed to the fund under each repurchase agreement.
Joint Trading Account — Pursuant to an Exemptive Order issued by the Securities and Exchange Commission, the fund, along with certain other funds in the American Century Investments family of funds, may transfer uninvested cash balances into a joint trading account. These balances are invested in one or more repurchase agreements that are collateralized by U.S. Treasury or Agency obligations.
Income Tax Status — It is the fund’s policy to distribute substantially all net investment income and net realized gains to shareholders and to otherwise qualify as a regulated investment company under provisions of the Internal Revenue Code. Accordingly, no provision has been made for income taxes. The fund files U.S. federal, state, local and non-U.S. tax returns as applicable. The fund's tax returns are subject to examination by the relevant taxing authority until expiration of the applicable statute of limitations, which is generally three years from the date of filing but can be longer in certain jurisdictions. At this time, management believes there are no uncertain tax positions which, based on their technical merit, would not be sustained upon examination and for which it is reasonably possible that the total amounts of unrecognized tax benefits will significantly change in the next twelve months.
Multiple Class — All shares of the fund represent an equal pro rata interest in the net assets of the class to which such shares belong, and have identical voting, dividend, liquidation and other rights and the same terms and conditions, except for class specific expenses and exclusive rights to vote on matters affecting only individual classes. Income, non-class specific expenses, and realized and unrealized capital gains and losses of the fund are allocated to each class of shares based on their relative net assets.
Distributions to Shareholders — Distributions from net investment income and net realized gains, if any, are generally declared and paid annually.
Indemnifications — Under the corporation’s organizational documents, its officers and directors are indemnified against certain liabilities arising out of the performance of their duties to the fund. In addition, in the normal course of business, the fund enters into contracts that provide general indemnifications. The maximum exposure under these arrangements is unknown as this would involve future claims that may be made against a fund. The risk of material loss from such claims is considered by management to be remote.
3. Fees and Transactions with Related Parties
Certain officers and directors of the corporation are also officers and/or directors of American Century Companies, Inc. (ACC). The corporation’s investment advisor, ACIM, the corporation's distributor, American Century Investment Services, Inc. (ACIS), and the corporation’s transfer agent, American Century Services, LLC, are wholly owned, directly or indirectly, by ACC.
Management Fees — The corporation has entered into a management agreement with ACIM, under which ACIM provides the fund with investment advisory and management services in exchange for a single, unified management fee (the fee) per class. The agreement provides that all expenses of managing and operating the fund, except distribution and service fees, brokerage expenses, taxes, interest, fees and expenses of the independent directors (including legal counsel fees), and extraordinary expenses, will be paid by ACIM. The fee is computed and accrued daily based on each class’s daily net assets and paid monthly in arrears. The rate of the fee is determined by applying a fee rate calculation formula. This formula takes into account the fund’s assets as well as certain assets, if any, of other clients of the investment advisor outside the American Century Investments family of funds (such as subadvised funds and separate accounts) that have very similar investment teams and investment strategies (strategy assets). The annual management fee schedule ranges from 0.900% to 1.100% for the Investor Class and A Class. The annual management fee ranges from 0.700% to 0.900% for the Institutional Class. During the year ended October 31, 2014, the investment advisor voluntarily agreed to waive 0.100% of its management fee. The investment advisor expects the fee waiver to continue through July 31, 2015, and cannot terminate it without the approval of the Board of Directors. The total amount of the waiver for each class for the year ended October 31, 2014 was $145,885, $3,165 and $3,680 for the Investor Class, Institutional Class and A Class, respectively. The effective annual management fee before waiver for each class for the year ended October 31, 2014 was 1.10% for the Investor Class and A Class and 0.90% for the Institutional Class. The effective annual management fee after waiver for each class for the year ended October 31, 2014 was 1.00% for the Investor Class and A Class and 0.80% for the Institutional Class.
Distribution and Service Fees — The Board of Directors has adopted a Master Distribution and Individual Shareholder Services Plan (the plan) for the A Class, pursuant to Rule 12b-1 of the 1940 Act. The plan provides that the A Class will pay ACIS an annual distribution and service fee of 0.25%. The fees are computed and accrued daily based on the A Class’s daily net assets and paid monthly in arrears. The fees are used to pay financial intermediaries for distribution and individual shareholder services. Fees incurred under the plan during the year ended October 31, 2014 are detailed in the Statement of Operations.
Directors' Fees and Expenses — The Board of Directors is responsible for overseeing the investment advisor’s management and operations of the fund. The directors receive detailed information about the fund and its investment advisor regularly throughout the year, and meet at least quarterly with management of the investment advisor to review reports about fund operations. Fees and expenses incurred in conjunction with the directors during the year ended October 31, 2014 are detailed in the Statement of Operations. The fund’s officers do not receive compensation from the fund.
4. Investment Transactions
Purchases and sales of investment securities, excluding short-term investments, for the year ended October 31, 2014 were $47,120,579 and $53,066,216, respectively.
5. Capital Share Transactions
Transactions in shares of the fund were as follows:
|
| | | | | | | | | | |
| | Year ended October 31, 2014 | Year ended October 31, 2013 |
| | Shares | Amount | Shares | Amount |
| Investor Class/Shares Authorized | 200,000,000 |
| | 200,000,000 |
| |
| Sold | 1,267,771 |
| $ | 11,567,934 |
| 2,309,072 |
| $ | 17,554,839 |
|
| Issued in reinvestment of distributions | 216,834 |
| 1,847,429 |
| 281,184 |
| 1,954,229 |
|
| Redeemed | (2,174,796 | ) | (19,739,614 | ) | (3,292,554 | ) | (25,061,231 | ) |
| | (690,191 | ) | (6,324,251 | ) | (702,298 | ) | (5,552,163 | ) |
| Institutional Class/Shares Authorized | 15,000,000 |
| | 15,000,000 |
| |
| Sold | 15,136 |
| 134,931 |
| 5,270 |
| 43,183 |
|
| Issued in reinvestment of distributions | 5,746 |
| 49,014 |
| 9,357 |
| 65,127 |
|
| Redeemed | (96,090 | ) | (873,186 | ) | (201,020 | ) | (1,492,099 | ) |
| | (75,208 | ) | (689,241 | ) | (186,393 | ) | (1,383,789 | ) |
| A Class/Shares Authorized | 50,000,000 |
| | 50,000,000 |
| |
| Sold | 183,136 |
| 1,647,219 |
| 159,663 |
| 1,241,709 |
|
| Issued in reinvestment of distributions | 4,248 |
| 36,111 |
| 6,716 |
| 46,609 |
|
| Redeemed | (134,836 | ) | (1,224,722 | ) | (201,014 | ) | (1,536,300 | ) |
| | 52,548 |
| 458,608 |
| (34,635 | ) | (247,982 | ) |
| Net increase (decrease) | (712,851 | ) | $ | (6,554,884 | ) | (923,326 | ) | $ | (7,183,934 | ) |
6. Fair Value Measurements
The fund’s investments valuation process is based on several considerations and may use multiple inputs to determine the fair value of the investments held by the fund. In conformity with accounting principles generally accepted in the United States of America, the inputs used to determine a valuation are classified into three broad levels.
| |
| • | Level 1 valuation inputs consist of unadjusted quoted prices in an active market for identical investments. |
| |
| • | Level 2 valuation inputs consist of direct or indirect observable market data (including quoted prices for comparable investments, evaluations of subsequent market events, interest rates, prepayment speeds, credit risk, etc.). These inputs also consist of quoted prices for identical investments initially expressed in local currencies that are adjusted through translation into U.S. dollars. |
| |
| • | Level 3 valuation inputs consist of unobservable data (including a fund’s own assumptions). |
The level classification is based on the lowest level input that is significant to the fair valuation measurement. The valuation inputs are not necessarily an indication of the risks associated with investing in these securities or other financial instruments. There were no significant transfers between levels during the period.
The following is a summary of the level classifications as of period end. The Schedule of Investments provides additional information on the fund’s portfolio holdings.
|
| | | | | | | | |
| | Level 1 | Level 2 | Level 3 |
| Assets | | | |
| Investment Securities | | | |
| Common Stocks | $ | 156,847,714 |
| $ | 1,449,277 |
| — |
|
| Temporary Cash Investments | 317,912 |
| 317,838 |
| — |
|
| | $ | 157,165,626 |
| $ | 1,767,115 |
| — |
|
| Other Financial Instruments | | | |
| Forward Foreign Currency Exchange Contracts | — |
| $ | 27,040 |
| — |
|
7. Derivative Instruments
Foreign Currency Risk — The fund is subject to foreign currency exchange rate risk in the normal course of pursuing its investment objectives. The value of foreign investments held by a fund may be significantly affected by changes in foreign currency exchange rates. The dollar value of a foreign security generally decreases when the value of the dollar rises against the foreign currency in which the security is denominated and tends to increase when the value of the dollar declines against such foreign currency. A fund may enter into forward foreign currency exchange contracts to reduce a fund's exposure to foreign currency exchange rate fluctuations. The net U.S. dollar value of foreign currency underlying all contractual commitments held by a fund and the resulting unrealized appreciation or depreciation are determined daily. Realized gain or loss is recorded upon the termination of the contract. Net realized and unrealized gains or losses occurring during the holding period of forward foreign currency exchange contracts are a component of net realized gain (loss) on foreign currency transactions and change in net unrealized appreciation (depreciation) on translation of assets and liabilities in foreign currencies, respectively. A fund bears the risk of an unfavorable change in the foreign currency exchange rate underlying the forward contract. Additionally, losses, up to the fair value, may arise if the counterparties do not perform under the contract terms. The fund's average U.S. dollar exposure to foreign currency risk derivative instruments held during the period was $2,166,961.
The value of foreign currency risk derivative instruments as of October 31, 2014, is disclosed on the Statement of Assets and Liabilities as an asset of $27,040 in unrealized appreciation on forward foreign currency exchange contracts. For the year ended October 31, 2014, the effect of foreign currency risk derivative instruments on the Statement of Operations was $156,515 in net realized gain (loss) on foreign currency transactions and $(5,119) in change in net unrealized appreciation (depreciation) on translation of assets and liabilities in foreign currencies.
8. Federal Tax Information
The tax character of distributions paid during the years ended October 31, 2014 and October 31, 2013 were as follows:
|
| | | | | | |
| | 2014 | 2013 |
| Distributions Paid From | | |
| Ordinary income | $ | 2,008,254 |
| $ | 2,162,311 |
|
| Long-term capital gains | — |
| — |
|
The book-basis character of distributions made during the year from net investment income or net realized gains may differ from their ultimate characterization for federal income tax purposes. These differences reflect the differing character of certain income items and net realized gains and losses for financial statement and tax purposes, and may result in reclassification among certain capital accounts on the financial statements.
As of October 31, 2014, the federal tax cost of investments and the components of distributable earnings on a tax-basis were as follows:
|
| | | |
| Federal tax cost of investments | $ | 103,392,958 |
|
| Gross tax appreciation of investments | $ | 56,106,977 |
|
| Gross tax depreciation of investments | (567,194) |
|
| Net tax appreciation (depreciation) of investments | 55,539,783 |
|
Net tax appreciation (depreciation) on derivatives and translation of assets and liabilities in foreign currencies | (2,190 | ) |
| Net tax appreciation (depreciation) | $ | 55,537,593 |
|
| Undistributed ordinary income | $ | 1,731,374 |
|
| Accumulated long-term gains | $ | 9,229,692 |
|
The difference between book-basis and tax-basis unrealized appreciation (depreciation) is attributable primarily to the tax deferral of losses on wash sales.
|
| | | | | | | | | | | | | | | |
| For a Share Outstanding Throughout the Years Ended October 31 (except as noted) |
| Per-Share Data | | | Ratios and Supplemental Data | | |
| | | Income From Investment Operations: | | | | Ratio to Average Net Assets of: | | |
| | Net Asset
Value,
Beginning
of Period | Net
Investment
Income
(Loss)(1) | Net
Realized
and
Unrealized
Gain (Loss) | Total From
Investment
Operations | Distributions From Net
Investment
Income | Net Asset
Value,
End
of Period | Total
Return(2) | Operating
Expenses | Operating
Expenses
(before
expense
waiver) | Net
Investment
Income
(Loss) | Net
Investment
Income
(Loss)
(before
expense
waiver) | Portfolio
Turnover
Rate | Net
Assets,
End of
Period
(in thousands) |
| Investor Class | | | | | | | | | | | | |
| 2014 | $8.51 | 0.12 | 1.20 | 1.32 | (0.12) | $9.71 | 15.68% | 1.00% | 1.10% | 1.32% | 1.22% | 31% |
| $151,715 |
|
| 2013 | $6.89 | 0.13 | 1.61 | 1.74 | (0.12) | $8.51 | 25.67% | 1.00% | 1.10% | 1.66% | 1.56% | 26% |
| $138,884 |
|
| 2012 | $5.96 | 0.11 | 0.93 | 1.04 | (0.11) | $6.89 | 17.80% | 1.00% | 1.10% | 1.76% | 1.66% | 32% |
| $117,210 |
|
| 2011 | $5.73 | 0.09 | 0.23 | 0.32 | (0.09) | $5.96 | 5.67% | 1.00% | 1.10% | 1.53% | 1.43% | 37% |
| $111,188 |
|
| 2010 | $5.32 | 0.09 | 0.42 | 0.51 | (0.10) | $5.73 | 9.69% | 1.09% | 1.11% | 1.56% | 1.54% | 27% |
| $137,037 |
|
| Institutional Class | | | | | | | | | | | | |
| 2014 | $8.54 | 0.14 | 1.20 | 1.34 | (0.14) | $9.74 | 15.86% | 0.80% | 0.90% | 1.52% | 1.42% | 31% |
| $3,019 |
|
| 2013 | $6.90 | 0.15 | 1.62 | 1.77 | (0.13) | $8.54 | 26.00% | 0.80% | 0.90% | 1.86% | 1.76% | 26% |
| $3,289 |
|
| 2012 | $5.97 | 0.12 | 0.93 | 1.05 | (0.12) | $6.90 | 18.00% | 0.80% | 0.90% | 1.96% | 1.86% | 32% |
| $3,943 |
|
| 2011 | $5.74 | 0.10 | 0.24 | 0.34 | (0.11) | $5.97 | 5.87% | 0.80% | 0.90% | 1.73% | 1.63% | 37% |
| $3,618 |
|
| 2010 | $5.32 | 0.10 | 0.43 | 0.53 | (0.11) | $5.74 | 10.11% | 0.89% | 0.91% | 1.76% | 1.74% | 27% |
| $3,980 |
|
|
| | | | | | | | | | | | | | | |
| For a Share Outstanding Throughout the Years Ended October 31 (except as noted) |
| Per-Share Data | | | Ratios and Supplemental Data | | |
| | | Income From Investment Operations: | | | | Ratio to Average Net Assets of: | | |
| | Net Asset
Value,
Beginning
of Period | Net
Investment
Income
(Loss)(1) | Net
Realized
and
Unrealized
Gain (Loss) | Total From
Investment
Operations | Distributions From Net
Investment
Income | Net Asset
Value,
End
of Period | Total
Return(2) | Operating
Expenses | Operating
Expenses
(before
expense
waiver) | Net
Investment
Income
(Loss) | Net
Investment
Income
(Loss)
(before
expense
waiver) | Portfolio
Turnover
Rate | Net
Assets,
End of
Period
(in thousands) |
A Class(3) | | | | | | | | | | | | | |
| 2014 | $8.48 | 0.10 | 1.19 | 1.29 | (0.10) | $9.67 | 15.32% | 1.25% | 1.35% | 1.07% | 0.97% | 31% |
| $4,107 |
|
| 2013 | $6.87 | 0.11 | 1.62 | 1.73 | (0.12) | $8.48 | 25.51% | 1.25% | 1.35% | 1.41% | 1.31% | 26% |
| $3,155 |
|
| 2012 | $5.95 | 0.10 | 0.92 | 1.02 | (0.10) | $6.87 | 17.37% | 1.25% | 1.35% | 1.51% | 1.41% | 32% |
| $2,796 |
|
| 2011 | $5.72 | 0.08 | 0.23 | 0.31 | (0.08) | $5.95 | 5.41% | 1.25% | 1.35% | 1.28% | 1.18% | 37% |
| $3,326 |
|
| 2010 | $5.30 | 0.07 | 0.44 | 0.51 | (0.09) | $5.72 | 9.64% | 1.34% | 1.36% | 1.31% | 1.29% | 27% |
| $4,130 |
|
|
|
| Notes to Financial Highlights |
| |
| (1) | Computed using average shares outstanding throughout the period. |
| |
| (2) | Total returns are calculated based on the net asset value of the last business day and do not reflect applicable sales charges, if any. Total returns for periods less than one year are not annualized. |
| |
| (3) | Prior to March 1, 2010, the A Class was referred to as the Advisor Class. |
See Notes to Financial Statements.
|
|
| Report of Independent Registered Public Accounting Firm |
To the Board of Directors and Shareholders of
American Century Mutual Funds, Inc.:
We have audited the accompanying statement of assets and liabilities, including the schedule of investments, of Capital Value Fund (the “Fund”), one of the funds constituting American Century Mutual Funds, Inc., as of October 31, 2014, and the related statement of operations for the year then ended, the statements of changes in net assets for each of the two years in the period then ended, and the financial highlights for each of the periods presented. These financial statements and financial highlights are the responsibility of the Fund's management. Our responsibility is to express an opinion on these financial statements and financial highlights based on our audits.
We conducted our audits in accordance with the standards of the Public Company Accounting Oversight Board (United States). Those standards require that we plan and perform the audit to obtain reasonable assurance about whether the financial statements and financial highlights are free of material misstatement. The Fund is not required to have, nor were we engaged to perform, an audit of its internal control over financial reporting. Our audits included consideration of internal control over financial reporting as a basis for designing audit procedures that are appropriate in the circumstances, but not for the purpose of expressing an opinion on the effectiveness of the Fund's internal control over financial reporting. Accordingly, we express no such opinion. An audit also includes examining, on a test basis, evidence supporting the amounts and disclosures in the financial statements, assessing the accounting principles used and significant estimates made by management, as well as evaluating the overall financial statement presentation. Our procedures included confirmation of securities owned as of October 31, 2014, by correspondence with the custodian and brokers; where replies were not received from brokers, we performed other auditing procedures. We believe that our audits provide a reasonable basis for our opinion.
In our opinion, the financial statements and financial highlights referred to above present fairly, in all material respects, the financial position of Capital Value Fund of American Century Mutual Funds, Inc. as of October 31, 2014, the results of its operations for the year then ended, the changes in its net assets for each of the two years in the period then ended, and the financial highlights for each of the periods presented, in conformity with accounting principles generally accepted in the United States of America.
DELOITTE & TOUCHE LLP
Kansas City, Missouri
December 17, 2014
The Board of Directors
The individuals listed below serve as directors of the funds. Each director will continue to serve in this capacity until death, retirement, resignation or removal from office. The board has adopted a mandatory retirement age for directors who are not “interested persons,” as that term is defined in the Investment Company Act (independent directors). Independent directors shall retire by December 31 of the year in which they reach their 75th birthday.
Mr. Thomas is an “interested person” because he currently serves as President and Chief Executive Officer of American Century Companies, Inc. (ACC), the parent company of American Century Investment Management, Inc. (ACIM or the advisor). Mr. Fink is treated as an “interested person” because of his recent employment with ACC and American Century Services, LLC (ACS). The other directors (more than three-fourths of the total number) are independent. They are not employees, directors or officers of, and have no financial interest in, ACC or any of its wholly owned, direct or indirect, subsidiaries, including ACIM, American Century Investment Services, Inc. (ACIS) and ACS, and they do not have any other affiliations, positions, or relationships that would cause them to be considered “interested persons” under the Investment Company Act. The directors serve in this capacity for seven (in the case of Mr. Thomas, 15) registered investment companies in the American Century Investments family of funds.
The following table presents additional information about the directors. The mailing address for each director is 4500 Main Street, Kansas City, Missouri 64111.
|
| | | | | |
Name
(Year of Birth) | Position(s) Held with Funds | Length of Time Served | Principal Occupation(s) During Past 5 Years | Number of American Century Portfolios Overseen by Director | Other Directorships Held During Past
5 Years |
| Independent Directors | | | | |
Thomas A. Brown
(1940) | Director | Since 1980 | Managing Member, Associated Investments, LLC (real estate investment company); Brown Cascade Properties, LLC (real estate investment company) (2001 to 2009) | 73 | None |
Andrea C. Hall
(1945) | Director | Since 1997 | Retired | 73 | None |
Jan M. Lewis
(1957) | Director | Since 2011 | Retired; President and Chief Executive Officer, Catholic Charities of Northeast Kansas (human services organization) (2006 to 2013) | 73 | None |
James A. Olson
(1942) | Director and Chairman of the Board | Since 2007 (Chairman since 2014) | Member, Plaza Belmont LLC (private equity fund manager) | 73 | Saia, Inc. (2002 to 2012) and EPR Properties (2003 to 2013) |
|
| | | | | |
Name
(Year of Birth) | Position(s) Held with Funds | Length of Time Served | Principal Occupation(s) During Past 5 Years | Number of American Century Portfolios Overseen by Director | Other Directorships Held During Past
5 Years |
| Independent Directors | | | | |
M. Jeannine Strandjord
(1945) | Director | Since 1994 | Retired | 73 | Euronet Worldwide Inc.; Charming Shoppes, Inc. (2006 to 2010); and DST Systems Inc. (1996 to 2012) |
John R. Whitten
(1946) | Director | Since 2008 | Retired | 73 | Rudolph Technologies, Inc. |
Stephen E. Yates
(1948) | Director | Since 2012 | Retired; Executive Vice President, Technology & Operations, KeyCorp. (computer services) (2004 to 2010) | 73 | Applied Industrial Technologies, Inc. (2001 to 2010) |
| Interested Directors | | | | |
Barry Fink
(1955) | Director | Since 2012 | Retired; Executive Vice President, ACC (September 2007 to February 2013); President, ACS (October 2007 to February 2013); Chief Operating Officer, ACC (September 2007 to November 2012) | 73 | None |
Jonathan S. Thomas
(1963) | Director and President | Since 2007 | President and Chief Executive Officer, ACC (March 2007 to present). Also serves as Chief Executive Officer, ACS; Executive Vice President, ACIM; Director, ACC, ACIM and other ACC subsidiaries | 118 | BioMed Valley Discoveries, Inc. |
The Statement of Additional Information has additional information about the fund's directors and is available without charge, upon request, by calling 1-800-345-2021.
Officers
The following table presents certain information about the executive officers of the funds. Each officer serves as an officer for each of the 15 investment companies in the American Century family of funds, unless otherwise noted. No officer is compensated for his or her service as an officer of the funds. The listed officers are interested persons of the funds and are appointed or re-appointed on an annual basis. The mailing address for each officer listed below is 4500 Main Street, Kansas City, Missouri 64111.
|
| | |
Name (Year of Birth) | Offices with the Funds | Principal Occupation(s) During the Past Five Years |
Jonathan S.
Thomas
(1963) | Director and
President
since 2007 | President and Chief Executive Officer, ACC (March 2007 to present). Also serves as Chief Executive Officer, ACS; Executive Vice President, ACIM; Director, ACC, ACIM and other ACC subsidiaries |
Amy D. Shelton
(1964) | Chief Compliance
Officer since 2014 | Chief Compliance Officer, American Century funds, (March 2014 to present); Chief Compliance Officer, ACIM (February 2014 to present); Chief Compliance Officer, ACIS (October 2009 to present); Vice President, Client Interactions and Marketing, ACIS (February 2013 to January 2014); Director, Client Interactions and Marketing, ACIS (June 2007 to January 2013). Also serves as Vice President, ACIS |
Charles A.
Etherington
(1957) | General Counsel
since 2007 and
Senior Vice
President since 2006 | Attorney, ACC (February 1994 to present); Vice President, ACC (November 2005 to present); General Counsel, ACC (March 2007 to present). Also serves as General Counsel, ACIM, ACS, ACIS and other ACC subsidiaries; and Senior Vice President, ACIM and ACS |
C. Jean Wade
(1964) | Vice President,
Treasurer and
Chief Financial
Officer since 2012 | Vice President, ACS (February 2000 to present) |
Robert J.
Leach
(1966) | Vice President
since 2006 and
Assistant Treasurer
since 2012 | Vice President, ACS (February 2000 to present) |
David H.
Reinmiller
(1963) | Vice President
since 2000 | Attorney, ACC (January 1994 to present); Associate General Counsel, ACC (January 2001 to present). Also serves as Vice President, ACIM and ACS |
Ward D.
Stauffer
(1960) | Secretary
since 2005 | Attorney, ACC (June 2003 to present) |
|
|
| Approval of Management Agreement |
At a meeting held on June 18, 2014, the Fund’s Board of Directors unanimously approved the renewal of the management agreement pursuant to which American Century Investment Management, Inc. (the “Advisor”) acts as the investment advisor for the Fund. Under Section 15(c) of the Investment Company Act, contracts for investment advisory services are required to be reviewed, evaluated, and approved by a majority of a fund’s directors (the “Directors”), including a majority of the independent Directors, each year.
Prior to its consideration of the renewal of the management agreement, the Board requested and reviewed extensive data and information compiled by the Advisor and certain independent providers of evaluation data concerning the Fund and the services provided to the Fund by the Advisor. This review was in addition to the oversight and evaluation undertaken by the Board and its committees on a continuous basis and the information received was supplemental to the extensive information that the Board and its committees receive and consider throughout the year.
In connection with its consideration of the renewal of the management agreement, the Board’s review and evaluation of the services provided by the Advisor included, but was not limited to, the following:
| |
| • | the nature, extent, and quality of investment management, shareholder services, and other services provided by the Advisor to the Fund; |
| |
| • | the wide range of other programs and services the Advisor provides to the Fund and its shareholders on a routine and non-routine basis; |
| |
| • | the Fund’s investment performance compared to appropriate benchmarks and/or a peer group of other mutual funds with similar investment objectives and strategies; |
| |
| • | the cost of owning the Fund compared to the cost of owning similar funds; |
| |
| • | the Advisor’s compliance policies, procedures, and regulatory experience; |
| |
| • | financial data showing the cost of services provided to the Fund, the profitability of the Fund to the Advisor, and the overall profitability of the Advisor; |
| |
| • | possible economies of scale associated with the Advisor’s management of the Fund and other accounts under its management; |
| |
| • | the services provided and charges to other investment management clients of the Advisor; |
| |
| • | acquired fund fees and expenses; and |
| |
| • | any collateral benefits derived by the Advisor from the management of the Fund. |
In keeping with its practice, the Board held two in-person meetings and one telephonic meeting to review and discuss the information provided. The independent Directors also had the benefit of the advice of their independent counsel throughout the process.
Factors Considered
The Directors considered all of the information provided by the Advisor, the independent data providers, and independent counsel, and evaluated such information for the Fund. In connection with their review, the Directors did not identify any single factor as being all-important or controlling, and each Director may have attributed different levels of importance to different factors. In deciding to renew the management agreement, the Board based its decision on a number of factors, including the following:
Nature, Extent and Quality of Services — Generally. Under the management agreement, the Advisor is responsible for providing or arranging for all services necessary for the operation of the Fund. The Board noted that under the management agreement, the Advisor provides or arranges at its own expense a wide variety of services including:
| |
| • | constructing and designing the Fund |
| |
| • | portfolio research and security selection |
| |
| • | initial capitalization/funding |
| |
| • | daily valuation of the Fund’s portfolio |
| |
| • | shareholder servicing and transfer agency, including shareholder confirmations, recordkeeping, and communications |
| |
| • | legal services (except the independent Directors’ counsel) |
| |
| • | regulatory and portfolio compliance |
| |
| • | marketing and distribution (except Rule 12b-1 plans) |
The Board noted that many of these services have expanded over time both in terms of quantity and complexity in response to shareholder demands, competition in the industry, changing distribution channels, and the changing regulatory environment.
Investment Management Services. The nature of the investment management services provided to the Fund is quite complex and allows Fund shareholders access to professional money management, instant diversification of their investments within an asset class, the opportunity to easily diversify among asset classes by investing in or exchanging among various American Century Investments funds, and liquidity. In evaluating investment performance, the Board expects the Advisor to manage the Fund in accordance with its investment objectives and approved strategies. Further, the Directors recognize that the Advisor has an obligation to monitor trading activities, and in particular to seek the best execution of fund trades, and to evaluate the use of and payment for research. In providing these services, the Advisor utilizes teams of investment professionals (portfolio managers, analysts, research assistants, and securities traders) who require extensive information technology, research, training, compliance and other systems to conduct their business. The Board, directly and through its Fund Performance Review Committee, regularly reviews investment performance information for the Fund, together with comparative information for appropriate benchmarks and/or peer groups of similarly-managed funds, over different time horizons. The Directors also review detailed performance information during the management agreement approval process. If performance concerns are identified, the Fund receives special reviews until performance improves, during which the Board discusses with the Advisor the reasons for such results (e.g., market conditions, security selection) and any efforts being undertaken to improve performance. The Fund’s performance was above its benchmark for the one- and three-year periods and below its benchmark for the five- and ten-year periods reviewed by the Board. The Board found the investment management services provided by the Advisor to the Fund to be satisfactory and consistent with the management agreement.
Shareholder and Other Services. Under the management agreement, the Advisor provides the Fund with a comprehensive package of transfer agency, shareholder, and other services. The Board, directly and through various committees of the Board, regularly reviews reports and evaluations of such services at its regular meetings. These reports include, but are not limited to, information regarding the operational efficiency and accuracy of the shareholder and transfer agency services provided, staffing levels, shareholder satisfaction (as measured by external as well as internal sources), technology support, new products and services offered to Fund shareholders, securities trading activities, portfolio valuation services, auditing services, and legal and operational compliance activities. Certain aspects of shareholder and transfer agency service level efficiency and the quality of securities trading activities are measured by independent third party providers and are presented in comparison to other fund groups not managed by the Advisor. The Board
found the services provided by the Advisor to the Fund under the management agreement to be competitive and of high quality.
Costs of Services and Profitability. The Advisor provides detailed information concerning its cost of providing various services to the Fund, its profitability in managing the Fund (pre- and post-distribution), its overall profitability, and its financial condition. The Directors have reviewed with the Advisor the methodology used to prepare this financial information. The financial information regarding the Advisor is considered in evaluating the Advisor’s financial condition, its ability to continue to provide services under the management agreement, and the reasonableness of the current management fee. The Board concluded that the Advisor’s profits were reasonable in light of the services provided to the Fund.
Ethics. The Board generally considers the Advisor’s commitment to providing quality services to shareholders and to conducting its business ethically. They noted that the Advisor’s practices generally meet or exceed industry best practices.
Economies of Scale. The Board also reviewed information provided by the Advisor regarding the possible existence of economies of scale in connection with the management of the Fund. The Board concluded that economies of scale are difficult to measure and predict with precision, especially on a fund-by-fund basis. The Board concluded that the Advisor is appropriately sharing economies of scale through its competitive fee structure, offering competitive fees from fund inception, and through reinvestment in its business to provide shareholders additional content and services.
Comparison to Other Funds’ Fees. The management agreement provides that the Fund pays the Advisor a single, all-inclusive (or unified) management fee for providing all services necessary for the management and operation of the Fund, other than brokerage expenses, taxes, interest, extraordinary expenses, and the fees and expenses of the Fund’s independent directors (including their independent legal counsel) and expenses incurred in connection with the provision of shareholder services and distribution services under a plan adopted pursuant to Rule 12b-1 under the 1940 Act. Under the unified fee structure, the Advisor is responsible for providing all investment advisory, custody, audit, administrative, compliance, recordkeeping, marketing and shareholder services, or arranging and supervising third parties to provide such services. By contrast, most other funds are charged a variety of fees, including an investment advisory fee, a transfer agency fee, an administrative fee, distribution charges and other expenses. Other than their investment advisory fees and any applicable Rule 12b-1 distribution fees, all other components of the total fees charged by these other funds may be increased without shareholder approval. The Board believes the unified fee structure is a benefit to Fund shareholders because it clearly discloses to shareholders the cost of owning Fund shares, and, since the unified fee cannot be increased without a vote of Fund shareholders, it shifts to the Advisor the risk of increased costs of operating the Fund and provides a direct incentive to minimize administrative inefficiencies. Part of the Board’s analysis of fee levels involves reviewing certain evaluative data compiled by an independent provider comparing the Fund’s unified fee to the total expense ratios of its peers. The unified fee charged to shareholders of the Fund was slightly above the median of the total expense ratios of the Fund’s peer expense universe and was within the range of its peer expense group. The Board and the Advisor agreed to a one year extension of the existing reduction of the Fund's annual unified management fee of 0.10% (e.g., the Investor Class fee will be reduced from 1.10% to 1.00%) beginning August 1, 2014. The Board concluded that the management fee paid by the Fund to the Advisor under the management agreement is reasonable in light of the services provided to the Fund.
Comparison to Fees and Services Provided to Other Clients of the Advisor. The Board also requested and received information from the Advisor concerning the nature of the services, fees, costs and profitability of its advisory services to advisory clients other than the Fund. They observed that these varying types of client accounts require different services and involve different regulatory and entrepreneurial risks than the management of the Fund. The Board analyzed this
information and concluded that the fees charged and services provided to the Fund were reasonable by comparison.
Collateral or “Fall-Out” Benefits Derived by the Advisor. The Board considered the existence of collateral benefits the Advisor may receive as a result of its relationship with the Fund. They concluded that the Advisor’s primary business is managing mutual funds and it generally does not use fund or shareholder information to generate profits in other lines of business, and therefore does not derive any significant collateral benefits from them. The Board noted that the Advisor receives proprietary research from broker-dealers that execute fund portfolio transactions and concluded that this research is likely to benefit Fund shareholders. The Board also determined that the Advisor is able to provide investment management services to certain clients other than the Fund, at least in part, due to its existing infrastructure built to serve the fund complex. The Board concluded, however, that the assets of those other clients are not material to the analysis and, where applicable, may be included with the assets of the Fund to determine breakpoints in the management fee schedule.
Existing Relationship. The Board also considered whether there was any reason for not continuing the existing arrangement with the Advisor. In this regard, the Board was mindful of the potential disruptions of the Fund’s operations and various risks, uncertainties, and other effects that could occur as a result of a decision not to continue such relationship. In particular, the Board recognized that most shareholders have invested in the Fund on the strength of the Advisor’s industry standing and reputation and in the expectation that the Advisor will have a continuing role in providing advisory services to the Fund.
Conclusion of the Directors. As a result of this process, the Board, including all of the independent Directors, taking into account all of the factors discussed above and the information provided by the Advisor and others, concluded that the management agreement between the Fund and the Advisor is fair and reasonable in light of the services provided and should be renewed.
Retirement Account Information
As required by law, distributions you receive from certain IRAs are subject to federal income tax withholding, unless you elect not to have withholding apply. Tax will be withheld on the total amount withdrawn even though you may be receiving amounts that are not subject to withholding, such as nondeductible contributions. In such case, excess amounts of withholding could occur. You may adjust your withholding election so that a greater or lesser amount will be withheld.
If you don’t want us to withhold on this amount, you must notify us to not withhold the federal income tax. You may notify us in writing or in certain situations by telephone or through other electronic means. For systematic withdrawals, your withholding election will remain in effect until revoked or changed by filing a new election. You have the right to revoke your election at any time.
Remember, even if you elect not to have income tax withheld, you are liable for paying income tax on the taxable portion of your withdrawal. If you elect not to have income tax withheld or you don’t have enough income tax withheld, you may be responsible for payment of estimated tax. You may incur penalties under the estimated tax rules if your withholding and estimated tax payments are not sufficient. You can reduce or defer the income tax on a distribution by directly or indirectly rolling such distribution over to another IRA or eligible plan. You should consult your tax advisor for additional information.
State tax will be withheld if, at the time of your distribution, your address is within one of the mandatory withholding states and you have federal income tax withheld (or as otherwise required by state law). State taxes will be withheld from your distribution in accordance with the respective state rules.
Distributions you receive from 403(b), 457 and qualified plans are subject to special tax and withholding rules. Your plan administrator or plan sponsor is required to provide you with a special tax notice explaining those rules at the time you request a distribution. If applicable, federal and/or state taxes may be withheld from your distribution amount.
Proxy Voting Policies
A description of the policies that the fund's investment advisor uses in exercising the voting rights associated with the securities purchased and/or held by the fund is available without charge, upon request, by calling 1-800-345-2021. It is also available on the "About Us" page of American Century Investments’ website at americancentury.com and on the Securities and Exchange Commission’s website at sec.gov. Information regarding how the investment advisor voted proxies relating to portfolio securities during the most recent 12-month period ended June 30 is available on the "About Us" page at americancentury.com. It is also available at sec.gov.
Quarterly Portfolio Disclosure
The fund files its complete schedule of portfolio holdings with the Securities and Exchange Commission (SEC) for the first and third quarters of each fiscal year on Form N-Q. The fund’s Forms N-Q are available on the SEC’s website at sec.gov, and may be reviewed and copied at the SEC’s Public Reference Room in Washington, DC. Information on the operation of the Public Reference Room may be obtained by calling 1-800-SEC-0330. The fund also makes its complete schedule of portfolio holdings for the most recent quarter of its fiscal year available on its
website at americancentury.com and, upon request, by calling 1-800-345-2021.
Other Tax Information
The following information is provided pursuant to provisions of the Internal Revenue Code.
The fund hereby designates up to the maximum amount allowable as qualified dividend income for the fiscal year ended October 31, 2014.
For corporate taxpayers, the fund hereby designates $2,008,254, or up to the maximum amount allowable, of ordinary income distributions paid during the fiscal year ended October 31, 2014 as qualified for the corporate dividends received deduction.
|
| | |
| |
| | | |
| Contact Us | americancentury.com | |
| Automated Information Line | 1-800-345-8765 | |
| Investor Services Representative | 1-800-345-2021 or 816-531-5575 | |
| Investors Using Advisors | 1-800-378-9878 | |
| Business, Not-For-Profit, Employer-Sponsored Retirement Plans | 1-800-345-3533 | |
| Banks and Trust Companies, Broker-Dealers, Financial Professionals, Insurance Companies | 1-800-345-6488 | |
| Telecommunications Relay Service for the Deaf | 711 | |
| | | |
| American Century Mutual Funds, Inc. | |
| | | |
Investment Advisor: American Century Investment Management, Inc. Kansas City, Missouri | |
| | | |
| This report and the statements it contains are submitted for the general information of our shareholders. The report is not authorized for distribution to prospective investors unless preceded or accompanied by an effective prospectus. | |
| | | |
©2014 American Century Proprietary Holdings, Inc. All rights reserved.
CL-ANN-84001 1412 | |
|
| |
| ANNUAL REPORT | OCTOBER 31, 2014 |
Focused Growth Fund
|
| |
| President’s Letter | |
| Performance | |
| Portfolio Commentary | |
| Fund Characteristics | |
| Shareholder Fee Example | |
| Schedule of Investments | |
| Statement of Assets and Liabilities | |
| Statement of Operations | |
| Statement of Changes in Net Assets | |
| Notes to Financial Statements | |
| Financial Highlights | |
| Report of Independent Registered Public Accounting Firm | |
| Management | |
| Approval of Management Agreement | |
| Additional Information | |
Any opinions expressed in this report reflect those of the author as of the date of the report, and do not necessarily represent the opinions of American Century Investments® or any other person in the American Century Investments organization. Any such opinions are subject to change at any time based upon market or other conditions and American Century Investments disclaims any responsibility to update such opinions. These opinions may not be relied upon as investment advice and, because investment decisions made by American Century Investments funds are based on numerous factors, may not be relied upon as an indication of trading intent on behalf of any American Century Investments fund. Security examples are used for representational purposes only and are not intended as recommendations to purchase or sell securities. Performance information for comparative indices and securities is provided to American Century Investments by third party vendors. To the best of American Century Investments’ knowledge, such information is accurate at the time of printing.
|
| |
| Dear Investor:
Thank you for reviewing this annual report for the 12 months ended October 31, 2014. It provides investment performance and portfolio information for the reporting period, plus longer-term historical performance data.
Annual reports remain important vehicles for conveying information about fund returns, including market and economic factors that affected performance during the reporting period. For additional, updated investment and market insights, we encourage you to visit our website, americancentury.com. |
| Jonathan Thomas |
Favorable Fiscal Year for U.S. Stocks and Bonds
Mostly stimulative monetary policies by central banks and expectations of longer-term economic improvement, interspersed with concerns about nearer-term weaker-than-expected global economic data and geopolitical conflicts, helped drive financial market returns during the reporting period. We believe the combination of longer-term optimism about U.S. economic growth, low costs of capital, and continued central bank stimulus (even as the U.S. Federal Reserve’s latest monthly bond purchase program ended) helped persuade investors to seek risk and yield, which benefited U.S. stocks and bonds. The S&P 500 Index gained 17.27% during the 12 months. The 30-year U.S. Treasury bond was close behind, returning 15.44%, according to Barclays. U.S. real estate investment trusts (REITs), whose shares combine performance attributes of stocks and bonds, benefited from both—the MSCI U.S. REIT Index advanced 19.19%.
U.S. market benchmark returns generally outpaced their non-U.S. counterparts. The U.S. was perceived by investors as a relative bastion of growth, stability, and potentially attractive yields compared with most of the rest of the world, so capital flows generally favored U.S. assets. These capital flows, along with weaker-than-expected global growth, lower-than-expected global inflation, and falling commodity and energy prices, helped keep long-term interest rates and other corporate costs low. U.S. stocks just completed a solid third-quarter earnings reporting season, though questions remain about next year’s revenues, given this year’s slowdown in global economic growth and concerns about how far it could extend into 2015.
We believe continuing global economic and geopolitical uncertainties could continue to support the relative appeal of U.S. assets in coming months. But the end of the U.S. Federal Reserve’s monthly bond-buying program and the still-looming possibility of higher interest rates in 2015 point to potential U.S. market volatility ahead. In this environment, we continue to believe in a disciplined, diversified, long-term investment approach, using professionally managed stock and bond portfolios for meeting financial goals. We appreciate your continued trust in us.
Sincerely,
Jonathan Thomas
President and Chief Executive Officer
American Century Investments
|
| | | | | |
| Total Returns as of October 31, 2014 |
| | | | Average Annual Returns | |
| | Ticker Symbol | 1 year | 5 years | Since Inception | Inception Date |
| Investor Class | AFSIX | 13.75% | 14.58% | 7.58% | 2/28/05 |
| Russell 1000 Growth Index | — | 17.11% | 17.42% | 8.82% | — |
| Institutional Class | AFGNX | 14.06% | 14.82% | 6.73% | 9/28/07 |
| A Class | AFGAX | | | | 9/28/07 |
| No sales charge* | | 13.49% | 14.31% | 6.25% | |
| With sales charge* | | 6.93% | 12.97% | 5.37% | |
| C Class | AFGCX | 12.66% | 13.44% | 5.45% | 9/28/07 |
| R Class | AFGRX | 13.20% | 14.02% | 5.98% | 9/28/07 |
| |
| * | Sales charges include initial sales charges and contingent deferred sales charges (CDSCs), as applicable. A Class shares have a 5.75% maximum initial sales charge and may be subject to a maximum CDSC of 1.00%. C Class shares redeemed within 12 months of purchase are subject to a maximum CDSC of 1.00%. The SEC requires that mutual funds provide performance information net of maximum sales charges in all cases where charges could be applied. |
Data presented reflect past performance. Past performance is no guarantee of future results. Current performance may be higher or lower than the performance shown. Investment return and principal value will fluctuate, and redemption value may be more or less than original cost. Data assumes reinvestment of dividends and capital gains, and none of the charts reflect the deduction of taxes that a shareholder would pay on fund distributions or the redemption of fund shares. To obtain performance data current to the most recent month end, please call 1-800-345-2021 or visit americancentury.com. For additional information about the fund, please consult the prospectus.
|
|
| Growth of $10,000 Over Life of Class |
| $10,000 investment made February 28, 2005 |
| Performance for other share classes will vary due to differences in fee structure. |
|
| |
| Value on October 31, 2014 |
| | Investor Class — $20,276 |
| |
| | Russell 1000 Growth Index — $22,653 |
| |
*From February 28, 2005, the Investor Class’s inception date. Not annualized.
|
| | | | |
| Total Annual Fund Operating Expenses |
| Investor Class | Institutional Class | A Class | C Class | R Class |
| 1.01% | 0.81% | 1.26% | 2.01% | 1.51% |
The total annual fund operating expenses shown is as stated in the fund’s prospectus current as of the date of this report. The prospectus may vary from the expense ratio shown elsewhere in this report because it is based on a different time period, includes acquired fund fees and expenses, and, if applicable, does not include fee waivers or expense reimbursements.
Data presented reflect past performance. Past performance is no guarantee of future results. Current performance may be higher or lower than the performance shown. Investment return and principal value will fluctuate, and redemption value may be more or less than original cost. Data assumes reinvestment of dividends and capital gains, and none of the charts reflect the deduction of taxes that a shareholder would pay on fund distributions or the redemption of fund shares. To obtain performance data current to the most recent month end, please call 1-800-345-2021 or visit americancentury.com. For additional information about the fund, please consult the prospectus.
Portfolio Managers: Greg Woodhams and Joe Reiland
Performance Summary
Focused Growth returned 13.75%* in the 12 months ended October 31, 2014, compared with the 17.11% return of its benchmark, the Russell 1000 Growth Index.
In terms of Focused Growth’s absolute returns, health care shares contributed most. Energy was the only sector to detract in absolute terms. Relative to the benchmark, stock selection made information technology the leading detractor. Stock choices meant consumer staples shares contributed most to relative performance.
Information Technology Positioning Detracted Most
Stock selection decisions in the information technology sector weighed on performance, led by an underweight position in computers and peripherals giant Apple. We had some exposure to the stock, but less than the index, believing it is difficult for Apple to continue to rapidly improve earnings; nevertheless, the stock did well as a result of excitement around new product launches. It also hurt to have no exposure to software giant Microsoft. The company lowered guidance, consistent with our less sanguine outlook for the business. Nevertheless, the stock benefited from price-to-earnings multiple expansion, excitement around moving Office 365 to a subscription model, and the announcement of the Windows 10 operating system. Other notable detractors included semiconductor manufacturer Linear Technology and communications equipment maker Cisco Systems. We eliminated our stakes in Linear and Cisco.
Energy, Consumer Discretionary Also Underperformed
Selection and allocation decisions in the energy and consumer staples discretionary sectors detracted from relative performance. Among energy stocks, positioning among oil, gas, and consumable fuels companies hurt most. North American energy exploration and production firm EOG Resources lagged as energy prices softened. We sold the stock.
In the consumer discretionary space, electronics retailer Best Buy was a key individual detractor. The company made progress on its turnaround in 2013, but reported much weaker-than-expected holiday sales amid a promotional sales environment that failed to drive higher industry demand. The promotions hit both the top line and margins, causing the company to miss earnings and lower future guidance. We eliminated the position. Elsewhere in the sector, Las Vegas Sands underperformed due to poor performance from its Macau property as Chinese economic growth moderated and the quadrennial staging of the World Cup negatively impacted casino visits. We eliminated the position.
Consumer Staples Stocks Helped Most
The leading contribution to relative returns came from positioning in the consumer staples sector. It benefited relative performance to be underrepresented in poor-performing food and staples retailers, personal products companies, and household products makers. At the same time, it helped to hold an overweight position in food products companies, led by a stake in Mead Johnson Nutrition.
| |
| * | All fund returns referenced in this commentary are for Investor Class shares. Performance for other share classes will vary due to differences in fee structure; when Investor Class performance exceeds that of the fund’s benchmark, other share classes may not. See page 3 for returns for all share classes. |
Other Notable Contributors
Stock selection meant the health care sector contributed positively to performance. The leading contributor in this space was biotech stock Alexion Pharmaceuticals, which gained on a very strong earnings report and investor enthusiasm for the company’s revised tax structure, which should lead to lower tax rates (and more profits) going forward. Elsewhere, it was beneficial to be underrepresented in the comparatively poor-performing telecommunication services space.
In terms of individual contributors to relative performance, hotelier Marriott International enjoyed solid profit growth as room capacity and rates are attractive after years of little or no room growth in the industry. Software maker Electronic Arts benefited from continued margin expansion, and better-than-expected sales of new games. Rail transportation company Union Pacific was another notable contributor to relative return. Because new sources of crude oil often don’t have a pipeline infrastructure to the coasts, rail has emerged as a necessary means of crude transport. Additionally, railroads are seeing sharp increases in volumes of sand used in hydraulic fracturing.
In addition, it helped to have no exposure to Amazon.com, a component of the benchmark. The internet retailer is struggling with rising capital expenditures, falling margins, and investor concern about the company’s profitability. Similarly, it was beneficial to avoid information technology services firm International Business Machines, which underperformed after reporting disappointing revenues and the departure of its CEO. Among other notable individual contributors to performance were stakes in textiles and apparel manufacturer Hanesbrands and data storage provider SanDisk. Both positions were eliminated during the period.
Current Positioning
We understand that investors use the Focused Growth portfolio as a building block in their larger investment strategy. Maintaining low cash balances and avoiding style drift provides our clients with confidence that the Focused Growth portfolio is providing the large-cap growth representation that they seek.
In our opinion, stock selection—rather than sector allocation or market timing via the use of cash—is the most efficient means of generating superior risk-adjusted returns. As a result of this approach, the portfolio’s sector and industry selection as well as capitalization range allocations are primarily a result of identifying what we believe to be superior individual securities. As of October 31, 2014, the industrials, consumer discretionary, and health care sectors were the portfolio’s largest overweight positions relative to the benchmark. The most notable sector underweight positions were in telecommunication services, consumer staples, and financials shares. Information technology shares remained the portfolio’s single largest sector allocation on an absolute basis.
|
| |
| OCTOBER 31, 2014 | |
| Top Ten Holdings | % of net assets |
| Visa, Inc., Class A | 4.2% |
| PepsiCo, Inc. | 4.1% |
| Walt Disney Co. (The) | 4.0% |
| Comcast Corp., Class A | 3.8% |
| Oracle Corp. | 3.7% |
| Honeywell International, Inc. | 3.3% |
| Johnson & Johnson | 3.1% |
| C.R. Bard, Inc. | 3.1% |
| AutoZone, Inc. | 3.0% |
| Expedia, Inc. | 3.0% |
| | |
| Top Five Industries | % of net assets |
| Media | 7.8% |
| Aerospace and Defense | 7.7% |
| Software | 7.5% |
| Internet Software and Services | 6.9% |
| IT Services | 5.7% |
| | |
| Types of Investments in Portfolio | % of net assets |
| Common Stocks | 98.3% |
| Exchange-Traded Funds | 0.1% |
| Total Equity Exposure | 98.4% |
| Temporary Cash Investments | 1.7% |
| Other Assets and Liabilities | (0.1)% |
Fund shareholders may incur two types of costs: (1) transaction costs, including sales charges (loads) on purchase payments and redemption/exchange fees; and (2) ongoing costs, including management fees; distribution and service (12b-1) fees; and other fund expenses. This example is intended to help you understand your ongoing costs (in dollars) of investing in your fund and to compare these costs with the ongoing cost of investing in other mutual funds.
The example is based on an investment of $1,000 made at the beginning of the period and held for the entire period from May 1, 2014 to October 31, 2014.
Actual Expenses
The table provides information about actual account values and actual expenses for each class. You may use the information, together with the amount you invested, to estimate the expenses that you paid over the period. First, identify the share class you own. Then simply divide your account value by $1,000 (for example, an $8,600 account value divided by $1,000 = 8.6), then multiply the result by the number under the heading “Expenses Paid During Period” to estimate the expenses you paid on your account during this period.
If you hold Investor Class shares of any American Century Investments fund, or Institutional Class shares of the American Century Diversified Bond Fund, in an American Century Investments account (i.e., not a financial intermediary or retirement plan account), American Century Investments may charge you a $12.50 semiannual account maintenance fee if the value of those shares is less than $10,000. We will redeem shares automatically in one of your accounts to pay the $12.50 fee. In determining your total eligible investment amount, we will include your investments in all personal accounts (including American Century Investments Brokerage accounts) registered under your Social Security number. Personal accounts include individual accounts, joint accounts, UGMA/UTMA accounts, personal trusts, Coverdell Education Savings Accounts and IRAs (including traditional, Roth, Rollover, SEP-, SARSEP- and SIMPLE-IRAs), and certain other retirement accounts. If you have only business, business retirement, employer-sponsored or American Century Investments Brokerage accounts, you are currently not subject to this fee. If you are subject to the Account Maintenance Fee, your account value could be reduced by the fee amount.
Hypothetical Example for Comparison Purposes
The table also provides information about hypothetical account values and hypothetical expenses based on the actual expense ratio of each class of your fund and an assumed rate of return of 5% per year before expenses, which is not the actual return of a fund’s share class. The hypothetical account values and expenses may not be used to estimate the actual ending account balance or expenses you paid for the period. You may use this information to compare the ongoing costs of investing in your fund and other funds. To do so, compare this 5% hypothetical example with the 5% hypothetical examples that appear in the shareholder reports of the other funds.
Please note that the expenses shown in the table are meant to highlight your ongoing costs only and do not reflect any transactional costs, such as sales charges (loads) or redemption/exchange fees. Therefore, the table is useful in comparing ongoing costs only, and will not help you determine the relative total costs of owning different funds. In addition, if these transactional costs were included, your costs would have been higher.
|
| | | | |
| Beginning
Account Value
5/1/14 | Ending
Account Value
10/31/14 | Expenses Paid
During Period(1)5/1/14 - 10/31/14 | Annualized
Expense Ratio(1) |
| Actual | | | | |
| Investor Class | $1,000 | $1,071.10 | $5.22 | 1.00% |
| Institutional Class | $1,000 | $1,073.20 | $4.18 | 0.80% |
| A Class | $1,000 | $1,069.80 | $6.52 | 1.25% |
| C Class | $1,000 | $1,066.10 | $10.42 | 2.00% |
| R Class | $1,000 | $1,068.70 | $7.82 | 1.50% |
| Hypothetical | | | | |
| Investor Class | $1,000 | $1,020.16 | $5.09 | 1.00% |
| Institutional Class | $1,000 | $1,021.17 | $4.08 | 0.80% |
| A Class | $1,000 | $1,018.90 | $6.36 | 1.25% |
| C Class | $1,000 | $1,015.12 | $10.16 | 2.00% |
| R Class | $1,000 | $1,017.64 | $7.63 | 1.50% |
| |
| (1) | Expenses are equal to the class's annualized expense ratio listed in the table above, multiplied by the average account value over the period, multiplied by 184, the number of days in the most recent fiscal half-year, divided by 365, to reflect the one-half year period. |
OCTOBER 31, 2014
|
| | | | | |
| | Shares | Value |
| COMMON STOCKS — 98.3% | | |
| Aerospace and Defense — 7.7% | | |
| Boeing Co. (The) | 3,233 |
| $ | 403,834 |
|
| Honeywell International, Inc. | 6,018 |
| 578,450 |
|
| Lockheed Martin Corp. | 1,844 |
| 351,411 |
|
| | | 1,333,695 |
|
| Airlines — 1.3% | | |
| Alaska Air Group, Inc. | 4,099 |
| 218,190 |
|
| Automobiles — 1.2% | | |
| Harley-Davidson, Inc. | 3,166 |
| 208,006 |
|
| Banks — 2.8% | | |
| SunTrust Banks, Inc. | 12,389 |
| 484,906 |
|
| Beverages — 4.1% | | |
| PepsiCo, Inc. | 7,472 |
| 718,582 |
|
| Biotechnology — 4.8% | | |
Alexion Pharmaceuticals, Inc.(1) | 2,209 |
| 422,714 |
|
Biogen Idec, Inc.(1) | 308 |
| 98,893 |
|
Incyte Corp.(1) | 4,520 |
| 303,111 |
|
| | | 824,718 |
|
| Capital Markets — 1.3% | | |
| Franklin Resources, Inc. | 3,264 |
| 181,511 |
|
| Invesco Ltd. | 1,148 |
| 46,460 |
|
| | | 227,971 |
|
| Chemicals — 0.3% | | |
| Sherwin-Williams Co. (The) | 252 |
| 57,849 |
|
| Commercial Services and Supplies — 1.0% | | |
| Tyco International Ltd. | 3,887 |
| 166,869 |
|
| Communications Equipment — 0.3% | | |
| QUALCOMM, Inc. | 637 |
| 50,011 |
|
| Electrical Equipment — 0.2% | | |
Generac Holdings, Inc.(1) | 789 |
| 35,773 |
|
| Energy Equipment and Services — 1.0% | | |
| Baker Hughes, Inc. | 3,418 |
| 181,017 |
|
| Food Products — 3.8% | | |
| Hershey Co. (The) | 1,516 |
| 145,399 |
|
| Mead Johnson Nutrition Co. | 5,141 |
| 510,553 |
|
| | | 655,952 |
|
| Health Care Equipment and Supplies — 4.0% | | |
| C.R. Bard, Inc. | 3,267 |
| 535,690 |
|
DexCom, Inc.(1) | 3,658 |
| 164,427 |
|
| | | 700,117 |
|
| Health Care Providers and Services — 2.8% | | |
| Cardinal Health, Inc. | 6,240 |
| 489,715 |
|
| Hotels, Restaurants and Leisure — 2.9% | | |
| Marriott International, Inc., Class A | 6,744 |
| 510,858 |
|
|
| | | | | |
| | Shares | Value |
| Internet and Catalog Retail — 3.0% | | |
| Expedia, Inc. | 6,054 |
| $ | 514,408 |
|
| Internet Software and Services — 6.9% | | |
eBay, Inc.(1) | 3,101 |
| 162,803 |
|
Facebook, Inc., Class A(1) | 4,458 |
| 334,305 |
|
Google, Inc., Class A(1) | 632 |
| 358,894 |
|
Yelp, Inc.(1) | 5,840 |
| 350,400 |
|
| | | 1,206,402 |
|
| IT Services — 5.7% | | |
Teradata Corp.(1) | 6,457 |
| 273,260 |
|
| Visa, Inc., Class A | 2,995 |
| 723,083 |
|
| | | 996,343 |
|
| Machinery — 3.8% | | |
| Caterpillar, Inc. | 1,829 |
| 185,479 |
|
| Parker-Hannifin Corp. | 2,478 |
| 314,780 |
|
WABCO Holdings, Inc.(1) | 1,570 |
| 152,887 |
|
| | | 653,146 |
|
| Media — 7.8% | | |
| Comcast Corp., Class A | 11,929 |
| 660,270 |
|
| Walt Disney Co. (The) | 7,593 |
| 693,849 |
|
| | | 1,354,119 |
|
| Multiline Retail — 1.9% | | |
| Macy's, Inc. | 5,842 |
| 337,784 |
|
| Oil, Gas and Consumable Fuels — 3.5% | | |
Concho Resources, Inc.(1) | 205 |
| 22,351 |
|
| Exxon Mobil Corp. | 4,931 |
| 476,877 |
|
| Occidental Petroleum Corp. | 1,176 |
| 104,582 |
|
| | | 603,810 |
|
| Pharmaceuticals — 5.1% | | |
| Johnson & Johnson | 5,076 |
| 547,091 |
|
| Teva Pharmaceutical Industries Ltd. ADR | 5,914 |
| 333,964 |
|
| | | 881,055 |
|
| Road and Rail — 2.5% | | |
| Union Pacific Corp. | 3,651 |
| 425,159 |
|
| Semiconductors and Semiconductor Equipment — 2.8% | | |
| Broadcom Corp., Class A | 11,456 |
| 479,777 |
|
| Software — 7.5% | | |
Electronic Arts, Inc.(1) | 11,634 |
| 476,645 |
|
| Oracle Corp. | 16,440 |
| 641,982 |
|
Splunk, Inc.(1) | 2,902 |
| 191,764 |
|
| | | 1,310,391 |
|
| Specialty Retail — 5.6% | | |
AutoZone, Inc.(1) | 937 |
| 518,648 |
|
Bed Bath & Beyond, Inc.(1) | 4,739 |
| 319,125 |
|
| Gap, Inc. (The) | 3,626 |
| 137,389 |
|
| | | 975,162 |
|
| Wireless Telecommunication Services — 2.7% | | |
SBA Communications Corp., Class A(1) | 4,155 |
| 466,731 |
|
TOTAL COMMON STOCKS (Cost $13,986,373) | | 17,068,516 |
|
|
| | | | | |
| | Shares | Value |
| EXCHANGE-TRADED FUNDS — 0.1% | | |
iShares Russell 1000 Growth Index Fund (Cost $16,854) | 185 |
| $ | 17,383 |
|
| TEMPORARY CASH INVESTMENTS — 1.7% | | |
| Repurchase Agreement, Bank of America Merrill Lynch, (collateralized by various U.S. Treasury obligations, 1.375% - 2.625%, 12/31/14 - 2/28/19, valued at $68,861), in a joint trading account at 0.07%, dated 10/31/14, due 11/3/14 (Delivery value $67,521) | | 67,521 |
|
| Repurchase Agreement, Credit Suisse First Boston, Inc., (collateralized by various U.S. Treasury obligations, 0.25%, 10/15/15, valued at $27,550), in a joint trading account at 0.04%, dated 10/31/14, due 11/3/14 (Delivery value $27,009) | | 27,009 |
|
| Repurchase Agreement, Goldman Sachs & Co., (collateralized by various U.S. Treasury obligations, 0.125%, 12/31/14, valued at $55,153), in a joint trading account at 0.03%, dated 10/31/14, due 11/3/14 (Delivery value $54,017) | | 54,017 |
|
| SSgA U.S. Government Money Market Fund, Class N | 148,581 |
| 148,581 |
|
TOTAL TEMPORARY CASH INVESTMENTS (Cost $297,128) | | 297,128 |
|
TOTAL INVESTMENT SECURITIES — 100.1% (Cost $14,300,355) | | 17,383,027 |
|
| OTHER ASSETS AND LIABILITIES — (0.1)% | | (9,656 | ) |
| TOTAL NET ASSETS — 100.0% | | $ | 17,373,371 |
|
|
| | |
| NOTES TO SCHEDULE OF INVESTMENTS |
| ADR | - | American Depositary Receipt |
See Notes to Financial Statements.
|
|
| Statement of Assets and Liabilities |
|
| | | |
| OCTOBER 31, 2014 | |
| Assets | |
| Investment securities, at value (cost of $14,300,355) | $ | 17,383,027 |
|
| Receivable for investments sold | 375,509 |
|
| Receivable for capital shares sold | 1,972 |
|
| Dividends and interest receivable | 1,716 |
|
| | 17,762,224 |
|
| | |
| Liabilities | |
| Payable for investments purchased | 374,392 |
|
| Accrued management fees | 13,906 |
|
| Distribution and service fees payable | 555 |
|
| | 388,853 |
|
| | |
| Net Assets | $ | 17,373,371 |
|
| | |
| Net Assets Consist of: | |
| Capital (par value and paid-in surplus) | $ | 10,742,449 |
|
| Undistributed net investment income | 41,472 |
|
| Undistributed net realized gain | 3,506,778 |
|
| Net unrealized appreciation | 3,082,672 |
|
| | $ | 17,373,371 |
|
|
| | | | | | |
| | Net Assets | Shares Outstanding | Net Asset Value Per Share |
| Investor Class, $0.01 Par Value |
| $15,906,130 |
| 1,055,125 |
| $15.08 |
| Institutional Class, $0.01 Par Value |
| $39,673 |
| 2,628 |
| $15.10 |
| A Class, $0.01 Par Value |
| $933,212 |
| 62,109 |
| $15.03* |
| C Class, $0.01 Par Value |
| $377,501 |
| 26,000 |
| $14.52 |
| R Class, $0.01 Par Value |
| $116,855 |
| 7,826 |
| $14.93 |
*Maximum offering price $15.95 (net asset value divided by 0.9425).
See Notes to Financial Statements.
|
| | | |
| YEAR ENDED OCTOBER 31, 2014 | |
| Investment Income (Loss) | |
| Income: | |
| Dividends (net of foreign taxes withheld of $348) | $ | 237,863 |
|
| Interest | 40 |
|
| | 237,903 |
|
| | |
| Expenses: | |
| Management fees | 172,191 |
|
| Distribution and service fees: | |
| A Class | 2,398 |
|
| C Class | 4,154 |
|
| R Class | 826 |
|
| Directors' fees and expenses | 187 |
|
| Other expenses | 63 |
|
| | 179,819 |
|
| | |
| Net investment income (loss) | 58,084 |
|
| | |
| Realized and Unrealized Gain (Loss) | |
| Net realized gain (loss) on investment transactions | 3,833,059 |
|
| Change in net unrealized appreciation (depreciation) on investments | (1,675,354 | ) |
| | |
| Net realized and unrealized gain (loss) | 2,157,705 |
|
| | |
| Net Increase (Decrease) in Net Assets Resulting from Operations | $ | 2,215,789 |
|
See Notes to Financial Statements.
|
|
| Statement of Changes in Net Assets |
|
| | | | | | |
| YEARS ENDED OCTOBER 31, 2014 AND OCTOBER 31, 2013 |
| Increase (Decrease) in Net Assets | October 31, 2014 | October 31, 2013 |
| Operations | | |
| Net investment income (loss) | $ | 58,084 |
| $ | 99,163 |
|
| Net realized gain (loss) | 3,833,059 |
| 2,560,514 |
|
| Change in net unrealized appreciation (depreciation) | (1,675,354 | ) | 1,112,666 |
|
| Net increase (decrease) in net assets resulting from operations | 2,215,789 |
| 3,772,343 |
|
| | | |
| Distributions to Shareholders | | |
| From net investment income: | | |
| Investor Class | (64,380 | ) | (98,934 | ) |
| Institutional Class | (216 | ) | (210 | ) |
| A Class | (1,153 | ) | (5,216 | ) |
| C Class | — |
| (1,351 | ) |
| R Class | — |
| (3,125 | ) |
| From net realized gains: | | |
| Investor Class | (1,657,959 | ) | — |
|
| Institutional Class | (3,744 | ) | — |
|
| A Class | (75,832 | ) | — |
|
| C Class | (48,564 | ) | — |
|
| R Class | (11,461 | ) | — |
|
| Decrease in net assets from distributions | (1,863,309 | ) | (108,836 | ) |
| | | |
| Capital Share Transactions | | |
| Net increase (decrease) in net assets from capital share transactions (Note 5) | (613,458 | ) | (2,130,667 | ) |
| | | |
| Net increase (decrease) in net assets | (260,978 | ) | 1,532,840 |
|
| | | |
| Net Assets | | |
| Beginning of period | 17,634,349 |
| 16,101,509 |
|
| End of period | $ | 17,373,371 |
| $ | 17,634,349 |
|
| | | |
| Undistributed net investment income | $ | 41,472 |
| $ | 53,306 |
|
See Notes to Financial Statements.
|
|
Notes to Financial Statements |
OCTOBER 31, 2014
1. Organization
American Century Mutual Funds, Inc. (the corporation) is registered under the Investment Company Act of 1940, as amended (the 1940 Act), as an open-end management investment company and is organized as a Maryland corporation. Focused Growth Fund (the fund) is one fund in a series issued by the corporation. The fund is diversified as defined under the 1940 Act. The fund’s investment objective is to seek long-term capital growth.
The fund offers the Investor Class, the Institutional Class, the A Class, the C Class and the R Class. The A Class may incur an initial sales charge. The A Class and C Class may be subject to a contingent deferred sales charge. The share classes differ principally in their respective sales charges and distribution and shareholder servicing expenses and arrangements. The Institutional Class is made available to institutional shareholders or through financial intermediaries whose clients do not require the same level of shareholder and administrative services as shareholders of other classes. As a result, the Institutional Class is charged a lower unified management fee.
2. Significant Accounting Policies
The following is a summary of significant accounting policies consistently followed by the fund in preparation of its financial statements. The fund is an investment company and follows accounting and reporting guidance in accordance with accounting principles generally accepted in the United States of America. This may require management to make certain estimates and assumptions at the date of the financial statements. Actual results could differ from these estimates. Management evaluated the impact of events or transactions occurring through the date the financial statements were issued that would merit recognition or disclosure.
Investment Valuations — The fund determines the fair value of its investments and computes its net asset value per share at the close of regular trading (usually 4 p.m. Eastern time) on the New York Stock Exchange (NYSE) on each day the NYSE is open. The Board of Directors has adopted valuation policies and procedures to guide the investment advisor in the fund’s investment valuation process and to provide methodologies for the oversight of the fund’s pricing function.
Equity securities that are listed or traded on a domestic securities exchange are valued at the last reported sales price or at the official closing price as provided by the exchange. Equity securities traded on foreign securities exchanges are generally valued at the closing price of such securities on the exchange where primarily traded or at the close of the NYSE, if that is earlier. If no last sales price is reported, or if local convention or regulation so provides, the mean of the latest bid and asked prices may be used. Securities traded over-the-counter are valued at the mean of the latest bid and asked prices, the last sales price, or the official closing price.
Fixed income securities maturing within 60 days at the time of purchase may be valued at cost, plus or minus any amortized discount or premium or at the evaluated mean as provided by an independent pricing service. Evaluated mean prices are commonly derived through utilization of market models, which may consider, among other factors: trade data, quotations from dealers and active market makers, relevant yield curve and spread data, related sector levels, creditworthiness, trade data or market information on comparable securities, and other relevant security specific information.
Open-end management investment companies are valued at the reported net asset value per share. Repurchase agreements are valued at cost, which approximates fair value.
If the fund determines that the market price for an investment is not readily available or the valuation methods mentioned above do not reflect an investment’s fair value, such investment is valued as determined in good faith by the Board of Directors or its delegate, in accordance with policies and procedures adopted by the Board of Directors. In its determination of fair value, the fund may review several factors including, but not limited to, market information regarding the specific investment or comparable investments and correlation with other investment types, futures indices or general market indicators. Circumstances that may cause the fund to use these procedures to value an investment include, but are not limited to: an investment has been declared in default or is distressed; trading in a security has been suspended during the trading day or a
security is not actively trading on its principal exchange; prices received from a regular pricing source are deemed unreliable; or there is a foreign market holiday and no trading occurred.
The fund monitors for significant events occurring after the close of an investment’s primary exchange but before the fund’s net asset value per share is determined. Significant events may include, but are not limited to: corporate announcements and transactions; governmental action and political unrest that could impact a specific investment or an investment sector; or armed conflicts, natural disasters and similar events that could affect investments in a specific country or region. The fund also monitors for significant fluctuations between domestic and foreign markets, as evidenced by the U.S. market or such other indicators that the Board of Directors, or its delegate, deems appropriate. If significant fluctuations in foreign markets are identified, the fund may apply a model-derived factor to the closing price of equity securities traded on foreign securities exchanges. The factor is based on observable market data as provided by an independent pricing service.
Security Transactions — Security transactions are accounted for as of the trade date. Net realized gains and losses are determined on the identified cost basis, which is also used for federal income tax purposes.
Investment Income — Dividend income less foreign taxes withheld, if any, is recorded as of the ex-dividend date. Distributions received on securities that represent a return of capital or long-term capital gain are recorded as a reduction of cost of investments and/or as a realized gain. The fund may estimate the components of distributions received that may be considered nontaxable distributions or long-term capital gain distributions for income tax purposes. Interest income is recorded on the accrual basis and includes accretion of discounts and amortization of premiums.
Repurchase Agreements — The fund may enter into repurchase agreements with institutions that American Century Investment Management, Inc. (ACIM) (the investment advisor) has determined are creditworthy pursuant to criteria adopted by the Board of Directors. The fund requires that the collateral, represented by securities, received in a repurchase transaction be transferred to the custodian in a manner sufficient to enable the fund to obtain those securities in the event of a default under the repurchase agreement. ACIM monitors, on a daily basis, the securities transferred to ensure the value, including accrued interest, of the securities under each repurchase agreement is equal to or greater than amounts owed to the fund under each repurchase agreement.
Joint Trading Account — Pursuant to an Exemptive Order issued by the Securities and Exchange Commission, the fund, along with certain other funds in the American Century Investments family of funds, may transfer uninvested cash balances into a joint trading account. These balances are invested in one or more repurchase agreements that are collateralized by U.S. Treasury or Agency obligations.
Income Tax Status — It is the fund’s policy to distribute substantially all net investment income and net realized gains to shareholders and to otherwise qualify as a regulated investment company under provisions of the Internal Revenue Code. Accordingly, no provision has been made for income taxes. The fund files U.S. federal, state, local and non-U.S. tax returns as applicable. The fund's tax returns are subject to examination by the relevant taxing authority until expiration of the applicable statute of limitations, which is generally three years from the date of filing but can be longer in certain jurisdictions. At this time, management believes there are no uncertain tax positions which, based on their technical merit, would not be sustained upon examination and for which it is reasonably possible that the total amounts of unrecognized tax benefits will significantly change in the next twelve months.
Multiple Class — All shares of the fund represent an equal pro rata interest in the net assets of the class to which such shares belong, and have identical voting, dividend, liquidation and other rights and the same terms and conditions, except for class specific expenses and exclusive rights to vote on matters affecting only individual classes. Income, non-class specific expenses, and realized and unrealized capital gains and losses of the fund are allocated to each class of shares based on their relative net assets.
Distributions to Shareholders — Distributions from net investment income and net realized gains, if any, are generally declared and paid annually. The fund may elect to treat a portion of its payment to a redeeming shareholder, which represents the pro rata share of undistributed net investment income and net realized gains, as a distribution for federal income tax purposes (tax equalization).
Indemnifications — Under the corporation’s organizational documents, its officers and directors are indemnified against certain liabilities arising out of the performance of their duties to the fund. In addition, in the normal course of business, the fund enters into contracts that provide general indemnifications. The maximum exposure under these arrangements is unknown as this would involve future claims that may be made against a fund. The risk of material loss from such claims is considered by management to be remote.
3. Fees and Transactions with Related Parties
Certain officers and directors of the corporation are also officers and/or directors of American Century Companies, Inc. (ACC). The corporation’s investment advisor, ACIM, the corporation's distributor, American Century Investment Services, Inc. (ACIS), and the corporation’s transfer agent, American Century Services, LLC, are wholly owned, directly or indirectly, by ACC.
Management Fees — The corporation has entered into a management agreement with ACIM, under which ACIM provides the fund with investment advisory and management services in exchange for a single, unified management fee (the fee) per class. The agreement provides that all expenses of managing and operating the fund, except distribution and service fees, brokerage expenses, taxes, interest, fees and expenses of the independent directors (including legal counsel fees), and extraordinary expenses, will be paid by ACIM. The fee is computed and accrued daily based on each class’s daily net assets and paid monthly in arrears. The rate of the fee is determined by applying a fee rate calculation formula. This formula takes into account the fund’s assets as well as certain assets, if any, of other clients of the investment advisor outside the American Century Investments family of funds (such as subadvised funds and separate accounts) that have very similar investment teams and investment strategies (strategy assets). The annual management fee schedule ranges from 0.800% to 0.990% for the Investor Class, A Class, C Class and R Class. The annual management fee schedule ranges from 0.600% to 0.790% for the Institutional Class. Prior to August 1, 2014, the annual management fee schedule ranged from 0.800% to 1.000% for the Investor Class, A Class, C Class and R Class and 0.600% to 0.800% for the Institutional Class. The effective annual management fee for each class for the year ended October 31, 2014 was 1.00% for the Investor Class, A Class, C Class and R Class and 0.80% for the Institutional Class.
Distribution and Service Fees — The Board of Directors has adopted a separate Master Distribution and Individual Shareholder Services Plan for each of the A Class, C Class and R Class (collectively the plans), pursuant to Rule 12b-1 of the 1940 Act. The plans provide that the A Class will pay ACIS an annual distribution and service fee of 0.25%. The plans provide that the C Class will pay ACIS an annual distribution and service fee of 1.00%, of which 0.25% is paid for individual shareholder services and 0.75% is paid for distribution services. The plans provide that the R Class will pay ACIS an annual distribution and service fee of 0.50%. The fees are computed and accrued daily based on each class’s daily net assets and paid monthly in arrears. The fees are used to pay financial intermediaries for distribution and individual shareholder services. Fees incurred under the plans during the year ended October 31, 2014 are detailed in the Statement of Operations.
Directors' Fees and Expenses — The Board of Directors is responsible for overseeing the investment advisor’s management and operations of the fund. The directors receive detailed information about the fund and its investment advisor regularly throughout the year, and meet at least quarterly with management of the investment advisor to review reports about fund operations. Fees and expenses incurred in conjunction with the directors during the year ended October 31, 2014 are detailed in the Statement of Operations. The fund’s officers do not receive compensation from the fund.
4. Investment Transactions
Purchases and sales of investment securities, excluding short-term investments, for the year ended October 31, 2014 were $16,501,514 and $18,940,855, respectively.
5. Capital Share Transactions
Transactions in shares of the fund were as follows:
|
| | | | | | | | | | |
| | Year ended October 31, 2014 | Year ended October 31, 2013 |
| | Shares | Amount | Shares | Amount |
| Investor Class/Shares Authorized | 50,000,000 |
| | 50,000,000 |
| |
| Sold | 83,756 |
| $ | 1,199,614 |
| 106,961 |
| $ | 1,348,320 |
|
| Issued in reinvestment of distributions | 126,729 |
| 1,704,510 |
| 7,954 |
| 97,837 |
|
| Redeemed | (207,315 | ) | (2,973,387 | ) | (214,810 | ) | (2,875,301 | ) |
| | 3,170 |
| (69,263 | ) | (99,895 | ) | (1,429,144 | ) |
| Institutional Class/Shares Authorized | 10,000,000 |
| | 10,000,000 |
| |
| Issued in reinvestment of distributions | 295 |
| 3,960 |
| 17 |
| 210 |
|
| A Class/Shares Authorized | 10,000,000 |
| | 10,000,000 |
| |
| Sold | 31,298 |
| 441,244 |
| 1,156 |
| 14,867 |
|
| Issued in reinvestment of distributions | 5,575 |
| 74,867 |
| 414 |
| 5,093 |
|
| Redeemed | (26,665 | ) | (378,220 | ) | (64,494 | ) | (794,634 | ) |
| | 10,208 |
| 137,891 |
| (62,924 | ) | (774,674 | ) |
| C Class/Shares Authorized | 10,000,000 |
| | 10,000,000 |
| |
| Sold | 3,194 |
| 45,140 |
| 19,412 |
| 246,001 |
|
| Issued in reinvestment of distributions | 3,058 |
| 39,961 |
| 86 |
| 1,041 |
|
| Redeemed | (10,239 | ) | (139,779 | ) | (15,979 | ) | (211,475 | ) |
| | (3,987 | ) | (54,678 | ) | 3,519 |
| 35,567 |
|
| R Class/Shares Authorized | 10,000,000 |
| | 10,000,000 |
| |
| Sold | 436 |
| 6,356 |
| 2,708 |
| 36,786 |
|
| Issued in reinvestment of distributions | 856 |
| 11,461 |
| 255 |
| 3,125 |
|
| Redeemed | (42,964 | ) | (649,185 | ) | (198 | ) | (2,537 | ) |
| | (41,672 | ) | (631,368 | ) | 2,765 |
| 37,374 |
|
| Net increase (decrease) | (31,986 | ) | $ | (613,458 | ) | (156,518 | ) | $ | (2,130,667 | ) |
6. Fair Value Measurements
The fund’s investments valuation process is based on several considerations and may use multiple inputs to determine the fair value of the investments held by the fund. In conformity with accounting principles generally accepted in the United States of America, the inputs used to determine a valuation are classified into three broad levels.
| |
| • | Level 1 valuation inputs consist of unadjusted quoted prices in an active market for identical investments. |
| |
| • | Level 2 valuation inputs consist of direct or indirect observable market data (including quoted prices for comparable investments, evaluations of subsequent market events, interest rates, prepayment speeds, credit risk, etc.). These inputs also consist of quoted prices for identical investments initially expressed in local currencies that are adjusted through translation into U.S. dollars. |
| |
| • | Level 3 valuation inputs consist of unobservable data (including a fund’s own assumptions). |
The level classification is based on the lowest level input that is significant to the fair valuation measurement. The valuation inputs are not necessarily an indication of the risks associated with investing in these securities or other financial instruments. There were no significant transfers between levels during the period.
The following is a summary of the level classifications as of period end. The Schedule of Investments provides additional information on the fund’s portfolio holdings.
|
| | | | | | | | |
| | Level 1 | Level 2 | Level 3 |
| Assets | | | |
| Investment Securities | | | |
| Common Stocks | $ | 17,068,516 |
| — |
| — |
|
| Exchange-Traded Funds | 17,383 |
| — |
| — |
|
| Temporary Cash Investments | 148,581 |
| $ | 148,547 |
| — |
|
| | $ | 17,234,480 |
| $ | 148,547 |
| — |
|
7. Federal Tax Information
The tax character of distributions paid during the years ended October 31, 2014 and October 31, 2013 were as follows:
|
| | | | | | |
| | 2014 | 2013 |
| Distributions Paid From | | |
| Ordinary income | $ | 65,749 |
| $ | 108,836 |
|
| Long-term capital gains | $ | 1,797,560 |
| — |
|
The book-basis character of distributions made during the year from net investment income or net realized gains may differ from their ultimate characterization for federal income tax purposes. These differences reflect the differing character of certain income items and net realized gains and losses for financial statement and tax purposes, and may result in reclassification among certain capital accounts on the financial statements.
The reclassifications, which are primarily due to tax equalization, were made to capital $278,387, undistributed net investment income $(4,169), and undistributed net realized gain $(274,218).
As of October 31, 2014, the federal tax cost of investments and the components of distributable earnings on a tax-basis were as follows:
|
| | | |
| Federal tax cost of investments | $ | 14,339,421 |
|
| Gross tax appreciation of investments | $ | 3,132,108 |
|
| Gross tax depreciation of investments | (88,502 | ) |
| Net tax appreciation (depreciation) of investments | $ | 3,043,606 |
|
| Undistributed ordinary income | $ | 252,139 |
|
| Accumulated long-term gains | $ | 3,335,177 |
|
The difference between book-basis and tax-basis unrealized appreciation (depreciation) is attributable primarily to the tax deferral of losses on wash sales.
|
| | | | | | | | | | | | | | | |
| For a Share Outstanding Throughout the Years Ended October 31 (except as noted) |
| Per-Share Data | | Ratios and Supplemental Data | | |
| | | Income From Investment Operations: | Distributions From: | | | Ratio to Average Net Assets of: | | |
| | Net Asset
Value,
Beginning
of Period | Net
Investment
Income
(Loss)(1) | Net
Realized
and
Unrealized
Gain (Loss) | Total From
Investment
Operations | Net
Investment
Income | Net
Realized
Gains | Total
Distributions | Net Asset
Value,
End
of Period | Total
Return(2) | Operating
Expenses | Net
Investment
Income
(Loss) | Portfolio
Turnover
Rate | Net
Assets,
End of
Period
(in thousands) |
| Investor Class | | | | | | | | | | | | |
| 2014 | $14.89 | 0.05 | 1.80 | 1.85 | (0.06) | (1.60) | (1.66) | $15.08 | 13.75% | 1.00% | 0.38% | 97% |
| $15,906 |
|
| 2013 | $12.00 | 0.08 | 2.89 | 2.97 | (0.08) | — | (0.08) | $14.89 | 24.93% | 1.00% | 0.64% | 73% |
| $15,664 |
|
| 2012 | $10.70 | 0.08 | 1.28 | 1.36 | (0.06) | — | (0.06) | $12.00 | 12.78% | 1.01% | 0.70% | 59% |
| $13,828 |
|
| 2011 | $10.17 | 0.06 | 0.53 | 0.59 | (0.06) | — | (0.06) | $10.70 | 5.76% | 1.00% | 0.54% | 91% |
| $14,335 |
|
| 2010 | $8.73 | 0.04 | 1.40 | 1.44 | —(3) | — | —(3) | $10.17 | 16.54% | 1.02% | 0.38% | 66% |
| $12,739 |
|
| Institutional Class | | | | | | | | | | | | |
| 2014 | $14.91 | 0.08 | 1.80 | 1.88 | (0.09) | (1.60) | (1.69) | $15.10 | 14.06% | 0.80% | 0.58% | 97% |
| $40 |
|
| 2013 | $12.01 | 0.11 | 2.88 | 2.99 | (0.09) | — | (0.09) | $14.91 | 25.06% | 0.80% | 0.84% | 73% |
| $35 |
|
| 2012 | $10.70 | 0.10 | 1.29 | 1.39 | (0.08) | — | (0.08) | $12.01 | 13.09% | 0.81% | 0.90% | 59% |
| $28 |
|
| 2011 | $10.17 | 0.08 | 0.53 | 0.61 | (0.08) | — | (0.08) | $10.70 | 5.98% | 0.80% | 0.74% | 91% |
| $25 |
|
| 2010 | $8.73 | 0.05 | 1.41 | 1.46 | (0.02) | — | (0.02) | $10.17 | 16.77% | 0.82% | 0.58% | 66% |
| $23 |
|
| A Class | | | | | | | | | | | | |
| 2014 | $14.84 | 0.02 | 1.79 | 1.81 | (0.02) | (1.60) | (1.62) | $15.03 | 13.49% | 1.25% | 0.13% | 97% |
| $933 |
|
| 2013 | $11.99 | 0.05 | 2.88 | 2.93 | (0.08) | — | (0.08) | $14.84 | 24.53% | 1.25% | 0.39% | 73% |
| $770 |
|
| 2012 | $10.68 | 0.05 | 1.29 | 1.34 | (0.03) | — | (0.03) | $11.99 | 12.62% | 1.26% | 0.45% | 59% |
| $1,376 |
|
| 2011 | $10.15 | 0.04 | 0.52 | 0.56 | (0.03) | — | (0.03) | $10.68 | 5.51% | 1.25% | 0.29% | 91% |
| $1,040 |
|
| 2010 | $8.74 | 0.01 | 1.40 | 1.41 | — | — | — | $10.15 | 16.27% | 1.27% | 0.13% | 66% |
| $501 |
|
|
| | | | | | | | | | | | | | | |
| For a Share Outstanding Throughout the Years Ended October 31 (except as noted) |
| Per-Share Data | | Ratios and Supplemental Data | | |
| | | Income From Investment Operations: | Distributions From: | | | Ratio to Average Net Assets of: | | |
| | Net Asset
Value,
Beginning
of Period | Net
Investment
Income
(Loss)(1) | Net
Realized
and
Unrealized
Gain (Loss) | Total From
Investment
Operations | Net
Investment
Income | Net
Realized
Gains | Total
Distributions | Net Asset
Value,
End
of Period | Total
Return(2) | Operating
Expenses | Net
Investment
Income
(Loss) | Portfolio
Turnover
Rate | Net
Assets,
End of
Period
(in thousands) |
| C Class | | | | | | | | | | | | |
| 2014 | $14.47 | (0.09) | 1.74 | 1.65 | — | (1.60) | (1.60) | $14.52 | 12.66% | 2.00% | (0.62)% | 97% |
| $378 |
|
| 2013 | $11.75 | (0.05) | 2.82 | 2.77 | (0.05) | — | (0.05) | $14.47 | 23.65% | 2.00% | (0.36)% | 73% |
| $434 |
|
| 2012 | $10.52 | (0.03) | 1.26 | 1.23 | — | — | — | $11.75 | 11.69% | 2.01% | (0.30)% | 59% |
| $311 |
|
| 2011 | $10.05 | (0.05) | 0.52 | 0.47 | — | — | — | $10.52 | 4.68% | 2.00% | (0.46)% | 91% |
| $346 |
|
| 2010 | $8.71 | (0.06) | 1.40 | 1.34 | — | — | — | $10.05 | 15.38% | 2.02% | (0.62)% | 66% |
| $131 |
|
| R Class | | | | | | | | | | | | |
| 2014 | $14.77 | 0.02 | 1.74 | 1.76 | — | (1.60) | (1.60) | $14.93 | 13.20% | 1.50% | (0.12)% | 97% |
| $117 |
|
| 2013 | $11.95 | 0.02 | 2.87 | 2.89 | (0.07) | — | (0.07) | $14.77 | 24.27% | 1.50% | 0.14% | 73% |
| $731 |
|
| 2012 | $10.65 | 0.02 | 1.29 | 1.31 | (0.01) | — | (0.01) | $11.95 | 12.29% | 1.51% | 0.20% | 59% |
| $558 |
|
| 2011 | $10.12 | 0.01 | 0.52 | 0.53 | —(3) | — | —(3) | $10.65 | 5.26% | 1.50% | 0.04% | 91% |
| $480 |
|
| 2010 | $8.73 | (0.01) | 1.40 | 1.39 | — | — | — | $10.12 | 15.92% | 1.52% | (0.12)% | 66% |
| $24 |
|
|
|
| Notes to Financial Highlights |
| |
| (1) | Computed using average shares outstanding throughout the period. |
| |
| (2) | Total returns are calculated based on the net asset value of the last business day and do not reflect applicable sales charges, if any. Total returns for periods less than one year are not annualized. |
| |
| (3) | Per-share amount was less than $0.005. |
See Notes to Financial Statements.
|
|
| Report of Independent Registered Public Accounting Firm |
To the Board of Directors and Shareholders of
American Century Mutual Funds, Inc.:
We have audited the accompanying statement of assets and liabilities, including the schedule of investments, of Focused Growth Fund (the “Fund”), one of the funds constituting American Century Mutual Funds, Inc., as of October 31, 2014, and the related statement of operations for the year then ended, the statements of changes in net assets for each of the two years in the period then ended, and the financial highlights for each of the periods presented. These financial statements and financial highlights are the responsibility of the Fund's management. Our responsibility is to express an opinion on these financial statements and financial highlights based on our audits.
We conducted our audits in accordance with the standards of the Public Company Accounting Oversight Board (United States). Those standards require that we plan and perform the audit to obtain reasonable assurance about whether the financial statements and financial highlights are free of material misstatement. The Fund is not required to have, nor were we engaged to perform, an audit of its internal control over financial reporting. Our audits included consideration of internal control over financial reporting as a basis for designing audit procedures that are appropriate in the circumstances, but not for the purpose of expressing an opinion on the effectiveness of the Fund's internal control over financial reporting. Accordingly, we express no such opinion. An audit also includes examining, on a test basis, evidence supporting the amounts and disclosures in the financial statements, assessing the accounting principles used and significant estimates made by management, as well as evaluating the overall financial statement presentation. Our procedures included confirmation of securities owned as of October 31, 2014, by correspondence with the custodian and brokers; where replies were not received from brokers, we performed other auditing procedures. We believe that our audits provide a reasonable basis for our opinion.
In our opinion, the financial statements and financial highlights referred to above present fairly, in all material respects, the financial position of Focused Growth Fund of American Century Mutual Funds, Inc. as of October 31, 2014, the results of its operations for the year then ended, the changes in its net assets for each of the two years in the period then ended, and the financial highlights for each of the periods presented, in conformity with accounting principles generally accepted in the United States of America.
DELOITTE & TOUCHE LLP
Kansas City, Missouri
December 17, 2014
The Board of Directors
The individuals listed below serve as directors of the funds. Each director will continue to serve in this capacity until death, retirement, resignation or removal from office. The board has adopted a mandatory retirement age for directors who are not “interested persons,” as that term is defined in the Investment Company Act (independent directors). Independent directors shall retire by December 31 of the year in which they reach their 75th birthday.
Mr. Thomas is an “interested person” because he currently serves as President and Chief Executive Officer of American Century Companies, Inc. (ACC), the parent company of American Century Investment Management, Inc. (ACIM or the advisor). Mr. Fink is treated as an “interested person” because of his recent employment with ACC and American Century Services, LLC (ACS). The other directors (more than three-fourths of the total number) are independent. They are not employees, directors or officers of, and have no financial interest in, ACC or any of its wholly owned, direct or indirect, subsidiaries, including ACIM, American Century Investment Services, Inc. (ACIS) and ACS, and they do not have any other affiliations, positions, or relationships that would cause them to be considered “interested persons” under the Investment Company Act. The directors serve in this capacity for seven (in the case of Mr. Thomas, 15) registered investment companies in the American Century Investments family of funds.
The following table presents additional information about the directors. The mailing address for each director is 4500 Main Street, Kansas City, Missouri 64111.
|
| | | | | |
Name
(Year of Birth) | Position(s) Held with Funds | Length of Time Served | Principal Occupation(s) During Past 5 Years | Number of American Century Portfolios Overseen by Director | Other Directorships Held During Past
5 Years |
| Independent Directors | | | | |
Thomas A. Brown
(1940) | Director | Since 1980 | Managing Member, Associated Investments, LLC (real estate investment company); Brown Cascade Properties, LLC (real estate investment company) (2001 to 2009) | 73 | None |
Andrea C. Hall
(1945) | Director | Since 1997 | Retired | 73 | None |
Jan M. Lewis
(1957) | Director | Since 2011 | Retired; President and Chief Executive Officer, Catholic Charities of Northeast Kansas (human services organization) (2006 to 2013) | 73 | None |
James A. Olson
(1942) | Director and Chairman of the Board | Since 2007 (Chairman since 2014) | Member, Plaza Belmont LLC (private equity fund manager) | 73 | Saia, Inc. (2002 to 2012) and EPR Properties (2003 to 2013) |
|
| | | | | |
Name
(Year of Birth) | Position(s) Held with Funds | Length of Time Served | Principal Occupation(s) During Past 5 Years | Number of American Century Portfolios Overseen by Director | Other Directorships Held During Past
5 Years |
| Independent Directors | | | | |
M. Jeannine Strandjord
(1945) | Director | Since 1994 | Retired | 73 | Euronet Worldwide Inc.; Charming Shoppes, Inc. (2006 to 2010); and DST Systems Inc. (1996 to 2012) |
John R. Whitten
(1946) | Director | Since 2008 | Retired | 73 | Rudolph Technologies, Inc. |
Stephen E. Yates
(1948) | Director | Since 2012 | Retired; Executive Vice President, Technology & Operations, KeyCorp. (computer services) (2004 to 2010) | 73 | Applied Industrial Technologies, Inc. (2001 to 2010) |
| Interested Directors | | | | |
Barry Fink
(1955) | Director | Since 2012 | Retired; Executive Vice President, ACC (September 2007 to February 2013); President, ACS (October 2007 to February 2013); Chief Operating Officer, ACC (September 2007 to November 2012) | 73 | None |
Jonathan S. Thomas
(1963) | Director and President | Since 2007 | President and Chief Executive Officer, ACC (March 2007 to present). Also serves as Chief Executive Officer, ACS; Executive Vice President, ACIM; Director, ACC, ACIM and other ACC subsidiaries | 118 | BioMed Valley Discoveries, Inc. |
The Statement of Additional Information has additional information about the fund's directors and is available without charge, upon request, by calling 1-800-345-2021.
Officers
The following table presents certain information about the executive officers of the funds. Each officer serves as an officer for each of the 15 investment companies in the American Century family of funds, unless otherwise noted. No officer is compensated for his or her service as an officer of the funds. The listed officers are interested persons of the funds and are appointed or re-appointed on an annual basis. The mailing address for each officer listed below is 4500 Main Street, Kansas City, Missouri 64111.
|
| | |
Name (Year of Birth) | Offices with the Funds | Principal Occupation(s) During the Past Five Years |
Jonathan S.
Thomas
(1963) | Director and
President
since 2007 | President and Chief Executive Officer, ACC (March 2007 to present). Also serves as Chief Executive Officer, ACS; Executive Vice President, ACIM; Director, ACC, ACIM and other ACC subsidiaries |
Amy D. Shelton
(1964) | Chief Compliance
Officer since 2014 | Chief Compliance Officer, American Century funds, (March 2014 to present); Chief Compliance Officer, ACIM (February 2014 to present); Chief Compliance Officer, ACIS (October 2009 to present); Vice President, Client Interactions and Marketing, ACIS (February 2013 to January 2014); Director, Client Interactions and Marketing, ACIS (June 2007 to January 2013). Also serves as Vice President, ACIS |
Charles A.
Etherington
(1957) | General Counsel
since 2007 and
Senior Vice
President since 2006 | Attorney, ACC (February 1994 to present); Vice President, ACC (November 2005 to present); General Counsel, ACC (March 2007 to present). Also serves as General Counsel, ACIM, ACS, ACIS and other ACC subsidiaries; and Senior Vice President, ACIM and ACS |
C. Jean Wade
(1964) | Vice President,
Treasurer and
Chief Financial
Officer since 2012 | Vice President, ACS (February 2000 to present) |
Robert J.
Leach
(1966) | Vice President
since 2006 and
Assistant Treasurer
since 2012 | Vice President, ACS (February 2000 to present) |
David H.
Reinmiller
(1963) | Vice President
since 2000 | Attorney, ACC (January 1994 to present); Associate General Counsel, ACC (January 2001 to present). Also serves as Vice President, ACIM and ACS |
Ward D.
Stauffer
(1960) | Secretary
since 2005 | Attorney, ACC (June 2003 to present) |
|
|
| Approval of Management Agreement |
At a meeting held on June 18, 2014, the Fund’s Board of Directors unanimously approved the renewal of the management agreement pursuant to which American Century Investment Management, Inc. (the “Advisor”) acts as the investment advisor for the Fund. Under Section 15(c) of the Investment Company Act, contracts for investment advisory services are required to be reviewed, evaluated, and approved by a majority of a fund’s directors (the “Directors”), including a majority of the independent Directors, each year.
Prior to its consideration of the renewal of the management agreement, the Board requested and reviewed extensive data and information compiled by the Advisor and certain independent providers of evaluation data concerning the Fund and the services provided to the Fund by the Advisor. This review was in addition to the oversight and evaluation undertaken by the Board and its committees on a continuous basis and the information received was supplemental to the extensive information that the Board and its committees receive and consider throughout the year.
In connection with its consideration of the renewal of the management agreement, the Board’s review and evaluation of the services provided by the Advisor included, but was not limited to, the following:
| |
| • | the nature, extent, and quality of investment management, shareholder services, and other services provided by the Advisor to the Fund; |
| |
| • | the wide range of other programs and services the Advisor provides to the Fund and its shareholders on a routine and non-routine basis; |
| |
| • | the Fund’s investment performance compared to appropriate benchmarks and/or a peer group of other mutual funds with similar investment objectives and strategies; |
| |
| • | the cost of owning the Fund compared to the cost of owning similar funds; |
| |
| • | the Advisor’s compliance policies, procedures, and regulatory experience; |
| |
| • | financial data showing the cost of services provided to the Fund, the profitability of the Fund to the Advisor, and the overall profitability of the Advisor; |
| |
| • | possible economies of scale associated with the Advisor’s management of the Fund and other accounts under its management; |
| |
| • | the services provided and charges to other investment management clients of the Advisor; |
| |
| • | acquired fund fees and expenses; and |
| |
| • | any collateral benefits derived by the Advisor from the management of the Fund. |
In keeping with its practice, the Board held two in-person meetings and one telephonic meeting to review and discuss the information provided. The independent Directors also had the benefit of the advice of their independent counsel throughout the process.
Factors Considered
The Directors considered all of the information provided by the Advisor, the independent data providers, and independent counsel, and evaluated such information for the Fund. In connection with their review, the Directors did not identify any single factor as being all-important or controlling, and each Director may have attributed different levels of importance to different factors. In deciding to renew the management agreement, the Board based its decision on a number of factors, including the following:
Nature, Extent and Quality of Services — Generally. Under the management agreement, the Advisor is responsible for providing or arranging for all services necessary for the operation of the Fund. The Board noted that under the management agreement, the Advisor provides or arranges at its own expense a wide variety of services including:
| |
| • | constructing and designing the Fund |
| |
| • | portfolio research and security selection |
| |
| • | initial capitalization/funding |
| |
| • | daily valuation of the Fund’s portfolio |
| |
| • | shareholder servicing and transfer agency, including shareholder confirmations, recordkeeping, and communications |
| |
| • | legal services (except the independent Directors’ counsel) |
| |
| • | regulatory and portfolio compliance |
| |
| • | marketing and distribution (except Rule 12b-1 plans) |
The Board noted that many of these services have expanded over time both in terms of quantity and complexity in response to shareholder demands, competition in the industry, changing distribution channels, and the changing regulatory environment.
Investment Management Services. The nature of the investment management services provided to the Fund is quite complex and allows Fund shareholders access to professional money management, instant diversification of their investments within an asset class, the opportunity to easily diversify among asset classes by investing in or exchanging among various American Century Investments funds, and liquidity. In evaluating investment performance, the Board expects the Advisor to manage the Fund in accordance with its investment objectives and approved strategies. Further, the Directors recognize that the Advisor has an obligation to monitor trading activities, and in particular to seek the best execution of fund trades, and to evaluate the use of and payment for research. In providing these services, the Advisor utilizes teams of investment professionals (portfolio managers, analysts, research assistants, and securities traders) who require extensive information technology, research, training, compliance and other systems to conduct their business. The Board, directly and through its Fund Performance Review Committee, regularly reviews investment performance information for the Fund, together with comparative information for appropriate benchmarks and/or peer groups of similarly-managed funds, over different time horizons. The Directors also review detailed performance information during the management agreement approval process. If performance concerns are identified, the Fund receives special reviews until performance improves, during which the Board discusses with the Advisor the reasons for such results (e.g., market conditions, security selection) and any efforts being undertaken to improve performance. The Fund’s performance was below its benchmark for the one-, three-, and five-year periods reviewed by the Board. The Board discussed the Fund’s performance with the Advisor and was satisfied with the efforts being undertaken by the Advisor. The Board found the investment management services provided by the Advisor to the Fund to be satisfactory and consistent with the management agreement.
Shareholder and Other Services. Under the management agreement, the Advisor provides the Fund with a comprehensive package of transfer agency, shareholder, and other services. The Board, directly and through various committees of the Board, regularly reviews reports and evaluations of such services at its regular meetings. These reports include, but are not limited to, information regarding the operational efficiency and accuracy of the shareholder and transfer agency services provided, staffing levels, shareholder satisfaction (as measured by external as well as internal sources), technology support, new products and services offered to Fund shareholders, securities trading activities, portfolio valuation services, auditing services, and legal and operational compliance activities. Certain aspects of shareholder and transfer agency service level efficiency and the quality of securities trading activities are measured by independent third party providers
and are presented in comparison to other fund groups not managed by the Advisor. The Board found the services provided by the Advisor to the Fund under the management agreement to be competitive and of high quality.
Costs of Services and Profitability. The Advisor provides detailed information concerning its cost of providing various services to the Fund, its profitability in managing the Fund (pre- and post-distribution), its overall profitability, and its financial condition. The Directors have reviewed with the Advisor the methodology used to prepare this financial information. The financial information regarding the Advisor is considered in evaluating the Advisor’s financial condition, its ability to continue to provide services under the management agreement, and the reasonableness of the current management fee. The Board concluded that the Advisor’s profits were reasonable in light of the services provided to the Fund.
Ethics. The Board generally considers the Advisor’s commitment to providing quality services to shareholders and to conducting its business ethically. They noted that the Advisor’s practices generally meet or exceed industry best practices.
Economies of Scale. The Board also reviewed information provided by the Advisor regarding the possible existence of economies of scale in connection with the management of the Fund. The Board concluded that economies of scale are difficult to measure and predict with precision, especially on a fund-by-fund basis. The Board concluded that the Advisor is appropriately sharing economies of scale through its competitive fee structure, offering competitive fees from fund inception, and through reinvestment in its business to provide shareholders additional content and services.
Comparison to Other Funds’ Fees. The management agreement provides that the Fund pays the Advisor a single, all-inclusive (or unified) management fee for providing all services necessary for the management and operation of the Fund, other than brokerage expenses, taxes, interest, extraordinary expenses, and the fees and expenses of the Fund’s independent directors (including their independent legal counsel) and expenses incurred in connection with the provision of shareholder services and distribution services under a plan adopted pursuant to Rule 12b-1 under the 1940 Act. Under the unified fee structure, the Advisor is responsible for providing all investment advisory, custody, audit, administrative, compliance, recordkeeping, marketing and shareholder services, or arranging and supervising third parties to provide such services. By contrast, most other funds are charged a variety of fees, including an investment advisory fee, a transfer agency fee, an administrative fee, distribution charges and other expenses. Other than their investment advisory fees and any applicable Rule 12b-1 distribution fees, all other components of the total fees charged by these other funds may be increased without shareholder approval. The Board believes the unified fee structure is a benefit to Fund shareholders because it clearly discloses to shareholders the cost of owning Fund shares, and, since the unified fee cannot be increased without a vote of Fund shareholders, it shifts to the Advisor the risk of increased costs of operating the Fund and provides a direct incentive to minimize administrative inefficiencies. Part of the Board’s analysis of fee levels involves reviewing certain evaluative data compiled by an independent provider comparing the Fund’s unified fee to the total expense ratios of its peers. The unified fee charged to shareholders of the Fund was below the median of the total expense ratios of the Fund’s peer expense universe and was within the range of its peer expense group. The Board and the Advisor agreed to certain adjustments regarding the breakpoints in the Fund's unified management fee schedule, including changing the number of breakpoints and the investment amount that applies to each breakpoint, beginning August 1, 2014. The Board concluded that the management fee paid by the Fund to the Advisor under the management agreement is reasonable in light of the services provided to the Fund.
Comparison to Fees and Services Provided to Other Clients of the Advisor. The Board also requested and received information from the Advisor concerning the nature of the services, fees, costs and profitability of its advisory services to advisory clients other than the Fund. They observed that these varying types of client accounts require different services and involve different regulatory and entrepreneurial risks than the management of the Fund. The Board analyzed this
information and concluded that the fees charged and services provided to the Fund were reasonable by comparison.
Collateral or “Fall-Out” Benefits Derived by the Advisor. The Board considered the existence of collateral benefits the Advisor may receive as a result of its relationship with the Fund. They concluded that the Advisor’s primary business is managing mutual funds and it generally does not use fund or shareholder information to generate profits in other lines of business, and therefore does not derive any significant collateral benefits from them. The Board noted that the Advisor receives proprietary research from broker-dealers that execute fund portfolio transactions and concluded that this research is likely to benefit Fund shareholders. The Board also determined that the Advisor is able to provide investment management services to certain clients other than the Fund, at least in part, due to its existing infrastructure built to serve the fund complex. The Board concluded, however, that the assets of those other clients are not material to the analysis and, where applicable, may be included with the assets of the Fund to determine breakpoints in the management fee schedule.
Existing Relationship. The Board also considered whether there was any reason for not continuing the existing arrangement with the Advisor. In this regard, the Board was mindful of the potential disruptions of the Fund’s operations and various risks, uncertainties, and other effects that could occur as a result of a decision not to continue such relationship. In particular, the Board recognized that most shareholders have invested in the Fund on the strength of the Advisor’s industry standing and reputation and in the expectation that the Advisor will have a continuing role in providing advisory services to the Fund.
Conclusion of the Directors. As a result of this process, the Board, including all of the independent Directors, taking into account all of the factors discussed above and the information provided by the Advisor and others, concluded that the management agreement between the Fund and the Advisor is fair and reasonable in light of the services provided and should be renewed.
Retirement Account Information
As required by law, distributions you receive from certain IRAs are subject to federal income tax withholding, unless you elect not to have withholding apply. Tax will be withheld on the total amount withdrawn even though you may be receiving amounts that are not subject to withholding, such as nondeductible contributions. In such case, excess amounts of withholding could occur. You may adjust your withholding election so that a greater or lesser amount will be withheld.
If you don’t want us to withhold on this amount, you must notify us to not withhold the federal income tax. You may notify us in writing or in certain situations by telephone or through other electronic means. For systematic withdrawals, your withholding election will remain in effect until revoked or changed by filing a new election. You have the right to revoke your election at any time.
Remember, even if you elect not to have income tax withheld, you are liable for paying income tax on the taxable portion of your withdrawal. If you elect not to have income tax withheld or you don’t have enough income tax withheld, you may be responsible for payment of estimated tax. You may incur penalties under the estimated tax rules if your withholding and estimated tax payments are not sufficient. You can reduce or defer the income tax on a distribution by directly or indirectly rolling such distribution over to another IRA or eligible plan. You should consult your tax advisor for additional information.
State tax will be withheld if, at the time of your distribution, your address is within one of the mandatory withholding states and you have federal income tax withheld (or as otherwise required by state law). State taxes will be withheld from your distribution in accordance with the respective state rules.
Distributions you receive from 403(b), 457 and qualified plans are subject to special tax and withholding rules. Your plan administrator or plan sponsor is required to provide you with a special tax notice explaining those rules at the time you request a distribution. If applicable, federal and/or state taxes may be withheld from your distribution amount.
Proxy Voting Policies
A description of the policies that the fund's investment advisor uses in exercising the voting rights associated with the securities purchased and/or held by the fund is available without charge, upon request, by calling 1-800-345-2021. It is also available on the "About Us" page of American Century Investments’ website at americancentury.com and on the Securities and Exchange Commission’s website at sec.gov. Information regarding how the investment advisor voted proxies relating to portfolio securities during the most recent 12-month period ended June 30 is available on the "About Us" page at americancentury.com. It is also available at sec.gov.
Quarterly Portfolio Disclosure
The fund files its complete schedule of portfolio holdings with the Securities and Exchange Commission (SEC) for the first and third quarters of each fiscal year on Form N-Q. The fund’s Forms N-Q are available on the SEC’s website at sec.gov, and may be reviewed and copied at the SEC’s Public Reference Room in Washington, DC. Information on the operation of the Public Reference Room may be obtained by calling 1-800-SEC-0330. The fund also makes its complete schedule of portfolio holdings for the most recent quarter of its fiscal year available on its
website at americancentury.com and, upon request, by calling 1-800-345-2021.
Other Tax Information
The following information is provided pursuant to provisions of the Internal Revenue Code.
The fund hereby designates up to the maximum amount allowable as qualified dividend income for the fiscal year ended October 31, 2014.
For corporate taxpayers, the fund hereby designates $65,749, or up to the maximum amount allowable, of ordinary income distributions paid during the fiscal year ended October 31, 2014 as qualified for the corporate dividends received deduction.
The fund hereby designates $16,292 as qualified short-term capital gain distributions for purposes of Internal Revenue Code Section 871 for the fiscal year ended October 31, 2014.
The fund hereby designates $2,055,486, or up to the maximum amount allowable, as long-term capital gain distributions for the fiscal year ended October 31, 2014.
The fund utilized earnings and profits of $278,387 distributed to shareholders on redemption of shares as part of the dividends paid deduction (tax equalization).
|
| | |
| |
| | | |
| Contact Us | americancentury.com | |
| Automated Information Line | 1-800-345-8765 | |
| Investor Services Representative | 1-800-345-2021 or 816-531-5575 | |
| Investors Using Advisors | 1-800-378-9878 | |
| Business, Not-For-Profit, Employer-Sponsored Retirement Plans | 1-800-345-3533 | |
| Banks and Trust Companies, Broker-Dealers, Financial Professionals, Insurance Companies | 1-800-345-6488 | |
| Telecommunications Relay Service for the Deaf | 711 | |
| | | |
| American Century Mutual Funds, Inc. | |
| | | |
Investment Advisor: American Century Investment Management, Inc. Kansas City, Missouri | |
| | | |
| This report and the statements it contains are submitted for the general information of our shareholders. The report is not authorized for distribution to prospective investors unless preceded or accompanied by an effective prospectus. | |
| | | |
©2014 American Century Proprietary Holdings, Inc. All rights reserved.
CL-ANN-84000 1412 | |
|
| |
| ANNUAL REPORT | OCTOBER 31, 2014 |
Fundamental Equity Fund
|
| |
| President's Letter | |
| Performance | |
| Portfolio Commentary | |
| Fund Characteristics | |
| Shareholder Fee Example | |
| Schedule of Investments | |
| Statement of Assets and Liabilities | |
| Statement of Operations | |
| Statement of Changes in Net Assets. | |
| Notes to Financial Statements | |
| Financial Highlights | |
| Report of Independent Registered Public Accounting Firm | |
| Management | |
| Approval of Management Agreement | |
| Additional Information | |
Any opinions expressed in this report reflect those of the author as of the date of the report, and do not necessarily represent the opinions of American Century Investments® or any other person in the American Century Investments organization. Any such opinions are subject to change at any time based upon market or other conditions and American Century Investments disclaims any responsibility to update such opinions. These opinions may not be relied upon as investment advice and, because investment decisions made by American Century Investments funds are based on numerous factors, may not be relied upon as an indication of trading intent on behalf of any American Century Investments fund. Security examples are used for representational purposes only and are not intended as recommendations to purchase or sell securities. Performance information for comparative indices and securities is provided to American Century Investments by third party vendors. To the best of American Century Investments’ knowledge, such information is accurate at the time of printing.
|
| |
| Dear Investor:
Thank you for reviewing this annual report for the 12 months ended October 31, 2014. It provides investment performance and portfolio information for the reporting period, plus longer-term historical performance data.
Annual reports remain important vehicles for conveying information about fund returns, including market and economic factors that affected performance during the reporting period. For additional, updated investment and market insights, we encourage you to visit our website, americancentury.com. |
| Jonathan Thomas |
Favorable Fiscal Year for U.S. Stocks and Bonds
Mostly stimulative monetary policies by central banks and expectations of longer-term economic improvement, interspersed with concerns about nearer-term weaker-than-expected global economic data and geopolitical conflicts, helped drive financial market returns during the reporting period. We believe the combination of longer-term optimism about U.S. economic growth, low costs of capital, and continued central bank stimulus (even as the U.S. Federal Reserve’s latest monthly bond purchase program ended) helped persuade investors to seek risk and yield, which benefited U.S. stocks and bonds. The S&P 500 Index gained 17.27% during the 12 months. The 30-year U.S. Treasury bond was close behind, returning 15.44%, according to Barclays. U.S. real estate investment trusts (REITs), whose shares combine performance attributes of stocks and bonds, benefited from both—the MSCI U.S. REIT Index advanced 19.19%.
U.S. market benchmark returns generally outpaced their non-U.S. counterparts. The U.S. was perceived by investors as a relative bastion of growth, stability, and potentially attractive yields compared with most of the rest of the world, so capital flows generally favored U.S. assets. These capital flows, along with weaker-than-expected global growth, lower-than-expected global inflation, and falling commodity and energy prices, helped keep long-term interest rates and other corporate costs low. U.S. stocks just completed a solid third-quarter earnings reporting season, though questions remain about next year’s revenues, given this year’s slowdown in global economic growth and concerns about how far it could extend into 2015.
We believe continuing global economic and geopolitical uncertainties could continue to support the relative appeal of U.S. assets in coming months. But the end of the U.S. Federal Reserve’s monthly bond-buying program and the still-looming possibility of higher interest rates in 2015 point to potential U.S. market volatility ahead. In this environment, we continue to believe in a disciplined, diversified, long-term investment approach, using professionally managed stock and bond portfolios for meeting financial goals. We appreciate your continued trust in us.
Sincerely,
Jonathan Thomas
President and Chief Executive Officer
American Century Investments
|
| | | | | |
| Total Returns as of October 31, 2014 |
| | | | Average Annual Returns | |
| | Ticker Symbol | 1 year | 5 years | Since Inception | Inception Date |
| A Class | AFDAX | | | | 11/30/04 |
| No sales charge* | | 16.76% | 16.12% | 9.42% | |
| With sales charge* | | 10.05% | 14.76% | 8.77% | |
| S&P 500 Index | — | 17.27% | 16.68% | 7.84% | — |
| Investor Class | AFDIX | 17.06% | 16.42% | 9.39% | 7/29/05 |
| Institutional Class | AFEIX | 17.29% | 16.65% | 9.61% | 7/29/05 |
| B Class | AFDBX | | | | 11/30/04 |
| No sales charge* | | 15.91% | 15.25% | 8.59% | |
| With sales charge* | | 11.91% | 15.14% | 8.59% | |
| C Class | AFDCX | 15.90% | 15.26% | 8.60% | 11/30/04 |
| R Class | AFDRX | 16.45% | 15.83% | 8.84% | 7/29/05 |
* Sales charges include initial sales charges and contingent deferred sales charges (CDSCs), as applicable. A Class shares have a 5.75% maximum initial sales charge and may be subject to a maximum CDSC of 1.00%. B Class shares redeemed within six years of purchase are subject to a CDSC that declines from 5.00% during the first year to 0.00% after the sixth year. C Class shares redeemed within 12 months of purchase are subject to a maximum CDSC of 1.00%. The SEC requires that mutual funds provide performance information net of maximum sales charges in all cases where charges could be applied.
Data presented reflect past performance. Past performance is no guarantee of future results. Current performance may be higher or lower than the performance shown. Investment return and principal value will fluctuate, and redemption value may be more or less than original cost. Data assumes reinvestment of dividends and capital gains, and none of the charts reflect the deduction of taxes that a shareholder would pay on fund distributions or the redemption of fund shares. To obtain performance data current to the most recent month end, please call 1-800-345-2021 or visit americancentury.com. For additional information about the fund, please consult the prospectus.
|
|
| Growth of $10,000 Over Life of Class |
| $10,000 investment made November 30, 2004 |
| Performance for other share classes will vary due to differences in fee structure. |
|
| |
| Value on October 31, 2014 |
| | A Class — $23,032 |
| |
| | S&P 500 Index — $21,145 |
| |
| |
| * | From November 30, 2004, the A Class’s inception date. Not annualized. The A Class’s initial investment is $9,425 to reflect the maximum 5.75% initial sales charge. |
|
| | | | | |
| Total Annual Fund Operating Expenses | |
| Investor Class | Institutional Class | A Class | B Class | C Class | R Class |
| 1.01% | 0.81% | 1.26% | 2.01% | 2.01% | 1.51% |
The total annual fund operating expenses shown is as stated in the fund’s prospectus current as of the date of this report. The prospectus may vary from the expense ratio shown elsewhere in this report because it is based on a different time period, includes acquired fund fees and expenses, and, if applicable, does not include fee waivers or expense reimbursements.
Data presented reflect past performance. Past performance is no guarantee of future results. Current performance may be higher or lower than the performance shown. Investment return and principal value will fluctuate, and redemption value may be more or less than original cost. Data assumes reinvestment of dividends and capital gains, and none of the charts reflect the deduction of taxes that a shareholder would pay on fund distributions or the redemption of fund shares. To obtain performance data current to the most recent month end, please call 1-800-345-2021 or visit americancentury.com. For additional information about the fund, please consult the prospectus.
Portfolio Managers: Greg Woodhams, Prescott LeGard, Justin Brown, and Joe Reiland
Performance Summary
Fundamental Equity returned 17.06%* for the 12 months ended October 31, 2014, compared with the 17.27% return of the portfolio’s benchmark, the S&P 500 Index.
U.S. stock indices delivered solid returns during the reporting period. Within the S&P 500 Index, health care was the top-performing sector on a total-return basis, gaining nearly 30%. Information technology also outpaced the benchmark average, returning nearly 26%. Utilities and financials also outperformed the benchmark average. No sectors lost ground, although energy, telecommunication services, and consumer discretionary posted more modest, single-digit returns.
Fundamental Equity received positive contributions to absolute return from all sectors, led by information technology and health care. Telecommunication services, utilities, and energy contributed the least. Stock decisions in the health care and information technology sectors detracted most from performance relative to the S&P 500. Stock selection in the consumer staples, industrials, and consumer discretionary sectors aided results versus the benchmark.
Health Care and Information Technology Led Detractors
Stock selection in the health care sector was the largest source of underperformance for the portfolio, driven by positioning among pharmaceuticals firms. Major detractors in the sector included Pfizer, which declined after AstraZeneca rejected its takeover bid. Not owning pharmaceutical company Allergan detracted as its shares appreciated after the company became the object of a buyout offer from Valeant Pharmaceuticals.
The information technology sector also hampered relative performance, largely due to stock choices. An overweight allocation to communication chipmaker QUALCOMM detracted as the company suffered from a competitive business environment, issues with royalty payments, and slower growth in China. An underweight position in software giant Microsoft also detracted. The company lowered guidance, consistent with our less sanguine outlook for the business. Nevertheless, the stock benefited from multiple expansion, excitement around moving Office365 to a subscription model, and the announcement of the Windows 10 operating system.
On an individual security basis, Occidental Petroleum was a significant relative detractor. Like other oil and gas exploration firms, Occidental suffered from the sharp decline in oil prices. Other notable individual detractors included aerospace giant Boeing, specialty retailer Pier 1 Imports, moneycenter bank Citigroup, and media company Viacom.
Consumer Staples and Industrials Holdings Aided Results
Stock decisions in the consumer staples sector contributed most to relative performance, driven by positioning in the food and staples retailing and food products industries. An overweight allocation to grocery chain Kroger was a key contributor. The company reported strong earnings and sales growth, increased its dividend, and raised guidance. Avoiding benchmark component Whole Foods also benefited results, as investors were concerned about the grocery chain’s price-reduction strategy on its margins. Other key contributors in the sector were soft drink manufacturer Dr Pepper Snapple Group and specialty coffee and tea company Keurig Green Mountain. We ultimately eliminated our stake in Keurig.
| |
| * | All fund returns referenced in this commentary are for Investor Class shares. Performance for other share classes will vary due to differences in fee structure; when Investor Class performance exceeds that of the fund’s benchmark, other share classes may not. See page 3 for returns for all share classes. |
The industrials sector provided solid contributions due to stock selection in the aerospace and defense and road and rail industries. An overweight to rail transportation company Union Pacific contributed positively. Because new sources of crude often don’t have a pipeline infrastructure to the coasts, rail has emerged as an important means of crude transport. In the aerospace and defense segment, shares of General Dynamics rose steadily this year, as did those of Lockheed Martin and Northrop Grumman.
Elsewhere, one of the leading individual contributors to relative results came from having no exposure to Amazon.com, a component of the benchmark. The internet retailer is struggling with rising capital expenditures, falling margins, and investor concern about the company’s profitability. In the materials sector, an overweight in chemicals firm LyondellBasell Industries was a leading contributor thanks to improving pricing for its products and cost advantages resulting from access to cheaper feedstocks. It was also beneficial to be underrepresented in shares of industrial conglomerate General Electric and information technology services firm International Business Machines. We eventually eliminated our position in IBM.
Outlook
Fundamental Equity generally invests in larger-sized companies, although it may invest in companies of any size. We use a quantitative model that combines fundamental measures of a stock's value and growth potential. The fund seeks to provide better returns than, and a dividend yield comparable to, its benchmark, the S&P 500 Index, without taking on significant additional risk.
As of October 31, 2014, the fund’s largest sector overweight was in information technology, driven by positioning among communications equipment and computers and peripherals companies. The key underweight was in financials, resulting primarily from limited exposure to diversified financial services firms and real estate investment trusts. Regardless of market conditions, we will remain focused on our methodology of identifying attractively valued companies with growth characteristics.
|
| |
| OCTOBER 31, 2014 | |
| Top Ten Holdings | % of net assets |
| Exxon Mobil Corp. | 3.8% |
| Apple, Inc. | 3.8% |
| Wells Fargo & Co. | 2.8% |
| JPMorgan Chase & Co. | 2.6% |
| Pfizer, Inc. | 2.3% |
| Johnson & Johnson | 2.2% |
| Comcast Corp., Class A | 2.1% |
| Home Depot, Inc. (The) | 1.9% |
| Visa, Inc., Class A | 1.8% |
| Union Pacific Corp. | 1.8% |
| | |
| Top Five Industries | % of net assets |
| Oil, Gas and Consumable Fuels | 7.9% |
| Banks | 6.4% |
| Pharmaceuticals | 5.6% |
| Technology Hardware, Storage and Peripherals | 5.1% |
| Media | 4.2% |
| | |
| Types of Investments in Portfolio | % of net assets |
| Common Stocks | 99.3% |
| Temporary Cash Investments | 0.8% |
| Other Assets and Liabilities | (0.1)% |
Fund shareholders may incur two types of costs: (1) transaction costs, including sales charges (loads) on purchase payments and redemption/exchange fees; and (2) ongoing costs, including management fees; distribution and service (12b-1) fees; and other fund expenses. This example is intended to help you understand your ongoing costs (in dollars) of investing in your fund and to compare these costs with the ongoing cost of investing in other mutual funds.
The example is based on an investment of $1,000 made at the beginning of the period and held for the entire period from May 1, 2014 to October 31, 2014.
Actual Expenses
The table provides information about actual account values and actual expenses for each class. You may use the information, together with the amount you invested, to estimate the expenses that you paid over the period. First, identify the share class you own. Then simply divide your account value by $1,000 (for example, an $8,600 account value divided by $1,000 = 8.6), then multiply the result by the number under the heading “Expenses Paid During Period” to estimate the expenses you paid on your account during this period.
If you hold Investor Class shares of any American Century Investments fund, or Institutional Class shares of the American Century Diversified Bond Fund, in an American Century Investments account (i.e., not a financial intermediary or retirement plan account), American Century Investments may charge you a $12.50 semiannual account maintenance fee if the value of those shares is less than $10,000. We will redeem shares automatically in one of your accounts to pay the $12.50 fee. In determining your total eligible investment amount, we will include your investments in all personal accounts (including American Century Investments Brokerage accounts) registered under your Social Security number. Personal accounts include individual accounts, joint accounts, UGMA/UTMA accounts, personal trusts, Coverdell Education Savings Accounts and IRAs (including traditional, Roth, Rollover, SEP-, SARSEP- and SIMPLE-IRAs), and certain other retirement accounts. If you have only business, business retirement, employer-sponsored or American Century Investments Brokerage accounts, you are currently not subject to this fee. If you are subject to the Account Maintenance Fee, your account value could be reduced by the fee amount.
Hypothetical Example for Comparison Purposes
The table also provides information about hypothetical account values and hypothetical expenses based on the actual expense ratio of each class of your fund and an assumed rate of return of 5% per year before expenses, which is not the actual return of a fund’s share class. The hypothetical account values and expenses may not be used to estimate the actual ending account balance or expenses you paid for the period. You may use this information to compare the ongoing costs of investing in your fund and other funds. To do so, compare this 5% hypothetical example with the 5% hypothetical examples that appear in the shareholder reports of the other funds.
Please note that the expenses shown in the table are meant to highlight your ongoing costs only and do not reflect any transactional costs, such as sales charges (loads) or redemption/exchange fees. Therefore, the table is useful in comparing ongoing costs only, and will not help you determine the relative total costs of owning different funds. In addition, if these transactional costs were included, your costs would have been higher.
|
| | | | |
| Beginning
Account Value
5/1/14 | Ending
Account Value
10/31/14 | Expenses Paid
During Period(1) 5/1/14 - 10/31/14 |
Annualized
Expense Ratio(1) |
| Actual | | | | |
| Investor Class | $1,000 | $1,085.10 | $5.26 | 1.00% |
| Institutional Class | $1,000 | $1,086.40 | $4.21 | 0.80% |
| A Class | $1,000 | $1,084.30 | $6.57 | 1.25% |
| B Class | $1,000 | $1,079.80 | $10.48 | 2.00% |
| C Class | $1,000 | $1,080.40 | $10.49 | 2.00% |
| R Class | $1,000 | $1,082.60 | $7.87 | 1.50% |
| Hypothetical | | | | |
| Investor Class | $1,000 | $1,020.16 | $5.09 | 1.00% |
| Institutional Class | $1,000 | $1,021.17 | $4.08 | 0.80% |
| A Class | $1,000 | $1,018.90 | $6.36 | 1.25% |
| B Class | $1,000 | $1,015.12 | $10.16 | 2.00% |
| C Class | $1,000 | $1,015.12 | $10.16 | 2.00% |
| R Class | $1,000 | $1,017.64 | $7.63 | 1.50% |
| |
| (1) | Expenses are equal to the class's annualized expense ratio listed in the table above, multiplied by the average account value over the period, multiplied by 184, the number of days in the most recent fiscal half-year, divided by 365, to reflect the one-half year period. |
OCTOBER 31, 2014
|
| | | | |
| | Shares | Value |
| COMMON STOCKS — 99.3% | | |
| Aerospace and Defense — 3.6% | | |
| Boeing Co. (The) | 7,277 | $ | 908,970 |
|
| General Dynamics Corp. | 16,550 | 2,313,028 |
|
| Lockheed Martin Corp. | 14,272 | 2,719,815 |
|
| Northrop Grumman Corp. | 15,237 | 2,102,096 |
|
| Raytheon Co. | 1,227 | 127,461 |
|
| | | 8,171,370 |
|
| Airlines — 0.8% | | |
| Delta Air Lines, Inc. | 43,538 | 1,751,534 |
|
| Banks — 6.4% | | |
| BancorpSouth, Inc. | 8,750 | 201,512 |
|
| Citigroup, Inc. | 33,554 | 1,796,146 |
|
| JPMorgan Chase & Co. | 100,368 | 6,070,257 |
|
| KeyCorp | 16,838 | 222,262 |
|
| Wells Fargo & Co. | 122,128 | 6,483,775 |
|
| | | 14,773,952 |
|
| Beverages — 2.0% | | |
| Coca-Cola Enterprises, Inc. | 15,920 | 690,132 |
|
| Dr Pepper Snapple Group, Inc. | 28,430 | 1,968,778 |
|
| PepsiCo, Inc. | 19,996 | 1,923,015 |
|
| | | 4,581,925 |
|
| Biotechnology — 3.7% | | |
Alexion Pharmaceuticals, Inc.(1) | 850 | 162,656 |
|
| Amgen, Inc. | 7,817 | 1,267,761 |
|
Biogen Idec, Inc.(1) | 10,956 | 3,517,753 |
|
Gilead Sciences, Inc.(1) | 29,370 | 3,289,440 |
|
Regeneron Pharmaceuticals, Inc.(1) | 638 | 251,193 |
|
| | | 8,488,803 |
|
| Capital Markets — 1.8% | | |
| Ameriprise Financial, Inc. | 11,305 | 1,426,352 |
|
| BlackRock, Inc. | 1,748 | 596,260 |
|
| Franklin Resources, Inc. | 11,793 | 655,809 |
|
| Goldman Sachs Group, Inc. (The) | 943 | 179,160 |
|
| Legg Mason, Inc. | 24,651 | 1,281,852 |
|
| | | 4,139,433 |
|
| Chemicals — 2.8% | | |
| CF Industries Holdings, Inc. | 6,643 | 1,727,180 |
|
| Dow Chemical Co. (The) | 10,640 | 525,616 |
|
| Eastman Chemical Co. | 1,735 | 140,153 |
|
| LyondellBasell Industries NV, Class A | 8,403 | 769,967 |
|
| PPG Industries, Inc. | 9,490 | 1,933,018 |
|
| Sherwin-Williams Co. (The) | 5,897 | 1,353,716 |
|
| | | 6,449,650 |
|
|
| | | | |
| | Shares | Value |
| Commercial Services and Supplies — 0.3% | | |
| Deluxe Corp. | 1,528 | $ | 92,903 |
|
| Tyco International Ltd. | 11,438 | 491,033 |
|
| | | 583,936 |
|
| Communications Equipment — 4.2% | | |
ARRIS Group, Inc.(1) | 9,138 | 274,323 |
|
| Cisco Systems, Inc. | 158,250 | 3,872,377 |
|
| Harris Corp. | 1,560 | 108,576 |
|
| Motorola Solutions, Inc. | 23,028 | 1,485,306 |
|
| QUALCOMM, Inc. | 49,506 | 3,886,716 |
|
| | | 9,627,298 |
|
| Construction and Engineering — 0.3% | | |
| EMCOR Group, Inc. | 6,304 | 278,196 |
|
| Fluor Corp. | 4,709 | 312,395 |
|
| | | 590,591 |
|
| Diversified Consumer Services — 0.3% | | |
| H&R Block, Inc. | 22,926 | 740,739 |
|
| Diversified Financial Services — 0.7% | | |
Berkshire Hathaway, Inc., Class B(1) | 883 | 123,761 |
|
| McGraw-Hill Cos., Inc. (The) | 11,876 | 1,074,541 |
|
| Moody's Corp. | 4,856 | 481,861 |
|
| | | 1,680,163 |
|
| Diversified Telecommunication Services — 2.2% | | |
| AT&T, Inc. | 66,933 | 2,331,946 |
|
| CenturyLink, Inc. | 42,508 | 1,763,232 |
|
Level 3 Communications, Inc.(1) | 2,048 | 96,072 |
|
| Verizon Communications, Inc. | 17,149 | 861,737 |
|
| | | 5,052,987 |
|
| Electric Utilities — 1.1% | | |
| Edison International | 8,622 | 539,565 |
|
| Entergy Corp. | 14,949 | 1,256,015 |
|
| Xcel Energy, Inc. | 22,053 | 738,114 |
|
| | | 2,533,694 |
|
| Electrical Equipment — 0.2% | | |
| Emerson Electric Co. | 5,639 | 361,234 |
|
| Electronic Equipment, Instruments and Components — 0.1% | | |
| Belden, Inc. | 2,612 | 185,948 |
|
| Energy Equipment and Services — 2.0% | | |
Cameron International Corp.(1) | 6,963 | 414,647 |
|
| Diamond Offshore Drilling, Inc. | 14,546 | 548,530 |
|
| Nabors Industries Ltd. | 4,445 | 79,343 |
|
| National Oilwell Varco, Inc. | 10,789 | 783,713 |
|
| Patterson-UTI Energy, Inc. | 4,864 | 112,018 |
|
| Schlumberger Ltd. | 26,390 | 2,603,637 |
|
| | | 4,541,888 |
|
| Food and Staples Retailing — 3.4% | | |
| CVS Health Corp. | 43,485 | 3,731,448 |
|
| Kroger Co. (The) | 56,680 | 3,157,643 |
|
| Safeway, Inc. | 11,052 | 385,272 |
|
|
| | | | |
| | Shares | Value |
SUPERVALU, Inc.(1) | 46,130 | $ | 398,102 |
|
| | | 7,672,465 |
|
| Food Products — 2.5% | | |
| Archer-Daniels-Midland Co. | 4,585 | 215,495 |
|
| ConAgra Foods, Inc. | 17,591 | 604,251 |
|
| General Mills, Inc. | 25,496 | 1,324,772 |
|
| Pinnacle Foods, Inc. | 21,311 | 720,312 |
|
| Tyson Foods, Inc., Class A | 68,910 | 2,780,518 |
|
| | | 5,645,348 |
|
| Health Care Equipment and Supplies — 1.8% | | |
| Abbott Laboratories | 41,475 | 1,807,895 |
|
Boston Scientific Corp.(1) | 20,072 | 266,556 |
|
| C.R. Bard, Inc. | 1,781 | 292,031 |
|
CareFusion Corp.(1) | 10,710 | 614,433 |
|
| Covidien plc | 1,399 | 129,323 |
|
Intuitive Surgical, Inc.(1) | 296 | 146,757 |
|
| Medtronic, Inc. | 6,181 | 421,297 |
|
| ResMed, Inc. | 358 | 18,695 |
|
| Stryker Corp. | 5,187 | 454,018 |
|
| | | 4,151,005 |
|
| Health Care Providers and Services — 2.9% | | |
| Aetna, Inc. | 14,354 | 1,184,349 |
|
| AmerisourceBergen Corp. | 20,758 | 1,772,941 |
|
| Cardinal Health, Inc. | 18,260 | 1,433,045 |
|
| Cigna Corp. | 12,114 | 1,206,191 |
|
Express Scripts Holding Co.(1) | 14,203 | 1,091,074 |
|
| | | 6,687,600 |
|
| Hotels, Restaurants and Leisure — 1.2% | | |
Bally Technologies, Inc.(1) | 264 | 21,225 |
|
| Brinker International, Inc. | 12,639 | 677,956 |
|
| Cheesecake Factory, Inc. (The) | 2,863 | 131,526 |
|
| Las Vegas Sands Corp. | 5,264 | 327,737 |
|
| Wyndham Worldwide Corp. | 13,540 | 1,051,652 |
|
| Wynn Resorts Ltd. | 3,212 | 610,312 |
|
| | | 2,820,408 |
|
| Household Products — 1.2% | | |
| Energizer Holdings, Inc. | 564 | 69,175 |
|
| Kimberly-Clark Corp. | 22,745 | 2,599,071 |
|
| | | 2,668,246 |
|
| Independent Power and Renewable Electricity Producers — 0.2% | |
| AES Corp. (The) | 25,091 | 353,030 |
|
| NRG Energy, Inc. | 2,248 | 67,395 |
|
| | | 420,425 |
|
| Industrial Conglomerates — 0.4% | | |
| 3M Co. | 4,803 | 738,557 |
|
| General Electric Co. | 9,438 | 243,595 |
|
| | | 982,152 |
|
| Insurance — 3.8% | | |
| Aflac, Inc. | 15,574 | 930,235 |
|
| American Financial Group, Inc. | 3,383 | 202,405 |
|
|
| | | | |
| | Shares | Value |
| American International Group, Inc. | 31,715 | $ | 1,698,973 |
|
| Assurant, Inc. | 8,438 | 575,640 |
|
| MetLife, Inc. | 16,930 | 918,283 |
|
| Principal Financial Group, Inc. | 1,343 | 70,333 |
|
| Travelers Cos., Inc. (The) | 35,328 | 3,561,062 |
|
| Unum Group | 22,095 | 739,299 |
|
| | | 8,696,230 |
|
| Internet and Catalog Retail — 0.8% | | |
| Expedia, Inc. | 15,982 | 1,357,990 |
|
Liberty Interactive Corp., Class A(1) | 8,715 | 227,810 |
|
Liberty Ventures(1) | 1,239 | 43,489 |
|
Priceline Group, Inc. (The)(1) | 194 | 234,005 |
|
| | | 1,863,294 |
|
| Internet Software and Services — 3.1% | | |
Facebook, Inc., Class A(1) | 42,966 | 3,222,020 |
|
Google, Inc., Class A(1) | 3,428 | 1,946,658 |
|
Google, Inc., Class C(1) | 1,491 | 833,588 |
|
| IAC/InterActiveCorp | 1,924 | 130,236 |
|
VeriSign, Inc.(1) | 7,635 | 456,268 |
|
Yelp, Inc.(1) | 9,124 | 547,440 |
|
| | | 7,136,210 |
|
| IT Services — 3.7% | | |
Alliance Data Systems Corp.(1) | 3,190 | 903,886 |
|
| Computer Sciences Corp. | 5,041 | 304,476 |
|
| MasterCard, Inc., Class A | 26,585 | 2,226,494 |
|
| Visa, Inc., Class A | 17,056 | 4,117,830 |
|
| Western Union Co. (The) | 49,561 | 840,555 |
|
| Xerox Corp. | 10,275 | 136,452 |
|
| | | 8,529,693 |
|
| Life Sciences Tools and Services — 0.2% | | |
| Agilent Technologies, Inc. | 9,145 | 505,536 |
|
| Machinery — 3.2% | | |
| Caterpillar, Inc. | 21,518 | 2,182,140 |
|
| Cummins, Inc. | 17,954 | 2,624,516 |
|
| Dover Corp. | 27,120 | 2,154,413 |
|
| Flowserve Corp. | 2,457 | 167,051 |
|
| Parker-Hannifin Corp. | 1,725 | 219,127 |
|
| | | 7,347,247 |
|
| Media — 4.2% | | |
| Comcast Corp., Class A | 86,677 | 4,797,572 |
|
| Omnicom Group, Inc. | 4,959 | 356,354 |
|
| Time Warner Cable, Inc. | 1,322 | 194,612 |
|
| Time Warner, Inc. | 18,685 | 1,484,897 |
|
| Viacom, Inc., Class B | 23,486 | 1,706,962 |
|
| Walt Disney Co. (The) | 12,189 | 1,113,831 |
|
| | | 9,654,228 |
|
| Multi-Utilities — 1.1% | | |
| Ameren Corp. | 21,671 | 917,550 |
|
| CenterPoint Energy, Inc. | 5,477 | 134,461 |
|
| DTE Energy Co. | 6,083 | 499,779 |
|
|
| | | | |
| | Shares | Value |
| PG&E Corp. | 14,429 | $ | 726,067 |
|
| Public Service Enterprise Group, Inc. | 7,213 | 297,969 |
|
| | | 2,575,826 |
|
| Multiline Retail — 1.4% | | |
| Big Lots, Inc. | 9,042 | 412,767 |
|
| Dillard's, Inc., Class A | 1,714 | 181,273 |
|
| Kohl's Corp. | 7,489 | 406,053 |
|
| Macy's, Inc. | 21,880 | 1,265,102 |
|
| Target Corp. | 16,616 | 1,027,201 |
|
| | | 3,292,396 |
|
| Oil, Gas and Consumable Fuels — 7.9% | | |
| Apache Corp. | 3,190 | 246,268 |
|
| Chesapeake Energy Corp. | 10,777 | 239,034 |
|
| Chevron Corp. | 7,481 | 897,346 |
|
| ConocoPhillips | 35,003 | 2,525,467 |
|
| EOG Resources, Inc. | 3,258 | 309,673 |
|
| Exxon Mobil Corp. | 89,409 | 8,646,744 |
|
| HollyFrontier Corp. | 12,635 | 573,376 |
|
| Murphy Oil Corp. | 5,736 | 306,245 |
|
| Occidental Petroleum Corp. | 41,726 | 3,710,693 |
|
| Valero Energy Corp. | 13,532 | 677,818 |
|
| | | 18,132,664 |
|
| Paper and Forest Products — 0.8% | | |
| International Paper Co. | 36,968 | 1,871,320 |
|
| Pharmaceuticals — 5.6% | | |
| AbbVie, Inc. | 3,227 | 204,785 |
|
| Eli Lilly & Co. | 23,862 | 1,582,767 |
|
Hospira, Inc.(1) | 3,539 | 190,044 |
|
| Johnson & Johnson | 47,712 | 5,142,399 |
|
Mylan, Inc.(1) | 10,111 | 541,444 |
|
| Pfizer, Inc. | 173,831 | 5,206,239 |
|
| | | 12,867,678 |
|
| Professional Services — 0.1% | | |
| Equifax, Inc. | 2,926 | 221,615 |
|
| Real Estate Investment Trusts (REITs) — 1.1% | | |
| Annaly Capital Management, Inc. | 18,122 | 206,772 |
|
| CBL & Associates Properties, Inc. | 4,828 | 92,360 |
|
| Digital Realty Trust, Inc. | 1,404 | 96,862 |
|
| Host Hotels & Resorts, Inc. | 11,435 | 266,550 |
|
| Prologis, Inc. | 2,830 | 117,869 |
|
| Public Storage | 7,364 | 1,357,480 |
|
| Simon Property Group, Inc. | 1,061 | 190,142 |
|
| Weyerhaeuser Co. | 4,399 | 148,950 |
|
| | | 2,476,985 |
|
| Road and Rail — 1.9% | | |
| Con-way, Inc. | 2,208 | 95,761 |
|
| Ryder System, Inc. | 2,686 | 237,630 |
|
| Union Pacific Corp. | 34,550 | 4,023,348 |
|
| | | 4,356,739 |
|
|
| | | | |
| | Shares | Value |
| Semiconductors and Semiconductor Equipment — 1.7% | | |
| Altera Corp. | 3,381 | $ | 116,205 |
|
First Solar, Inc.(1) | 3,914 | 230,535 |
|
| KLA-Tencor Corp. | 14,604 | 1,155,907 |
|
| Marvell Technology Group Ltd. | 28,507 | 383,134 |
|
Micron Technology, Inc.(1) | 18,770 | 621,099 |
|
| NVIDIA Corp. | 25,424 | 496,785 |
|
| Texas Instruments, Inc. | 15,294 | 759,500 |
|
| Xilinx, Inc. | 3,144 | 139,845 |
|
| | | 3,903,010 |
|
| Software — 3.5% | | |
Electronic Arts, Inc.(1) | 22,069 | 904,167 |
|
| Microsoft Corp. | 59,707 | 2,803,244 |
|
| Oracle Corp. | 61,060 | 2,384,393 |
|
Red Hat, Inc.(1) | 5,396 | 317,932 |
|
| Symantec Corp. | 60,060 | 1,490,689 |
|
| | | 7,900,425 |
|
| Specialty Retail — 3.0% | | |
AutoZone, Inc.(1) | 660 | 365,323 |
|
Bed Bath & Beyond, Inc.(1) | 1,073 | 72,256 |
|
| Gap, Inc. (The) | 34,439 | 1,304,894 |
|
| Home Depot, Inc. (The) | 43,728 | 4,264,354 |
|
| Lowe's Cos., Inc. | 9,399 | 537,623 |
|
Murphy USA, Inc.(1) | 879 | 50,367 |
|
| Pier 1 Imports, Inc. | 3,374 | 43,524 |
|
| Ross Stores, Inc. | 907 | 73,213 |
|
| TJX Cos., Inc. (The) | 4,162 | 263,538 |
|
| | | 6,975,092 |
|
| Technology Hardware, Storage and Peripherals — 5.1% | | |
| Apple, Inc. | 79,933 | 8,632,764 |
|
| EMC Corp. | 21,471 | 616,862 |
|
| Hewlett-Packard Co. | 65,776 | 2,360,043 |
|
| Western Digital Corp. | 1,861 | 183,066 |
|
| | | 11,792,735 |
|
| Textiles, Apparel and Luxury Goods — 0.5% | | |
| Coach, Inc. | 2,841 | 97,674 |
|
| Ralph Lauren Corp. | 6,718 | 1,107,395 |
|
| | | 1,205,069 |
|
Thrifts and Mortgage Finance† | | |
| Hudson City Bancorp., Inc. | 6,919 | 66,768 |
|
| Tobacco — 0.5% | | |
| Altria Group, Inc. | 3,053 | 147,582 |
|
| Lorillard, Inc. | 15,984 | 983,016 |
|
| | | 1,130,598 |
|
TOTAL COMMON STOCKS (Cost $155,296,097) | | 227,804,152 |
|
|
| | | | |
| | Shares | Value |
| TEMPORARY CASH INVESTMENTS — 0.8% | | |
| Repurchase Agreement, Bank of America Merrill Lynch, (collateralized by various U.S. Treasury obligations, 1.375% - 2.625%, 12/31/14 - 2/28/19, valued at $405,363), in a joint trading account at 0.07%, dated 10/31/14, due 11/3/14 (Delivery value $397,478) | | $ | 397,476 |
|
| Repurchase Agreement, Credit Suisse First Boston, Inc., (collateralized by various U.S. Treasury obligations, 0.25%, 10/15/15, valued at $162,179), in a joint trading account at 0.04%, dated 10/31/14, due 11/3/14 (Delivery value $158,991) | | 158,990 |
|
| Repurchase Agreement, Goldman Sachs & Co., (collateralized by various U.S. Treasury obligations, 0.125%, 12/31/14, valued at $324,668), in a joint trading account at 0.03%, dated 10/31/14, due 11/3/14 (Delivery value $317,981) | | 317,980 |
|
| SSgA U.S. Government Money Market Fund, Class N | 874,645 | 874,645 |
|
TOTAL TEMPORARY CASH INVESTMENTS (Cost $1,749,091) | | 1,749,091 |
|
TOTAL INVESTMENT SECURITIES — 100.1% (Cost $157,045,188) | | 229,553,243 |
|
| OTHER ASSETS AND LIABILITIES — (0.1)% | | (264,789) |
|
| TOTAL NET ASSETS — 100.0% | | $ | 229,288,454 |
|
|
|
| NOTES TO SCHEDULE OF INVESTMENTS |
| |
| † | Category is less than 0.05% of total net assets. |
See Notes to Financial Statements.
|
|
| Statement of Assets and Liabilities |
|
| | | |
| OCTOBER 31, 2014 | |
| Assets | |
| Investment securities, at value (cost of $157,045,188) | $ | 229,553,243 |
|
| Receivable for capital shares sold | 31,371 |
|
| Dividends and interest receivable | 148,897 |
|
| | 229,733,511 |
|
| | |
| Liabilities | |
| Payable for capital shares redeemed | 220,789 |
|
| Accrued management fees | 182,385 |
|
| Distribution and service fees payable | 41,883 |
|
| | 445,057 |
|
| | |
| Net Assets | $ | 229,288,454 |
|
| | |
| Net Assets Consist of: | |
| Capital (par value and paid-in surplus) | $ | 207,301,953 |
|
| Undistributed net investment income | 1,664,108 |
|
| Accumulated net realized loss | (52,185,662) |
|
| Net unrealized appreciation | 72,508,055 |
|
| | $ | 229,288,454 |
|
|
| | | | |
| | Net Assets | Shares Outstanding | Net Asset Value Per Share |
| Investor Class, $0.01 Par Value | $77,014,634 | 3,614,845 |
| $21.31 |
| Institutional Class, $0.01 Par Value | $10,731,056 | 502,191 |
| $21.37 |
| A Class, $0.01 Par Value | $116,461,709 | 5,486,231 |
| $21.23* |
| B Class, $0.01 Par Value | $3,009,830 | 144,493 |
| $20.83 |
| C Class, $0.01 Par Value | $16,777,295 | 805,157 |
| $20.84 |
| R Class, $0.01 Par Value | $5,293,930 | 250,731 |
| $21.11 |
*Maximum offering price $22.53 (net asset value divided by 0.9425).
See Notes to Financial Statements.
|
| | | |
| YEAR ENDED OCTOBER 31, 2014 |
| Investment Income (Loss) | |
| Income: | |
| Dividends (net of foreign taxes withheld of $309) | $ | 5,018,700 |
|
| Interest | 224 |
|
| | 5,018,924 |
|
| | |
| Expenses: | |
| Management fees | 2,258,016 |
|
| Distribution and service fees: | |
| A Class | 294,741 |
|
| B Class | 31,328 |
|
| C Class | 168,069 |
|
| R Class | 24,577 |
|
| Directors' fees and expenses | 1,374 |
|
| Other expenses | 333 |
|
| | 2,778,438 |
|
| | |
| Net investment income (loss) | 2,240,486 |
|
| | |
| Realized and Unrealized Gain (Loss) | |
| Net realized gain (loss) on investment transactions | 41,107,598 |
|
| Change in net unrealized appreciation (depreciation) on investments | (7,784,637) |
|
| | |
| Net realized and unrealized gain (loss) | 33,322,961 |
|
| | |
| Net Increase (Decrease) in Net Assets Resulting from Operations | $ | 35,563,447 |
|
See Notes to Financial Statements.
|
|
| Statement of Changes in Net Assets |
|
| | | | | | |
| YEARS ENDED OCTOBER 31, 2014 AND OCTOBER 31, 2013 |
| Increase (Decrease) in Net Assets | October 31, 2014 | October 31, 2013 |
| Operations | | |
| Net investment income (loss) | $ | 2,240,486 |
| $ | 2,359,078 |
|
| Net realized gain (loss) | 41,107,598 |
| 15,335,223 |
|
| Change in net unrealized appreciation (depreciation) | (7,784,637 | ) | 26,660,396 |
|
| Net increase (decrease) in net assets resulting from operations | 35,563,447 |
| 44,354,697 |
|
| | | |
| Distributions to Shareholders | | |
| From net investment income: | | |
| Investor Class | (884,103) |
| (505,892) |
|
| Institutional Class | (143,856) |
| (124,491) |
|
| A Class | (1,093,090) |
| (1,279,655) |
|
| B Class | (5,373) |
| (32,227) |
|
| C Class | (27,587) |
| (153,858) |
|
| R Class | (32,137) |
| (34,693) |
|
| Decrease in net assets from distributions | (2,186,146) |
| (2,130,816) |
|
| | | |
| Capital Share Transactions | | |
| Net increase (decrease) in net assets from capital share transactions (Note 5) | (27,318,260) |
| 6,863,937 |
|
| | | |
| Net increase (decrease) in net assets | 6,059,041 |
| 49,087,818 |
|
| | | |
| Net Assets | | |
| Beginning of period | 223,229,413 |
| 174,141,595 |
|
| End of period | $ | 229,288,454 |
| $ | 223,229,413 |
|
| | | |
| Undistributed net investment income | $ | 1,664,108 |
| $ | 1,620,774 |
|
See Notes to Financial Statements.
|
|
Notes to Financial Statements |
OCTOBER 31, 2014
1. Organization
American Century Mutual Funds, Inc. (the corporation) is registered under the Investment Company Act of 1940, as amended (the 1940 Act), as an open-end management investment company and is organized as a Maryland corporation. Fundamental Equity Fund (the fund) is one fund in a series issued by the corporation. The fund is diversified as defined under the 1940 Act. The fund’s investment objective is to seek long-term capital growth. Income is a secondary objective.
The fund offers the Investor Class, the Institutional Class, the A Class, the B Class, the C Class and the R Class. The A Class may incur an initial sales charge. The A Class, B Class and C Class may be subject to a contingent deferred sales charge. The share classes differ principally in their respective sales charges and distribution and shareholder servicing expenses and arrangements. The Institutional Class is made available to institutional shareholders or through financial intermediaries whose clients do not require the same level of shareholder and administrative services as shareholders of other classes. As a result, the Institutional Class is charged a lower unified management fee.
2. Significant Accounting Policies
The following is a summary of significant accounting policies consistently followed by the fund in preparation of its financial statements. The fund is an investment company and follows accounting and reporting guidance in accordance with accounting principles generally accepted in the United States of America. This may require management to make certain estimates and assumptions at the date of the financial statements. Actual results could differ from these estimates. Management evaluated the impact of events or transactions occurring through the date the financial statements were issued that would merit recognition or disclosure.
Investment Valuations — The fund determines the fair value of its investments and computes its net asset value per share at the close of regular trading (usually 4 p.m. Eastern time) on the New York Stock Exchange (NYSE) on each day the NYSE is open. The Board of Directors has adopted valuation policies and procedures to guide the investment advisor in the fund’s investment valuation process and to provide methodologies for the oversight of the fund’s pricing function.
Equity securities that are listed or traded on a domestic securities exchange are valued at the last reported sales price or at the official closing price as provided by the exchange. Equity securities traded on foreign securities exchanges are generally valued at the closing price of such securities on the exchange where primarily traded or at the close of the NYSE, if that is earlier. If no last sales price is reported, or if local convention or regulation so provides, the mean of the latest bid and asked prices may be used. Securities traded over-the-counter are valued at the mean of the latest bid and asked prices, the last sales price, or the official closing price.
Fixed income securities maturing within 60 days at the time of purchase may be valued at cost, plus or minus any amortized discount or premium or at the evaluated mean as provided by an independent pricing service. Evaluated mean prices are commonly derived through utilization of market models, which may consider, among other factors: trade data, quotations from dealers and active market makers, relevant yield curve and spread data, related sector levels, creditworthiness, trade data or market information on comparable securities, and other relevant security specific information.
Open-end management investment companies are valued at the reported net asset value per share. Repurchase agreements are valued at cost, which approximates fair value.
If the fund determines that the market price for an investment is not readily available or the valuation methods mentioned above do not reflect an investment’s fair value, such investment is valued as determined in good faith by the Board of Directors or its delegate, in accordance with policies and procedures adopted by the Board of Directors. In its determination of fair value, the fund may review several factors including, but not limited to, market information regarding the specific investment or comparable investments and correlation with other investment types, futures indices or general market indicators. Circumstances that may cause the fund to use these procedures to value an investment include, but are not limited to: an investment has been declared in default or is distressed; trading in a security has been suspended during the trading day or a
security is not actively trading on its principal exchange; prices received from a regular pricing source are deemed unreliable; or there is a foreign market holiday and no trading occurred.
The fund monitors for significant events occurring after the close of an investment’s primary exchange but before the fund’s net asset value per share is determined. Significant events may include, but are not limited to: corporate announcements and transactions; governmental action and political unrest that could impact a specific investment or an investment sector; or armed conflicts, natural disasters and similar events that could affect investments in a specific country or region. The fund also monitors for significant fluctuations between domestic and foreign markets, as evidenced by the U.S. market or such other indicators that the Board of Directors, or its delegate, deems appropriate. If significant fluctuations in foreign markets are identified, the fund may apply a model-derived factor to the closing price of equity securities traded on foreign securities exchanges. The factor is based on observable market data as provided by an independent pricing service.
Security Transactions — Security transactions are accounted for as of the trade date. Net realized gains and losses are determined on the identified cost basis, which is also used for federal income tax purposes.
Investment Income — Dividend income less foreign taxes withheld, if any, is recorded as of the ex-dividend date. Distributions received on securities that represent a return of capital or long-term capital gain are recorded as a reduction of cost of investments and/or as a realized gain. The fund may estimate the components of distributions received that may be considered nontaxable distributions or long-term capital gain distributions for income tax purposes. Interest income is recorded on the accrual basis and includes accretion of discounts and amortization of premiums.
Repurchase Agreements — The fund may enter into repurchase agreements with institutions that American Century Investment Management, Inc. (ACIM) (the investment advisor) has determined are creditworthy pursuant to criteria adopted by the Board of Directors. The fund requires that the collateral, represented by securities, received in a repurchase transaction be transferred to the custodian in a manner sufficient to enable the fund to obtain those securities in the event of a default under the repurchase agreement. ACIM monitors, on a daily basis, the securities transferred to ensure the value, including accrued interest, of the securities under each repurchase agreement is equal to or greater than amounts owed to the fund under each repurchase agreement.
Joint Trading Account — Pursuant to an Exemptive Order issued by the Securities and Exchange Commission, the fund, along with certain other funds in the American Century Investments family of funds, may transfer uninvested cash balances into a joint trading account. These balances are invested in one or more repurchase agreements that are collateralized by U.S. Treasury or Agency obligations.
Income Tax Status — It is the fund’s policy to distribute substantially all net investment income and net realized gains to shareholders and to otherwise qualify as a regulated investment company under provisions of the Internal Revenue Code. Accordingly, no provision has been made for income taxes. The fund files U.S. federal, state, local and non-U.S. tax returns as applicable. The fund's tax returns are subject to examination by the relevant taxing authority until expiration of the applicable statute of limitations, which is generally three years from the date of filing but can be longer in certain jurisdictions. At this time, management believes there are no uncertain tax positions which, based on their technical merit, would not be sustained upon examination and for which it is reasonably possible that the total amounts of unrecognized tax benefits will significantly change in the next twelve months.
Multiple Class — All shares of the fund represent an equal pro rata interest in the net assets of the class to which such shares belong, and have identical voting, dividend, liquidation and other rights and the same terms and conditions, except for class specific expenses and exclusive rights to vote on matters affecting only individual classes. Income, non-class specific expenses, and realized and unrealized capital gains and losses of the fund are allocated to each class of shares based on their relative net assets.
Distributions to Shareholders — Distributions from net investment income and net realized gains, if any, are generally declared and paid annually.
Indemnifications — Under the corporation’s organizational documents, its officers and directors are indemnified against certain liabilities arising out of the performance of their duties to the fund. In addition, in the normal course of business, the fund enters into contracts that provide general indemnifications. The maximum exposure under these arrangements is unknown as this would involve future claims that may be made against a fund. The risk of material loss from such claims is considered by management to be remote.
3. Fees and Transactions with Related Parties
Certain officers and directors of the corporation are also officers and/or directors of American Century Companies, Inc. (ACC). The corporation’s investment advisor, ACIM, the corporation's distributor, American Century Investment Services, Inc. (ACIS), and the corporation’s transfer agent, American Century Services, LLC, are wholly owned, directly or indirectly, by ACC.
Management Fees — The corporation has entered into a management agreement with ACIM, under which ACIM provides the fund with investment advisory and management services in exchange for a single, unified management fee (the fee) per class. The agreement provides that all expenses of managing and operating the fund, except distribution and service fees, brokerage expenses, taxes, interest, fees and expenses of the independent directors (including legal counsel fees), and extraordinary expenses, will be paid by ACIM. The fee is computed and accrued daily based on each class’s daily net assets and paid monthly in arrears. The rate of the fee is determined by applying a fee rate calculation formula. This formula takes into account the fund’s assets as well as certain assets, if any, of other clients of the investment advisor outside the American Century Investments family of funds (such as subadvised funds and separate accounts) that have very similar investment teams and investment strategies (strategy assets). The annual management fee schedule ranges from 0.800% to 0.990% for the Investor Class, A Class, B Class, C Class and R Class. The annual management fee schedule ranges from 0.600% to 0.790% for the Institutional Class. Prior to August 1, 2014, the annual management fee schedule ranged from 0.800% to 1.000% for the Investor Class, A Class, B Class, C Class and R Class and 0.600% to 0.800% for the Institutional Class. The effective annual management fee for each class for the year ended October 31, 2014 was 1.00% for the Investor Class, A Class, B Class, C Class and R Class and 0.80% for the Institutional Class.
Distribution and Service Fees — The Board of Directors has adopted a separate Master Distribution and Individual Shareholder Services Plan for each of the A Class, B Class, C Class and R Class (collectively the plans), pursuant to Rule 12b-1 of the 1940 Act. The plans provide that the A Class will pay ACIS an annual distribution and service fee of 0.25%. The plans provide that the B Class and C Class will each pay ACIS an annual distribution and service fee of 1.00%, of which 0.25% is paid for individual shareholder services and 0.75% is paid for distribution services. The plans provide that the R Class will pay ACIS an annual distribution and service fee of 0.50%. The fees are computed and accrued daily based on each class’s daily net assets and paid monthly in arrears. The fees are used to pay financial intermediaries for distribution and individual shareholder services. Fees incurred under the plans during the year ended October 31, 2014 are detailed in the Statement of Operations.
Directors' Fees and Expenses — The Board of Directors is responsible for overseeing the investment advisor’s management and operations of the fund. The directors receive detailed information about the fund and its investment advisor regularly throughout the year, and meet at least quarterly with management of the investment advisor to review reports about fund operations. Fees and expenses incurred in conjunction with the directors during the year ended October 31, 2014 are detailed in the Statement of Operations. The fund’s officers do not receive compensation from the fund.
4. Investment Transactions
Purchases and sales of investment securities, excluding short-term investments, for the year ended October 31, 2014 were $93,409,463 and $120,069,700, respectively.
5. Capital Share Transactions
Transactions in shares of the fund were as follows:
|
| | | | | | | | | | |
| | Year ended October 31, 2014 | Year ended October 31, 2013 |
| | Shares | Amount | Shares | Amount |
| Investor Class/Shares Authorized | 200,000,000 |
| | 200,000,000 |
| |
| Sold | 1,240,505 |
| $ | 24,046,130 |
| 2,105,291 |
| $ | 35,157,597 |
|
| Issued in reinvestment of distributions | 45,454 |
| 843,629 |
| 31,320 |
| 469,801 |
|
| Redeemed | (1,386,474 | ) | (27,284,419 | ) | (1,001,523 | ) | (16,616,170 | ) |
| | (100,515 | ) | (2,394,660 | ) | 1,135,088 |
| 19,011,228 |
|
| Institutional Class/Shares Authorized | 25,000,000 |
| | 25,000,000 |
| |
| Sold | 50,921 |
| 1,012,141 |
| 97,765 |
| 1,637,665 |
|
| Issued in reinvestment of distributions | 7,739 |
| 143,856 |
| 8,288 |
| 124,491 |
|
| Redeemed | (122,317 | ) | (2,428,789 | ) | (161,547 | ) | (2,718,059 | ) |
| | (63,657 | ) | (1,272,792 | ) | (55,494 | ) | (955,903 | ) |
| A Class/Shares Authorized | 150,000,000 |
| | 150,000,000 |
| |
| Sold | 562,114 |
| 10,904,874 |
| 1,060,036 |
| 17,404,481 |
|
| Issued in reinvestment of distributions | 54,286 |
| 1,006,471 |
| 77,769 |
| 1,164,981 |
|
| Redeemed | (1,635,326 | ) | (32,004,656 | ) | (1,777,030 | ) | (28,895,340 | ) |
| | (1,018,926 | ) | (20,093,311 | ) | (639,225 | ) | (10,325,878 | ) |
| B Class/Shares Authorized | 25,000,000 |
| | 25,000,000 |
| |
| Sold | 7,348 |
| 141,987 |
| 10,530 |
| 172,424 |
|
| Issued in reinvestment of distributions | 269 |
| 4,937 |
| 1,991 |
| 29,471 |
|
| Redeemed | (47,860 | ) | (919,712 | ) | (44,575 | ) | (708,772 | ) |
| | (40,243 | ) | (772,788 | ) | (32,054 | ) | (506,877 | ) |
| C Class/Shares Authorized | 50,000,000 |
| | 50,000,000 |
| |
| Sold | 67,666 |
| 1,293,651 |
| 141,577 |
| 2,300,680 |
|
| Issued in reinvestment of distributions | 1,079 |
| 19,765 |
| 6,759 |
| 100,029 |
|
| Redeemed | (189,694 | ) | (3,655,169 | ) | (246,977 | ) | (4,014,231 | ) |
| | (120,949 | ) | (2,341,753 | ) | (98,641 | ) | (1,613,522 | ) |
| R Class/Shares Authorized | 10,000,000 |
| | 10,000,000 |
| |
| Sold | 40,435 |
| 792,329 |
| 145,612 |
| 2,270,986 |
|
| Issued in reinvestment of distributions | 1,739 |
| 32,137 |
| 2,324 |
| 34,693 |
|
| Redeemed | (65,414 | ) | (1,267,422 | ) | (65,001 | ) | (1,050,790 | ) |
| | (23,240 | ) | (442,956 | ) | 82,935 |
| 1,254,889 |
|
| Net increase (decrease) | (1,367,530 | ) | $ | (27,318,260 | ) | 392,609 |
| $ | 6,863,937 |
|
6. Fair Value Measurements
The fund’s investments valuation process is based on several considerations and may use multiple inputs to determine the fair value of the investments held by the fund. In conformity with accounting principles generally accepted in the United States of America, the inputs used to determine a valuation are classified into three broad levels.
| |
| • | Level 1 valuation inputs consist of unadjusted quoted prices in an active market for identical investments. |
| |
| • | Level 2 valuation inputs consist of direct or indirect observable market data (including quoted prices for comparable investments, evaluations of subsequent market events, interest rates, prepayment speeds, credit risk, etc.). These inputs also consist of quoted prices for identical investments initially expressed in local currencies that are adjusted through translation into U.S. dollars. |
| |
| • | Level 3 valuation inputs consist of unobservable data (including a fund’s own assumptions). |
The level classification is based on the lowest level input that is significant to the fair valuation measurement. The valuation inputs are not necessarily an indication of the risks associated with investing in these securities or other financial instruments. There were no significant transfers between levels during the period.
The following is a summary of the level classifications as of period end. The Schedule of Investments provides additional information on the fund’s portfolio holdings.
|
| | | | | | | | |
| | Level 1 | Level 2 | Level 3 |
| Assets | | | |
| Investment Securities | | | |
| Common Stocks | $ | 227,804,152 |
| — |
| — |
|
| Temporary Cash Investments | 874,645 |
| $ | 874,446 |
| — |
|
| | $ | 228,678,797 |
| $ | 874,446 |
| — |
|
7. Federal Tax Information
The tax character of distributions paid during the years ended October 31, 2014 and October 31, 2013 were as follows:
|
| | | | | | |
| | 2014 | 2013 |
| Distributions Paid From | | |
| Ordinary income | $ | 2,186,146 |
| $ | 2,130,816 |
|
| Long-term capital gains | — |
| — |
|
The book-basis character of distributions made during the year from net investment income or net realized gains may differ from their ultimate characterization for federal income tax purposes. These differences reflect the differing character of certain income items and net realized gains and losses for financial statement and tax purposes, and may result in reclassification among certain capital accounts on the financial statements.
As of October 31, 2014, the federal tax cost of investments and the components of distributable earnings on a tax-basis were as follows:
|
| | | |
| Federal tax cost of investments | $ | 159,467,080 |
|
| Gross tax appreciation of investments | $ | 71,128,036 |
|
| Gross tax depreciation of investments | (1,041,873 | ) |
| Net tax appreciation (depreciation) of investments | $ | 70,086,163 |
|
| Undistributed ordinary income | $ | 1,664,108 |
|
| Accumulated short-term capital losses | $ | (49,763,770 | ) |
The difference between book-basis and tax-basis unrealized appreciation (depreciation) is attributable primarily to the tax deferral of losses on wash sales.
Accumulated capital losses represent net capital loss carryovers that may be used to offset future realized capital gains for federal income tax purposes. Future capital loss carryover utilization in any given year may be subject to Internal Revenue Code limitations. Capital loss carryovers expire in 2017.
|
| | | | | | | | | | | | | |
| For a Share Outstanding Throughout the Years Ended October 31 (except as noted) | |
| Per-Share Data | | | | Ratios and Supplemental Data |
| | | Income From Investment Operations: | | | Ratio to Average Net Assets of: | | |
| | Net Asset
Value,
Beginning
of Period | Net
Investment
Income
(Loss)(1) | Net
Realized
and
Unrealized
Gain (Loss) | Total From
Investment
Operations | Distributions From Net
Investment
Income | Net Asset
Value,
End
of Period | Total
Return(2) | Operating
Expenses | Net
Investment
Income
(Loss) | Portfolio
Turnover
Rate | Net
Assets,
End of
Period
(in thousands) |
| Investor Class | | | | | | | | | |
| 2014 | $18.41 | 0.24 | 2.88 | 3.12 | (0.22) | $21.31 | 17.06% | 1.00% | 1.19% | 41% |
| $77,015 |
|
| 2013 | $14.82 | 0.23 | 3.55 | 3.78 | (0.19) | $18.41 | 25.83% | 1.01% | 1.44% | 36% |
| $68,416 |
|
| 2012 | $12.97 | 0.20 | 1.81 | 2.01 | (0.16) | $14.82 | 15.65% | 1.01% | 1.39% | 18% |
| $38,250 |
|
| 2011 | $11.95 | 0.14 | 1.02 | 1.16 | (0.14) | $12.97 | 9.72% | 1.01% | 1.11% | 18% |
| $45,991 |
|
| 2010 | $10.57 | 0.12 | 1.40 | 1.52 | (0.14) | $11.95 | 14.47% | 1.02% | 1.06% | 29% |
| $41,698 |
|
| Institutional Class | | | | | | | | |
| 2014 | $18.47 | 0.28 | 2.88 | 3.16 | (0.26) | $21.37 | 17.29% | 0.80% | 1.39% | 41% |
| $10,731 |
|
| 2013 | $14.85 | 0.27 | 3.55 | 3.82 | (0.20) | $18.47 | 26.06% | 0.81% | 1.64% | 36% |
| $10,451 |
|
| 2012 | $12.99 | 0.21 | 1.83 | 2.04 | (0.18) | $14.85 | 15.93% | 0.81% | 1.59% | 18% |
| $9,225 |
|
| 2011 | $11.96 | 0.17 | 1.02 | 1.19 | (0.16) | $12.99 | 10.02% | 0.81% | 1.31% | 18% |
| $103 |
|
| 2010 | $10.59 | 0.15 | 1.38 | 1.53 | (0.16) | $11.96 | 14.57% | 0.82% | 1.26% | 29% |
| $120 |
|
|
| | | | | | | | | | | | | |
| For a Share Outstanding Throughout the Years Ended October 31 (except as noted) | |
| Per-Share Data | | | | Ratios and Supplemental Data |
| | | Income From Investment Operations: | | | Ratio to Average Net Assets of: | | |
| | Net Asset
Value,
Beginning
of Period | Net
Investment
Income
(Loss)(1) | Net
Realized
and
Unrealized
Gain (Loss) | Total From
Investment
Operations | Distributions From Net
Investment
Income | Net Asset
Value,
End
of Period | Total
Return(2) | Operating
Expenses | Net
Investment
Income
(Loss) | Portfolio
Turnover
Rate | Net
Assets,
End of
Period
(in thousands) |
| A Class | | | | | | | | | |
| 2014 | $18.35 | 0.19 | 2.86 | 3.05 | (0.17) | $21.23 | 16.76% | 1.25% | 0.94% | 41% |
| $116,462 |
|
| 2013 | $14.80 | 0.20 | 3.53 | 3.73 | (0.18) | $18.35 | 25.51% | 1.26% | 1.19% | 36% |
| $119,358 |
|
| 2012 | $12.94 | 0.16 | 1.82 | 1.98 | (0.12) | $14.80 | 15.48% | 1.26% | 1.14% | 18% |
| $105,718 |
|
| 2011 | $11.93 | 0.11 | 1.01 | 1.12 | (0.11) | $12.94 | 9.38% | 1.26% | 0.86% | 18% |
| $106,159 |
|
| 2010 | $10.56 | 0.09 | 1.39 | 1.48 | (0.11) | $11.93 | 14.10% | 1.27% | 0.81% | 29% |
| $129,960 |
|
| B Class | | | | | | | | | |
| 2014 | $18.00 | 0.04 | 2.82 | 2.86 | (0.03) | $20.83 | 15.91% | 2.00% | 0.19% | 41% |
| $3,010 |
|
| 2013 | $14.60 | 0.08 | 3.47 | 3.55 | (0.15) | $18.00 | 24.56% | 2.01% | 0.44% | 36% |
| $3,326 |
|
| 2012 | $12.77 | 0.06 | 1.80 | 1.86 | (0.03) | $14.60 | 14.60% | 2.01% | 0.39% | 18% |
| $3,165 |
|
| 2011 | $11.77 | 0.01 | 1.00 | 1.01 | (0.01) | $12.77 | 8.59% | 2.01% | 0.11% | 18% |
| $3,133 |
|
| 2010 | $10.42 | 0.01 | 1.37 | 1.38 | (0.03) | $11.77 | 13.23% | 2.02% | 0.06% | 29% |
| $3,838 |
|
| C Class | | | | | | | | | |
| 2014 | $18.01 | 0.04 | 2.82 | 2.86 | (0.03) | $20.84 | 15.90% | 2.00% | 0.19% | 41% |
| $16,777 |
|
| 2013 | $14.61 | 0.07 | 3.48 | 3.55 | (0.15) | $18.01 | 24.54% | 2.01% | 0.44% | 36% |
| $16,679 |
|
| 2012 | $12.78 | 0.05 | 1.81 | 1.86 | (0.03) | $14.61 | 14.59% | 2.01% | 0.39% | 18% |
| $14,967 |
|
| 2011 | $11.77 | 0.01 | 1.01 | 1.02 | (0.01) | $12.78 | 8.68% | 2.01% | 0.11% | 18% |
| $13,990 |
|
| 2010 | $10.42 | 0.01 | 1.37 | 1.38 | (0.03) | $11.77 | 13.23% | 2.02% | 0.06% | 29% |
| $14,816 |
|
|
| | | | | | | | | | | | | |
| For a Share Outstanding Throughout the Years Ended October 31 (except as noted) | |
| Per-Share Data | | | | Ratios and Supplemental Data |
| | | Income From Investment Operations: | | | Ratio to Average Net Assets of: | | |
| | Net Asset
Value,
Beginning
of Period | Net
Investment
Income
(Loss)(1) | Net
Realized
and
Unrealized
Gain (Loss) | Total From
Investment
Operations | Distributions From Net
Investment
Income | Net Asset
Value,
End
of Period | Total
Return(2) | Operating
Expenses | Net
Investment
Income
(Loss) | Portfolio
Turnover
Rate | Net
Assets,
End of
Period
(in thousands) |
| R Class | | | | | | | | | |
| 2014 | $18.25 | 0.14 | 2.84 | 2.98 | (0.12) | $21.11 | 16.45% | 1.50% | 0.69% | 41% |
| $5,294 |
|
| 2013 | $14.74 | 0.15 | 3.53 | 3.68 | (0.17) | $18.25 | 25.25% | 1.51% | 0.94% | 36% |
| $5,000 |
|
| 2012 | $12.90 | 0.13 | 1.80 | 1.93 | (0.09) | $14.74 | 15.09% | 1.51% | 0.89% | 18% |
| $2,817 |
|
| 2011 | $11.89 | 0.08 | 1.00 | 1.08 | (0.07) | $12.90 | 9.14% | 1.51% | 0.61% | 18% |
| $2,456 |
|
| 2010 | $10.52 | 0.06 | 1.39 | 1.45 | (0.08) | $11.89 | 13.86% | 1.52% | 0.56% | 29% |
| $2,624 |
|
|
|
| Notes to Financial Highlights |
| |
| (1) | Computed using average shares outstanding throughout the period. |
| |
| (2) | Total returns are calculated based on the net asset value of the last business day and do not reflect applicable sales charges, if any. Total returns for periods less than one year are not annualized. |
See Notes to Financial Statements.
|
|
| Report of Independent Registered Public Accounting Firm |
To the Board of Directors and Shareholders of
American Century Mutual Funds, Inc.:
We have audited the accompanying statement of assets and liabilities, including the schedule of investments, of Fundamental Equity Fund (the “Fund”), one of the funds constituting American Century Mutual Funds, Inc., as of October 31, 2014, and the related statement of operations for the year then ended, the statements of changes in net assets for each of the two years in the period then ended, and the financial highlights for each of the periods presented. These financial statements and financial highlights are the responsibility of the Fund's management. Our responsibility is to express an opinion on these financial statements and financial highlights based on our audits.
We conducted our audits in accordance with the standards of the Public Company Accounting Oversight Board (United States). Those standards require that we plan and perform the audit to obtain reasonable assurance about whether the financial statements and financial highlights are free of material misstatement. The Fund is not required to have, nor were we engaged to perform, an audit of its internal control over financial reporting. Our audits included consideration of internal control over financial reporting as a basis for designing audit procedures that are appropriate in the circumstances, but not for the purpose of expressing an opinion on the effectiveness of the Fund's internal control over financial reporting. Accordingly, we express no such opinion. An audit also includes examining, on a test basis, evidence supporting the amounts and disclosures in the financial statements, assessing the accounting principles used and significant estimates made by management, as well as evaluating the overall financial statement presentation. Our procedures included confirmation of securities owned as of October 31, 2014, by correspondence with the custodian and brokers; where replies were not received from brokers, we performed other auditing procedures. We believe that our audits provide a reasonable basis for our opinion.
In our opinion, the financial statements and financial highlights referred to above present fairly, in all material respects, the financial position of Fundamental Equity Fund of American Century Mutual Funds, Inc. as of October 31, 2014, the results of its operations for the year then ended, the changes in its net assets for each of the two years in the period then ended, and the financial highlights for each of the periods presented, in conformity with accounting principles generally accepted in the United States of America.
DELOITTE & TOUCHE LLP
Kansas City, Missouri
December 17, 2014
The Board of Directors
The individuals listed below serve as directors of the funds. Each director will continue to serve in this capacity until death, retirement, resignation or removal from office. The board has adopted a mandatory retirement age for directors who are not “interested persons,” as that term is defined in the Investment Company Act (independent directors). Independent directors shall retire by December 31 of the year in which they reach their 75th birthday.
Mr. Thomas is an “interested person” because he currently serves as President and Chief Executive Officer of American Century Companies, Inc. (ACC), the parent company of American Century Investment Management, Inc. (ACIM or the advisor). Mr. Fink is treated as an “interested person” because of his recent employment with ACC and American Century Services, LLC (ACS). The other directors (more than three-fourths of the total number) are independent. They are not employees, directors or officers of, and have no financial interest in, ACC or any of its wholly owned, direct or indirect, subsidiaries, including ACIM, American Century Investment Services, Inc. (ACIS) and ACS, and they do not have any other affiliations, positions, or relationships that would cause them to be considered “interested persons” under the Investment Company Act. The directors serve in this capacity for seven (in the case of Mr. Thomas, 15) registered investment companies in the American Century Investments family of funds.
The following table presents additional information about the directors. The mailing address for each director is 4500 Main Street, Kansas City, Missouri 64111.
|
| | | | | |
Name
(Year of Birth) | Position(s) Held with Funds | Length of Time Served | Principal Occupation(s) During Past 5 Years | Number of American Century Portfolios Overseen by Director | Other Directorships Held During Past
5 Years |
| Independent Directors | | | | |
Thomas A. Brown
(1940) | Director | Since 1980 | Managing Member, Associated Investments, LLC (real estate investment company); Brown Cascade Properties, LLC (real estate investment company) (2001 to 2009) | 73 | None |
Andrea C. Hall
(1945) | Director | Since 1997 | Retired | 73 | None |
Jan M. Lewis
(1957) | Director | Since 2011 | Retired; President and Chief Executive Officer, Catholic Charities of Northeast Kansas (human services organization) (2006 to 2013) | 73 | None |
James A. Olson
(1942) | Director and Chairman of the Board | Since 2007 (Chairman since 2014) | Member, Plaza Belmont LLC (private equity fund manager) | 73 | Saia, Inc. (2002 to 2012) and EPR Properties (2003 to 2013) |
|
| | | | | |
Name
(Year of Birth) | Position(s) Held with Funds | Length of Time Served | Principal Occupation(s) During Past 5 Years | Number of American Century Portfolios Overseen by Director | Other Directorships Held During Past
5 Years |
| Independent Directors | | | | |
M. Jeannine Strandjord
(1945) | Director | Since 1994 | Retired | 73 | Euronet Worldwide Inc.; Charming Shoppes, Inc. (2006 to 2010); and DST Systems Inc. (1996 to 2012) |
John R. Whitten
(1946) | Director | Since 2008 | Retired | 73 | Rudolph Technologies, Inc. |
Stephen E. Yates
(1948) | Director | Since 2012 | Retired; Executive Vice President, Technology & Operations, KeyCorp. (computer services) (2004 to 2010) | 73 | Applied Industrial Technologies, Inc. (2001 to 2010) |
| Interested Directors | | | | |
Barry Fink
(1955) | Director | Since 2012 | Retired; Executive Vice President, ACC (September 2007 to February 2013); President, ACS (October 2007 to February 2013); Chief Operating Officer, ACC (September 2007 to November 2012) | 73 | None |
Jonathan S. Thomas
(1963) | Director and President | Since 2007 | President and Chief Executive Officer, ACC (March 2007 to present). Also serves as Chief Executive Officer, ACS; Executive Vice President, ACIM; Director, ACC, ACIM and other ACC subsidiaries | 118 | BioMed Valley Discoveries, Inc. |
The Statement of Additional Information has additional information about the fund's directors and is available without charge, upon request, by calling 1-800-345-2021.
Officers
The following table presents certain information about the executive officers of the funds. Each officer serves as an officer for each of the 15 investment companies in the American Century family of funds, unless otherwise noted. No officer is compensated for his or her service as an officer of the funds. The listed officers are interested persons of the funds and are appointed or re-appointed on an annual basis. The mailing address for each officer listed below is 4500 Main Street, Kansas City, Missouri 64111.
|
| | |
Name (Year of Birth) | Offices with the Funds | Principal Occupation(s) During the Past Five Years |
Jonathan S.
Thomas
(1963) | Director and
President
since 2007 | President and Chief Executive Officer, ACC (March 2007 to present). Also serves as Chief Executive Officer, ACS; Executive Vice President, ACIM; Director, ACC, ACIM and other ACC subsidiaries |
Amy D. Shelton
(1964) | Chief Compliance
Officer since 2014 | Chief Compliance Officer, American Century funds, (March 2014 to present); Chief Compliance Officer, ACIM (February 2014 to present); Chief Compliance Officer, ACIS (October 2009 to present); Vice President, Client Interactions and Marketing, ACIS (February 2013 to January 2014); Director, Client Interactions and Marketing, ACIS (June 2007 to January 2013). Also serves as Vice President, ACIS |
Charles A.
Etherington
(1957) | General Counsel
since 2007 and
Senior Vice
President since 2006 | Attorney, ACC (February 1994 to present); Vice President, ACC (November 2005 to present); General Counsel, ACC (March 2007 to present). Also serves as General Counsel, ACIM, ACS, ACIS and other ACC subsidiaries; and Senior Vice President, ACIM and ACS |
C. Jean Wade
(1964) | Vice President,
Treasurer and
Chief Financial
Officer since 2012 | Vice President, ACS (February 2000 to present) |
Robert J.
Leach
(1966) | Vice President
since 2006 and
Assistant Treasurer
since 2012 | Vice President, ACS (February 2000 to present) |
David H.
Reinmiller
(1963) | Vice President
since 2000 | Attorney, ACC (January 1994 to present); Associate General Counsel, ACC (January 2001 to present). Also serves as Vice President, ACIM and ACS |
Ward D.
Stauffer
(1960) | Secretary
since 2005 | Attorney, ACC (June 2003 to present) |
|
|
| Approval of Management Agreement |
At a meeting held on June 18, 2014, the Fund’s Board of Directors unanimously approved the renewal of the management agreement pursuant to which American Century Investment Management, Inc. (the “Advisor”) acts as the investment advisor for the Fund. Under Section 15(c) of the Investment Company Act, contracts for investment advisory services are required to be reviewed, evaluated, and approved by a majority of a fund’s directors (the “Directors”), including a majority of the independent Directors, each year.
Prior to its consideration of the renewal of the management agreement, the Board requested and reviewed extensive data and information compiled by the Advisor and certain independent providers of evaluation data concerning the Fund and the services provided to the Fund by the Advisor. This review was in addition to the oversight and evaluation undertaken by the Board and its committees on a continuous basis and the information received was supplemental to the extensive information that the Board and its committees receive and consider throughout the year.
In connection with its consideration of the renewal of the management agreement, the Board’s review and evaluation of the services provided by the Advisor included, but was not limited to, the following:
| |
| • | the nature, extent, and quality of investment management, shareholder services, and other services provided by the Advisor to the Fund; |
| |
| • | the wide range of other programs and services the Advisor provides to the Fund and its shareholders on a routine and non-routine basis; |
| |
| • | the Fund’s investment performance compared to appropriate benchmarks and/or a peer group of other mutual funds with similar investment objectives and strategies; |
| |
| • | the cost of owning the Fund compared to the cost of owning similar funds; |
| |
| • | the Advisor’s compliance policies, procedures, and regulatory experience; |
| |
| • | financial data showing the cost of services provided to the Fund, the profitability of the Fund to the Advisor, and the overall profitability of the Advisor; |
| |
| • | possible economies of scale associated with the Advisor’s management of the Fund and other accounts under its management; |
| |
| • | the services provided and charges to other investment management clients of the Advisor; |
| |
| • | acquired fund fees and expenses; and |
| |
| • | any collateral benefits derived by the Advisor from the management of the Fund. |
In keeping with its practice, the Board held two in-person meetings and one telephonic meeting to review and discuss the information provided. The independent Directors also had the benefit of the advice of their independent counsel throughout the process.
Factors Considered
The Directors considered all of the information provided by the Advisor, the independent data providers, and independent counsel, and evaluated such information for the Fund. In connection with their review, the Directors did not identify any single factor as being all-important or controlling, and each Director may have attributed different levels of importance to different factors. In deciding to renew the management agreement, the Board based its decision on a number of factors, including the following:
Nature, Extent and Quality of Services — Generally. Under the management agreement, the Advisor is responsible for providing or arranging for all services necessary for the operation of the Fund. The Board noted that under the management agreement, the Advisor provides or arranges at its own expense a wide variety of services including:
| |
| • | constructing and designing the Fund |
| |
| • | portfolio research and security selection |
| |
| • | initial capitalization/funding |
| |
| • | daily valuation of the Fund’s portfolio |
| |
| • | shareholder servicing and transfer agency, including shareholder confirmations, recordkeeping, and communications |
| |
| • | legal services (except the independent Directors’ counsel) |
| |
| • | regulatory and portfolio compliance |
| |
| • | marketing and distribution (except Rule 12b-1 plans) |
The Board noted that many of these services have expanded over time both in terms of quantity and complexity in response to shareholder demands, competition in the industry, changing distribution channels, and the changing regulatory environment.
Investment Management Services. The nature of the investment management services provided to the Fund is quite complex and allows Fund shareholders access to professional money management, instant diversification of their investments within an asset class, the opportunity to easily diversify among asset classes by investing in or exchanging among various American Century Investments funds, and liquidity. In evaluating investment performance, the Board expects the Advisor to manage the Fund in accordance with its investment objectives and approved strategies. Further, the Directors recognize that the Advisor has an obligation to monitor trading activities, and in particular to seek the best execution of fund trades, and to evaluate the use of and payment for research. In providing these services, the Advisor utilizes teams of investment professionals (portfolio managers, analysts, research assistants, and securities traders) who require extensive information technology, research, training, compliance and other systems to conduct their business. The Board, directly and through its Fund Performance Review Committee, regularly reviews investment performance information for the Fund, together with comparative information for appropriate benchmarks and/or peer groups of similarly-managed funds, over different time horizons. The Directors also review detailed performance information during the management agreement approval process. If performance concerns are identified, the Fund receives special reviews until performance improves, during which the Board discusses with the Advisor the reasons for such results (e.g., market conditions, security selection) and any efforts being undertaken to improve performance. The Fund’s performance was above its benchmark for the one-, three-, and five-year periods reviewed by the Board. The Board found the investment management services provided by the Advisor to the Fund to be satisfactory and consistent with the management agreement.
Shareholder and Other Services. Under the management agreement, the Advisor provides the Fund with a comprehensive package of transfer agency, shareholder, and other services. The Board, directly and through various committees of the Board, regularly reviews reports and evaluations of such services at its regular meetings. These reports include, but are not limited to, information regarding the operational efficiency and accuracy of the shareholder and transfer agency services provided, staffing levels, shareholder satisfaction (as measured by external as well as internal sources), technology support, new products and services offered to Fund shareholders, securities trading activities, portfolio valuation services, auditing services, and legal and operational compliance activities. Certain aspects of shareholder and transfer agency service level efficiency and the quality of securities trading activities are measured by independent third party providers and are presented in comparison to other fund groups not managed by the Advisor. The Board
found the services provided by the Advisor to the Fund under the management agreement to be competitive and of high quality.
Costs of Services and Profitability. The Advisor provides detailed information concerning its cost of providing various services to the Fund, its profitability in managing the Fund (pre- and post-distribution), its overall profitability, and its financial condition. The Directors have reviewed with the Advisor the methodology used to prepare this financial information. The financial information regarding the Advisor is considered in evaluating the Advisor’s financial condition, its ability to continue to provide services under the management agreement, and the reasonableness of the current management fee. The Board concluded that the Advisor’s profits were reasonable in light of the services provided to the Fund.
Ethics. The Board generally considers the Advisor’s commitment to providing quality services to shareholders and to conducting its business ethically. They noted that the Advisor’s practices generally meet or exceed industry best practices.
Economies of Scale. The Board also reviewed information provided by the Advisor regarding the possible existence of economies of scale in connection with the management of the Fund. The Board concluded that economies of scale are difficult to measure and predict with precision, especially on a fund-by-fund basis. The Board concluded that the Advisor is appropriately sharing economies of scale through its competitive fee structure, offering competitive fees from fund inception, and through reinvestment in its business to provide shareholders additional content and services.
Comparison to Other Funds’ Fees. The management agreement provides that the Fund pays the Advisor a single, all-inclusive (or unified) management fee for providing all services necessary for the management and operation of the Fund, other than brokerage expenses, taxes, interest, extraordinary expenses, and the fees and expenses of the Fund’s independent directors (including their independent legal counsel) and expenses incurred in connection with the provision of shareholder services and distribution services under a plan adopted pursuant to Rule 12b-1 under the 1940 Act. Under the unified fee structure, the Advisor is responsible for providing all investment advisory, custody, audit, administrative, compliance, recordkeeping, marketing and shareholder services, or arranging and supervising third parties to provide such services. By contrast, most other funds are charged a variety of fees, including an investment advisory fee, a transfer agency fee, an administrative fee, distribution charges and other expenses. Other than their investment advisory fees and any applicable Rule 12b-1 distribution fees, all other components of the total fees charged by these other funds may be increased without shareholder approval. The Board believes the unified fee structure is a benefit to Fund shareholders because it clearly discloses to shareholders the cost of owning Fund shares, and, since the unified fee cannot be increased without a vote of Fund shareholders, it shifts to the Advisor the risk of increased costs of operating the Fund and provides a direct incentive to minimize administrative inefficiencies. Part of the Board’s analysis of fee levels involves reviewing certain evaluative data compiled by an independent provider comparing the Fund’s unified fee to the total expense ratios of its peers. The unified fee charged to shareholders of the Fund was slightly above the median of the total expense ratios of the Fund’s peer expense universe and was within the range of its peer expense group. The Board and the Advisor agreed to certain adjustments regarding the breakpoints in the Fund’s unified management fee schedule, including changing the number of breakpoints and the investment amount that applies to each breakpoint, beginning August 1, 2014. The Board concluded that the management fee paid by the Fund to the Advisor under the management agreement is reasonable in light of the services provided to the Fund.
Comparison to Fees and Services Provided to Other Clients of the Advisor. The Board also requested and received information from the Advisor concerning the nature of the services, fees, costs and profitability of its advisory services to advisory clients other than the Fund. They observed that these varying types of client accounts require different services and involve different regulatory and entrepreneurial risks than the management of the Fund. The Board analyzed this
information and concluded that the fees charged and services provided to the Fund were reasonable by comparison.
Collateral or “Fall-Out” Benefits Derived by the Advisor. The Board considered the existence of collateral benefits the Advisor may receive as a result of its relationship with the Fund. They concluded that the Advisor’s primary business is managing mutual funds and it generally does not use fund or shareholder information to generate profits in other lines of business, and therefore does not derive any significant collateral benefits from them. The Board noted that the Advisor receives proprietary research from broker-dealers that execute fund portfolio transactions and concluded that this research is likely to benefit Fund shareholders. The Board also determined that the Advisor is able to provide investment management services to certain clients other than the Fund, at least in part, due to its existing infrastructure built to serve the fund complex. The Board concluded, however, that the assets of those other clients are not material to the analysis and, where applicable, may be included with the assets of the Fund to determine breakpoints in the management fee schedule.
Existing Relationship. The Board also considered whether there was any reason for not continuing the existing arrangement with the Advisor. In this regard, the Board was mindful of the potential disruptions of the Fund’s operations and various risks, uncertainties, and other effects that could occur as a result of a decision not to continue such relationship. In particular, the Board recognized that most shareholders have invested in the Fund on the strength of the Advisor’s industry standing and reputation and in the expectation that the Advisor will have a continuing role in providing advisory services to the Fund.
Conclusion of the Directors. As a result of this process, the Board, including all of the independent Directors, taking into account all of the factors discussed above and the information provided by the Advisor and others, concluded that the management agreement between the Fund and the Advisor is fair and reasonable in light of the services provided and should be renewed.
Retirement Account Information
As required by law, distributions you receive from certain IRAs are subject to federal income tax withholding, unless you elect not to have withholding apply. Tax will be withheld on the total amount withdrawn even though you may be receiving amounts that are not subject to withholding, such as nondeductible contributions. In such case, excess amounts of withholding could occur. You may adjust your withholding election so that a greater or lesser amount will be withheld.
If you don’t want us to withhold on this amount, you must notify us to not withhold the federal income tax. You may notify us in writing or in certain situations by telephone or through other electronic means. For systematic withdrawals, your withholding election will remain in effect until revoked or changed by filing a new election. You have the right to revoke your election at any time.
Remember, even if you elect not to have income tax withheld, you are liable for paying income tax on the taxable portion of your withdrawal. If you elect not to have income tax withheld or you don’t have enough income tax withheld, you may be responsible for payment of estimated tax. You may incur penalties under the estimated tax rules if your withholding and estimated tax payments are not sufficient. You can reduce or defer the income tax on a distribution by directly or indirectly rolling such distribution over to another IRA or eligible plan. You should consult your tax advisor for additional information.
State tax will be withheld if, at the time of your distribution, your address is within one of the mandatory withholding states and you have federal income tax withheld (or as otherwise required by state law). State taxes will be withheld from your distribution in accordance with the respective state rules.
Distributions you receive from 403(b), 457 and qualified plans are subject to special tax and withholding rules. Your plan administrator or plan sponsor is required to provide you with a special tax notice explaining those rules at the time you request a distribution. If applicable, federal and/or state taxes may be withheld from your distribution amount.
Proxy Voting Policies
A description of the policies that the fund's investment advisor uses in exercising the voting rights associated with the securities purchased and/or held by the fund is available without charge, upon request, by calling 1-800-345-2021. It is also available on the "About Us" page of American Century Investments’ website at americancentury.com and on the Securities and Exchange Commission’s website at sec.gov. Information regarding how the investment advisor voted proxies relating to portfolio securities during the most recent 12-month period ended June 30 is available on the "About Us" page at americancentury.com. It is also available at sec.gov.
Quarterly Portfolio Disclosure
The fund files its complete schedule of portfolio holdings with the Securities and Exchange Commission (SEC) for the first and third quarters of each fiscal year on Form N-Q. The fund’s Forms N-Q are available on the SEC’s website at sec.gov, and may be reviewed and copied at the SEC’s Public Reference Room in Washington, DC. Information on the operation of the Public Reference Room may be obtained by calling 1-800-SEC-0330. The fund also makes its complete schedule of portfolio holdings for the most recent quarter of its fiscal year available on its
website at americancentury.com and, upon request, by calling 1-800-345-2021.
Other Tax Information
The following information is provided pursuant to provisions of the Internal Revenue Code.
The fund hereby designates up to the maximum amount allowable as qualified dividend income for the fiscal year ended October 31, 2014.
For corporate taxpayers, the fund hereby designates $2,186,146, or up to the maximum amount allowable, of ordinary income distributions paid during the fiscal year ended October 31, 2014 as qualified for the corporate dividends received deduction.
|
| | |
| |
| | | |
| Contact Us | americancentury.com | |
| Automated Information Line | 1-800-345-8765 | |
| Investor Services Representative | 1-800-345-2021 or 816-531-5575 | |
| Investors Using Advisors | 1-800-378-9878 | |
| Business, Not-For-Profit, Employer-Sponsored Retirement Plans | 1-800-345-3533 | |
| Banks and Trust Companies, Broker-Dealers, Financial Professionals, Insurance Companies | 1-800-345-6488 | |
| Telecommunications Relay Service for the Deaf | 711 | |
| | | |
| American Century Mutual Funds, Inc. | |
| | | |
Investment Advisor: American Century Investment Management, Inc. Kansas City, Missouri | |
| | | |
| This report and the statements it contains are submitted for the general information of our shareholders. The report is not authorized for distribution to prospective investors unless preceded or accompanied by an effective prospectus. | |
| | | |
©2014 American Century Proprietary Holdings, Inc. All rights reserved.
CL-ANN-83999 1412 | |
|
| |
| ANNUAL REPORT | OCTOBER 31, 2014 |
Growth Fund
|
| |
| President’s Letter | |
| Performance | |
| Portfolio Commentary | |
| Fund Characteristics | |
| Shareholder Fee Example | |
| Schedule of Investments | |
| Statement of Assets and Liabilities | |
| Statement of Operations | |
| Statement of Changes in Net Assets | |
| Notes to Financial Statements | |
| Financial Highlights | |
| Report of Independent Registered Public Accounting Firm | |
| Management | |
| Approval of Management Agreement | |
| Additional Information | |
Any opinions expressed in this report reflect those of the author as of the date of the report, and do not necessarily represent the opinions of American Century Investments® or any other person in the American Century Investments organization. Any such opinions are subject to change at any time based upon market or other conditions and American Century Investments disclaims any responsibility to update such opinions. These opinions may not be relied upon as investment advice and, because investment decisions made by American Century Investments funds are based on numerous factors, may not be relied upon as an indication of trading intent on behalf of any American Century Investments fund. Security examples are used for representational purposes only and are not intended as recommendations to purchase or sell securities. Performance information for comparative indices and securities is provided to American Century Investments by third party vendors. To the best of American Century Investments’ knowledge, such information is accurate at the time of printing.
|
| |
| Dear Investor:
Thank you for reviewing this annual report for the 12 months ended October 31, 2014. It provides investment performance and portfolio information for the reporting period, plus longer-term historical performance data.
Annual reports remain important vehicles for conveying information about fund returns, including market and economic factors that affected performance during the reporting period. For additional, updated investment and market insights, we encourage you to visit our website, americancentury.com. |
| Jonathan Thomas |
Favorable Fiscal Year for U.S. Stocks and Bonds
Mostly stimulative monetary policies by central banks and expectations of longer-term economic improvement, interspersed with concerns about nearer-term weaker-than-expected global economic data and geopolitical conflicts, helped drive financial market returns during the reporting period. We believe the combination of longer-term optimism about U.S. economic growth, low costs of capital, and continued central bank stimulus (even as the U.S. Federal Reserve’s latest monthly bond purchase program ended) helped persuade investors to seek risk and yield, which benefited U.S. stocks and bonds. The S&P 500 Index gained 17.27% during the 12 months. The 30-year U.S. Treasury bond was close behind, returning 15.44%, according to Barclays. U.S. real estate investment trusts (REITs), whose shares combine performance attributes of stocks and bonds, benefited from both—the MSCI U.S. REIT Index advanced 19.19%.
U.S. market benchmark returns generally outpaced their non-U.S. counterparts. The U.S. was perceived by investors as a relative bastion of growth, stability, and potentially attractive yields compared with most of the rest of the world, so capital flows generally favored U.S. assets. These capital flows, along with weaker-than-expected global growth, lower-than-expected global inflation, and falling commodity and energy prices, helped keep long-term interest rates and other corporate costs low. U.S. stocks just completed a solid third-quarter earnings reporting season, though questions remain about next year’s revenues, given this year’s slowdown in global economic growth and concerns about how far it could extend into 2015.
We believe continuing global economic and geopolitical uncertainties could continue to support the relative appeal of U.S. assets in coming months. But the end of the U.S. Federal Reserve’s monthly bond-buying program and the still-looming possibility of higher interest rates in 2015 point to potential U.S. market volatility ahead. In this environment, we continue to believe in a disciplined, diversified, long-term investment approach, using professionally managed stock and bond portfolios for meeting financial goals. We appreciate your continued trust in us.
Sincerely,
Jonathan Thomas
President and Chief Executive Officer
American Century Investments
|
| | | | | | |
| Total Returns as of October 31, 2014 | |
| | | | Average Annual Returns | |
| | Ticker Symbol | 1 year | 5 years | 10 years | Since Inception | Inception Date |
| Investor Class | TWCGX | 13.84% | 15.18% | 8.48% | 13.49% | 6/30/71(1) |
| Russell 1000 Growth Index | — | 17.11% | 17.42% | 9.05% | N/A(2) | — |
| Institutional Class | TWGIX | 14.03% | 15.41% | 8.70% | 6.73% | 6/16/97 |
A Class(3) | TCRAX | | | | | 6/4/97 |
| No sales charge* | | 13.53% | 14.90% | 8.21% | 6.56% | |
| With sales charge* | | 7.00% | 13.54% | 7.58% | 6.20% | |
| C Class | TWRCX | 12.71% | — | — | 13.03% | 3/1/10 |
| R Class | AGWRX | 13.26% | 14.61% | 7.94% | 8.05% | 8/29/03 |
| R6 Class | AGRDX | 14.20% | — | — | 17.45% | 7/26/13 |
| |
| * | Sales charges include initial sales charges and contingent deferred sales charges (CDSCs), as applicable. A Class shares have a 5.75% maximum initial sales charge and may be subject to a maximum CDSC of 1.00%. C Class shares redeemed within 12 months of purchase are subject to a maximum CDSC of 1.00%. The SEC requires that mutual funds provide performance information net of maximum sales charges in all cases where charges could be applied. |
| |
| (1) | Although the fund’s actual inception date was October 31, 1958, this inception date corresponds with the investment advisor’s implementation of its current investment philosophy and practices. |
| |
| (2) | Benchmark data first available December 1978. |
| |
| (3) | Prior to March 1, 2010, the A Class was referred to as the Advisor Class and did not have a front-end sales charge. Performance has been adjusted to reflect this charge. |
Data presented reflect past performance. Past performance is no guarantee of future results. Current performance may be higher or lower than the performance shown. Investment return and principal value will fluctuate, and redemption value may be more or less than original cost. Data assumes reinvestment of dividends and capital gains, and none of the charts reflect the deduction of taxes that a shareholder would pay on fund distributions or the redemption of fund shares. To obtain performance data current to the most recent month end, please call 1-800-345-2021 or visit americancentury.com. For additional information about the fund, please consult the prospectus.
|
|
| Growth of $10,000 Over 10 Years |
| $10,000 investment made October 31, 2004 |
| Performance for other share classes will vary due to differences in fee structure. |
|
| |
| Value on October 31, 2014 |
| | Investor Class — $22,582 |
| |
| | Russell 1000 Growth Index — $23,790 |
| |
|
| | | | | |
| Total Annual Fund Operating Expenses |
| Investor Class | Institutional Class | A Class | C Class | R Class | R6 Class |
| 0.97% | 0.77% | 1.22% | 1.97% | 1.47% | 0.62% |
The total annual fund operating expenses shown is as stated in the fund’s prospectus current as of the date of this report. The prospectus may vary from the expense ratio shown elsewhere in this report because it is based on a different time period, includes acquired fund fees and expenses, and, if applicable, does not include fee waivers or expense reimbursements.
Data presented reflect past performance. Past performance is no guarantee of future results. Current performance may be higher or lower than the performance shown. Investment return and principal value will fluctuate, and redemption value may be more or less than original cost. Data assumes reinvestment of dividends and capital gains, and none of the charts reflect the deduction of taxes that a shareholder would pay on fund distributions or the redemption of fund shares. To obtain performance data current to the most recent month end, please call 1-800-345-2021 or visit americancentury.com. For additional information about the fund, please consult the prospectus.
Portfolio Managers: Greg Woodhams and Prescott LeGard
Performance Summary
Growth returned 13.84%* in the 12 months ended October 31, 2014, compared with the 17.11% return of its benchmark, the Russell 1000 Growth Index.
Information technology stocks contributed most to absolute returns. Energy was the only sector to detract from performance in absolute terms. Relative to the benchmark, the health care and energy sectors were the leading detractors, driven by stock selection decisions. Materials and consumer staples stocks contributed most to relative results.
Health Care Detracted Most
Positioning in the health care sector detracted most from performance relative to the Russell 1000 Growth Index. Stock choices meant the pharmaceutical industry underperformed, led by a stake in Bristol-Myers Squibb. We eliminated the position. An underweight position and stock selection decisions in the biotechnology industry also weighed on performance. It hurt to be underrepresented in shares of Amgen, a position we eliminated. We were also underrepresented in Gilead Sciences, though we increased our stake in Gilead later in the period.
Other Notable Detractors
Stock selection detracted from relative results in the energy sector. Positioning among oil, gas, and consumable fuels companies hurt most. North American energy exploration and production firms Noble Energy and Concho Resources suffered temporarily from a slowdown in takeaway capacity, while EOG Resources lagged as energy prices softened. We sold our stakes in Noble and EOG.
One of the leading individual detractors for the fiscal year was electronics retailer Best Buy. The company made progress on its turnaround in 2013, but reported much weaker-than-expected holiday sales amid a promotional sales environment that failed to drive higher industry demand. The promotions hit both the top line and margins, causing the company to miss earnings and lower future guidance. We eliminated the position.
Computers and peripherals giant Apple was a notable detractor from performance compared with the benchmark. The stock is a sizable holding, but we nevertheless have relatively less exposure than the index, believing it is difficult for Apple to continue to rapidly improve earnings; however, the stock did well as a result of excitement around new product launches. An underweight position in software giant Microsoft detracted from relative results. The company lowered guidance, consistent with our less sanguine outlook for the business and we sold the stock. Nevertheless, the stock benefited from price-to-earnings multiple expansion, excitement around moving Office 365 to a subscription model, and the announcement of the Windows 10 operating system.
| |
| * | All fund returns referenced in this commentary are for Investor Class shares. Performance for other share classes will vary due to differences in fee structure; when Investor Class performance exceeds that of the fund’s benchmark, other share classes may not. See page 3 for returns for all share classes. |
Materials and Staples Helped Most
An underweight position and stock selection decisions made materials stocks the leading contributors to relative results. Chemicals companies contributed most to outperformance thanks to an underweight position and stock choices. Stock selection also drove outperformance in the consumer staples sector. Positioning among beverages and food products companies helped most. Notable contributors in the materials sector were LyondellBasell Industries and The Dow Chemical Company, and Mead Johnson Nutrition in the staples sector. We ultimately sold our stakes in Dow and LyondellBasell.
Significant Individual Contributors
The largest contribution to relative performance came from a stake in hotelier Marriott International, which enjoyed solid profit growth as room capacity and rates are attractive after years of little or no room growth in the industry. It was also beneficial to have no exposure to technology firm International Business Machines and to be underrepresented in shares of internet retailer Amazon.com. We eliminated Amazon earlier in 2014 as the company saw capital expenditures rise and margins fall.
Biotech stock Alexion Pharmaceuticals gained on a very strong earnings report and investor enthusiasm for the company’s revised tax structure, which should lead to lower tax rates (and more profits) going forward. Rail transportation company Union Pacific was another notable contributor to relative return. Because new sources of crude oil often don’t have a pipeline infrastructure to the coasts, rail has emerged as a necessary means of crude transport. Additionally, railroads are seeing sharp increases in volumes of sand used in hydraulic fracturing. Software maker Electronic Arts benefited from continued margin expansion, and better-than-expected sales of new games.
Current Positioning
In our opinion, stock selection—rather than sector allocation or market timing via the use of cash—is the most efficient means of generating superior risk-adjusted returns. As a result of this approach, the portfolio’s sector and industry selection as well as capitalization range allocations are primarily a result of identifying what we believe to be superior individual securities.
As of October 31, 2014, the health care sector was the portfolio’s largest overweight position relative to the benchmark. We favored health care equipment and supplies and pharmaceuticals companies. Medical device companies should see a better environment from higher utilization rates in the U.S., as well as getting the medical device tax. Device pipelines, however, are not universally robust, so security selection in this space is crucial to differentiate among market participants. At the other end of the spectrum, the underweight position in the materials sector is attributable in part to our decision to eliminate the fund’s stake in chemical firm Monsanto. We worried about the outlook for seed purchases given falling corn prices.
|
| |
| OCTOBER 31, 2014 | |
| Top Ten Holdings | % of net assets |
| Apple, Inc. | 4.8% |
| Visa, Inc., Class A | 3.9% |
| PepsiCo, Inc. | 3.4% |
| Comcast Corp., Class A | 3.2% |
| Boeing Co. (The) | 2.4% |
| Union Pacific Corp. | 2.3% |
| Facebook, Inc., Class A | 2.2% |
| Lockheed Martin Corp. | 2.2% |
| CVS Health Corp. | 2.1% |
| Gilead Sciences, Inc. | 2.1% |
| | |
| Top Five Industries | % of net assets |
| Internet Software and Services | 7.5% |
| Biotechnology | 6.5% |
| Aerospace and Defense | 6.5% |
| IT Services | 6.4% |
| Media | 6.3% |
| | |
| Types of Investments in Portfolio | % of net assets |
| Common Stocks | 99.7% |
| Temporary Cash Investments | 0.4% |
| Other Assets and Liabilities | (0.1)% |
Fund shareholders may incur two types of costs: (1) transaction costs, including sales charges (loads) on purchase payments and redemption/exchange fees; and (2) ongoing costs, including management fees; distribution and service (12b-1) fees; and other fund expenses. This example is intended to help you understand your ongoing costs (in dollars) of investing in your fund and to compare these costs with the ongoing cost of investing in other mutual funds.
The example is based on an investment of $1,000 made at the beginning of the period and held for the entire period from May 1, 2014 to October 31, 2014.
Actual Expenses
The table provides information about actual account values and actual expenses for each class. You may use the information, together with the amount you invested, to estimate the expenses that you paid over the period. First, identify the share class you own. Then simply divide your account value by $1,000 (for example, an $8,600 account value divided by $1,000 = 8.6), then multiply the result by the number under the heading “Expenses Paid During Period” to estimate the expenses you paid on your account during this period.
If you hold Investor Class shares of any American Century Investments fund, or Institutional Class shares of the American Century Diversified Bond Fund, in an American Century Investments account (i.e., not a financial intermediary or retirement plan account), American Century Investments may charge you a $12.50 semiannual account maintenance fee if the value of those shares is less than $10,000. We will redeem shares automatically in one of your accounts to pay the $12.50 fee. In determining your total eligible investment amount, we will include your investments in all personal accounts (including American Century Investments Brokerage accounts) registered under your Social Security number. Personal accounts include individual accounts, joint accounts, UGMA/UTMA accounts, personal trusts, Coverdell Education Savings Accounts and IRAs (including traditional, Roth, Rollover, SEP-, SARSEP- and SIMPLE-IRAs), and certain other retirement accounts. If you have only business, business retirement, employer-sponsored or American Century Investments Brokerage accounts, you are currently not subject to this fee. If you are subject to the Account Maintenance Fee, your account value could be reduced by the fee amount.
Hypothetical Example for Comparison Purposes
The table also provides information about hypothetical account values and hypothetical expenses based on the actual expense ratio of each class of your fund and an assumed rate of return of 5% per year before expenses, which is not the actual return of a fund’s share class. The hypothetical account values and expenses may not be used to estimate the actual ending account balance or expenses you paid for the period. You may use this information to compare the ongoing costs of investing in your fund and other funds. To do so, compare this 5% hypothetical example with the 5% hypothetical examples that appear in the shareholder reports of the other funds.
Please note that the expenses shown in the table are meant to highlight your ongoing costs only and do not reflect any transactional costs, such as sales charges (loads) or redemption/exchange fees. Therefore, the table is useful in comparing ongoing costs only, and will not help you determine the relative total costs of owning different funds. In addition, if these transactional costs were included, your costs would have been higher.
|
| | | | |
| Beginning
Account Value
5/1/14 | Ending
Account Value
10/31/14 | Expenses Paid
During Period(1)5/1/14 - 10/31/14 | Annualized
Expense Ratio(1) |
| Actual | | | | |
| Investor Class | $1,000 | $1,075.00 | $5.07 | 0.97% |
| Institutional Class | $1,000 | $1,075.70 | $4.03 | 0.77% |
| A Class | $1,000 | $1,073.40 | $6.38 | 1.22% |
| C Class | $1,000 | $1,069.40 | $10.28 | 1.97% |
| R Class | $1,000 | $1,072.30 | $7.68 | 1.47% |
| R6 Class | $1,000 | $1,076.60 | $3.25 | 0.62% |
| Hypothetical | | | | |
| Investor Class | $1,000 | $1,020.32 | $4.94 | 0.97% |
| Institutional Class | $1,000 | $1,021.32 | $3.92 | 0.77% |
| A Class | $1,000 | $1,019.06 | $6.21 | 1.22% |
| C Class | $1,000 | $1,015.28 | $10.01 | 1.97% |
| R Class | $1,000 | $1,017.80 | $7.48 | 1.47% |
| R6 Class | $1,000 | $1,022.08 | $3.16 | 0.62% |
| |
| (1) | Expenses are equal to the class's annualized expense ratio listed in the table above, multiplied by the average account value over the period, multiplied by 184, the number of days in the most recent fiscal half-year, divided by 365, to reflect the one-half year period. |
OCTOBER 31, 2014
|
| | | | | |
| | Shares | Value |
| COMMON STOCKS — 99.7% | | |
| Aerospace and Defense — 6.5% | | |
| Boeing Co. (The) | 1,940,890 |
| $ | 242,436,570 |
|
| Honeywell International, Inc. | 734,691 |
| 70,618,499 |
|
| Lockheed Martin Corp. | 1,135,333 |
| 216,360,410 |
|
| Precision Castparts Corp. | 214,503 |
| 47,340,812 |
|
| Raytheon Co. | 630,591 |
| 65,505,793 |
|
| | | 642,262,084 |
|
| Airlines — 0.8% | | |
| Alaska Air Group, Inc. | 1,433,282 |
| 76,293,601 |
|
| Automobiles — 0.6% | | |
| Harley-Davidson, Inc. | 929,745 |
| 61,084,247 |
|
| Banks — 2.8% | | |
| SunTrust Banks, Inc. | 3,046,494 |
| 119,239,775 |
|
| Wells Fargo & Co. | 2,923,554 |
| 155,211,482 |
|
| | | 274,451,257 |
|
| Beverages — 3.5% | | |
| Brown-Forman Corp., Class B | 99,203 |
| 9,193,142 |
|
| PepsiCo, Inc. | 3,487,130 |
| 335,357,292 |
|
| | | 344,550,434 |
|
| Biotechnology — 6.5% | | |
Alexion Pharmaceuticals, Inc.(1) | 859,276 |
| 164,431,055 |
|
Biogen Idec, Inc.(1) | 478,793 |
| 153,730,857 |
|
Gilead Sciences, Inc.(1) | 1,851,199 |
| 207,334,288 |
|
Incyte Corp.(1) | 776,206 |
| 52,052,374 |
|
Regeneron Pharmaceuticals, Inc.(1) | 166,484 |
| 65,548,081 |
|
| | | 643,096,655 |
|
| Capital Markets — 2.5% | | |
| Franklin Resources, Inc. | 1,839,183 |
| 102,276,966 |
|
| Invesco Ltd. | 3,525,521 |
| 142,677,835 |
|
| | | 244,954,801 |
|
| Chemicals — 1.7% | | |
| PPG Industries, Inc. | 461,960 |
| 94,096,632 |
|
| Sherwin-Williams Co. (The) | 330,559 |
| 75,883,124 |
|
| | | 169,979,756 |
|
| Commercial Services and Supplies — 0.9% | | |
| Tyco International Ltd. | 2,105,614 |
| 90,394,009 |
|
| Communications Equipment — 2.0% | | |
| QUALCOMM, Inc. | 2,490,588 |
| 195,536,064 |
|
| Electrical Equipment — 0.5% | | |
Generac Holdings, Inc.(1) | 1,205,541 |
| 54,659,229 |
|
| Energy Equipment and Services — 0.4% | | |
| Baker Hughes, Inc. | 701,733 |
| 37,163,780 |
|
|
| | | | | |
| | Shares | Value |
| Food and Staples Retailing — 2.1% | | |
| CVS Health Corp. | 2,481,936 |
| $ | 212,974,928 |
|
| Food Products — 1.8% | | |
| Hershey Co. (The) | 1,009,959 |
| 96,865,168 |
|
| Mead Johnson Nutrition Co. | 849,564 |
| 84,370,201 |
|
| | | 181,235,369 |
|
| Health Care Equipment and Supplies — 4.5% | | |
| C.R. Bard, Inc. | 823,459 |
| 135,022,572 |
|
| DENTSPLY International, Inc. | 1,556,545 |
| 79,025,790 |
|
DexCom, Inc.(1) | 132,239 |
| 5,944,143 |
|
Intuitive Surgical, Inc.(1) | 128,606 |
| 63,762,855 |
|
| Medtronic, Inc. | 1,695,295 |
| 115,551,307 |
|
Mettler-Toledo International, Inc.(1) | 169,241 |
| 43,743,721 |
|
| | | 443,050,388 |
|
| Health Care Providers and Services — 2.0% | | |
| Cardinal Health, Inc. | 1,278,157 |
| 100,309,761 |
|
Express Scripts Holding Co.(1) | 1,244,339 |
| 95,590,122 |
|
| | | 195,899,883 |
|
| Health Care Technology — 0.5% | | |
Cerner Corp.(1) | 864,919 |
| 54,783,969 |
|
| Hotels, Restaurants and Leisure — 2.1% | | |
Chipotle Mexican Grill, Inc.(1) | 84,286 |
| 53,774,468 |
|
| Marriott International, Inc., Class A | 2,098,260 |
| 158,943,195 |
|
| | | 212,717,663 |
|
| Household Products — 1.0% | | |
| Church & Dwight Co., Inc. | 1,343,067 |
| 97,251,481 |
|
| Internet and Catalog Retail — 2.5% | | |
| Expedia, Inc. | 1,563,266 |
| 132,830,712 |
|
Priceline Group, Inc. (The)(1) | 97,066 |
| 117,081,980 |
|
| | | 249,912,692 |
|
| Internet Software and Services — 7.5% | | |
eBay, Inc.(1) | 2,591,749 |
| 136,066,823 |
|
Facebook, Inc., Class A(1) | 2,963,179 |
| 222,208,793 |
|
Google, Inc., Class A(1) | 315,286 |
| 179,041,461 |
|
LinkedIn Corp., Class A(1) | 208,390 |
| 47,712,974 |
|
Pandora Media, Inc.(1) | 2,347,597 |
| 45,261,670 |
|
VeriSign, Inc.(1) | 847,642 |
| 50,655,086 |
|
Yelp, Inc.(1) | 1,051,210 |
| 63,072,600 |
|
| | | 744,019,407 |
|
| IT Services — 6.4% | | |
Alliance Data Systems Corp.(1) | 407,041 |
| 115,335,067 |
|
Fiserv, Inc.(1) | 1,176,578 |
| 81,748,640 |
|
Teradata Corp.(1) | 1,147,694 |
| 48,570,410 |
|
| Visa, Inc., Class A | 1,605,173 |
| 387,536,917 |
|
| | | 633,191,034 |
|
|
| | | | | |
| | Shares | Value |
| Life Sciences Tools and Services — 0.8% | | |
Illumina, Inc.(1) | 116,987 |
| $ | 22,529,357 |
|
Waters Corp.(1) | 516,634 |
| 57,243,047 |
|
| | | 79,772,404 |
|
| Machinery — 3.4% | | |
| Caterpillar, Inc. | 1,005,100 |
| 101,927,191 |
|
| Parker-Hannifin Corp. | 895,626 |
| 113,771,371 |
|
WABCO Holdings, Inc.(1) | 633,500 |
| 61,690,230 |
|
| Wabtec Corp. | 745,900 |
| 64,371,170 |
|
| | | 341,759,962 |
|
| Media — 6.3% | | |
| Comcast Corp., Class A | 5,751,163 |
| 318,326,872 |
|
| Scripps Networks Interactive, Inc., Class A | 614,305 |
| 47,448,918 |
|
Sirius XM Holdings, Inc.(1) | 15,843,666 |
| 54,343,774 |
|
| Walt Disney Co. (The) | 2,237,780 |
| 204,488,337 |
|
| | | 624,607,901 |
|
| Multiline Retail — 1.1% | | |
| Macy's, Inc. | 1,878,384 |
| 108,608,163 |
|
| Oil, Gas and Consumable Fuels — 4.2% | | |
Concho Resources, Inc.(1) | 542,067 |
| 59,101,565 |
|
| Exxon Mobil Corp. | 2,096,610 |
| 202,763,153 |
|
| Occidental Petroleum Corp. | 502,933 |
| 44,725,832 |
|
| Phillips 66 | 1,484,647 |
| 116,544,789 |
|
| | | 423,135,339 |
|
| Personal Products — 0.9% | | |
| Estee Lauder Cos., Inc. (The), Class A | 1,191,604 |
| 89,584,789 |
|
| Pharmaceuticals — 2.8% | | |
| Johnson & Johnson | 1,204,719 |
| 129,844,614 |
|
| Teva Pharmaceutical Industries Ltd. ADR | 1,825,102 |
| 103,063,510 |
|
| Zoetis, Inc. | 1,299,256 |
| 48,280,353 |
|
| | | 281,188,477 |
|
| Road and Rail — 2.3% | | |
| Union Pacific Corp. | 1,928,287 |
| 224,549,021 |
|
| Semiconductors and Semiconductor Equipment — 0.9% | | |
| Broadcom Corp., Class A | 1,298,271 |
| 54,371,590 |
|
| Xilinx, Inc. | 852,298 |
| 37,910,215 |
|
| | | 92,281,805 |
|
| Software — 4.7% | | |
Electronic Arts, Inc.(1) | 1,582,175 |
| 64,821,710 |
|
| Intuit, Inc. | 1,532,735 |
| 134,896,007 |
|
NetSuite, Inc.(1) | 596,486 |
| 64,814,169 |
|
| Oracle Corp. | 3,789,782 |
| 147,990,987 |
|
Splunk, Inc.(1) | 830,281 |
| 54,864,969 |
|
Varonis Systems, Inc.(1) | 21,865 |
| 425,930 |
|
| | | 467,813,772 |
|
|
| | | | | |
| | Shares | Value |
| Specialty Retail — 5.4% | | |
AutoZone, Inc.(1) | 251,753 |
| $ | 139,350,320 |
|
Bed Bath & Beyond, Inc.(1) | 1,525,047 |
| 102,696,665 |
|
| Gap, Inc. (The) | 1,971,241 |
| 74,690,321 |
|
O'Reilly Automotive, Inc.(1) | 140,699 |
| 24,746,140 |
|
| Ross Stores, Inc. | 910,862 |
| 73,524,781 |
|
| TJX Cos., Inc. (The) | 1,896,758 |
| 120,102,717 |
|
| | | 535,110,944 |
|
| Technology Hardware, Storage and Peripherals — 4.8% | | |
| Apple, Inc. | 4,420,910 |
| 477,458,280 |
|
| Tobacco — 1.5% | | |
| Philip Morris International, Inc. | 1,735,104 |
| 154,441,607 |
|
| Wireless Telecommunication Services — 1.5% | | |
SBA Communications Corp., Class A(1) | 1,358,761 |
| 152,629,623 |
|
TOTAL COMMON STOCKS (Cost $8,184,820,513) | | 9,912,404,818 |
|
| TEMPORARY CASH INVESTMENTS — 0.4% | | |
| Repurchase Agreement, Bank of America Merrill Lynch, (collateralized by various U.S. Treasury obligations, 1.375% - 2.625%, 12/31/14 - 2/28/19, valued at $10,537,025), in a joint trading account at 0.07%, dated 10/31/14, due 11/3/14 (Delivery value $10,332,051) | | 10,331,991 |
|
| Repurchase Agreement, Credit Suisse First Boston, Inc., (collateralized by various U.S. Treasury obligations, 0.25%, 10/15/15, valued at $4,215,684), in a joint trading account at 0.04%, dated 10/31/14, due 11/3/14 (Delivery value $4,132,811) | | 4,132,797 |
|
| Repurchase Agreement, Goldman Sachs & Co., (collateralized by various U.S. Treasury obligations, 0.125%, 12/31/14, valued at $8,439,428), in a joint trading account at 0.03%, dated 10/31/14, due 11/3/14 (Delivery value $8,265,614) | | 8,265,593 |
|
| SSgA U.S. Government Money Market Fund, Class N | 22,725,775 |
| 22,725,775 |
|
TOTAL TEMPORARY CASH INVESTMENTS (Cost $45,456,156) | | 45,456,156 |
|
TOTAL INVESTMENT SECURITIES — 100.1% (Cost $8,230,276,669) | | 9,957,860,974 |
|
| OTHER ASSETS AND LIABILITIES — (0.1)% | | (12,323,006 | ) |
| TOTAL NET ASSETS — 100.0% | | $ | 9,945,537,968 |
|
|
| | |
| NOTES TO SCHEDULE OF INVESTMENTS |
| ADR | - | American Depositary Receipt |
See Notes to Financial Statements.
|
|
| Statement of Assets and Liabilities |
|
| | | |
| OCTOBER 31, 2014 | |
| Assets | |
| Investment securities, at value (cost of $8,230,276,669) | $ | 9,957,860,974 |
|
| Receivable for investments sold | 211,532,607 |
|
| Receivable for capital shares sold | 7,750,263 |
|
| Dividends and interest receivable | 2,462,912 |
|
| | 10,179,606,756 |
|
| | |
| Liabilities | |
| Payable for investments purchased | 216,746,942 |
|
| Payable for capital shares redeemed | 9,874,571 |
|
| Accrued management fees | 7,232,490 |
|
| Distribution and service fees payable | 214,785 |
|
| | 234,068,788 |
|
| | |
| Net Assets | $ | 9,945,537,968 |
|
| | |
| Net Assets Consist of: | |
| Capital (par value and paid-in surplus) | $ | 6,221,512,337 |
|
| Undistributed net investment income | 31,909,075 |
|
| Undistributed net realized gain | 1,964,532,281 |
|
| Net unrealized appreciation | 1,727,584,275 |
|
| | $ | 9,945,537,968 |
|
|
| | | | | | |
| | Net Assets | Shares Outstanding | Net Asset Value Per Share |
| Investor Class, $0.01 Par Value |
| $6,021,114,932 |
| 170,147,412 |
| $35.39 |
| Institutional Class, $0.01 Par Value |
| $2,482,605,588 |
| 69,296,799 |
| $35.83 |
| A Class, $0.01 Par Value |
| $718,640,046 |
| 20,739,335 |
| $34.65* |
| C Class, $0.01 Par Value |
| $13,413,284 |
| 392,214 |
| $34.20 |
| R Class, $0.01 Par Value |
| $142,844,715 |
| 4,167,129 |
| $34.28 |
| R6 Class, $0.01 Par Value |
| $566,919,403 |
| 15,816,594 |
| $35.84 |
*Maximum offering price $36.76 (net asset value divided by 0.9425).
See Notes to Financial Statements.
|
| | | |
| YEAR ENDED OCTOBER 31, 2014 | |
| Investment Income (Loss) | |
| Income: | |
| Dividends (net of foreign taxes withheld of $272,236) | $ | 131,642,130 |
|
| Interest | 11,263 |
|
| | 131,653,393 |
|
| | |
| Expenses: | |
| Management fees | 92,524,600 |
|
| Distribution and service fees: | |
| A Class | 1,943,698 |
|
| C Class | 135,093 |
|
| R Class | 734,792 |
|
| Directors' fees and expenses | 177,613 |
|
| Other expenses | 2,976 |
|
| | 95,518,772 |
|
| | |
| Net investment income (loss) | 36,134,621 |
|
| | |
| Realized and Unrealized Gain (Loss) | |
| Net realized gain (loss) on: | |
| Investment transactions | 2,191,222,820 |
|
| Futures contract transactions | 7,481,263 |
|
| | 2,198,704,083 |
|
| | |
| Change in net unrealized appreciation (depreciation) on: | |
| Investments | (898,224,272 | ) |
| Translation of assets and liabilities in foreign currencies | (112 | ) |
| | (898,224,384 | ) |
| | |
| Net realized and unrealized gain (loss) | 1,300,479,699 |
|
| | |
| Net Increase (Decrease) in Net Assets Resulting from Operations | $ | 1,336,614,320 |
|
See Notes to Financial Statements.
|
|
| Statement of Changes in Net Assets |
|
| | | | | | |
| YEARS ENDED OCTOBER 31, 2014 AND OCTOBER 31, 2013 |
| Increase (Decrease) in Net Assets | October 31, 2014 | October 31, 2013 |
| Operations | | |
| Net investment income (loss) | $ | 36,134,621 |
| $ | 69,228,240 |
|
| Net realized gain (loss) | 2,198,704,083 |
| 588,359,957 |
|
| Change in net unrealized appreciation (depreciation) | (898,224,384 | ) | 1,482,465,638 |
|
| Net increase (decrease) in net assets resulting from operations | 1,336,614,320 |
| 2,140,053,835 |
|
| | | |
| Distributions to Shareholders | | |
| From net investment income: | | |
| Investor Class | (22,778,559 | ) | (50,120,015 | ) |
| Institutional Class | (15,873,908 | ) | (20,798,230 | ) |
| A Class | (888,505 | ) | (5,972,503 | ) |
| C Class | — |
| (86,748 | ) |
| R Class | — |
| (890,390 | ) |
| R6 Class | (106,884 | ) | — |
|
| From net realized gains: | | |
| Investor Class | (363,165,714 | ) | (177,112,333 | ) |
| Institutional Class | (162,417,278 | ) | (69,134,932 | ) |
| A Class | (46,907,160 | ) | (22,912,075 | ) |
| C Class | (847,836 | ) | (448,307 | ) |
| R Class | (8,690,601 | ) | (3,737,327 | ) |
| R6 Class | (862,082 | ) | — |
|
| Decrease in net assets from distributions | (622,538,527 | ) | (351,212,860 | ) |
| | | |
| Capital Share Transactions | | |
| Net increase (decrease) in net assets from capital share transactions (Note 5) | (930,608,672 | ) | (288,999,763 | ) |
| | | |
| Net increase (decrease) in net assets | (216,532,879 | ) | 1,499,841,212 |
|
| | | |
| Net Assets | | |
| Beginning of period | 10,162,070,847 |
| 8,662,229,635 |
|
| End of period | $ | 9,945,537,968 |
| $ | 10,162,070,847 |
|
| | | |
| Undistributed net investment income | $ | 31,909,075 |
| $ | 39,626,721 |
|
See Notes to Financial Statements.
|
|
| Notes to Financial Statements |
OCTOBER 31, 2014
1. Organization
American Century Mutual Funds, Inc. (the corporation) is registered under the Investment Company Act of 1940, as amended (the 1940 Act), as an open-end management investment company and is organized as a Maryland corporation. Growth Fund (the fund) is one fund in a series issued by the corporation. The fund is diversified as defined under the 1940 Act. The fund's investment objective is to seek long-term capital growth.
The fund offers the Investor Class, the Institutional Class, the A Class, the C Class, the R Class and the R6 Class. The A Class may incur an initial sales charge. The A Class and C Class may be subject to a contingent deferred sales charge. The share classes differ principally in their respective sales charges and distribution and shareholder servicing expenses and arrangements. The Institutional Class and R6 Class shareholders do not require the same level of shareholder and administrative services from American Century Investment Management, Inc. (ACIM) (the investment advisor) as shareholders of other classes. In addition, financial intermediaries do not receive any service, distribution or administrative fees for the R6 Class. As a result, the Institutional Class and R6 Class are charged lower unified management fees. Sale of the R6 Class commenced on July 26, 2013.
2. Significant Accounting Policies
The following is a summary of significant accounting policies consistently followed by the fund in preparation of its financial statements. The fund is an investment company and follows accounting and reporting guidance in accordance with accounting principles generally accepted in the United States of America. This may require management to make certain estimates and assumptions at the date of the financial statements. Actual results could differ from these estimates. Management evaluated the impact of events or transactions occurring through the date the financial statements were issued that would merit recognition or disclosure.
Investment Valuations — The fund determines the fair value of its investments and computes its net asset value per share at the close of regular trading (usually 4 p.m. Eastern time) on the New York Stock Exchange (NYSE) on each day the NYSE is open. The Board of Directors has adopted valuation policies and procedures to guide the investment advisor in the fund’s investment valuation process and to provide methodologies for the oversight of the fund’s pricing function.
Equity securities that are listed or traded on a domestic securities exchange are valued at the last reported sales price or at the official closing price as provided by the exchange. Equity securities traded on foreign securities exchanges are generally valued at the closing price of such securities on the exchange where primarily traded or at the close of the NYSE, if that is earlier. If no last sales price is reported, or if local convention or regulation so provides, the mean of the latest bid and asked prices may be used. Securities traded over-the-counter are valued at the mean of the latest bid and asked prices, the last sales price, or the official closing price. Equity securities initially expressed in local currencies are translated into U.S. dollars at the mean of the appropriate currency exchange rate at the close of the NYSE as provided by an independent pricing service.
Fixed income securities maturing within 60 days at the time of purchase may be valued at cost, plus or minus any amortized discount or premium or at the evaluated mean as provided by an independent pricing service. Evaluated mean prices are commonly derived through utilization of market models, which may consider, among other factors: trade data, quotations from dealers and active market makers, relevant yield curve and spread data, related sector levels, creditworthiness, trade data or market information on comparable securities, and other relevant security specific information.
Open-end management investment companies are valued at the reported net asset value per share. Repurchase agreements are valued at cost, which approximates fair value. Exchange-traded futures contracts are valued at the settlement price as provided by the appropriate clearing corporation.
If the fund determines that the market price for an investment is not readily available or the valuation methods mentioned above do not reflect an investment’s fair value, such investment is valued as determined in good faith by the Board of Directors or its delegate, in accordance with policies and procedures adopted by the Board of Directors. In its determination of fair value, the fund may review several factors including, but not limited to, market information regarding the specific investment or comparable investments and correlation with other investment types, futures indices or general market indicators. Circumstances that may cause the fund to use these procedures to value an investment include, but are not limited to: an investment has been declared in default or is distressed; trading in a security has been suspended during the trading day or a security is not actively trading on its principal exchange; prices received from a regular pricing source are deemed unreliable; or there is a foreign market holiday and no trading occurred.
The fund monitors for significant events occurring after the close of an investment’s primary exchange but before the fund’s net asset value per share is determined. Significant events may include, but are not limited to: corporate announcements and transactions; governmental action and political unrest that could impact a specific investment or an investment sector; or armed conflicts, natural disasters and similar events that could affect investments in a specific country or region. The fund also monitors for significant fluctuations between domestic and foreign markets, as evidenced by the U.S. market or such other indicators that the Board of Directors, or its delegate, deems appropriate. If significant fluctuations in foreign markets are identified, the fund may apply a model-derived factor to the closing price of equity securities traded on foreign securities exchanges. The factor is based on observable market data as provided by an independent pricing service.
Security Transactions — Security transactions are accounted for as of the trade date. Net realized gains and losses are determined on the identified cost basis, which is also used for federal income tax purposes.
Investment Income — Dividend income less foreign taxes withheld, if any, is recorded as of the ex-dividend date. Distributions received on securities that represent a return of capital or long-term capital gain are recorded as a reduction of cost of investments and/or as a realized gain. The fund may estimate the components of distributions received that may be considered nontaxable distributions or long-term capital gain distributions for income tax purposes. Interest income is recorded on the accrual basis and includes accretion of discounts and amortization of premiums.
Foreign Currency Translations — All assets and liabilities initially expressed in foreign currencies are translated into U.S. dollars at prevailing exchange rates at period end. The fund may enter into spot foreign currency exchange contracts to facilitate transactions denominated in a foreign currency. Purchases and sales of investment securities, dividend and interest income, spot foreign currency exchange contracts, and expenses are translated at the rates of exchange prevailing on the respective dates of such transactions. Net realized and unrealized foreign currency exchange gains or losses related to investment securities are a component of net realized gain (loss) on investment transactions and change in net unrealized appreciation (depreciation) on investments, respectively.
Repurchase Agreements — The fund may enter into repurchase agreements with institutions that ACIM has determined are creditworthy pursuant to criteria adopted by the Board of Directors. The fund requires that the collateral, represented by securities, received in a repurchase transaction be transferred to the custodian in a manner sufficient to enable the fund to obtain those securities in the event of a default under the repurchase agreement. ACIM monitors, on a daily basis, the securities transferred to ensure the value, including accrued interest, of the securities under each repurchase agreement is equal to or greater than amounts owed to the fund under each repurchase agreement.
Joint Trading Account — Pursuant to an Exemptive Order issued by the Securities and Exchange Commission, the fund, along with certain other funds in the American Century Investments family of funds, may transfer uninvested cash balances into a joint trading account. These balances are invested in one or more repurchase agreements that are collateralized by U.S. Treasury or Agency obligations.
Segregated Assets — In accordance with the 1940 Act, the fund segregates assets on its books and records to cover futures contracts. ACIM monitors, on a daily basis, the securities segregated to ensure the fund designates a sufficient amount of liquid assets, marked-to-market daily. The fund may also receive assets or be required to pledge assets at the custodian bank or with a broker for margin requirements on futures contracts.
Income Tax Status — It is the fund’s policy to distribute substantially all net investment income and net realized gains to shareholders and to otherwise qualify as a regulated investment company under provisions of the Internal Revenue Code. Accordingly, no provision has been made for income taxes. The fund files U.S. federal, state, local and non-U.S. tax returns as applicable. The fund's tax returns are subject to examination by the relevant taxing authority until expiration of the applicable statute of limitations, which is generally three years from the date of filing but can be longer in certain jurisdictions. At this time, management believes there are no uncertain tax positions which, based on their technical merit, would not be sustained upon examination and for which it is reasonably possible that the total amounts of unrecognized tax benefits will significantly change in the next twelve months.
Multiple Class — All shares of the fund represent an equal pro rata interest in the net assets of the class to which such shares belong, and have identical voting, dividend, liquidation and other rights and the same terms and conditions, except for class specific expenses and exclusive rights to vote on matters affecting only individual classes. Income, non-class specific expenses, and realized and unrealized capital gains and losses of the fund are allocated to each class of shares based on their relative net assets.
Distributions to Shareholders — Distributions from net investment income and net realized gains, if any, are generally declared and paid annually. The fund may elect to treat a portion of its payment to a redeeming shareholder, which represents the pro rata share of undistributed net investment income and net realized gains, as a distribution for federal income tax purposes (tax equalization).
Indemnifications — Under the corporation’s organizational documents, its officers and directors are indemnified against certain liabilities arising out of the performance of their duties to the fund. In addition, in the normal course of business, the fund enters into contracts that provide general indemnifications. The maximum exposure under these arrangements is unknown as this would involve future claims that may be made against a fund. The risk of material loss from such claims is considered by management to be remote.
3. Fees and Transactions with Related Parties
Certain officers and directors of the corporation are also officers and/or directors of American Century Companies, Inc. (ACC). The corporation’s investment advisor, ACIM, the corporation's distributor, American Century Investment Services, Inc. (ACIS), and the corporation’s transfer agent, American Century Services, LLC, are wholly owned, directly or indirectly, by ACC.
Management Fees — The corporation has entered into a management agreement with ACIM, under which ACIM provides the fund with investment advisory and management services in exchange for a single, unified management fee (the fee) per class. The agreement provides that all expenses of managing and operating the fund, except distribution and service fees, brokerage expenses, taxes, interest, fees and expenses of the independent directors (including legal counsel fees), and extraordinary expenses, will be paid by ACIM. The fee is computed and accrued daily based on each class’s daily net assets and paid monthly in arrears. The rate of the fee is determined by applying a fee rate calculation formula. This formula takes into account the fund’s assets as well as certain assets, if any, of other clients of the investment advisor outside the American Century Investments family of funds (such as subadvised funds and separate accounts) that have very similar investment teams and investment strategies (strategy assets). The strategy assets of the fund also include the assets of NT Growth Fund, one fund in a series issued by the corporation. The annual management fee schedule ranges from 0.800% to 0.990% for the Investor Class, A Class, C Class and R Class. The annual management fee schedule ranges from 0.600% to 0.790% for the Institutional Class and 0.450% to 0.640% for the R6 Class. Prior to August 1, 2014, the annual management fee schedule ranged from 0.800% to 1.000% for the Investor Class, A Class, C Class and R Class, 0.600% to 0.800% for the Institutional Class and 0.450% to 0.650% for the R6 Class. The effective annual management fee for each class for the year ended October 31, 2014 was 0.97% for the Investor Class, A Class, C Class and R Class, 0.77% for the Institutional Class and 0.62% for the R6 Class.
Distribution and Service Fees — The Board of Directors has adopted a separate Master Distribution and Individual Shareholder Services Plan for each of the A Class, C Class and R Class (collectively the plans), pursuant to Rule 12b-1 of the 1940 Act. The plans provide that the A Class will pay ACIS an annual distribution and service fee of 0.25%. The plans provide that the C Class will pay ACIS an annual distribution and service fee of 1.00%, of which 0.25% is paid for individual shareholder services and 0.75% is paid for distribution services. The plans provide that the R Class will pay ACIS an annual distribution and service fee of 0.50%. The fees are computed and accrued daily based on each class’s daily net assets and paid monthly in arrears. The fees are used to pay financial intermediaries for distribution and individual shareholder services. Fees incurred under the plans during the year ended October 31, 2014 are detailed in the Statement of Operations.
Directors' Fees and Expenses — The Board of Directors is responsible for overseeing the investment advisor’s management and operations of the fund. The directors receive detailed information about the fund and its investment advisor regularly throughout the year, and meet at least quarterly with management of the investment advisor to review reports about fund operations. Fees and expenses incurred in conjunction with the directors during the year ended October 31, 2014 are detailed in the Statement of Operations. The fund’s officers do not receive compensation from the fund.
4. Investment Transactions
Purchases and sales of investment securities, excluding short-term investments, for the year ended October 31, 2014 were $10,440,812,590 and $11,728,428,260, respectively.
5. Capital Share Transactions
Transactions in shares of the fund were as follows:
|
| | | | | | | | | | |
| | Year ended October 31, 2014 | Year ended October 31, 2013(1) |
| | Shares | Amount | Shares | Amount |
| Investor Class/Shares Authorized | 800,000,000 |
| | 800,000,000 |
| |
| Sold | 13,332,918 |
| $ | 445,451,613 |
| 15,758,673 |
| $ | 458,269,744 |
|
| Issued in reinvestment of distributions | 11,936,516 |
| 375,642,112 |
| 8,131,994 |
| 221,190,187 |
|
| Redeemed | (46,275,518 | ) | (1,573,721,708 | ) | (36,318,749 | ) | (1,071,846,016 | ) |
| | (21,006,084 | ) | (752,627,983 | ) | (12,428,082 | ) | (392,386,085 | ) |
| Institutional Class/Shares Authorized | 345,000,000 |
| | 345,000,000 |
| |
| Sold | 19,929,594 |
| 680,057,728 |
| 24,000,053 |
| 708,413,723 |
|
| Issued in reinvestment of distributions | 5,462,288 |
| 173,755,364 |
| 3,154,202 |
| 86,645,932 |
|
| Redeemed | (40,962,347 | ) | (1,379,407,350 | ) | (22,931,725 | ) | (681,198,270 | ) |
| | (15,570,465 | ) | (525,594,258 | ) | 4,222,530 |
| 113,861,385 |
|
| A Class/Shares Authorized | 310,000,000 |
| | 310,000,000 |
| |
| Sold | 2,580,515 |
| 84,073,659 |
| 4,360,740 |
| 123,057,542 |
|
| Issued in reinvestment of distributions | 1,452,224 |
| 44,844,664 |
| 1,010,735 |
| 27,006,835 |
|
| Redeemed | (8,476,259 | ) | (280,585,369 | ) | (6,160,662 | ) | (178,220,923 | ) |
| | (4,443,520 | ) | (151,667,046 | ) | (789,187 | ) | (28,156,546 | ) |
| C Class/Shares Authorized | 20,000,000 |
| | 20,000,000 |
| |
| Sold | 46,991 |
| 1,539,309 |
| 38,712 |
| 1,107,256 |
|
| Issued in reinvestment of distributions | 19,381 |
| 594,604 |
| 12,908 |
| 344,918 |
|
| Redeemed | (123,535 | ) | (3,974,728 | ) | (124,341 | ) | (3,565,181 | ) |
| | (57,163 | ) | (1,840,815 | ) | (72,721 | ) | (2,113,007 | ) |
| R Class/Shares Authorized | 30,000,000 |
| | 30,000,000 |
| |
| Sold | 601,554 |
| 19,559,453 |
| 1,135,215 |
| 32,171,052 |
|
| Issued in reinvestment of distributions | 276,271 |
| 8,459,424 |
| 167,967 |
| 4,457,853 |
|
| Redeemed | (1,229,483 | ) | (40,169,460 | ) | (1,080,129 | ) | (30,973,232 | ) |
| | (351,658 | ) | (12,150,583 | ) | 223,053 |
| 5,655,673 |
|
| R6 Class/Shares Authorized | 50,000,000 |
| | 50,000,000 |
| |
| Sold | 16,405,541 |
| 548,650,322 |
| 466,448 |
| 14,535,460 |
|
| Issued in reinvestment of distributions | 30,490 |
| 968,966 |
| — |
| — |
|
| Redeemed | (1,073,663 | ) | (36,347,275 | ) | (12,222 | ) | (396,643 | ) |
| | 15,362,368 |
| 513,272,013 |
| 454,226 |
| 14,138,817 |
|
| Net increase (decrease) | (26,066,522 | ) | $ | (930,608,672 | ) | (8,390,181 | ) | $ | (288,999,763 | ) |
| |
| (1) | July 26, 2013 (commencement of sale) through October 31, 2013 for the R6 Class. |
6. Fair Value Measurements
The fund’s investments valuation process is based on several considerations and may use multiple inputs to determine the fair value of the investments held by the fund. In conformity with accounting principles generally accepted in the United States of America, the inputs used to determine a valuation are classified into three broad levels.
| |
| • | Level 1 valuation inputs consist of unadjusted quoted prices in an active market for identical investments. |
| |
| • | Level 2 valuation inputs consist of direct or indirect observable market data (including quoted prices for comparable investments, evaluations of subsequent market events, interest rates, prepayment speeds, credit risk, etc.). These inputs also consist of quoted prices for identical investments initially expressed in local currencies that are adjusted through translation into U.S. dollars. |
| |
| • | Level 3 valuation inputs consist of unobservable data (including a fund’s own assumptions). |
The level classification is based on the lowest level input that is significant to the fair valuation measurement. The valuation inputs are not necessarily an indication of the risks associated with investing in these securities or other financial instruments. There were no significant transfers between levels during the period.
The following is a summary of the level classifications as of period end. The Schedule of Investments provides additional information on the fund’s portfolio holdings.
|
| | | | | | | | |
| | Level 1 | Level 2 | Level 3 |
| Assets | | | |
| Investment Securities | | | |
| Common Stocks | $ | 9,912,404,818 |
| — |
| — |
|
| Temporary Cash Investments | 22,725,775 |
| $ | 22,730,381 |
| — |
|
| | $ | 9,935,130,593 |
| $ | 22,730,381 |
| — |
|
7. Derivative Instruments
Equity Price Risk — The fund is subject to equity price risk in the normal course of pursuing its investment objectives. A fund may enter into futures contracts based on an equity index in order to manage its exposure to changes in market conditions. A fund may purchase futures contracts to gain exposure to increases in market value or sell futures contracts to protect against a decline in market value. Upon entering into a futures contract, a fund is required to deposit either cash or securities in an amount equal to a certain percentage of the contract value (initial margin). Subsequent payments (variation margin) are made or received daily, in cash, by a fund. The variation margin is equal to the daily change in the contract value and is recorded as unrealized gains and losses. A fund recognizes a realized gain or loss when the contract is closed or expires. Net realized and unrealized gains or losses occurring during the holding period of futures contracts are a component of net realized gain (loss) on futures contract transactions and change in net unrealized appreciation (depreciation) on futures contracts, respectively. One of the risks of entering into futures contracts is the possibility that the change in value of the contract may not correlate with the changes in value of the underlying securities. During the period, the fund infrequently purchased equity price risk derivative instruments for temporary investment purposes.
At period end, the fund did not have any derivative instruments disclosed on the Statement of Assets and Liabilities. For the year ended October 31, 2014, the effect of equity price risk derivative instruments on the Statement of Operations was $7,481,263 in net realized gain (loss) on futures contract transactions.
8. Risk Factors
The fund’s investment process may result in high portfolio turnover, which could mean high transaction costs, affecting both performance and capital gains tax liabilities to investors.
9. Federal Tax Information
The tax character of distributions paid during the years ended October 31, 2014 and October 31, 2013 were as follows:
|
| | | | | | |
| | 2014 | 2013 |
| Distributions Paid From | | |
| Ordinary income | $ | 141,541,055 |
| $ | 77,552,048 |
|
| Long-term capital gains | $ | 480,997,472 |
| $ | 273,660,812 |
|
The book-basis character of distributions made during the year from net investment income or net realized gains may differ from their ultimate characterization for federal income tax purposes. These differences reflect the differing character of certain income items and net realized gains and losses for financial statement and tax purposes, and may result in reclassification among certain capital accounts on the financial statements.
The reclassifications, which are primarily due to tax equalization, were made to capital $222,292,972, undistributed net investment income $(4,204,411), and undistributed net realized gain $(218,088,561).
As of October 31, 2014, the federal tax cost of investments and the components of distributable earnings on a tax-basis were as follows:
|
| | | |
| Federal tax cost of investments | $ | 8,234,167,734 |
|
| Gross tax appreciation of investments | $ | 1,803,406,903 |
|
| Gross tax depreciation of investments | (79,713,663 | ) |
| Net tax appreciation (depreciation) of investments | 1,723,693,240 |
|
Net tax appreciation (depreciation) on translation of assets and liabilities in foreign currencies | (30 | ) |
| Net tax appreciation (depreciation) | $ | 1,723,693,210 |
|
| Undistributed ordinary income | $ | 266,445,588 |
|
| Accumulated long-term gains | $ | 1,733,886,833 |
|
The difference between book-basis and tax-basis unrealized appreciation (depreciation) is attributable primarily to the tax deferral of losses on wash sales.
|
| | | | | | | | | | | | | | | |
| For a Share Outstanding Throughout the Years Ended October 31 (except as noted) | |
| Per-Share Data | | | | | | | | | Ratios and Supplemental Data |
| | | Income From Investment Operations: | Distributions From: | | | Ratio to Average Net Assets of: | |
| | Net Asset
Value,
Beginning
of Period | Net
Investment
Income
(Loss)(1) | Net
Realized
and
Unrealized
Gain (Loss) | Total From
Investment
Operations | Net
Investment
Income | Net
Realized
Gains | Total
Distributions | Net Asset
Value,
End
of Period | Total
Return(2) | Operating
Expenses | Net
Investment
Income
(Loss) | Portfolio
Turnover
Rate | Net
Assets,
End of
Period
(in thousands) |
| Investor Class | | | | | | | | | | | | |
| 2014 | $33.10 | 0.11 | 4.22 | 4.33 | (0.12) | (1.92) | (2.04) | $35.39 | 13.84% | 0.97% | 0.32% | 103% |
| $6,021,115 |
|
| 2013 | $27.48 | 0.21 | 6.53 | 6.74 | (0.25) | (0.87) | (1.12) | $33.10 | 25.42% | 0.97% | 0.71% | 67% |
| $6,327,674 |
|
| 2012 | $25.88 | 0.14 | 2.50 | 2.64 | (0.13) | (0.91) | (1.04) | $27.48 | 10.67% | 0.97% | 0.54% | 74% |
| $5,593,916 |
|
| 2011 | $24.00 | 0.16 | 1.81 | 1.97 | (0.09) | — | (0.09) | $25.88 | 8.20% | 0.98% | 0.58% | 79% |
| $5,377,431 |
|
| 2010 | $20.28 | 0.10 | 3.68 | 3.78 | (0.06) | — | (0.06) | $24.00 | 18.65% | 1.00% | 0.43% | 86% |
| $4,440,152 |
|
| Institutional Class | | | | | | | | | | | | |
| 2014 | $33.49 | 0.18 | 4.27 | 4.45 | (0.19) | (1.92) | (2.11) | $35.83 | 14.03% | 0.77% | 0.52% | 103% |
| $2,482,606 |
|
| 2013 | $27.75 | 0.27 | 6.60 | 6.87 | (0.26) | (0.87) | (1.13) | $33.49 | 25.68% | 0.77% | 0.91% | 67% |
| $2,842,185 |
|
| 2012 | $26.13 | 0.20 | 2.51 | 2.71 | (0.18) | (0.91) | (1.09) | $27.75 | 10.86% | 0.77% | 0.74% | 74% |
| $2,237,708 |
|
| 2011 | $24.23 | 0.20 | 1.84 | 2.04 | (0.14) | — | (0.14) | $26.13 | 8.42% | 0.78% | 0.78% | 79% |
| $2,080,463 |
|
| 2010 | $20.47 | 0.14 | 3.72 | 3.86 | (0.10) | — | (0.10) | $24.23 | 18.90% | 0.80% | 0.63% | 86% |
| $1,106,748 |
|
|
| | | | | | | | | | | | | | | |
| For a Share Outstanding Throughout the Years Ended October 31 (except as noted) | |
| Per-Share Data | | | | | | | | | Ratios and Supplemental Data |
| | | Income From Investment Operations: | Distributions From: | | | Ratio to Average Net Assets of: | |
| | Net Asset
Value,
Beginning
of Period | Net
Investment
Income
(Loss)(1) | Net
Realized
and
Unrealized
Gain (Loss) | Total From
Investment
Operations | Net
Investment
Income | Net
Realized
Gains | Total
Distributions | Net Asset
Value,
End
of Period | Total
Return(2) | Operating
Expenses | Net
Investment
Income
(Loss) | Portfolio
Turnover
Rate | Net
Assets,
End of
Period
(in thousands) |
A Class(3) | | | | | | | | | | | | | |
| 2014 | $32.45 | 0.03 | 4.13 | 4.16 | (0.04) | (1.92) | (1.96) | $34.65 | 13.53% | 1.22% | 0.07% | 103% |
| $718,640 |
|
| 2013 | $27.00 | 0.13 | 6.42 | 6.55 | (0.23) | (0.87) | (1.10) | $32.45 | 25.14% | 1.22% | 0.46% | 67% |
| $817,166 |
|
| 2012 | $25.45 | 0.07 | 2.46 | 2.53 | (0.07) | (0.91) | (0.98) | $27.00 | 10.37% | 1.22% | 0.29% | 74% |
| $701,313 |
|
| 2011 | $23.60 | 0.08 | 1.79 | 1.87 | (0.02) | — | (0.02) | $25.45 | 7.93% | 1.23% | 0.33% | 79% |
| $628,634 |
|
| 2010 | $19.94 | 0.04 | 3.62 | 3.66 | —(4) | — | —(4) | $23.60 | 18.37% | 1.25% | 0.18% | 86% |
| $369,142 |
|
| C Class | | | | | | | | | | | | | |
| 2014 | $32.24 | (0.22) | 4.10 | 3.88 | — | (1.92) | (1.92) | $34.20 | 12.71% | 1.97% | (0.68)% | 103% |
| $13,413 |
|
| 2013 | $26.98 | (0.08) | 6.38 | 6.30 | (0.17) | (0.87) | (1.04) | $32.24 | 24.16% | 1.97% | (0.29)% | 67% |
| $14,489 |
|
| 2012 | $25.55 | (0.12) | 2.46 | 2.34 | — | (0.91) | (0.91) | $26.98 | 9.55% | 1.97% | (0.46)% | 74% |
| $14,084 |
|
| 2011 | $23.85 | (0.12) | 1.82 | 1.70 | — | — | — | $25.55 | 7.13% | 1.98% | (0.42)% | 79% |
| $14,730 |
|
2010(5) | $22.10 | (0.10) | 1.85 | 1.75 | — | — | — | $23.85 | 7.92% | 2.00%(6) | (0.66)%(6) | 86%(7) |
| $6,219 |
|
| R Class | | | | | | | | | | | | | |
| 2014 | $32.16 | (0.06) | 4.10 | 4.04 | — | (1.92) | (1.92) | $34.28 | 13.26% | 1.47% | (0.18)% | 103% |
| $142,845 |
|
| 2013 | $26.82 | 0.06 | 6.36 | 6.42 | (0.21) | (0.87) | (1.08) | $32.16 | 24.80% | 1.47% | 0.21% | 67% |
| $145,337 |
|
| 2012 | $25.28 | 0.01 | 2.44 | 2.45 | —(4) | (0.91) | (0.91) | $26.82 | 10.12% | 1.47% | 0.04% | 74% |
| $115,208 |
|
| 2011 | $23.49 | —(4) | 1.79 | 1.79 | — | — | — | $25.28 | 7.62% | 1.48% | 0.08% | 79% |
| $79,569 |
|
| 2010 | $19.90 | (0.02) | 3.61 | 3.59 | — | — | — | $23.49 | 18.10% | 1.50% | (0.07)% | 86% |
| $20,325 |
|
|
| | | | | | | | | | | | | | | |
| For a Share Outstanding Throughout the Years Ended October 31 (except as noted) | |
| Per-Share Data | | | | | | | | | Ratios and Supplemental Data |
| | | Income From Investment Operations: | Distributions From: | | | Ratio to Average Net Assets of: | |
| | Net Asset
Value,
Beginning
of Period | Net
Investment
Income
(Loss)(1) | Net
Realized
and
Unrealized
Gain (Loss) | Total From
Investment
Operations | Net
Investment
Income | Net
Realized
Gains | Total
Distributions | Net Asset
Value,
End
of Period | Total
Return(2) | Operating
Expenses | Net
Investment
Income
(Loss) | Portfolio
Turnover
Rate | Net
Assets,
End of
Period
(in thousands) |
| R6 Class | | | | | | | | | | | | | |
| 2014 | $33.51 | 0.18 | 4.31 | 4.49 | (0.24) | (1.92) | (2.16) | $35.84 | 14.20% | 0.62% | 0.67% | 103% |
| $566,919 |
|
2013(8) | $31.22 | 0.05 | 2.24 | 2.29 | — | — | — | $33.51 | 7.34% | 0.62%(6) | 0.64%(6) | 67%(9) |
| $15,219 |
|
|
| | | | |
| Notes to Financial Highlights | | |
| |
| (1) | Computed using average shares outstanding throughout the period. |
| |
| (2) | Total returns are calculated based on the net asset value of the last business day and do not reflect applicable sales charges, if any. Total returns for periods less than one year are not annualized. |
| |
| (3) | Prior to March 1, 2010, the A Class was referred to as the Advisor Class. |
| |
| (4) | Per-share amount was less than $0.005. |
| |
| (5) | March 1, 2010 (commencement of sale) through October 31, 2010. |
| |
| (7) | Portfolio turnover is calculated at the fund level. Percentage indicated was calculated for the year ended October 31, 2010. |
| |
| (8) | July 26, 2013 (commencement of sale) through October 31, 2013. |
| |
| (9) | Portfolio turnover is calculated at the fund level. Percentage indicated was calculated for the year ended October 31, 2013. |
See Notes to Financial Statements.
|
|
| Report of Independent Registered Public Accounting Firm |
To the Board of Directors and Shareholders of
American Century Mutual Funds, Inc.:
We have audited the accompanying statement of assets and liabilities, including the schedule of investments, of Growth Fund (the “Fund”), one of the funds constituting American Century Mutual Funds, Inc., as of October 31, 2014, and the related statement of operations for the year then ended, the statements of changes in net assets for each of the two years in the period then ended, and the financial highlights for each of the periods presented. These financial statements and financial highlights are the responsibility of the Fund's management. Our responsibility is to express an opinion on these financial statements and financial highlights based on our audits.
We conducted our audits in accordance with the standards of the Public Company Accounting Oversight Board (United States). Those standards require that we plan and perform the audit to obtain reasonable assurance about whether the financial statements and financial highlights are free of material misstatement. The Fund is not required to have, nor were we engaged to perform, an audit of its internal control over financial reporting. Our audits included consideration of internal control over financial reporting as a basis for designing audit procedures that are appropriate in the circumstances, but not for the purpose of expressing an opinion on the effectiveness of the Fund's internal control over financial reporting. Accordingly, we express no such opinion. An audit also includes examining, on a test basis, evidence supporting the amounts and disclosures in the financial statements, assessing the accounting principles used and significant estimates made by management, as well as evaluating the overall financial statement presentation. Our procedures included confirmation of securities owned as of October 31, 2014, by correspondence with the custodian and brokers; where replies were not received from brokers, we performed other auditing procedures. We believe that our audits provide a reasonable basis for our opinion.
In our opinion, the financial statements and financial highlights referred to above present fairly, in all material respects, the financial position of Growth Fund of American Century Mutual Funds, Inc. as of October 31, 2014, the results of its operations for the year then ended, the changes in its net assets for each of the two years in the period then ended, and the financial highlights for each of the periods presented, in conformity with accounting principles generally accepted in the United States of America.
DELOITTE & TOUCHE LLP
Kansas City, Missouri
December 17, 2014
The Board of Directors
The individuals listed below serve as directors of the funds. Each director will continue to serve in this capacity until death, retirement, resignation or removal from office. The board has adopted a mandatory retirement age for directors who are not “interested persons,” as that term is defined in the Investment Company Act (independent directors). Independent directors shall retire by December 31 of the year in which they reach their 75th birthday.
Mr. Thomas is an “interested person” because he currently serves as President and Chief Executive Officer of American Century Companies, Inc. (ACC), the parent company of American Century Investment Management, Inc. (ACIM or the advisor). Mr. Fink is treated as an “interested person” because of his recent employment with ACC and American Century Services, LLC (ACS). The other directors (more than three-fourths of the total number) are independent. They are not employees, directors or officers of, and have no financial interest in, ACC or any of its wholly owned, direct or indirect, subsidiaries, including ACIM, American Century Investment Services, Inc. (ACIS) and ACS, and they do not have any other affiliations, positions, or relationships that would cause them to be considered “interested persons” under the Investment Company Act. The directors serve in this capacity for seven (in the case of Mr. Thomas, 15) registered investment companies in the American Century Investments family of funds.
The following table presents additional information about the directors. The mailing address for each director is 4500 Main Street, Kansas City, Missouri 64111.
|
| | | | | |
Name
(Year of Birth) | Position(s) Held with Funds | Length of Time Served | Principal Occupation(s) During Past 5 Years | Number of American Century Portfolios Overseen by Director | Other Directorships Held During Past
5 Years |
| Independent Directors | | | | |
Thomas A. Brown
(1940) | Director | Since 1980 | Managing Member, Associated Investments, LLC (real estate investment company); Brown Cascade Properties, LLC (real estate investment company) (2001 to 2009) | 73 | None |
Andrea C. Hall
(1945) | Director | Since 1997 | Retired | 73 | None |
Jan M. Lewis
(1957) | Director | Since 2011 | Retired; President and Chief Executive Officer, Catholic Charities of Northeast Kansas (human services organization) (2006 to 2013) | 73 | None |
James A. Olson
(1942) | Director and Chairman of the Board | Since 2007 (Chairman since 2014) | Member, Plaza Belmont LLC (private equity fund manager) | 73 | Saia, Inc. (2002 to 2012) and EPR Properties (2003 to 2013) |
|
| | | | | |
Name
(Year of Birth) | Position(s) Held with Funds | Length of Time Served | Principal Occupation(s) During Past 5 Years | Number of American Century Portfolios Overseen by Director | Other Directorships Held During Past
5 Years |
| Independent Directors | | | | |
M. Jeannine Strandjord
(1945) | Director | Since 1994 | Retired | 73 | Euronet Worldwide Inc.; Charming Shoppes, Inc. (2006 to 2010); and DST Systems Inc. (1996 to 2012) |
John R. Whitten
(1946) | Director | Since 2008 | Retired | 73 | Rudolph Technologies, Inc. |
Stephen E. Yates
(1948) | Director | Since 2012 | Retired; Executive Vice President, Technology & Operations, KeyCorp. (computer services) (2004 to 2010) | 73 | Applied Industrial Technologies, Inc. (2001 to 2010) |
| Interested Directors | | | | |
Barry Fink
(1955) | Director | Since 2012 | Retired; Executive Vice President, ACC (September 2007 to February 2013); President, ACS (October 2007 to February 2013); Chief Operating Officer, ACC (September 2007 to November 2012) | 73 | None |
Jonathan S. Thomas
(1963) | Director and President | Since 2007 | President and Chief Executive Officer, ACC (March 2007 to present). Also serves as Chief Executive Officer, ACS; Executive Vice President, ACIM; Director, ACC, ACIM and other ACC subsidiaries | 118 | BioMed Valley Discoveries, Inc. |
The Statement of Additional Information has additional information about the fund's directors and is available without charge, upon request, by calling 1-800-345-2021.
Officers
The following table presents certain information about the executive officers of the funds. Each officer serves as an officer for each of the 15 investment companies in the American Century family of funds, unless otherwise noted. No officer is compensated for his or her service as an officer of the funds. The listed officers are interested persons of the funds and are appointed or re-appointed on an annual basis. The mailing address for each officer listed below is 4500 Main Street, Kansas City, Missouri 64111.
|
| | |
Name (Year of Birth) | Offices with the Funds | Principal Occupation(s) During the Past Five Years |
Jonathan S.
Thomas
(1963) | Director and
President
since 2007 | President and Chief Executive Officer, ACC (March 2007 to present). Also serves as Chief Executive Officer, ACS; Executive Vice President, ACIM; Director, ACC, ACIM and other ACC subsidiaries |
Amy D. Shelton
(1964) | Chief Compliance
Officer since 2014 | Chief Compliance Officer, American Century funds, (March 2014 to present); Chief Compliance Officer, ACIM (February 2014 to present); Chief Compliance Officer, ACIS (October 2009 to present); Vice President, Client Interactions and Marketing, ACIS (February 2013 to January 2014); Director, Client Interactions and Marketing, ACIS (June 2007 to January 2013). Also serves as Vice President, ACIS |
Charles A.
Etherington
(1957) | General Counsel
since 2007 and
Senior Vice
President since 2006 | Attorney, ACC (February 1994 to present); Vice President, ACC (November 2005 to present); General Counsel, ACC (March 2007 to present). Also serves as General Counsel, ACIM, ACS, ACIS and other ACC subsidiaries; and Senior Vice President, ACIM and ACS |
C. Jean Wade
(1964) | Vice President,
Treasurer and
Chief Financial
Officer since 2012 | Vice President, ACS (February 2000 to present) |
Robert J.
Leach
(1966) | Vice President
since 2006 and
Assistant Treasurer
since 2012 | Vice President, ACS (February 2000 to present) |
David H.
Reinmiller
(1963) | Vice President
since 2000 | Attorney, ACC (January 1994 to present); Associate General Counsel, ACC (January 2001 to present). Also serves as Vice President, ACIM and ACS |
Ward D.
Stauffer
(1960) | Secretary
since 2005 | Attorney, ACC (June 2003 to present) |
|
|
| Approval of Management Agreement |
At a meeting held on June 18, 2014, the Fund’s Board of Directors unanimously approved the renewal of the management agreement pursuant to which American Century Investment Management, Inc. (the “Advisor”) acts as the investment advisor for the Fund. Under Section 15(c) of the Investment Company Act, contracts for investment advisory services are required to be reviewed, evaluated, and approved by a majority of a fund’s directors (the “Directors”), including a majority of the independent Directors, each year.
Prior to its consideration of the renewal of the management agreement, the Board requested and reviewed extensive data and information compiled by the Advisor and certain independent providers of evaluation data concerning the Fund and the services provided to the Fund by the Advisor. This review was in addition to the oversight and evaluation undertaken by the Board and its committees on a continuous basis and the information received was supplemental to the extensive information that the Board and its committees receive and consider throughout the year.
In connection with its consideration of the renewal of the management agreement, the Board’s review and evaluation of the services provided by the Advisor included, but was not limited to, the following:
| |
| • | the nature, extent, and quality of investment management, shareholder services, and other services provided by the Advisor to the Fund; |
| |
| • | the wide range of other programs and services the Advisor provides to the Fund and its shareholders on a routine and non-routine basis; |
| |
| • | the Fund’s investment performance compared to appropriate benchmarks and/or a peer group of other mutual funds with similar investment objectives and strategies; |
| |
| • | the cost of owning the Fund compared to the cost of owning similar funds; |
| |
| • | the Advisor’s compliance policies, procedures, and regulatory experience; |
| |
| • | financial data showing the cost of services provided to the Fund, the profitability of the Fund to the Advisor, and the overall profitability of the Advisor; |
| |
| • | possible economies of scale associated with the Advisor’s management of the Fund and other accounts under its management; |
| |
| • | the services provided and charges to other investment management clients of the Advisor; |
| |
| • | acquired fund fees and expenses; and |
| |
| • | any collateral benefits derived by the Advisor from the management of the Fund. |
In keeping with its practice, the Board held two in-person meetings and one telephonic meeting to review and discuss the information provided. The independent Directors also had the benefit of the advice of their independent counsel throughout the process.
Factors Considered
The Directors considered all of the information provided by the Advisor, the independent data providers, and independent counsel, and evaluated such information for the Fund. In connection with their review, the Directors did not identify any single factor as being all-important or controlling, and each Director may have attributed different levels of importance to different factors. In deciding to renew the management agreement, the Board based its decision on a number of factors, including the following:
Nature, Extent and Quality of Services — Generally. Under the management agreement, the Advisor is responsible for providing or arranging for all services necessary for the operation of the Fund. The Board noted that under the management agreement, the Advisor provides or arranges at its own expense a wide variety of services including:
| |
| • | constructing and designing the Fund |
| |
| • | portfolio research and security selection |
| |
| • | initial capitalization/funding |
| |
| • | daily valuation of the Fund’s portfolio |
| |
| • | shareholder servicing and transfer agency, including shareholder confirmations, recordkeeping, and communications |
| |
| • | legal services (except the independent Directors’ counsel) |
| |
| • | regulatory and portfolio compliance |
| |
| • | marketing and distribution (except Rule 12b-1 plans) |
The Board noted that many of these services have expanded over time both in terms of quantity and complexity in response to shareholder demands, competition in the industry, changing distribution channels, and the changing regulatory environment.
Investment Management Services. The nature of the investment management services provided to the Fund is quite complex and allows Fund shareholders access to professional money management, instant diversification of their investments within an asset class, the opportunity to easily diversify among asset classes by investing in or exchanging among various American Century Investments funds, and liquidity. In evaluating investment performance, the Board expects the Advisor to manage the Fund in accordance with its investment objectives and approved strategies. Further, the Directors recognize that the Advisor has an obligation to monitor trading activities, and in particular to seek the best execution of fund trades, and to evaluate the use of and payment for research. In providing these services, the Advisor utilizes teams of investment professionals (portfolio managers, analysts, research assistants, and securities traders) who require extensive information technology, research, training, compliance and other systems to conduct their business. The Board, directly and through its Fund Performance Review Committee, regularly reviews investment performance information for the Fund, together with comparative information for appropriate benchmarks and/or peer groups of similarly-managed funds, over different time horizons. The Directors also review detailed performance information during the management agreement approval process. If performance concerns are identified, the Fund receives special reviews until performance improves, during which the Board discusses with the Advisor the reasons for such results (e.g., market conditions, security selection) and any efforts being undertaken to improve performance. The Fund’s performance was above its benchmark for the ten-year period and below its benchmark for the one-, three-, and five-year periods reviewed by the Board. The Board discussed the Fund’s performance with the Advisor and was satisfied with the efforts being undertaken by the Advisor. The Board found the investment management services provided by the Advisor to the Fund to be satisfactory and consistent with the management agreement.
Shareholder and Other Services. Under the management agreement, the Advisor provides the Fund with a comprehensive package of transfer agency, shareholder, and other services. The Board, directly and through various committees of the Board, regularly reviews reports and evaluations of such services at its regular meetings. These reports include, but are not limited to, information regarding the operational efficiency and accuracy of the shareholder and transfer agency services provided, staffing levels, shareholder satisfaction (as measured by external as well as internal sources), technology support, new products and services offered to Fund shareholders, securities trading activities, portfolio valuation services, auditing services, and legal and operational compliance activities. Certain aspects of shareholder and transfer agency service level efficiency
and the quality of securities trading activities are measured by independent third party providers and are presented in comparison to other fund groups not managed by the Advisor. The Board found the services provided by the Advisor to the Fund under the management agreement to be competitive and of high quality.
Costs of Services and Profitability. The Advisor provides detailed information concerning its cost of providing various services to the Fund, its profitability in managing the Fund (pre- and post-distribution), its overall profitability, and its financial condition. The Directors have reviewed with the Advisor the methodology used to prepare this financial information. The financial information regarding the Advisor is considered in evaluating the Advisor’s financial condition, its ability to continue to provide services under the management agreement, and the reasonableness of the current management fee. The Board concluded that the Advisor’s profits were reasonable in light of the services provided to the Fund.
Ethics. The Board generally considers the Advisor’s commitment to providing quality services to shareholders and to conducting its business ethically. They noted that the Advisor’s practices generally meet or exceed industry best practices.
Economies of Scale. The Board also reviewed information provided by the Advisor regarding the possible existence of economies of scale in connection with the management of the Fund. The Board concluded that economies of scale are difficult to measure and predict with precision, especially on a fund-by-fund basis. The Board concluded that the Advisor is appropriately sharing economies of scale through its competitive fee structure, offering competitive fees from fund inception, and through reinvestment in its business to provide shareholders additional content and services.
Comparison to Other Funds’ Fees. The management agreement provides that the Fund pays the Advisor a single, all-inclusive (or unified) management fee for providing all services necessary for the management and operation of the Fund, other than brokerage expenses, taxes, interest, extraordinary expenses, and the fees and expenses of the Fund’s independent directors (including their independent legal counsel) and expenses incurred in connection with the provision of shareholder services and distribution services under a plan adopted pursuant to Rule 12b-1 under the 1940 Act. Under the unified fee structure, the Advisor is responsible for providing all investment advisory, custody, audit, administrative, compliance, recordkeeping, marketing and shareholder services, or arranging and supervising third parties to provide such services. By contrast, most other funds are charged a variety of fees, including an investment advisory fee, a transfer agency fee, an administrative fee, distribution charges and other expenses. Other than their investment advisory fees and any applicable Rule 12b-1 distribution fees, all other components of the total fees charged by these other funds may be increased without shareholder approval. The Board believes the unified fee structure is a benefit to Fund shareholders because it clearly discloses to shareholders the cost of owning Fund shares, and, since the unified fee cannot be increased without a vote of Fund shareholders, it shifts to the Advisor the risk of increased costs of operating the Fund and provides a direct incentive to minimize administrative inefficiencies. Part of the Board’s analysis of fee levels involves reviewing certain evaluative data compiled by an independent provider comparing the Fund’s unified fee to the total expense ratios of its peers. The unified fee charged to shareholders of the Fund was below the median of the total expense ratios of the Fund’s peer expense universe and was within the range of its peer expense group. The Board and the Advisor agreed to certain adjustments regarding the breakpoints in the Fund’s unified management fee schedule, including changing the number of breakpoints and the investment amount that applies to each breakpoint, beginning August 1, 2014. The Board concluded that the management fee paid by the Fund to the Advisor under the management agreement is reasonable in light of the services provided to the Fund.
Comparison to Fees and Services Provided to Other Clients of the Advisor. The Board also requested and received information from the Advisor concerning the nature of the services, fees, costs and profitability of its advisory services to advisory clients other than the Fund. They observed that these varying types of client accounts require different services and involve different regulatory and entrepreneurial risks than the management of the Fund. The Board analyzed this information and concluded that the fees charged and services provided to the Fund were reasonable by comparison.
Collateral or “Fall-Out” Benefits Derived by the Advisor. The Board considered the existence of collateral benefits the Advisor may receive as a result of its relationship with the Fund. They concluded that the Advisor’s primary business is managing mutual funds and it generally does not use fund or shareholder information to generate profits in other lines of business, and therefore does not derive any significant collateral benefits from them. The Board noted that the Advisor receives proprietary research from broker-dealers that execute fund portfolio transactions and concluded that this research is likely to benefit Fund shareholders. The Board also determined that the Advisor is able to provide investment management services to certain clients other than the Fund, at least in part, due to its existing infrastructure built to serve the fund complex. The Board concluded, however, that the assets of those other clients are not material to the analysis and, where applicable, may be included with the assets of the Fund to determine breakpoints in the management fee schedule.
Existing Relationship. The Board also considered whether there was any reason for not continuing the existing arrangement with the Advisor. In this regard, the Board was mindful of the potential disruptions of the Fund’s operations and various risks, uncertainties, and other effects that could occur as a result of a decision not to continue such relationship. In particular, the Board recognized that most shareholders have invested in the Fund on the strength of the Advisor’s industry standing and reputation and in the expectation that the Advisor will have a continuing role in providing advisory services to the Fund.
Conclusion of the Directors. As a result of this process, the Board, including all of the independent Directors, taking into account all of the factors discussed above and the information provided by the Advisor and others, concluded that the management agreement between the Fund and the Advisor is fair and reasonable in light of the services provided and should be renewed.
Retirement Account Information
As required by law, distributions you receive from certain IRAs are subject to federal income tax withholding, unless you elect not to have withholding apply. Tax will be withheld on the total amount withdrawn even though you may be receiving amounts that are not subject to withholding, such as nondeductible contributions. In such case, excess amounts of withholding could occur. You may adjust your withholding election so that a greater or lesser amount will be withheld.
If you don’t want us to withhold on this amount, you must notify us to not withhold the federal income tax. You may notify us in writing or in certain situations by telephone or through other electronic means. For systematic withdrawals, your withholding election will remain in effect until revoked or changed by filing a new election. You have the right to revoke your election at any time.
Remember, even if you elect not to have income tax withheld, you are liable for paying income tax on the taxable portion of your withdrawal. If you elect not to have income tax withheld or you don’t have enough income tax withheld, you may be responsible for payment of estimated tax. You may incur penalties under the estimated tax rules if your withholding and estimated tax payments are not sufficient. You can reduce or defer the income tax on a distribution by directly or indirectly rolling such distribution over to another IRA or eligible plan. You should consult your tax advisor for additional information.
State tax will be withheld if, at the time of your distribution, your address is within one of the mandatory withholding states and you have federal income tax withheld (or as otherwise required by state law). State taxes will be withheld from your distribution in accordance with the respective state rules.
Distributions you receive from 403(b), 457 and qualified plans are subject to special tax and withholding rules. Your plan administrator or plan sponsor is required to provide you with a special tax notice explaining those rules at the time you request a distribution. If applicable, federal and/or state taxes may be withheld from your distribution amount.
Proxy Voting Policies
A description of the policies that the fund's investment advisor uses in exercising the voting rights associated with the securities purchased and/or held by the fund is available without charge, upon request, by calling 1-800-345-2021. It is also available on the "About Us" page of American Century Investments’ website at americancentury.com and on the Securities and Exchange Commission’s website at sec.gov. Information regarding how the investment advisor voted proxies relating to portfolio securities during the most recent 12-month period ended June 30 is available on the "About Us" page at americancentury.com. It is also available at sec.gov.
Quarterly Portfolio Disclosure
The fund files its complete schedule of portfolio holdings with the Securities and Exchange Commission (SEC) for the first and third quarters of each fiscal year on Form N-Q. The fund’s Forms N-Q are available on the SEC’s website at sec.gov, and may be reviewed and copied at the SEC’s Public Reference Room in Washington, DC. Information on the operation of the Public Reference Room may be obtained by calling 1-800-SEC-0330. The fund also makes its complete schedule of portfolio holdings for the most recent quarter of its fiscal year available on its
website at americancentury.com and, upon request, by calling 1-800-345-2021.
Other Tax Information
The following information is provided pursuant to provisions of the Internal Revenue Code.
The fund hereby designates up to the maximum amount allowable as qualified dividend income for the fiscal year ended October 31, 2014.
For corporate taxpayers, the fund hereby designates $118,367,249, or up to the maximum amount allowable, of ordinary income distributions paid during the fiscal year ended October 31, 2014 as qualified for the corporate dividends received deduction.
The fund hereby designates $127,918,496 as qualified short-term capital gain distributions for purposes of Internal Revenue Code Section 871 for the fiscal year ended October 31, 2014.
The fund hereby designates $673,675,254, or up to the maximum amount allowable, as long-term capital gain distributions for the fiscal year ended October 31, 2014.
The fund utilized earnings and profits of $222,292,972 distributed to shareholders on redemption of shares as part of the dividends paid deduction (tax equalization).
|
| | |
| |
| | | |
| Contact Us | americancentury.com | |
| Automated Information Line | 1-800-345-8765 | |
| Investor Services Representative | 1-800-345-2021 or 816-531-5575 | |
| Investors Using Advisors | 1-800-378-9878 | |
| Business, Not-For-Profit, Employer-Sponsored Retirement Plans | 1-800-345-3533 | |
| Banks and Trust Companies, Broker-Dealers, Financial Professionals, Insurance Companies | 1-800-345-6488 | |
| Telecommunications Relay Service for the Deaf | 711 | |
| | | |
| American Century Mutual Funds, Inc. | |
| | | |
Investment Advisor: American Century Investment Management, Inc. Kansas City, Missouri | |
| | | |
| This report and the statements it contains are submitted for the general information of our shareholders. The report is not authorized for distribution to prospective investors unless preceded or accompanied by an effective prospectus. | |
| | | |
©2014 American Century Proprietary Holdings, Inc. All rights reserved.
CL-ANN-83998 1412 | |
|
| |
| ANNUAL REPORT | OCTOBER 31, 2014 |
Heritage Fund
|
| |
| President’s Letter | |
| Performance | |
| Portfolio Commentary | |
| Fund Characteristics | |
| Shareholder Fee Example | |
| Schedule of Investments | |
| Statement of Assets and Liabilities | |
| Statement of Operations | |
| Statement of Changes in Net Assets | |
| Notes to Financial Statements | |
| Financial Highlights | |
| Report of Independent Registered Public Accounting Firm | |
| Management | |
| Approval of Management Agreement | |
| Additional Information | |
Any opinions expressed in this report reflect those of the author as of the date of the report, and do not necessarily represent the opinions of American Century Investments® or any other person in the American Century Investments organization. Any such opinions are subject to change at any time based upon market or other conditions and American Century Investments disclaims any responsibility to update such opinions. These opinions may not be relied upon as investment advice and, because investment decisions made by American Century Investments funds are based on numerous factors, may not be relied upon as an indication of trading intent on behalf of any American Century Investments fund. Security examples are used for representational purposes only and are not intended as recommendations to purchase or sell securities. Performance information for comparative indices and securities is provided to American Century Investments by third party vendors. To the best of American Century Investments’ knowledge, such information is accurate at the time of printing.
|
| |
| Dear Investor:
Thank you for reviewing this annual report for the 12 months ended October 31, 2014. It provides investment performance and portfolio information for the reporting period, plus longer-term historical performance data.
Annual reports remain important vehicles for conveying information about fund returns, including market and economic factors that affected performance during the reporting period. For additional, updated investment and market insights, we encourage you to visit our website, americancentury.com. |
| Jonathan Thomas |
Favorable Fiscal Year for U.S. Stocks and Bonds
Mostly stimulative monetary policies by central banks and expectations of longer-term economic improvement, interspersed with concerns about nearer-term weaker-than-expected global economic data and geopolitical conflicts, helped drive financial market returns during the reporting period. We believe the combination of longer-term optimism about U.S. economic growth, low costs of capital, and continued central bank stimulus (even as the U.S. Federal Reserve’s latest monthly bond purchase program ended) helped persuade investors to seek risk and yield, which benefited U.S. stocks and bonds. The S&P 500 Index gained 17.27% during the 12 months. The 30-year U.S. Treasury bond was close behind, returning 15.44%, according to Barclays. U.S. real estate investment trusts (REITs), whose shares combine performance attributes of stocks and bonds, benefited from both—the MSCI U.S. REIT Index advanced 19.19%.
U.S. market benchmark returns generally outpaced their non-U.S. counterparts. The U.S. was perceived by investors as a relative bastion of growth, stability, and potentially attractive yields compared with most of the rest of the world, so capital flows generally favored U.S. assets. These capital flows, along with weaker-than-expected global growth, lower-than-expected global inflation, and falling commodity and energy prices, helped keep long-term interest rates and other corporate costs low. U.S. stocks just completed a solid third-quarter earnings reporting season, though questions remain about next year’s revenues, given this year’s slowdown in global economic growth and concerns about how far it could extend into 2015.
We believe continuing global economic and geopolitical uncertainties could continue to support the relative appeal of U.S. assets in coming months. But the end of the U.S. Federal Reserve’s monthly bond-buying program and the still-looming possibility of higher interest rates in 2015 point to potential U.S. market volatility ahead. In this environment, we continue to believe in a disciplined, diversified, long-term investment approach, using professionally managed stock and bond portfolios for meeting financial goals. We appreciate your continued trust in us.
Sincerely,
Jonathan Thomas
President and Chief Executive Officer
American Century Investments
|
| | | | | | |
| Total Returns as of October 31, 2014 | | | |
| | | | Average Annual Returns | |
| | Ticker Symbol | 1 year | 5 years | 10 years | Since Inception | Inception Date |
| Investor Class | TWHIX | 8.33% | 17.04% | 12.78% | 11.76% | 11/10/87 |
| Russell Midcap Growth Index | — | 14.59% | 18.72% | 10.16% | 11.36%(1) | — |
| Institutional Class | ATHIX | 8.53% | 17.28% | 13.01% | 9.44% | 6/16/97 |
A Class(2) | ATHAX | | | | | 7/11/97 |
| No sales charge* | | 8.04% | 16.74% | 12.50% | 8.69% | |
| With sales charge* | | 1.82% | 15.37% | 11.84% | 8.32% | |
| B Class | ATHBX | | | | | 9/28/07 |
| No sales charge* | | 7.23% | 15.88% | — | 5.34% | |
| With sales charge* | | 3.23% | 15.77% | — | 5.34% | |
| C Class | AHGCX | 7.25% | 15.88% | 11.67% | 7.19% | 6/26/01 |
| R Class | ATHWX | 7.80% | 16.46% | — | 5.86% | 9/28/07 |
| R6 Class | ATHDX | 8.72% | — | — | 13.08% | 7/26/13 |
| |
| * | Sales charges include initial sales charges and contingent deferred sales charges (CDSCs), as applicable. A Class shares have a 5.75% maximum initial sales charge and may be subject to a maximum CDSC of 1.00%. B Class shares redeemed within six years of purchase are subject to a CDSC that declines from 5.00% during the first year to 0.00% after the sixth year. C Class shares redeemed within 12 months of purchase are subject to a maximum CDSC of 1.00%. The SEC requires that mutual funds provide performance information net of maximum sales charges in all cases where charges could be applied. |
| |
| (1) | Since October 31, 1987, the date nearest the Investor Class’s inception for which data are available. |
| |
| (2) | Prior to September 4, 2007, the A Class was referred to as the Advisor Class and did not have a front-end sales charge. Performance has been adjusted to reflect this charge. |
Data presented reflect past performance. Past performance is no guarantee of future results. Current performance may be higher or lower than the performance shown. Investment return and principal value will fluctuate, and redemption value may be more or less than original cost. Data assumes reinvestment of dividends and capital gains, and none of the charts reflect the deduction of taxes that a shareholder would pay on fund distributions or the redemption of fund shares. To obtain performance data current to the most recent month end, please call 1-800-345-2021 or visit americancentury.com. For additional information about the fund, please consult the prospectus.
|
|
| Growth of $10,000 Over 10 Years |
| $10,000 investment made October 31, 2004 |
| Performance for other share classes will vary due to differences in fee structure. |
|
| |
| Value on October 31, 2014 |
| | Investor Class — $33,303 |
| |
| | Russell Midcap Growth Index — $26,338 |
| |
|
| | | | | | |
| Total Annual Fund Operating Expenses | |
| Investor Class | Institutional Class | A Class | B Class | C Class | R Class | R6 Class |
| 1.00% | 0.80% | 1.25% | 2.00% | 2.00% | 1.50% | 0.65% |
The total annual fund operating expenses shown is as stated in the fund’s prospectus current as of the date of this report. The prospectus may vary from the expense ratio shown elsewhere in this report because it is based on a different time period, includes acquired fund fees and expenses, and, if applicable, does not include fee waivers or expense reimbursements.
Data presented reflect past performance. Past performance is no guarantee of future results. Current performance may be higher or lower than the performance shown. Investment return and principal value will fluctuate, and redemption value may be more or less than original cost. Data assumes reinvestment of dividends and capital gains, and none of the charts reflect the deduction of taxes that a shareholder would pay on fund distributions or the redemption of fund shares. To obtain performance data current to the most recent month end, please call 1-800-345-2021 or visit americancentury.com. For additional information about the fund, please consult the prospectus.
Portfolio Managers: David Hollond and Greg Walsh
Performance Summary
Heritage returned 8.33%* for the 12 months ended October 31, 2014, lagging the 14.59% return of the portfolio’s benchmark, the Russell Midcap Growth Index.
U.S. stock indices delivered solid returns during the reporting period. Within the Russell Midcap Growth Index, all sectors except energy posted positive returns on a total-return basis. Telecommunication services and health care were the top-performing sectors, gaining nearly 33%. Consumer staples, utilities, and information technology also performed well and outpaced the benchmark average. Falling oil prices hurt stocks in the energy sector.
Heritage received positive absolute contributions from most sectors, with health care leading the way. Energy holdings were weakest, posting a modest loss. Stock decisions in the consumer discretionary, energy, and health care sectors were key performance detractors relative to the Russell index. Stock selection in the information technology sector and an overweight allocation to telecommunication services aided results versus the benchmark.
Consumer Discretionary Stocks Led Detractors
Stock choices in the consumer discretionary sector detracted from relative results. Specialty-flooring retailer Lumber Liquidators failed to rebound from lower-than-expected first-quarter same-store sales caused by severe winter weather. The company also reported a shortage in hardwood flooring inventory. The stock was eliminated from the portfolio. Underweighting Tesla Motors detracted as investors continued to be excited about the future of electric cars and the company’s pursuit of the Chinese market.
The energy sector also detracted, largely due to stock selection in the energy equipment and services and oil, gas, and consumable fuels industries. Key detractors included Patterson-UTI Energy and Antero Resources. Both producers and services firms are struggling with declining oil prices. Within the health care sector, not owning several solid performers in the biotechnology industry detracted.
Among other leading detractors, the social media employment site LinkedIn has seen some deceleration of growth in its user base and provided weaker-than-expected guidance for 2014. We believe there is room for growth, however, as the company has no competition, a large, traditional job search market to disrupt, new product opportunities, and expansion potential.
| |
| * | All fund returns referenced in this commentary are for Investor Class shares. Performance for other share classes will vary due to differences in fee structure; when Investor Class performance exceeds that of the fund’s benchmark, other share classes may not. See page 3 for returns for all share classes. |
Information Technology Stocks Aided Results
Stock decisions in information technology benefited relative results, led by Electronic Arts. The video game maker rose on strong results consistent with our investment thesis of improving operating margins, driven by a higher percentage of video games being delivered digitally, and a gaming console refresh cycle. Positioning in the telecommunication services sector aided results, led by an overweight position in SBA Communications, which owns and operates wireless communications towers and other structures. The company continued to benefit from industry trends and organic growth as consumers increase their use of data transmission for videos and other content, and from acquisitions, most recently one of Brazil’s largest wireless providers.
The fund’s holding of Canadian Pacific Railway, which is not a component of the index, was another key contributor. Canadian Pacific was helped by an improved balance sheet and its thoughtful use of cash, including a large share-repurchase program. Specialty pharmaceutical firm Actavis was a top contributor, as it has done a good job of integrating its purchase of Forest Laboratories and has benefited from the overall enthusiasm for merger and acquisitions in the pharmaceutical space. Sports apparel maker Under Armour aided results. The firm is gaining market share, and its international arm, though still fairly small, is growing rapidly.
Outlook
Heritage’s investment process focuses primarily on medium-sized and smaller companies with accelerating earnings growth rates and share price momentum. The fund’s positioning remains largely stock specific. As of October 31, 2014, the largest overweights were in telecommunication services and health care, while the largest underweights were in materials and consumer discretionary. Current investment themes include stocks of companies benefiting from the Affordable Care Act, which has given a lift to health care providers. We are also finding opportunities in companies that benefit from the secular shift toward natural and organic foods.
|
| |
| OCTOBER 31, 2014 | |
| Top Ten Holdings | % of net assets |
| Electronic Arts, Inc. | 4.3% |
| SBA Communications Corp., Class A | 3.2% |
| Alliance Data Systems Corp. | 3.1% |
| Teleflex, Inc. | 2.3% |
| Canadian Pacific Railway Ltd., New York Shares | 2.0% |
| Constellation Brands, Inc., Class A | 2.0% |
| Actavis plc | 2.0% |
| Affiliated Managers Group, Inc. | 1.9% |
| Spirit Airlines, Inc. | 1.9% |
| Avago Technologies Ltd. | 1.9% |
| | |
| Top Five Industries | % of net assets |
| Software | 7.7% |
| Pharmaceuticals | 5.6% |
| Machinery | 5.2% |
| Specialty Retail | 4.9% |
| Textiles, Apparel and Luxury Goods | 3.6% |
| | |
| Types of Investments in Portfolio | % of net assets |
| Common Stocks | 98.8% |
| Temporary Cash Investments | 1.0% |
| Other Assets and Liabilities | 0.2% |
Fund shareholders may incur two types of costs: (1) transaction costs, including sales charges (loads) on purchase payments and redemption/exchange fees; and (2) ongoing costs, including management fees; distribution and service (12b-1) fees; and other fund expenses. This example is intended to help you understand your ongoing costs (in dollars) of investing in your fund and to compare these costs with the ongoing cost of investing in other mutual funds.
The example is based on an investment of $1,000 made at the beginning of the period and held for the entire period from May 1, 2014 to October 31, 2014.
Actual Expenses
The table provides information about actual account values and actual expenses for each class. You may use the information, together with the amount you invested, to estimate the expenses that you paid over the period. First, identify the share class you own. Then simply divide your account value by $1,000 (for example, an $8,600 account value divided by $1,000 = 8.6), then multiply the result by the number under the heading “Expenses Paid During Period” to estimate the expenses you paid on your account during this period.
If you hold Investor Class shares of any American Century Investments fund, or Institutional Class shares of the American Century Diversified Bond Fund, in an American Century Investments account (i.e., not a financial intermediary or retirement plan account), American Century Investments may charge you a $12.50 semiannual account maintenance fee if the value of those shares is less than $10,000. We will redeem shares automatically in one of your accounts to pay the $12.50 fee. In determining your total eligible investment amount, we will include your investments in all personal accounts (including American Century Investments Brokerage accounts) registered under your Social Security number. Personal accounts include individual accounts, joint accounts, UGMA/UTMA accounts, personal trusts, Coverdell Education Savings Accounts and IRAs (including traditional, Roth, Rollover, SEP-, SARSEP- and SIMPLE-IRAs), and certain other retirement accounts. If you have only business, business retirement, employer-sponsored or American Century Investments Brokerage accounts, you are currently not subject to this fee. If you are subject to the Account Maintenance Fee, your account value could be reduced by the fee amount.
Hypothetical Example for Comparison Purposes
The table also provides information about hypothetical account values and hypothetical expenses based on the actual expense ratio of each class of your fund and an assumed rate of return of 5% per year before expenses, which is not the actual return of a fund’s share class. The hypothetical account values and expenses may not be used to estimate the actual ending account balance or expenses you paid for the period. You may use this information to compare the ongoing costs of investing in your fund and other funds. To do so, compare this 5% hypothetical example with the 5% hypothetical examples that appear in the shareholder reports of the other funds.
Please note that the expenses shown in the table are meant to highlight your ongoing costs only and do not reflect any transactional costs, such as sales charges (loads) or redemption/exchange fees. Therefore, the table is useful in comparing ongoing costs only, and will not help you determine the relative total costs of owning different funds. In addition, if these transactional costs were included, your costs would have been higher.
|
| | | | |
| Beginning
Account Value
5/1/14 | Ending
Account Value
10/31/14 | Expenses Paid
During Period(1)5/1/14 - 10/31/14 | Annualized
Expense Ratio(1) |
| Actual | | | | |
| Investor Class | $1,000 | $1,071.70 | $5.22 | 1.00% |
| Institutional Class | $1,000 | $1,072.90 | $4.18 | 0.80% |
| A Class | $1,000 | $1,070.60 | $6.52 | 1.25% |
| B Class | $1,000 | $1,066.30 | $10.42 | 2.00% |
| C Class | $1,000 | $1,066.50 | $10.42 | 2.00% |
| R Class | $1,000 | $1,069.20 | $7.82 | 1.50% |
| R6 Class | $1,000 | $1,074.00 | $3.40 | 0.65% |
| Hypothetical | | | | |
| Investor Class | $1,000 | $1,020.16 | $5.09 | 1.00% |
| Institutional Class | $1,000 | $1,021.17 | $4.08 | 0.80% |
| A Class | $1,000 | $1,018.90 | $6.36 | 1.25% |
| B Class | $1,000 | $1,015.12 | $10.16 | 2.00% |
| C Class | $1,000 | $1,015.12 | $10.16 | 2.00% |
| R Class | $1,000 | $1,017.64 | $7.63 | 1.50% |
| R6 Class | $1,000 | $1,021.93 | $3.31 | 0.65% |
| |
| (1) | Expenses are equal to the class's annualized expense ratio listed in the table above, multiplied by the average account value over the period, multiplied by 184, the number of days in the most recent fiscal half-year, divided by 365, to reflect the one-half year period. |
OCTOBER 31, 2014
|
| | | | | |
| | Shares | Value |
| COMMON STOCKS — 98.8% | | |
| Aerospace and Defense — 1.9% | | |
B/E Aerospace, Inc.(1) | 658,480 |
| $ | 49,023,836 |
|
Esterline Technologies Corp.(1) | 536,850 |
| 62,870,504 |
|
| | | 111,894,340 |
|
| Airlines — 1.9% | | |
Spirit Airlines, Inc.(1) | 1,471,097 |
| 107,551,902 |
|
| Auto Components — 1.5% | | |
| BorgWarner, Inc. | 1,467,760 |
| 83,691,675 |
|
| Automobiles — 0.5% | | |
Tesla Motors, Inc.(1) | 124,328 |
| 30,050,078 |
|
| Banks — 2.8% | | |
| East West Bancorp, Inc. | 1,287,330 |
| 47,322,251 |
|
Signature Bank(1) | 401,723 |
| 48,660,707 |
|
SVB Financial Group(1) | 575,556 |
| 64,456,516 |
|
| | | 160,439,474 |
|
| Beverages — 3.2% | | |
| Brown-Forman Corp., Class B | 773,484 |
| 71,678,763 |
|
Constellation Brands, Inc., Class A(1) | 1,263,756 |
| 115,684,224 |
|
| | | 187,362,987 |
|
| Biotechnology — 2.2% | | |
Alexion Pharmaceuticals, Inc.(1) | 332,776 |
| 63,680,015 |
|
BioMarin Pharmaceutical, Inc.(1) | 408,902 |
| 33,734,415 |
|
Regeneron Pharmaceuticals, Inc.(1) | 81,675 |
| 32,157,081 |
|
| | | 129,571,511 |
|
| Building Products — 1.5% | | |
| Fortune Brands Home & Security, Inc. | 1,074,590 |
| 46,476,018 |
|
| Lennox International, Inc. | 424,985 |
| 37,789,666 |
|
| | | 84,265,684 |
|
| Capital Markets — 2.2% | | |
Affiliated Managers Group, Inc.(1) | 543,273 |
| 108,540,512 |
|
| KKR & Co. LP | 866,896 |
| 18,690,278 |
|
| | | 127,230,790 |
|
| Chemicals — 1.4% | | |
| Sherwin-Williams Co. (The) | 232,836 |
| 53,449,832 |
|
| Westlake Chemical Corp. | 359,968 |
| 25,395,743 |
|
| | | 78,845,575 |
|
| Commercial Services and Supplies — 1.2% | | |
| KAR Auction Services, Inc. | 1,058,681 |
| 32,141,555 |
|
Stericycle, Inc.(1) | 316,227 |
| 39,844,602 |
|
| | | 71,986,157 |
|
|
| | | | | |
| | Shares | Value |
| Communications Equipment — 1.3% | | |
ARRIS Group, Inc.(1) | 919,544 |
| $ | 27,604,711 |
|
Palo Alto Networks, Inc.(1) | 454,516 |
| 48,042,341 |
|
| | | 75,647,052 |
|
| Construction and Engineering — 0.8% | | |
Quanta Services, Inc.(1) | 1,357,691 |
| 46,270,109 |
|
| Consumer Finance — 1.1% | | |
| Discover Financial Services | 1,025,463 |
| 65,404,030 |
|
| Containers and Packaging — 0.9% | | |
| Ball Corp. | 788,185 |
| 50,782,760 |
|
| Distributors — 1.5% | | |
LKQ Corp.(1) | 2,980,281 |
| 85,146,628 |
|
| Electrical Equipment — 0.8% | | |
| Acuity Brands, Inc. | 317,711 |
| 44,298,445 |
|
| Electronic Equipment, Instruments and Components — 0.8% | | |
| TE Connectivity Ltd. | 716,524 |
| 43,801,112 |
|
| Energy Equipment and Services — 1.3% | | |
| Patterson-UTI Energy, Inc. | 2,111,428 |
| 48,626,187 |
|
Weatherford International plc(1) | 1,476,483 |
| 24,243,851 |
|
| | | 72,870,038 |
|
| Food and Staples Retailing — 2.2% | | |
| Costco Wholesale Corp. | 725,698 |
| 96,786,343 |
|
United Natural Foods, Inc.(1) | 439,811 |
| 29,915,944 |
|
| | | 126,702,287 |
|
| Food Products — 2.8% | | |
Hain Celestial Group, Inc. (The)(1) | 543,978 |
| 58,885,619 |
|
| Hershey Co. (The) | 656,885 |
| 63,001,840 |
|
WhiteWave Foods Co., Class A(1) | 991,536 |
| 36,914,885 |
|
| | | 158,802,344 |
|
| Health Care Equipment and Supplies — 2.9% | | |
| Cooper Cos., Inc. (The) | 225,940 |
| 37,031,566 |
|
| Teleflex, Inc. | 1,142,974 |
| 130,436,193 |
|
| | | 167,467,759 |
|
| Health Care Providers and Services — 3.4% | | |
| AmerisourceBergen Corp. | 1,003,535 |
| 85,711,924 |
|
HCA Holdings, Inc.(1) | 844,031 |
| 59,124,372 |
|
Team Health Holdings, Inc.(1) | 792,728 |
| 49,577,209 |
|
| | | 194,413,505 |
|
| Hotels, Restaurants and Leisure — 2.8% | | |
Chipotle Mexican Grill, Inc.(1) | 137,546 |
| 87,754,348 |
|
| Dunkin' Brands Group, Inc. | 833,717 |
| 37,917,449 |
|
Panera Bread Co., Class A(1) | 231,681 |
| 37,448,917 |
|
| | | 163,120,714 |
|
| Household Durables — 1.5% | | |
| Harman International Industries, Inc. | 524,117 |
| 56,258,719 |
|
Mohawk Industries, Inc.(1) | 209,680 |
| 29,782,947 |
|
| | | 86,041,666 |
|
|
| | | | | |
| | Shares | Value |
| Internet and Catalog Retail — 1.8% | | |
TripAdvisor, Inc.(1) | 1,163,418 |
| $ | 103,148,640 |
|
| Internet Software and Services — 2.6% | | |
CoStar Group, Inc.(1) | 540,429 |
| 87,057,708 |
|
LinkedIn Corp., Class A(1) | 281,364 |
| 64,421,101 |
|
| | | 151,478,809 |
|
| IT Services — 3.1% | | |
Alliance Data Systems Corp.(1) | 622,652 |
| 176,428,444 |
|
| Leisure Products — 1.1% | | |
| Polaris Industries, Inc. | 426,262 |
| 64,305,885 |
|
| Life Sciences Tools and Services — 1.1% | | |
Illumina, Inc.(1) | 339,900 |
| 65,457,942 |
|
| Machinery — 5.2% | | |
| Flowserve Corp. | 1,436,837 |
| 97,690,548 |
|
| Ingersoll-Rand plc | 869,749 |
| 54,463,682 |
|
Middleby Corp.(1) | 1,179,945 |
| 104,425,133 |
|
| Snap-On, Inc. | 76,417 |
| 10,097,742 |
|
WABCO Holdings, Inc.(1) | 333,479 |
| 32,474,185 |
|
| | | 299,151,290 |
|
| Media — 1.7% | | |
Charter Communications, Inc., Class A(1) | 534,165 |
| 84,606,394 |
|
Tribune Media Co.(1) | 169,607 |
| 11,363,669 |
|
| | | 95,970,063 |
|
| Multiline Retail — 0.3% | | |
Burlington Stores, Inc.(1) | 474,805 |
| 19,913,322 |
|
| Oil, Gas and Consumable Fuels — 3.6% | | |
Antero Resources Corp.(1) | 1,097,000 |
| 57,526,680 |
|
| Cabot Oil & Gas Corp. | 879,995 |
| 27,367,845 |
|
Concho Resources, Inc.(1) | 670,405 |
| 73,094,257 |
|
Gulfport Energy Corp.(1) | 535,723 |
| 26,882,580 |
|
Oasis Petroleum, Inc.(1) | 660,544 |
| 19,789,898 |
|
| | | 204,661,260 |
|
| Pharmaceuticals — 5.6% | | |
Actavis plc(1) | 468,716 |
| 113,776,122 |
|
Endo International plc(1) | 932,135 |
| 62,378,474 |
|
Salix Pharmaceuticals Ltd.(1) | 477,350 |
| 68,666,797 |
|
| Zoetis, Inc. | 2,124,235 |
| 78,936,573 |
|
| | | 323,757,966 |
|
| Professional Services — 1.1% | | |
| Nielsen NV | 1,549,480 |
| 65,837,405 |
|
| Real Estate Management and Development — 1.3% | | |
| Jones Lang LaSalle, Inc. | 574,297 |
| 77,650,697 |
|
| Road and Rail — 3.3% | | |
| Canadian Pacific Railway Ltd., New York Shares | 563,475 |
| 117,022,488 |
|
| Kansas City Southern | 607,285 |
| 74,568,525 |
|
| | | 191,591,013 |
|
|
| | | | | |
| | Shares | Value |
| Semiconductors and Semiconductor Equipment — 3.2% | | |
| Avago Technologies Ltd. | 1,236,954 |
| $ | 106,687,282 |
|
NXP Semiconductor NV(1) | 1,143,630 |
| 78,521,636 |
|
| | | 185,208,918 |
|
| Software — 7.7% | | |
Electronic Arts, Inc.(1) | 6,048,711 |
| 247,815,689 |
|
| Intuit, Inc. | 936,392 |
| 82,411,860 |
|
NetSuite, Inc.(1) | 324,082 |
| 35,214,750 |
|
Splunk, Inc.(1) | 621,476 |
| 41,067,134 |
|
Workday, Inc.(1) | 378,116 |
| 36,102,516 |
|
| | | 442,611,949 |
|
| Specialty Retail — 4.9% | | |
| Advance Auto Parts, Inc. | 373,823 |
| 54,937,028 |
|
Cabela's, Inc.(1) | 235,814 |
| 11,323,788 |
|
O'Reilly Automotive, Inc.(1) | 326,869 |
| 57,489,720 |
|
Restoration Hardware Holdings, Inc.(1) | 384,776 |
| 30,905,208 |
|
| Signet Jewelers Ltd. | 619,809 |
| 74,383,278 |
|
| Tractor Supply Co. | 718,125 |
| 52,581,113 |
|
| | | 281,620,135 |
|
| Textiles, Apparel and Luxury Goods — 3.6% | | |
| Hanesbrands, Inc. | 831,526 |
| 87,817,461 |
|
Kate Spade & Co.(1) | 1,034,189 |
| 28,057,547 |
|
Michael Kors Holdings Ltd.(1) | 362,196 |
| 28,464,984 |
|
Under Armour, Inc., Class A(1) | 981,595 |
| 64,373,000 |
|
| | | 208,712,992 |
|
| Wireless Telecommunication Services — 3.2% | | |
SBA Communications Corp., Class A(1) | 1,618,278 |
| 181,781,168 |
|
TOTAL COMMON STOCKS (Cost $4,191,194,697) | | 5,692,946,520 |
|
| TEMPORARY CASH INVESTMENTS — 1.0% | | |
| Repurchase Agreement, Bank of America Merrill Lynch, (collateralized by various U.S. Treasury obligations, 1.375% - 2.625%, 12/31/14 - 2/28/19, valued at $14,316,355), in a joint trading account at 0.07%, dated 10/31/14, due 11/3/14 (Delivery value $14,037,863) | | 14,037,781 |
|
| Repurchase Agreement, Credit Suisse First Boston, Inc., (collateralized by various U.S. Treasury obligations, 0.25%, 10/15/15, valued at $5,727,729), in a joint trading account at 0.04%, dated 10/31/14, due 11/3/14 (Delivery value $5,615,131) | | 5,615,112 |
|
| Repurchase Agreement, Goldman Sachs & Co., (collateralized by various U.S. Treasury obligations, 0.125%, 12/31/14, valued at $11,466,409), in a joint trading account at 0.03%, dated 10/31/14, due 11/3/14 (Delivery value $11,230,253) | | 11,230,225 |
|
| SSgA U.S. Government Money Market Fund, Class N | 30,890,110 |
| 30,890,110 |
|
TOTAL TEMPORARY CASH INVESTMENTS (Cost $61,773,228) | | 61,773,228 |
|
TOTAL INVESTMENT SECURITIES — 99.8% (Cost $4,252,967,925) | | 5,754,719,748 |
|
| OTHER ASSETS AND LIABILITIES — 0.2% | | 8,951,606 |
|
| TOTAL NET ASSETS — 100.0% | | $ | 5,763,671,354 |
|
|
| | | | | | | | | | |
| FORWARD FOREIGN CURRENCY EXCHANGE CONTRACTS |
| Currency Purchased | Currency Sold | Counterparty | Settlement Date | Unrealized Appreciation
(Depreciation) |
| USD | 108,247,560 |
| CAD | 121,464,587 |
| JPMorgan Chase Bank N.A. | 11/28/14 | $ | 541,522 |
|
|
| | |
| NOTES TO SCHEDULE OF INVESTMENTS |
| CAD | - | Canadian Dollar |
| USD | - | United States Dollar |
See Notes to Financial Statements.
|
|
| Statement of Assets and Liabilities |
|
| | | |
| OCTOBER 31, 2014 | |
| Assets | |
| Investment securities, at value (cost of $4,252,967,925) | $ | 5,754,719,748 |
|
| Foreign currency holdings, at value (cost of $17,853) | 16,114 |
|
| Receivable for investments sold | 120,308,713 |
|
| Receivable for capital shares sold | 1,278,702 |
|
| Unrealized appreciation on forward foreign currency exchange contracts | 541,522 |
|
| Dividends and interest receivable | 1,164,407 |
|
| | 5,878,029,206 |
|
| | |
| Liabilities | |
| Payable for investments purchased | 78,759,025 |
|
| Payable for capital shares redeemed | 30,637,969 |
|
| Accrued management fees | 4,651,330 |
|
| Distribution and service fees payable | 309,528 |
|
| | 114,357,852 |
|
| | |
| Net Assets | $ | 5,763,671,354 |
|
| | |
| Net Assets Consist of: | |
| Capital (par value and paid-in surplus) | $ | 3,487,909,006 |
|
| Accumulated net investment loss | (32,365,845 | ) |
| Undistributed net realized gain | 805,803,168 |
|
| Net unrealized appreciation | 1,502,325,025 |
|
| | $ | 5,763,671,354 |
|
|
| | | | | | |
| | Net Assets | Shares Outstanding | Net Asset Value Per Share |
| Investor Class, $0.01 Par Value |
| $4,449,376,724 |
| 165,441,119 |
| $26.89 |
| Institutional Class, $0.01 Par Value |
| $198,894,925 |
| 7,151,126 |
| $27.81 |
| A Class, $0.01 Par Value |
| $869,380,593 |
| 33,728,941 |
| $25.78* |
| B Class, $0.01 Par Value |
| $2,628,579 |
| 104,781 |
| $25.09 |
| C Class, $0.01 Par Value |
| $128,521,977 |
| 5,564,794 |
| $23.10 |
| R Class, $0.01 Par Value |
| $58,426,239 |
| 2,249,385 |
| $25.97 |
| R6 Class, $0.01 Par Value |
| $56,442,317 |
| 2,025,743 |
| $27.86 |
*Maximum offering price $27.35 (net asset value divided by 0.9425).
See Notes to Financial Statements.
|
| | | |
| YEAR ENDED OCTOBER 31, 2014 | |
| Investment Income (Loss) | |
| Income: | |
| Dividends (net of foreign taxes withheld of $283,195) | $ | 26,041,520 |
|
| Interest | 8,522 |
|
| | 26,050,042 |
|
| | |
| Expenses: | |
| Management fees | 57,645,314 |
|
| Distribution and service fees: | |
| A Class | 2,563,839 |
|
| B Class | 29,020 |
|
| C Class | 1,332,791 |
|
| R Class | 306,463 |
|
| Directors' fees and expenses | 60,588 |
|
| Other expenses | 3,257 |
|
| | 61,941,272 |
|
| | |
| Net investment income (loss) | (35,891,230 | ) |
| | |
| Realized and Unrealized Gain (Loss) | |
| Net realized gain (loss) on: | |
| Investment transactions | 966,288,081 |
|
| Foreign currency transactions | 2,656,645 |
|
| | 968,944,726 |
|
| | |
| Change in net unrealized appreciation (depreciation) on: | |
| Investments | (464,921,185 | ) |
| Translation of assets and liabilities in foreign currencies | 43,710 |
|
| | (464,877,475 | ) |
| | |
| Net realized and unrealized gain (loss) | 504,067,251 |
|
| | |
| Net Increase (Decrease) in Net Assets Resulting from Operations | $ | 468,176,021 |
|
See Notes to Financial Statements.
|
|
| Statement of Changes in Net Assets |
|
| | | | | | |
| YEARS ENDED OCTOBER 31, 2014 AND OCTOBER 31, 2013 |
| Increase (Decrease) in Net Assets | October 31, 2014 | October 31, 2013 |
| Operations | | |
| Net investment income (loss) | $ | (35,891,230 | ) | $ | (15,794,803 | ) |
| Net realized gain (loss) | 968,944,726 |
| 579,776,023 |
|
| Change in net unrealized appreciation (depreciation) | (464,877,475 | ) | 504,740,345 |
|
| Net increase (decrease) in net assets resulting from operations | 468,176,021 |
| 1,068,721,565 |
|
| | | |
| Distributions to Shareholders | | |
| From net realized gains: | | |
| Investor Class | (377,362,029 | ) | (51,872,462 | ) |
| Institutional Class | (30,282,537 | ) | (4,009,776 | ) |
| A Class | (140,744,405 | ) | (20,688,083 | ) |
| B Class | (416,601 | ) | (62,664 | ) |
| C Class | (19,841,840 | ) | (2,690,270 | ) |
| R Class | (7,088,192 | ) | (839,874 | ) |
| R6 Class | (9,153 | ) | — |
|
| Decrease in net assets from distributions | (575,744,757 | ) | (80,163,129 | ) |
| | | |
| Capital Share Transactions | | |
| Net increase (decrease) in net assets from capital share transactions (Note 5) | 1,321,732,036 |
| (258,823,703 | ) |
| | | |
| Net increase (decrease) in net assets | 1,214,163,300 |
| 729,734,733 |
|
| | | |
| Net Assets | | |
| Beginning of period | 4,549,508,054 |
| 3,819,773,321 |
|
| End of period | $ | 5,763,671,354 |
| $ | 4,549,508,054 |
|
| | | |
| Accumulated net investment loss | $ | (32,365,845 | ) | $ | (482,837 | ) |
See Notes to Financial Statements.
|
|
| Notes to Financial Statements |
OCTOBER 31, 2014
1. Organization
American Century Mutual Funds, Inc. (the corporation) is registered under the Investment Company Act of 1940, as amended (the 1940 Act), as an open-end management investment company and is organized as a Maryland corporation. Heritage Fund (the fund) is one fund in a series issued by the corporation. The fund is diversified as defined under the 1940 Act. The fund's investment objective is to seek long-term capital growth.
The fund offers the Investor Class, the Institutional Class, the A Class, the B Class, the C Class, the R Class and the R6 Class. The A Class may incur an initial sales charge. The A Class, B Class and C Class may be subject to a contingent deferred sales charge. The share classes differ principally in their respective sales charges and distribution and shareholder servicing expenses and arrangements. The Institutional Class and R6 Class shareholders do not require the same level of shareholder and administrative services from American Century Investment Management, Inc. (ACIM) (the investment advisor) as shareholders of other classes. In addition, financial intermediaries do not receive any service, distribution or administrative fees for the R6 Class. As a result, the Institutional Class and R6 Class are charged lower unified management fees. Sale of the R6 Class commenced on July 26, 2013.
2. Significant Accounting Policies
The following is a summary of significant accounting policies consistently followed by the fund in preparation of its financial statements. The fund is an investment company and follows accounting and reporting guidance in accordance with accounting principles generally accepted in the United States of America. This may require management to make certain estimates and assumptions at the date of the financial statements. Actual results could differ from these estimates. Management evaluated the impact of events or transactions occurring through the date the financial statements were issued that would merit recognition or disclosure.
Investment Valuations — The fund determines the fair value of its investments and computes its net asset value per share at the close of regular trading (usually 4 p.m. Eastern time) on the New York Stock Exchange (NYSE) on each day the NYSE is open. The Board of Directors has adopted valuation policies and procedures to guide the investment advisor in the fund’s investment valuation process and to provide methodologies for the oversight of the fund’s pricing function.
Equity securities that are listed or traded on a domestic securities exchange are valued at the last reported sales price or at the official closing price as provided by the exchange. Equity securities traded on foreign securities exchanges are generally valued at the closing price of such securities on the exchange where primarily traded or at the close of the NYSE, if that is earlier. If no last sales price is reported, or if local convention or regulation so provides, the mean of the latest bid and asked prices may be used. Securities traded over-the-counter are valued at the mean of the latest bid and asked prices, the last sales price, or the official closing price. Equity securities initially expressed in local currencies are translated into U.S. dollars at the mean of the appropriate currency exchange rate at the close of the NYSE as provided by an independent pricing service.
Fixed income securities maturing within 60 days at the time of purchase may be valued at cost, plus or minus any amortized discount or premium or at the evaluated mean as provided by an independent pricing service. Evaluated mean prices are commonly derived through utilization of market models, which may consider, among other factors: trade data, quotations from dealers and active market makers, relevant yield curve and spread data, related sector levels, creditworthiness, trade data or market information on comparable securities, and other relevant security specific information.
Open-end management investment companies are valued at the reported net asset value per share. Repurchase agreements are valued at cost, which approximates fair value. Forward foreign currency exchange contracts are valued at the mean of the appropriate forward exchange rate at the close of the NYSE as provided by an independent pricing service.
If the fund determines that the market price for an investment is not readily available or the valuation methods mentioned above do not reflect an investment’s fair value, such investment is valued as determined in good faith by the Board of Directors or its delegate, in accordance with policies and procedures adopted by the Board of Directors. In its determination of fair value, the fund may review several factors including, but not limited to, market information regarding the specific investment or comparable investments and correlation with other investment types, futures indices or general market indicators. Circumstances that may cause the fund to use these procedures to value an investment include, but are not limited to: an investment has been declared in default or is distressed; trading in a security has been suspended during the trading day or a security is not actively trading on its principal exchange; prices received from a regular pricing source are deemed unreliable; or there is a foreign market holiday and no trading occurred.
The fund monitors for significant events occurring after the close of an investment’s primary exchange but before the fund’s net asset value per share is determined. Significant events may include, but are not limited to: corporate announcements and transactions; governmental action and political unrest that could impact a specific investment or an investment sector; or armed conflicts, natural disasters and similar events that could affect investments in a specific country or region. The fund also monitors for significant fluctuations between domestic and foreign markets, as evidenced by the U.S. market or such other indicators that the Board of Directors, or its delegate, deems appropriate. If significant fluctuations in foreign markets are identified, the fund may apply a model-derived factor to the closing price of equity securities traded on foreign securities exchanges. The factor is based on observable market data as provided by an independent pricing service.
Security Transactions — Security transactions are accounted for as of the trade date. Net realized gains and losses are determined on the identified cost basis, which is also used for federal income tax purposes.
Investment Income — Dividend income less foreign taxes withheld, if any, is recorded as of the ex-dividend date. Distributions received on securities that represent a return of capital or long-term capital gain are recorded as a reduction of cost of investments and/or as a realized gain. The fund may estimate the components of distributions received that may be considered nontaxable distributions or long-term capital gain distributions for income tax purposes. Interest income is recorded on the accrual basis and includes accretion of discounts and amortization of premiums.
Foreign Currency Translations — All assets and liabilities initially expressed in foreign currencies are translated into U.S. dollars at prevailing exchange rates at period end. The fund may enter into spot foreign currency exchange contracts to facilitate transactions denominated in a foreign currency. Purchases and sales of investment securities, dividend and interest income, spot foreign currency exchange contracts, and expenses are translated at the rates of exchange prevailing on the respective dates of such transactions. Net realized and unrealized foreign currency exchange gains or losses related to investment securities are a component of net realized gain (loss) on investment transactions and change in net unrealized appreciation (depreciation) on investments, respectively.
Repurchase Agreements — The fund may enter into repurchase agreements with institutions that ACIM has determined are creditworthy pursuant to criteria adopted by the Board of Directors. The fund requires that the collateral, represented by securities, received in a repurchase transaction be transferred to the custodian in a manner sufficient to enable the fund to obtain those securities in the event of a default under the repurchase agreement. ACIM monitors, on a daily basis, the securities transferred to ensure the value, including accrued interest, of the securities under each repurchase agreement is equal to or greater than amounts owed to the fund under each repurchase agreement.
Joint Trading Account — Pursuant to an Exemptive Order issued by the Securities and Exchange Commission, the fund, along with certain other funds in the American Century Investments family of funds, may transfer uninvested cash balances into a joint trading account. These balances are invested in one or more repurchase agreements that are collateralized by U.S. Treasury or Agency obligations.
Income Tax Status — It is the fund’s policy to distribute substantially all net investment income and net realized gains to shareholders and to otherwise qualify as a regulated investment company under provisions of the Internal Revenue Code. Accordingly, no provision has been made for income taxes. The fund files U.S. federal, state, local and non-U.S. tax returns as applicable. The fund's tax returns are subject to examination by the relevant taxing authority until expiration of the applicable statute of limitations, which is generally three years from the date of filing but can be longer in certain jurisdictions. At this time, management believes there are no uncertain tax positions which, based on their technical merit, would not be sustained upon examination and for which it is reasonably possible that the total amounts of unrecognized tax benefits will significantly change in the next twelve months.
Multiple Class — All shares of the fund represent an equal pro rata interest in the net assets of the class to which such shares belong, and have identical voting, dividend, liquidation and other rights and the same terms and conditions, except for class specific expenses and exclusive rights to vote on matters affecting only individual classes. Income, non-class specific expenses, and realized and unrealized capital gains and losses of the fund are allocated to each class of shares based on their relative net assets.
Distributions to Shareholders — Distributions from net investment income and net realized gains, if any, are generally declared and paid annually. The fund may elect to treat a portion of its payment to a redeeming shareholder, which represents the pro rata share of undistributed net investment income and net realized gains, as a distribution for federal income tax purposes (tax equalization).
Indemnifications — Under the corporation’s organizational documents, its officers and directors are indemnified against certain liabilities arising out of the performance of their duties to the fund. In addition, in the normal course of business, the fund enters into contracts that provide general indemnifications. The maximum exposure under these arrangements is unknown as this would involve future claims that may be made against a fund. The risk of material loss from such claims is considered by management to be remote.
3. Fees and Transactions with Related Parties
Certain officers and directors of the corporation are also officers and/or directors of American Century Companies, Inc. (ACC). The corporation’s investment advisor, ACIM, the corporation's distributor, American Century Investment Services, Inc. (ACIS), and the corporation’s transfer agent, American Century Services, LLC, are wholly owned, directly or indirectly, by ACC. Various funds issued by American Century Asset Allocation Portfolios, Inc. and American Century Strategic Asset Allocations, Inc. own, in aggregate, 7% of the shares of the fund.
Management Fees — The corporation has entered into a management agreement with ACIM, under which ACIM provides the fund with investment advisory and management services in exchange for a single, unified management fee (the fee) per class. The agreement provides that all expenses of managing and operating the fund, except distribution and service fees, brokerage expenses, taxes, interest, fees and expenses of the independent directors (including legal counsel fees), and extraordinary expenses, will be paid by ACIM. The fee is computed and accrued daily based on each class's daily net assets and paid monthly in arrears. The annual management fee is 1.00% for the Investor Class, A Class, B Class, C Class and R Class, 0.80% for the Institutional Class and 0.65% for the R6 Class.
Distribution and Service Fees — The Board of Directors has adopted a separate Master Distribution and Individual Shareholder Services Plan for each of the A Class, B Class, C Class and R Class (collectively the plans), pursuant to Rule 12b-1 of the 1940 Act. The plans provide that the A Class will pay ACIS an annual distribution and service fee of 0.25%. The plans provide that the B Class and C Class will each pay ACIS an annual distribution and service fee of 1.00%, of which 0.25% is paid for individual shareholder services and 0.75% is paid for distribution services. The plans provide that the R Class will pay ACIS an annual distribution and service fee of 0.50%. The fees are computed and accrued daily based on each class’s daily net assets and paid monthly in arrears. The fees are used to pay financial intermediaries for distribution and individual shareholder services. Fees incurred under the plans during the year ended October 31, 2014 are detailed in the Statement of Operations.
Directors' Fees and Expenses — The Board of Directors is responsible for overseeing the investment advisor’s management and operations of the fund. The directors receive detailed information about the fund and its investment advisor regularly throughout the year, and meet at least quarterly with management of the investment advisor to review reports about fund operations. Fees and expenses incurred in conjunction with the directors during the year ended October 31, 2014 are detailed in the Statement of Operations. The fund’s officers do not receive compensation from the fund.
4. Investment Transactions
Purchases and sales of investment securities, excluding short-term investments, for the year ended October 31, 2014 were $4,172,024,776 and $4,955,788,123, respectively.
5. Capital Share Transactions
Transactions in shares of the fund were as follows:
|
| | | | | | | | | | |
| | Year ended October 31, 2014 | Year ended October 31, 2013(1) |
| | Shares | Amount | Shares | Amount |
| Investor Class/Shares Authorized | 1,150,000,000 |
| | 400,000,000 |
| |
| Sold | 19,443,145 |
| $ | 506,861,274 |
| 16,795,955 |
| $ | 412,396,030 |
|
| Issued in connection with reorganization (Note 10) | 57,086,650 |
| 1,417,578,208 |
| — |
| — |
|
| Issued in reinvestment of distributions | 14,781,644 |
| 364,367,525 |
| 2,209,352 |
| 49,666,229 |
|
| Redeemed | (31,920,610 | ) | (828,419,741 | ) | (24,326,674 | ) | (597,491,711 | ) |
| | 59,390,829 |
| 1,460,387,266 |
| (5,321,367 | ) | (135,429,452 | ) |
| Institutional Class/Shares Authorized | 120,000,000 |
| | 40,000,000 |
| |
| Sold | 2,215,202 |
| 59,672,546 |
| 2,587,620 |
| 64,421,636 |
|
| Issued in connection with reorganization (Note 10) | 2,456,543 |
| 62,960,928 |
| — |
| — |
|
| Issued in reinvestment of distributions | 1,186,665 |
| 30,200,632 |
| 173,645 |
| 4,005,998 |
|
| Redeemed | (7,034,757 | ) | (189,801,647 | ) | (2,603,496 | ) | (66,934,941 | ) |
| | (1,176,347 | ) | (36,967,541 | ) | 157,769 |
| 1,492,693 |
|
| A Class/Shares Authorized | 510,000,000 |
| | 200,000,000 |
| |
| Sold | 6,854,460 |
| 171,181,761 |
| 8,850,144 |
| 211,406,392 |
|
| Issued in connection with reorganization (Note 10) | 2,306,433 |
| 55,013,464 |
| — |
| — |
|
| Issued in reinvestment of distributions | 5,786,878 |
| 137,033,276 |
| 915,571 |
| 19,922,827 |
|
| Redeemed | (20,982,643 | ) | (525,622,531 | ) | (14,746,186 | ) | (352,236,250 | ) |
| | (6,034,872 | ) | (162,394,030 | ) | (4,980,471 | ) | (120,907,031 | ) |
| B Class/Shares Authorized | 35,000,000 |
| | 35,000,000 |
| |
| Sold | 3,351 |
| 85,668 |
| 2,503 |
| 57,164 |
|
| Issued in reinvestment of distributions | 16,762 |
| 388,880 |
| 2,775 |
| 59,744 |
|
| Redeemed | (33,378 | ) | (817,653 | ) | (28,873 | ) | (669,324 | ) |
| | (13,265 | ) | (343,105 | ) | (23,595 | ) | (552,416 | ) |
| C Class/Shares Authorized | 85,000,000 |
| | 35,000,000 |
| |
| Sold | 742,832 |
| 16,581,958 |
| 1,063,202 |
| 23,407,917 |
|
| Issued in connection with reorganization (Note 10) | 5,312 |
| 114,258 |
| — |
| — |
|
| Issued in reinvestment of distributions | 767,435 |
| 16,392,408 |
| 106,299 |
| 2,131,290 |
|
| Redeemed | (1,477,752 | ) | (33,088,095 | ) | (1,493,875 | ) | (32,586,225 | ) |
| | 37,827 |
| 529 |
| (324,374 | ) | (7,047,018 | ) |
| R Class/Shares Authorized | 40,000,000 |
| | 30,000,000 |
| |
| Sold | 554,024 |
| 13,999,728 |
| 732,975 |
| 17,538,607 |
|
| Issued in connection with reorganization (Note 10) | 568,103 |
| 13,685,676 |
| — |
| — |
|
| Issued in reinvestment of distributions | 296,453 |
| 7,088,192 |
| 38,176 |
| 839,874 |
|
| Redeemed | (1,121,755 | ) | (27,935,786 | ) | (606,808 | ) | (14,830,736 | ) |
| | 296,825 |
| 6,837,810 |
| 164,343 |
| 3,547,745 |
|
| R6 Class/Shares Authorized | 50,000,000 |
| | 50,000,000 |
| |
| Sold | 2,267,161 |
| 60,858,580 |
| 2,514 |
| 71,776 |
|
| Issued in reinvestment of distributions | 359 |
| 9,153 |
| — |
| — |
|
| Redeemed | (244,291 | ) | (6,656,626 | ) | — |
| — |
|
| | 2,023,229 |
| 54,211,107 |
| 2,514 |
| 71,776 |
|
| Net increase (decrease) | 54,524,226 |
| $ | 1,321,732,036 |
| (10,325,181 | ) | $ | (258,823,703 | ) |
| |
| (1) | July 26, 2013 (commencement of sale) through October 31, 2013 for the R6 Class. |
6. Fair Value Measurements
The fund’s investments valuation process is based on several considerations and may use multiple inputs to determine the fair value of the investments held by the fund. In conformity with accounting principles generally accepted in the United States of America, the inputs used to determine a valuation are classified into three broad levels.
| |
| • | Level 1 valuation inputs consist of unadjusted quoted prices in an active market for identical investments. |
| |
| • | Level 2 valuation inputs consist of direct or indirect observable market data (including quoted prices for comparable investments, evaluations of subsequent market events, interest rates, prepayment speeds, credit risk, etc.). These inputs also consist of quoted prices for identical investments initially expressed in local currencies that are adjusted through translation into U.S. dollars. |
| |
| • | Level 3 valuation inputs consist of unobservable data (including a fund’s own assumptions). |
The level classification is based on the lowest level input that is significant to the fair valuation measurement. The valuation inputs are not necessarily an indication of the risks associated with investing in these securities or other financial instruments. There were no significant transfers between levels during the period.
The following is a summary of the level classifications as of period end. The Schedule of Investments provides additional information on the fund’s portfolio holdings.
|
| | | | | | | | |
| | Level 1 | Level 2 | Level 3 |
| Assets | | | |
| Investment Securities | | | |
| Common Stocks | $ | 5,692,946,520 |
| — |
| — |
|
| Temporary Cash Investments | 30,890,110 |
| $ | 30,883,118 |
| — |
|
| | $ | 5,723,836,630 |
| $ | 30,883,118 |
| — |
|
| Other Financial Instruments | | | |
| Forward Foreign Currency Exchange Contracts | — |
| $ | 541,522 |
| — |
|
7. Derivative Instruments
Foreign Currency Risk — The fund is subject to foreign currency exchange rate risk in the normal course of pursuing its investment objectives. The value of foreign investments held by a fund may be significantly affected by changes in foreign currency exchange rates. The dollar value of a foreign security generally decreases when the value of the dollar rises against the foreign currency in which the security is denominated and tends to increase when the value of the dollar declines against such foreign currency. A fund may enter into forward foreign currency exchange contracts to reduce a fund's exposure to foreign currency exchange rate fluctuations. The net U.S. dollar value of foreign currency underlying all contractual commitments held by a fund and the resulting unrealized appreciation or depreciation are determined daily. Realized gain or loss is recorded upon the termination of the contract. Net realized and unrealized gains or losses occurring during the holding period of forward foreign currency exchange contracts are a component of net realized gain (loss) on foreign currency transactions and change in net unrealized appreciation (depreciation) on translation of assets and liabilities in foreign currencies, respectively. A fund bears the risk of an unfavorable change in the foreign currency exchange rate underlying the forward contract. Additionally, losses, up to the fair value, may arise if the counterparties do not perform under the contract terms. The fund's average U.S. dollar exposure to foreign currency risk derivative instruments held during the period was $79,231,918.
The value of foreign currency risk derivative instruments as of October 31, 2014, is disclosed on the Statement of Assets and Liabilities as an asset of $541,522 in unrealized appreciation on forward foreign currency exchange contracts. For the year ended October 31, 2014, the effect of foreign currency risk derivative instruments on the Statement of Operations was $2,689,605 in net realized gain (loss) on foreign currency transactions and $58,854 in change in net unrealized appreciation (depreciation) on translation of assets and liabilities in foreign currencies.
8. Risk Factors
The fund invests in common stocks of small companies. Because of this, the fund may be subject to greater risk and market fluctuations than a fund investing in larger, more established companies.
9. Federal Tax Information
The tax character of distributions paid during the years ended October 31, 2014 and October 31, 2013 were as follows:
|
| | | | | | |
| | 2014 | 2013 |
| Distributions Paid From | | |
| Ordinary income | $ | 14,863,680 |
| — |
|
| Long-term capital gains | $ | 560,881,077 |
| $ | 80,163,129 |
|
The book-basis character of distributions made during the year from net investment income or net realized gains may differ from their ultimate characterization for federal income tax purposes. These differences reflect the differing character of certain income items and net realized gains and losses for financial statement and tax purposes, and may result in reclassification among certain capital accounts on the financial statements.
The reclassifications, which are primarily due to tax equalization, were made to capital $96,949,862, accumulated net investment loss $4,008,222, and undistributed net realized gain $(100,958,084).
As of October 31, 2014, the federal tax cost of investments and the components of distributable earnings on a tax-basis were as follows:
|
| | | |
| Federal tax cost of investments | $ | 4,265,358,024 |
|
| Gross tax appreciation of investments | $ | 1,574,574,162 |
|
| Gross tax depreciation of investments | (85,212,438 | ) |
| Net tax appreciation (depreciation) of investments | 1,489,361,724 |
|
Net tax appreciation (depreciation) on derivatives and translation of assets and liabilities in foreign currencies | 31,680 |
|
| Net tax appreciation (depreciation) | $ | 1,489,393,404 |
|
| Undistributed ordinary income | — |
|
| Accumulated long-term gains | $ | 818,193,267 |
|
| Late-year ordinary loss deferral | $ | (31,824,323 | ) |
The difference between book-basis and tax-basis unrealized appreciation (depreciation) is attributable primarily to the tax deferral of losses on wash sales.
Loss deferrals represent certain qualified losses that the fund has elected to treat as having been incurred in the following fiscal year for federal income tax purposes.
10. Reorganization
On September 12, 2013, the Board of Directors approved an agreement and plan of reorganization (the reorganization), whereby the net assets of Vista Fund (Vista), one fund in a series issued by the corporation, were transferred to Heritage Fund (Heritage) in exchange for shares of Heritage. The purpose of the transaction was to combine two funds with matching investment objectives and similar underlying securities. The financial statements and performance history of Heritage survived after the reorganization. The reorganization was effective at the close of the NYSE on December 6, 2013.
The reorganization was accomplished by a tax-free exchange of shares. On December 6, 2013, Vista exchanged its shares for shares of Heritage as follows:
|
| | | |
| Original Fund/Class | Shares Exchanged | New Fund/Class | Shares Received |
| Vista – Investor Class | 66,205,582 | Heritage – Investor Class | 57,086,650 |
| Vista – Institutional Class | 2,836,089 | Heritage – Institutional Class | 2,456,543 |
| Vista – A Class | 2,682,028 | Heritage – A Class | 2,306,433 |
| Vista – C Class | 5,555 | Heritage – C Class | 5,312 |
| Vista – R Class | 668,896 | Heritage – R Class | 568,103 |
The net assets of Vista and Heritage immediately before the reorganization were $1,549,352,534 and $4,468,145,045, respectively. Vista’s unrealized appreciation of $520,936,072 was combined with that of Heritage. Immediately after the reorganization, the combined net assets were $6,017,497,579.
Assuming the reorganization had been completed on November 1, 2013, the beginning of the annual reporting period, the pro forma results of operations for the year ended October 31, 2014 are as follows:
|
| | | |
| Net investment income (loss) | $ | (36,359,829 | ) |
| Net realized and unrealized gain (loss) | 522,241,877 |
|
| Net increase (decrease) in net assets resulting from operations | $ | 485,882,048 |
|
Because the combined investment portfolios have been managed as a single integrated portfolio since the reorganization was completed, it is not practicable to separate the amounts of revenue and earnings of Vista that have been included in the fund’s Statement of Operations since December 6, 2013.
|
| | | | | | | | | | | | | | | |
| For a Share Outstanding Throughout the Years Ended October 31 (except as noted) | | | | | |
| Per-Share Data | | | | | | | | Ratios and Supplemental Data | | |
| | | Income From Investment Operations: | Distributions From: | | | Ratio to Average Net Assets of: | | |
| | Net Asset
Value,
Beginning
of Period | Net
Investment
Income
(Loss)(1) | Net
Realized
and
Unrealized
Gain (Loss) | Total From
Investment
Operations | Net
Investment
Income | Net
Realized
Gains | Total
Distributions | Net Asset
Value,
End
of Period | Total
Return(2) | Operating
Expenses | Net
Investment
Income
(Loss) | Portfolio
Turnover
Rate | Net
Assets,
End of
Period
(in thousands) |
| Investor Class | | | | | | | | | | | | |
| 2014 | $28.45 | (0.14) | 2.18 | 2.04 | — | (3.60) | (3.60) | $26.89 | 8.33% | 1.00% | (0.55)% | 73% |
| $4,449,377 |
|
| 2013 | $22.44 | (0.07) | 6.55 | 6.48 | — | (0.47) | (0.47) | $28.45 | 29.43% | 1.00% | (0.29)% | 70% |
| $3,016,930 |
|
| 2012 | $20.51 | (0.06) | 1.99 | 1.93 | — | — | — | $22.44 | 9.41% | 1.01% | (0.28)% | 72% |
| $2,499,048 |
|
| 2011 | $19.21 | (0.07) | 1.37 | 1.30 | — | — | — | $20.51 | 6.77% | 1.01% | (0.35)% | 95% |
| $2,395,881 |
|
| 2010 | $14.32 | (0.07) | 4.96 | 4.89 | — | — | — | $19.21 | 34.15% | 1.01% | (0.45)% | 114% |
| $1,886,729 |
|
| Institutional Class | | | | | | | | | | | | |
| 2014 | $29.25 | (0.09) | 2.25 | 2.16 | — | (3.60) | (3.60) | $27.81 | 8.53% | 0.80% | (0.35)% | 73% |
| $198,895 |
|
| 2013 | $23.01 | (0.02) | 6.73 | 6.71 | — | (0.47) | (0.47) | $29.25 | 29.70% | 0.80% | (0.09)% | 70% |
| $243,548 |
|
| 2012 | $20.99 | (0.01) | 2.03 | 2.02 | — | — | — | $23.01 | 9.62% | 0.81% | (0.08)% | 72% |
| $187,984 |
|
| 2011 | $19.62 | (0.03) | 1.40 | 1.37 | — | — | — | $20.99 | 6.98% | 0.81% | (0.15)% | 95% |
| $156,681 |
|
| 2010 | $14.60 | (0.04) | 5.07 | 5.03 | (0.01) | — | (0.01) | $19.62 | 34.44% | 0.81% | (0.25)% | 114% |
| $115,261 |
|
| A Class | | | | | | | | | | | | |
| 2014 | $27.48 | (0.20) | 2.10 | 1.90 | — | (3.60) | (3.60) | $25.78 | 8.04% | 1.25% | (0.80)% | 73% |
| $869,381 |
|
| 2013 | $21.74 | (0.13) | 6.34 | 6.21 | — | (0.47) | (0.47) | $27.48 | 29.13% | 1.25% | (0.54)% | 70% |
| $1,092,574 |
|
| 2012 | $19.92 | (0.11) | 1.93 | 1.82 | — | — | — | $21.74 | 9.08% | 1.26% | (0.53)% | 72% |
| $972,795 |
|
| 2011 | $18.70 | (0.12) | 1.34 | 1.22 | — | — | — | $19.92 | 6.58% | 1.26% | (0.60)% | 95% |
| $973,051 |
|
| 2010 | $13.98 | (0.11) | 4.83 | 4.72 | — | — | — | $18.70 | 33.76% | 1.26% | (0.70)% | 114% |
| $803,692 |
|
|
| | | | | | | | | | | | | | | |
| For a Share Outstanding Throughout the Years Ended October 31 (except as noted) | | | | | |
| Per-Share Data | | | | | | | | Ratios and Supplemental Data | | |
| | | Income From Investment Operations: | Distributions From: | | | Ratio to Average Net Assets of: | | |
| | Net Asset
Value,
Beginning
of Period | Net
Investment
Income
(Loss)(1) | Net
Realized
and
Unrealized
Gain (Loss) | Total From
Investment
Operations | Net
Investment
Income | Net
Realized
Gains | Total
Distributions | Net Asset
Value,
End
of Period | Total
Return(2) | Operating
Expenses | Net
Investment
Income
(Loss) | Portfolio
Turnover
Rate | Net
Assets,
End of
Period
(in thousands) |
| B Class | | | | | | | | | | | | |
| 2014 | $27.02 | (0.38) | 2.05 | 1.67 | — | (3.60) | (3.60) | $25.09 | 7.23% | 2.00% | (1.55)% | 73% |
| $2,629 |
|
| 2013 | $21.54 | (0.30) | 6.25 | 5.95 | — | (0.47) | (0.47) | $27.02 | 28.17% | 2.00% | (1.29)% | 70% |
| $3,189 |
|
| 2012 | $19.89 | (0.27) | 1.92 | 1.65 | — | — | — | $21.54 | 8.30% | 2.01% | (1.28)% | 72% |
| $3,051 |
|
| 2011 | $18.81 | (0.28) | 1.36 | 1.08 | — | — | — | $19.89 | 5.74% | 2.01% | (1.35)% | 95% |
| $3,574 |
|
| 2010 | $14.16 | (0.24) | 4.89 | 4.65 | — | — | — | $18.81 | 32.84% | 2.01% | (1.45)% | 114% |
| $3,997 |
|
| C Class | | | | | | | | | | | | |
| 2014 | $25.16 | (0.35) | 1.89 | 1.54 | — | (3.60) | (3.60) | $23.10 | 7.25% | 2.00% | (1.55)% | 73% |
| $128,522 |
|
| 2013 | $20.09 | (0.28) | 5.82 | 5.54 | — | (0.47) | (0.47) | $25.16 | 28.10% | 2.00% | (1.29)% | 70% |
| $139,064 |
|
| 2012 | $18.55 | (0.25) | 1.79 | 1.54 | — | — | — | $20.09 | 8.30% | 2.01% | (1.28)% | 72% |
| $117,580 |
|
| 2011 | $17.55 | (0.26) | 1.26 | 1.00 | — | — | — | $18.55 | 5.75% | 2.01% | (1.35)% | 95% |
| $115,641 |
|
| 2010 | $13.21 | (0.22) | 4.56 | 4.34 | — | — | — | $17.55 | 32.85% | 2.01% | (1.45)% | 114% |
| $85,381 |
|
| R Class | | | | | | | | | | | | |
| 2014 | $27.72 | (0.27) | 2.12 | 1.85 | — | (3.60) | (3.60) | $25.97 | 7.80% | 1.50% | (1.05)% | 73% |
| $58,426 |
|
| 2013 | $21.99 | (0.20) | 6.40 | 6.20 | — | (0.47) | (0.47) | $27.72 | 28.74% | 1.50% | (0.79)% | 70% |
| $54,129 |
|
| 2012 | $20.20 | (0.16) | 1.95 | 1.79 | — | — | — | $21.99 | 8.86% | 1.51% | (0.78)% | 72% |
| $39,314 |
|
| 2011 | $19.01 | (0.18) | 1.37 | 1.19 | — | — | — | $20.20 | 6.26% | 1.51% | (0.85)% | 95% |
| $32,023 |
|
| 2010 | $14.24 | (0.16) | 4.93 | 4.77 | — | — | — | $19.01 | 33.50% | 1.51% | (0.95)% | 114% |
| $17,544 |
|
| R6 Class | | | | | | | | | | | | |
| 2014 | $29.25 | (0.07) | 2.28 | 2.21 | — | (3.60) | (3.60) | $27.86 | 8.72% | 0.65% | (0.20)% | 73% |
| $56,442 |
|
2013(3) | $27.22 | —(4) | 2.03 | 2.03 | — | — | — | $29.25 | 7.46% | 0.65%(5) | (0.07)%(5) | 70%(6) |
| $74 |
|
|
| | | | |
| Notes to Financial Highlights | | |
| |
| (1) | Computed using average shares outstanding throughout the period. |
| |
| (2) | Total returns are calculated based on the net asset value of the last business day and do not reflect applicable sales charges, if any. Total returns for periods less than one year are not annualized. |
| |
| (3) | July 26, 2013 (commencement of sale) through October 31, 2013. |
| |
| (4) | Per-share amount was less than $0.005. |
| |
| (6) | Portfolio turnover is calculated at the fund level. Percentage indicated was calculated for the year ended October 31, 2013. |
See Notes to Financial Statements.
|
|
| Report of Independent Registered Public Accounting Firm |
To the Board of Directors and Shareholders of
American Century Mutual Funds, Inc.:
We have audited the accompanying statement of assets and liabilities, including the schedule of investments, of Heritage Fund (the “Fund”), one of the funds constituting American Century Mutual Funds, Inc., as of October 31, 2014, and the related statement of operations for the year then ended, the statements of changes in net assets for each of the two years in the period then ended, and the financial highlights for each of the periods presented. These financial statements and financial highlights are the responsibility of the Fund's management. Our responsibility is to express an opinion on these financial statements and financial highlights based on our audits.
We conducted our audits in accordance with the standards of the Public Company Accounting Oversight Board (United States). Those standards require that we plan and perform the audit to obtain reasonable assurance about whether the financial statements and financial highlights are free of material misstatement. The Fund is not required to have, nor were we engaged to perform, an audit of its internal control over financial reporting. Our audits included consideration of internal control over financial reporting as a basis for designing audit procedures that are appropriate in the circumstances, but not for the purpose of expressing an opinion on the effectiveness of the Fund's internal control over financial reporting. Accordingly, we express no such opinion. An audit also includes examining, on a test basis, evidence supporting the amounts and disclosures in the financial statements, assessing the accounting principles used and significant estimates made by management, as well as evaluating the overall financial statement presentation. Our procedures included confirmation of securities owned as of October 31, 2014, by correspondence with the custodian and brokers; where replies were not received from brokers, we performed other auditing procedures. We believe that our audits provide a reasonable basis for our opinion.
In our opinion, the financial statements and financial highlights referred to above present fairly, in all material respects, the financial position of Heritage Fund of American Century Mutual Funds, Inc. as of October 31, 2014, the results of its operations for the year then ended, the changes in its net assets for each of the two years in the period then ended, and the financial highlights for each of the periods presented, in conformity with accounting principles generally accepted in the United States of America.
DELOITTE & TOUCHE LLP
Kansas City, Missouri
December 17, 2014
The Board of Directors
The individuals listed below serve as directors of the funds. Each director will continue to serve in this capacity until death, retirement, resignation or removal from office. The board has adopted a mandatory retirement age for directors who are not “interested persons,” as that term is defined in the Investment Company Act (independent directors). Independent directors shall retire by December 31 of the year in which they reach their 75th birthday.
Mr. Thomas is an “interested person” because he currently serves as President and Chief Executive Officer of American Century Companies, Inc. (ACC), the parent company of American Century Investment Management, Inc. (ACIM or the advisor). Mr. Fink is treated as an “interested person” because of his recent employment with ACC and American Century Services, LLC (ACS). The other directors (more than three-fourths of the total number) are independent. They are not employees, directors or officers of, and have no financial interest in, ACC or any of its wholly owned, direct or indirect, subsidiaries, including ACIM, American Century Investment Services, Inc. (ACIS) and ACS, and they do not have any other affiliations, positions, or relationships that would cause them to be considered “interested persons” under the Investment Company Act. The directors serve in this capacity for seven (in the case of Mr. Thomas, 15) registered investment companies in the American Century Investments family of funds.
The following table presents additional information about the directors. The mailing address for each director is 4500 Main Street, Kansas City, Missouri 64111.
|
| | | | | |
Name
(Year of Birth) | Position(s) Held with Funds | Length of Time Served | Principal Occupation(s) During Past 5 Years | Number of American Century Portfolios Overseen by Director | Other Directorships Held During Past
5 Years |
| Independent Directors | | | | |
Thomas A. Brown
(1940) | Director | Since 1980 | Managing Member, Associated Investments, LLC (real estate investment company); Brown Cascade Properties, LLC (real estate investment company) (2001 to 2009) | 73 | None |
Andrea C. Hall
(1945) | Director | Since 1997 | Retired | 73 | None |
Jan M. Lewis
(1957) | Director | Since 2011 | Retired; President and Chief Executive Officer, Catholic Charities of Northeast Kansas (human services organization) (2006 to 2013) | 73 | None |
James A. Olson
(1942) | Director and Chairman of the Board | Since 2007 (Chairman since 2014) | Member, Plaza Belmont LLC (private equity fund manager) | 73 | Saia, Inc. (2002 to 2012) and EPR Properties (2003 to 2013) |
|
| | | | | |
Name
(Year of Birth) | Position(s) Held with Funds | Length of Time Served | Principal Occupation(s) During Past 5 Years | Number of American Century Portfolios Overseen by Director | Other Directorships Held During Past
5 Years |
| Independent Directors | | | | |
M. Jeannine Strandjord
(1945) | Director | Since 1994 | Retired | 73 | Euronet Worldwide Inc.; Charming Shoppes, Inc. (2006 to 2010); and DST Systems Inc. (1996 to 2012) |
John R. Whitten
(1946) | Director | Since 2008 | Retired | 73 | Rudolph Technologies, Inc. |
Stephen E. Yates
(1948) | Director | Since 2012 | Retired; Executive Vice President, Technology & Operations, KeyCorp. (computer services) (2004 to 2010) | 73 | Applied Industrial Technologies, Inc. (2001 to 2010) |
| Interested Directors | | | | |
Barry Fink
(1955) | Director | Since 2012 | Retired; Executive Vice President, ACC (September 2007 to February 2013); President, ACS (October 2007 to February 2013); Chief Operating Officer, ACC (September 2007 to November 2012) | 73 | None |
Jonathan S. Thomas
(1963) | Director and President | Since 2007 | President and Chief Executive Officer, ACC (March 2007 to present). Also serves as Chief Executive Officer, ACS; Executive Vice President, ACIM; Director, ACC, ACIM and other ACC subsidiaries | 118 | BioMed Valley Discoveries, Inc. |
The Statement of Additional Information has additional information about the fund's directors and is available without charge, upon request, by calling 1-800-345-2021.
Officers
The following table presents certain information about the executive officers of the funds. Each officer serves as an officer for each of the 15 investment companies in the American Century family of funds, unless otherwise noted. No officer is compensated for his or her service as an officer of the funds. The listed officers are interested persons of the funds and are appointed or re-appointed on an annual basis. The mailing address for each officer listed below is 4500 Main Street, Kansas City, Missouri 64111.
|
| | |
Name (Year of Birth) | Offices with the Funds | Principal Occupation(s) During the Past Five Years |
Jonathan S.
Thomas
(1963) | Director and
President
since 2007 | President and Chief Executive Officer, ACC (March 2007 to present). Also serves as Chief Executive Officer, ACS; Executive Vice President, ACIM; Director, ACC, ACIM and other ACC subsidiaries |
Amy D. Shelton
(1964) | Chief Compliance
Officer since 2014 | Chief Compliance Officer, American Century funds, (March 2014 to present); Chief Compliance Officer, ACIM (February 2014 to present); Chief Compliance Officer, ACIS (October 2009 to present); Vice President, Client Interactions and Marketing, ACIS (February 2013 to January 2014); Director, Client Interactions and Marketing, ACIS (June 2007 to January 2013). Also serves as Vice President, ACIS |
Charles A.
Etherington
(1957) | General Counsel
since 2007 and
Senior Vice
President since 2006 | Attorney, ACC (February 1994 to present); Vice President, ACC (November 2005 to present); General Counsel, ACC (March 2007 to present). Also serves as General Counsel, ACIM, ACS, ACIS and other ACC subsidiaries; and Senior Vice President, ACIM and ACS |
C. Jean Wade
(1964) | Vice President,
Treasurer and
Chief Financial
Officer since 2012 | Vice President, ACS (February 2000 to present) |
Robert J.
Leach
(1966) | Vice President
since 2006 and
Assistant Treasurer
since 2012 | Vice President, ACS (February 2000 to present) |
David H.
Reinmiller
(1963) | Vice President
since 2000 | Attorney, ACC (January 1994 to present); Associate General Counsel, ACC (January 2001 to present). Also serves as Vice President, ACIM and ACS |
Ward D.
Stauffer
(1960) | Secretary
since 2005 | Attorney, ACC (June 2003 to present) |
|
|
| Approval of Management Agreement |
At a meeting held on June 18, 2014, the Fund’s Board of Directors unanimously approved the renewal of the management agreement pursuant to which American Century Investment Management, Inc. (the “Advisor”) acts as the investment advisor for the Fund. Under Section 15(c) of the Investment Company Act, contracts for investment advisory services are required to be reviewed, evaluated, and approved by a majority of a fund’s directors (the “Directors”), including a majority of the independent Directors, each year.
Prior to its consideration of the renewal of the management agreement, the Board requested and reviewed extensive data and information compiled by the Advisor and certain independent providers of evaluation data concerning the Fund and the services provided to the Fund by the Advisor. This review was in addition to the oversight and evaluation undertaken by the Board and its committees on a continuous basis and the information received was supplemental to the extensive information that the Board and its committees receive and consider throughout the year.
In connection with its consideration of the renewal of the management agreement, the Board’s review and evaluation of the services provided by the Advisor included, but was not limited to, the following:
| |
| • | the nature, extent, and quality of investment management, shareholder services, and other services provided by the Advisor to the Fund; |
| |
| • | the wide range of other programs and services the Advisor provides to the Fund and its shareholders on a routine and non-routine basis; |
| |
| • | the Fund’s investment performance compared to appropriate benchmarks and/or a peer group of other mutual funds with similar investment objectives and strategies; |
| |
| • | the cost of owning the Fund compared to the cost of owning similar funds; |
| |
| • | the Advisor’s compliance policies, procedures, and regulatory experience; |
| |
| • | financial data showing the cost of services provided to the Fund, the profitability of the Fund to the Advisor, and the overall profitability of the Advisor; |
| |
| • | possible economies of scale associated with the Advisor’s management of the Fund and other accounts under its management; |
| |
| • | the services provided and charges to other investment management clients of the Advisor; |
| |
| • | acquired fund fees and expenses; and |
| |
| • | any collateral benefits derived by the Advisor from the management of the Fund. |
In keeping with its practice, the Board held two in-person meetings and one telephonic meeting to review and discuss the information provided. The independent Directors also had the benefit of the advice of their independent counsel throughout the process.
Factors Considered
The Directors considered all of the information provided by the Advisor, the independent data providers, and independent counsel, and evaluated such information for the Fund. In connection with their review, the Directors did not identify any single factor as being all-important or controlling, and each Director may have attributed different levels of importance to different factors. In deciding to renew the management agreement, the Board based its decision on a number of factors, including the following:
Nature, Extent and Quality of Services — Generally. Under the management agreement, the Advisor is responsible for providing or arranging for all services necessary for the operation of the Fund. The Board noted that under the management agreement, the Advisor provides or arranges at its own expense a wide variety of services including:
| |
| • | constructing and designing the Fund |
| |
| • | portfolio research and security selection |
| |
| • | initial capitalization/funding |
| |
| • | daily valuation of the Fund’s portfolio |
| |
| • | shareholder servicing and transfer agency, including shareholder confirmations, recordkeeping, and communications |
| |
| • | legal services (except the independent Directors’ counsel) |
| |
| • | regulatory and portfolio compliance |
| |
| • | marketing and distribution (except Rule 12b-1 plans) |
The Board noted that many of these services have expanded over time both in terms of quantity and complexity in response to shareholder demands, competition in the industry, changing distribution channels, and the changing regulatory environment.
Investment Management Services. The nature of the investment management services provided to the Fund is quite complex and allows Fund shareholders access to professional money management, instant diversification of their investments within an asset class, the opportunity to easily diversify among asset classes by investing in or exchanging among various American Century Investments funds, and liquidity. In evaluating investment performance, the Board expects the Advisor to manage the Fund in accordance with its investment objectives and approved strategies. Further, the Directors recognize that the Advisor has an obligation to monitor trading activities, and in particular to seek the best execution of fund trades, and to evaluate the use of and payment for research. In providing these services, the Advisor utilizes teams of investment professionals (portfolio managers, analysts, research assistants, and securities traders) who require extensive information technology, research, training, compliance and other systems to conduct their business. The Board, directly and through its Fund Performance Review Committee, regularly reviews investment performance information for the Fund, together with comparative information for appropriate benchmarks and/or peer groups of similarly-managed funds, over different time horizons. The Directors also review detailed performance information during the management agreement approval process. If performance concerns are identified, the Fund receives special reviews until performance improves, during which the Board discusses with the Advisor the reasons for such results (e.g., market conditions, security selection) and any efforts being undertaken to improve performance. The Fund’s performance was above its benchmark for the ten-year period and below its benchmark for the one-, three-, and five-year periods reviewed by the Board. The Board discussed the Fund’s performance with the Advisor and was satisfied with the efforts being undertaken by the Advisor. The Board found the investment management services provided by the Advisor to the Fund to be satisfactory and consistent with the management agreement.
Shareholder and Other Services. Under the management agreement, the Advisor provides the Fund with a comprehensive package of transfer agency, shareholder, and other services. The Board, directly and through various committees of the Board, regularly reviews reports and evaluations of such services at its regular meetings. These reports include, but are not limited to, information regarding the operational efficiency and accuracy of the shareholder and transfer agency services provided, staffing levels, shareholder satisfaction (as measured by external as well as internal sources), technology support, new products and services offered to Fund shareholders, securities trading activities, portfolio valuation services, auditing services, and legal and operational compliance activities. Certain aspects of shareholder and transfer agency service level efficiency
and the quality of securities trading activities are measured by independent third party providers and are presented in comparison to other fund groups not managed by the Advisor. The Board found the services provided by the Advisor to the Fund under the management agreement to be competitive and of high quality.
Costs of Services and Profitability. The Advisor provides detailed information concerning its cost of providing various services to the Fund, its profitability in managing the Fund (pre- and post-distribution), its overall profitability, and its financial condition. The Directors have reviewed with the Advisor the methodology used to prepare this financial information. The financial information regarding the Advisor is considered in evaluating the Advisor’s financial condition, its ability to continue to provide services under the management agreement, and the reasonableness of the current management fee. The Board concluded that the Advisor’s profits were reasonable in light of the services provided to the Fund.
Ethics. The Board generally considers the Advisor’s commitment to providing quality services to shareholders and to conducting its business ethically. They noted that the Advisor’s practices generally meet or exceed industry best practices.
Economies of Scale. The Board also reviewed information provided by the Advisor regarding the possible existence of economies of scale in connection with the management of the Fund. The Board concluded that economies of scale are difficult to measure and predict with precision, especially on a fund-by-fund basis. The Board concluded that the Advisor is appropriately sharing economies of scale through its competitive fee structure, offering competitive fees from fund inception, and through reinvestment in its business to provide shareholders additional content and services.
Comparison to Other Funds’ Fees. The management agreement provides that the Fund pays the Advisor a single, all-inclusive (or unified) management fee for providing all services necessary for the management and operation of the Fund, other than brokerage expenses, taxes, interest, extraordinary expenses, and the fees and expenses of the Fund’s independent directors (including their independent legal counsel) and expenses incurred in connection with the provision of shareholder services and distribution services under a plan adopted pursuant to Rule 12b-1 under the 1940 Act. Under the unified fee structure, the Advisor is responsible for providing all investment advisory, custody, audit, administrative, compliance, recordkeeping, marketing and shareholder services, or arranging and supervising third parties to provide such services. By contrast, most other funds are charged a variety of fees, including an investment advisory fee, a transfer agency fee, an administrative fee, distribution charges and other expenses. Other than their investment advisory fees and any applicable Rule 12b-1 distribution fees, all other components of the total fees charged by these other funds may be increased without shareholder approval. The Board believes the unified fee structure is a benefit to Fund shareholders because it clearly discloses to shareholders the cost of owning Fund shares, and, since the unified fee cannot be increased without a vote of Fund shareholders, it shifts to the Advisor the risk of increased costs of operating the Fund and provides a direct incentive to minimize administrative inefficiencies. Part of the Board’s analysis of fee levels involves reviewing certain evaluative data compiled by an independent provider comparing the Fund’s unified fee to the total expense ratios of its peers. The unified fee charged to shareholders of the Fund was below the median of the total expense ratios of the Fund’s peer expense universe and was within the range of its peer expense group. The Board concluded that the management fee paid by the Fund to the Advisor under the management agreement is reasonable in light of the services provided to the Fund.
Comparison to Fees and Services Provided to Other Clients of the Advisor. The Board also requested and received information from the Advisor concerning the nature of the services, fees, costs and profitability of its advisory services to advisory clients other than the Fund. They observed that these varying types of client accounts require different services and involve different regulatory and entrepreneurial risks than the management of the Fund. The Board analyzed this information and concluded that the fees charged and services provided to the Fund were reasonable by comparison.
Collateral or “Fall-Out” Benefits Derived by the Advisor. The Board considered the existence of collateral benefits the Advisor may receive as a result of its relationship with the Fund. They concluded that the Advisor’s primary business is managing mutual funds and it generally does not use fund or shareholder information to generate profits in other lines of business, and therefore does not derive any significant collateral benefits from them. The Board noted that the Advisor receives proprietary research from broker-dealers that execute fund portfolio transactions and concluded that this research is likely to benefit Fund shareholders. The Board also determined that the Advisor is able to provide investment management services to certain clients other than the Fund, at least in part, due to its existing infrastructure built to serve the fund complex. The Board concluded, however, that the assets of those other clients are not material to its analysis.
Existing Relationship. The Board also considered whether there was any reason for not continuing the existing arrangement with the Advisor. In this regard, the Board was mindful of the potential disruptions of the Fund’s operations and various risks, uncertainties, and other effects that could occur as a result of a decision not to continue such relationship. In particular, the Board recognized that most shareholders have invested in the Fund on the strength of the Advisor’s industry standing and reputation and in the expectation that the Advisor will have a continuing role in providing advisory services to the Fund.
Conclusion of the Directors. As a result of this process, the Board, including all of the independent Directors, taking into account all of the factors discussed above and the information provided by the Advisor and others, concluded that the management agreement between the Fund and the Advisor is fair and reasonable in light of the services provided and should be renewed.
Retirement Account Information
As required by law, distributions you receive from certain IRAs are subject to federal income tax withholding, unless you elect not to have withholding apply. Tax will be withheld on the total amount withdrawn even though you may be receiving amounts that are not subject to withholding, such as nondeductible contributions. In such case, excess amounts of withholding could occur. You may adjust your withholding election so that a greater or lesser amount will be withheld.
If you don’t want us to withhold on this amount, you must notify us to not withhold the federal income tax. You may notify us in writing or in certain situations by telephone or through other electronic means. For systematic withdrawals, your withholding election will remain in effect until revoked or changed by filing a new election. You have the right to revoke your election at any time.
Remember, even if you elect not to have income tax withheld, you are liable for paying income tax on the taxable portion of your withdrawal. If you elect not to have income tax withheld or you don’t have enough income tax withheld, you may be responsible for payment of estimated tax. You may incur penalties under the estimated tax rules if your withholding and estimated tax payments are not sufficient. You can reduce or defer the income tax on a distribution by directly or indirectly rolling such distribution over to another IRA or eligible plan. You should consult your tax advisor for additional information.
State tax will be withheld if, at the time of your distribution, your address is within one of the mandatory withholding states and you have federal income tax withheld (or as otherwise required by state law). State taxes will be withheld from your distribution in accordance with the respective state rules.
Distributions you receive from 403(b), 457 and qualified plans are subject to special tax and withholding rules. Your plan administrator or plan sponsor is required to provide you with a special tax notice explaining those rules at the time you request a distribution. If applicable, federal and/or state taxes may be withheld from your distribution amount.
Proxy Voting Policies
A description of the policies that the fund's investment advisor uses in exercising the voting rights associated with the securities purchased and/or held by the fund is available without charge, upon request, by calling 1-800-345-2021. It is also available on the "About Us" page of American Century Investments’ website at americancentury.com and on the Securities and Exchange Commission’s website at sec.gov. Information regarding how the investment advisor voted proxies relating to portfolio securities during the most recent 12-month period ended June 30 is available on the "About Us" page at americancentury.com. It is also available at sec.gov.
Quarterly Portfolio Disclosure
The fund files its complete schedule of portfolio holdings with the Securities and Exchange Commission (SEC) for the first and third quarters of each fiscal year on Form N-Q. The fund’s Forms N-Q are available on the SEC’s website at sec.gov, and may be reviewed and copied at the SEC’s Public Reference Room in Washington, DC. Information on the operation of the Public Reference Room may be obtained by calling 1-800-SEC-0330. The fund also makes its complete schedule of portfolio holdings for the most recent quarter of its fiscal year available on its
website at americancentury.com and, upon request, by calling 1-800-345-2021.
Other Tax Information
The following information is provided pursuant to provisions of the Internal Revenue Code.
The fund hereby designates up to the maximum amount allowable as qualified dividend income for the fiscal year ended October 31, 2014.
For corporate taxpayers, the fund hereby designates $14,863,680, or up to the maximum amount allowable, of ordinary income distributions paid during the fiscal year ended October 31, 2014 as qualified for the corporate dividends received deduction.
The fund hereby designates $14,863,680 as qualified short-term capital gain distributions for purposes of Internal Revenue Code Section 871 for the fiscal year ended October 31, 2014.
The fund hereby designates $659,009,715, or up to the maximum amount allowable, as long-term capital gain distributions for the fiscal year ended October 31, 2014.
The fund utilized earnings and profits of $98,128,638 distributed to shareholders on redemption of shares as part of the dividends paid deduction (tax equalization).
|
| | |
| |
| | | |
| Contact Us | americancentury.com | |
| Automated Information Line | 1-800-345-8765 | |
| Investor Services Representative | 1-800-345-2021 or 816-531-5575 | |
| Investors Using Advisors | 1-800-378-9878 | |
| Business, Not-For-Profit, Employer-Sponsored Retirement Plans | 1-800-345-3533 | |
| Banks and Trust Companies, Broker-Dealers, Financial Professionals, Insurance Companies | 1-800-345-6488 | |
| Telecommunications Relay Service for the Deaf | 711 | |
| | | |
| American Century Mutual Funds, Inc. | |
| | | |
Investment Advisor: American Century Investment Management, Inc. Kansas City, Missouri | |
| | | |
| This report and the statements it contains are submitted for the general information of our shareholders. The report is not authorized for distribution to prospective investors unless preceded or accompanied by an effective prospectus. | |
| | | |
©2014 American Century Proprietary Holdings, Inc. All rights reserved.
CL-ANN-84006 1412 | |
|
| |
| ANNUAL REPORT | OCTOBER 31, 2014 |
New Opportunities Fund
|
| |
| President’s Letter | |
| Performance | |
| Portfolio Commentary | |
| Fund Characteristics | |
| Shareholder Fee Example | |
| Schedule of Investments | |
| Statement of Assets and Liabilities | |
| Statement of Operations | |
| Statement of Changes in Net Assets | |
| Notes to Financial Statements | |
| Financial Highlights | |
| Report of Independent Registered Public Accounting Firm | |
| Management | |
| Approval of Management Agreement | |
| Additional Information | |
Any opinions expressed in this report reflect those of the author as of the date of the report, and do not necessarily represent the opinions of American Century Investments® or any other person in the American Century Investments organization. Any such opinions are subject to change at any time based upon market or other conditions and American Century Investments disclaims any responsibility to update such opinions. These opinions may not be relied upon as investment advice and, because investment decisions made by American Century Investments funds are based on numerous factors, may not be relied upon as an indication of trading intent on behalf of any American Century Investments fund. Security examples are used for representational purposes only and are not intended as recommendations to purchase or sell securities. Performance information for comparative indices and securities is provided to American Century Investments by third party vendors. To the best of American Century Investments’ knowledge, such information is accurate at the time of printing.
|
| |
| Dear Investor:
Thank you for reviewing this annual report for the 12 months ended October 31, 2014. It provides investment performance and portfolio information for the reporting period, plus longer-term historical performance data.
Annual reports remain important vehicles for conveying information about fund returns, including market and economic factors that affected performance during the reporting period. For additional, updated investment and market insights, we encourage you to visit our website, americancentury.com. |
| Jonathan Thomas |
Favorable Fiscal Year for U.S. Stocks and Bonds
Mostly stimulative monetary policies by central banks and expectations of longer-term economic improvement, interspersed with concerns about nearer-term weaker-than-expected global economic data and geopolitical conflicts, helped drive financial market returns during the reporting period. We believe the combination of longer-term optimism about U.S. economic growth, low costs of capital, and continued central bank stimulus (even as the U.S. Federal Reserve’s latest monthly bond purchase program ended) helped persuade investors to seek risk and yield, which benefited U.S. stocks and bonds. The S&P 500 Index gained 17.27% during the 12 months. The 30-year U.S. Treasury bond was close behind, returning 15.44%, according to Barclays. U.S. real estate investment trusts (REITs), whose shares combine performance attributes of stocks and bonds, benefited from both—the MSCI U.S. REIT Index advanced 19.19%.
U.S. market benchmark returns generally outpaced their non-U.S. counterparts. The U.S. was perceived by investors as a relative bastion of growth, stability, and potentially attractive yields compared with most of the rest of the world, so capital flows generally favored U.S. assets. These capital flows, along with weaker-than-expected global growth, lower-than-expected global inflation, and falling commodity and energy prices, helped keep long-term interest rates and other corporate costs low. U.S. stocks just completed a solid third-quarter earnings reporting season, though questions remain about next year’s revenues, given this year’s slowdown in global economic growth and concerns about how far it could extend into 2015.
We believe continuing global economic and geopolitical uncertainties could continue to support the relative appeal of U.S. assets in coming months. But the end of the U.S. Federal Reserve’s monthly bond-buying program and the still-looming possibility of higher interest rates in 2015 point to potential U.S. market volatility ahead. In this environment, we continue to believe in a disciplined, diversified, long-term investment approach, using professionally managed stock and bond portfolios for meeting financial goals. We appreciate your continued trust in us.
Sincerely,
Jonathan Thomas
President and Chief Executive Officer
American Century Investments
|
| | | | | | |
| Total Returns as of October 31, 2014 |
| | | | Average Annual Returns | |
| | Ticker Symbol | 1 year | 5 years | 10 years | Since Inception | Inception Date |
| Investor Class | TWNOX | 8.60%(1) | 18.58% | 8.90% | 7.82% | 12/26/96 |
| Russell 2500 Growth Index | — | 10.24% | 19.19% | 10.26% | 8.00% | — |
| Institutional Class | TWNIX | 8.81%(1) | — | — | 15.67% | 3/1/10 |
| A Class | TWNAX | | | | | 3/1/10 |
| No sales charge* | | 8.31%(1) | — | — | 15.15% | |
| With sales charge* | | 2.09%(1) | — | — | 13.70% | |
| C Class | TWNCX | 7.50%(1) | — | — | 14.27% | 3/1/10 |
| R Class | TWNRX | 8.12%(1) | — | — | 14.85% | 3/1/10 |
* Sales charges include initial sales charges and contingent deferred sales charges (CDSCs), as applicable. A Class shares have a 5.75% maximum initial sales charge and may be subject to a maximum CDSC of 1.00%. C Class shares redeemed within 12 months of purchase are subject to a maximum CDSC of 1.00%. The SEC requires that mutual funds provide performance information net of maximum sales charges in all cases where charges could be applied.
| |
| (1) | Returns would have been lower if a portion of the management fee had not been waived. |
Data presented reflect past performance. Past performance is no guarantee of future results. Current performance may be higher or lower than the performance shown. Investment return and principal value will fluctuate, and redemption value may be more or less than original cost. Data assumes reinvestment of dividends and capital gains, and none of the charts reflect the deduction of taxes that a shareholder would pay on fund distributions or the redemption of fund shares. To obtain performance data current to the most recent month end, please call 1-800-345-2021 or visit americancentury.com. For additional information about the fund, please consult the prospectus.
|
|
| Growth of $10,000 Over 10 Years |
| $10,000 investment made October 31, 2004 |
| Performance for other share classes will vary due to differences in fee structure. |
|
| |
| Value on October 31, 2014 |
| | Investor Class — $23,458* |
| |
| | Russell 2500 Growth Index — $26,567 |
| |
*Ending value would have been lower if a portion of the management fee had not been waived.
|
| | | | |
| Total Annual Fund Operating Expenses |
| Investor Class | Institutional Class | A Class | C Class | R Class |
| 1.54% | 1.34% | 1.79% | 2.54% | 2.04% |
The total annual fund operating expenses shown is as stated in the fund’s prospectus current as of the date of this report. The prospectus may vary from the expense ratio shown elsewhere in this report because it is based on a different time period, includes acquired fund fees and expenses, and, if applicable, does not include fee waivers or expense reimbursements.
Data presented reflect past performance. Past performance is no guarantee of future results. Current performance may be higher or lower than the performance shown. Investment return and principal value will fluctuate, and redemption value may be more or less than original cost. Data assumes reinvestment of dividends and capital gains, and none of the charts reflect the deduction of taxes that a shareholder would pay on fund distributions or the redemption of fund shares. To obtain performance data current to the most recent month end, please call 1-800-345-2021 or visit americancentury.com. For additional information about the fund, please consult the prospectus.
Portfolio Managers: Matthew Ferretti and Jeffrey Otto
Performance Summary
New Opportunities returned 8.60%* for the 12 months ended October 31, 2014, lagging the 10.24% return of the portfolio’s benchmark, the Russell 2500 Growth Index.
U.S. stock indices delivered solid returns during the reporting period. Within the Russell 2500 Growth Index, health care was the top-performing sector on a total-return basis, gaining more than 25%. Telecommunication services stocks returned nearly 25%, while the utilities, industrials, and materials sectors also outperformed the benchmark average. Energy was the only sector to post negative returns, weighed down by declining oil prices. Consumer discretionary and consumer staples stocks registered modest gains that trailed the benchmark average.
New Opportunities received positive contributions from all sectors except energy and telecommunication services. Stock decisions in the health care, energy, and telecommunication services sectors were key performance detractors relative to the Russell index. Stock selection in the industrials, consumer discretionary, and materials sectors benefited results versus the benchmark.
Health Care Stocks Weighed on Relative Results
Stock choices in the health care sector detracted from relative results, as did an underweight to the biotechnology industry. The fund had lighter exposure than the benchmark to Puma Biotechnology, which surged on the July announcement of positive results in the phase III clinical trial for its breast cancer drug, Neratinib. Aegerion Pharmaceuticals also detracted. The company’s drug to treat extremely high cholesterol was approved in 2013. After achieving early success, there were indications that not as many patients as expected were signing up for the drug and some weren’t sticking with the therapy due to significant side effects, so we eliminated our position.
Energy and Telecommunication Services Detracted
Energy stocks weighed on relative results due primarily to stock selection, especially among energy equipment and services firms. Oil and gas exploration and production company Magnum Hunter Resources slipped as the mild summer weather led to lower prices for natural gas. On a positive note, the company announced record natural gas flows from its Eureka Hunter pipeline in West Virginia and Ohio, as well as the opening of new wells in its Marcellus Shale operations. Not owning Cheniere Energy, a component of the benchmark, detracted from fund results as the company is benefiting from exporting growing domestic supplies of liquefied natural gas.
Telecommunication services detracted from results due to selection in the wireless telecommunications industry and less exposure than the benchmark to the diversified telecommunication services industry. Among other leading detractors, specialty retailer Conn’s experienced a reversal of fortunes after a strong 2013. Reduced electronics sales and elevated credit delinquencies lowered estimates for fiscal 2015. We eliminated the position.
* All fund returns referenced in this commentary are for Investor Class shares. Returns would have been lower if a portion of the management fee had not been waived. Performance for other share classes will vary due to differences in fee structure; when Investor Class performance exceeds that of the fund’s benchmark, other share classes may not. See page 3 for returns for all share classes.
Industrials and Consumer Discretionary Holdings Aided Results
The fund benefited from holdings in the industrials sector. Apogee Enterprises, which makes and installs architectural glass, saw a surge in orders, especially for taller buildings, as the non-residential real estate market has strengthened. H&E Equipment Services, which rents heavy equipment to construction companies, gained on improved pricing and demand, especially from growth in the Gulf Coast region. Trucking company Saia is benefiting from improved pricing driven by greater demand and limited capacity as a result of new regulations.
In consumer discretionary, an overweight in Hanesbrands added to relative returns. The apparel maker outperformed on its progress in integrating Maidenform and news it had closed the acquisition of DB Apparel. The company continues to increase margins through better sourcing and manufacturing efficiencies in a low-growth environment.
Other Top Individual Contributors
Bucking the trend in the energy sector, Athlon Energy was one of the portfolio’s top relative contributors. The stock had done well since its 2013 IPO and rose sharply after Encana announced that it was buying the exploration and production company. In the IT services industry, the fund benefited from its holding in FleetCor Technologies, a provider of specialized payment products. The company is driving strong growth with accretive acquisitions in a fragmented industry.
Outlook
As of October 31, 2014, health care and consumer discretionary stocks were the largest overweights relative to the Russell index, while materials and financials represented the largest underweights. New Opportunities’ investment process focuses on small and mid-sized companies with accelerating earnings growth rates and share-price momentum. We believe that active investing in such companies will generate outperformance over time compared with the Russell 2500 Growth Index.
|
| |
| OCTOBER 31, 2014 | |
| Top Ten Holdings | % of net assets |
| LKQ Corp. | 4.3% |
| Middleby Corp. | 2.0% |
| CoStar Group, Inc. | 1.8% |
| ExamWorks Group, Inc. | 1.5% |
| Hanesbrands, Inc. | 1.4% |
| Signet Jewelers Ltd. | 1.4% |
| Shutterstock, Inc. | 1.4% |
| Alliance Data Systems Corp. | 1.4% |
| Restoration Hardware Holdings, Inc. | 1.3% |
| Signature Bank | 1.2% |
| | |
| Top Five Industries | % of net assets |
| Biotechnology | 6.8% |
| Machinery | 5.2% |
| Internet Software and Services | 4.8% |
| Distributors | 4.7% |
| Health Care Providers and Services | 4.6% |
| | |
| Types of Investments in Portfolio | % of net assets |
| Common Stocks | 97.8% |
| Temporary Cash Investments | 1.7% |
| Other Assets and Liabilities | 0.5% |
Fund shareholders may incur two types of costs: (1) transaction costs, including sales charges (loads) on purchase payments and redemption/exchange fees; and (2) ongoing costs, including management fees; distribution and service (12b-1) fees; and other fund expenses. This example is intended to help you understand your ongoing costs (in dollars) of investing in your fund and to compare these costs with the ongoing cost of investing in other mutual funds.
The example is based on an investment of $1,000 made at the beginning of the period and held for the entire period from May 1, 2014 to October 31, 2014.
Actual Expenses
The table provides information about actual account values and actual expenses for each class. You may use the information, together with the amount you invested, to estimate the expenses that you paid over the period. First, identify the share class you own. Then simply divide your account value by $1,000 (for example, an $8,600 account value divided by $1,000 = 8.6), then multiply the result by the number under the heading “Expenses Paid During Period” to estimate the expenses you paid on your account during this period.
If you hold Investor Class shares of any American Century Investments fund, or Institutional Class shares of the American Century Diversified Bond Fund, in an American Century Investments account (i.e., not a financial intermediary or retirement plan account), American Century Investments may charge you a $12.50 semiannual account maintenance fee if the value of those shares is less than $10,000. We will redeem shares automatically in one of your accounts to pay the $12.50 fee. In determining your total eligible investment amount, we will include your investments in all personal accounts (including American Century Investments Brokerage accounts) registered under your Social Security number. Personal accounts include individual accounts, joint accounts, UGMA/UTMA accounts, personal trusts, Coverdell Education Savings Accounts and IRAs (including traditional, Roth, Rollover, SEP-, SARSEP- and SIMPLE-IRAs), and certain other retirement accounts. If you have only business, business retirement, employer-sponsored or American Century Investments Brokerage accounts, you are currently not subject to this fee. If you are subject to the Account Maintenance Fee, your account value could be reduced by the fee amount.
Hypothetical Example for Comparison Purposes
The table also provides information about hypothetical account values and hypothetical expenses based on the actual expense ratio of each class of your fund and an assumed rate of return of 5% per year before expenses, which is not the actual return of a fund’s share class. The hypothetical account values and expenses may not be used to estimate the actual ending account balance or expenses you paid for the period. You may use this information to compare the ongoing costs of investing in your fund and other funds. To do so, compare this 5% hypothetical example with the 5% hypothetical examples that appear in the shareholder reports of the other funds.
Please note that the expenses shown in the table are meant to highlight your ongoing costs only and do not reflect any transactional costs, such as sales charges (loads) or redemption/exchange fees. Therefore, the table is useful in comparing ongoing costs only, and will not help you determine the relative total costs of owning different funds. In addition, if these transactional costs were included, your costs would have been higher.
|
| | | | |
| Beginning
Account Value
5/1/14 | Ending
Account Value
10/31/14 | Expenses Paid
During Period(1)5/1/14 - 10/31/14 | Annualized
Expense Ratio(1) |
| Actual | | | | |
| Investor Class (after waiver) | $1,000 | $1,064.60 | $7.55 | 1.45% |
| Investor Class (before waiver) | $1,000 | $1,064.60(2) | $7.81 | 1.50% |
| Institutional Class (after waiver) | $1,000 | $1,065.80 | $6.51 | 1.25% |
| Institutional Class (before waiver) | $1,000 | $1,065.80(2) | $6.77 | 1.30% |
| A Class (after waiver) | $1,000 | $1,063.50 | $8.84 | 1.70% |
| A Class (before waiver) | $1,000 | $1,063.50(2) | $9.10 | 1.75% |
| C Class (after waiver) | $1,000 | $1,058.90 | $12.71 | 2.45% |
| C Class (before waiver) | $1,000 | $1,058.90(2) | $12.97 | 2.50% |
| R Class (after waiver) | $1,000 | $1,062.30 | $10.14 | 1.95% |
| R Class (before waiver) | $1,000 | $1,062.30(2) | $10.40 | 2.00% |
| Hypothetical | | | | |
| Investor Class (after waiver) | $1,000 | $1,017.90 | $7.38 | 1.45% |
| Investor Class (before waiver) | $1,000 | $1,017.64 | $7.63 | 1.50% |
| Institutional Class (after waiver) | $1,000 | $1,018.90 | $6.36 | 1.25% |
| Institutional Class (before waiver) | $1,000 | $1,018.65 | $6.61 | 1.30% |
| A Class (after waiver) | $1,000 | $1,016.64 | $8.64 | 1.70% |
| A Class (before waiver) | $1,000 | $1,016.38 | $8.89 | 1.75% |
| C Class (after waiver) | $1,000 | $1,012.86 | $12.43 | 2.45% |
| C Class (before waiver) | $1,000 | $1,012.60 | $12.68 | 2.50% |
| R Class (after waiver) | $1,000 | $1,015.38 | $9.91 | 1.95% |
| R Class (before waiver) | $1,000 | $1,015.12 | $10.16 | 2.00% |
| |
| (1) | Expenses are equal to the class's annualized expense ratio listed in the table above, multiplied by the average account value over the period, multiplied by 184, the number of days in the most recent fiscal half-year, divided by 365, to reflect the one-half year period. |
| |
| (2) | Ending account value assumes the return earned after waiver and would have been lower if a portion of the management fee had not been waived. |
OCTOBER 31, 2014
|
| | | | | |
| | Shares | Value |
| COMMON STOCKS — 97.8% | | |
| Aerospace and Defense — 1.1% | | |
B/E Aerospace, Inc.(1) | 12,148 |
| $ | 904,419 |
|
| TransDigm Group, Inc. | 5,615 |
| 1,050,173 |
|
| | | 1,954,592 |
|
| Airlines — 0.9% | | |
Spirit Airlines, Inc.(1) | 22,760 |
| 1,663,984 |
|
| Auto Components — 0.6% | | |
American Axle & Manufacturing Holdings, Inc.(1) | 53,314 |
| 1,030,560 |
|
| Banks — 3.1% | | |
| Bank of the Ozarks, Inc. | 35,120 |
| 1,237,629 |
|
| Cathay General Bancorp. | 45,518 |
| 1,202,130 |
|
| IBERIABANK Corp. | 17,402 |
| 1,198,302 |
|
Signature Bank(1) | 18,030 |
| 2,183,974 |
|
| | | 5,822,035 |
|
| Biotechnology — 6.8% | | |
ACADIA Pharmaceuticals, Inc.(1) | 15,037 |
| 416,525 |
|
Agios Pharmaceuticals, Inc.(1) | 1,990 |
| 167,220 |
|
Alkermes plc(1) | 15,682 |
| 792,725 |
|
Alnylam Pharmaceuticals, Inc.(1) | 7,737 |
| 717,529 |
|
Celldex Therapeutics, Inc.(1) | 18,977 |
| 317,865 |
|
Cepheid, Inc.(1) | 10,582 |
| 560,952 |
|
Clovis Oncology, Inc.(1) | 2,932 |
| 174,923 |
|
Cubist Pharmaceuticals, Inc.(1) | 9,438 |
| 682,273 |
|
Incyte Corp.(1) | 16,983 |
| 1,138,880 |
|
Intercept Pharmaceuticals, Inc.(1) | 1,988 |
| 513,679 |
|
Isis Pharmaceuticals, Inc.(1) | 15,737 |
| 724,846 |
|
Keryx Biopharmaceuticals, Inc.(1) | 17,068 |
| 287,596 |
|
MannKind Corp.(1) | 39,547 |
| 237,678 |
|
Medivation, Inc.(1) | 9,616 |
| 1,016,411 |
|
Myriad Genetics, Inc.(1) | 11,368 |
| 448,922 |
|
NPS Pharmaceuticals, Inc.(1) | 15,213 |
| 416,836 |
|
Opko Health, Inc.(1) | 38,353 |
| 320,248 |
|
| PDL BioPharma, Inc. | 32,102 |
| 273,830 |
|
Pharmacyclics, Inc.(1) | 7,680 |
| 1,003,546 |
|
Puma Biotechnology, Inc.(1) | 2,212 |
| 554,327 |
|
Receptos, Inc.(1) | 3,014 |
| 312,401 |
|
Seattle Genetics, Inc.(1) | 14,198 |
| 520,641 |
|
Synageva BioPharma Corp.(1) | 3,837 |
| 290,614 |
|
United Therapeutics Corp.(1) | 6,425 |
| 841,482 |
|
| | | 12,731,949 |
|
| Building Products — 4.6% | | |
| Apogee Enterprises, Inc. | 47,802 |
| 2,098,508 |
|
| Fortune Brands Home & Security, Inc. | 44,404 |
| 1,920,473 |
|
|
| | | | | |
| | Shares | Value |
| Insteel Industries, Inc. | 23,463 |
| $ | 559,358 |
|
| Lennox International, Inc. | 15,756 |
| 1,401,023 |
|
NCI Building Systems, Inc.(1) | 68,716 |
| 1,365,387 |
|
Trex Co., Inc.(1) | 28,950 |
| 1,244,850 |
|
| | | 8,589,599 |
|
| Capital Markets — 1.7% | | |
| Evercore Partners, Inc., Class A | 19,796 |
| 1,024,839 |
|
| HFF, Inc., Class A | 16,139 |
| 508,056 |
|
| Lazard Ltd., Class A | 33,967 |
| 1,671,516 |
|
| | | 3,204,411 |
|
| Chemicals — 1.2% | | |
| International Flavors & Fragrances, Inc. | 10,221 |
| 1,013,412 |
|
| PolyOne Corp. | 32,520 |
| 1,203,565 |
|
| | | 2,216,977 |
|
| Communications Equipment — 1.0% | | |
Palo Alto Networks, Inc.(1) | 6,983 |
| 738,103 |
|
| Ubiquiti Networks, Inc. | 33,274 |
| 1,190,211 |
|
| | | 1,928,314 |
|
| Construction Materials — 1.6% | | |
| Caesarstone Sdot-Yam Ltd. | 22,068 |
| 1,232,719 |
|
Headwaters, Inc.(1) | 87,772 |
| 1,114,704 |
|
| Martin Marietta Materials, Inc. | 5,750 |
| 672,290 |
|
| | | 3,019,713 |
|
| Containers and Packaging — 1.8% | | |
| Ball Corp. | 18,733 |
| 1,206,967 |
|
Crown Holdings, Inc.(1) | 16,410 |
| 786,531 |
|
Graphic Packaging Holding Co.(1) | 119,829 |
| 1,453,526 |
|
| | | 3,447,024 |
|
| Distributors — 4.7% | | |
| Core-Mark Holding Co., Inc. | 12,531 |
| 727,174 |
|
LKQ Corp.(1) | 279,577 |
| 7,987,515 |
|
| | | 8,714,689 |
|
| Diversified Consumer Services — 0.6% | | |
Nord Anglia Education, Inc.(1) | 61,096 |
| 1,043,520 |
|
| Diversified Financial Services — 1.1% | | |
| CBOE Holdings, Inc. | 17,164 |
| 1,011,646 |
|
| MarketAxess Holdings, Inc. | 15,038 |
| 972,207 |
|
| | | 1,983,853 |
|
| Diversified Telecommunication Services — 0.3% | | |
tw telecom, inc., Class A(1) | 14,920 |
| 638,278 |
|
| Electrical Equipment — 0.8% | | |
| Acuity Brands, Inc. | 11,233 |
| 1,566,217 |
|
| Electronic Equipment, Instruments and Components — 2.0% | | |
| Littelfuse, Inc. | 16,971 |
| 1,655,351 |
|
| Methode Electronics, Inc. | 37,280 |
| 1,468,087 |
|
Trimble Navigation Ltd.(1) | 23,963 |
| 643,646 |
|
| | | 3,767,084 |
|
|
| | | | | |
| | Shares | Value |
| Energy Equipment and Services — 1.0% | | |
Dril-Quip, Inc.(1) | 5,959 |
| $ | 536,012 |
|
| Helmerich & Payne, Inc. | 6,934 |
| 602,010 |
|
RigNet, Inc.(1) | 16,200 |
| 703,890 |
|
| | | 1,841,912 |
|
| Food and Staples Retailing — 0.8% | | |
United Natural Foods, Inc.(1) | 22,923 |
| 1,559,222 |
|
| Food Products — 2.0% | | |
Hain Celestial Group, Inc. (The)(1) | 15,522 |
| 1,680,256 |
|
| J&J Snack Foods Corp. | 8,842 |
| 910,991 |
|
TreeHouse Foods, Inc.(1) | 14,033 |
| 1,195,191 |
|
| | | 3,786,438 |
|
| Health Care Equipment and Supplies — 4.5% | | |
Align Technology, Inc.(1) | 10,525 |
| 553,825 |
|
| Cooper Cos., Inc. (The) | 4,342 |
| 711,654 |
|
DexCom, Inc.(1) | 9,842 |
| 442,398 |
|
IDEXX Laboratories, Inc.(1) | 5,931 |
| 840,245 |
|
Insulet Corp.(1) | 9,160 |
| 395,437 |
|
Mettler-Toledo International, Inc.(1) | 2,880 |
| 744,393 |
|
| ResMed, Inc. | 15,858 |
| 828,105 |
|
Sirona Dental Systems, Inc.(1) | 5,009 |
| 393,457 |
|
| STERIS Corp. | 15,986 |
| 987,935 |
|
| Teleflex, Inc. | 17,931 |
| 2,046,286 |
|
| West Pharmaceutical Services, Inc. | 10,560 |
| 541,200 |
|
| | | 8,484,935 |
|
| Health Care Providers and Services — 4.6% | | |
Acadia Healthcare Co., Inc.(1) | 7,015 |
| 435,281 |
|
Brookdale Senior Living, Inc.(1) | 17,054 |
| 574,890 |
|
Centene Corp.(1) | 7,817 |
| 724,401 |
|
ExamWorks Group, Inc.(1) | 72,284 |
| 2,803,173 |
|
| HealthSouth Corp. | 13,867 |
| 559,256 |
|
Mednax, Inc.(1) | 9,349 |
| 583,658 |
|
Team Health Holdings, Inc.(1) | 22,098 |
| 1,382,009 |
|
Tenet Healthcare Corp.(1) | 17,831 |
| 999,428 |
|
| Universal Health Services, Inc., Class B | 5,343 |
| 554,123 |
|
| | | 8,616,219 |
|
| Health Care Technology — 0.9% | | |
athenahealth, Inc.(1) | 4,953 |
| 606,743 |
|
HMS Holdings Corp.(1) | 16,386 |
| 380,647 |
|
Medidata Solutions, Inc.(1) | 14,849 |
| 669,838 |
|
| | | 1,657,228 |
|
| Hotels, Restaurants and Leisure — 2.3% | | |
La Quinta Holdings, Inc.(1) | 45,607 |
| 930,839 |
|
| Papa John's International, Inc. | 40,350 |
| 1,886,766 |
|
| Vail Resorts, Inc. | 17,636 |
| 1,523,045 |
|
| | | 4,340,650 |
|
|
| | | | | |
| | Shares | Value |
| Household Durables — 1.6% | | |
| Harman International Industries, Inc. | 12,651 |
| $ | 1,357,959 |
|
Jarden Corp.(1) | 24,946 |
| 1,623,735 |
|
| | | 2,981,694 |
|
| Insurance — 0.8% | | |
| Allied World Assurance Co. Holdings Ltd. | 38,298 |
| 1,455,324 |
|
| Internet Software and Services — 4.8% | | |
comScore, Inc.(1) | 26,009 |
| 1,096,019 |
|
CoStar Group, Inc.(1) | 20,448 |
| 3,293,968 |
|
Envestnet, Inc.(1) | 27,570 |
| 1,224,660 |
|
Shutterstock, Inc.(1) | 33,914 |
| 2,637,153 |
|
Yelp, Inc.(1) | 11,805 |
| 708,300 |
|
| | | 8,960,100 |
|
| IT Services — 4.6% | | |
Alliance Data Systems Corp.(1) | 9,029 |
| 2,558,367 |
|
FleetCor Technologies, Inc.(1) | 11,481 |
| 1,728,580 |
|
| Heartland Payment Systems, Inc. | 19,862 |
| 1,025,872 |
|
Virtusa Corp.(1) | 42,635 |
| 1,747,182 |
|
WEX, Inc.(1) | 13,620 |
| 1,546,687 |
|
| | | 8,606,688 |
|
| Leisure Products — 2.0% | | |
| Brunswick Corp. | 39,821 |
| 1,863,623 |
|
| Polaris Industries, Inc. | 12,462 |
| 1,880,017 |
|
| | | 3,743,640 |
|
| Life Sciences Tools and Services — 1.0% | | |
Charles River Laboratories International, Inc.(1) | 20,160 |
| 1,273,305 |
|
Covance, Inc.(1) | 7,333 |
| 585,907 |
|
| | | 1,859,212 |
|
| Machinery — 5.2% | | |
| ITT Corp. | 29,576 |
| 1,332,695 |
|
Middleby Corp.(1) | 41,855 |
| 3,704,167 |
|
| Mueller Water Products, Inc., Class A | 177,717 |
| 1,754,067 |
|
| Snap-On, Inc. | 15,607 |
| 2,062,309 |
|
WABCO Holdings, Inc.(1) | 8,298 |
| 808,059 |
|
| | | 9,661,297 |
|
| Media — 0.6% | | |
Time, Inc.(1) | 45,701 |
| 1,032,386 |
|
| Metals and Mining — 0.9% | | |
Horsehead Holding Corp.(1) | 102,621 |
| 1,612,176 |
|
| Oil, Gas and Consumable Fuels — 2.5% | | |
Athlon Energy, Inc.(1) | 15,944 |
| 929,535 |
|
Carrizo Oil & Gas, Inc.(1) | 21,370 |
| 1,109,958 |
|
Goodrich Petroleum Corp.(1) | 39,592 |
| 326,238 |
|
Gulfport Energy Corp.(1) | 31,192 |
| 1,565,214 |
|
Magnum Hunter Resources Corp.(1) | 166,512 |
| 772,616 |
|
| | | 4,703,561 |
|
|
| | | | | |
| | Shares | Value |
| Personal Products — 0.2% | | |
| Herbalife Ltd. | 7,592 |
| $ | 398,276 |
|
| Pharmaceuticals — 3.0% | | |
Akorn, Inc.(1) | 10,647 |
| 474,324 |
|
AVANIR Pharmaceuticals, Inc.(1) | 19,127 |
| 247,503 |
|
Jazz Pharmaceuticals plc(1) | 6,891 |
| 1,163,476 |
|
Mallinckrodt plc(1) | 10,772 |
| 992,963 |
|
Medicines Co. (The)(1) | 11,115 |
| 281,432 |
|
Pacira Pharmaceuticals, Inc.(1) | 5,214 |
| 483,964 |
|
Salix Pharmaceuticals Ltd.(1) | 11,753 |
| 1,690,669 |
|
| Theravance, Inc. | 13,640 |
| 218,513 |
|
| | | 5,552,844 |
|
| Professional Services — 1.1% | | |
Huron Consulting Group, Inc.(1) | 13,881 |
| 966,256 |
|
Korn/Ferry International(1) | 36,518 |
| 1,019,948 |
|
| | | 1,986,204 |
|
| Real Estate Investment Trusts (REITs) — 0.8% | | |
| Federal Realty Investment Trust | 4,215 |
| 555,537 |
|
| Sun Communities, Inc. | 16,323 |
| 946,244 |
|
| | | 1,501,781 |
|
| Road and Rail — 1.9% | | |
Roadrunner Transportation Systems, Inc.(1) | 49,637 |
| 1,023,019 |
|
Saia, Inc.(1) | 35,139 |
| 1,722,514 |
|
Swift Transportation Co.(1) | 31,696 |
| 782,891 |
|
| | | 3,528,424 |
|
| Semiconductors and Semiconductor Equipment — 2.7% | | |
M/A-COM Technology Solutions Holdings, Inc.(1) | 27,414 |
| 602,834 |
|
Photronics, Inc.(1) | 89,343 |
| 803,194 |
|
RF Micro Devices, Inc.(1) | 83,284 |
| 1,083,525 |
|
| Skyworks Solutions, Inc. | 32,969 |
| 1,920,114 |
|
Synaptics, Inc.(1) | 9,143 |
| 625,655 |
|
| | | 5,035,322 |
|
| Software — 4.5% | | |
Aspen Technology, Inc.(1) | 44,891 |
| 1,657,825 |
|
FireEye, Inc.(1) | 31,640 |
| 1,075,443 |
|
Manhattan Associates, Inc.(1) | 21,430 |
| 859,557 |
|
| Monotype Imaging Holdings, Inc. | 31,006 |
| 887,082 |
|
ServiceNow, Inc.(1) | 26,087 |
| 1,772,090 |
|
Splunk, Inc.(1) | 12,463 |
| 823,555 |
|
Verint Systems, Inc.(1) | 24,614 |
| 1,415,059 |
|
| | | 8,490,611 |
|
| Specialty Retail — 4.6% | | |
Cabela's, Inc.(1) | 10,985 |
| 527,500 |
|
| Foot Locker, Inc. | 29,350 |
| 1,643,893 |
|
| Lithia Motors, Inc., Class A | 6,286 |
| 487,919 |
|
Restoration Hardware Holdings, Inc.(1) | 29,890 |
| 2,400,765 |
|
|
| | | | | |
| | Shares | Value |
| Signet Jewelers Ltd. | 22,124 |
| $ | 2,655,101 |
|
Ulta Salon Cosmetics & Fragrance, Inc.(1) | 7,049 |
| 851,590 |
|
| | | 8,566,768 |
|
| Technology Hardware, Storage and Peripherals — 1.2% | | |
Nimble Storage, Inc.(1) | 35,815 |
| 979,898 |
|
Stratasys Ltd.(1) | 10,832 |
| 1,303,740 |
|
| | | 2,283,638 |
|
| Textiles, Apparel and Luxury Goods — 2.2% | | |
| Hanesbrands, Inc. | 25,322 |
| 2,674,256 |
|
Skechers U.S.A., Inc., Class A(1) | 25,832 |
| 1,414,302 |
|
| | | 4,088,558 |
|
| Trading Companies and Distributors — 1.3% | | |
| H&E Equipment Services, Inc. | 23,568 |
| 881,208 |
|
United Rentals, Inc.(1) | 13,554 |
| 1,491,753 |
|
| | | 2,372,961 |
|
| Wireless Telecommunication Services — 0.3% | | |
RingCentral, Inc., Class A(1) | 43,474 |
| 571,248 |
|
TOTAL COMMON STOCKS (Cost $141,125,438) | | 182,602,116 |
|
| TEMPORARY CASH INVESTMENTS — 1.7% | | |
| Repurchase Agreement, Bank of America Merrill Lynch, (collateralized by various U.S. Treasury obligations, 1.375% - 2.625%, 12/31/14 - 2/28/19, valued at $744,752), in a joint trading account at 0.07%, dated 10/31/14, due 11/3/14 (Delivery value $730,264) | | 730,260 |
|
| Repurchase Agreement, Credit Suisse First Boston, Inc., (collateralized by various U.S. Treasury obligations, 0.25%, 10/15/15, valued at $297,963), in a joint trading account at 0.04%, dated 10/31/14, due 11/3/14 (Delivery value $292,105) | | 292,104 |
|
| Repurchase Agreement, Goldman Sachs & Co., (collateralized by various U.S. Treasury obligations, 0.125%, 12/31/14, valued at $596,495), in a joint trading account at 0.03%, dated 10/31/14, due 11/3/14 (Delivery value $584,209) | | 584,208 |
|
| SSgA U.S. Government Money Market Fund, Class N | 1,606,938 |
| 1,606,938 |
|
TOTAL TEMPORARY CASH INVESTMENTS (Cost $3,213,510) | | 3,213,510 |
|
TOTAL INVESTMENT SECURITIES — 99.5% (Cost $144,338,948) | | 185,815,626 |
|
| OTHER ASSETS AND LIABILITIES — 0.5% | | 945,328 |
|
| TOTAL NET ASSETS — 100.0% | | $ | 186,760,954 |
|
|
| | |
| NOTES TO SCHEDULE OF INVESTMENTS |
See Notes to Financial Statements.
|
|
| Statement of Assets and Liabilities |
|
| | | |
| OCTOBER 31, 2014 | |
| Assets | |
| Investment securities, at value (cost of $144,338,948) | $ | 185,815,626 |
|
| Receivable for investments sold | 2,377,951 |
|
| Receivable for capital shares sold | 21,937 |
|
| Dividends and interest receivable | 21,582 |
|
| | 188,237,096 |
|
| | |
| Liabilities | |
| Payable for investments purchased | 1,026,918 |
|
| Payable for capital shares redeemed | 239,581 |
|
| Accrued management fees | 209,459 |
|
| Distribution and service fees payable | 184 |
|
| | 1,476,142 |
|
| | |
| Net Assets | $ | 186,760,954 |
|
| | |
| Net Assets Consist of: | |
| Capital (par value and paid-in surplus) | $ | 135,290,829 |
|
| Accumulated net investment loss | (1,539,393 | ) |
| Undistributed net realized gain | 11,532,840 |
|
| Net unrealized appreciation | 41,476,678 |
|
| | $ | 186,760,954 |
|
|
| | | | | | |
| | Net Assets | Shares Outstanding | Net Asset Value Per Share |
| Investor Class, $0.01 Par Value |
| $186,134,171 |
| 15,679,790 |
| $11.87 |
| Institutional Class, $0.01 Par Value |
| $49,339 |
| 4,119 |
| $11.98 |
| A Class, $0.01 Par Value |
| $393,970 |
| 33,584 |
| $11.73* |
| C Class, $0.01 Par Value |
| $75,402 |
| 6,658 |
| $11.33 |
| R Class, $0.01 Par Value |
| $108,072 |
| 9,321 |
| $11.59 |
*Maximum offering price $12.45 (net asset value divided by 0.9425).
See Notes to Financial Statements.
|
| | | |
| YEAR ENDED OCTOBER 31, 2014 | |
| Investment Income (Loss) | |
| Income: | |
| Dividends (net of foreign taxes withheld of $2,571) | $ | 1,042,331 |
|
| Interest | 533 |
|
| | 1,042,864 |
|
| | |
| Expenses: | |
| Management fees | 2,847,404 |
|
| Distribution and service fees: | |
| A Class | 908 |
|
| C Class | 829 |
|
| R Class | 498 |
|
| Directors' fees and expenses | 2,885 |
|
| | 2,852,524 |
|
| Fees waived | (45,863 | ) |
| | 2,806,661 |
|
| | |
| Net investment income (loss) | (1,763,797 | ) |
| | |
| Realized and Unrealized Gain (Loss) | |
| Net realized gain (loss) on: | |
| Investment transactions | 21,420,935 |
|
| Foreign currency transactions | 69,271 |
|
| | 21,490,206 |
|
| | |
| Change in net unrealized appreciation (depreciation) on investments | (4,048,543 | ) |
| | |
| Net realized and unrealized gain (loss) | 17,441,663 |
|
| | |
| Net Increase (Decrease) in Net Assets Resulting from Operations | $ | 15,677,866 |
|
See Notes to Financial Statements.
|
|
| Statement of Changes in Net Assets |
|
| | | | | | |
| YEARS ENDED OCTOBER 31, 2014 AND OCTOBER 31, 2013 | |
| Increase (Decrease) in Net Assets | October 31, 2014 | October 31, 2013 |
| Operations | | |
| Net investment income (loss) | $ | (1,763,797 | ) | $ | (1,056,726 | ) |
| Net realized gain (loss) | 21,490,206 |
| 26,351,491 |
|
| Change in net unrealized appreciation (depreciation) | (4,048,543 | ) | 24,716,488 |
|
| Net increase (decrease) in net assets resulting from operations | 15,677,866 |
| 50,011,253 |
|
| | | |
| Capital Share Transactions | | |
| Net increase (decrease) in net assets from capital share transactions (Note 5) | (19,993,842 | ) | (13,879,798 | ) |
| | | |
| Redemption Fees | | |
| Increase in net assets from redemption fees | 8,985 |
| 5,437 |
|
| | | |
| Net increase (decrease) in net assets | (4,306,991 | ) | 36,136,892 |
|
| | | |
| Net Assets | | |
| Beginning of period | 191,067,945 |
| 154,931,053 |
|
| End of period | $ | 186,760,954 |
| $ | 191,067,945 |
|
| | | |
| Accumulated net investment loss | $ | (1,539,393 | ) | $ | (1,483,655 | ) |
See Notes to Financial Statements.
|
|
| Notes to Financial Statements |
OCTOBER 31, 2014
1. Organization
American Century Mutual Funds, Inc. (the corporation) is registered under the Investment Company Act of 1940, as amended (the 1940 Act), as an open-end management investment company and is organized as a Maryland corporation. New Opportunities Fund (the fund) is one fund in a series issued by the corporation. The fund is diversified as defined under the 1940 Act. The fund’s investment objective is to seek long-term capital growth.
The fund offers the Investor Class, the Institutional Class, the A Class, the C Class and the R Class. The A Class may incur an initial sales charge. The A Class and C Class may be subject to a contingent deferred sales charge. The share classes differ principally in their respective sales charges and distribution and shareholder servicing expenses and arrangements. The Institutional Class is made available to institutional shareholders or through financial intermediaries whose clients do not require the same level of shareholder and administrative services as shareholders of other classes. As a result, the Institutional Class is charged a lower unified management fee.
2. Significant Accounting Policies
The following is a summary of significant accounting policies consistently followed by the fund in preparation of its financial statements. The fund is an investment company and follows accounting and reporting guidance in accordance with accounting principles generally accepted in the United States of America. This may require management to make certain estimates and assumptions at the date of the financial statements. Actual results could differ from these estimates. Management evaluated the impact of events or transactions occurring through the date the financial statements were issued that would merit recognition or disclosure.
Investment Valuations — The fund determines the fair value of its investments and computes its net asset value per share at the close of regular trading (usually 4 p.m. Eastern time) on the New York Stock Exchange (NYSE) on each day the NYSE is open. The Board of Directors has adopted valuation policies and procedures to guide the investment advisor in the fund’s investment valuation process and to provide methodologies for the oversight of the fund’s pricing function.
Equity securities that are listed or traded on a domestic securities exchange are valued at the last reported sales price or at the official closing price as provided by the exchange. Equity securities traded on foreign securities exchanges are generally valued at the closing price of such securities on the exchange where primarily traded or at the close of the NYSE, if that is earlier. If no last sales price is reported, or if local convention or regulation so provides, the mean of the latest bid and asked prices may be used. Securities traded over-the-counter are valued at the mean of the latest bid and asked prices, the last sales price, or the official closing price. Equity securities initially expressed in local currencies are translated into U.S. dollars at the mean of the appropriate currency exchange rate at the close of the NYSE as provided by an independent pricing service.
Fixed income securities maturing within 60 days at the time of purchase may be valued at cost, plus or minus any amortized discount or premium or at the evaluated mean as provided by an independent pricing service. Evaluated mean prices are commonly derived through utilization of market models, which may consider, among other factors: trade data, quotations from dealers and active market makers, relevant yield curve and spread data, related sector levels, creditworthiness, trade data or market information on comparable securities, and other relevant security specific information.
Open-end management investment companies are valued at the reported net asset value per share. Repurchase agreements are valued at cost, which approximates fair value. Forward foreign currency exchange contracts are valued at the mean of the appropriate forward exchange rate at the close of the NYSE as provided by an independent pricing service.
If the fund determines that the market price for an investment is not readily available or the valuation methods mentioned above do not reflect an investment’s fair value, such investment is valued as determined in good faith by the Board of Directors or its delegate, in accordance with policies and procedures adopted by the
Board of Directors. In its determination of fair value, the fund may review several factors including, but not limited to, market information regarding the specific investment or comparable investments and correlation with other investment types, futures indices or general market indicators. Circumstances that may cause the fund to use these procedures to value an investment include, but are not limited to: an investment has been declared in default or is distressed; trading in a security has been suspended during the trading day or a security is not actively trading on its principal exchange; prices received from a regular pricing source are deemed unreliable; or there is a foreign market holiday and no trading occurred.
The fund monitors for significant events occurring after the close of an investment’s primary exchange but before the fund’s net asset value per share is determined. Significant events may include, but are not limited to: corporate announcements and transactions; governmental action and political unrest that could impact a specific investment or an investment sector; or armed conflicts, natural disasters and similar events that could affect investments in a specific country or region. The fund also monitors for significant fluctuations between domestic and foreign markets, as evidenced by the U.S. market or such other indicators that the Board of Directors, or its delegate, deems appropriate. If significant fluctuations in foreign markets are identified, the fund may apply a model-derived factor to the closing price of equity securities traded on foreign securities exchanges. The factor is based on observable market data as provided by an independent pricing service.
Security Transactions — Security transactions are accounted for as of the trade date. Net realized gains and losses are determined on the identified cost basis, which is also used for federal income tax purposes.
Investment Income — Dividend income less foreign taxes withheld, if any, is recorded as of the ex-dividend date. Distributions received on securities that represent a return of capital or long-term capital gain are recorded as a reduction of cost of investments and/or as a realized gain. The fund may estimate the components of distributions received that may be considered nontaxable distributions or long-term capital gain distributions for income tax purposes. Interest income is recorded on the accrual basis and includes accretion of discounts and amortization of premiums.
Foreign Currency Translations — All assets and liabilities initially expressed in foreign currencies are translated into U.S. dollars at prevailing exchange rates at period end. The fund may enter into spot foreign currency exchange contracts to facilitate transactions denominated in a foreign currency. Purchases and sales of investment securities, dividend and interest income, spot foreign currency exchange contracts, and expenses are translated at the rates of exchange prevailing on the respective dates of such transactions. Net realized and unrealized foreign currency exchange gains or losses related to investment securities are a component of net realized gain (loss) on investment transactions and change in net unrealized appreciation (depreciation) on investments, respectively.
Repurchase Agreements — The fund may enter into repurchase agreements with institutions that American Century Investment Management, Inc. (ACIM) (the investment advisor) has determined are creditworthy pursuant to criteria adopted by the Board of Directors. The fund requires that the collateral, represented by securities, received in a repurchase transaction be transferred to the custodian in a manner sufficient to enable the fund to obtain those securities in the event of a default under the repurchase agreement. ACIM monitors, on a daily basis, the securities transferred to ensure the value, including accrued interest, of the securities under each repurchase agreement is equal to or greater than amounts owed to the fund under each repurchase agreement.
Joint Trading Account — Pursuant to an Exemptive Order issued by the Securities and Exchange Commission, the fund, along with certain other funds in the American Century Investments family of funds, may transfer uninvested cash balances into a joint trading account. These balances are invested in one or more repurchase agreements that are collateralized by U.S. Treasury or Agency obligations.
Income Tax Status — It is the fund’s policy to distribute substantially all net investment income and net realized gains to shareholders and to otherwise qualify as a regulated investment company under provisions of the Internal Revenue Code. Accordingly, no provision has been made for income taxes. The fund files U.S. federal, state, local and non-U.S. tax returns as applicable. The fund's tax returns are subject to examination by the relevant taxing authority until expiration of the applicable statute of limitations, which is generally three years from the date of filing but can be longer in certain jurisdictions. At this time, management believes there are no uncertain tax positions which, based on their technical merit, would not be sustained upon examination and for which it is reasonably possible that the total amounts of unrecognized tax benefits will significantly change in the next twelve months.
Multiple Class — All shares of the fund represent an equal pro rata interest in the net assets of the class to which such shares belong, and have identical voting, dividend, liquidation and other rights and the same terms
and conditions, except for class specific expenses and exclusive rights to vote on matters affecting only individual classes. Income, non-class specific expenses, and realized and unrealized capital gains and losses of the fund are allocated to each class of shares based on their relative net assets.
Distributions to Shareholders — Distributions from net investment income and net realized gains, if any, are generally declared and paid annually.
Redemption Fees — The fund may impose a 2.00% redemption fee on shares held less than 60 days. The fee may not be applicable to all classes. The redemption fee is retained by the fund and helps cover transaction costs that long-term investors may bear when the fund sells securities to meet investor redemptions.
Indemnifications — Under the corporation’s organizational documents, its officers and directors are indemnified against certain liabilities arising out of the performance of their duties to the fund. In addition, in the normal course of business, the fund enters into contracts that provide general indemnifications. The maximum exposure under these arrangements is unknown as this would involve future claims that may be made against a fund. The risk of material loss from such claims is considered by management to be remote.
3. Fees and Transactions with Related Parties
Certain officers and directors of the corporation are also officers and/or directors of American Century Companies, Inc. (ACC). The corporation’s investment advisor, ACIM, the corporation's distributor, American Century Investment Services, Inc. (ACIS), and the corporation’s transfer agent, American Century Services, LLC, are wholly owned, directly or indirectly, by ACC.
Management Fees — The corporation has entered into a management agreement with ACIM, under which ACIM provides the fund with investment advisory and management services in exchange for a single, unified management fee (the fee) per class. The agreement provides that all expenses of managing and operating the fund, except distribution and service fees, brokerage expenses, taxes, interest, fees and expenses of the independent directors (including legal counsel fees), and extraordinary expenses, will be paid by ACIM. The fee is computed and accrued daily based on each class’s daily net assets and paid monthly in arrears. The rate of the fee is determined by applying a fee rate calculation formula. This formula takes into account the fund’s assets as well as certain assets, if any, of other clients of the investment advisor outside the American Century Investments family of funds (such as subadvised funds and separate accounts) that have very similar investment teams and investment strategies (strategy assets). The annual management fee schedule ranges from 1.100% to 1.500% for the Investor Class, A Class, C Class and R Class. The annual management fee schedule ranges from 0.900% to 1.300% for the Institutional Class. Effective August 1, 2014, the investment advisor voluntarily agreed to waive 0.10% of its management fee. The investment advisor expects the fee waiver to continue through July 31, 2015, and cannot terminate it without the approval of the Board of Directors. The total amount of the waiver for each class for the year ended October 31, 2014 was $45,708, $12, $99, $18 and $26 for the Investor Class, Institutional Class, A Class, C Class and R Class, respectively. The effective annual management fee before waiver for each class for the year ended October 31, 2014 was 1.50% for the Investor Class, A Class, C Class and R Class and 1.30% for the Institutional Class. The effective annual management fee after waiver for each class for the year ended October 31, 2014 was 1.48% for the Investor Class, A Class, C Class and R Class and 1.28% for the Institutional Class.
Distribution and Service Fees — The Board of Directors has adopted a separate Master Distribution and Individual Shareholder Services Plan for each of the A Class, C Class and R Class (collectively the plans), pursuant to Rule 12b-1 of the 1940 Act. The plans provide that the A Class will pay ACIS an annual distribution and service fee of 0.25%. The plans provide that the C Class will pay ACIS an annual distribution and service fee of 1.00%, of which 0.25% is paid for individual shareholder services and 0.75% is paid for distribution services. The plans provide that the R Class will pay ACIS an annual distribution and service fee of 0.50%. The fees are computed and accrued daily based on each class’s daily net assets and paid monthly in arrears. The fees are used to pay financial intermediaries for distribution and individual shareholder services. Fees incurred under the plans during the year ended October 31, 2014 are detailed in the Statement of Operations.
Directors' Fees and Expenses — The Board of Directors is responsible for overseeing the investment advisor’s management and operations of the fund. The directors receive detailed information about the fund and its investment advisor regularly throughout the year, and meet at least quarterly with management of the investment advisor to review reports about fund operations. Fees and expenses incurred in conjunction with the directors during the year ended October 31, 2014 are detailed in the Statement of Operations. The fund’s officers do not receive compensation from the fund.
Acquired Fund Fees and Expenses — The fund may invest in mutual funds, exchange-traded funds, and business development companies (the acquired funds). The fund will indirectly realize its pro rata share of the fees and expenses of the acquired funds in which it invests. These indirect fees and expenses are not paid out of the fund's assets but are reflected in the return realized by the fund on its investment in the acquired funds.
4. Investment Transactions
Purchases and sales of investment securities, excluding short-term investments, for the year ended October 31, 2014 were $142,159,371 and $162,728,675, respectively.
5. Capital Share Transactions
Transactions in shares of the fund were as follows:
|
| | | | | | | | | | |
| | Year ended October 31, 2014 | Year ended October 31, 2013 |
| | Shares | Amount | Shares | Amount |
| Investor Class/Shares Authorized | 200,000,000 |
| | 200,000,000 |
| |
| Sold | 670,786 |
| $ | 7,648,874 |
| 1,105,428 |
| $ | 10,646,772 |
|
| Redeemed | (2,422,255 | ) | (27,644,383 | ) | (2,680,109 | ) | (24,543,220 | ) |
| | (1,751,469 | ) | (19,995,509 | ) | (1,574,681 | ) | (13,896,448 | ) |
| Institutional Class/Shares Authorized | 25,000,000 |
| | 25,000,000 |
| |
| A Class/Shares Authorized | 25,000,000 |
| | 25,000,000 |
| |
| Sold | 7,111 |
| 80,085 |
| 13,453 |
| 127,738 |
|
| Redeemed | (3,258 | ) | (35,806 | ) | (13,318 | ) | (125,925 | ) |
| | 3,853 |
| 44,279 |
| 135 |
| 1,813 |
|
| C Class/Shares Authorized | 25,000,000 |
| | 25,000,000 |
| |
| Sold | 967 |
| 10,481 |
| 5,823 |
| 51,750 |
|
| Redeemed | (5,463 | ) | (60,448 | ) | (4,720 | ) | (46,089 | ) |
| | (4,496 | ) | (49,967 | ) | 1,103 |
| 5,661 |
|
| R Class/Shares Authorized | 25,000,000 |
| | 25,000,000 |
| |
| Sold | 972 |
| 10,912 |
| 999 |
| 9,337 |
|
| Redeemed | (319 | ) | (3,557 | ) | (15 | ) | (161 | ) |
| | 653 |
| 7,355 |
| 984 |
| 9,176 |
|
| Net increase (decrease) | (1,751,459 | ) | $ | (19,993,842 | ) | (1,572,459 | ) | $ | (13,879,798 | ) |
6. Fair Value Measurements
The fund’s investments valuation process is based on several considerations and may use multiple inputs to determine the fair value of the investments held by the fund. In conformity with accounting principles generally accepted in the United States of America, the inputs used to determine a valuation are classified into three broad levels.
| |
| • | Level 1 valuation inputs consist of unadjusted quoted prices in an active market for identical investments. |
| |
| • | Level 2 valuation inputs consist of direct or indirect observable market data (including quoted prices for comparable investments, evaluations of subsequent market events, interest rates, prepayment speeds, credit risk, etc.). These inputs also consist of quoted prices for identical investments initially expressed in local currencies that are adjusted through translation into U.S. dollars. |
| |
| • | Level 3 valuation inputs consist of unobservable data (including a fund’s own assumptions). |
The level classification is based on the lowest level input that is significant to the fair valuation measurement. The valuation inputs are not necessarily an indication of the risks associated with investing in these securities or other financial instruments. There were no significant transfers between levels during the period.
The following is a summary of the level classifications as of period end. The Schedule of Investments provides additional information on the fund’s portfolio holdings.
|
| | | | | | | | |
| | Level 1 | Level 2 | Level 3 |
| Assets | | | |
| Investment Securities | | | |
| Common Stocks | $ | 182,602,116 |
| — |
| — |
|
| Temporary Cash Investments | 1,606,938 |
| $ | 1,606,572 |
| — |
|
| | $ | 184,209,054 |
| $ | 1,606,572 |
| — |
|
7. Derivative Instruments
Foreign Currency Risk — The fund is subject to foreign currency exchange rate risk in the normal course of pursuing its investment objectives. The value of foreign investments held by a fund may be significantly affected by changes in foreign currency exchange rates. The dollar value of a foreign security generally decreases when the value of the dollar rises against the foreign currency in which the security is denominated and tends to increase when the value of the dollar declines against such foreign currency. A fund may enter into forward foreign currency exchange contracts to reduce a fund's exposure to foreign currency exchange rate fluctuations. The net U.S. dollar value of foreign currency underlying all contractual commitments held by a fund and the resulting unrealized appreciation or depreciation are determined daily. Realized gain or loss is recorded upon the termination of the contract. Net realized and unrealized gains or losses occurring during the holding period of forward foreign currency exchange contracts are a component of net realized gain (loss) on foreign currency transactions and change in net unrealized appreciation (depreciation) on translation of assets and liabilities in foreign currencies, respectively. A fund bears the risk of an unfavorable change in the foreign currency exchange rate underlying the forward contract. Additionally, losses, up to the fair value, may arise if the counterparties do not perform under the contract terms. The fund's average U.S. dollar exposure to foreign currency risk derivative instruments held during the period was $979,364.
At period end, the fund did not have any derivative instruments disclosed on the Statement of Assets and Liabilities. For the year ended October 31, 2014, the effect of foreign currency risk derivative instruments on the Statement of Operations was $70,822 in net realized gain (loss) on foreign currency transactions.
8. Risk Factors
The fund invests in common stocks of small companies. Because of this, the fund may be subject to greater risk and market fluctuations than a fund investing in larger, more established companies.
9. Federal Tax Information
The book-basis character of distributions made during the year from net investment income or net realized gains may differ from their ultimate characterization for federal income tax purposes. These differences reflect the differing character of certain income items and net realized gains and losses for financial statement and tax purposes, and may result in reclassification among certain capital accounts on the financial statements. There were no distributions paid by the fund during the years ended October 31, 2014 and October 31, 2013.
As of October 31, 2014, the federal tax cost of investments and the components of distributable earnings on a tax-basis were as follows:
|
| | | |
| Federal tax cost of investments | $ | 144,429,037 |
|
| Gross tax appreciation of investments | $ | 43,955,101 |
|
| Gross tax depreciation of investments | (2,568,512 | ) |
| Net tax appreciation (depreciation) of investments | $ | 41,386,589 |
|
| Undistributed ordinary income | — |
|
| Accumulated long-term gains | $ | 11,622,929 |
|
Late-year ordinary loss deferral
| $ | (1,539,393 | ) |
The difference between book-basis and tax-basis unrealized appreciation (depreciation) is attributable primarily to the tax deferral of losses on wash sales and return of capital dividends received.
Loss deferrals represent certain qualified losses that the fund has elected to treat as having been incurred in the following fiscal year for federal income tax purposes.
|
| | | | | | | | | | | | | | |
| For a Share Outstanding Throughout the Years Ended October 31 (except as noted) |
| Per-Share Data | | | | | | Ratios and Supplemental Data |
| | | Income From Investment Operations: | | | Ratio to Average Net Assets of: | | |
| | Net Asset
Value,
Beginning
of Period | Net
Investment
Income
(Loss)(1) | Net
Realized
and
Unrealized
Gain (Loss) | Total From
Investment
Operations | Net Asset
Value,
End
of Period | Total
Return(2) | Operating
Expenses | Operating
Expenses
(before
expense
waiver) | Net
Investment
Income
(Loss) | Net
Investment
Income (Loss)
(before expense waiver) | Portfolio
Turnover
Rate | Net
Assets,
End of
Period
(in thousands) |
| Investor Class | | | | | | | | | | | |
| 2014 | $10.93 | (0.11) | 1.05 | 0.94 | $11.87 | 8.60% | 1.48% | 1.50% | (0.93)% | (0.95)% | 76% |
| $186,134 |
|
| 2013 | $8.13 | (0.06) | 2.86 | 2.80 | $10.93 | 34.44% | 1.50% | 1.50% | (0.62)% | (0.62)% | 79% |
| $190,490 |
|
| 2012 | $7.47 | (0.02) | 0.68 | 0.66 | $8.13 | 8.84% | 1.50% | 1.50% | (0.22)% | (0.22)% | 63% |
| $154,517 |
|
| 2011 | $6.86 | (0.07) | 0.68 | 0.61 | $7.47 | 8.89% | 1.50% | 1.50% | (0.95)% | (0.95)% | 107% |
| $158,117 |
|
| 2010 | $5.06 | (0.04) | 1.84 | 1.80 | $6.86 | 33.57% | 1.51% | 1.51% | (0.59)% | (0.59)% | 181% |
| $146,747 |
|
| Institutional Class | | | | | | | | | | | |
| 2014 | $11.01 | (0.08) | 1.05 | 0.97 | $11.98 | 8.81% | 1.28% | 1.30% | (0.73)% | (0.75)% | 76% |
| $49 |
|
| 2013 | $8.17 | (0.04) | 2.88 | 2.84 | $11.01 | 34.76% | 1.30% | 1.30% | (0.42)% | (0.42)% | 79% |
| $45 |
|
| 2012 | $7.49 | —(3) | 0.68 | 0.68 | $8.17 | 9.08% | 1.30% | 1.30% | (0.02)% | (0.02)% | 63% |
| $34 |
|
| 2011 | $6.87 | (0.06) | 0.68 | 0.62 | $7.49 | 9.02% | 1.30% | 1.30% | (0.75)% | (0.75)% | 107% |
| $31 |
|
2010(4) | $6.07 | (0.01) | 0.81 | 0.80 | $6.87 | 13.18% | 1.31%(5) | 1.31%(5) | (0.29)%(5) | (0.29)%(5) | 181%(6) |
| $28 |
|
| A Class | | | | | | | | | | | | |
| 2014 | $10.83 | (0.13) | 1.03 | 0.90 | $11.73 | 8.31% | 1.73% | 1.75% | (1.18)% | (1.20)% | 76% |
| $394 |
|
| 2013 | $8.08 | (0.08) | 2.83 | 2.75 | $10.83 | 34.03% | 1.75% | 1.75% | (0.87)% | (0.87)% | 79% |
| $322 |
|
| 2012 | $7.44 | (0.04) | 0.68 | 0.64 | $8.08 | 8.60% | 1.75% | 1.75% | (0.47)% | (0.47)% | 63% |
| $239 |
|
| 2011 | $6.85 | (0.09) | 0.68 | 0.59 | $7.44 | 8.61% | 1.75% | 1.75% | (1.20)% | (1.20)% | 107% |
| $282 |
|
2010(4) | $6.07 | (0.03) | 0.81 | 0.78 | $6.85 | 12.85% | 1.76%(5) | 1.76%(5) | (0.67)%(5) | (0.67)%(5) | 181%(6) |
| $121 |
|
|
| | | | | | | | | | | | | | |
| For a Share Outstanding Throughout the Years Ended October 31 (except as noted) |
| Per-Share Data | | | | | | Ratios and Supplemental Data |
| | | Income From Investment Operations: | | | Ratio to Average Net Assets of: | | |
| | Net Asset
Value,
Beginning
of Period | Net
Investment
Income
(Loss)(1) | Net
Realized
and
Unrealized
Gain (Loss) | Total From
Investment
Operations | Net Asset
Value,
End
of Period | Total
Return(2) | Operating
Expenses | Operating
Expenses
(before
expense
waiver) | Net
Investment
Income
(Loss) | Net
Investment
Income (Loss)
(before expense waiver) | Portfolio
Turnover
Rate | Net
Assets,
End of
Period
(in thousands) |
| C Class | | | | | | | | | | | | |
| 2014 | $10.53 | (0.21) | 1.01 | 0.80 | $11.33 | 7.50% | 2.48% | 2.50% | (1.93)% | (1.95)% | 76% |
| $75 |
|
| 2013 | $7.91 | (0.15) | 2.77 | 2.62 | $10.53 | 33.12% | 2.50% | 2.50% | (1.62)% | (1.62)% | 79% |
| $117 |
|
| 2012 | $7.34 | (0.09) | 0.66 | 0.57 | $7.91 | 7.77% | 2.50% | 2.50% | (1.22)% | (1.22)% | 63% |
| $80 |
|
| 2011 | $6.81 | (0.15) | 0.68 | 0.53 | $7.34 | 7.78% | 2.50% | 2.50% | (1.95)% | (1.95)% | 107% |
| $57 |
|
2010(4) | $6.07 | (0.06) | 0.80 | 0.74 | $6.81 | 12.19% | 2.51%(5) | 2.51%(5) | (1.46)%(5) | (1.46)%(5) | 181%(6) |
| $40 |
|
| R Class | | | | | | | | | | | |
| 2014 | $10.73 | (0.16) | 1.02 | 0.86 | $11.59 | 8.12% | 1.98% | 2.00% | (1.43)% | (1.45)% | 76% |
| $108 |
|
| 2013 | $8.02 | (0.11) | 2.82 | 2.71 | $10.73 | 33.67% | 2.00% | 2.00% | (1.12)% | (1.12)% | 79% |
| $93 |
|
| 2012 | $7.40 | (0.06) | 0.68 | 0.62 | $8.02 | 8.38% | 2.00% | 2.00% | (0.72)% | (0.72)% | 63% |
| $62 |
|
| 2011 | $6.84 | (0.11) | 0.67 | 0.56 | $7.40 | 8.19% | 2.00% | 2.00% | (1.45)% | (1.45)% | 107% |
| $48 |
|
2010(4) | $6.07 | (0.04) | 0.81 | 0.77 | $6.84 | 12.69% | 2.01%(5) | 2.01%(5) | (0.99)%(5) | (0.99)%(5) | 181%(6) |
| $29 |
|
|
|
| Notes to Financial Highlights |
| |
| (1) | Computed using average shares outstanding throughout the period. |
| |
| (2) | Total returns are calculated based on the net asset value of the last business day and do not reflect applicable sales charges, if any. Total returns for periods less than one year are not annualized. |
| |
| (3) | Per-share amount was less than $0.005. |
| |
| (4) | March 1, 2010 (commencement of sale) through October 31, 2010. |
| |
| (6) | Portfolio turnover is calculated at the fund level. Percentage indicated was calculated for the year ended October 31, 2010. |
See Notes to Financial Statements.
|
|
| Report of Independent Registered Public Accounting Firm |
To the Board of Directors and Shareholders of
American Century Mutual Funds, Inc.:
We have audited the accompanying statement of assets and liabilities, including the schedule of investments, of New Opportunities Fund (the “Fund”), one of the funds constituting American Century Mutual Funds, Inc., as of October 31, 2014, and the related statement of operations for the year then ended, the statements of changes in net assets for each of the two years in the period then ended, and the financial highlights for each of the periods presented. These financial statements and financial highlights are the responsibility of the Fund's management. Our responsibility is to express an opinion on these financial statements and financial highlights based on our audits.
We conducted our audits in accordance with the standards of the Public Company Accounting Oversight Board (United States). Those standards require that we plan and perform the audit to obtain reasonable assurance about whether the financial statements and financial highlights are free of material misstatement. The Fund is not required to have, nor were we engaged to perform, an audit of its internal control over financial reporting. Our audits included consideration of internal control over financial reporting as a basis for designing audit procedures that are appropriate in the circumstances, but not for the purpose of expressing an opinion on the effectiveness of the Fund's internal control over financial reporting. Accordingly, we express no such opinion. An audit also includes examining, on a test basis, evidence supporting the amounts and disclosures in the financial statements, assessing the accounting principles used and significant estimates made by management, as well as evaluating the overall financial statement presentation. Our procedures included confirmation of securities owned as of October 31, 2014, by correspondence with the custodian and brokers; where replies were not received from brokers, we performed other auditing procedures. We believe that our audits provide a reasonable basis for our opinion.
In our opinion, the financial statements and financial highlights referred to above present fairly, in all material respects, the financial position of New Opportunities Fund of American Century Mutual Funds, Inc. as of October 31, 2014, the results of its operations for the year then ended, the changes in its net assets for each of the two years in the period then ended, and the financial highlights for each of the periods presented, in conformity with accounting principles generally accepted in the United States of America.
DELOITTE & TOUCHE LLP
Kansas City, Missouri
December 17, 2014
The Board of Directors
The individuals listed below serve as directors of the funds. Each director will continue to serve in this capacity until death, retirement, resignation or removal from office. The board has adopted a mandatory retirement age for directors who are not “interested persons,” as that term is defined in the Investment Company Act (independent directors). Independent directors shall retire by December 31 of the year in which they reach their 75th birthday.
Mr. Thomas is an “interested person” because he currently serves as President and Chief Executive Officer of American Century Companies, Inc. (ACC), the parent company of American Century Investment Management, Inc. (ACIM or the advisor). Mr. Fink is treated as an “interested person” because of his recent employment with ACC and American Century Services, LLC (ACS). The other directors (more than three-fourths of the total number) are independent. They are not employees, directors or officers of, and have no financial interest in, ACC or any of its wholly owned, direct or indirect, subsidiaries, including ACIM, American Century Investment Services, Inc. (ACIS) and ACS, and they do not have any other affiliations, positions, or relationships that would cause them to be considered “interested persons” under the Investment Company Act. The directors serve in this capacity for seven (in the case of Mr. Thomas, 15) registered investment companies in the American Century Investments family of funds.
The following table presents additional information about the directors. The mailing address for each director is 4500 Main Street, Kansas City, Missouri 64111.
|
| | | | | |
Name
(Year of Birth) | Position(s) Held with Funds | Length of Time Served | Principal Occupation(s) During Past 5 Years | Number of American Century Portfolios Overseen by Director | Other Directorships Held During Past
5 Years |
| Independent Directors | | | | |
Thomas A. Brown
(1940) | Director | Since 1980 | Managing Member, Associated Investments, LLC (real estate investment company); Brown Cascade Properties, LLC (real estate investment company) (2001 to 2009) | 73 | None |
Andrea C. Hall
(1945) | Director | Since 1997 | Retired | 73 | None |
Jan M. Lewis
(1957) | Director | Since 2011 | Retired; President and Chief Executive Officer, Catholic Charities of Northeast Kansas (human services organization) (2006 to 2013) | 73 | None |
James A. Olson
(1942) | Director and Chairman of the Board | Since 2007 (Chairman since 2014) | Member, Plaza Belmont LLC (private equity fund manager) | 73 | Saia, Inc. (2002 to 2012) and EPR Properties (2003 to 2013) |
|
| | | | | |
Name
(Year of Birth) | Position(s) Held with Funds | Length of Time Served | Principal Occupation(s) During Past 5 Years | Number of American Century Portfolios Overseen by Director | Other Directorships Held During Past
5 Years |
| Independent Directors | | | | |
M. Jeannine Strandjord
(1945) | Director | Since 1994 | Retired | 73 | Euronet Worldwide Inc.; Charming Shoppes, Inc. (2006 to 2010); and DST Systems Inc. (1996 to 2012) |
John R. Whitten
(1946) | Director | Since 2008 | Retired | 73 | Rudolph Technologies, Inc. |
Stephen E. Yates
(1948) | Director | Since 2012 | Retired; Executive Vice President, Technology & Operations, KeyCorp. (computer services) (2004 to 2010) | 73 | Applied Industrial Technologies, Inc. (2001 to 2010) |
| Interested Directors | | | | |
Barry Fink
(1955) | Director | Since 2012 | Retired; Executive Vice President, ACC (September 2007 to February 2013); President, ACS (October 2007 to February 2013); Chief Operating Officer, ACC (September 2007 to November 2012) | 73 | None |
Jonathan S. Thomas
(1963) | Director and President | Since 2007 | President and Chief Executive Officer, ACC (March 2007 to present). Also serves as Chief Executive Officer, ACS; Executive Vice President, ACIM; Director, ACC, ACIM and other ACC subsidiaries | 118 | BioMed Valley Discoveries, Inc. |
The Statement of Additional Information has additional information about the fund's directors and is available without charge, upon request, by calling 1-800-345-2021.
Officers
The following table presents certain information about the executive officers of the funds. Each officer serves as an officer for each of the 15 investment companies in the American Century family of funds, unless otherwise noted. No officer is compensated for his or her service as an officer of the funds. The listed officers are interested persons of the funds and are appointed or re-appointed on an annual basis. The mailing address for each officer listed below is 4500 Main Street, Kansas City, Missouri 64111.
|
| | |
Name (Year of Birth) | Offices with the Funds | Principal Occupation(s) During the Past Five Years |
Jonathan S.
Thomas
(1963) | Director and
President
since 2007 | President and Chief Executive Officer, ACC (March 2007 to present). Also serves as Chief Executive Officer, ACS; Executive Vice President, ACIM; Director, ACC, ACIM and other ACC subsidiaries |
Amy D. Shelton
(1964) | Chief Compliance
Officer since 2014 | Chief Compliance Officer, American Century funds, (March 2014 to present); Chief Compliance Officer, ACIM (February 2014 to present); Chief Compliance Officer, ACIS (October 2009 to present); Vice President, Client Interactions and Marketing, ACIS (February 2013 to January 2014); Director, Client Interactions and Marketing, ACIS (June 2007 to January 2013). Also serves as Vice President, ACIS |
Charles A.
Etherington
(1957) | General Counsel
since 2007 and
Senior Vice
President since 2006 | Attorney, ACC (February 1994 to present); Vice President, ACC (November 2005 to present); General Counsel, ACC (March 2007 to present). Also serves as General Counsel, ACIM, ACS, ACIS and other ACC subsidiaries; and Senior Vice President, ACIM and ACS |
C. Jean Wade
(1964) | Vice President,
Treasurer and
Chief Financial
Officer since 2012 | Vice President, ACS (February 2000 to present) |
Robert J.
Leach
(1966) | Vice President
since 2006 and
Assistant Treasurer
since 2012 | Vice President, ACS (February 2000 to present) |
David H.
Reinmiller
(1963) | Vice President
since 2000 | Attorney, ACC (January 1994 to present); Associate General Counsel, ACC (January 2001 to present). Also serves as Vice President, ACIM and ACS |
Ward D.
Stauffer
(1960) | Secretary
since 2005 | Attorney, ACC (June 2003 to present) |
|
|
| Approval of Management Agreement |
At a meeting held on June 18, 2014, the Fund’s Board of Directors unanimously approved the renewal of the management agreement pursuant to which American Century Investment Management, Inc. (the “Advisor”) acts as the investment advisor for the Fund. Under Section 15(c) of the Investment Company Act, contracts for investment advisory services are required to be reviewed, evaluated, and approved by a majority of a fund’s directors (the “Directors”), including a majority of the independent Directors, each year.
Prior to its consideration of the renewal of the management agreement, the Board requested and reviewed extensive data and information compiled by the Advisor and certain independent providers of evaluation data concerning the Fund and the services provided to the Fund by the Advisor. This review was in addition to the oversight and evaluation undertaken by the Board and its committees on a continuous basis and the information received was supplemental to the extensive information that the Board and its committees receive and consider throughout the year.
In connection with its consideration of the renewal of the management agreement, the Board’s review and evaluation of the services provided by the Advisor included, but was not limited to, the following:
| |
| • | the nature, extent, and quality of investment management, shareholder services, and other services provided by the Advisor to the Fund; |
| |
| • | the wide range of other programs and services the Advisor provides to the Fund and its shareholders on a routine and non-routine basis; |
| |
| • | the Fund’s investment performance compared to appropriate benchmarks and/or a peer group of other mutual funds with similar investment objectives and strategies; |
| |
| • | the cost of owning the Fund compared to the cost of owning similar funds; |
| |
| • | the Advisor’s compliance policies, procedures, and regulatory experience; |
| |
| • | financial data showing the cost of services provided to the Fund, the profitability of the Fund to the Advisor, and the overall profitability of the Advisor; |
| |
| • | possible economies of scale associated with the Advisor’s management of the Fund and other accounts under its management; |
| |
| • | the services provided and charges to other investment management clients of the Advisor; |
| |
| • | acquired fund fees and expenses; and |
| |
| • | any collateral benefits derived by the Advisor from the management of the Fund. |
In keeping with its practice, the Board held two in-person meetings and one telephonic meeting to review and discuss the information provided. The independent Directors also had the benefit of the advice of their independent counsel throughout the process.
Factors Considered
The Directors considered all of the information provided by the Advisor, the independent data providers, and independent counsel, and evaluated such information for the Fund. In connection with their review, the Directors did not identify any single factor as being all-important or controlling, and each Director may have attributed different levels of importance to different factors. In deciding to renew the management agreement, the Board based its decision on a number of factors, including the following:
Nature, Extent and Quality of Services — Generally. Under the management agreement, the Advisor is responsible for providing or arranging for all services necessary for the operation of the Fund. The Board noted that under the management agreement, the Advisor provides or arranges at its own expense a wide variety of services including:
| |
| • | constructing and designing the Fund |
| |
| • | portfolio research and security selection |
| |
| • | initial capitalization/funding |
| |
| • | daily valuation of the Fund’s portfolio |
| |
| • | shareholder servicing and transfer agency, including shareholder confirmations, recordkeeping, and communications |
| |
| • | legal services (except the independent Directors’ counsel) |
| |
| • | regulatory and portfolio compliance |
| |
| • | marketing and distribution (except Rule 12b-1 plans) |
The Board noted that many of these services have expanded over time both in terms of quantity and complexity in response to shareholder demands, competition in the industry, changing distribution channels, and the changing regulatory environment.
Investment Management Services. The nature of the investment management services provided to the Fund is quite complex and allows Fund shareholders access to professional money management, instant diversification of their investments within an asset class, the opportunity to easily diversify among asset classes by investing in or exchanging among various American Century Investments funds, and liquidity. In evaluating investment performance, the Board expects the Advisor to manage the Fund in accordance with its investment objectives and approved strategies. Further, the Directors recognize that the Advisor has an obligation to monitor trading activities, and in particular to seek the best execution of fund trades, and to evaluate the use of and payment for research. In providing these services, the Advisor utilizes teams of investment professionals (portfolio managers, analysts, research assistants, and securities traders) who require extensive information technology, research, training, compliance and other systems to conduct their business. The Board, directly and through its Fund Performance Review Committee, regularly reviews investment performance information for the Fund, together with comparative information for appropriate benchmarks and/or peer groups of similarly-managed funds, over different time horizons. The Directors also review detailed performance information during the management agreement approval process. If performance concerns are identified, the Fund receives special reviews until performance improves, during which the Board discusses with the Advisor the reasons for such results (e.g., market conditions, security selection) and any efforts being undertaken to improve performance. The Fund’s performance was above its benchmark for the ten-year period and below its benchmark for the one-, three-, and five-year periods reviewed by the Board. The Board discussed the Fund’s performance with the Advisor and was satisfied with the efforts being undertaken by the Advisor. The Board found the investment management services provided by the Advisor to the Fund to be satisfactory and consistent with the management agreement.
Shareholder and Other Services. Under the management agreement, the Advisor provides the Fund with a comprehensive package of transfer agency, shareholder, and other services. The Board, directly and through various committees of the Board, regularly reviews reports and evaluations of such services at its regular meetings. These reports include, but are not limited to, information regarding the operational efficiency and accuracy of the shareholder and transfer agency services provided, staffing levels, shareholder satisfaction (as measured by external as well as internal sources), technology support, new products and services offered to Fund shareholders, securities trading activities, portfolio valuation services, auditing services, and legal and operational compliance activities. Certain aspects of shareholder and transfer agency service level efficiency
and the quality of securities trading activities are measured by independent third party providers and are presented in comparison to other fund groups not managed by the Advisor. The Board found the services provided by the Advisor to the Fund under the management agreement to be competitive and of high quality.
Costs of Services and Profitability. The Advisor provides detailed information concerning its cost of providing various services to the Fund, its profitability in managing the Fund (pre- and post-distribution), its overall profitability, and its financial condition. The Directors have reviewed with the Advisor the methodology used to prepare this financial information. The financial information regarding the Advisor is considered in evaluating the Advisor’s financial condition, its ability to continue to provide services under the management agreement, and the reasonableness of the current management fee. The Board concluded that the Advisor’s profits were reasonable in light of the services provided to the Fund.
Ethics. The Board generally considers the Advisor’s commitment to providing quality services to shareholders and to conducting its business ethically. They noted that the Advisor’s practices generally meet or exceed industry best practices.
Economies of Scale. The Board also reviewed information provided by the Advisor regarding the possible existence of economies of scale in connection with the management of the Fund. The Board concluded that economies of scale are difficult to measure and predict with precision, especially on a fund-by-fund basis. The Board concluded that the Advisor is appropriately sharing economies of scale through its competitive fee structure, offering competitive fees from fund inception, and through reinvestment in its business to provide shareholders additional content and services.
Comparison to Other Funds’ Fees. The management agreement provides that the Fund pays the Advisor a single, all-inclusive (or unified) management fee for providing all services necessary for the management and operation of the Fund, other than brokerage expenses, taxes, interest, extraordinary expenses, and the fees and expenses of the Fund’s independent directors (including their independent legal counsel) and expenses incurred in connection with the provision of shareholder services and distribution services under a plan adopted pursuant to Rule 12b-1 under the 1940 Act. Under the unified fee structure, the Advisor is responsible for providing all investment advisory, custody, audit, administrative, compliance, recordkeeping, marketing and shareholder services, or arranging and supervising third parties to provide such services. By contrast, most other funds are charged a variety of fees, including an investment advisory fee, a transfer agency fee, an administrative fee, distribution charges and other expenses. Other than their investment advisory fees and any applicable Rule 12b-1 distribution fees, all other components of the total fees charged by these other funds may be increased without shareholder approval. The Board believes the unified fee structure is a benefit to Fund shareholders because it clearly discloses to shareholders the cost of owning Fund shares, and, since the unified fee cannot be increased without a vote of Fund shareholders, it shifts to the Advisor the risk of increased costs of operating the Fund and provides a direct incentive to minimize administrative inefficiencies. Part of the Board’s analysis of fee levels involves reviewing certain evaluative data compiled by an independent provider comparing the Fund’s unified fee to the total expense ratios of its peers. The unified fee charged to shareholders of the Fund was above the median of the total expense ratios of the Fund’s peer expense universe and was within the range of its peer expense group. The Board and the Advisor agreed to a one year reduction of the Fund’s annual unified management fee of 0.10% (e.g., the Investor Class unified fee will be reduced from 1.50% to 1.40%) beginning August 1, 2014. The Board concluded that the management fee paid by the Fund to the Advisor under the management agreement is reasonable in light of the services provided to the Fund.
Comparison to Fees and Services Provided to Other Clients of the Advisor. The Board also requested and received information from the Advisor concerning the nature of the services, fees, costs and profitability of its advisory services to advisory clients other than the Fund. They observed that these varying types of client accounts require different services and involve different regulatory and entrepreneurial risks than the management of the Fund. The Board analyzed this information and concluded that the fees charged and services provided to the Fund were reasonable by comparison.
Collateral or “Fall-Out” Benefits Derived by the Advisor. The Board considered the existence of collateral benefits the Advisor may receive as a result of its relationship with the Fund. They concluded that the Advisor’s primary business is managing mutual funds and it generally does not use fund or shareholder information to generate profits in other lines of business, and therefore does not derive any significant collateral benefits from them. The Board noted that the Advisor receives proprietary research from broker-dealers that execute fund portfolio transactions and concluded that this research is likely to benefit Fund shareholders. The Board also determined that the Advisor is able to provide investment management services to certain clients other than the Fund, at least in part, due to its existing infrastructure built to serve the fund complex. The Board concluded, however, that the assets of those other clients are not material to the analysis and, where applicable, may be included with the assets of the Fund to determine breakpoints in the management fee schedule.
Existing Relationship. The Board also considered whether there was any reason for not continuing the existing arrangement with the Advisor. In this regard, the Board was mindful of the potential disruptions of the Fund’s operations and various risks, uncertainties, and other effects that could occur as a result of a decision not to continue such relationship. In particular, the Board recognized that most shareholders have invested in the Fund on the strength of the Advisor’s industry standing and reputation and in the expectation that the Advisor will have a continuing role in providing advisory services to the Fund.
Conclusion of the Directors. As a result of this process, the Board, including all of the independent Directors, taking into account all of the factors discussed above and the information provided by the Advisor and others, concluded that the management agreement between the Fund and the Advisor is fair and reasonable in light of the services provided and should be renewed.
Retirement Account Information
As required by law, distributions you receive from certain IRAs are subject to federal income tax withholding, unless you elect not to have withholding apply. Tax will be withheld on the total amount withdrawn even though you may be receiving amounts that are not subject to withholding, such as nondeductible contributions. In such case, excess amounts of withholding could occur. You may adjust your withholding election so that a greater or lesser amount will be withheld.
If you don’t want us to withhold on this amount, you must notify us to not withhold the federal income tax. You may notify us in writing or in certain situations by telephone or through other electronic means. For systematic withdrawals, your withholding election will remain in effect until revoked or changed by filing a new election. You have the right to revoke your election at any time.
Remember, even if you elect not to have income tax withheld, you are liable for paying income tax on the taxable portion of your withdrawal. If you elect not to have income tax withheld or you don’t have enough income tax withheld, you may be responsible for payment of estimated tax. You may incur penalties under the estimated tax rules if your withholding and estimated tax payments are not sufficient. You can reduce or defer the income tax on a distribution by directly or indirectly rolling such distribution over to another IRA or eligible plan. You should consult your tax advisor for additional information.
State tax will be withheld if, at the time of your distribution, your address is within one of the mandatory withholding states and you have federal income tax withheld (or as otherwise required by state law). State taxes will be withheld from your distribution in accordance with the respective state rules.
Distributions you receive from 403(b), 457 and qualified plans are subject to special tax and withholding rules. Your plan administrator or plan sponsor is required to provide you with a special tax notice explaining those rules at the time you request a distribution. If applicable, federal and/or state taxes may be withheld from your distribution amount.
Proxy Voting Policies
A description of the policies that the fund's investment advisor uses in exercising the voting rights associated with the securities purchased and/or held by the fund is available without charge, upon request, by calling 1-800-345-2021. It is also available on the "About Us" page of American Century Investments’ website at americancentury.com and on the Securities and Exchange Commission’s website at sec.gov. Information regarding how the investment advisor voted proxies relating to portfolio securities during the most recent 12-month period ended June 30 is available on the "About Us" page at americancentury.com. It is also available at sec.gov.
Quarterly Portfolio Disclosure
The fund files its complete schedule of portfolio holdings with the Securities and Exchange Commission (SEC) for the first and third quarters of each fiscal year on Form N-Q. The fund’s Forms N-Q are available on the SEC’s website at sec.gov, and may be reviewed and copied at the SEC’s Public Reference Room in Washington, DC. Information on the operation of the Public Reference Room may be obtained by calling 1-800-SEC-0330. The fund also makes its complete schedule of portfolio holdings for the most recent quarter of its fiscal year available on its
website at americancentury.com and, upon request, by calling 1-800-345-2021.
|
| | |
| |
| | | |
| Contact Us | americancentury.com | |
| Automated Information Line | 1-800-345-8765 | |
| Investor Services Representative | 1-800-345-2021 or 816-531-5575 | |
| Investors Using Advisors | 1-800-378-9878 | |
| Business, Not-For-Profit, Employer-Sponsored Retirement Plans | 1-800-345-3533 | |
| Banks and Trust Companies, Broker-Dealers, Financial Professionals, Insurance Companies | 1-800-345-6488 | |
| Telecommunications Relay Service for the Deaf | 711 | |
| | | |
| American Century Mutual Funds, Inc. | |
| | | |
Investment Advisor: American Century Investment Management, Inc. Kansas City, Missouri | |
| | | |
| This report and the statements it contains are submitted for the general information of our shareholders. The report is not authorized for distribution to prospective investors unless preceded or accompanied by an effective prospectus. | |
| | | |
©2014 American Century Proprietary Holdings, Inc. All rights reserved.
CL-ANN-84003 1412 | |
|
| |
| ANNUAL REPORT | OCTOBER 31, 2014 |
NT Growth Fund
|
| |
| President’s Letter | |
| Performance | |
| Portfolio Commentary | |
| Fund Characteristics | |
| Shareholder Fee Example | |
| Schedule of Investments | |
| Statement of Assets and Liabilities | |
| Statement of Operations | |
| Statement of Changes in Net Assets | |
| Notes to Financial Statements | |
| Financial Highlights | |
| Report of Independent Registered Public Accounting Firm | |
| Management | |
| Approval of Management Agreement | |
| Additional Information | |
Any opinions expressed in this report reflect those of the author as of the date of the report, and do not necessarily represent the opinions of American Century Investments® or any other person in the American Century Investments organization. Any such opinions are subject to change at any time based upon market or other conditions and American Century Investments disclaims any responsibility to update such opinions. These opinions may not be relied upon as investment advice and, because investment decisions made by American Century Investments funds are based on numerous factors, may not be relied upon as an indication of trading intent on behalf of any American Century Investments fund. Security examples are used for representational purposes only and are not intended as recommendations to purchase or sell securities. Performance information for comparative indices and securities is provided to American Century Investments by third party vendors. To the best of American Century Investments’ knowledge, such information is accurate at the time of printing.
|
| |
| Dear Investor:
Thank you for reviewing this annual report for the 12 months ended October 31, 2014. It provides investment performance and portfolio information for the reporting period, plus longer-term historical performance data.
Annual reports remain important vehicles for conveying information about fund returns, including market and economic factors that affected performance during the reporting period. For additional, updated investment and market insights, we encourage you to visit our website, americancentury.com. |
| Jonathan Thomas |
Favorable Fiscal Year for U.S. Stocks and Bonds
Mostly stimulative monetary policies by central banks and expectations of longer-term economic improvement, interspersed with concerns about nearer-term weaker-than-expected global economic data and geopolitical conflicts, helped drive financial market returns during the reporting period. We believe the combination of longer-term optimism about U.S. economic growth, low costs of capital, and continued central bank stimulus (even as the U.S. Federal Reserve’s latest monthly bond purchase program ended) helped persuade investors to seek risk and yield, which benefited U.S. stocks and bonds. The S&P 500 Index gained 17.27% during the 12 months. The 30-year U.S. Treasury bond was close behind, returning 15.44%, according to Barclays. U.S. real estate investment trusts (REITs), whose shares combine performance attributes of stocks and bonds, benefited from both—the MSCI U.S. REIT Index advanced 19.19%.
U.S. market benchmark returns generally outpaced their non-U.S. counterparts. The U.S. was perceived by investors as a relative bastion of growth, stability, and potentially attractive yields compared with most of the rest of the world, so capital flows generally favored U.S. assets. These capital flows, along with weaker-than-expected global growth, lower-than-expected global inflation, and falling commodity and energy prices, helped keep long-term interest rates and other corporate costs low. U.S. stocks just completed a solid third-quarter earnings reporting season, though questions remain about next year’s revenues, given this year’s slowdown in global economic growth and concerns about how far it could extend into 2015.
We believe continuing global economic and geopolitical uncertainties could continue to support the relative appeal of U.S. assets in coming months. But the end of the U.S. Federal Reserve’s monthly bond-buying program and the still-looming possibility of higher interest rates in 2015 point to potential U.S. market volatility ahead. In this environment, we continue to believe in a disciplined, diversified, long-term investment approach, using professionally managed stock and bond portfolios for meeting financial goals. We appreciate your continued trust in us.
Sincerely,
Jonathan Thomas
President and Chief Executive Officer
American Century Investments
|
| | | | | |
| Total Returns as of October 31, 2014 | |
| | | | Average Annual Returns | |
| | Ticker Symbol | 1 year | 5 years | Since Inception | Inception Date |
| Institutional Class | ACLTX | 14.17% | 15.41% | 8.73% | 5/12/06 |
| Russell 1000 Growth Index | — | 17.11% | 17.42% | 9.00% | — |
| R6 Class | ACDTX | 14.27% | — | 17.48% | 7/26/13 |
|
|
| Growth of $10,000 Over Life of Class |
| $10,000 investment made May 12, 2006 |
| Performance for other share classes will vary due to differences in fee structure. |
|
| |
| Value on October 31, 2014 |
| | Institutional Class — $20,323 |
| |
| | Russell 1000 Growth Index — $20,765 |
| |
*From May 12, 2006, the Institutional Class’s inception date. Not annualized.
|
| |
| Total Annual Fund Operating Expenses |
| Institutional Class | R6 Class |
| 0.77% | 0.62% |
The total annual fund operating expenses shown is as stated in the fund’s prospectus current as of the date of this report. The prospectus may vary from the expense ratio shown elsewhere in this report because it is based on a different time period, includes acquired fund fees and expenses, and, if applicable, does not include fee waivers or expense reimbursements.
Data presented reflect past performance. Past performance is no guarantee of future results. Current performance may be higher or lower than the performance shown. Investment return and principal value will fluctuate, and redemption value may be more or less than original cost. Data assumes reinvestment of dividends and capital gains, and none of the charts reflect the deduction of taxes that a shareholder would pay on fund distributions or the redemption of fund shares. To obtain performance data current to the most recent month end, please call 1-800-345-2021 or visit americancentury.com. For additional information about the fund, please consult the prospectus.
Portfolio Managers: Greg Woodhams and Prescott LeGard
Performance Summary
NT Growth returned 14.17%* in the 12 months ended October 31, 2014, compared with the 17.11% return of its benchmark, the Russell 1000 Growth Index.
Information technology stocks contributed most to absolute returns. Energy was the only sector to detract from performance in absolute terms. Relative to the benchmark, the health care and energy sectors were the leading detractors, driven by stock selection decisions. Materials and consumer staples stocks contributed most to relative results.
Health Care Detracted Most
Positioning in the health care sector detracted most from performance relative to the Russell 1000 Growth Index. Stock choices meant the pharmaceutical industry underperformed, led by a stake in Bristol-Myers Squibb. We eliminated the position. An underweight position and stock selection decisions in the biotechnology industry also weighed on performance. It hurt to be underrepresented in shares of Amgen, a position we eliminated. We were also underrepresented in Gilead Sciences, though we increased our stake in Gilead later in the period.
Other Notable Detractors
Stock selection detracted from relative results in the energy sector. Positioning among oil, gas, and consumable fuels companies hurt most. North American energy exploration and production firms Noble Energy and Concho Resources suffered temporarily from a slowdown in takeaway capacity, while EOG Resources lagged as energy prices softened. We sold our stakes in Noble and EOG.
One of the leading individual detractors for the fiscal year was electronics retailer Best Buy. The company made progress on its turnaround in 2013, but reported much weaker-than-expected holiday sales amid a promotional sales environment that failed to drive higher industry demand. The promotions hit both the top line and margins, causing the company to miss earnings and lower future guidance. We eliminated the position.
Computers and peripherals giant Apple was a notable detractor from performance compared with the benchmark. The stock is a sizable holding, but we nevertheless have relatively less exposure than the index, believing it is difficult for Apple to continue to rapidly improve earnings; however, the stock did well as a result of excitement around new product launches. An underweight position in software giant Microsoft detracted from relative results. The company lowered guidance, consistent with our less sanguine outlook for the business and we sold the stock. Nevertheless, the stock benefited from price-to-earnings multiple expansion, excitement around moving Office 365 to a subscription model, and the announcement of the Windows 10 operating system.
| |
| * | All fund returns referenced in this commentary are for Institutional Class shares. Performance for other share classes will vary due to differences in fee structure; when Institutional Class performance exceeds that of the fund's benchmark, other share classes may not. See page 3 for returns for all share classes. |
Materials and Staples Helped Most
An underweight position and stock selection decisions made materials stocks the leading contributors to relative results. Chemicals companies contributed most to outperformance thanks to an underweight position and stock choices. Stock selection also drove outperformance in the consumer staples sector. Positioning among beverages and food products companies helped most. Notable contributors in the materials sector were LyondellBasell Industries and The Dow Chemical Company, and Mead Johnson Nutrition in the staples sector. We ultimately sold our stakes in Dow and LyondellBasell.
Significant Individual Contributors
The largest contribution to relative performance came from a stake in hotelier Marriott International, which enjoyed solid profit growth as room capacity and rates are attractive after years of little or no room growth in the industry. It was also beneficial to have no exposure to technology firm International Business Machines and to be underrepresented in shares of internet retailer Amazon.com. We eliminated Amazon earlier in 2014 as the company saw capital expenditures rise and margins fall.
Biotech stock Alexion Pharmaceuticals gained on a very strong earnings report and investor enthusiasm for the company’s revised tax structure, which should lead to lower tax rates (and more profits) going forward. Rail transportation company Union Pacific was another notable contributor to relative return. Because new sources of crude oil often don’t have a pipeline infrastructure to the coasts, rail has emerged as a necessary means of crude transport. Additionally, railroads are seeing sharp increases in volumes of sand used in hydraulic fracturing. Software maker Electronic Arts benefited from continued margin expansion, and better-than-expected sales of new games.
Current Positioning
In our opinion, stock selection—rather than sector allocation or market timing via the use of cash—is the most efficient means of generating superior risk-adjusted returns. As a result of this approach, the portfolio’s sector and industry selection as well as capitalization range allocations are primarily a result of identifying what we believe to be superior individual securities.
As of October 31, 2014, the health care sector was the portfolio’s largest overweight position relative to the benchmark. We favored health care equipment and supplies and pharmaceuticals companies. Medical device companies should see a better environment from higher utilization rates in the U.S., as well as getting the medical device tax. Device pipelines, however, are not universally robust, so security selection in this space is crucial to differentiate among market participants. At the other end of the spectrum, the underweight position in the materials sector is attributable in part to our decision to eliminate the fund’s stake in chemical firm Monsanto. We worried about the outlook for seed purchases given falling corn prices.
|
| |
| OCTOBER 31, 2014 | |
| Top Ten Holdings | % of net assets |
| PepsiCo, Inc. | 4.9% |
| Apple, Inc. | 4.8% |
| Visa, Inc., Class A | 3.9% |
| Comcast Corp., Class A | 3.2% |
| Boeing Co. (The) | 2.4% |
| Union Pacific Corp. | 2.2% |
| Facebook, Inc., Class A | 2.2% |
| Lockheed Martin Corp. | 2.2% |
| CVS Health Corp. | 2.1% |
| Gilead Sciences, Inc. | 2.1% |
| | |
| Top Five Industries | % of net assets |
| Internet Software and Services | 7.5% |
| Biotechnology | 6.5% |
| Aerospace and Defense | 6.5% |
| IT Services | 6.4% |
| Media | 6.3% |
| | |
| Types of Investments in Portfolio | % of net assets |
| Common Stocks | 99.8% |
| Exchange-Traded Funds | 0.3% |
| Total Equity Exposure | 100.1% |
| Temporary Cash Investments | 0.4% |
| Other Assets and Liabilities | (0.5)% |
Fund shareholders may incur two types of costs: (1) transaction costs, including sales charges (loads) on purchase payments and redemption/exchange fees; and (2) ongoing costs, including management fees; distribution and service (12b-1) fees; and other fund expenses. This example is intended to help you understand your ongoing costs (in dollars) of investing in your fund and to compare these costs with the ongoing cost of investing in other mutual funds.
The example is based on an investment of $1,000 made at the beginning of the period and held for the entire period from May 1, 2014 to October 31, 2014.
Actual Expenses
The table provides information about actual account values and actual expenses for each class. You may use the information, together with the amount you invested, to estimate the expenses that you paid over the period. First, identify the share class you own. Then simply divide your account value by $1,000 (for example, an $8,600 account value divided by $1,000 = 8.6), then multiply the result by the number under the heading “Expenses Paid During Period” to estimate the expenses you paid on your account during this period.
If you hold Investor Class shares of any American Century Investments fund, or Institutional Class shares of the American Century Diversified Bond Fund, in an American Century Investments account (i.e., not a financial intermediary or retirement plan account), American Century Investments may charge you a $12.50 semiannual account maintenance fee if the value of those shares is less than $10,000. We will redeem shares automatically in one of your accounts to pay the $12.50 fee. In determining your total eligible investment amount, we will include your investments in all personal accounts (including American Century Investments Brokerage accounts) registered under your Social Security number. Personal accounts include individual accounts, joint accounts, UGMA/UTMA accounts, personal trusts, Coverdell Education Savings Accounts and IRAs (including traditional, Roth, Rollover, SEP-, SARSEP- and SIMPLE-IRAs), and certain other retirement accounts. If you have only business, business retirement, employer-sponsored or American Century Investments Brokerage accounts, you are currently not subject to this fee. If you are subject to the Account Maintenance Fee, your account value could be reduced by the fee amount.
Hypothetical Example for Comparison Purposes
The table also provides information about hypothetical account values and hypothetical expenses based on the actual expense ratio of each class of your fund and an assumed rate of return of 5% per year before expenses, which is not the actual return of a fund’s share class. The hypothetical account values and expenses may not be used to estimate the actual ending account balance or expenses you paid for the period. You may use this information to compare the ongoing costs of investing in your fund and other funds. To do so, compare this 5% hypothetical example with the 5% hypothetical examples that appear in the shareholder reports of the other funds.
Please note that the expenses shown in the table are meant to highlight your ongoing costs only and do not reflect any transactional costs, such as sales charges (loads) or redemption/exchange fees. Therefore, the table is useful in comparing ongoing costs only, and will not help you determine the relative total costs of owning different funds. In addition, if these transactional costs were included, your costs would have been higher.
|
| | | | |
| Beginning
Account Value
5/1/14 | Ending
Account Value
10/31/14 | Expenses Paid
During Period(1)5/1/14 - 10/31/14 | Annualized
Expense Ratio(1) |
| Actual | | | | |
| Institutional Class | $1,000 | $1,075.40 | $4.03 | 0.77% |
| R6 Class | $1,000 | $1,076.10 | $3.24 | 0.62% |
| Hypothetical | | | | |
| Institutional Class | $1,000 | $1,021.32 | $3.92 | 0.77% |
| R6 Class | $1,000 | $1,022.08 | $3.16 | 0.62% |
| |
| (1) | Expenses are equal to the class's annualized expense ratio listed in the table above, multiplied by the average account value over the period, multiplied by 184, the number of days in the most recent fiscal half-year, divided by 365, to reflect the one-half year period. |
OCTOBER 31, 2014 |
| | | | | |
| | Shares | Value |
| COMMON STOCKS — 99.8% | | |
| Aerospace and Defense — 6.5% | | |
| Boeing Co. (The) | 248,748 |
| $ | 31,071,113 |
|
| Honeywell International, Inc. | 94,160 |
| 9,050,659 |
|
| Lockheed Martin Corp. | 145,439 |
| 27,716,310 |
|
| Precision Castparts Corp. | 27,491 |
| 6,067,264 |
|
| Raytheon Co. | 80,027 |
| 8,313,205 |
|
| | | 82,218,551 |
|
| Airlines — 0.8% | | |
| Alaska Air Group, Inc. | 187,111 |
| 9,959,919 |
|
| Automobiles — 0.6% | | |
| Harley-Davidson, Inc. | 119,158 |
| 7,828,681 |
|
| Banks — 2.8% | | |
| SunTrust Banks, Inc. | 390,381 |
| 15,279,513 |
|
| Wells Fargo & Co. | 374,691 |
| 19,892,345 |
|
| | | 35,171,858 |
|
| Beverages — 5.0% | | |
| Brown-Forman Corp., Class B | 12,714 |
| 1,178,206 |
|
| PepsiCo, Inc. | 652,434 |
| 62,744,578 |
|
| | | 63,922,784 |
|
| Biotechnology — 6.5% | | |
Alexion Pharmaceuticals, Inc.(1) | 109,940 |
| 21,038,118 |
|
Biogen Idec, Inc.(1) | 61,343 |
| 19,696,010 |
|
Gilead Sciences, Inc.(1) | 237,250 |
| 26,572,000 |
|
Incyte Corp.(1) | 99,195 |
| 6,652,017 |
|
Regeneron Pharmaceuticals, Inc.(1) | 21,329 |
| 8,397,654 |
|
| | | 82,355,799 |
|
| Capital Markets — 2.5% | | |
| Franklin Resources, Inc. | 235,339 |
| 13,087,202 |
|
| Invesco Ltd. | 450,541 |
| 18,233,394 |
|
| | | 31,320,596 |
|
| Chemicals — 1.7% | | |
| PPG Industries, Inc. | 59,196 |
| 12,057,633 |
|
| Sherwin-Williams Co. (The) | 42,364 |
| 9,725,080 |
|
| | | 21,782,713 |
|
| Commercial Services and Supplies — 0.9% | | |
| Tyco International Ltd. | 269,088 |
| 11,551,948 |
|
| Communications Equipment — 2.0% | | |
| QUALCOMM, Inc. | 319,050 |
| 25,048,616 |
|
| Electrical Equipment — 0.5% | | |
Generac Holdings, Inc.(1) | 150,900 |
| 6,841,806 |
|
| Energy Equipment and Services — 0.4% | | |
| Baker Hughes, Inc. | 89,056 |
| 4,716,406 |
|
|
| | | | | |
| | Shares | Value |
| Food and Staples Retailing — 2.1% | | |
| CVS Health Corp. | 317,585 |
| $ | 27,251,969 |
|
| Food Products — 1.8% | | |
| Hershey Co. (The) | 132,012 |
| 12,661,271 |
|
| Mead Johnson Nutrition Co. | 108,880 |
| 10,812,873 |
|
| | | 23,474,144 |
|
| Health Care Equipment and Supplies — 4.5% | | |
| C.R. Bard, Inc. | 107,062 |
| 17,554,956 |
|
| DENTSPLY International, Inc. | 199,424 |
| 10,124,757 |
|
DexCom, Inc.(1) | 17,507 |
| 786,940 |
|
Intuitive Surgical, Inc.(1) | 16,224 |
| 8,043,859 |
|
| Medtronic, Inc. | 217,269 |
| 14,809,055 |
|
Mettler-Toledo International, Inc.(1) | 20,943 |
| 5,413,137 |
|
| | | 56,732,704 |
|
| Health Care Providers and Services — 2.0% | | |
| Cardinal Health, Inc. | 163,757 |
| 12,851,650 |
|
Express Scripts Holding Co.(1) | 159,477 |
| 12,251,023 |
|
| | | 25,102,673 |
|
| Health Care Technology — 0.6% | | |
Cerner Corp.(1) | 110,689 |
| 7,011,041 |
|
| Hotels, Restaurants and Leisure — 2.1% | | |
Chipotle Mexican Grill, Inc.(1) | 10,697 |
| 6,824,686 |
|
| Marriott International, Inc., Class A | 268,798 |
| 20,361,449 |
|
| | | 27,186,135 |
|
| Household Products — 1.0% | | |
| Church & Dwight Co., Inc. | 169,736 |
| 12,290,584 |
|
| Internet and Catalog Retail — 2.5% | | |
| Expedia, Inc. | 198,401 |
| 16,858,133 |
|
Priceline Group, Inc. (The)(1) | 12,319 |
| 14,859,301 |
|
| | | 31,717,434 |
|
| Internet Software and Services — 7.5% | | |
eBay, Inc.(1) | 331,210 |
| 17,388,525 |
|
Facebook, Inc., Class A(1) | 379,766 |
| 28,478,652 |
|
Google, Inc., Class A(1) | 40,408 |
| 22,946,491 |
|
LinkedIn Corp., Class A(1) | 26,446 |
| 6,055,076 |
|
Pandora Media, Inc.(1) | 297,003 |
| 5,726,218 |
|
VeriSign, Inc.(1) | 108,585 |
| 6,489,040 |
|
Yelp, Inc.(1) | 133,797 |
| 8,027,820 |
|
| | | 95,111,822 |
|
| IT Services — 6.4% | | |
Alliance Data Systems Corp.(1) | 52,167 |
| 14,781,519 |
|
Fiserv, Inc.(1) | 148,860 |
| 10,342,793 |
|
Teradata Corp.(1) | 146,123 |
| 6,183,925 |
|
| Visa, Inc., Class A | 205,595 |
| 49,636,801 |
|
| | | 80,945,038 |
|
|
| | | | | |
| | Shares | Value |
| Life Sciences Tools and Services — 0.8% | | |
Illumina, Inc.(1) | 14,993 |
| $ | 2,887,352 |
|
Waters Corp.(1) | 66,164 |
| 7,330,971 |
|
| | | 10,218,323 |
|
| Machinery — 3.4% | | |
| Caterpillar, Inc. | 128,815 |
| 13,063,129 |
|
| Parker-Hannifin Corp. | 114,785 |
| 14,581,138 |
|
WABCO Holdings, Inc.(1) | 80,958 |
| 7,883,690 |
|
| Wabtec Corp. | 95,362 |
| 8,229,741 |
|
| | | 43,757,698 |
|
| Media — 6.3% | | |
| Comcast Corp., Class A | 736,961 |
| 40,790,792 |
|
| Scripps Networks Interactive, Inc., Class A | 79,795 |
| 6,163,366 |
|
Sirius XM Holdings, Inc.(1) | 2,010,938 |
| 6,897,517 |
|
| Walt Disney Co. (The) | 286,798 |
| 26,207,601 |
|
| | | 80,059,276 |
|
| Multiline Retail — 1.1% | | |
| Macy's, Inc. | 240,737 |
| 13,919,413 |
|
| Oil, Gas and Consumable Fuels — 4.3% | | |
Concho Resources, Inc.(1) | 69,554 |
| 7,583,473 |
|
| Exxon Mobil Corp. | 268,662 |
| 25,982,302 |
|
| Occidental Petroleum Corp. | 63,495 |
| 5,646,610 |
|
| Phillips 66 | 189,729 |
| 14,893,726 |
|
| | | 54,106,111 |
|
| Personal Products — 0.9% | | |
| Estee Lauder Cos., Inc. (The), Class A | 153,891 |
| 11,569,525 |
|
| Pharmaceuticals — 2.8% | | |
| Johnson & Johnson | 154,374 |
| 16,638,430 |
|
| Teva Pharmaceutical Industries Ltd. ADR | 230,210 |
| 12,999,958 |
|
| Zoetis, Inc. | 166,263 |
| 6,178,333 |
|
| | | 35,816,721 |
|
| Road and Rail — 2.2% | | |
| Union Pacific Corp. | 245,431 |
| 28,580,440 |
|
| Semiconductors and Semiconductor Equipment — 0.9% | | |
| Broadcom Corp., Class A | 166,148 |
| 6,958,278 |
|
| Xilinx, Inc. | 108,513 |
| 4,826,658 |
|
| | | 11,784,936 |
|
| Software — 4.7% | | |
Electronic Arts, Inc.(1) | 201,440 |
| 8,252,997 |
|
| Intuit, Inc. | 196,373 |
| 17,282,788 |
|
NetSuite, Inc.(1) | 75,920 |
| 8,249,467 |
|
| Oracle Corp. | 485,705 |
| 18,966,780 |
|
Splunk, Inc.(1) | 105,677 |
| 6,983,136 |
|
Varonis Systems, Inc.(1) | 5,292 |
| 103,088 |
|
| | | 59,838,256 |
|
|
| | | | | |
| | Shares | Value |
| Specialty Retail — 5.4% | | |
AutoZone, Inc.(1) | 32,173 |
| $ | 17,808,399 |
|
Bed Bath & Beyond, Inc.(1) | 193,565 |
| 13,034,667 |
|
| Gap, Inc. (The) | 250,167 |
| 9,478,828 |
|
O'Reilly Automotive, Inc.(1) | 18,032 |
| 3,171,468 |
|
| Ross Stores, Inc. | 116,403 |
| 9,396,050 |
|
| TJX Cos., Inc. (The) | 242,397 |
| 15,348,578 |
|
| | | 68,237,990 |
|
| Technology Hardware, Storage and Peripherals — 4.8% | | |
| Apple, Inc. | 565,194 |
| 61,040,952 |
|
| Wireless Telecommunication Services — 1.5% | | |
SBA Communications Corp., Class A(1) | 173,642 |
| 19,505,206 |
|
TOTAL COMMON STOCKS (Cost $1,066,538,240) | | 1,267,978,068 |
|
| EXCHANGE-TRADED FUNDS — 0.3% | | |
iShares Russell 1000 Growth Index Fund (Cost $3,410,695) | 37,920 |
| 3,562,963 |
|
| TEMPORARY CASH INVESTMENTS — 0.4% | | |
| Repurchase Agreement, Bank of America Merrill Lynch, (collateralized by various U.S. Treasury obligations, 1.375% - 2.625%, 12/31/14 - 2/28/19, valued at $1,265,910), in a joint trading account at 0.07%, dated 10/31/14, due 11/3/14 (Delivery value $1,241,284) | | 1,241,277 |
|
| Repurchase Agreement, Credit Suisse First Boston, Inc., (collateralized by various U.S. Treasury obligations, 0.25%, 10/15/15, valued at $506,469), in a joint trading account at 0.04%, dated 10/31/14, due 11/3/14 (Delivery value $496,513) | | 496,511 |
|
| Repurchase Agreement, Goldman Sachs & Co., (collateralized by various U.S. Treasury obligations, 0.125%, 12/31/14, valued at $1,013,906), in a joint trading account at 0.03%, dated 10/31/14, due 11/3/14 (Delivery value $993,024) | | 993,022 |
|
| SSgA U.S. Government Money Market Fund, Class N | 2,730,304 |
| 2,730,304 |
|
TOTAL TEMPORARY CASH INVESTMENTS (Cost $5,461,114) | | 5,461,114 |
|
TOTAL INVESTMENT SECURITIES — 100.5% (Cost $1,075,410,049) | | 1,277,002,145 |
|
| OTHER ASSETS AND LIABILITIES — (0.5)% | | (5,981,557 | ) |
| TOTAL NET ASSETS — 100.0% | | $ | 1,271,020,588 |
|
|
| | |
| NOTES TO SCHEDULE OF INVESTMENTS |
| ADR | - | American Depositary Receipt |
See Notes to Financial Statements.
|
|
| Statement of Assets and Liabilities |
|
| | | |
| OCTOBER 31, 2014 | |
| Assets | |
| Investment securities, at value (cost of $1,075,410,049) | $ | 1,277,002,145 |
|
| Receivable for investments sold | 26,679,642 |
|
| Dividends and interest receivable | 310,890 |
|
| | 1,303,992,677 |
|
| | |
| Liabilities | |
| Payable for investments purchased | 28,413,916 |
|
| Payable for capital shares redeemed | 3,781,294 |
|
| Accrued management fees | 776,879 |
|
| | 32,972,089 |
|
| | |
| Net Assets | $ | 1,271,020,588 |
|
| | |
| Net Assets Consist of: | |
| Capital (par value and paid-in surplus) | $ | 886,375,465 |
|
| Undistributed net investment income | 4,316,340 |
|
| Undistributed net realized gain | 178,736,687 |
|
| Net unrealized appreciation | 201,592,096 |
|
| | $ | 1,271,020,588 |
|
|
| | | | | | |
| | Net Assets | Shares Outstanding | Net Asset Value Per Share |
| Institutional Class, $0.01 Par Value |
| $1,234,783,551 |
| 73,420,600 |
| $16.82 |
| R6 Class, $0.01 Par Value |
| $36,237,037 |
| 2,153,893 |
| $16.82 |
See Notes to Financial Statements.
|
| | | |
| YEAR ENDED OCTOBER 31, 2014 | |
| Investment Income (Loss) | |
| Income: | |
| Dividends (net of foreign taxes withheld of $31,981) | $ | 14,703,675 |
|
| Interest | 2,065 |
|
| | 14,705,740 |
|
| | |
| Expenses: | |
| Management fees | 8,790,904 |
|
| Directors' fees and expenses | 28,099 |
|
| Other expenses | 300 |
|
| | 8,819,303 |
|
| | |
| Net investment income (loss) | 5,886,437 |
|
| | |
| Realized and Unrealized Gain (Loss) | |
| Net realized gain (loss) on: | |
| Investment transactions | 190,022,869 |
|
| Futures contract transactions | 125,193 |
|
| Foreign currency transactions | 1,120 |
|
| | 190,149,182 |
|
| | |
| Change in net unrealized appreciation (depreciation) on: | |
| Investments | (42,726,130 | ) |
| Translation of assets and liabilities in foreign currencies | (1,072 | ) |
| | (42,727,202 | ) |
| | |
| Net realized and unrealized gain (loss) | 147,421,980 |
|
| | |
| Net Increase (Decrease) in Net Assets Resulting from Operations | $ | 153,308,417 |
|
See Notes to Financial Statements.
|
|
| Statement of Changes in Net Assets |
|
| | | | | | |
| YEARS ENDED OCTOBER 31, 2014 AND OCTOBER 31, 2013 |
| Increase (Decrease) in Net Assets | October 31, 2014 | October 31, 2013 |
| Operations | | |
| Net investment income (loss) | $ | 5,886,437 |
| $ | 7,019,981 |
|
| Net realized gain (loss) | 190,149,182 |
| 40,309,020 |
|
| Change in net unrealized appreciation (depreciation) | (42,727,202 | ) | 145,709,726 |
|
| Net increase (decrease) in net assets resulting from operations | 153,308,417 |
| 193,038,727 |
|
| | | |
| Distributions to Shareholders | | |
| From net investment income: | | |
| Institutional Class | (5,994,161 | ) | (5,233,236 | ) |
| R6 Class | (63,884 | ) | — |
|
| From net realized gains: | | |
| Institutional Class | (39,897,401 | ) | (21,042,732 | ) |
| R6 Class | (337,944 | ) | — |
|
| Decrease in net assets from distributions | (46,293,390 | ) | (26,275,968 | ) |
| | | |
| Capital Share Transactions | | |
| Net increase (decrease) in net assets from capital share transactions (Note 5) | 160,105,574 |
| 201,230,763 |
|
| | | |
| Net increase (decrease) in net assets | 267,120,601 |
| 367,993,522 |
|
| | | |
| Net Assets | | |
| Beginning of period | 1,003,899,987 |
| 635,906,465 |
|
| End of period | $ | 1,271,020,588 |
| $ | 1,003,899,987 |
|
| | | |
| Undistributed net investment income | $ | 4,316,340 |
| $ | 4,660,845 |
|
See Notes to Financial Statements.
|
|
| Notes to Financial Statements |
OCTOBER 31, 2014
1. Organization
American Century Mutual Funds, Inc. (the corporation) is registered under the Investment Company Act of 1940, as amended (the 1940 Act), as an open-end management investment company and is organized as a Maryland corporation. NT Growth Fund (the fund) is one fund in a series issued by the corporation. The fund is diversified as defined under the 1940 Act. The fund's investment objective is to seek long-term capital growth. The fund is not permitted to invest in securities issued by companies assigned the Global Industry Classification Standard for the tobacco industry.
The fund offers the Institutional Class and the R6 Class, which have different fees and expenses. The difference in the fee structures between the classes is not the result of any difference in advisory or custodial fees or other expenses related to management of the fund’s assets, which do not vary by class. The fund’s R6 Class shares are available for purchase exclusively by certain American Century Investments funds of funds that are offered only through employer-sponsored retirement plans where a financial intermediary provides retirement recordkeeping services to plan participants. Because financial intermediaries do not receive any service, distribution or administrative fees for offering such funds of funds, American Century Investment Management, Inc. (ACIM) (the investment advisor) is able to charge the R6 Class a lower unified management fee. Sale of the R6 Class commenced on July 26, 2013.
2. Significant Accounting Policies
The following is a summary of significant accounting policies consistently followed by the fund in preparation of its financial statements. The fund is an investment company and follows accounting and reporting guidance in accordance with accounting principles generally accepted in the United States of America. This may require management to make certain estimates and assumptions at the date of the financial statements. Actual results could differ from these estimates. Management evaluated the impact of events or transactions occurring through the date the financial statements were issued that would merit recognition or disclosure.
Investment Valuations — The fund determines the fair value of its investments and computes its net asset value per share at the close of regular trading (usually 4 p.m. Eastern time) on the New York Stock Exchange (NYSE) on each day the NYSE is open. The Board of Directors has adopted valuation policies and procedures to guide the investment advisor in the fund’s investment valuation process and to provide methodologies for the oversight of the fund’s pricing function.
Equity securities that are listed or traded on a domestic securities exchange are valued at the last reported sales price or at the official closing price as provided by the exchange. Equity securities traded on foreign securities exchanges are generally valued at the closing price of such securities on the exchange where primarily traded or at the close of the NYSE, if that is earlier. If no last sales price is reported, or if local convention or regulation so provides, the mean of the latest bid and asked prices may be used. Securities traded over-the-counter are valued at the mean of the latest bid and asked prices, the last sales price, or the official closing price. Equity securities initially expressed in local currencies are translated into U.S. dollars at the mean of the appropriate currency exchange rate at the close of the NYSE as provided by an independent pricing service.
Fixed income securities maturing within 60 days at the time of purchase may be valued at cost, plus or minus any amortized discount or premium or at the evaluated mean as provided by an independent pricing service. Evaluated mean prices are commonly derived through utilization of market models, which may consider, among other factors: trade data, quotations from dealers and active market makers, relevant yield curve and spread data, related sector levels, creditworthiness, trade data or market information on comparable securities, and other relevant security specific information.
Open-end management investment companies are valued at the reported net asset value per share. Repurchase agreements are valued at cost, which approximates fair value. Exchange-traded futures contracts are valued at the settlement price as provided by the appropriate clearing corporation.
If the fund determines that the market price for an investment is not readily available or the valuation methods mentioned above do not reflect an investment’s fair value, such investment is valued as determined in good faith by the Board of Directors or its delegate, in accordance with policies and procedures adopted by the Board of Directors. In its determination of fair value, the fund may review several factors including, but not limited to, market information regarding the specific investment or comparable investments and correlation with other investment types, futures indices or general market indicators. Circumstances that may cause the fund to use these procedures to value an investment include, but are not limited to: an investment has been declared in default or is distressed; trading in a security has been suspended during the trading day or a security is not actively trading on its principal exchange; prices received from a regular pricing source are deemed unreliable; or there is a foreign market holiday and no trading occurred.
The fund monitors for significant events occurring after the close of an investment’s primary exchange but before the fund’s net asset value per share is determined. Significant events may include, but are not limited to: corporate announcements and transactions; governmental action and political unrest that could impact a specific investment or an investment sector; or armed conflicts, natural disasters and similar events that could affect investments in a specific country or region. The fund also monitors for significant fluctuations between domestic and foreign markets, as evidenced by the U.S. market or such other indicators that the Board of Directors, or its delegate, deems appropriate. If significant fluctuations in foreign markets are identified, the fund may apply a model-derived factor to the closing price of equity securities traded on foreign securities exchanges. The factor is based on observable market data as provided by an independent pricing service.
Security Transactions — Security transactions are accounted for as of the trade date. Net realized gains and losses are determined on the identified cost basis, which is also used for federal income tax purposes.
Investment Income — Dividend income less foreign taxes withheld, if any, is recorded as of the ex-dividend date. Distributions received on securities that represent a return of capital or long-term capital gain are recorded as a reduction of cost of investments and/or as a realized gain. The fund may estimate the components of distributions received that may be considered nontaxable distributions or long-term capital gain distributions for income tax purposes. Interest income is recorded on the accrual basis and includes accretion of discounts and amortization of premiums.
Foreign Currency Translations — All assets and liabilities initially expressed in foreign currencies are translated into U.S. dollars at prevailing exchange rates at period end. The fund may enter into spot foreign currency exchange contracts to facilitate transactions denominated in a foreign currency. Purchases and sales of investment securities, dividend and interest income, spot foreign currency exchange contracts, and expenses are translated at the rates of exchange prevailing on the respective dates of such transactions. Net realized and unrealized foreign currency exchange gains or losses related to investment securities are a component of net realized gain (loss) on investment transactions and change in net unrealized appreciation (depreciation) on investments, respectively.
Repurchase Agreements — The fund may enter into repurchase agreements with institutions that ACIM has determined are creditworthy pursuant to criteria adopted by the Board of Directors. The fund requires that the collateral, represented by securities, received in a repurchase transaction be transferred to the custodian in a manner sufficient to enable the fund to obtain those securities in the event of a default under the repurchase agreement. ACIM monitors, on a daily basis, the securities transferred to ensure the value, including accrued interest, of the securities under each repurchase agreement is equal to or greater than amounts owed to the fund under each repurchase agreement.
Joint Trading Account — Pursuant to an Exemptive Order issued by the Securities and Exchange Commission, the fund, along with certain other funds in the American Century Investments family of funds, may transfer uninvested cash balances into a joint trading account. These balances are invested in one or more repurchase agreements that are collateralized by U.S. Treasury or Agency obligations.
Segregated Assets — In accordance with the 1940 Act, the fund segregates assets on its books and records to cover futures contracts. ACIM monitors, on a daily basis, the securities segregated to ensure the fund designates a sufficient amount of liquid assets, marked-to-market daily. The fund may also receive assets or be required to pledge assets at the custodian bank or with a broker for margin requirements on futures contracts.
Income Tax Status — It is the fund’s policy to distribute substantially all net investment income and net realized gains to shareholders and to otherwise qualify as a regulated investment company under provisions of the Internal Revenue Code. Accordingly, no provision has been made for income taxes. The fund files U.S. federal, state, local and non-U.S. tax returns as applicable. The fund's tax returns are subject to examination by the relevant taxing authority until expiration of the applicable statute of limitations, which is generally three years from the date of filing but can be longer in certain jurisdictions. At this time, management believes there are no uncertain tax positions which, based on their technical merit, would not be sustained upon examination and for which it is reasonably possible that the total amounts of unrecognized tax benefits will significantly change in the next twelve months.
Multiple Class — All shares of the fund represent an equal pro rata interest in the net assets of the class to which such shares belong, and have identical voting, dividend, liquidation and other rights and the same terms and conditions, except for class specific expenses and exclusive rights to vote on matters affecting only individual classes. Income, non-class specific expenses, and realized and unrealized capital gains and losses of the fund are allocated to each class of shares based on their relative net assets.
Distributions to Shareholders — Distributions from net investment income and net realized gains, if any, are generally declared and paid annually. The fund may elect to treat a portion of its payment to a redeeming shareholder, which represents the pro rata share of undistributed net investment income and net realized gains, as a distribution for federal income tax purposes (tax equalization).
Indemnifications — Under the corporation’s organizational documents, its officers and directors are indemnified against certain liabilities arising out of the performance of their duties to the fund. In addition, in the normal course of business, the fund enters into contracts that provide general indemnifications. The maximum exposure under these arrangements is unknown as this would involve future claims that may be made against a fund. The risk of material loss from such claims is considered by management to be remote.
3. Fees and Transactions with Related Parties
Certain officers and directors of the corporation are also officers and/or directors of American Century Companies, Inc. (ACC). The corporation’s investment advisor, ACIM, the corporation's distributor, American Century Investment Services, Inc., and the corporation’s transfer agent, American Century Services, LLC, are wholly owned, directly or indirectly, by ACC. Various funds issued by American Century Asset Allocation Portfolios, Inc. own, in aggregate, 100% of the shares of the fund. Related parties do not invest in the fund for the purpose of exercising management or control.
Management Fees — The corporation has entered into a management agreement with ACIM, under which ACIM provides the fund with investment advisory and management services in exchange for a single, unified management fee (the fee) per class. The agreement provides that all expenses of managing and operating the fund, except distribution and service fees, brokerage expenses, taxes, interest, fees and expenses of the independent directors (including legal counsel fees), and extraordinary expenses, will be paid by ACIM. The fee is computed and accrued daily based on each class's daily net assets and paid monthly in arrears. The rate of the fee is determined by applying a fee rate calculation formula. This formula takes into account the fund’s assets as well as certain assets, if any, of other clients of the investment advisor outside the American Century Investments family of funds (such as subadvised funds and separate accounts) that have very similar investment teams and investment strategies (strategy assets). The strategy assets of the fund also include the assets of Growth Fund, one fund in a series issued by the corporation. The annual management fee schedule ranges from 0.600% to 0.790% for the Institutional Class and 0.450% to 0.640% for the R6 Class. Prior to August 1, 2014, the annual management fee schedule ranged from 0.600% to 0.800% for the Institutional Class and 0.450% to 0.650% for the R6 Class. The effective annual management fee for each class for the year ended October 31, 2014 was 0.77% for the Institutional Class and 0.62% for the R6 Class.
Directors' Fees and Expenses — The Board of Directors is responsible for overseeing the investment advisor’s management and operations of the fund. The directors receive detailed information about the fund and its investment advisor regularly throughout the year, and meet at least quarterly with management of the investment advisor to review reports about fund operations. Fees and expenses incurred in conjunction with the directors during the year ended October 31, 2014 are detailed in the Statement of Operations. The fund’s officers do not receive compensation from the fund.
4. Investment Transactions
Purchases and sales of investment securities, excluding short-term investments, for the year ended October 31, 2014 were $1,504,598,809 and $1,360,227,506, respectively.
5. Capital Share Transactions
Transactions in shares of the fund were as follows:
|
| | | | | | | | | | |
| | Year ended October 31, 2014 | Year ended October 31, 2013(1) |
| | Shares | Amount | Shares | Amount |
| Institutional Class/Shares Authorized | 300,000,000 |
| | 300,000,000 |
| |
| Sold | 10,717,121 |
| $ | 168,204,864 |
| 14,965,867 |
| $ | 201,231,386 |
|
| Issued in reinvestment of distributions | 3,073,782 |
| 45,891,562 |
| 2,082,089 |
| 26,275,968 |
|
| Redeemed | (4,925,067 | ) | (79,243,577 | ) | (2,473,143 | ) | (34,535,500 | ) |
| | 8,865,836 |
| 134,852,849 |
| 14,574,813 |
| 192,971,854 |
|
| R6 Class/Shares Authorized | 50,000,000 |
| | 50,000,000 |
| |
| Sold | 1,838,061 |
| 28,823,154 |
| 542,537 |
| 8,303,599 |
|
| Issued in reinvestment of distributions | 26,932 |
| 401,828 |
| — |
| — |
|
| Redeemed | (250,670 | ) | (3,972,257 | ) | (2,967 | ) | (44,690 | ) |
| | 1,614,323 |
| 25,252,725 |
| 539,570 |
| 8,258,909 |
|
| Net increase (decrease) | 10,480,159 |
| $ | 160,105,574 |
| 15,114,383 |
| $ | 201,230,763 |
|
| |
| (1) | July 26, 2013 (commencement of sale) through October 31, 2013 for the R6 Class. |
6. Fair Value Measurements
The fund’s investments valuation process is based on several considerations and may use multiple inputs to determine the fair value of the investments held by the fund. In conformity with accounting principles generally accepted in the United States of America, the inputs used to determine a valuation are classified into three broad levels.
| |
| • | Level 1 valuation inputs consist of unadjusted quoted prices in an active market for identical investments. |
| |
| • | Level 2 valuation inputs consist of direct or indirect observable market data (including quoted prices for comparable investments, evaluations of subsequent market events, interest rates, prepayment speeds, credit risk, etc.). These inputs also consist of quoted prices for identical investments initially expressed in local currencies that are adjusted through translation into U.S. dollars. |
| |
| • | Level 3 valuation inputs consist of unobservable data (including a fund’s own assumptions). |
The level classification is based on the lowest level input that is significant to the fair valuation measurement. The valuation inputs are not necessarily an indication of the risks associated with investing in these securities or other financial instruments. There were no significant transfers between levels during the period.
The following is a summary of the level classifications as of period end. The Schedule of Investments provides additional information on the fund’s portfolio holdings.
|
| | | | | | | | |
| | Level 1 | Level 2 | Level 3 |
| Assets | | | |
| Investment Securities | | | |
| Common Stocks | $ | 1,267,978,068 |
| — |
| — |
|
| Exchange-Traded Funds | 3,562,963 |
| — |
| — |
|
| Temporary Cash Investments | 2,730,304 |
| $ | 2,730,810 |
| — |
|
| | $ | 1,274,271,335 |
| $ | 2,730,810 |
| — |
|
7. Derivative Instruments
Equity Price Risk — The fund is subject to equity price risk in the normal course of pursuing its investment objectives. A fund may enter into futures contracts based on an equity index in order to manage its exposure to changes in market conditions. A fund may purchase futures contracts to gain exposure to increases in market value or sell futures contracts to protect against a decline in market value. Upon entering into a futures contract, a fund is required to deposit either cash or securities in an amount equal to a certain percentage of the contract value (initial margin). Subsequent payments (variation margin) are made or received daily, in cash, by a fund. The variation margin is equal to the daily change in the contract value and is recorded as unrealized gains and losses. A fund recognizes a realized gain or loss when the contract is closed or expires. Net realized and unrealized gains or losses occurring during the holding period of futures contracts are a component of net realized gain (loss) on futures contract transactions and change in net unrealized appreciation (depreciation) on futures contracts, respectively. One of the risks of entering into futures contracts is the possibility that the change in value of the contract may not correlate with the changes in value of the underlying securities. During the period, the fund infrequently purchased equity price risk derivative instruments for temporary investment purposes.
At period end, the fund did not have any derivative instruments disclosed on the Statement of Assets and Liabilities. For the year ended October 31, 2014, the effect of equity price risk derivative instruments on the Statement of Operations was $125,193 in net realized gain (loss) on futures contract transactions.
8. Risk Factors
The fund’s investment process may result in high portfolio turnover, which could mean high transaction costs, affecting both performance and capital gains tax liabilities to investors.
9. Federal Tax Information
The tax character of distributions paid during the years ended October 31, 2014 and October 31, 2013 were as follows:
|
| | | | | | |
| | 2014 | 2013 |
| Distributions Paid From | | |
| Ordinary income | $ | 13,537,820 |
| $ | 5,216,535 |
|
| Long-term capital gains | $ | 32,755,570 |
| $ | 21,059,433 |
|
The book-basis character of distributions made during the year from net investment income or net realized gains may differ from their ultimate characterization for federal income tax purposes. These differences reflect the differing character of certain income items and net realized gains and losses for financial statement and tax purposes, and may result in reclassification among certain capital accounts on the financial statements.
As of October 31, 2014, the federal tax cost of investments and the components of distributable earnings on a tax-basis were as follows:
|
| | | |
| Federal tax cost of investments | $ | 1,078,239,365 |
|
| Gross tax appreciation of investments | $ | 208,894,797 |
|
| Gross tax depreciation of investments | (10,132,017 | ) |
| Net tax appreciation (depreciation) of investments | $ | 198,762,780 |
|
| Undistributed ordinary income | $ | 31,590,462 |
|
| Accumulated long-term gains | $ | 154,291,881 |
|
The difference between book-basis and tax-basis unrealized appreciation (depreciation) is attributable primarily to the tax deferral of losses on wash sales.
|
| | | | | | | | | | | | | | | |
| For a Share Outstanding Throughout the Years Ended October 31 (except as noted) | |
| Per-Share Data | | | | | | | | | Ratios and Supplemental Data |
| | | Income From Investment Operations: | Distributions From: | | | Ratio to Average Net Assets of: | |
| | Net Asset Value, Beginning of Period | Net Investment Income (Loss)(1) | Net Realized and Unrealized Gain (Loss) | Total From Investment Operations | Net Investment Income | Net Realized Gains | Total Distributions | Net Asset Value, End of Period | Total Return(2) | Operating Expenses | Net Investment Income (Loss) | Portfolio Turnover Rate | Net Assets, End of Period (in thousands) |
| Institutional Class | | | | | | | | | | | | |
| 2014 | $15.42 | 0.08 | 2.02 | 2.10 | (0.09) | (0.61) | (0.70) | $16.82 | 14.17% | 0.77% | 0.50% | 119% |
| $1,234,784 |
|
| 2013 | $12.72 | 0.12 | 3.08 | 3.20 | (0.10) | (0.40) | (0.50) | $15.42 | 26.05% | 0.77% | 0.85% | 77% |
| $995,575 |
|
| 2012 | $11.92 | 0.09 | 1.09 | 1.18 | (0.08) | (0.30) | (0.38) | $12.72 | 10.33% | 0.77% | 0.71% | 87% |
| $635,906 |
|
| 2011 | $11.06 | 0.09 | 0.85 | 0.94 | (0.08) | — | (0.08) | $11.92 | 8.48% | 0.78% | 0.78% | 95% |
| $461,845 |
|
| 2010 | $9.34 | 0.06 | 1.71 | 1.77 | (0.05) | — | (0.05) | $11.06 | 18.94% | 0.79% | 0.63% | 95% |
| $340,417 |
|
| R6 Class | | | | | | | | | | | | | |
| 2014 | $15.43 | 0.10 | 2.01 | 2.11 | (0.11) | (0.61) | (0.72) | $16.82 | 14.27% | 0.62% | 0.65% | 119% |
| $36,237 |
|
2013(3) | $14.38 | —(4) | 1.05 | 1.05 | — | — | — | $15.43 | 7.30% | 0.62%(5) | 0.09%(5) | 77%(6) |
| $8,325 |
|
|
|
| Notes to Financial Highlights |
| |
| (1) | Computed using average shares outstanding throughout the period. |
| |
| (2) | Total returns are calculated based on the net asset value of the last business day. Total returns for periods less than one year are not annualized. |
| |
| (3) | July 26, 2013 (commencement of sale) through October 31, 2013. |
| |
| (4) | Per-share amount was less than $0.005. |
| |
| (6) | Portfolio turnover is calculated at the fund level. Percentage indicated was calculated for the year ended October 31, 2013. |
See Notes to Financial Statements.
|
|
| Report of Independent Registered Public Accounting Firm |
To the Board of Directors and Shareholders of
American Century Mutual Funds, Inc.:
We have audited the accompanying statement of assets and liabilities, including the schedule of investments, of NT Growth Fund (the “Fund”), one of the funds constituting American Century Mutual Funds, Inc., as of October 31, 2014, and the related statement of operations for the year then ended, the statements of changes in net assets for each of the two years in the period then ended, and the financial highlights for each of the periods presented. These financial statements and financial highlights are the responsibility of the Fund's management. Our responsibility is to express an opinion on these financial statements and financial highlights based on our audits.
We conducted our audits in accordance with the standards of the Public Company Accounting Oversight Board (United States). Those standards require that we plan and perform the audit to obtain reasonable assurance about whether the financial statements and financial highlights are free of material misstatement. The Fund is not required to have, nor were we engaged to perform, an audit of its internal control over financial reporting. Our audits included consideration of internal control over financial reporting as a basis for designing audit procedures that are appropriate in the circumstances, but not for the purpose of expressing an opinion on the effectiveness of the Fund's internal control over financial reporting. Accordingly, we express no such opinion. An audit also includes examining, on a test basis, evidence supporting the amounts and disclosures in the financial statements, assessing the accounting principles used and significant estimates made by management, as well as evaluating the overall financial statement presentation. Our procedures included confirmation of securities owned as of October 31, 2014, by correspondence with the custodian and brokers; where replies were not received from brokers, we performed other auditing procedures. We believe that our audits provide a reasonable basis for our opinion.
In our opinion, the financial statements and financial highlights referred to above present fairly, in all material respects, the financial position of NT Growth Fund of American Century Mutual Funds, Inc. as of October 31, 2014, the results of its operations for the year then ended, the changes in its net assets for each of the two years in the period then ended, and the financial highlights for each of the periods presented, in conformity with accounting principles generally accepted in the United States of America.
DELOITTE & TOUCHE LLP
Kansas City, Missouri
December 17, 2014
The Board of Directors
The individuals listed below serve as directors of the funds. Each director will continue to serve in this capacity until death, retirement, resignation or removal from office. The board has adopted a mandatory retirement age for directors who are not “interested persons,” as that term is defined in the Investment Company Act (independent directors). Independent directors shall retire by December 31 of the year in which they reach their 75th birthday.
Mr. Thomas is an “interested person” because he currently serves as President and Chief Executive Officer of American Century Companies, Inc. (ACC), the parent company of American Century Investment Management, Inc. (ACIM or the advisor). Mr. Fink is treated as an “interested person” because of his recent employment with ACC and American Century Services, LLC (ACS). The other directors (more than three-fourths of the total number) are independent. They are not employees, directors or officers of, and have no financial interest in, ACC or any of its wholly owned, direct or indirect, subsidiaries, including ACIM, American Century Investment Services, Inc. (ACIS) and ACS, and they do not have any other affiliations, positions, or relationships that would cause them to be considered “interested persons” under the Investment Company Act. The directors serve in this capacity for seven (in the case of Mr. Thomas, 15) registered investment companies in the American Century Investments family of funds.
The following table presents additional information about the directors. The mailing address for each director is 4500 Main Street, Kansas City, Missouri 64111.
|
| | | | | |
Name
(Year of Birth) | Position(s) Held with Funds | Length of Time Served | Principal Occupation(s) During Past 5 Years | Number of American Century Portfolios Overseen by Director | Other Directorships Held During Past
5 Years |
| Independent Directors | | | | |
Thomas A. Brown
(1940) | Director | Since 1980 | Managing Member, Associated Investments, LLC (real estate investment company); Brown Cascade Properties, LLC (real estate investment company) (2001 to 2009) | 73 | None |
Andrea C. Hall
(1945) | Director | Since 1997 | Retired | 73 | None |
Jan M. Lewis
(1957) | Director | Since 2011 | Retired; President and Chief Executive Officer, Catholic Charities of Northeast Kansas (human services organization) (2006 to 2013) | 73 | None |
James A. Olson
(1942) | Director and Chairman of the Board | Since 2007 (Chairman since 2014) | Member, Plaza Belmont LLC (private equity fund manager) | 73 | Saia, Inc. (2002 to 2012) and EPR Properties (2003 to 2013) |
|
| | | | | |
Name
(Year of Birth) | Position(s) Held with Funds | Length of Time Served | Principal Occupation(s) During Past 5 Years | Number of American Century Portfolios Overseen by Director | Other Directorships Held During Past
5 Years |
| Independent Directors | | | | |
M. Jeannine Strandjord
(1945) | Director | Since 1994 | Retired | 73 | Euronet Worldwide Inc.; Charming Shoppes, Inc. (2006 to 2010); and DST Systems Inc. (1996 to 2012) |
John R. Whitten
(1946) | Director | Since 2008 | Retired | 73 | Rudolph Technologies, Inc. |
Stephen E. Yates
(1948) | Director | Since 2012 | Retired; Executive Vice President, Technology & Operations, KeyCorp. (computer services) (2004 to 2010) | 73 | Applied Industrial Technologies, Inc. (2001 to 2010) |
| Interested Directors | | | | |
Barry Fink
(1955) | Director | Since 2012 | Retired; Executive Vice President, ACC (September 2007 to February 2013); President, ACS (October 2007 to February 2013); Chief Operating Officer, ACC (September 2007 to November 2012) | 73 | None |
Jonathan S. Thomas
(1963) | Director and President | Since 2007 | President and Chief Executive Officer, ACC (March 2007 to present). Also serves as Chief Executive Officer, ACS; Executive Vice President, ACIM; Director, ACC, ACIM and other ACC subsidiaries | 118 | BioMed Valley Discoveries, Inc. |
The Statement of Additional Information has additional information about the fund's directors and is available without charge, upon request, by calling 1-800-345-2021.
Officers
The following table presents certain information about the executive officers of the funds. Each officer serves as an officer for each of the 15 investment companies in the American Century family of funds, unless otherwise noted. No officer is compensated for his or her service as an officer of the funds. The listed officers are interested persons of the funds and are appointed or re-appointed on an annual basis. The mailing address for each officer listed below is 4500 Main Street, Kansas City, Missouri 64111.
|
| | |
Name (Year of Birth) | Offices with the Funds | Principal Occupation(s) During the Past Five Years |
Jonathan S.
Thomas
(1963) | Director and
President
since 2007 | President and Chief Executive Officer, ACC (March 2007 to present). Also serves as Chief Executive Officer, ACS; Executive Vice President, ACIM; Director, ACC, ACIM and other ACC subsidiaries |
Amy D. Shelton
(1964) | Chief Compliance
Officer since 2014 | Chief Compliance Officer, American Century funds, (March 2014 to present); Chief Compliance Officer, ACIM (February 2014 to present); Chief Compliance Officer, ACIS (October 2009 to present); Vice President, Client Interactions and Marketing, ACIS (February 2013 to January 2014); Director, Client Interactions and Marketing, ACIS (June 2007 to January 2013). Also serves as Vice President, ACIS |
Charles A.
Etherington
(1957) | General Counsel
since 2007 and
Senior Vice
President since 2006 | Attorney, ACC (February 1994 to present); Vice President, ACC (November 2005 to present); General Counsel, ACC (March 2007 to present). Also serves as General Counsel, ACIM, ACS, ACIS and other ACC subsidiaries; and Senior Vice President, ACIM and ACS |
C. Jean Wade
(1964) | Vice President,
Treasurer and
Chief Financial
Officer since 2012 | Vice President, ACS (February 2000 to present) |
Robert J.
Leach
(1966) | Vice President
since 2006 and
Assistant Treasurer
since 2012 | Vice President, ACS (February 2000 to present) |
David H.
Reinmiller
(1963) | Vice President
since 2000 | Attorney, ACC (January 1994 to present); Associate General Counsel, ACC (January 2001 to present). Also serves as Vice President, ACIM and ACS |
Ward D.
Stauffer
(1960) | Secretary
since 2005 | Attorney, ACC (June 2003 to present) |
|
|
| Approval of Management Agreement |
At a meeting held on June 18, 2014, the Fund’s Board of Directors unanimously approved the renewal of the management agreement pursuant to which American Century Investment Management, Inc. (the “Advisor”) acts as the investment advisor for the Fund. Under Section 15(c) of the Investment Company Act, contracts for investment advisory services are required to be reviewed, evaluated, and approved by a majority of a fund’s directors (the “Directors”), including a majority of the independent Directors, each year.
Prior to its consideration of the renewal of the management agreement, the Board requested and reviewed extensive data and information compiled by the Advisor and certain independent providers of evaluation data concerning the Fund and the services provided to the Fund by the Advisor. This review was in addition to the oversight and evaluation undertaken by the Board and its committees on a continuous basis and the information received was supplemental to the extensive information that the Board and its committees receive and consider throughout the year.
In connection with its consideration of the renewal of the management agreement, the Board’s review and evaluation of the services provided by the Advisor included, but was not limited to, the following:
| |
| • | the nature, extent, and quality of investment management, shareholder services, and other services provided by the Advisor to the Fund; |
| |
| • | the wide range of other programs and services the Advisor provides to the Fund and its shareholders on a routine and non-routine basis; |
| |
| • | the Fund’s investment performance compared to appropriate benchmarks and/or a peer group of other mutual funds with similar investment objectives and strategies; |
| |
| • | the cost of owning the Fund compared to the cost of owning similar funds; |
| |
| • | the Advisor’s compliance policies, procedures, and regulatory experience; |
| |
| • | financial data showing the cost of services provided to the Fund, the profitability of the Fund to the Advisor, and the overall profitability of the Advisor; |
| |
| • | possible economies of scale associated with the Advisor’s management of the Fund and other accounts under its management; |
| |
| • | the services provided and charges to other investment management clients of the Advisor; |
| |
| • | acquired fund fees and expenses; and |
| |
| • | any collateral benefits derived by the Advisor from the management of the Fund. |
In keeping with its practice, the Board held two in-person meetings and one telephonic meeting to review and discuss the information provided. The independent Directors also had the benefit of the advice of their independent counsel throughout the process.
Factors Considered
The Directors considered all of the information provided by the Advisor, the independent data providers, and independent counsel, and evaluated such information for the Fund. In connection with their review, the Directors did not identify any single factor as being all-important or controlling, and each Director may have attributed different levels of importance to different factors. In deciding to renew the management agreement, the Board based its decision on a number of factors, including the following:
Nature, Extent and Quality of Services — Generally. Under the management agreement, the Advisor is responsible for providing or arranging for all services necessary for the operation of the Fund. The Board noted that under the management agreement, the Advisor provides or arranges at its own expense a wide variety of services including:
| |
| • | constructing and designing the Fund |
| |
| • | portfolio research and security selection |
| |
| • | initial capitalization/funding |
| |
| • | daily valuation of the Fund’s portfolio |
| |
| • | shareholder servicing and transfer agency, including shareholder confirmations, recordkeeping, and communications |
| |
| • | legal services (except the independent Directors’ counsel) |
| |
| • | regulatory and portfolio compliance |
| |
| • | marketing and distribution (except Rule 12b-1 plans) |
The Board noted that many of these services have expanded over time both in terms of quantity and complexity in response to shareholder demands, competition in the industry, changing distribution channels, and the changing regulatory environment.
Investment Management Services. The nature of the investment management services provided to the Fund is quite complex and allows Fund shareholders access to professional money management, instant diversification of their investments within an asset class, the opportunity to easily diversify among asset classes by investing in or exchanging among various American Century Investments funds, and liquidity. In evaluating investment performance, the Board expects the Advisor to manage the Fund in accordance with its investment objectives and approved strategies. Further, the Directors recognize that the Advisor has an obligation to monitor trading activities, and in particular to seek the best execution of fund trades, and to evaluate the use of and payment for research. In providing these services, the Advisor utilizes teams of investment professionals (portfolio managers, analysts, research assistants, and securities traders) who require extensive information technology, research, training, compliance and other systems to conduct their business. The Board, directly and through its Fund Performance Review Committee, regularly reviews investment performance information for the Fund, together with comparative information for appropriate benchmarks and/or peer groups of similarly-managed funds, over different time horizons. The Directors also review detailed performance information during the management agreement approval process. If performance concerns are identified, the Fund receives special reviews until performance improves, during which the Board discusses with the Advisor the reasons for such results (e.g., market conditions, security selection) and any efforts being undertaken to improve performance. The Fund’s performance was below its benchmark for the one-, three-, and five-year periods reviewed by the Board. The Board discussed the Fund’s performance with the Advisor and was satisfied with the efforts being undertaken by the Advisor. The Board found the investment management services provided by the Advisor to the Fund to be satisfactory and consistent with the management agreement.
Shareholder and Other Services. Under the management agreement, the Advisor provides the Fund with a comprehensive package of transfer agency, shareholder, and other services. The Board, directly and through various committees of the Board, regularly reviews reports and evaluations of such services at its regular meetings. These reports include, but are not limited to, information regarding the operational efficiency and accuracy of the shareholder and transfer agency services provided, staffing levels, shareholder satisfaction (as measured by external as well as internal sources), technology support, new products and services offered to Fund shareholders, securities trading activities, portfolio valuation services, auditing services, and legal and operational compliance activities. Certain aspects of shareholder and transfer agency service level efficiency and the quality of securities trading activities are measured by independent third party providers
and are presented in comparison to other fund groups not managed by the Advisor. The Board found the services provided by the Advisor to the Fund under the management agreement to be competitive and of high quality.
Costs of Services and Profitability. The Advisor provides detailed information concerning its cost of providing various services to the Fund, its profitability in managing the Fund (pre- and post-distribution), its overall profitability, and its financial condition. The Directors have reviewed with the Advisor the methodology used to prepare this financial information. The financial information regarding the Advisor is considered in evaluating the Advisor’s financial condition, its ability to continue to provide services under the management agreement, and the reasonableness of the current management fee. The Board concluded that the Advisor’s profits were reasonable in light of the services provided to the Fund.
Ethics. The Board generally considers the Advisor’s commitment to providing quality services to shareholders and to conducting its business ethically. They noted that the Advisor’s practices generally meet or exceed industry best practices.
Economies of Scale. The Board also reviewed information provided by the Advisor regarding the possible existence of economies of scale in connection with the management of the Fund. The Board concluded that economies of scale are difficult to measure and predict with precision, especially on a fund-by-fund basis. The Board concluded that the Advisor is appropriately sharing economies of scale through its competitive fee structure, offering competitive fees from fund inception, and through reinvestment in its business to provide shareholders additional content and services.
Comparison to Other Funds’ Fees. The management agreement provides that the Fund pays the Advisor a single, all-inclusive (or unified) management fee for providing all services necessary for the management and operation of the Fund, other than brokerage expenses, taxes, interest, extraordinary expenses, and the fees and expenses of the Fund’s independent directors (including their independent legal counsel) and expenses incurred in connection with the provision of shareholder services and distribution services under a plan adopted pursuant to Rule 12b-1 under the 1940 Act. Under the unified fee structure, the Advisor is responsible for providing all investment advisory, custody, audit, administrative, compliance, recordkeeping, marketing and shareholder services, or arranging and supervising third parties to provide such services. By contrast, most other funds are charged a variety of fees, including an investment advisory fee, a transfer agency fee, an administrative fee, distribution charges and other expenses. Other than their investment advisory fees and any applicable Rule 12b-1 distribution fees, all other components of the total fees charged by these other funds may be increased without shareholder approval. The Board believes the unified fee structure is a benefit to Fund shareholders because it clearly discloses to shareholders the cost of owning Fund shares, and, since the unified fee cannot be increased without a vote of Fund shareholders, it shifts to the Advisor the risk of increased costs of operating the Fund and provides a direct incentive to minimize administrative inefficiencies. Part of the Board’s analysis of fee levels involves reviewing certain evaluative data compiled by an independent provider comparing the Fund’s unified fee to the total expense ratios of its peers. The unified fee charged to shareholders of the Fund was below the median of the total expense ratios of the Fund’s peer expense universe and was within the range of its peer expense group. The Board and the Advisor agreed to certain adjustments regarding the breakpoints in the Fund’s unified management fee schedule, including changing the number of breakpoints and the investment amount that applies to each breakpoint, beginning August 1, 2014. The Board concluded that the management fee paid by the Fund to the Advisor under the management agreement is reasonable in light of the services provided to the Fund.
Comparison to Fees and Services Provided to Other Clients of the Advisor. The Board also requested and received information from the Advisor concerning the nature of the services, fees, costs and profitability of its advisory services to advisory clients other than the Fund. They observed that these varying types of client accounts require different services and involve different regulatory and entrepreneurial risks than the management of the Fund. The Board analyzed this information and concluded that the fees charged and services provided to the Fund were reasonable by comparison.
Collateral or “Fall-Out” Benefits Derived by the Advisor. The Board considered the existence of collateral benefits the Advisor may receive as a result of its relationship with the Fund. They concluded that the Advisor’s primary business is managing mutual funds and it generally does not use fund or shareholder information to generate profits in other lines of business, and therefore does not derive any significant collateral benefits from them. The Board noted that the Advisor receives proprietary research from broker-dealers that execute fund portfolio transactions and concluded that this research is likely to benefit Fund shareholders. The Board also determined that the Advisor is able to provide investment management services to certain clients other than the Fund, at least in part, due to its existing infrastructure built to serve the fund complex. The Board concluded, however, that the assets of those other clients are not material to the analysis and, where applicable, may be included with the assets of the Fund to determine breakpoints in the management fee schedule.
Existing Relationship. The Board also considered whether there was any reason for not continuing the existing arrangement with the Advisor. In this regard, the Board was mindful of the potential disruptions of the Fund’s operations and various risks, uncertainties, and other effects that could occur as a result of a decision not to continue such relationship. In particular, the Board recognized that most shareholders have invested in the Fund on the strength of the Advisor’s industry standing and reputation and in the expectation that the Advisor will have a continuing role in providing advisory services to the Fund.
Conclusion of the Directors. As a result of this process, the Board, including all of the independent Directors, taking into account all of the factors discussed above and the information provided by the Advisor and others, concluded that the management agreement between the Fund and the Advisor is fair and reasonable in light of the services provided and should be renewed.
Retirement Account Information
As required by law, distributions you receive from certain IRAs are subject to federal income tax withholding, unless you elect not to have withholding apply. Tax will be withheld on the total amount withdrawn even though you may be receiving amounts that are not subject to withholding, such as nondeductible contributions. In such case, excess amounts of withholding could occur. You may adjust your withholding election so that a greater or lesser amount will be withheld.
If you don’t want us to withhold on this amount, you must notify us to not withhold the federal income tax. You may notify us in writing or in certain situations by telephone or through other electronic means. For systematic withdrawals, your withholding election will remain in effect until revoked or changed by filing a new election. You have the right to revoke your election at any time.
Remember, even if you elect not to have income tax withheld, you are liable for paying income tax on the taxable portion of your withdrawal. If you elect not to have income tax withheld or you don’t have enough income tax withheld, you may be responsible for payment of estimated tax. You may incur penalties under the estimated tax rules if your withholding and estimated tax payments are not sufficient. You can reduce or defer the income tax on a distribution by directly or indirectly rolling such distribution over to another IRA or eligible plan. You should consult your tax advisor for additional information.
State tax will be withheld if, at the time of your distribution, your address is within one of the mandatory withholding states and you have federal income tax withheld (or as otherwise required by state law). State taxes will be withheld from your distribution in accordance with the respective state rules.
Distributions you receive from 403(b), 457 and qualified plans are subject to special tax and withholding rules. Your plan administrator or plan sponsor is required to provide you with a special tax notice explaining those rules at the time you request a distribution. If applicable, federal and/or state taxes may be withheld from your distribution amount.
Proxy Voting Policies
A description of the policies that the fund's investment advisor uses in exercising the voting rights associated with the securities purchased and/or held by the fund is available without charge, upon request, by calling 1-800-345-2021. It is also available on the "About Us" page of American Century Investments’ website at americancentury.com and on the Securities and Exchange Commission’s website at sec.gov. Information regarding how the investment advisor voted proxies relating to portfolio securities during the most recent 12-month period ended June 30 is available on the "About Us" page at americancentury.com. It is also available at sec.gov.
Quarterly Portfolio Disclosure
The fund files its complete schedule of portfolio holdings with the Securities and Exchange Commission (SEC) for the first and third quarters of each fiscal year on Form N-Q. The fund’s Forms N-Q are available on the SEC’s website at sec.gov, and may be reviewed and copied at the SEC’s Public Reference Room in Washington, DC. Information on the operation of the Public Reference Room may be obtained by calling 1-800-SEC-0330. The fund also makes its complete schedule of portfolio holdings for the most recent quarter of its fiscal year available on its
website at americancentury.com and, upon request, by calling 1-800-345-2021.
Other Tax Information
The following information is provided pursuant to provisions of the Internal Revenue Code.
The fund hereby designates up to the maximum amount allowable as qualified dividend income for the fiscal year ended October 31, 2014.
For corporate taxpayers, the fund hereby designates $11,402,997, or up to the maximum amount allowable, of ordinary income distributions paid during the fiscal year ended October 31, 2014 as qualified for the corporate dividends received deduction.
The fund hereby designates $8,026,397 as qualified short-term capital gain distributions for purposes of Internal Revenue Code Section 871 for the fiscal year ended October 31, 2014.
The fund hereby designates $35,850,734, or up to the maximum amount allowable, as long-term capital gain distributions for the fiscal year ended October 31, 2014.
The fund utilized earnings and profits of $3,757,089 distributed to shareholders on redemption of shares as part of the dividends paid deduction (tax equalization).
|
| | |
| |
| | | |
| Contact Us | americancentury.com | |
| Automated Information Line | 1-800-345-8765 | |
| Investor Services Representative | 1-800-345-2021 or 816-531-5575 | |
| Investors Using Advisors | 1-800-378-9878 | |
| Business, Not-For-Profit, Employer-Sponsored Retirement Plans | 1-800-345-3533 | |
| Banks and Trust Companies, Broker-Dealers, Financial Professionals, Insurance Companies | 1-800-345-6488 | |
| Telecommunications Relay Service for the Deaf | 711 | |
| | | |
| American Century Mutual Funds, Inc. | |
| | | |
Investment Advisor: American Century Investment Management, Inc. Kansas City, Missouri | |
| | | |
| This report and the statements it contains are submitted for the general information of our shareholders. The report is not authorized for distribution to prospective investors unless preceded or accompanied by an effective prospectus. | |
| | | |
©2014 American Century Proprietary Holdings, Inc. All rights reserved.
CL-ANN-84010 1412 | |
|
| |
| ANNUAL REPORT | OCTOBER 31, 2014 |
NT Heritage Fund
|
| |
| President’s Letter | |
| Performance | |
| Portfolio Commentary | |
| Fund Characteristics | |
| Shareholder Fee Example | |
| Schedule of Investments | |
| Statement of Assets and Liabilities | |
| Statement of Operations | |
| Statement of Changes in Net Assets | |
| Notes to Financial Statements | |
| Financial Highlights | |
| Report of Independent Registered Public Accounting Firm | |
| Management | |
| Approval of Management Agreement | |
| Additional Information | |
Any opinions expressed in this report reflect those of the author as of the date of the report, and do not necessarily represent the opinions of American Century Investments® or any other person in the American Century Investments organization. Any such opinions are subject to change at any time based upon market or other conditions and American Century Investments disclaims any responsibility to update such opinions. These opinions may not be relied upon as investment advice and, because investment decisions made by American Century Investments funds are based on numerous factors, may not be relied upon as an indication of trading intent on behalf of any American Century Investments fund. Security examples are used for representational purposes only and are not intended as recommendations to purchase or sell securities. Performance information for comparative indices and securities is provided to American Century Investments by third party vendors. To the best of American Century Investments’ knowledge, such information is accurate at the time of printing.
|
| |
| Dear Investor:
Thank you for reviewing this annual report for the 12 months ended October 31, 2014. It provides investment performance and portfolio information for the reporting period, plus longer-term historical performance data.
Annual reports remain important vehicles for conveying information about fund returns, including market and economic factors that affected performance during the reporting period. For additional, updated investment and market insights, we encourage you to visit our website, americancentury.com. |
| Jonathan Thomas |
Favorable Fiscal Year for U.S. Stocks and Bonds
Mostly stimulative monetary policies by central banks and expectations of longer-term economic improvement, interspersed with concerns about nearer-term weaker-than-expected global economic data and geopolitical conflicts, helped drive financial market returns during the reporting period. We believe the combination of longer-term optimism about U.S. economic growth, low costs of capital, and continued central bank stimulus (even as the U.S. Federal Reserve’s latest monthly bond purchase program ended) helped persuade investors to seek risk and yield, which benefited U.S. stocks and bonds. The S&P 500 Index gained 17.27% during the 12 months. The 30-year U.S. Treasury bond was close behind, returning 15.44%, according to Barclays. U.S. real estate investment trusts (REITs), whose shares combine performance attributes of stocks and bonds, benefited from both—the MSCI U.S. REIT Index advanced 19.19%.
U.S. market benchmark returns generally outpaced their non-U.S. counterparts. The U.S. was perceived by investors as a relative bastion of growth, stability, and potentially attractive yields compared with most of the rest of the world, so capital flows generally favored U.S. assets. These capital flows, along with weaker-than-expected global growth, lower-than-expected global inflation, and falling commodity and energy prices, helped keep long-term interest rates and other corporate costs low. U.S. stocks just completed a solid third-quarter earnings reporting season, though questions remain about next year’s revenues, given this year’s slowdown in global economic growth and concerns about how far it could extend into 2015.
We believe continuing global economic and geopolitical uncertainties could continue to support the relative appeal of U.S. assets in coming months. But the end of the U.S. Federal Reserve’s monthly bond-buying program and the still-looming possibility of higher interest rates in 2015 point to potential U.S. market volatility ahead. In this environment, we continue to believe in a disciplined, diversified, long-term investment approach, using professionally managed stock and bond portfolios for meeting financial goals. We appreciate your continued trust in us.
Sincerely,
Jonathan Thomas
President and Chief Executive Officer
American Century Investments
|
| | | | | |
| Total Returns as of October 31, 2014 |
| | | | Average Annual Returns | |
| | Ticker Symbol | 1 year | 5 years | Since Inception | Inception Date |
| Institutional Class | ACLWX | 8.53% | 15.30% | 5.15% | 5/12/06 |
| Russell Midcap Growth Index | — | 14.59% | 18.72% | 8.52% | — |
| R6 Class | ACDUX | 8.60% | — | 12.57% | 7/26/13 |
|
|
| Growth of $10,000 Over Life of Class |
| $10,000 investment made May 12, 2006 |
| Performance for other share classes will vary due to differences in fee structure. |
|
| |
| Value on October 31, 2014 |
| | Institutional Class — $15,305 |
| |
| | Russell Midcap Growth Index — $20,001 |
| |
*From May 12, 2006, the Institutional Class’s inception date. Not annualized.
|
| |
| Total Annual Fund Operating Expenses |
| Institutional Class | R6 Class |
| 0.80% | 0.65% |
The total annual fund operating expenses shown is as stated in the fund’s prospectus current as of the date of this report. The prospectus may vary from the expense ratio shown elsewhere in this report because it is based on a different time period, includes acquired fund fees and expenses, and, if applicable, does not include fee waivers or expense reimbursements.
Data presented reflect past performance. Past performance is no guarantee of future results. Current performance may be higher or lower than the performance shown. Investment return and principal value will fluctuate, and redemption value may be more or less than original cost. Data assumes reinvestment of dividends and capital gains, and none of the charts reflect the deduction of taxes that a shareholder would pay on fund distributions or the redemption of fund shares. To obtain performance data current to the most recent month end, please call 1-800-345-2021 or visit americancentury.com. For additional information about the fund, please consult the prospectus.
Portfolio Managers: David Hollond and Greg Walsh
Performance Summary
NT Heritage returned 8.53%* for the 12 months ended October 31, 2014, lagging the 14.59% return of the portfolio’s benchmark, the Russell Midcap Growth Index.
U.S. stock indices delivered solid returns during the reporting period. Within the Russell Midcap Growth Index, all sectors except energy posted positive returns on a total-return basis. Telecommunication services and health care were the top-performing sectors, gaining nearly 33%. Consumer staples, utilities, and information technology also performed well and outpaced the benchmark average. Falling oil prices hurt stocks in the energy sector.
NT Heritage received positive absolute contributions from most sectors, with health care leading the way. Energy holdings were weakest, posting a modest loss. Stock decisions in the consumer discretionary, energy, and health care sectors were key performance detractors relative to the Russell index. Stock selection in the information technology sector and an overweight allocation to telecommunication services aided results versus the benchmark.
Consumer Discretionary Stocks Led Detractors
Stock choices in the consumer discretionary sector detracted from relative results. Specialty-flooring retailer Lumber Liquidators failed to rebound from lower-than-expected first-quarter same-store sales caused by severe winter weather. The company also reported a shortage in hardwood flooring inventory. The stock was eliminated from the portfolio. Underweighting Tesla Motors detracted as investors continued to be excited about the future of electric cars and the company’s pursuit of the Chinese market.
The energy sector also detracted, largely due to stock selection in the energy equipment and services and oil, gas, and consumable fuels industries. Key detractors included Patterson-UTI Energy and Antero Resources. Both producers and services firms are struggling with declining oil prices. Within the health care sector, not owning several solid performers in the biotechnology industry detracted.
Among other leading detractors, the social media employment site LinkedIn has seen some deceleration of growth in its user base and provided weaker-than-expected guidance for 2014. We believe there is room for growth, however, as the company has no competition, a large, traditional job search market to disrupt, new product opportunities, and expansion potential.
| |
| * | All fund returns referenced in this commentary are for Institutional Class shares. Performance for other share classes will vary due to differences in fee structure; when Institutional Class performance exceeds that of the fund's benchmark, other share classes may not. See page 3 for returns for all share classes. |
Information Technology Stocks Aided Results
Stock decisions in information technology benefited relative results, led by Electronic Arts. The video game maker rose on strong results consistent with our investment thesis of improving operating margins, driven by a higher percentage of video games being delivered digitally, and a gaming console refresh cycle. Positioning in the telecommunication services sector aided results, led by an overweight position in SBA Communications, which owns and operates wireless communications towers and other structures. The company continued to benefit from industry trends and organic growth as consumers increase their use of data transmission for videos and other content, and from acquisitions, most recently one of Brazil’s largest wireless providers.
The fund’s holding of Canadian Pacific Railway, which is not a component of the index, was another key contributor. Canadian Pacific was helped by an improved balance sheet and its thoughtful use of cash, including a large share-repurchase program. Specialty pharmaceutical firm Actavis was a top contributor, as it has done a good job of integrating its purchase of Forest Laboratories and has benefited from the overall enthusiasm for merger and acquisitions in the pharmaceutical space. Sports apparel maker Under Armour aided results. The firm is gaining market share, and its international arm, though still fairly small, is growing rapidly.
Outlook
NT Heritage’s investment process focuses primarily on medium-sized and smaller companies with accelerating earnings growth rates and share price momentum. The fund’s positioning remains largely stock specific. As of October 31, 2014, the largest overweights were in telecommunication services and health care, while the largest underweights were in materials and consumer discretionary. Current investment themes include stocks of companies benefiting from the Affordable Care Act, which has given a lift to health care providers. We are also finding opportunities in companies that benefit from the secular shift toward natural and organic foods.
|
| |
| OCTOBER 31, 2014 | |
| Top Ten Holdings | % of net assets |
| Electronic Arts, Inc. | 4.3% |
| SBA Communications Corp., Class A | 3.2% |
| Alliance Data Systems Corp. | 3.1% |
| Teleflex, Inc. | 2.3% |
| Canadian Pacific Railway Ltd., New York Shares | 2.0% |
| Constellation Brands, Inc., Class A | 2.0% |
| Actavis plc | 2.0% |
| Affiliated Managers Group, Inc. | 1.9% |
| Spirit Airlines, Inc. | 1.9% |
| Avago Technologies Ltd. | 1.8% |
| | |
| Top Five Industries | % of net assets |
| Software | 7.6% |
| Pharmaceuticals | 5.6% |
| Machinery | 5.2% |
| Specialty Retail | 4.8% |
| Textiles, Apparel and Luxury Goods | 3.6% |
| | |
| Types of Investments in Portfolio | % of net assets |
| Common Stocks | 98.6% |
| Temporary Cash Investments | 1.4% |
| Other Assets and Liabilities | —* |
*Category is less than 0.05% of total net assets.
Fund shareholders may incur two types of costs: (1) transaction costs, including sales charges (loads) on purchase payments and redemption/exchange fees; and (2) ongoing costs, including management fees; distribution and service (12b-1) fees; and other fund expenses. This example is intended to help you understand your ongoing costs (in dollars) of investing in your fund and to compare these costs with the ongoing cost of investing in other mutual funds.
The example is based on an investment of $1,000 made at the beginning of the period and held for the entire period from May 1, 2014 to October 31, 2014.
Actual Expenses
The table provides information about actual account values and actual expenses for each class. You may use the information, together with the amount you invested, to estimate the expenses that you paid over the period. First, identify the share class you own. Then simply divide your account value by $1,000 (for example, an $8,600 account value divided by $1,000 = 8.6), then multiply the result by the number under the heading “Expenses Paid During Period” to estimate the expenses you paid on your account during this period.
If you hold Investor Class shares of any American Century Investments fund, or Institutional Class shares of the American Century Diversified Bond Fund, in an American Century Investments account (i.e., not a financial intermediary or retirement plan account), American Century Investments may charge you a $12.50 semiannual account maintenance fee if the value of those shares is less than $10,000. We will redeem shares automatically in one of your accounts to pay the $12.50 fee. In determining your total eligible investment amount, we will include your investments in all personal accounts (including American Century Investments Brokerage accounts) registered under your Social Security number. Personal accounts include individual accounts, joint accounts, UGMA/UTMA accounts, personal trusts, Coverdell Education Savings Accounts and IRAs (including traditional, Roth, Rollover, SEP-, SARSEP- and SIMPLE-IRAs), and certain other retirement accounts. If you have only business, business retirement, employer-sponsored or American Century Investments Brokerage accounts, you are currently not subject to this fee. If you are subject to the Account Maintenance Fee, your account value could be reduced by the fee amount.
Hypothetical Example for Comparison Purposes
The table also provides information about hypothetical account values and hypothetical expenses based on the actual expense ratio of each class of your fund and an assumed rate of return of 5% per year before expenses, which is not the actual return of a fund’s share class. The hypothetical account values and expenses may not be used to estimate the actual ending account balance or expenses you paid for the period. You may use this information to compare the ongoing costs of investing in your fund and other funds. To do so, compare this 5% hypothetical example with the 5% hypothetical examples that appear in the shareholder reports of the other funds.
Please note that the expenses shown in the table are meant to highlight your ongoing costs only and do not reflect any transactional costs, such as sales charges (loads) or redemption/exchange fees. Therefore, the table is useful in comparing ongoing costs only, and will not help you determine the relative total costs of owning different funds. In addition, if these transactional costs were included, your costs would have been higher.
|
| | | | |
| Beginning
Account Value
5/1/14 | Ending
Account Value
10/31/14 | Expenses Paid
During Period(1)5/1/14 - 10/31/14 |
Annualized
Expense Ratio(1) |
| Actual | | | | |
| Institutional Class | $1,000 | $1,073.00 | $4.18 | 0.80% |
| R6 Class | $1,000 | $1,072.90 | $3.40 | 0.65% |
| Hypothetical | | | | |
| Institutional Class | $1,000 | $1,021.17 | $4.08 | 0.80% |
| R6 Class | $1,000 | $1,021.93 | $3.31 | 0.65% |
| |
| (1) | Expenses are equal to the class's annualized expense ratio listed in the table above, multiplied by the average account value over the period, multiplied by 184, the number of days in the most recent fiscal half-year, divided by 365, to reflect the one-half year period. |
OCTOBER 31, 2014
|
| | | | |
| | Shares | Value |
| COMMON STOCKS — 98.6% | | |
| Aerospace and Defense — 2.0% | | |
B/E Aerospace, Inc.(1) | 68,452 | $ | 5,096,251 |
|
Esterline Technologies Corp.(1) | 54,762 | 6,413,178 |
|
| | | 11,509,429 |
|
| Airlines — 1.9% | | |
Spirit Airlines, Inc.(1) | 150,060 | 10,970,887 |
|
| Auto Components — 1.5% | | |
| BorgWarner, Inc. | 149,992 | 8,552,544 |
|
| Automobiles — 0.5% | | |
Tesla Motors, Inc.(1) | 12,807 | 3,095,452 |
|
| Banks — 2.8% | | |
| East West Bancorp, Inc. | 132,784 | 4,881,140 |
|
Signature Bank(1) | 40,768 | 4,938,228 |
|
SVB Financial Group(1) | 59,599 | 6,674,492 |
|
| | | 16,493,860 |
|
| Beverages — 3.3% | | |
| Brown-Forman Corp., Class B | 78,901 | 7,311,755 |
|
Constellation Brands, Inc., Class A(1) | 129,707 | 11,873,379 |
|
| | | 19,185,134 |
|
| Biotechnology — 2.3% | | |
Alexion Pharmaceuticals, Inc.(1) | 33,945 | 6,495,715 |
|
BioMarin Pharmaceutical, Inc.(1) | 41,304 | 3,407,580 |
|
Regeneron Pharmaceuticals, Inc.(1) | 8,626 | 3,396,229 |
|
| | | 13,299,524 |
|
| Building Products — 1.4% | | |
| Fortune Brands Home & Security, Inc. | 108,150 | 4,677,487 |
|
| Lennox International, Inc. | 43,351 | 3,854,771 |
|
| | | 8,532,258 |
|
| Capital Markets — 2.2% | | |
Affiliated Managers Group, Inc.(1) | 55,417 | 11,071,763 |
|
| KKR & Co. LP | 88,054 | 1,898,444 |
|
| | | 12,970,207 |
|
| Chemicals — 1.4% | | |
| Sherwin-Williams Co. (The) | 23,751 | 5,452,280 |
|
| Westlake Chemical Corp. | 36,719 | 2,590,525 |
|
| | | 8,042,805 |
|
| Commercial Services and Supplies — 1.2% | | |
| KAR Auction Services, Inc. | 107,961 | 3,277,696 |
|
Stericycle, Inc.(1) | 31,847 | 4,012,722 |
|
| | | 7,290,418 |
|
| Communications Equipment — 1.3% | | |
ARRIS Group, Inc.(1) | 93,800 | 2,815,876 |
|
Palo Alto Networks, Inc.(1) | 46,363 | 4,900,569 |
|
| | | 7,716,445 |
|
|
| | | | |
| | Shares | Value |
| Construction and Engineering — 0.8% | | |
Quanta Services, Inc.(1) | 138,494 | $ | 4,719,875 |
|
| Consumer Finance — 1.1% | | |
| Discover Financial Services | 104,603 | 6,671,579 |
|
| Containers and Packaging — 0.9% | | |
| Ball Corp. | 79,587 | 5,127,790 |
|
| Distributors — 1.5% | | |
LKQ Corp.(1) | 305,943 | 8,740,791 |
|
| Electrical Equipment — 0.8% | | |
| Acuity Brands, Inc. | 32,488 | 4,529,802 |
|
| Electronic Equipment, Instruments and Components — 0.8% | | |
| TE Connectivity Ltd. | 73,089 | 4,467,931 |
|
| Energy Equipment and Services — 1.2% | | |
| Patterson-UTI Energy, Inc. | 215,569 | 4,964,554 |
|
Weatherford International plc(1) | 145,249 | 2,384,989 |
|
| | | 7,349,543 |
|
| Food and Staples Retailing — 2.2% | | |
| Costco Wholesale Corp. | 74,025 | 9,872,714 |
|
United Natural Foods, Inc.(1) | 44,189 | 3,005,736 |
|
| | | 12,878,450 |
|
| Food Products — 2.8% | | |
Hain Celestial Group, Inc. (The)(1) | 56,123 | 6,075,315 |
|
| Hershey Co. (The) | 67,006 | 6,426,545 |
|
WhiteWave Foods Co., Class A(1) | 101,823 | 3,790,870 |
|
| | | 16,292,730 |
|
| Health Care Equipment and Supplies — 2.9% | | |
| Cooper Cos., Inc. (The) | 22,668 | 3,715,285 |
|
| Teleflex, Inc. | 116,538 | 13,299,317 |
|
| | | 17,014,602 |
|
| Health Care Providers and Services — 3.4% | | |
| AmerisourceBergen Corp. | 102,366 | 8,743,080 |
|
HCA Holdings, Inc.(1) | 87,741 | 6,146,257 |
|
Team Health Holdings, Inc.(1) | 79,654 | 4,981,561 |
|
| | | 19,870,898 |
|
| Hotels, Restaurants and Leisure — 2.8% | | |
Chipotle Mexican Grill, Inc.(1) | 13,900 | 8,868,200 |
|
| Dunkin' Brands Group, Inc. | 86,066 | 3,914,282 |
|
Panera Bread Co., Class A(1) | 23,633 | 3,820,038 |
|
| | | 16,602,520 |
|
| Household Durables — 1.5% | | |
| Harman International Industries, Inc. | 53,464 | 5,738,826 |
|
Mohawk Industries, Inc.(1) | 21,092 | 2,995,907 |
|
| | | 8,734,733 |
|
| Internet and Catalog Retail — 1.8% | | |
TripAdvisor, Inc.(1) | 119,216 | 10,569,691 |
|
| Internet Software and Services — 2.6% | | |
CoStar Group, Inc.(1) | 55,134 | 8,881,536 |
|
LinkedIn Corp., Class A(1) | 28,701 | 6,571,381 |
|
| | | 15,452,917 |
|
|
| | | | |
| | Shares | Value |
| IT Services — 3.1% | | |
Alliance Data Systems Corp.(1) | 63,869 | $ | 18,097,281 |
|
| Leisure Products — 1.1% | | |
| Polaris Industries, Inc. | 43,482 | 6,559,694 |
|
| Life Sciences Tools and Services — 1.1% | | |
Illumina, Inc.(1) | 35,109 | 6,761,291 |
|
| Machinery — 5.2% | | |
| Flowserve Corp. | 146,567 | 9,965,090 |
|
| Ingersoll-Rand plc | 88,379 | 5,534,293 |
|
Middleby Corp.(1) | 120,248 | 10,641,948 |
|
| Snap-On, Inc. | 7,782 | 1,028,314 |
|
WABCO Holdings, Inc.(1) | 34,745 | 3,383,468 |
|
| | | 30,553,113 |
|
| Media — 1.7% | | |
Charter Communications, Inc., Class A(1) | 54,489 | 8,630,513 |
|
Tribune Media Co.(1) | 17,224 | 1,154,008 |
|
| | | 9,784,521 |
|
| Multiline Retail — 0.3% | | |
Burlington Stores, Inc.(1) | 48,433 | 2,031,280 |
|
| Oil, Gas and Consumable Fuels — 3.5% | | |
Antero Resources Corp.(1) | 113,196 | 5,935,998 |
|
| Cabot Oil & Gas Corp. | 90,270 | 2,807,397 |
|
Concho Resources, Inc.(1) | 67,992 | 7,413,168 |
|
Gulfport Energy Corp.(1) | 54,165 | 2,718,000 |
|
Oasis Petroleum, Inc.(1) | 64,052 | 1,918,998 |
|
| | | 20,793,561 |
|
| Pharmaceuticals — 5.6% | | |
Actavis plc(1) | 47,812 | 11,605,885 |
|
Endo International plc(1) | 94,392 | 6,316,713 |
|
Salix Pharmaceuticals Ltd.(1) | 48,467 | 6,971,978 |
|
| Zoetis, Inc. | 216,684 | 8,051,977 |
|
| | | 32,946,553 |
|
| Professional Services — 1.1% | | |
| Nielsen NV | 158,790 | 6,746,987 |
|
| Real Estate Management and Development — 1.3% | | |
| Jones Lang LaSalle, Inc. | 58,582 | 7,920,872 |
|
| Road and Rail — 3.3% | | |
| Canadian Pacific Railway Ltd., New York Shares | 57,478 | 11,937,031 |
|
| Kansas City Southern | 61,560 | 7,558,952 |
|
| | | 19,495,983 |
|
| Semiconductors and Semiconductor Equipment — 3.2% | | |
| Avago Technologies Ltd. | 126,176 | 10,882,680 |
|
NXP Semiconductor NV(1) | 116,657 | 8,009,670 |
|
| | | 18,892,350 |
|
| Software — 7.6% | | |
Electronic Arts, Inc.(1) | 614,672 | 25,183,112 |
|
| Intuit, Inc. | 95,517 | 8,406,451 |
|
NetSuite, Inc.(1) | 32,420 | 3,522,757 |
|
Splunk, Inc.(1) | 63,608 | 4,203,217 |
|
Workday, Inc.(1) | 38,462 | 3,672,352 |
|
| | | 44,987,889 |
|
|
| | | | |
| | Shares | Value |
| Specialty Retail — 4.8% | | |
| Advance Auto Parts, Inc. | 38,133 | $ | 5,604,026 |
|
Cabela's, Inc.(1) | 23,962 | 1,150,655 |
|
O'Reilly Automotive, Inc.(1) | 33,194 | 5,838,161 |
|
Restoration Hardware Holdings, Inc.(1) | 37,596 | 3,019,711 |
|
| Signet Jewelers Ltd. | 63,225 | 7,587,632 |
|
| Tractor Supply Co. | 72,677 | 5,321,410 |
|
| | | 28,521,595 |
|
| Textiles, Apparel and Luxury Goods — 3.6% | | |
| Hanesbrands, Inc. | 84,190 | 8,891,306 |
|
Kate Spade & Co.(1) | 102,843 | 2,790,131 |
|
Michael Kors Holdings Ltd.(1) | 36,748 | 2,888,025 |
|
Under Armour, Inc., Class A(1) | 100,130 | 6,566,525 |
|
| | | 21,135,987 |
|
| Wireless Telecommunication Services — 3.2% | | |
SBA Communications Corp., Class A(1) | 165,702 | 18,613,306 |
|
TOTAL COMMON STOCKS (Cost $460,234,860) | | 580,525,078 |
|
| TEMPORARY CASH INVESTMENTS — 1.4% | | |
| Repurchase Agreement, Bank of America Merrill Lynch, (collateralized by various U.S. Treasury obligations, 1.375% - 2.625%, 12/31/14 - 2/28/19, valued at $1,936,576), in a joint trading account at 0.07%, dated 10/31/14, due 11/3/14 (Delivery value $1,898,904) | | 1,898,893 |
|
| Repurchase Agreement, Credit Suisse First Boston, Inc., (collateralized by various U.S. Treasury obligations, 0.25%, 10/15/15, valued at $774,791), in a joint trading account at 0.04%, dated 10/31/14, due 11/3/14 (Delivery value $759,560) | | 759,557 |
|
| Repurchase Agreement, Goldman Sachs & Co., (collateralized by various U.S. Treasury obligations, 0.125%, 12/31/14, valued at $1,551,063), in a joint trading account at 0.03%, dated 10/31/14, due 11/3/14 (Delivery value $1,519,119) | | 1,519,115 |
|
| SSgA U.S. Government Money Market Fund, Class N | 4,178,515 | 4,178,515 |
|
TOTAL TEMPORARY CASH INVESTMENTS (Cost $8,356,080) | | 8,356,080 |
|
TOTAL INVESTMENT SECURITIES — 100.0% (Cost $468,590,940) | | 588,881,158 |
|
OTHER ASSETS AND LIABILITIES† | | 195,948 |
|
| TOTAL NET ASSETS — 100.0% | | $ | 589,077,106 |
|
|
| | | | | | | | |
| FORWARD FOREIGN CURRENCY EXCHANGE CONTRACTS |
| Currency Purchased | Currency Sold | Counterparty | Settlement Date | Unrealized Appreciation
(Depreciation) |
| USD | 10,919,085 | CAD | 12,252,305 | JPMorgan Chase Bank N.A. | 11/28/14 | $ | 54,624 |
|
|
| | |
| NOTES TO SCHEDULE OF INVESTMENTS |
| CAD | - | Canadian Dollar |
| USD | - | United States Dollar |
| |
| † | Category is less than 0.05% of total net assets. |
See Notes to Financial Statements.
|
|
| Statement of Assets and Liabilities |
|
| | | |
| OCTOBER 31, 2014 | |
| Assets | |
| Investment securities, at value (cost of $468,590,940) | $ | 588,881,158 |
|
| Receivable for investments sold | 11,549,952 |
|
| Unrealized appreciation on forward foreign currency exchange contracts | 54,624 |
|
| Dividends and interest receivable | 95,908 |
|
| | 600,581,642 |
|
| | |
| Liabilities | |
| Payable for investments purchased | 10,900,333 |
|
| Payable for capital shares redeemed | 229,102 |
|
| Accrued management fees | 375,101 |
|
| | 11,504,536 |
|
| | |
| Net Assets | $ | 589,077,106 |
|
| | |
| Net Assets Consist of: | |
| Capital (par value and paid-in surplus) | $ | 444,217,643 |
|
| Accumulated net investment loss | (1,642,488 | ) |
| Undistributed net realized gain | 26,157,109 |
|
| Net unrealized appreciation | 120,344,842 |
|
| | $ | 589,077,106 |
|
|
| | | | |
| | Net Assets | Shares Outstanding | Net Asset Value Per Share |
| Institutional Class, $0.01 Par Value | $572,084,897 | 42,792,177 |
| $13.37 |
| R6 Class, $0.01 Par Value | $16,992,209 | 1,268,630 |
| $13.39 |
See Notes to Financial Statements.
|
| | | |
| YEAR ENDED OCTOBER 31, 2014 |
| Investment Income (Loss) |
| Income: | |
| Dividends (net of foreign taxes withheld of $25,652) | $ | 2,609,894 |
|
| Interest | 1,239 |
|
| | 2,611,133 |
|
| Expenses: | |
| Management fees | 4,260,378 |
|
| Directors' fees and expenses | 13,043 |
|
| Other expenses | 52 |
|
| | 4,273,473 |
|
| | |
| Net investment income (loss) | (1,662,340 | ) |
| | |
| Realized and Unrealized Gain (Loss) | |
| Net realized gain (loss) on: | |
| Investment transactions | 26,477,466 |
|
| Foreign currency transactions | 262,555 |
|
| | 26,740,021 |
|
| | |
| Change in net unrealized appreciation (depreciation) on: | |
| Investments | 20,361,773 |
|
| Translation of assets and liabilities in foreign currencies | 4,331 |
|
| | 20,366,104 |
|
| | |
| Net realized and unrealized gain (loss) | 47,106,125 |
|
| | |
| Net Increase (Decrease) in Net Assets Resulting from Operations | $ | 45,443,785 |
|
See Notes to Financial Statements.
|
|
| Statement of Changes in Net Assets |
|
| | | | | | |
| YEARS ENDED OCTOBER 31, 2014 AND OCTOBER 31, 2013 |
| Increase (Decrease) in Net Assets | October 31, 2014 | October 31, 2013 |
| Operations | | |
| Net investment income (loss) | $ | (1,662,340 | ) | $ | (396,623 | ) |
| Net realized gain (loss) | 26,740,021 |
| 56,759,936 |
|
| Change in net unrealized appreciation (depreciation) | 20,366,104 |
| 46,370,878 |
|
| Net increase (decrease) in net assets resulting from operations | 45,443,785 |
| 102,734,191 |
|
| | | |
| Distributions to Shareholders | | |
| From net investment income: | | |
| Institutional Class | — |
| (530,477 | ) |
| From net realized gains: | | |
| Institutional Class | (51,250,181 | ) | — |
|
| R6 Class | (433,893 | ) | — |
|
| Decrease in net assets from distributions | (51,684,074 | ) | (530,477 | ) |
| | | |
| Capital Share Transactions | | |
| Net increase (decrease) in net assets from capital share transactions (Note 5) | 131,572,665 |
| 64,111,641 |
|
| | | |
| Net increase (decrease) in net assets | 125,332,376 |
| 166,315,355 |
|
| | | |
| Net Assets | | |
| Beginning of period | 463,744,730 |
| 297,429,375 |
|
| End of period | $ | 589,077,106 |
| $ | 463,744,730 |
|
| | | |
| Accumulated net investment loss | $ | (1,642,488 | ) | $ | (50,293 | ) |
See Notes to Financial Statements.
|
|
| Notes to Financial Statements |
OCTOBER 31, 2014
1. Organization
American Century Mutual Funds, Inc. (the corporation) is registered under the Investment Company Act of 1940, as amended (the 1940 Act), as an open-end management investment company and is organized as a Maryland corporation. NT Heritage Fund (the fund) is one fund in a series issued by the corporation. The fund is diversified as defined under the 1940 Act. The fund's investment objective is to seek long-term capital growth. The fund is not permitted to invest in securities issued by companies assigned the Global Industry Classification Standard for the tobacco industry.
The fund offers the Institutional Class and the R6 Class, which have different fees and expenses. The difference in the fee structures between the classes is not the result of any difference in advisory or custodial fees or other expenses related to management of the fund’s assets, which do not vary by class. The fund’s R6 Class shares are available for purchase exclusively by certain American Century Investments funds of funds that are offered only through employer-sponsored retirement plans where a financial intermediary provides retirement recordkeeping services to plan participants. Because financial intermediaries do not receive any service, distribution or administrative fees for offering such funds of funds, American Century Investment Management, Inc. (ACIM) (the investment advisor) is able to charge the R6 Class a lower unified management fee. Sale of the R6 Class commenced on July 26, 2013.
2. Significant Accounting Policies
The following is a summary of significant accounting policies consistently followed by the fund in preparation of its financial statements. The fund is an investment company and follows accounting and reporting guidance in accordance with accounting principles generally accepted in the United States of America. This may require management to make certain estimates and assumptions at the date of the financial statements. Actual results could differ from these estimates. Management evaluated the impact of events or transactions occurring through the date the financial statements were issued that would merit recognition or disclosure.
Investment Valuations — The fund determines the fair value of its investments and computes its net asset value per share at the close of regular trading (usually 4 p.m. Eastern time) on the New York Stock Exchange (NYSE) on each day the NYSE is open. The Board of Directors has adopted valuation policies and procedures to guide the investment advisor in the fund’s investment valuation process and to provide methodologies for the oversight of the fund’s pricing function.
Equity securities that are listed or traded on a domestic securities exchange are valued at the last reported sales price or at the official closing price as provided by the exchange. Equity securities traded on foreign securities exchanges are generally valued at the closing price of such securities on the exchange where primarily traded or at the close of the NYSE, if that is earlier. If no last sales price is reported, or if local convention or regulation so provides, the mean of the latest bid and asked prices may be used. Securities traded over-the-counter are valued at the mean of the latest bid and asked prices, the last sales price, or the official closing price. Equity securities initially expressed in local currencies are translated into U.S. dollars at the mean of the appropriate currency exchange rate at the close of the NYSE as provided by an independent pricing service.
Fixed income securities maturing within 60 days at the time of purchase may be valued at cost, plus or minus any amortized discount or premium or at the evaluated mean as provided by an independent pricing service. Evaluated mean prices are commonly derived through utilization of market models, which may consider, among other factors: trade data, quotations from dealers and active market makers, relevant yield curve and spread data, related sector levels, creditworthiness, trade data or market information on comparable securities, and other relevant security specific information.
Open-end management investment companies are valued at the reported net asset value per share. Repurchase agreements are valued at cost, which approximates fair value. Forward foreign currency exchange contracts are valued at the mean of the appropriate forward exchange rate at the close of the NYSE as provided by an independent pricing service.
If the fund determines that the market price for an investment is not readily available or the valuation methods mentioned above do not reflect an investment’s fair value, such investment is valued as determined in good faith by the Board of Directors or its delegate, in accordance with policies and procedures adopted by the Board of Directors. In its determination of fair value, the fund may review several factors including, but not limited to, market information regarding the specific investment or comparable investments and correlation with other investment types, futures indices or general market indicators. Circumstances that may cause the fund to use these procedures to value an investment include, but are not limited to: an investment has been declared in default or is distressed; trading in a security has been suspended during the trading day or a security is not actively trading on its principal exchange; prices received from a regular pricing source are deemed unreliable; or there is a foreign market holiday and no trading occurred.
The fund monitors for significant events occurring after the close of an investment’s primary exchange but before the fund’s net asset value per share is determined. Significant events may include, but are not limited to: corporate announcements and transactions; governmental action and political unrest that could impact a specific investment or an investment sector; or armed conflicts, natural disasters and similar events that could affect investments in a specific country or region. The fund also monitors for significant fluctuations between domestic and foreign markets, as evidenced by the U.S. market or such other indicators that the Board of Directors, or its delegate, deems appropriate. If significant fluctuations in foreign markets are identified, the fund may apply a model-derived factor to the closing price of equity securities traded on foreign securities exchanges. The factor is based on observable market data as provided by an independent pricing service.
Security Transactions — Security transactions are accounted for as of the trade date. Net realized gains and losses are determined on the identified cost basis, which is also used for federal income tax purposes.
Investment Income — Dividend income less foreign taxes withheld, if any, is recorded as of the ex-dividend date. Distributions received on securities that represent a return of capital or long-term capital gain are recorded as a reduction of cost of investments and/or as a realized gain. The fund may estimate the components of distributions received that may be considered nontaxable distributions or long-term capital gain distributions for income tax purposes. Interest income is recorded on the accrual basis and includes accretion of discounts and amortization of premiums.
Foreign Currency Translations — All assets and liabilities initially expressed in foreign currencies are translated into U.S. dollars at prevailing exchange rates at period end. The fund may enter into spot foreign currency exchange contracts to facilitate transactions denominated in a foreign currency. Purchases and sales of investment securities, dividend and interest income, spot foreign currency exchange contracts, and expenses are translated at the rates of exchange prevailing on the respective dates of such transactions. Net realized and unrealized foreign currency exchange gains or losses related to investment securities are a component of net realized gain (loss) on investment transactions and change in net unrealized appreciation (depreciation) on investments, respectively.
Repurchase Agreements — The fund may enter into repurchase agreements with institutions that ACIM has determined are creditworthy pursuant to criteria adopted by the Board of Directors. The fund requires that the collateral, represented by securities, received in a repurchase transaction be transferred to the custodian in a manner sufficient to enable the fund to obtain those securities in the event of a default under the repurchase agreement. ACIM monitors, on a daily basis, the securities transferred to ensure the value, including accrued interest, of the securities under each repurchase agreement is equal to or greater than amounts owed to the fund under each repurchase agreement.
Joint Trading Account — Pursuant to an Exemptive Order issued by the Securities and Exchange Commission, the fund, along with certain other funds in the American Century Investments family of funds, may transfer uninvested cash balances into a joint trading account. These balances are invested in one or more repurchase agreements that are collateralized by U.S. Treasury or Agency obligations.
Income Tax Status — It is the fund’s policy to distribute substantially all net investment income and net realized gains to shareholders and to otherwise qualify as a regulated investment company under provisions of the Internal Revenue Code. Accordingly, no provision has been made for income taxes. The fund files U.S. federal, state, local and non-U.S. tax returns as applicable. The fund's tax returns are subject to examination by the relevant taxing authority until expiration of the applicable statute of limitations, which is generally three years from the date of filing but can be longer in certain jurisdictions. At this time, management believes there are no uncertain tax positions which, based on their technical merit, would not be sustained upon examination and for which it is reasonably possible that the total amounts of unrecognized tax benefits will significantly change in the next twelve months.
Multiple Class — All shares of the fund represent an equal pro rata interest in the net assets of the class to which such shares belong, and have identical voting, dividend, liquidation and other rights and the same terms and conditions, except for class specific expenses and exclusive rights to vote on matters affecting only individual classes. Income, non-class specific expenses, and realized and unrealized capital gains and losses of the fund are allocated to each class of shares based on their relative net assets.
Distributions to Shareholders — Distributions from net investment income and net realized gains, if any, are generally declared and paid annually.
Indemnifications — Under the corporation’s organizational documents, its officers and directors are indemnified against certain liabilities arising out of the performance of their duties to the fund. In addition, in the normal course of business, the fund enters into contracts that provide general indemnifications. The maximum exposure under these arrangements is unknown as this would involve future claims that may be made against a fund. The risk of material loss from such claims is considered by management to be remote.
3. Fees and Transactions with Related Parties
Certain officers and directors of the corporation are also officers and/or directors of American Century Companies, Inc. (ACC). The corporation’s investment advisor, ACIM, the corporation's distributor, American Century Investment Services, Inc., and the corporation’s transfer agent, American Century Services, LLC, are wholly owned, directly or indirectly, by ACC. Various funds issued by American Century Asset Allocation Portfolios, Inc. own, in aggregate, 100% of the shares of the fund. Related parties do not invest in the fund for the purpose of exercising management or control.
Management Fees — The corporation has entered into a management agreement with ACIM, under which ACIM provides the fund with investment advisory and management services in exchange for a single, unified management fee (the fee) per class. The agreement provides that all expenses of managing and operating the fund, except distribution and service fees, brokerage expenses, taxes, interest, fees and expenses of the independent directors (including legal counsel fees), and extraordinary expenses, will be paid by ACIM. The fee is computed and accrued daily based on each class's daily net assets and paid monthly in arrears. The annual management fee is 0.80% for the Institutional Class and 0.65% for the R6 Class.
Directors' Fees and Expenses — The Board of Directors is responsible for overseeing the investment advisor’s management and operations of the fund. The directors receive detailed information about the fund and its investment advisor regularly throughout the year, and meet at least quarterly with management of the investment advisor to review reports about fund operations. Fees and expenses incurred in conjunction with the directors during the year ended October 31, 2014 are detailed in the Statement of Operations. The fund’s officers do not receive compensation from the fund.
4. Investment Transactions
Purchases and sales of investment securities, excluding short-term investments, for the year ended October 31, 2014 were $482,420,443 and $401,326,174, respectively.
5. Capital Share Transactions
Transactions in shares of the fund were as follows:
|
| | | | | | | | | |
| | Year ended October 31, 2014 | Year ended October 31, 2013(1) |
| | Shares | Amount | Shares | Amount |
| Institutional Class/Shares Authorized | 150,000,000 | | 150,000,000 |
| |
| Sold | 7,340,306 | $ | 94,685,851 |
| 6,738,647 |
| $ | 79,054,475 |
|
| Issued in reinvestment of distributions | 4,197,394 | 51,250,181 |
| 48,534 |
| 530,477 |
|
| Redeemed | (2,037,795) | (26,819,633) |
| (1,529,071) |
| (19,331,015) |
|
| | 9,499,905 | 119,116,399 |
| 5,258,110 |
| 60,253,937 |
|
| R6 Class/Shares Authorized | 50,000,000 | | 50,000,000 |
| |
| Sold | 1,085,310 | 13,736,485 |
| 281,120 |
| 3,874,593 |
|
| Issued in reinvestment of distributions | 35,507 | 433,893 |
| — |
| — |
|
| Redeemed | (132,053) | (1,714,112) |
| (1,254) |
| (16,889) |
|
| | 988,764 | 12,456,266 |
| 279,866 |
| 3,857,704 |
|
| Net increase (decrease) | 10,488,669 | $ | 131,572,665 |
| 5,537,976 |
| $ | 64,111,641 |
|
| |
| (1) | July 26, 2013 (commencement of sale) through October 31, 2013 for the R6 Class. |
6. Fair Value Measurements
The fund’s investments valuation process is based on several considerations and may use multiple inputs to determine the fair value of the investments held by the fund. In conformity with accounting principles generally accepted in the United States of America, the inputs used to determine a valuation are classified into three broad levels.
| |
| • | Level 1 valuation inputs consist of unadjusted quoted prices in an active market for identical investments. |
| |
| • | Level 2 valuation inputs consist of direct or indirect observable market data (including quoted prices for comparable investments, evaluations of subsequent market events, interest rates, prepayment speeds, credit risk, etc.). These inputs also consist of quoted prices for identical investments initially expressed in local currencies that are adjusted through translation into U.S. dollars. |
| |
| • | Level 3 valuation inputs consist of unobservable data (including a fund’s own assumptions). |
The level classification is based on the lowest level input that is significant to the fair valuation measurement. The valuation inputs are not necessarily an indication of the risks associated with investing in these securities or other financial instruments. There were no significant transfers between levels during the period.
The following is a summary of the level classifications as of period end. The Schedule of Investments provides additional information on the fund’s portfolio holdings.
|
| | | | | | | | |
| | Level 1 | Level 2 | Level 3 |
| Assets | | | |
| Investment Securities | | | |
| Common Stocks | $ | 580,525,078 |
| — |
| — |
|
| Temporary Cash Investments | 4,178,515 |
| $ | 4,177,565 |
| — |
|
| | $ | 584,703,593 |
| $ | 4,177,565 |
| — |
|
| Other Financial Instruments | | | |
| Forward Foreign Currency Exchange Contracts | — |
| $ | 54,624 |
| — |
|
7. Derivative Instruments
Foreign Currency Risk — The fund is subject to foreign currency exchange rate risk in the normal course of pursuing its investment objectives. The value of foreign investments held by a fund may be significantly affected by changes in foreign currency exchange rates. The dollar value of a foreign security generally decreases when the value of the dollar rises against the foreign currency in which the security is denominated and tends to increase when the value of the dollar declines against such foreign currency. A fund may enter into forward foreign currency exchange contracts to reduce a fund's exposure to foreign currency exchange rate fluctuations. The net U.S. dollar value of foreign currency underlying all contractual commitments held by a fund and the resulting unrealized appreciation or depreciation are determined daily. Realized gain or loss is recorded upon the termination of the contract. Net realized and unrealized gains or losses occurring during the holding period of forward foreign currency exchange contracts are a component of net realized gain (loss) on foreign currency transactions and change in net unrealized appreciation (depreciation) on translation of assets and liabilities in foreign currencies, respectively. A fund bears the risk of an unfavorable change in the foreign currency exchange rate underlying the forward contract. Additionally, losses, up to the fair value, may arise if the counterparties do not perform under the contract terms. The fund's average U.S. dollar exposure to foreign currency risk derivative instruments held during the period was $7,419,984.
The value of foreign currency risk derivative instruments as of October 31, 2014, is disclosed on the Statement of Assets and Liabilities as an asset of $54,624 in unrealized appreciation on forward foreign currency exchange contracts. For the year ended October 31, 2014, the effect of foreign currency risk derivative instruments on the Statement of Operations was $265,516 in net realized gain (loss) on foreign currency transactions and $4,331 in change in net unrealized appreciation (depreciation) on translation of assets and liabilities in foreign currencies.
8. Risk Factors
The fund invests in common stocks of small companies. Because of this, it may be subject to greater risk and market fluctuations than a fund investing in larger, more established companies.
9. Federal Tax Information
The tax character of distributions paid during the years ended October 31, 2014 and October 31, 2013 were as follows:
|
| | | | | | |
| | 2014 | 2013 |
| Distributions Paid From | | |
| Ordinary income | $ | 9,980,242 |
| $ | 530,477 |
|
| Long-term capital gains | $ | 41,703,832 |
| — |
|
The book-basis character of distributions made during the year from net investment income or net realized gains may differ from their ultimate characterization for federal income tax purposes. These differences reflect the differing character of certain income items and net realized gains and losses for financial statement and tax purposes, and may result in reclassification among certain capital accounts on the financial statements.
As of October 31, 2014, the federal tax cost of investments and the components of distributable earnings on a tax-basis were as follows:
|
| | | |
| Federal tax cost of investments | $ | 469,975,204 |
|
| Gross tax appreciation of investments | $ | 128,150,054 |
|
| Gross tax depreciation of investments | (9,244,100 | ) |
| Net tax appreciation (depreciation) of investments | $ | 118,905,954 |
|
| Undistributed ordinary income | — |
|
| Accumulated long-term gains | $ | 27,541,373 |
|
| Late-year ordinary loss deferral | $ | (1,587,864 | ) |
The difference between book-basis and tax-basis unrealized appreciation (depreciation) is attributable primarily to the tax deferral of losses on wash sales.
Loss deferrals represent certain qualified losses that the fund has elected to treat as having been incurred in the following fiscal year for federal income tax purposes.
|
| | | | | | | | | | | | | | | |
| For a Share Outstanding Throughout the Years Ended October 31 (except as noted) | | | | | | |
| Per-Share Data | | | | | | | | | Ratios and Supplemental Data | |
| | | Income From Investment Operations: | Distributions From: | | | Ratio to Average Net Assets of: | | |
| | Net Asset
Value,
Beginning
of Period | Net
Investment
Income
(Loss)(1) | Net
Realized
and
Unrealized
Gain (Loss) | Total From
Investment
Operations | Net
Investment
Income | Net
Realized
Gains | Total
Distributions | Net Asset
Value,
End
of Period | Total
Return(2) | Operating
Expenses | Net
Investment
Income
(Loss) | Portfolio
Turnover
Rate | Net
Assets,
End of
Period
(in thousands) |
| Institutional Class | | | | | | | | | | | | |
| 2014 | $13.81 | (0.04) | 1.08 | 1.04 | — | (1.48) | (1.48) | $13.37 | 8.53% | 0.80% | (0.31)% | 76% |
| $572,085 |
|
| 2013 | $10.61 | (0.01) | 3.23 | 3.22 | (0.02) | — | (0.02) | $13.81 | 30.38% | 0.80% | (0.10)% | 113% |
| $459,877 |
|
| 2012 | $10.03 | —(3) | 0.74 | 0.74 | — | (0.16) | (0.16) | $10.61 | 7.59% | 0.81% | (0.02)% | 92% |
| $297,429 |
|
| 2011 | $9.44 | (0.03) | 0.62 | 0.59 | — | — | — | $10.03 | 6.25% | 0.80% | (0.27)% | 115% |
| $215,060 |
|
| 2010 | $7.50 | (0.02) | 1.96 | 1.94 | —(3) | — | —(3) | $9.44 | 26.05% | 0.80% | (0.26)% | 152% |
| $161,304 |
|
| R6 Class | | | | | | | | | | | | |
| 2014 | $13.82 | (0.02) | 1.07 | 1.05 | — | (1.48) | (1.48) | $13.39 | 8.60% | 0.65% | (0.16)% | 76% |
| $16,992 |
|
2013(4) | $12.92 | —(3) | 0.90 | 0.90 | — | — | — | $13.82 | 6.97% | 0.65%(5) | 0.03%(5) | 113%(6) |
| $3,867 |
|
|
|
| Notes to Financial Highlights |
| |
| (1) | Computed using average shares outstanding throughout the period. |
| |
| (2) | Total returns are calculated based on the net asset value of the last business day. Total returns for periods less than one year are not annualized. |
| |
| (3) | Per-share amount was less than $0.005. |
| |
| (4) | July 26, 2013 (commencement of sale) through October 31, 2013. |
| |
| (6) | Portfolio turnover is calculated at the fund level. Percentage indicated was calculated for the year ended October 31, 2013. |
See Notes to Financial Statements.
|
|
| Report of Independent Registered Public Accounting Firm |
To the Board of Directors and Shareholders of
American Century Mutual Funds, Inc.:
We have audited the accompanying statement of assets and liabilities, including the schedule of investments, of NT Heritage Fund (the “Fund”), one of the funds constituting American Century Mutual Funds, Inc., as of October 31, 2014, and the related statement of operations for the year then ended, the statements of changes in net assets for each of the two years in the period then ended, and the financial highlights for each of the periods presented. These financial statements and financial highlights are the responsibility of the Fund's management. Our responsibility is to express an opinion on these financial statements and financial highlights based on our audits.
We conducted our audits in accordance with the standards of the Public Company Accounting Oversight Board (United States). Those standards require that we plan and perform the audit to obtain reasonable assurance about whether the financial statements and financial highlights are free of material misstatement. The Fund is not required to have, nor were we engaged to perform, an audit of its internal control over financial reporting. Our audits included consideration of internal control over financial reporting as a basis for designing audit procedures that are appropriate in the circumstances, but not for the purpose of expressing an opinion on the effectiveness of the Fund's internal control over financial reporting. Accordingly, we express no such opinion. An audit also includes examining, on a test basis, evidence supporting the amounts and disclosures in the financial statements, assessing the accounting principles used and significant estimates made by management, as well as evaluating the overall financial statement presentation. Our procedures included confirmation of securities owned as of October 31, 2014, by correspondence with the custodian and brokers; where replies were not received from brokers, we performed other auditing procedures. We believe that our audits provide a reasonable basis for our opinion.
In our opinion, the financial statements and financial highlights referred to above present fairly, in all material respects, the financial position of NT Heritage Fund of American Century Mutual Funds, Inc. as of October 31, 2014, the results of its operations for the year then ended, the changes in its net assets for each of the two years in the period then ended, and the financial highlights for each of the periods presented, in conformity with accounting principles generally accepted in the United States of America.
DELOITTE & TOUCHE LLP
Kansas City, Missouri
December 17, 2014
The Board of Directors
The individuals listed below serve as directors of the funds. Each director will continue to serve in this capacity until death, retirement, resignation or removal from office. The board has adopted a mandatory retirement age for directors who are not “interested persons,” as that term is defined in the Investment Company Act (independent directors). Independent directors shall retire by December 31 of the year in which they reach their 75th birthday.
Mr. Thomas is an “interested person” because he currently serves as President and Chief Executive Officer of American Century Companies, Inc. (ACC), the parent company of American Century Investment Management, Inc. (ACIM or the advisor). Mr. Fink is treated as an “interested person” because of his recent employment with ACC and American Century Services, LLC (ACS). The other directors (more than three-fourths of the total number) are independent. They are not employees, directors or officers of, and have no financial interest in, ACC or any of its wholly owned, direct or indirect, subsidiaries, including ACIM, American Century Investment Services, Inc. (ACIS) and ACS, and they do not have any other affiliations, positions, or relationships that would cause them to be considered “interested persons” under the Investment Company Act. The directors serve in this capacity for seven (in the case of Mr. Thomas, 15) registered investment companies in the American Century Investments family of funds.
The following table presents additional information about the directors. The mailing address for each director is 4500 Main Street, Kansas City, Missouri 64111.
|
| | | | | |
Name
(Year of Birth) | Position(s) Held with Funds | Length of Time Served | Principal Occupation(s) During Past 5 Years | Number of American Century Portfolios Overseen by Director | Other Directorships Held During Past
5 Years |
| Independent Directors | | | | |
Thomas A. Brown
(1940) | Director | Since 1980 | Managing Member, Associated Investments, LLC (real estate investment company); Brown Cascade Properties, LLC (real estate investment company) (2001 to 2009) | 73 | None |
Andrea C. Hall
(1945) | Director | Since 1997 | Retired | 73 | None |
Jan M. Lewis
(1957) | Director | Since 2011 | Retired; President and Chief Executive Officer, Catholic Charities of Northeast Kansas (human services organization) (2006 to 2013) | 73 | None |
James A. Olson
(1942) | Director and Chairman of the Board | Since 2007 (Chairman since 2014) | Member, Plaza Belmont LLC (private equity fund manager) | 73 | Saia, Inc. (2002 to 2012) and EPR Properties (2003 to 2013) |
|
| | | | | |
Name
(Year of Birth) | Position(s) Held with Funds | Length of Time Served | Principal Occupation(s) During Past 5 Years | Number of American Century Portfolios Overseen by Director | Other Directorships Held During Past
5 Years |
| Independent Directors | | | | |
M. Jeannine Strandjord
(1945) | Director | Since 1994 | Retired | 73 | Euronet Worldwide Inc.; Charming Shoppes, Inc. (2006 to 2010); and DST Systems Inc. (1996 to 2012) |
John R. Whitten
(1946) | Director | Since 2008 | Retired | 73 | Rudolph Technologies, Inc. |
Stephen E. Yates
(1948) | Director | Since 2012 | Retired; Executive Vice President, Technology & Operations, KeyCorp. (computer services) (2004 to 2010) | 73 | Applied Industrial Technologies, Inc. (2001 to 2010) |
| Interested Directors | | | | |
Barry Fink
(1955) | Director | Since 2012 | Retired; Executive Vice President, ACC (September 2007 to February 2013); President, ACS (October 2007 to February 2013); Chief Operating Officer, ACC (September 2007 to November 2012) | 73 | None |
Jonathan S. Thomas
(1963) | Director and President | Since 2007 | President and Chief Executive Officer, ACC (March 2007 to present). Also serves as Chief Executive Officer, ACS; Executive Vice President, ACIM; Director, ACC, ACIM and other ACC subsidiaries | 118 | BioMed Valley Discoveries, Inc. |
The Statement of Additional Information has additional information about the fund's directors and is available without charge, upon request, by calling 1-800-345-2021.
Officers
The following table presents certain information about the executive officers of the funds. Each officer serves as an officer for each of the 15 investment companies in the American Century family of funds, unless otherwise noted. No officer is compensated for his or her service as an officer of the funds. The listed officers are interested persons of the funds and are appointed or re-appointed on an annual basis. The mailing address for each officer listed below is 4500 Main Street, Kansas City, Missouri 64111.
|
| | |
Name (Year of Birth) | Offices with the Funds | Principal Occupation(s) During the Past Five Years |
Jonathan S.
Thomas
(1963) | Director and
President
since 2007 | President and Chief Executive Officer, ACC (March 2007 to present). Also serves as Chief Executive Officer, ACS; Executive Vice President, ACIM; Director, ACC, ACIM and other ACC subsidiaries |
Amy D. Shelton
(1964) | Chief Compliance
Officer since 2014 | Chief Compliance Officer, American Century funds, (March 2014 to present); Chief Compliance Officer, ACIM (February 2014 to present); Chief Compliance Officer, ACIS (October 2009 to present); Vice President, Client Interactions and Marketing, ACIS (February 2013 to January 2014); Director, Client Interactions and Marketing, ACIS (June 2007 to January 2013). Also serves as Vice President, ACIS |
Charles A.
Etherington
(1957) | General Counsel
since 2007 and
Senior Vice
President since 2006 | Attorney, ACC (February 1994 to present); Vice President, ACC (November 2005 to present); General Counsel, ACC (March 2007 to present). Also serves as General Counsel, ACIM, ACS, ACIS and other ACC subsidiaries; and Senior Vice President, ACIM and ACS |
C. Jean Wade
(1964) | Vice President,
Treasurer and
Chief Financial
Officer since 2012 | Vice President, ACS (February 2000 to present) |
Robert J.
Leach
(1966) | Vice President
since 2006 and
Assistant Treasurer
since 2012 | Vice President, ACS (February 2000 to present) |
David H.
Reinmiller
(1963) | Vice President
since 2000 | Attorney, ACC (January 1994 to present); Associate General Counsel, ACC (January 2001 to present). Also serves as Vice President, ACIM and ACS |
Ward D.
Stauffer
(1960) | Secretary
since 2005 | Attorney, ACC (June 2003 to present) |
|
|
| Approval of Management Agreement |
At a meeting held on June 18, 2014, the Fund’s Board of Directors unanimously approved the renewal of the management agreement pursuant to which American Century Investment Management, Inc. (the “Advisor”) acts as the investment advisor for the Fund. Under Section 15(c) of the Investment Company Act, contracts for investment advisory services are required to be reviewed, evaluated, and approved by a majority of a fund’s directors (the “Directors”), including a majority of the independent Directors, each year.
Prior to its consideration of the renewal of the management agreement, the Board requested and reviewed extensive data and information compiled by the Advisor and certain independent providers of evaluation data concerning the Fund and the services provided to the Fund by the Advisor. This review was in addition to the oversight and evaluation undertaken by the Board and its committees on a continuous basis and the information received was supplemental to the extensive information that the Board and its committees receive and consider throughout the year.
In connection with its consideration of the renewal of the management agreement, the Board’s review and evaluation of the services provided by the Advisor included, but was not limited to, the following:
| |
| • | the nature, extent, and quality of investment management, shareholder services, and other services provided by the Advisor to the Fund; |
| |
| • | the wide range of other programs and services the Advisor provides to the Fund and its shareholders on a routine and non-routine basis; |
| |
| • | the Fund’s investment performance compared to appropriate benchmarks and/or a peer group of other mutual funds with similar investment objectives and strategies; |
| |
| • | the cost of owning the Fund compared to the cost of owning similar funds; |
| |
| • | the Advisor’s compliance policies, procedures, and regulatory experience; |
| |
| • | financial data showing the cost of services provided to the Fund, the profitability of the Fund to the Advisor, and the overall profitability of the Advisor; |
| |
| • | possible economies of scale associated with the Advisor’s management of the Fund and other accounts under its management; |
| |
| • | the services provided and charges to other investment management clients of the Advisor; |
| |
| • | acquired fund fees and expenses; and |
| |
| • | any collateral benefits derived by the Advisor from the management of the Fund. |
In keeping with its practice, the Board held two in-person meetings and one telephonic meeting to review and discuss the information provided. The independent Directors also had the benefit of the advice of their independent counsel throughout the process.
Factors Considered
The Directors considered all of the information provided by the Advisor, the independent data providers, and independent counsel, and evaluated such information for the Fund. In connection with their review, the Directors did not identify any single factor as being all-important or controlling, and each Director may have attributed different levels of importance to different factors. In deciding to renew the management agreement, the Board based its decision on a number of factors, including the following:
Nature, Extent and Quality of Services — Generally. Under the management agreement, the Advisor is responsible for providing or arranging for all services necessary for the operation of the Fund. The Board noted that under the management agreement, the Advisor provides or arranges at its own expense a wide variety of services including:
| |
| • | constructing and designing the Fund |
| |
| • | portfolio research and security selection |
| |
| • | initial capitalization/funding |
| |
| • | daily valuation of the Fund’s portfolio |
| |
| • | shareholder servicing and transfer agency, including shareholder confirmations, recordkeeping, and communications |
| |
| • | legal services (except the independent Directors’ counsel) |
| |
| • | regulatory and portfolio compliance |
| |
| • | marketing and distribution (except Rule 12b-1 plans) |
The Board noted that many of these services have expanded over time both in terms of quantity and complexity in response to shareholder demands, competition in the industry, changing distribution channels, and the changing regulatory environment.
Investment Management Services. The nature of the investment management services provided to the Fund is quite complex and allows Fund shareholders access to professional money management, instant diversification of their investments within an asset class, the opportunity to easily diversify among asset classes by investing in or exchanging among various American Century Investments funds, and liquidity. In evaluating investment performance, the Board expects the Advisor to manage the Fund in accordance with its investment objectives and approved strategies. Further, the Directors recognize that the Advisor has an obligation to monitor trading activities, and in particular to seek the best execution of fund trades, and to evaluate the use of and payment for research. In providing these services, the Advisor utilizes teams of investment professionals (portfolio managers, analysts, research assistants, and securities traders) who require extensive information technology, research, training, compliance and other systems to conduct their business. The Board, directly and through its Fund Performance Review Committee, regularly reviews investment performance information for the Fund, together with comparative information for appropriate benchmarks and/or peer groups of similarly-managed funds, over different time horizons. The Directors also review detailed performance information during the management agreement approval process. If performance concerns are identified, the Fund receives special reviews until performance improves, during which the Board discusses with the Advisor the reasons for such results (e.g., market conditions, security selection) and any efforts being undertaken to improve performance. The Fund’s performance was below its benchmark for the one-, three-, and five-year periods reviewed by the Board. The Board discussed the Fund’s performance with the Advisor and was satisfied with the efforts being undertaken by the Advisor. The Board found the investment management services provided by the Advisor to the Fund to be satisfactory and consistent with the management agreement.
Shareholder and Other Services. Under the management agreement, the Advisor provides the Fund with a comprehensive package of transfer agency, shareholder, and other services. The Board, directly and through various committees of the Board, regularly reviews reports and evaluations of such services at its regular meetings. These reports include, but are not limited to, information regarding the operational efficiency and accuracy of the shareholder and transfer agency services provided, staffing levels, shareholder satisfaction (as measured by external as well as internal sources), technology support, new products and services offered to Fund shareholders, securities trading activities, portfolio valuation services, auditing services, and legal and operational compliance activities. Certain aspects of shareholder and transfer agency service level efficiency and the quality of securities trading activities are measured by independent third party providers
and are presented in comparison to other fund groups not managed by the Advisor. The Board found the services provided by the Advisor to the Fund under the management agreement to be competitive and of high quality.
Costs of Services and Profitability. The Advisor provides detailed information concerning its cost of providing various services to the Fund, its profitability in managing the Fund (pre- and post-distribution), its overall profitability, and its financial condition. The Directors have reviewed with the Advisor the methodology used to prepare this financial information. The financial information regarding the Advisor is considered in evaluating the Advisor’s financial condition, its ability to continue to provide services under the management agreement, and the reasonableness of the current management fee. The Board concluded that the Advisor’s profits were reasonable in light of the services provided to the Fund.
Ethics. The Board generally considers the Advisor’s commitment to providing quality services to shareholders and to conducting its business ethically. They noted that the Advisor’s practices generally meet or exceed industry best practices.
Economies of Scale. The Board also reviewed information provided by the Advisor regarding the possible existence of economies of scale in connection with the management of the Fund. The Board concluded that economies of scale are difficult to measure and predict with precision, especially on a fund-by-fund basis. The Board concluded that the Advisor is appropriately sharing economies of scale through its competitive fee structure, offering competitive fees from fund inception, and through reinvestment in its business to provide shareholders additional content and services.
Comparison to Other Funds’ Fees. The management agreement provides that the Fund pays the Advisor a single, all-inclusive (or unified) management fee for providing all services necessary for the management and operation of the Fund, other than brokerage expenses, taxes, interest, extraordinary expenses, and the fees and expenses of the Fund’s independent directors (including their independent legal counsel) and expenses incurred in connection with the provision of shareholder services and distribution services under a plan adopted pursuant to Rule 12b-1 under the 1940 Act. Under the unified fee structure, the Advisor is responsible for providing all investment advisory, custody, audit, administrative, compliance, recordkeeping, marketing and shareholder services, or arranging and supervising third parties to provide such services. By contrast, most other funds are charged a variety of fees, including an investment advisory fee, a transfer agency fee, an administrative fee, distribution charges and other expenses. Other than their investment advisory fees and any applicable Rule 12b-1 distribution fees, all other components of the total fees charged by these other funds may be increased without shareholder approval. The Board believes the unified fee structure is a benefit to Fund shareholders because it clearly discloses to shareholders the cost of owning Fund shares, and, since the unified fee cannot be increased without a vote of Fund shareholders, it shifts to the Advisor the risk of increased costs of operating the Fund and provides a direct incentive to minimize administrative inefficiencies. Part of the Board’s analysis of fee levels involves reviewing certain evaluative data compiled by an independent provider comparing the Fund’s unified fee to the total expense ratios of its peers. The unified fee charged to shareholders of the Fund was below the median of the total expense ratios of the Fund’s peer expense universe and was within the range of its peer expense group. The Board concluded that the management fee paid by the Fund to the Advisor under the management agreement is reasonable in light of the services provided to the Fund.
Comparison to Fees and Services Provided to Other Clients of the Advisor. The Board also requested and received information from the Advisor concerning the nature of the services, fees, costs and profitability of its advisory services to advisory clients other than the Fund. They observed that these varying types of client accounts require different services and involve different regulatory and entrepreneurial risks than the management of the Fund. The Board analyzed this information and concluded that the fees charged and services provided to the Fund were reasonable by comparison.
Collateral or “Fall-Out” Benefits Derived by the Advisor. The Board considered the existence of collateral benefits the Advisor may receive as a result of its relationship with the Fund. They concluded that the Advisor’s primary business is managing mutual funds and it generally does not use fund or shareholder information to generate profits in other lines of business, and therefore does not derive any significant collateral benefits from them. The Board noted that the Advisor receives proprietary research from broker-dealers that execute fund portfolio transactions and concluded that this research is likely to benefit Fund shareholders. The Board also determined that the Advisor is able to provide investment management services to certain clients other than the Fund, at least in part, due to its existing infrastructure built to serve the fund complex. The Board concluded, however, that the assets of those other clients are not material to its analysis.
Existing Relationship. The Board also considered whether there was any reason for not continuing the existing arrangement with the Advisor. In this regard, the Board was mindful of the potential disruptions of the Fund’s operations and various risks, uncertainties, and other effects that could occur as a result of a decision not to continue such relationship. In particular, the Board recognized that most shareholders have invested in the Fund on the strength of the Advisor’s industry standing and reputation and in the expectation that the Advisor will have a continuing role in providing advisory services to the Fund.
Conclusion of the Directors. As a result of this process, the Board, including all of the independent Directors, taking into account all of the factors discussed above and the information provided by the Advisor and others, concluded that the management agreement between the Fund and the Advisor is fair and reasonable in light of the services provided and should be renewed.
Retirement Account Information
As required by law, distributions you receive from certain IRAs are subject to federal income tax withholding, unless you elect not to have withholding apply. Tax will be withheld on the total amount withdrawn even though you may be receiving amounts that are not subject to withholding, such as nondeductible contributions. In such case, excess amounts of withholding could occur. You may adjust your withholding election so that a greater or lesser amount will be withheld.
If you don’t want us to withhold on this amount, you must notify us to not withhold the federal income tax. You may notify us in writing or in certain situations by telephone or through other electronic means. For systematic withdrawals, your withholding election will remain in effect until revoked or changed by filing a new election. You have the right to revoke your election at any time.
Remember, even if you elect not to have income tax withheld, you are liable for paying income tax on the taxable portion of your withdrawal. If you elect not to have income tax withheld or you don’t have enough income tax withheld, you may be responsible for payment of estimated tax. You may incur penalties under the estimated tax rules if your withholding and estimated tax payments are not sufficient. You can reduce or defer the income tax on a distribution by directly or indirectly rolling such distribution over to another IRA or eligible plan. You should consult your tax advisor for additional information.
State tax will be withheld if, at the time of your distribution, your address is within one of the mandatory withholding states and you have federal income tax withheld (or as otherwise required by state law). State taxes will be withheld from your distribution in accordance with the respective state rules.
Distributions you receive from 403(b), 457 and qualified plans are subject to special tax and withholding rules. Your plan administrator or plan sponsor is required to provide you with a special tax notice explaining those rules at the time you request a distribution. If applicable, federal and/or state taxes may be withheld from your distribution amount.
Proxy Voting Policies
A description of the policies that the fund's investment advisor uses in exercising the voting rights associated with the securities purchased and/or held by the fund is available without charge, upon request, by calling 1-800-345-2021. It is also available on the "About Us" page of American Century Investments’ website at americancentury.com and on the Securities and Exchange Commission’s website at sec.gov. Information regarding how the investment advisor voted proxies relating to portfolio securities during the most recent 12-month period ended June 30 is available on the "About Us" page at americancentury.com. It is also available at sec.gov.
Quarterly Portfolio Disclosure
The fund files its complete schedule of portfolio holdings with the Securities and Exchange Commission (SEC) for the first and third quarters of each fiscal year on Form N-Q. The fund’s Forms N-Q are available on the SEC’s website at sec.gov, and may be reviewed and copied at the SEC’s Public Reference Room in Washington, DC. Information on the operation of the Public Reference Room may be obtained by calling 1-800-SEC-0330. The fund also makes its complete schedule of portfolio holdings for the most recent quarter of its fiscal year available on its
website at americancentury.com and, upon request, by calling 1-800-345-2021.
Other Tax Information
The following information is provided pursuant to provisions of the Internal Revenue Code.
The fund hereby designates up to the maximum amount allowable as qualified dividend income for the fiscal year ended October 31, 2014.
For corporate taxpayers, the fund hereby designates $2,329,389, or up to the maximum amount allowable, of ordinary income distributions paid during the fiscal year ended October 31, 2014 as qualified for the corporate dividends received deduction.
The fund hereby designates $9,980,242 as qualified short-term capital gain distributions for purposes of Internal Revenue Code Section 871 for the fiscal year ended October 31, 2014.
The fund hereby designates $41,703,832, or up to the maximum amount allowable, as long-term capital gain distributions for the fiscal year ended October 31, 2014.
|
| | |
| |
| | | |
| Contact Us | americancentury.com | |
| Automated Information Line | 1-800-345-8765 | |
| Investor Services Representative | 1-800-345-2021 or 816-531-5575 | |
| Investors Using Advisors | 1-800-378-9878 | |
| Business, Not-For-Profit, Employer-Sponsored Retirement Plans | 1-800-345-3533 | |
| Banks and Trust Companies, Broker-Dealers, Financial Professionals, Insurance Companies | 1-800-345-6488 | |
| Telecommunications Relay Service for the Deaf | 711 | |
| | | |
| American Century Mutual Funds, Inc. | |
| | | |
Investment Advisor: American Century Investment Management, Inc. Kansas City, Missouri | |
| | | |
| This report and the statements it contains are submitted for the general information of our shareholders. The report is not authorized for distribution to prospective investors unless preceded or accompanied by an effective prospectus. | |
| | | |
©2014 American Century Proprietary Holdings, Inc. All rights reserved.
CL-ANN-84011 1412 | |
|
| |
| ANNUAL REPORT | OCTOBER 31, 2014 |
Select Fund
|
| |
| President’s Letter | |
| Performance | |
| Portfolio Commentary | |
| Fund Characteristics | |
| Shareholder Fee Example | |
| Schedule of Investments | |
| Statement of Assets and Liabilities | |
| Statement of Operations | |
| Statement of Changes in Net Assets | |
| Notes to Financial Statements | |
| Financial Highlights | |
| Report of Independent Registered Public Accounting Firm | |
| Management | |
| Approval of Management Agreement | |
| Additional Information | |
Any opinions expressed in this report reflect those of the author as of the date of the report, and do not necessarily represent the opinions of American Century Investments® or any other person in the American Century Investments organization. Any such opinions are subject to change at any time based upon market or other conditions and American Century Investments disclaims any responsibility to update such opinions. These opinions may not be relied upon as investment advice and, because investment decisions made by American Century Investments funds are based on numerous factors, may not be relied upon as an indication of trading intent on behalf of any American Century Investments fund. Security examples are used for representational purposes only and are not intended as recommendations to purchase or sell securities. Performance information for comparative indices and securities is provided to American Century Investments by third party vendors. To the best of American Century Investments’ knowledge, such information is accurate at the time of printing.
|
| |
| Dear Investor:
Thank you for reviewing this annual report for the 12 months ended October 31, 2014. It provides investment performance and portfolio information for the reporting period, plus longer-term historical performance data.
Annual reports remain important vehicles for conveying information about fund returns, including market and economic factors that affected performance during the reporting period. For additional, updated investment and market insights, we encourage you to visit our website, americancentury.com. |
| Jonathan Thomas |
Favorable Fiscal Year for U.S. Stocks and Bonds
Mostly stimulative monetary policies by central banks and expectations of longer-term economic improvement, interspersed with concerns about nearer-term weaker-than-expected global economic data and geopolitical conflicts, helped drive financial market returns during the reporting period. We believe the combination of longer-term optimism about U.S. economic growth, low costs of capital, and continued central bank stimulus (even as the U.S. Federal Reserve’s latest monthly bond purchase program ended) helped persuade investors to seek risk and yield, which benefited U.S. stocks and bonds. The S&P 500 Index gained 17.27% during the 12 months. The 30-year U.S. Treasury bond was close behind, returning 15.44%, according to Barclays. U.S. real estate investment trusts (REITs), whose shares combine performance attributes of stocks and bonds, benefited from both—the MSCI U.S. REIT Index advanced 19.19%.
U.S. market benchmark returns generally outpaced their non-U.S. counterparts. The U.S. was perceived by investors as a relative bastion of growth, stability, and potentially attractive yields compared with most of the rest of the world, so capital flows generally favored U.S. assets. These capital flows, along with weaker-than-expected global growth, lower-than-expected global inflation, and falling commodity and energy prices, helped keep long-term interest rates and other corporate costs low. U.S. stocks just completed a solid third-quarter earnings reporting season, though questions remain about next year’s revenues, given this year’s slowdown in global economic growth and concerns about how far it could extend into 2015.
We believe continuing global economic and geopolitical uncertainties could continue to support the relative appeal of U.S. assets in coming months. But the end of the U.S. Federal Reserve’s monthly bond-buying program and the still-looming possibility of higher interest rates in 2015 point to potential U.S. market volatility ahead. In this environment, we continue to believe in a disciplined, diversified, long-term investment approach, using professionally managed stock and bond portfolios for meeting financial goals. We appreciate your continued trust in us.
Sincerely,
Jonathan Thomas
President and Chief Executive Officer
American Century Investments
|
| | | | | | |
| Total Returns as of October 31, 2014 | |
| | | | Average Annual Returns | |
| | Ticker Symbol | 1 year | 5 years | 10 years | Since Inception | Inception Date |
| Investor Class | TWCIX | 16.50% | 15.52% | 7.36% | 12.36% | 6/30/71(1) |
| Russell 1000 Growth Index | — | 17.11% | 17.42% | 9.05% | N/A(2) | — |
| Institutional Class | TWSIX | 16.74% | 15.76% | 7.58% | 6.61% | 3/13/97 |
A Class(3) | TWCAX | | | | | 8/8/97 |
| No sales charge* | | 16.21% | 15.23% | 7.09% | 5.07% | |
| With sales charge* | | 9.53% | 13.87% | 6.46% | 4.71% | |
| C Class | ACSLX | 15.34% | 14.38% | 6.29% | 7.23% | 1/31/03 |
| R Class | ASERX | 15.92% | 14.94% | — | 6.29% | 7/29/05 |
| R6 Class | ASDEX | 16.92% | — | — | 20.00% | 7/26/13 |
| |
| * | Sales charges include initial sales charges and contingent deferred sales charges (CDSCs), as applicable. A Class shares have a 5.75% maximum initial sales charge and may be subject to a maximum CDSC of 1.00%. C Class shares redeemed within 12 months of purchase are subject to a maximum CDSC of 1.00%. The SEC requires that mutual funds provide performance information net of maximum sales charges in all cases where charges could be applied. |
| |
| (1) | Although the fund’s actual inception date was October 31, 1958, this inception date corresponds with the investment advisor’s implementation of its current investment philosophy and practices. |
| |
| (2) | Benchmark data first available December 1978. |
| |
| (3) | Prior to September 4, 2007, the A Class was referred to as the Advisor Class and did not have a front-end sales charge. Performance has been adjusted to reflect this charge. |
Data presented reflect past performance. Past performance is no guarantee of future results. Current performance may be higher or lower than the performance shown. Investment return and principal value will fluctuate, and redemption value may be more or less than original cost. Data assumes reinvestment of dividends and capital gains, and none of the charts reflect the deduction of taxes that a shareholder would pay on fund distributions or the redemption of fund shares. To obtain performance data current to the most recent month end, please call 1-800-345-2021 or visit americancentury.com. For additional information about the fund, please consult the prospectus.
|
|
| Growth of $10,000 Over 10 Years |
| $10,000 investment made October 31, 2004 |
| Performance for other share classes will vary due to differences in fee structure. |
|
| |
| Value on October 31, 2014 |
| | Investor Class — $20,351 |
| |
| | Russell 1000 Growth Index — $23,790 |
| |
|
| | | | | |
| Total Annual Fund Operating Expenses |
| Investor Class | Institutional Class | A Class | C Class | R Class | R6 Class |
| 1.00% | 0.80% | 1.25% | 2.00% | 1.50% | 0.65% |
The total annual fund operating expenses shown is as stated in the fund’s prospectus current as of the date of this report. The prospectus may vary from the expense ratio shown elsewhere in this report because it is based on a different time period, includes acquired fund fees and expenses, and, if applicable, does not include fee waivers or expense reimbursements.
Data presented reflect past performance. Past performance is no guarantee of future results. Current performance may be higher or lower than the performance shown. Investment return and principal value will fluctuate, and redemption value may be more or less than original cost. Data assumes reinvestment of dividends and capital gains, and none of the charts reflect the deduction of taxes that a shareholder would pay on fund distributions or the redemption of fund shares. To obtain performance data current to the most recent month end, please call 1-800-345-2021 or visit americancentury.com. For additional information about the fund, please consult the prospectus.
Portfolio Managers: Keith Lee, Michael Li, and Christopher Krantz
Performance Summary
Select returned 16.50%* for the 12 months ended October 31, 2014, compared with the 17.11% return of the portfolio’s benchmark, the Russell 1000 Growth Index.
U.S. stock indices delivered solid returns during the reporting period. Within the Russell 1000 Growth Index, health care was the top-performing sector, gaining nearly 35%. Information technology also outpaced the benchmark average with a 22% return. No sectors lost ground, although energy, telecommunication services, and consumer discretionary posted more modest, single-digit returns.
Select received positive contributions to absolute return from every sector in which it was invested, with the exception of energy. Stock decisions in the industrials, consumer staples, and energy sectors detracted most from performance relative to the Russell index. Stock selection in health care and information technology made these sectors key contributors to results versus the benchmark.
Industrials and Consumer Staples Led Detractors
Stock selection in the industrials sector was the largest source of underperformance, driven by weakness in aerospace and defense companies. United Technologies underperformed after the company reported results that were in line with expectations but indicated soft organic growth and weaker growth in non-U.S. operations. Underweighting the road and rail industry also hurt results in the sector. In particular, it hurt to have no exposure to rail transportation company Union Pacific.
Stock decisions in the consumer staples sector also hampered relative results. Beverage firm Diageo underperformed on weak sales trends for some of its key brands such as Smirnoff vodka, hurting earnings growth and expectations for future profitability.
Another notable individual detractor was North American energy exploration and production firm Noble Energy, which suffered temporarily from a slump in energy prices and a slowdown in takeaway capacity.
Health Care and Information Technology Holdings Aided Results
The fund benefited from holdings in the health care sector, led by positioning among pharmaceuticals and health care providers and services companies. Pharmaceutical company Allergan was a top contributor for the year as its shares appreciated after being the object of a buyout offer from Valeant Pharmaceuticals. Biotech firm Gilead Sciences rose on strong sales for its hepatitis C drug Sovaldi and announcement of a new share-buyback program. UnitedHealth Group performed well on earnings that were ahead of expectations due to lower medical care costs.
| |
| * | All fund returns referenced in this commentary are for Investor Class shares. Performance for other share classes will vary due to differences in fee structure; when Investor Class performance exceeds that of the fund’s benchmark, other share classes may not. See page 3 for returns for all share classes. |
Information technology stocks were also key contributors, led by Apple. The computer and peripherals giant benefited from anticipation of and eventual release of new products, including the iPhone 6, Apple Pay mobile payment service, and forthcoming Apple Watch. It helped to have no exposure to technology firm International Business Machines. Having said that, the technology sector’s contribution would have been even greater but for an underweight position in software giant Microsoft, which was eventually eliminated from the portfolio. The company lowered guidance, consistent with our less sanguine outlook for the business. Nevertheless, the stock benefited from price-to-earnings multiple expansion, excitement around moving Office 365 to a subscription model, the announcement of the Windows 10 operating system, and the departure of CEO Steve Balmer.
Stock decisions and positioning within the materials sector also aided relative results. Sigma-Aldrich—categorized as a chemicals company in the materials sector—is a life sciences and technology company making and distributing biochemicals used in scientific research, as well as providing other biopharmaceutical testing services. The stock benefited from an offer to be acquired by German firm Merck. Avoiding a number of poor-performing stocks in the sector also helped portfolio results.
Outlook
Going forward, we remain confident in our belief that stocks that exhibit high-quality, accelerating fundamentals, positive relative strength, and attractive valuations will outperform in the long term. Our portfolio positioning reflects where we are seeing opportunities as a result of the application of that philosophy and process.
As of October 31, 2014, that process pointed us toward overweight positions in the health care and information technology sectors. The top underweight sector was telecommunication services. In the health care sector, we favored biotechnology and health care providers and services companies, while in information technology, the overweight position was driven by holdings in the internet software and services industry. In the telecommunications sector, competition among wireless carriers is intensifying, likely leading to higher capital spending, lower free cash flow, lower valuations, and lower margins.
|
| |
| OCTOBER 31, 2014 | |
| Top Ten Holdings | % of net assets |
| Apple, Inc. | 8.7% |
Google, Inc.(1) | 4.2% |
| Gilead Sciences, Inc. | 3.9% |
| MasterCard, Inc., Class A | 2.7% |
| UnitedHealth Group, Inc. | 2.7% |
| Walt Disney Co. (The) | 2.5% |
| Home Depot, Inc. (The) | 2.5% |
| Bristol-Myers Squibb Co. | 2.4% |
| QUALCOMM, Inc. | 2.3% |
| Biogen Idec, Inc. | 2.3% |
| (1) Includes all classes of the issuer. | |
| | |
| Top Five Industries | % of net assets |
| Technology Hardware, Storage and Peripherals | 10.5% |
| Internet Software and Services | 8.0% |
| Biotechnology | 6.7% |
| Specialty Retail | 6.0% |
| Pharmaceuticals | 5.3% |
| | |
| Types of Investments in Portfolio | % of net assets |
| Domestic Common Stocks | 94.4% |
Foreign Common Stocks(2) | 5.1% |
| Total Common Stocks | 99.5% |
| Temporary Cash Investments | 0.5% |
| Other Assets and Liabilities | —(3) |
(2) Includes depositary shares, dual listed securities and foreign ordinary shares.
(3) Category is less than 0.05% of total net assets.
Fund shareholders may incur two types of costs: (1) transaction costs, including sales charges (loads) on purchase payments and redemption/exchange fees; and (2) ongoing costs, including management fees; distribution and service (12b-1) fees; and other fund expenses. This example is intended to help you understand your ongoing costs (in dollars) of investing in your fund and to compare these costs with the ongoing cost of investing in other mutual funds.
The example is based on an investment of $1,000 made at the beginning of the period and held for the entire period from May 1, 2014 to October 31, 2014.
Actual Expenses
The table provides information about actual account values and actual expenses for each class. You may use the information, together with the amount you invested, to estimate the expenses that you paid over the period. First, identify the share class you own. Then simply divide your account value by $1,000 (for example, an $8,600 account value divided by $1,000 = 8.6), then multiply the result by the number under the heading “Expenses Paid During Period” to estimate the expenses you paid on your account during this period.
If you hold Investor Class shares of any American Century Investments fund, or Institutional Class shares of the American Century Diversified Bond Fund, in an American Century Investments account (i.e., not a financial intermediary or retirement plan account), American Century Investments may charge you a $12.50 semiannual account maintenance fee if the value of those shares is less than $10,000. We will redeem shares automatically in one of your accounts to pay the $12.50 fee. In determining your total eligible investment amount, we will include your investments in all personal accounts (including American Century Investments Brokerage accounts) registered under your Social Security number. Personal accounts include individual accounts, joint accounts, UGMA/UTMA accounts, personal trusts, Coverdell Education Savings Accounts and IRAs (including traditional, Roth, Rollover, SEP-, SARSEP- and SIMPLE-IRAs), and certain other retirement accounts. If you have only business, business retirement, employer-sponsored or American Century Investments Brokerage accounts, you are currently not subject to this fee. If you are subject to the Account Maintenance Fee, your account value could be reduced by the fee amount.
Hypothetical Example for Comparison Purposes
The table also provides information about hypothetical account values and hypothetical expenses based on the actual expense ratio of each class of your fund and an assumed rate of return of 5% per year before expenses, which is not the actual return of a fund’s share class. The hypothetical account values and expenses may not be used to estimate the actual ending account balance or expenses you paid for the period. You may use this information to compare the ongoing costs of investing in your fund and other funds. To do so, compare this 5% hypothetical example with the 5% hypothetical examples that appear in the shareholder reports of the other funds.
Please note that the expenses shown in the table are meant to highlight your ongoing costs only and do not reflect any transactional costs, such as sales charges (loads) or redemption/exchange fees. Therefore, the table is useful in comparing ongoing costs only, and will not help you determine the relative total costs of owning different funds. In addition, if these transactional costs were included, your costs would have been higher.
|
| | | | |
| Beginning
Account Value
5/1/14 | Ending
Account Value
10/31/14 | Expenses Paid
During Period(1)5/1/14 - 10/31/14 |
Annualized
Expense Ratio(1) |
| Actual | | | | |
| Investor Class | $1,000 | $1,102.90 | $5.30 | 1.00% |
| Institutional Class | $1,000 | $1,104.10 | $4.24 | 0.80% |
| A Class | $1,000 | $1,101.50 | $6.62 | 1.25% |
| C Class | $1,000 | $1,097.20 | $10.57 | 2.00% |
| R Class | $1,000 | $1,099.90 | $7.94 | 1.50% |
| R6 Class | $1,000 | $1,104.80 | $3.45 | 0.65% |
| Hypothetical | | | | |
| Investor Class | $1,000 | $1,020.16 | $5.09 | 1.00% |
| Institutional Class | $1,000 | $1,021.17 | $4.08 | 0.80% |
| A Class | $1,000 | $1,018.90 | $6.36 | 1.25% |
| C Class | $1,000 | $1,015.12 | $10.16 | 2.00% |
| R Class | $1,000 | $1,017.64 | $7.63 | 1.50% |
| R6 Class | $1,000 | $1,021.93 | $3.31 | 0.65% |
| |
| (1) | Expenses are equal to the class's annualized expense ratio listed in the table above, multiplied by the average account value over the period, multiplied by 184, the number of days in the most recent fiscal half-year, divided by 365, to reflect the one-half year period. |
OCTOBER 31, 2014
|
| | | | |
| | Shares | Value |
| COMMON STOCKS — 99.5% | | |
| Aerospace and Defense — 3.8% | | |
| Boeing Co. (The) | 360,300 | $ | 45,005,073 |
|
| United Technologies Corp. | 429,100 | 45,913,700 |
|
| | | 90,918,773 |
|
| Auto Components — 1.7% | | |
| Delphi Automotive plc | 334,400 | 23,066,912 |
|
| Gentex Corp. | 499,200 | 16,343,808 |
|
| | | 39,410,720 |
|
| Banks — 1.0% | | |
| JPMorgan Chase & Co. | 385,500 | 23,315,040 |
|
| Beverages — 3.7% | | |
Constellation Brands, Inc., Class A(1) | 477,500 | 43,710,350 |
|
| Diageo plc | 1,473,000 | 43,354,094 |
|
| | | 87,064,444 |
|
| Biotechnology — 6.7% | | |
Biogen Idec, Inc.(1) | 170,400 | 54,712,032 |
|
Gilead Sciences, Inc.(1) | 826,700 | 92,590,400 |
|
Vertex Pharmaceuticals, Inc.(1) | 117,400 | 13,223,936 |
|
| | | 160,526,368 |
|
| Capital Markets — 2.0% | | |
| Franklin Resources, Inc. | 854,900 | 47,540,989 |
|
| Chemicals — 3.2% | | |
| Monsanto Co. | 453,700 | 52,193,648 |
|
| Sigma-Aldrich Corp. | 170,200 | 23,131,882 |
|
| | | 75,325,530 |
|
| Communications Equipment — 2.3% | | |
| QUALCOMM, Inc. | 704,200 | 55,286,742 |
|
| Diversified Financial Services — 1.5% | | |
| CBOE Holdings, Inc. | 587,800 | 34,644,932 |
|
| Electrical Equipment — 1.4% | | |
| Emerson Electric Co. | 514,900 | 32,984,494 |
|
| Energy Equipment and Services — 2.6% | | |
| Core Laboratories NV | 96,700 | 13,492,551 |
|
| Schlumberger Ltd. | 500,900 | 49,418,794 |
|
| | | 62,911,345 |
|
| Food and Staples Retailing — 2.3% | | |
| Costco Wholesale Corp. | 322,300 | 42,985,151 |
|
| PriceSmart, Inc. | 123,500 | 10,995,205 |
|
| | | 53,980,356 |
|
| Food Products — 2.5% | | |
| Mead Johnson Nutrition Co. | 373,600 | 37,102,216 |
|
| Mondelez International, Inc., Class A | 617,800 | 21,783,628 |
|
| | | 58,885,844 |
|
|
| | | | |
| | Shares | Value |
| Health Care Providers and Services — 4.0% | | |
Express Scripts Holding Co.(1) | 413,200 | $ | 31,742,024 |
|
| UnitedHealth Group, Inc. | 670,100 | 63,666,201 |
|
| | | 95,408,225 |
|
| Hotels, Restaurants and Leisure — 2.9% | | |
| Papa John's International, Inc. | 45,333 | 2,119,771 |
|
| Starbucks Corp. | 283,200 | 21,398,592 |
|
| Wynn Resorts Ltd. | 242,600 | 46,096,426 |
|
| | | 69,614,789 |
|
| Industrial Conglomerates — 1.8% | | |
| Roper Industries, Inc. | 272,300 | 43,105,090 |
|
| Insurance — 1.5% | | |
| MetLife, Inc. | 663,300 | 35,977,392 |
|
| Internet and Catalog Retail — 2.3% | | |
Amazon.com, Inc.(1) | 128,200 | 39,159,972 |
|
TripAdvisor, Inc.(1) | 169,600 | 15,036,736 |
|
| | | 54,196,708 |
|
| Internet Software and Services — 8.0% | | |
Alibaba Group Holding Ltd. ADR(1) | 28,369 | 2,797,183 |
|
Baidu, Inc. ADR(1) | 97,100 | 23,184,567 |
|
Facebook, Inc., Class A(1) | 690,900 | 51,810,591 |
|
Google, Inc., Class A(1) | 88,400 | 50,199,708 |
|
Google, Inc., Class C(1) | 90,000 | 50,317,200 |
|
LinkedIn Corp., Class A(1) | 53,900 | 12,340,944 |
|
| | | 190,650,193 |
|
| IT Services — 3.7% | | |
| MasterCard, Inc., Class A | 762,500 | 63,859,375 |
|
Teradata Corp.(1) | 591,700 | 25,040,744 |
|
| | | 88,900,119 |
|
| Leisure Products — 0.4% | | |
| Hasbro, Inc. | 180,000 | 10,355,400 |
|
| Machinery — 2.9% | | |
| FANUC Corp. | 101,500 | 17,833,074 |
|
| Graco, Inc. | 268,800 | 21,100,800 |
|
Middleby Corp.(1) | 274,500 | 24,293,250 |
|
| Nordson Corp. | 75,700 | 5,794,835 |
|
| | | 69,021,959 |
|
| Media — 4.5% | | |
| Comcast Corp., Class A | 848,400 | 46,958,940 |
|
| Walt Disney Co. (The) | 657,500 | 60,082,350 |
|
| | | 107,041,290 |
|
| Oil, Gas and Consumable Fuels — 2.0% | | |
| Noble Energy, Inc. | 514,600 | 29,656,398 |
|
| Occidental Petroleum Corp. | 198,000 | 17,608,140 |
|
| | | 47,264,538 |
|
| Personal Products — 1.2% | | |
| Estee Lauder Cos., Inc. (The), Class A | 386,400 | 29,049,552 |
|
| Pharmaceuticals — 5.3% | | |
| Allergan, Inc. | 188,300 | 35,788,298 |
|
| Bristol-Myers Squibb Co. | 998,700 | 58,114,353 |
|
|
| | | | |
| | Shares | Value |
| Teva Pharmaceutical Industries Ltd. ADR | 582,900 | $ | 32,916,363 |
|
| | | 126,819,014 |
|
| Professional Services — 0.9% | | |
Verisk Analytics, Inc., Class A(1) | 329,200 | 20,525,620 |
|
| Semiconductors and Semiconductor Equipment — 1.1% | | |
| Linear Technology Corp. | 600,200 | 25,712,568 |
|
| Software — 3.7% | | |
Electronic Arts, Inc.(1) | 963,600 | 39,478,692 |
|
Mobileye NV(1) | 50,000 | 2,600,500 |
|
| Oracle Corp. | 1,165,031 | 45,494,461 |
|
| | | 87,573,653 |
|
| Specialty Retail — 6.0% | | |
AutoZone, Inc.(1) | 81,400 | 45,056,528 |
|
| Home Depot, Inc. (The) | 606,800 | 59,175,136 |
|
| TJX Cos., Inc. (The) | 614,100 | 38,884,812 |
|
| | | 143,116,476 |
|
| Technology Hardware, Storage and Peripherals — 10.5% | | |
| Apple, Inc. | 1,926,200 | 208,029,600 |
|
| EMC Corp. | 1,481,700 | 42,569,241 |
|
| | | 250,598,841 |
|
| Tobacco — 1.7% | | |
| Philip Morris International, Inc. | 444,800 | 39,591,648 |
|
| Trading Companies and Distributors — 0.4% | | |
| W.W. Grainger, Inc. | 40,900 | 10,094,120 |
|
TOTAL COMMON STOCKS (Cost $1,313,747,461) | | 2,367,412,772 |
|
| TEMPORARY CASH INVESTMENTS — 0.5% | | |
| Repurchase Agreement, Bank of America Merrill Lynch, (collateralized by various U.S. Treasury obligations, 1.375% - 2.625%, 12/31/14 - 2/28/19, valued at $2,517,884), in a joint trading account at 0.07%, dated 10/31/14, due 11/3/14 (Delivery value $2,468,903) | | 2,468,889 |
|
| Repurchase Agreement, Credit Suisse First Boston, Inc., (collateralized by various U.S. Treasury obligations, 0.25%, 10/15/15, valued at $1,007,362), in a joint trading account at 0.04%, dated 10/31/14, due 11/3/14 (Delivery value $987,559) | | 987,556 |
|
| Repurchase Agreement, Goldman Sachs & Co., (collateralized by various U.S. Treasury obligations, 0.125%, 12/31/14, valued at $2,016,651), in a joint trading account at 0.03%, dated 10/31/14, due 11/3/14 (Delivery value $1,975,117) | | 1,975,112 |
|
| SSgA U.S. Government Money Market Fund, Class N | 5,432,793 | 5,432,793 |
|
TOTAL TEMPORARY CASH INVESTMENTS (Cost $10,864,350) | | 10,864,350 |
|
TOTAL INVESTMENT SECURITIES — 100.0% (Cost $1,324,611,811) | | 2,378,277,122 |
|
OTHER ASSETS AND LIABILITIES† | | 1,183,572 |
|
| TOTAL NET ASSETS — 100.0% | | $ | 2,379,460,694 |
|
|
| | | | | | | | |
| FORWARD FOREIGN CURRENCY EXCHANGE CONTRACTS | |
| Currency Purchased | Currency Sold | Counterparty | Settlement Date | Unrealized Appreciation
(Depreciation) |
| USD | 35,905,463 | GBP | 22,217,627 | Credit Suisse AG | 11/28/14 | $ | 370,845 |
|
| USD | 14,329,561 | JPY | 1,545,185,250 | Credit Suisse AG | 11/28/14 | 570,807 |
|
| | | | | | | $ | 941,652 |
|
|
| | |
| NOTES TO SCHEDULE OF INVESTMENTS |
| ADR | - | American Depositary Receipt |
| GBP | - | British Pound |
| JPY | - | Japanese Yen |
| USD | - | United States Dollar |
| |
| † | Category is less than 0.05% of total net assets. |
See Notes to Financial Statements.
|
|
| Statement of Assets and Liabilities |
|
| | | |
| OCTOBER 31, 2014 | |
| Assets | |
| Investment securities, at value (cost of $1,324,611,811) | $ | 2,378,277,122 |
|
| Foreign currency holdings, at value (cost of $298,283) | 283,790 |
|
| Receivable for investments sold | 14,659,199 |
|
| Receivable for capital shares sold | 2,551,013 |
|
| Unrealized appreciation on forward foreign currency exchange contracts | 941,652 |
|
| Dividends and interest receivable | 827,524 |
|
| | 2,397,540,300 |
|
| | |
| Liabilities | |
| Payable for investments purchased | 15,288,037 |
|
| Payable for capital shares redeemed | 875,148 |
|
| Accrued management fees | 1,902,480 |
|
| Distribution and service fees payable | 13,941 |
|
| | 18,079,606 |
|
| | |
| Net Assets | $ | 2,379,460,694 |
|
| | |
| Net Assets Consist of: | |
| Capital (par value and paid-in surplus) | $ | 1,111,868,409 |
|
| Undistributed net investment income | 8,260,833 |
|
| Undistributed net realized gain | 204,742,245 |
|
| Net unrealized appreciation | 1,054,589,207 |
|
| | $ | 2,379,460,694 |
|
|
| | | | | | |
| | Net Assets | Shares Outstanding | Net Asset Value Per Share |
| Investor Class, $0.01 Par Value |
| $2,293,893,065 |
| 37,413,683 |
| $61.31 |
| Institutional Class, $0.01 Par Value |
| $29,129,852 |
| 468,707 |
| $62.15 |
| A Class, $0.01 Par Value |
| $39,786,186 |
| 660,383 |
| $60.25* |
| C Class, $0.01 Par Value |
| $5,929,378 |
| 104,681 |
| $56.64 |
| R Class, $0.01 Par Value |
| $3,049,804 |
| 50,730 |
| $60.12 |
| R6 Class, $0.01 Par Value |
| $7,672,409 |
| 123,391 |
| $62.18 |
*Maximum offering price $63.93 (net asset value divided by 0.9425).
See Notes to Financial Statements.
|
| | | |
| YEAR ENDED OCTOBER 31, 2014 | |
| Investment Income (Loss) | |
| Income: | |
| Dividends (net of foreign taxes withheld of $54,507) | $ | 30,642,732 |
|
| Interest | 1,582 |
|
| | 30,644,314 |
|
| Expenses: | |
| Management fees | 22,708,536 |
|
| Distribution and service fees: | |
| A Class | 100,775 |
|
| C Class | 75,454 |
|
| R Class | 15,571 |
|
| Directors' fees and expenses | 36,854 |
|
| Other expenses | 111 |
|
| | 22,937,301 |
|
| | |
| Net investment income (loss) | 7,707,013 |
|
| | |
| Realized and Unrealized Gain (Loss) | |
| Net realized gain (loss) on: | |
| Investment transactions | 207,993,704 |
|
| Foreign currency transactions | 1,276,565 |
|
| | 209,270,269 |
|
| | |
| Change in net unrealized appreciation (depreciation) on: | |
| Investments | 132,264,734 |
|
| Translation of assets and liabilities in foreign currencies | 504,579 |
|
| | 132,769,313 |
|
| | |
| Net realized and unrealized gain (loss) | 342,039,582 |
|
| | |
| Net Increase (Decrease) in Net Assets Resulting from Operations | $ | 349,746,595 |
|
See Notes to Financial Statements.
|
|
| Statement of Changes in Net Assets |
|
| | | | | | |
| YEARS ENDED OCTOBER 31, 2014 AND OCTOBER 31, 2013 |
| Increase (Decrease) in Net Assets | October 31, 2014 | October 31, 2013 |
| Operations | | |
| Net investment income (loss) | $ | 7,707,013 |
| $ | 15,006,298 |
|
| Net realized gain (loss) | 209,270,269 |
| 130,624,128 |
|
| Change in net unrealized appreciation (depreciation) | 132,769,313 |
| 277,007,733 |
|
| Net increase (decrease) in net assets resulting from operations | 349,746,595 |
| 422,638,159 |
|
| | | |
| Distributions to Shareholders | | |
| From net investment income: | | |
| Investor Class | (9,365,514 | ) | (13,028,356 | ) |
| Institutional Class | (245,709 | ) | (140,890 | ) |
| A Class | (82,331 | ) | (295,191 | ) |
| C Class | — |
| (26,359 | ) |
| R Class | — |
| (12,375 | ) |
| R6 Class | (214 | ) | — |
|
| From net realized gains: | | |
| Investor Class | (8,633,102 | ) | — |
|
| Institutional Class | (155,106 | ) | — |
|
| A Class | (178,850 | ) | — |
|
| C Class | (34,463 | ) | — |
|
| R Class | (14,057 | ) | — |
|
| R6 Class | (109 | ) | — |
|
| Decrease in net assets from distributions | (18,709,455 | ) | (13,503,171 | ) |
| | | |
| Capital Share Transactions | | |
| Net increase (decrease) in net assets from capital share transactions (Note 5) | (165,037,117 | ) | (126,523,858 | ) |
| | | |
| Net increase (decrease) in net assets | 166,000,023 |
| 282,611,130 |
|
| | | |
| Net Assets | | |
| Beginning of period | 2,213,460,671 |
| 1,930,849,541 |
|
| End of period | $ | 2,379,460,694 |
| $ | 2,213,460,671 |
|
| | | |
| Undistributed net investment income | $ | 8,260,833 |
| $ | 9,263,975 |
|
See Notes to Financial Statements.
|
|
| Notes to Financial Statements |
OCTOBER 31, 2014
1. Organization
American Century Mutual Funds, Inc. (the corporation) is registered under the Investment Company Act of 1940, as amended (the 1940 Act), as an open-end management investment company and is organized as a Maryland corporation. Select Fund (the fund) is one fund in a series issued by the corporation. The fund is diversified as defined under the 1940 Act. The fund’s investment objective is to seek long-term capital growth.
The fund offers the Investor Class, the Institutional Class, the A Class, the C Class, the R Class and the R6 Class. The A Class may incur an initial sales charge. The A Class and C Class may be subject to a contingent deferred sales charge. The share classes differ principally in their respective sales charges and distribution and shareholder servicing expenses and arrangements. The Institutional Class and R6 Class shareholders do not require the same level of shareholder and administrative services from American Century Investment Management, Inc. (ACIM) (the investment advisor) as shareholders of other classes. In addition, financial intermediaries do not receive any service, distribution or administrative fees for the R6 Class. As a result, the Institutional Class and R6 Class are charged lower unified management fees. Sale of the R6 Class commenced on July 26, 2013.
2. Significant Accounting Policies
The following is a summary of significant accounting policies consistently followed by the fund in preparation of its financial statements. The fund is an investment company and follows accounting and reporting guidance in accordance with accounting principles generally accepted in the United States of America. This may require management to make certain estimates and assumptions at the date of the financial statements. Actual results could differ from these estimates. Management evaluated the impact of events or transactions occurring through the date the financial statements were issued that would merit recognition or disclosure.
Investment Valuations — The fund determines the fair value of its investments and computes its net asset value per share at the close of regular trading (usually 4 p.m. Eastern time) on the New York Stock Exchange (NYSE) on each day the NYSE is open. The Board of Directors has adopted valuation policies and procedures to guide the investment advisor in the fund’s investment valuation process and to provide methodologies for the oversight of the fund’s pricing function.
Equity securities that are listed or traded on a domestic securities exchange are valued at the last reported sales price or at the official closing price as provided by the exchange. Equity securities traded on foreign securities exchanges are generally valued at the closing price of such securities on the exchange where primarily traded or at the close of the NYSE, if that is earlier. If no last sales price is reported, or if local convention or regulation so provides, the mean of the latest bid and asked prices may be used. Securities traded over-the-counter are valued at the mean of the latest bid and asked prices, the last sales price, or the official closing price. Equity securities initially expressed in local currencies are translated into U.S. dollars at the mean of the appropriate currency exchange rate at the close of the NYSE as provided by an independent pricing service.
Fixed income securities maturing within 60 days at the time of purchase may be valued at cost, plus or minus any amortized discount or premium or at the evaluated mean as provided by an independent pricing service. Evaluated mean prices are commonly derived through utilization of market models, which may consider, among other factors: trade data, quotations from dealers and active market makers, relevant yield curve and spread data, related sector levels, creditworthiness, trade data or market information on comparable securities, and other relevant security specific information.
Open-end management investment companies are valued at the reported net asset value per share. Repurchase agreements are valued at cost, which approximates fair value. Forward foreign currency exchange contracts are valued at the mean of the appropriate forward exchange rate at the close of the NYSE as provided by an independent pricing service.
If the fund determines that the market price for an investment is not readily available or the valuation methods mentioned above do not reflect an investment’s fair value, such investment is valued as determined in good faith by the Board of Directors or its delegate, in accordance with policies and procedures adopted by the Board of Directors. In its determination of fair value, the fund may review several factors including, but not limited to, market information regarding the specific investment or comparable investments and correlation with other investment types, futures indices or general market indicators. Circumstances that may cause the fund to use these procedures to value an investment include, but are not limited to: an investment has been declared in default or is distressed; trading in a security has been suspended during the trading day or a security is not actively trading on its principal exchange; prices received from a regular pricing source are deemed unreliable; or there is a foreign market holiday and no trading occurred.
The fund monitors for significant events occurring after the close of an investment’s primary exchange but before the fund’s net asset value per share is determined. Significant events may include, but are not limited to: corporate announcements and transactions; governmental action and political unrest that could impact a specific investment or an investment sector; or armed conflicts, natural disasters and similar events that could affect investments in a specific country or region. The fund also monitors for significant fluctuations between domestic and foreign markets, as evidenced by the U.S. market or such other indicators that the Board of Directors, or its delegate, deems appropriate. If significant fluctuations in foreign markets are identified, the fund may apply a model-derived factor to the closing price of equity securities traded on foreign securities exchanges. The factor is based on observable market data as provided by an independent pricing service.
Security Transactions — Security transactions are accounted for as of the trade date. Net realized gains and losses are determined on the identified cost basis, which is also used for federal income tax purposes.
Investment Income — Dividend income less foreign taxes withheld, if any, is recorded as of the ex-dividend date. Distributions received on securities that represent a return of capital or long-term capital gain are recorded as a reduction of cost of investments and/or as a realized gain. The fund may estimate the components of distributions received that may be considered nontaxable distributions or long-term capital gain distributions for income tax purposes. Interest income is recorded on the accrual basis and includes accretion of discounts and amortization of premiums.
Foreign Currency Translations — All assets and liabilities initially expressed in foreign currencies are translated into U.S. dollars at prevailing exchange rates at period end. The fund may enter into spot foreign currency exchange contracts to facilitate transactions denominated in a foreign currency. Purchases and sales of investment securities, dividend and interest income, spot foreign currency exchange contracts, and expenses are translated at the rates of exchange prevailing on the respective dates of such transactions. Net realized and unrealized foreign currency exchange gains or losses related to investment securities are a component of net realized gain (loss) on investment transactions and change in net unrealized appreciation (depreciation) on investments, respectively.
Repurchase Agreements — The fund may enter into repurchase agreements with institutions that ACIM has determined are creditworthy pursuant to criteria adopted by the Board of Directors. The fund requires that the collateral, represented by securities, received in a repurchase transaction be transferred to the custodian in a manner sufficient to enable the fund to obtain those securities in the event of a default under the repurchase agreement. ACIM monitors, on a daily basis, the securities transferred to ensure the value, including accrued interest, of the securities under each repurchase agreement is equal to or greater than amounts owed to the fund under each repurchase agreement.
Joint Trading Account — Pursuant to an Exemptive Order issued by the Securities and Exchange Commission, the fund, along with certain other funds in the American Century Investments family of funds, may transfer uninvested cash balances into a joint trading account. These balances are invested in one or more repurchase agreements that are collateralized by U.S. Treasury or Agency obligations.
Income Tax Status — It is the fund’s policy to distribute substantially all net investment income and net realized gains to shareholders and to otherwise qualify as a regulated investment company under provisions of the Internal Revenue Code. Accordingly, no provision has been made for income taxes. The fund files U.S. federal, state, local and non-U.S. tax returns as applicable. The fund's tax returns are subject to examination by the relevant taxing authority until expiration of the applicable statute of limitations, which is generally three years from the date of filing but can be longer in certain jurisdictions. At this time, management believes there are no uncertain tax positions which, based on their technical merit, would not be sustained upon examination and for which it is reasonably possible that the total amounts of unrecognized tax benefits will significantly change in the next twelve months.
Multiple Class — All shares of the fund represent an equal pro rata interest in the net assets of the class to which such shares belong, and have identical voting, dividend, liquidation and other rights and the same terms and conditions, except for class specific expenses and exclusive rights to vote on matters affecting only individual classes. Income, non-class specific expenses, and realized and unrealized capital gains and losses of the fund are allocated to each class of shares based on their relative net assets.
Distributions to Shareholders — Distributions from net investment income and net realized gains, if any, are generally declared and paid annually.
Indemnifications — Under the corporation’s organizational documents, its officers and directors are indemnified against certain liabilities arising out of the performance of their duties to the fund. In addition, in the normal course of business, the fund enters into contracts that provide general indemnifications. The maximum exposure under these arrangements is unknown as this would involve future claims that may be made against a fund. The risk of material loss from such claims is considered by management to be remote.
3. Fees and Transactions with Related Parties
Certain officers and directors of the corporation are also officers and/or directors of American Century Companies, Inc. (ACC). The corporation’s investment advisor, ACIM, the corporation's distributor, American Century Investment Services, Inc. (ACIS), and the corporation’s transfer agent, American Century Services, LLC, are wholly owned, directly or indirectly, by ACC.
Management Fees — The corporation has entered into a management agreement with ACIM, under which ACIM provides the fund with investment advisory and management services in exchange for a single, unified management fee (the fee) per class. The agreement provides that all expenses of managing and operating the fund, except distribution and service fees, brokerage expenses, taxes, interest, fees and expenses of the independent directors (including legal counsel fees), and extraordinary expenses, will be paid by ACIM. The fee is computed and accrued daily based on each class’s daily net assets and paid monthly in arrears. The rate of the fee is determined by applying a fee rate calculation formula. This formula takes into account the fund’s assets as well as certain assets, if any, of other clients of the investment advisor outside the American Century Investments family of funds (such as subadvised funds and separate accounts) that have very similar investment teams and investment strategies (strategy assets). The annual management fee schedule ranges from 0.800% to 0.990% for the Investor Class, A Class, C Class and R Class. The annual management fee schedule ranges from 0.600% to 0.790% for the Institutional Class and 0.450% to 0.640% for the R6 Class. Prior to August 1, 2014, the annual management fee schedule ranged from 0.800% to 1.000% for the Investor Class, A Class, C Class and R Class, 0.600% to 0.800% for the Institutional Class and 0.450% to 0.650% for the R6 Class. The effective annual management fee for each class for the year ended October 31, 2014 was 1.00% for the Investor Class, A Class, C Class and R Class, 0.80% for the Institutional Class and 0.65% for the R6 Class.
Distribution and Service Fees — The Board of Directors has adopted a separate Master Distribution and Individual Shareholder Services Plan for each of the A Class, C Class and R Class (collectively the plans), pursuant to Rule 12b-1 of the 1940 Act. The plans provide that the A Class will pay ACIS an annual distribution and service fee of 0.25%. The plans provide that the C Class will pay ACIS an annual distribution and service fee of 1.00%, of which 0.25% is paid for individual shareholder services and 0.75% is paid for distribution services. The plans provide that the R Class will pay ACIS an annual distribution and service fee of 0.50%. The fees are computed and accrued daily based on each class’s daily net assets and paid monthly in arrears. The fees are used to pay financial intermediaries for distribution and individual shareholder services. Fees incurred under the plans during the year ended October 31, 2014 are detailed in the Statement of Operations.
Directors' Fees and Expenses — The Board of Directors is responsible for overseeing the investment advisor’s management and operations of the fund. The directors receive detailed information about the fund and its investment advisor regularly throughout the year, and meet at least quarterly with management of the investment advisor to review reports about fund operations. Fees and expenses incurred in conjunction with the directors during the year ended October 31, 2014 are detailed in the Statement of Operations. The fund’s officers do not receive compensation from the fund.
4. Investment Transactions
Purchases and sales of investment securities, excluding short-term investments, for the year ended October 31, 2014 were $576,736,094 and $753,206,632, respectively.
5. Capital Share Transactions
Transactions in shares of the fund were as follows:
|
| | | | | | | | | |
| | Year ended October 31, 2014 | Year ended October 31, 2013(1) |
| | Shares | Amount | Shares | Amount |
| Investor Class/Shares Authorized | 300,000,000 | | 300,000,000 |
| |
| Sold | 1,013,144 | $ | 57,402,134 |
| 1,670,785 |
| $ | 78,033,446 |
|
| Issued in reinvestment of distributions | 318,597 | 17,156,436 |
| 281,233 |
| 12,430,501 |
|
| Redeemed | (3,857,942) | (218,157,619) |
| (4,785,724) |
| (224,053,202) |
|
| | (2,526,201) | (143,599,049) |
| (2,833,706) |
| (133,589,255) |
|
| Institutional Class/Shares Authorized | 40,000,000 | | 40,000,000 |
| |
| Sold | 161,413 | 9,211,409 |
| 522,243 |
| 23,886,199 |
|
| Issued in reinvestment of distributions | 6,433 | 350,521 |
| 2,051 |
| 91,713 |
|
| Redeemed | (429,102) | (25,087,621) |
| (176,427) |
| (8,601,099) |
|
| | (261,256) | (15,525,691) |
| 347,867 |
| 15,376,813 |
|
| A Class/Shares Authorized | 75,000,000 | | 75,000,000 |
| |
| Sold | 116,938 | 6,632,877 |
| 272,763 |
| 12,295,204 |
|
| Issued in reinvestment of distributions | 4,668 | 247,529 |
| 6,596 |
| 287,136 |
|
| Redeemed | (291,832) | (16,281,685) |
| (507,187) |
| (23,202,894) |
|
| | (170,226) | (9,401,279) |
| (227,828) |
| (10,620,554) |
|
| C Class/Shares Authorized | 25,000,000 | | 25,000,000 |
| |
| Sold | 12,065 | 623,486 |
| 52,007 |
| 2,251,547 |
|
| Issued in reinvestment of distributions | 379 | 19,014 |
| 337 |
| 13,997 |
|
| Redeemed | (71,078) | (3,785,994) |
| (28,064) |
| (1,256,210) |
|
| | (58,634) | (3,143,494) |
| 24,280 |
| 1,009,334 |
|
| R Class/Shares Authorized | 50,000,000 | | 50,000,000 |
| |
| Sold | 8,774 | 488,474 |
| 35,684 |
| 1,579,863 |
|
| Issued in reinvestment of distributions | 265 | 14,057 |
| 284 |
| 12,375 |
|
| Redeemed | (21,213) | (1,181,480) |
| (7,025) |
| (317,434) |
|
| | (12,174) | (678,949) |
| 28,943 |
| 1,274,804 |
|
| R6 Class/Shares Authorized | 50,000,000 | | 50,000,000 |
| |
| Sold | 129,561 | 7,711,850 |
| 500 |
| 25,000 |
|
| Issued in reinvestment of distributions | 6 | 323 |
| — |
| — |
|
| Redeemed | (6,676) | (400,828) |
| — |
| — |
|
| | 122,891 | 7,311,345 |
| 500 |
| 25,000 |
|
| Net increase (decrease) | (2,905,600) | $ | (165,037,117 | ) | (2,659,944) |
| $ | (126,523,858 | ) |
| |
| (1) | July 26, 2013 (commencement of sale) through October 31, 2013 for the R6 Class. |
6. Fair Value Measurements
The fund’s investments valuation process is based on several considerations and may use multiple inputs to determine the fair value of the investments held by the fund. In conformity with accounting principles generally accepted in the United States of America, the inputs used to determine a valuation are classified into three broad levels.
| |
| • | Level 1 valuation inputs consist of unadjusted quoted prices in an active market for identical investments. |
| |
| • | Level 2 valuation inputs consist of direct or indirect observable market data (including quoted prices for comparable investments, evaluations of subsequent market events, interest rates, prepayment speeds, credit risk, etc.). These inputs also consist of quoted prices for identical investments initially expressed in local currencies that are adjusted through translation into U.S. dollars. |
| |
| • | Level 3 valuation inputs consist of unobservable data (including a fund’s own assumptions). |
The level classification is based on the lowest level input that is significant to the fair valuation measurement. The valuation inputs are not necessarily an indication of the risks associated with investing in these securities or other financial instruments. There were no significant transfers between levels during the period.
The following is a summary of the level classifications as of period end. The Schedule of Investments provides additional information on the fund’s portfolio holdings.
|
| | | | | | | | |
| | Level 1 | Level 2 | Level 3 |
| Assets | | | |
| Investment Securities | | | |
| Common Stocks | $ | 2,306,225,604 |
| $ | 61,187,168 |
| — |
|
| Temporary Cash Investments | 5,432,793 |
| 5,431,557 |
| — |
|
| | $ | 2,311,658,397 |
| $ | 66,618,725 |
| — |
|
| Other Financial Instruments | | | |
| Forward Foreign Currency Exchange Contracts | — |
| $ | 941,652 |
| — |
|
7. Derivative Instruments
Foreign Currency Risk — The fund is subject to foreign currency exchange rate risk in the normal course of pursuing its investment objectives. The value of foreign investments held by a fund may be significantly affected by changes in foreign currency exchange rates. The dollar value of a foreign security generally decreases when the value of the dollar rises against the foreign currency in which the security is denominated and tends to increase when the value of the dollar declines against such foreign currency. A fund may enter into forward foreign currency exchange contracts to reduce a fund's exposure to foreign currency exchange rate fluctuations. The net U.S. dollar value of foreign currency underlying all contractual commitments held by a fund and the resulting unrealized appreciation or depreciation are determined daily. Realized gain or loss is recorded upon the termination of the contract. Net realized and unrealized gains or losses occurring during the holding period of forward foreign currency exchange contracts are a component of net realized gain (loss) on foreign currency transactions and change in net unrealized appreciation (depreciation) on translation of assets and liabilities in foreign currencies, respectively. A fund bears the risk of an unfavorable change in the foreign currency exchange rate underlying the forward contract. Additionally, losses, up to the fair value, may arise if the counterparties do not perform under the contract terms. The fund's average U.S. dollar exposure to foreign currency risk derivative instruments held during the period was $51,127,410.
The value of foreign currency risk derivative instruments as of October 31, 2014, is disclosed on the Statement of Assets and Liabilities as an asset of $941,652 in unrealized appreciation on forward foreign currency exchange contracts. For the year ended October 31, 2014, the effect of foreign currency risk derivative instruments on the Statement of Operations was $1,249,576 in net realized gain (loss) on foreign currency transactions and $515,145 in change in net unrealized appreciation (depreciation) on translation of assets and liabilities in foreign currencies.
8. Risk Factors
There are certain risks involved in investing in foreign securities. These risks include those resulting from future adverse political, social and economic developments, fluctuations in currency exchange rates, the possible imposition of exchange controls, and other foreign laws or restrictions.
9. Federal Tax Information
The tax character of distributions paid during the years ended October 31, 2014 and October 31, 2013 were as follows:
|
| | | | | | |
| | 2014 | 2013 |
| Distributions Paid From | | |
| Ordinary income | $ | 9,693,768 |
| $ | 13,503,171 |
|
| Long-term capital gains | $ | 9,015,687 |
| — |
|
The book-basis character of distributions made during the year from net investment income or net realized gains may differ from their ultimate characterization for federal income tax purposes. These differences reflect the differing character of certain income items and net realized gains and losses for financial statement and tax purposes, and may result in reclassification among certain capital accounts on the financial statements.
As of October 31, 2014, the federal tax cost of investments and the components of distributable earnings on a tax-basis were as follows: |
| | | |
| Federal tax cost of investments | $ | 1,328,237,613 |
|
| Gross tax appreciation of investments | $ | 1,053,776,094 |
|
| Gross tax depreciation of investments | (3,736,585) |
|
| Net tax appreciation (depreciation) of investments | 1,050,039,509 |
|
Net tax appreciation (depreciation) on derivatives and translation of assets and liabilities in foreign currencies | (17,756 | ) |
| Net tax appreciation (depreciation) | $ | 1,050,021,753 |
|
| Undistributed ordinary income | $ | 12,079,740 |
|
| Accumulated long-term gains | $ | 205,490,792 |
|
The difference between book-basis and tax-basis unrealized appreciation (depreciation) is attributable primarily to the tax deferral of losses on wash sales.
|
| | | | | | | | | | | | | | | |
| For a Share Outstanding Throughout the Years Ended October 31 (except as noted) | | | |
| Per-Share Data | | | | | | | | | Ratios and Supplemental Data |
| | | Income From Investment Operations: | Distributions From: | | | Ratio to Average Net Assets of: | | |
| | Net Asset
Value,
Beginning
of Period | Net
Investment
Income
(Loss)(1) | Net
Realized
and
Unrealized
Gain (Loss) | Total From
Investment
Operations | Net
Investment
Income | Net
Realized
Gains | Total
Distributions | Net Asset
Value,
End
of Period | Total
Return(2) | Operating
Expenses | Net
Investment
Income
(Loss) | Portfolio
Turnover
Rate | Net
Assets,
End of
Period
(in thousands) |
| Investor Class | | | | | | | | | | | | |
| 2014 | $53.07 | 0.19 | 8.51 | 8.70 | (0.24) | (0.22) | (0.46) | $61.31 | 16.50% | 1.00% | 0.34% | 25% |
| $2,293,893 |
|
| 2013 | $43.52 | 0.35 | 9.51 | 9.86 | (0.31) | — | (0.31) | $53.07 | 22.80% | 1.00% | 0.74% | 31% |
| $2,119,523 |
|
| 2012 | $39.14 | 0.17 | 4.31 | 4.48 | (0.10) | — | (0.10) | $43.52 | 11.50% | 1.00% | 0.41% | 17% |
| $1,861,545 |
|
| 2011 | $35.54 | 0.10 | 3.62 | 3.72 | (0.12) | — | (0.12) | $39.14 | 10.49% | 1.00% | 0.26% | 17% |
| $1,765,718 |
|
| 2010 | $30.58 | 0.11 | 5.01 | 5.12 | (0.16) | — | (0.16) | $35.54 | 16.78% | 1.01% | 0.34% | 35% |
| $1,722,138 |
|
| Institutional Class | | | | | | | | | | | | |
| 2014 | $53.79 | 0.32 | 8.61 | 8.93 | (0.35) | (0.22) | (0.57) | $62.15 | 16.74% | 0.80% | 0.54% | 25% |
| $29,130 |
|
| 2013 | $44.04 | 0.36 | 9.72 | 10.08 | (0.33) | — | (0.33) | $53.79 | 23.05% | 0.80% | 0.94% | 31% |
| $39,263 |
|
| 2012 | $39.60 | 0.24 | 4.38 | 4.62 | (0.18) | — | (0.18) | $44.04 | 11.73% | 0.80% | 0.61% | 17% |
| $16,828 |
|
| 2011 | $35.95 | 0.18 | 3.67 | 3.85 | (0.20) | — | (0.20) | $39.60 | 10.73% | 0.80% | 0.46% | 17% |
| $5,133 |
|
| 2010 | $30.94 | 0.18 | 5.06 | 5.24 | (0.23) | — | (0.23) | $35.95 | 17.02% | 0.81% | 0.54% | 35% |
| $4,563 |
|
|
| | | | | | | | | | | | | | | |
| For a Share Outstanding Throughout the Years Ended October 31 (except as noted) | | | |
| Per-Share Data | | | | | | | | | Ratios and Supplemental Data |
| | | Income From Investment Operations: | Distributions From: | | | Ratio to Average Net Assets of: | | |
| | Net Asset
Value,
Beginning
of Period | Net
Investment
Income
(Loss)(1) | Net
Realized
and
Unrealized
Gain (Loss) | Total From
Investment
Operations | Net
Investment
Income | Net
Realized
Gains | Total
Distributions | Net Asset
Value,
End
of Period | Total
Return(2) | Operating
Expenses | Net
Investment
Income
(Loss) | Portfolio
Turnover
Rate | Net
Assets,
End of
Period
(in thousands) |
| A Class | | | | | | | | | | | | |
| 2014 | $52.15 | 0.06 | 8.36 | 8.42 | (0.10) | (0.22) | (0.32) | $60.25 | 16.21% | 1.25% | 0.09% | 25% |
| $39,786 |
|
| 2013 | $42.85 | 0.25 | 9.33 | 9.58 | (0.28) | — | (0.28) | $52.15 | 22.48% | 1.25% | 0.49% | 31% |
| $43,318 |
|
| 2012 | $38.54 | 0.06 | 4.26 | 4.32 | (0.01) | — | (0.01) | $42.85 | 11.22% | 1.25% | 0.16% | 17% |
| $45,355 |
|
| 2011 | $34.99 | —(3) | 3.58 | 3.58 | (0.03) | — | (0.03) | $38.54 | 10.23% | 1.25% | 0.01% | 17% |
| $24,573 |
|
| 2010 | $30.11 | 0.03 | 4.93 | 4.96 | (0.08) | — | (0.08) | $34.99 | 16.48% | 1.26% | 0.09% | 35% |
| $20,666 |
|
| C Class | | | | | | | | | | | | |
| 2014 | $49.32 | (0.34) | 7.88 | 7.54 | — | (0.22) | (0.22) | $56.64 | 15.34% | 2.00% | (0.66)% | 25% |
| $5,929 |
|
| 2013 | $40.75 | (0.14) | 8.90 | 8.76 | (0.19) | — | (0.19) | $49.32 | 21.57% | 2.00% | (0.26)% | 31% |
| $8,054 |
|
| 2012 | $36.92 | (0.25) | 4.08 | 3.83 | — | — | — | $40.75 | 10.37% | 2.00% | (0.59)% | 17% |
| $5,666 |
|
| 2011 | $33.74 | (0.28) | 3.46 | 3.18 | — | — | — | $36.92 | 9.43% | 2.00% | (0.74)% | 17% |
| $571 |
|
| 2010 | $29.19 | (0.20) | 4.75 | 4.55 | — | — | — | $33.74 | 15.63% | 2.01% | (0.66)% | 35% |
| $390 |
|
| R Class | | | | | | | | | | | | |
| 2014 | $52.07 | (0.08) | 8.35 | 8.27 | — | (0.22) | (0.22) | $60.12 | 15.92% | 1.50% | (0.16)% | 25% |
| $3,050 |
|
| 2013 | $42.86 | 0.03 | 9.43 | 9.46 | (0.25) | — | (0.25) | $52.07 | 22.18% | 1.50% | 0.24% | 31% |
| $3,275 |
|
| 2012 | $38.64 | (0.06) | 4.28 | 4.22 | — | — | — | $42.86 | 10.92% | 1.50% | (0.09)% | 17% |
| $1,456 |
|
| 2011 | $35.14 | (0.08) | 3.58 | 3.50 | — | — | — | $38.64 | 9.96% | 1.50% | (0.24)% | 17% |
| $59 |
|
| 2010 | $30.24 | (0.05) | 4.95 | 4.90 | — | — | — | $35.14 | 16.20% | 1.51% | (0.16)% | 35% |
| $29 |
|
|
| | | | | | | | | | | | | | | |
| For a Share Outstanding Throughout the Years Ended October 31 (except as noted) | | | |
| Per-Share Data | | | | | | | | | Ratios and Supplemental Data |
| | | Income From Investment Operations: | Distributions From: | | | Ratio to Average Net Assets of: | | |
| | Net Asset
Value,
Beginning
of Period | Net
Investment
Income
(Loss)(1) | Net
Realized
and
Unrealized
Gain (Loss) | Total From
Investment
Operations | Net
Investment
Income | Net
Realized
Gains | Total
Distributions | Net Asset
Value,
End
of Period | Total
Return(2) | Operating
Expenses | Net
Investment
Income
(Loss) | Portfolio
Turnover
Rate | Net
Assets,
End of
Period
(in thousands) |
| R6 Class | | | | | | | | | | | | |
| 2014 | $53.81 | 0.18 | 8.84 | 9.02 | (0.43) | (0.22) | (0.65) | $62.18 | 16.92% | 0.65% | 0.69% | 25% |
| $7,672 |
|
2013(4) | $49.95 | 0.10 | 3.76 | 3.86 | — | — | — | $53.81 | 7.73% | 0.65%(5) | 0.72%(5) | 31%(6) |
| $27 |
|
|
| | | | |
| Notes to Financial Highlights | | |
| |
| (1) | Computed using average shares outstanding throughout the period. |
| |
| (2) | Total returns are calculated based on the net asset value of the last business day and do not reflect applicable sales charges, if any. Total returns for periods less than one year are not annualized. |
| |
| (3) | Per-share amount was less than $0.005. |
| |
| (4) | July 26, 2013 (commencement of sale) through October 31, 2013. |
| |
| (6) | Portfolio turnover is calculated at the fund level. Percentage indicated was calculated for the year ended October 31, 2013. |
See Notes to Financial Statements.
|
|
| Report of Independent Registered Public Accounting Firm |
To the Board of Directors and Shareholders of
American Century Mutual Funds, Inc.:
We have audited the accompanying statement of assets and liabilities, including the schedule of investments, of Select Fund (the “Fund”), one of the funds constituting American Century Mutual Funds, Inc., as of October 31, 2014, and the related statement of operations for the year then ended, the statements of changes in net assets for each of the two years in the period then ended, and the financial highlights for each of the periods presented. These financial statements and financial highlights are the responsibility of the Fund's management. Our responsibility is to express an opinion on these financial statements and financial highlights based on our audits.
We conducted our audits in accordance with the standards of the Public Company Accounting Oversight Board (United States). Those standards require that we plan and perform the audit to obtain reasonable assurance about whether the financial statements and financial highlights are free of material misstatement. The Fund is not required to have, nor were we engaged to perform, an audit of its internal control over financial reporting. Our audits included consideration of internal control over financial reporting as a basis for designing audit procedures that are appropriate in the circumstances, but not for the purpose of expressing an opinion on the effectiveness of the Fund's internal control over financial reporting. Accordingly, we express no such opinion. An audit also includes examining, on a test basis, evidence supporting the amounts and disclosures in the financial statements, assessing the accounting principles used and significant estimates made by management, as well as evaluating the overall financial statement presentation. Our procedures included confirmation of securities owned as of October 31, 2014, by correspondence with the custodian and brokers; where replies were not received from brokers, we performed other auditing procedures. We believe that our audits provide a reasonable basis for our opinion.
In our opinion, the financial statements and financial highlights referred to above present fairly, in all material respects, the financial position of Select Fund of American Century Mutual Funds, Inc. as of October 31, 2014, the results of its operations for the year then ended, the changes in its net assets for each of the two years in the period then ended, and the financial highlights for each of the periods presented, in conformity with accounting principles generally accepted in the United States of America.
DELOITTE & TOUCHE LLP
Kansas City, Missouri
December 17, 2014
The Board of Directors
The individuals listed below serve as directors of the funds. Each director will continue to serve in this capacity until death, retirement, resignation or removal from office. The board has adopted a mandatory retirement age for directors who are not “interested persons,” as that term is defined in the Investment Company Act (independent directors). Independent directors shall retire by December 31 of the year in which they reach their 75th birthday.
Mr. Thomas is an “interested person” because he currently serves as President and Chief Executive Officer of American Century Companies, Inc. (ACC), the parent company of American Century Investment Management, Inc. (ACIM or the advisor). Mr. Fink is treated as an “interested person” because of his recent employment with ACC and American Century Services, LLC (ACS). The other directors (more than three-fourths of the total number) are independent. They are not employees, directors or officers of, and have no financial interest in, ACC or any of its wholly owned, direct or indirect, subsidiaries, including ACIM, American Century Investment Services, Inc. (ACIS) and ACS, and they do not have any other affiliations, positions, or relationships that would cause them to be considered “interested persons” under the Investment Company Act. The directors serve in this capacity for seven (in the case of Mr. Thomas, 15) registered investment companies in the American Century Investments family of funds.
The following table presents additional information about the directors. The mailing address for each director is 4500 Main Street, Kansas City, Missouri 64111.
|
| | | | | |
Name
(Year of Birth) | Position(s) Held with Funds | Length of Time Served | Principal Occupation(s) During Past 5 Years | Number of American Century Portfolios Overseen by Director | Other Directorships Held During Past
5 Years |
| Independent Directors | | | | |
Thomas A. Brown
(1940) | Director | Since 1980 | Managing Member, Associated Investments, LLC (real estate investment company); Brown Cascade Properties, LLC (real estate investment company) (2001 to 2009) | 73 | None |
Andrea C. Hall
(1945) | Director | Since 1997 | Retired | 73 | None |
Jan M. Lewis
(1957) | Director | Since 2011 | Retired; President and Chief Executive Officer, Catholic Charities of Northeast Kansas (human services organization) (2006 to 2013) | 73 | None |
James A. Olson
(1942) | Director and Chairman of the Board | Since 2007 (Chairman since 2014) | Member, Plaza Belmont LLC (private equity fund manager) | 73 | Saia, Inc. (2002 to 2012) and EPR Properties (2003 to 2013) |
|
| | | | | |
Name
(Year of Birth) | Position(s) Held with Funds | Length of Time Served | Principal Occupation(s) During Past 5 Years | Number of American Century Portfolios Overseen by Director | Other Directorships Held During Past
5 Years |
| Independent Directors | | | | |
M. Jeannine Strandjord
(1945) | Director | Since 1994 | Retired | 73 | Euronet Worldwide Inc.; Charming Shoppes, Inc. (2006 to 2010); and DST Systems Inc. (1996 to 2012) |
John R. Whitten
(1946) | Director | Since 2008 | Retired | 73 | Rudolph Technologies, Inc. |
Stephen E. Yates
(1948) | Director | Since 2012 | Retired; Executive Vice President, Technology & Operations, KeyCorp. (computer services) (2004 to 2010) | 73 | Applied Industrial Technologies, Inc. (2001 to 2010) |
| Interested Directors | | | | |
Barry Fink
(1955) | Director | Since 2012 | Retired; Executive Vice President, ACC (September 2007 to February 2013); President, ACS (October 2007 to February 2013); Chief Operating Officer, ACC (September 2007 to November 2012) | 73 | None |
Jonathan S. Thomas
(1963) | Director and President | Since 2007 | President and Chief Executive Officer, ACC (March 2007 to present). Also serves as Chief Executive Officer, ACS; Executive Vice President, ACIM; Director, ACC, ACIM and other ACC subsidiaries | 118 | BioMed Valley Discoveries, Inc. |
The Statement of Additional Information has additional information about the fund's directors and is available without charge, upon request, by calling 1-800-345-2021.
Officers
The following table presents certain information about the executive officers of the funds. Each officer serves as an officer for each of the 15 investment companies in the American Century family of funds, unless otherwise noted. No officer is compensated for his or her service as an officer of the funds. The listed officers are interested persons of the funds and are appointed or re-appointed on an annual basis. The mailing address for each officer listed below is 4500 Main Street, Kansas City, Missouri 64111.
|
| | |
Name (Year of Birth) | Offices with the Funds | Principal Occupation(s) During the Past Five Years |
Jonathan S.
Thomas
(1963) | Director and
President
since 2007 | President and Chief Executive Officer, ACC (March 2007 to present). Also serves as Chief Executive Officer, ACS; Executive Vice President, ACIM; Director, ACC, ACIM and other ACC subsidiaries |
Amy D. Shelton
(1964) | Chief Compliance
Officer since 2014 | Chief Compliance Officer, American Century funds, (March 2014 to present); Chief Compliance Officer, ACIM (February 2014 to present); Chief Compliance Officer, ACIS (October 2009 to present); Vice President, Client Interactions and Marketing, ACIS (February 2013 to January 2014); Director, Client Interactions and Marketing, ACIS (June 2007 to January 2013). Also serves as Vice President, ACIS |
Charles A.
Etherington
(1957) | General Counsel
since 2007 and
Senior Vice
President since 2006 | Attorney, ACC (February 1994 to present); Vice President, ACC (November 2005 to present); General Counsel, ACC (March 2007 to present). Also serves as General Counsel, ACIM, ACS, ACIS and other ACC subsidiaries; and Senior Vice President, ACIM and ACS |
C. Jean Wade
(1964) | Vice President,
Treasurer and
Chief Financial
Officer since 2012 | Vice President, ACS (February 2000 to present) |
Robert J.
Leach
(1966) | Vice President
since 2006 and
Assistant Treasurer
since 2012 | Vice President, ACS (February 2000 to present) |
David H.
Reinmiller
(1963) | Vice President
since 2000 | Attorney, ACC (January 1994 to present); Associate General Counsel, ACC (January 2001 to present). Also serves as Vice President, ACIM and ACS |
Ward D.
Stauffer
(1960) | Secretary
since 2005 | Attorney, ACC (June 2003 to present) |
|
|
| Approval of Management Agreement |
At a meeting held on June 18, 2014, the Fund’s Board of Directors unanimously approved the renewal of the management agreement pursuant to which American Century Investment Management, Inc. (the “Advisor”) acts as the investment advisor for the Fund. Under Section 15(c) of the Investment Company Act, contracts for investment advisory services are required to be reviewed, evaluated, and approved by a majority of a fund’s directors (the “Directors”), including a majority of the independent Directors, each year.
Prior to its consideration of the renewal of the management agreement, the Board requested and reviewed extensive data and information compiled by the Advisor and certain independent providers of evaluation data concerning the Fund and the services provided to the Fund by the Advisor. This review was in addition to the oversight and evaluation undertaken by the Board and its committees on a continuous basis and the information received was supplemental to the extensive information that the Board and its committees receive and consider throughout the year.
In connection with its consideration of the renewal of the management agreement, the Board’s review and evaluation of the services provided by the Advisor included, but was not limited to, the following:
| |
| • | the nature, extent, and quality of investment management, shareholder services, and other services provided by the Advisor to the Fund; |
| |
| • | the wide range of other programs and services the Advisor provides to the Fund and its shareholders on a routine and non-routine basis; |
| |
| • | the Fund’s investment performance compared to appropriate benchmarks and/or a peer group of other mutual funds with similar investment objectives and strategies; |
| |
| • | the cost of owning the Fund compared to the cost of owning similar funds; |
| |
| • | the Advisor’s compliance policies, procedures, and regulatory experience; |
| |
| • | financial data showing the cost of services provided to the Fund, the profitability of the Fund to the Advisor, and the overall profitability of the Advisor; |
| |
| • | possible economies of scale associated with the Advisor’s management of the Fund and other accounts under its management; |
| |
| • | the services provided and charges to other investment management clients of the Advisor; |
| |
| • | acquired fund fees and expenses; and |
| |
| • | any collateral benefits derived by the Advisor from the management of the Fund. |
In keeping with its practice, the Board held two in-person meetings and one telephonic meeting to review and discuss the information provided. The independent Directors also had the benefit of the advice of their independent counsel throughout the process.
Factors Considered
The Directors considered all of the information provided by the Advisor, the independent data providers, and independent counsel, and evaluated such information for the Fund. In connection with their review, the Directors did not identify any single factor as being all-important or controlling, and each Director may have attributed different levels of importance to different factors. In deciding to renew the management agreement, the Board based its decision on a number of factors, including the following:
Nature, Extent and Quality of Services — Generally. Under the management agreement, the Advisor is responsible for providing or arranging for all services necessary for the operation of the Fund. The Board noted that under the management agreement, the Advisor provides or arranges at its own expense a wide variety of services including:
| |
| • | constructing and designing the Fund |
| |
| • | portfolio research and security selection |
| |
| • | initial capitalization/funding |
| |
| • | daily valuation of the Fund’s portfolio |
| |
| • | shareholder servicing and transfer agency, including shareholder confirmations, recordkeeping, and communications |
| |
| • | legal services (except the independent Directors’ counsel) |
| |
| • | regulatory and portfolio compliance |
| |
| • | marketing and distribution (except Rule 12b-1 plans) |
The Board noted that many of these services have expanded over time both in terms of quantity and complexity in response to shareholder demands, competition in the industry, changing distribution channels, and the changing regulatory environment.
Investment Management Services. The nature of the investment management services provided to the Fund is quite complex and allows Fund shareholders access to professional money management, instant diversification of their investments within an asset class, the opportunity to easily diversify among asset classes by investing in or exchanging among various American Century Investments funds, and liquidity. In evaluating investment performance, the Board expects the Advisor to manage the Fund in accordance with its investment objectives and approved strategies. Further, the Directors recognize that the Advisor has an obligation to monitor trading activities, and in particular to seek the best execution of fund trades, and to evaluate the use of and payment for research. In providing these services, the Advisor utilizes teams of investment professionals (portfolio managers, analysts, research assistants, and securities traders) who require extensive information technology, research, training, compliance and other systems to conduct their business. The Board, directly and through its Fund Performance Review Committee, regularly reviews investment performance information for the Fund, together with comparative information for appropriate benchmarks and/or peer groups of similarly-managed funds, over different time horizons. The Directors also review detailed performance information during the management agreement approval process. If performance concerns are identified, the Fund receives special reviews until performance improves, during which the Board discusses with the Advisor the reasons for such results (e.g., market conditions, security selection) and any efforts being undertaken to improve performance. The Fund’s performance was below its benchmark for the one-, three-, five-, and ten-year periods reviewed by the Board. The Board discussed the Fund’s performance with the Advisor and was satisfied with the efforts being undertaken by the Advisor. The Board found the investment management services provided by the Advisor to the Fund to be satisfactory and consistent with the management agreement.
Shareholder and Other Services. Under the management agreement, the Advisor provides the Fund with a comprehensive package of transfer agency, shareholder, and other services. The Board, directly and through various committees of the Board, regularly reviews reports and evaluations of such services at its regular meetings. These reports include, but are not limited to, information regarding the operational efficiency and accuracy of the shareholder and transfer agency services provided, staffing levels, shareholder satisfaction (as measured by external as well as internal sources), technology support, new products and services offered to Fund shareholders, securities trading activities, portfolio valuation services, auditing services, and legal and operational compliance activities. Certain aspects of shareholder and transfer agency service level efficiency and the quality of securities trading activities are measured by independent third party providers
and are presented in comparison to other fund groups not managed by the Advisor. The Board found the services provided by the Advisor to the Fund under the management agreement to be competitive and of high quality.
Costs of Services and Profitability. The Advisor provides detailed information concerning its cost of providing various services to the Fund, its profitability in managing the Fund (pre- and post-distribution), its overall profitability, and its financial condition. The Directors have reviewed with the Advisor the methodology used to prepare this financial information. The financial information regarding the Advisor is considered in evaluating the Advisor’s financial condition, its ability to continue to provide services under the management agreement, and the reasonableness of the current management fee. The Board concluded that the Advisor’s profits were reasonable in light of the services provided to the Fund.
Ethics. The Board generally considers the Advisor’s commitment to providing quality services to shareholders and to conducting its business ethically. They noted that the Advisor’s practices generally meet or exceed industry best practices.
Economies of Scale. The Board also reviewed information provided by the Advisor regarding the possible existence of economies of scale in connection with the management of the Fund. The Board concluded that economies of scale are difficult to measure and predict with precision, especially on a fund-by-fund basis. The Board concluded that the Advisor is appropriately sharing economies of scale through its competitive fee structure, offering competitive fees from fund inception, and through reinvestment in its business to provide shareholders additional content and services.
Comparison to Other Funds’ Fees. The management agreement provides that the Fund pays the Advisor a single, all-inclusive (or unified) management fee for providing all services necessary for the management and operation of the Fund, other than brokerage expenses, taxes, interest, extraordinary expenses, and the fees and expenses of the Fund’s independent directors (including their independent legal counsel) and expenses incurred in connection with the provision of shareholder services and distribution services under a plan adopted pursuant to Rule 12b-1 under the 1940 Act. Under the unified fee structure, the Advisor is responsible for providing all investment advisory, custody, audit, administrative, compliance, recordkeeping, marketing and shareholder services, or arranging and supervising third parties to provide such services. By contrast, most other funds are charged a variety of fees, including an investment advisory fee, a transfer agency fee, an administrative fee, distribution charges and other expenses. Other than their investment advisory fees and any applicable Rule 12b-1 distribution fees, all other components of the total fees charged by these other funds may be increased without shareholder approval. The Board believes the unified fee structure is a benefit to Fund shareholders because it clearly discloses to shareholders the cost of owning Fund shares, and, since the unified fee cannot be increased without a vote of Fund shareholders, it shifts to the Advisor the risk of increased costs of operating the Fund and provides a direct incentive to minimize administrative inefficiencies. Part of the Board’s analysis of fee levels involves reviewing certain evaluative data compiled by an independent provider comparing the Fund’s unified fee to the total expense ratios of its peers. The unified fee charged to shareholders of the Fund was below the median of the total expense ratios of the Fund’s peer expense universe and was within the range of its peer expense group. The Board and the Advisor agreed to certain adjustments regarding the breakpoints in the Fund’s unified management fee schedule, including changing the number of breakpoints and the investment amount that applies to each breakpoint, beginning August 1, 2014. The Board concluded that the management fee paid by the Fund to the Advisor under the management agreement is reasonable in light of the services provided to the Fund.
Comparison to Fees and Services Provided to Other Clients of the Advisor. The Board also requested and received information from the Advisor concerning the nature of the services, fees, costs and profitability of its advisory services to advisory clients other than the Fund. They observed that these varying types of client accounts require different services and involve different regulatory and entrepreneurial risks than the management of the Fund. The Board analyzed this
information and concluded that the fees charged and services provided to the Fund were reasonable by comparison.
Collateral or “Fall-Out” Benefits Derived by the Advisor. The Board considered the existence of collateral benefits the Advisor may receive as a result of its relationship with the Fund. They concluded that the Advisor’s primary business is managing mutual funds and it generally does not use fund or shareholder information to generate profits in other lines of business, and therefore does not derive any significant collateral benefits from them. The Board noted that the Advisor receives proprietary research from broker-dealers that execute fund portfolio transactions and concluded that this research is likely to benefit Fund shareholders. The Board also determined that the Advisor is able to provide investment management services to certain clients other than the Fund, at least in part, due to its existing infrastructure built to serve the fund complex. The Board concluded, however, that the assets of those other clients are not material to the analysis and, where applicable, may be included with the assets of the Fund to determine breakpoints in the management fee schedule.
Existing Relationship. The Board also considered whether there was any reason for not continuing the existing arrangement with the Advisor. In this regard, the Board was mindful of the potential disruptions of the Fund’s operations and various risks, uncertainties, and other effects that could occur as a result of a decision not to continue such relationship. In particular, the Board recognized that most shareholders have invested in the Fund on the strength of the Advisor’s industry standing and reputation and in the expectation that the Advisor will have a continuing role in providing advisory services to the Fund.
Conclusion of the Directors. As a result of this process, the Board, including all of the independent Directors, taking into account all of the factors discussed above and the information provided by the Advisor and others, concluded that the management agreement between the Fund and the Advisor is fair and reasonable in light of the services provided and should be renewed.
Retirement Account Information
As required by law, distributions you receive from certain IRAs are subject to federal income tax withholding, unless you elect not to have withholding apply. Tax will be withheld on the total amount withdrawn even though you may be receiving amounts that are not subject to withholding, such as nondeductible contributions. In such case, excess amounts of withholding could occur. You may adjust your withholding election so that a greater or lesser amount will be withheld.
If you don’t want us to withhold on this amount, you must notify us to not withhold the federal income tax. You may notify us in writing or in certain situations by telephone or through other electronic means. For systematic withdrawals, your withholding election will remain in effect until revoked or changed by filing a new election. You have the right to revoke your election at any time.
Remember, even if you elect not to have income tax withheld, you are liable for paying income tax on the taxable portion of your withdrawal. If you elect not to have income tax withheld or you don’t have enough income tax withheld, you may be responsible for payment of estimated tax. You may incur penalties under the estimated tax rules if your withholding and estimated tax payments are not sufficient. You can reduce or defer the income tax on a distribution by directly or indirectly rolling such distribution over to another IRA or eligible plan. You should consult your tax advisor for additional information.
State tax will be withheld if, at the time of your distribution, your address is within one of the mandatory withholding states and you have federal income tax withheld (or as otherwise required by state law). State taxes will be withheld from your distribution in accordance with the respective state rules.
Distributions you receive from 403(b), 457 and qualified plans are subject to special tax and withholding rules. Your plan administrator or plan sponsor is required to provide you with a special tax notice explaining those rules at the time you request a distribution. If applicable, federal and/or state taxes may be withheld from your distribution amount.
Proxy Voting Policies
A description of the policies that the fund's investment advisor uses in exercising the voting rights associated with the securities purchased and/or held by the fund is available without charge, upon request, by calling 1-800-345-2021. It is also available on the "About Us" page of American Century Investments’ website at americancentury.com and on the Securities and Exchange Commission’s website at sec.gov. Information regarding how the investment advisor voted proxies relating to portfolio securities during the most recent 12-month period ended June 30 is available on the "About Us" page at americancentury.com. It is also available at sec.gov.
Quarterly Portfolio Disclosure
The fund files its complete schedule of portfolio holdings with the Securities and Exchange Commission (SEC) for the first and third quarters of each fiscal year on Form N-Q. The fund’s Forms N-Q are available on the SEC’s website at sec.gov, and may be reviewed and copied at the SEC’s Public Reference Room in Washington, DC. Information on the operation of the Public Reference Room may be obtained by calling 1-800-SEC-0330. The fund also makes its complete schedule of portfolio holdings for the most recent quarter of its fiscal year available on its
website at americancentury.com and, upon request, by calling 1-800-345-2021.
Other Tax Information
The following information is provided pursuant to provisions of the Internal Revenue Code.
The fund hereby designates up to the maximum amount allowable as qualified dividend income for the fiscal year ended October 31, 2014.
For corporate taxpayers, the fund hereby designates $9,693,768, or up to the maximum amount allowable, of ordinary income distributions paid during the fiscal year ended October 31, 2014 as qualified for the corporate dividends received deduction.
The fund hereby designates $9,015,687, or up to the maximum amount allowable, as long-term capital gain distributions for the fiscal year ended October 31, 2014.
|
| | |
| |
| | | |
| Contact Us | americancentury.com | |
| Automated Information Line | 1-800-345-8765 | |
| Investor Services Representative | 1-800-345-2021 or 816-531-5575 | |
| Investors Using Advisors | 1-800-378-9878 | |
| Business, Not-For-Profit, Employer-Sponsored Retirement Plans | 1-800-345-3533 | |
| Banks and Trust Companies, Broker-Dealers, Financial Professionals, Insurance Companies | 1-800-345-6488 | |
| Telecommunications Relay Service for the Deaf | 711 | |
| | | |
| American Century Mutual Funds, Inc. | |
| | | |
Investment Advisor: American Century Investment Management, Inc. Kansas City, Missouri | |
| | | |
| This report and the statements it contains are submitted for the general information of our shareholders. The report is not authorized for distribution to prospective investors unless preceded or accompanied by an effective prospectus. | |
| | | |
©2014 American Century Proprietary Holdings, Inc. All rights reserved.
CL-ANN-83997 1412 | |
|
| |
| ANNUAL REPORT | OCTOBER 31, 2014 |
Small Cap Growth Fund
|
| |
| President’s Letter | |
| Performance | |
| Portfolio Commentary | |
| Fund Characteristics | |
| Shareholder Fee Example | |
| Schedule of Investments | |
| Statement of Assets and Liabilities | |
| Statement of Operations | |
| Statement of Changes in Net Assets | |
| Notes to Financial Statements | |
| Financial Highlights | |
| Report of Independent Registered Public Accounting Firm | |
| Management | |
| Approval of Management Agreement | |
| Additional Information | |
Any opinions expressed in this report reflect those of the author as of the date of the report, and do not necessarily represent the opinions of American Century Investments® or any other person in the American Century Investments organization. Any such opinions are subject to change at any time based upon market or other conditions and American Century Investments disclaims any responsibility to update such opinions. These opinions may not be relied upon as investment advice and, because investment decisions made by American Century Investments funds are based on numerous factors, may not be relied upon as an indication of trading intent on behalf of any American Century Investments fund. Security examples are used for representational purposes only and are not intended as recommendations to purchase or sell securities. Performance information for comparative indices and securities is provided to American Century Investments by third party vendors. To the best of American Century Investments’ knowledge, such information is accurate at the time of printing.
|
| |
| Dear Investor:
Thank you for reviewing this annual report for the 12 months ended October 31, 2014. It provides investment performance and portfolio information for the reporting period, plus longer-term historical performance data.
Annual reports remain important vehicles for conveying information about fund returns, including market and economic factors that affected performance during the reporting period. For additional, updated investment and market insights, we encourage you to visit our website, americancentury.com. |
| Jonathan Thomas |
Favorable Fiscal Year for U.S. Stocks and Bonds
Mostly stimulative monetary policies by central banks and expectations of longer-term economic improvement, interspersed with concerns about nearer-term weaker-than-expected global economic data and geopolitical conflicts, helped drive financial market returns during the reporting period. We believe the combination of longer-term optimism about U.S. economic growth, low costs of capital, and continued central bank stimulus (even as the U.S. Federal Reserve’s latest monthly bond purchase program ended) helped persuade investors to seek risk and yield, which benefited U.S. stocks and bonds. The S&P 500 Index gained 17.27% during the 12 months. The 30-year U.S. Treasury bond was close behind, returning 15.44%, according to Barclays. U.S. real estate investment trusts (REITs), whose shares combine performance attributes of stocks and bonds, benefited from both—the MSCI U.S. REIT Index advanced 19.19%.
U.S. market benchmark returns generally outpaced their non-U.S. counterparts. The U.S. was perceived by investors as a relative bastion of growth, stability, and potentially attractive yields compared with most of the rest of the world, so capital flows generally favored U.S. assets. These capital flows, along with weaker-than-expected global growth, lower-than-expected global inflation, and falling commodity and energy prices, helped keep long-term interest rates and other corporate costs low. U.S. stocks just completed a solid third-quarter earnings reporting season, though questions remain about next year’s revenues, given this year’s slowdown in global economic growth and concerns about how far it could extend into 2015.
We believe continuing global economic and geopolitical uncertainties could continue to support the relative appeal of U.S. assets in coming months. But the end of the U.S. Federal Reserve’s monthly bond-buying program and the still-looming possibility of higher interest rates in 2015 point to potential U.S. market volatility ahead. In this environment, we continue to believe in a disciplined, diversified, long-term investment approach, using professionally managed stock and bond portfolios for meeting financial goals. We appreciate your continued trust in us.
Sincerely,
Jonathan Thomas
President and Chief Executive Officer
American Century Investments
|
| | | | | | |
| Total Returns as of October 31, 2014 |
| | | | Average Annual Returns | |
| | Ticker Symbol | 1 year | 5 years | 10 years | Since Inception | Inception Date |
| Investor Class | ANOIX | 7.28% | 18.61% | 9.09% | 8.54% | 6/1/01 |
| Russell 2000 Growth Index | — | 8.26% | 18.59% | 9.42% | 6.79% | — |
| Institutional Class | ANONX | 7.52% | 18.88% | — | 6.43% | 5/18/07 |
| A Class | ANOAX | | | | | 1/31/03 |
| No sales charge* | | 7.00% | 18.33% | 8.82% | 11.29% | |
| With sales charge* | | 0.80% | 16.94% | 8.18% | 10.73% | |
| B Class | ANOBX | | | | | 1/31/03 |
| No sales charge* | | 6.23% | 17.47% | 8.02% | 10.46% | |
| With sales charge* | | 2.23% | 17.36% | 8.02% | 10.46% | |
| C Class | ANOCX | 6.21% | 17.46% | 8.02% | 10.49%(1) | 1/31/03 |
| R Class | ANORX | 6.72% | 18.03% | — | 4.72% | 9/28/07 |
| R6 Class | ANODX | 7.69% | — | — | 11.68% | 7/26/13 |
* Sales charges include initial sales charges and contingent deferred sales charges (CDSCs), as applicable. A Class shares have a 5.75% maximum initial sales charge and may be subject to a maximum CDSC of 1.00%. B Class shares redeemed within six years of purchase are subject to a CDSC that declines from 5.00% during the first year to 0.00% after the sixth year. C Class shares redeemed within 12 months of purchase are subject to a maximum CDSC of 1.00%. The SEC requires that mutual funds provide performance information net of maximum sales charges in all cases where charges could be applied.
| |
| (1) | Returns would have been lower if a portion of the management fee had not been waived. |
Data presented reflect past performance. Past performance is no guarantee of future results. Current performance may be higher or lower than the performance shown. Investment return and principal value will fluctuate, and redemption value may be more or less than original cost. Data assumes reinvestment of dividends and capital gains, and none of the charts reflect the deduction of taxes that a shareholder would pay on fund distributions or the redemption of fund shares. To obtain performance data current to the most recent month end, please call 1-800-345-2021 or visit americancentury.com. For additional information about the fund, please consult the prospectus.
|
|
| Growth of $10,000 Over 10 Years |
| $10,000 investment made October 31, 2004 |
| Performance for other share classes will vary due to differences in fee structure. |
|
| |
| Value on October 31, 2014 |
| | Investor Class — $23,880 |
| |
| | Russell 2000 Growth Index — $24,606 |
| |
|
| | | | | | |
| Total Annual Fund Operating Expenses |
| Investor Class | Institutional Class | A Class | B Class | C Class | R Class | R6 Class |
| 1.47% | 1.27% | 1.72% | 2.47% | 2.47% | 1.97% | 1.12% |
The total annual fund operating expenses shown is as stated in the fund’s prospectus current as of the date of this report. The prospectus may vary from the expense ratio shown elsewhere in this report because it is based on a different time period, includes acquired fund fees and expenses, and, if applicable, does not include fee waivers or expense reimbursements.
Data presented reflect past performance. Past performance is no guarantee of future results. Current performance may be higher or lower than the performance shown. Investment return and principal value will fluctuate, and redemption value may be more or less than original cost. Data assumes reinvestment of dividends and capital gains, and none of the charts reflect the deduction of taxes that a shareholder would pay on fund distributions or the redemption of fund shares. To obtain performance data current to the most recent month end, please call 1-800-345-2021 or visit americancentury.com. For additional information about the fund, please consult the prospectus.
Portfolio Managers: Matthew Ferretti and Jeffrey Otto
Performance Summary
Small Cap Growth returned 7.28%* for the 12 months ended October 31, 2014, lagging the 8.26% return of the portfolio’s benchmark, the Russell 2000 Growth Index.
U.S. stock indices delivered solid returns during the reporting period. Within the Russell 2000 Growth Index, health care was the top-performing sector on a total-return basis, gaining nearly 22%. Consumer staples, information technology, and financials stocks also performed well and outpaced the benchmark average. The energy sector fell sharply, posting a double-digit loss, weighed down by declining oil prices. Consumer discretionary was the only other sector to decline, but utilities posted only a slight gain.
Small Cap Growth received positive contributions from all sectors it was invested in except energy and telecommunication services, with health care the top contributor. Stock decisions in the information technology, financials, and health care sectors were key performance detractors relative to the Russell index. Stock selection in the consumer discretionary, materials, and industrials sectors aided results versus the benchmark.
Information Technology Stocks Led Detractors
Stock choices in the information technology sector detracted from relative results, especially in the software and internet software and services industries. Covisint was a significant detractor. The company provides cloud-based software that allows companies to connect securely with their customers and business partners. The firm’s board replaced its CEO in March, saying that the company was not converting potential business opportunities and executing strongly enough on its business plan. Since our original thesis on the company had changed, we sold out of the position.
Financials stocks also detracted from relative results, largely due to stock selection among real estate investment trusts and an underweight to the industry. An overweight to banks and stock decisions within the industry were also negative.
Among other leading detractors, specialty retailer Conn’s experienced a reversal of fortunes after a strong 2013. Reduced electronics sales and elevated credit delinquencies lowered estimates for fiscal 2015. We eliminated the position. Oil and gas exploration and production company Magnum Hunter Resources slipped as the mild summer weather led to lower prices for natural gas. On a positive note, the company announced record natural gas flows from its Eureka Hunter pipeline in West Virginia and Ohio, as well as the opening of new wells in its Marcellus Shale operations.
Consumer Discretionary and Materials Holdings Aided Results
The fund benefited from holdings in the consumer discretionary sector. Lithia Motors was a top relative contributor. Earlier this year, the automotive dealership network announced the acquisition of DCH Auto Group, which gives the company a presence on the East Coast. Lithia Motors’ profit margins have also expanded as more customers bring in cars for servicing. Restoration Hardware Holdings outperformed on news of better-than-expected earnings, including an increase in same-store sales. The luxury furniture retailer also boosted profit margins by changing its source book strategy and undertaking a number of supply-chain initiatives. Materials added to relative results due to positioning among chemicals firms, where the fund avoided several weak performers that are components of the benchmark.
| |
| * | All fund returns referenced in this commentary are for Investor Class shares. Performance for other share classes will vary due to differences in fee structure; when Investor Class performance exceeds that of the fund’s benchmark, other share classes may not. See page 3 for returns for all share classes. |
Industrials Stocks Were Key Contributors
Within the industrials sector, Apogee Enterprises, which makes and installs architectural glass, saw a surge in orders, especially for taller buildings, as the non-residential real estate market has strengthened. Trucking company Saia is benefiting from improved pricing driven by greater demand and limited capacity as a result of new regulations.
Bucking the trend in the energy sector, Athlon Energy was one of the portfolio’s top relative contributors. The stock had done well since its 2013 IPO and rose sharply after Encana announced that it was buying the exploration and production company. In the IT services industry, the fund benefited from its holding in FleetCor Technologies, a provider of specialized payment products. The company is driving strong growth with accretive acquisitions in a fragmented industry.
Outlook
The portfolio positioning remains largely stock specific, with few thematic trends. As of October 31, 2014, health care was the largest overweight and financials and industrials the largest underweights. Small Cap Growth’s investment process focuses on smaller companies with accelerating earnings growth rates and share-price momentum. We believe that active investing in such companies will generate outperformance over time compared with the Russell 2000 Growth Index.
|
| |
| OCTOBER 31, 2014 | |
| Top Ten Holdings | % of net assets |
| LKQ Corp. | 2.3% |
| Shutterstock, Inc. | 1.8% |
| Middleby Corp. | 1.7% |
| ExamWorks Group, Inc. | 1.7% |
| CoStar Group, Inc. | 1.6% |
| Restoration Hardware Holdings, Inc. | 1.6% |
| Brunswick Corp. | 1.4% |
| Papa John's International, Inc. | 1.4% |
| Apogee Enterprises, Inc. | 1.3% |
| Mueller Water Products, Inc., Class A | 1.3% |
| | |
| Top Five Industries | % of net assets |
| Biotechnology | 9.3% |
| Internet Software and Services | 7.3% |
| Health Care Providers and Services | 5.7% |
| Software | 5.4% |
| Health Care Equipment and Supplies | 5.3% |
| | |
| Types of Investments in Portfolio | % of net assets |
| Common Stocks | 98.9% |
| Temporary Cash Investments | 0.9% |
| Other Assets and Liabilities | 0.2% |
Fund shareholders may incur two types of costs: (1) transaction costs, including sales charges (loads) on purchase payments and redemption/exchange fees; and (2) ongoing costs, including management fees; distribution and service (12b-1) fees; and other fund expenses. This example is intended to help you understand your ongoing costs (in dollars) of investing in your fund and to compare these costs with the ongoing cost of investing in other mutual funds.
The example is based on an investment of $1,000 made at the beginning of the period and held for the entire period from May 1, 2014 to October 31, 2014.
Actual Expenses
The table provides information about actual account values and actual expenses for each class. You may use the information, together with the amount you invested, to estimate the expenses that you paid over the period. First, identify the share class you own. Then simply divide your account value by $1,000 (for example, an $8,600 account value divided by $1,000 = 8.6), then multiply the result by the number under the heading “Expenses Paid During Period” to estimate the expenses you paid on your account during this period.
If you hold Investor Class shares of any American Century Investments fund, or Institutional Class shares of the American Century Diversified Bond Fund, in an American Century Investments account (i.e., not a financial intermediary or retirement plan account), American Century Investments may charge you a $12.50 semiannual account maintenance fee if the value of those shares is less than $10,000. We will redeem shares automatically in one of your accounts to pay the $12.50 fee. In determining your total eligible investment amount, we will include your investments in all personal accounts (including American Century Investments Brokerage accounts) registered under your Social Security number. Personal accounts include individual accounts, joint accounts, UGMA/UTMA accounts, personal trusts, Coverdell Education Savings Accounts and IRAs (including traditional, Roth, Rollover, SEP-, SARSEP- and SIMPLE-IRAs), and certain other retirement accounts. If you have only business, business retirement, employer-sponsored or American Century Investments Brokerage accounts, you are currently not subject to this fee. If you are subject to the Account Maintenance Fee, your account value could be reduced by the fee amount.
Hypothetical Example for Comparison Purposes
The table also provides information about hypothetical account values and hypothetical expenses based on the actual expense ratio of each class of your fund and an assumed rate of return of 5% per year before expenses, which is not the actual return of a fund’s share class. The hypothetical account values and expenses may not be used to estimate the actual ending account balance or expenses you paid for the period. You may use this information to compare the ongoing costs of investing in your fund and other funds. To do so, compare this 5% hypothetical example with the 5% hypothetical examples that appear in the shareholder reports of the other funds.
Please note that the expenses shown in the table are meant to highlight your ongoing costs only and do not reflect any transactional costs, such as sales charges (loads) or redemption/exchange fees. Therefore, the table is useful in comparing ongoing costs only, and will not help you determine the relative total costs of owning different funds. In addition, if these transactional costs were included, your costs would have been higher.
|
| | | | |
| Beginning
Account Value
5/1/14 | Ending
Account Value
10/31/14 | Expenses Paid
During Period(1)5/1/14 - 10/31/14 | Annualized
Expense Ratio(1) |
| Actual | | | | |
| Investor Class | $1,000 | $1,071.00 | $7.36 | 1.41% |
| Institutional Class | $1,000 | $1,072.50 | $6.32 | 1.21% |
| A Class | $1,000 | $1,070.00 | $8.66 | 1.66% |
| B Class | $1,000 | $1,066.10 | $12.55 | 2.41% |
| C Class | $1,000 | $1,065.90 | $12.55 | 2.41% |
| R Class | $1,000 | $1,068.10 | $9.96 | 1.91% |
| R6 Class | $1,000 | $1,073.30 | $5.59 | 1.07% |
| Hypothetical | | | | |
| Investor Class | $1,000 | $1,018.10 | $7.17 | 1.41% |
| Institutional Class | $1,000 | $1,019.11 | $6.16 | 1.21% |
| A Class | $1,000 | $1,016.84 | $8.44 | 1.66% |
| B Class | $1,000 | $1,013.06 | $12.23 | 2.41% |
| C Class | $1,000 | $1,013.06 | $12.23 | 2.41% |
| R Class | $1,000 | $1,015.58 | $9.70 | 1.91% |
| R6 Class | $1,000 | $1,019.81 | $5.45 | 1.07% |
| |
| (1) | Expenses are equal to the class's annualized expense ratio listed in the table above, multiplied by the average account value over the period, multiplied by 184, the number of days in the most recent fiscal half-year, divided by 365, to reflect the one-half year period. |
OCTOBER 31, 2014
|
| | | | | |
| | Shares | Value |
| COMMON STOCKS — 98.9% | | |
| Airlines — 0.7% | | |
Spirit Airlines, Inc.(1) | 37,225 |
| $ | 2,721,520 |
|
| Auto Components — 0.8% | | |
American Axle & Manufacturing Holdings, Inc.(1) | 151,788 |
| 2,934,062 |
|
| Banks — 3.3% | | |
| Bank of the Ozarks, Inc. | 93,923 |
| 3,309,846 |
|
| Cathay General Bancorp. | 104,892 |
| 2,770,198 |
|
| IBERIABANK Corp. | 37,945 |
| 2,612,893 |
|
| Renasant Corp. | 42,124 |
| 1,270,039 |
|
Signature Bank(1) | 18,996 |
| 2,300,985 |
|
| | | 12,263,961 |
|
| Beverages — 0.3% | | |
Boston Beer Co., Inc. (The), Class A(1) | 4,469 |
| 1,112,781 |
|
| Biotechnology — 9.3% | | |
ACADIA Pharmaceuticals, Inc.(1) | 49,987 |
| 1,384,640 |
|
Acceleron Pharma, Inc.(1) | 8,868 |
| 327,939 |
|
Acorda Therapeutics, Inc.(1) | 31,916 |
| 1,111,315 |
|
Agios Pharmaceuticals, Inc.(1) | 7,535 |
| 633,166 |
|
Arena Pharmaceuticals, Inc.(1) | 176,105 |
| 767,818 |
|
ARIAD Pharmaceuticals, Inc.(1) | 134,571 |
| 802,043 |
|
Celldex Therapeutics, Inc.(1) | 62,855 |
| 1,052,821 |
|
Cepheid, Inc.(1) | 42,319 |
| 2,243,330 |
|
Clovis Oncology, Inc.(1) | 21,352 |
| 1,273,860 |
|
Dyax Corp.(1) | 107,989 |
| 1,335,824 |
|
Exact Sciences Corp.(1) | 56,160 |
| 1,351,771 |
|
Halozyme Therapeutics, Inc.(1) | 87,859 |
| 845,204 |
|
ImmunoGen, Inc.(1) | 76,427 |
| 707,714 |
|
Ironwood Pharmaceuticals, Inc.(1) | 82,795 |
| 1,160,786 |
|
Isis Pharmaceuticals, Inc.(1) | 63,665 |
| 2,932,410 |
|
Keryx Biopharmaceuticals, Inc.(1) | 65,622 |
| 1,105,731 |
|
Ligand Pharmaceuticals, Inc., Class B(1) | 14,834 |
| 819,875 |
|
MannKind Corp.(1) | 155,046 |
| 931,826 |
|
Momenta Pharmaceuticals, Inc.(1) | 27,826 |
| 303,582 |
|
Neurocrine Biosciences, Inc.(1) | 62,469 |
| 1,156,926 |
|
Novavax, Inc.(1) | 195,110 |
| 1,092,616 |
|
NPS Pharmaceuticals, Inc.(1) | 61,469 |
| 1,684,251 |
|
Opko Health, Inc.(1) | 139,459 |
| 1,164,483 |
|
| PDL BioPharma, Inc. | 117,094 |
| 998,812 |
|
Portola Pharmaceuticals, Inc.(1) | 31,677 |
| 902,794 |
|
Puma Biotechnology, Inc.(1) | 10,830 |
| 2,713,998 |
|
Raptor Pharmaceutical Corp.(1) | 32,774 |
| 314,958 |
|
Receptos, Inc.(1) | 11,858 |
| 1,229,082 |
|
|
| | | | | |
| | Shares | Value |
Sangamo Biosciences, Inc.(1) | 60,046 |
| $ | 728,958 |
|
Sarepta Therapeutics, Inc.(1) | 32,106 |
| 519,154 |
|
Synageva BioPharma Corp.(1) | 15,023 |
| 1,137,842 |
|
| | | 34,735,529 |
|
| Building Products — 4.0% | | |
| Apogee Enterprises, Inc. | 108,702 |
| 4,772,018 |
|
| Insteel Industries, Inc. | 72,810 |
| 1,735,790 |
|
| Lennox International, Inc. | 24,406 |
| 2,170,182 |
|
NCI Building Systems, Inc.(1) | 154,501 |
| 3,069,935 |
|
Trex Co., Inc.(1) | 76,167 |
| 3,275,181 |
|
| | | 15,023,106 |
|
| Capital Markets — 1.5% | | |
| Evercore Partners, Inc., Class A | 67,751 |
| 3,507,469 |
|
| HFF, Inc., Class A | 70,030 |
| 2,204,545 |
|
| | | 5,712,014 |
|
| Chemicals — 1.3% | | |
Flotek Industries, Inc.(1) | 41,205 |
| 913,103 |
|
| PolyOne Corp. | 75,603 |
| 2,798,067 |
|
Trecora Resources(1) | 83,682 |
| 1,100,418 |
|
| | | 4,811,588 |
|
| Commercial Services and Supplies — 0.7% | | |
| Multi-Color Corp. | 50,372 |
| 2,483,340 |
|
| Communications Equipment — 0.6% | | |
| Ubiquiti Networks, Inc. | 68,050 |
| 2,434,148 |
|
| Construction Materials — 1.7% | | |
| Caesarstone Sdot-Yam Ltd. | 54,764 |
| 3,059,117 |
|
Headwaters, Inc.(1) | 252,272 |
| 3,203,854 |
|
| | | 6,262,971 |
|
| Containers and Packaging — 1.1% | | |
Graphic Packaging Holding Co.(1) | 336,867 |
| 4,086,197 |
|
| Distributors — 2.7% | | |
| Core-Mark Holding Co., Inc. | 25,920 |
| 1,504,138 |
|
LKQ Corp.(1) | 301,488 |
| 8,613,512 |
|
| | | 10,117,650 |
|
| Diversified Consumer Services — 1.4% | | |
Grand Canyon Education, Inc.(1) | 26,286 |
| 1,259,099 |
|
Liberty Tax, Inc.(1) | 46,254 |
| 1,752,564 |
|
Nord Anglia Education, Inc.(1) | 135,244 |
| 2,309,968 |
|
| | | 5,321,631 |
|
| Diversified Financial Services — 0.7% | | |
| MarketAxess Holdings, Inc. | 41,214 |
| 2,664,485 |
|
| Electronic Equipment, Instruments and Components — 3.6% | | |
| Belden, Inc. | 32,834 |
| 2,337,452 |
|
Cognex Corp.(1) | 40,574 |
| 1,605,107 |
|
| FEI Co. | 20,331 |
| 1,713,497 |
|
| Littelfuse, Inc. | 45,441 |
| 4,432,315 |
|
|
| | | | | |
| | Shares | Value |
| Methode Electronics, Inc. | 89,615 |
| $ | 3,529,039 |
|
| | | 13,617,410 |
|
| Energy Equipment and Services — 0.6% | | |
Archer Ltd.(1) | 774,226 |
| 745,714 |
|
RigNet, Inc.(1) | 37,006 |
| 1,607,910 |
|
| | | 2,353,624 |
|
| Food and Staples Retailing — 1.2% | | |
United Natural Foods, Inc.(1) | 65,111 |
| 4,428,850 |
|
| Food Products — 2.0% | | |
Hain Celestial Group, Inc. (The)(1) | 13,432 |
| 1,454,014 |
|
| J&J Snack Foods Corp. | 31,407 |
| 3,235,863 |
|
TreeHouse Foods, Inc.(1) | 34,774 |
| 2,961,702 |
|
| | | 7,651,579 |
|
| Health Care Equipment and Supplies — 5.3% | | |
| Abaxis, Inc. | 18,027 |
| 949,302 |
|
| Cantel Medical Corp. | 25,148 |
| 1,066,275 |
|
Cyberonics, Inc.(1) | 19,324 |
| 1,014,510 |
|
DexCom, Inc.(1) | 43,627 |
| 1,961,034 |
|
Globus Medical, Inc.(1) | 44,110 |
| 977,919 |
|
HeartWare International, Inc.(1) | 11,317 |
| 872,767 |
|
Insulet Corp.(1) | 36,435 |
| 1,572,899 |
|
Masimo Corp.(1) | 37,299 |
| 941,427 |
|
Neogen Corp.(1) | 25,611 |
| 1,124,323 |
|
NuVasive, Inc.(1) | 26,743 |
| 1,093,789 |
|
| STERIS Corp. | 48,832 |
| 3,017,817 |
|
| Teleflex, Inc. | 20,158 |
| 2,300,431 |
|
Thoratec Corp.(1) | 36,998 |
| 1,005,605 |
|
| West Pharmaceutical Services, Inc. | 40,408 |
| 2,070,910 |
|
| | | 19,969,008 |
|
| Health Care Providers and Services — 5.7% | | |
Acadia Healthcare Co., Inc.(1) | 24,786 |
| 1,537,971 |
|
Adeptus Health, Inc., Class A(1) | 58,059 |
| 1,926,398 |
|
Air Methods Corp.(1) | 24,783 |
| 1,170,501 |
|
| Chemed Corp. | 11,387 |
| 1,176,960 |
|
ExamWorks Group, Inc.(1) | 161,756 |
| 6,272,898 |
|
| HealthSouth Corp. | 51,014 |
| 2,057,395 |
|
Molina Healthcare, Inc.(1) | 22,280 |
| 1,083,699 |
|
MWI Veterinary Supply, Inc.(1) | 8,354 |
| 1,417,298 |
|
Team Health Holdings, Inc.(1) | 74,097 |
| 4,634,026 |
|
| | | 21,277,146 |
|
| Health Care Technology — 1.4% | | |
HMS Holdings Corp.(1) | 58,919 |
| 1,368,688 |
|
MedAssets, Inc.(1) | 43,646 |
| 945,372 |
|
Medidata Solutions, Inc.(1) | 45,924 |
| 2,071,632 |
|
Omnicell, Inc.(1) | 29,038 |
| 938,218 |
|
| | | 5,323,910 |
|
|
| | | | | |
| | Shares | Value |
| Hotels, Restaurants and Leisure — 3.5% | | |
Buffalo Wild Wings, Inc.(1) | 10,788 |
| $ | 1,610,433 |
|
La Quinta Holdings, Inc.(1) | 104,958 |
| 2,142,193 |
|
| Papa John's International, Inc. | 109,761 |
| 5,132,424 |
|
| Vail Resorts, Inc. | 48,295 |
| 4,170,756 |
|
| | | 13,055,806 |
|
| Insurance — 0.4% | | |
| Allied World Assurance Co. Holdings Ltd. | 36,293 |
| 1,379,134 |
|
| Internet Software and Services — 7.3% | | |
Amber Road, Inc.(1) | 113,541 |
| 1,515,772 |
|
comScore, Inc.(1) | 77,729 |
| 3,275,500 |
|
Cornerstone OnDemand, Inc.(1) | 56,334 |
| 2,043,234 |
|
CoStar Group, Inc.(1) | 38,412 |
| 6,187,789 |
|
Cvent, Inc.(1) | 51,941 |
| 1,347,350 |
|
Envestnet, Inc.(1) | 92,223 |
| 4,096,546 |
|
Q2 Holdings, Inc.(1) | 128,749 |
| 1,942,822 |
|
Shutterstock, Inc.(1) | 88,231 |
| 6,860,843 |
|
| | | 27,269,856 |
|
| IT Services — 3.4% | | |
FleetCor Technologies, Inc.(1) | 13,275 |
| 1,998,684 |
|
| Heartland Payment Systems, Inc. | 46,894 |
| 2,422,075 |
|
Virtusa Corp.(1) | 104,185 |
| 4,269,501 |
|
WEX, Inc.(1) | 35,911 |
| 4,078,053 |
|
| | | 12,768,313 |
|
| Leisure Products — 1.4% | | |
| Brunswick Corp. | 111,276 |
| 5,207,717 |
|
| Life Sciences Tools and Services — 1.1% | | |
Charles River Laboratories International, Inc.(1) | 42,902 |
| 2,709,690 |
|
PAREXEL International Corp.(1) | 27,498 |
| 1,493,417 |
|
| | | 4,203,107 |
|
| Machinery — 3.4% | | |
| ITT Corp. | 31,150 |
| 1,403,619 |
|
Middleby Corp.(1) | 73,652 |
| 6,518,202 |
|
| Mueller Water Products, Inc., Class A | 478,380 |
| 4,721,611 |
|
| | | 12,643,432 |
|
| Media — 1.1% | | |
| Entravision Communications Corp., Class A | 357,851 |
| 1,846,511 |
|
Time, Inc.(1) | 93,247 |
| 2,106,450 |
|
| | | 3,952,961 |
|
| Metals and Mining — 0.9% | | |
Horsehead Holding Corp.(1) | 224,262 |
| 3,523,156 |
|
| Oil, Gas and Consumable Fuels — 2.7% | | |
Athlon Energy, Inc.(1) | 19,746 |
| 1,151,192 |
|
Carrizo Oil & Gas, Inc.(1) | 61,850 |
| 3,212,489 |
|
Goodrich Petroleum Corp.(1) | 111,689 |
| 920,317 |
|
Gulfport Energy Corp.(1) | 48,745 |
| 2,446,024 |
|
|
| | | | | |
| | Shares | Value |
Magnum Hunter Resources Corp.(1) | 508,129 |
| $ | 2,357,719 |
|
| | | 10,087,741 |
|
| Paper and Forest Products — 0.3% | | |
KapStone Paper and Packaging Corp.(1) | 37,221 |
| 1,144,918 |
|
| Pharmaceuticals — 2.6% | | |
Akorn, Inc.(1) | 43,315 |
| 1,929,683 |
|
AVANIR Pharmaceuticals, Inc.(1) | 110,904 |
| 1,435,098 |
|
BioDelivery Sciences International, Inc.(1) | 32,398 |
| 563,725 |
|
Lannett Co., Inc.(1) | 21,563 |
| 1,223,053 |
|
Medicines Co. (The)(1) | 42,463 |
| 1,075,163 |
|
Nektar Therapeutics(1) | 65,578 |
| 904,321 |
|
Pacira Pharmaceuticals, Inc.(1) | 20,803 |
| 1,930,935 |
|
| Theravance, Inc. | 50,397 |
| 807,360 |
|
| | | 9,869,338 |
|
| Professional Services — 1.4% | | |
Huron Consulting Group, Inc.(1) | 38,369 |
| 2,670,866 |
|
Korn/Ferry International(1) | 89,947 |
| 2,512,220 |
|
| | | 5,183,086 |
|
| Real Estate Investment Trusts (REITs) — 0.5% | | |
| Sun Communities, Inc. | 32,756 |
| 1,898,865 |
|
| Road and Rail — 2.2% | | |
Roadrunner Transportation Systems, Inc.(1) | 109,187 |
| 2,250,344 |
|
Saia, Inc.(1) | 79,817 |
| 3,912,629 |
|
Swift Transportation Co.(1) | 91,844 |
| 2,268,547 |
|
| | | 8,431,520 |
|
| Semiconductors and Semiconductor Equipment — 3.7% | | |
Cavium, Inc.(1) | 41,599 |
| 2,134,445 |
|
Formfactor, Inc.(1) | 260,787 |
| 2,078,472 |
|
M/A-COM Technology Solutions Holdings, Inc.(1) | 54,854 |
| 1,206,240 |
|
Photronics, Inc.(1) | 307,596 |
| 2,765,288 |
|
RF Micro Devices, Inc.(1) | 294,803 |
| 3,835,387 |
|
Synaptics, Inc.(1) | 28,066 |
| 1,920,556 |
|
| | | 13,940,388 |
|
| Software — 5.4% | | |
Aspen Technology, Inc.(1) | 118,578 |
| 4,379,086 |
|
ePlus, Inc.(1) | 32,316 |
| 1,973,538 |
|
FireEye, Inc.(1) | 51,580 |
| 1,753,204 |
|
Manhattan Associates, Inc.(1) | 87,720 |
| 3,518,449 |
|
| Monotype Imaging Holdings, Inc. | 98,103 |
| 2,806,727 |
|
Ultimate Software Group, Inc.(1) | 14,549 |
| 2,189,770 |
|
Verint Systems, Inc.(1) | 64,712 |
| 3,720,293 |
|
| | | 20,341,067 |
|
| Specialty Retail — 3.7% | | |
| Brown Shoe Co., Inc. | 82,956 |
| 2,205,800 |
|
Cabela's, Inc.(1) | 14,458 |
| 694,273 |
|
Kirkland's, Inc.(1) | 162,280 |
| 2,888,584 |
|
|
| | | | | |
| | Shares | Value |
| Lithia Motors, Inc., Class A | 23,642 |
| $ | 1,835,092 |
|
Restoration Hardware Holdings, Inc.(1) | 76,700 |
| 6,160,544 |
|
| | | 13,784,293 |
|
| Technology Hardware, Storage and Peripherals — 1.4% | | |
Nimble Storage, Inc.(1) | 88,867 |
| 2,431,401 |
|
Super Micro Computer, Inc.(1) | 85,574 |
| 2,734,945 |
|
| | | 5,166,346 |
|
| Textiles, Apparel and Luxury Goods — 0.9% | | |
Skechers U.S.A., Inc., Class A(1) | 61,164 |
| 3,348,729 |
|
| Trading Companies and Distributors — 1.1% | | |
| H&E Equipment Services, Inc. | 110,032 |
| 4,114,096 |
|
| Wireless Telecommunication Services — 0.6% | | |
RingCentral, Inc., Class A(1) | 161,640 |
| 2,123,950 |
|
TOTAL COMMON STOCKS (Cost $281,879,633) | | 370,744,329 |
|
| TEMPORARY CASH INVESTMENTS — 0.9% | | |
| Repurchase Agreement, Bank of America Merrill Lynch, (collateralized by various U.S. Treasury obligations, 1.375% - 2.625%, 12/31/14 - 2/28/19, valued at $799,999), in a joint trading account at 0.07%, dated 10/31/14, due 11/3/14 (Delivery value $784,437) | | 784,432 |
|
| Repurchase Agreement, Credit Suisse First Boston, Inc., (collateralized by various U.S. Treasury obligations, 0.25%, 10/15/15, valued at $320,066), in a joint trading account at 0.04%, dated 10/31/14, due 11/3/14 (Delivery value $313,774) | | 313,773 |
|
| Repurchase Agreement, Goldman Sachs & Co., (collateralized by various U.S. Treasury obligations, 0.125%, 12/31/14, valued at $640,744), in a joint trading account at 0.03%, dated 10/31/14, due 11/3/14 (Delivery value $627,548) | | 627,546 |
|
| SSgA U.S. Government Money Market Fund, Class N | 1,726,143 |
| 1,726,143 |
|
TOTAL TEMPORARY CASH INVESTMENTS (Cost $3,451,894) | | 3,451,894 |
|
TOTAL INVESTMENT SECURITIES — 99.8% (Cost $285,331,527) | | 374,196,223 |
|
| OTHER ASSETS AND LIABILITIES — 0.2% | | 930,083 |
|
| TOTAL NET ASSETS — 100.0% | | $ | 375,126,306 |
|
|
| | | | | | | | |
| FORWARD FOREIGN CURRENCY EXCHANGE CONTRACTS |
| Currency Purchased | Currency Sold | Counterparty | Settlement Date | Unrealized Appreciation
(Depreciation) |
| NOK | 180,497 | USD | 26,900 | UBS AG | 11/28/14 | $ | (162 | ) |
| NOK | 1,172,565 | USD | 173,546 | UBS AG | 11/28/14 | 154 |
|
| USD | 852,451 | NOK | 5,646,962 | UBS AG | 11/28/14 | 15,929 |
|
| USD | 37,156 | NOK | 249,257 | UBS AG | 11/28/14 | 232 |
|
| | | | | | | $ | 16,153 |
|
|
| | |
| NOTES TO SCHEDULE OF INVESTMENTS |
| NOK | - | Norwegian Krone |
| USD | - | United States Dollar |
See Notes to Financial Statements.
|
|
| Statement of Assets and Liabilities |
|
| | | |
| OCTOBER 31, 2014 | |
| Assets | |
| Investment securities, at value (cost of $285,331,527) | $ | 374,196,223 |
|
| Receivable for investments sold | 5,375,642 |
|
| Receivable for capital shares sold | 126,537 |
|
| Unrealized appreciation on forward foreign currency exchange contracts | 16,315 |
|
| Dividends and interest receivable | 15,321 |
|
| | 379,730,038 |
|
| | |
| Liabilities | |
| Payable for investments purchased | 3,190,325 |
|
| Payable for capital shares redeemed | 968,969 |
|
| Unrealized depreciation on forward foreign currency exchange contracts | 162 |
|
| Accrued management fees | 413,684 |
|
| Distribution and service fees payable | 30,592 |
|
| | 4,603,732 |
|
| | |
| Net Assets | $ | 375,126,306 |
|
| | |
| Net Assets Consist of: | |
| Capital (par value and paid-in surplus) | $ | 399,646,976 |
|
| Accumulated net investment loss | (3,554,664 | ) |
| Accumulated net realized loss | (109,846,698 | ) |
| Net unrealized appreciation | 88,880,692 |
|
| | $ | 375,126,306 |
|
|
| | | | |
| | Net Assets | Shares Outstanding | Net Asset Value Per Share |
| Investor Class, $0.01 Par Value | $170,315,914 | 13,280,199 |
| $12.82 |
| Institutional Class, $0.01 Par Value | $72,541,944 | 5,576,459 |
| $13.01 |
| A Class, $0.01 Par Value | $100,050,978 | 7,977,285 |
| $12.54* |
| B Class, $0.01 Par Value | $669,821 | 56,919 |
| $11.77 |
| C Class, $0.01 Par Value | $11,727,399 | 992,953 |
| $11.81 |
| R Class, $0.01 Par Value | $1,373,479 | 110,833 |
| $12.39 |
| R6 Class, $0.01 Par Value | $18,446,771 | 1,416,014 |
| $13.03 |
*Maximum offering price $13.31 (net asset value divided by 0.9425).
See Notes to Financial Statements.
|
| | | |
| YEAR ENDED OCTOBER 31, 2014 | |
| Investment Income (Loss) | |
| Income: | |
| Dividends (net of foreign taxes withheld of $5,285) | $ | 1,957,464 |
|
| Interest | 1,146 |
|
| | 1,958,610 |
|
| | |
| Expenses: | |
| Management fees | 5,609,971 |
|
| Distribution and service fees: | |
| A Class | 274,060 |
|
| B Class | 10,108 |
|
| C Class | 126,880 |
|
| R Class | 7,394 |
|
| Directors' fees and expenses | 2,659 |
|
| | 6,031,072 |
|
| | |
| Net investment income (loss) | (4,072,462 | ) |
| | |
| Realized and Unrealized Gain (Loss) | |
| Net realized gain (loss) on: | |
| Investment transactions | 68,820,814 |
|
| Foreign currency transactions | 160,041 |
|
| | 68,980,855 |
|
| | |
| Change in net unrealized appreciation (depreciation) on: | |
| Investments | (37,279,362 | ) |
| Translation of assets and liabilities in foreign currencies | 15,996 |
|
| | (37,263,366 | ) |
| | |
| Net realized and unrealized gain (loss) | 31,717,489 |
|
| | |
| Net Increase (Decrease) in Net Assets Resulting from Operations | $ | 27,645,027 |
|
See Notes to Financial Statements.
|
|
| Statement of Changes in Net Assets |
|
| | | | | | |
| YEARS ENDED OCTOBER 31, 2014 AND OCTOBER 31, 2013 |
| Increase (Decrease) in Net Assets | October 31, 2014 | October 31, 2013 |
| Operations | | |
| Net investment income (loss) | $ | (4,072,462 | ) | $ | (1,986,123 | ) |
| Net realized gain (loss) | 68,980,855 |
| 65,698,476 |
|
| Change in net unrealized appreciation (depreciation) | (37,263,366 | ) | 52,908,024 |
|
| Net increase (decrease) in net assets resulting from operations | 27,645,027 |
| 116,620,377 |
|
| | | |
| Distributions to Shareholders | | |
| From net investment income: | | |
| Investor Class | — |
| (290,567 | ) |
| Institutional Class | — |
| (245,683 | ) |
| A Class | — |
| (133,149 | ) |
| R Class | — |
| (1,075 | ) |
| Decrease in net assets from distributions | — |
| (670,474 | ) |
| | | |
| Capital Share Transactions | | |
| Net increase (decrease) in net assets from capital share transactions (Note 5) | (85,899,458 | ) | (35,896,888 | ) |
| | | |
| Redemption Fees | | |
| Increase in net assets from redemption fees | 32,108 |
| 33,683 |
|
| | | |
| Net increase (decrease) in net assets | (58,222,323 | ) | 80,086,698 |
|
| | | |
| Net Assets | | |
| Beginning of period | 433,348,629 |
| 353,261,931 |
|
| End of period | $ | 375,126,306 |
| $ | 433,348,629 |
|
| | | |
| Accumulated net investment loss | $ | (3,554,664 | ) | $ | (3,027,091 | ) |
See Notes to Financial Statements.
|
|
| Notes to Financial Statements |
OCTOBER 31, 2014
1. Organization
American Century Mutual Funds, Inc. (the corporation) is registered under the Investment Company Act of 1940, as amended (the 1940 Act), as an open-end management investment company and is organized as a Maryland corporation. Small Cap Growth Fund (the fund) is one fund in a series issued by the corporation. The fund is diversified as defined under the 1940 Act. The fund’s investment objective is to seek long-term capital growth.
The fund offers the Investor Class, the Institutional Class, the A Class, the B Class, the C Class, the R Class and the R6 Class. The A Class may incur an initial sales charge. The A Class, B Class and C Class may be subject to a contingent deferred sales charge. The share classes differ principally in their respective sales charges and distribution and shareholder servicing expenses and arrangements. The Institutional Class and R6 Class shareholders do not require the same level of shareholder and administrative services from American Century Investment Management, Inc. (ACIM) (the investment advisor) as shareholders of other classes. In addition, financial intermediaries do not receive any service, distribution or administrative fees for the R6 Class. As a result, the Institutional Class and R6 Class are charged lower unified management fees. Sale of the R6 Class commenced on July 26, 2013.
2. Significant Accounting Policies
The following is a summary of significant accounting policies consistently followed by the fund in preparation of its financial statements. The fund is an investment company and follows accounting and reporting guidance in accordance with accounting principles generally accepted in the United States of America. This may require management to make certain estimates and assumptions at the date of the financial statements. Actual results could differ from these estimates. Management evaluated the impact of events or transactions occurring through the date the financial statements were issued that would merit recognition or disclosure.
Investment Valuations — The fund determines the fair value of its investments and computes its net asset value per share at the close of regular trading (usually 4 p.m. Eastern time) on the New York Stock Exchange (NYSE) on each day the NYSE is open. The Board of Directors has adopted valuation policies and procedures to guide the investment advisor in the fund’s investment valuation process and to provide methodologies for the oversight of the fund’s pricing function.
Equity securities that are listed or traded on a domestic securities exchange are valued at the last reported sales price or at the official closing price as provided by the exchange. Equity securities traded on foreign securities exchanges are generally valued at the closing price of such securities on the exchange where primarily traded or at the close of the NYSE, if that is earlier. If no last sales price is reported, or if local convention or regulation so provides, the mean of the latest bid and asked prices may be used. Securities traded over-the-counter are valued at the mean of the latest bid and asked prices, the last sales price, or the official closing price. Equity securities initially expressed in local currencies are translated into U.S. dollars at the mean of the appropriate currency exchange rate at the close of the NYSE as provided by an independent pricing service.
Fixed income securities maturing within 60 days at the time of purchase may be valued at cost, plus or minus any amortized discount or premium or at the evaluated mean as provided by an independent pricing service. Evaluated mean prices are commonly derived through utilization of market models, which may consider, among other factors: trade data, quotations from dealers and active market makers, relevant yield curve and spread data, related sector levels, creditworthiness, trade data or market information on comparable securities, and other relevant security specific information.
Open-end management investment companies are valued at the reported net asset value per share. Repurchase agreements are valued at cost, which approximates fair value. Forward foreign currency exchange contracts are valued at the mean of the appropriate forward exchange rate at the close of the NYSE as provided by an independent pricing service.
If the fund determines that the market price for an investment is not readily available or the valuation methods mentioned above do not reflect an investment’s fair value, such investment is valued as determined in good faith by the Board of Directors or its delegate, in accordance with policies and procedures adopted by the Board of Directors. In its determination of fair value, the fund may review several factors including, but not limited to, market information regarding the specific investment or comparable investments and correlation with other investment types, futures indices or general market indicators. Circumstances that may cause the fund to use these procedures to value an investment include, but are not limited to: an investment has been declared in default or is distressed; trading in a security has been suspended during the trading day or a security is not actively trading on its principal exchange; prices received from a regular pricing source are deemed unreliable; or there is a foreign market holiday and no trading occurred.
The fund monitors for significant events occurring after the close of an investment’s primary exchange but before the fund’s net asset value per share is determined. Significant events may include, but are not limited to: corporate announcements and transactions; governmental action and political unrest that could impact a specific investment or an investment sector; or armed conflicts, natural disasters and similar events that could affect investments in a specific country or region. The fund also monitors for significant fluctuations between domestic and foreign markets, as evidenced by the U.S. market or such other indicators that the Board of Directors, or its delegate, deems appropriate. If significant fluctuations in foreign markets are identified, the fund may apply a model-derived factor to the closing price of equity securities traded on foreign securities exchanges. The factor is based on observable market data as provided by an independent pricing service.
Security Transactions — Security transactions are accounted for as of the trade date. Net realized gains and losses are determined on the identified cost basis, which is also used for federal income tax purposes.
Investment Income — Dividend income less foreign taxes withheld, if any, is recorded as of the ex-dividend date. Distributions received on securities that represent a return of capital or long-term capital gain are recorded as a reduction of cost of investments and/or as a realized gain. The fund may estimate the components of distributions received that may be considered nontaxable distributions or long-term capital gain distributions for income tax purposes. Interest income is recorded on the accrual basis and includes accretion of discounts and amortization of premiums.
Foreign Currency Translations — All assets and liabilities initially expressed in foreign currencies are translated into U.S. dollars at prevailing exchange rates at period end. The fund may enter into spot foreign currency exchange contracts to facilitate transactions denominated in a foreign currency. Purchases and sales of investment securities, dividend and interest income, spot foreign currency exchange contracts, and expenses are translated at the rates of exchange prevailing on the respective dates of such transactions. Net realized and unrealized foreign currency exchange gains or losses related to investment securities are a component of net realized gain (loss) on investment transactions and change in net unrealized appreciation (depreciation) on investments, respectively.
Repurchase Agreements — The fund may enter into repurchase agreements with institutions that ACIM has determined are creditworthy pursuant to criteria adopted by the Board of Directors. The fund requires that the collateral, represented by securities, received in a repurchase transaction be transferred to the custodian in a manner sufficient to enable the fund to obtain those securities in the event of a default under the repurchase agreement. ACIM monitors, on a daily basis, the securities transferred to ensure the value, including accrued interest, of the securities under each repurchase agreement is equal to or greater than amounts owed to the fund under each repurchase agreement.
Joint Trading Account — Pursuant to an Exemptive Order issued by the Securities and Exchange Commission, the fund, along with certain other funds in the American Century Investments family of funds, may transfer uninvested cash balances into a joint trading account. These balances are invested in one or more repurchase agreements that are collateralized by U.S. Treasury or Agency obligations.
Income Tax Status — It is the fund’s policy to distribute substantially all net investment income and net realized gains to shareholders and to otherwise qualify as a regulated investment company under provisions of the Internal Revenue Code. Accordingly, no provision has been made for income taxes. The fund files U.S. federal, state, local and non-U.S. tax returns as applicable. The fund's tax returns are subject to examination by the relevant taxing authority until expiration of the applicable statute of limitations, which is generally three years from the date of filing but can be longer in certain jurisdictions. At this time, management believes there are no uncertain tax positions which, based on their technical merit, would not be sustained upon examination and for which it is reasonably possible that the total amounts of unrecognized tax benefits will significantly change in the next twelve months.
Multiple Class — All shares of the fund represent an equal pro rata interest in the net assets of the class to which such shares belong, and have identical voting, dividend, liquidation and other rights and the same terms and conditions, except for class specific expenses and exclusive rights to vote on matters affecting only individual classes. Income, non-class specific expenses, and realized and unrealized capital gains and losses of the fund are allocated to each class of shares based on their relative net assets.
Distributions to Shareholders — Distributions from net investment income and net realized gains, if any, are generally declared and paid annually.
Redemption Fees — The fund may impose a 2.00% redemption fee on shares held less than 60 days. The fee may not be applicable to all classes. The redemption fee is retained by the fund and helps cover transaction costs that long-term investors may bear when the fund sells securities to meet investor redemptions.
Indemnifications — Under the corporation’s organizational documents, its officers and directors are indemnified against certain liabilities arising out of the performance of their duties to the fund. In addition, in the normal course of business, the fund enters into contracts that provide general indemnifications. The maximum exposure under these arrangements is unknown as this would involve future claims that may be made against a fund. The risk of material loss from such claims is considered by management to be remote.
3. Fees and Transactions with Related Parties
Certain officers and directors of the corporation are also officers and/or directors of American Century Companies, Inc. (ACC). The corporation’s investment advisor, ACIM, the corporation's distributor, American Century Investment Services, Inc. (ACIS), and the corporation’s transfer agent, American Century Services, LLC, are wholly owned, directly or indirectly, by ACC.
Management Fees — The corporation has entered into a management agreement with ACIM, under which ACIM provides the fund with investment advisory and management services in exchange for a single, unified management fee (the fee) per class. The agreement provides that all expenses of managing and operating the fund, except distribution and service fees, brokerage expenses, taxes, interest, fees and expenses of the independent directors (including legal counsel fees), and extraordinary expenses, will be paid by ACIM. The fee is computed and accrued daily based on each class’s daily net assets and paid monthly in arrears. The rate of the fee is determined by applying a fee rate calculation formula. This formula takes into account the fund’s assets as well as certain assets, if any, of other clients of the investment advisor outside the American Century Investments family of funds (such as subadvised funds and separate accounts) that have very similar investment teams and investment strategies (strategy assets). The annual management fee schedule ranges from 1.100% to 1.500% for the Investor Class, A Class, B Class, C Class and R Class. The annual management fee schedule ranges from 0.900% to 1.300% for the Institutional Class and 0.750% to 1.150% for the R6 Class. The effective annual management fee for each class for the year ended October 31, 2014 was 1.40% for the Investor Class, A Class, B Class, C Class and R Class, 1.20% for the Institutional Class and 1.07% for the R6 Class.
Distribution and Service Fees — The Board of Directors has adopted a separate Master Distribution and Individual Shareholder Services Plan for each of the A Class, B Class, C Class and R Class (collectively the plans), pursuant to Rule 12b-1 of the 1940 Act. The plans provide that the A Class will pay ACIS an annual distribution and service fee of 0.25%. The plans provide that the B Class and C Class will each pay ACIS an annual distribution and service fee of 1.00%, of which 0.25% is paid for individual shareholder services and 0.75% is paid for distribution services. The plans provide that the R Class will pay ACIS an annual distribution and service fee of 0.50%. The fees are computed and accrued daily based on each class’s daily net assets and paid monthly in arrears. The fees are used to pay financial intermediaries for distribution and individual shareholder services. Fees incurred under the plans during the year ended October 31, 2014 are detailed in the Statement of Operations.
Acquired Fund Fees and Expenses — The fund may invest in mutual funds, exchange-traded funds, and business development companies (the acquired funds). The fund will indirectly realize its pro rata share of the fees and expenses of the acquired funds in which it invests. These indirect fees and expenses are not paid out of the fund's assets but are reflected in the return realized by the fund on its investment in the acquired funds.
Directors' Fees and Expenses — The Board of Directors is responsible for overseeing the investment advisor’s management and operations of the fund. The directors receive detailed information about the fund and its investment advisor regularly throughout the year, and meet at least quarterly with management of the investment advisor to review reports about fund operations. Fees and expenses incurred in conjunction with the directors during the year ended October 31, 2014 are detailed in the Statement of Operations. The fund’s officers do not receive compensation from the fund.
4. Investment Transactions
Purchases and sales of investment securities, excluding short-term investments, for the year ended October 31, 2014 were $306,575,938 and $385,994,184, respectively.
5. Capital Share Transactions
Transactions in shares of the fund were as follows:
|
| | | | | | | | | | |
| | Year ended October 31, 2014 | Year ended October 31, 2013(1) |
| | Shares | Amount | Shares | Amount |
| Investor Class/Shares Authorized | 165,000,000 |
| | 165,000,000 |
| |
| Sold | 2,973,559 |
| $ | 36,997,342 |
| 4,784,271 |
| $ | 50,038,404 |
|
| Issued in reinvestment of distributions | — |
| — |
| 24,882 |
| 222,449 |
|
| Redeemed | (6,364,796 | ) | (78,560,612 | ) | (4,525,780 | ) | (45,610,715 | ) |
| | (3,391,237 | ) | (41,563,270 | ) | 283,373 |
| 4,650,138 |
|
| Institutional Class/Shares Authorized | 150,000,000 |
| | 150,000,000 |
| |
| Sold | 498,126 |
| 6,292,729 |
| 945,452 |
| 9,862,852 |
|
| Issued in reinvestment of distributions | — |
| — |
| 15,913 |
| 143,690 |
|
| Redeemed | (3,476,777 | ) | (43,573,925 | ) | (3,224,317 | ) | (32,242,668 | ) |
| | (2,978,651 | ) | (37,281,196 | ) | (2,262,952 | ) | (22,236,126 | ) |
| A Class/Shares Authorized | 110,000,000 |
| | 110,000,000 |
| |
| Sold | 794,104 |
| 9,618,573 |
| 1,361,853 |
| 13,876,067 |
|
| Issued in reinvestment of distributions | — |
| — |
| 14,402 |
| 126,446 |
|
| Redeemed | (2,550,555 | ) | (30,759,719 | ) | (3,073,091 | ) | (29,790,771 | ) |
| | (1,756,451 | ) | (21,141,146 | ) | (1,696,836 | ) | (15,788,258 | ) |
| B Class/Shares Authorized | 20,000,000 |
| | 20,000,000 |
| |
| Sold | 8,571 |
| 97,098 |
| 2,039 |
| 21,056 |
|
| Redeemed | (63,019 | ) | (720,580 | ) | (88,360 | ) | (803,639 | ) |
| | (54,448 | ) | (623,482 | ) | (86,321 | ) | (782,583 | ) |
| C Class/Shares Authorized | 20,000,000 |
| | 20,000,000 |
| |
| Sold | 189,767 |
| 2,181,272 |
| 162,263 |
| 1,591,310 |
|
| Redeemed | (381,341 | ) | (4,360,695 | ) | (348,060 | ) | (3,296,362 | ) |
| | (191,574 | ) | (2,179,423 | ) | (185,797 | ) | (1,705,052 | ) |
| R Class/Shares Authorized | 20,000,000 |
| | 20,000,000 |
| |
| Sold | 29,376 |
| 350,874 |
| 43,615 |
| 447,754 |
|
| Issued in reinvestment of distributions | — |
| — |
| 123 |
| 1,075 |
|
| Redeemed | (92,712 | ) | (1,120,090 | ) | (52,854 | ) | (508,836 | ) |
| | (63,336 | ) | (769,216 | ) | (9,116 | ) | (60,007 | ) |
| R6 Class/Shares Authorized | 50,000,000 |
| | 50,000,000 |
| |
| Sold | 1,440,038 |
| 17,986,045 |
| 2,207 |
| 25,000 |
|
| Redeemed | (26,231 | ) | (327,770 | ) | — |
| — |
|
| | 1,413,807 |
| 17,658,275 |
| 2,207 |
| 25,000 |
|
| Net increase (decrease) | (7,021,890 | ) | $ | (85,899,458 | ) | (3,955,442 | ) | $ | (35,896,888 | ) |
| |
| (1) | July 26, 2013 (commencement of sale) through October 31, 2013 for the R6 Class. |
6. Fair Value Measurements
The fund’s investments valuation process is based on several considerations and may use multiple inputs to determine the fair value of the investments held by the fund. In conformity with accounting principles generally accepted in the United States of America, the inputs used to determine a valuation are classified into three broad levels.
| |
| • | Level 1 valuation inputs consist of unadjusted quoted prices in an active market for identical investments. |
| |
| • | Level 2 valuation inputs consist of direct or indirect observable market data (including quoted prices for comparable investments, evaluations of subsequent market events, interest rates, prepayment speeds, credit risk, etc.). These inputs also consist of quoted prices for identical investments initially expressed in local currencies that are adjusted through translation into U.S. dollars. |
| |
| • | Level 3 valuation inputs consist of unobservable data (including a fund’s own assumptions). |
The level classification is based on the lowest level input that is significant to the fair valuation measurement. The valuation inputs are not necessarily an indication of the risks associated with investing in these securities or other financial instruments. There were no significant transfers between levels during the period.
The following is a summary of the level classifications as of period end. The Schedule of Investments provides additional information on the fund’s portfolio holdings.
|
| | | | | | | | |
| | Level 1 | Level 2 | Level 3 |
| Assets | | | |
| Investment Securities | | | |
| Common Stocks | $ | 369,998,615 |
| $ | 745,714 |
| — |
|
| Temporary Cash Investments | 1,726,143 |
| 1,725,751 |
| — |
|
| | $ | 371,724,758 |
| $ | 2,471,465 |
| — |
|
| Other Financial Instruments | | | |
| Forward Foreign Currency Exchange Contracts | — |
| $ | 16,315 |
| — |
|
| | | | |
| Liabilities | | | |
| Other Financial Instruments | | | |
| Forward Foreign Currency Exchange Contracts | — |
| $ | (162 | ) | — |
|
7. Derivative Instruments
Foreign Currency Risk — The fund is subject to foreign currency exchange rate risk in the normal course of pursuing its investment objectives. The value of foreign investments held by a fund may be significantly affected by changes in foreign currency exchange rates. The dollar value of a foreign security generally decreases when the value of the dollar rises against the foreign currency in which the security is denominated and tends to increase when the value of the dollar declines against such foreign currency. A fund may enter into forward foreign currency exchange contracts to reduce a fund's exposure to foreign currency exchange rate fluctuations. The net U.S. dollar value of foreign currency underlying all contractual commitments held by a fund and the resulting unrealized appreciation or depreciation are determined daily. Realized gain or loss is recorded upon the termination of the contract. Net realized and unrealized gains or losses occurring during the holding period of forward foreign currency exchange contracts are a component of net realized gain (loss) on foreign currency transactions and change in net unrealized appreciation (depreciation) on translation of assets and liabilities in foreign currencies, respectively. A fund bears the risk of an unfavorable change in the foreign currency exchange rate underlying the forward contract. Additionally, losses, up to the fair value, may arise if the counterparties do not perform under the contract terms. The fund's average U.S. dollar exposure to foreign currency risk derivative instruments held during the period was $1,923,893.
The value of foreign currency risk derivative instruments as of October 31, 2014, is disclosed on the Statement of Assets and Liabilities as an asset of $16,315 in unrealized appreciation on forward foreign currency exchange contracts and a liability of $162 in unrealized depreciation on forward foreign currency exchange contracts. For the year ended October 31, 2014, the effect of foreign currency risk derivative instruments on the Statement of Operations was $161,135 in net realized gain (loss) on foreign currency transactions and $16,153 in change in net unrealized appreciation (depreciation) on translation of assets and liabilities in foreign currencies.
8. Risk Factors
The fund invests in common stocks of small companies. Because of this, the fund may be subject to greater risk and market fluctuations than a fund investing in larger, more established companies.
9. Federal Tax Information
The tax character of distributions paid during the years ended October 31, 2014 and October 31, 2013 were as follows:
|
| | | | | |
| | 2014 | 2013 |
| Distributions Paid From | | |
| Ordinary income | — |
| $ | 670,474 |
|
| Long-term capital gains | — |
| — |
|
The book-basis character of distributions made during the year from net investment income or net realized gains may differ from their ultimate characterization for federal income tax purposes. These differences reflect the differing character of certain income items and net realized gains and losses for financial statement and tax purposes, and may result in reclassification among certain capital accounts on the financial statements.
As of October 31, 2014, the federal tax cost of investments and the components of distributable earnings on a tax-basis were as follows: |
| | | |
| Federal tax cost of investments | $ | 286,426,827 |
|
| Gross tax appreciation of investments | $ | 96,099,453 |
|
| Gross tax depreciation of investments | (8,330,057 | ) |
| Net tax appreciation (depreciation) of investments | 87,769,396 |
|
Net tax appreciation (depreciation) on derivatives and translation of assets and liabilities in foreign currencies
| (157 | ) |
Net tax appreciation (depreciation)
| $ | 87,769,239 |
|
| Undistributed ordinary income | — |
|
Accumulated short-term capital losses
| $ | (108,751,398 | ) |
Late-year ordinary loss deferral
| $ | (3,538,511 | ) |
The difference between book-basis and tax-basis unrealized appreciation (depreciation) is attributable primarily to the tax deferral of losses on wash sales.
Accumulated capital losses represent net capital loss carryovers that may be used to offset future realized capital gains for federal income tax purposes. Future capital loss carryover utilization in any given year may be subject to Internal Revenue Code limitations. Capital loss carryovers expire in 2017.
Loss deferrals represent certain qualified losses that the fund has elected to treat as having been incurred in the following fiscal year for federal income tax purposes.
|
| | | | | | | | | | | | | |
| For a Share Outstanding Throughout the Years Ended October 31 (except as noted) | | | |
| Per-Share Data | | | | | | | Ratios and Supplemental Data |
| | | Income From Investment Operations: | | | | Ratio to Average Net Assets of: | | |
| | Net Asset
Value,
Beginning
of Period | Net
Investment
Income
(Loss)(1) | Net
Realized
and
Unrealized
Gain (Loss) | Total From
Investment
Operations | Distributions From Net
Investment
Income | Net Asset
Value,
End
of Period | Total
Return(2) | Operating
Expenses | Net
Investment
Income
(Loss) | Portfolio
Turnover
Rate | Net
Assets,
End of
Period
(in thousands) |
| Investor Class | | | | | | | | | | |
| 2014 | $11.95 | (0.11) | 0.98 | 0.87 | — | $12.82 | 7.28% | 1.40% | (0.93)% | 75% |
| $170,316 |
|
| 2013 | $8.79 | (0.05) | 3.23 | 3.18 | (0.02) | $11.95 | 36.23% | 1.42% | (0.47)% | 80% |
| $199,294 |
|
| 2012 | $8.06 | (0.01) | 0.74 | 0.73 | — | $8.79 | 9.06% | 1.42% | (0.12)% | 62% |
| $144,021 |
|
| 2011 | $7.45 | (0.07) | 0.68 | 0.61 | — | $8.06 | 8.19% | 1.40% | (0.84)% | 108% |
| $166,243 |
|
| 2010 | $5.47 | (0.03) | 2.01 | 1.98 | — | $7.45 | 36.20% | 1.42% | (0.48)% | 183% |
| $142,793 |
|
| Institutional Class | | | | | | | | | | |
| 2014 | $12.10 | (0.09) | 1.00 | 0.91 | — | $13.01 | 7.52% | 1.20% | (0.73)% | 75% |
| $72,542 |
|
| 2013 | $8.88 | (0.02) | 3.26 | 3.24 | (0.02) | $12.10 | 36.61% | 1.22% | (0.27)% | 80% |
| $103,520 |
|
| 2012 | $8.13 | 0.01 | 0.74 | 0.75 | — | $8.88 | 9.23% | 1.22% | 0.08% | 62% |
| $96,092 |
|
| 2011 | $7.50 | (0.05) | 0.68 | 0.63 | — | $8.13 | 8.40% | 1.20% | (0.64)% | 108% |
| $105,520 |
|
| 2010 | $5.49 | (0.02) | 2.03 | 2.01 | — | $7.50 | 36.61% | 1.22% | (0.28)% | 183% |
| $114,513 |
|
|
| | | | | | | | | | | | | |
| For a Share Outstanding Throughout the Years Ended October 31 (except as noted) | | | |
| Per-Share Data | | | | | | | Ratios and Supplemental Data |
| | | Income From Investment Operations: | | | | Ratio to Average Net Assets of: | | |
| | Net Asset
Value,
Beginning
of Period | Net
Investment
Income
(Loss)(1) | Net
Realized
and
Unrealized
Gain (Loss) | Total From
Investment
Operations | Distributions From Net
Investment
Income | Net Asset
Value,
End
of Period | Total
Return(2) | Operating
Expenses | Net
Investment
Income
(Loss) | Portfolio
Turnover
Rate | Net
Assets,
End of
Period
(in thousands) |
| A Class | | | | | | | | | | |
| 2014 | $11.72 | (0.14) | 0.96 | 0.82 | — | $12.54 | 7.00% | 1.65% | (1.18)% | 75% |
| $100,051 |
|
| 2013 | $8.63 | (0.07) | 3.17 | 3.10 | (0.01) | $11.72 | 36.00% | 1.67% | (0.72)% | 80% |
| $114,080 |
|
| 2012 | $7.94 | (0.03) | 0.72 | 0.69 | — | $8.63 | 8.69% | 1.67% | (0.37)% | 62% |
| $98,665 |
|
| 2011 | $7.35 | (0.09) | 0.68 | 0.59 | — | $7.94 | 8.03% | 1.65% | (1.09)% | 108% |
| $115,741 |
|
| 2010 | $5.41 | (0.05) | 1.99 | 1.94 | — | $7.35 | 35.86% | 1.67% | (0.73)% | 183% |
| $126,763 |
|
| B Class | | | | | | | | | | |
| 2014 | $11.08 | (0.22) | 0.91 | 0.69 | — | $11.77 | 6.23% | 2.40% | (1.93)% | 75% |
| $670 |
|
| 2013 | $8.21 | (0.13) | 3.00 | 2.87 | — | $11.08 | 34.96% | 2.42% | (1.47)% | 80% |
| $1,234 |
|
| 2012 | $7.60 | (0.09) | 0.70 | 0.61 | — | $8.21 | 8.03% | 2.42% | (1.12)% | 62% |
| $1,623 |
|
| 2011 | $7.10 | (0.15) | 0.65 | 0.50 | — | $7.60 | 7.04% | 2.40% | (1.84)% | 108% |
| $2,197 |
|
| 2010 | $5.26 | (0.09) | 1.93 | 1.84 | — | $7.10 | 34.98% | 2.42% | (1.48)% | 183% |
| $3,107 |
|
| C Class | | | | | | | | | | |
| 2014 | $11.12 | (0.22) | 0.91 | 0.69 | — | $11.81 | 6.21% | 2.40% | (1.93)% | 75% |
| $11,727 |
|
| 2013 | $8.24 | (0.14) | 3.02 | 2.88 | — | $11.12 | 34.95% | 2.42% | (1.47)% | 80% |
| $13,171 |
|
| 2012 | $7.63 | (0.09) | 0.70 | 0.61 | — | $8.24 | 7.99% | 2.42% | (1.12)% | 62% |
| $11,291 |
|
| 2011 | $7.13 | (0.15) | 0.65 | 0.50 | — | $7.63 | 7.01% | 2.40% | (1.84)% | 108% |
| $12,691 |
|
| 2010 | $5.28 | (0.09) | 1.94 | 1.85 | — | $7.13 | 35.04% | 2.42% | (1.48)% | 183% |
| $13,476 |
|
|
| | | | | | | | | | | | | |
| For a Share Outstanding Throughout the Years Ended October 31 (except as noted) | | | |
| Per-Share Data | | | | | | | Ratios and Supplemental Data |
| | | Income From Investment Operations: | | | | Ratio to Average Net Assets of: | | |
| | Net Asset
Value,
Beginning
of Period | Net
Investment
Income
(Loss)(1) | Net
Realized
and
Unrealized
Gain (Loss) | Total From
Investment
Operations | Distributions From Net
Investment
Income | Net Asset
Value,
End
of Period | Total
Return(2) | Operating
Expenses | Net
Investment
Income
(Loss) | Portfolio
Turnover
Rate | Net
Assets,
End of
Period
(in thousands) |
| R Class | | | | | | | | | | |
| 2014 | $11.61 | (0.17) | 0.95 | 0.78 | — | $12.39 | 6.72% | 1.90% | (1.43)% | 75% |
| $1,373 |
|
| 2013 | $8.56 | (0.10) | 3.16 | 3.06 | (0.01) | $11.61 | 35.73% | 1.92% | (0.97)% | 80% |
| $2,022 |
|
| 2012 | $7.89 | (0.04) | 0.71 | 0.67 | — | $8.56 | 8.49% | 1.92% | (0.62)% | 62% |
| $1,570 |
|
| 2011 | $7.33 | (0.11) | 0.67 | 0.56 | — | $7.89 | 7.64% | 1.90% | (1.34)% | 108% |
| $1,266 |
|
| 2010 | $5.41 | (0.06) | 1.98 | 1.92 | — | $7.33 | 35.49% | 1.92% | (0.98)% | 183% |
| $998 |
|
| R6 Class | | | | | | | | | | |
| 2014 | $12.10 | (0.08) | 1.01 | 0.93 | — | $13.03 | 7.69% | 1.07% | (0.60)% | 75% |
| $18,447 |
|
2013(3) | $11.33 | (0.02) | 0.79 | 0.77 | — | $12.10 | 6.80% | 1.05%(4) | (0.55)%(4) | 80%(5) |
| $27 |
|
|
| | | | |
| Notes to Financial Highlights | | |
| |
| (1) | Computed using average shares outstanding throughout the period. |
| |
| (2) | Total returns are calculated based on the net asset value of the last business day and do not reflect applicable sales charges, if any. Total returns for periods less than one year are not annualized. |
| |
| (3) | July 26, 2013 (commencement of sale) through October 31, 2013. |
| |
| (5) | Portfolio turnover is calculated at the fund level. Percentage indicated was calculated for the year ended October 31, 2013. |
See Notes to Financial Statements.
|
|
| Report of Independent Registered Public Accounting Firm |
To the Board of Directors and Shareholders of
American Century Mutual Funds, Inc.:
We have audited the accompanying statement of assets and liabilities, including the schedule of investments, of Small Cap Growth Fund (the “Fund”), one of the funds constituting American Century Mutual Funds, Inc., as of October 31, 2014, and the related statement of operations for the year then ended, the statements of changes in net assets for each of the two years in the period then ended, and the financial highlights for each of the periods presented. These financial statements and financial highlights are the responsibility of the Fund's management. Our responsibility is to express an opinion on these financial statements and financial highlights based on our audits.
We conducted our audits in accordance with the standards of the Public Company Accounting Oversight Board (United States). Those standards require that we plan and perform the audit to obtain reasonable assurance about whether the financial statements and financial highlights are free of material misstatement. The Fund is not required to have, nor were we engaged to perform, an audit of its internal control over financial reporting. Our audits included consideration of internal control over financial reporting as a basis for designing audit procedures that are appropriate in the circumstances, but not for the purpose of expressing an opinion on the effectiveness of the Fund's internal control over financial reporting. Accordingly, we express no such opinion. An audit also includes examining, on a test basis, evidence supporting the amounts and disclosures in the financial statements, assessing the accounting principles used and significant estimates made by management, as well as evaluating the overall financial statement presentation. Our procedures included confirmation of securities owned as of October 31, 2014, by correspondence with the custodian and brokers; where replies were not received from brokers, we performed other auditing procedures. We believe that our audits provide a reasonable basis for our opinion.
In our opinion, the financial statements and financial highlights referred to above present fairly, in all material respects, the financial position of Small Cap Growth Fund of American Century Mutual Funds, Inc. as of October 31, 2014, the results of its operations for the year then ended, the changes in its net assets for each of the two years in the period then ended, and the financial highlights for each of the periods presented, in conformity with accounting principles generally accepted in the United States of America.
DELOITTE & TOUCHE LLP
Kansas City, Missouri
December 17, 2014
The Board of Directors
The individuals listed below serve as directors of the funds. Each director will continue to serve in this capacity until death, retirement, resignation or removal from office. The board has adopted a mandatory retirement age for directors who are not “interested persons,” as that term is defined in the Investment Company Act (independent directors). Independent directors shall retire by December 31 of the year in which they reach their 75th birthday.
Mr. Thomas is an “interested person” because he currently serves as President and Chief Executive Officer of American Century Companies, Inc. (ACC), the parent company of American Century Investment Management, Inc. (ACIM or the advisor). Mr. Fink is treated as an “interested person” because of his recent employment with ACC and American Century Services, LLC (ACS). The other directors (more than three-fourths of the total number) are independent. They are not employees, directors or officers of, and have no financial interest in, ACC or any of its wholly owned, direct or indirect, subsidiaries, including ACIM, American Century Investment Services, Inc. (ACIS) and ACS, and they do not have any other affiliations, positions, or relationships that would cause them to be considered “interested persons” under the Investment Company Act. The directors serve in this capacity for seven (in the case of Mr. Thomas, 15) registered investment companies in the American Century Investments family of funds.
The following table presents additional information about the directors. The mailing address for each director is 4500 Main Street, Kansas City, Missouri 64111.
|
| | | | | |
Name
(Year of Birth) | Position(s) Held with Funds | Length of Time Served | Principal Occupation(s) During Past 5 Years | Number of American Century Portfolios Overseen by Director | Other Directorships Held During Past
5 Years |
| Independent Directors | | | | |
Thomas A. Brown
(1940) | Director | Since 1980 | Managing Member, Associated Investments, LLC (real estate investment company); Brown Cascade Properties, LLC (real estate investment company) (2001 to 2009) | 73 | None |
Andrea C. Hall
(1945) | Director | Since 1997 | Retired | 73 | None |
Jan M. Lewis
(1957) | Director | Since 2011 | Retired; President and Chief Executive Officer, Catholic Charities of Northeast Kansas (human services organization) (2006 to 2013) | 73 | None |
James A. Olson
(1942) | Director and Chairman of the Board | Since 2007 (Chairman since 2014) | Member, Plaza Belmont LLC (private equity fund manager) | 73 | Saia, Inc. (2002 to 2012) and EPR Properties (2003 to 2013) |
|
| | | | | |
Name
(Year of Birth) | Position(s) Held with Funds | Length of Time Served | Principal Occupation(s) During Past 5 Years | Number of American Century Portfolios Overseen by Director | Other Directorships Held During Past
5 Years |
| Independent Directors | | | | |
M. Jeannine Strandjord
(1945) | Director | Since 1994 | Retired | 73 | Euronet Worldwide Inc.; Charming Shoppes, Inc. (2006 to 2010); and DST Systems Inc. (1996 to 2012) |
John R. Whitten
(1946) | Director | Since 2008 | Retired | 73 | Rudolph Technologies, Inc. |
Stephen E. Yates
(1948) | Director | Since 2012 | Retired; Executive Vice President, Technology & Operations, KeyCorp. (computer services) (2004 to 2010) | 73 | Applied Industrial Technologies, Inc. (2001 to 2010) |
| Interested Directors | | | | |
Barry Fink
(1955) | Director | Since 2012 | Retired; Executive Vice President, ACC (September 2007 to February 2013); President, ACS (October 2007 to February 2013); Chief Operating Officer, ACC (September 2007 to November 2012) | 73 | None |
Jonathan S. Thomas
(1963) | Director and President | Since 2007 | President and Chief Executive Officer, ACC (March 2007 to present). Also serves as Chief Executive Officer, ACS; Executive Vice President, ACIM; Director, ACC, ACIM and other ACC subsidiaries | 118 | BioMed Valley Discoveries, Inc. |
The Statement of Additional Information has additional information about the fund's directors and is available without charge, upon request, by calling 1-800-345-2021.
Officers
The following table presents certain information about the executive officers of the funds. Each officer serves as an officer for each of the 15 investment companies in the American Century family of funds, unless otherwise noted. No officer is compensated for his or her service as an officer of the funds. The listed officers are interested persons of the funds and are appointed or re-appointed on an annual basis. The mailing address for each officer listed below is 4500 Main Street, Kansas City, Missouri 64111.
|
| | |
Name (Year of Birth) | Offices with the Funds | Principal Occupation(s) During the Past Five Years |
Jonathan S.
Thomas
(1963) | Director and
President
since 2007 | President and Chief Executive Officer, ACC (March 2007 to present). Also serves as Chief Executive Officer, ACS; Executive Vice President, ACIM; Director, ACC, ACIM and other ACC subsidiaries |
Amy D. Shelton
(1964) | Chief Compliance
Officer since 2014 | Chief Compliance Officer, American Century funds, (March 2014 to present); Chief Compliance Officer, ACIM (February 2014 to present); Chief Compliance Officer, ACIS (October 2009 to present); Vice President, Client Interactions and Marketing, ACIS (February 2013 to January 2014); Director, Client Interactions and Marketing, ACIS (June 2007 to January 2013). Also serves as Vice President, ACIS |
Charles A.
Etherington
(1957) | General Counsel
since 2007 and
Senior Vice
President since 2006 | Attorney, ACC (February 1994 to present); Vice President, ACC (November 2005 to present); General Counsel, ACC (March 2007 to present). Also serves as General Counsel, ACIM, ACS, ACIS and other ACC subsidiaries; and Senior Vice President, ACIM and ACS |
C. Jean Wade
(1964) | Vice President,
Treasurer and
Chief Financial
Officer since 2012 | Vice President, ACS (February 2000 to present) |
Robert J.
Leach
(1966) | Vice President
since 2006 and
Assistant Treasurer
since 2012 | Vice President, ACS (February 2000 to present) |
David H.
Reinmiller
(1963) | Vice President
since 2000 | Attorney, ACC (January 1994 to present); Associate General Counsel, ACC (January 2001 to present). Also serves as Vice President, ACIM and ACS |
Ward D.
Stauffer
(1960) | Secretary
since 2005 | Attorney, ACC (June 2003 to present) |
|
|
| Approval of Management Agreement |
At a meeting held on June 18, 2014, the Fund’s Board of Directors unanimously approved the renewal of the management agreement pursuant to which American Century Investment Management, Inc. (the “Advisor”) acts as the investment advisor for the Fund. Under Section 15(c) of the Investment Company Act, contracts for investment advisory services are required to be reviewed, evaluated, and approved by a majority of a fund’s directors (the “Directors”), including a majority of the independent Directors, each year.
Prior to its consideration of the renewal of the management agreement, the Board requested and reviewed extensive data and information compiled by the Advisor and certain independent providers of evaluation data concerning the Fund and the services provided to the Fund by the Advisor. This review was in addition to the oversight and evaluation undertaken by the Board and its committees on a continuous basis and the information received was supplemental to the extensive information that the Board and its committees receive and consider throughout the year.
In connection with its consideration of the renewal of the management agreement, the Board’s review and evaluation of the services provided by the Advisor included, but was not limited to, the following:
| |
| • | the nature, extent, and quality of investment management, shareholder services, and other services provided by the Advisor to the Fund; |
| |
| • | the wide range of other programs and services the Advisor provides to the Fund and its shareholders on a routine and non-routine basis; |
| |
| • | the Fund’s investment performance compared to appropriate benchmarks and/or a peer group of other mutual funds with similar investment objectives and strategies; |
| |
| • | the cost of owning the Fund compared to the cost of owning similar funds; |
| |
| • | the Advisor’s compliance policies, procedures, and regulatory experience; |
| |
| • | financial data showing the cost of services provided to the Fund, the profitability of the Fund to the Advisor, and the overall profitability of the Advisor; |
| |
| • | possible economies of scale associated with the Advisor’s management of the Fund and other accounts under its management; |
| |
| • | the services provided and charges to other investment management clients of the Advisor; |
| |
| • | acquired fund fees and expenses; and |
| |
| • | any collateral benefits derived by the Advisor from the management of the Fund. |
In keeping with its practice, the Board held two in-person meetings and one telephonic meeting to review and discuss the information provided. The independent Directors also had the benefit of the advice of their independent counsel throughout the process.
Factors Considered
The Directors considered all of the information provided by the Advisor, the independent data providers, and independent counsel, and evaluated such information for the Fund. In connection with their review, the Directors did not identify any single factor as being all-important or controlling, and each Director may have attributed different levels of importance to different factors. In deciding to renew the management agreement, the Board based its decision on a number of factors, including the following:
Nature, Extent and Quality of Services — Generally. Under the management agreement, the Advisor is responsible for providing or arranging for all services necessary for the operation of the Fund. The Board noted that under the management agreement, the Advisor provides or arranges at its own expense a wide variety of services including:
| |
| • | constructing and designing the Fund |
| |
| • | portfolio research and security selection |
| |
| • | initial capitalization/funding |
| |
| • | daily valuation of the Fund’s portfolio |
| |
| • | shareholder servicing and transfer agency, including shareholder confirmations, recordkeeping, and communications |
| |
| • | legal services (except the independent Directors’ counsel) |
| |
| • | regulatory and portfolio compliance |
| |
| • | marketing and distribution (except Rule 12b-1 plans) |
The Board noted that many of these services have expanded over time both in terms of quantity and complexity in response to shareholder demands, competition in the industry, changing distribution channels, and the changing regulatory environment.
Investment Management Services. The nature of the investment management services provided to the Fund is quite complex and allows Fund shareholders access to professional money management, instant diversification of their investments within an asset class, the opportunity to easily diversify among asset classes by investing in or exchanging among various American Century Investments funds, and liquidity. In evaluating investment performance, the Board expects the Advisor to manage the Fund in accordance with its investment objectives and approved strategies. Further, the Directors recognize that the Advisor has an obligation to monitor trading activities, and in particular to seek the best execution of fund trades, and to evaluate the use of and payment for research. In providing these services, the Advisor utilizes teams of investment professionals (portfolio managers, analysts, research assistants, and securities traders) who require extensive information technology, research, training, compliance and other systems to conduct their business. The Board, directly and through its Fund Performance Review Committee, regularly reviews investment performance information for the Fund, together with comparative information for appropriate benchmarks and/or peer groups of similarly-managed funds, over different time horizons. The Directors also review detailed performance information during the management agreement approval process. If performance concerns are identified, the Fund receives special reviews until performance improves, during which the Board discusses with the Advisor the reasons for such results (e.g., market conditions, security selection) and any efforts being undertaken to improve performance. The Fund’s performance was above its benchmark for the three- and ten-year periods and below its benchmark for the one- and five-year periods reviewed by the Board. The Board discussed the Fund’s performance with the Advisor and was satisfied with the efforts being undertaken by the Advisor. The Board found the investment management services provided by the Advisor to the Fund to be satisfactory and consistent with the management agreement.
Shareholder and Other Services. Under the management agreement, the Advisor provides the Fund with a comprehensive package of transfer agency, shareholder, and other services. The Board, directly and through various committees of the Board, regularly reviews reports and evaluations of such services at its regular meetings. These reports include, but are not limited to, information regarding the operational efficiency and accuracy of the shareholder and transfer agency services provided, staffing levels, shareholder satisfaction (as measured by external as well as internal sources), technology support, new products and services offered to Fund shareholders, securities trading activities, portfolio valuation services, auditing services, and legal and operational compliance activities. Certain aspects of shareholder and transfer agency service level efficiency
and the quality of securities trading activities are measured by independent third party providers and are presented in comparison to other fund groups not managed by the Advisor. The Board found the services provided by the Advisor to the Fund under the management agreement to be competitive and of high quality.
Costs of Services and Profitability. The Advisor provides detailed information concerning its cost of providing various services to the Fund, its profitability in managing the Fund (pre- and post-distribution), its overall profitability, and its financial condition. The Directors have reviewed with the Advisor the methodology used to prepare this financial information. The financial information regarding the Advisor is considered in evaluating the Advisor’s financial condition, its ability to continue to provide services under the management agreement, and the reasonableness of the current management fee. The Board concluded that the Advisor’s profits were reasonable in light of the services provided to the Fund.
Ethics. The Board generally considers the Advisor’s commitment to providing quality services to shareholders and to conducting its business ethically. They noted that the Advisor’s practices generally meet or exceed industry best practices.
Economies of Scale. The Board also reviewed information provided by the Advisor regarding the possible existence of economies of scale in connection with the management of the Fund. The Board concluded that economies of scale are difficult to measure and predict with precision, especially on a fund-by-fund basis. The Board concluded that the Advisor is appropriately sharing economies of scale through its competitive fee structure, offering competitive fees from fund inception, and through reinvestment in its business to provide shareholders additional content and services.
Comparison to Other Funds’ Fees. The management agreement provides that the Fund pays the Advisor a single, all-inclusive (or unified) management fee for providing all services necessary for the management and operation of the Fund, other than brokerage expenses, taxes, interest, extraordinary expenses, and the fees and expenses of the Fund’s independent directors (including their independent legal counsel) and expenses incurred in connection with the provision of shareholder services and distribution services under a plan adopted pursuant to Rule 12b-1 under the 1940 Act. Under the unified fee structure, the Advisor is responsible for providing all investment advisory, custody, audit, administrative, compliance, recordkeeping, marketing and shareholder services, or arranging and supervising third parties to provide such services. By contrast, most other funds are charged a variety of fees, including an investment advisory fee, a transfer agency fee, an administrative fee, distribution charges and other expenses. Other than their investment advisory fees and any applicable Rule 12b-1 distribution fees, all other components of the total fees charged by these other funds may be increased without shareholder approval. The Board believes the unified fee structure is a benefit to Fund shareholders because it clearly discloses to shareholders the cost of owning Fund shares, and, since the unified fee cannot be increased without a vote of Fund shareholders, it shifts to the Advisor the risk of increased costs of operating the Fund and provides a direct incentive to minimize administrative inefficiencies. Part of the Board’s analysis of fee levels involves reviewing certain evaluative data compiled by an independent provider comparing the Fund’s unified fee to the total expense ratios of its peers. The unified fee charged to shareholders of the Fund was above the median of the total expense ratios of the Fund’s peer expense universe and was within the range of its peer expense group. The Board concluded that the management fee paid by the Fund to the Advisor under the management agreement is reasonable in light of the services provided to the Fund.
Comparison to Fees and Services Provided to Other Clients of the Advisor. The Board also requested and received information from the Advisor concerning the nature of the services, fees, costs and profitability of its advisory services to advisory clients other than the Fund. They observed that these varying types of client accounts require different services and involve different regulatory and entrepreneurial risks than the management of the Fund. The Board analyzed this information and concluded that the fees charged and services provided to the Fund were reasonable by comparison.
Collateral or “Fall-Out” Benefits Derived by the Advisor. The Board considered the existence of collateral benefits the Advisor may receive as a result of its relationship with the Fund. They concluded that the Advisor’s primary business is managing mutual funds and it generally does not use fund or shareholder information to generate profits in other lines of business, and therefore does not derive any significant collateral benefits from them. The Board noted that the Advisor receives proprietary research from broker-dealers that execute fund portfolio transactions and concluded that this research is likely to benefit Fund shareholders. The Board also determined that the Advisor is able to provide investment management services to certain clients other than the Fund, at least in part, due to its existing infrastructure built to serve the fund complex. The Board concluded, however, that the assets of those other clients are not material to the analysis and, where applicable, may be included with the assets of the Fund to determine breakpoints in the management fee schedule.
Existing Relationship. The Board also considered whether there was any reason for not continuing the existing arrangement with the Advisor. In this regard, the Board was mindful of the potential disruptions of the Fund’s operations and various risks, uncertainties, and other effects that could occur as a result of a decision not to continue such relationship. In particular, the Board recognized that most shareholders have invested in the Fund on the strength of the Advisor’s industry standing and reputation and in the expectation that the Advisor will have a continuing role in providing advisory services to the Fund.
Conclusion of the Directors. As a result of this process, the Board, including all of the independent Directors, taking into account all of the factors discussed above and the information provided by the Advisor and others, concluded that the management agreement between the Fund and the Advisor is fair and reasonable in light of the services provided and should be renewed.
Retirement Account Information
As required by law, distributions you receive from certain IRAs are subject to federal income tax withholding, unless you elect not to have withholding apply. Tax will be withheld on the total amount withdrawn even though you may be receiving amounts that are not subject to withholding, such as nondeductible contributions. In such case, excess amounts of withholding could occur. You may adjust your withholding election so that a greater or lesser amount will be withheld.
If you don’t want us to withhold on this amount, you must notify us to not withhold the federal income tax. You may notify us in writing or in certain situations by telephone or through other electronic means. For systematic withdrawals, your withholding election will remain in effect until revoked or changed by filing a new election. You have the right to revoke your election at any time.
Remember, even if you elect not to have income tax withheld, you are liable for paying income tax on the taxable portion of your withdrawal. If you elect not to have income tax withheld or you don’t have enough income tax withheld, you may be responsible for payment of estimated tax. You may incur penalties under the estimated tax rules if your withholding and estimated tax payments are not sufficient. You can reduce or defer the income tax on a distribution by directly or indirectly rolling such distribution over to another IRA or eligible plan. You should consult your tax advisor for additional information.
State tax will be withheld if, at the time of your distribution, your address is within one of the mandatory withholding states and you have federal income tax withheld (or as otherwise required by state law). State taxes will be withheld from your distribution in accordance with the respective state rules.
Distributions you receive from 403(b), 457 and qualified plans are subject to special tax and withholding rules. Your plan administrator or plan sponsor is required to provide you with a special tax notice explaining those rules at the time you request a distribution. If applicable, federal and/or state taxes may be withheld from your distribution amount.
Proxy Voting Policies
A description of the policies that the fund's investment advisor uses in exercising the voting rights associated with the securities purchased and/or held by the fund is available without charge, upon request, by calling 1-800-345-2021. It is also available on the "About Us" page of American Century Investments’ website at americancentury.com and on the Securities and Exchange Commission’s website at sec.gov. Information regarding how the investment advisor voted proxies relating to portfolio securities during the most recent 12-month period ended June 30 is available on the "About Us" page at americancentury.com. It is also available at sec.gov.
Quarterly Portfolio Disclosure
The fund files its complete schedule of portfolio holdings with the Securities and Exchange Commission (SEC) for the first and third quarters of each fiscal year on Form N-Q. The fund’s Forms N-Q are available on the SEC’s website at sec.gov, and may be reviewed and copied at the SEC’s Public Reference Room in Washington, DC. Information on the operation of the Public Reference Room may be obtained by calling 1-800-SEC-0330. The fund also makes its complete schedule of portfolio holdings for the most recent quarter of its fiscal year available on its
website at americancentury.com and, upon request, by calling 1-800-345-2021.
|
| | |
| |
| | | |
| Contact Us | americancentury.com | |
| Automated Information Line | 1-800-345-8765 | |
| Investor Services Representative | 1-800-345-2021 or 816-531-5575 | |
| Investors Using Advisors | 1-800-378-9878 | |
| Business, Not-For-Profit, Employer-Sponsored Retirement Plans | 1-800-345-3533 | |
| Banks and Trust Companies, Broker-Dealers, Financial Professionals, Insurance Companies | 1-800-345-6488 | |
| Telecommunications Relay Service for the Deaf | 711 | |
| | | |
| American Century Mutual Funds, Inc. | |
| | | |
Investment Advisor: American Century Investment Management, Inc. Kansas City, Missouri | |
| | | |
| This report and the statements it contains are submitted for the general information of our shareholders. The report is not authorized for distribution to prospective investors unless preceded or accompanied by an effective prospectus. | |
| | | |
©2014 American Century Proprietary Holdings, Inc. All rights reserved.
CL-ANN-84007 1412 | |
|
| |
| ANNUAL REPORT | OCTOBER 31, 2014 |
Ultra® Fund
|
| |
| President’s Letter | |
| Performance | |
| Portfolio Commentary | |
| Fund Characteristics | |
| Shareholder Fee Example | |
| Schedule of Investments | |
| Statement of Assets and Liabilities | |
| Statement of Operations | |
| Statement of Changes in Net Assets | |
| Notes to Financial Statements | |
| Financial Highlights | |
| Report of Independent Registered Public Accounting Firm | |
| Management | |
| Approval of Management Agreement | |
| Additional Information | |
Any opinions expressed in this report reflect those of the author as of the date of the report, and do not necessarily represent the opinions of American Century Investments® or any other person in the American Century Investments organization. Any such opinions are subject to change at any time based upon market or other conditions and American Century Investments disclaims any responsibility to update such opinions. These opinions may not be relied upon as investment advice and, because investment decisions made by American Century Investments funds are based on numerous factors, may not be relied upon as an indication of trading intent on behalf of any American Century Investments fund. Security examples are used for representational purposes only and are not intended as recommendations to purchase or sell securities. Performance information for comparative indices and securities is provided to American Century Investments by third party vendors. To the best of American Century Investments’ knowledge, such information is accurate at the time of printing.
|
| |
| Dear Investor:
Thank you for reviewing this annual report for the 12 months ended October 31, 2014. It provides investment performance and portfolio information for the reporting period, plus longer-term historical performance data.
Annual reports remain important vehicles for conveying information about fund returns, including market and economic factors that affected performance during the reporting period. For additional, updated investment and market insights, we encourage you to visit our website, americancentury.com. |
| Jonathan Thomas |
Favorable Fiscal Year for U.S. Stocks and Bonds
Mostly stimulative monetary policies by central banks and expectations of longer-term economic improvement, interspersed with concerns about nearer-term weaker-than-expected global economic data and geopolitical conflicts, helped drive financial market returns during the reporting period. We believe the combination of longer-term optimism about U.S. economic growth, low costs of capital, and continued central bank stimulus (even as the U.S. Federal Reserve’s latest monthly bond purchase program ended) helped persuade investors to seek risk and yield, which benefited U.S. stocks and bonds. The S&P 500 Index gained 17.27% during the 12 months. The 30-year U.S. Treasury bond was close behind, returning 15.44%, according to Barclays. U.S. real estate investment trusts (REITs), whose shares combine performance attributes of stocks and bonds, benefited from both—the MSCI U.S. REIT Index advanced 19.19%.
U.S. market benchmark returns generally outpaced their non-U.S. counterparts. The U.S. was perceived by investors as a relative bastion of growth, stability, and potentially attractive yields compared with most of the rest of the world, so capital flows generally favored U.S. assets. These capital flows, along with weaker-than-expected global growth, lower-than-expected global inflation, and falling commodity and energy prices, helped keep long-term interest rates and other corporate costs low. U.S. stocks just completed a solid third-quarter earnings reporting season, though questions remain about next year’s revenues, given this year’s slowdown in global economic growth and concerns about how far it could extend into 2015.
We believe continuing global economic and geopolitical uncertainties could continue to support the relative appeal of U.S. assets in coming months. But the end of the U.S. Federal Reserve’s monthly bond-buying program and the still-looming possibility of higher interest rates in 2015 point to potential U.S. market volatility ahead. In this environment, we continue to believe in a disciplined, diversified, long-term investment approach, using professionally managed stock and bond portfolios for meeting financial goals. We appreciate your continued trust in us.
Sincerely,
Jonathan Thomas
President and Chief Executive Officer
American Century Investments
|
| | | | | | |
| Total Returns as of October 31, 2014 |
| | | | Average Annual Returns | |
| | Ticker Symbol | 1 year | 5 years | 10 years | Since Inception | Inception Date |
| Investor Class | TWCUX | 15.66% | 17.11% | 7.53% | 11.64% | 11/2/81 |
| Russell 1000 Growth Index | — | 17.11% | 17.42% | 9.05% | 10.80%(1) | — |
| S&P 500 Index | — | 17.27% | 16.68% | 8.20% | 11.77%(1) | — |
| Institutional Class | TWUIX | 15.90% | 17.34% | 7.75% | 6.81% | 11/14/96 |
A Class(2) | TWUAX | | | | | 10/2/96 |
| No sales charge* | | 15.35% | 16.80% | 7.26% | 6.54% | |
| With sales charge* | | 8.72% | 15.42% | 6.63% | 6.19% | |
| C Class | TWCCX | 14.51% | 15.95% | 6.46% | 5.22% | 10/29/01 |
| R Class | AULRX | 15.08% | 16.52% | 7.00% | 7.03% | 8/29/03 |
| R6 Class | AULDX | 16.06% | — | — | 20.55% | 7/26/13 |
* Sales charges include initial sales charges and contingent deferred sales charges (CDSCs), as applicable. A Class shares have a 5.75% maximum initial sales charge and may be subject to a maximum CDSC of 1.00%. C Class shares redeemed within 12 months of purchase are subject to a maximum CDSC of 1.00%. The SEC requires that mutual funds provide performance information net of maximum sales charges in all cases where charges could be applied.
| |
| (1) | Since October 31, 1981, the date nearest the Investor Class's inception for which data are available. |
| |
| (2) | Prior to September 4, 2007, the A Class was referred to as the Advisor Class and did not have a front-end sales charge. Performance has been adjusted to reflect this charge. |
Data presented reflect past performance. Past performance is no guarantee of future results. Current performance may be higher or lower than the performance shown. Investment return and principal value will fluctuate, and redemption value may be more or less than original cost. Data assumes reinvestment of dividends and capital gains, and none of the charts reflect the deduction of taxes that a shareholder would pay on fund distributions or the redemption of fund shares. To obtain performance data current to the most recent month end, please call 1-800-345-2021 or visit americancentury.com. For additional information about the fund, please consult the prospectus.
|
|
| Growth of $10,000 Over 10 Years |
| $10,000 investment made October 31, 2004 |
| Performance for other share classes will vary due to differences in fee structure. |
|
| |
| Value on October 31, 2014 |
| | Investor Class — $20,682 |
| |
| | Russell 1000 Growth Index — $23,790 |
| |
| | S&P 500 Index — $22,001 |
| |
|
| | | | | |
| Total Annual Fund Operating Expenses |
| Investor Class | Institutional Class | A Class | C Class | R Class | R6 Class |
| 0.99% | 0.79% | 1.24% | 1.99% | 1.49% | 0.64% |
The total annual fund operating expenses shown is as stated in the fund’s prospectus current as of the date of this report. The prospectus may vary from the expense ratio shown elsewhere in this report because it is based on a different time period, includes acquired fund fees and expenses, and, if applicable, does not include fee waivers or expense reimbursements.
Data presented reflect past performance. Past performance is no guarantee of future results. Current performance may be higher or lower than the performance shown. Investment return and principal value will fluctuate, and redemption value may be more or less than original cost. Data assumes reinvestment of dividends and capital gains, and none of the charts reflect the deduction of taxes that a shareholder would pay on fund distributions or the redemption of fund shares. To obtain performance data current to the most recent month end, please call 1-800-345-2021 or visit americancentury.com. For additional information about the fund, please consult the prospectus.
Portfolio Managers: Keith Lee, Michael Li, and Jeffrey Bourke
Performance Summary
Ultra returned 15.66%* for the 12 months ended October 31, 2014, compared with the 17.11% return of the portfolio’s benchmark, the Russell 1000 Growth Index.
U.S. stock indices delivered solid returns during the reporting period. Within the Russell 1000 Growth Index, health care was the top-performing sector on a total-return basis, gaining nearly 35%. Information technology also outpaced the benchmark average with a 22% return. No sectors lost ground, although energy, telecommunication services, and consumer discretionary posted more modest, single-digit returns.
Ultra received positive contributions to absolute return from all sectors it was invested in except energy. Stock decisions in the industrials, consumer staples, and energy sectors detracted most from performance relative to the Russell index. Stock selection in the consumer discretionary and information technology sectors aided results versus the benchmark.
Industrials and Consumer Staples Led Detractors
Stock selection in the industrials sector was the largest source of underperformance for the portfolio, driven by weakness in aerospace and defense and electrical equipment companies. Aerospace and defense firm United Technologies underperformed after the company reported results that were in line with expectations but indicated soft organic growth and weaker growth in non-U.S. operations. Underweighting the road and rail industry also hurt results in the sector. Not owning rail transportation company Union Pacific weighed on results. Because new sources of crude often don’t have a pipeline infrastructure to the coasts, rail has emerged as an important means of crude transport.
Stock decisions in the consumer staples sector also hampered results. Whole Foods was a key detractor in the sector. The food retailer was hurt by perceptions that margins will be constrained by its price-reduction strategy as it seeks a larger market share in an increasingly competitive space. We eliminated the position.
Other major detractors included an underweight position in software giant Microsoft, which was eventually eliminated from the portfolio. The company lowered guidance, consistent with our less sanguine outlook for the business. Nevertheless, the stock benefited from price-to-earnings multiple expansion, excitement around moving Office 365 to a subscription model, and the announcement of the Windows 10 operating system. The fund’s holding in internet retailer Amazon.com also detracted. The company saw capital expenditures rise and margins fall and suffered as investors focused on the company’s profitability. North American energy exploration and production firm Noble Energy suffered temporarily from a slump in energy prices and slowdown in takeaway capacity.
Consumer Discretionary and Information Technology Holdings Aided Results
The fund benefited from holdings in the consumer discretionary sector, led by positioning among media firms and textile, apparel, and luxury goods companies. Sports apparel maker Under Armour was a top contributor. The firm is gaining market share, and its international arm is growing rapidly.
*All fund returns referenced in this commentary are for Investor Class shares. Performance for other share classes will vary due to differences in fee structure; when Investor Class performance exceeds that of the fund’s benchmark, other share classes may not. See page 3 for returns for all share classes.
Information technology stocks were also key contributors, led by Apple. The computer and peripherals giant benefited from anticipation of and eventual release of new products, including the iPhone 6, Apple Pay mobile payment service, and the forthcoming Apple Watch. It helped to have no exposure to technology firm International Business Machines.
Positioning in the health care sector aided relative results, driven by stock selection decisions within the biotechnology industry. Biotechnology company Gilead Sciences was a portfolio top contributor, benefiting from stronger-than-expected growth in its hepatitis C business. It was helpful to hold an overweight position in biotech stock Alexion Pharmaceuticals, which gained on a very strong earnings report and investor enthusiasm for the company’s revised tax structure, which should lead to lower tax rates (and more profits) going forward.
Outlook
We remain confident in our belief that stocks that exhibit high quality, accelerating fundamentals, positive relative strength, and attractive valuations will outperform in the long term. Our portfolio positioning reflects where we are seeing opportunities as a result of the application of that philosophy and process. As of October 31, 2014, the portfolio’s largest overweight positions relative to the Russell 1000 Growth Index were in health care and information technology. Consumer staples and telecommunication services represented the largest underweights.
|
| |
| OCTOBER 31, 2014 | |
| Top Ten Holdings | % of net assets |
| Apple, Inc. | 8.2% |
| Google, Inc.* | 4.3% |
| Gilead Sciences, Inc. | 3.9% |
| Celgene Corp. | 2.8% |
| MasterCard, Inc., Class A | 2.4% |
| Starbucks Corp. | 2.3% |
| QUALCOMM, Inc. | 2.2% |
| UnitedHealth Group, Inc. | 2.2% |
| NIKE, Inc., Class B | 2.1% |
| Amazon.com, Inc. | 2.1% |
| * Includes all classes of the issuer. | |
| | |
| Top Five Industries | % of net assets |
| Internet Software and Services | 9.5% |
| Biotechnology | 9.3% |
| Technology Hardware, Storage and Peripherals | 9.1% |
| IT Services | 4.4% |
| Software | 4.4% |
| | |
| Types of Investments in Portfolio | % of net assets |
| Common Stocks | 99.4% |
| Temporary Cash Investments | 0.7% |
| Other Assets and Liabilities | (0.1)% |
Fund shareholders may incur two types of costs: (1) transaction costs, including sales charges (loads) on purchase payments and redemption/exchange fees; and (2) ongoing costs, including management fees; distribution and service (12b-1) fees; and other fund expenses. This example is intended to help you understand your ongoing costs (in dollars) of investing in your fund and to compare these costs with the ongoing cost of investing in other mutual funds.
The example is based on an investment of $1,000 made at the beginning of the period and held for the entire period from May 1, 2014 to October 31, 2014.
Actual Expenses
The table provides information about actual account values and actual expenses for each class. You may use the information, together with the amount you invested, to estimate the expenses that you paid over the period. First, identify the share class you own. Then simply divide your account value by $1,000 (for example, an $8,600 account value divided by $1,000 = 8.6), then multiply the result by the number under the heading “Expenses Paid During Period” to estimate the expenses you paid on your account during this period.
If you hold Investor Class shares of any American Century Investments fund, or Institutional Class shares of the American Century Diversified Bond Fund, in an American Century Investments account (i.e., not a financial intermediary or retirement plan account), American Century Investments may charge you a $12.50 semiannual account maintenance fee if the value of those shares is less than $10,000. We will redeem shares automatically in one of your accounts to pay the $12.50 fee. In determining your total eligible investment amount, we will include your investments in all personal accounts (including American Century Investments Brokerage accounts) registered under your Social Security number. Personal accounts include individual accounts, joint accounts, UGMA/UTMA accounts, personal trusts, Coverdell Education Savings Accounts and IRAs (including traditional, Roth, Rollover, SEP-, SARSEP- and SIMPLE-IRAs), and certain other retirement accounts. If you have only business, business retirement, employer-sponsored or American Century Investments Brokerage accounts, you are currently not subject to this fee. If you are subject to the Account Maintenance Fee, your account value could be reduced by the fee amount.
Hypothetical Example for Comparison Purposes
The table also provides information about hypothetical account values and hypothetical expenses based on the actual expense ratio of each class of your fund and an assumed rate of return of 5% per year before expenses, which is not the actual return of a fund’s share class. The hypothetical account values and expenses may not be used to estimate the actual ending account balance or expenses you paid for the period. You may use this information to compare the ongoing costs of investing in your fund and other funds. To do so, compare this 5% hypothetical example with the 5% hypothetical examples that appear in the shareholder reports of the other funds.
Please note that the expenses shown in the table are meant to highlight your ongoing costs only and do not reflect any transactional costs, such as sales charges (loads) or redemption/exchange fees. Therefore, the table is useful in comparing ongoing costs only, and will not help you determine the relative total costs of owning different funds. In addition, if these transactional costs were included, your costs would have been higher.
|
| | | | |
| Beginning
Account Value
5/1/14 | Ending
Account Value
10/31/14 | Expenses Paid
During Period(1)5/1/14 - 10/31/14 | Annualized
Expense Ratio(1) |
| Actual | | | | |
| Investor Class (after waiver) | $1,000 | $1,108.50 | $5.26 | 0.99% |
| Investor Class (before waiver) | $1,000 | $1,108.50(2) | $5.26 | 0.99% |
| Institutional Class (after waiver) | $1,000 | $1,109.80 | $4.20 | 0.79% |
| Institutional Class (before waiver) | $1,000 | $1,109.80(2) | $4.20 | 0.79% |
| A Class (after waiver) | $1,000 | $1,107.20 | $6.59 | 1.24% |
| A Class (before waiver) | $1,000 | $1,107.20(2) | $6.59 | 1.24% |
| C Class (after waiver) | $1,000 | $1,103.10 | $10.55 | 1.99% |
| C Class (before waiver) | $1,000 | $1,103.10(2) | $10.55 | 1.99% |
| R Class (after waiver) | $1,000 | $1,105.70 | $7.91 | 1.49% |
| R Class (before waiver) | $1,000 | $1,105.70(2) | $7.91 | 1.49% |
| R6 Class (after waiver) | $1,000 | $1,110.70 | $3.40 | 0.64% |
| R6 Class (before waiver) | $1,000 | $1,110.70(2) | $3.40 | 0.64% |
| Hypothetical | | | | |
| Investor Class (after waiver) | $1,000 | $1,020.22 | $5.04 | 0.99% |
| Investor Class (before waiver) | $1,000 | $1,020.22 | $5.04 | 0.99% |
| Institutional Class (after waiver) | $1,000 | $1,021.22 | $4.02 | 0.79% |
| Institutional Class (before waiver) | $1,000 | $1,021.22 | $4.02 | 0.79% |
| A Class (after waiver) | $1,000 | $1,018.96 | $6.31 | 1.24% |
| A Class (before waiver) | $1,000 | $1,018.96 | $6.31 | 1.24% |
| C Class (after waiver) | $1,000 | $1,015.17 | $10.11 | 1.99% |
| C Class (before waiver) | $1,000 | $1,015.17 | $10.11 | 1.99% |
| R Class (after waiver) | $1,000 | $1,017.69 | $7.58 | 1.49% |
| R Class (before waiver) | $1,000 | $1,017.69 | $7.58 | 1.49% |
| R6 Class (after waiver) | $1,000 | $1,021.98 | $3.26 | 0.64% |
| R6 Class (before waiver) | $1,000 | $1,021.98 | $3.26 | 0.64% |
| |
| (1) | Expenses are equal to the class's annualized expense ratio listed in the table above, multiplied by the average account value over the period, multiplied by 184, the number of days in the most recent fiscal half-year, divided by 365, to reflect the one-half year period. |
| |
| (2) | Ending account value assumes the return earned after waiver and would have been lower if a portion of the management fee had not been waived. |
OCTOBER 31, 2014
|
| | | | | |
| | Shares | Value |
| COMMON STOCKS — 99.4% | | |
| Aerospace and Defense — 3.5% | | |
| Boeing Co. (The) | 1,023,000 |
| $ | 127,782,930 |
|
| United Technologies Corp. | 1,491,000 |
| 159,537,000 |
|
| | | 287,319,930 |
|
| Auto Components — 0.6% | | |
| BorgWarner, Inc. | 896,000 |
| 51,089,920 |
|
| Automobiles — 0.9% | | |
Tesla Motors, Inc.(1) | 300,000 |
| 72,510,000 |
|
| Banks — 1.0% | | |
| JPMorgan Chase & Co. | 1,408,000 |
| 85,155,840 |
|
| Beverages — 1.3% | | |
Boston Beer Co., Inc. (The), Class A(1) | 123,000 |
| 30,627,000 |
|
Constellation Brands, Inc., Class A(1) | 824,000 |
| 75,428,960 |
|
| | | 106,055,960 |
|
| Biotechnology — 9.3% | | |
Alexion Pharmaceuticals, Inc.(1) | 500,000 |
| 95,680,000 |
|
Celgene Corp.(1) | 2,132,000 |
| 228,315,880 |
|
Gilead Sciences, Inc.(1) | 2,877,000 |
| 322,224,000 |
|
Isis Pharmaceuticals, Inc.(1) | 396,000 |
| 18,239,760 |
|
Regeneron Pharmaceuticals, Inc.(1) | 266,000 |
| 104,729,520 |
|
| | | 769,189,160 |
|
| Capital Markets — 1.8% | | |
| Franklin Resources, Inc. | 1,375,000 |
| 76,463,750 |
|
| T. Rowe Price Group, Inc. | 939,000 |
| 77,082,510 |
|
| | | 153,546,260 |
|
| Chemicals — 2.9% | | |
| Monsanto Co. | 1,350,000 |
| 155,304,000 |
|
| Valspar Corp. (The) | 1,007,000 |
| 82,735,120 |
|
| | | 238,039,120 |
|
| Communications Equipment — 2.2% | | |
| QUALCOMM, Inc. | 2,370,000 |
| 186,068,700 |
|
| Consumer Finance — 1.1% | | |
| American Express Co. | 1,022,000 |
| 91,928,900 |
|
| Electrical Equipment — 3.1% | | |
| Acuity Brands, Inc. | 528,000 |
| 73,619,040 |
|
| Eaton Corp. plc | 762,000 |
| 52,113,180 |
|
| Emerson Electric Co. | 2,064,000 |
| 132,219,840 |
|
| | | 257,952,060 |
|
| Energy Equipment and Services — 2.5% | | |
| Core Laboratories NV | 484,000 |
| 67,532,520 |
|
| Schlumberger Ltd. | 1,413,000 |
| 139,406,580 |
|
| | | 206,939,100 |
|
|
| | | | | |
| | Shares | Value |
| Food and Staples Retailing — 2.0% | | |
| Costco Wholesale Corp. | 1,224,000 |
| $ | 163,244,880 |
|
| Food Products — 1.6% | | |
| Mead Johnson Nutrition Co. | 743,000 |
| 73,787,330 |
|
| Nestle SA | 809,000 |
| 59,227,482 |
|
| | | 133,014,812 |
|
| Health Care Equipment and Supplies — 2.3% | | |
Intuitive Surgical, Inc.(1) | 187,165 |
| 92,796,407 |
|
| St. Jude Medical, Inc. | 984,000 |
| 63,143,280 |
|
Varian Medical Systems, Inc.(1) | 396,000 |
| 33,311,520 |
|
| | | 189,251,207 |
|
| Health Care Providers and Services — 3.5% | | |
Express Scripts Holding Co.(1) | 1,401,000 |
| 107,624,820 |
|
| UnitedHealth Group, Inc. | 1,946,000 |
| 184,889,460 |
|
| | | 292,514,280 |
|
| Health Care Technology — 1.0% | | |
Cerner Corp.(1) | 1,287,000 |
| 81,518,580 |
|
| Hotels, Restaurants and Leisure — 4.1% | | |
Chipotle Mexican Grill, Inc.(1) | 73,000 |
| 46,574,000 |
|
| Starbucks Corp. | 2,522,000 |
| 190,562,320 |
|
| Wynn Resorts Ltd. | 560,000 |
| 106,405,600 |
|
| | | 343,541,920 |
|
| Insurance — 1.4% | | |
| MetLife, Inc. | 2,179,000 |
| 118,188,960 |
|
| Internet and Catalog Retail — 2.1% | | |
Amazon.com, Inc.(1) | 580,000 |
| 177,166,800 |
|
| Internet Software and Services — 9.5% | | |
Alibaba Group Holding Ltd. ADR(1) | 98,994 |
| 9,760,808 |
|
Baidu, Inc. ADR(1) | 308,000 |
| 73,541,160 |
|
Facebook, Inc., Class A(1) | 2,217,000 |
| 166,252,830 |
|
Google, Inc., Class A(1) | 318,484 |
| 180,857,509 |
|
Google, Inc., Class C(1) | 318,000 |
| 177,787,440 |
|
LinkedIn Corp., Class A(1) | 382,000 |
| 87,462,720 |
|
| Tencent Holdings Ltd. | 3,675,000 |
| 58,510,018 |
|
Yelp, Inc.(1) | 540,000 |
| 32,400,000 |
|
| | | 786,572,485 |
|
| IT Services — 4.4% | | |
| MasterCard, Inc., Class A | 2,354,802 |
| 197,214,667 |
|
Teradata Corp.(1) | 492,000 |
| 20,821,440 |
|
| Visa, Inc., Class A | 626,000 |
| 151,135,180 |
|
| | | 369,171,287 |
|
| Machinery — 3.4% | | |
| Cummins, Inc. | 701,000 |
| 102,472,180 |
|
| Donaldson Co., Inc. | 779,000 |
| 32,390,820 |
|
WABCO Holdings, Inc.(1) | 856,000 |
| 83,357,280 |
|
| Wabtec Corp. | 752,000 |
| 64,897,600 |
|
| | | 283,117,880 |
|
|
| | | | | |
| | Shares | Value |
| Media — 3.8% | | |
| Time Warner, Inc. | 1,887,000 |
| $ | 149,959,890 |
|
| Walt Disney Co. (The) | 1,837,000 |
| 167,865,060 |
|
| | | 317,824,950 |
|
| Oil, Gas and Consumable Fuels — 2.7% | | |
Concho Resources, Inc.(1) | 375,000 |
| 40,886,250 |
|
| EOG Resources, Inc. | 702,000 |
| 66,725,100 |
|
| Noble Energy, Inc. | 1,265,000 |
| 72,901,950 |
|
| Occidental Petroleum Corp. | 505,000 |
| 44,909,650 |
|
| | | 225,422,950 |
|
| Personal Products — 1.3% | | |
| Estee Lauder Cos., Inc. (The), Class A | 1,412,000 |
| 106,154,160 |
|
| Pharmaceuticals — 1.2% | | |
| Pfizer, Inc. | 3,196,000 |
| 95,720,200 |
|
| Professional Services — 1.1% | | |
| Nielsen NV | 2,055,000 |
| 87,316,950 |
|
| Semiconductors and Semiconductor Equipment — 1.2% | | |
| ARM Holdings plc | 2,981,000 |
| 42,208,334 |
|
| Linear Technology Corp. | 1,285,000 |
| 55,049,400 |
|
| | | 97,257,734 |
|
| Software — 4.4% | | |
NetSuite, Inc.(1) | 445,000 |
| 48,353,700 |
|
| Oracle Corp. | 2,869,000 |
| 112,034,450 |
|
Salesforce.com, Inc.(1) | 1,084,000 |
| 69,365,160 |
|
Splunk, Inc.(1) | 282,000 |
| 18,634,560 |
|
Tableau Software, Inc., Class A(1) | 316,000 |
| 26,098,440 |
|
VMware, Inc., Class A(1) | 713,000 |
| 59,585,410 |
|
Workday, Inc.(1) | 326,000 |
| 31,126,480 |
|
| | | 365,198,200 |
|
| Specialty Retail — 3.7% | | |
| Home Depot, Inc. (The) | 379,000 |
| 36,960,080 |
|
O'Reilly Automotive, Inc.(1) | 476,000 |
| 83,718,880 |
|
| Tiffany & Co. | 661,000 |
| 63,535,320 |
|
| TJX Cos., Inc. (The) | 1,989,000 |
| 125,943,480 |
|
| | | 310,157,760 |
|
| Technology Hardware, Storage and Peripherals — 9.1% | | |
| Apple, Inc. | 6,336,315 |
| 684,322,020 |
|
| EMC Corp. | 2,618,000 |
| 75,215,140 |
|
| | | 759,537,160 |
|
| Textiles, Apparel and Luxury Goods — 3.5% | | |
| Burberry Group plc | 1,882,000 |
| 46,155,850 |
|
| NIKE, Inc., Class B | 1,915,000 |
| 178,037,550 |
|
Under Armour, Inc., Class A(1) | 1,042,000 |
| 68,334,360 |
|
| | | 292,527,760 |
|
| Tobacco — 1.9% | | |
| Philip Morris International, Inc. | 1,742,000 |
| 155,055,420 |
|
TOTAL COMMON STOCKS (Cost $3,945,953,362) | | 8,255,271,285 |
|
|
| | | | | |
| | Shares | Value |
| TEMPORARY CASH INVESTMENTS — 0.7% | | |
| Repurchase Agreement, Bank of America Merrill Lynch, (collateralized by various U.S. Treasury obligations, 1.375% - 2.625%, 12/31/14 - 2/28/19, valued at $12,279,030), in a joint trading account at 0.07%, dated 10/31/14, due 11/3/14 (Delivery value $12,040,169) | | $ | 12,040,099 |
|
| Repurchase Agreement, Credit Suisse First Boston, Inc., (collateralized by various U.S. Treasury obligations, 0.25%, 10/15/15, valued at $4,912,630), in a joint trading account at 0.04%, dated 10/31/14, due 11/3/14 (Delivery value $4,816,056) | | 4,816,040 |
|
| Repurchase Agreement, Goldman Sachs & Co., (collateralized by various U.S. Treasury obligations, 0.125%, 12/31/14, valued at $9,834,652), in a joint trading account at 0.03%, dated 10/31/14, due 11/3/14 (Delivery value $9,632,103) | | 9,632,079 |
|
| SSgA U.S. Government Money Market Fund, Class N | 26,494,289 |
| 26,494,289 |
|
TOTAL TEMPORARY CASH INVESTMENTS (Cost $52,982,507) | | 52,982,507 |
|
TOTAL INVESTMENT SECURITIES — 100.1% (Cost $3,998,935,869) | | 8,308,253,792 |
|
| OTHER ASSETS AND LIABILITIES — (0.1)% | | (6,208,888 | ) |
| TOTAL NET ASSETS — 100.0% | | $ | 8,302,044,904 |
|
|
| | | | | | | | |
| FORWARD FOREIGN CURRENCY EXCHANGE CONTRACTS |
| Currency Purchased | Currency Sold | Counterparty | Settlement Date | Unrealized Appreciation
(Depreciation) |
| USD | 49,437,748 | CHF | 46,760,200 | Credit Suisse AG | 11/28/14 | $ | 829,158 |
|
| USD | 72,309,499 | GBP | 44,743,762 | Credit Suisse AG | 11/28/14 | 746,840 |
|
| | | | | | | $ | 1,575,998 |
|
|
| | |
| NOTES TO SCHEDULE OF INVESTMENTS |
| ADR | - | American Depositary Receipt |
| CHF | - | Swiss Franc |
| GBP | - | British Pound |
| USD | - | United States Dollar |
See Notes to Financial Statements.
|
|
| Statement of Assets and Liabilities |
|
| | | |
| OCTOBER 31, 2014 | |
| Assets | |
| Investment securities, at value (cost of $3,998,935,869) | $ | 8,308,253,792 |
|
| Foreign currency holdings, at value (cost of $403,485) | 403,365 |
|
| Receivable for investments sold | 8,178,614 |
|
| Receivable for capital shares sold | 1,027,867 |
|
| Unrealized appreciation on forward foreign currency exchange contracts | 1,575,998 |
|
| Dividends and interest receivable | 1,814,284 |
|
| | 8,321,253,920 |
|
| | |
| Liabilities | |
| Payable for investments purchased | 7,958,520 |
|
| Payable for capital shares redeemed | 4,688,606 |
|
| Accrued management fees | 6,542,106 |
|
| Distribution and service fees payable | 19,784 |
|
| | 19,209,016 |
|
| | |
| Net Assets | $ | 8,302,044,904 |
|
| | |
| Net Assets Consist of: | |
| Capital (par value and paid-in surplus) | $ | 3,442,301,884 |
|
| Undistributed net investment income | 25,351,601 |
|
| Undistributed net realized gain | 523,547,193 |
|
| Net unrealized appreciation | 4,310,844,226 |
|
| | $ | 8,302,044,904 |
|
|
| | | | |
| | Net Assets | Shares Outstanding | Net Asset Value Per Share |
| Investor Class, $0.01 Par Value | $7,981,780,709 | 214,551,722 |
| $37.20 |
| Institutional Class, $0.01 Par Value | $214,464,359 | 5,610,851 |
| $38.22 |
| A Class, $0.01 Par Value | $71,650,344 | 1,993,861 |
| $35.94* |
| C Class, $0.01 Par Value | $2,482,438 | 76,586 |
| $32.41 |
| R Class, $0.01 Par Value | $7,982,998 | 225,152 |
| $35.46 |
| R6 Class, $0.01 Par Value | $23,684,056 | 619,257 |
| $38.25 |
*Maximum offering price $38.13 (net asset value divided by 0.9425).
See Notes to Financial Statements.
|
| | | |
| YEAR ENDED OCTOBER 31, 2014 | |
| Investment Income (Loss) | |
| Income: | |
| Dividends (net of foreign taxes withheld of $620,336) | $ | 102,090,384 |
|
| Interest | 5,999 |
|
| | 102,096,383 |
|
| Expenses: | |
| Management fees | 77,690,205 |
|
| Distribution and service fees: | |
| A Class | 181,972 |
|
| C Class | 23,887 |
|
| R Class | 35,724 |
|
| Directors' fees and expenses | 2,018,576 |
|
| Other expenses | 91 |
|
| | 79,950,455 |
|
| Fees waived | (590,328 | ) |
| | 79,360,127 |
|
| | |
| Net investment income (loss) | 22,736,256 |
|
| | |
| Realized and Unrealized Gain (Loss) | |
| Net realized gain (loss) on: | |
| Investment transactions | 570,443,273 |
|
| Foreign currency transactions | 4,541,257 |
|
| | 574,984,530 |
|
| | |
| Change in net unrealized appreciation (depreciation) on: | |
| Investments | 559,958,108 |
|
| Translation of assets and liabilities in foreign currencies | 417,545 |
|
| | 560,375,653 |
|
| | |
| Net realized and unrealized gain (loss) | 1,135,360,183 |
|
| | |
| Net Increase (Decrease) in Net Assets Resulting from Operations | $ | 1,158,096,439 |
|
See Notes to Financial Statements.
|
|
| Statement of Changes in Net Assets |
|
| | | | | | |
| YEARS ENDED OCTOBER 31, 2014 AND OCTOBER 31, 2013 |
| Increase (Decrease) in Net Assets | October 31, 2014 | October 31, 2013 |
| Operations | | |
| Net investment income (loss) | $ | 22,736,256 |
| $ | 35,311,295 |
|
| Net realized gain (loss) | 574,984,530 |
| 725,268,617 |
|
| Change in net unrealized appreciation (depreciation) | 560,375,653 |
| 1,108,706,632 |
|
| Net increase (decrease) in net assets resulting from operations | 1,158,096,439 |
| 1,869,286,544 |
|
| | | |
| Distributions to Shareholders | | |
| From net investment income: | | |
| Investor Class | (22,249,493 | ) | (31,423,524 | ) |
| Institutional Class | (1,003,895 | ) | (288,697 | ) |
| A Class | (36,312 | ) | (284,451 | ) |
| C Class | — |
| (3,847 | ) |
| R Class | — |
| (22,083 | ) |
| R6 Class | (176 | ) | — |
|
| From net realized gains: | | |
| Investor Class | (287,611,433 | ) | — |
|
| Institutional Class | (7,766,552 | ) | — |
|
| A Class | (2,913,158 | ) | — |
|
| C Class | (96,221 | ) | — |
|
| R Class | (274,425 | ) | — |
|
| R6 Class | (1,048 | ) | — |
|
| Decrease in net assets from distributions | (321,952,713 | ) | (32,022,602 | ) |
| | | |
| Capital Share Transactions | | |
| Net increase (decrease) in net assets from capital share transactions (Note 5) | (154,161,615 | ) | (534,351,092 | ) |
| | | |
| Net increase (decrease) in net assets | 681,982,111 |
| 1,302,912,850 |
|
| | | |
| Net Assets | | |
| Beginning of period | 7,620,062,793 |
| 6,317,149,943 |
|
| End of period | $ | 8,302,044,904 |
| $ | 7,620,062,793 |
|
| | | |
| Undistributed net investment income | $ | 25,351,601 |
| $ | 22,220,265 |
|
See Notes to Financial Statements.
|
|
| Notes to Financial Statements |
OCTOBER 31, 2014
1. Organization
American Century Mutual Funds, Inc. (the corporation) is registered under the Investment Company Act of 1940, as amended (the 1940 Act), as an open-end management investment company and is organized as a Maryland corporation. Ultra Fund (the fund) is one fund in a series issued by the corporation. The fund is diversified as defined under the 1940 Act. The fund's investment objective is to seek long-term capital growth.
The fund offers the Investor Class, the Institutional Class, the A Class, the C Class, the R Class and the R6 Class. The A Class may incur an initial sales charge. The A Class and C Class may be subject to a contingent deferred sales charge. The share classes differ principally in their respective sales charges and distribution and shareholder servicing expenses and arrangements. The Institutional Class and R6 Class shareholders do not require the same level of shareholder and administrative services from American Century Investment Management, Inc. (ACIM) (the investment advisor) as shareholders of other classes. In addition, financial intermediaries do not receive any service, distribution or administrative fees for the R6 Class. As a result, the Institutional Class and R6 Class are charged lower unified management fees. Sale of the R6 Class commenced on July 26, 2013.
2. Significant Accounting Policies
The following is a summary of significant accounting policies consistently followed by the fund in preparation of its financial statements. The fund is an investment company and follows accounting and reporting guidance in accordance with accounting principles generally accepted in the United States of America. This may require management to make certain estimates and assumptions at the date of the financial statements. Actual results could differ from these estimates. Management evaluated the impact of events or transactions occurring through the date the financial statements were issued that would merit recognition or disclosure.
Investment Valuations — The fund determines the fair value of its investments and computes its net asset value per share at the close of regular trading (usually 4 p.m. Eastern time) on the New York Stock Exchange (NYSE) on each day the NYSE is open. The Board of Directors has adopted valuation policies and procedures to guide the investment advisor in the fund’s investment valuation process and to provide methodologies for the oversight of the fund’s pricing function.
Equity securities that are listed or traded on a domestic securities exchange are valued at the last reported sales price or at the official closing price as provided by the exchange. Equity securities traded on foreign securities exchanges are generally valued at the closing price of such securities on the exchange where primarily traded or at the close of the NYSE, if that is earlier. If no last sales price is reported, or if local convention or regulation so provides, the mean of the latest bid and asked prices may be used. Securities traded over-the-counter are valued at the mean of the latest bid and asked prices, the last sales price, or the official closing price. Equity securities initially expressed in local currencies are translated into U.S. dollars at the mean of the appropriate currency exchange rate at the close of the NYSE as provided by an independent pricing service.
Fixed income securities maturing within 60 days at the time of purchase may be valued at cost, plus or minus any amortized discount or premium or at the evaluated mean as provided by an independent pricing service. Evaluated mean prices are commonly derived through utilization of market models, which may consider, among other factors: trade data, quotations from dealers and active market makers, relevant yield curve and spread data, related sector levels, creditworthiness, trade data or market information on comparable securities, and other relevant security specific information.
Open-end management investment companies are valued at the reported net asset value per share. Repurchase agreements are valued at cost, which approximates fair value. Forward foreign currency exchange contracts are valued at the mean of the appropriate forward exchange rate at the close of the NYSE as provided by an independent pricing service.
If the fund determines that the market price for an investment is not readily available or the valuation methods mentioned above do not reflect an investment’s fair value, such investment is valued as determined in good faith by the Board of Directors or its delegate, in accordance with policies and procedures adopted by the Board of Directors. In its determination of fair value, the fund may review several factors including, but not limited to, market information regarding the specific investment or comparable investments and correlation with other investment types, futures indices or general market indicators. Circumstances that may cause the fund to use these procedures to value an investment include, but are not limited to: an investment has been declared in default or is distressed; trading in a security has been suspended during the trading day or a security is not actively trading on its principal exchange; prices received from a regular pricing source are deemed unreliable; or there is a foreign market holiday and no trading occurred.
The fund monitors for significant events occurring after the close of an investment’s primary exchange but before the fund’s net asset value per share is determined. Significant events may include, but are not limited to: corporate announcements and transactions; governmental action and political unrest that could impact a specific investment or an investment sector; or armed conflicts, natural disasters and similar events that could affect investments in a specific country or region. The fund also monitors for significant fluctuations between domestic and foreign markets, as evidenced by the U.S. market or such other indicators that the Board of Directors, or its delegate, deems appropriate. If significant fluctuations in foreign markets are identified, the fund may apply a model-derived factor to the closing price of equity securities traded on foreign securities exchanges. The factor is based on observable market data as provided by an independent pricing service.
Security Transactions — Security transactions are accounted for as of the trade date. Net realized gains and losses are determined on the identified cost basis, which is also used for federal income tax purposes.
Investment Income — Dividend income less foreign taxes withheld, if any, is recorded as of the ex-dividend date. Distributions received on securities that represent a return of capital or long-term capital gain are recorded as a reduction of cost of investments and/or as a realized gain. The fund may estimate the components of distributions received that may be considered nontaxable distributions or long-term capital gain distributions for income tax purposes. Interest income is recorded on the accrual basis and includes accretion of discounts and amortization of premiums.
Foreign Currency Translations — All assets and liabilities initially expressed in foreign currencies are translated into U.S. dollars at prevailing exchange rates at period end. The fund may enter into spot foreign currency exchange contracts to facilitate transactions denominated in a foreign currency. Purchases and sales of investment securities, dividend and interest income, spot foreign currency exchange contracts, and expenses are translated at the rates of exchange prevailing on the respective dates of such transactions. Net realized and unrealized foreign currency exchange gains or losses related to investment securities are a component of net realized gain (loss) on investment transactions and change in net unrealized appreciation (depreciation) on investments, respectively.
Repurchase Agreements — The fund may enter into repurchase agreements with institutions that ACIM has determined are creditworthy pursuant to criteria adopted by the Board of Directors. The fund requires that the collateral, represented by securities, received in a repurchase transaction be transferred to the custodian in a manner sufficient to enable the fund to obtain those securities in the event of a default under the repurchase agreement. ACIM monitors, on a daily basis, the securities transferred to ensure the value, including accrued interest, of the securities under each repurchase agreement is equal to or greater than amounts owed to the fund under each repurchase agreement.
Joint Trading Account — Pursuant to an Exemptive Order issued by the Securities and Exchange Commission, the fund, along with certain other funds in the American Century Investments family of funds, may transfer uninvested cash balances into a joint trading account. These balances are invested in one or more repurchase agreements that are collateralized by U.S. Treasury or Agency obligations.
Income Tax Status — It is the fund’s policy to distribute substantially all net investment income and net realized gains to shareholders and to otherwise qualify as a regulated investment company under provisions of the Internal Revenue Code. Accordingly, no provision has been made for income taxes. The fund files U.S. federal, state, local and non-U.S. tax returns as applicable. The fund's tax returns are subject to examination by the relevant taxing authority until expiration of the applicable statute of limitations, which is generally three years from the date of filing but can be longer in certain jurisdictions. At this time, management believes there are no uncertain tax positions which, based on their technical merit, would not be sustained upon examination and for which it is reasonably possible that the total amounts of unrecognized tax benefits will significantly change in the next twelve months.
Multiple Class — All shares of the fund represent an equal pro rata interest in the net assets of the class to which such shares belong, and have identical voting, dividend, liquidation and other rights and the same terms and conditions, except for class specific expenses and exclusive rights to vote on matters affecting only individual classes. Income, non-class specific expenses, and realized and unrealized capital gains and losses of the fund are allocated to each class of shares based on their relative net assets.
Distributions to Shareholders — Distributions from net investment income and net realized gains, if any, are generally declared and paid annually.
Indemnifications — Under the corporation’s organizational documents, its officers and directors are indemnified against certain liabilities arising out of the performance of their duties to the fund. In addition, in the normal course of business, the fund enters into contracts that provide general indemnifications. The maximum exposure under these arrangements is unknown as this would involve future claims that may be made against a fund. The risk of material loss from such claims is considered by management to be remote.
3. Fees and Transactions with Related Parties
Certain officers and directors of the corporation are also officers and/or directors of American Century Companies, Inc. (ACC). The corporation’s investment advisor, ACIM, the corporation's distributor, American Century Investment Services, Inc. (ACIS), and the corporation’s transfer agent, American Century Services, LLC, are wholly owned, directly or indirectly, by ACC.
Management Fees — The corporation has entered into a management agreement with ACIM, under which ACIM provides the fund with investment advisory and management services in exchange for a single, unified management fee (the fee) per class. The agreement provides that all expenses of managing and operating the fund, except distribution and service fees, brokerage expenses, taxes, interest, fees and expenses of the independent directors (including legal counsel fees), and extraordinary expenses, will be paid by ACIM. The fee is computed and accrued daily based on each class’s daily net assets and paid monthly in arrears. The rate of the fee is determined by applying a fee rate calculation formula. This formula takes into account the fund’s assets as well as certain assets, if any, of other clients of the investment advisor outside the American Century Investments family of funds (such as subadvised funds and separate accounts) that have very similar investment teams and investment strategies (strategy assets). The annual management fee schedule ranges from 0.800% to 0.990% for the Investor Class, A Class, C Class and R Class. The annual management fee schedule ranges from 0.600% to 0.790% for the Institutional Class and 0.450% to 0.640% for the R6 Class. Prior to August 1, 2014, the annual management fee schedule ranged from 0.800% to 1.000% for the Investor Class, A Class, C Class and R Class, 0.600% to 0.800% for the Institutional Class and 0.450% to 0.650% for the R6 Class. The investment advisor voluntarily agreed to waive 0.01% of its management fee from November 1, 2013 through July 31, 2014, at which time the waiver was terminated. The total amount of the waiver for each class for the year ended October 31, 2014 was $568,030, $16,091, $5,498, $176, $527 and $6 for the Investor Class, Institutional Class, A Class, C Class, R Class and R6 Class, respectively. The effective annual management fee before waiver for each class for the year ended October 31, 2014 was 0.98% for the Investor Class, A Class, C Class and R Class, 0.78% for the Institutional Class and 0.63% for the R6 Class. The effective annual management fee after waiver for each class for the year ended October 31, 2014 was 0.97% for the Investor Class, A Class, C Class and R Class, 0.77% for the Institutional Class and 0.62% for the R6 Class.
Distribution and Service Fees — The Board of Directors has adopted a separate Master Distribution and Individual Shareholder Services Plan for each of the A Class, C Class and R Class (collectively the plans), pursuant to Rule 12b-1 of the 1940 Act. The plans provide that the A Class will pay ACIS an annual distribution and service fee of 0.25%. The plans provide that the C Class will pay ACIS an annual distribution and service fee of 1.00%, of which 0.25% is paid for individual shareholder services and 0.75% is paid for distribution services. The plans provide that the R Class will pay ACIS an annual distribution and service fee of 0.50%. The fees are computed and accrued daily based on each class’s daily net assets and paid monthly in arrears. The fees are used to pay financial intermediaries for distribution and individual shareholder services. Fees incurred under the plans during the year ended October 31, 2014 are detailed in the Statement of Operations.
Directors' Fees and Expenses — The Board of Directors is responsible for overseeing the investment advisor’s management and operations of the fund. The directors receive detailed information about the fund and its investment advisor regularly throughout the year, and meet at least quarterly with management of the investment advisor to review reports about fund operations. Fees and expenses incurred in conjunction with the directors during the year ended October 31, 2014 are detailed in the Statement of Operations. The impact of directors' fees and expenses to the ratio of operating expenses to average net assets was 0.03% for the year ended October 31, 2014. The fund’s officers do not receive compensation from the fund.
4. Investment Transactions
Purchases and sales of investment securities, excluding short-term investments, for the year ended October 31, 2014 were $1,240,145,903 and $1,692,465,791, respectively.
5. Capital Share Transactions
Transactions in shares of the fund were as follows:
|
| | | | | | | | | | |
| | Year ended October 31, 2014 | Year ended October 31, 2013(1) |
| | Shares | Amount | Shares | Amount |
| Investor Class/Shares Authorized | 3,500,000,000 |
| | 3,500,000,000 |
| |
| Sold | 6,200,249 |
| $ | 213,362,510 |
| 7,055,804 |
| $ | 203,087,516 |
|
| Issued in reinvestment of distributions | 9,141,045 |
| 300,466,112 |
| 1,154,983 |
| 30,456,895 |
|
| Redeemed | (19,472,162 | ) | (674,617,017 | ) | (30,708,842 | ) | (872,739,374 | ) |
| | (4,130,868 | ) | (160,788,395 | ) | (22,498,055 | ) | (639,194,963 | ) |
| Institutional Class/Shares Authorized | 200,000,000 |
| | 200,000,000 |
| |
| Sold | 768,139 |
| 27,328,125 |
| 4,611,587 |
| 136,709,282 |
|
| Issued in reinvestment of distributions | 255,214 |
| 8,603,265 |
| 10,077 |
| 272,290 |
|
| Redeemed | (1,281,115 | ) | (46,122,369 | ) | (742,701 | ) | (21,742,793 | ) |
| | (257,762 | ) | (10,190,979 | ) | 3,878,963 |
| 115,238,779 |
|
| A Class/Shares Authorized | 100,000,000 |
| | 100,000,000 |
| |
| Sold | 407,067 |
| 13,580,404 |
| 327,276 |
| 9,115,770 |
|
| Issued in reinvestment of distributions | 88,201 |
| 2,806,562 |
| 10,500 |
| 268,378 |
|
| Redeemed | (690,952 | ) | (23,193,216 | ) | (698,036 | ) | (19,328,348 | ) |
| | (195,684 | ) | (6,806,250 | ) | (360,260 | ) | (9,944,200 | ) |
| C Class/Shares Authorized | 50,000,000 |
| | 50,000,000 |
| |
| Sold | 19,057 |
| 573,448 |
| 14,186 |
| 370,450 |
|
| Issued in reinvestment of distributions | 2,224 |
| 64,240 |
| 95 |
| 2,235 |
|
| Redeemed | (14,867 | ) | (456,659 | ) | (8,260 | ) | (210,230 | ) |
| | 6,414 |
| 181,029 |
| 6,021 |
| 162,455 |
|
| R Class/Shares Authorized | 50,000,000 |
| | 50,000,000 |
| |
| Sold | 89,195 |
| 2,986,075 |
| 86,097 |
| 2,296,500 |
|
| Issued in reinvestment of distributions | 8,616 |
| 271,047 |
| 863 |
| 21,866 |
|
| Redeemed | (76,899 | ) | (2,556,081 | ) | (109,589 | ) | (2,956,529 | ) |
| | 20,912 |
| 701,041 |
| (22,629 | ) | (638,163 | ) |
| R6 Class/Shares Authorized | 50,000,000 |
| | 50,000,000 |
| |
| Sold | 635,580 |
| 23,373,082 |
| 792 |
| 25,000 |
|
| Issued in reinvestment of distributions | 36 |
| 1,224 |
| — |
| — |
|
| Redeemed | (17,151 | ) | (632,367 | ) | — |
| — |
|
| | 618,465 |
| 22,741,939 |
| 792 |
| 25,000 |
|
| Net increase (decrease) | (3,938,523 | ) | $ | (154,161,615 | ) | (18,995,168 | ) | $ | (534,351,092 | ) |
| |
| (1) | July 26, 2013 (commencement of sale) through October 31, 2013 for the R6 Class. |
6. Fair Value Measurements
The fund’s investments valuation process is based on several considerations and may use multiple inputs to determine the fair value of the investments held by the fund. In conformity with accounting principles generally accepted in the United States of America, the inputs used to determine a valuation are classified into three broad levels.
| |
| • | Level 1 valuation inputs consist of unadjusted quoted prices in an active market for identical investments. |
| |
| • | Level 2 valuation inputs consist of direct or indirect observable market data (including quoted prices for comparable investments, evaluations of subsequent market events, interest rates, prepayment speeds, credit risk, etc.). These inputs also consist of quoted prices for identical investments initially expressed in local currencies that are adjusted through translation into U.S. dollars. |
| |
| • | Level 3 valuation inputs consist of unobservable data (including a fund’s own assumptions). |
The level classification is based on the lowest level input that is significant to the fair valuation measurement. The valuation inputs are not necessarily an indication of the risks associated with investing in these securities or other financial instruments. There were no significant transfers between levels during the period.
The following is a summary of the level classifications as of period end. The Schedule of Investments provides additional information on the fund’s portfolio holdings.
|
| | | | | | | | |
| | Level 1 | Level 2 | Level 3 |
| Assets | | | |
| Investment Securities | | | |
| Common Stocks | $ | 8,049,169,601 |
| $ | 206,101,684 |
| — |
|
| Temporary Cash Investments | 26,494,289 |
| 26,488,218 |
| — |
|
| | $ | 8,075,663,890 |
| $ | 232,589,902 |
| — |
|
| Other Financial Instruments | | | |
| Forward Foreign Currency Exchange Contracts | — |
| $ | 1,575,998 |
| — |
|
7. Derivative Instruments
Foreign Currency Risk — The fund is subject to foreign currency exchange rate risk in the normal course of pursuing its investment objectives. The value of foreign investments held by a fund may be significantly affected by changes in foreign currency exchange rates. The dollar value of a foreign security generally decreases when the value of the dollar rises against the foreign currency in which the security is denominated and tends to increase when the value of the dollar declines against such foreign currency. A fund may enter into forward foreign currency exchange contracts to reduce a fund's exposure to foreign currency exchange rate fluctuations. The net U.S. dollar value of foreign currency underlying all contractual commitments held by a fund and the resulting unrealized appreciation or depreciation are determined daily. Realized gain or loss is recorded upon the termination of the contract. Net realized and unrealized gains or losses occurring during the holding period of forward foreign currency exchange contracts are a component of net realized gain (loss) on foreign currency transactions and change in net unrealized appreciation (depreciation) on translation of assets and liabilities in foreign currencies, respectively. A fund bears the risk of an unfavorable change in the foreign currency exchange rate underlying the forward contract. Additionally, losses, up to the fair value, may arise if the counterparties do not perform under the contract terms. The fund's average U.S. dollar exposure to foreign currency risk derivative instruments held during the period was $127,531,439.
The value of foreign currency risk derivative instruments as of October 31, 2014, is disclosed on the Statement of Assets and Liabilities as an asset of $1,575,998 in unrealized appreciation on forward foreign currency exchange contracts. For the year ended October 31, 2014, the effect of foreign currency risk derivative instruments on the Statement of Operations was $4,515,676 in net realized gain (loss) on foreign currency transactions and $515,797 in change in net unrealized appreciation (depreciation) on translation of assets and liabilities in foreign currencies.
8. Federal Tax Information
The tax character of distributions paid during the years ended October 31, 2014 and October 31, 2013 were as follows:
|
| | | | | | |
| | 2014 | 2013 |
| Distributions Paid From | | |
| Ordinary income | $ | 23,289,876 |
| $ | 32,022,602 |
|
| Long-term capital gains | $ | 298,662,837 |
| — |
|
The book-basis character of distributions made during the year from net investment income or net realized gains may differ from their ultimate characterization for federal income tax purposes. These differences reflect the differing character of certain income items and net realized gains and losses for financial statement and tax purposes, and may result in reclassification among certain capital accounts on the financial statements.
As of October 31, 2014, the federal tax cost of investments and the components of distributable earnings on a tax-basis were as follows:
|
| | | |
| Federal tax cost of investments | $ | 4,036,349,252 |
|
| Gross tax appreciation of investments | $ | 4,290,214,199 |
|
| Gross tax depreciation of investments | (18,309,659 | ) |
| Net tax appreciation (depreciation) of investments | 4,271,904,540 |
|
Net tax appreciation (depreciation) on derivatives and translation of assets and liabilities in foreign currencies | (49,695 | ) |
| Net tax appreciation (depreciation) | $ | 4,271,854,845 |
|
| Undistributed ordinary income | $ | 27,085,184 |
|
| Accumulated long-term gains | $ | 560,802,991 |
|
The difference between book-basis and tax-basis unrealized appreciation (depreciation) is attributable primarily to the tax deferral of losses on wash sales.
|
| | | | | | | | | | | | | | | | | |
| For a Share Outstanding Throughout the Years Ended October 31 (except as noted) | | | | |
| Per-Share Data | | | | | | | | | Ratios and Supplemental Data |
| | | Income From Investment Operations: | Distributions From: | | | Ratio to Average Net Assets of: | | |
| | Net Asset
Value,
Beginning
of Period | Net
Investment
Income
(Loss)(1) | Net
Realized
and
Unrealized
Gain (Loss) | Total From
Investment
Operations | Net
Investment
Income | Net
Realized
Gains | Total
Distributions | Net Asset
Value,
End
of Period | Total
Return(2) | Operating
Expenses | Operating
Expenses
(before
expense
waiver) | Net
Investment
Income
(Loss) | Net
Investment
Income
(Loss)
(before
expense
waiver) | Portfolio
Turnover
Rate | Net
Assets,
End of
Period
(in thousands) |
| Investor Class | | | | | | | | | | | | | | |
| 2014 | $33.56 | 0.10 | 4.96 | 5.06 | (0.10) | (1.32) | (1.42) | $37.20 | 15.66% | 1.00% | 1.01% | 0.29% | 0.28% | 16% |
| $7,981,781 |
|
| 2013 | $25.68 | 0.15 | 7.86 | 8.01 | (0.13) | — | (0.13) | $33.56 | 31.34% | 0.99% | 0.99% | 0.52% | 0.52% | 26% |
| $7,338,222 |
|
| 2012 | $23.42 | 0.06 | 2.20 | 2.26 | — | — | — | $25.68 | 9.65% | 0.99% | 0.99% | 0.26% | 0.26% | 13% |
| $6,194,268 |
|
| 2011 | $21.22 | 0.04 | 2.20 | 2.24 | (0.04) | — | (0.04) | $23.42 | 10.59% | 0.99% | 0.99% | 0.16% | 0.16% | 13% |
| $5,984,972 |
|
| 2010 | $17.82 | 0.05 | 3.44 | 3.49 | (0.09) | — | (0.09) | $21.22 | 19.63% | 1.00% | 1.00% | 0.25% | 0.25% | 24% |
| $5,906,158 |
|
| Institutional Class | | | | | | | | | | | | | | |
| 2014 | $34.44 | 0.17 | 5.10 | 5.27 | (0.17) | (1.32) | (1.49) | $38.22 | 15.90% | 0.80% | 0.81% | 0.49% | 0.48% | 16% |
| $214,464 |
|
| 2013 | $26.32 | 0.17 | 8.10 | 8.27 | (0.15) | — | (0.15) | $34.44 | 31.56% | 0.79% | 0.79% | 0.72% | 0.72% | 26% |
| $202,118 |
|
| 2012 | $23.95 | 0.12 | 2.25 | 2.37 | — | — | — | $26.32 | 9.90% | 0.79% | 0.79% | 0.46% | 0.46% | 13% |
| $52,362 |
|
| 2011 | $21.69 | 0.08 | 2.27 | 2.35 | (0.09) | — | (0.09) | $23.95 | 10.85% | 0.79% | 0.79% | 0.36% | 0.36% | 13% |
| $52,751 |
|
| 2010 | $18.22 | 0.09 | 3.51 | 3.60 | (0.13) | — | (0.13) | $21.69 | 19.81% | 0.80% | 0.80% | 0.45% | 0.45% | 24% |
| $45,791 |
|
|
| | | | | | | | | | | | | | | | | |
| For a Share Outstanding Throughout the Years Ended October 31 (except as noted) | | | | |
| Per-Share Data | | | | | | | | | Ratios and Supplemental Data |
| | | Income From Investment Operations: | Distributions From: | | | Ratio to Average Net Assets of: | | |
| | Net Asset
Value,
Beginning
of Period | Net
Investment
Income
(Loss)(1) | Net
Realized
and
Unrealized
Gain (Loss) | Total From
Investment
Operations | Net
Investment
Income | Net
Realized
Gains | Total
Distributions | Net Asset
Value,
End
of Period | Total
Return(2) | Operating
Expenses | Operating
Expenses
(before
expense
waiver) | Net
Investment
Income
(Loss) | Net
Investment
Income
(Loss)
(before
expense
waiver) | Portfolio
Turnover
Rate | Net
Assets,
End of
Period
(in thousands) |
| A Class | | | | | | | | | | | | | | |
| 2014 | $32.46 | 0.01 | 4.81 | 4.82 | (0.02) | (1.32) | (1.34) | $35.94 | 15.35% | 1.25% | 1.26% | 0.04% | 0.03% | 16% |
| $71,650 |
|
| 2013 | $24.89 | 0.08 | 7.60 | 7.68 | (0.11) | — | (0.11) | $32.46 | 30.99% | 1.24% | 1.24% | 0.27% | 0.27% | 26% |
| $71,063 |
|
| 2012 | $22.75 | —(3) | 2.14 | 2.14 | — | — | — | $24.89 | 9.41% | 1.24% | 1.24% | 0.01% | 0.01% | 13% |
| $63,461 |
|
| 2011 | $20.62 | (0.02) | 2.15 | 2.13 | — | — | — | $22.75 | 10.33% | 1.24% | 1.24% | (0.09)% | (0.09)% | 13% |
| $62,304 |
|
| 2010 | $17.33 | —(3) | 3.33 | 3.33 | (0.04) | — | (0.04) | $20.62 | 19.24% | 1.25% | 1.25% | 0.00%(4) | 0.00%(4) | 24% |
| $68,109 |
|
| C Class | | | | | | | | | | | | | | |
| 2014 | $29.60 | (0.22) | 4.35 | 4.13 | — | (1.32) | (1.32) | $32.41 | 14.51% | 2.00% | 2.01% | (0.71)% | (0.72)% | 16% |
| $2,482 |
|
| 2013 | $22.83 | (0.13) | 6.96 | 6.83 | (0.06) | — | (0.06) | $29.60 | 29.98% | 1.99% | 1.99% | (0.48)% | (0.48)% | 26% |
| $2,077 |
|
| 2012 | $21.02 | (0.17) | 1.98 | 1.81 | — | — | — | $22.83 | 8.61% | 1.99% | 1.99% | (0.74)% | (0.74)% | 13% |
| $1,464 |
|
| 2011 | $19.20 | (0.17) | 1.99 | 1.82 | — | — | — | $21.02 | 9.48% | 1.99% | 1.99% | (0.84)% | (0.84)% | 13% |
| $678 |
|
| 2010 | $16.22 | (0.13) | 3.11 | 2.98 | — | — | — | $19.20 | 18.45% | 2.00% | 2.00% | (0.75)% | (0.75)% | 24% |
| $789 |
|
|
| | | | | | | | | | | | | | | | | |
| For a Share Outstanding Throughout the Years Ended October 31 (except as noted) | | | | |
| Per-Share Data | | | | | | | | | Ratios and Supplemental Data |
| | | Income From Investment Operations: | Distributions From: | | | Ratio to Average Net Assets of: | | |
| | Net Asset
Value,
Beginning
of Period | Net
Investment
Income
(Loss)(1) | Net
Realized
and
Unrealized
Gain (Loss) | Total From
Investment
Operations | Net
Investment
Income | Net
Realized
Gains | Total
Distributions | Net Asset
Value,
End
of Period | Total
Return(2) | Operating
Expenses | Operating
Expenses
(before
expense
waiver) | Net
Investment
Income
(Loss) | Net
Investment
Income
(Loss)
(before
expense
waiver) | Portfolio
Turnover
Rate | Net
Assets,
End of
Period
(in thousands) |
| R Class | | | | | | | | | | | | | | |
| 2014 | $32.10 | (0.08) | 4.76 | 4.68 | — | (1.32) | (1.32) | $35.46 | 15.08% | 1.50% | 1.51% | (0.21)% | (0.22)% | 16% |
| $7,983 |
|
| 2013 | $24.66 | 0.01 | 7.53 | 7.54 | (0.10) | — | (0.10) | $32.10 | 30.66% | 1.49% | 1.49% | 0.02% | 0.02% | 26% |
| $6,556 |
|
| 2012 | $22.60 | (0.06) | 2.12 | 2.06 | — | — | — | $24.66 | 9.12% | 1.49% | 1.49% | (0.24)% | (0.24)% | 13% |
| $5,595 |
|
| 2011 | $20.54 | (0.08) | 2.14 | 2.06 | — | — | — | $22.60 | 10.03% | 1.49% | 1.49% | (0.34)% | (0.34)% | 13% |
| $4,173 |
|
| 2010 | $17.26 | (0.05) | 3.33 | 3.28 | — | — | — | $20.54 | 19.00% | 1.50% | 1.50% | (0.25)% | (0.25)% | 24% |
| $3,260 |
|
| R6 Class | | | | | | | | | | | | | | |
| 2014 | $34.46 | 0.05 | 5.28 | 5.33 | (0.22) | (1.32) | (1.54) | $38.25 | 16.06% | 0.65% | 0.66% | 0.64% | 0.63% | 16% |
| $23,684 |
|
2013(5) | $31.57 | 0.05 | 2.84 | 2.89 | — | — | — | $34.46 | 9.15% | 0.63%(6) | 0.64%(6) | 0.61%(6) | 0.60%(6) | 26%(7) |
| $27 |
|
|
| | | | |
| Notes to Financial Highlights | | |
| |
| (1) | Computed using average shares outstanding throughout the period. |
| |
| (2) | Total returns are calculated based on the net asset value of the last business day and do not reflect applicable sales charges, if any. Total returns for periods less than one year are not annualized. |
| |
| (3) | Per-share amount was less than $0.005. |
| |
| (4) | Ratio was less than 0.005%. |
| |
| (5) | July 26, 2013 (commencement of sale) through October 31, 2013. |
| |
| (7) | Portfolio turnover is calculated at the fund level. Percentage indicated was calculated for the year ended October 31, 2013. |
See Notes to Financial Statements.
|
|
| Report of Independent Registered Public Accounting Firm |
To the Board of Directors and Shareholders of
American Century Mutual Funds, Inc.:
We have audited the accompanying statement of assets and liabilities, including the schedule of investments, of Ultra Fund (the “Fund”), one of the funds constituting American Century Mutual Funds, Inc., as of October 31, 2014, and the related statement of operations for the year then ended, the statements of changes in net assets for each of the two years in the period then ended, and the financial highlights for each of the periods presented. These financial statements and financial highlights are the responsibility of the Fund's management. Our responsibility is to express an opinion on these financial statements and financial highlights based on our audits.
We conducted our audits in accordance with the standards of the Public Company Accounting Oversight Board (United States). Those standards require that we plan and perform the audit to obtain reasonable assurance about whether the financial statements and financial highlights are free of material misstatement. The Fund is not required to have, nor were we engaged to perform, an audit of its internal control over financial reporting. Our audits included consideration of internal control over financial reporting as a basis for designing audit procedures that are appropriate in the circumstances, but not for the purpose of expressing an opinion on the effectiveness of the Fund's internal control over financial reporting. Accordingly, we express no such opinion. An audit also includes examining, on a test basis, evidence supporting the amounts and disclosures in the financial statements, assessing the accounting principles used and significant estimates made by management, as well as evaluating the overall financial statement presentation. Our procedures included confirmation of securities owned as of October 31, 2014, by correspondence with the custodian and brokers; where replies were not received from brokers, we performed other auditing procedures. We believe that our audits provide a reasonable basis for our opinion.
In our opinion, the financial statements and financial highlights referred to above present fairly, in all material respects, the financial position of Ultra Fund of American Century Mutual Funds, Inc. as of October 31, 2014, the results of its operations for the year then ended, the changes in its net assets for each of the two years in the period then ended, and the financial highlights for each of the periods presented, in conformity with accounting principles generally accepted in the United States of America.
DELOITTE & TOUCHE LLP
Kansas City, Missouri
December 17, 2014
The Board of Directors
The individuals listed below serve as directors of the funds. Each director will continue to serve in this capacity until death, retirement, resignation or removal from office. The board has adopted a mandatory retirement age for directors who are not “interested persons,” as that term is defined in the Investment Company Act (independent directors). Independent directors shall retire by December 31 of the year in which they reach their 75th birthday.
Mr. Thomas is an “interested person” because he currently serves as President and Chief Executive Officer of American Century Companies, Inc. (ACC), the parent company of American Century Investment Management, Inc. (ACIM or the advisor). Mr. Fink is treated as an “interested person” because of his recent employment with ACC and American Century Services, LLC (ACS). The other directors (more than three-fourths of the total number) are independent. They are not employees, directors or officers of, and have no financial interest in, ACC or any of its wholly owned, direct or indirect, subsidiaries, including ACIM, American Century Investment Services, Inc. (ACIS) and ACS, and they do not have any other affiliations, positions, or relationships that would cause them to be considered “interested persons” under the Investment Company Act. The directors serve in this capacity for seven (in the case of Mr. Thomas, 15) registered investment companies in the American Century Investments family of funds.
The following table presents additional information about the directors. The mailing address for each director is 4500 Main Street, Kansas City, Missouri 64111.
|
| | | | | |
Name
(Year of Birth) | Position(s) Held with Funds | Length of Time Served | Principal Occupation(s) During Past 5 Years | Number of American Century Portfolios Overseen by Director | Other Directorships Held During Past
5 Years |
| Independent Directors | | | | |
Thomas A. Brown
(1940) | Director | Since 1980 | Managing Member, Associated Investments, LLC (real estate investment company); Brown Cascade Properties, LLC (real estate investment company) (2001 to 2009) | 73 | None |
Andrea C. Hall
(1945) | Director | Since 1997 | Retired | 73 | None |
Jan M. Lewis
(1957) | Director | Since 2011 | Retired; President and Chief Executive Officer, Catholic Charities of Northeast Kansas (human services organization) (2006 to 2013) | 73 | None |
James A. Olson
(1942) | Director and Chairman of the Board | Since 2007 (Chairman since 2014) | Member, Plaza Belmont LLC (private equity fund manager) | 73 | Saia, Inc. (2002 to 2012) and EPR Properties (2003 to 2013) |
|
| | | | | |
Name
(Year of Birth) | Position(s) Held with Funds | Length of Time Served | Principal Occupation(s) During Past 5 Years | Number of American Century Portfolios Overseen by Director | Other Directorships Held During Past
5 Years |
| Independent Directors | | | | |
M. Jeannine Strandjord
(1945) | Director | Since 1994 | Retired | 73 | Euronet Worldwide Inc.; Charming Shoppes, Inc. (2006 to 2010); and DST Systems Inc. (1996 to 2012) |
John R. Whitten
(1946) | Director | Since 2008 | Retired | 73 | Rudolph Technologies, Inc. |
Stephen E. Yates
(1948) | Director | Since 2012 | Retired; Executive Vice President, Technology & Operations, KeyCorp. (computer services) (2004 to 2010) | 73 | Applied Industrial Technologies, Inc. (2001 to 2010) |
| Interested Directors | | | | |
Barry Fink
(1955) | Director | Since 2012 | Retired; Executive Vice President, ACC (September 2007 to February 2013); President, ACS (October 2007 to February 2013); Chief Operating Officer, ACC (September 2007 to November 2012) | 73 | None |
Jonathan S. Thomas
(1963) | Director and President | Since 2007 | President and Chief Executive Officer, ACC (March 2007 to present). Also serves as Chief Executive Officer, ACS; Executive Vice President, ACIM; Director, ACC, ACIM and other ACC subsidiaries | 118 | BioMed Valley Discoveries, Inc. |
The Statement of Additional Information has additional information about the fund's directors and is available without charge, upon request, by calling 1-800-345-2021.
Officers
The following table presents certain information about the executive officers of the funds. Each officer serves as an officer for each of the 15 investment companies in the American Century family of funds, unless otherwise noted. No officer is compensated for his or her service as an officer of the funds. The listed officers are interested persons of the funds and are appointed or re-appointed on an annual basis. The mailing address for each officer listed below is 4500 Main Street, Kansas City, Missouri 64111.
|
| | |
Name (Year of Birth) | Offices with the Funds | Principal Occupation(s) During the Past Five Years |
Jonathan S.
Thomas
(1963) | Director and
President
since 2007 | President and Chief Executive Officer, ACC (March 2007 to present). Also serves as Chief Executive Officer, ACS; Executive Vice President, ACIM; Director, ACC, ACIM and other ACC subsidiaries |
Amy D. Shelton
(1964) | Chief Compliance
Officer since 2014 | Chief Compliance Officer, American Century funds, (March 2014 to present); Chief Compliance Officer, ACIM (February 2014 to present); Chief Compliance Officer, ACIS (October 2009 to present); Vice President, Client Interactions and Marketing, ACIS (February 2013 to January 2014); Director, Client Interactions and Marketing, ACIS (June 2007 to January 2013). Also serves as Vice President, ACIS |
Charles A.
Etherington
(1957) | General Counsel
since 2007 and
Senior Vice
President since 2006 | Attorney, ACC (February 1994 to present); Vice President, ACC (November 2005 to present); General Counsel, ACC (March 2007 to present). Also serves as General Counsel, ACIM, ACS, ACIS and other ACC subsidiaries; and Senior Vice President, ACIM and ACS |
C. Jean Wade
(1964) | Vice President,
Treasurer and
Chief Financial
Officer since 2012 | Vice President, ACS (February 2000 to present) |
Robert J.
Leach
(1966) | Vice President
since 2006 and
Assistant Treasurer
since 2012 | Vice President, ACS (February 2000 to present) |
David H.
Reinmiller
(1963) | Vice President
since 2000 | Attorney, ACC (January 1994 to present); Associate General Counsel, ACC (January 2001 to present). Also serves as Vice President, ACIM and ACS |
Ward D.
Stauffer
(1960) | Secretary
since 2005 | Attorney, ACC (June 2003 to present) |
|
|
| Approval of Management Agreement |
At a meeting held on June 18, 2014, the Fund’s Board of Directors unanimously approved the renewal of the management agreement pursuant to which American Century Investment Management, Inc. (the “Advisor”) acts as the investment advisor for the Fund. Under Section 15(c) of the Investment Company Act, contracts for investment advisory services are required to be reviewed, evaluated, and approved by a majority of a fund’s directors (the “Directors”), including a majority of the independent Directors, each year.
Prior to its consideration of the renewal of the management agreement, the Board requested and reviewed extensive data and information compiled by the Advisor and certain independent providers of evaluation data concerning the Fund and the services provided to the Fund by the Advisor. This review was in addition to the oversight and evaluation undertaken by the Board and its committees on a continuous basis and the information received was supplemental to the extensive information that the Board and its committees receive and consider throughout the year.
In connection with its consideration of the renewal of the management agreement, the Board’s review and evaluation of the services provided by the Advisor included, but was not limited to, the following:
| |
| • | the nature, extent, and quality of investment management, shareholder services, and other services provided by the Advisor to the Fund; |
| |
| • | the wide range of other programs and services the Advisor provides to the Fund and its shareholders on a routine and non-routine basis; |
| |
| • | the Fund’s investment performance compared to appropriate benchmarks and/or a peer group of other mutual funds with similar investment objectives and strategies; |
| |
| • | the cost of owning the Fund compared to the cost of owning similar funds; |
| |
| • | the Advisor’s compliance policies, procedures, and regulatory experience; |
| |
| • | financial data showing the cost of services provided to the Fund, the profitability of the Fund to the Advisor, and the overall profitability of the Advisor; |
| |
| • | possible economies of scale associated with the Advisor’s management of the Fund and other accounts under its management; |
| |
| • | the services provided and charges to other investment management clients of the Advisor; |
| |
| • | acquired fund fees and expenses; and |
| |
| • | any collateral benefits derived by the Advisor from the management of the Fund. |
In keeping with its practice, the Board held two in-person meetings and one telephonic meeting to review and discuss the information provided. The independent Directors also had the benefit of the advice of their independent counsel throughout the process.
Factors Considered
The Directors considered all of the information provided by the Advisor, the independent data providers, and independent counsel, and evaluated such information for the Fund. In connection with their review, the Directors did not identify any single factor as being all-important or controlling, and each Director may have attributed different levels of importance to different factors. In deciding to renew the management agreement, the Board based its decision on a number of factors, including the following:
Nature, Extent and Quality of Services — Generally. Under the management agreement, the Advisor is responsible for providing or arranging for all services necessary for the operation of the Fund. The Board noted that under the management agreement, the Advisor provides or arranges at its own expense a wide variety of services including:
| |
| • | constructing and designing the Fund |
| |
| • | portfolio research and security selection |
| |
| • | initial capitalization/funding |
| |
| • | daily valuation of the Fund’s portfolio |
| |
| • | shareholder servicing and transfer agency, including shareholder confirmations, recordkeeping, and communications |
| |
| • | legal services (except the independent Directors’ counsel) |
| |
| • | regulatory and portfolio compliance |
| |
| • | marketing and distribution (except Rule 12b-1 plans) |
The Board noted that many of these services have expanded over time both in terms of quantity and complexity in response to shareholder demands, competition in the industry, changing distribution channels, and the changing regulatory environment.
Investment Management Services. The nature of the investment management services provided to the Fund is quite complex and allows Fund shareholders access to professional money management, instant diversification of their investments within an asset class, the opportunity to easily diversify among asset classes by investing in or exchanging among various American Century Investments funds, and liquidity. In evaluating investment performance, the Board expects the Advisor to manage the Fund in accordance with its investment objectives and approved strategies. Further, the Directors recognize that the Advisor has an obligation to monitor trading activities, and in particular to seek the best execution of fund trades, and to evaluate the use of and payment for research. In providing these services, the Advisor utilizes teams of investment professionals (portfolio managers, analysts, research assistants, and securities traders) who require extensive information technology, research, training, compliance and other systems to conduct their business. The Board, directly and through its Fund Performance Review Committee, regularly reviews investment performance information for the Fund, together with comparative information for appropriate benchmarks and/or peer groups of similarly-managed funds, over different time horizons. The Directors also review detailed performance information during the management agreement approval process. If performance concerns are identified, the Fund receives special reviews until performance improves, during which the Board discusses with the Advisor the reasons for such results (e.g., market conditions, security selection) and any efforts being undertaken to improve performance. The Fund’s performance was above its benchmark for the one-, three-, and five-year periods and slightly below its benchmark for the ten-year period reviewed by the Board. The Board found the investment management services provided by the Advisor to the Fund to be satisfactory and consistent with the management agreement.
Shareholder and Other Services. Under the management agreement, the Advisor provides the Fund with a comprehensive package of transfer agency, shareholder, and other services. The Board, directly and through various committees of the Board, regularly reviews reports and evaluations of such services at its regular meetings. These reports include, but are not limited to, information regarding the operational efficiency and accuracy of the shareholder and transfer agency services provided, staffing levels, shareholder satisfaction (as measured by external as well as internal sources), technology support, new products and services offered to Fund shareholders, securities trading activities, portfolio valuation services, auditing services, and legal and operational compliance activities. Certain aspects of shareholder and transfer agency service level efficiency and the quality of securities trading activities are measured by independent third party providers and are presented in comparison to other fund groups not managed by the Advisor. The Board
found the services provided by the Advisor to the Fund under the management agreement to be competitive and of high quality.
Costs of Services and Profitability. The Advisor provides detailed information concerning its cost of providing various services to the Fund, its profitability in managing the Fund (pre- and post-distribution), its overall profitability, and its financial condition. The Directors have reviewed with the Advisor the methodology used to prepare this financial information. The financial information regarding the Advisor is considered in evaluating the Advisor’s financial condition, its ability to continue to provide services under the management agreement, and the reasonableness of the current management fee. The Board concluded that the Advisor’s profits were reasonable in light of the services provided to the Fund.
Ethics. The Board generally considers the Advisor’s commitment to providing quality services to shareholders and to conducting its business ethically. They noted that the Advisor’s practices generally meet or exceed industry best practices.
Economies of Scale. The Board also reviewed information provided by the Advisor regarding the possible existence of economies of scale in connection with the management of the Fund. The Board concluded that economies of scale are difficult to measure and predict with precision, especially on a fund-by-fund basis. The Board concluded that the Advisor is appropriately sharing economies of scale through its competitive fee structure, offering competitive fees from fund inception, and through reinvestment in its business to provide shareholders additional content and services.
Comparison to Other Funds’ Fees. The management agreement provides that the Fund pays the Advisor a single, all-inclusive (or unified) management fee for providing all services necessary for the management and operation of the Fund, other than brokerage expenses, taxes, interest, extraordinary expenses, and the fees and expenses of the Fund’s independent directors (including their independent legal counsel) and expenses incurred in connection with the provision of shareholder services and distribution services under a plan adopted pursuant to Rule 12b-1 under the 1940 Act. Under the unified fee structure, the Advisor is responsible for providing all investment advisory, custody, audit, administrative, compliance, recordkeeping, marketing and shareholder services, or arranging and supervising third parties to provide such services. By contrast, most other funds are charged a variety of fees, including an investment advisory fee, a transfer agency fee, an administrative fee, distribution charges and other expenses. Other than their investment advisory fees and any applicable Rule 12b-1 distribution fees, all other components of the total fees charged by these other funds may be increased without shareholder approval. The Board believes the unified fee structure is a benefit to Fund shareholders because it clearly discloses to shareholders the cost of owning Fund shares, and, since the unified fee cannot be increased without a vote of Fund shareholders, it shifts to the Advisor the risk of increased costs of operating the Fund and provides a direct incentive to minimize administrative inefficiencies. Part of the Board’s analysis of fee levels involves reviewing certain evaluative data compiled by an independent provider comparing the Fund’s unified fee to the total expense ratios of its peers. The unified fee charged to shareholders of the Fund was below the median of the total expense ratios of the Fund’s peer expense universe and was within the range of its peer expense group. The Board and the Advisor agreed to certain adjustments regarding the breakpoints in the Fund’s unified management fee schedule, including changing the number of breakpoints and the investment amount that applies to each breakpoint, beginning August 1, 2014. The Board concluded that the management fee paid by the Fund to the Advisor under the management agreement is reasonable in light of the services provided to the Fund.
Comparison to Fees and Services Provided to Other Clients of the Advisor. The Board also requested and received information from the Advisor concerning the nature of the services, fees, costs and profitability of its advisory services to advisory clients other than the Fund. They observed that these varying types of client accounts require different services and involve different regulatory and entrepreneurial risks than the management of the Fund. The Board analyzed this information and concluded that the fees charged and services provided to the Fund were reasonable by comparison.
Collateral or “Fall-Out” Benefits Derived by the Advisor. The Board considered the existence of collateral benefits the Advisor may receive as a result of its relationship with the Fund. They concluded that the Advisor’s primary business is managing mutual funds and it generally does not use fund or shareholder information to generate profits in other lines of business, and therefore does not derive any significant collateral benefits from them. The Board noted that the Advisor receives proprietary research from broker-dealers that execute fund portfolio transactions and concluded that this research is likely to benefit Fund shareholders. The Board also determined that the Advisor is able to provide investment management services to certain clients other than the Fund, at least in part, due to its existing infrastructure built to serve the fund complex. The Board concluded, however, that the assets of those other clients are not material to the analysis and, where applicable, may be included with the assets of the Fund to determine breakpoints in the management fee schedule.
Existing Relationship. The Board also considered whether there was any reason for not continuing the existing arrangement with the Advisor. In this regard, the Board was mindful of the potential disruptions of the Fund’s operations and various risks, uncertainties, and other effects that could occur as a result of a decision not to continue such relationship. In particular, the Board recognized that most shareholders have invested in the Fund on the strength of the Advisor’s industry standing and reputation and in the expectation that the Advisor will have a continuing role in providing advisory services to the Fund.
Conclusion of the Directors. As a result of this process, the Board, including all of the independent Directors, taking into account all of the factors discussed above and the information provided by the Advisor and others, concluded that the management agreement between the Fund and the Advisor is fair and reasonable in light of the services provided and should be renewed.
Retirement Account Information
As required by law, distributions you receive from certain IRAs are subject to federal income tax withholding, unless you elect not to have withholding apply. Tax will be withheld on the total amount withdrawn even though you may be receiving amounts that are not subject to withholding, such as nondeductible contributions. In such case, excess amounts of withholding could occur. You may adjust your withholding election so that a greater or lesser amount will be withheld.
If you don’t want us to withhold on this amount, you must notify us to not withhold the federal income tax. You may notify us in writing or in certain situations by telephone or through other electronic means. For systematic withdrawals, your withholding election will remain in effect until revoked or changed by filing a new election. You have the right to revoke your election at any time.
Remember, even if you elect not to have income tax withheld, you are liable for paying income tax on the taxable portion of your withdrawal. If you elect not to have income tax withheld or you don’t have enough income tax withheld, you may be responsible for payment of estimated tax. You may incur penalties under the estimated tax rules if your withholding and estimated tax payments are not sufficient. You can reduce or defer the income tax on a distribution by directly or indirectly rolling such distribution over to another IRA or eligible plan. You should consult your tax advisor for additional information.
State tax will be withheld if, at the time of your distribution, your address is within one of the mandatory withholding states and you have federal income tax withheld (or as otherwise required by state law). State taxes will be withheld from your distribution in accordance with the respective state rules.
Distributions you receive from 403(b), 457 and qualified plans are subject to special tax and withholding rules. Your plan administrator or plan sponsor is required to provide you with a special tax notice explaining those rules at the time you request a distribution. If applicable, federal and/or state taxes may be withheld from your distribution amount.
Proxy Voting Policies
A description of the policies that the fund's investment advisor uses in exercising the voting rights associated with the securities purchased and/or held by the fund is available without charge, upon request, by calling 1-800-345-2021. It is also available on the "About Us" page of American Century Investments’ website at americancentury.com and on the Securities and Exchange Commission’s website at sec.gov. Information regarding how the investment advisor voted proxies relating to portfolio securities during the most recent 12-month period ended June 30 is available on the "About Us" page at americancentury.com. It is also available at sec.gov.
Quarterly Portfolio Disclosure
The fund files its complete schedule of portfolio holdings with the Securities and Exchange Commission (SEC) for the first and third quarters of each fiscal year on Form N-Q. The fund’s Forms N-Q are available on the SEC’s website at sec.gov, and may be reviewed and copied at the SEC’s Public Reference Room in Washington, DC. Information on the operation of the Public Reference Room may be obtained by calling 1-800-SEC-0330. The fund also makes its complete schedule of portfolio holdings for the most recent quarter of its fiscal year available on its
website at americancentury.com and, upon request, by calling 1-800-345-2021.
Other Tax Information
The following information is provided pursuant to provisions of the Internal Revenue Code.
The fund hereby designates up to the maximum amount allowable as qualified dividend income for the fiscal year ended October 31, 2014.
For corporate taxpayers, the fund hereby designates $23,289,876, or up to the maximum amount allowable, of ordinary income distributions paid during the fiscal year ended October 31, 2014 as qualified for the corporate dividends received deduction.
The fund hereby designates $298,662,837, or up to the maximum amount allowable, as long-term capital gain distributions for the fiscal year ended October 31, 2014.
|
| | |
| |
| | | |
| Contact Us | americancentury.com | |
| Automated Information Line | 1-800-345-8765 | |
| Investor Services Representative | 1-800-345-2021 or 816-531-5575 | |
| Investors Using Advisors | 1-800-378-9878 | |
| Business, Not-For-Profit, Employer-Sponsored Retirement Plans | 1-800-345-3533 | |
| Banks and Trust Companies, Broker-Dealers, Financial Professionals, Insurance Companies | 1-800-345-6488 | |
| Telecommunications Relay Service for the Deaf | 711 | |
| | | |
| American Century Mutual Funds, Inc. | |
| | | |
Investment Advisor: American Century Investment Management, Inc. Kansas City, Missouri | |
| | | |
| This report and the statements it contains are submitted for the general information of our shareholders. The report is not authorized for distribution to prospective investors unless preceded or accompanied by an effective prospectus. | |
| | | |
©2014 American Century Proprietary Holdings, Inc. All rights reserved.
CL-ANN-84004 1412 | |
|
| |
| ANNUAL REPORT | OCTOBER 31, 2014 |
Veedot® Fund
|
| |
| President’s Letter | |
| Performance | |
| Portfolio Commentary | |
| Fund Characteristics | |
| Shareholder Fee Example | |
| Schedule of Investments | |
| Statement of Assets and Liabilities | |
| Statement of Operations | |
| Statement of Changes in Net Assets | |
| Notes to Financial Statements | |
| Financial Highlights | |
| Report of Independent Registered Public Accounting Firm | |
| Management | |
| Approval of Management Agreement | |
| Additional Information | |
Any opinions expressed in this report reflect those of the author as of the date of the report, and do not necessarily represent the opinions of American Century Investments® or any other person in the American Century Investments organization. Any such opinions are subject to change at any time based upon market or other conditions and American Century Investments disclaims any responsibility to update such opinions. These opinions may not be relied upon as investment advice and, because investment decisions made by American Century Investments funds are based on numerous factors, may not be relied upon as an indication of trading intent on behalf of any American Century Investments fund. Security examples are used for representational purposes only and are not intended as recommendations to purchase or sell securities. Performance information for comparative indices and securities is provided to American Century Investments by third party vendors. To the best of American Century Investments’ knowledge, such information is accurate at the time of printing.
|
| |
| Dear Investor:
Thank you for reviewing this annual report for the 12 months ended October 31, 2014. It provides investment performance and portfolio information for the reporting period, plus longer-term historical performance data.
Annual reports remain important vehicles for conveying information about fund returns, including market and economic factors that affected performance during the reporting period. For additional, updated investment and market insights, we encourage you to visit our website, americancentury.com. |
| Jonathan Thomas |
Favorable Fiscal Year for U.S. Stocks and Bonds
Mostly stimulative monetary policies by central banks and expectations of longer-term economic improvement, interspersed with concerns about nearer-term weaker-than-expected global economic data and geopolitical conflicts, helped drive financial market returns during the reporting period. We believe the combination of longer-term optimism about U.S. economic growth, low costs of capital, and continued central bank stimulus (even as the U.S. Federal Reserve’s latest monthly bond purchase program ended) helped persuade investors to seek risk and yield, which benefited U.S. stocks and bonds. The S&P 500 Index gained 17.27% during the 12 months. The 30-year U.S. Treasury bond was close behind, returning 15.44%, according to Barclays. U.S. real estate investment trusts (REITs), whose shares combine performance attributes of stocks and bonds, benefited from both—the MSCI U.S. REIT Index advanced 19.19%.
U.S. market benchmark returns generally outpaced their non-U.S. counterparts. The U.S. was perceived by investors as a relative bastion of growth, stability, and potentially attractive yields compared with most of the rest of the world, so capital flows generally favored U.S. assets. These capital flows, along with weaker-than-expected global growth, lower-than-expected global inflation, and falling commodity and energy prices, helped keep long-term interest rates and other corporate costs low. U.S. stocks just completed a solid third-quarter earnings reporting season, though questions remain about next year’s revenues, given this year’s slowdown in global economic growth and concerns about how far it could extend into 2015.
We believe continuing global economic and geopolitical uncertainties could continue to support the relative appeal of U.S. assets in coming months. But the end of the U.S. Federal Reserve’s monthly bond-buying program and the still-looming possibility of higher interest rates in 2015 point to potential U.S. market volatility ahead. In this environment, we continue to believe in a disciplined, diversified, long-term investment approach, using professionally managed stock and bond portfolios for meeting financial goals. We appreciate your continued trust in us.
Sincerely,
Jonathan Thomas
President and Chief Executive Officer
American Century Investments
|
| | | | | | |
| Total Returns as of October 31, 2014 |
| | | | Average Annual Returns | |
| | Ticker Symbol | 1 year | 5 years | 10 years | Since Inception | Inception Date |
| Investor Class | AMVIX | 12.96% | 17.66% | 7.70% | 5.18% | 11/30/99 |
| Russell 3000 Index | — | 16.07% | 17.00% | 8.55% | 5.03% | — |
| Institutional Class | AVDIX | 13.13% | 17.92% | 7.91% | 4.15% | 8/1/00 |
|
|
| Growth of $10,000 Over 10 Years |
| $10,000 investment made October 31, 2004 |
| Performance for other share classes will vary due to differences in fee structure. |
|
| |
| Value on October 31, 2014 |
| | Investor Class — $20,999 |
| |
| | Russell 3000 Index — $22,727 |
| |
|
| |
| Total Annual Fund Operating Expenses |
| Investor Class | Institutional Class |
| 1.27% | 1.07% |
The total annual fund operating expenses shown is as stated in the fund’s prospectus current as of the date of this report. The prospectus may vary from the expense ratio shown elsewhere in this report because it is based on a different time period, includes acquired fund fees and expenses, and, if applicable, does not include fee waivers or expense reimbursements.
Data presented reflect past performance. Past performance is no guarantee of future results. Current performance may be higher or lower than the performance shown. Investment return and principal value will fluctuate, and redemption value may be more or less than original cost. Data assumes reinvestment of dividends and capital gains, and none of the charts reflect the deduction of taxes that a shareholder would pay on fund distributions or the redemption of fund shares. To obtain performance data current to the most recent month end, please call 1-800-345-2021 or visit americancentury.com. For additional information about the fund, please consult the prospectus.
Portfolio Managers: John Small, Jr. and Stephen Pool
Performance Summary
Veedot returned 12.96%* for the 12 months ended October 31, 2014, lagging the 16.07% return of the portfolio’s benchmark, the Russell 3000 Index.
U.S. stock indices delivered solid returns during the reporting period. Within the Russell 3000 Index, health care was the top-performing sector on a total-return basis, gaining nearly 30%. Information technology, utilities, and financials stocks also performed well and outpaced the benchmark average. Energy was the weakest sector, posting only a modest gain. Telecommunication services and consumer discretionary stocks registered single-digit returns as well.
In this environment, Veedot’s highly systematic investment process delivered positive portfolio returns but trailed its benchmark. The fund received the best contributions from health care, financials, and industrials stocks, while telecommunication services, energy, materials, and utilities generated negative or only slightly positive contributions. Relative to the Russell benchmark, stock selection in information technology was the chief detractor. Stock decisions in materials and energy also weighed on results. Stock selection in industrials, health care, and consumer staples benefited relative results.
Information Technology Stocks Led Detractors
Stock choices in the information technology sector detracted from relative results, especially in the software and IT services industries. The fund’s largest detractor overall was Apple. The portfolio had exposure to the computer and peripherals giant but less than the benchmark. The company benefited from anticipation of and eventual release of new products, including the iPhone 6, Apple Pay mobile payment service, and forthcoming Apple Watch. Two cloud-based software firms detracted. Ultimate Software Group, which develops human resources software for business, declined sharply earlier in 2014, though it rebounded somewhat after reporting better results at midyear. ServiceNow, which automates IT support, followed a similar path. None of these stocks were in the portfolio at the end of the period.
The materials sector also detracted from relative results, led by holdings in the metals and mining and chemicals industries. South Korean steelmaker POSCO suffered from China’s slowing economy. The stock was eliminated from the portfolio. Dow Chemical performed well for much of the year but declined late in the period following an adverse legal ruling in a lawsuit concerning pricing in the polyurethane business.
Other major detractors included several holdings in the energy sector, including SM Energy, Laredo Petroleum, and Occidental Petroleum. Energy producers and exploration companies have been hurt by declining oil prices. SM Energy and Laredo Petroleum were not in the portfolio at the end of the period.
| |
| * | All fund returns referenced in this commentary are for Investor Class shares. Performance for other share classes will vary due to differences in fee structure; when Investor Class performance exceeds that of the fund’s benchmark, other share classes may not. See page 3 for returns for all share classes. |
Industrials Stocks Were Key Contributors
The fund benefited from holdings in the industrials sector due primarily to stock selection in the aerospace and defense and industrial conglomerate industries. Shares of diversified defense firm General Dynamics rose steadily this year, aided by its business jet unit and restructuring of its core businesses. Not owning General Electric, a component of the benchmark, helped fund results.
Stock selection in the health care sector also helped relative results. Providence Service, which provides government-sponsored social services, was the fund’s overall top contributor, benefiting from increased government spending in the industry. We exited our position in this stock prior to period end. WellPoint also performed well in the good environment for health care managers as the Affordable Care Act gains traction.
Stock selection in the consumer staples sector was a significant contributor, led by Monster Beverage, a maker of energy and soft drinks. In the consumer discretionary sector, automotive parts supplier Magna International was among the top contributors for the year. The Ontario-based company benefited from increased sales of new vehicles in North America. The hotels, restaurants, and leisure industry generated solid relative results for the fund, led by overweight positions in pizza chain Papa John’s International and Brinker International, owner of the Chili’s and Maggiano’s restaurants. Papa John’s and Brinker were not in the portfolio at the end of the period.
Outlook
Using a systematic and technically driven process, Veedot examines macroeconomic and company specific information in a complex model to underpin its stock selection process. Looking ahead, we remain confident that its systematic process of fusing macroeconomic and stock-specific factors will continue to successfully identify risk-adjusted opportunities across investment styles and industry sectors.
|
| |
| OCTOBER 31, 2014 | |
| Top Ten Holdings | % of net assets |
| Exxon Mobil Corp. | 1.9% |
| Microsoft Corp. | 1.7% |
| Monster Beverage Corp. | 1.4% |
| Western Digital Corp. | 1.4% |
| Intel Corp. | 1.3% |
| Eli Lilly & Co. | 1.3% |
| Time Warner Cable, Inc. | 1.2% |
| Becton Dickinson and Co. | 1.2% |
| HCI Group, Inc. | 1.2% |
| Kroger Co. (The) | 1.2% |
| | |
| Top Five Industries | % of net assets |
| Oil, Gas and Consumable Fuels | 7.2% |
| Insurance | 4.4% |
| Software | 4.3% |
| Capital Markets | 3.7% |
| Life Sciences Tools and Services | 3.6% |
| | |
| Types of Investments in Portfolio | % of net assets |
| Common Stocks | 99.1% |
| Temporary Cash Investments | 0.9% |
| Other Assets and Liabilities | —* |
*Category is less than 0.05% of total net assets.
Fund shareholders may incur two types of costs: (1) transaction costs, including sales charges (loads) on purchase payments and redemption/exchange fees; and (2) ongoing costs, including management fees; distribution and service (12b-1) fees; and other fund expenses. This example is intended to help you understand your ongoing costs (in dollars) of investing in your fund and to compare these costs with the ongoing cost of investing in other mutual funds.
The example is based on an investment of $1,000 made at the beginning of the period and held for the entire period from May 1, 2014 to October 31, 2014.
Actual Expenses
The table provides information about actual account values and actual expenses for each class. You may use the information, together with the amount you invested, to estimate the expenses that you paid over the period. First, identify the share class you own. Then simply divide your account value by $1,000 (for example, an $8,600 account value divided by $1,000 = 8.6), then multiply the result by the number under the heading “Expenses Paid During Period” to estimate the expenses you paid on your account during this period.
If you hold Investor Class shares of any American Century Investments fund, or Institutional Class shares of the American Century Diversified Bond Fund, in an American Century Investments account (i.e., not a financial intermediary or retirement plan account), American Century Investments may charge you a $12.50 semiannual account maintenance fee if the value of those shares is less than $10,000. We will redeem shares automatically in one of your accounts to pay the $12.50 fee. In determining your total eligible investment amount, we will include your investments in all personal accounts (including American Century Investments Brokerage accounts) registered under your Social Security number. Personal accounts include individual accounts, joint accounts, UGMA/UTMA accounts, personal trusts, Coverdell Education Savings Accounts and IRAs (including traditional, Roth, Rollover, SEP-, SARSEP- and SIMPLE-IRAs), and certain other retirement accounts. If you have only business, business retirement, employer-sponsored or American Century Investments Brokerage accounts, you are currently not subject to this fee. If you are subject to the Account Maintenance Fee, your account value could be reduced by the fee amount.
Hypothetical Example for Comparison Purposes
The table also provides information about hypothetical account values and hypothetical expenses based on the actual expense ratio of each class of your fund and an assumed rate of return of 5% per year before expenses, which is not the actual return of a fund’s share class. The hypothetical account values and expenses may not be used to estimate the actual ending account balance or expenses you paid for the period. You may use this information to compare the ongoing costs of investing in your fund and other funds. To do so, compare this 5% hypothetical example with the 5% hypothetical examples that appear in the shareholder reports of the other funds.
Please note that the expenses shown in the table are meant to highlight your ongoing costs only and do not reflect any transactional costs, such as sales charges (loads) or redemption/exchange fees. Therefore, the table is useful in comparing ongoing costs only, and will not help you determine the relative total costs of owning different funds. In addition, if these transactional costs were included, your costs would have been higher.
|
| | | | |
| Beginning
Account Value
5/1/14 | Ending
Account Value
10/31/14 | Expenses Paid
During Period(1)5/1/14 - 10/31/14 | Annualized
Expense Ratio(1) |
| Actual | | | | |
| Investor Class | $1,000 | $1,057.30 | $6.48 | 1.25% |
| Institutional Class | $1,000 | $1,058.20 | $5.45 | 1.05% |
| Hypothetical | | | | |
| Investor Class | $1,000 | $1,018.90 | $6.36 | 1.25% |
| Institutional Class | $1,000 | $1,019.91 | $5.35 | 1.05% |
| |
| (1) | Expenses are equal to the class's annualized expense ratio listed in the table above, multiplied by the average account value over the period, multiplied by 184, the number of days in the most recent fiscal half-year, divided by 365, to reflect the one-half year period. |
OCTOBER 31, 2014
|
| | | | | |
| | Shares | Value |
| COMMON STOCKS — 99.1% | | |
| Aerospace and Defense — 2.3% | | |
| General Dynamics Corp. | 6,587 |
| $ | 920,599 |
|
| Raytheon Co. | 7,749 |
| 804,966 |
|
| TransDigm Group, Inc. | 2,287 |
| 427,738 |
|
| | | 2,153,303 |
|
| Air Freight and Logistics — 1.1% | | |
| United Parcel Service, Inc., Class B | 10,206 |
| 1,070,711 |
|
| Airlines — 2.4% | | |
| Allegiant Travel Co. | 5,373 |
| 717,134 |
|
| Southwest Airlines Co. | 22,281 |
| 768,249 |
|
Spirit Airlines, Inc.(1) | 10,121 |
| 739,947 |
|
| | | 2,225,330 |
|
| Auto Components — 0.2% | | |
| Magna International, Inc. | 1,988 |
| 196,236 |
|
| Automobiles — 2.0% | | |
| Ford Motor Co. | 56,891 |
| 801,594 |
|
| Toyota Motor Corp. ADR | 8,552 |
| 1,037,785 |
|
| | | 1,839,379 |
|
| Banks — 1.9% | | |
| Hancock Holding Co. | 23,158 |
| 814,930 |
|
| Wells Fargo & Co. | 18,810 |
| 998,623 |
|
| | | 1,813,553 |
|
| Beverages — 1.5% | | |
| Dr Pepper Snapple Group, Inc. | 1,742 |
| 120,633 |
|
Monster Beverage Corp.(1) | 12,777 |
| 1,288,944 |
|
| | | 1,409,577 |
|
| Biotechnology — 0.9% | | |
Gilead Sciences, Inc.(1) | 7,587 |
| 849,744 |
|
| Capital Markets — 3.7% | | |
| AllianceBernstein Holding LP | 33,491 |
| 890,860 |
|
| Blackstone Group LP (The) | 32,441 |
| 977,123 |
|
E*Trade Financial Corp.(1) | 25,670 |
| 572,441 |
|
| Janus Capital Group, Inc. | 69,308 |
| 1,038,927 |
|
| | | 3,479,351 |
|
| Chemicals — 2.2% | | |
| Dow Chemical Co. (The) | 17,957 |
| 887,076 |
|
| Ecolab, Inc. | 8,222 |
| 914,533 |
|
| Mosaic Co. (The) | 5,143 |
| 227,886 |
|
| | | 2,029,495 |
|
| Communications Equipment — 1.9% | | |
| Cisco Systems, Inc. | 41,740 |
| 1,021,378 |
|
Palo Alto Networks, Inc.(1) | 7,438 |
| 786,196 |
|
| | | 1,807,574 |
|
| Consumer Finance — 1.0% | | |
| Capital One Financial Corp. | 11,604 |
| 960,463 |
|
|
| | | | | |
| | Shares | Value |
| Diversified Consumer Services — 0.6% | | |
| Weight Watchers International, Inc. | 21,694 |
| $ | 565,129 |
|
| Diversified Financial Services — 0.9% | | |
Berkshire Hathaway, Inc., Class A(1) | 4 |
| 840,000 |
|
| Diversified Telecommunication Services — 1.2% | | |
| PT Telekomunikasi Indonesia Persero Tbk ADR | 3,245 |
| 147,161 |
|
| Verizon Communications, Inc. | 19,857 |
| 997,814 |
|
| | | 1,144,975 |
|
| Electric Utilities — 1.9% | | |
| Duke Energy Corp. | 11,697 |
| 960,909 |
|
| Exelon Corp. | 22,775 |
| 833,337 |
|
| | | 1,794,246 |
|
| Electronic Equipment, Instruments and Components — 1.2% | | |
| Corning, Inc. | 52,482 |
| 1,072,207 |
|
| Energy Equipment and Services — 0.9% | | |
| National Oilwell Varco, Inc. | 11,665 |
| 847,346 |
|
| Food and Staples Retailing — 2.4% | | |
| Kroger Co. (The) | 20,219 |
| 1,126,400 |
|
| Wal-Mart Stores, Inc. | 14,562 |
| 1,110,644 |
|
| | | 2,237,044 |
|
| Food Products — 2.5% | | |
| General Mills, Inc. | 14,132 |
| 734,299 |
|
Hain Celestial Group, Inc. (The)(1) | 7,317 |
| 792,065 |
|
| Kellogg Co. | 13,293 |
| 850,220 |
|
| | | 2,376,584 |
|
| Health Care Equipment and Supplies — 1.2% | | |
| Becton Dickinson and Co. | 8,993 |
| 1,157,399 |
|
| Health Care Providers and Services — 3.3% | | |
| Aetna, Inc. | 13,070 |
| 1,078,406 |
|
Express Scripts Holding Co.(1) | 12,893 |
| 990,440 |
|
| WellPoint, Inc. | 8,027 |
| 1,016,941 |
|
| | | 3,085,787 |
|
| Hotels, Restaurants and Leisure — 2.2% | | |
Hyatt Hotels Corp., Class A(1) | 18,982 |
| 1,124,114 |
|
| McDonald's Corp. | 9,681 |
| 907,400 |
|
| | | 2,031,514 |
|
| Household Products — 1.4% | | |
| Colgate-Palmolive Co. | 12,148 |
| 812,458 |
|
| Kimberly-Clark Corp. | 4,674 |
| 534,098 |
|
| | | 1,346,556 |
|
| Industrial Conglomerates — 2.3% | | |
| 3M Co. | 6,992 |
| 1,075,160 |
|
| Roper Industries, Inc. | 7,024 |
| 1,111,899 |
|
| | | 2,187,059 |
|
| Insurance — 4.4% | | |
| ACE Ltd. | 9,219 |
| 1,007,637 |
|
| Aflac, Inc. | 16,221 |
| 968,880 |
|
| Hanover Insurance Group, Inc. (The) | 14,510 |
| 971,300 |
|
| HCI Group, Inc. | 22,356 |
| 1,136,579 |
|
| | | 4,084,396 |
|
|
| | | | | |
| | Shares | Value |
| Internet and Catalog Retail — 1.2% | | |
Amazon.com, Inc.(1) | 2,333 |
| $ | 712,638 |
|
Orbitz Worldwide, Inc.(1) | 50,436 |
| 417,106 |
|
| | | 1,129,744 |
|
| Internet Software and Services — 3.3% | | |
Baidu, Inc. ADR(1) | 1,538 |
| 367,228 |
|
| Equinix, Inc. | 4,748 |
| 991,857 |
|
Facebook, Inc., Class A(1) | 12,098 |
| 907,229 |
|
Google, Inc., Class A(1) | 1,362 |
| 773,439 |
|
| | | 3,039,753 |
|
| IT Services — 2.8% | | |
| International Business Machines Corp. | 5,659 |
| 930,339 |
|
| MAXIMUS, Inc. | 20,808 |
| 1,008,356 |
|
NeuStar, Inc., Class A(1) | 26,031 |
| 687,479 |
|
| | | 2,626,174 |
|
| Life Sciences Tools and Services — 3.6% | | |
| Bio-Techne Corp. | 8,444 |
| 768,826 |
|
Charles River Laboratories International, Inc.(1) | 17,262 |
| 1,090,268 |
|
PAREXEL International Corp.(1) | 14,747 |
| 800,910 |
|
| PerkinElmer, Inc. | 15,976 |
| 693,678 |
|
| | | 3,353,682 |
|
| Machinery — 1.0% | | |
| Caterpillar, Inc. | 9,177 |
| 930,640 |
|
| Media — 2.3% | | |
| Comcast Corp., Class A | 17,222 |
| 953,238 |
|
| Time Warner Cable, Inc. | 7,921 |
| 1,166,050 |
|
| | | 2,119,288 |
|
| Metals and Mining — 0.6% | | |
| Freeport-McMoRan, Inc. | 11,788 |
| 335,958 |
|
| Vale SA ADR | 20,893 |
| 210,810 |
|
| | | 546,768 |
|
| Multi-Utilities — 0.8% | | |
| Dominion Resources, Inc. | 10,949 |
| 780,664 |
|
| Multiline Retail — 0.7% | | |
| Macy's, Inc. | 11,167 |
| 645,676 |
|
| Oil, Gas and Consumable Fuels — 7.2% | | |
| Anadarko Petroleum Corp. | 10,080 |
| 925,142 |
|
| Chesapeake Energy Corp. | 20,327 |
| 450,853 |
|
| Chevron Corp. | 6,733 |
| 807,623 |
|
| Exxon Mobil Corp. | 18,085 |
| 1,749,000 |
|
| Kinder Morgan, Inc. | 20,514 |
| 793,892 |
|
| Marathon Oil Corp. | 24,482 |
| 866,663 |
|
| Occidental Petroleum Corp. | 9,356 |
| 832,029 |
|
| Phillips 66 | 4,505 |
| 353,643 |
|
| | | 6,778,845 |
|
| Paper and Forest Products — 0.7% | | |
| International Paper Co. | 12,041 |
| 609,515 |
|
| Pharmaceuticals — 3.4% | | |
| Eli Lilly & Co. | 17,888 |
| 1,186,511 |
|
Hospira, Inc.(1) | 20,185 |
| 1,083,934 |
|
|
| | | | | |
| | Shares | Value |
| Merck & Co., Inc. | 15,606 |
| $ | 904,212 |
|
| | | 3,174,657 |
|
| Professional Services — 1.1% | | |
IHS, Inc., Class A(1) | 7,594 |
| 995,042 |
|
| Real Estate Investment Trusts (REITs) — 1.6% | | |
| Columbia Property Trust, Inc. | 18,634 |
| 470,136 |
|
| Simon Property Group, Inc. | 5,691 |
| 1,019,884 |
|
| | | 1,490,020 |
|
| Real Estate Management and Development — 1.1% | | |
| Jones Lang LaSalle, Inc. | 7,777 |
| 1,051,528 |
|
| Road and Rail — 1.0% | | |
| Union Pacific Corp. | 7,992 |
| 930,668 |
|
| Semiconductors and Semiconductor Equipment — 2.8% | | |
Advanced Energy Industries, Inc.(1) | 33,068 |
| 654,085 |
|
Canadian Solar, Inc.(1) | 7,061 |
| 225,246 |
|
| Intel Corp. | 37,131 |
| 1,262,825 |
|
| Skyworks Solutions, Inc. | 7,749 |
| 451,302 |
|
| | | 2,593,458 |
|
| Software — 4.3% | | |
Electronic Arts, Inc.(1) | 13,584 |
| 556,537 |
|
| Microsoft Corp. | 34,826 |
| 1,635,081 |
|
| Oracle Corp. | 24,202 |
| 945,088 |
|
VMware, Inc., Class A(1) | 10,706 |
| 894,700 |
|
| | | 4,031,406 |
|
| Specialty Retail — 3.3% | | |
| Gap, Inc. (The) | 24,777 |
| 938,801 |
|
| Penske Automotive Group, Inc. | 21,463 |
| 970,986 |
|
Select Comfort Corp.(1) | 17,393 |
| 446,826 |
|
Ulta Salon Cosmetics & Fragrance, Inc.(1) | 6,315 |
| 762,915 |
|
| | | 3,119,528 |
|
| Technology Hardware, Storage and Peripherals — 3.3% | | |
| SanDisk Corp. | 11,678 |
| 1,099,367 |
|
| Seagate Technology plc | 12,020 |
| 755,217 |
|
| Western Digital Corp. | 12,903 |
| 1,269,268 |
|
| | | 3,123,852 |
|
| Textiles, Apparel and Luxury Goods — 1.5% | | |
Michael Kors Holdings Ltd.(1) | 8,124 |
| 638,465 |
|
| PVH Corp. | 7,024 |
| 803,195 |
|
| | | 1,441,660 |
|
| Thrifts and Mortgage Finance — 2.0% | | |
| Capitol Federal Financial, Inc. | 72,796 |
| 932,517 |
|
| TFS Financial Corp. | 61,391 |
| 917,181 |
|
| | | 1,849,698 |
|
| Tobacco — 1.1% | | |
| Philip Morris International, Inc. | 11,260 |
| 1,002,253 |
|
| Wireless Telecommunication Services — 0.9% | | |
| SK Telecom Co. Ltd. ADR | 30,181 |
| 838,730 |
|
TOTAL COMMON STOCKS (Cost $81,549,137) | | 92,808,207 |
|
|
| | | | | |
| | Shares | Value |
| TEMPORARY CASH INVESTMENTS — 0.9% | | |
| Repurchase Agreement, Bank of America Merrill Lynch, (collateralized by various U.S. Treasury obligations, 1.375% - 2.625%, 12/31/14 - 2/28/19, valued at $188,412), in a joint trading account at 0.07%, dated 10/31/14, due 11/3/14 (Delivery value $184,747) | | $ | 184,746 |
|
| Repurchase Agreement, Credit Suisse First Boston, Inc., (collateralized by various U.S. Treasury obligations, 0.25%, 10/15/15, valued at $75,380), in a joint trading account at 0.04%, dated 10/31/14, due 11/3/14 (Delivery value $73,898) | | 73,898 |
|
| Repurchase Agreement, Goldman Sachs & Co., (collateralized by various U.S. Treasury obligations, 0.125%, 12/31/14, valued at $150,905), in a joint trading account at 0.03%, dated 10/31/14, due 11/3/14 (Delivery value $147,797) | | 147,797 |
|
| SSgA U.S. Government Money Market Fund, Class N | 406,533 |
| 406,533 |
|
TOTAL TEMPORARY CASH INVESTMENTS (Cost $812,974) | | 812,974 |
|
TOTAL INVESTMENT SECURITIES — 100.0% (Cost $82,362,111) | | 93,621,181 |
|
OTHER ASSETS AND LIABILITIES† | | (27,765 | ) |
| TOTAL NET ASSETS — 100.0% | | $ | 93,593,416 |
|
|
| | | | | | | | | | |
| FORWARD FOREIGN CURRENCY EXCHANGE CONTRACTS |
| Currency Purchased | Currency Sold | Counterparty | Settlement Date | Unrealized Appreciation
(Depreciation) |
| USD | 878,069 |
| JPY | 94,856,426 |
| Credit Suisse AG | 11/28/14 | $ | 33,441 |
|
| USD | 20,127 |
| JPY | 2,191,110 |
| Credit Suisse AG | 11/28/14 | 617 |
|
| | | | | | | $ | 34,058 |
|
|
| | |
| NOTES TO SCHEDULE OF INVESTMENTS |
| ADR | - | American Depositary Receipt |
| JPY | - | Japanese Yen |
| USD | - | United States Dollar |
| |
| † | Category is less than 0.05% of total net assets. |
See Notes to Financial Statements.
|
|
| Statement of Assets and Liabilities |
|
| | | |
| OCTOBER 31, 2014 | |
| Assets | |
| Investment securities, at value (cost of $82,362,111) | $ | 93,621,181 |
|
| Receivable for capital shares sold | 7,750 |
|
| Unrealized appreciation on forward foreign currency exchange contracts | 34,058 |
|
| Dividends and interest receivable | 135,516 |
|
| | 93,798,505 |
|
| | |
| Liabilities | |
| Payable for capital shares redeemed | 109,589 |
|
| Accrued management fees | 95,500 |
|
| | 205,089 |
|
| | |
| Net Assets | $ | 93,593,416 |
|
| | |
| Net Assets Consist of: | |
| Capital (par value and paid-in surplus) | $ | 83,821,678 |
|
| Undistributed net investment income | 296,859 |
|
| Accumulated net realized loss | (1,818,249 | ) |
| Net unrealized appreciation | 11,293,128 |
|
| | $ | 93,593,416 |
|
|
| | | | |
| | Net Assets | Shares Outstanding | Net Asset Value Per Share |
| Investor Class, $0.01 Par Value | $91,092,757 | 8,977,043 |
| $10.15 |
| Institutional Class, $0.01 Par Value | $2,500,659 | 241,395 |
| $10.36 |
See Notes to Financial Statements.
|
| | | |
| YEAR ENDED OCTOBER 31, 2014 | |
| Investment Income (Loss) | |
| Income: | |
| Dividends (net of foreign taxes withheld of $16,629) | $ | 1,700,084 |
|
| Interest | 149 |
|
| | 1,700,233 |
|
| | |
| Expenses: | |
| Management fees | 1,152,675 |
|
| Directors' fees and expenses | 1,392 |
|
| Other expenses | 188 |
|
| | 1,154,255 |
|
| | |
| Net investment income (loss) | 545,978 |
|
| | |
| Realized and Unrealized Gain (Loss) | |
| Net realized gain (loss) on: | |
| Investment transactions | 11,501,377 |
|
| Foreign currency transactions | (114 | ) |
| | 11,501,263 |
|
| | |
| Change in net unrealized appreciation (depreciation) on: | |
| Investments | (872,649 | ) |
| Translation of assets and liabilities in foreign currencies | 34,058 |
|
| | (838,591 | ) |
| | |
| Net realized and unrealized gain (loss) | 10,662,672 |
|
| | |
| Net Increase (Decrease) in Net Assets Resulting from Operations | $ | 11,208,650 |
|
See Notes to Financial Statements.
|
|
| Statement of Changes in Net Assets |
|
| | | | | | |
| YEARS ENDED OCTOBER 31, 2014 AND OCTOBER 31, 2013 |
| Increase (Decrease) in Net Assets | October 31, 2014 | October 31, 2013 |
| Operations | | |
| Net investment income (loss) | $ | 545,978 |
| $ | 610,705 |
|
| Net realized gain (loss) | 11,501,263 |
| 11,933,220 |
|
| Change in net unrealized appreciation (depreciation) | (838,591) |
| 9,993,980 |
|
| Net increase (decrease) in net assets resulting from operations | 11,208,650 |
| 22,537,905 |
|
| | | |
| Distributions to Shareholders | | |
| From net investment income: | | |
| Investor Class | (933,951) |
| (1,340,681) |
|
| Institutional Class | (1,513) |
| (3,138) |
|
| Decrease in net assets from distributions | (935,464) |
| (1,343,819) |
|
| | | |
| Capital Share Transactions | | |
| Net increase (decrease) in net assets from capital share transactions (Note 5) | (5,259,520) |
| (5,094,889) |
|
| | | |
| Redemption Fees | | |
| Increase in net assets from redemption fees | 6,720 |
| 4,298 |
|
| | | |
| Net increase (decrease) in net assets | 5,020,386 |
| 16,103,495 |
|
| | | |
| Net Assets | | |
| Beginning of period | 88,573,030 |
| 72,469,535 |
|
| End of period | $ | 93,593,416 |
| $ | 88,573,030 |
|
| | | |
| Undistributed net investment income | $ | 296,859 |
| $ | 586,671 |
|
See Notes to Financial Statements.
|
|
| Notes to Financial Statements |
OCTOBER 31, 2014
1. Organization
American Century Mutual Funds, Inc. (the corporation) is registered under the Investment Company Act of 1940, as amended (the 1940 Act), as an open-end management investment company and is organized as a Maryland corporation. Veedot Fund (the fund) is one fund in a series issued by the corporation. The fund is nondiversified as defined under the 1940 Act. The fund's investment objective is to seek long-term capital growth.
The fund offers the Investor Class and the Institutional Class. The share classes differ principally in their respective distribution and shareholder servicing expenses and arrangements. The Institutional Class is made available to institutional shareholders or through financial intermediaries whose clients do not require the same level of shareholder and administrative services as shareholders of other classes. As a result, the Institutional Class is charged a lower unified management fee.
2. Significant Accounting Policies
The following is a summary of significant accounting policies consistently followed by the fund in preparation of its financial statements. The fund is an investment company and follows accounting and reporting guidance in accordance with accounting principles generally accepted in the United States of America. This may require management to make certain estimates and assumptions at the date of the financial statements. Actual results could differ from these estimates. Management evaluated the impact of events or transactions occurring through the date the financial statements were issued that would merit recognition or disclosure.
Investment Valuations — The fund determines the fair value of its investments and computes its net asset value per share at the close of regular trading (usually 4 p.m. Eastern time) on the New York Stock Exchange (NYSE) on each day the NYSE is open. The Board of Directors has adopted valuation policies and procedures to guide the investment advisor in the fund’s investment valuation process and to provide methodologies for the oversight of the fund’s pricing function.
Equity securities that are listed or traded on a domestic securities exchange are valued at the last reported sales price or at the official closing price as provided by the exchange. Equity securities traded on foreign securities exchanges are generally valued at the closing price of such securities on the exchange where primarily traded or at the close of the NYSE, if that is earlier. If no last sales price is reported, or if local convention or regulation so provides, the mean of the latest bid and asked prices may be used. Securities traded over-the-counter are valued at the mean of the latest bid and asked prices, the last sales price, or the official closing price. Equity securities initially expressed in local currencies are translated into U.S. dollars at the mean of the appropriate currency exchange rate at the close of the NYSE as provided by an independent pricing service.
Fixed income securities maturing within 60 days at the time of purchase may be valued at cost, plus or minus any amortized discount or premium or at the evaluated mean as provided by an independent pricing service. Evaluated mean prices are commonly derived through utilization of market models, which may consider, among other factors: trade data, quotations from dealers and active market makers, relevant yield curve and spread data, related sector levels, creditworthiness, trade data or market information on comparable securities, and other relevant security specific information.
Open-end management investment companies are valued at the reported net asset value per share. Repurchase agreements are valued at cost, which approximates fair value. Forward foreign currency exchange contracts are valued at the mean of the appropriate forward exchange rate at the close of the NYSE as provided by an independent pricing service.
If the fund determines that the market price for an investment is not readily available or the valuation methods mentioned above do not reflect an investment’s fair value, such investment is valued as determined in good faith by the Board of Directors or its delegate, in accordance with policies and procedures adopted by the Board of Directors. In its determination of fair value, the fund may review several factors including, but not limited to, market information regarding the specific investment or comparable investments and correlation
with other investment types, futures indices or general market indicators. Circumstances that may cause the fund to use these procedures to value an investment include, but are not limited to: an investment has been declared in default or is distressed; trading in a security has been suspended during the trading day or a security is not actively trading on its principal exchange; prices received from a regular pricing source are deemed unreliable; or there is a foreign market holiday and no trading occurred.
The fund monitors for significant events occurring after the close of an investment’s primary exchange but before the fund’s net asset value per share is determined. Significant events may include, but are not limited to: corporate announcements and transactions; governmental action and political unrest that could impact a specific investment or an investment sector; or armed conflicts, natural disasters and similar events that could affect investments in a specific country or region. The fund also monitors for significant fluctuations between domestic and foreign markets, as evidenced by the U.S. market or such other indicators that the Board of Directors, or its delegate, deems appropriate. If significant fluctuations in foreign markets are identified, the fund may apply a model-derived factor to the closing price of equity securities traded on foreign securities exchanges. The factor is based on observable market data as provided by an independent pricing service.
Security Transactions — Security transactions are accounted for as of the trade date. Net realized gains and losses are determined on the identified cost basis, which is also used for federal income tax purposes.
Investment Income — Dividend income less foreign taxes withheld, if any, is recorded as of the ex-dividend date. Distributions received on securities that represent a return of capital or long-term capital gain are recorded as a reduction of cost of investments and/or as a realized gain. The fund may estimate the components of distributions received that may be considered nontaxable distributions or long-term capital gain distributions for income tax purposes. Interest income is recorded on the accrual basis and includes accretion of discounts and amortization of premiums.
Foreign Currency Translations — All assets and liabilities initially expressed in foreign currencies are translated into U.S. dollars at prevailing exchange rates at period end. The fund may enter into spot foreign currency exchange contracts to facilitate transactions denominated in a foreign currency. Purchases and sales of investment securities, dividend and interest income, spot foreign currency exchange contracts, and expenses are translated at the rates of exchange prevailing on the respective dates of such transactions. Net realized and unrealized foreign currency exchange gains or losses related to investment securities are a component of net realized gain (loss) on investment transactions and change in net unrealized appreciation (depreciation) on investments, respectively.
Repurchase Agreements — The fund may enter into repurchase agreements with institutions that American Century Investment Management, Inc. (ACIM) (the investment advisor) has determined are creditworthy pursuant to criteria adopted by the Board of Directors. The fund requires that the collateral, represented by securities, received in a repurchase transaction be transferred to the custodian in a manner sufficient to enable the fund to obtain those securities in the event of a default under the repurchase agreement. ACIM monitors, on a daily basis, the securities transferred to ensure the value, including accrued interest, of the securities under each repurchase agreement is equal to or greater than amounts owed to the fund under each repurchase agreement.
Joint Trading Account — Pursuant to an Exemptive Order issued by the Securities and Exchange Commission, the fund, along with certain other funds in the American Century Investments family of funds, may transfer uninvested cash balances into a joint trading account. These balances are invested in one or more repurchase agreements that are collateralized by U.S. Treasury or Agency obligations.
Income Tax Status — It is the fund’s policy to distribute substantially all net investment income and net realized gains to shareholders and to otherwise qualify as a regulated investment company under provisions of the Internal Revenue Code. Accordingly, no provision has been made for income taxes. The fund files U.S. federal, state, local and non-U.S. tax returns as applicable. The fund's tax returns are subject to examination by the relevant taxing authority until expiration of the applicable statute of limitations, which is generally three years from the date of filing but can be longer in certain jurisdictions. At this time, management believes there are no uncertain tax positions which, based on their technical merit, would not be sustained upon examination and for which it is reasonably possible that the total amounts of unrecognized tax benefits will significantly change in the next twelve months.
Multiple Class — All shares of the fund represent an equal pro rata interest in the net assets of the class to which such shares belong, and have identical voting, dividend, liquidation and other rights and the same terms and conditions, except for class specific expenses and exclusive rights to vote on matters affecting only
individual classes. Income, non-class specific expenses, and realized and unrealized capital gains and losses of the fund are allocated to each class of shares based on their relative net assets.
Distributions to Shareholders — Distributions from net investment income and net realized gains, if any, are generally declared and paid annually.
Redemption Fees — The fund may impose a 2.00% redemption fee on shares held less than 60 days. The fee may not be applicable to all classes. The redemption fee is retained by the fund and helps cover transaction costs that long-term investors may bear when the fund sells securities to meet investor redemptions.
Indemnifications — Under the corporation’s organizational documents, its officers and directors are indemnified against certain liabilities arising out of the performance of their duties to the fund. In addition, in the normal course of business, the fund enters into contracts that provide general indemnifications. The maximum exposure under these arrangements is unknown as this would involve future claims that may be made against a fund. The risk of material loss from such claims is considered by management to be remote.
3. Fees and Transactions with Related Parties
Certain officers and directors of the corporation are also officers and/or directors of American Century Companies, Inc. (ACC). The corporation’s investment advisor, ACIM, the corporation's distributor, American Century Investment Services, Inc., and the corporation’s transfer agent, American Century Services, LLC, are wholly owned, directly or indirectly, by ACC.
Management Fees — The corporation has entered into a management agreement with ACIM, under which ACIM provides the fund with investment advisory and management services in exchange for a single, unified management fee (the fee) per class. The agreement provides that all expenses of managing and operating the fund, except distribution and service fees, brokerage expenses, taxes, interest, fees and expenses of the independent directors (including legal counsel fees), and extraordinary expenses, will be paid by ACIM. The fee is computed and accrued daily based on each class’s daily net assets and paid monthly in arrears. The rate of the fee is determined by applying a fee rate calculation formula. This formula takes into account the fund’s assets as well as certain assets, if any, of other clients of the investment advisor outside the American Century Investments family of funds (such as subadvised funds and separate accounts) that have very similar investment teams and investment strategies (strategy assets). The annual management fee schedule ranges from 1.000% to 1.250% for the Investor Class. The annual management fee schedule ranges from 0.800% to 1.050% for the Institutional Class. The effective annual management fee for each class for the year ended October 31, 2014 was 1.25% and 1.05% for the Investor Class and Institutional Class, respectively.
Directors' Fees and Expenses — The Board of Directors is responsible for overseeing the investment advisor’s management and operations of the fund. The directors receive detailed information about the fund and its investment advisor regularly throughout the year, and meet at least quarterly with management of the investment advisor to review reports about fund operations. Fees and expenses incurred in conjunction with the directors during the year ended October 31, 2014 are detailed in the Statement of Operations. The fund’s officers do not receive compensation from the fund.
4. Investment Transactions
Purchases and sales of investment securities, excluding short-term investments, for the year ended October 31, 2014 were $168,745,455 and $173,865,917, respectively.
5. Capital Share Transactions
Transactions in shares of the fund were as follows:
|
| | | | | | | | | | |
| | Year ended October 31, 2014 | Year ended October 31, 2013 |
| | Shares | Amount | Shares | Amount |
| Investor Class/Shares Authorized | 200,000,000 |
| | 200,000,000 |
| |
| Sold | 719,155 |
| $ | 6,834,412 |
| 959,126 |
| $ | 7,928,759 |
|
| Issued in reinvestment of distributions | 99,908 |
| 912,160 |
| 189,568 |
| 1,313,705 |
|
| Redeemed | (1,558,477 | ) | (15,012,894 | ) | (1,916,842 | ) | (14,445,066 | ) |
| | (739,414 | ) | (7,266,322 | ) | (768,148 | ) | (5,202,602 | ) |
| Institutional Class/Shares Authorized | 100,000,000 |
| | 100,000,000 |
| |
| Sold | 251,800 |
| 2,432,360 |
| 22,611 |
| 188,877 |
|
| Issued in reinvestment of distributions | 163 |
| 1,513 |
| 444 |
| 3,138 |
|
| Redeemed | (44,714 | ) | (427,071 | ) | (11,454 | ) | (84,302 | ) |
| | 207,249 |
| 2,006,802 |
| 11,601 |
| 107,713 |
|
| Net increase (decrease) | (532,165 | ) | $ | (5,259,520 | ) | (756,547 | ) | $ | (5,094,889 | ) |
6. Fair Value Measurements
The fund’s investments valuation process is based on several considerations and may use multiple inputs to determine the fair value of the investments held by the fund. In conformity with accounting principles generally accepted in the United States of America, the inputs used to determine a valuation are classified into three broad levels.
| |
| • | Level 1 valuation inputs consist of unadjusted quoted prices in an active market for identical investments. |
| |
| • | Level 2 valuation inputs consist of direct or indirect observable market data (including quoted prices for comparable investments, evaluations of subsequent market events, interest rates, prepayment speeds, credit risk, etc.). These inputs also consist of quoted prices for identical investments initially expressed in local currencies that are adjusted through translation into U.S. dollars. |
| |
| • | Level 3 valuation inputs consist of unobservable data (including a fund’s own assumptions). |
The level classification is based on the lowest level input that is significant to the fair valuation measurement. The valuation inputs are not necessarily an indication of the risks associated with investing in these securities or other financial instruments. There were no significant transfers between levels during the period.
The following is a summary of the level classifications as of period end. The Schedule of Investments provides additional information on the fund’s portfolio holdings.
|
| | | | | | | | |
| | Level 1 | Level 2 | Level 3 |
| Assets | | | |
| Investment Securities | | | |
| Common Stocks | $ | 92,808,207 |
| — |
| — |
|
| Temporary Cash Investments | 406,533 |
| $ | 406,441 |
| — |
|
| | $ | 93,214,740 |
| $ | 406,441 |
| — |
|
| Other Financial Instruments | | | |
| Forward Foreign Currency Exchange Contracts | — |
| $ | 34,058 |
| — |
|
7. Derivative Instruments
Foreign Currency Risk — The fund is subject to foreign currency exchange rate risk in the normal course of pursuing its investment objectives. The value of foreign investments held by a fund may be significantly affected by changes in foreign currency exchange rates. The dollar value of a foreign security generally decreases when the value of the dollar rises against the foreign currency in which the security is denominated and tends to increase when the value of the dollar declines against such foreign currency. A fund may enter into forward foreign currency exchange contracts to reduce a fund's exposure to foreign currency exchange rate fluctuations. The net U.S. dollar value of foreign currency underlying all contractual commitments held by a fund and the resulting unrealized appreciation or depreciation are determined daily. Realized gain or loss is recorded upon the termination of the contract. Net realized and unrealized gains or losses occurring during the holding period of forward foreign currency exchange contracts are a component of net realized gain (loss) on foreign currency transactions and change in net unrealized appreciation (depreciation) on translation of assets and liabilities in foreign currencies, respectively. A fund bears the risk of an unfavorable change in the foreign currency exchange rate underlying the forward contract. Additionally, losses, up to the fair value, may arise if the counterparties do not perform under the contract terms. The fund began investing in forward foreign currency exchange contracts in October 2014. The fund's U.S. dollar exposure to foreign currency risk derivative instruments at period end was $898,196.
The value of foreign currency risk derivative instruments as of October 31, 2014, is disclosed on the Statement of Assets and Liabilities as an asset of $34,058 in unrealized appreciation on forward foreign currency exchange contracts. For the year ended October 31, 2014, the effect of foreign currency risk derivative instruments on the Statement of Operations was $34,058 in change in net unrealized appreciation (depreciation) on translation of assets and liabilities in foreign currencies.
8. Risk Factors
The fund’s investment process may result in high portfolio turnover, which could mean high transaction costs, affecting both performance and capital gains tax liabilities to investors.
9. Federal Tax Information
The tax character of distributions paid during the years ended October 31, 2014 and October 31, 2013 were as follows:
|
| | | | | | |
| | 2014 | 2013 |
| Distributions Paid From | | |
| Ordinary income | $ | 935,464 |
| $ | 1,343,819 |
|
| Long-term capital gains | — |
| — |
|
The book-basis character of distributions made during the year from net investment income or net realized gains may differ from their ultimate characterization for federal income tax purposes. These differences reflect the differing character of certain income items and net realized gains and losses for financial statement and tax purposes, and may result in reclassification among certain capital accounts on the financial statements.
As of October 31, 2014, the federal tax cost of investments and the components of distributable earnings on a tax-basis were as follows: |
| | | |
| Federal tax cost of investments | $ | 82,272,605 |
|
| Gross tax appreciation of investments | $ | 12,584,843 |
|
| Gross tax depreciation of investments | (1,236,267 | ) |
| Net tax appreciation (depreciation) of investments | $ | 11,348,576 |
|
| Undistributed ordinary income | $ | 330,917 |
|
| Accumulated short-term capital losses | $ | (1,907,755 | ) |
The difference between book-basis and tax-basis unrealized appreciation (depreciation) is attributable primarily to the realization for tax purposes of unrealized gains (losses) on certain foreign currency exchange contracts, return of capital dividends received and the timing and recognition of partnership income.
Accumulated capital losses represent net capital loss carryovers that may be used to offset future realized capital gains for federal income tax purposes. Future capital loss carryover utilization in any given year may be subject to Internal Revenue Code limitations. Capital loss carryovers expire in 2017.
|
| | | | | | | | | | | | | |
| For a Share Outstanding Throughout the Years Ended October 31 (except as noted) | | | |
| Per-Share Data | | | | | | | Ratios and Supplemental Data |
| | | Income From Investment Operations: | | | | Ratio to Average Net Assets of: | | |
| | Net Asset
Value,
Beginning
of Period | Net
Investment
Income
(Loss)(1) | Net
Realized
and
Unrealized
Gain (Loss) | Total From
Investment
Operations | Distributions From Net
Investment
Income | Net Asset
Value,
End
of Period | Total
Return(2) | Operating
Expenses | Net
Investment
Income
(Loss) | Portfolio
Turnover
Rate | Net
Assets,
End of
Period
(in thousands) |
| Investor Class | | | | | | | | | | |
| 2014 | $9.08 | 0.06 | 1.11 | 1.17 | (0.10) | $10.15 | 12.96% | 1.25% | 0.59% | 184% |
| $91,093 |
|
| 2013 | $6.90 | 0.06 | 2.25 | 2.31 | (0.13) | $9.08 | 34.11% | 1.25% | 0.80% | 158% |
| $88,256 |
|
| 2012 | $6.25 | 0.09 | 0.65 | 0.74 | (0.09) | $6.90 | 12.03% | 1.26% | 1.35% | 257% |
| $72,311 |
|
| 2011 | $5.68 | 0.05 | 0.53 | 0.58 | (0.01) | $6.25 | 10.16% | 1.25% | 0.82% | 280% |
| $72,851 |
|
| 2010 | $4.71 | —(3) | 0.97 | 0.97 | —(3) | $5.68 | 20.66% | 1.26% | (0.06)% | 260% |
| $78,441 |
|
| Institutional Class | | | | | | | | | | |
| 2014 | $9.27 | 0.09 | 1.11 | 1.20 | (0.11) | $10.36 | 13.13% | 1.05% | 0.79% | 184% |
| $2,501 |
|
| 2013 | $7.03 | 0.07 | 2.31 | 2.38 | (0.14) | $9.27 | 34.41% | 1.05% | 1.00% | 158% |
| $317 |
|
| 2012 | $6.37 | 0.10 | 0.66 | 0.76 | (0.10) | $7.03 | 12.18% | 1.06% | 1.55% | 257% |
| $158 |
|
| 2011 | $5.78 | 0.06 | 0.55 | 0.61 | (0.02) | $6.37 | 10.55% | 1.05% | 1.02% | 280% |
| $169 |
|
| 2010 | $4.79 | 0.01 | 0.99 | 1.00 | (0.01) | $5.78 | 20.97% | 1.06% | 0.14% | 260% |
| $2,981 |
|
|
|
| Notes to Financial Highlights |
| |
| (1) | Computed using average shares outstanding throughout the period. |
| |
| (2) | Total returns are calculated based on the net asset value of the last business day. Total returns for periods less than one year are not annualized. |
| |
| (3) | Per-share amount was less than $0.005. |
See Notes to Financial Statements.
|
|
| Report of Independent Registered Public Accounting Firm |
To the Board of Directors and Shareholders of
American Century Mutual Funds, Inc.:
We have audited the accompanying statement of assets and liabilities, including the schedule of investments, of Veedot Fund (the “Fund”), one of the funds constituting American Century Mutual Funds, Inc., as of October 31, 2014, and the related statement of operations for the year then ended, the statements of changes in net assets for each of the two years in the period then ended, and the financial highlights for each of the periods presented. These financial statements and financial highlights are the responsibility of the Fund's management. Our responsibility is to express an opinion on these financial statements and financial highlights based on our audits.
We conducted our audits in accordance with the standards of the Public Company Accounting Oversight Board (United States). Those standards require that we plan and perform the audit to obtain reasonable assurance about whether the financial statements and financial highlights are free of material misstatement. The Fund is not required to have, nor were we engaged to perform, an audit of its internal control over financial reporting. Our audits included consideration of internal control over financial reporting as a basis for designing audit procedures that are appropriate in the circumstances, but not for the purpose of expressing an opinion on the effectiveness of the Fund's internal control over financial reporting. Accordingly, we express no such opinion. An audit also includes examining, on a test basis, evidence supporting the amounts and disclosures in the financial statements, assessing the accounting principles used and significant estimates made by management, as well as evaluating the overall financial statement presentation. Our procedures included confirmation of securities owned as of October 31, 2014, by correspondence with the custodian and brokers; where replies were not received from brokers, we performed other auditing procedures. We believe that our audits provide a reasonable basis for our opinion.
In our opinion, the financial statements and financial highlights referred to above present fairly, in all material respects, the financial position of Veedot Fund of American Century Mutual Funds, Inc. as of October 31, 2014, the results of its operations for the year then ended, the changes in its net assets for each of the two years in the period then ended, and the financial highlights for each of the periods presented, in conformity with accounting principles generally accepted in the United States of America.
DELOITTE & TOUCHE LLP
Kansas City, Missouri
December 17, 2014
The Board of Directors
The individuals listed below serve as directors of the funds. Each director will continue to serve in this capacity until death, retirement, resignation or removal from office. The board has adopted a mandatory retirement age for directors who are not “interested persons,” as that term is defined in the Investment Company Act (independent directors). Independent directors shall retire by December 31 of the year in which they reach their 75th birthday.
Mr. Thomas is an “interested person” because he currently serves as President and Chief Executive Officer of American Century Companies, Inc. (ACC), the parent company of American Century Investment Management, Inc. (ACIM or the advisor). Mr. Fink is treated as an “interested person” because of his recent employment with ACC and American Century Services, LLC (ACS). The other directors (more than three-fourths of the total number) are independent. They are not employees, directors or officers of, and have no financial interest in, ACC or any of its wholly owned, direct or indirect, subsidiaries, including ACIM, American Century Investment Services, Inc. (ACIS) and ACS, and they do not have any other affiliations, positions, or relationships that would cause them to be considered “interested persons” under the Investment Company Act. The directors serve in this capacity for seven (in the case of Mr. Thomas, 15) registered investment companies in the American Century Investments family of funds.
The following table presents additional information about the directors. The mailing address for each director is 4500 Main Street, Kansas City, Missouri 64111.
|
| | | | | |
Name
(Year of Birth) | Position(s) Held with Funds | Length of Time Served | Principal Occupation(s) During Past 5 Years | Number of American Century Portfolios Overseen by Director | Other Directorships Held During Past
5 Years |
| Independent Directors | | | | |
Thomas A. Brown
(1940) | Director | Since 1980 | Managing Member, Associated Investments, LLC (real estate investment company); Brown Cascade Properties, LLC (real estate investment company) (2001 to 2009) | 73 | None |
Andrea C. Hall
(1945) | Director | Since 1997 | Retired | 73 | None |
Jan M. Lewis
(1957) | Director | Since 2011 | Retired; President and Chief Executive Officer, Catholic Charities of Northeast Kansas (human services organization) (2006 to 2013) | 73 | None |
James A. Olson
(1942) | Director and Chairman of the Board | Since 2007 (Chairman since 2014) | Member, Plaza Belmont LLC (private equity fund manager) | 73 | Saia, Inc. (2002 to 2012) and EPR Properties (2003 to 2013) |
|
| | | | | |
Name
(Year of Birth) | Position(s) Held with Funds | Length of Time Served | Principal Occupation(s) During Past 5 Years | Number of American Century Portfolios Overseen by Director | Other Directorships Held During Past
5 Years |
| Independent Directors | | | | |
M. Jeannine Strandjord
(1945) | Director | Since 1994 | Retired | 73 | Euronet Worldwide Inc.; Charming Shoppes, Inc. (2006 to 2010); and DST Systems Inc. (1996 to 2012) |
John R. Whitten
(1946) | Director | Since 2008 | Retired | 73 | Rudolph Technologies, Inc. |
Stephen E. Yates
(1948) | Director | Since 2012 | Retired; Executive Vice President, Technology & Operations, KeyCorp. (computer services) (2004 to 2010) | 73 | Applied Industrial Technologies, Inc. (2001 to 2010) |
| Interested Directors | | | | |
Barry Fink
(1955) | Director | Since 2012 | Retired; Executive Vice President, ACC (September 2007 to February 2013); President, ACS (October 2007 to February 2013); Chief Operating Officer, ACC (September 2007 to November 2012) | 73 | None |
Jonathan S. Thomas
(1963) | Director and President | Since 2007 | President and Chief Executive Officer, ACC (March 2007 to present). Also serves as Chief Executive Officer, ACS; Executive Vice President, ACIM; Director, ACC, ACIM and other ACC subsidiaries | 118 | BioMed Valley Discoveries, Inc. |
The Statement of Additional Information has additional information about the fund's directors and is available without charge, upon request, by calling 1-800-345-2021.
Officers
The following table presents certain information about the executive officers of the funds. Each officer serves as an officer for each of the 15 investment companies in the American Century family of funds, unless otherwise noted. No officer is compensated for his or her service as an officer of the funds. The listed officers are interested persons of the funds and are appointed or re-appointed on an annual basis. The mailing address for each officer listed below is 4500 Main Street, Kansas City, Missouri 64111.
|
| | |
Name (Year of Birth) | Offices with the Funds | Principal Occupation(s) During the Past Five Years |
Jonathan S.
Thomas
(1963) | Director and
President
since 2007 | President and Chief Executive Officer, ACC (March 2007 to present). Also serves as Chief Executive Officer, ACS; Executive Vice President, ACIM; Director, ACC, ACIM and other ACC subsidiaries |
Amy D. Shelton
(1964) | Chief Compliance
Officer since 2014 | Chief Compliance Officer, American Century funds, (March 2014 to present); Chief Compliance Officer, ACIM (February 2014 to present); Chief Compliance Officer, ACIS (October 2009 to present); Vice President, Client Interactions and Marketing, ACIS (February 2013 to January 2014); Director, Client Interactions and Marketing, ACIS (June 2007 to January 2013). Also serves as Vice President, ACIS |
Charles A.
Etherington
(1957) | General Counsel
since 2007 and
Senior Vice
President since 2006 | Attorney, ACC (February 1994 to present); Vice President, ACC (November 2005 to present); General Counsel, ACC (March 2007 to present). Also serves as General Counsel, ACIM, ACS, ACIS and other ACC subsidiaries; and Senior Vice President, ACIM and ACS |
C. Jean Wade
(1964) | Vice President,
Treasurer and
Chief Financial
Officer since 2012 | Vice President, ACS (February 2000 to present) |
Robert J.
Leach
(1966) | Vice President
since 2006 and
Assistant Treasurer
since 2012 | Vice President, ACS (February 2000 to present) |
David H.
Reinmiller
(1963) | Vice President
since 2000 | Attorney, ACC (January 1994 to present); Associate General Counsel, ACC (January 2001 to present). Also serves as Vice President, ACIM and ACS |
Ward D.
Stauffer
(1960) | Secretary
since 2005 | Attorney, ACC (June 2003 to present) |
|
|
| Approval of Management Agreement |
At a meeting held on June 18, 2014, the Fund’s Board of Directors unanimously approved the renewal of the management agreement pursuant to which American Century Investment Management, Inc. (the “Advisor”) acts as the investment advisor for the Fund. Under Section 15(c) of the Investment Company Act, contracts for investment advisory services are required to be reviewed, evaluated, and approved by a majority of a fund’s directors (the “Directors”), including a majority of the independent Directors, each year.
Prior to its consideration of the renewal of the management agreement, the Board requested and reviewed extensive data and information compiled by the Advisor and certain independent providers of evaluation data concerning the Fund and the services provided to the Fund by the Advisor. This review was in addition to the oversight and evaluation undertaken by the Board and its committees on a continuous basis and the information received was supplemental to the extensive information that the Board and its committees receive and consider throughout the year.
In connection with its consideration of the renewal of the management agreement, the Board’s review and evaluation of the services provided by the Advisor included, but was not limited to, the following:
| |
| • | the nature, extent, and quality of investment management, shareholder services, and other services provided by the Advisor to the Fund; |
| |
| • | the wide range of other programs and services the Advisor provides to the Fund and its shareholders on a routine and non-routine basis; |
| |
| • | the Fund’s investment performance compared to appropriate benchmarks and/or a peer group of other mutual funds with similar investment objectives and strategies; |
| |
| • | the cost of owning the Fund compared to the cost of owning similar funds; |
| |
| • | the Advisor’s compliance policies, procedures, and regulatory experience; |
| |
| • | financial data showing the cost of services provided to the Fund, the profitability of the Fund to the Advisor, and the overall profitability of the Advisor; |
| |
| • | possible economies of scale associated with the Advisor’s management of the Fund and other accounts under its management; |
| |
| • | the services provided and charges to other investment management clients of the Advisor; |
| |
| • | acquired fund fees and expenses; and |
| |
| • | any collateral benefits derived by the Advisor from the management of the Fund. |
In keeping with its practice, the Board held two in-person meetings and one telephonic meeting to review and discuss the information provided. The independent Directors also had the benefit of the advice of their independent counsel throughout the process.
Factors Considered
The Directors considered all of the information provided by the Advisor, the independent data providers, and independent counsel, and evaluated such information for the Fund. In connection with their review, the Directors did not identify any single factor as being all-important or controlling, and each Director may have attributed different levels of importance to different factors. In deciding to renew the management agreement, the Board based its decision on a number of factors, including the following:
Nature, Extent and Quality of Services — Generally. Under the management agreement, the Advisor is responsible for providing or arranging for all services necessary for the operation of the Fund. The Board noted that under the management agreement, the Advisor provides or arranges at its own expense a wide variety of services including:
| |
| • | constructing and designing the Fund |
| |
| • | portfolio research and security selection |
| |
| • | initial capitalization/funding |
| |
| • | daily valuation of the Fund’s portfolio |
| |
| • | shareholder servicing and transfer agency, including shareholder confirmations, recordkeeping, and communications |
| |
| • | legal services (except the independent Directors’ counsel) |
| |
| • | regulatory and portfolio compliance |
| |
| • | marketing and distribution (except Rule 12b-1 plans) |
The Board noted that many of these services have expanded over time both in terms of quantity and complexity in response to shareholder demands, competition in the industry, changing distribution channels, and the changing regulatory environment.
Investment Management Services. The nature of the investment management services provided to the Fund is quite complex and allows Fund shareholders access to professional money management, instant diversification of their investments within an asset class, the opportunity to easily diversify among asset classes by investing in or exchanging among various American Century Investments funds, and liquidity. In evaluating investment performance, the Board expects the Advisor to manage the Fund in accordance with its investment objectives and approved strategies. Further, the Directors recognize that the Advisor has an obligation to monitor trading activities, and in particular to seek the best execution of fund trades, and to evaluate the use of and payment for research. In providing these services, the Advisor utilizes teams of investment professionals (portfolio managers, analysts, research assistants, and securities traders) who require extensive information technology, research, training, compliance and other systems to conduct their business. The Board, directly and through its Fund Performance Review Committee, regularly reviews investment performance information for the Fund, together with comparative information for appropriate benchmarks and/or peer groups of similarly-managed funds, over different time horizons. The Directors also review detailed performance information during the management agreement approval process. If performance concerns are identified, the Fund receives special reviews until performance improves, during which the Board discusses with the Advisor the reasons for such results (e.g., market conditions, security selection) and any efforts being undertaken to improve performance. The Fund’s performance was above its benchmark for the one-, three-, and ten-year periods and below its benchmark for the five-year period reviewed by the Board. The Board found the investment management services provided by the Advisor to the Fund to be satisfactory and consistent with the management agreement.
Shareholder and Other Services. Under the management agreement, the Advisor provides the Fund with a comprehensive package of transfer agency, shareholder, and other services. The Board, directly and through various committees of the Board, regularly reviews reports and evaluations of such services at its regular meetings. These reports include, but are not limited to, information regarding the operational efficiency and accuracy of the shareholder and transfer agency services provided, staffing levels, shareholder satisfaction (as measured by external as well as internal sources), technology support, new products and services offered to Fund shareholders, securities trading activities, portfolio valuation services, auditing services, and legal and operational compliance activities. Certain aspects of shareholder and transfer agency service level efficiency and the quality of securities trading activities are measured by independent third party providers and are presented in comparison to other fund groups not managed by the Advisor. The Board
found the services provided by the Advisor to the Fund under the management agreement to be competitive and of high quality.
Costs of Services and Profitability. The Advisor provides detailed information concerning its cost of providing various services to the Fund, its profitability in managing the Fund (pre- and post-distribution), its overall profitability, and its financial condition. The Directors have reviewed with the Advisor the methodology used to prepare this financial information. The financial information regarding the Advisor is considered in evaluating the Advisor’s financial condition, its ability to continue to provide services under the management agreement, and the reasonableness of the current management fee. The Board concluded that the Advisor’s profits were reasonable in light of the services provided to the Fund.
Ethics. The Board generally considers the Advisor’s commitment to providing quality services to shareholders and to conducting its business ethically. They noted that the Advisor’s practices generally meet or exceed industry best practices.
Economies of Scale. The Board also reviewed information provided by the Advisor regarding the possible existence of economies of scale in connection with the management of the Fund. The Board concluded that economies of scale are difficult to measure and predict with precision, especially on a fund-by-fund basis. The Board concluded that the Advisor is appropriately sharing economies of scale through its competitive fee structure, offering competitive fees from fund inception, and through reinvestment in its business to provide shareholders additional content and services.
Comparison to Other Funds’ Fees. The management agreement provides that the Fund pays the Advisor a single, all-inclusive (or unified) management fee for providing all services necessary for the management and operation of the Fund, other than brokerage expenses, taxes, interest, extraordinary expenses, and the fees and expenses of the Fund’s independent directors (including their independent legal counsel) and expenses incurred in connection with the provision of shareholder services and distribution services under a plan adopted pursuant to Rule 12b-1 under the 1940 Act. Under the unified fee structure, the Advisor is responsible for providing all investment advisory, custody, audit, administrative, compliance, recordkeeping, marketing and shareholder services, or arranging and supervising third parties to provide such services. By contrast, most other funds are charged a variety of fees, including an investment advisory fee, a transfer agency fee, an administrative fee, distribution charges and other expenses. Other than their investment advisory fees and any applicable Rule 12b-1 distribution fees, all other components of the total fees charged by these other funds may be increased without shareholder approval. The Board believes the unified fee structure is a benefit to Fund shareholders because it clearly discloses to shareholders the cost of owning Fund shares, and, since the unified fee cannot be increased without a vote of Fund shareholders, it shifts to the Advisor the risk of increased costs of operating the Fund and provides a direct incentive to minimize administrative inefficiencies. Part of the Board’s analysis of fee levels involves reviewing certain evaluative data compiled by an independent provider comparing the Fund’s unified fee to the total expense ratios of its peers. The unified fee charged to shareholders of the Fund was slightly above the median of the total expense ratios of the Fund’s peer expense universe and was within the range of its peer expense group. The Board concluded that the management fee paid by the Fund to the Advisor under the management agreement is reasonable in light of the services provided to the Fund.
Comparison to Fees and Services Provided to Other Clients of the Advisor. The Board also requested and received information from the Advisor concerning the nature of the services, fees, costs and profitability of its advisory services to advisory clients other than the Fund. They observed that these varying types of client accounts require different services and involve different regulatory and entrepreneurial risks than the management of the Fund. The Board analyzed this information and concluded that the fees charged and services provided to the Fund were reasonable by comparison.
Collateral or “Fall-Out” Benefits Derived by the Advisor. The Board considered the existence of collateral benefits the Advisor may receive as a result of its relationship with the Fund. They concluded that the Advisor’s primary business is managing mutual funds and it generally does not use fund or shareholder information to generate profits in other lines of business, and therefore does not derive any significant collateral benefits from them. The Board noted that the Advisor receives proprietary research from broker-dealers that execute fund portfolio transactions and concluded that this research is likely to benefit Fund shareholders. The Board also determined that the Advisor is able to provide investment management services to certain clients other than the Fund, at least in part, due to its existing infrastructure built to serve the fund complex. The Board concluded, however, that the assets of those other clients are not material to the analysis and, where applicable, may be included with the assets of the Fund to determine breakpoints in the management fee schedule.
Existing Relationship. The Board also considered whether there was any reason for not continuing the existing arrangement with the Advisor. In this regard, the Board was mindful of the potential disruptions of the Fund’s operations and various risks, uncertainties, and other effects that could occur as a result of a decision not to continue such relationship. In particular, the Board recognized that most shareholders have invested in the Fund on the strength of the Advisor’s industry standing and reputation and in the expectation that the Advisor will have a continuing role in providing advisory services to the Fund.
Conclusion of the Directors. As a result of this process, the Board, including all of the independent Directors, taking into account all of the factors discussed above and the information provided by the Advisor and others, concluded that the management agreement between the Fund and the Advisor is fair and reasonable in light of the services provided and should be renewed.
Retirement Account Information
As required by law, distributions you receive from certain IRAs are subject to federal income tax withholding, unless you elect not to have withholding apply. Tax will be withheld on the total amount withdrawn even though you may be receiving amounts that are not subject to withholding, such as nondeductible contributions. In such case, excess amounts of withholding could occur. You may adjust your withholding election so that a greater or lesser amount will be withheld.
If you don’t want us to withhold on this amount, you must notify us to not withhold the federal income tax. You may notify us in writing or in certain situations by telephone or through other electronic means. For systematic withdrawals, your withholding election will remain in effect until revoked or changed by filing a new election. You have the right to revoke your election at any time.
Remember, even if you elect not to have income tax withheld, you are liable for paying income tax on the taxable portion of your withdrawal. If you elect not to have income tax withheld or you don’t have enough income tax withheld, you may be responsible for payment of estimated tax. You may incur penalties under the estimated tax rules if your withholding and estimated tax payments are not sufficient. You can reduce or defer the income tax on a distribution by directly or indirectly rolling such distribution over to another IRA or eligible plan. You should consult your tax advisor for additional information.
State tax will be withheld if, at the time of your distribution, your address is within one of the mandatory withholding states and you have federal income tax withheld (or as otherwise required by state law). State taxes will be withheld from your distribution in accordance with the respective state rules.
Distributions you receive from 403(b), 457 and qualified plans are subject to special tax and withholding rules. Your plan administrator or plan sponsor is required to provide you with a special tax notice explaining those rules at the time you request a distribution. If applicable, federal and/or state taxes may be withheld from your distribution amount.
Proxy Voting Policies
A description of the policies that the fund's investment advisor uses in exercising the voting rights associated with the securities purchased and/or held by the fund is available without charge, upon request, by calling 1-800-345-2021. It is also available on the "About Us" page of American Century Investments’ website at americancentury.com and on the Securities and Exchange Commission’s website at sec.gov. Information regarding how the investment advisor voted proxies relating to portfolio securities during the most recent 12-month period ended June 30 is available on the "About Us" page at americancentury.com. It is also available at sec.gov.
Quarterly Portfolio Disclosure
The fund files its complete schedule of portfolio holdings with the Securities and Exchange Commission (SEC) for the first and third quarters of each fiscal year on Form N-Q. The fund’s Forms N-Q are available on the SEC’s website at sec.gov, and may be reviewed and copied at the SEC’s Public Reference Room in Washington, DC. Information on the operation of the Public Reference Room may be obtained by calling 1-800-SEC-0330. The fund also makes its complete schedule of portfolio holdings for the most recent quarter of its fiscal year available on its
website at americancentury.com and, upon request, by calling 1-800-345-2021.
Other Tax Information
The following information is provided pursuant to provisions of the Internal Revenue Code.
The fund hereby designates up to the maximum amount allowable as qualified dividend income for the fiscal year ended October 31, 2014.
For corporate taxpayers, the fund hereby designates $935,464, or up to the maximum amount allowable, of ordinary income distributions paid during the fiscal year ended October 31, 2014 as qualified for the corporate dividends received deduction.
|
| | |
| |
| | | |
| Contact Us | americancentury.com | |
| Automated Information Line | 1-800-345-8765 | |
| Investor Services Representative | 1-800-345-2021 or 816-531-5575 | |
| Investors Using Advisors | 1-800-378-9878 | |
| Business, Not-For-Profit, Employer-Sponsored Retirement Plans | 1-800-345-3533 | |
| Banks and Trust Companies, Broker-Dealers, Financial Professionals, Insurance Companies | 1-800-345-6488 | |
| Telecommunications Relay Service for the Deaf | 711 | |
| | | |
| American Century Mutual Funds, Inc. | |
| | | |
Investment Advisor: American Century Investment Management, Inc. Kansas City, Missouri | |
| | | |
| This report and the statements it contains are submitted for the general information of our shareholders. The report is not authorized for distribution to prospective investors unless preceded or accompanied by an effective prospectus. | |
| | | |
©2014 American Century Proprietary Holdings, Inc. All rights reserved.
CL-ANN-84005 1412 | |
ITEM 2. CODE OF ETHICS.
| |
| (a) | The registrant has adopted a Code of Ethics for Senior Financial Officers that applies to the registrant’s principal executive officer, principal financial officer, principal accounting officer, and persons performing similar functions. |
| |
| (f) | The registrant’s Code of Ethics for Senior Financial Officers was filed as Exhibit 12 (a)(1) to American Century Asset Allocation Portfolios, Inc.’s Annual Certified Shareholder Report on Form N-CSR, File No. 811-21591, on September 29, 2005, and is incorporated herein by reference. |
ITEM 3. AUDIT COMMITTEE FINANCIAL EXPERT.
| |
| (a)(1) | The registrant’s board has determined that the registrant has at least one audit committee financial expert serving on its audit committee. |
| |
| (a)(2) | M. Jeannine Strandjord, Stephen E. Yates, Thomas A. Brown and John R. Whitten are the registrant’s designated audit committee financial experts. They are “independent” as defined in Item 3 of Form N-CSR. |
ITEM 4. PRINCIPAL ACCOUNTANT FEES AND SERVICES.
The aggregate fees billed for each of the last two fiscal years for professional services rendered by the principal accountant for the audit of the registrant’s annual financial statements or services that are normally provided by the accountant in connection with statutory and regulatory filings or engagements for those fiscal years were as follows:
FY 2013: $360,409
FY 2014: $299,650
The aggregate fees billed in each of the last two fiscal years for assurance and related services by the principal accountant that are reasonably related to the performance of the audit of the registrant’s financial statements and are not reported under paragraph (a) of this Item were as follows:
For services rendered to the registrant:
FY 2013: $0
FY 2014: $0
Fees required to be approved pursuant to paragraph (c)(7)(ii) of Rule 2-01 of Regulation S-X (relating to certain engagements for non-audit services with the registrant’s investment adviser and its affiliates):
FY 2013: $0
FY 2014: $0
The aggregate fees billed in each of the last two fiscal years for professional services rendered by the principal accountant for tax compliance, tax advice, and tax planning were as follows:
For services rendered to the registrant:
FY 2013: $0
FY 2014: $0
Fees required to be approved pursuant to paragraph (c)(7)(ii) of Rule 2-01 of Regulation S-X (relating to certain engagements for non-audit services with the registrant’s investment adviser and its affiliates):
FY 2013: $0
FY 2014: $0
The aggregate fees billed in each of the last two fiscal years for products and services provided by the principal accountant, other than the services reported in paragraphs (a) through (c) of this Item were as follows:
For services rendered to the registrant:
FY 2013: $0
FY 2014: $0
Fees required to be approved pursuant to paragraph (c)(7)(ii) of Rule 2-01 of Regulation S-X (relating to certain engagements for non-audit services with the registrant’s investment adviser and its affiliates):
FY 2013: $0
FY 2014: $0
| |
| (e)(1) | In accordance with paragraph (c)(7)(i)(A) of Rule 2-01 of Regulation S-X, before the accountant is engaged by the registrant to render audit or non-audit services, the engagement is approved by the registrant’s audit committee. Pursuant to paragraph (c)(7)(ii) of Rule 2-01 of Regulation S-X, the registrant’s audit committee also pre-approves its accountant’s engagements for non-audit services with the registrant’s investment adviser, its parent company, and any entity controlled by, or under common control with the investment adviser that provides ongoing services to the registrant, if the engagement relates directly to the operations and financial reporting of the registrant. |
| |
| (e)(2) | All services described in each of paragraphs (b) through (d) of this Item were pre-approved before the engagement by the registrant’s audit committee pursuant to paragraph (c)(7)(i)(A) of Rule 2-01 of Regulation S-X. Consequently, none of such services were required to be approved by the audit committee pursuant to paragraph (c)(7)(i)(C). |
| |
| (f) | The percentage of hours expended on the principal accountant’s engagement to audit the registrant’s financial statements for the most recent fiscal year that were attributed to work performed by persons other than the principal accountant’s full-time, permanent employees was less than 50%. |
| |
| (g) | The aggregate non-audit fees billed by the registrant’s accountant for services rendered to the registrant, and rendered to the registrant’s investment adviser (not including any sub-adviser whose role is primarily portfolio management and is subcontracted with or overseen by another investment adviser), and any entity controlling, controlled by, or under common control with the adviser that provides ongoing services to the registrant for each of the last two fiscal years of the registrant were as follows: |
FY 2013: $101,621
FY 2014: $ 91,808
| |
| (h) | The registrant’s investment adviser and accountant have notified the registrant’s audit committee of all non-audit services that were rendered by the registrant’s accountant to the registrant’s investment adviser, its parent company, and any entity controlled by, or under common control with the investment adviser that provides services to the registrant, which services were not required to be pre-approved pursuant to paragraph (c)(7)(ii) of Rule 2-01 of Regulation S-X. The notification provided to the registrant’s audit committee included sufficient details regarding such services to allow the registrant’s audit committee to consider the continuing independence of its principal accountant. |
ITEM 5. AUDIT COMMITTEE OF LISTED REGISTRANTS.
Not applicable.
ITEM 6. INVESTMENTS.
| |
| (a) | The schedule of investments is included as part of the report to stockholders filed under Item 1 of this Form. |
ITEM 7. DISCLOSURE OF PROXY VOTING POLICIES AND PROCEDURES FOR CLOSED-END MANAGEMENT INVESTMENT COMPANIES.
Not applicable.
ITEM 8. PORTFOLIO MANAGERS OF CLOSED-END MANAGEMENT INVESTMENT COMPANIES.
Not applicable.
ITEM 9. PURCHASES OF EQUITY SECURITIES BY CLOSED-END MANAGEMENT INVESTMENT COMPANY AND AFFILIATED PURCHASERS.
Not applicable.
ITEM 10. SUBMISSION OF MATTERS TO A VOTE OF SECURITY HOLDERS.
During the reporting period, there were no material changes to the procedures by which shareholders may recommend nominees to the registrant’s board.
ITEM 11. CONTROLS AND PROCEDURES.
| |
| (a) | The registrant's principal executive officer and principal financial officer have concluded that the registrant's disclosure controls and procedures (as defined in Rule 30a-3(c) under the Investment Company Act of 1940) are effective based on their evaluation of these controls and procedures as of a date within 90 days of the filing date of this report. |
| |
| (b) | There were no changes in the registrant's internal control over financial reporting (as defined in Rule 30a-3(d) under the Investment Company Act of 1940) that occurred during the registrant's second fiscal quarter of the period covered by this report that have materially affected, or are reasonably likely to materially affect, the registrant's internal control over financial reporting. |
ITEM 12. EXHIBITS.
| |
| (a)(1) | Registrant’s Code of Ethics for Senior Financial Officers, which is the subject of the disclosure required by Item 2 of Form N-CSR, was filed as Exhibit 12(a)(1) to American Century Asset Allocation Portfolios, Inc.’s Certified Shareholder Report on Form N-CSR, File No. 811-21591, on September 29, 2005. |
| |
| (a)(2) | Separate certifications by the registrant’s principal executive officer and principal financial officer, pursuant to Section 302 of the Sarbanes-Oxley Act of 2002 and Rule 30a-2(a) under the Investment Company Act of 1940, are filed and attached hereto as EX-99.CERT. |
| |
| (b) | A certification by the registrant’s chief executive officer and chief financial officer, pursuant to Section 906 of the Sarbanes-Oxley Act of 2002, is furnished and attached hereto as EX-99.906CERT. |
SIGNATURES
Pursuant to the requirements of the Securities Exchange Act of 1934 and the Investment Company Act of 1940, the registrant has duly caused this report to be signed on its behalf by the undersigned, thereunto duly authorized.
|
| | | |
| Registrant: | American Century Mutual Funds, Inc. |
| | | |
| By: | /s/ Jonathan S. Thomas |
| | Name: | Jonathan S. Thomas |
| | Title: | President |
| | | |
| Date: | January 7, 2015 |
Pursuant to the requirements of the Securities Exchange Act of 1934 and the Investment Company Act of 1940, this report has been signed below by the following persons on behalf of the registrant and in the capacities and on the dates indicated.
|
| | |
| By: | /s/ Jonathan S. Thomas |
| | Name: | Jonathan S. Thomas |
| | Title: | President |
| | | (principal executive officer) |
| | | |
| Date: | January 7, 2015 |
|
| | |
| By: | /s/ C. Jean Wade |
| | Name: | C. Jean Wade |
| | Title: | Vice President, Treasurer, and |
| | | Chief Financial Officer |
| | | (principal financial officer) |
| | | |
| Date: | January 7, 2015 |