Searchable text section of graphics shown above
[GRAPHIC]
[LOGO]
December 8, 2005
Annual New York Investor Forum
[LOGO]
Introductions & Opening Comments
Denny Oklak
Chairman & Chief Executive Officer
Agenda
9:00am - 9:30am | | Introduction and Opening Comments |
| | Denny Oklak |
| | |
9:30am - 10:30am | | Property Type and Development Panel |
| | Bob Chapman, Chris Seger, Steve Kennedy |
| | |
10:30am - 10:45am | | Break |
| | |
10:45am - 12:00pm | | Markets Panel |
| | Jim Connor, Bob Fessler, Don Hunter |
| | |
12:00pm - 12:30pm | | Summary and Questions and Answers |
| | |
12:30pm - 2:00pm | | Lunch/Speaker |
| | Glenn Hubbard - Dean, Columbia Graduate School of Business and Duke Board Member |
2005 Goals and Accomplishments
2006 Objectives
2005 Goals and Accomplishments
• Complete Flex Portfolio Sale
• Double Development Pipeline
• Geographic Expansion
• Actively Manage Balance Sheet
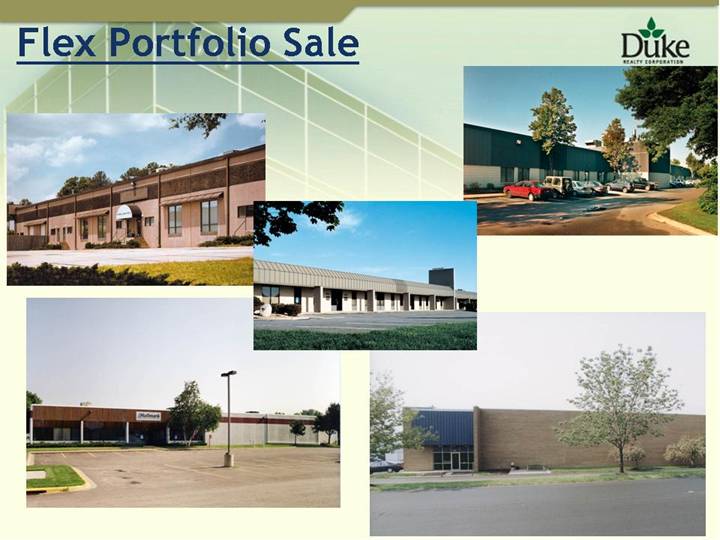
Flex Portfolio Sale
[GRAPHIC] | | [GRAPHIC] |
[GRAPHIC] |
[GRAPHIC] | | [GRAPHIC] |
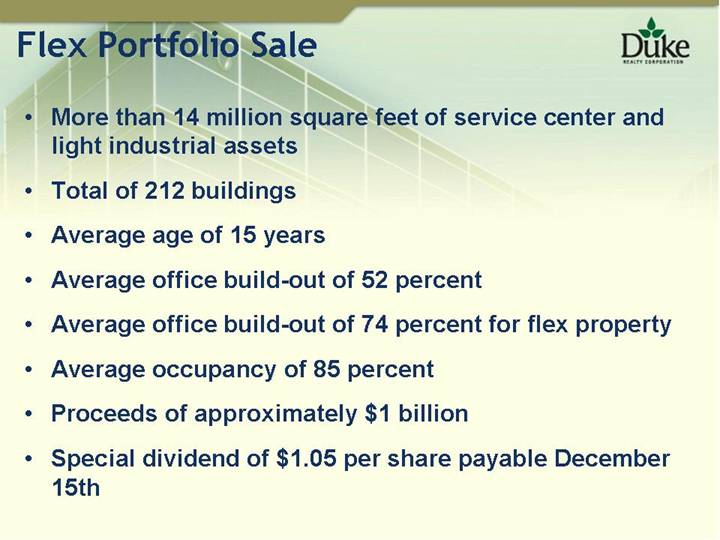
• More than 14 million square feet of service center and light industrial assets
• Total of 212 buildings
• Average age of 15 years
• Average office build-out of 52 percent
• Average office build-out of 74 percent for flex property
• Average occupancy of 85 percent
• Proceeds of approximately $1 billion
• Special dividend of $1.05 per share payable December 15th
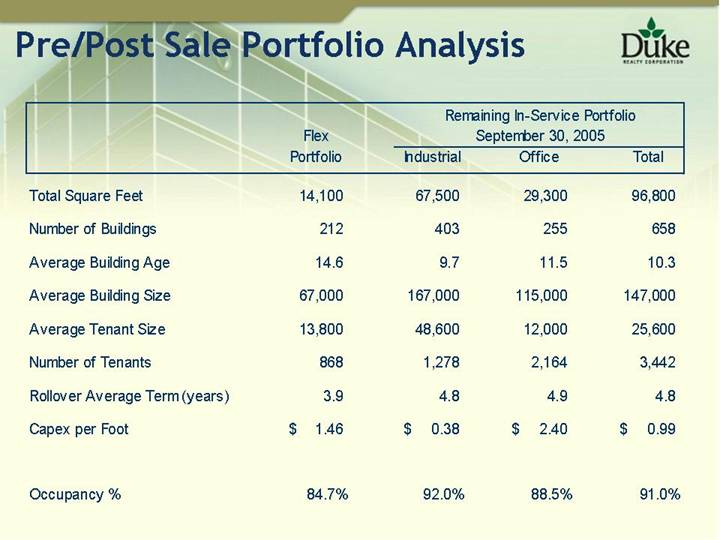
Pre/Post Sale Portfolio Analysis
| | Flex | | Remaining In-Service Portfolio
September 30, 2005 | |
| | Portfolio | | Industrial | | Office | | Total | |
| | | | | | | | | |
Total Square Feet | | 14,100 | | 67,500 | | 29,300 | | 96,800 | |
| | | | | | | | | |
Number of Buildings | | 212 | | 403 | | 255 | | 658 | |
| | | | | | | | | |
Average Building Age | | 14.6 | | 9.7 | | 11.5 | | 10.3 | |
| | | | | | | | | |
Average Building Size | | 67,000 | | 167,000 | | 115,000 | | 147,000 | |
| | | | | | | | | |
Average Tenant Size | | 13,800 | | 48,600 | | 12,000 | | 25,600 | |
| | | | | | | | | |
Number of Tenants | | 868 | | 1,278 | | 2,164 | | 3,442 | |
| | | | | | | | | |
Rollover Average Term (years) | | 3.9 | | 4.8 | | 4.9 | | 4.8 | |
| | | | | | | | | |
Capex per Foot | | $ | 1.46 | | $ | 0.38 | | $ | 2.40 | | $ | 0.99 | |
| | | | | | | | | |
Occupancy % | | 84.7 | % | 92.0 | % | 88.5 | % | 91.0 | % |
| | | | | | | | | | | | | |
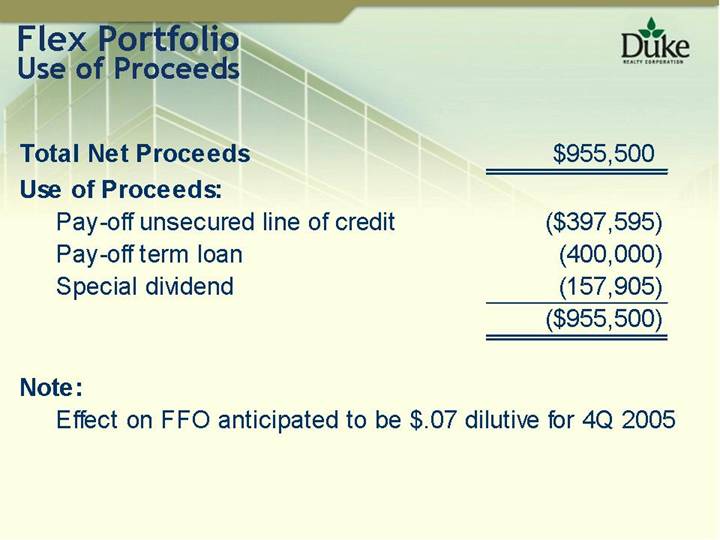
Flex Portfolio
Use of Proceeds
Total Net Proceeds | | $ | 955,500 | |
| | | | |
Use of Proceeds: | | | |
Pay-off unsecured line of credit | | $ | (397,595 | ) |
Pay-off term loan | | (400,000 | ) |
Special dividend | | (157,905 | ) |
| | $ | (955,500 | ) |
Note:
Effect on FFO anticipated to be $.07 dilutive for 4Q 2005
Searchable text section of graphics shown above
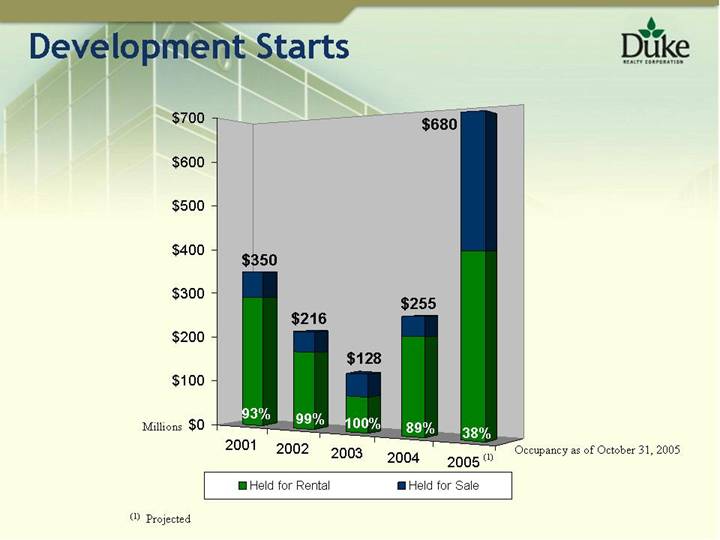
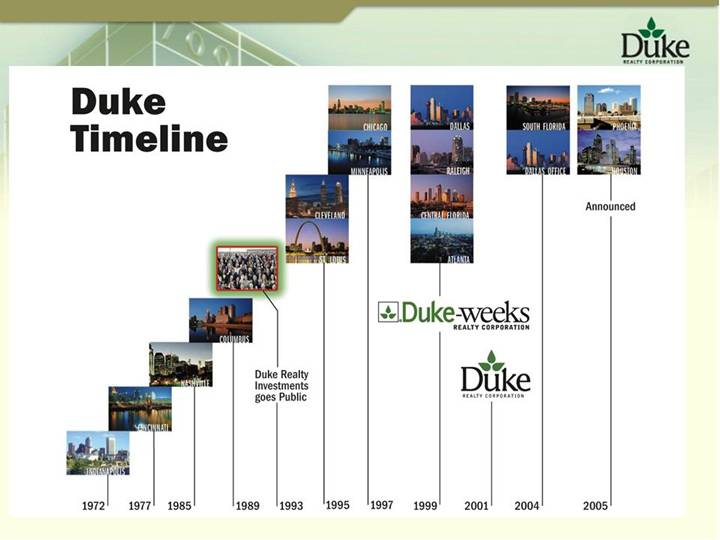
Development Starts
[CHART]
(1) Projected
Duke | | | | | | | | | | | | | | [GRAPHIC] | | | | [GRAPHIC] | | [GRAPHIC] | |
Timeline | | | | | | | | | | | | | | [GRAPHIC] | | | | [GRAPHIC] | | [GRAPHIC] | |
| | | | | | | | | | | | [GRAPHIC] | | [GRAPHIC] | | | | | | | |
| | | | | | | | | | | | [GRAPHIC] | | [GRAPHIC] | | | | | | Announced | |
| | | | | | | | | | [GRAPHIC] | | | | | | | | | | | |
| | | | | | | | | | [GRAPHIC] | | | | | | | | | | | |
| | | | | | | | [GRAPHIC] | | | | [LOGO] | | | |
| | | | | | [GRAPHIC] | | | | | | | | | | [LOGO] | | | |
| | | | [GRAPHIC] | | | | Duke Realty | | | | | | | | | | | | | |
| | [GRAPHIC] | | | | | | Investments | | | | | | | | | | | | | |
[GRAPHIC] | | | | | | | | goes Public | | | | | | | | | | | | | |
| | | | | | | | | | | | | | | | | | | | | |
| | | | | | | | | | | | | | | | | | | | | |
| | | | | | | | | | | | | | | | | | | | | |
1972 | | 1977 | | 1985 | | 1989 | | 1993 | | 1995 | | 1997 | | 1999 | | 2001 | | 2004 | | 2005 | |
Geographic Expansion
• Dallas Office
• Development opportunities
• South Florida
• Employment and Population Growth
• Houston
• Port of Houston and land available
• Phoenix
• Available land and large bulk market
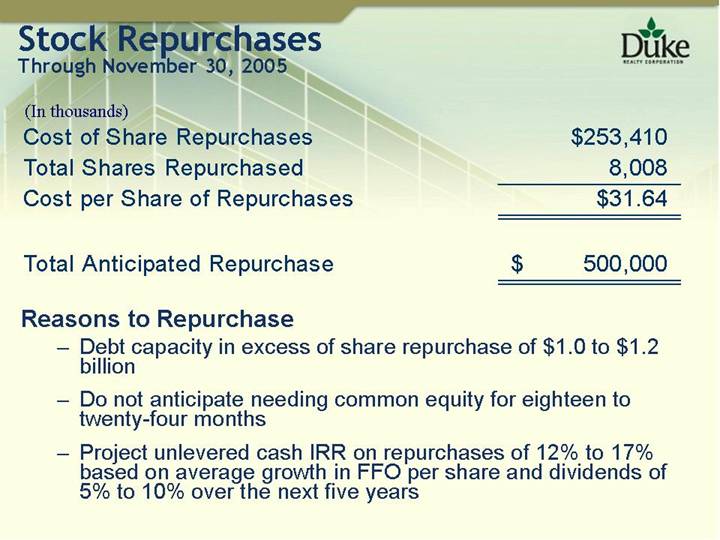
Stock Repurchases
Through November 30, 2005
(In thousands) | | | |
Cost of Share Repurchases | | $ | 253,410 | |
Total Shares Repurchased | | 8,008 | |
Cost per Share of Repurchases | | $ | 31.64 | |
| | | | |
Total Anticipated Repurchase | | $ | 500,000 | |
Reasons to Repurchase
• Debt capacity in excess of share repurchase of $1.0 to $1.2 billion
• Do not anticipate needing common equity for eighteen to twenty-four months
• Project unlevered cash IRR on repurchases of 12% to 17% based on average growth in FFO per share and dividends of 5% to 10% over the next five years
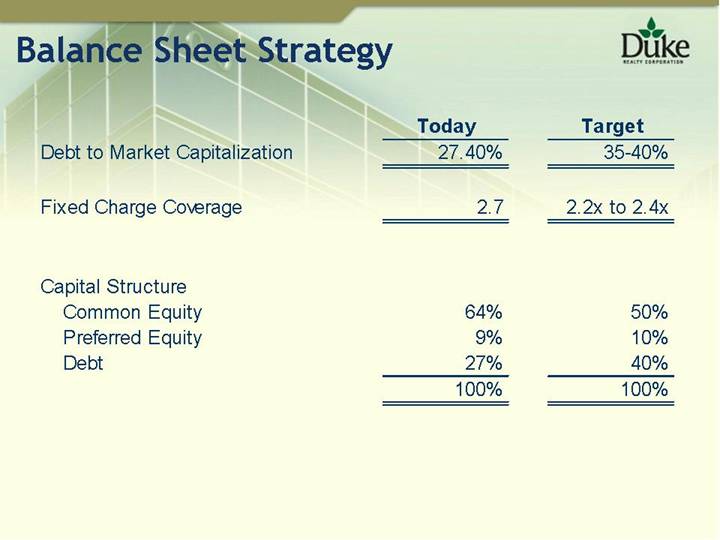
Balance Sheet Strategy
| | Today | | Target | |
Debt to Market Capitalization | | 27.40 | % | 35-40 | % |
| | | | | |
Fixed Charge Coverage | | 2.7 | | 2.2x to 2.4x | |
| | | | | |
Capital Structure | | | | | |
Common Equity | | 64 | % | 50 | % |
Preferred Equity | | 9 | % | 10 | % |
Debt | | 27 | % | 40 | % |
| | 100 | % | 100 | % |
2006 Objectives
• Continue to Expand Development Pipeline
• Goal of $800 million new starts
• Expand Joint Venture and Fund Business
• General Plan
• Office Acquisitions
• Held-for-Sale Development – industrial, office, medical office
Searchable text section of graphics shown above
2006 Objectives
• Expand New Market Opportunities
• Acquire prime bulk land positions
• Commence bulk development
• Complete acquisition of over 5 million square feet in Savannah
• Actively Manage Balance Sheet
• Continue share repurchase program up to $500 million
• Increase leverage
Property Type and Development Panel
Bob Chapman | Senior Executive Vice President, Real Estate Operations |
| |
Chris Seger | Executive Vice President, National Development |
| |
Steve Kennedy | Executive Vice President, Construction |
Property Types
• Advantages/Disadvantages
• Trends in Industrial and Office
• 2005 Development Analysis
• Land Analysis
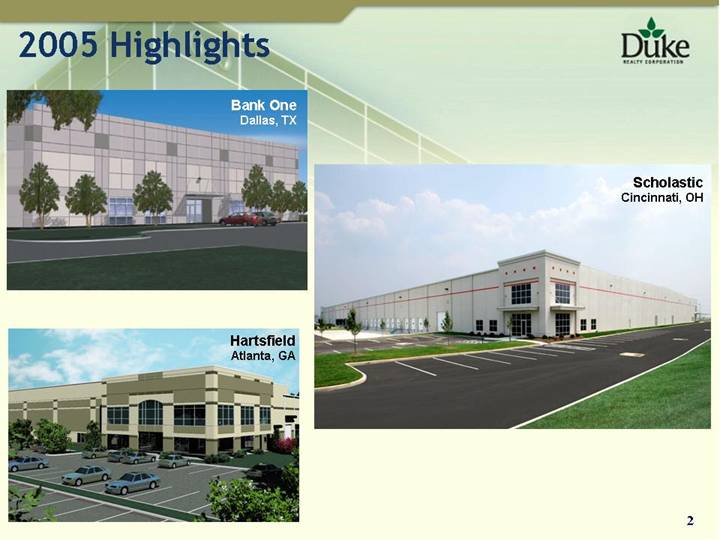
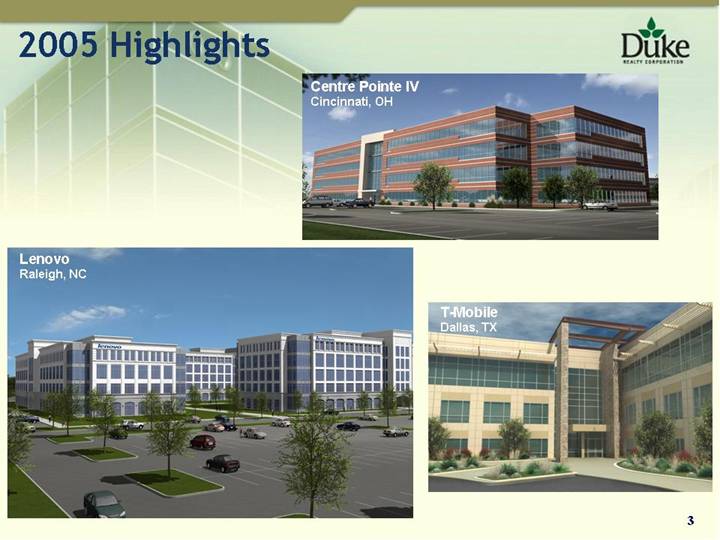
• 2005 Highlights
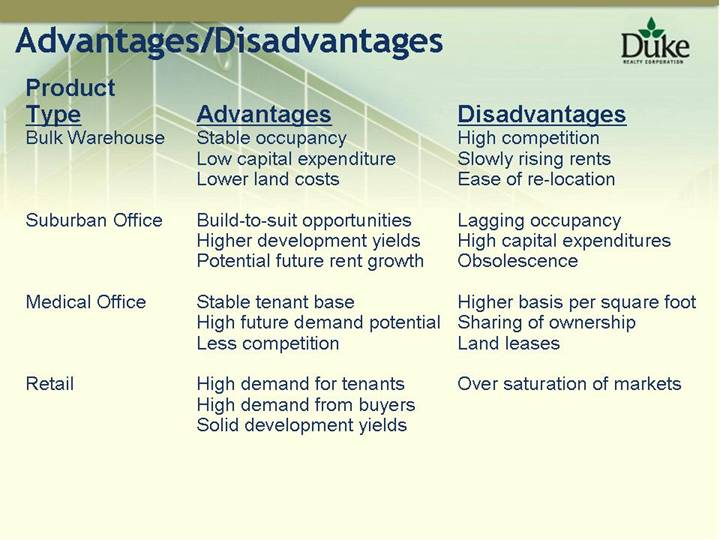
Advantages/Disadvantages
Product
Type | | Advantages | | Disadvantages |
Bulk Warehouse | | Stable occupancy | | High competition |
| | Low capital expenditure | | Slowly rising rents |
| | Lower land costs | | Ease of re-location |
| | | | |
Suburban Office | | Build-to-suit opportunities | | Lagging occupancy |
| | Higher development yields | | High capital expenditures |
| | Potential future rent growth | | Obsolescence |
| | | | |
Medical Office | | Stable tenant base | | Higher basis per square foot |
| | High future demand potential | | Sharing of ownership |
| | Less competition | | Land leases |
| | | | |
Retail | | High demand for tenants | | Over saturation of markets |
| | High demand from buyers | | |
| | Solid development yields | | |
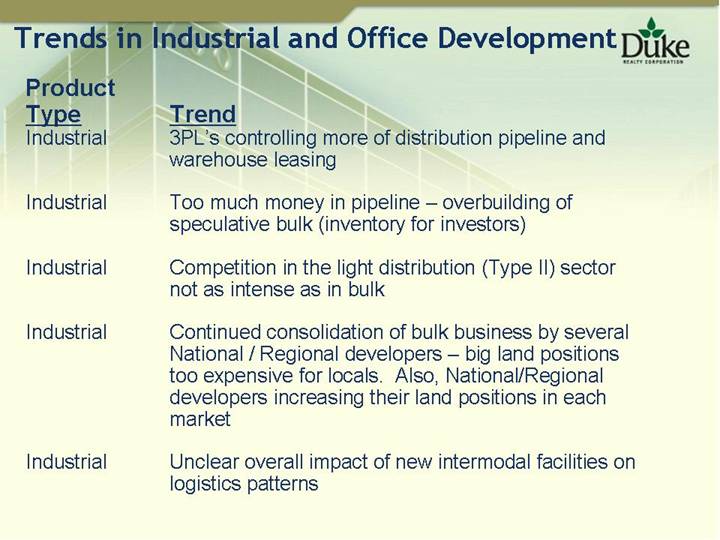
Trends in Industrial and Office Development
Product
Type | | Trend |
Industrial | | 3PL’s controlling more of distribution pipeline and warehouse leasing |
| | |
Industrial | | Too much money in pipeline – overbuilding of speculative bulk (inventory for investors) |
| | |
Industrial | | Competition in the light distribution (Type II) sector not as intense as in bulk |
| | |
Industrial | | Continued consolidation of bulk business by several National / Regional developers – big land positions too expensive for locals. Also, National/Regional developers increasing their land positions in each market |
| | |
Industrial | | Unclear overall impact of new intermodal facilities on logistics patterns |
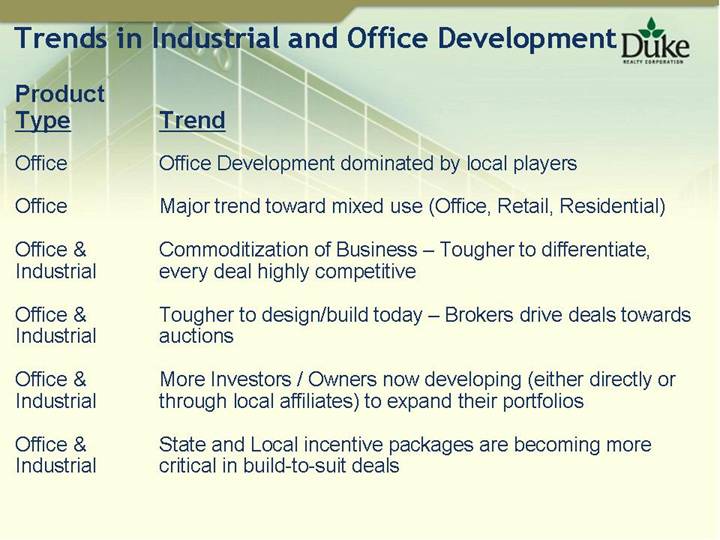
Trends in Industrial and Office Development
Product
Type | | Trend |
| | |
Office | | Office Development dominated by local players |
| | |
Office | | Major trend toward mixed use (Office, Retail, Residential) |
| | |
Office & Industrial | | Commoditization of Business – Tougher to differentiate, every deal highly competitive |
| | |
Office & Industrial | | Tougher to design/build today – Brokers drive deals towards auctions |
| | |
Office & Industrial | | More Investors / Owners now developing (either directly or through local affiliates) to expand their portfolios |
| | |
Office & Industrial | | State and Local incentive packages are becoming more critical in build-to-suit deals |
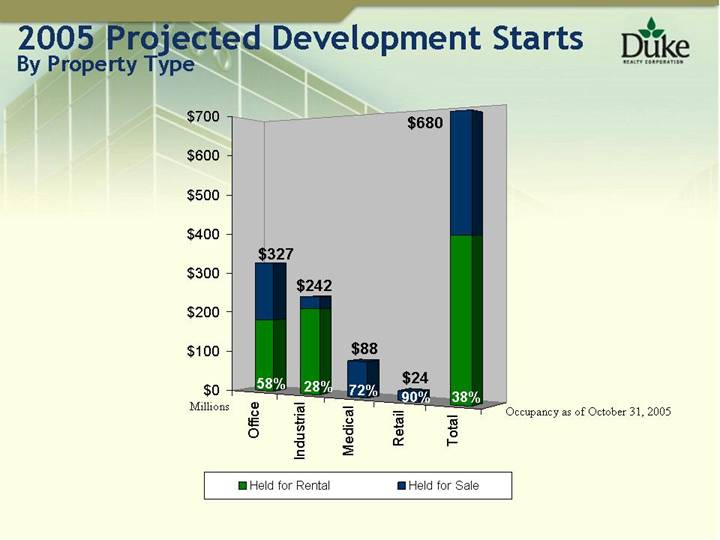
2005 Projected Development Starts
By Property Type
[CHART]
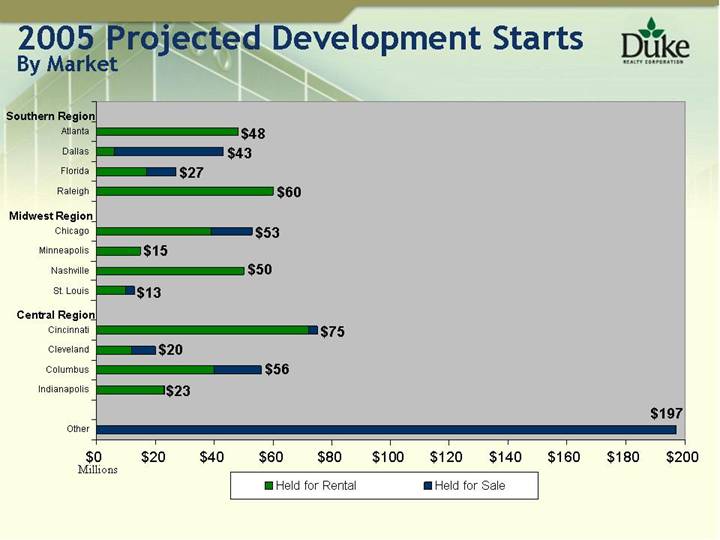
2005 Projected Development Starts
By Market
[CHART]
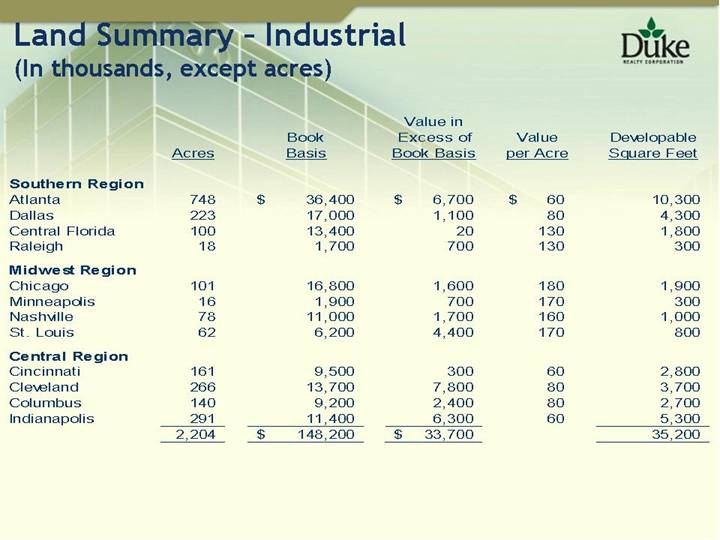
Land Summary - Industrial
(In thousands, except acres)
| | Acres | | Book
Basis | | Value in
Excess of
Book Basis | | Value
per Acre | | Developable
Square Feet | |
| | | | | | | | | | | |
Southern Region | | | | | | | | | | | |
Atlanta | | 748 | | $ | 36,400 | | $ | 6,700 | | $ | 60 | | 10,300 | |
Dallas | | 223 | | 17,000 | | 1,100 | | 80 | | 4,300 | |
Central Florida | | 100 | | 13,400 | | 20 | | 130 | | 1,800 | |
Raleigh | | 18 | | 1,700 | | 700 | | 130 | | 300 | |
| | | | | | | | | | | |
Midwest Region | | | | | | | | | | | |
Chicago | | 101 | | 16,800 | | 1,600 | | 180 | | 1,900 | |
Minneapolis | | 16 | | 1,900 | | 700 | | 170 | | 300 | |
Nashville | | 78 | | 11,000 | | 1,700 | | 160 | | 1,000 | |
St. Louis | | 62 | | 6,200 | | 4,400 | | 170 | | 800 | |
| | | | | | | | | | | |
Central Region | | | | | | | | | | | |
Cincinnati | | 161 | | 9,500 | | 300 | | 60 | | 2,800 | |
Cleveland | | 266 | | 13,700 | | 7,800 | | 80 | | 3,700 | |
Columbus | | 140 | | 9,200 | | 2,400 | | 80 | | 2,700 | |
Indianapolis | | 291 | | 11,400 | | 6,300 | | 60 | | 5,300 | |
| | 2,204 | | $ | 148,200 | | $ | 33,700 | | | | 35,200 | |
| | | | | | | | | | | | | | |
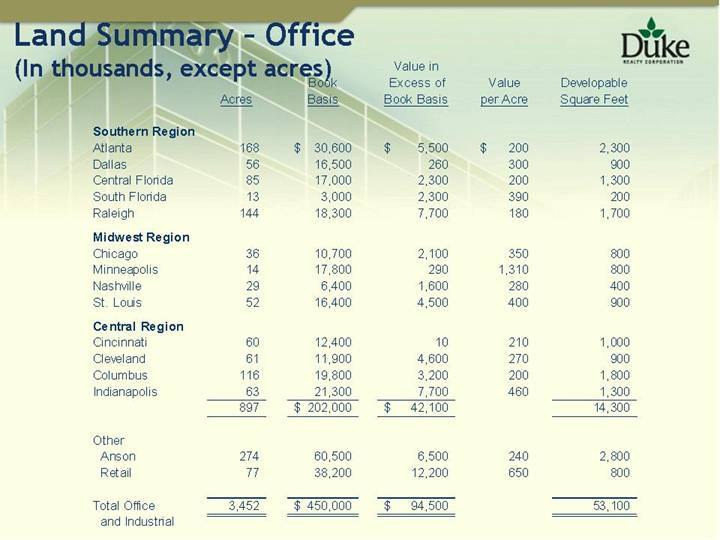
Land Summary - Office
(In thousands, except acres)
| | Acres | | Book
Basis | | Value in
Excess of
Book Basis | | Value
per Acre | | Developable
Square Feet | |
| | | | | | | | | | | |
Southern Region | | | | | | | | | | | |
Atlanta | | 168 | | $ | 30,600 | | $ | 5,500 | | $ | 200 | | 2,300 | |
Dallas | | 56 | | 16,500 | | 260 | | 300 | | 900 | |
Central Florida | | 85 | | 17,000 | | 2,300 | | 200 | | 1,300 | |
South Florida | | 13 | | 3,000 | | 2,300 | | 390 | | 200 | |
Raleigh | | 144 | | 18,300 | | 7,700 | | 180 | | 1,700 | |
| | | | | | | | | | | |
Midwest Region | | | | | | | | | | | |
Chicago | | 36 | | 10,700 | | 2,100 | | 350 | | 800 | |
Minneapolis | | 14 | | 17,800 | | 290 | | 1,310 | | 800 | |
Nashville | | 29 | | 6,400 | | 1,600 | | 280 | | 400 | |
St. Louis | | 52 | | 16,400 | | 4,500 | | 400 | | 900 | |
| | | | | | | | | | | |
Central Region | | | | | | | | | | | |
Cincinnati | | 60 | | 12,400 | | 10 | | 210 | | 1,000 | |
Cleveland | | 61 | | 11,900 | | 4,600 | | 270 | | 900 | |
Columbus | | 116 | | 19,800 | | 3,200 | | 200 | | 1,800 | |
Indianapolis | | 63 | | 21,300 | | 7,700 | | 460 | | 1,300 | |
| | 897 | | $ | 202,000 | | $ | 42,100 | | | | 14,300 | |
| | | | | | | | | | | |
Other | | | | | | | | | | | |
Anson | | 274 | | 60,500 | | 6,500 | | 240 | | 2,800 | |
Retail | | 77 | | 38,200 | | 12,200 | | 650 | | 800 | |
| | | | | | | | | | | |
Total Office and Industrial | | 3,452 | | $ | 450,000 | | $ | 94,500 | | | | 53,100 | |
| | | | | | | | | | | | | | |
Searchable text section of graphics shown above
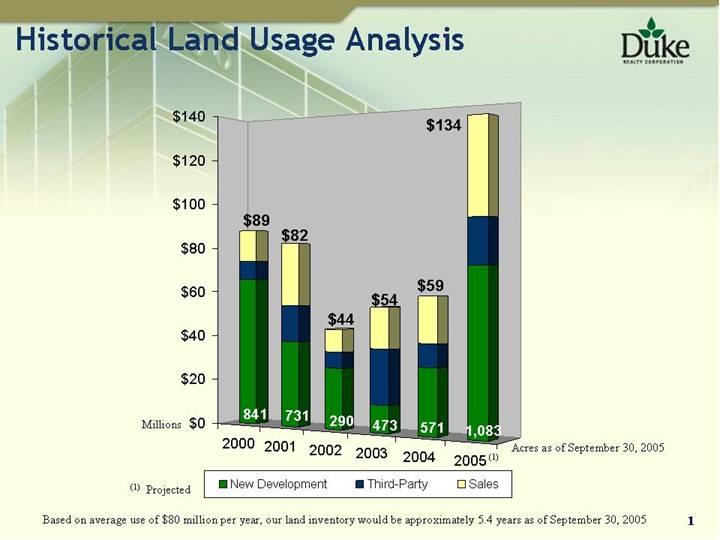
Historical Land Usage Analysis | | |
[CHART]
Based on average use of $80 million per year, our land inventory would be approximately 5.4 years as of September 30, 2005
1
[GRAPHIC] | | |
| | |
Bank One | | |
Dallas, TX | | |
| | |
[GRAPHIC] | | |
| | |
Hartsfield | | |
Atlanta, GA | | |
| | |
[GRAPHIC] | | |
| | |
Scholastic | | |
Cincinnati, OH | | |
2
[GRAPHIC] | |
| |
Centre Pointe IV | |
Cincinnati, OH | |
| |
[GRAPHIC] | |
| |
Lenovo | |
Raleigh, NC | |
| |
[GRAPHIC] | |
| |
T-Mobile | |
Dallas, TX | |
3
National Development
• National Build-to-Suit
• Healthcare Joint Venture
• Retail
• Anson
4
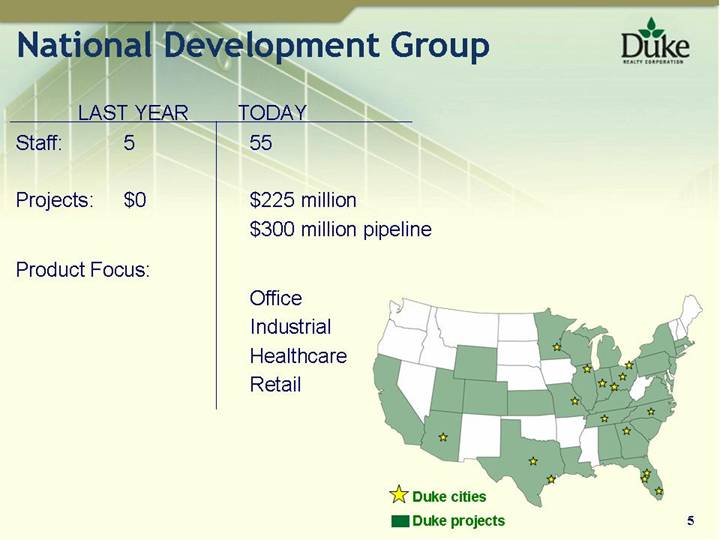
National Development Group
LAST YEAR | | | | TODAY | |
| | | | | |
Staff: | | 5 | | 55 | |
| | | | | |
Projects: | | $0 | | $225 million | |
| | | | $300 million pipeline | |
| | | | | |
Product Focus: | | | | | |
| | | | | |
| | | | Office | |
| | | | Industrial | |
| | | | Healthcare | |
| | | | Retail | |
[GRAPHIC]
5
Build-to-Suit Overview
• Leveraging our history as a contractor
• Leveraging our development expertise
• Leveraging relationships
6
Build-to-Suit Performance
2005 Starts: | | $125 million |
| | |
2006 Plan: | | $70 million |
| | |
Pre-tax Gross Margins: | | 15% - 20% |
7
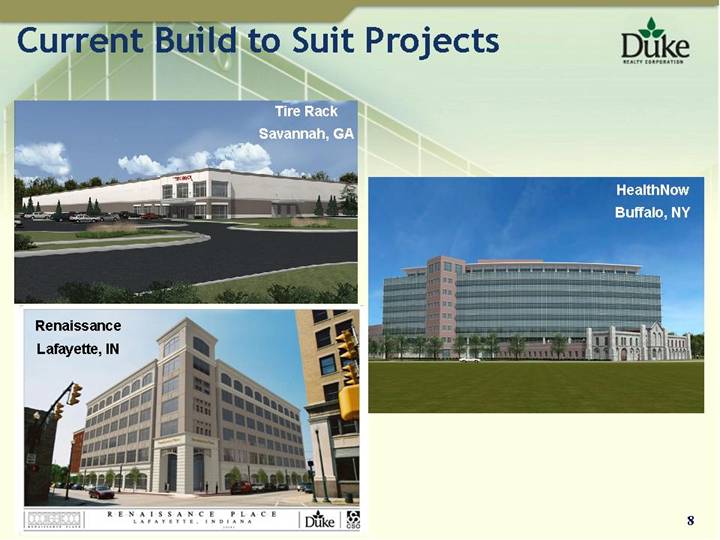
Current Build to Suit Projects
[GRAPHIC] | |
| |
Tire Rack | |
Savannah, GA | |
| |
[GRAPHIC] | |
| |
Renaissance | |
Lafayette, IN | |
| |
[GRAPHIC] | |
| |
HealthNow | |
Buffalo, NY | |
8
Healthcare Overview
• Building obsolescence
• Consumer demand
• 83 million baby boomers
• Technology
9
Trends in Healthcare Property Types
• Outpatient Medical Facilities
• MOB
• MOB/ASC
• Hospital
• “Traditional” hospital
• Replacement hospitals
• Long-term acute care facilities — LTAC
• Rehabilitation facilities - Rehab
• Skilled nursing facilities — Nursing homes
• Senior housing
10
Searchable text section of graphics shown above
Trends in Healthcare Property Types
• Outpatient Medical Facilities
• MOB
• MOB/ASC
• Hospital
• “Traditional” hospital
• Replacement hospitals
• Long-term acute care facilities – LTAC
• Rehabilitation facilities - Rehab
• Skilled nursing facilities – Nursing homes
• Senior housing
Healthcare Performance
2005 Starts: | | $ | 100 million | |
| | | |
2006 Plan: | | $ | 160 million | |
| | | |
Pre-tax Gross Margins: | | 20% - 30% | |
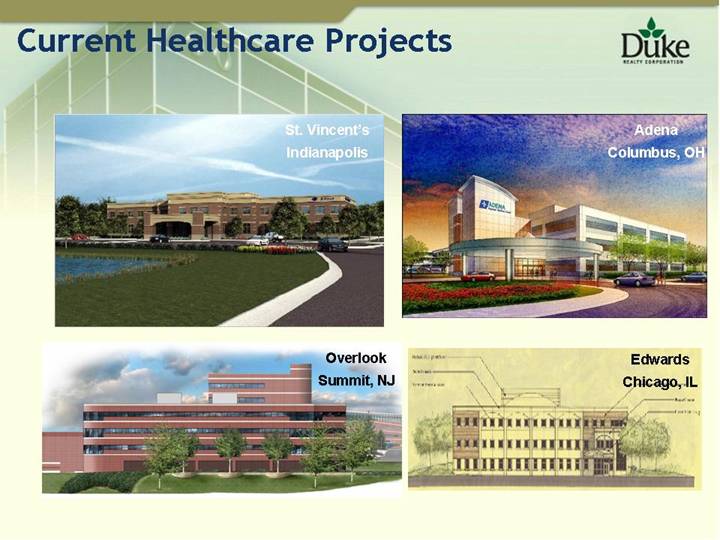
Current Healthcare Projects
St. Vincent’s
Indianapolis | | | |
| | |
[GRAPHIC] | | |
| | |
Adena
Columbus, OH | | | |
| | |
[GRAPHIC] | | |
| | |
Overlook
Summit, NJ | | | | |
| | |
[GRAPHIC] | | |
| | |
Edwards
Chicago, IL | | | |
| | |
[GRAPHIC] | | |
| | | | | |
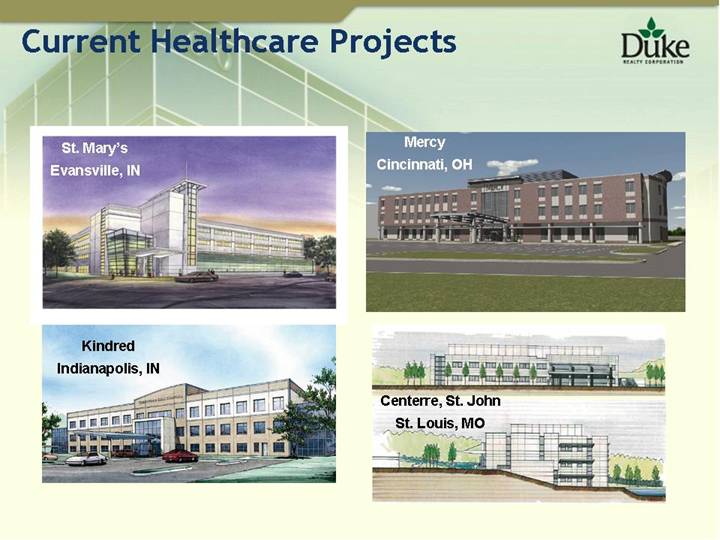
St. Mary’s
Evansville, IN | | | | |
| | |
[GRAPHIC] | | |
| | |
Mercy
Cincinnati, OH | | | |
| | |
[GRAPHIC] | | |
| | |
Kindred
Indianapolis, IN | | | | |
| | |
[GRAPHIC] | | |
| | |
Centerre, St. John
St. Louis, MO | | | |
| | |
[GRAPHIC] | | |
| | | | | | | |
Retail Overview
• Retail business remains strong in U.S.
• Fits our model
• Site selection
• Development
• Strong returns 30% – 40%
Joint Venture - Lifestyle Centers
• Lifestyle Centers
• Target affluent areas
• Upscale specialty retail without the major mall anchors
• Construction and operating expenses much less expensive vs. enclosed mall
• 50% growth rate expected during next 5 years
• Anderson’s expertise – 8 projects totaling $500 million
• Duke constructed 3 projects totaling $120 million with Anderson
• Joint venture currently includes four lifestyle centers
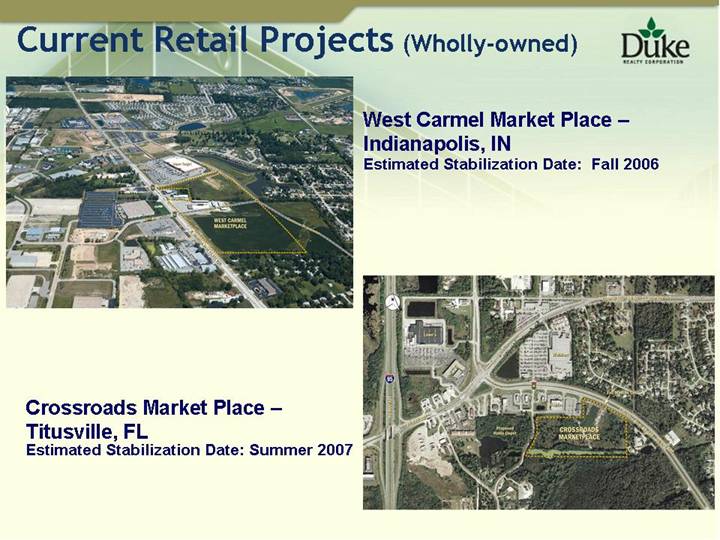
Current Retail Projects (Wholly-owned)
[GRAPHIC]
West Carmel Market Place –
Indianapolis, IN
Estimated Stabilization Date: Fall 2006
Crossroads Market Place –
Titusville, FL
Estimated Stabilization Date: Summer 2007
[GRAPHIC]
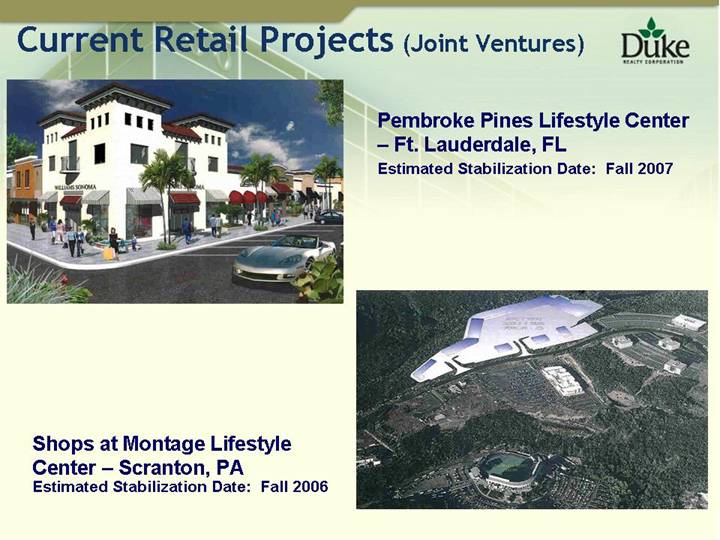
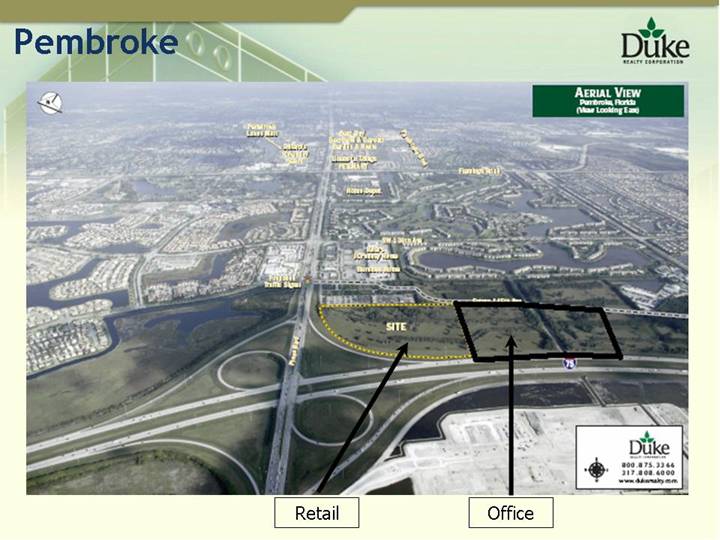
Current Retail Projects (Joint Ventures)
[GRAPHIC]
Pembroke Pines Lifestyle Center
– Ft. Lauderdale, FL
Estimated Stabilization Date: Fall 2007
Shops at Montage Lifestyle
Center – Scranton, PA
Estimated Stabilization Date: Fall 2006
[GRAPHIC]
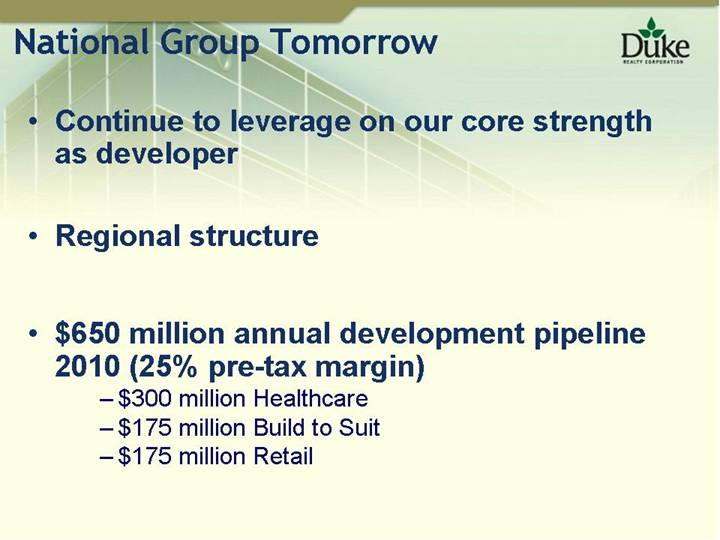
National Group Tomorrow
• Continue to leverage on our core strength as developer
• Regional structure
• $650 million annual development pipeline 2010 (25% pre-tax margin)
• $300 million Healthcare
• $175 million Build to Suit
• $175 million Retail
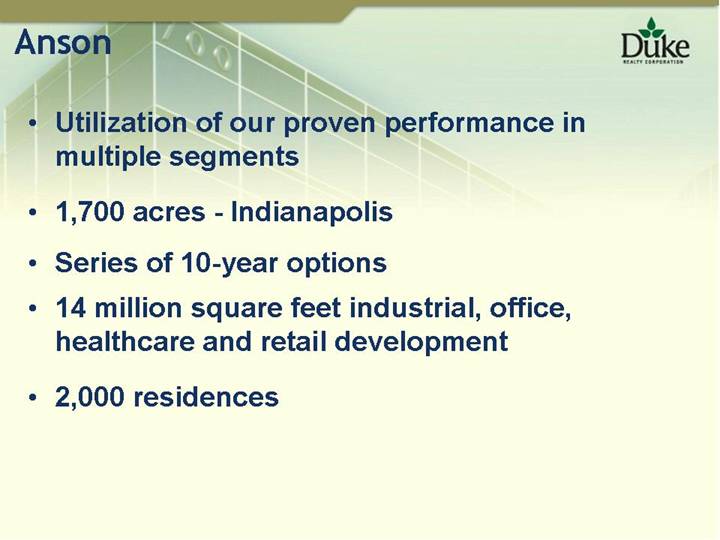
Anson
• Utilization of our proven performance in multiple segments
• 1,700 acres - Indianapolis
• Series of 10-year options
• 14 million square feet industrial, office, healthcare and retail development
• 2,000 residences
Link to searchable text of slide shown above
Link to searchable text of slide shown above
Link to searchable text of slide shown above
Link to searchable text of slide shown above
Link to searchable text of slide shown above
Link to searchable text of slide shown above
Searchable text section of graphics shown above
Construction
• Construction Model – Human Resources Perspective
• Recent Constructions Trends
[LOGO]
DESIGN BUILD
GENERAL CONTRACTING
CONSTRUCTION MANAGEMENT
Construction Model – People / Positions
• Proactive management of development execution
• Designed to impact developed product & outcome
• Combine design, engineering, development & construction expertise
• Collaboration w/ real estate & asset management professionals
• Professional positions align with development timeline
• Duke’s competitive advantage
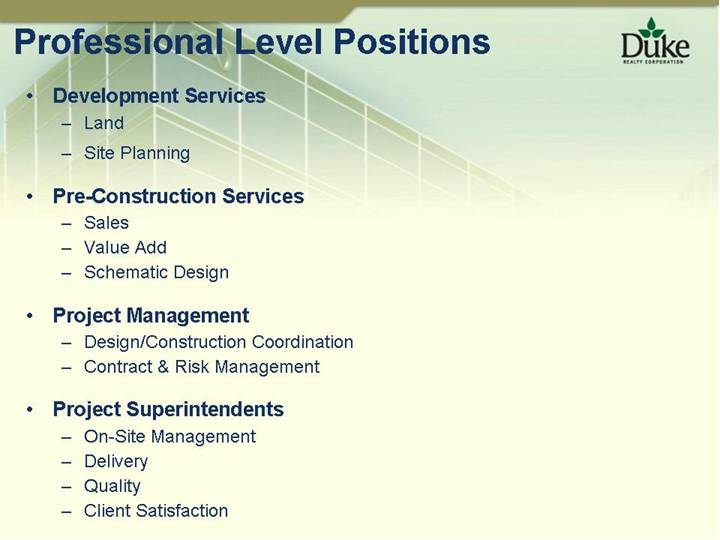
Professional Level Positions
• Development Services
• Land
• Site Planning
• Pre-Construction Services
• Sales
• Value Add
• Schematic Design
• Project Management
• Design/Construction Coordination
• Contract & Risk Management
• Project Superintendents
• On-Site Management
• Delivery
• Quality
• Client Satisfaction
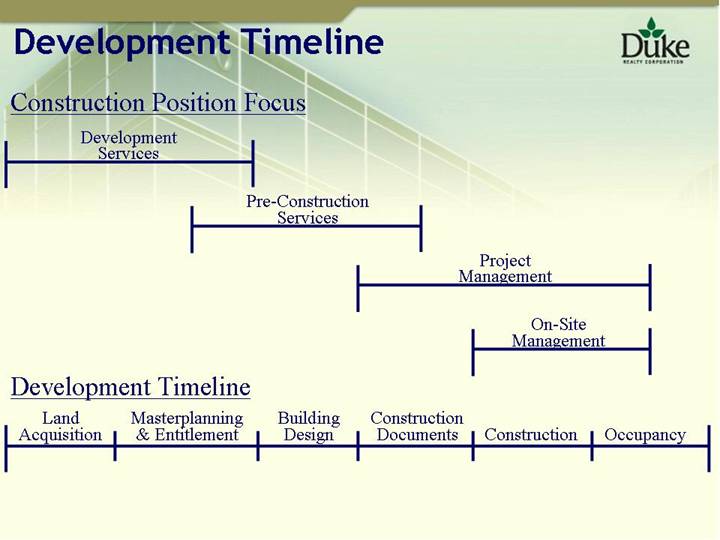
Development Timeline
Construction Position Focus
Development | | | | | | | | | | |
Services | | | | | | | | | | |
| | | | Pre-Construction | | | | | | |
| | | | Services | | | | | | |
| | | | | | | | Project | | |
| | | | | | | | Management | | |
| | | | | | | | | | On-Site |
| | | | | | | | | | Management |
Development Timeline
Land | | Masterplanning | | Building | | Construction | | | | | |
Acquisition | | & Entitlement | | Design | | Documents | | Construction | | Occupancy | |
| | | | | | | | | | | |
Construction Cost Increases
• Building Components – Most Significant Cost Increases
• Steel
• Roofing Systems
• Concrete
• Suburban Office and Bulk Industrial: 15% - 20% over past 2 years
• Active management of proposal/pre-construction process
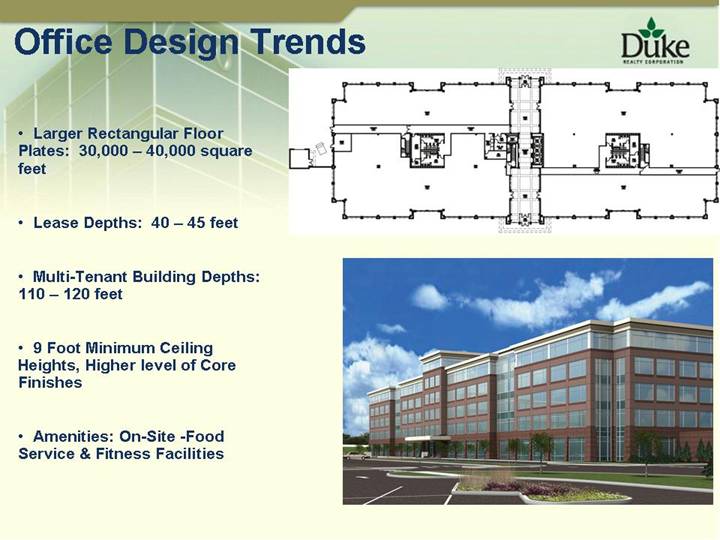
Office Design Trends
• Larger Rectangular Floor Plates: 30,000 – 40,000 square feet
• Lease Depths: 40 – 45 feet
• Multi-Tenant Building Depths: 110 – 120 feet
• 9 Foot Minimum Ceiling Heights, Higher level of Core Finishes
• Amenities: On-Site -Food Service & Fitness Facilities
[GRAPHIC]
[GRAPHIC]
Searchable text section of graphics shown above
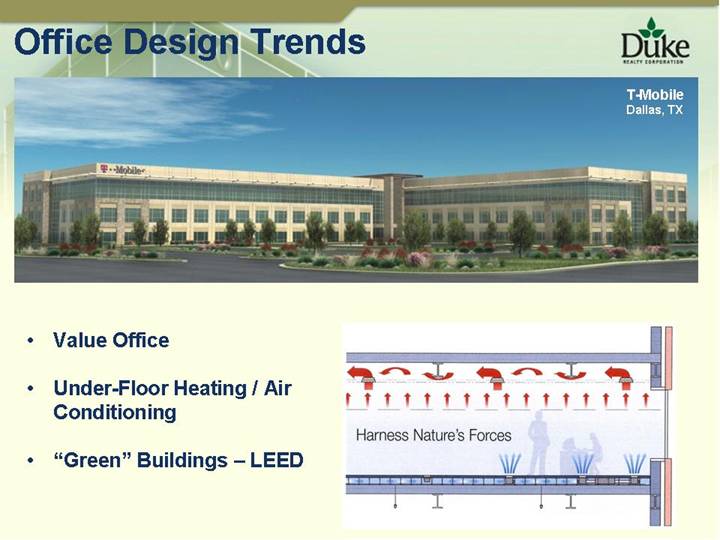
Office Design Trends
T-Mobile
Dallas, TX
[GRAPHIC]
• Value Office
• Under-Floor Heating / Air Conditioning
• “Green” Buildings – LEED
[GRAPHIC]
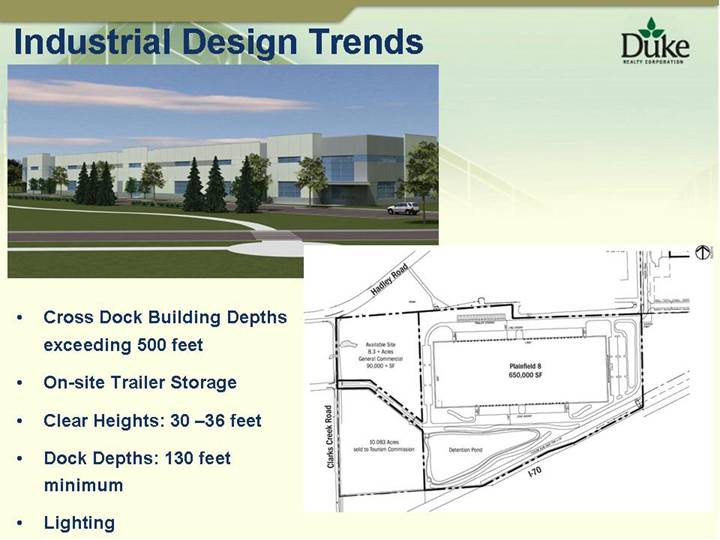
Industrial Design Trends
[GRAPHIC]
• Cross Dock Building Depths exceeding 500 feet
• On-site Trailer Storage
• Clear Heights: 30 –36 feet
• Dock Depths: 130 feet minimum
• Lighting
[GRAPHIC]
Markets Panel
Jim Connor | Executive Vice President, Midwest Region |
| |
Bob Fessler | Executive Vice President, Southern Region |
| |
Don Hunter | Executive Vice President, Central Region |
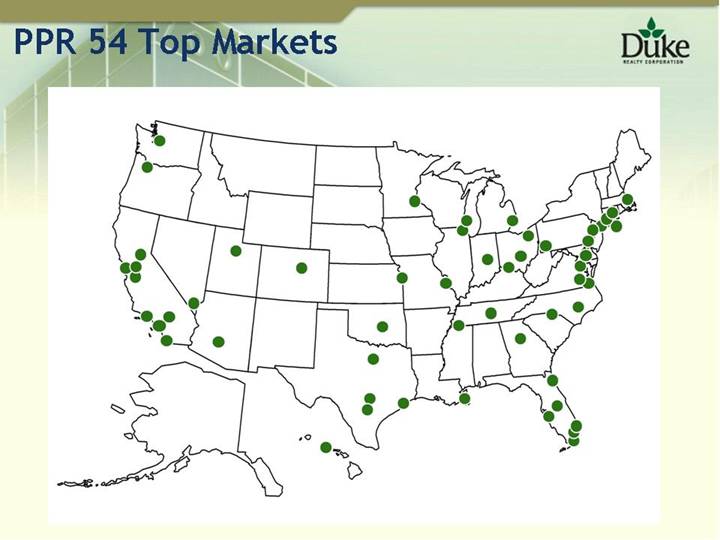
PPR 54 Top Markets
[GRAPHIC]
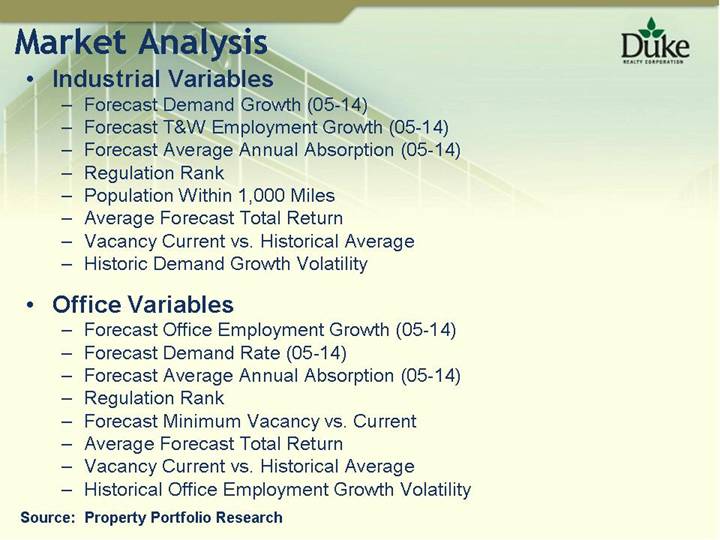
Market Analysis
• Industrial Variables
• Forecast Demand Growth (05-14)
• Forecast T&W Employment Growth (05-14)
• Forecast Average Annual Absorption (05-14)
• Regulation Rank
• Population Within 1,000 Miles
• Average Forecast Total Return
• Vacancy Current vs. Historical Average
• Historic Demand Growth Volatility
• Office Variables
• Forecast Office Employment Growth (05-14)
• Forecast Demand Rate (05-14)
• Forecast Average Annual Absorption (05-14)
• Regulation Rank
• Forecast Minimum Vacancy vs. Current
• Average Forecast Total Return
• Vacancy Current vs. Historical Average
• Historical Office Employment Growth Volatility
Source: Property Portfolio Research
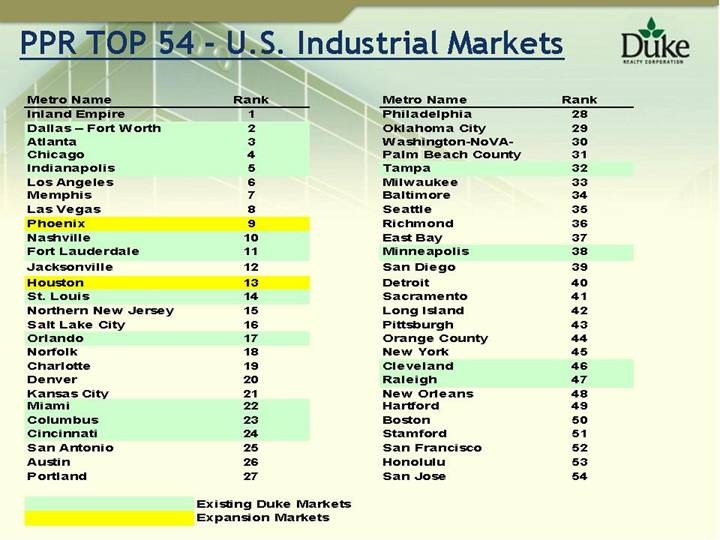
PPR TOP 54 - U.S. Industrial Markets
Metro Name | | Rank |
Inland Empire | | 1 |
Dallas – Fort Worth* | | 2 |
Atlanta* | | 3 |
Chicago* | | 4 |
Indianapolis* | | 5 |
Los Angeles | | 6 |
Memphis | | 7 |
Las Vegas | | 8 |
Phoenix** | | 9 |
Nashville* | | 10 |
Fort Lauderdale* | | 11 |
Jacksonville | | 12 |
Houston** | | 13 |
St. Louis* | | 14 |
Northern New Jersey | | 15 |
Salt Lake City | | 16 |
Orlando* | | 17 |
Norfolk | | 18 |
Charlotte | | 19 |
Denver | | 20 |
Kansas City | | 21 |
Miami* | | 22 |
Columbus* | | 23 |
Cincinnati* | | 24 |
San Antonio | | 25 |
Austin | | 26 |
Portland | | 27 |
Philadelphia | | 28 |
Oklahoma City | | 29 |
Washington-NoVA-MD | | 30 |
Palm Beach County | | 31 |
Tampa* | | 32 |
Milwaukee | | 33 |
Baltimore | | 34 |
Seattle | | 35 |
Richmond | | 36 |
East Bay | | 37 |
Minneapolis* | | 38 |
San Diego | | 39 |
Detroit | | 40 |
Sacramento | | 41 |
Long Island | | 42 |
Pittsburgh | | 43 |
Orange County | | 44 |
New York | | 45 |
Cleveland* | | 46 |
Raleigh* | | 47 |
New Orleans | | 48 |
Hartford | | 49 |
Boston | | 50 |
Stamford | | 51 |
San Francisco | | 52 |
Honolulu | | 53 |
San Jose | | 54 |
* Existing Duke Markets
** Expansion Markets
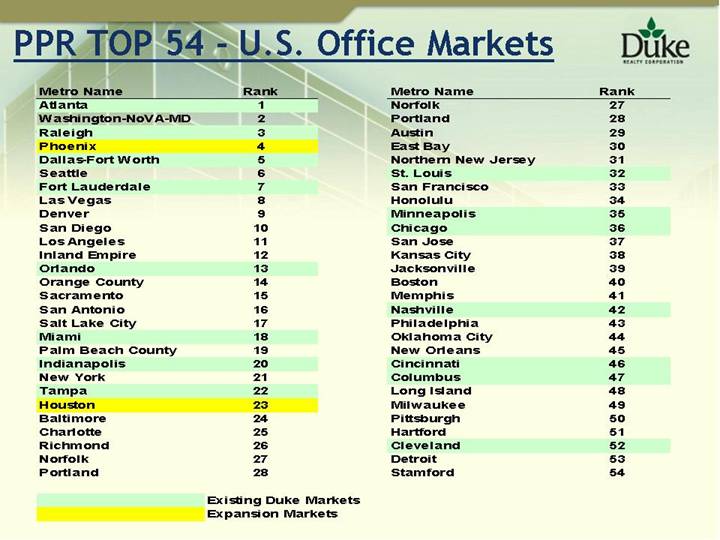
PPR TOP 54 - U.S. Office Markets
Metro Name | | Rank |
Atlanta* | | 1 |
Washington-NoVA-MD | | 2 |
Raleigh* | | 3 |
Phoenix** | | 4 |
Dallas-Fort Worth* | | 5 |
Seattle | | 6 |
Fort Lauderdale* | | 7 |
Las Vegas | | 8 |
Denver | | 9 |
San Diego | | 10 |
Los Angeles | | 11 |
Inland Empire | | 12 |
Orlando* | | 13 |
Orange County | | 14 |
Sacramento | | 15 |
San Antonio | | 16 |
Salt Lake City | | 17 |
Miami* | | 18 |
Palm Beach County | | 19 |
Indianapolis* | | 20 |
New York | | 21 |
Tampa* | | 22 |
Houston** | | 23 |
Baltimore | | 24 |
Charlotte | | 25 |
Richmond | | 26 |
Norfolk | | 27 |
Portland | | 28 |
Norfolk | | 27 |
Portland | | 28 |
Austin | | 29 |
East Bay | | 30 |
Northern New Jersey | | 31 |
St. Louis* | | 32 |
San Francisco | | 33 |
Honolulu | | 34 |
Minneapolis* | | 35 |
Chicago* | | 36 |
San Jose | | 37 |
Kansas City | | 38 |
Jacksonville | | 39 |
Boston | | 40 |
Memphis | | 41 |
Nashville* | | 42 |
Philadelphia | | 43 |
Oklahoma City | | 44 |
New Orleans | | 45 |
Cincinnati* | | 46 |
Columbus* | | 47 |
Long Island | | 48 |
Milwaukee | | 49 |
Pittsburgh | | 50 |
Hartford | | 51 |
Cleveland* | | 52 |
Detroit | | 53 |
Stamford | | 54 |
* Existing Duke Markets
** Expansion Markets
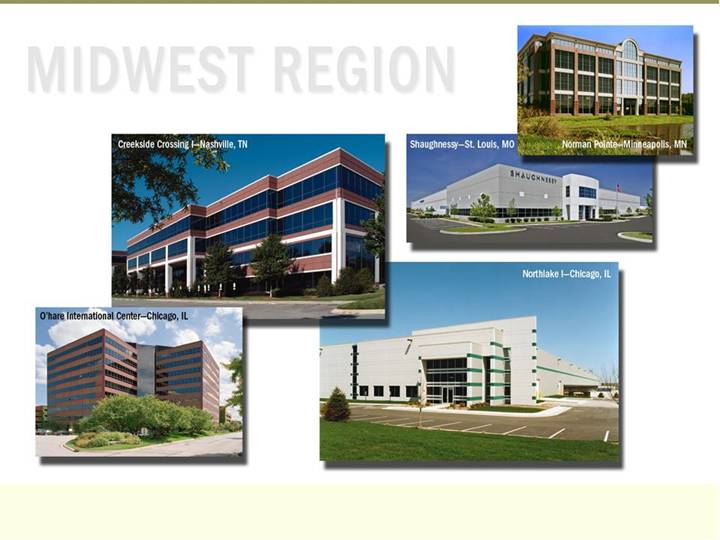
MIDWEST REGION
Creekside Crossing I–Nashville, TN
[GRAPHIC]
O’hare International Center–Chicago, IL
[GRAPHIC]
Norman Pointe–Minneapolis, MN
[GRAPHIC]
Shaughnessy–St. Louis, MO
[GRAPHIC]
Northlake I–Chicago, IL
[GRAPHIC]
Searchable text section of graphics shown above
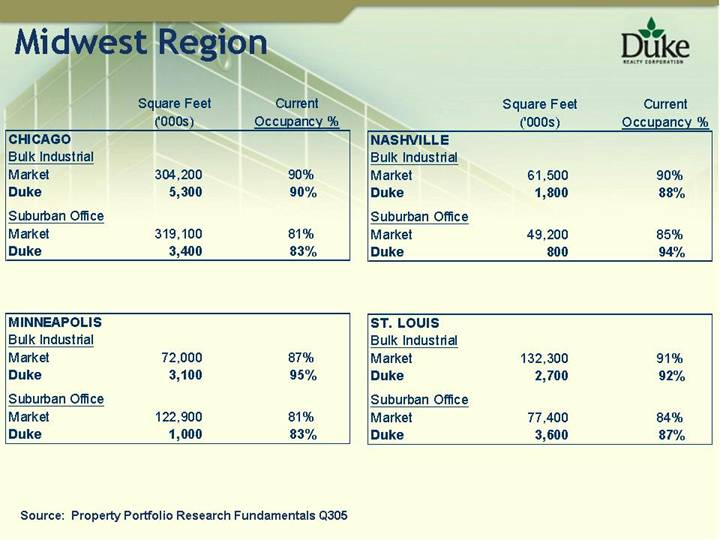
| | Square Feet | | Current | |
| | (‘000s) | | Occupancy % | |
CHICAGO | | | | | |
Bulk Industrial | | | | | |
Market | | 304,200 | | 90 | % |
Duke | | 5,300 | | 90 | % |
| | | | | |
Suburban Office | | | | | |
Market | | 319,100 | | 81 | % |
Duke | | 3,400 | | 83 | % |
| | | | | |
MINNEAPOLIS | | | | | |
Bulk Industrial | | | | | |
Market | | 72,000 | | 87 | % |
Duke | | 3,100 | | 95 | % |
| | | | | |
Suburban Office | | | | | |
Market | | 122,900 | | 81 | % |
Duke | | 1,000 | | 83 | % |
| | | | | |
NASHVILLE | | | | | |
Bulk Industrial | | | | | |
Market | | 61,500 | | 90 | % |
Duke | | 1,800 | | 88 | % |
| | | | | |
Suburban Office | | | | | |
Market | | 49,200 | | 85 | % |
Duke | | 800 | | 94 | % |
| | | | | |
ST. LOUIS | | | | | |
Bulk Industrial | | | | | |
Market | | 132,300 | | 91 | % |
Duke | | 2,700 | | 92 | % |
| | | | | |
Suburban Office | | | | | |
Market | | 77,400 | | 84 | % |
Duke | | 3,600 | | 87 | % |
Source: Property Portfolio Research Fundamentals Q305
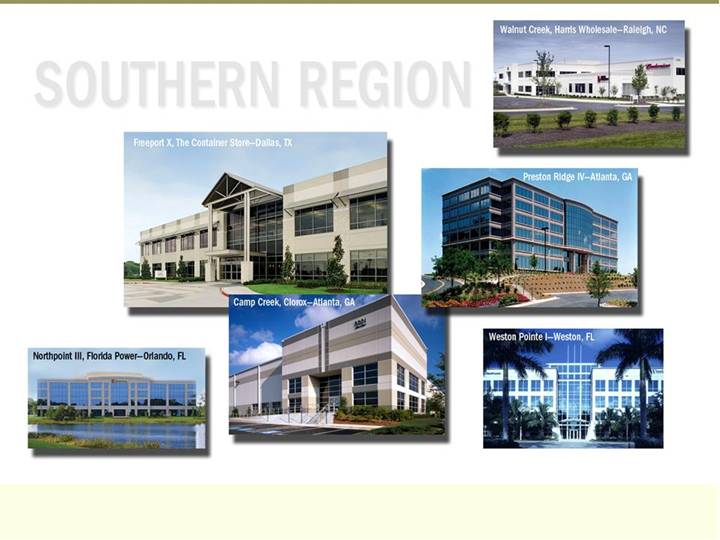
SOUTHERN REGION
Walnut Creek, Harris Wholesale–Raleigh, NC
[GRAPHIC]
Freeport X, The Container Store–Dallas, TX
[GRAPHIC]
Preston Ridge IV–Atlanta, GA
[GRAPHIC]
Northpoint III, Florida Power–Oriando, FL
[GRAPHIC]
Camp Creek, Clorox–Atlanta, GA
[GRAPHIC]
Weston Pointe I–Weston, Fl
[GRAPHIC]
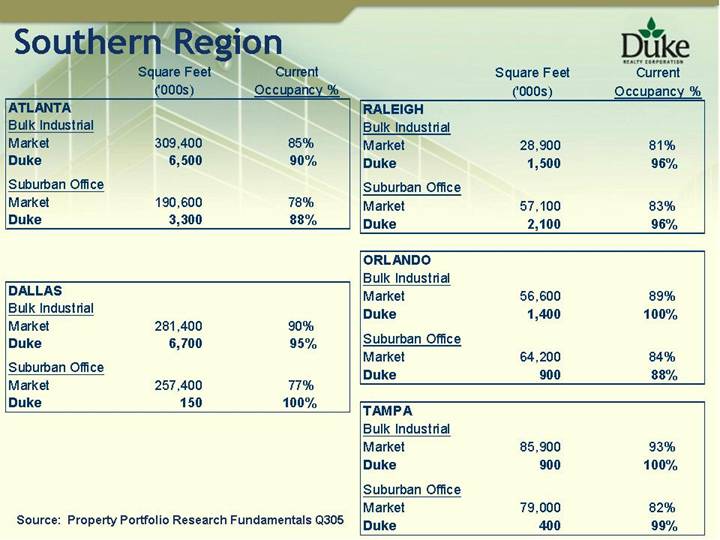
Southern Region
| | Square Feet | | Current | |
| | (‘000s) | | Occupancy % | |
ATLANTA | | | | | |
Bulk Industrial | | | | | |
Market | | 309,400 | | 85 | % |
Duke | | 6,500 | | 90 | % |
| | | | | |
Suburban Office | | | | | |
Market | | 190,600 | | 78 | % |
Duke | | 3,300 | | 88 | % |
| | | | | |
DALLAS | | | | | |
Bulk Industrial | | | | | |
Market | | 281,400 | | 90 | % |
Duke | | 6,700 | | 95 | % |
| | | | | |
Suburban Office | | | | | |
Market | | 257,400 | | 77 | % |
Duke | | 150 | | 100 | % |
| | | | | |
RALEIGH | | | | | |
Bulk Industrial | | | | | |
Market | | 28,900 | | 81 | % |
Duke | | 1,500 | | 96 | % |
| | | | | |
Suburban Office | | | | | |
Market | | 57,100 | | 83 | % |
Duke | | 2,100 | | 96 | % |
| | | | | |
ORLANDO | | | | | |
Bulk Industrial | | | | | |
Market | | 56,600 | | 89 | % |
Duke | | 1,400 | | 100 | % |
| | | | | |
Suburban Office | | | | | |
Market | | 64,200 | | 84 | % |
Duke | | 900 | | 88 | % |
| | | | | |
TAMPA | | | | | |
Bulk Industrial | | | | | |
Market | | 85,900 | | 93 | % |
Duke | | 900 | | 100 | % |
| | | | | |
Suburban Office | | | | | |
Market | | 79,000 | | 82 | % |
Duke | | 400 | | 99 | % |
Source: Property Portfolio Research Fundamentals Q305
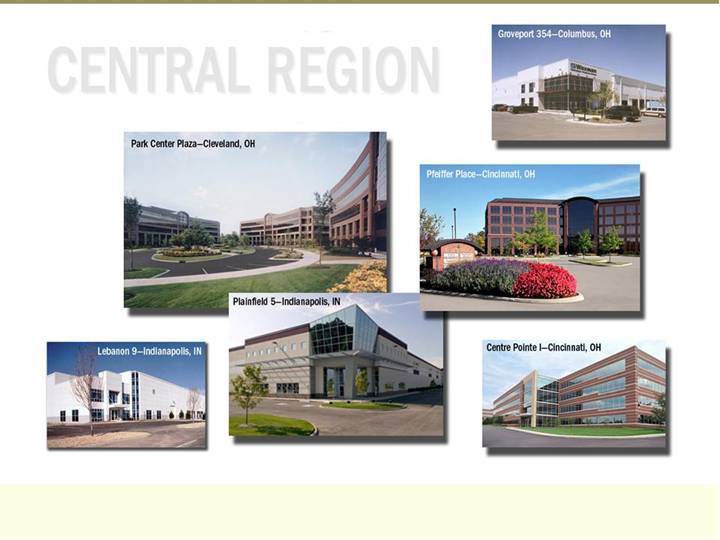
CENTRAL REGION
Groveport 354–Columbus, OH
[GRAPHIC]
Park Center Plaza–Cleveland, OH
[GRAPHIC]
Pfeiffer Place–Cincinnati, OH
[GRAPHIC]
Lebanon 9–Indianapolis, IN
[GRAPHIC]
Plainfield 5–Indianapolis, IN
[GRAPHIC]
Centre Pointe I–Cincinnati, OH
[GRAPHIC]
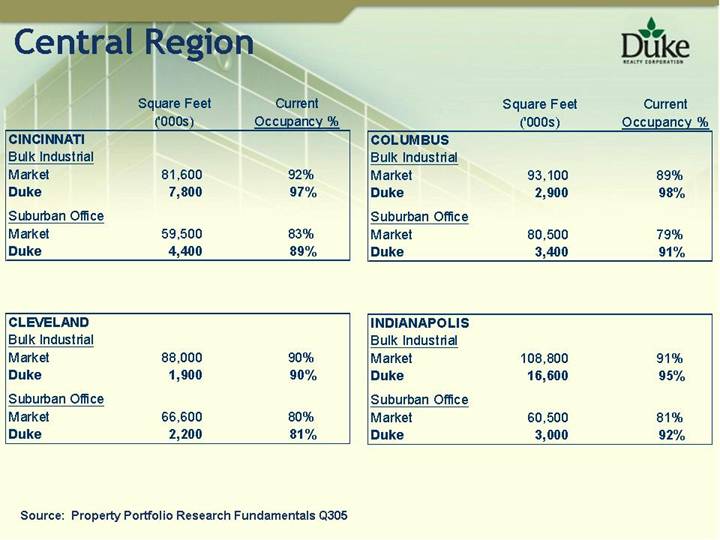
Central Region
| | Square Feet | | Current | |
| | (‘000s) | | Occupancy % | |
CINCINNATI | | | | | |
Bulk Industrial | | | | | |
Market | | 81,600 | | 92 | % |
Duke | | 7,800 | | 97 | % |
| | | | | |
Suburban Office | | | | | |
Market | | 59,500 | | 83 | % |
Duke | | 4,400 | | 89 | % |
| | | | | |
CLEVELAND | | | | | |
Bulk Industrial | | | | | |
Market | | 88,000 | | 90 | % |
Duke | | 1,900 | | 90 | % |
| | | | | |
Suburban Office | | | | | |
Market | | 66,600 | | 80 | % |
Duke | | 2,200 | | 81 | % |
| | | | | |
COLUMBUS | | | | | |
Bulk Industrial | | | | | |
Market | | 93,100 | | 89 | % |
Duke | | 2,900 | | 98 | % |
| | | | | |
Suburban Office | | | | | |
Market | | 80,500 | | 79 | % |
Duke | | 3,400 | | 91 | % |
| | | | | |
INDIANAPOLIS | | | | | |
Bulk Industrial | | | | | |
Market | | 108,800 | | 91 | % |
Duke | | 16,600 | | 95 | % |
| | | | | |
Suburban Office | | | | | |
Market | | 60,500 | | 81 | % |
Duke | | 3,000 | | 92 | % |
Source: Property Portfolio Research Fundamentals Q305
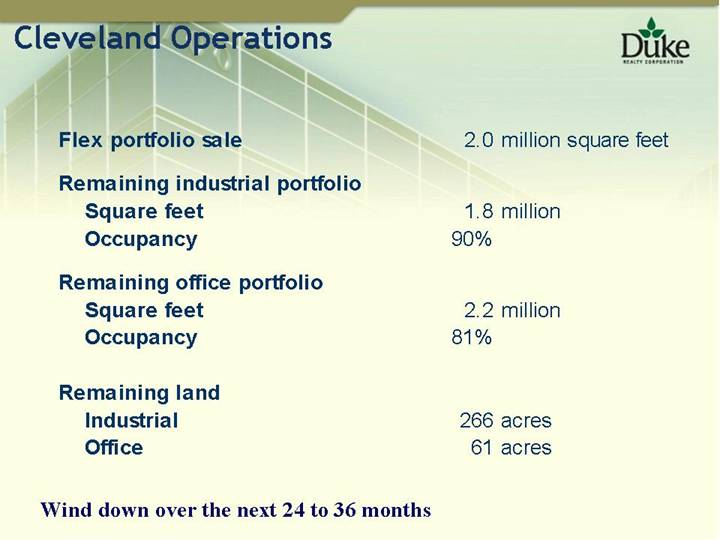
Cleveland Operations
Flex portfolio sale | | 2.0 | million square feet |
| | | |
Remaining industrial portfolio | | | |
Square feet | | 1.8 | million |
Occupancy | | 90 | % |
| | | |
Remaining office portfolio | | | |
Square feet | | 2.2 | million |
Occupancy | | 81 | % |
| | | |
Remaining land | | | |
Industrial | | 266 | acres |
Office | | 61 | acres |
Wind down over the next 24 to 36 months
New Markets
• South Florida
• Savannah
• Houston
• Phoenix
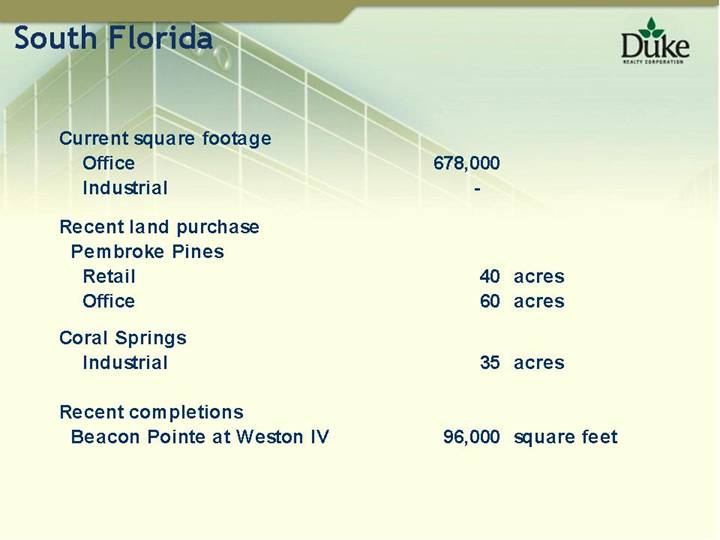
South Florida
Current square footage | | | |
Office | | 678,000 | |
Industrial | | — | |
| | | |
Recent land purchase | | | |
Pembroke Pines | | | |
Retail | | 40 | acres |
Office | | 60 | acres |
| | | |
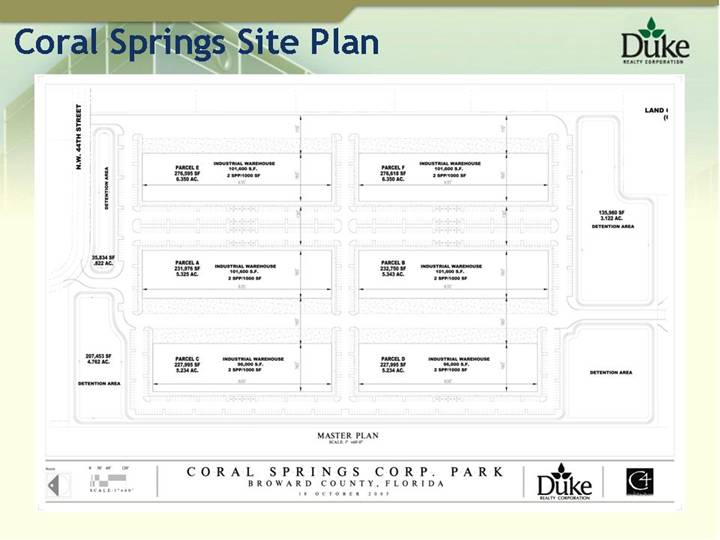
Coral Springs | | | |
Industrial | | 35 | acres |
| | | |
Recent completions | | | |
Beacon Pointe at Weston IV | | 96,000 | square feet |
South Florida
[GRAPHIC]
• OFFICE
1 Sawgrass Pointe; Sunrise, FL
2 Weston Pointe; Weston, FL
3 Pembroke Pines; Pembroke, FL
4 Coral Springs; Coral Springs, FL
Searchable text section of graphics shown above
Coral Springs Site Plan
[GRAPHIC]
MASTER PLAN
SCALE 1” =60’-0”
North | | CORAL SPRINGS CORP. PARK | | |
[GRAPHIC] | [GRAPHIC] | BROWARD COUNTY, FLORIDA | [LOGO] | [LOGO] |
| | 18 OCTOBER 2005 | | |
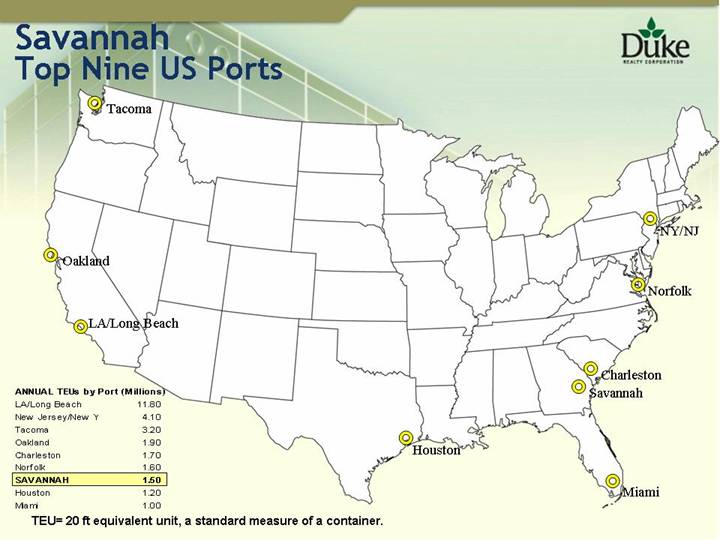
Savannah
Top Nine US Ports
[GRAPHIC]
ANNUAL TEUs by Port (Millions)
LA/Long Beach | | 11.80 | |
New Jersey/New York | | 4.10 | |
Tacoma | | 3.20 | |
Oakland | | 1.90 | |
Charleston | | 1.70 | |
Norfolk | | 1.60 | |
SAVANNAH | | 1.50 | |
Houston | | 1.20 | |
Miami | | 1.00 | |
TEU= 20 ft equivalent unit, a standard measure of a container.
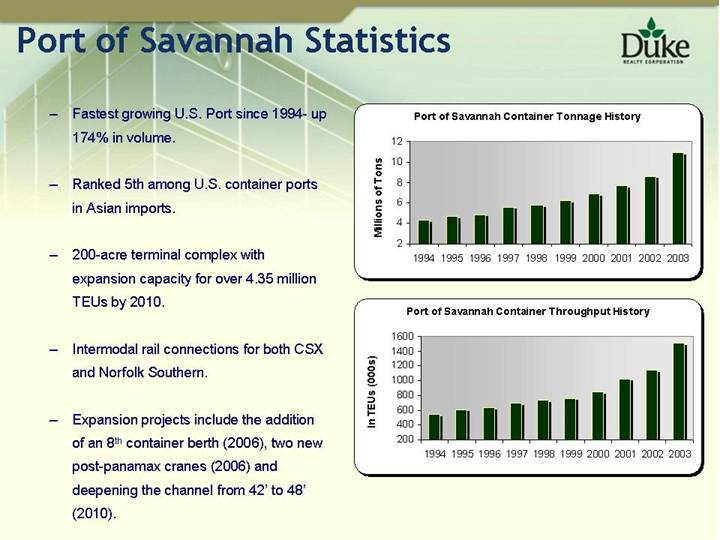
Port of Savannah Statistics
• Fastest growing U.S. Port since 1994- up 174% in volume.
• Ranked 5th among U.S. container ports in Asian imports.
• 200-acre terminal complex with expansion capacity for over 4.35 million TEUs by 2010.
• Intermodal rail connections for both CSX and Norfolk Southern.
• Expansion projects include the addition of an 8th container berth (2006), two new post-panamax cranes (2006) and deepening the channel from 42’ to 48’ (2010).
Port of Savannah Container Tonnage History
[CHART]
Port of Savannah Container Throughput History
[CHART]
Searchable text section of graphics shown above
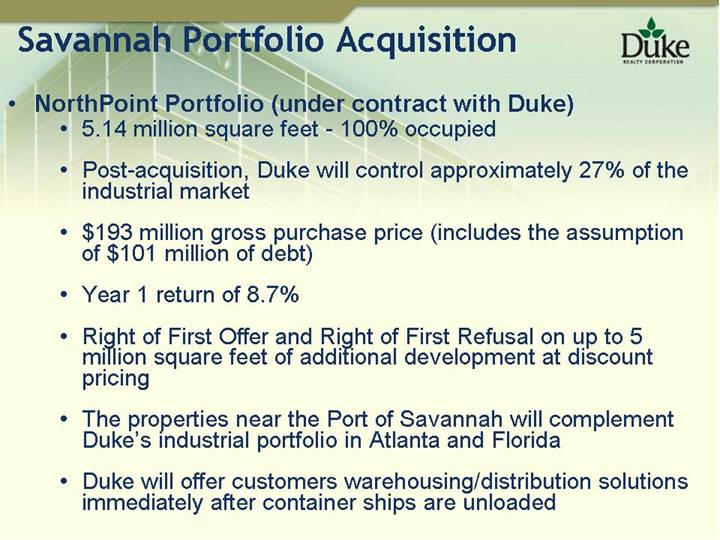
Savannah Portfolio Acquisition
• NorthPoint Portfolio (under contract with Duke)
• 5.14 million square feet - 100% occupied
• Post-acquisition, Duke will control approximately 27% of the industrial market
• $193 million gross purchase price (includes the assumption of $101 million of debt)
• Year 1 return of 8.7%
• Right of First Offer and Right of First Refusal on up to 5 million square feet of additional development at discount pricing
• The properties near the Port of Savannah will complement Duke’s industrial portfolio in Atlanta and Florida
• Duke will offer customers warehousing/distribution solutions immediately after container ships are unloaded
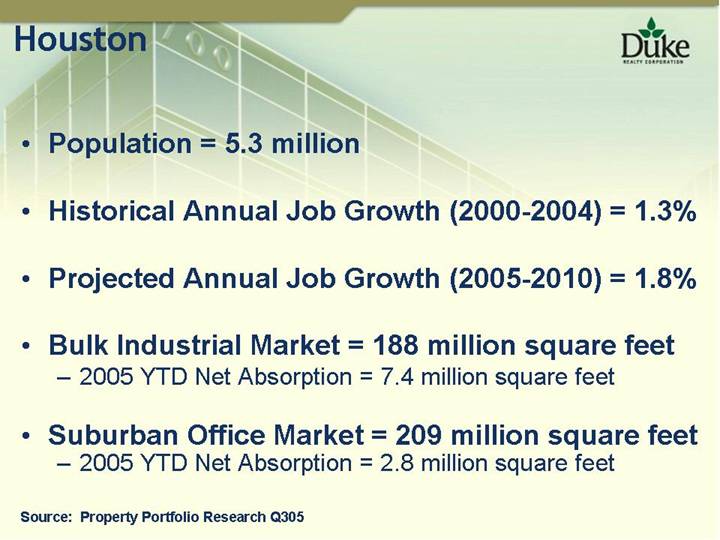
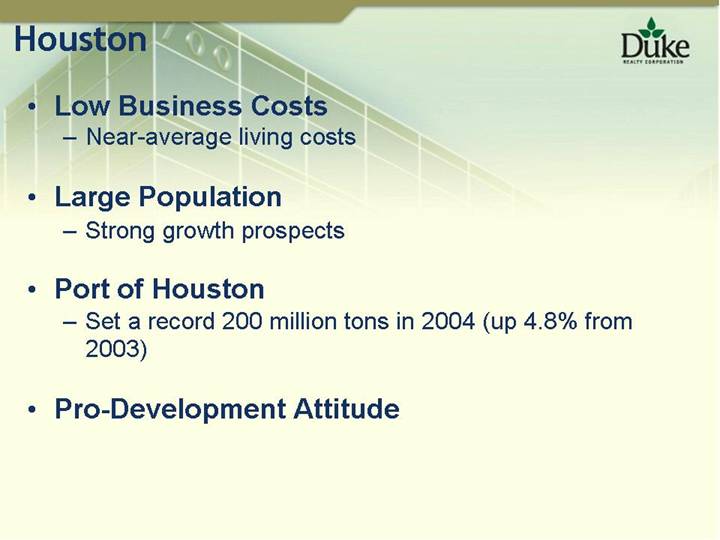
Houston
• Population = 5.3 million
• Historical Annual Job Growth (2000-2004) = 1.3%
• Projected Annual Job Growth (2005-2010) = 1.8%
• Bulk Industrial Market = 188 million square feet
• 2005 YTD Net Absorption = 7.4 million square feet
• Suburban Office Market = 209 million square feet
• 2005 YTD Net Absorption = 2.8 million square feet
Source: Property Portfolio Research Q305
• Low Business Costs
• Near-average living costs
• Large Population
• Strong growth prospects
• Port of Houston
• Set a record 200 million tons in 2004 (up 4.8% from 2003)
• Pro-Development Attitude
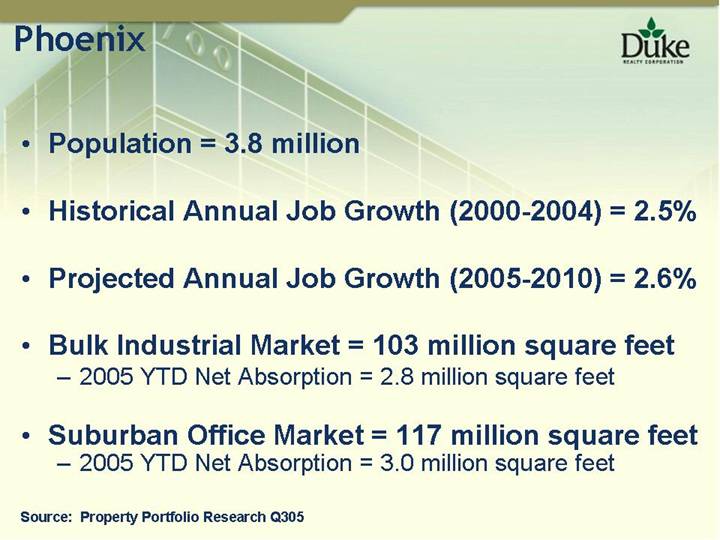
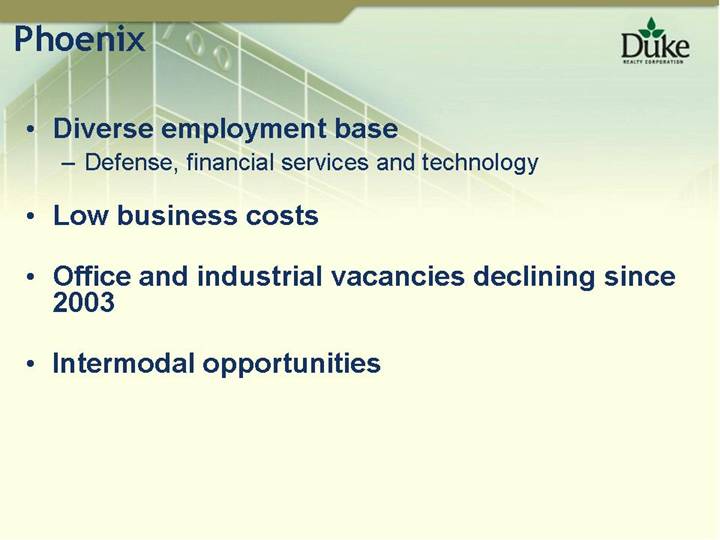
Phoenix
• Population = 3.8 million
• Historical Annual Job Growth (2000-2004) = 2.5%
• Projected Annual Job Growth (2005-2010) = 2.6%
• Bulk Industrial Market = 103 million square feet
• 2005 YTD Net Absorption = 2.8 million square feet
• Suburban Office Market = 117 million square feet
• 2005 YTD Net Absorption = 3.0 million square feet
Source: Property Portfolio Research Q305
• Diverse employment base
• Defense, financial services and technology
• Low business costs
• Office and industrial vacancies declining since 2003
• Intermodal opportunities
Searchable text section of graphics shown above
2007 and Beyond
• Continue to Increase the Development Pipeline
• Goal is to exceed $1 Billion annually in new development starts by 2010
• Continue Geographic Expansion
• Measured pace
• Property Type Focus
• Wholly-own bulk industrial
• Joint venture office
• Sell or joint venture medical office and retail
• Acquisitions
• We will continue to be a cautious acquirer
• Greater use of joint ventures for strategic acquisitions
• We will pursue acquisition targets for business combinations if we believe the quality of the portfolio and pricing is accretive long-term
• Balance Sheet
• Increase leverage moderately
• Maintain current ratings of Baa1 and BBB+
• Focus on FFO Growth and Return on Shareholders Equity
• New development
• Fund and joint venture fee business
• Geographic expansion
• Redeploying proceeds into higher growth markets
Summary
• 2005 a very strong and successful year
• Back on the growth track in 2006
• 2007 and Beyond – A focused strategy for long-term growth
[GRAPHIC]
[LOGO]
December 8, 2005
Thank you for joining us today
Searchable text section of graphics shown above
`
[LOGO]
December 8, 2005
Annual New York Investor Forum
Appendix
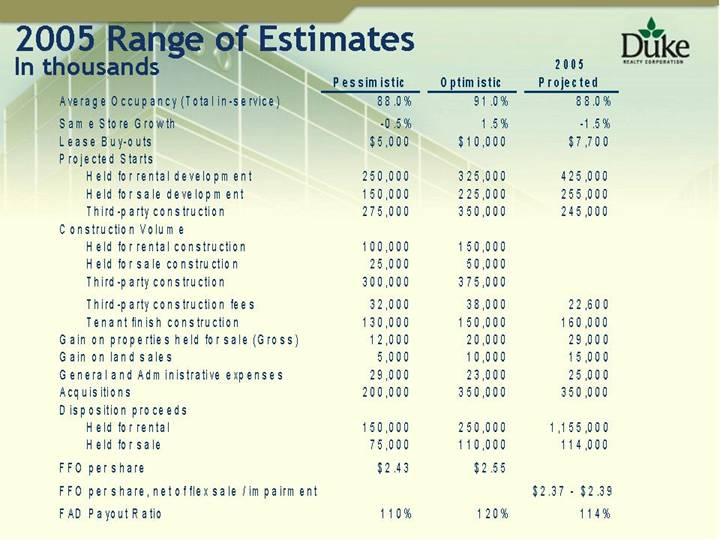
2005 Range of Estimates
In thousands | | [LOGO] |
| | | | | | 2005 | |
| | Pessimistic | | Optimistic | | Projected | |
Average Occupancy (Total in-service) | | 88.0 | % | 91.0 | % | 88.0 | % |
Same Store Growth | | -0.5 | % | 1.5 | % | -1.5 | % |
Lease Buy-outs | | $ | 5,000 | | $ | 10,000 | | $ | 7,700 | |
Projected Starts | | | | | | | |
Held for rental development | | 250,000 | | 325,000 | | 425,000 | |
Held for sale development | | 150,000 | | 225,000 | | 255,000 | |
Third-party construction | | 275,000 | | 350,000 | | 245,000 | |
Construction Volume | | | | | | | |
Held for rental construction | | 100,000 | | 150,000 | | | |
Held for sale construction | | 25,000 | | 50,000 | | | |
Third-party construction | | 300,000 | | 375,000 | | | |
| | | | | | | |
Third-party construction fees | | 32,000 | | 38,000 | | 22,600 | |
Tenant finish construction | | 130,000 | | 150,000 | | 160,000 | |
Gain on properties held for sale (Gross) | | 12,000 | | 20,000 | | 29,000 | |
Gain on land sales | | 5,000 | | 10,000 | | 15,000 | |
General and Administrative expenses | | 29,000 | | 23,000 | | 25,000 | |
Acquisitions | | 200,000 | | 350,000 | | 350,000 | |
Disposition proceeds | | | | | | | |
Held for rental | | 150,000 | | 250,000 | | 1,155,000 | |
Held for sale | | 75,000 | | 110,000 | | 114,000 | |
| | | | | | | |
FFO per share | | $ | 2.43 | | $ | 2.55 | | | |
| | | | | | | |
FFO per share, net of flex sale / impairment | | | | | | $2.37 - $2.39 | |
| | | | | | | |
FAD Payout Ratio | | 110 | % | 120 | % | 114 | % |
| | | | | | | | | | |
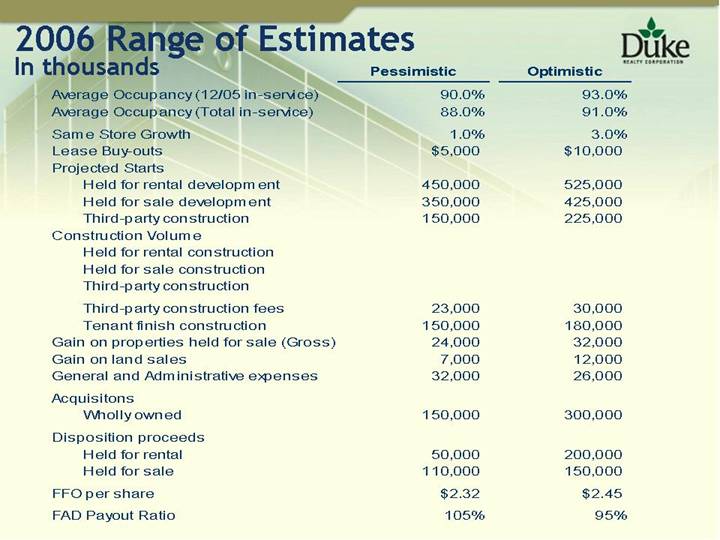
2006 Range of Estimates
In thousands | | |
| | Pessimistic | | Optimistic | |
| | | | | |
Average Occupancy (12/05 in-service) | | 90.0 | % | 93.0 | % |
Average Occupancy (Total in-service) | | 88.0 | % | 91.0 | % |
| | | | | |
Same Store Growth | | 1.0 | % | 3.0 | % |
Lease Buy-outs | | $ | 5,000 | | $ | 10,000 | |
Projected Starts | | | | | |
Held for rental development | | 450,000 | | 525,000 | |
Held for sale development | | 350,000 | | 425,000 | |
Third-party construction | | 150,000 | | 225,000 | |
Construction Volume | | | | | |
Held for rental construction | | | | | |
Held for sale construction | | | | | |
Third-party construction | | | | | |
| | | | | |
Third-party construction fees | | 23,000 | | 30,000 | |
Tenant finish construction | | 150,000 | | 180,000 | |
Gain on properties held for sale (Gross) | | 24,000 | | 32,000 | |
Gain on land sales | | 7,000 | | 12,000 | |
General and Administrative expenses | | 32,000 | | 26,000 | |
| | | | | |
Acquisitons | | | | | |
Wholly owned | | 150,000 | | 300,000 | |
| | | | | |
Disposition proceeds | | | | | |
Held for rental | | 50,000 | | 200,000 | |
Held for sale | | 110,000 | | 150,000 | |
| | | | | |
FFO per share | | $ | 2.32 | | $ | 2.45 | |
| | | | | |
FAD Payout Ratio | | 105 | % | 95 | % |
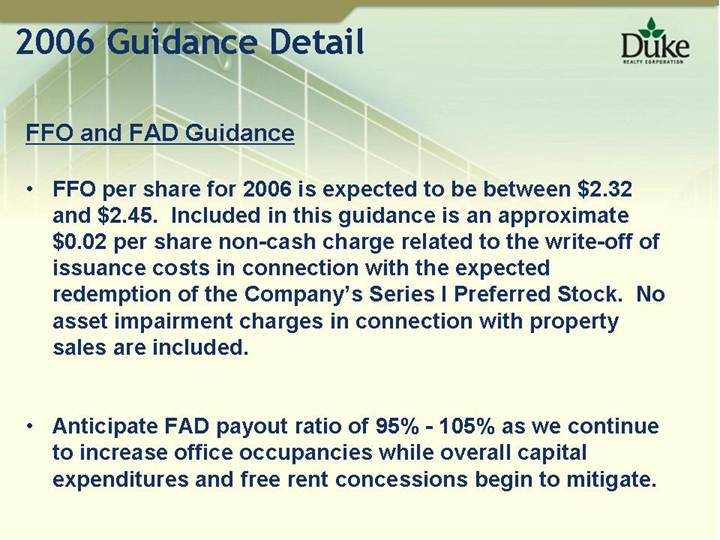
2006 Guidance Detail
FFO and FAD Guidance
• FFO per share for 2006 is expected to be between $2.32 and $2.45. Included in this guidance is an approximate $0.02 per share non-cash charge related to the write-off of issuance costs in connection with the expected redemption of the Company’s Series I Preferred Stock. No asset impairment charges in connection with property sales are included.
• Anticipate FAD payout ratio of 95% - 105% as we continue to increase office occupancies while overall capital expenditures and free rent concessions begin to mitigate.
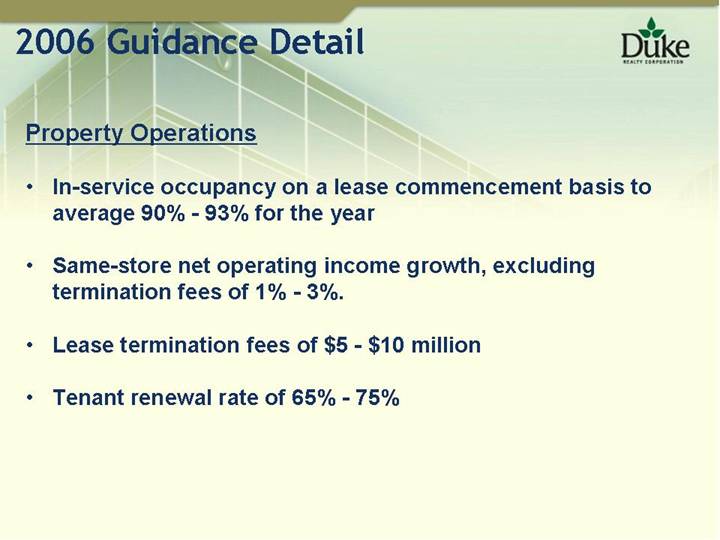
Property Operations
• In-service occupancy on a lease commencement basis to average 90% - 93% for the year
• Same-store net operating income growth, excluding termination fees of 1% - 3%.
• Lease termination fees of $5 - - $10 million
• Tenant renewal rate of 65% - 75%
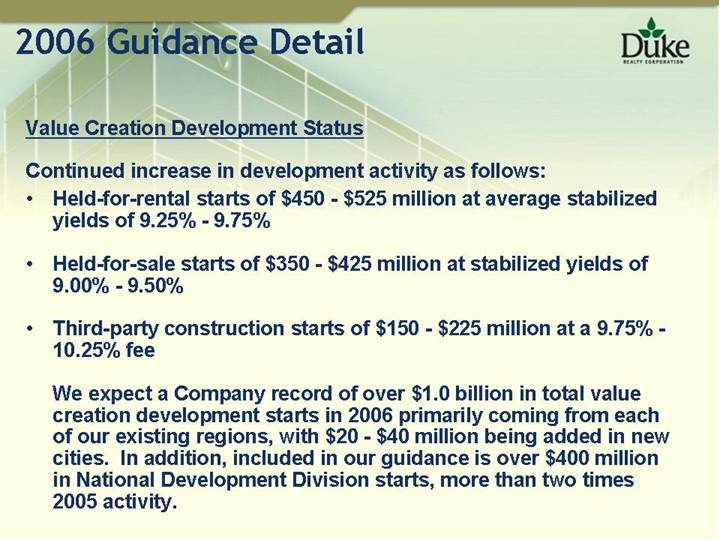
Value Creation Development Status
Continued increase in development activity as follows:
• Held-for-rental starts of $450 - $525 million at average stabilized yields of 9.25% - 9.75%
• Held-for-sale starts of $350 - - $425 million at stabilized yields of 9.00% - 9.50%
• Third-party construction starts of $150 - $225 million at a 9.75% - 10.25% fee
We expect a Company record of over $1.0 billion in total value creation development starts in 2006 primarily coming from each of our existing regions, with $20 - $40 million being added in new cities. In addition, included in our guidance is over $400 million in National Development Division starts, more than two times 2005 activity.
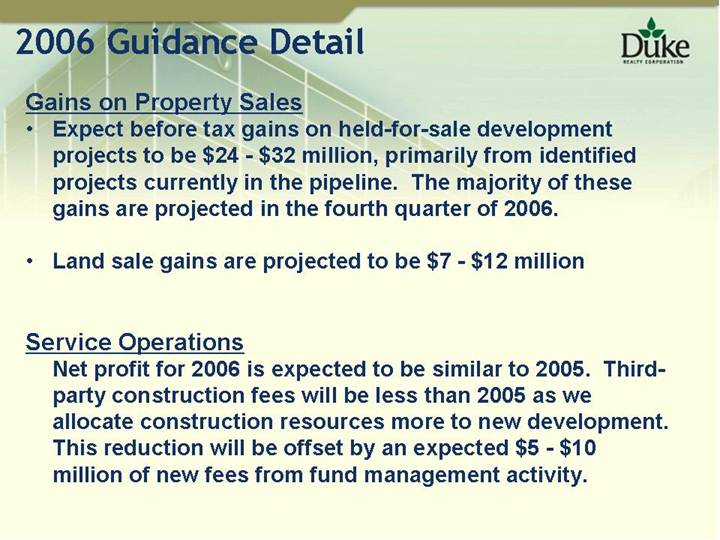
Gains on Property Sales
• Expect before tax gains on held-for-sale development projects to be $24 - $32 million, primarily from identified projects currently in the pipeline. The majority of these gains are projected in the fourth quarter of 2006.
• Land sale gains are projected to be $7 - $12 million
Service Operations
Net profit for 2006 is expected to be similar to 2005. Third-party construction fees will be less than 2005 as we allocate construction resources more to new development. This reduction will be offset by an expected $5 - $10 million of new fees from fund management activity.
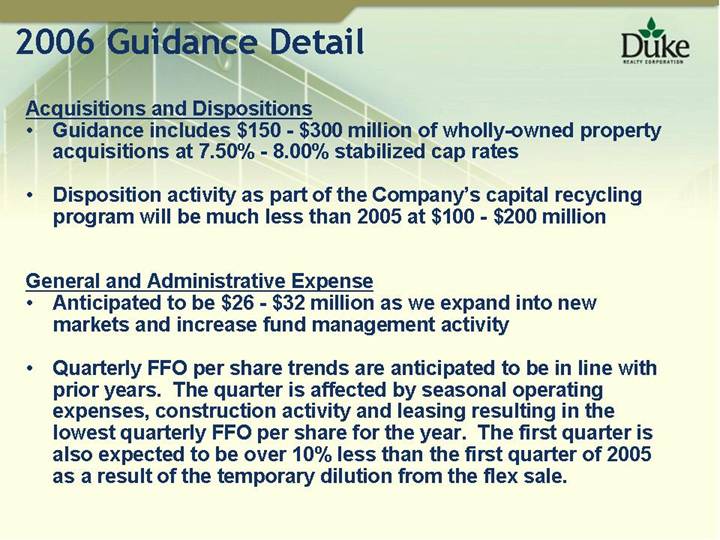
Acquisitions and Dispositions
• Guidance includes $150 - $300 million of wholly-owned property acquisitions at 7.50% - 8.00% stabilized cap rates
• Disposition activity as part of the Company’s capital recycling program will be much less than 2005 at $100 - - $200 million
General and Administrative Expense
• Anticipated to be $26 - $32 million as we expand into new markets and increase fund management activity
• Quarterly FFO per share trends are anticipated to be in line with prior years. The quarter is affected by seasonal operating expenses, construction activity and leasing resulting in the lowest quarterly FFO per share for the year. The first quarter is also expected to be over 10% less than the first quarter of 2005 as a result of the temporary dilution from the flex sale.
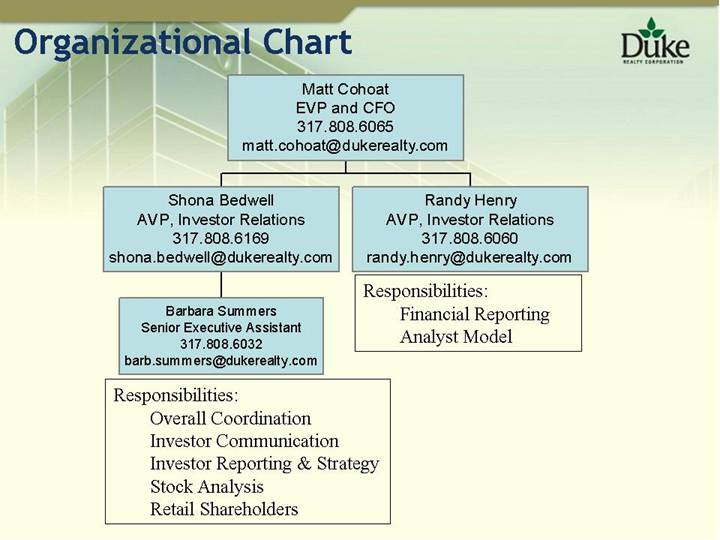
Organizational Chart
Matt Cohoat
EVP and CFO
317.808.6065
matt.cohoat@dukerealty.com |
| | |
Shona Bedwell
AVP, Investor Relations
317.808.6169
shona.bedwell@dukerealty.com | | Randy Henry
AVP, Investor Relations
317.808.6060
randy.henry@dukerealty.com |
| | |
Barbara Summers
Senior Executive Assistant
317.808.6032
barb.summers@dukerealty.com | | Responsibilities:
Financial Reporting
Analyst Model
|
| | |
Responsibilities:
Overall Coordination
Investor Communication
Investor Reporting & Strategy
Stock Analysis
Retail Shareholders | | |