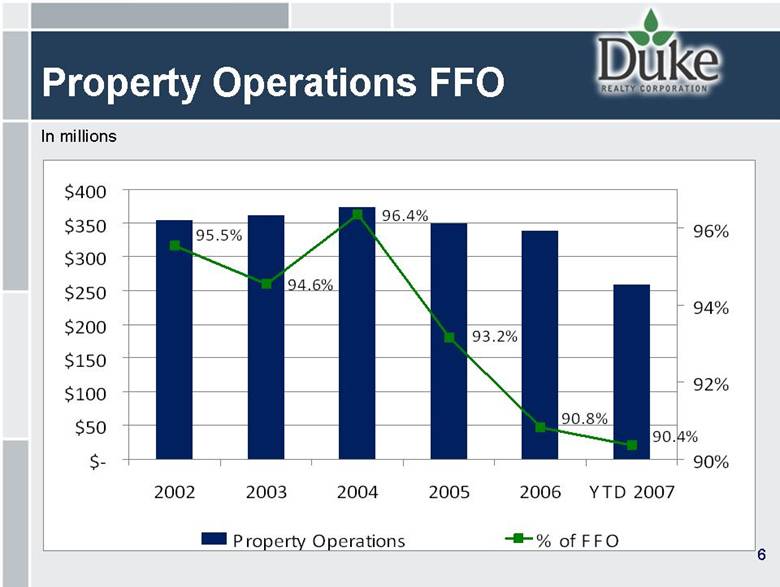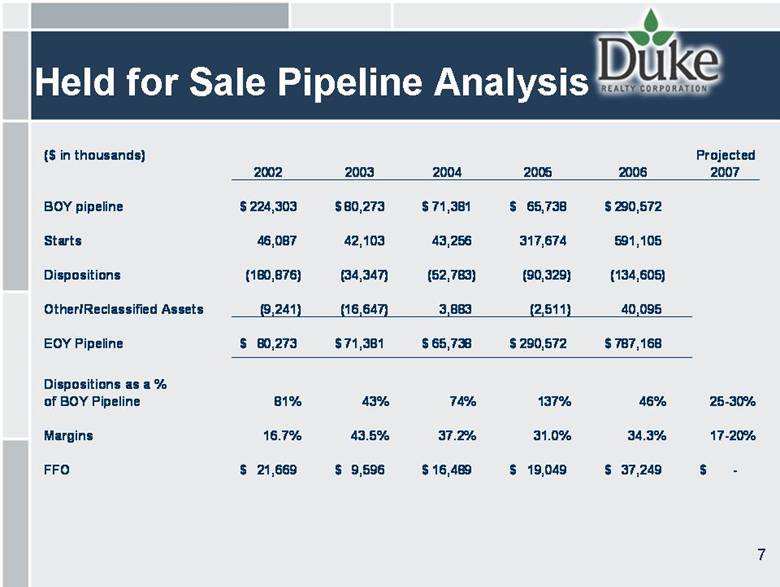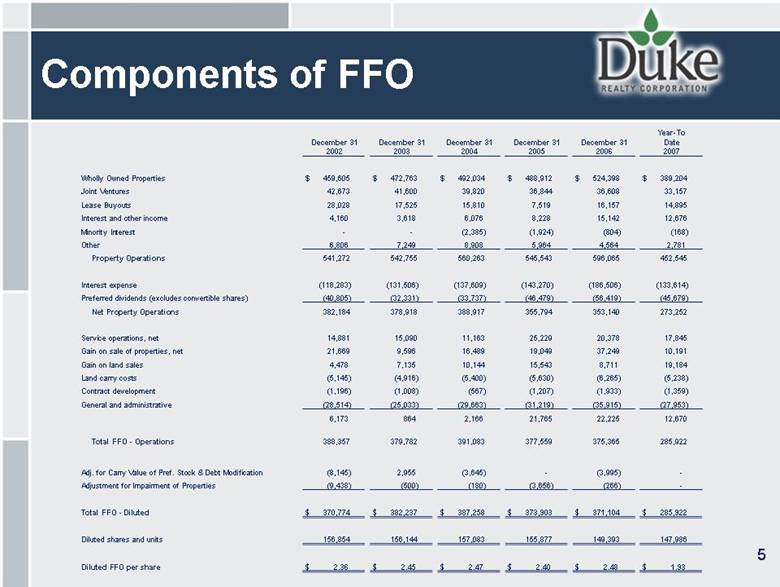
| 5 Components of FFO Year-To December 31 December 31 December 31 December 31 December 31 Date 2002 2003 2004 2005 2006 2007 Wholly Owned Properties $ 459,605 $ 472,763 $ 492,034 $ 488,912 $ 524,398 $ 389,204 Joint Ventures Lease Buyouts Interest and other income Minority Interest Other Property Operations Interest expense Preferred dividends (excludes convertible shares) Net Property Operations Service operations, net Gain on sale of properties, net Gain on land sales Land carry costs Contract development General and administrative Total FFO - Operations Adj. for Carry Value of Pref. Stock & Debt Modification Adjustment for Impairment of Properties Total FFO - Diluted $ 370,774 $ 382,237 $ 387,258 $ 373,903 $ 371,104 $ 285,922 Diluted shares and units Diluted FFO per share $ 2.36 $ 2.45 $ 2.47 $ 2.40 $ 2.48 $ 1.93 147,986 149,393 155,877 157,083 156,144 156,854 - (266) (3,656) (180) (500) (9,438) - (3,995) - (3,645) 2,955 (8,145) 285,922 375,365 377,559 391,083 379,782 388,357 12,670 22,225 21,765 2,166 864 6,173 (27,953) (35,915) (31,219) (29,663) (25,033) (28,514) (1,359) (1,933) (1,207) (567) (1,008) (1,196) (5,238) (6,265) (5,630) (5,400) (4,916) (5,145) 19,184 8,711 15,543 10,144 7,135 4,478 10,191 37,249 19,049 16,489 9,596 21,669 17,845 20,378 25,229 11,163 15,090 14,881 273,252 353,140 355,794 388,917 378,918 382,184 (45,679) (56,419) (46,479) (33,737) (32,331) (40,805) (133,614) (186,506) (143,270) (137,609) (131,506) (118,283) 452,545 596,065 545,543 560,263 542,755 541,272 2,781 4,564 5,964 8,908 7,249 6,806 (168) (804) (1,924) (2,385) - - 12,676 15,142 8,228 6,076 3,618 4,160 14,895 16,157 7,519 15,810 17,525 28,028 33,157 36,608 36,844 39,820 41,600 42,673 |