Exhibit 99.1
Exhibit 99.1
2013 BMO Chicago Conference
September 16-17, 2013
RELIABLE. ANSWERS.
RELIABLE. ANSWERS
WHY DUKE REALTY?
Superior Asset Quality
Strategically Located Land Bank and Experienced Development Capabilities
Proven Operational Success and Future Growth Opportunities
Balance Sheet Strength
Relative Value vs. Peers
Talent and Leadership Depth to Execute
2013 Duke Realty Corporation 2
RELIABLE . ANSWERS .
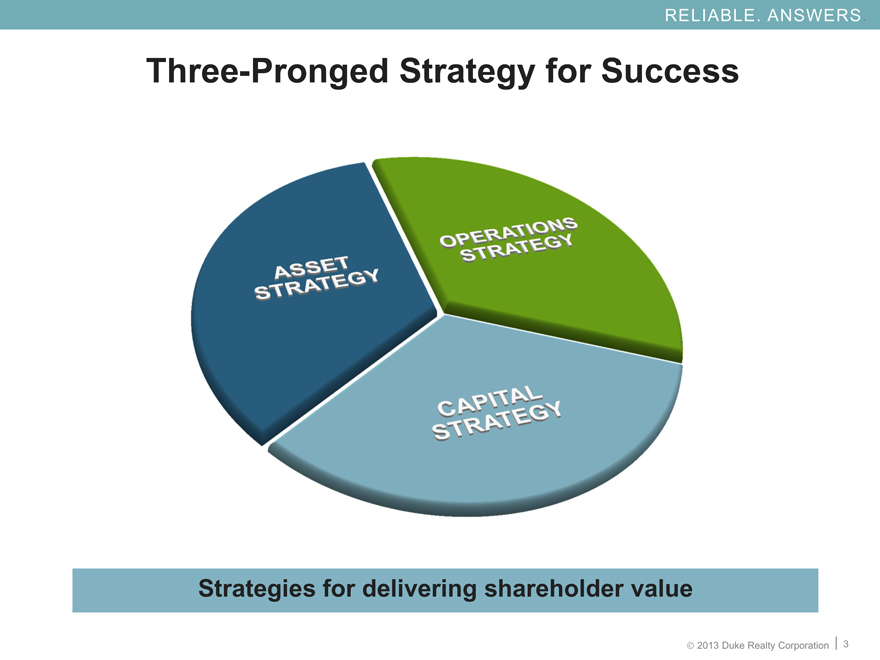
Three-Pronged Strategy for Success
Strategies for delivering shareholder value
2013 Duke Realty Corporation 3

ASSET STRATEGY
2013 Duke Realty Corporation 4
ASSET STRATEGY
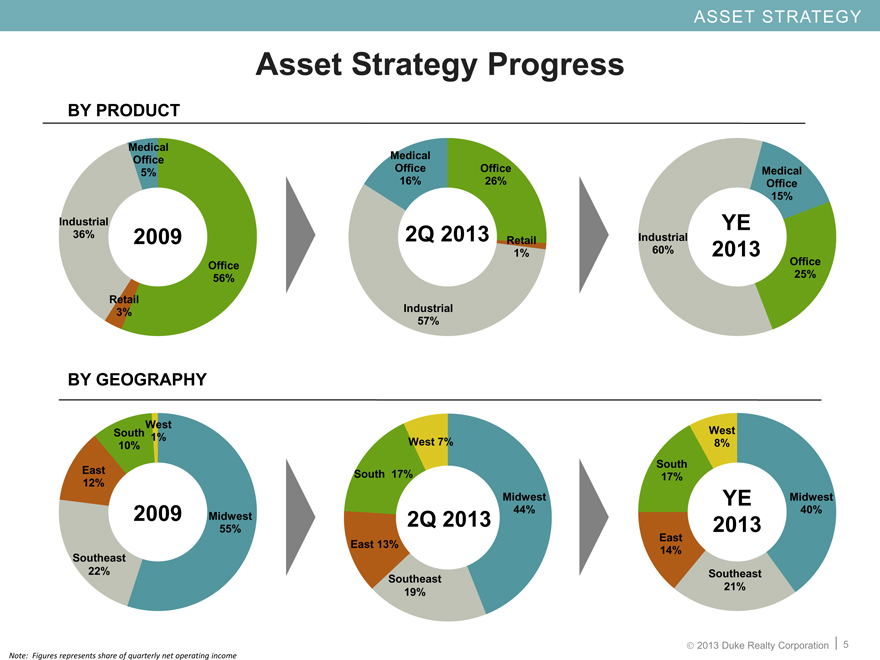
Asset Strategy Progress
BY PRODUCT
Medical
Office Medical
5% Office Office Medical
16% 26% Office
15%
Industrial YE
36% 2009 2Q 2013 Retail Industrial
1% 60% 2013
Office Office
56% 25%
Retail
3% Industrial
57%
BY GEOGRAPHY
South West West
1%
10% West 7% 8%
South
East South 17% 17%
12%
Midwest YE Midwest
2009 Midwest 2Q 2013 44% 2013 40%
55%
East
East 13% 14%
Southeast
22% Southeast
Southeast
19% 21%
2013 Duke Realty Corporation 5
Note: Figures represents share of quarterly net operating income
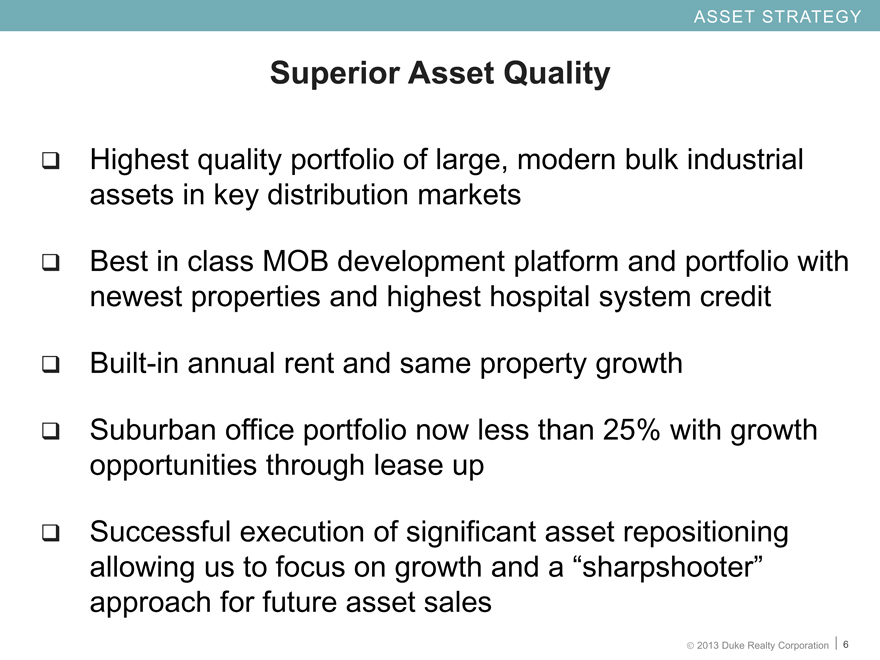
Highest quality portfolio of large, modern bulk industrial
assets in key distribution markets
Best in class MOB development platform and portfolio with
newest properties and highest hospital system credit
Built-in annual rent and same property growth
Suburban office portfolio now less than 25% with growth
opportunities through lease up
Successful execution of significant asset repositioning
allowing us to focus on growth and a "sharpshooter"
approach for future asset sales
Superior Asset Quality
Asset Strategy
6
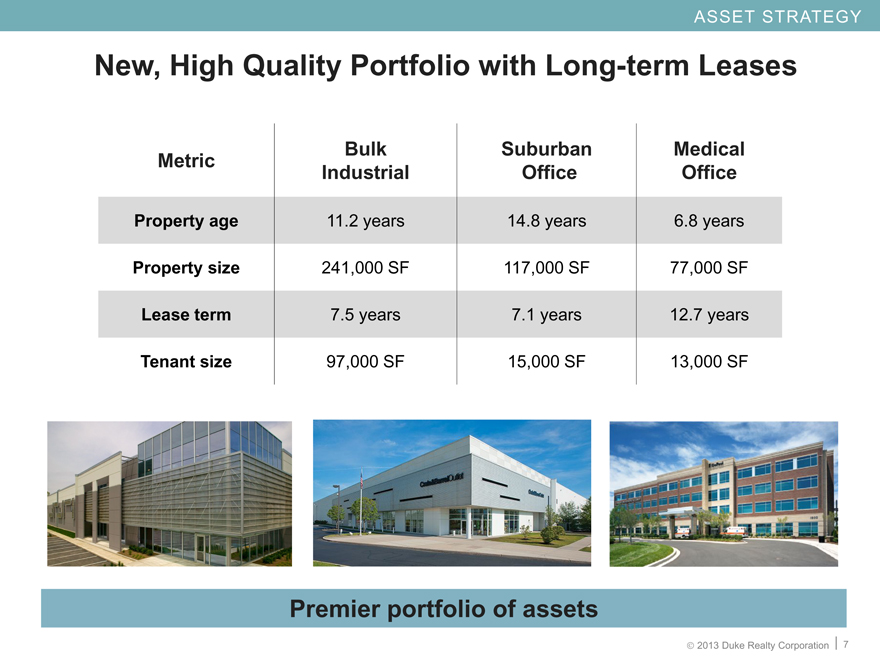
New, High Quality Portfolio with Long-term Leases
Premier portfolio of assets
Metric Bulk Industrial Suburban Office Medical Office
Property age 11.2 years 14.8 years 6.8 years
Property size 241,000 SF 117,000 SF 77,000 SF
Lease term 7.5 years 7.1 years 12.7 years
Tenant size 97,000 SF 15,000 SF 13,000 SF
Asset Strategy

ASSET STRATEGY –
INDUSTRIAL PORTFOLIO
9
Leverage 40 years of industrial operating and development experience as
primary driver of company growth
Focus on larger, modern bulk distribution product which results in higher credit
quality tenant base with fewer overall tenants to manage
Geographic strategy focused on major markets in key trucking, rail and
shipping corridors
Growing NOI stream with contractual rent escalations and low capital
expenditures
Leverage current business trends in e-commerce and supply chain
reconfiguration along with key long term relationships
Utilize land positions in existing markets to grow rent through higher yield
development
Strategically seek acquisition opportunities in higher rent growth markets
Industrial Strategy
Asset Strategy
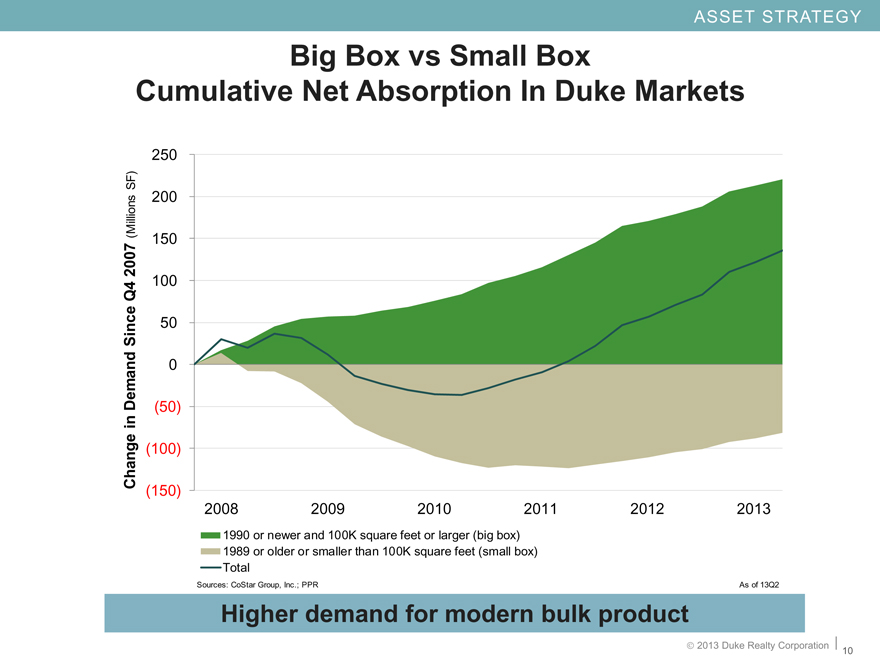
Big Box vs Small Box
Cumulative Net Absorption In Duke Markets
10
Higher demand for modern bulk product
Asset Strategy
11
Asset Strategy
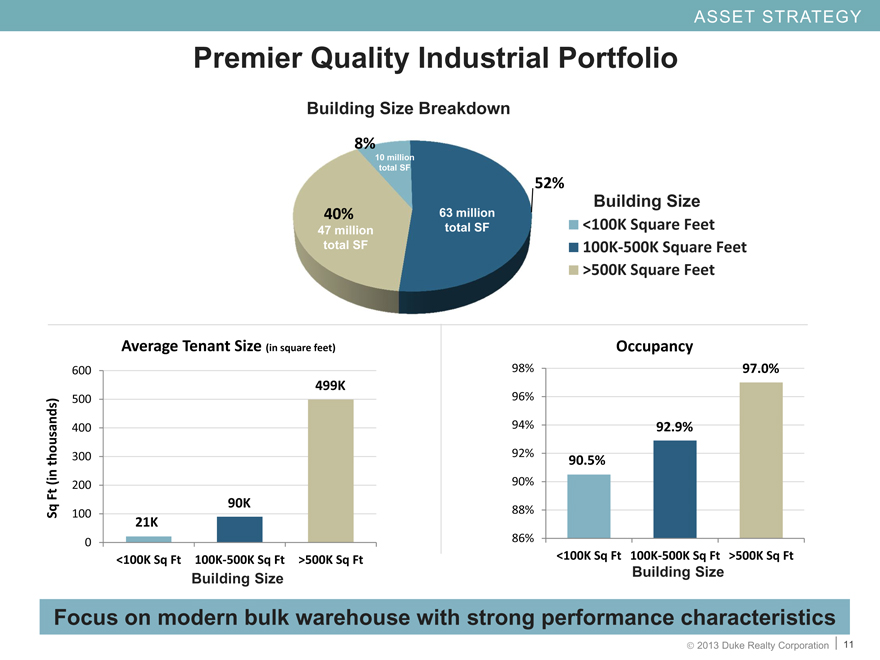
Premier Quality Industrial Portfolio
Premier Quality Industrial Portfolio
(CHART)
(CHART)
Focus on modern bulk warehouse with strong performance characteristics
Building Size
Building Size
63 million
total SF
47 million
total SF
10 million
total SF
Building Size
Building Size Breakdown
12
Asset Strategy
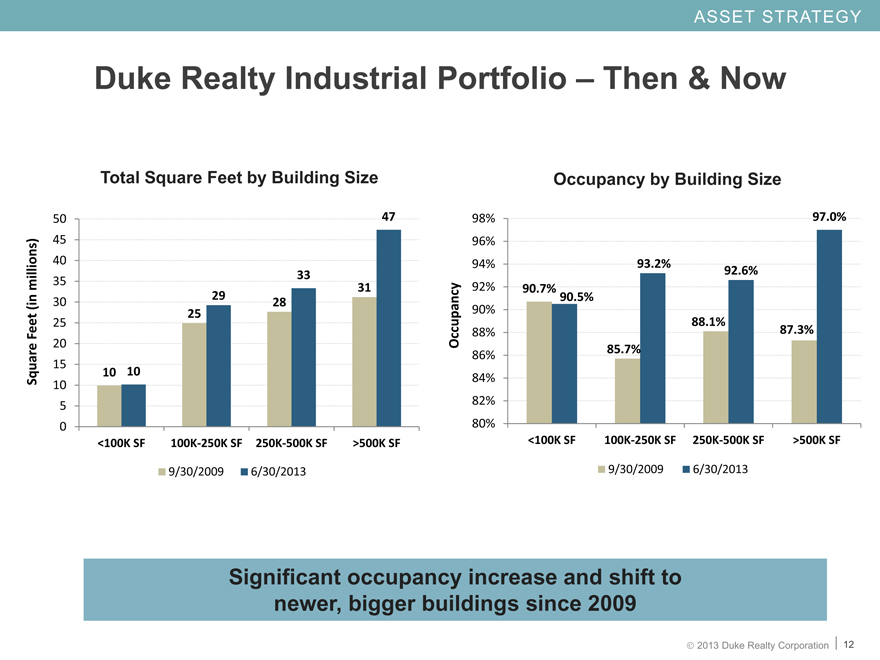
Duke Realty Industrial Portfolio – Then & Now
Duke Realty Industrial Portfolio – Then & Now
Significant occupancy increase and shift to
newer, bigger buildings since 2009
Total Square Feet by Building Size
Occupancy by Building Size
(CHART)
13
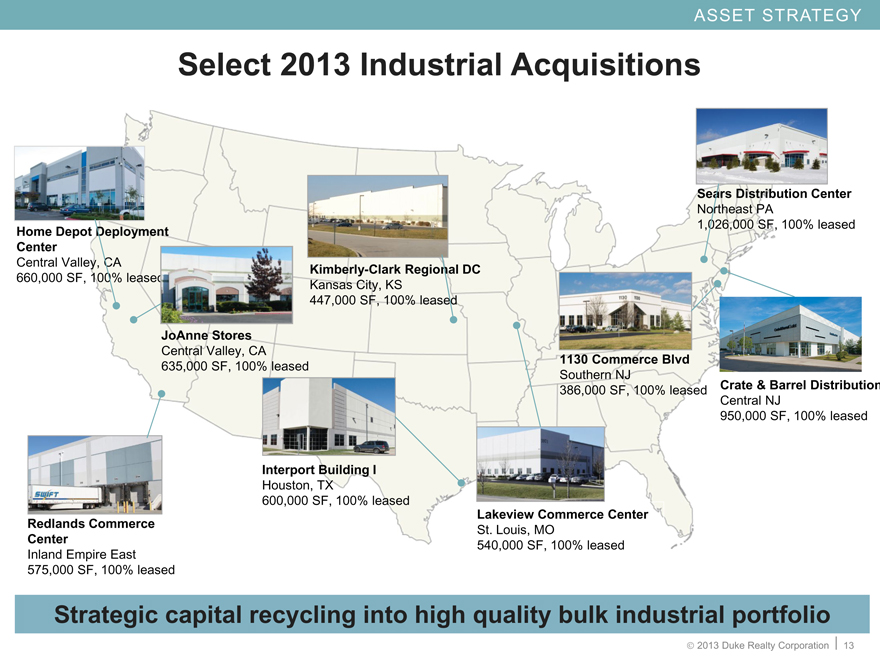
Home Depot Deployment
Center
Central Valley, CA
660,000 SF, 100% leased
JoAnne Stores
Central Valley, CA
635,000 SF, 100% leased
Redlands Commerce
Center
Inland Empire East
575,000 SF, 100% leased
Lakeview Commerce Center
St. Louis, MO
540,000 SF, 100% leased
Kimberly-Clark Regional DC
Kansas City, KS
447,000 SF, 100% leased
Interport Building I
Houston, TX
600,000 SF, 100% leased
1130 Commerce Blvd
Southern NJ
386,000 SF, 100% leased
Sears Distribution Center
Northeast PA
1,026,000 SF, 100% leased
Select 2013 Industrial Acquisitions
Strategic capital recycling into high quality bulk industrial portfolio
Crate & Barrel Distribution
Central NJ
950,000 SF, 100% leased
ASSET Strategy
(CHART)
(CHART)
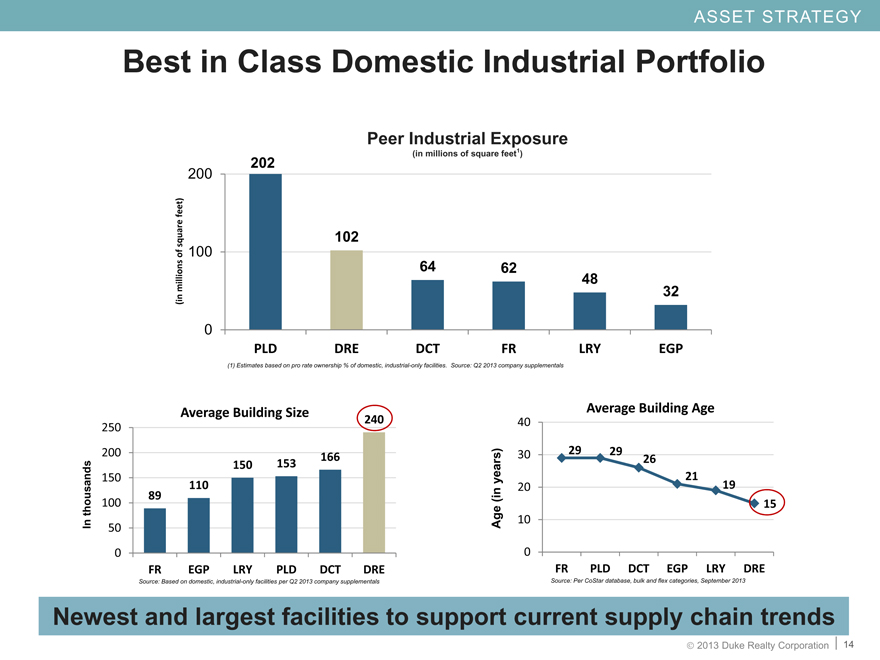
Peer Industrial Exposure
(in millions of square feet1)
14
Asset Strategy
(CHART)
Best in Class Domestic Industrial Portfolio
Newest and largest facilities to support current supply chain trends
(1) Estimates based on pro rate ownership % of domestic, industrial-only facilities. Source: Q2 2013 company supplementals
Source: Per CoStar database, bulk and flex categories, September 2013
202
Source: Based on domestic, industrial-only facilities per Q2 2013 company supplementals

ASSET STRATEGY –
OFFICE PORTFOLIO
15
16
Will reach 25% target by year-end 2013
Continue to sell older, non-strategic assets
Develop remaining office land bank primarily with build
to suit projects
Own highest quality assets in high growth office
markets
Office Strategy
Asset Strategy
17
Asset Strategy
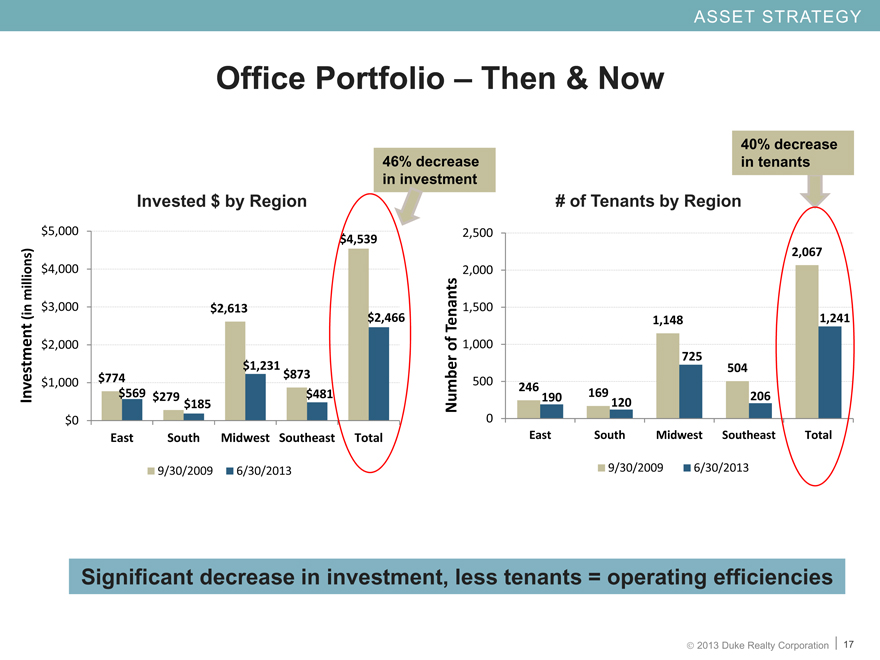
Office Portfolio – Then & Now
Office Portfolio – Then & Now
(CHART)
40% decrease
in tenants
46% decrease
in investment
Significant decrease in investment, less tenants = operating efficiencies
Invested $ by Region
# of Tenants by Region

ASSET STRATEGY –
MEDICAL OFFICE PORTFOLIO
18
19
Asset Strategy
MOB Platform Strategy and Benefits to Duke Realty
Solid NOI growth and low volatility
Growth industry, recession resistant asset class
Best in class development team able to produce consistent
development opportunities through economic cycles
Substantially all on-campus or aligned with major hospital systems
Long term leases averaging over 12 years
Consistent NOI growth with typical leases including 2-3% annual
net rent escalations and expense increase pass-throughs
Recycle selected assets to recognize value created and fund new
development
20
Asset Strategy
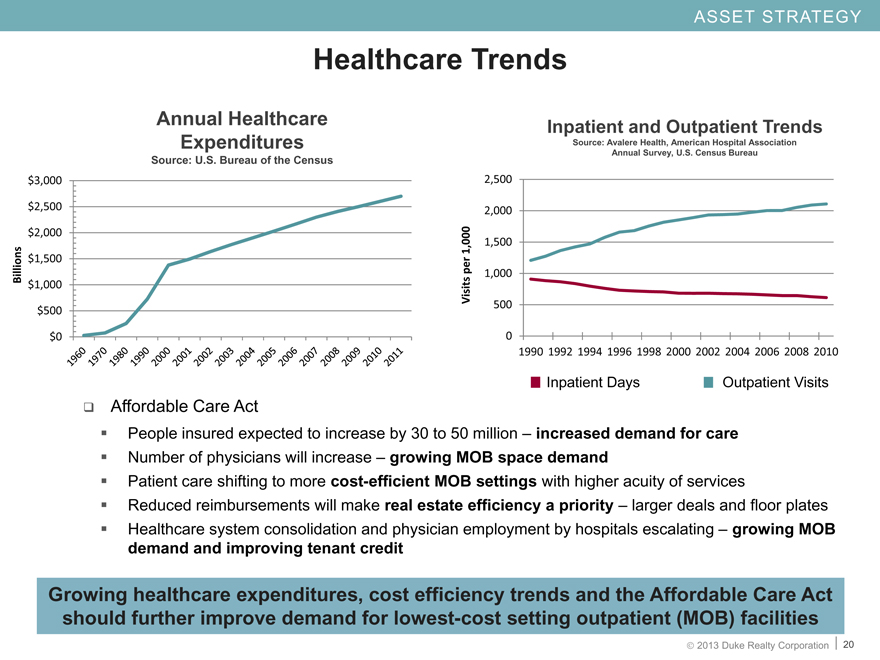
Healthcare Trends
Annual Healthcare
Expenditures
Source: U.S. Bureau of the Census
(CHART)
Growing healthcare expenditures, cost efficiency trends and the Affordable Care Act
should further improve demand for lowest-cost setting outpatient (MOB) facilities
Affordable Care Act
People insured expected to increase by 30 to 50 million – increased demand for care
Number of physicians will increase – growing MOB space demand
Patient care shifting to more cost-efficient MOB settings with higher acuity of services
Reduced reimbursements will make real estate efficiency a priority – larger deals and floor plates
Healthcare system consolidation and physician employment by hospitals escalating – growing MOB
demand and improving tenant credit
(CHART)
Inpatient and Outpatient Trends
Source: Avalere Health, American Hospital Association
Annual Survey, U.S. Census Bureau
Inpatient Days Outpatient Visits
21
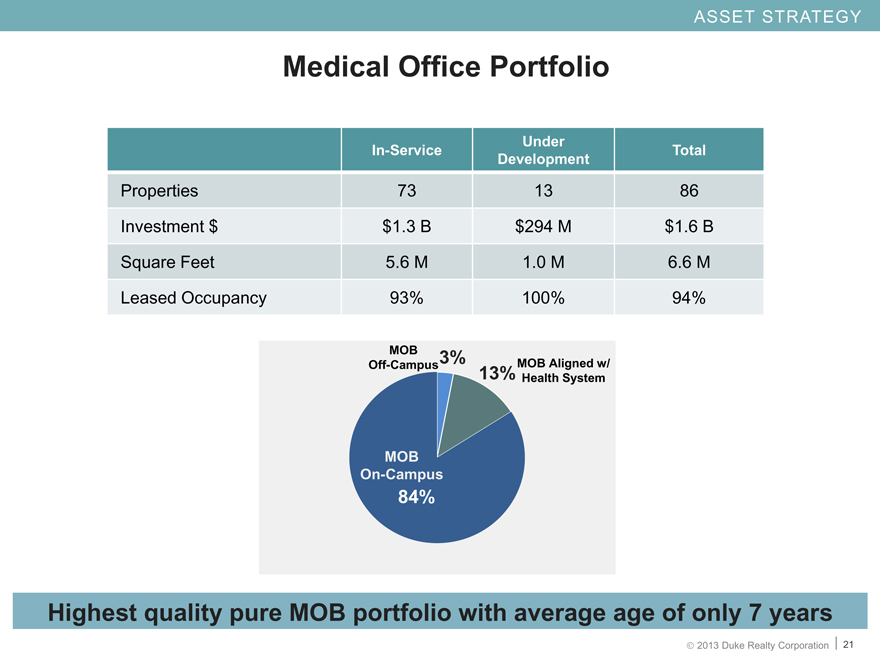
Asset Strategy
In-Service Under Development Total
Properties 73 13 86
Investment $ $1.3 B $294 M $1.6 B
Square Feet 5.6 M 1.0 M 6.6 M
Leased Occupancy 93% 100% 94%
Investment
by product type
MOB
On-Campus
MOB
Off-Campus
Medical Office Portfolio
Highest quality pure MOB portfolio with average age of only 7 years
MOB Aligned w/
Health System
22
Asset Strategy
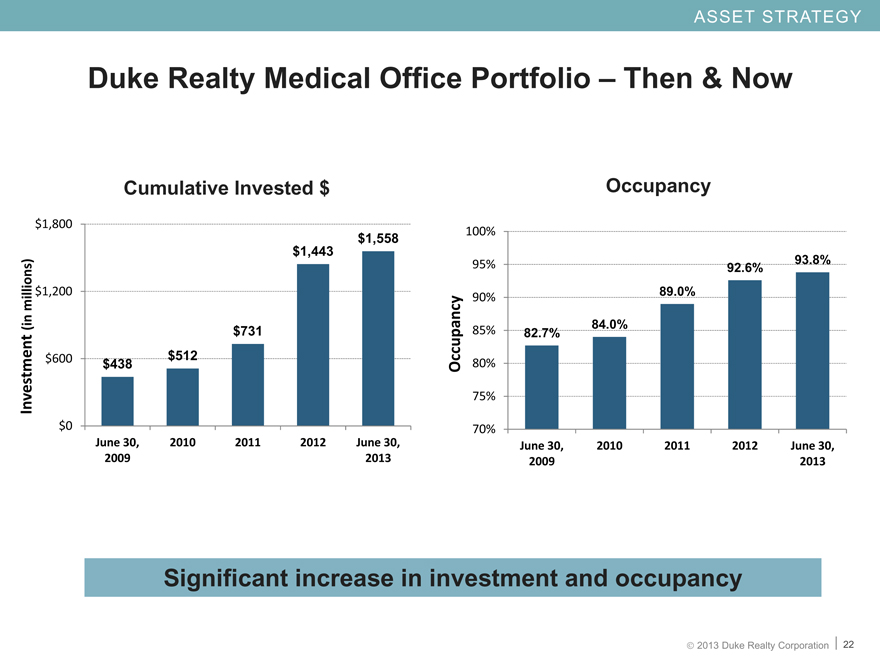
Duke Realty Medical Office Portfolio – Then & Now
Duke Realty Medical Office Portfolio – Then & Now
(CHART)
Significant increase in investment and occupancy
Cumulative Invested $
Occupancy
23
Asset Strategy
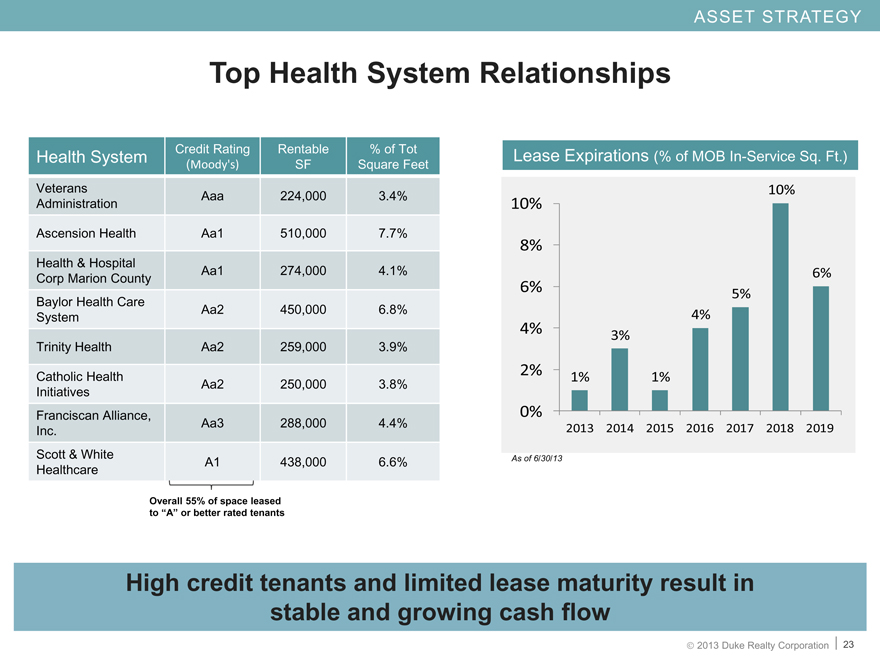
Lease Expirations (% of MOB In-Service Sq. Ft.)
High credit tenants and limited lease maturity result in
stable and growing cash flow
Top Health System Relationships
Health System Credit Rating (Moody’s) Rentable SF % of Tot Square Feet
Veterans Administration Aaa 224,000 3.4%
Ascension Health Aa1 510,000 7.7%
Health & Hospital Corp Marion County Aa1 274,000 4.1%
Baylor Health Care System Aa2 450,000 6.8%
Trinity Health Aa2 259,000 3.9%
Catholic Health Initiatives Aa2 250,000 3.8%
Franciscan Alliance, Inc. Aa3 288,000 4.4%
Scott & White Healthcare A1 438,000 6.6%
As of 6/30/13
Overall 55% of space leased
to "A" or better rated tenants
24
Asset Strategy
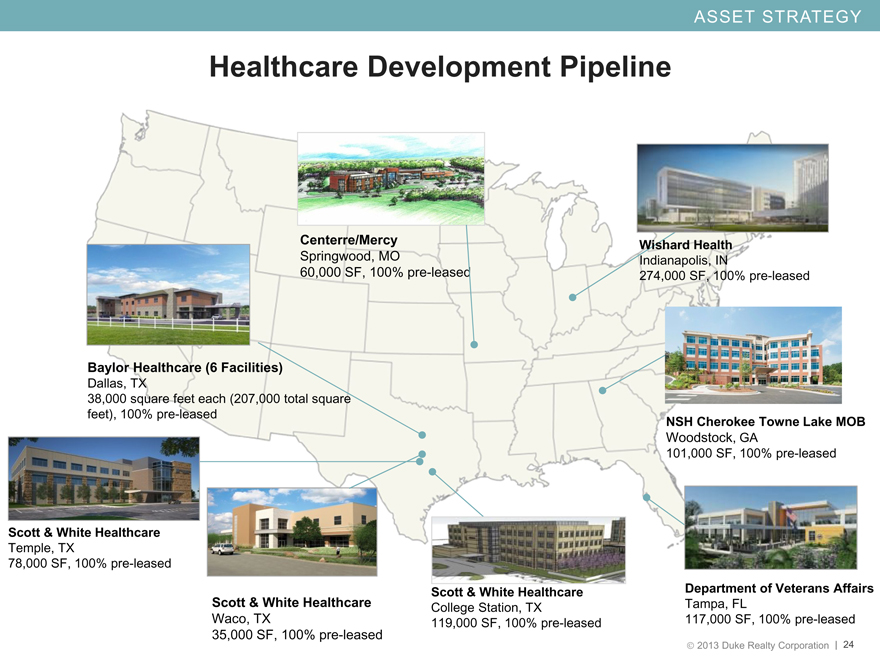
Healthcare Development Pipeline
Department of Veterans Affairs
Tampa, FL
117,000 SF, 100% pre-leased
Wishard Health
Indianapolis, IN
274,000 SF, 100% pre-leased
Scott & White Healthcare
College Station, TX
119,000 SF, 100% pre-leased
Scott & White Healthcare
Temple, TX
78,000 SF, 100% pre-leased
Baylor Healthcare (6 Facilities)
Dallas, TX
38,000 square feet each (207,000 total square
feet), 100% pre-leased
Scott & White Healthcare
Waco, TX
35,000 SF, 100% pre-leased
Centerre/Mercy
Springwood, MO
60,000 SF, 100% pre-leased
NSH Cherokee Towne Lake MOB
Woodstock, GA
101,000 SF, 100% pre-leased
ASSET STRATEGY –
DEVELOPMENT CAPABILITIES
25
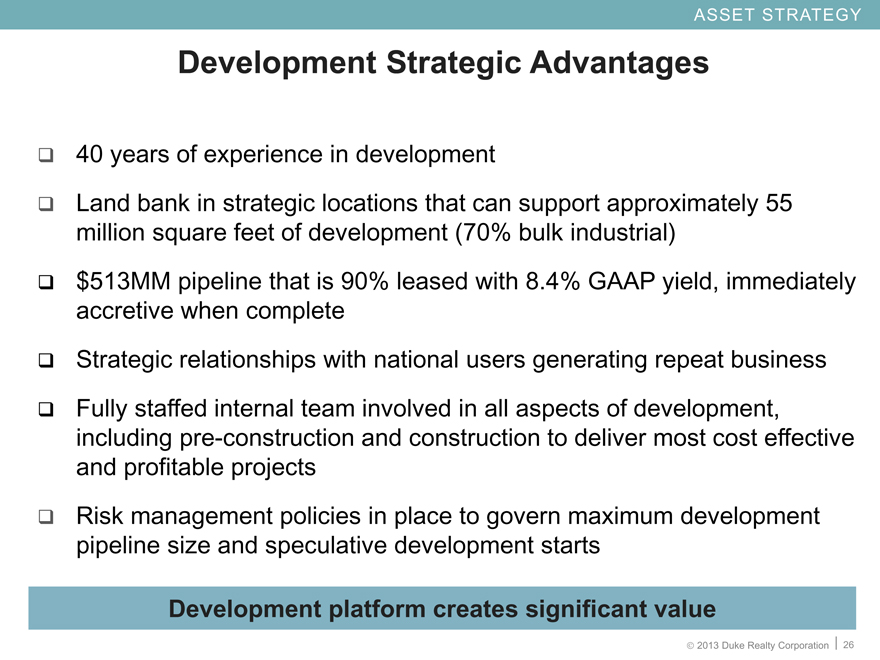
Development Strategic Advantages
Development platform creates significant value
26
40 years of experience in development
Land bank in strategic locations that can support approximately 55
million square feet of development (70% bulk industrial)
$513MM pipeline that is 90% leased with 8.4% GAAP yield, immediately
accretive when complete
Strategic relationships with national users generating repeat business
Fully staffed internal team involved in all aspects of development,
including pre-construction and construction to deliver most cost effective
and profitable projects
Risk management policies in place to govern maximum development
pipeline size and speculative development starts
Asset Strategy
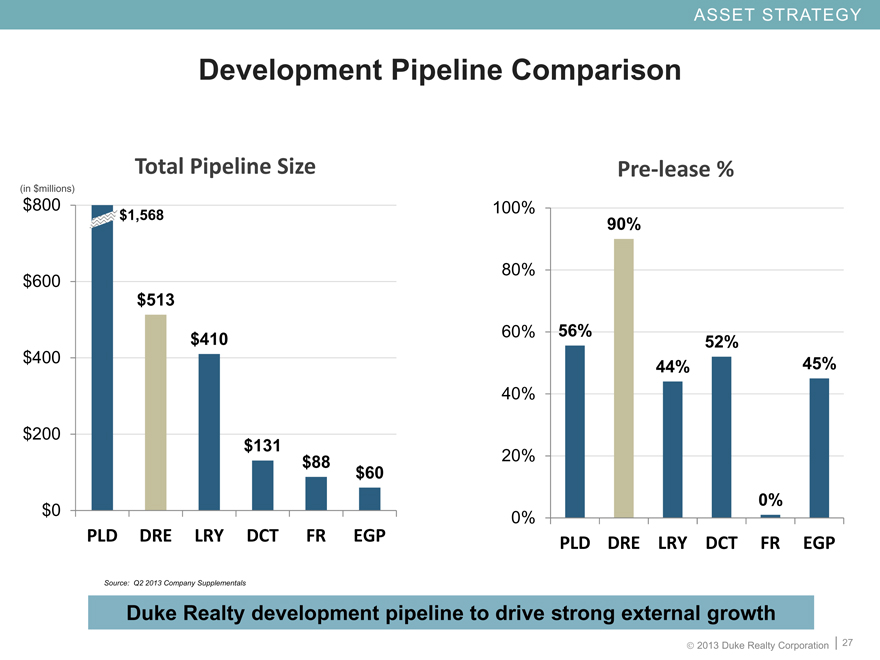
Development Pipeline Comparison
27
Duke Realty development pipeline to drive strong external growth
Asset Strategy
(CHART)
$1,568
(CHART)
(in $millions)
Source: Q2 2013 Company Supplementals
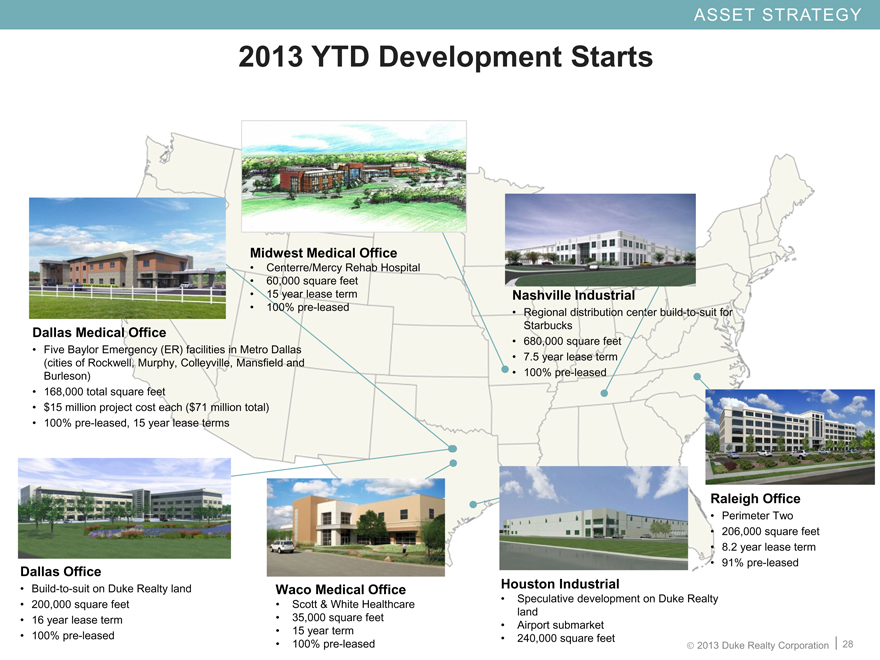
2013 YTD Development Starts
28
Nashville Industrial
Regional distribution center build-to-suit for
Starbucks
680,000 square feet
7.5 year lease term
100% pre-leased
Dallas Medical Office
Five Baylor Emergency (ER) facilities in Metro Dallas
(cities of Rockwell, Murphy, Colleyville, Mansfield and
Burleson)
168,000 total square feet
$15 million project cost each ($71 million total)
100% pre-leased, 15 year lease terms
Dallas Office
Build-to-suit on Duke Realty land
200,000 square feet
16 year lease term
100% pre-leased
Houston Industrial
Speculative development on Duke Realty
land
Airport submarket
240,000 square feet
Waco Medical Office
Scott & White Healthcare
35,000 square feet
15 year term
100% pre-leased
Raleigh Office
Perimeter Two
206,000 square feet
8.2 year lease term
91% pre-leased
Midwest Medical Office
Centerre/Mercy Rehab Hospital
60,000 square feet
15 year lease term
100% pre-leased
Asset Strategy

OPERATIng strategy
29
30
Completed asset repositioning into higher quality, higher growth
assets with minimal FFO per share dilution and annual growth
in AFFO per share
AFFO payout ratio of 72% and AFFO multiple of approximately
17x at the low end of the sector and well positioned for
continued growth
Proven same property NOI outperformance, well positioned for
continuing rental rate growth through lease rent escalations
Ability to push rents because of occupancy and asset quality
Modern bulk product and staggered lease maturities
significantly reduces capex
Operational Success and Future Growth Opportunities
OPERATIONS Strategy
31
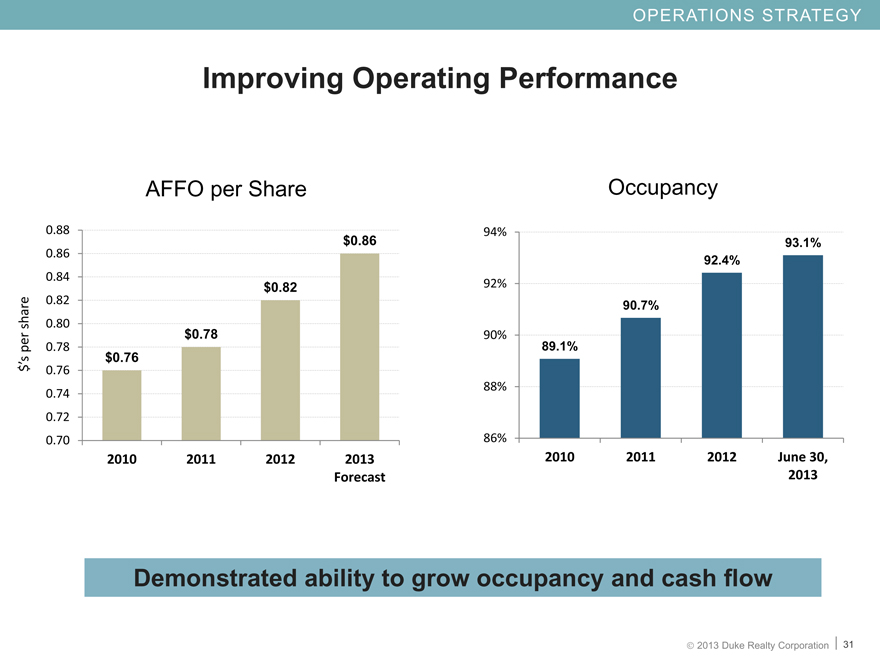
Improving Operating Performance
Improving Operating Performance
(CHART)
Demonstrated ability to grow occupancy and cash flow
AFFO per Share
Occupancy
OPERATIONS Strategy

CAPITAL STRATEGY
32
33
CAPITAL Strategy
Will reach original leverage goals established in 2009 by Q4
2013
Continue to delever through assets sales and funding new
development 60/40 equity/debt
Well balanced annual debt maturities
Significant liquidity with $850 million LOC with little to no
borrowings and low near-term maturities
Low percentage of secured and variable rate debt compared to
peer group
Balance Sheet Quality
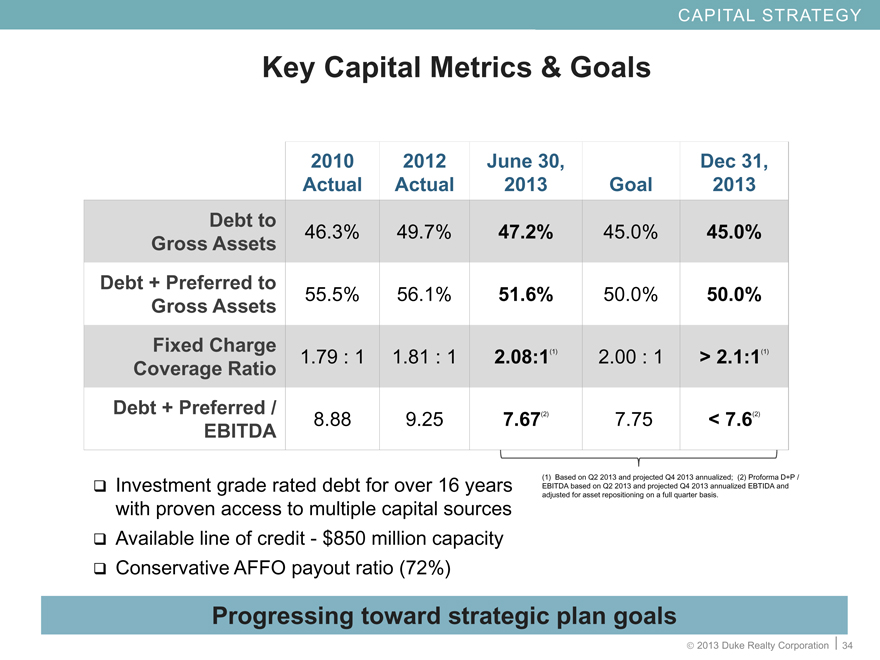
Investment grade rated debt for over 16 years
with proven access to multiple capital sources
Available line of credit—$850 million capacity
Conservative AFFO payout ratio (72%)
34
Key Capital Metrics & Goals
2010 Actual 2012 Actual June 30, 2013 Goal Dec 31, 2013
Debt to Gross Assets 46.3% 49.7% 47.2% 45.0% 45.0%
Debt + Preferred to Gross Assets 55.5% 56.1% 51.6% 50.0% 50.0%
Fixed Charge Coverage Ratio 1.79 : 1 1.81 : 1 2.08:1(1) 2.00 : 1 > 2.1:1(1)
Debt + Preferred / EBITDA 8.88 9.25 7.67(2) 7.75 < 7.6(2)
CAPITAL Strategy
Progressing toward strategic plan goals
(1) | | Based on Q2 2013 and projected Q4 2013 annualized; (2) Proforma D+P / |
EBITDA based on Q2 2013 and projected Q4 2013 annualized EBTIDA and
adjusted for asset repositioning on a full quarter basis.
CAPITAL STRATEGY
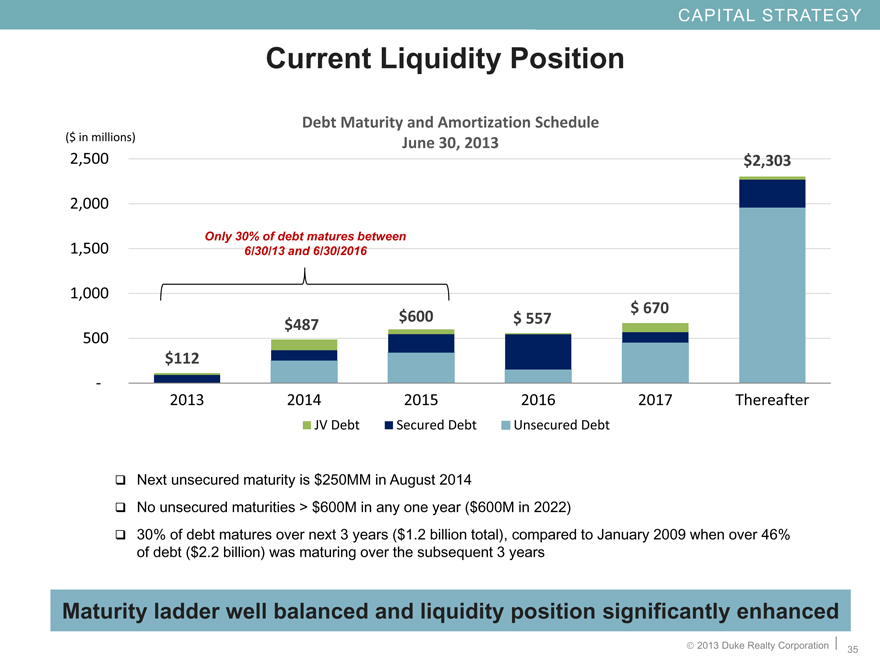
Current Liquidity Position
Debt Maturity and Amortization Schedule
($ in millions) June 30, 2013
2,500 $2,303
2,000
Only 30% of debt matures between
1,500 6/30/13 and 6/30/2016
1,000
$ 670
$487 $600 $ 557
500
$112
2013 2014 2015 2016 2017 Thereafter
JV Debt Secured Debt Unsecured Debt
Next unsecured maturity is $250MM in August 2014
No unsecured maturities > $600M in any one year ($600M in 2022)
30% of debt matures over next 3 years ($1.2 billion total), compared to January 2009 when over 46%
of debt ($2.2 billion) was maturing over the subsequent 3 years
Maturity ladder well balanced and liquidity position significantly enhanced
2013 Duke Realty Corporation 35
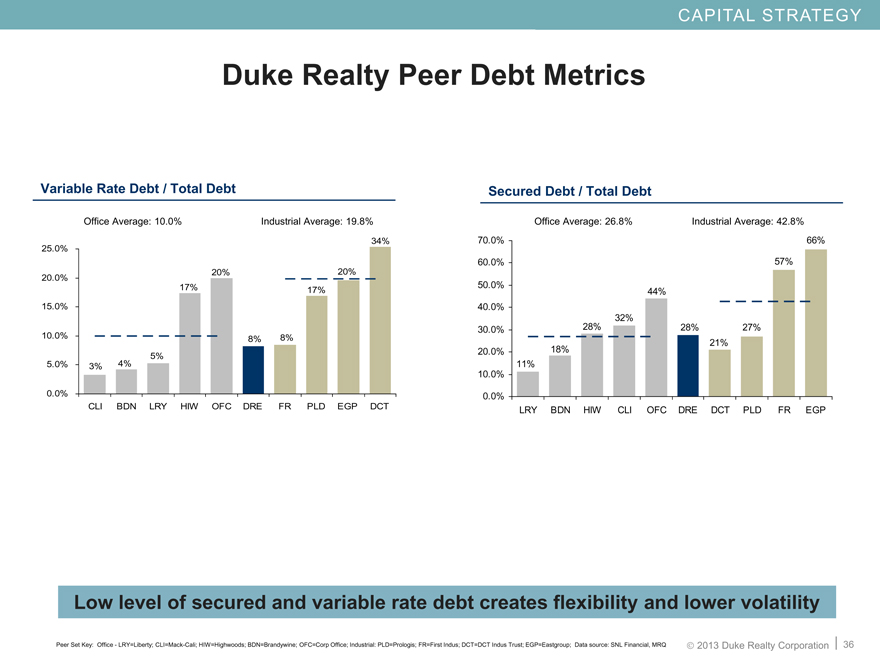
LRY BDN HIW CLI OFC DRE DCT PLD FR EGP
Secured Debt / Total Debt 0.113 0.184 0.282 0.318 0.442 0.276 0.21 0.271 0.569 0.66
Average 0.268 0.268 0.268 0.268 0.268 0.428 0.428 0.428 0.428
Industrial Average: 42.8%
Office Average: 26.8%
Secured Debt / Total Debt
Peer Set Key: Office—LRY=Liberty; CLI=Mack-Cali; HIW=Highwoods; BDN=Brandywine; OFC=Corp Office; Industrial: PLD=Prologis; FR=First Indus; DCT=DCT Indus Trust; EGP=Eastgroup; Data source: SNL Financial, MRQ
36
CLI BDN LRY HIW OFC DRE FR PLD EGP DCT
Variable Debt / Total Debt 0.033 0.042 0.053 0.174 0.2 0.082 0.084 0.169 0.196 0.343
Average 0.1 0.1 0.1 0.1 0.1 0.198 0.198 0.198 0.198
Industrial Average: 19.8%
Office Average: 10.0%
Variable Rate Debt / Total Debt
Low level of secured and variable rate debt creates flexibility and lower volatility
Duke Realty Peer Debt Metrics
CAPITAL Strategy

WHY DUKE REALTY
37
38
Why duke realty
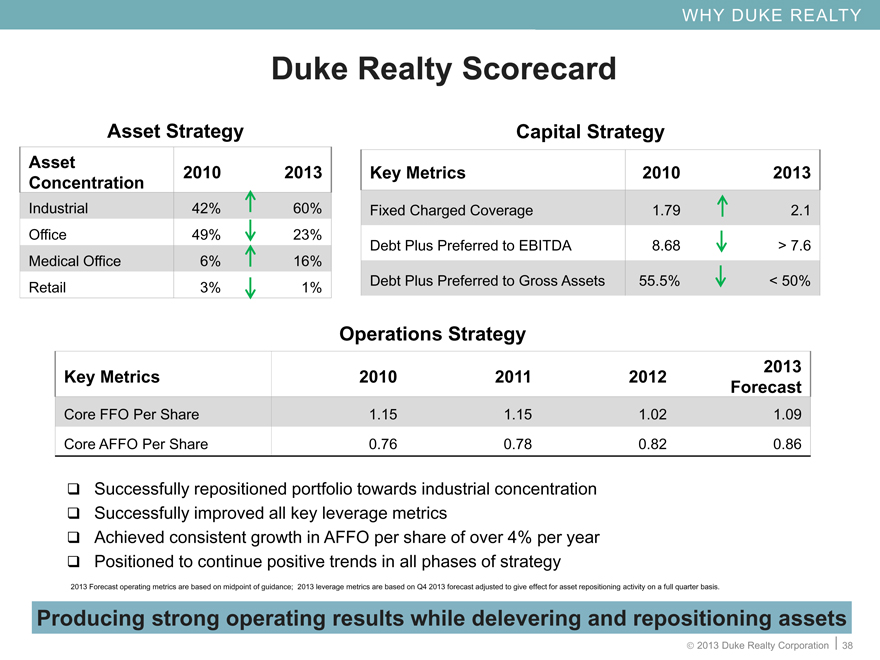
Duke Realty Scorecard
Asset Strategy Asset Strategy Asset Strategy Asset Strategy
Asset Concentration 2010 2013
Industrial 42% 60%
Office 49% 23%
Medical Office 6% 16%
Retail 3% 1%
Capital Strategy Capital Strategy Capital Strategy Capital Strategy
Key Metrics 2010 2013
Fixed Charged Coverage 1.79 2.1
Debt Plus Preferred to EBITDA 8.68 > 7.6
Debt Plus Preferred to Gross Assets 55.5% < 50%
Operations Strategy Operations Strategy Operations Strategy Operations Strategy Operations Strategy
Key Metrics 2010 2011 2012 2013Forecast
Core FFO Per Share 1.15 1.15 1.02 1.09
Core AFFO Per Share 0.76 0.78 0.82 0.86
Successfully repositioned portfolio towards industrial concentration
Successfully improved all key leverage metrics
Achieved consistent growth in AFFO per share of over 4% per year
Positioned to continue positive trends in all phases of strategy
2013 Forecast operating metrics are based on midpoint of guidance; 2013 leverage metrics are based on Q4 2013 forecast adjusted to give effect for asset repositioning activity on a full quarter basis.
Producing strong operating results while delevering and repositioning assets
39
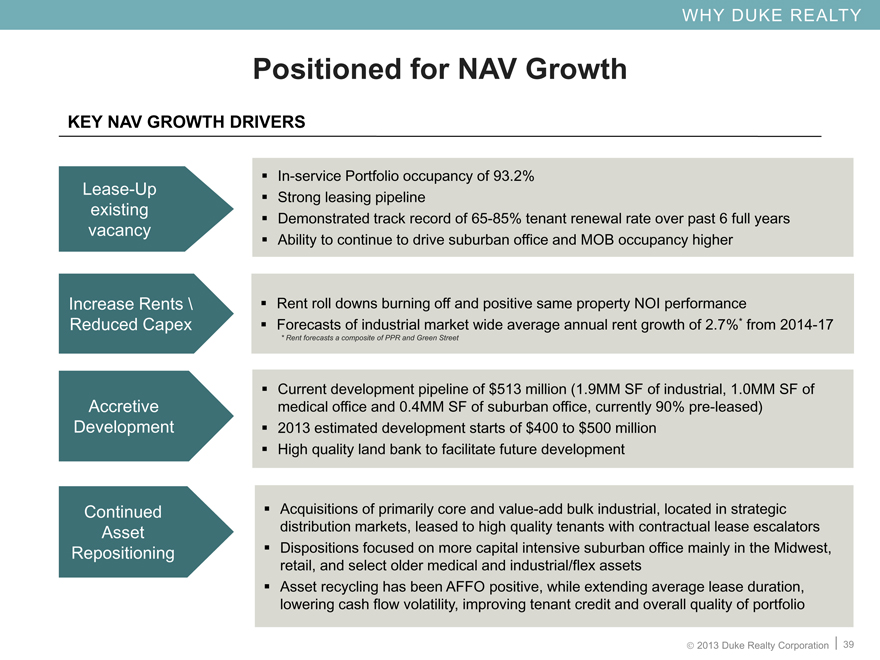
Positioned for NAV Growth
Key NAV Growth Drivers
Lease-Up
existing
vacancy
In-service Portfolio occupancy of 93.2%
Strong leasing pipeline
Demonstrated track record of 65-85% tenant renewal rate over past 6 full years
Ability to continue to drive suburban office and MOB occupancy higher
Accretive
Development
Current development pipeline of $513 million (1.9MM SF of industrial, 1.0MM SF of
medical office and 0.4MM SF of suburban office, currently 90% pre-leased)
2013 estimated development starts of $400 to $500 million
High quality land bank to facilitate future development
Continued
Asset
Repositioning
Acquisitions of primarily core and value-add bulk industrial, located in strategic
distribution markets, leased to high quality tenants with contractual lease escalators
Dispositions focused on more capital intensive suburban office mainly in the Midwest,
retail, and select older medical and industrial/flex assets
Asset recycling has been AFFO positive, while extending average lease duration,
lowering cash flow volatility, improving tenant credit and overall quality of portfolio
Increase Rents \
Reduced Capex
Rent roll downs burning off and positive same property NOI performance
Forecasts of industrial market wide average annual rent growth of 2.7%* from 2014-17
* | | Rent forecasts a composite of PPR and Green Street |
OPERATIONS Strategy
Why duke realty
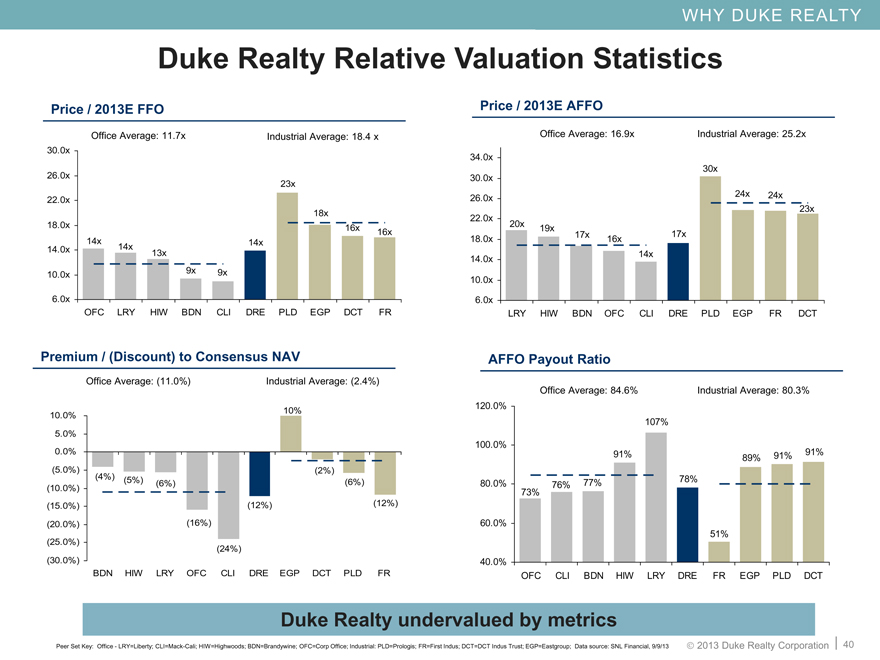
OFC CLI BDN HIW LRY DRE FR EGP PLD DCT
AFFO Payout Ratio 0.725 0.761 0.765 0.912 1.065 0.782 0.506 0.888 0.905 0.913
Average 0.846 0.846 0.846 0.846 0.846 0.803 0.803 0.803 0.803
LRY HIW BDN OFC CLI DRE PLD EGP FR DCT
P / 2013 AFFO 19.8 18.6 16.7 15.7 13.6 17.2 30.4 23.8 23.6 23.1
Average 16.9 16.9 16.9 16.9 16.9 25.2 25.2 25.2 25.2
OFC LRY HIW BDN CLI DRE PLD EGP DCT FR
P / 2013 FFO 14.2 13.5 12.5 9.4 8.9 13.9 23.2 18.1 16.2 16
Average 11.7 11.7 11.7 11.7 11.7 18.4 18.4 18.4 18.4
Industrial Average: 18.4 x
Office Average: 11.7x
Industrial Average: 25.2x
Industrial Average: 80.3%
Office Average: 16.9x
Office Average: 84.6%
Price / 2013E FFO
AFFO Payout Ratio
Price / 2013E AFFO
Peer Set Key: Office—LRY=Liberty; CLI=Mack-Cali; HIW=Highwoods; BDN=Brandywine; OFC=Corp Office; Industrial: PLD=Prologis; FR=First Indus; DCT=DCT Indus Trust; EGP=Eastgroup; Data source: SNL Financial, 9/9/13
Duke Realty Relative Valuation Statistics
40
BDN HIW LRY OFC CLI DRE EGP DCT PLD FR
Premium / (Discount) to NAV -0.04 -0.054 -0.056 -0.159 -0.24 -0.122 0.1 -0.021 -0.057 -0.118
Average -0.11 -0.11 -0.11 -0.11 -0.11 -0.024 -0.024 -0.024 -0.024
Industrial Average: (2.4%)
Office Average: (11.0%)
Premium / (Discount) to Consensus NAV
Duke Realty undervalued by metrics
Why duke realty

41
WHY DUKE REALTY?
Superior Asset Quality
Strategically Located Land Bank and Experienced
Development Capabilities
Proven Operational Success and Future Growth
Opportunities
Balance Sheet Strength
Relative Value vs. Peers
Talent and Leadership Depth to Execute
Medical office strategy
Reliable. answers
Why duke realty
Forward-Looking Statement
This slide presentation contains statements that constitute "forward-looking statements" within the meaning
of the Securities Act of 1933 and the Securities Exchange Act of 1934 as amended by the Private Securities
Litigation Reform Act of 1995. These forward-looking statements include, among others, our statements
regarding (1) strategic initiatives with respect to our assets, operations and capital and (2) the assumptions
underlying our expectations. Prospective investors are cautioned that any such forward-looking statements
are not guarantees of future performance and involve risks and uncertainties, and that actual results may differ
materially from those contemplated by such forward-looking statements. A number of important factors could
cause actual results to differ materially from those contemplated by forward-looking statements in this slide
presentation. Many of these factors are beyond our ability to control or predict. Factors that could cause
actual results to differ materially from those contemplated in this slide presentation include the factors set
forth in our filings with the Securities and Exchange Commission, including our annual report on Form10-K,
quarterly reports on Form 10-Q and current reports on Form 8-K. We believe these forward-looking statements
are reasonable, however, undue reliance should not be placed on any forward-looking statements, which are
based on current expectations. We do not assume any obligation to update any forward-looking statements
as a result of new information or future developments or otherwise.
Certain of the financial measures appearing in this slide presentation are or may be considered to be non-
GAAP financial measures. Management believes that these non-GAAP financial measures provide additional
appropriate measures of our operating results. While we believe these non-GAAP financial measures are
useful in evaluating our company, the information should be considered supplemental in nature and not a
substitute for the information prepared in accordance with GAAP. We have provided for your reference
supplemental financial disclosure for these measures, including the most directly comparable GAAP measure
and an associated reconciliation in our most recent quarter supplemental report, which is available on our
website at www.dukerealty.com. Our most recent quarter supplemental report also includes the information
necessary to recalculate certain operational ratios and ratios of financial position. The calculation of these
non-GAAP measures may differ from the methodology used by other REITs, and therefore, may not be
comparable.
42