UNITED STATES
SECURITIES AND EXCHANGE COMMISSION
Washington, D.C. 20549
FORM 6-K
REPORT OF FOREIGN PRIVATE ISSUER
PURSUANT TO RULE 13a-16 or 15d-16 OF
THE SECURITIES EXCHANGE ACT OF 1934
Report on Form 6-K dated July 30, 2003
Commission File No. 1-14110
7, Place du Chancelier Adenauer
75218 Paris Cedex 16
France
Indicate by check mark whether the registrant files or will file annual reports under cover of Form 20-F or Form 40-F:
Form 20-F: [X] Form 40-F: [ ]
Indicate by check mark if the registrant is submitting the Form 6-K in paper as permitted by Regulation S-T Rule 101(b)(1):
Yes:[ ] No: [X]
Indicate by check mark if the registrant is submitting the Form 6-K in paper as permitted by Regulation S-T Rule 101(b)(7):
Yes:[ ] No: [X]
Indicate by check mark whether the registrant by furnishing the information contained in this form is also thereby furnishing the information to the Commission pursuant to Rule 12g3-2(b) under the Securities Exchange Act of 1934.
Yes:[ ] No: [X]
If “Yes” is marked, indicate below the file number assigned to the registrant in connection with
Rule 12g3-2(b): 82- __________
Enclosure: A press release dated July 29, 2003, announcing Pechiney’s second quarter results for 2003.
| July 29, 2003 | |
| PRESS RELEASE |

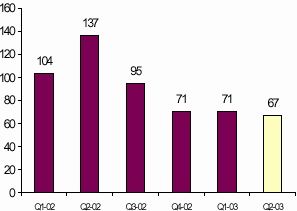
For the second quarter of 2003, Pechiney announces earnings from operations of €67 million, down slightly from the €71 million in the previous quarter. Net income in the second quarter totals €12 million, after a net loss of €1 million in the first quarter of the year.
Highlights
The main trends in the Group’s earnings from operations were as follows.
- As in previous quarters, thePrimary Aluminumsector, which reported earnings from operations of €37 million, down from €42 million, was affected by the depreciation of the US dollar. The €/$ parity realized was 1.11 in the second quarter, compared with 1.04 in the first quarter and 0.90 in the second quarter of 2002. The recent stabilization of the US dollar observed in the markets is a positive factor for Pechiney with reference to its production capacities outside the dollar zone.
- In the second quarter, theAluminum Conversionsector confirmed the recovery reported in the previous quarter, with earnings from operations of €14 million, versus €15 million in the first quarter and €9 million in the second quarter of 2002.Sales volume remained satisfactory particularly in aerospace in Europe, after the inventory depletion observed in 2002, and as additional orders for the A380 are only beginning their upward trend.
- At €26 million, thePackaging sector reported earnings from operations identical to the first quarter. Boosted by good performances in controllable costs reductions, this result was achieved in spite of the fact that the cost of the plastic resins used in flexible packaging reached a high point during the quarter before starting to slide downwards, reflecting the decline in the price of oil.
Pechiney actively continued to implement its strategy during the second quarter with:
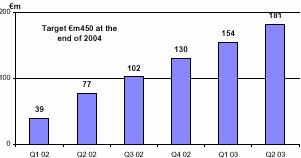
- New gains generated by the Pechiney Continuous Improvement System, totaling the cumulated sum of €181 million since January 1, 2002;
- Two major acquisitions: that of the 65% equity interest held by the financial partners in the Aluminium Dunkerque smelter (effective as of December 30, 2003), which will increase the Group’s attributable aluminum capacity by 17%, and the acquisition of Novacel, the Mexican leader in specialty flexible packaging, a transaction that is expected to be finalized during the summer.
Commentary and prospects At the announcement of Pechiney’s 2003 second quarter results, Jean-Pierre Rodier declared:“2003 is another year in which Pechiney is moving forward. In an eroded economic environment, Pechiney continues to strengthen the Group’s positions in terms of costs as well as of the preparation of the AP50 project and Pechiney’s position as the main supplier for the A380 aircraft, which will lead to an acceleration of deliveries beyond 2003. Pechiney’s uncontested technological leadership in aluminum, its leading positions in the aerospace and in European automotive, as well as the leadership of a good number of its businesses in packaging are the result of a strategy developed over a few years, which aims at maximizing the value of Pechiney for its shareholders and makes for a unique combination of key strong points designed, with the Pechiney Continuous Improvement System, to secure as many growth projects as possible that satisfy the Group’s strict investment criteria.”
The Pechiney Board met on July 28, 2003 and confirmed its position as expressed on July 8, 2003. Besides the uncertain nature of the unsolicited proposed offer by Alcan, the proposed price is grossly insufficient given the company’s industrial, technological and immaterial assets, and in no way reflects its strategic value.
| Statement of income | (French GAAP) | ||||||||||
| Millions of euros | H1 2002 | H1 2003 | Millions of euros | Q2 2002 | Q1 2003* | Q2 2003 | |||||
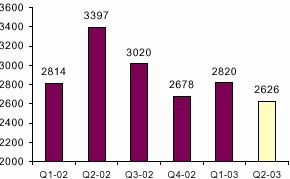
| Net sales | 6,211 | 5,446 | Net sales | 3,397 | 2,820 | 2,626 | |||||
| Earnings from operations | 241 | 138 | Earnings from operations | 137 | 71 | 67 | |||||
| Restructuring expense, other | (70) | (76) | Restructuring expense, other | (54) | (59) | (17) | |||||
| (expense) income | (expense) income | ||||||||||
| Financial expense, net | (22) | (24) | Financial expense, net | (11) | (11) | (13) | |||||
| Income tax expense | (59) | (15) | Income tax expense | (31) | 5 | (20) | |||||
| Equity affiliates | 4 | 5 | Equity affiliates | 3 | 2 | 3 | |||||
| Minority interests | 0 | (3) | Minority interests | 4 | (2) | (1) | |||||
| Net Income before goodwill | 94 | 25 | Net Income before goodwill | 48 | 6 | 19 | |||||
| Goodwill amortisation | (17) | (14) | Goodwill amortisation | (8) | (7) | (7) | |||||
| except. Goodwill amortisation | (31) | - | except. Goodwill amortisation | (31) | - | - | |||||
| Net income | 46 | 11 | Net income | 9 | (1) | 12 | |||||
| Net Income Per share "A" (€) | 0.57 | 0.14 | Net Income Per share "A" (€) | 0.11 | (0.02) | 0.15 | |||||
| Adjusted Net Income ** | 123 | 60 | Adjusted Net Income ** | 74 | 37 | 23 | |||||
| Adj. Net inc. / share** bef. GW | 1.78 | 0.95 | Adj. Net inc. / share** bef. GW | 1.04 | 0.56 | 0.39 | |||||
| Adj. net income per share** | 1.56 | 0.77 | Adj. net income per share** | 0.94 | 0.47 | 0.30 | |||||
| Principal indicators | ||||||
| Q2 | Q1 | Q2 | ||||
| 2002 | 2003 | 2003 | ||||
| Average euro/U.S. dollar | 0.92 | 1.07 | 1.14 | |||
| Realised € /$ (Primary Al.) | 0.90 | 1.04 | 1.11 | |||
| LME average price ($/t) | 1,377 | 1,392 | 1,380 | |||
| Average realized price ($/t) | 1,385 | 1,368 | 1,390 | |||
 |  |
| Recent developments | ||
|
| |
Main trends – Q2 2003
Pechiney Continuous Improvement System – Q2 2003
To cumulated gains, gross of inflation, of €154 million reported at the end of March 2003, €27 million can be added for the second quarter of 2003. Cumulated gains since January 1, 2002, thus total €181 million.
Cumulated Continuous Improvement Gains at the end of June 2003
Market environment
In the Primary Aluminum market, the latest estimates of the balance between supply and demand show a significant revision of the data for 2002. With a world demand higher than estimated, with an increase of 6.9%, and a level of production that was slightly below previous estimates, the excess supply of primary aluminum vis-à-vis demand in 2002 can now be estimated at approximately 320,000 metric tons, instead of the almost 800,000 metric tons previously reported. In 2003, the planned increases in production capacity should be scaled back by pressure on the spot market price of alumina, while demand remains strong, boosted in particular by the consumption of aluminum in China, up 29% in the first five months of 2003. In the Aluminum Conversion markets, Pechiney’s European activities benefit from the upturn in shipments to Airbus after inventory depletion in 2002. Conversely, markets for extrusions in Europe and for standard rolled products in the United States remain depressed. In Packaging, the trend in markets linked to food products remains steady, whereas the beauty market remains depressed without sign of a recovery. | In addition, the main external factors that influence Pechiney’s results seem to have hit a low point in the second quarter in several areas:
|
Net Sales (new organization1)
| Millions of euros | Q2 2002 | Q1 2003 | Q2 2003 | |||
| Primary Aluminium | 488 | 473 | 460 | |||
| Aluminium Conversion | 703 | 659 | 618 | |||
| Packaging | 614 | 559 | 549 | |||
| Net sales from | 1,805 | 1,691 | 1,627 | |||
| industrial operations | ||||||
| International Trade | 1,592 | 1,129 | 999 | |||
| Total | 3,397 | 2,820 | 2,626 | |||
Earnings from operations (new organization1)
| Millions of euros | Q2 2002 | *Q1 2003 | Q2 2003 | |||
| Primary Aluminium | 93 | 42 | 37 | |||
| Aluminium Conversion | 9 | 15 | 14 | |||
| Packaging | 40 | 26 | 26 | |||
| International Trade | 18 | 14 | 14 | |||
| Holdings | (23) | (26) | (24) | |||
| Total | 137 | 71 | 67 | |||
Segment breakdown - Second quarter 2003
Primary Aluminum (Aluminum Metal, Bauxite – Alumina and Ferroalloys) Good operating performance and stabilization of external factors At €37 million, earnings from operations in the second quarter of 2003, were down €5 million from the previous quarter, and down €56 million from the second quarter of 2002. This decline was mainly due to the depreciation of the US dollar, whose parity realized vis-à-vis the euro fell 23%, from 0.90 to 1.11 US dollars for 1 euro since the second quarter of 2002. This negative trend has, however, recently stabilized. This occurred in an environment in which the price of aluminum remained not very high, at a level slightly less than 1,400 US dollars per metric ton, in expectation of signs of a world economic recovery and of a reduction in the excess supply of aluminum. In this difficult environment, the sector reported very good manufacturing performance in the second quarter at almost all its production facilities, with the exception of PNL’s Dutch smelter, whose difficulties should be resolved by the end of 2003. The project to build the first smelter using AP50 technology in South Africa is also being actively pursued in order to finalize the project’s shareholding base. Aluminum Conversion Upturn in shipments to the aerospace sector confirmed, good operational performance of European facilities, slight decrease in demand in Europe and reduced losses in the United States In the second quarter, with earnings from operations of €14 million, the Aluminum Conversion sector confirmed the recovery reported in the first quarter which generated €15 million, versus €9 million in the second quarter of 2002. | European activities ensured earnings from operations of €21 million, compared with €24 million in the second quarter of 2002. The increase in aerospace shipments was thus confirmed. After a 15% rise in the first quarter, the Issoire facility reported 29% growth in shipments to aerospace in Europe compared with the second quarter of 2002, in part owing to the first shipments of parts for the assembly of Airbus A380 aircraft. However, the environment remains depressed in extrusions and foil and thin foil. In the United States (Ravenswood, Vernon and Aluminum Lithium), the operating loss totaled €7 million in the second quarter of 2003, a definite improvement over the first quarter of 2003 (loss of €11 million) and the second quarter of 2002 (loss of €15 million). The reorganization of Aluminum Lithium activities made it possible to offset somewhat the difficulties at Ravenswood, where improved operating performance has been slowed by the continued depressed economic environment in the United States. Packaging A fast pace of cost reductions in the second quarter and the start of a decline in the price of resins after a high point during the period Earnings from operations in Packaging totaled €26 million, stable compared with the previous quarter and down from the second quarter of 2002. The sector reported good performances with regard to the Pechiney Continuous Improvement System, and managed to reduce its costs despite cost overruns of plans being shut down. In the second quarter, the sector continued to suffer from a strong price/raw materials scissors effect and the depreciation of the US dollar vis-à-vis the euro, a movement that accelerated in comparison with the first quarter. | |
| 1 2002 numbers have been restated according to the new organization launched on February 1st 2003. | ||
The sector also announced the signing of an agreement to acquire Novacel, the Mexican leader in specialty flexible packaging. This transaction creates major growth opportunities for Pechiney in both the Mexican and American markets. This acquisition, like the creation of Techpack Asia, illustrates the strategy that aims to expand in new markets and optimize labor costs. In the second half, the sector should benefit from the impact of these acquisitions, the progressive recovery of activities currently being restructured and the recent trend to lower resin prices. International Trade At €14 million, earnings from operations in International Trade were in line with the figure reported in the first quarter, as the good performance of trading activities offset the negative influence of the US dollar. Other statement of income items Income from operations totaled €50 million in the second quarter of 2003, versus €83 million in the second quarter of 2002 and €12 million in the first quarter of 2003. This figure included €17 million of Restructuring expense and Other (expense) income. | Current and deferred income taxes represented a charge of €20 million in the second quarter of 2003, versus €31 million in the same period in 2002. The high effective tax rate during the quarter is owed to the impact on differed taxes of the USD/AUD parity evolution. Amortization of goodwill The Group continues the regular amortization of its goodwill on the basis of French accounting standards. A charge of €7 million was recorded in the second quarter of 2003. Cash flow The cash flow generated by operations totaled €268 million in the first half of the year. Net of investments and divestitures, the Group's cash flow was a negative €38 million, before €87 million of dividends paid. Financial structure As of June 30, 2003, net indebtedness totaled €1,526 million, up €89 million from December 31, 2002. Compared with shareholders' equity and minority interests of €3,024 million, the debt-to-equity ratio was 0.50, compared with 0.45 as of December 31, 2002.
|
| Calendar | |
| Next consensus survey: | October 1, 2003 |
| Third quarter results: | October 28, 2003 |
Pursuant to article 7 of the COB Rule book n° 2002-04, this press release was disclosed to the Commission des Opérations de Bourse before its release.
Certain statements in this press release that describe Pechiney’s intentions, expectations or projections may constitute forward-looking statements. These forward-looking statements involve known and unknown risks, uncertainties and other factors that may cause Pechiney’s actual results, performance or achievement to be materially different from its intentions, expectations or projections. The forward-looking statements in this press release speak only as of its date and Pechiney undertakes no obligation to update or revise any forward-looking statement to reflect events or circumstances after the date hereof or to reflect the occurrence of unanticipated events.
| Investor Relations Contact: | Press Contacts: | ||
| Charles L. Ranunkel: | Tel: 33 1 56 28 25 07 Fax 33 1 56 28 33 38 | Chrystèle Ivins: Tel: 33 1 56 28 24 18 chrystele.ivins@pechiney.com | |
PECHINEY | Stephan Giraud: Tel: 33 1 56 28 24 19 stephan.giraud@pechiney.com | ||
Appendix
Comparison with American accounting standards (US GAAP)
Statement of Income Q2 2003
| Millions of euros | French | FAS | FAS | US | ||||
| GAAP | 133 | 142 | GAAP | |||||
| Impact | Impact | |||||||
| Net Sales | 2,626 | (1) | - | 2,625 | ||||
| Earnings from | 67 | 9 | - | 76 | ||||
| operations | ||||||||
| Restructuring expense, | ||||||||
| other (expense) income | (17) | - | - | (17) | ||||
| Income from | 50 | 9 | - | 59 | ||||
| operations | ||||||||
| Financial expense, net | (13) | (2) | - | (15) | ||||
| Income tax benefit | (20) | (3) | - | (23) | ||||
| (expense) | ||||||||
| Equity in net earnings of | 3 | 1 | - | 4 | ||||
| affiliates | ||||||||
| Minority interests | (1) | - | - | (1) | ||||
| Goodwill amortisation | (7) | - | 7 | - | ||||
| Net Income | 12 | 5 | 7 | 24 | ||||
Balance Sheet as of 30/06/2003
| Millions of euros | French | US | US | ||||||
| GAAP | GAAP | GAAP | |||||||
| Impact | |||||||||
| Long-term assets | 4,865 | (28) | 4,837 | ||||||
| Current assets | 3,344 | 228 | 3,572 | ||||||
| Total assets | 8,209 | 200 | 8,409 | ||||||
| Shareholder's equity | 2,877 | (57) | 2,820 | ||||||
| Minority Interests | 147 | - | 147 | ||||||
| Long-term liabilities | 2,674 | 55 | 2,729 | ||||||
| Current liabilities | 2,511 | 202 | 2,713 | ||||||
| Total liabilities and | |||||||||
| 8,209 | 200 | 8,409 | |||||||
| Shareholder's equity | |||||||||
Impact of the initial application of SFAS 143 on the
| statement of income Q1 2003 | |||||||||||
| Millions of euros | |||||||||||
| Earnings from operations | 72 | (1) | 71 | (5) | 66 | ||||||
| Restructuring expense, other | |||||||||||
| (expense) income | (61) | 2 | (59) | - | (59) | ||||||
| Income from operations | 11 | 1 | 12 | (5) | 7 | ||||||
| Financial expense, net | (11) | - | (11) | 3 | (8) | ||||||
| Income tax benefit (expense) | 6 | (1) | 5 | 1 | 6 | ||||||
| Equity in net earnings of | 1 | 1 | 2 | 2 | 4 | ||||||
| affiliates | |||||||||||
| Minority interests | (2) | - | (2) | - | (2) | ||||||
| Goodwill amortisation | (7) | - | (7) | 7 | - | ||||||
| Net income before cumulative | (2) | 1 | (1) | 8 | 7 | ||||||
| effect of accounting change | |||||||||||
| Cumulative effect of | - | - | 36 | 36 | |||||||
| accounting change | |||||||||||
| Net Income | (2) | 1 | (1) | 44 | 43 | ||||||
The accounting principles applied by the Group in the preparation of its financial statements differ in certain points from generally accepted accounting principles in the United States (US GAAP). The impact of these differences is presented in the accompanying tables. Accounting for derivatives and hedging operations Pechiney's US GAAP financial statements reflect the application of SFAS 133, which requires that derivative instruments (foreign exchange, interest rates, commodities) be recognized in the balance sheet at fair value, and sets criteria to define transactions that may be accounted for as hedging operations. On the basis of these criteria, certain hedging operations, although efficient from an economic point of view, are not recognized as hedging activities. As a result, gains and losses due to the mark to market of certain hedging instruments are recorded in net income or in equity, with no recognition of the inverse effect of the mark to market of the hedged items. For this reason, the impact of this standard on results varies according to market conditions and is difficult to forecast. The application of SFAS 133 generated a net accounting gain (with no impact on cash flow) of € 5 million in the second quarter of 2003. Amortisation of goodwill In Pechiney's US GAAP financial statements reflect the application of SFAS 142, which requires that goodwill be not amortised on a recurring basis, but be regularly tested for impairment, leading, if necessary to non-recurring amortisation.The application of SFAS 142 led to the cancellation of recurring amortisation in the second quarter of 2003. | Cumulative effect of initially applying SFAS 143 In Pechiney's US GAAP financial statements and French GAAP financial statements, the accounting standard SFAS 143, “Accounting for asset retirement obligation”, was adopted during the second quarter of 2003, effective January 1, 2003. In the US GAAP financial statements, the cumulative effect adjustment at January 1, 2003 is presented on a specific line, at the bottom of the statement of income for the first quarter of 2003. In the French GAAP financial statements, the cumulative effect adjustment is directly recognized in equity. SFAS 143 requires that legal obligations associated with the retirement of long-lived assets and resulting from normal activities be recognized as liabilities, at fair value, when incurred. These asset retirement costs are capitalized by increasing the carrying amount of the related asset and are depreciated over the useful life of the asset. For Pechiney, the main change relates to the cost of disposal of spent pot lining of aluminum pots in operation, which is now recognized as a liability and capitalized from the time the lining is placed into service. As a consequence, since January 1, 2003, the cost of replacing pot lining, which was previously charged to income, has also been capitalized and depreciated over the useful life of the lining, including for pots in operation at January 1, 2003. The cumulative effect at January 1, 2003 is an increase of net property plant and equipment, environmental reserves and minority interest by respectively 90, 30 and 3 million euros and a decrease of net deferred tax assets by 21 million euros resulting in a positive net effect of € 36 million. The effect of the change on the results for the first quarter of 2003 is a decrease of Earnings from operations of the Primary Aluminum sector by €1 million and an improvement of Net income before cumulative effect of accounting change by € 1 million. The effect of the change on the second quarter is a decrease of Earnings from operations by € 1 million and a decrease of Net income by € 1 million. Balance-sheet – The differences in the balance sheet as of June 30, 2003 included the impacts of SFAS 133, SFAS 142 and SFAS 87 (reduction in shareholders' equity due to the different way complementary retirement provisions are recorded in US and in French GAAP). These differences amounted to a net reduction in shareholders’ equity of € 57 million as of June 30, 2003 in US GAAP, down from € 105 million as of December 31, 2002. |
PECHINEY
Consolidated Statement of Income
| French GAAP | |||||
| (in millions of euros) | Q2 2002 | Q2 2003 | |||
| Net sales | 3,397 | 2,626 | |||
| Other operating revenues | 41 | 51 | |||
| Cost of goods sold (excluding depreciation) | (3,042) | (2,344) | |||
| Selling, general and administrative expense | (152) | (144) | |||
| Research and development expense | (20) | (24) | |||
| Amortisation (excluding goodwill) | (87) | (98) | |||
| Earnings from operations | 137 | 67 | |||
| Restructuring expense and Long-lived assets writedowns | (43) | (10) | |||
| Other (expense) income | (11) | (7) | |||
| Income from operations | 83 | 50 | |||
| Financial expense, net | (11) | (13) | |||
| Income before income taxes | 72 | 37 | |||
| Income tax benefit (expense) | (31) | (20) | |||
| Income from consolidated companies | 41 | 17 | |||
| Equity in net earnings of affiliates | 3 | 3 | |||
| Minority interests | 4 | (1) | |||
| Net Income before goodwill | 48 | 19 | |||
| Goodwill amortisation | (8) | (7) | |||
| Exceptional Goodwill amortisation | (31) | - | |||
| Net Income | 9 | 12 | |||
| Net Income per share "A" (€)(*) | 0.11 | 0.15 | |||
| (*) Computed on the average number of shares, i.e. 77,855,742 for the second quarter of2003 (excludingtreasury shares) and 78,927,067 “A” and “B” (which existed at the time) shares for the second quarter of 2002. | |||||
| Adjusted Net Income per share Calculation | |||||
| - Adjusted net Income (**) | 74 | 23 | |||
| - Adjusted net Income per share (€) | 0.94 | 0.30 | |||
Consolidated Statement of Cash Flow
| (in millions of euros) | Q2 2002 | Q2 2003 | ||
| Resources from Operations | 173 | 169 | ||
| Change in working capital requirements | 74 | 10 | ||
| Utilisation of provisions and other | (127) | (90) | ||
| Cash provided by Operations | 120 | 89 | ||
| Capital expenditures | (122) | (162) | ||
| Financial investments | (5) | (27) | ||
| Divestitures and other | (6) | 8 | ||
| Net Cash-flow | (13) | (92) | ||
| Dividends paid | (98) | (87) | ||
| Purchase of treasury shares | (7) | (1) | ||
| Increase in capital | - | - | ||
| Increase (decrease) in Cash | (118) | (180) | ||
PECHINEY
Consolidated Statement of Income
| French GAAP | |||||||||||||||
| (in millions of euros) | Q1 | Q2 | Q3 | Q4 | Q1 | Q2 | Q4 | ||||||||
| Net sales | 2,814 | 3,397 | 3,020 | 2,678 | 2,820 | 2,626 | |||||||||
| Other operating revenues | 30 | 41 | 35 | 38 | 30 | 51 | |||||||||
| Cost of goods sold (excluding depreciation) | (2,473) | (3,042) | (2,717) | (2,379) | (2,513) | (2,344) | |||||||||
| Selling, general and administrative expense | (153) | (152) | (142) | (163) | (148) | (144) | |||||||||
| Research and development expense | (24) | (20) | (22) | (24) | (24) | (24) | |||||||||
| Amortisation (excluding goodwill) | (90) | (87) | (79) | (79) | (94) | (98) | |||||||||
| Earnings from operations | 104 | 137 | 95 | 71 | 71 | 67 | |||||||||
| Restructuring expense and Long-lived assets | (10) | (43) | (7) | (85) | (50) | (10) | |||||||||
| writedowns | |||||||||||||||
| Other (expense) income | (6) | (11) | (40) | (41) | (9) | (7) | |||||||||
| Income from operations | 88 | 83 | 48 | (55) | 12 | 50 | |||||||||
| Financial expense, net | (11) | (11) | (16) | (11) | (11) | (13) | |||||||||
| Income before income taxes | 77 | 72 | 32 | (66) | 1 | 37 | |||||||||
| Income tax benefit (expense) | (28) | (31) | (19) | 39 | 5 | (20) | |||||||||
| Income from consolidated companies | 49 | 41 | 13 | (27) | 6 | 17 | |||||||||
| Equity in net earnings of affiliates | 1 | 3 | 0 | (1) | 2 | 3 | |||||||||
| Minority interests | (4) | 4 | (3) | 3 | (2) | (1) | |||||||||
| Net Income before goodwill | 46 | 48 | 10 | (25) | 6 | 19 | |||||||||
| Goodwill amortisation | (9) | (8) | (8) | (7) | (7) | (7) | |||||||||
| Exceptional Goodwill amortisation | - | (31) | (16) | (50) | - | - | |||||||||
| Net Income | 37 | 9 | (14) | (82) | (1) | 12 | |||||||||
| - Adjusted net Income (*) | 49 | 74 | 38 | 50 | 37 | 23 | |||||||||
| - Adjusted net Income per share (€) | 0.62 | 0.94 | 0.48 | 0.65 | 0.47 | 0.30 | |||||||||
Earnings from operations (new organization)
| Q1 | Q2 | Q3 | Q4 | Q1 | Q2 | Q3 | Q4 | |||||||||
| Primary Aluminium | 69 | 93 | 70 | 50 | 42 | 37 | ||||||||||
| Aluminium Conversion | 4 | 9 | 0 | 0 | 15 | 14 | ||||||||||
| Packaging | 33 | 40 | 32 | 24 | 26 | 26 | ||||||||||
| International Trade | 19 | 18 | 16 | 20 | 14 | 14 | ||||||||||
| Holdings | (21) | (23) | (23) | (23) | (26) | (24) | ||||||||||
| Total | ||||||||||||||||
| 104 | 137 | 95 | 71 | 71 | 67 | |||||||||||
| Total EBITDA (**) | 194 | 224 | 174 | 150 | 165 | 165 | ||||||||||
| Consolidated primary Aluminium Prod. (kt) | 215 | 219 | 221 | 222 | 217 | 210 | ||||||||||
| Average realised LME price ($/t)(***) | 1,354 | 1,385 | 1,360 | 1,334 | 1,368 | 1,390 | ||||||||||
| Realised € /$ – Primary Aluminium | 0.88 | 0.90 | 0.95 | 0.98 | 1.04 | 1.11 | ||||||||||
| Average euro/U.S. dollar | 0.88 | 0.92 | 0.98 | 1.00 | 1.07 | 1.14 | ||||||||||
(***) Average actual selling price of a metric ton of primary aluminium (excluding premiums) negotiated by the Group during the quarter.
Consolidated Balance Sheet
| French GAAP | |||||
| (in millions of euros) | As of 31/12/2002 | As of 30/06/2003 | |||
| ASSETS | |||||
| Long-term assets | |||||
| Property, plant and equipment, net | 2,832 | 2,927 | |||
| Goodwill, net | 637 | 625 | |||
| Other intangible assets, net | 163 | 135 | |||
| Investments in equity affiliates | 285 | 285 | |||
| Long-term investments | 139 | 100 | |||
| Deferred income taxes | 505 | 495 | |||
| Other long-term assets | 279 | 298 | |||
| 4,840 | 4,865 | ||||
| Current assets | |||||
| Inventories, net | 1,525 | 1,453 | |||
| Accounts receivable – Trade | 1,281 | 1,414 | |||
| Deferred income taxes | 51 | 46 | |||
| Prepaid expenses | 72 | 66 | |||
| Other receivables | 29 | 14 | |||
| Marketable securities | 153 | 54 | |||
| Cash | 283 | 297 | |||
| 3,394 | 3,344 | ||||
| Total assets | 8,234 | 8,209 | |||
| LIABILITIES AND SHAREHOLDERS' EQUITY | |||||
| Shareholder's equity | |||||
| Capital stock | |||||
| - Common shares "A" | 1,242 | 1,260 | |||
| - Preferred shares "B" | 16 | - | |||
| Treasury shares | (180) | (181) | |||
| Share premium | 790 | 790 | |||
| Retained earnings | 1,297 | 1,242 | |||
| Cumulative translation adjustment | (151) | (234) | |||
| 3,014 | 2,877 | ||||
| Minority interests | 149 | 147 | |||
| Long-term liabilities | |||||
| Deferred income taxes | 195 | 184 | |||
| Other long-term liabilities | 1,142 | 1,162 | |||
| 1,337 | 1,346 | ||||
| Long-term debt | 1,465 | 1,328 | |||
| Current liabilities | |||||
| Accounts payable – Trade | 1,456 | 1,576 | |||
| Accrued liabilities | 376 | 372 | |||
| Other payables | 8 | 6 | |||
| Current portion of long-term debt | 39 | 185 | |||
| Short-term bank loans | 390 | 372 | |||
| 2,269 | 2,511 | ||||
| Total liabilities and shareholders' equity | 8,234 | 8,209 | |||
| Net Debt | 1,437 | 1,526 | |||
| Shareholder's equity + Minority interests | 3,163 | 3,024 | |||
| Gearing | 0.45 | 0.50 | |||
PECHINEY
Consolidated Statement of Income
| US GAAP(*) | |||||
| (in millions of euros) | Q2 2002 | Q2 2003 | |||
| Net sales | 3,408 | 2,625 | |||
| Other operating revenues | 41 | 51 | |||
| Cost of goods sold (excluding depreciation) | (3,043) | (2,334) | |||
| Selling, general and administrative expense | (152) | (144) | |||
| Research and development expense | (20) | (24) | |||
| Amortisation (excluding goodwill) | (87) | (98) | |||
| Earnings from operations | 147 | 76 | |||
| Restructuring expense and Long-lived assets writedown | (43) | (10) | |||
| Other (expense) income | (11) | (7) | |||
| Income from operations | 93 | 59 | |||
| Financial expense, net | (13) | (15) | |||
| Income before income taxes | 80 | 44 | |||
| Income tax benefit (expense) | (34) | (23) | |||
| Income from consolidated companies | 46 | 21 | |||
| Equity in net earnings of affiliates | 14 | 4 | |||
| Minority interests | 4 | (1) | |||
| Net Income | 64 | 24 | |||
| Net Income per share "A" (€)(**) | 0.81 | 0.31 | |||
(**) Computed on the average number of shares, i.e. 77,855,742 for the second quarter of 2003 (excluding treasury shares) and 78,927,067 “A” and “B” (which existed at the time) shares for the second quarter of 2002.
| - Adjusted net Income (***) | 98 | 35 | ||
| - Adjusted net Income per share (€) | 1.25 | 0.46 | ||
Consolidated Statement of Cash Flow
| (in millions of euros) | Q2 2002 | Q2 2003 | ||
| Resources from Operations | 188 | 176 | ||
| Change in working capital requirements | 53 | 15 | ||
| Utilisation of provisions and other | (121) | (102) | ||
| Cash provided by Operations | 120 | 89 | ||
| Capital expenditures | (122) | (162) | ||
| Financial investments | (5) | (27) | ||
| Divestitures and other | (6) | 8 | ||
| Net Cash-flow | (13) | (92) | ||
| Dividends paid | (98) | (87) | ||
| Purchase of treasury shares | (7) | (1) | ||
| Increase in capital | - | - | ||
| Increase (decrease) in Cash | (118) | (180) | ||
Appendix
Consolidated Balance Sheet
| US GAAP | ||||
| (in millions of euros) | As of 31/12/2002 | As of 30/06/2003 | ||
| ASSETS | ||||
| Current assets | ||||
| Cash | 283 | 297 | ||
| Marketable securities | 153 | 54 | ||
| Other receivables | 11 | 10 | ||
| Prepaid expenses | 309 | 334 | ||
| Deferred income taxes | 47 | 31 | ||
| Accounts receivable – Trade | 1,269 | 1,392 | ||
| Inventories, net | 1,524 | 1,454 | ||
| 3,596 | 3,572 | |||
| Long-term assets | ||||
| Other long-term assets | 201 | 240 | ||
| Deferred income taxes | 499 | 488 | ||
| Long-term investments | 139 | 100 | ||
| Investments in equity affiliates | 285 | 287 | ||
| Other intangible assets, net | 163 | 135 | ||
| Goodwill, net | 659 | 660 | ||
| Property, plant and equipment, net | 2,832 | 2,927 | ||
| 4,778 | 4,837 | |||
| Total assets | 8,374 | 8,409 | ||
| LIABILITIES AND SHAREHOLDERS' EQUITY | ||||
| Short term debt | ||||
| Short term bank loans | 392 | 372 | ||
| Current portion of long term debt | 39 | 185 | ||
| Other payables | 8 | 6 | ||
| Accrued liabilities | 579 | 578 | ||
| Accounts payable – Trade | 1,451 | 1,572 | ||
| 2,469 | 2,713 | |||
| Other long term liabilities | 45 | 55 | ||
| Long term Debt | 1,465 | 1,328 | ||
| Long term Liabilities | ||||
| Other long term liabilities | 1,142 | 1,162 | ||
| Deferred income taxes | 195 | 184 | ||
| 1,337 | 1,346 | |||
| Minority Interests | 149 | 147 | ||
| Shareholder's equity | ||||
| Fair value of derivative instruments | 33 | 54 | ||
| Cumulative translation adjustment | (151) | (233) | ||
| Additional minimum pension liability | (141) | (135) | ||
| Retained earnings | 1,300 | 1,265 | ||
| Share premium | 790 | 790 | ||
| Treasury shares | (180) | (181) | ||
| Capital stock | 1,258 | 1,260 | ||
| - Common shares "A" | 1,242 | 1,260 | ||
| - Preferred shares "B" | 16 | - | ||
| 2,909 | 2,820 | |||
| Total liabilities and shareholders' equity | 8,374 | 8,409 | ||
SIGNATURES
Pursuant to the requirements of the Securities Exchange Act of 1934, Pechiney has duly caused this report to be signed on its behalf by the undersigned, thereunto duly authorized.
| Date: July 30, 2003 | PECHINEY By: /s/ OLIVIER MALLET Name: Olivier MALLET Title: Chief Financial Officer |