QuickLinks -- Click here to rapidly navigate through this document
SECURITIES AND EXCHANGE COMMISSION
Washington, DC 20549
FORM 6-K
REPORT OF FOREIGN ISSUER
PURSUANT TO RULE 13a-16 or 15d-16 OF
THE SECURITIES EXCHANGE ACT OF 1934
For the month of November 2005
Commission File Number:1-14118
2005 THIRD QUARTER RESULTS
QUEBECOR WORLD INC.
(Translation of Registrant's Name into English)
612 Saint-Jacques Street, Montreal, Quebec H3C 4M8
(Address of Principal Executive Office)
Indicate by check mark whether the registrant files or will file annual reports under cover of Form 20-F or Form 40-F
Form 20-F o Form 40-F ý
Indicate by check mark if the registrant is submitting the Form 6-K in paper as permitted by Regulation S-T Rule 101(b)(1):
Note: Regulation S-T Rule 101(b)(1) only permits the submission in paper of a Form 6-K if submitted solely to provide an attached annual report to security holders.
Indicate by check mark if the registrant is submitting the Fork 6-K in paper as permitted by Regulation S-T Rule 101(b)(7):
Note: Regulation S-T Rule 101(b)(7) only permits the submission in paper of a Form 6-K if submitted to furnish a report or other document that the registrant foreign private issuer must furnish and make public under the laws of the jurisdiction in which the registrant is incorporated, domiciled or legally organized (the registrant's "home country"), or under the rules of the home country exchange on which the registrant's securities are traded, as long as the report or other document is not a press release, is not required to be and has not been distributed to the registrant's security holders, and, if discussing a material event, has already been the subject of a Form 6-K submission or other filing on EDGAR.
Indicate by check mark whether the registrant by furnishing the information contained in this form is also thereby furnishing the information to the Commission pursuant to Rule 12g3-2(b) under the Securities Exchange Act of 1934.
Yes o No ý
If "Yes" is marked, indicate below the file number assigned to the registrant in connection with Rule 12g3-2(b): 82- .
QUEBECOR WORLD INC.
Filed in this Form 6-K
Documents index
- Press Release dated November 1, 2005; Financial Highlights
- Management's Discussion and Analysis of Financial Condition and Results of Operations
- Consolidated Financial Statements
- Certifications of Interim Filings
![]()
November 1, 2005 13/05
For immediate release Page 1 of 8
QUEBECOR WORLD ANNOUNCES THIRD QUARTER RESULTS
HIGHLIGHTS
- Net income from continuing operations for the third quarter of $31 million compared to $46 million
- Third quarter revenue was $1.58 billion
- Volume increases offset by lower pricing in most segments and weak performance in France and the UK
- Operating income before impairment of assets, restructuring and other charges (IAROC) at $97 million compared to $112 million
- Earnings per share before IAROC $0.28 compared to $0.36
- IAROC of $17 million in quarter compared to $13 million
Montréal, Canada — Quebecor World (NYSE:IQW, TSX:IQW.SV) announces that for the third quarter 2005 the Company reported net income of $31 million from continuing operations compared to $46 million in the third quarter of last year. The continuing operations do not include a previously identified group of non-core group assets slated for sale and the third quarter results for 2004 have been restated to reflect this fact. On the same basis, diluted earnings per share in the third quarter were $0.16 compared to $0.28 in 2004. Operating income before IAROC was $97 million compared to $112 million during the same period last year. Consolidated revenues for the quarter were $1.58 billion compared to $1.57 billion last year.
In the third quarter 2005, the Company recorded impairment of assets, restructuring and other charges of $17 million or $0.12 per share compared to $13 million or $0.08 per share in the third quarter last year. Before impairment of assets restructuring and other charges, earnings per share for continuing operation were $0.28 compared to $0.36 in the third quarter of 2004.
1
For immediate release Page 2 of 8
"These results are indicative of lower prices for many print products, higher energy costs and the poor performance of our operations in France and the United Kingdom," said Pierre Karl Péladeau, President and CEO, Quebecor World Inc. "We are continuing to renew existing customers, and are winning new ones. These sales successes are positioning us to realize the maximum benefits of our new equipment as we move forward with the implementation of our North American and European retooling plans."
Quebecor World is on schedule with its current equipment investment plan that will see the installation of 22 new wide-web offset presses. Five of those presses will be in operation in U.S. facilities in the fourth quarter. The remainder will come into service in 2006 and 2007.
"Not only are our new presses being installed on time but because of the strong support form our suppliers and the diligent efforts of our employees, these presses have not experienced the usual start-up delays," said Mr. Péladeau. "To date, the new equipment is performing as advertised and we expect this to continue as we move forward with our investment plan."
To address the underperformance of certain sectors of its European operations and to further strengthen the overall platform the Company expects to announce a comprehensive European investment plan in the first quarter of 2006.
"Our European investment plan will be based on the criteria we established for our North America platform. We will invest in state-of-the-art technology and locate it where it can best serve our customers" added Mr. Péladeau.
As part of its effort to improve results in Europe, restructuring initiatives in the third quarter included workforce reductions at the Helio Corbeil facility in France and other plants across the Company. The cash cost of the third quarter restructuring initiatives was $9.5 million.
Quebecor World continues to reduce costs across its global platform. In the third quarter 2005, selling, general and administrative expenses were $95 million compared to $108 million in the third quarter of 2004, a decrease of 12% or $15 million excluding the unfavourable impact of currency translation.
Year-to-date
For the first nine months of 2005, net income from continuing operations was $56 million or $0.20 per share compared to $94 million or $0.50 per share last year. Before impairment of assets, restructuring and other charges, diluted earnings per share for the first three quarters of 2005 were $0.77 compared to $0.86 last year. Operating income before IAROC was $270 million in 2005 compared to $310 million last year. Consolidated revenue for the first nine months of 2005 was $4.62 billion compared to $4.52 billion in 2004.
2
For immediate release Page 3 of 8
Impairment of assets, restructuring and other charges for nine months stands at $82 million compared to $67 million for 2004. On the cost side, for the first nine months of 2005, SG&A expenses were $294 million compared to $318 million in the first three quarters last year. Excluding the unfavourable impact of currency translation, SG&A expenses were lower by $32 million year-to-date. The savings are due to ongoing cost-containment initiatives and workforce reductions.
Discontinued Operations
Quebecor World's core printing activities involve the printing of magazines, catalogs, retail inserts, books, directories and direct mail for the world's largest publishers and retailers. As the Company has grown by acquisition certain facilities were included in those transactions that do not relate to these core businesses. Approximately a dozen facilities in North America are involved in the printing of short-run contractual work such as marketing materials, annual reports, travel and fashion brochures. These activities are different from Quebecor World's core businesses and do not benefit from the advantages and synergies of the Company's global platform. The Company has announced its intention to sell this non-core group. Consequently the operating results related to these activities have been presented separately in the Company's consolidated financial results as discontinued operations and comparative figures have been restated to conform to the presentation adopted during the quart er ended September 30, 2005.
Dividend
The Board of Directors declared a dividend of $0.14 per share on Multiple Voting Shares and Subordinate Voting Shares. The Board also declared a dividend of CDN$0.3845 per share on Series 3 Preferred Shares, CDN$0.421875 per share on Series 4 Preferred Shares and CDN$0.43125 on Series 5 Preferred Shares. The dividends are payable on December 1, 2005 to shareholders of record at the close of business November 16, 2005.
Full Financial Information
Management Discussion and Analysis
Please refer to the MD&A for the reconciliation to Canadian generally accepted accounting principles of certain figures used to explain these results. The MD&A can be found on the Company's website atwww.quebecorworld.com and through the SEDAR and SEC filings.
3
For immediate release Page 4 of 8
Financial statements are available on the Company's website and through the SEDAR and SEC filings.
Sedar web address:www.sedar.com
SEC web address:www.sec.gov
Conference Call
Quebecor World To Webcast Investor Conference Call on November 1, 2005
Quebecor World Inc. will broadcast its Third Quarter conference call live over the Internet on November 1, 2005 at 4:00 PM (Eastern Time).
The conference call will be webcast live and can be accessed on the Quebecor World web site:
http://www.quebecorworld.com/en/investors/webcasts/Q305
Prior to the call please ensure that you have the appropriate software. The Quebecor World web address listed above has instructions and a direct link to download the necessary software, free of charge.
Anyone unable to attend this conference call may listen to the replay tape by phoning (877) 293-8133 or (403) 266-2079 – passcode 294645#, available from November 1, 2005 to December 3, 2005.
Forward looking statements
Except for historical information contained herein, the statements in this release are forward-looking and made pursuant to the safe harbor provisions of the Private Securities Litigation Reform Act of 1995. Forward-looking statements involve known and unknown risks and uncertainties that may cause the Company's actual results in future periods to differ materially from forecasted results. Those risks include, among others, changes in customers' demand for the Company's products, changes in raw material and equipment costs and availability, seasonal changes in customer orders, pricing actions by the Company's competitors, and general changes in economic conditions.
4
For immediate release Page 5 of 8
The Company
Quebecor World Inc. (NYSE:IQW, TSX:IQW.SV) is one of the largest commercial printers in the world. It is a market leader in most of its major product categories which include magazines, inserts and circulars, books, catalogs, direct mail, directories, digital pre-media, logistics, mail list technologies and other value added services. The Company has approximately 34,000 employees working in more than 160 printing and related facilities in the United States, Canada, Argentina, Austria, Belgium, Brazil, Chile, Colombia, Finland, France, India, Mexico, Peru, Spain, Sweden, Switzerland and the United Kingdom.
Web address:www.quebecorworld.com
- 30 -
For further Information contact:
Tony Ross | Philippe Cloutier |
|
5
For immediate release Page 6 of 8
QUEBECOR WORLD INC.
FINANCIAL HIGHLIGHTS
Periods ended September 30
(In millions of US dollars, except per share data)
(Unaudited)
| | Three months | Nine months | ||||||||||||
|---|---|---|---|---|---|---|---|---|---|---|---|---|---|---|
| | 2005 | 2004 | 2005 | 2004 | ||||||||||
| Consolidated Results from Continuing Operations | ||||||||||||||
| Revenues | $ | 1,577.2 | $ | 1,569.6 | $ | 4,619.3 | $ | 4,516.8 | ||||||
| Operating income before depreciation and amortization and before IAROC | 178.7 | 197.4 | 520.8 | 570.3 | ||||||||||
| Operating income before IAROC | 97.2 | 112.3 | 270.2 | 309.7 | ||||||||||
| IAROC | 17.2 | 12.8 | 82.3 | 67.2 | ||||||||||
| Operating income | 80.0 | 99.5 | 187.9 | 242.5 | ||||||||||
| Net income from continuing operations | 30.9 | 45.8 | 56.2 | 93.6 | ||||||||||
| Operating margin before depreciation and amortization and before IAROC* | 11.3 | % | 12.6 | % | 11.3 | % | 12.6 | % | ||||||
| Operating margin before IAROC* | 6.2 | % | 7.2 | % | 5.8 | % | 6.9 | % | ||||||
| Operating margin * | 5.1 | % | 6.3 | % | 4.1 | % | 5.4 | % | ||||||
Segmented Information from Continuing Operations | ||||||||||||||
Revenues | ||||||||||||||
| North America | $ | 1,253.6 | $ | 1,228.5 | $ | 3,559.4 | $ | 3,462.4 | ||||||
| Europe | 270.7 | 295.7 | 886.2 | 920.8 | ||||||||||
| Latin America | 54.4 | 45.0 | 177.2 | 136.2 | ||||||||||
Operating income (loss) before IAROC | ||||||||||||||
| North America | $ | 100.0 | $ | 110.4 | $ | 264.3 | $ | 284.3 | ||||||
| Europe | (4.8 | ) | 9.3 | (0.8 | ) | 33.6 | ||||||||
| Latin America | 2.8 | 1.1 | 9.3 | 3.1 | ||||||||||
Operating margins before IAROC* | ||||||||||||||
| North America | 8.0 | % | 9.0 | % | 7.4 | % | 8.2 | % | ||||||
| Europe | (1.8 | %) | 3.1 | % | (0.1 | %) | 3.6 | % | ||||||
| Latin America | 5.1 | % | 2.5 | % | 5.2 | % | 2.3 | % | ||||||
Financial Position | ||||||||||||||
| Cash provided by operating activities | $ | 6.5 | $ | 41.4 | $ | 191.2 | $ | 106.9 | ||||||
| Free cash flow (outflow) from operations** | $ | (80.1 | ) | $ | (0.1 | ) | $ | (43.2 | ) | $ | (18.3 | ) | ||
| Working capital | $ | 142.6 | $ | 92.8 | ||||||||||
| Total assets | $ | 6,122.4 | $ | 6,281.0 | ||||||||||
| Long-term debt (including convertible notes) | $ | 2,003.6 | $ | 2,162.2 | ||||||||||
| Shareholders' equity | $ | 2,499.4 | $ | 2,529.9 | ||||||||||
| Debt-to-capitalization | 44:56 | 46:54 | ||||||||||||
| Debt-to-EBITDA ratio (times)*** | 2.6 | 2.9 | ||||||||||||
| EBITDA interest coverage ratio (times)*** | 6.3 | 5.0 | ||||||||||||
Per Share Data | ||||||||||||||
| Earnings from continuing operations | ||||||||||||||
| Diluted | $ | 0.16 | $ | 0.28 | $ | 0.20 | $ | 0.50 | ||||||
| Diluted before IAROC | $ | 0.28 | $ | 0.36 | $ | 0.77 | $ | 0.86 | ||||||
| Dividends on equity shares | $ | 0.14 | $ | 0.13 | $ | 0.42 | $ | 0.39 | ||||||
| Book value | $ | 15.62 | $ | 15.65 | ||||||||||
IAROC: Impairment of assets, restructuring and other charges.
Debt-to-EBITDA ratio: Total debt divided by operating income before depreciation and amortization and before IAROC.
EBIDTA interest coverage ratio: Operating income before depreciation and amortization and before IAROC divided by financial expenses.
- *
- Margins calculated on revenues.
- **
- Cash provided by operating activities, less capital expenditures net of proceeds from disposals, and preferred share dividends.
- ***
- Calculations based on a rolling twelve-month period for continuing operations.
6
For immediate release Page 7 of 8
APPENDIX — SEGMENTED RESULTS
North America
In the third quarter, revenues from North American operations were $1.25 billion compared to $1.23 billion in 2004. Year-to-date revenues were $3.56 billion compared to $3.46 billion last year. Operating income in the third quarter before impairment of assets restructuring and other charges was $100 million compared to $110 million and operating margin on the same basis was 8.0% compared to 9.0%. In the third quarter, increases in revenue and volume in several product groups were offset by continuing negative price pressure and lower volume in some groups.
Magazine/Direct
In the Magazine and Direct group, volume increased 5% in the Direct Mail segment but was offset by a 3% volume decrease in magazines. To improve productivity and customer service, two new 48 page presses in the magazine platform will be operational in the fourth quarter.
Retail/Catalog
In the Retail group, net volume increased 4% in the quarter due to new customers and additional work from existing ones as well as by the addition of an offset printing facility in Pittsburg, CA. In Catalogs, volume increased 2% but excluding the positive impact of paper sales, revenues were lower. Also, as part of the North American investment plan, a new 64-page press will be in operation in the fourth quarter to serve catalog customers in the Company's Jonesboro facility.
Book/Directory
In the Book and Directory group, revenues and volume decreased in the quarter compared to the same period last year. Two new 64 page presses will be operating in the fourth quarter to serve book publishers. In the quarter, the Company announced a major long-term contract with one of North America's largest directory publishers which will significantly increase volumes starting in 2007.
Canada
In Canada, volume increased slightly in the quarter mainly due to increases in the retail sector. Pricing impact was compensated by cost containment and operational efficiency. In the third quarter, Quebecor World announced an investment in new presses in partnership with Quebecor Inc.'s subsidiary Quebecor Media. The investment includes a new printing facility in the Toronto area to print newspapers and directories.
7
For immediate release Page 8 of 8
Europe
In Europe, revenues in the third quarter were $271 million compared to $296 million in the third quarter of 2004. Excluding the positive impact of currency translation, revenues for the quarter were down 8%. Volume in Europe decreased 14% in the third quarter. The decrease was largely due to the loss of a major customer in the United Kingdom and lower volume in the French magazine market. In the third quarter, operations in Europe recorded a negative operating margin due to lower volume and pricing. This was due to the poor performance of the French platform and the first full quarter without volume from a major customer at the UK facility. Some of this volume has been replaced but at lower margins. Operating income and margin increased in the third quarter and year-to-date in Spain, Finland and Austria.
Latin America
In Latin America, revenues in the third quarter increased 21% to $54 million compared to $45 million in the same period last year. Excluding the positive impact of currency translation and paper sales, revenues in the quarter increased 5%. Volume in the quarter decreased 13% compared to the same period last year. The volume decrease is specifically related to the timing of the production of certain directories. Operating income and margin increased due to operational efficiency, an increase in prices in certain segments and a favourable product mix. The Latin American operations are continuing to benefit from an earlier initiative that positioned these assets as a low-cost alternative to publishers who are having products produced in Asia. This initiative is attracting increased interest and sales from North American and European publishers.
8
Management's Discussion and Analysis
The following is a discussion of the consolidated financial condition and results of operations of Quebecor World Inc. (the "Company") for the three-month and nine-month periods ended September 30, 2005 and 2004, and should be read together with the Company's interim consolidated financial statements and the annual "Management's Discussion and Analysis" included in the 2004 Annual Report. The interim consolidated financial statements and Management's Discussion and Analysis have been reviewed by the Company's Audit Committee and approved by its Board of Directors. This discussion contains forward-looking information that is qualified by reference to, and should be read together with, the discussion regarding forward-looking statements that is part of this document. Management determines whether or not information is "material" based on whether it believes a reasonable investor's decision to buy, sell or hold securities in the Company would likely be influenced or changed if the information were omitted or misstated.
Financial data have been prepared in conformity with Canadian generally accepted accounting Principles ("Canadian GAAP"). However, certain measures used in this discussion and analysis do not have any standardized meaning under Canadian GAAP. When used, these measures are defined in such terms as to allow the reconciliation to the closest Canadian GAAP measure. Numerical reconciliations are provided in figure 6. It is unlikely that these measures could be compared to similar measures presented by other companies.
The Company's functional currency is the Canadian dollar and its reporting currency is the U.S. dollar.
FORWARD-LOOKING STATEMENTS
Except for historical information contained herein, the statements in this document are forward-looking and made pursuant to the safe harbor provisions of the Private Securities Litigation Reform Act of 1995. Forward-looking statements involve known and unknown risks and uncertainties, which may cause actual results in future periods to differ materially from forecasted results. Those risks include, among others, changes in customer demand for products, changes in raw material and equipment costs and availability, seasonal changes in customer orders, pricing actions by competitors and general changes in economic conditions.
OVERVIEW
Quebecor World Inc. is one of the largest commercial print media services companies in the world. Quebecor World is a market leader in the product categories and geographies it serves. This market-leading position has been built through a combination of integrating acquisitions, investing in key strategic technologies and a commitment to building long-term partnerships with the world's leading print media customers.
Quebecor World has facilities in the United States, Canada, Argentina, Austria, Belgium, Brazil, Chile, Colombia, Finland, France, India, Mexico, Peru, Spain, Sweden, Switzerland and the United Kingdom.
The Company offers its customers a broad range of printed products and related communication services, such as magazines, retail inserts, catalogs, direct mail, books, directories, logistics, pre-media and other value-added services.
The Company operates in the commercial print media segment of the printing industry and its business groups are located in three geographical regions: North America, which has historically represented approximately 80% of the Company's revenues, Europe and Latin America.
Operations in this segment of the print industry are seasonal with a greater part of volume being realized in the second half of the fiscal year, primarily due to the higher number of magazine pages, new product launches and back-to-school, retail and holiday catalog promotions. The interim results of operations analyzed hereafter are not necessarily indicative of full year results.
Consolidation of the printing industry is ongoing because of global overcapacity, which has led to negative price pressures. As smaller plants disappear, larger plants continue to grow and deploy more efficient equipment. Global capacity is also affected by the emergence of Asian competitors in particular in the Book segment where the timing of deliveries is less of an issue. In response to this competition, the Company offers its clients the Latin American platform as a low-cost alternative. Overall, global overcapacity will remain an issue and will likely continue to impact prices in most segments.
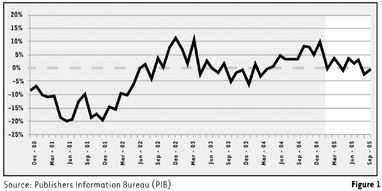
The primary drivers affecting the Company are consumer confidence and economic growth rates. These are key drivers of demand for commercial print media because they affect the level of advertising and merchandising activity. The Company uses magazine advertising pages as an important indicator of demand for printing products and services. This indicator, as measured in the United States by the Publishers Information Bureau, showed some positive signs throughout 2004, but was uneven in the first nine months of 2005 (Figure 1).
U.S. Magazine Advertising Pages 2001-2005 (Monthly)
Percentage Year-Over-Year Change
The Company also emphasizes two additional key success factors — administrative and manufacturing efficiency — and addresses them on a continual basis. In recent years, the Company has undertaken restructuring initiatives that resulted in downsizing across the platform and several plant closures or combinations. These measures are ongoing and are expected to continue through the rest of 2005. In the current challenging environment, the positive effects of the ongoing restructuring initiatives did not translate into increases in operating income because of the continuing price reductions, rising energy costs and the underperformance of the French and British operations.
The Company's strategy is to reduce its fixed cost base and increase its efficiency by consolidating smaller facilities into larger groups of operations, grouping similar types of assets into larger facilities using available space and optimizing all aspects of pressroom efficiencies. As is the case with other manufacturing industries, technology in the printing industry is constantly evolving and it will continue to play an important role in improving Quebecor World's manufacturing efficiency. The Company is focused on improving speeds, reducing manning, lowering downtime and paper waste as well as shorter make-ready times.
As part of these efforts, the Company approved a three-year investment plan in 2004 that calls for over $300 million in investments in newer, more efficient presses in North America. The installation of the first group of presses was underway in the third quarter of 2005 at facilities in Merced (California), Dallas (Texas), Jonesboro (Arkansas) and Versailles (Kentucky).
9
In Europe, the Company is also working on a retooling plan to be announced in the first quarter of 2006. The Company intends to rapidly implement the necessary programs to improve its competitive position in this segment.
In addition, the Company divested certain smaller operations in France and North America. Finally, during the fourth quarter, the Company expects to complete its divestiture program that was previously announced.
On October 21, 2005, the Company released an outlook for 2005. Management estimated at that time that earnings per share for the third and fourth quarters of 2005 would be lower than 2004 and below market expectations. The actual results for the third quarter are below those of the corresponding period in 2004, and the first nine months of 2005 have been particularly difficult for the Company. These lower results reflect the challenging market conditions that the Company has faced, especially with regard to continuing worldwide price erosion and rising energy costs. In addition, European results are down significantly compared to 2004 as a result of the loss of an important customer in the United Kingdom and the underperformance of French operations. The French operations suffered from continued price pressure coupled with operational inefficiencies throughout the first nine months of 2005. The United Kingdom's results for the second and third quarters reflect the volume lost because an important contract was terminated. The Company is addressing both the situation in France and the United Kingdom as part of the European retooling plan currently under development.
The current charge for impairment of assets, restructuring and other charges reflects smaller initiatives undertaken in the first nine months and definite plans to eliminate inefficient and idle equipment. As such, a detailed review of activities took place in 2005 at the facility in Corby, United Kingdom. This resulted in the implementation of the first two parts of a workforce reduction plan as well as impairments of long-lived assets. The Company anticipates additional restructuring charges in the upcoming quarters related to the restructuring of this facility, as discussed in the "Impairment of Assets and Restructuring Initiatives" section.
DISCONTINUED OPERATIONS
Over the years, Quebecor World has strived to build a global printing platform that allows publishers and retailers to print in multiple plants, in various countries, reducing lead-time and distribution costs. The Company's core printing activities, mainly the printing of magazines, catalogs, retail inserts, books and directories, benefit from this platform. However, as the Company grew by acquisitions, certain facilities were included in these transactions that do not concentrate on Quebecor World's core printing activities. As a result, there are approximately a dozen facilities in North America whose primary activities are non-core general commercial printing. These activities consist primarily of short-run, non-contractual work such as annual reports, marketing materials, travel, fashion and automobile brochures and packaging. This market is highly competitive and fragmented with many small local and regional players. Unlike Quebecor World's previously described core business, these activities do not benefit from the advantages and synergies of the Company's global platform. As a result, on May 10, 2005, the Company announced a plan to sell its group of non-core printing facilities in North America (the "non-core Group").
At the end of the second quarter of 2005, the Company completed the sale of a unit in Los Angeles, California. During the third quarter, the Company completed the sale of a unit in Westwood, Massachusetts and signed agreements to sell the remaining units included in the non-core Group, subject to the fulfillment of certain conditions by the Company and the purchasers. The units should be sold in the last quarter of 2005 if the conditions of the agreements are met by the Company and the purchasers. Consequently, the operating results related to these activities have been presented separately in the Company's consolidated financial statements as discontinued operations and comparative figures have been restated to conform to the presentation adopted in 2005. The assets and liabilities related to the remaining plants are presented as held for sale in Note 5 to the consolidated financial statements as at September 30, 2005.
The results of the non-core Group have been significantly impacted by the loss on disposition of the Los Angeles and Westwood facilities as well as specific charges related to these facilities in the second and third quarters of 2005 and pension curtailment costs in the third quarter.
REVIEW OF THIRD QUARTER AND YEAR-TO-DATE
The Company assesses performance based on operating income before impairment of assets, restructuring and other charges. The following operating analyses are before impairment of assets, restructuring and other charges. The review focused only on continuing operations.
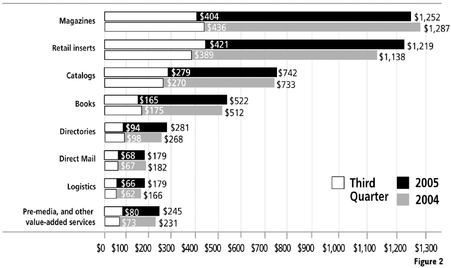
The Company's consolidated revenues for the quarter were $1,577 million compared to $1,570 million for the same period in 2004. On a year-to-date basis, revenues were $4,619 million, up 2% from $4,517 million in 2004. Excluding the favorable impact of currency translation (see figure 3), revenues were $1,554 for the quarter, down 1% compared to 2004 and $4,529 for the first nine months of 2005, flat compared to 2004. This situation is mainly due to continued pressure on prices, and a volume decrease in certain segments. Revenue by product is shown in figure 2.
Revenue by Product-Worldwide
($ millions)
For the quarter and the nine-month periods ended September 30
(Continuing Operations)
For the third quarter of 2005, operating income decreased 13% to $97 million, from $112 million in 2004. On a year-to-date basis, operating income was $270 million, down 13% from $310 million in 2004. Operating margin for the quarter was 6.2% compared to 7.2% for the same period in 2004. For the year 2005 to date, operating margin was 5.8% down from 6.9% in 2004.
Impact of Foreign Currency
($ millions)
(Continuing Operations)
| | Three months ended September 30, 2005 | Nine months ended September 30, 2005 | ||||
|---|---|---|---|---|---|---|
| Foreign currency favorable impact on revenues | $ | 23.3 | $ | 89.6 | ||
| Foreign currency favorable impact on operating income | $ | 1.2 | $ | 2.6 | ||
Figure 3
10
Paper sales, excluding the effect of currency translation, increased by 7% in the third quarter of 2005, compared to the same period in 2004. On the same basis, for the first nine months of 2005, paper sales increased by 8% compared to the same period in 2004. The increase for the quarter and year-to-date is mainly due to the increase in paper sales to customers and the increase in paper prices compared to 2004. Although the increase in paper sales has a positive impact on revenues, it has little or no impact on operating income because the cost is generally passed on to the customer and, as a result, it contributes to the lower operating margin. Most of the Company's long-term contracts with its customers include price-adjustment clauses based on the cost of materials in order to minimize the effects of fluctuation in the price of paper.
Cost of sales for the third quarter 2005 increased 3% at $1,305 million compared to $1,268 million last year. For the year 2005 to date, cost of sales was $3,808 million, a 5% increase compared to $3,639 million for the same period in 2004. Gross profit margin was 17.3% in the third quarter of 2005, down from 19.2% in 2004. On a year-to-date basis, gross profit margin was 17.6% compared to 19.4% in 2004. The cost of sales for the first nine months of 2005 included specific charges of $12 million, mainly due to lease provisions, compared to $1 million for the same period in 2004. Cost of sales was not significantly impacted by specific charges in the third quarter of 2005 and 2004. Excluding the unfavorable impact of currency translation, gross profit margin for the quarter was 17.3%, down from 19.5% for the same quarter last year. On a year-to-date basis in 2005, gross profit margin, excluding specific items as well as the unfavorable impact of currency translation, was 17.9% compared to 19.4% for 2004. The decrease compared to 2004 is explained by continued pressure on prices, rising energy costs and a higher level of paper sales. On a year-to-date basis, these were partly offset by a $52 million decrease in labor costs compared to the same period in 2004. This reflects the effect of the ongoing restructuring initiatives undertaken by the Company and described in the "Impairment of Assets and Restructuring Initiatives" section hereafter.
Selling, general and administrative expenses for the third quarter of 2005 were $95 million compared to $108 million in 2004, a decrease of 12%. On a year-to-date basis, selling, general and administrative expenses were $294 million in 2005, compared to $318 million in 2004 or a decrease of 8%. Excluding the unfavorable impact of currency translation of $2 million, selling, general and administrative expenses were lower by $15 million for the third quarter compared to last year. On a year-to-date basis, excluding the negative impact of currency translation of $8 million, selling, general and administrative expenses improved by $32 million. The savings were mostly explained by cost-containment initiatives and headcount reductions.
Segmented Results of Continuing Operations
($ millions)
Selected Performance Indicators
| | North America | Europe | Latin America | Inter-Segment and Others | Total | ||||||||||||||||||||||||||
|---|---|---|---|---|---|---|---|---|---|---|---|---|---|---|---|---|---|---|---|---|---|---|---|---|---|---|---|---|---|---|---|
| | 2005 | 2004 | 2005 | 2004 | 2005 | 2004 | 2005 | 2004 | 2005 | 2004 | |||||||||||||||||||||
| Three months ended September 30, | |||||||||||||||||||||||||||||||
| Revenues | $ | 1,253.6 | $ | 1,228.5 | $ | 270.7 | $ | 295.7 | $ | 54.4 | $ | 45.0 | $ | (1.5 | ) | $ | 0.4 | $ | 1,577.2 | $ | 1,569.6 | ||||||||||
| Operating income (loss) before depreciation and amortization and before IAROC | 165.2 | 174.9 | 8.5 | 26.7 | 5.6 | 3.9 | (0.6 | ) | (8.1 | ) | 178.7 | 197.4 | |||||||||||||||||||
| Operating income (loss) before IAROC | 100.0 | 110.4 | (4.8 | ) | 9.3 | 2.8 | 1.1 | (0.8 | ) | (8.5 | ) | 97.2 | 112.3 | ||||||||||||||||||
| IAROC | 3.3 | 6.0 | 13.7 | 6.1 | 0.2 | 0.5 | — | 0.2 | 17.2 | 12.8 | |||||||||||||||||||||
| Operating income (loss) | 96.7 | 104.4 | (18.5 | ) | 3.2 | 2.6 | 0.6 | (0.8 | ) | (8.7 | ) | 80.0 | 99.5 | ||||||||||||||||||
| Operating margin before depreciation and amortization and before IAROC | 13.2 | % | 14.2 | % | 3.2 | % | 9.0 | % | 10.3 | % | 8.7 | % | 11.3 | % | 12.6 | % | |||||||||||||||
| Operating margin before IAROC | 8.0 | % | 9.0 | % | (1.8 | %) | 3.1 | % | 5.1 | % | 2.5 | % | 6.2 | % | 7.2 | % | |||||||||||||||
| Operating margin | 7.7 | % | 8.5 | % | (6.8 | %) | 1.1 | % | 4.7 | % | 1.5 | % | 5.1 | % | 6.3 | % | |||||||||||||||
| Capital expenditures(1) | $ | 64.3 | $ | 26.7 | $ | 22.8 | $ | 8.9 | $ | 1.2 | $ | 0.2 | $ | 0.2 | $ | 0.1 | $ | 88.5 | $ | 35.9 | |||||||||||
| Changes in non-cash balances related to operations, cash flow (outflow)(1) | (123.6 | ) | (129.8 | ) | 3.3 | (13.6 | ) | (14.1 | ) | (0.3 | ) | 11.6 | 24.8 | (122.8 | ) | (118.9 | ) | ||||||||||||||
Nine months ended September 30, | |||||||||||||||||||||||||||||||
| Revenues | $ | 3,559.4 | $ | 3,462.4 | $ | 886.2 | $ | 920.8 | $ | 177.2 | $ | 136.2 | $ | (3.5 | ) | $ | (2.6 | ) | $ | 4,619.3 | $ | 4,516.8 | |||||||||
| Operating income (loss) before depreciation and amortization and before IAROC | 462.1 | 484.2 | 43.2 | 85.0 | 17.4 | 11.4 | (1.9 | ) | (10.3 | ) | 520.8 | 570.3 | |||||||||||||||||||
| Operating income (loss) before IAROC | 264.3 | 284.3 | (0.8 | ) | 33.6 | 9.3 | 3.1 | (2.6 | ) | (11.3 | ) | 270.2 | 309.7 | ||||||||||||||||||
| IAROC | 19.7 | 56.6 | 61.9 | 9.0 | 0.7 | 1.1 | — | 0.5 | 82.3 | 67.2 | |||||||||||||||||||||
| Operating income (loss) | 244.6 | 227.7 | (62.7 | ) | 24.6 | 8.6 | 2.0 | (2.6 | ) | (11.8 | ) | 187.9 | 242.5 | ||||||||||||||||||
| Operating margin before depreciation and amortization and before IAROC | 13.0 | % | 14.0 | % | 4.9 | % | 9.2 | % | 9.8 | % | 8.4 | % | 11.3 | % | 12.6 | % | |||||||||||||||
| Operating margin before IAROC | 7.4 | % | 8.2 | % | (0.1 | %) | 3.6 | % | 5.2 | % | 2.3 | % | 5.8 | % | 6.9 | % | |||||||||||||||
| Operating margin | 6.9 | % | 6.6 | % | (7.1 | %) | 2.7 | % | 4.9 | % | 1.5 | % | 4.1 | % | 5.4 | % | |||||||||||||||
| Capital expenditures(1) | $ | 174.9 | $ | 82.4 | $ | 39.5 | $ | 15.0 | $ | 2.3 | $ | 3.3 | $ | 0.2 | $ | 0.1 | $ | 216.9 | $ | 100.8 | |||||||||||
| Changes in non-cash balances related to operations, cash flow (outflow)(1) | (121.1 | ) | (323.4 | ) | (28.2 | ) | (41.3 | ) | (19.0 | ) | 5.4 | (11.1 | ) | 26.9 | (179.4 | ) | (332.4 | ) | |||||||||||||
| Figure 4 | |||||||||||||||||||||||||||||||
IAROC: Impairment of assets, restructuring and other charges.
(1) Including both continued and discontinued operations
11
Depreciation and amortization were $74 million in the third quarter of 2005 compared to $79 million in the same period of 2004. On a year-to-date basis, depreciation and amortization were $231 million in 2005, compared to $242 million in 2004. Excluding the impact of currency movement, depreciation and amortization decreased by 6% for the third quarter and year-to-date in 2005 compared to last year. The decrease is mostly due to impairment charges taken during the last twelve months.
Securitization fees totaled $6 million for the third quarter of 2005 ($3 million for the third quarter of 2004) and $16 million for the first nine months of 2005 ($9 million for the same period in 2004). The increase for the first nine months of 2005 was mainly due to higher market interest rates underlying the program fees. Servicing revenues and expenses did not have a significant impact on the Company's results.
During the first three quarters of 2005, the Company continued its restructuring initiatives and recorded a net impairment of assets and restructuring charges of $82 million, which reflected further workforce reductions across the Company. These measures are described in the section "Impairment of Assets and Restructuring Initiatives".
Financial expenses were $31 million in the third quarter of 2005, compared to $32 million in 2004. On a year to-date basis, financial expenses were $91 million in 2005, compared to $102 million in 2004. The lower expenses on a year-to-date basis, were mainly due to a lower average volume of debt in 2005 and a $2 million non-recurring charge on extinguishments of long-term debt in 2004.
In the third quarter of 2005, income taxes were $18 million compared to $21 million for the same period in 2004 or an effective tax rate of 37.2% compared to 30.9% in 2004. On a year-to-date basis, income taxes were $41 million in 2005, compared to $42 million in 2004, or an effective tax rate of 42.2% compared to 29.8% in 2004. The rates were significantly higher in 2005 due to valuation allowances recorded on tax benefits related to the impairment of long-lived assets, restructuring and other charges. Before impairment of assets, restructuring and other charges, income taxes were $19 million for the third quarter of 2005 compared to $23 million for the same period last year or an effective tax rate of 29.3% for 2005 compared to 28.7% in 2004. On the same basis, the year-to-date income taxes were $48 million compared to $62 million in 2004, or an effective tax rate of 26.8% compared to 29.8% for 2004. The decrease in income tax rate was mainly due to a decrease in profits before taxes in jurisdictions with higher tax rates.
Net income for the third quarter was $30 million compared to $48 million in 2004. For the nine-month period, net income was $48 million in 2005, compared to $99 million for the same period last year. Diluted earnings per share of continuing operations were $0.16 for the third quarter of 2005, down from $0.28 in 2004. These results incorporated impairment of assets, restructuring and other charges of $17 million ($16 million net of taxes) or $0.12 per share compared with $13 million ($11 million net of taxes) or $0.08 per share in 2004. Excluding the effect of impairment of assets, restructuring and other charges, the third quarter of 2005 resulted in diluted earnings per share of $0.28 compared with $0.36 in the same period of 2004. Diluted earnings per share were $0.20 for the first nine months of 2005 compared to $0.50 for the same period in 2004. These results incorporated impairment of assets, restructuring and other charges of $82 million ($75 million net of taxes) or $0.57 per share compared with $67 million ($47 million net of taxes) or $0.36 per share in 2004. Excluding the effect of impairment of assets, restructuring and other charges, the first three quarters of 2005 resulted in diluted earnings per share of $0.77 compared with $0.86 in the same period of 2004.
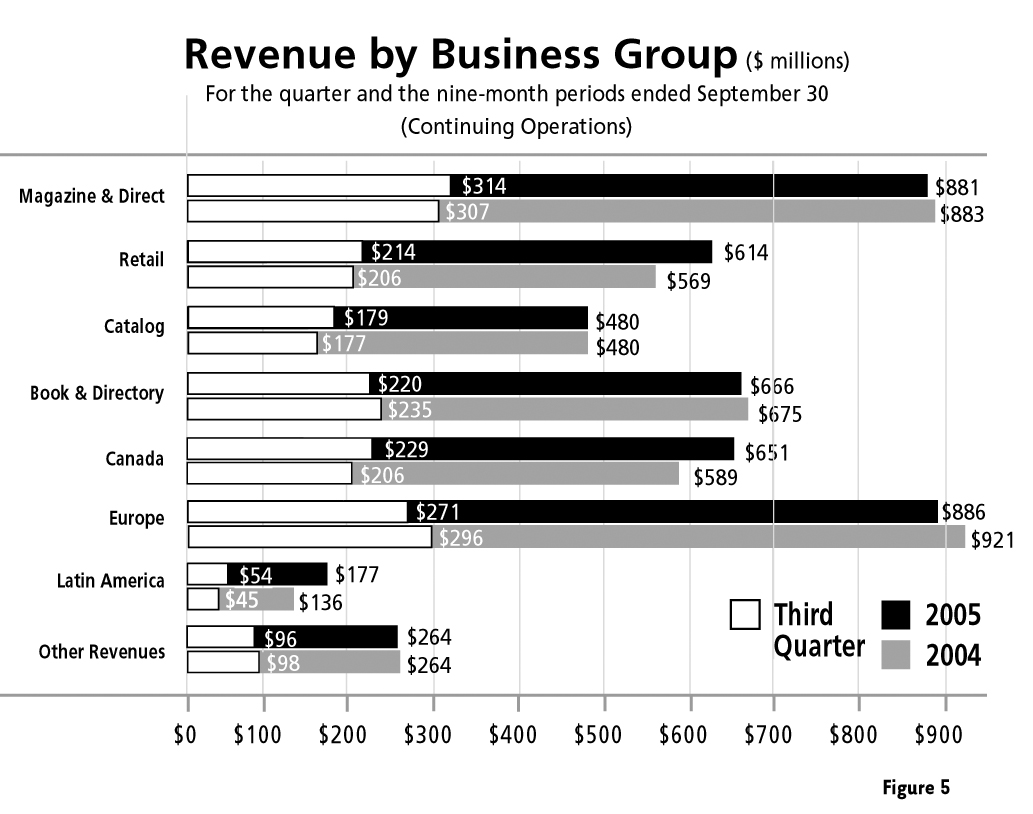
SEGMENT REVIEW
The following review of operating activities by business group (figure 5) is before impairment of assets, restructuring and other charges. Also, the review focuses only on continuing operations.
Revenue by Business Group
($ millions)
For the quarter and the nine-month periods ended September 30
(Continuing Operations)
North America
North American revenues for the third quarter of 2005 were $1,254 million, up 2% from $1,228 million in 2004. On a year-to-date basis, revenues were $3,559 in 2005 up 3% from $3,462 in 2004. Excluding the effect of currency translation and the favorable impact of paper sales, revenues decreased by 2% in the third quarter and 1% on a year-to-date basis mainly due to price erosion. Selling, general and administrative expenses decreased across the North American platform in the third quarter and on a year-to-date basis in 2005 compared to 2004, due to savings from facility closures, cost-containment initiatives and corporate headcount reductions, mostly in 2004. Year-over-year headcount was reduced in North America by 1,342 employees, or approximately 5%.
The following is a review of the North American activities by business group. The North American segment is made up of the following business groups: Magazine & Direct, Retail, Catalog, Book & Directory, Canada and Other Revenues.
Magazine & Direct
Magazine & Direct revenues for the third quarter of 2005 were $314 million, up 2% from $307 million in 2004. On a year-to-date basis, revenues were $881 million in 2005, down slightly from $883 million in 2004. Revenue increased in the third quarter due mainly to increased paper sales in both groups and a 5% volume increase in the Direct group which was offset by a 3% volume shortfall in the Magazine group as well as continued price erosion in the Direct group. Revenue decreased on a year-to-date basis due to the volume shortfalls of 4% in the Magazine group with continued price erosion in both groups. These shortfalls were partially offset by increased paper sales in both groups. Volume in the Magazine group was negatively impacted due to the non-renewal of certain important contracts. Operating income and margin decreased in the third quarter and on a year-to-date basis due mainly to the volume decreases and price erosion, but was partly offset by a decrease in labor costs from headcount reduction. As part of the ongoing investment plan to improve operational efficiencies, new presses are being installed in three facilities for magazine customers with two of them expected to be in operation in the fourth quarter of 2005.
Retail
Retail revenues for the third quarter of 2005 were $214 million, up 4% from $206 million in 2004. On a year-to-date basis, revenues were $614 million in 2005, up 8% from $569 million in 2004. Excluding the favorable impact of paper sales, revenues decreased 1% in the third quarter and increased 2% on a year-to-date basis compared to the
12
| | Three months ended Sept. 30, | Nine months ended Sept. 30, | |||||||||||||
|---|---|---|---|---|---|---|---|---|---|---|---|---|---|---|---|
| Reconciliation of non GAAP measures ($ millions) | |||||||||||||||
| 2005 | 2004 | 2005 | 2004 | ||||||||||||
| Operating Income from Continuing Operations | |||||||||||||||
| Operating income | $ | 80.0 | $ | 99.5 | $ | 187.9 | $ | 242.5 | |||||||
| IAROC | 17.2 | 12.8 | 82.3 | 67.2 | |||||||||||
| Operating income before IAROC | $ | 97.2 | $ | 112.3 | $ | 270.2 | $ | 309.7 | |||||||
| Operating income | $ | 80.0 | $ | 99.5 | $ | 187.9 | $ | 242.5 | |||||||
| Depreciation of property, plant and equipment(1) | 74.3 | 81.0 | 234.9 | 248.7 | |||||||||||
| Amortization of deferred charges(1) | 7.2 | 6.6 | 19.9 | 19.4 | |||||||||||
| Less depreciation and amortization from discontinued operations(2) | — | (2.5 | ) | (4.2 | ) | (7.5 | ) | ||||||||
| Operating income before depreciation and amortization | $ | 161.5 | $ | 184.6 | $ | 438.5 | $ | 503.1 | |||||||
| IAROC | 17.2 | 12.8 | 82.3 | 67.2 | |||||||||||
| Operating income before depreciation and amortization and before IAROC | $ | 178.7 | $ | 197.4 | $ | 520.8 | $ | 570.3 | |||||||
Earnings per share from Continuing Operations | |||||||||||||||
| Net income from Continuing Operations | $ | 30.9 | $ | 45.8 | $ | 56.2 | $ | 93.6 | |||||||
| IAROC (net of income taxes of $1 million for the third quarter of 2005 ($7 million year-to-date) and $2 million for the third quarter of 2004 ($20 million year-to-date)) | 16.0 | 10.6 | 75.1 | 47.1 | |||||||||||
| Net income from continuing operations before IAROC | $ | 46.9 | $ | 56.4 | $ | 131.3 | $ | 140.7 | |||||||
| Net income available to holders of preferred shares | 10.1 | 9.0 | 29.8 | 26.9 | |||||||||||
| Net income from continuing operations available to holders of equity shares before IAROC | $ | 36.8 | $ | 47.4 | $ | 101.5 | $ | 113.8 | |||||||
| Diluted average number of equity shares outstanding (in millions) | 130.9 | 132.7 | 132.1 | 132.5 | |||||||||||
| Earnings per share from continuing operations | |||||||||||||||
| Diluted | $ | 0.16 | $ | 0.28 | $ | 0.20 | $ | 0.50 | |||||||
| Diluted before IAROC | $ | 0.28 | $ | 0.36 | $ | 0.77 | $ | 0.86 | |||||||
Free Cash Flow (Outflow) | |||||||||||||||
| Cash provided by operating activities | $ | 6.5 | $ | 41.4 | $ | 191.2 | $ | 106.9 | |||||||
| Dividends on preferred shares | (2.4 | ) | (5.9 | ) | (27.0 | ) | (26.1 | ) | |||||||
| Additions to property, plant and equipment | (88.5 | ) | (35.9 | ) | (216.9 | ) | (100.8 | ) | |||||||
| Net proceeds from disposal of assets | 4.3 | 0.3 | 9.5 | 1.7 | |||||||||||
| Free cash flow (outflow) from operations | $ | (80.1 | ) | $ | (0.1 | ) | $ | (43.2 | ) | $ | (18.3 | ) | |||
Debt-to-capitalization | |||||||||||||||
| Bank indebtedness | $ | — | $ | 1.5 | |||||||||||
| Current portion of long-term debt | 9.2 | 11.7 | |||||||||||||
| Long-term debt | 1,880.2 | 2,038.3 | |||||||||||||
| Convertible notes | 114.2 | 112.2 | |||||||||||||
| Total debt | $ | 2,003.6 | $ | 2,163.7 | |||||||||||
| Minority interest | 0.6 | 27.8 | |||||||||||||
| Shareholders' equity | 2,499.4 | 2,529.9 | |||||||||||||
| Capitalization | $ | 4,503.6 | $ | 4,721.4 | |||||||||||
| Debt-to-capitalization | 44:56 | 46:54 | |||||||||||||
Book value per share | |||||||||||||||
| Shareholders' equity | $ | 2,499.4 | $ | 2,529.9 | |||||||||||
| Preferred shares | (456.6 | ) | (456.6 | ) | |||||||||||
| $ | 2,042.8 | $ | 2,073.3 | ||||||||||||
| Ending number of equity shares (in millions) | 130.8 | 132.5 | |||||||||||||
| Book value per share | $ | 15.62 | $ | 15.65 | |||||||||||
Figure 6
IAROC: Impairment of assets, restructuring and other charges
- (1)
- As reported in the Consolidated Statements of Cash Flows
- (2)
- As reported in Note 5 "Discontinued Operations"
13
same period in 2004. The increase in revenue year-to-date was due to a volume increase, partially offset by the negative impact of lower priced work. The volume increase is explained by both new gains as well as additional volume from existing customers and the addition of the offset printing facility in Pittsburg, California. Operating income and margin decreased in the third quarter and year-to-date basis of 2005 compared to the same periods in 2004, due mainly to the price erosions partially offset by the savings from restructuring initiatives.
Catalog
Catalog revenues for the third quarter of 2005 were $179 million, up 1% from $177 million in 2004. On a year-to-date basis, revenues were $480 million in 2005 and 2004, respectively. Excluding the favorable impact of paper sales, revenues decreased 2% and 1% in the third quarter and year-to-date respectively, due to the continuing price erosion. The price erosion was a result of the overall competitive catalog market. Operating income and margin decreased in the third quarter and year-to-date basis due mainly to the negative impact of lower pricing that was partly offset by cost containment initiatives and headcount reduction. As part of the ongoing investment plan to improve operational efficiencies, a new 64-page press is being installed in one of the Catalog facilities to be in operation in the fourth quarter of 2005.
Book & Directory
Book & Directory revenues for the third quarter of 2005 were $220 million, down 6% from $235 million in 2004. On a year-to-date basis, revenues were $666 million in 2005, down 1% from $675 million in 2004. The decrease in revenue in the third quarter and year-to-date was due mainly to the volume shortfalls and price erosion in both the Book and Directory groups compared to the same periods in 2004. Volume decreased in the third quarter of 2005 by 4% in the Book group and 10% in the Directory group. On a year-to-date basis, volume decreased 1% in the Book group and 3% in the Directory group. Operating income and margin decreased in the third quarter and year-to-date basis compared to 2004 due to volume shortfalls, continued price erosion and some operational inefficiencies. One facility's volume output was negatively affected by the down time caused to install a new press. The Book group has continued to enhance its position by increasing competitive efficiencies with the addition of 64-page presses at two facilities that are expected to be operational in the fourth quarter of 2005. Also, the Directory group has added two new ten-year contracts with existing customers, Yellow Book USA and Dex Media. The Company currently anticipates that this additional volume will significantly increase its market share in the directory business beginning in 2007.
Canada
The Canadian business group operates mainly in the Retail, Magazine, Direct, Catalog, and Directory markets. Canadian revenues for the third quarter of 2005 were $229 million, up 11% from $206 million in 2004. On a year-to-date basis, revenues were $651 million in 2005, up 11% from $589 million in 2004. Excluding the favorable impact of currency translation and paper sales, revenues decreased by 2% for the quarter and remained flat on year-to-date basis compared to the same periods in 2004. Volume was relatively flat in the third quarter of 2005, but increased 1% year-to-date compared to the same periods last year, mainly due to volume growth in the Retail markets. Despite a volume increase, market conditions remained extremely competitive as reflected in the pricing. However, operating income and margin increased in both the third quarter and year-to-date compared to the same periods last year mainly due to savings from cost control initiatives and operational efficiency gains.
In April 2005, the Company announced a plan to reorganize a portion of its East Group printing operations to better position itself to compete in a challenging market environment. The plan included the consolidation of prepress and sales operations at its Laval facility with other plants in Quebec and the cessation of printing operations in Laval. Approximately 50 employees were transferred to other facilities and approximately 140 positions were eliminated as a result of this reorganization.
In August 2005, Quebecor Inc. announced a major investment that will include a new print facility in Islington, Ontario to be operated by a new entity co-owned by Quebecor Media (another subsidiary of the mother company) and Quebecor World (the Company), serving both its customers. The new entity will print newspapers for Quebecor Media in Ontario as well as Quebecor World's print contracts for its North American customers, including some of the larger directory publishers.
Other Revenues
Other sources of revenues in North America include Quebecor World Premedia and Logistics.
The Quebecor World Premedia revenues for the third quarter of 2005 were $15 million, down 9% from $16 million in 2004. On a year-to-date basis, revenues were $43 million in 2005, down 13% from $49 million in 2004. The decrease in revenue for the third quarter compared to 2004 was due to a 14% decrease in volume partly offset by an increase in price, essentially due to product mix. On a year-to-date basis, volume decreased 5% year over year and changes in the type of prepress work and the price erosion earlier in the year caused a negative impact on revenue. The economic environment has led customers to continue looking for ways to reduce their costs by putting pressure on reducing prices, re-using previously captured images and taking more of the prepress production in-house. Operating income and margin for the third quarter and year-to-date 2005 compared to the same periods last year decreased due mainly to decreased volume.
Logistics revenue for the third quarter of 2005 was $84 million, up 5% from $80 million in 2004. On a year-to-date basis, revenues were $228 million in 2005, up 4% from $220 million in 2004. The increase in revenue was due mainly to higher retail commodity shipments in both the third quarter and year-to-date. However, gross profit margins decreased in the third quarter and year-to-date due to more truck shipments for time-sensitive products. Higher margin airfreight in the United States continued to grow slowly with pricing pressure from fuel surcharge and security fees. Operating income and margin were relatively flat in third quarter of 2005 and decreased year-to-date compared to the same periods last year due mainly to the continuing rise in fuel charges and a shift in the sales mix due to increased retail freight with lower margins.
Europe
The European business group operates mainly in the Magazine, Retail, Catalog and Book markets. European revenues for the third quarter of 2005 were $271 million, down 8% from $296 million in 2004. On a year-to-date basis, revenues were $886 million in 2005 down 4% from $921 million in 2004. Excluding the impact of currency translation, revenues were down 8% for the third quarter and down 7% year-to-date compared to the same periods last year. Overall volume decreased by 14% in the third quarter and 8% year-to-date mainly explained by the Magazine markets in France and the wind-down of an important contract not renewed at the Corby (England) facility. Price erosion continued to have a negative impact on the European results.
The operating income and margin for the European segment were negative for the third quarter and year-to-date and represented a significant decrease compared to the same periods in 2004. The negative operating results were mainly due to the loss of the contract at the Corby (England) facility in the UK. Volumes related to this contract began to decrease in the first half of 2005 and the contract was terminated at the end of May. The facility has been able to replace some of the lost volume, but at a lower margin. France also reported negative operating results for both the third quarter and nine-months of 2005 compared to the same periods last year. The decrease in volume combined with various inefficiencies and the continued price pressure negatively affected the French results. The lack of investment and unproductive assets in France and elsewhere in the platform have also contributed to poor operating results. However, operating income and margin increased in the third quarter and year-to-date in Spain, Finland and Austria.
14
Europe is a key element in the Company's global service offering and, therefore, the Company will be implementing a retooling program for the manufacturing platform that will improve its competitiveness and reduce its costs. Management is putting together a comprehensive investment plan to equip this platform with the right mix of technology. It is currently anticipated that a more detailed announcement will be made in the first quarter of 2006.
Selling, general and administrative expenses, when excluding the effect of currency translation, decreased in the third quarter and the nine-months of 2005 compared to the same periods in 2004 as a result of lower volume and headcount reductions. Year-over-year headcount decreased by 735 employees or approximately 13%, mostly in the United Kingdom and Sweden.
Latin America
Latin America operates mainly in the Book, Directory, Magazine, and Retail markets. Latin America's revenues for the third quarter of 2005 were $54 million, up 21% from $45 million in 2004. On a year-to-date basis, revenues were $177 million in 2005, up 30% from $136 million in 2004. Excluding the favorable impact of currency translation and paper sales, revenues increased by 5% for the quarter and by 6% on a year-to-date basis. Overall print volume decreased by 13% for the quarter compared to the same period last year due to the volume shortfall in Peru, Colombia and Recife offset by positive impact on revenues of currency translation along with increased paper sales and increased bindery volume in the Book market in Argentina. The volume decrease in the quarter is partly due to the timing of the production of certain directories. On a year-to-date basis, revenues increased due to print volume increase of 6%, the positive impact of currency translation, an increase in paper sales, and the volume increase of cross selling with the North American and European groups. During the third quarter of 2004, the Company had embarked on an initiative to link more closely the Latin American Book and Directory facilities with its North American counterparts to expand the capacity and capabilities to its overall customer base. This initiative has continued through the third quarter of 2005. For the third quarter, prices, expressed in local currency, have increased significantly as a result of a positive product mix and a recovering economy in Argentina. On a year-to-date basis, prices remained stable in all countries and increased in Argentina as explained earlier, compared to the same period in 2004. Operating income and margin increased in the third quarter compared to the same period last year mainly due to the increased prices and cost saving initiatives. On a year-to-date basis, operating income and margin increased due to higher volume and operational efficiencies.
Selling, general and administrative expenses, when excluding the effect of currency translation, decreased in the third quarter and the nine-months of 2005 compared to the same periods in 2004, due mainly to savings from cost containment initiatives and headcount reductions. Year-over-year headcount was reduced by 294 employees, or approximately 13%.
CRITICAL ACCOUNTING ESTIMATES
The Company's critical accounting estimates are discussed in the Company's annual "Management's Discussion and Analysis" included in the 2004 Annual Report. The preparation of financial statements in conformity with Canadian GAAP requires management to make estimates and assumptions that affect the reported amounts of assets and liabilities and disclosure of contingent assets and liabilities at the date of the financial statements and the reported amounts of revenues and expenses during the reporting period. Management has not made any significant changes to the estimates and assumptions in the quarter ended September 30, 2005 from those described in its 2004 Annual Report. Actual results could differ from those estimates.
FINANCIAL CONDITION, LIQUIDITY AND CAPITAL RESOURCES
The Company measures its liquidity performance using the calculation of free cash flow as described in figure 6. Free cash flow reflects liquidity available for business acquisitions, equity dividends and repayments of long-term debt. Free cash flow for the third quarter of 2005 amounted to an outflow of $80 million, compared to an outflow of $0.1 million for the same quarter last year. On a year-to-date basis, free cash flow for 2005 amounted to an outflow of $43 million, compared to an outflow of $18 million for the same period of 2004. The decrease is due mainly to increased capital expenditures in connection with the North American retooling plan and decrease in cash provided by operating activities.
The Company's Debt-to-EBITDA ratio before IAROC, on continuing operations, for the rolling twelve months ended September 30, 2005 was 2.6 compared to 2.9 for the same period in 2004. Furthermore, on the same basis, the EBITDA interest coverage ratio for the period ended September 30, 2005 was 6.3 compared to 5.0 for the same period in 2004 (see figure 7).
Coverage ratios
($ millions)
(Rolling twelve-month period ending)
| | Sept. 30, 2005 | Sept. 30, 2004 | ||||
|---|---|---|---|---|---|---|
| EBITDA before IAROC from continuing YTD September | $ | 520.8 | $ | 570.3 | ||
| Fourth quarter of previous year | 252.2 | 175.4 | ||||
| EBITDA — Last 12 months | $ | 773.0 | $ | 745.7 | ||
Financial expenses from continuing operations | ||||||
| YTD September | $ | 91.2 | $ | 101.8 | ||
| Fourth quarter of previous year | 31.3 | 79.2 | ||||
| Loss on extinguishment of long-term debt YTD September | (30.0) | |||||
| Fourth quarter of previous year | (2.2) | |||||
| Financial expenses adjusted — Last 12 months | $ | 122.5 | $ | 148.8 | ||
| EBITDA Interest Coverage ratio (times) | 6.3 | 5.0 | ||||
| ||||||
| Total Debt | $ | 2,003.6 | $ | 2,163.7 | ||
| Debt-to-EBITDA ratio (times) | 2.6 | 2.9 | ||||
EBITDA: Operating income before depreciation and amortization These ratios are non-GAAP mesures | Figure 7 | |||||
Operating Activities
Working capital was $143 million as at September 30, 2005, compared to $93 million as at September 30, 2004. This increase in working capital of $50 million was largely due to a decrease in trade payables and accrued liabilities partly offset by a decrease in trade receivables, essentially attributable to a higher level of securitization. The Company manages its trade payables in order to take advantage of prompt payment discounts. Also, the Company maximizes the use of its accounts receivable securitization program, since the cost of these programs is relatively low compared to that of its secured credit facility. The amount of trade receivables under securitization varies from month to month, based on the previous month's volume (September securitization is based on outstanding receivables at the end of August).
15
Financing Activities
As at September 30, 2005, the Company's total consolidated debt was $2,004 million, a $160 million decrease compared to the end of September 2004. The debt-to-capitalization ratio was 44:56 compared to 46:54 in September 2004 (see figure 6). The same ratio was 43:57 as at December 31, 2004. Including accounts receivable securitization, total debt would be $2,619 million, $128 million lower than last year. The debt-to-capitalization ratio, including accounts receivable securitization, was 51:49 as at September 30, 2005, compared to 52:48 in September 2004 (see figure 8).
Total Debt and Accounts Receivable Securitization
($ millions)
| | Sept. 30, 2005 | Sept. 30, 2004 | ||||
|---|---|---|---|---|---|---|
| Bank indebtedness | $ | — | $ | 1.5 | ||
| Current portion of long-term debt | 9.2 | 11.7 | ||||
| Long-term debt | 1,880.2 | 2,038.3 | ||||
| Convertible notes | 114.2 | 112.2 | ||||
| Total debt | $ | 2,003.6 | $ | 2,163.7 | ||
| Accounts receivable securitization | 614.9 | 583.2 | ||||
| Total debt and accounts receivable securitization | $ | 2,618.5 | $ | 2,746.9 | ||
| Minority interest | 0.6 | 27.8 | ||||
| Shareholders' equity | 2,499.4 | 2,529.9 | ||||
| Capitalization, including securitization | $ | 5,118.5 | $ | 5,304.6 | ||
| Debt-to-Capitalization, including securitization | 51:49 | 52:48 | ||||
These ratios are non-GAAP measures. | Figure 8 | |||||
The Company is subject to certain financial covenants in some of its major financing agreements. The key financial ratios are the earnings before interest, tax and depreciation and amortization (EBITDA) coverage ratio and the debt-to-capitalization ratio. As at September 30, 2005, the Company was in compliance with all of its significant debt covenants.
The Company's 7.20% Senior Notes for a principal amount of $250 million will mature in March 2006. The Company currently expects to repay these Senior Notes by using its long-term revolving bank facility or other sources of long-term financing available to it at such time and, as such, these Notes have not been included in the current portion of long-term debt.
The Company's Series 4 Cumulative Redeemable First Preferred Shares are redeemable at its option on and after March 15, 2006 at Cdn$25.00, or with regulatory approval, the preferred shares may be converted into equity shares by the Company. On and after June 15, 2006, these preferred shares may be converted at the option of the holder into equity shares, subject to the right of the Company prior to the conversion date to redeem for cash or find substitute purchasers for such preferred shares. The Company currently intends to redeem these shares in March 2006 using its revolving bank facility.
Contractual Cash Obligations
($ millions)
(Continuing Operations)
| | Remainder of 2005 | 2006 | 2007 | 2008 | 2009 | 2010 and thereafter | ||||||||||||
|---|---|---|---|---|---|---|---|---|---|---|---|---|---|---|---|---|---|---|
| Long-term debt and convertible notes | $ | — | $ | 250 | $ | 745 | $ | 202 | $ | — | $ | 772 | ||||||
| Capital leases | 2 | 8 | 4 | 3 | 8 | 9 | ||||||||||||
| Operating leases | 35 | 77 | 58 | 36 | 27 | 100 | ||||||||||||
| Capital asset purchase commitments | 51 | 102 | 12 | — | — | — | ||||||||||||
| Total contractual cash obligations | $ | 88 | $ | 437 | $ | 819 | $ | 241 | $ | 35 | $ | 881 | ||||||
Figure 9
On May 13, 2005, the Company commenced a normal course issuer bid for a maximum of 7,300,000 Subordinate Voting Shares, which represented approximately 10% of the public float for the Subordinate Voting Shares at the time of the announcement. The purchases are to be made at prevailing market prices, on the open market through the facilities of the Toronto Stock Exchange and the bid expires on May 12, 2006. In the third quarter of 2005, the Company repurchased 106,000 shares at an average price of Cdn$23.73 for a net cash consideration of Cdn$2.6 million ($2.1 million). For the year 2005 to date, the Company repurchased 2,438,500 shares at an average price of Cdn$23.85 for a net cash consideration of Cdn$58.2 million ($46.6 million). The excess of the price paid over the book value of the shares repurchased amounting to $0.4 million for the third quarter and $9.8 million for the year to date was charged to retained earnings. The normal course issuer bid is funded using the Company's revolving bank facility. The Company has not repurchased any Subordinated Voting Shares since August 12, 2005 and does not have the intention of repurchasing any in the upcoming months. As at September 30, 2005, the unused portion of the bank facility was $611 million.
The minimum legal requirement for pension contributions is $50 million in 2005 of which $46 million has been paid as of September 30, 2005 (total annual contribution in 2004 was $77 million).
As at September 30, 2005, the following credit ratings applied to the long-term unsecured debt of the Company:
| Rating Agency | Rating | |
|---|---|---|
| Moody's Investors Service | Ba2 | |
| Standard & Poor's | BB+ | |
| Dominion Bond Rating Service Limited | BBB (low) |
On August 26, 2005, Moody's Investors Service lowered the Company's credit rating from Baa3 to Ba2. Similarly, Standard and Poor's lowered the Company's credit rating from BBB- to BB+ on September 8, 2005. The financial costs of certain debts have increased due to these lower credit ratings.
The Company believes that its liquidity, capital resources and cash flow from operations are sufficient to fund planned capital expenditures, working capital requirements, interest and principal payments for the foreseeable future.
Investing Activities
In the third quarter, the Company invested $89 million in capital projects compared to $36 million in 2004. On a year-to-date basis, $217 million has been invested in capital projects in 2005 compared to $101 million in 2004. Of that amount, 80% (80% in 2004) was for organic growth, including expenditures for new capacity requirements and productivity improvement, and 20% (20% in 2004) was for the maintenance of the Company's structure.
Key expenditures for the third quarter of 2005 included approximately $44 million for the purchase and installation of new presses in the United-States and Europe. Other notable projects included the lease buyback of the land and building in Fernley (USA), an efficiency improvement program in Cayfosa (Spain), the purchase of two folder lines in Graphic Brochage (France) and the relocation of equipment from the closed Interprint (Sweden) plant to Helprint (Finland) and Hélio Charleroi (Belgium).
On a year-to-date basis, the investment in the purchasing and installation of new presses in the United-States and Europe amounted to approximately $128 million. Other key expenditures included the replacement of a bindery line in Islington (Canada) and the upgrade of the co-mailing system in the United-States.
During the third quarter of 2005, the Company placed four firm orders for new presses. Also, as part of the U.S. industrial plan announced in 2004, the Company has placed a total of 18 firm orders for new presses. The Company has now placed a total of 22 firm orders for new presses representing a total cost of approximately $265 million of which $116 million has been already disbursed.
For the remainder of 2005, the Company projects capital expenditures of approximately $150 million, of which a portion is related to the U.S. industrial plan and a significant lease buyout. The Company expects to fund these expenditures using cash flows from operations, drawings on the Company's revolving bank facility and other sources of financing such as the following.
The Company is in the process of implementing a financing of its new equipment that are part of its U.S. retooling plan. The application for insured export financing was approved by Euler Hermes Kreditversicherungs-AG ("Hermes"), the agent acting on behalf of the German government, for approximately 110 million Euros. The Company intends to finalize this agreement before year-end.
In addition, the Company expects to generate cash flows in excess of its net book value for the disposal of its non-core Commercial printing group as described below.
In September, the Company signed agreements to sell the remaining units of its North American non-core printing Group subject to the fullfilment of certain conditions by the Company and the purchasers. The transactions should be finalized in the last quarter of 2005.
In April 2005, the Company purchased assets of a web offset printing facility in Pittsburg, California for a consideration of $9 million. This facility complements and strengthens the Company's Retail insert platform and add capacity for customers in the West coast market.
16
Selected Quarterly Financial Data (Continuing Operations)
(in millions of dollars, except per share data)
| | 2005 | 2004 | 2003 | |||||||||||||||||||||||
|---|---|---|---|---|---|---|---|---|---|---|---|---|---|---|---|---|---|---|---|---|---|---|---|---|---|---|
| Q3 | Q2 | Q1 | Q4 | Q3 | Q2 | Q1 | Q4 | |||||||||||||||||||
| Consolidated Results | ||||||||||||||||||||||||||
| Revenues | $ | 1,577.2 | $ | 1,491.1 | $ | 1,551.0 | $ | 1,822.7 | $ | 1,569.6 | $ | 1,471.6 | $ | 1,475.6 | $ | 1,656.2 | ||||||||||
| Operating income before depreciation and amortization and before IAROC | 178.7 | 167.4 | 174.7 | 252.2 | 197.4 | 193.4 | 179.5 | 175.4 | ||||||||||||||||||
| Operating income before IAROC | 97.2 | 84.4 | 88.6 | 161.5 | 112.3 | 104.5 | 92.9 | 85.6 | ||||||||||||||||||
| IAROC | 17.2 | 31.8 | 33.3 | 48.4 | 12.8 | 50.2 | 4.2 | 19.8 | ||||||||||||||||||
| Operating income | 80.0 | 52.6 | 55.3 | 113.1 | 99.5 | 54.3 | 88.7 | 65.8 | ||||||||||||||||||
| Net income (loss) from continuing operations | 30.9 | 9.5 | 15.8 | 46.3 | 45.8 | 15.1 | 32.7 | (50.4 | ) | |||||||||||||||||
Per Share Data | ||||||||||||||||||||||||||
| Earnings (losses) | ||||||||||||||||||||||||||
| Diluted | $ | 0.16 | $ | — | $ | 0.04 | $ | 0.27 | $ | 0.28 | $ | 0.05 | $ | 0.18 | $ | (0.46 | ) | |||||||||
| Diluted before IAROC | $ | 0.28 | $ | 0.21 | $ | 0.27 | $ | 0.59 | $ | 0.36 | $ | 0.30 | $ | 0.20 | $ | (0.34 | ) | |||||||||
| Dividends on equity shares | $ | 0.14 | $ | 0.14 | $ | 0.14 | $ | 0.13 | $ | 0.13 | $ | 0.13 | $ | 0.13 | $ | 0.13 | ||||||||||
IAROC:Impairment of assets, restructuring and other charges
Figure 10
QUARTERLY TRENDS:
Revenue
Due to the seasonality of the printing business (higher volumes in the third and fourth quarters), an analysis of the consecutive quarters is not a true measurement of the revenue trend. In 2003, quarterly revenues were negatively affected by significant pricing pressures in a difficult environment in the printing industry. The volume was higher in most segments due to the Company's initiative to aggressively secure an increased market share, but the continued pricing pressures and overcapacity in the printing industry negatively affected revenues in all business segments. Currency translation had a positive impact on the fourth quarter in 2003. In the first quarter of 2004, there was an increase in volume, but there was a continuing overcapacity in the printing industry and pricing pressures which negatively affected revenue. This trend continued through the remaining three quarters of 2004, while currency translation continued to have a positive impact on revenue in each of the quarters in 2004. Revenue increased in the first three quarters of 2005 due mainly to a favorable impact on currency translation and a higher volume of paper sold to customers. However, continued pricing pressures across the platform adversely affected revenues in the first three quarters of 2005, and volume decreases were particularly felt in the North American Magazine and Book and Directory platforms, the British and the French operations.
Operating income before impairment of assets, restructuring and other charges
In 2003, a detailed review of the Company's operations was undertaken to further reduce the fixed cost base and improve efficiencies. This resulted in a series of restructuring initiatives throughout the year. The first quarter of 2004 showed improved results attributed to the positive impact of the cost reduction efforts initiated in 2003 and the reduction in force. This positive trend continued through the next three quarters of 2004 but was partly offset by increased fringe benefits (including healthcare and pension), $19 million of specific charges, increased freight costs due to higher fuel prices and new government hours of service regulations. Moreover, the third quarter of 2004 was negatively impacted by operational inefficiencies mainly at plants involved in the installation and transfer of equipment.
Operating income before impairment of assets, restructuring and other charges decreased in the first three quarters of 2005 compared to the same periods in 2004. The positive effects of the 2004 restructuring initiatives did not translate in an increase of operating income because of the continuing price reductions, rising energy costs and the underperformance of the French and British operations.
Impairment of assets, restructuring and other charges
Impairment of assets, restructuring and other charges have been a major focus of the Company's cost reduction initiatives undertaken during the last two years that involved a reduction in force, closure or downsizing of facilities, decommissioning of under-performing assets, lowering of overhead expenses, consolidating corporate functions and relocating sales and administrative offices into plants. This determined focus on cost containment has reduced the Company's long-term cost structure and improved efficiency across the platform.
In the fourth quarter of 2003, there was a $20 million charge for new impairment of assets, restructuring and other charges. In the first quarter of 2004, the Company continued this initiative with a $4 million charge for restructuring and other charges. In the second quarter of 2004, the Company recorded a $50 million charge for impairment of assets and restructuring charge, which reflected the closing of a facility, the downsizing of another facility in North America, and the continued workforce reduction across all platforms. In the third quarter of 2004, the Company announced the reorganization of its Nordic Gravure platform and the closing of the Stockholm facility by the end of 2004. The Company also recorded an additional impairment of assets, restructuring and other charges of $13 million. In the fourth quarter of 2004, the Company recorded $35 million of impairment of assets, $11 million in restructuring and $2 million of other charges. In the first quarter of 2005 the Company took a $33 million charge mainly related to the impairment of long-term assets. For the second quarter of 2005, the Company booked a $32 million charge, approximately half of which was for impairment of assets and the other half related to restructuring initiatives. In the third quarter of 2005, there was a $17 million charge for new impairment of assets, restructuring and other charges. The impairments and restructuring initiatives in the first three quarters of 2005 were related to European operations, mainly in France and the United Kingdom.
Net income
Net income was primarily affected by the negative impact of the difficult economic environment and the benefit from restructuring and cost containment initiatives mentioned above. In addition, unusual items impacting financial expenses and income taxes also affected the net income for specific quarters. In the fourth quarter of 2003, net income included a $30 million charge ($18 million, net of income taxes) for the extinguishment of long-term debt related to the redemption of the 8.375% Senior Notes and the repurchase of 89.6% of the 7.75% Senior Notes, as well as a $5 million charge for currency translation loss related to the reduction of a net investment in Latin America. In the same quarter, there was also a $28 million charge of additional tax expense for a change in the average tax rate applied on cumulative temporary differences within different states in the United States and a $18 million charge for a reassessment of the expectation of tax asset recovery and liabilities from prior years. Through the year 2004, financial expenses decreased mainly due to the favorable impact of the 2003 fourth quarter refinancing of long-term debt combined with a lower average volume of debt, as well as a favorable impact of the mix of the debt portfolio compared to the previous year. Net income in the third quarter of 2005 was negatively affected by the global pricing erosion, the underperforming French operations as well as volume reductions in the United Kingdom and certain business groups in the North American platform.
17
On June 30, 2005, the Company concluded the sale of certain assets related to its Los Angeles, California facility for a cash consideration of $0.5 million. On July 15, 2005, the Company sold additionnal assets related to this facility for a cash consideration of $0.8 million. This resulted in a loss on disposal of $6.3 million ($4.1 million, net of income tax recovery).
On August 4, 2005, the Company concluded the sale of certain assets related to its Westwood, Massachussets facility for a cash consideration of $2.6 million resulting in a loss on disposal of $0.8 million ($0.8 million, net of income tax).
During the first nine months of 2005, the Company acquired minority interests in its North American and French operations for a cash consideration of $7.0 million. The Company also sold investments in facilities in France for a total cash consideration of $0.3 million. The Company realized no gain or loss on these transactions.
IMPAIRMENT OF ASSETS AND RESTRUCTURING INITIATIVES
The following analysis takes into account impairments and measures pertaining to continuing operations.
During the third quarter of 2005, the Company recorded an impairment of assets and restructuring charges of $17.2 million, which were composed of cash items of $9.5 million and non-cash items of $7.7 million. The cash items included $5.7 million for the implementation of third quarter initiatives; $0.5 million related to the first and second quarter initiatives and $3.3 million related to the prior year initiatives. For the nine-month period ended September 30, 2005, the Company recorded impairment of assets and restructuring charges of $82.3 million, composed of non-cash items of $48.7 million and cash items of $33.6 million.
On a regular basis, the Company performs a review of its assets and impairment tests on various specific units.
For the third quarter, the Company concluded that some assets, mainly in the United Kingdom, were impaired and recorded an impairment of long-lived assets of $7.7 million. For the nine-month period ended September 30, 2005, the Company recorded impairments of long-lived assets, mainly in Europe, totalling $48.3 million.
In the first quarter of 2005, the Company modified its plan of action for the facility in Corby, United Kingdom and engaged in restructuring activities. The Company had concluded as at December 31, 2004 that no impairment was required. However, based on the revised plan of action, the Company re-evaluated the situation at Corby and recorded an impairment of assets. An additional impairment was recorded for this plant in the third quarter, as revised forecasted results for upcoming years were lower than initially anticipated in the first quarter. Furthermore, the announcement, in April 2005, of the closing of a facility in Canada and other events triggered an impairment test on other groups of assets. The impairments have been calculated as the excess of the carrying amount of the asset or group of assets over its fair value, based on quoted market prices when available, or using a discounted cash flow method.
During the third quarter of 2005, the Company continued its restructuring initiatives by approving the downsizing of operations in Helio Corbeil (France), and other workforce reductions across the Company. The cash cost of these initiatives were estimated at $7.4 million, of which $5.7 million were recorded during the third quarter of 2005. The Company also recorded $0.5 million related to first and second quarter initiatives. In the second quarter of 2005, the Company approved the second phase of the downsizing operations in Corby, the closure of a Canadian facility and other workforce reductions across the Company. The cash cost of these initiatives were estimated at $14.3 million, of which $12.3 million were recorded during the second quarter. In the first quarter of 2005, the Company approved the first phase of the downsizing operations in Corby and other workforce reductions across the Company. The cash cost of these initiatives estimated at $3.8 million were recorded in the first quarter of 2005. The non-cash cost of these initiatives included $0.4 million for the curtailment of one of the Company's Canadian pension plans. The 2005 restructuring initiatives affected 955 employees in total, of which 774 jobs have been eliminated as of September 30, 2005 and 181 are still to come in 2005. However, the Company estimated that 83 new jobs would be created in other facilities.
During the third quarter of 2005, the Company recorded $2.0 million resulting from the continuation of the 2004 initiatives, mainly in Sweden and a net overspending of $1.3 million on leasing and facility costs in North America resulting from the execution of prior year initiatives for a total of $3.3 million. In the second quarter of 2005, the Company recorded $3.7 million resulting from the continuation of 2004 initiatives. The Company also recorded a net reversal of $0.2 million resulting from the execution of prior year initiatives. In the first quarter of 2005, the Company recorded $4.7 million resulting from the continuation of the 2004 initiatives and $2.2 million for the pension obligation related to the Effingham multiemployer benefit plan. The Company also recorded a net reversal of $2.4 million resulting from the execution of prior year initiatives. In summary, 312 jobs were eliminated in the first nine months of 2005 as a result of the execution of prior year initiatives and 54 are still to come in 2005.
For the fourth quarter of 2005 and the year 2006, the Company estimates it will incur additional restructuring charges of $12.8 million for initiatives related to continuing operations that were announced and approved prior to September 30, 2005.
During the nine-month period of 2005, the Company utilized $40.5 million of its restructuring reserves and has a balance of $30.9 million at period end.
FINANCIAL INSTRUMENTS
The Company uses a number of financial instruments to manage its exposure to fluctuations in foreign currency exchange rates, interest rates, and commodity prices. A complete description of these instruments is contained in the Company's annual "Management's Discussion and Analysis" included in the 2004 Annual Report. The following is an analysis of the Company's financial instruments as at September 30, 2005.
18
- •
- Interest rate swap agreements outstanding at quarter-end had a notional value of $233 million. The total adjustment recorded to interest expense was $0.4 million for the first nine months of 2005 and a revenue of $1.3 million for the same period in 2004.
- •
- The Company enters into foreign exchange forward contracts to hedge foreign denominated sales and related receivables, raw materials and equipment purchases. The contracts outstanding as at September 30, 2005 had a notional value of $229 million and expire between 2005 and 2007. The foreign exchange translation gains and losses and the deferred premiums and discounts are recognized as an adjustment to the corresponding revenues and exchange gains or losses when the transaction is recorded. The total amounts recorded in these accounts for the first nine months of 2005 for these contracts were revenues of $16.6 million, and a gain of $0.9 million (revenues of $10.9 million, and a gain of $1.3 million for the same period in 2004).
- •
- In February 2005, the Company sold foreign exchange forward contracts that were used to hedge its net investment in a foreign subsidiary for a cash consideration of $69 million. These foreign exchange forward contracts were already recorded at the fair market value and all resulting gains were previously recorded in cumulative translation adjustment.
- •
- Foreign exchange forward contracts and cross-currency swaps outstanding at quarter-end, used to hedge foreign denominated asset exposures, had a notional value of $276 million and $108 million respectively, and expire between October 2005 and December 2006. The total adjustment recorded in foreign exchange gain or loss related to these contracts was a gain of $43 million for the first nine months of 2005 (a gain of $7 million for 2004) which compensated the foreign exchange gains and losses on the translation of foreign denominated assets.
- •
- Natural gas swap contracts outstanding at quarter-end had a notional quantity of 127,000 gigajoules in Canada and 1,344,000 MMBTU in the U.S. and expire between October 2005 and December 2006. The total adjustment to gas cost for the first nine months of 2005 was a gain of $1.5 million ($1.0 million in 2004).
- •
- The total amount deferred as a liability as at September 30, 2005 in relation to certain terminated derivative instruments or those that have ceased to be effective was $7.2 million ($11.8 million for the same period in 2004) and the total amount recognized in income was $1.7 million ($2.9 million for the same period of 2004).
Fair Value of Derivative Financial Instruments
($ millions)
(Continuing Operations)
| | September 30, 2005 | December 31, 2004 | ||||||||||||
|---|---|---|---|---|---|---|---|---|---|---|---|---|---|---|
| | Book Value | Fair Value | Book Value | Fair Value | ||||||||||
| Derivative financial instruments | ||||||||||||||
| Interest rate swap agreements | $ | — | $ | (8.4 | ) | $ | — | $ | (5.1 | ) | ||||
| Foreign exchange forward contracts | 4.9 | 22.4 | 72.8 | 109.8 | ||||||||||
| Cross-currency interest rate swaps | 5.5 | 5.5 | (16.7 | ) | (16.7 | ) | ||||||||
| Commodity swaps | 0.9 | 8.4 | (0.1 | ) | (1.4 | ) | ||||||||
Figure 11
OFF-BALANCE SHEET ARRANGEMENTS
The Company is party to various off-balance sheet arrangements. For a complete description of these arrangements, please refer to the Company's "Management's Discussion and Analysis" included in its 2004 Annual Report.
The Company renewed and amended its 1999 agreement to sell, with limited recourse, a portion of its U.S. trade receivables on a revolving basis. The $510.0 million program continues to be renewable annually and has been extended through September 29, 2006 with the option to extend the term for an additional year. The amendment allows for more flexibility in the Company's reporting requirements to the purchaser.
The Company also amended its Canadian receivables securitization agreement. There continues to be a requirement in the amended agreement to maintain an investment grade rating by Dominion Bond Rating Service.
As at September 30, 2005, the amounts outstanding under the Canadian, US and European securitization programs were Cdn$70 million, $417 million and 114 million Euros, respectively, (Cdn$80 million, $388 million and 108 million Euros as at September 30, 2004). The Company had a retained interest of $130 million in the trade receivables sold, which is recorded in the Company's trade receivables. As at September 30, 2005, an aggregate amount of $745 million ($710 million as at September 30, 2004) of accounts receivable has been sold under the three programs. The Company is in compliance with all its covenants under the agreements governing its securitization programs.
RELATED PARTY TRANSACTIONS
The Company entered into transactions with the parent company and its subsidiaries, which were accounted for at prices and conditions prevailing in the market, except as otherwise specified for transactions that occured outside the normal course of operations. Intercompany revenues from the parent company's media subsidiaries involved mostly printing of magazines.
Related Party Transactions
($ millions)
| | 2005 | 2004 | ||||
|---|---|---|---|---|---|---|
| Three-month periods ended September 30, | ||||||
| Revenues | $ | 16.3 | $ | 12.1 | ||
| Purchases | 1.1 | 2.0 | ||||
| Management fees billed by Quebecor Inc. | 1.1 | 1.0 | ||||
| IT services billed by VTL (net of incurred expenses billed to VTL of $1.0,$2.2 in 2004) | 3.0 | 1.2 | ||||
Nine-month periods ended September 30, | ||||||
| Revenues | $ | 44.1 | $ | 35.4 | ||
| Purchases | 3.3 | 3.5 | ||||
| Management fees billed by Quebecor Inc. | 3.3 | 3.1 | ||||
| IT services billed by VTL (net of incurred expenses billed to VTL of $2.8,$2.2 in 2004) | 8.4 | 1.2 | ||||
Figure 12
In March 2005, the Company sold certain operating assets to Quebecor Media Inc., one of the parent company's other subsidiaries, for a consideration of Cdn $3.3 million ($2.7 million). The transaction has been realized at the carrying amount and no gain or loss was recorded. The amount has been received in full as at September 30, 2005.
OUTSTANDING SHARE DATA
The following figure discloses the Company's outstanding share data as at October 15, 2005:
Outstanding Share Data
($ millions and thousands of shares)
| | October 15, 2005 | ||||
|---|---|---|---|---|---|
| | Issued and outstanding shares | Book value | |||
| Equity Multiple Voting Shares | 46,987 | $ | 93.5 | ||
| Equity Subordinate Voting Shares | 83,940 | 1,138.0 | |||
| First Preferred Shares, Series 3 | 12,000 | 212.5 | |||
| First Preferred Shares, Series 4 | 8,000 | 130.2 | |||
| First Preferred Shares, Series 5 | 7,000 | 113.9 | |||
Figure 13
RISKS AND UNCERTAINTIES
The Company operates in the printing industry, which has a variety of risk factors as discussed in the Company's 2004 annual "Management's Discussion and Analysis" included in the Company's annual report. Due to the risks and uncertainties outlined therein, the Company's operating environment and financial results may be materially affected. No material changes occurred in Management's evaluation of these risks and uncertainties for the quarter ended September 30, 2005.
19
ACCOUNTING POLICIES
The consolidated financial statements have been prepared using the same accounting policies as described in the Company's latest Annual Report.
In January 2005, the CICA published Section 3855,Financial Instruments — Recognition and Measurement, Section 3865,Hedges, and Section 1530,Comprehensive Income. Section 3855 stipulates standards governing when and in what amount a financial instrument is to be recorded on the balance sheet. Financial instruments are to be recognized at fair value in some cases, at cost-based value in others. The section also stipulates standards for reporting gains and losses on financial instruments. Section 3865 is an optional application that allows entities to apply treatments other than those provided under Section 3855 to eligible operations they choose to designate, for accounting purposes, as being part of a hedging relationship. It expands on the guidance in Accounting Guideline 13,Hedging Relationships, and Section 1650,Foreign Currency Translation, specifying the application of hedge accounting and the information that is to be reported by the entity. Section 1530 stipulates a new requirement that certain gains and losses be temporarily accumulated outside net income and recognized in other comprehensive income. Application of these sections to interim and annual financial statements for financial periods beginning on or after October 1, 2006 will be mandatory. The Company is currently evaluating the impact of the new standards.
ADDITIONAL INFORMATION
Additional information relating to the Company, including its most recent annual information form, is available on SEDAR at www.sedar.com and on EDGAR at www.sec.gov.
On behalf of Management,

Jacques Mallette
Executive Vice President
Chief Financial Officer

Carl Gauvreau
Senior Vice President
Chief Accounting Officer
Montreal, Canada
November 1, 2005
20
CONSOLIDATED STATEMENTS OF INCOME AND RETAINED EARNINGS
Periods ended September 30,
(In millions of US dollars, except per share amounts)
(Unaudited)
| | | Three months | Nine months | ||||||||||||||
|---|---|---|---|---|---|---|---|---|---|---|---|---|---|---|---|---|---|
| | Notes | 2005 | 2004 | 2005 | 2004 | ||||||||||||
| Revenues | $ | 1,577.2 | $ | 1,569.6 | $ | 4,619.3 | $ | 4,516.8 | |||||||||
| Operating expenses: | |||||||||||||||||
| Cost of sales | 1,304.6 | 1,268.2 | 3,808.1 | 3,638.8 | |||||||||||||
| Selling, general and administrative | 95.3 | 107.8 | 293.9 | 317.9 | |||||||||||||
| Securitization fees | 5.7 | 2.7 | 16.1 | 8.7 | |||||||||||||
| Depreciation and amortization | 74.4 | 78.6 | 231.0 | 241.7 | |||||||||||||
| Impairment of assets, restructuring and other charges | 2 | 17.2 | 12.8 | 82.3 | 67.2 | ||||||||||||
| 1,497.2 | 1,470.1 | 4,431.4 | 4,274.3 | ||||||||||||||
| Operating income | 80.0 | 99.5 | 187.9 | 242.5 | |||||||||||||
| Financial expenses | 3 | 31.0 | 31.5 | 91.2 | 101.8 | ||||||||||||
| Income from continuing operations before income taxes | 49.0 | 68.0 | 96.7 | 140.7 | |||||||||||||
| Income taxes | 18.2 | 20.9 | 40.8 | 41.9 | |||||||||||||
| Income from continuing operations before minority interest | 30.8 | 47.1 | 55.9 | 98.8 | |||||||||||||
| Minority interest | (0.1 | ) | 1.3 | (0.3 | ) | 5.2 | |||||||||||
| Net income from continuing operations | 30.9 | 45.8 | 56.2 | 93.6 | |||||||||||||
| Net income (loss) from discontinued operations (net of tax) | 5 | (1.2 | ) | 2.3 | (8.2 | ) | 5.6 | ||||||||||
| Net income | $ | 29.7 | $ | 48.1 | $ | 48.0 | $ | 99.2 | |||||||||
| Net income available to holders of preferred shares | 10.1 | 9.0 | 29.8 | 26.9 | |||||||||||||
| Net income available to holders of equity shares | $ | 19.6 | $ | 39.1 | $ | 18.2 | $ | 72.3 | |||||||||
| Earnings (loss) per share: | 10 | ||||||||||||||||
| Basic: | |||||||||||||||||
| Continuing operations | $ | 0.16 | $ | 0.28 | $ | 0.20 | $ | 0.50 | |||||||||
| Discontinued operations | (0.01 | ) | 0.02 | (0.06 | ) | 0.05 | |||||||||||
| 0.15 | 0.30 | 0.14 | 0.55 | ||||||||||||||
| Diluted: | |||||||||||||||||
| Continuing operations | $ | 0.16 | $ | 0.28 | $ | 0.20 | $ | 0.50 | |||||||||
| Discontinued operations | (0.01 | ) | 0.01 | (0.06 | ) | 0.05 | |||||||||||
| 0.15 | 0.29 | 0.14 | 0.55 | ||||||||||||||
Weighted average number of equity shares outstanding | |||||||||||||||||
| (in millions) | 10 | ||||||||||||||||
| Basic | 130.9 | 132.5 | 132.1 | 132.3 | |||||||||||||
| Diluted | 130.9 | 132.7 | 132.1 | 132.5 | |||||||||||||
Retained earnings: | |||||||||||||||||
| Balance, beginning of period | $ | 713.4 | $ | 722.3 | $ | 761.0 | $ | 723.6 | |||||||||
| Net income | 29.7 | 48.1 | 48.0 | 99.2 | |||||||||||||
| Shares repurchased | 9 | (0.4 | ) | — | (9.8 | ) | — | ||||||||||
| Dividends: | |||||||||||||||||
| Equity shares | (18.0 | ) | (17.2 | ) | (55.1 | ) | (51.6 | ) | |||||||||
| Preferred shares | (10.0 | ) | (9.2 | ) | (29.4 | ) | (27.2 | ) | |||||||||
| Balance, end of period | $ | 714.7 | $ | 744.0 | $ | 714.7 | $ | 744.0 | |||||||||
See Notes to Consolidated Financial Statements.
21
CONSOLIDATED STATEMENTS OF CASH FLOWS
Periods ended September 30,
(In millions of US dollars)
(Unaudited)
| | | Three months | Nine months | ||||||||||||||
|---|---|---|---|---|---|---|---|---|---|---|---|---|---|---|---|---|---|
| | Notes | 2005 | 2004 | 2005 | 2004 | ||||||||||||
| Operating activities: | |||||||||||||||||
| Net income | $ | 29.7 | $ | 48.1 | $ | 48.0 | $ | 99.2 | |||||||||
| Non-cash items in net income: | |||||||||||||||||
| Depreciation of property, plant and equipment | 74.3 | 81.0 | 234.9 | 248.7 | |||||||||||||
| Impairment of assets and non-cash portion of restructuring and other charges | 2 | 7.7 | 3.5 | 48.7 | 44.4 | ||||||||||||
| Future income taxes | 12.0 | 17.0 | 10.9 | 14.2 | |||||||||||||
| Amortization of deferred charges | 7.2 | 6.6 | 19.9 | 19.4 | |||||||||||||
| Other | (1.6 | ) | 4.1 | 8.2 | 13.4 | ||||||||||||
| Changes in non-cash balances related to operations: | |||||||||||||||||
| Trade receivables | (82.5 | ) | (145.3 | ) | (71.7 | ) | (163.5 | ) | |||||||||
| Inventories | (61.7 | ) | (71.8 | ) | (49.5 | ) | (74.4 | ) | |||||||||
| Trade payables and accrued liabilities | 32.4 | 105.7 | (30.1 | ) | (66.9 | ) | |||||||||||
| Other current assets and liabilities | (7.5 | ) | 40.8 | (28.5 | ) | 76.0 | |||||||||||
| Other non-current assets and liabilities | (3.5 | ) | (48.3 | ) | 0.4 | (103.6 | ) | ||||||||||
| (122.8 | ) | (118.9 | ) | (179.4 | ) | (332.4 | ) | ||||||||||
| Cash provided by operating activities | 6.5 | 41.4 | 191.2 | 106.9 | |||||||||||||
Financing activities: | |||||||||||||||||
| Net change in bank indebtedness | (0.2 | ) | 0.5 | — | 0.2 | ||||||||||||
| Net proceeds from issuance of equity shares | 2.3 | 2.6 | 14.1 | 9.3 | |||||||||||||
| Repurchases of shares for cancellation | 9 | (2.1 | ) | — | (46.6 | ) | — | ||||||||||
| Repayments of long-term debt | (2.4 | ) | (150.0 | ) | (8.5 | ) | (198.0 | ) | |||||||||
| Net borrowings under revolving bank facility and commercial paper | 89.0 | 207.3 | 50.7 | 336.0 | |||||||||||||
| Dividends on equity shares | (18.0 | ) | (17.2 | ) | (55.1 | ) | (51.6 | ) | |||||||||
| Dividends on preferred shares | (2.4 | ) | (5.9 | ) | (27.0 | ) | (26.1 | ) | |||||||||
| Dividends to minority shareholders | — | — | — | (0.8 | ) | ||||||||||||
| Cash provided by (used in) financing activities | 66.2 | 37.3 | (72.4 | ) | 69.0 | ||||||||||||
Investing activities: | |||||||||||||||||
| Business acquisitions and disposals, net of cash and cash equivalents | 4,5 | 2.8 | (2.4 | ) | (2.8 | ) | (4.7 | ) | |||||||||
| Additions to property, plant and equipment | (88.5 | ) | (35.9 | ) | (216.9 | ) | (100.8 | ) | |||||||||
| Net proceeds from disposal of assets | 4.3 | 0.3 | 9.5 | 1.7 | |||||||||||||
| Net proceeds from disposal of derivative financial instruments | 7 | — | — | 69.2 | — | ||||||||||||
| Cash used in investing activities | (81.4 | ) | (38.0 | ) | (141.0 | ) | (103.8 | ) | |||||||||
| Effect of foreign currency | (7.8 | ) | (31.6 | ) | 17.6 | (32.4 | ) | ||||||||||
| Net increase (decrease) in cash and cash equivalents | (16.5 | ) | 9.1 | (4.6 | ) | 39.7 | |||||||||||
| Cash and cash equivalents, beginning of period | 70.7 | 45.7 | 58.8 | 15.1 | |||||||||||||
| Cash and cash equivalents, end of period | $ | 54.2 | $ | 54.8 | $ | 54.2 | $ | 54.8 | |||||||||
| Supplemental cash flow information: | |||||||||||||||||
| Interest paid | $ | 33.5 | $ | 40.0 | $ | 90.3 | $ | 105.5 | |||||||||
| Income taxes paid | 9.0 | 7.0 | 50.9 | 57.3 | |||||||||||||
See Notes to Consolidated Financial Statements.
22
CONSOLIDATED BALANCE SHEETS
(In millions of US dollars)
| | Notes | September 30, 2005 | December 31, 2004 | September 30, 2004 | |||||||||
|---|---|---|---|---|---|---|---|---|---|---|---|---|---|
| | | (Unaudited) | (Audited) | (Unaudited) | |||||||||
| Assets | |||||||||||||
| Current assets: | |||||||||||||
| Cash and cash equivalents | $ | 54.2 | $ | 58.8 | $ | 54.8 | |||||||
| Trade receivables | 461.8 | 400.4 | 511.9 | ||||||||||
| Receivables from related parties | 12.9 | 19.7 | 9.8 | ||||||||||
| Inventories | 463.0 | 419.5 | 474.8 | ||||||||||
| Income taxes receivable | 62.3 | 33.0 | 10.3 | ||||||||||
| Future income taxes | 43.2 | 43.2 | 24.4 | ||||||||||
| Prepaid expenses | 17.0 | 24.5 | 18.8 | ||||||||||
| Total current assets | 1,114.4 | 999.1 | 1,104.8 | ||||||||||
| Property, plant and equipment, net | 2,255.0 | 2,373.6 | 2,388.3 | ||||||||||
| Goodwill | 6 | 2,599.4 | 2,651.9 | 2,590.6 | |||||||||
| Other assets | 153.6 | 219.8 | 197.3 | ||||||||||
| Total assets | $ | 6,122.4 | $ | 6,244.4 | $ | 6,281.0 | |||||||
Liabilities and Shareholders' Equity | |||||||||||||
| Current liabilities: | |||||||||||||
| Bank indebtedness | $ | — | $ | — | $ | 1.5 | |||||||
| Trade payables and accrued liabilities | 880.2 | 931.9 | 931.2 | ||||||||||
| Payables to related parties | 2.0 | 2.7 | 0.3 | ||||||||||
| Income and other taxes payable | 75.9 | 83.7 | 52.1 | ||||||||||
| Future income taxes | 4.5 | 4.4 | 15.2 | ||||||||||
| Current portion of long-term debt | 9.2 | 11.7 | 11.7 | ||||||||||
| Total current liabilities | 971.8 | 1,034.4 | 1,012.0 | ||||||||||
Long-term debt | 1,880.2 | 1,825.8 | 2,038.3 | ||||||||||
| Other liabilities | 245.2 | 248.1 | 220.4 | ||||||||||
| Future income taxes | 411.0 | 402.6 | 340.4 | ||||||||||
| Convertible notes | 114.2 | 112.6 | 112.2 | ||||||||||
| Minority interest | 0.6 | 8.3 | 27.8 | ||||||||||
Shareholders' equity: | |||||||||||||
| Capital stock | 9 | 1,686.4 | 1,705.3 | 1,702.4 | |||||||||
| Additional paid-in capital | 111.5 | 109.7 | 108.0 | ||||||||||
| Retained earnings | 714.7 | 761.0 | 744.0 | ||||||||||
| Translation adjustment | (13.2 | ) | 36.6 | (24.5 | ) | ||||||||
| 2,499.4 | 2,612.6 | 2,529.9 | |||||||||||
| Total liabilities and shareholders' equity | $ | 6,122.4 | $ | 6,244.4 | $ | 6,281.0 | |||||||
See Notes to Consolidated Financial Statements.
23
NOTES TO CONSOLIDATED FINANCIAL STATEMENTS
Periods ended September 30, 2005 and 2004
(Tabular amounts are expressed in millions of US dollars, except for earnings per share amounts and number of shares and options)
(Unaudited)
1. BASIS OF PRESENTATION
The consolidated financial statements included in this report are unaudited and reflect normal and recurring adjustments which are, in the opinion of the Company, considered necessary for a fair presentation. These consolidated financial statements have been prepared in conformity with Canadian generally accepted accounting principles ("Canadian GAAP"). The same accounting policies as described in the Company's latest Annual Report have been used. However, these consolidated financial statements do not include all disclosures required under Canadian GAAP and, accordingly, should be read in conjunction with the consolidated financial statements and the notes thereto included in the Company's latest Annual Report.
Seasonality
The operations of the Company's business are seasonal, with approximately 60% of operating income historically recognized in the second half of the fiscal year, primarily due to the higher number of magazine pages, new product launches and back-to-school, retail and holiday catalog promotions.
Reclassification
Certain reclassifications have been made to prior period amounts in order to conform with the basis of presentation adopted in the current period.
2. IMPAIRMENT OF ASSETS, RESTRUCTURING AND OTHER CHARGES
During the third quarter of 2005, the Company recorded an impairment of assets and restructuring charges of $17.2 million, which were composed of cash items of $9.5 million and non-cash items of $7.7 million. The cash items included $5.7 million for the implementation of third quarter initiatives; $0.5 million related to the first and second quarter initiatives and $3.3 million related to the prior year initiatives. For the nine-month period ended September 30, 2005, the Company recorded impairment of assets and restructuring charges of $86.2 million, composed of non-cash items of $48.7 million and cash items of $37.5 million, of which $3.9 million was related to discontinued operations.
The following table sets forth the segmented information and the category of charges.
| 2005 Third Quarter | Workforce reduction costs | Leases, closed facilities carrying costs and other | Total restructuring charges | Impairment of assets and pension curtailments | Total impairment of assets, restructuring and other charges | ||||||||||
|---|---|---|---|---|---|---|---|---|---|---|---|---|---|---|---|
| North America | $ | 0.7 | $ | 1.2 | $ | 1.9 | $ | 1.4 | $ | 3.3 | |||||
| Europe | 6.1 | 1.3 | 7.4 | 6.3 | 13.7 | ||||||||||
| Latin America | 0.2 | — | 0.2 | — | 0.2 | ||||||||||
| Continued operations | $ | 7.0 | $ | 2.5 | $ | 9.5 | $ | 7.7 | $ | 17.2 | |||||
| 2004 Third Quarter | Workforce reduction costs | Leases, closed facilities carrying costs and other | Total restructuring charges | Impairment of assets and pension curtailments | Total impairment of assets, restructuring and other charges | ||||||||||
|---|---|---|---|---|---|---|---|---|---|---|---|---|---|---|---|
| North America | $ | 5.8 | $ | 0.3 | $ | 6.1 | $ | — | $ | 6.1 | |||||
| Europe | 3.2 | — | 3.2 | 2.9 | 6.1 | ||||||||||
| Latin America | (0.1 | ) | — | (0.1 | ) | 0.6 | 0.5 | ||||||||
| Other | 0.2 | — | 0.2 | — | 0.2 | ||||||||||
| $ | 9.1 | $ | 0.3 | $ | 9.4 | $ | 3.5 | $ | 12.9 | ||||||
| Discontinued Operations | $ | 0.1 | $ | — | $ | 0.1 | $ | — | $ | 0.1 | |||||
| Continued Operations | 9.0 | 0.3 | 9.3 | 3.5 | 12.8 | ||||||||||
| $ | 9.1 | $ | 0.3 | $ | 9.4 | $ | 3.5 | $ | 12.9 | ||||||
24
2. IMPAIRMENT OF ASSETS, RESTRUCTURING AND OTHER CHARGES (CONT'D)
| 2005 YTD | Workforce reduction costs | Leases, closed facilities carrying costs and other | Total restructuring charges | Impairment of assets and pension curtailments | Total impairment of assets, restructuring and other charges | ||||||||||
|---|---|---|---|---|---|---|---|---|---|---|---|---|---|---|---|
| North America | $ | 12.8 | $ | 3.9 | $ | 16.7 | $ | 6.9 | $ | 23.6 | |||||
| Europe | 13.4 | 7.0 | 20.4 | 41.5 | 61.9 | ||||||||||
| Latin America | 0.3 | 0.1 | 0.4 | 0.3 | 0.7 | ||||||||||
| $ | 26.5 | $ | 11.0 | $ | 37.5 | $ | 48.7 | $ | 86.2 | ||||||
| Discontinued Operations | $ | 3.8 | $ | 0.1 | $ | 3.9 | $ | — | $ | 3.9 | |||||
| Continued Operations | 22.7 | 10.9 | 33.6 | 48.7 | 82.3 | ||||||||||
| $ | 26.5 | $ | 11.0 | $ | 37.5 | $ | 48.7 | $ | 86.2 | ||||||
| 2004 YTD | Workforce reduction costs | Leases, closed facilities carrying costs and other | Total restructuring charges | Impairment of assets and pension curtailments | Total impairment of assets, restructuring and other charges | ||||||||||
|---|---|---|---|---|---|---|---|---|---|---|---|---|---|---|---|
| North America | $ | 18.0 | $ | (0.4 | ) | $ | 17.6 | $ | 40.7 | $ | 58.3 | ||||
| Europe | 5.4 | 0.5 | 5.9 | 3.1 | 9.0 | ||||||||||
| Latin America | 0.5 | — | 0.5 | 0.6 | 1.1 | ||||||||||
| Other | 0.5 | — | 0.5 | — | 0.5 | ||||||||||
| $ | 24.4 | $ | 0.1 | $ | 24.5 | $ | 44.4 | $ | 68.9 | ||||||
| Discontinued Operations | $ | 1.7 | $ | — | $ | 1.7 | $ | — | $ | 1.7 | |||||
| Continued Operations | 22.7 | 0.1 | 22.8 | 44.4 | 67.2 | ||||||||||
| $ | 24.4 | $ | 0.1 | $ | 24.5 | $ | 44.4 | $ | 68.9 | ||||||
Impairment of assets
During the quarter ended September 30, 2005, the Company performed a review of its assets. Following impairment tests on various specific units, the Company concluded that some assets, mainly in the United Kingdom, were impaired. Accordingly, for the third quarter of 2005, the Company recorded an impairment of long-lived assets of $7.7 million. For the nine months period ended September 30, 2005, the Company recorded impairments of long-lived assets, mainly in Europe, totalling $48.3 million.
The impairment of long-lived assets has been calculated as the excess of the carrying amount of an asset over its fair value, based on quoted market prices when available, or on the expected present value of future cash flows approach.
2005 Restructuring charges
During the third quarter of 2005, the Company continued its restructuring initiatives by approving the downsizing of operations in Helio Corbeil (France), and other workforce reductions across the Company. The cash costs of these initiatives were estimated at $7.4 million, of which $5.7 million were recorded during the third quarter. The Company also recorded $0.5 million related to first and second quarter initiatives.
During the second quarter of 2005, the Company approved restructuring initiatives for the second phase of the downsizing operations in Corby, the closure of a Canadian facility and other workforce reductions across the Company. The cash costs of these initiatives were estimated at $18.2 million, of which $12.3 million were recorded during the second quarter. The Company had also recorded cash restructuring charges of $3.9 million for severance related to the disposal of a non-core facility.
During the first quarter of 2005, the Company approved the first phase of the downsizing operations in Corby and other workforce reductions across the Company. The cash costs of these initiatives estimated at $3.8 million was recorded in the first quarter. The non-cash cost of these initiatives included $0.4 million for the curtailment of one of the Company's Canadian pension plans.
Prior year restructuring initiatives
During the third quarter of 2005, the Company recorded $2.0 million resulting from the continuation of the 2004 initiatives, mainly in Sweden and a net overspending of $1.3 million on leasing and facility costs in North America resulting from the execution of prior year initiatives for a total of $3.3 million.
During the second quarter of 2005, the Company recorded $3.7 million resulting from the continuation of 2004 initiatives. The Company also recorded a net reversal of $0.2 million resulting from the execution of prior year initiatives.
During the first quarter of 2005, the Company recorded $4.7 million resulting from the continuation of the 2004 initiatives and $2.2 million for the pension obligation related to the Effingham multiemployer benefit plan. The Company also recorded a net reversal of $2.4 million resulting from the execution of prior year initiatives.
Continuity of the reserve for restructuring and other charges
As at January 1, 2005, the balance of the restructuring reserve was $35.2 million. This amount related mostly to workforce reductions across the platform and lease and facility carrying costs. The Company utilized $40.5 million of the current and prior years' restructuring and other charges reserves during the nine-month period ended September 30, 2005.
25
2. IMPAIRMENT OF ASSETS, RESTRUCTURING AND OTHER CHARGES (CONT'D)
The following table sets forth the Company's 2005 restructuring reserve and activities against the reserves carried forward from 2004:
| | Workforce reduction costs | Leases, closed facilities carrying costs and other | 2005 | 2004 | |||||||||
|---|---|---|---|---|---|---|---|---|---|---|---|---|---|
| Beginning of the year | $ | 21.3 | $ | 13.9 | $ | 35.2 | $ | 45.8 | |||||
| Overspending on prior years' initiatives | 0.6 | 1.6 | 2.2 | 5.1 | |||||||||
| Reversal of previous years' reserves | (2.6 | ) | (0.9 | ) | (3.5 | ) | (7.8 | ) | |||||
| 2004 initiatives | 3.9 | 8.7 | 12.6 | 27.2 | |||||||||
| 2005 initiatives | 24.6 | 1.6 | 26.2 | — | |||||||||
| 26.5 | 11.0 | 37.5 | 24.5 | ||||||||||
| Reserve utilized during the nine-month periods ended September 30 | (27.5 | ) | (13.0 | ) | (40.5 | ) | (38.3 | ) | |||||
| Foreign currency changes | (0.7 | ) | (0.6 | ) | (1.3 | ) | (0.2 | ) | |||||
| Balance as at September 30 | $ | 19.6 | $ | 11.3 | $ | 30.9 | $ | 31.8 | |||||
Cash disbursements related to this reserve are expected to be as follows:
| | Workforce reduction costs | Leases, closed facilities carrying costs and other | Total | ||||||
|---|---|---|---|---|---|---|---|---|---|
| Remainder of 2005 | $ | 9.7 | $ | 2.8 | $ | 12.5 | |||
| 2006 | 9.9 | 4.1 | 14.0 | ||||||
| 2007 | — | 2.6 | 2.6 | ||||||
| 2008 | — | 1.2 | 1.2 | ||||||
| 2009 and thereafter | — | 0.6 | 0.6 | ||||||
| $ | 19.6 | $ | 11.3 | $ | 30.9 | ||||
3. FINANCIAL EXPENSES
| | Three months | Nine months | |||||||||||
|---|---|---|---|---|---|---|---|---|---|---|---|---|---|
| | 2005 | 2004 | 2005 | 2004 | |||||||||
| Interest on long-term debt and convertible notes | $ | 30.0 | $ | 30.1 | $ | 88.0 | $ | 93.7 | |||||
| Interest on short-term debt | 1.0 | 1.5 | 2.5 | 4.2 | |||||||||
| Amortization of deferred financing costs | 0.4 | 0.4 | 1.4 | 2.2 | |||||||||
| Exchange loss | 0.5 | 0.7 | 2.7 | 0.9 | |||||||||
| Derivative financial instruments | 0.7 | (1.1 | ) | (0.2 | ) | (0.5 | ) | ||||||
| Loss on extinguishment of long-term debt | — | — | — | 2.0 | |||||||||
| 32.6 | 31.6 | 94.4 | 102.5 | ||||||||||
| Interest capitalized to the cost of equipment | (1.1 | ) | (0.1 | ) | (2.7 | ) | (0.9 | ) | |||||
| $ | 31.5 | $ | 31.5 | $ | 91.7 | $ | 101.6 | ||||||
| Portion included in discontinued operations | 0.5 | — | 0.5 | (0.2 | ) | ||||||||
| $ | 31.0 | $ | 31.5 | $ | 91.2 | $ | 101.8 | ||||||
4. BUSINESS ACQUISITIONS AND DISPOSALS
In August 2005, the Company acquired minority interests in its French operations for a cash consideration of $0.6 million, of which $0.2 million has been recorded in goodwill.
In March 2005, the Company acquired minority interests in its North American operations for a cash consideration of $6.4 million.
In March 2005, the Company sold its investment in a facility in Torcy, France for a cash consideration of 1 Euro. The Company also sold the operating assets of a division of a subsidiary in France for a total cash consideration of $0.3 million. No gain or loss was realized on those transactions.
26
5. DISCONTINUED OPERATIONS
On May 10, 2005, the Company announced its intention to divest its North American non-core Commercial Printing Group, one of the largest providers of general, financial, packaging and commercial specialty printing services throughout the United States, Canada, and Mexico, in order to focus on its core long-run print business. The Company has classified all units of this group as discontinued operations in the consolidated financial statements during the second quarter of 2005.
On June 30, 2005, the Company concluded the sale of certain assets related to its Los Angeles, California facility, one of the business units in the North American non-core Commercial Printing Group, for a cash consideration of $0.5 million. On July 19, 2005, the Company sold additionnal assets related to this facility for a cash consideration of $0.8 million. This resulted in a loss on disposal of $6.3 million ($4.1 million, net of income tax recovery). Under the terms of the agreement, the Company has assumed obligations for termination benefits relating to this business that have been recorded as part of restructuring and other charges, and has retained certain operating leases. A reduction of $0.4 million relating to goodwill of this business was recorded within discontinued operations.
On August 4, 2005, the Company concluded the sale of certain assets related to its Westwood, Massachusetts facility, one of the business units in the North American non-core Commercial Printing Group, for a cash consideration of $2.6 million resulting in a loss on disposal of $0.8 million ($0.8 million, net of income tax). A reduction of $0.9 million relating to goodwill of this business was recorded during the third quarter within discontinued operations.
In September 2005, the Company signed agreements to sell the remaining units of its North American non-core Commercial Printing group, subject to the fullfilment of certain conditions by the Company and the purchasers. The units should be sold in the last quarter of 2005 if the conditions of the agreements are met by the Company and the purchasers.
Summarized financial information for the discontinued operations is as follows:
Operations summary of discontinued operations
| | | Three months | Nine months | ||||||||||||
|---|---|---|---|---|---|---|---|---|---|---|---|---|---|---|---|
| | Note | 2005 | 2004 | 2005 | 2004 | ||||||||||
| Revenues | $ | 52.2 | $ | 63.4 | $ | 185.4 | $ | 210.6 | |||||||
| Cost of sales and selling, general and administrative expenses | 51.4 | 58.7 | 182.1 | 192.2 | |||||||||||
| Depreciation and amortization | — | 2.5 | 4.2 | 7.5 | |||||||||||
| Restructuring and other charges | 2 | — | 0.1 | 3.9 | 1.7 | ||||||||||
| Loss on disposal of business units | 1.2 | — | 7.1 | — | |||||||||||
| Operating income (loss) | (0.4 | ) | 2.1 | (11.9 | ) | 9.2 | |||||||||
| Financial expenses (income) | 3 | 0.5 | — | 0.5 | (0.2 | ) | |||||||||
| Income (loss) before income taxes | (0.9 | ) | 2.1 | (12.4 | ) | 9.4 | |||||||||
| Income taxes (recovery) | 0.3 | (0.2 | ) | (4.2 | ) | 3.8 | |||||||||
| Net income (loss) from discontinued operations | $ | (1.2 | ) | $ | 2.3 | $ | (8.2 | ) | $ | 5.6 | |||||
Net assets held for sale
| | September 30 2005 | December 31 2004 | September 30 2004 | ||||||
|---|---|---|---|---|---|---|---|---|---|
| Cash | $ | 5.9 | $ | 4.6 | $ | 3.9 | |||
| Trade receivables | 3.4 | 4.5 | 4.4 | ||||||
| Inventories | 19.5 | 16.1 | 17.3 | ||||||
| Property, plant and equipment, net | 41.4 | 50.8 | 57.3 | ||||||
| Goodwill | 41.3 | 42.6 | 42.6 | ||||||
| Other assets | 1.0 | 0.9 | 0.9 | ||||||
| Total assets | 112.5 | 119.5 | 126.4 | ||||||
| Trade payables and accrued liabilities | 16.1 | 14.6 | 10.0 | ||||||
| Net assets | $ | 96.4 | $ | 104.9 | $ | 116.4 | |||
27
6. GOODWILL
The changes in the carrying amount of goodwill for the nine-month period ended September 30, 2005 are as follows:
| | Note | North America | Europe | Latin America | Total | ||||||||||
|---|---|---|---|---|---|---|---|---|---|---|---|---|---|---|---|
| Balance as at December 31, 2004 | $ | 2,198.3 | $ | 445.4 | $ | 8.2 | $ | 2,651.9 | |||||||
| Goodwill acquired during the period | 4 | — | 0.2 | — | 0.2 | ||||||||||
| Business disposal | 5 | (1.3 | ) | — | — | (1.3 | ) | ||||||||
| Foreign currency changes | 1.6 | (53.4 | ) | 0.4 | (51.4 | ) | |||||||||
| Balance as at September 30, 2005 | $ | 2,198.6 | $ | 392.2 | $ | 8.6 | $ | 2,599.4 | |||||||
The Company will complete its annual impairment test of the goodwill in the fourth quarter.
7. FINANCIAL INSTRUMENTS
In February 2005, the Company sold foreign exchange forward contracts that were used to hedge its net investment in a foreign subsidiary for a cash consideration of $69.2 million. These foreign exchange forward contracts were already recorded at the fair market value and all resulting gains were previously recorded in cumulative translation adjustment.
8. STOCK-BASED COMPENSATION
The Company uses the fair value based method of accounting for stock options granted to employees on or after January 1, 2003, and compensation cost is charged against income. However, prior to January 1, 2003, the Company used the settlement based method for its stock-based compensation plans. Had compensation cost been determined using the fair value based method at the date of grant for awards granted in 2002 under all plans, the Company's pro forma net income, earnings per share and diluted earnings per share would not significantly differ from those presented in the consolidated income statement.
The following table summarizes information about stock options:
| | September 30, 2005 | December 31, 2004 | |||
|---|---|---|---|---|---|
| Number of stock options at the end of the period (in thousands): | |||||
| Outstanding | 6,097.6 | 4,542.0 | |||
| Exercisable | 2,629.3 | 2,306.9 | |||
In January 2005, the Company modified its stock option plan. All options granted in accordance with the modified plan vest as follows: 50% vest based on the passage of time and the remaining 50% vest based on the achievement of performance targets (25% based on the growth of earnings per share as reported in the annual audited consolidated financial statements of the Company and 25% based on the increase in share price) over a four year period. These options expire after six years. In 2005, the Company granted a total of 1,930,120 options in accordance with the modified plan.
In the third quarter of 2005, the Company reviewed the likelihood that performance targets would be met for the vesting of the 2004 special grant. Management concluded that the achievement of the performance targets based on earnings per share was no longer probable and as a result, the related compensation expense of $1.6 million previously recorded was reversed in the third quarter of 2005.
The total compensation expense recorded in 2005 (net of the $1.6 million reversal) was $2.0 million ($2.3 million in 2004).
28
9. CAPITAL STOCK
a) Authorized capital stock
| | September 30, 2005 | December 31, 2004 | | ||||||||||
|---|---|---|---|---|---|---|---|---|---|---|---|---|---|
| | Convertible into | ||||||||||||
| | Number | Amount | Number | Amount | |||||||||
| (Thousands of shares) | |||||||||||||
| Multiple voting shares | 46,987 | $ | 93.5 | 46,987 | $ | 93.5 | Subordinate shares | ||||||
| Subordinate voting shares | 83,851 | 1,136.3 | 85,604 | 1,155.2 | n/a | ||||||||
| Redeemable first preferred shares: | |||||||||||||
| Series 3 | 12,000 | 212.5 | 12,000 | 212.5 | Series 2 preferred shares(1) | ||||||||
| Series 4 | 8,000 | 130.2 | 8,000 | 130.2 | Subordinate shares(1) | ||||||||
| Series 5 | 7,000 | 113.9 | 7,000 | 113.9 | Subordinate shares(1) | ||||||||
| 27,000 | 456.6 | 27,000 | 456.6 | ||||||||||
| Total capital stock | $ | 1,686.4 | $ | 1,705.3 | |||||||||
(1)Under certain conditions
During the first nine months of 2005, there were 315,065 Subordinate Voting Shares issued under the Company's stock option plan (41,257 in the first nine months of 2004) and 357,979 Subordinate Voting Shares issued under the Company's employee stock purchase plans (464,465 in the first nine months of 2004)for a total cash consideration of $14.1 million ($9.3 million in the first nine months of 2004).
b) Share repurchase
On May 10, 2005 the Company announced a Normal Course Issuer Bid Program (the "Program") under which a maximum of 7,300,000 Subordinate Voting Shares can be repurchased. The purchases will be made during a twelve-month period from May 13, 2005 to May 12, 2006.
As at September 30, 2005, the Company repurchased for cancellation under the Program, a total of 2,438,500 Subordinate Voting Shares for a net cash consideration of Cdn $58.2 million ($46.6 million). The excess of the price paid over the book value of the shares repurchased amounting to Cdn $12.3 million ($9.8 million) was charged to retained earnings.
10. EARNINGS PER SHARE
The following table sets forth the computation of basic and diluted earnings per share for continuing operations:
| | Three months | Nine months | |||||||||||
|---|---|---|---|---|---|---|---|---|---|---|---|---|---|
| | 2005 | 2004 | 2005 | 2004 | |||||||||
| Net income from continuing operations | $ | 30.9 | $ | 45.8 | $ | 56.2 | $ | 93.6 | |||||
| Net income available to holders of preferred shares | 10.1 | 9.0 | 29.8 | 26.9 | |||||||||
| Net income from continuing operations available to holders of equity shares | $ | 20.8 | $ | 36.8 | $ | 26.4 | $ | 66.7 | |||||
| (In millions) | |||||||||||||
| Weighted-average number of equity shares outstanding | 130.9 | 132.5 | 132.1 | 132.3 | |||||||||
| Effect of dilutive stock options | — | 0.2 | — | 0.2 | |||||||||
| Weighted-average number of diluted equity shares outstanding | 130.9 | 132.7 | 132.1 | 132.5 | |||||||||
| Earnings per share: | |||||||||||||
| Basic and Diluted | $ | 0.16 | $ | 0.28 | $ | 0.20 | $ | 0.50 | |||||
For the three months and nine months of 2005 and 2004, diluted earnings per share did not include the effects of the convertible notes which were anti-dilutive.
Earnings per share for discontinued operations are calculated by dividing the net income (loss) from discontinued operations (net of tax) by the weighted average number of equity shares outstanding during the period.
The computation of diluted earnings per share excluded the outstanding options to purchase equity shares that have an exercise price greater than the average market price of shares of the same category. During the third quarter of 2005, 5,635,670 such options were outstanding (3,198,256 for the same period in 2004) and 3,641,665 were outstanding during the first nine months of 2005 (3,909,811 in 2004). These options will expire between 2006 and 2014.
11. RELATED PARTY TRANSACTIONS
In March 2005, the Company sold certain operating assets to Quebecor Media Inc., one of the parent company's subsidiaries, for a consideration of Cdn $3.3 million ($2.7 million). The transaction has been realized at the carrying amount and no gain or loss was recorded.
29
12. PENSION AND OTHER POSTRETIREMENT BENEFITS
The following table presents the Company's pension and other postretirement benefit costs:
| | Three months | Nine months | ||||||||||
|---|---|---|---|---|---|---|---|---|---|---|---|---|
| | 2005 | 2004 | 2005 | 2004 | ||||||||
| Pension benefits | $ | 21.5 | $ | 18.7 | $ | 57.7 | $ | 61.0 | ||||
| Postretirement benefits | 0.8 | 2.3 | 2.6 | 6.8 | ||||||||
| Total periodic benefit cost | $ | 22.3 | $ | 21.0 | $ | 60.3 | $ | 67.8 | ||||
| Portion included in discontinued operations | 4.6 | 0.3 | 5.7 | 1.0 | ||||||||
| Total periodic benefit cost from continuing operations | $ | 17.7 | $ | 20.7 | $ | 54.6 | $ | 66.8 | ||||
The 2005 pension benefit costs included a $4.2 million pension curtailment related to plants included in the discontinued operations results. The 2004 pension benefit costs included an $10.7 million pension obligation related to restructuring.
13. COMMITMENTS
During the first nine months of 2005, the Company concluded agreements to purchase 13 new presses. Future payments related to these commitments will amount to $27.1 million in 2005, $71.8 million in 2006, and $11.5 million in 2007.
14. SEGMENT DISCLOSURE
The Company operates in the printing industry. Its business groups are located in three main segments: North America, Europe and Latin America. These segments are managed separately since they all require specific market strategies. The Company assesses the performance of each segment based on operating income before restructuring and other charges. The following is a summary of the segmented information for the Company's Continuing Operations:
| | North America | Europe | Latin America | Other | Inter- Segment | Total | ||||||||||||
|---|---|---|---|---|---|---|---|---|---|---|---|---|---|---|---|---|---|---|
| Three months ended September 30, | ||||||||||||||||||
2005 | ||||||||||||||||||
| Revenues | $ | 1,253.6 | $ | 270.7 | $ | 54.4 | — | $ | (1.5 | ) | $ | 1,577.2 | ||||||
| Impairment of assets, restructuring and other charges | 3.3 | 13.7 | 0.2 | — | — | 17.2 | ||||||||||||
| Operating income (loss) | 96.7 | (18.5 | ) | 2.6 | (0.8 | ) | — | 80.0 | ||||||||||
2004 | ||||||||||||||||||
| Revenues | $ | 1,228.5 | $ | 295.7 | $ | 45.0 | $ | 0.1 | $ | 0.3 | $ | 1,569.6 | ||||||
| Impairment of assets, restructuring and other charges | 6.0 | 6.1 | 0.5 | 0.2 | — | 12.8 | ||||||||||||
| Operating income (loss) | 104.4 | 3.2 | 0.6 | (8.7 | ) | — | 99.5 | |||||||||||
| Nine months ended September 30, | ||||||||||||||||||
2005 | ||||||||||||||||||
| Revenues | $ | 3,559.4 | $ | 886.2 | $ | 177.2 | $ | 0.2 | $ | (3.7 | ) | $ | 4,619.3 | |||||
| Impairment of assets, restructuring and other charges | 19.7 | 61.9 | 0.7 | — | — | 82.3 | ||||||||||||
| Operating income (loss) | 244.6 | (62.7 | ) | 8.6 | (2.6 | ) | — | 187.9 | ||||||||||
2004 | ||||||||||||||||||
| Revenues | $ | 3,462.4 | $ | 920.8 | $ | 136.2 | $ | 0.3 | $ | (2.9 | ) | $ | 4,516.8 | |||||
| Impairment of assets, restructuring and other charges | 56.6 | 9.0 | 1.1 | 0.5 | — | 67.2 | ||||||||||||
| Operating income (loss) | 227.7 | 24.6 | 2.0 | (11.8 | ) | — | 242.5 | |||||||||||
30
FORM 52-109FT2
CERTIFICATION OF INTERIM FILINGS
DURING TRANSITION PERIOD
I, Pierre Karl Péladeau, President and Chief Executive Officer of Quebecor World Inc., certify that:
- I have reviewed the interim filings (as this term is defined in Multilateral Instrument 52-109Certification of Disclosure in Issuers' Annual and Interim Filings) ofQuebecor World Inc., (the issuer) for the interim period ending September 30, 2005;
- Based on my knowledge, the interim filings do not contain any untrue statement of a material fact or omit to state a material fact required to be stated or that is necessary to make a statement not misleading in light of the circumstances under which it was made, with respect to the period covered by the interim filings; and
- Based on my knowledge, the interim financial statements together with the other financial information included in the interim filings fairly present in all material aspects the financial condition, results of operations and cash flows of the issuer, as of the date and for the periods presented in the interim filings.
Date: November 1, 2005
/s/Pierre Karl Péladeau
Pierre Karl Péladeau
President and Chief Executive Officer
FORM 52-109FT2
CERTIFICATION OF INTERIM FILINGS
DURING TRANSITION PERIOD
I, Jacques Mallette, Executive Vice President and Chief Financial Officer of Quebecor World Inc., certify that:
- I have reviewed the interim filings (as this term is defined in Multilateral Instrument 52-109Certification of Disclosure in Issuers' Annual and Interim Filings) ofQuebecor World Inc., (the issuer) for the interim period ending September 30, 2005;
- Based on my knowledge, the interim filings do not contain any untrue statement of a material fact or omit to state a material fact required to be stated or that is necessary to make a statement not misleading in light of the circumstances under which it was made, with respect to the period covered by the interim filings; and
- Based on my knowledge, the interim financial statements together with the other financial information included in the interim filings fairly present in all material aspects the financial condition, results of operations and cash flows of the issuer, as of the date and for the periods presented in the interim filings.
Date: November 1, 2005
/s/Jacques Malette
Jacques Mallette
Executive Vice President and
Chief Financial Officer
31
SIGNATURES
Pursuant to the requirements of the Securities Exchange Act of 1934, the registrant has duly caused this report to be signed on its behalf by the undersigned, thereunto duly authorized.
QUEBECOR WORLD INC.
By:/s/ Marie-É. Chlumecky
Name: Marie-É. Chlumecky
Title: Assistant Secretary
Date: November 1, 2005
QUEBECOR WORLD INC. FINANCIAL HIGHLIGHTS
CONSOLIDATED STATEMENTS OF INCOME AND RETAINED EARNINGS Periods ended September 30, (In millions of US dollars, except per share amounts) (Unaudited)
CONSOLIDATED STATEMENTS OF CASH FLOWS Periods ended September 30, (In millions of US dollars) (Unaudited)
CONSOLIDATED BALANCE SHEETS (In millions of US dollars)
NOTES TO CONSOLIDATED FINANCIAL STATEMENTS Periods ended September 30, 2005 and 2004 (Tabular amounts are expressed in millions of US dollars, except for earnings per share amounts and number of shares and options) (Unaudited)