QuickLinks -- Click here to rapidly navigate through this document
SECURITIES AND EXCHANGE COMMISSION
Washington, DC 20549
FORM 6-K
REPORT OF FOREIGN ISSUER
PURSUANT TO RULE 13a-16 or 15d-16 OF
THE SECURITIES EXCHANGE ACT OF 1934
For the month of February 2006
Commission File Number:1-14118
2005 FOURTH QUARTER RESULTS
QUEBECOR WORLD INC.
(Translation of Registrant's Name into English)
612 Saint-Jacques Street, Montreal, Quebec H3C 4M8
(Address of Principal Executive Office)
Indicate by check mark whether the registrant files or will file annual reports under cover of Form 20-F or Form 40-F
Form 20-F o Form 40-F ý
Indicate by check mark if the registrant is submitting the Form 6-K in paper as permitted by Regulation S-T Rule 101(b)(1):
Note: Regulation S-T Rule 101(b)(1) only permits the submission in paper of a Form 6-K if submitted solely to provide an attached annual report to security holders.
Indicate by check mark if the registrant is submitting the Fork 6-K in paper as permitted by Regulation S-T Rule 101(b)(7):
Note: Regulation S-T Rule 101(b)(7) only permits the submission in paper of a Form 6-K if submitted to furnish a report or other document that the registrant foreign private issuer must furnish and make public under the laws of the jurisdiction in which the registrant is incorporated, domiciled or legally organized (the registrant's "home country"), or under the rules of the home country exchange on which the registrant's securities are traded, as long as the report or other document is not a press release, is not required to be and has not been distributed to the registrant's security holders, and, if discussing a material event, has already been the subject of a Form 6-K submission or other filing on EDGAR.
Indicate by check mark whether the registrant by furnishing the information contained in this form is also thereby furnishing the information to the Commission pursuant to Rule 12g3-2(b) under the Securities Exchange Act of 1934.
Yes o No ý
If "Yes" is marked, indicate below the file number assigned to the registrant in connection with Rule 12g3-2(b): 82- .
QUEBECOR WORLD INC.
Filed in this Form 6-K
Documents index
- Press Release dated February 16, 2006; Financial Highlights
- Management's Discussion and Analysis of Financial Condition and Results of Operations
- Consolidated Financial Statements
2
![]()
February 16, 2006 05/06
For immediate release Page 1 of 8
QUEBECOR WORLD ANNOUNCES
FOURTH QUARTER AND 2005 RESULTS
HIGHLIGHTS
- Revenue was $1.7 billion in fourth quarter and $6.3 billion in 2005
- Non-cash goodwill impairment charge of $243 million or $1.77 per share in fourth quarter related to European operations
- Impairment of assets, restructuring and other charges (IAROC) of $12 million in fourth quarter or $0.08 per share
- Excluding IAROC and goodwill impairment, earnings per share from continuing operations in the fourth quarter were $0.21 compared to $0.59 last year.
- On the same basis, earnings per share in 05 were $0.98 compared to $1.45 in 04
- Capital Expenditures of $394 million in 05 compared to $133 million in 04 due to major retooling program
Montréal, Canada – Quebecor World Inc. (NYSE:IQW, TSX:IQW.SV) announces that for the fourth quarter 2005 the Company reported a net loss of $205 million from continuing operations compared to net income of $46 million in the fourth quarter of last year. On the same basis, loss per share in the fourth quarter was $1.64 compared to diluted earnings per share of $0.27 in 2004. Quebecor World's fourth quarter and 2005 results were negatively impacted by a previously announced non-cash goodwill impairment charge of $243 million, ($232 million after tax, or $1.77 per share), related to the Company's European operations. Consolidated revenues for the quarter were $1.7 billion compared to $1.8 billion last year.
In the fourth quarter 2005, the Company recorded impairment of assets, restructuring and other charges (IAROC) of $12 million or $0.08 per share compared to $48 million or $0.32 per share in the fourth quarter last year. Operating income before IAROC and goodwill impairment in the fourth quarter was $87 million compared to $161 million during the same period last year.
3
For immediate release Page 2 of 8
Earnings per share from continuing operations before IAROC and goodwill impairment were $0.21 compared to $0.59 in the fourth quarter of 2004.
Quebecor World's fourth quarter results were hampered by a lower pricing environment compared to last year, higher energy costs, under performing operations in France and the United Kingdom, the absence of an additional week in the quarter compared to 2004 which negatively impacted revenues in North America by approximately 7%, additional freight costs and inefficiencies related to press start-ups.
"We continue to face a very challenging environment on several fronts which is reflected in our results. Our retooling plan is underway and despite some inefficiencies in the fourth quarter, we expect this equipment to deliver as promised in the medium and long-term as it reaches full-capacity and as we replace previously lost volume," said Pierre Karl Péladeau, President and CEO, Quebecor World Inc. "In the short-term we are taking additional measures to reduce our costs by being more efficient in our energy consumption and through additional restructuring initiatives. The Company is also utilizing its distinct competitive advantages to focus on securing higher margin volume from leading publishers and retailers."
Quebecor World's three-year retooling plan is based on strategically installing state-of-the-art technology across its global platform and decommissioning older less productive equipment to enhance service, reduce costs and improve efficiencies. The previously announced plan calls for an investment of $330 million in North America and $250 million in Europe. The Company's retooling program on two continents is one of the largest ever undertaken in the printing industry and the full effect of these efforts will be realized over time.
Due to the retooling program in North America and Europe, Quebecor World recorded capital expenditures of $394 million in 2005 compared to $133 million in 2004 and generated free cash flow of $119 million in 2005 compared to $319 million in 2004.
As announced in January 2006, the European retooling program includes installing two new gravure presses in Belgium and wide-web offset presses in Austria and Spain as well as additional potential investments in the United Kingdom and France. In February 2006, the Company successfully concluded negotiations with its employees' representatives in the United Kingdom that will quickly bring the cost structure in line with the market. Similar negotiations are progressing more slowly in France. This could be a lengthy process which might negatively impact our performance.
4
For immediate release Page 3 of 8
Full-year 2005
In 2005, net loss was $149 million or $1.43 per share compared to net income of $140 million or $0.77 per share last year. Before IAROC and goodwill impairment, diluted earnings per share in 2005 were $0.98 compared to $1.45 last year. Operating income before IAROC and goodwill impairment was $358 million in 2005 compared to $471 million last year. Consolidated revenue for 2005 were essentially flat at $6.3 billion compared to 2004.
Impairment of assets, restructuring and other charges for 2005 were $94 million compared to $116 million in 2004. Selling General and Administrative expenses were $397 million compared to $432 million last year. Excluding the unfavourable impact of currency translation, SG&A expenses were lower by $42 million compared to the previous year.
Outlook 2006
In 2006, Quebecor World anticipates its operations will continue to be affected by negative pricing pressures and previously announced volume reductions. While the Company has made significant progress in replacing this volume, many of these new agreements only come into force in the later half of 2006 and in 2007. The Company intends to address these challenges by continuing to implement cost containment measures. These measures include retooling plans for North America and Europe, additional restructuring initiatives and decommissioning of older presses resulting in a more efficient manufacturing platform. The Company will also develop projects to help reduce energy consumption. Furthermore, Quebecor World will use its distinct competitive advantages to seek higher margin business. However, as this is a long-term process and as the Company anticipates additional start-up related inefficiencies in upcoming quarters, the full effect of these efforts will be realized over time.
Discontinued Operations
Quebecor World's core printing activities involve the printing of magazines, catalogs, retail inserts, books, directories and direct mail for the world's largest publishers and retailers. As the Company has grown by acquisition certain facilities were included in those transactions that did not relate to these core businesses. Approximately a dozen facilities in North America were involved in the printing of short-run contractual work such as marketing materials, annual reports, travel and fashion brochures. These activities were different from Quebecor World's core businesses and did not benefit from the advantages and synergies of the Company's global platform. The Company completed the sale of these assets in the fourth quarter 2005. Consequently the operating results related to these activities have been presented separately in the Company's consolidated financial results as discontinued operations and comparative figures have been restated to conform to the presentation adopted for t he year-ended December 31, 2005.
5
For immediate release Page 4 of 8
Dividend
The Board of Directors declared a dividend of $0.10 per share on Multiple Voting Shares and Subordinate Voting Shares. The Board also declared a dividend of CDN$0.3845 per share on Series 3 Preferred Shares, CDN$0.421875 per share on Series 4 Preferred Shares and CDN$0.43125 on Series 5 Preferred Shares.
The dividends are payable on March 1st, 2006 to shareholders of record at the close of business February 27, 2006.
Full Financial Information
Management Discussion and Analysis
Please refer to the MD&A for the reconciliation to Canadian generally accepted accounting principles of certain figures used to explain these results. The MD&A can be found on the Company's website at www.quebecorworld.com and through the SEDAR and SEC filings.
Financial statements are available on the Company's website and through the SEDAR and SEC filings.
Sedar web address:www.sedar.com
SEC web address:www.sec.gov
Conference Call
Quebecor World To Webcast Investor Conference Call on February 16, 2006
Quebecor World Inc. will broadcast its fourth quarter and year-end conference call live over the Internet on February 16, 2006 at 4:00 PM (Eastern Time).
The conference call will be webcast live and can be accessed on the Quebecor World web site:
http://www.quebecorworld.com/en/investors/webcasts/Q104http://www.quebecorworldinc.com/main.aspx?id=958&lang=en
6
For immediate release Page 5 of 8
Prior to the call please ensure that you have the appropriate software. The Quebecor World web address listed above has instructions and a direct link to download the necessary software, free of charge.
Anyone unable to attend this conference call may listen to the replay tape by phoning (877) 293-8133 or (403) 266-2079 &150; passcode 305789#, available from February 16, 2006 to March 17, 2006.
Forward looking statements
Except for historical information contained herein, the statements in this release are forward-looking and made pursuant to the safe harbor provisions of the Private Securities Litigation Reform Act of 1995. Forward-looking statements involve known and unknown risks and uncertainties that may cause the Company's actual results in future periods to differ materially from forecasted results. Those risks include, among others, changes in customers' demand for the Company's products, changes in raw material and equipment costs and availability, seasonal changes in customer orders, pricing actions by the Company's competitors, and general changes in economic conditions.
The Company
Quebecor World Inc. (NYSE:IQW, TSX:IQW.SV) is one of the largest commercial printers in the world. It is a market leader in most of its major product categories which include magazines, inserts and circulars, books, catalogs, direct mail, directories, digital pre-media, logistics, mail list technologies and other value added services. Quebecor World has approximately 31,000 employees working in more than 130 printing and related facilities in the United States, Canada, Argentina, Austria, Belgium, Brazil, Chile, Colombia, Finland, France, India, Mexico, Peru, Spain, Sweden, Switzerland and the United Kingdom.
Web address: www.quebecorworld.com - - 30 -
For further Information contact:
Tony Ross |
| Philippe Cloutier |
|
- 30 -
For immediate release Page 6 of 8
QUEBECOR WORLD INC.
FINANCIAL HIGHLIGHTS
Periods ended December 31
(In millions of US dollars, except per share data)
(Unaudited)
| | Three months | Twelve months | ||||||||||||
|---|---|---|---|---|---|---|---|---|---|---|---|---|---|---|
| | 2005 | 2004 | 2005 | 2004 | ||||||||||
| Consolidated Results from Continuing Operations | ||||||||||||||
| Revenues | $ | 1,664.0 | $ | 1,822.7 | $ | 6,283.3 | $ | 6,339.5 | ||||||
| Adjusted EBITDA | 167.9 | 251.9 | 688.7 | 822.2 | ||||||||||
| Adjusted EBIT | 87.3 | 161.4 | 357.5 | 471.1 | ||||||||||
| IAROC | 11.9 | 48.4 | 94.2 | 115.6 | ||||||||||
| Goodwill impairment charge | 243.0 | – | 243.0 | – | ||||||||||
| Operating income (loss) | (167.6 | ) | 113.0 | 20.3 | 355.5 | |||||||||
| Net income (loss) from continuing operations | (205.0 | ) | 46.3 | (148.8 | ) | 139.9 | ||||||||
| Adjusted EBITDA margin* | 10.1 | % | 13.8 | % | 11.0 | % | 13.0 | % | ||||||
| Adjusted EBIT margin* | 5.3 | % | 8.9 | % | 5.7 | % | 7.4 | % | ||||||
| Operating margin* | (10.1 | ) % | 6.2 | % | 0.3 | % | 5.6 | % | ||||||
| Segmented Information from Continuing Operations | ||||||||||||||
| Revenues | ||||||||||||||
| North America | $ | 1,321.7 | $ | 1,387.9 | $ | 4,881.1 | $ | 4,850.3 | ||||||
| Europe | 276.7 | 376.6 | 1,162.9 | 1,297.4 | ||||||||||
| Latin America | 64.5 | 56.2 | 241.7 | 192.4 | ||||||||||
Adjusted EBIT | ||||||||||||||
| North America | $ | 89.2 | $ | 137.1 | $ | 353.5 | $ | 421.4 | ||||||
| Europe | (2.8 | ) | 16.5 | (3.6 | ) | 50.1 | ||||||||
| Latin America | 3.7 | (1.8 | ) | 13.0 | 1.3 | |||||||||
Ajusted EBIT margin | ||||||||||||||
| North America | 6.8 | % | 9.9 | % | 7.2 | % | 8.7 | % | ||||||
| Europe | (1.0 | ) % | 4.4 | % | (0.3 | ) % | 3.9 | % | ||||||
| Latin America | 5.7 | % | (3.2 | ) % | 5.4 | % | 0.7 | % | ||||||
Financial Position | ||||||||||||||
| Cash provided by operating activities | $ | 278.3 | $ | 380.9 | $ | 469.5 | $ | 487.8 | ||||||
| Free cash flow** | $ | 158.2 | $ | 337.7 | $ | 119.2 | 319.4 | |||||||
| Working capital | $ | (58.9 | ) | $ | (35.3 | ) | ||||||||
| Total assets | $ | 5,705.6 | 6,273.8 | |||||||||||
| Long-term debt (including convertible notes) | $ | 1,855.1 | $ | 1,950.1 | ||||||||||
| Shareholder's equity | $ | 2,250.6 | $ | 2,612.6 | ||||||||||
| Debt-to-capitalization | 45:55 | 43:57 | ||||||||||||
| Debt-to-Adjusted-EBITDA ratio (times)*** | 2.7 | 2.4 | ||||||||||||
| Interest coverage ratio (times)*** | 5.8 | 6.3 | ||||||||||||
Per Share Data | ||||||||||||||
| Earnings (loss) from continuing operations | ||||||||||||||
| Diluted | $ | (1.64 | ) | $ | 0.27 | $ | (1.43 | ) | $ | 0.77 | ||||
| Adjusted Diluted | $ | 0.21 | $ | 0.59 | $ | 0.98 | $ | 1.45 | ||||||
| Dividends on equity shares | $ | 0.14 | $ | 0.13 | $ | 0.56 | $ | 0.52 | ||||||
| Book value | $ | 13.69 | $ | 16.26 | ||||||||||
IAROC: Impairment of assets, restructuring and other charges.
Adjusted: Defined as before IAROC and before goodwill impairment charge.
Debt-to-Adjusted-EBITDA ratio: Total debt divided by Adjusted EBITDA.
Interest coverage ratio: Adjusted EBITDA divided by financial expenses.
- *
- Margins calculated on revenues.
- **
- Cash provided by operating activities, less capital expenditures and preferred share dividends, net of proceeds from disposals of assets and proceeds from business disposals.
- ***
- For continuing operations.
7
For immediate release Page 7 of 8
APPENDIX — SEGMENTED RESULTS
North America
In the fourth quarter, revenues from North American operations were down 5% to $1.32 billion from to $1.39 billion in 2004. Year-to-date revenues were $4.88 billion compared to $4.85 billion last year. Operating income in the fourth quarter before impairment of assets, restructuring and other charges was $89.2 million compared to $137.1 million and operating margin on the same basis was 6.8% compared to 9.9%. In the fourth quarter, the lack of an additional week compared to 2004, negative price pressures, higher energy costs and certain inefficiencies related to new press installations led to lower revenues and operating margins.
Magazine/Direct
In the Magazine segment volume was down (9% for the quarter and 5% for 2005) due to the lack of an additional week compared to 2004 and reduced volume from an important customers. During the year the magazine segment continued to secure market share by reaching new agreements with Time Inc., Primedia, Wenner Media and Morris Communications. In the Direct Mail segment volume decreased 6% in the quarter and 1% for the year, essentially due to the absence of the 53rd week.
Retail/Catalog
In the Retail group, volume remained stable for the quarter and increased 5% for the year. Revenues in the quarter decreased 3% and increased 5% for the year essentially due to increased paper sale. The increased volume for the year is related to additional volume from exiting customers and the addition of an offset printing facility in Pittsburg, California. In the Catalog segment volume decreased 6% in the quarter and 1% for the full-year due to the lack of the 53rd week. The catalog group is continued to secure market share by extending contracts and winning new customers such as Bass Pro Shops and School Specialty. As part of the North American investment plan, a new 64-page press became operational in the catalog platform in the fourth quarter.
Book/Directory
In the Book and Directory group, revenues were down 13% compared to fourth quarter 2004 and 5% for the full-year. Revenue decreases are in part due to a volume decrease of 6% in the Book group and a 16% in the Directory group in the fourth quarter and 3% and 7% respectively for the full-year. The volume decrease in the directory group is due to the loss of one customer from the fourth quarter 2005 and the change in format of another one.
8
For immediate release page 8 of 8
Canada
In Canada, volume decreased 7% from the fourth quarter and 1% for the year. The decrease in magazine volume was partially offset by an increase in catalog and retail volume. Revenues for our Canadian segment decreased 3% compared to the fourth quarter of 2004 (including the favourable impact of currency translation and paper sales).
Europe
In Europe, revenues in the fourth quarter were down 27% to $277 million compared to $376 million in the fourth quarter of 2004. Excluding the positive impact of currency translation, revenues for the quarter were down 16% and 9% for the full year. Volume in Europe decreased 23% in the fourth quarter and 13% for the year. The decrease was largely due the continued impact of the loss of a major customer at our Corby, UK, facility, where some lost volume has been replaced at lower margins. France also reported negative operating results for the fourth quarter as a result of decreased volumes, workforce inefficiencies and lower pricing. Excluding the effect of currency translation, Selling, General & Administrative costs in our European segment decreased in the fourth quarter over the previous year. Operating income and margins increased on a year-to-date basis in Spain and Austria.
Latin America
In Latin America, revenues in the fourth quarter increased 15% to $65 million compared to $56 million in the same period last year. Excluding the positive impact of currency translation and paper sales, revenues in the quarter increased 6%. Volume in the quarter increased 3% compared to the same period last year, explained by increased directory volume in our Brazilian and Mexican facilities. Operating income and margin increased in the fourth quarter and full year as a result of cost saving initiatives, as well as improved pricing in the Argentinean market due to economic recovery.
The Latin American operations are continuing to benefit from an earlier initiative that positioned these assets as a low-cost alternative to publishers who are having products produced in Asia. This initiative is attracting increased interest and sales from North American and European publishers.
9
MANAGEMENT'S DISCUSSION AND ANALYSIS
The following is a discussion of the consolidated financial condition and results of operations of Quebecor World Inc. (the "Company") for the years ended December 31, 2005 and 2004, and it should be read together with the Company's consolidated financial statements. The annual consolidated financial statements and Management's Discussion and Analysis have been reviewed by the Company's Audit Committee and approved by its Board of Directors. This discussion contains forward-looking information that is qualified by reference to, and should be read together with, the discussion regarding forward-looking statements that is part of this document. Management determines whether or not information is "material" based on whether it believes a reasonable investor's decision to buy, sell or hold securities in the Company would likely be influenced or changed if the information were omitted or misstated.
FORWARD-LOOKING STATEMENTS
Except for historical information contained herein, the statements in this document are forward-looking and made pursuant to the safe harbor provisions of the Private Securities Litigation Reform Act of 1995. Forward-looking statements involve known and unknown risks and uncertainties, which may cause actual results in future periods to differ materially from forecasted results. Those risks include, among others, changes in customer demand for print services, changes in raw material and equipment costs and availability, seasonal changes in customer orders, pricing actions by competitors and general changes in economic conditions.
OVERVIEW
BUSINESS PROFILE
Quebecor World Inc. is one of the largest commercial print media services companies in the world. Quebecor World is a market leader in the product categories and geographies it serves. This market-leading position has been built through a combination of integrating acquisitions, investing in key strategic technologies and a commitment to building long-term partnerships with the world's leading print media customers.
Quebecor World has facilities in the United States, Canada, Argentina, Austria, Belgium, Brazil, Chile, Colombia, Finland, France, India, Mexico, Peru, Spain, Sweden, Switzerland and the United Kingdom.
The Company offers its customers a broad range of print services, such as magazines, retail inserts, catalogs, books, directories, direct mail, logistics, premedia and other value-added services.
The Company operates in the commercial print media segment of the printing industry and its business groups are located in three geographical regions: North America, which has historically represented approximately 80% of the Company's revenues, Europe and Latin America.
INDUSTRY PROFILE
Operations in this segment of the print industry are seasonal with a greater part of volume being realized in the second half of the fiscal year, primarily due to the higher number of magazine pages, new product launches and back-to-school, retail and holiday catalog promotions.
Consolidation of the printing industry is ongoing because of global overcapacity, which has led to negative price pressures. The disappearance of smaller plants creates the opportunity for larger plants to continue to grow and deploy more efficient equipment. Global capacity is also affected by the emergence of Asian competitors in particular in the Book segment where the timing of deliveries is less of an issue. In response to this competition, the Company offers its clients the Latin American platform as a low-cost alternative. Overall, global overcapacity will remain an issue and will likely continue to impact prices in most segments.
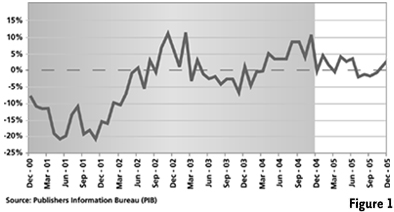
The primary drivers affecting the Company are consumer confidence and economic growth rates. These are key drivers of demand for commercial print media because they affect the level of advertising and merchandising activity. The Company uses magazine advertising pages as an important indicator of demand for printing products and services. This indicator, as measured in the United States by the Publishers Information Bureau, showed some positive signs throughout 2004, but was uneven through most of 2005 (Figure 1).
STRATEGY
The Company's objective is to be the preferred low-cost provider of print services. As part of this goal, the Company has adopted the following related strategies.
The Company intends to use technology to improve efficiency and reduce costs. As is the case with other manufacturing industries, technology in the printing industry is constantly evolving and it will continue to play an important role in improving Quebecor World's manufacturing platform. The Company is focused on improving speeds, reducing manning, lowering downtime and paper waste and reducing make-ready times.
The Company also intends to continue to reduce its fixed cost base and increase its efficiency. The Company has identified two key success factors — manufacturing and administrative efficiency — and addresses them on a continual basis. In recent years, the Company has undertaken restructuring initiatives that resulted in consolidating smaller facilities into larger groups of operations, grouping similar types of assets into larger facilities using available space and optimizing all aspects of pressroom efficiencies. The Company has also reviewed and streamlined its administrative structure. These measures are ongoing and are expected to continue through 2006. Although these restructuring initiatives have generated several positive effects, in the current challenging environment, these positive effects did not translate into increases in operating income because of continuing price reductions, rising energy costs and the underperformance of the French and British operations.
U.S. Magazine Advertising Pages 2001-2005 (Monthly)
% Change Year-over-Year
10
2005 AT A GLANCE
2005 was a year in which Quebecor World faced significant challenges and issues as the Company continued through a transitional period that is needed to achieve its objectives. The Company has also set forth several initiatives that it believes are crucial as it implements its retooling strategy to further improve efficiency, customer service and productivity.
In 2004, the Company approved a $330 million investment plan calling for newer, wider and more efficient presses for its North American platform. The implementation of this plan began in the second half of 2005 with the installation of the first five presses. In 2006, the Company intends to install ten additional presses. The deployment of such an extensive plan cannot be accomplished without experiencing certain temporary inefficiencies. Some of these inefficiencies, primarily related to the installation of new presses and the decommissioning of less productive ones, were encountered in the fourth quarter of 2005, negatively affecting operating income. The Company anticipates that it will continue to experience certain inefficiencies in upcoming quarters as more presses come online. The Company has set up a dedicated task force whose primary objective is to mitigate costs related to the plan.
On January 18, 2006, the Company announced the completion of a strategic review of its operations in Europe and announced a capital investment program that it believes will improve the platform's competitive position, lower its cost base and provide better service to customers. The program provides for investments up to $250 million, of which $87 million were disbursed in 2005, and involves the purchase of new state-of-the-art technology to be installed in facilities in Belgium, Spain, Austria as well as additional potential investments in the United Kingdom and France. The Company also successfully completed labor negotiations in February 2006 with its employee representatives in the United Kingdom that will quickly bring the facility in line with the market. Finally, similar negotiations are progressing more slowly in France. This could be a lengthy process which might negatively impact the Company's performance. The Company intends to install four presses in Europe in 2006.
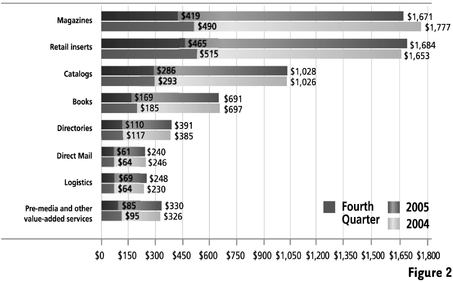
Revenue by Print Service — Worldwide ($ millions)
For the quarter and the year ended December 31
(Continuing Operations)
In addition, the Company disposed of its non-core printing group as discussed in the "Discontinued Operations" section hereafter as well as certain smaller operations in France and North America.
The current charge for impairment of long-lived assets, restructuring and other charges reflects smaller initiatives undertaken in 2005 and definite plans to eliminate inefficient and idle equipment. As such, a detailed review of activities took place in 2005 at the facility in Corby, United Kingdom. This resulted in the implementation of the first two phases of a workforce reduction plan as well as an impairment charge on long-lived assets as discussed in the "Impairment of Assets and Restructuring Initiatives" section.
On October 21, 2005, the Company communicated its financial outlook for 2005. Management estimated at that time that earnings per share for the remainder of 2005 would be lower than 2004 and below market expectations. The actual results for the second half of 2005 are below those of the corresponding period in 2004. These results principally reflect the challenging market conditions the Company has faced as well as the temporary inefficiencies related to the installation of new presses as previously discussed.
OUTLOOK 2006
In 2006, Quebecor World anticipates its operations will continue to be affected by negative pricing pressures and previously announced volume reductions. While the Company has made significant progress in replacing this volume, many of these new agreements only come into force in the later half of 2006 and in 2007. The Company intends to address these challenges by continuing to implement cost containment measures. These measures include retooling plans for North America and Europe, additional restructuring initiatives and decommissioning of older presses resulting in a more efficient manufacturing platform. The Company will also develop projects to help reduce energy consumption. Furthermore, Quebecor World will use its distinct competitive advantages to seek higher margin business. However, as this is a long-term process and as the Company anticipates additional start-up related inefficiencies in upcoming quarters, the full effec t of these efforts will be realized over time.
PRESENTATION OF FINANCIAL INFORMATION
Financial data have been prepared in conformity with Canadian generally accepted accounting principles ("Canadian GAAP"). However, certain measures used in this discussion and analysis do not have any standardized meaning under Canadian GAAP. When used, these measures are defined in such terms as to allow the reconciliation to the closest Canadian GAAP measure. Numerical reconciliations are provided in figures 7 and 8. It is unlikely that these measures could be compared to similar measures presented by other companies.
The Company's functional currency is the Canadian dollar and its reporting currency is the U.S. dollar.
The Company's annual reporting period usually lasts 52 weeks. Every five or six years, the annual reporting period lasts 53 weeks, as was the case in 2004. The additional week had an impact on the comparison of the 2005 results with those from 2004 as well as the comparison of 2004 with 2003. The estimated impact on revenues and operating income is $(130) million and $(12) million, respectively, for the fourth quarter of 2005 compared to the same period in 2004. The estimated impact on revenues and operating income is $88 million and $5 million, respectively, for the fourth quarter of 2004 compared to the same period in 2003. The comparative impact varies from one year to the next because of the timing differences related to the beginning and closing of accounting periods, which vary year-over-year.
11
Impact of Foreign Currency ($ millions)
| | Periods ended December 31, 2005 | |||||
|---|---|---|---|---|---|---|
| | Three months | Twelve months | ||||
| Foreign currency favorable (unfavorable) impact on revenues | $ | (10.8 | ) | $ | 78.8 | |
| Foreign currency favorable impact on operating income | $ | 0.7 | $ | 3.3 | ||
Figure 3
DISCONTINUED OPERATIONS
Over the years, Quebecor World has strived to build a global printing platform that allows publishers and retailers to print in multiple plants, in various countries, reducing lead-time and distribution costs. The Company's core print services, mainly the printing of magazines, catalogs, retail inserts, books, directories and direct mail, benefit from this platform.
However, as the Company grew through acquisitions, certain facilities were included in these transactions that do not concentrate on Quebecor World's core print services. As a result, there were approximately a dozen facilities in North America whose primary activities were non-core general commercial printing. These activities consist primarily of short-run, non-contractual work such as annual reports, marketing materials, travel, fashion and automobile brochures and packaging. This market is highly competitive and fragmented with many small local and regional players. Unlike Quebecor World's previously described core business, these activities do not benefit from the advantages and synergies of the Company's global platform. As a result, on May 10, 2005, the Company announced a plan to sell its group of non-core printing facilities in North America (the "non-core Group").
In the second half of 2005, the Company completed the disposal of all business units of its non-core Group in five separate transactions. These disposals are further discussed in the "Financial Condition, Liquidity and Capital Resources" section. Consequently, the operating results related to these activities have been presented separately in the Company's consolidated financial statements as discontinued operations and comparative figures have been restated to conform to the presentation adopted in 2005 as shown in Note 7 to the Consolidated Financial Statements.
The results of the non-core Group were significantly impacted in 2005 by a $3 million gain ($12 million loss, net of taxes) on the various disposals of units as well as specific charges related to these facilities and pension curtailment costs.
FINANCIAL REVIEW
The Company assesses performance based on operating income before impairment of assets, restructuring and other charges, and goodwill impairment charge ("Adjusted EBIT", Figures 7 and 8). The following operating analyses are before impairment of assets, restructuring and other charges, and goodwill impairment charge, except where otherwise indicated. The review focusses only on continuing operations.
On January 18, 2006, the Company announced the completion of its annual goodwill impairment test. The European reporting unit suffered from poor market conditions throughout 2005, namely continued price erosion and decreased volumes, as well as several production inefficiencies and the loss of an important client. As a result, the Company concluded that the carrying amount of goodwill for the European reporting unit was not fully recoverable and a pre-tax impairment charge of $243 million was taken at December 31, 2005.
FOURTH QUARTER 2005
Overall, results deteriorated in the fourth quarter of 2005 compared to 2004. The Company suffered from pricing pressures, production inefficiencies related to the start-up of presses in the North American platform and rising energy costs. It should be noted however that the results for the fourth quarter of 2004 included fourteen weeks whereas the corresponding quarter in 2005 includes only thirteen.
The Company's consolidated revenues for the fourth quarter were $1,664 million, a 9% decrease when compared to $1,823 million for the same period in 2004. Excluding the unfavorable impact of currency translation (Figure 3), revenues were down 8% due mainly to decrease in volumes and continued price pressures in North America and Europe. Excluding the negative impact of the additional week in 2004, volume increased in the fourth quarter of 2005 for the North American segment in general.
In the fourth quarter of 2005, Adjusted EBIT decreased by 46% to $87 million compared to $161 million in 2004. Operating margin, on the same basis, was 5.3% down from 8.9% in 2004.
Paper sales, excluding the effect of currency translation, decreased by 3% in the fourth quarter of 2005, compared to the same period in 2004. The decrease for the quarter is mainly due to a decrease in paper sales to customers. Although the variance in paper sales has an impact on revenues, it has little or no impact on operating income because the cost is generally passed on to the customer. Most of the Company's long-term contracts with its customers include price-adjustment clauses based on the cost of materials in order to minimize the effects of fluctuation in the price of paper.
Cost of sales for the fourth quarter of 2005 decreased by 4% compared to last year, mostly explained by a decrease in sales volume and a decrease in labor costs. Gross profit margin was 16.3% in the fourth quarter of 2005 compared to 20.0% in 2004. Excluding the favorable impact of currency translation, gross profit margin for the quarter decreased to 16.2% compared to 20.0% last year.
Selling, general and administrative expenses were $103 million compared with $114 million in 2004, a decrease of $11 million. Currency fluctuations did not have a material impact on selling, general and administrative expenses in the fourth quarter of 2005. The savings were mostly explained by workforce reduction, which contributed to the decrease in salaries and benefits. A reduction in bonuses and stock option expenses also contributed to the variance.
12
Depreciation and amortization was $73 million compared with $83 million in 2004. Excluding the impact of currency translation, depreciation and amortization decreased by 11% for the fourth quarter of 2005. The expense decreased compared to 2004 as a result of impairment charges on long-lived assets booked in 2005 and 2004.
Securitization fees totaled $8 million for the fourth quarter of 2005 compared to $6 million for the same period in 2004. The increase for the fourth quarter of 2005 was mainly due to higher market interest rates underlying the program fees. Servicing revenues and expenses did not have a significant impact on the Company's results.
During the fourth quarter, the Company continued its restructuring initiatives and recorded an impairment of long-lived assets, restructuring and other charges of $12 million, which included the workforce reduction in North America and Europe and the continuation of prior initiatives. These measures are described in the section "Impairment of Assets and Restructuring Initiatives".
Financial expenses were $28 million in the fourth quarter of 2005, compared to $31 million in 2004. The variance of $3 million was mainly explained by an increase of interest capitalized to the cost of equipment, and foreign exchange gain partly offset by losses on derivative instruments.
Income taxes were $10 million in the fourth quarter of 2005 compared to $35 million in 2004. Income taxes before impairment of assets, restructuring and other charges, and goodwill impairment charge, were $22 million in the fourth quarter of 2005 compared to $40 million in 2004. The decrease in income taxes was due to a decrease in profits before taxes in countries with a higher overall tax rate.
For the fourth quarter ended December 31, 2005, the Company reported a loss per share of $1.64 compared to diluted earnings per share of $0.27 in 2004. These results incorporated impairment of assets, restructuring and other charges, and a goodwill impairment charge of $255 million ($243 million net of taxes) or $1.85 per share compared with $48 million ($44 million net of taxes) or $0.32 per share in 2004. Excluding the effect of impairment of assets, restructuring and other charges and goodwill impairment charge, the fourth quarter of 2005 resulted in diluted earnings per share of $0.21 compared with $0.59 in the same period of 2004.
YEAR 2005
The Company's consolidated revenues for 2005 were $6,283 million, a 1% decrease when compared to $6,340 million in 2004. Excluding the favorable impact of currency translation (Figure 3) revenues were down 2% due to a decrease in volume and continued pressure on prices in North America and Europe.
Paper sales, excluding the effect of currency translation, increased by 5% in 2005 when compared to the same period in 2004. The increase is mainly due to the increase in paper sales to customers and the increase in paper prices compared to 2004.
In 2005, Adjusted EBIT decreased by 24% to $358 million compared to $471 million in 2004. Operating margin, on the same basis, decreased to 5.7% from 7.4% in 2004. The significant decreases in both operating income and margin are due mainly to the decrease in volume and price pressures that were partially offset by cost containment initiatives and headcount reduction.
Cost of sales in 2005 increased by 2% compared to last year, mostly explained by an increase in paper sales, as described above and an increase in utilities costs during the year that were partly offset by a reduction in labor costs as a result of cost containment initiatives. Gross profit margin was 17.2% in 2005 compared to 19.6% in 2004. Excluding the unfavorable impact of currency translation, gross profit margin for the year was 17.2% compared to 19.6% last year.
Selected Annual Information (Continuing Operations)
($ millions, except per share data)
| | Years ended December 31(1) | ||||||||||
|---|---|---|---|---|---|---|---|---|---|---|---|
| | 2005 | 2004 | 2003 | ||||||||
| Consolidated Results | |||||||||||
| Revenues | $ | 6,283.3 | $ | 6,339.5 | $ | 6,048.1 | |||||
| Adjusted EBITDA | 688.7 | 822.2 | 654.8 | ||||||||
| Adjusted EBIT | 357.5 | 471.1 | 306.4 | ||||||||
| IAROC | 94.2 | 115.6 | 94.5 | ||||||||
| Goodwill impairment charge | 243.0 | — | — | ||||||||
| Operating income | 20.3 | 355.5 | 211.9 | ||||||||
| Net income (loss) from continuing operations | (148.8 | ) | 139.9 | (32.7 | ) | ||||||
| Net income (loss) | (162.6 | ) | 143.7 | (31.4 | ) | ||||||
Financial Position | |||||||||||
| Total assets | 5,705.6 | 6,273.8 | 6,256.9 | ||||||||
| Total long-term debt and convertible notes | 1,855.1 | 1,950.1 | 2,009.0 | ||||||||
Per Share Data | |||||||||||
| Earnings (loss) | |||||||||||
| Basic and Diluted | (1.43 | ) | 0.77 | (0.51 | ) | ||||||
| Adjusted diluted | 0.98 | 1.45 | 0.00 | ||||||||
| Dividends on preferred shares | 1.33 | 1.26 | 1.17 | ||||||||
| Dividends on equity shares | 0.56 | 0.52 | 0.52 | ||||||||
Figure 4
| IAROC: Impairment of assets, restructuring and other charges. | ||
| Adjusted: Defined as before IAROC and before goodwill impairment charge. | ||
| (1) Annual information for 2004 consisted of 53 weeks whereas information for 2003 and 2005 consisted of 52 weeks. |
13
Selling, general and administrative expenses were $397 million compared to $432 million in 2004, a decrease of $35 million. Excluding the unfavorable impact of currency translation of $7 million, selling, general and administrative expenses were favorable by $42 million in 2005, compared to last year. The savings were explained by workforce reductions, which contributed to the decrease in salaries and benefits. A reduction in bonuses, stock options as well as travel and entertainment expenses also contributed to the variance.
Securitization fees totaled $24 million compared to $15 million in 2004. The increase was mainly due to high market interest rates underlying the program fees. Servicing revenues and expenses did not have a significant impact on the Company's results.
Depreciation and amortization was $304 million in 2005 and $325 million in 2004. Excluding the impact of currency translation, depreciation and amortization decreased by 7% in 2005 as compared to 2004, as a result of impairment charges, on long-lived assets booked in 2005 and 2004.
The Company continued its restructuring initiatives in 2005 and recorded a net restructuring charge of $94 million, which reflected closure of facilities in North America and Europe, further workforce reductions, and additional impairment of assets in Europe. These measures are described in the section "Impairment of Assets and Restructuring Initiatives".
Financial expenses were $119 million in 2005, compared to $133 million in 2004. Two elements lowered the 2005 financial expenses: a lower average debt combined with the increase in interest capitalized to the cost of equipment.
Income taxes were $50 million in the year 2005 compared to $77 million in 2004. Income taxes before impairment of assets, restructuring and other charges and goodwill impairment charge were $70 million in 2005 compared to $102 million in 2004. The decrease is mostly explained by a decrease in profits before tax in countries with higher overall tax rates.
For the year ended December 31, 2005, the Company reported a loss per share of $1.43 compared to diluted earnings per share of $0.77 in 2004. These results include impairment of assets, restructuring and other charges and a goodwill impairment charge of $337 million ($318 million net of taxes) or $2.41 per share compared with $116 million ($91 million net of taxes) or $0.68 per share in 2004. Excluding the effect of impairment of assets, restructuring and other charges, and goodwill impairment charge, 2005 diluted earnings per share were $0.98 compared with $1.45 in 2004.
YEAR 2004
The Company's consolidated revenues for 2004 were $6,340 million, a 5% increase when compared to $6,048 million in 2003. Excluding the favorable impact of currency translation and the additional week in 2004, revenues were essentially flat compared to 2003.
On a full year basis, the Company incurred specific charges that reduced operating income by $15 million for various items including provisions for leases, favorable legal claim settlements, and workers' compensation claims related to closed plants, mainly in North America. In 2003, the Company incurred specific charges that reduced operating income by $74 million, of which $54 million was related to North America, $8 million to Latin America, $6 million to Europe and the balance to other provisions.
Segmented Results of Continuing Operations ($ millions)
Selected Performance Indicators
| | North America | Europe | Latin America | Inter-Segment and Others | Total | ||||||||||||||||||||||||||
|---|---|---|---|---|---|---|---|---|---|---|---|---|---|---|---|---|---|---|---|---|---|---|---|---|---|---|---|---|---|---|---|
| | 2005 | 2004 | 2005 | 2004 | 2005 | 2004 | 2005 | 2004 | 2005 | 2004 | |||||||||||||||||||||
| Three months ended December 31 | |||||||||||||||||||||||||||||||
| Revenues | $ | 1,321.7 | $ | 1,387.9 | $ | 276.7 | $ | 376.6 | $ | 64.5 | $ | 56.2 | $ | 1.1 | $ | 2.0 | $ | 1,664.0 | $ | 1,822.7 | |||||||||||
| Adjusted EBITDA | 153.6 | 205.8 | 10.3 | 35.5 | 6.5 | 0.9 | (2.5 | ) | 9.7 | 167.9 | 251.9 | ||||||||||||||||||||
| Adjusted EBIT | 89.2 | 137.1 | (2.8 | ) | 16.5 | 3.7 | (1.8 | ) | (2.8 | ) | 9.6 | 87.3 | 161.4 | ||||||||||||||||||
| IAROC | 2.9 | 11.7 | 9.0 | 31.6 | — | 4.6 | — | 0.5 | 11.9 | 48.4 | |||||||||||||||||||||
| Goodwill impairment charge | — | — | 243.0 | — | — | — | — | — | 243.0 | — | |||||||||||||||||||||
| Operating income (loss) | 86.3 | 125.4 | (254.8 | ) | (15.1 | ) | 3.7 | (6.4 | ) | (2.8 | ) | 9.1 | (167.6 | ) | 113.0 | ||||||||||||||||
| Adjusted EBITDA margin | 11.6 | % | 14.8 | % | 3.7 | % | 9.4 | % | 10.0 | % | 1.7 | % | 10.1 | % | 13.8 | % | |||||||||||||||
| Adjusted EBIT margin | 6.8 | % | 9.9 | % | (1.0 | )% | 4.4 | % | 5.7 | % | (3.2 | )% | 5.3 | % | 8.9 | % | |||||||||||||||
| Operating margin | 6.5 | % | 9.0 | % | (92.1 | )% | (4.0 | )% | 5.7 | % | (11.4 | )% | (10.1 | )% | 6.2 | % | |||||||||||||||
| Capital expenditures(1) | $ | 111.5 | $ | 24.1 | $ | 63.8 | $ | 7.2 | $ | 1.8 | $ | 0.5 | $ | — | $ | — | $ | 177.1 | $ | 31.8 | |||||||||||
| Change in non-cash balances related to operations, cash flow (outflow)(1) | 210.0 | 121.4 | (0.9 | ) | 42.4 | 1.0 | 12.6 | (16.4 | ) | (3.3 | ) | 193.7 | 173.1 | ||||||||||||||||||
Years ended December 31 | |||||||||||||||||||||||||||||||
| Revenues | $ | 4,881.1 | $ | 4,850.3 | $ | 1,162.9 | $ | 1,297.4 | $ | 241.7 | $ | 192.4 | $ | (2.4 | ) | $ | (0.6 | ) | $ | 6,283.3 | $ | 6,339.5 | |||||||||
| Adjusted EBITDA | 615.7 | 690.0 | 53.5 | 120.5 | 23.9 | 12.3 | (4.4 | ) | (0.6 | ) | 688.7 | 822.2 | |||||||||||||||||||
| Adjusted EBIT | 353.5 | 421.4 | (3.6 | ) | 50.1 | 13.0 | 1.3 | (5.4 | ) | (1.7 | ) | 357.5 | 471.1 | ||||||||||||||||||
| IAROC | 22.6 | 68.3 | 70.9 | 40.6 | 0.7 | 5.7 | — | 1.0 | 94.2 | 115.6 | |||||||||||||||||||||
| Goodwill impairment charge | — | — | 243.0 | — | — | — | — | — | 243.0 | — | |||||||||||||||||||||
| Operating income (loss) | 330.9 | 353.1 | (317.5 | ) | 9.5 | 12.3 | (4.4 | ) | (5.4 | ) | (2.7 | ) | 20.3 | 355.5 | |||||||||||||||||
| Adjusted EBITDA margin | 12.6 | % | 14.2 | % | 4.6 | % | 9.3 | % | 9.9 | % | 6.4 | % | 11.0 | % | 13.0 | % | |||||||||||||||
| Adjusted EBIT margin | 7.2 | % | 8.7 | % | (0.3 | )% | 3.9 | % | 5.4 | % | 0.7 | % | 5.7 | % | 7.4 | % | |||||||||||||||
| Operating margin | 6.8 | % | 7.3 | % | (27.3 | )% | 0.7 | % | 5.1 | % | (2.3 | )% | 0.3 | % | 5.6 | % | |||||||||||||||
| Capital expenditures(1) | $ | 286.4 | $ | 106.5 | $ | 103.3 | $ | 22.2 | $ | 4.1 | $ | 3.8 | $ | 0.2 | $ | 0.1 | $ | 394.0 | $ | 132.6 | |||||||||||
| Change in non-cash balances related to operations, cash flow (outflow)(1) | 88.9 | (202.0 | ) | (29.1 | ) | 1.1 | (18.0 | ) | 18.0 | (27.5 | ) | 23.6 | 14.3 | (159.3 | ) | ||||||||||||||||
Figure 5
| IAROC: Impairment of assets, restructuring and other charges. Adjusted: Defined as before IAROC and before goodwill impairment charge. (1) Including both continued and discontinued operations. |
14
In 2004, Adjusted EBIT increased by 54% to $471 million compared to $306 million in 2003. Operating margin, on the same basis, increased to 7.4% from 5.1% in 2003. The significant increases in both operating income and margin are due mainly to the increase in volume, cost containment initiatives and headcount reduction, partially offset by price pressures.
Cost of sales for the full year of 2004 increased by 4% compared to last year, mostly explained by the additional week in 2004. Gross profit margin was 19.6% in 2004 compared to 18.8% in 2003. The 2004 and 2003 cost of sales included specific charges of $5 million and $36 million, respectively. Excluding these specific charges as well as the unfavorable impact of currency translation, gross profit margin for the year was 19.7% compared to 19.4% last year. Despite an increase in sales volume across the platform in 2004, labor decreased by $6 million. Gains on other materials and higher paper prices on scrap paper sales contributed to a reduction in cost of materials by approximately $48 million. These elements were partly offset by operational inefficiencies in certain plants, mainly those involved with installation and transfer of equipment, in the third quarter. Excluding the negative impact of currency translation, these items contributed to improve the gross profit margin for 2004.
Selling, general and administrative expenses were $432 million compared with $494 million in 2003, a decrease of $62 million. Excluding the specific charges of $9 million in 2004 and $38 million in 2003, as well as the unfavorable impact of currency translation of $15 million, selling, general and administrative expenses were favorable by $48 million in 2004, compared to last year. On a year-to-date basis, the savings were explained by workforce reductions which contributed to the decrease in salaries and benefits as well as travel and entertainment expenses.
For the year ended December 31, 2004, securitization fees were $15 million compared to $14 million in 2003. Servicing revenues and expenses did not have a significant impact on our results.
Depreciation and amortization were $325 million in both 2004 and 2003. Excluding the impact of currency translation, depreciation and amortization decreased by 3% in 2004 as compared to 2003.
The Company continued its restructuring initiatives in 2004 and recorded a net restructuring charge of $116 million, which reflected closure of facilities in North America and Europe, further workforce reductions, and additional impairment of assets across the platform. These measures are described in the section "Impairment of Assets and Restructuring Initiatives".
Financial expenses were $133 million in 2004, compared to $205 million in 2003. Two non-recurring events affected the 2003 financial expenses. First, the Company redeemed the 8.375% Senior Notes and repurchased 89.6% of the 7.75% Senior Notes which resulted in a $30 million charge on extinguishment of long-term debt in 2003. Furthermore, the financial expenses for 2003 included a $5 million exchange loss on the currency translation adjustment due to the reduction of a net investment in Latin America. Excluding these two events, financial expenses were down by $37 million in 2004 compared to 2003. Part of the decrease is a direct effect of the above-mentioned repurchase and redemption of Senior Notes. A lower average debt mainly explained the rest of the reduction in 2004 combined with reduced losses on foreign exchange compared with 2003.
Income taxes were $77 million in 2004 compared to $37 million in 2003. Income taxes before impairment of assets, restructuring and other charges were $102 million in 2004 compared to $63 million in 2003. The 2003 income taxes before impairment of assets, restructuring and other charges included two non-recurring items which occurred in 2003; an unfavorable adjustment of the average tax rate applied on cumulative temporary differences within different states in the United States for $28 million and an additional charge of $25 million reflecting the Company's revised expectation of tax asset recovery and liabilities from prior years. When excluding these items, income taxes before impairment of assets, restructuring and other charges increased in the year 2004. The increase in income taxes was due to an increase in profits before taxes in countries with a higher overall tax rate and as a result of valuation allowances recorded on certain tax assets.
For the year ended December 31, 2004, the Company reported a diluted earnings per share of $0.77 compared to a loss per share of $0.51 in 2003. These results incorporated impairment of assets, restructuring and other charges of $116 million ($91 million net of taxes) or $ 0.68 per share compared with $94 million ($69 million net of taxes) or $0.51 per share in 2003. Excluding the effect of impairment of assets, restructuring and other charges, 2004 diluted earnings per share were $1.45 compared to nil in 2003.
In 2003, a series of non-recurring items, such as a $30 million charge on extinguishment of long-term debt, a $5 million loss from currency translation adjustment and the combined effect on the income tax expense of the items described above ($53 million), reduced earnings per share by $0.56.
SEGMENT REVIEW
The following is a review of activities by segment. The operating analysis is before impairment of assets, restructuring and other charges, and before goodwill impairment charge. Also, the review focuses only on continuing operations.
NORTH AMERICA
North American revenues for the fourth quarter of 2005 were $1,322 million, down 5% from $1,388 million in 2004. On a full year basis, revenues increased 1% to $4,881 million in 2005 from $4,850 million in 2004. Excluding the effect of currency translation and the impact of paper sales, revenues decreased by 5% in the fourth quarter and 2% on a year-to-date basis compared to 2004. As mentioned in the "Overview" section, the additional week in 2004 had an impact on comparative figures. This impact is reflected most significantly in the results of the North American segment and explained a portion of the decrease in revenues, operating income and volume in all business groups. Although the extra week impacted the entire North American platform in the fourth quarter, if its effects are discounted, the Catalog, Retail, Direct, Book and Canada groups would have registered volume increases.
Operating income and margin decreased compared to 2004 for both the quarter and the full year. This was a result of the challenging market conditions impacting most of the North American business groups with continued price erosion, rising energy costs as well as temporary inefficiencies related to installation and start-up of new presses related to the retooling plan.
15
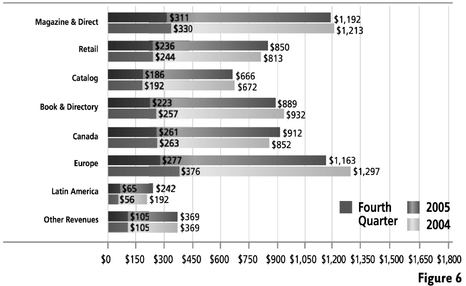
Revenue by Business Group ($ million)
For the quarter and the year ended December 31
(Continuing Operations)
Selling, general and administrative expenses decreased across the North American platform in 2005 compared to 2004, mainly due to savings from facility closures, cost-containment initiatives and corporate headcount reductions, mostly in 2004. Year-over-year headcount was reduced in North America by 484 employees, or approximately 2%.
The following is a review of the North American activities by business group. The North American segment is made up of the following business groups: Magazine & Direct, Retail, Catalog, Book & Directory, Canada and Other Revenues. (Figure 6)
Magazine & Direct
Magazine & Direct revenues for the fourth quarter of 2005 were $311 million, down 5% from $330 million in 2004. On a full year basis, revenues decreased by 2% to $1,192 million in 2005, from $1,213 million in 2004, despite a 2% increase in paper sales, mainly in the Magazine group.
Prices were down in the Magazine group for the fourth quarter and were down year-to-date for both Magazine & Direct compared to 2004. Volume for the Magazine group was down 9% for the quarter and 5% year-to-date, due to the absence of the 53rd week, the non-renewal of one customer and reduced volume from another. In the Direct group, volume decreased by 6% for the quarter and 1% year-to-date, essentially explained by the 53rd week in 2004. However, coupled with declining pricing, this market suffered from mergers in the banking and the telecom sectors resulting in less demand.
As part of the ongoing retooling plan to improve operational efficiencies, new presses are being installed in five facilities for magazine customers. Two of them were operating in the fourth quarter of 2005. This process resulted in certain inefficiencies from the preparation, installation and the start-up of the new equipment, which negatively affected the results.
Over the year and despite the challenging market, the Magazine group continued to secure market share by extending current contracts and increasing volume for customers by signing multi-year agreements of more than a billion dollars. Customers include Time, Primedia, Wenner Media, Morris Communications, Disney/ESPN and Ascend Media.
Retail
Retail revenues for the fourth quarter of 2005 were $236 million, down 3% from $244 million in 2004. On a full year basis, revenues increased by 5% to $850 million in 2005, from $813 million in 2004, essentially explained by increased paper sales.
Volume remained stable for the quarter and increased by 5% on a year-to-date basis. The increased volume is explained by new gains as well as additional volume from existing customers such as: Sports Authority, Wal-Mart, Big 5 Sporting Goods, Walgreen and Best Buy. Volume increased also because of the addition of the offset printing facility in Pittsburg, California. However, this increase has been partially offset by the negative impact of lower priced work for both the quarter and the full year compared to 2004. While selected customers are opting for increased versioning in their retail campaigns, Quebecor World's coast-to-coast dual processes platforms (gravure/offset) is uniquely positioned to fulfill their needs.
Catalog
Catalog revenues for the fourth quarter of 2005 were $186 million, down 3% from $192 million in 2004. On a full-year basis, revenues decreased by 1% to $666 million in 2005, from $672 million in 2004.
Volume was down 6% for the quarter and 1% for the full year. Price erosion continued for both the quarter and the full-year resulting in decreased operating margins compared to last year. As part of the ongoing retooling plan to improve efficiencies, a new 64-page press has been installed in the Catalog platform in the fourth quarter of 2005 and experienced some start-up inefficiencies, which also contributed to the lower operating margins.
The Catalog group is continuing to secure market share by extending current contracts and winning new customers such as: Bass Pro Shops, School Specialty and Brookstone.
Book & Directory
Book & Directory revenues for the fourth quarter of 2005 were $223 million, down 13% from $257 million in 2004. On a full-year basis, revenues decreased by 5% to $889 million in 2005, from $932 million in 2004. The decrease in revenue in the fourth quarter and for the full year was due mainly to the volume shortfalls and price erosion in both the Book and Directory groups compared to the same periods in 2004. Volume decreased in the fourth quarter of 2005 by 6% in the Book group and by 16% in the Directory group. On a full-year basis, volume decreased by 3% in the Book group and 7% in the Directory group. The volume shortfall in Directory is due to lower volumes from two customers.
The Book group has continued to enhance its position by increasing competitive efficiencies with the addition of 64-page presses at two facilities that were in operation in the fourth quarter of 2005. Also, the Directory group has signed two new multi-year contracts with Yellow Book USA and DEX Media. The Company currently anticipates that this additional volume will significantly increase its market share in the directory business beginning in 2007.
16
Canada
The Canadian business group operates mainly in the Retail, Magazine & Direct, Catalog and Directory markets. Canadian revenues for the fourth quarter of 2005 were $261 million, essentially flat compared to 2004. On a full-year basis, revenues increased by 7% to $912 million in 2005, from $852 million in 2004. Excluding the favorable impact of currency translation and paper sales, revenues decreased by 3% for the quarter and 1% for the full year compared to 2004. Volume decreased by 7% in the fourth quarter and 1% for the full year compared to the same periods in 2004. Magazine volume decreased in the fourth quarter and year-to-date, both partly offset by an increase in Retail and Catalog across the platform. Market conditions remained extremely competitive as reflected in the pricing.
In August 2005, Quebecor inc. announced a major investment that will include a new print facility in Islington, Ontario to be operated by a new entity co-owned by Quebecor Media (another subsidiary of the parent company) and Quebecor World, serving both of their customers. The new entity will print newspapers for Quebecor Media in Ontario as well as Quebecor World's print contracts for its North American customers, including some of the larger directory publishers.
Other Revenue
Other sources of revenue in North America include Quebecor World Premedia and Logistics.
Premedia revenues for the fourth quarter were $15 million, down 6% from $16 million in 2004. On a full-year basis, revenues were $58 million in 2005, down 11% from $66 million in 2004. The decrease in revenue for the fourth quarter compared to 2004 was due to a 12% decrease in volume partly offset by an increase in price, essentially due to product mix. On a full-year basis, volume decreased by 7% year-over-year and changes in type of prepress work and the price erosion earlier in the year caused a negative impact on revenue. The economic environment has led customers to continue looking for ways to reduce their costs by putting pressure on reducing prices, re-using previously captured images and taking more of the prepress production in-house.
Logistics revenues for the fourth quarter were $93 million, up 4% from $89 million in 2004. On a full year basis, revenues were $321 million in 2005, up 4% from $309 million in 2004. The increase in revenue was due mainly to higher retail commodity shipments in both the fourth quarter and the full year. However, gross profit margins decreased in the fourth quarter and year-to-date due to more unscheduled truck shipments for time-sensitive products, higher operating costs due to effects of hurricanes in the Gulf Coast and higher fuel prices.
EUROPE
The European business group operates mainly in the Magazine, Retail, Catalog and Book markets. European revenues for the fourth quarter of 2005 were $277 million, down 27% from $377 million in 2004. On a full-year basis, revenues were $1,163 million, down 10% from $1,297 million in 2004. Excluding the impact of currency translation and paper sales, revenues were down 16% for the fourth quarter and 9% for the full year compared to the same periods last year. Overall volume decreased by 23% in the fourth quarter and 13% year-to-date mainly explained by the Magazine and the Retail markets in France and the wind-down of an important contract not renewed at the Corby, United Kingdom facility. Price erosion continued to have a negative impact on the European results throughout the year. During the year 2005, the Company sold investments in some facilities in France, which also contributed to the decrease in revenues when compared to year 2004.
Operating income and margin for the European segment were negative for the fourth quarter and the full year and represented a significant decrease compared to the same periods in 2004. The negative operating results were in part due to the loss of the contract at the Corby facility. Volumes related to this contract began to decrease in the first half of 2005 and the contract was terminated at the end of May. The facility has been able to replace some of the lost volume, but at lower margins. France also reported negative operating results for both the fourth quarter and the full year of 2005 compared to the same periods last year. The decrease in volume combined with various workforce related inefficiencies and the continued price pressure negatively affected the French results. The less productive assets, mainly in France, have also contributed to poor operating results. However, operating income and margin increased in Spain and Austria for the year 2005 compared to 2004.
The Company recently completed a strategic review of its operations in the whole platform and announced a capital investment program of approximately $250 million. Europe is an important element in the Company's global service offering and it is expected that this program will improve the platform's competitive position, lower its cost base and allow the Company to provide better service to customers. The program will affect selected European operations and involves the purchase of new state-of-the-art equipment to be installed in facilities in Belgium, Spain, Austria as well as additional potential investments in the United Kingdom and France. The Company also successfully completed labor negotiations in February 2006 with its employee representatives in the United Kingdom that will quickly bring the facility in line with the market. Finally, similar negotiations are progressing more slowly in France. This could be a lenghty process which might negatively impact the Company's performance.
Selling, general and administrative expenses, when excluding the effect of currency translation, decreased in the fourth quarter and the full year of 2005 compared to the same periods in 2004 as a result of headcount reductions. Year-over-year headcount decreased by 790 employees or approximately 14% mostly in the United Kingdom, Sweden and France.
LATIN AMERICA
Latin America operates mainly in the Book, Directory, Magazine, and Retail markets. Latin America's revenues for the fourth quarter of 2005 were $65 million, up 15% from $56 million in 2004. On a full-year basis, revenues were $242 million in 2005, up 26% from $192 million in 2004. Excluding the favorable impact of currency translation and paper sales, revenues increased by 6% for both the fourth quarter and the full year compared to 2004. Overall volume increased by 3% for the quarter compared to the same period last year explained by increased directory volume in the Recife, Brazil and Mexico facilities. On a full-year basis, volume increased by 5% reflecting strengthened local economies, which led to general increases in all markets coupled with the increased volume of cross selling efforts with the North American and European segments. During the third quarter of 2004, the Company had embarked on an initiative to more closely link the Latin American Book and Directory facilities with its North American counterparts to expand the capacity and capabilities to its overall customer base. This initiative has continued through the fourth quarter of 2005.
For both the fourth quarter and the full year, prices, expressed in local currency, remained essentially stable with the exception of Argentina which increased significantly as a result of a recovering economy in that country. Operating income and margin increased in the fourth quarter compared to the same period last year, mainly due to increased prices and cost saving initiatives. On a year-to-date basis, operating income and margin increased due to higher volume and operational efficiencies.
Selling, general and administrative expenses, when excluding the effect of currency translation, decreased in the fourth quarter and for the full year of 2005 compared to the same periods in 2004, due mainly to savings from cost containment initiatives and headcount reductions. Year-over-year headcount was reduced by 84 employees, or approximately 4%.
17
Reconciliation of non GAAP measures
($ millions)
| | Years ended December 31 | ||||||||||||
|---|---|---|---|---|---|---|---|---|---|---|---|---|---|
| | 2005 | 2004 | 2003 | ||||||||||
| Operating Income from Continuing Operations | |||||||||||||
| Operating income ("EBIT") | $ | 20.3 | $ | 355.5 | $ | 211.9 | |||||||
| Impairment of assets, restructuring and other charges ("IAROC") | 94.2 | 115.6 | 94.5 | ||||||||||
| Goodwill impairment charge | 243.0 | — | — | ||||||||||
| Adjusted EBIT | $ | 357.5 | $ | 471.1 | $ | 306.4 | |||||||
| EBIT | $ | 20.3 | $ | 355.5 | $ | 211.9 | |||||||
| Depreciation of property, plant and equipment(1) | 308.1 | 334.5 | 333.2 | ||||||||||
| Amortization of deferred charges(1) | 27.3 | 27.0 | 26.2 | ||||||||||
| Less depreciation and amortization from discontinued operations(2) | (4.2 | ) | (10.4 | ) | (11.0 | ) | |||||||
| Operating income before depreciation and amortization ("EBITDA") | $ | 351.5 | $ | 706.6 | $ | 560.3 | |||||||
| IAROC | 94.2 | 115.6 | 94.5 | ||||||||||
| Goodwill impairment charge | 243.0 | — | — | ||||||||||
| Adjusted EBITDA | $ | 688.7 | $ | 822.2 | $ | 654.8 | |||||||
Earnings (loss) per share from Continuing Operations | |||||||||||||
| Net income (loss) from Continuing Operations | $ | (148.8 | ) | $ | 139.9 | $ | (32.7 | ) | |||||
| IAROC (net of income taxes of $8.2 million in 2005, | |||||||||||||
| $24.8 million in 2004 and $25.7 million in 2003) | 86.0 | 90.8 | 68.8 | ||||||||||
| Goodwill impairment charge (net of income taxes of $10.9 million in 2005) | 232.1 | — | — | ||||||||||
| Adjusted net income from continuing operations | $ | 169.3 | $ | 230.7 | $ | 36.1 | |||||||
| Net income available to holders of preferred shares | 39.6 | 37.5 | 36.5 | ||||||||||
| Adjusted net income from continuing operations available to holders of equity shares | $ | 129.7 | $ | 193.2 | $ | (0.4 | ) | ||||||
| Diluted average number of equity shares outstanding (in millions) | 131.8 | 132.6 | 136.0 | ||||||||||
| Earnings (loss) per share from continuing operations | |||||||||||||
| Diluted | $ | (1.43 | ) | $ | 0.77 | $ | (0.51 | ) | |||||
| Adjusted diluted | $ | 0.98 | $ | 1.45 | $ | — | |||||||
Free Cash Flow | |||||||||||||
| Cash provided by operating activities | $ | 469.5 | $ | 487.8 | $ | 461.3 | |||||||
| Dividends on preferred shares | (39.6 | ) | (38.8 | ) | (37.7 | ) | |||||||
| Additions to property, plant and equipment | (394.0 | ) | (132.6 | ) | (243.1 | ) | |||||||
| Net proceeds from disposal of assets | 16.4 | 3.0 | 2.8 | ||||||||||
| Proceeds from business disposals | 66.9 | — | — | ||||||||||
| Free cash flow | $ | 119.2 | $ | 319.4 | $ | 183.3 | |||||||
Book value per share | |||||||||||||
| Shareholders' equity | $ | 2,250.6 | $ | 2,612.6 | $ | 2,503.4 | |||||||
| Preferred shares | (456.6 | ) | (456.6 | ) | (456.6 | ) | |||||||
| $ | 1,794.0 | $ | 2,156.0 | $ | 2,046.8 | ||||||||
| Ending number of equity shares (in millions) | 131.0 | 132.6 | 132.0 | ||||||||||
| Book value per share | $ | 13.69 | $ | 16.26 | $ | 15.51 | |||||||
Figure 7
| Adjusted: Defined as before IAROC and before goodwill impairment charge (1) As reported in the Consolidated Statements of Cash Flows (2) As reported in Note 7 "Discontinued Operations" |
18
Reconciliation of non GAAP measures
($ millions)
| | Years ended December 31 | ||||||||||
|---|---|---|---|---|---|---|---|---|---|---|---|
| | 2005 | 2004 | 2003 | ||||||||
| Debt-to-capitalization | |||||||||||
| Bank indebtedness | $ | — | $ | — | $ | 1.3 | |||||
| Current portion of long-term debt and convertible notes | 7.7 | 11.7 | 23.9 | ||||||||
| Long-term debt | 1,731.9 | 1,825.8 | 1,874.4 | ||||||||
| Convertible notes | 115.5 | 112.6 | 110.7 | ||||||||
| Total debt | $ | 1,855.1 | $ | 1,950.1 | $ | 2,010.3 | |||||
| Minority interest | 0.6 | 8.3 | 24.7 | ||||||||
| Shareholders' equity | 2,250.6 | 2,612.6 | 2,503.4 | ||||||||
| Capitalization | $ | 4,106.3 | $ | 4,571.0 | $ | 4,538.4 | |||||
| Debt-to-capitalization | 45:55 | 43:57 | 44:56 | ||||||||
Total Debt and Accounts Receivable Securitization | |||||||||||
| Bank indebtedness | $ | — | $ | — | $ | 1.3 | |||||
| Current portion of long-term debt and convertible notes | 7.7 | 11.7 | 23.9 | ||||||||
| Long-term debt | 1,731.9 | 1,825.8 | 1,874.4 | ||||||||
| Convertible notes | 115.5 | 112.6 | 110.7 | ||||||||
| Total debt | $ | 1,855.1 | $ | 1,950.1 | $ | 2,010.3 | |||||
| Accounts receivable securitization | 692.8 | 785.5 | 766.6 | ||||||||
| Total debt and accounts receivable securitization | $ | 2,547.9 | $ | 2,735.6 | $ | 2,776.9 | |||||
| Minority interest | 0.6 | 8.3 | 24.7 | ||||||||
| Shareholders' equity | 2,250.6 | 2,612.6 | 2,503.4 | ||||||||
| Capitalization, including securitization | $ | 4,799.1 | $ | 5,356.5 | $ | 5,305.0 | |||||
| Debt-to-capitalization, including securitization | 53:47 | 51:49 | 52:48 | ||||||||
Coverage Ratios from Continuing Operations | |||||||||||
| Adjusted EBITDA | $ | 688.7 | $ | 822.2 | $ | 654.8 | |||||
| Financial expenses | 119.0 | 133.1 | 204.5 | ||||||||
| Loss on extinguishment of long-term debt | — | (2.0 | ) | (30.2 | ) | ||||||
| Financial expenses adjusted — Last 12 months | 119.0 | 131.1 | 174.3 | ||||||||
| Interest coverage ratio (times) | 5.8 | 6.3 | 3.8 | ||||||||
| Total debt | $ | 1,855.1 | $ | 1,950.1 | $ | 2,010.3 | |||||
| Debt-to-Adjusted-EBITDA ratio (times) | 2.7 | 2.4 | 3.1 | ||||||||
Figure 7
19
Reconciliation of non GAAP measures
($ millions)
| | Three months ended December 31 | ||||||||
|---|---|---|---|---|---|---|---|---|---|
| | 2005 | 2004 | |||||||
| Operating Income from Continuing Operations | |||||||||
| Operating income ("EBIT") | $ | (167.6 | ) | $ | 113.0 | ||||
| Impairment of assets, restructuring and other charges ("IAROC") | 11.9 | 48.4 | |||||||
| Goodwill impairment charge | 243.0 | — | |||||||
| Adjusted EBIT | $ | 87.3 | $ | 161.4 | |||||
| EBIT | $ | (167.6 | ) | $ | 113.0 | ||||
| Depreciation of property, plant and equipment(1) | 73.2 | 85.8 | |||||||
| Amortization of deferred charges(1) | 7.4 | 7.6 | |||||||
| Less depreciation and amortization from discontinued operations | — | (2.9 | ) | ||||||
| Operating income before depreciation and amortization ("EBITDA") | $ | (87.0 | ) | $ | 203.5 | ||||
| IAROC | 11.9 | 48.4 | |||||||
| Goodwill impairment charge | 243.0 | — | |||||||
| Adjusted EBITDA | $ | 167.9 | $ | 251.9 | |||||
Earnings (loss) per share from Continuing Operations | |||||||||
| Net income (loss) from Continuing Operations | $ | (205.0 | ) | $ | 46.3 | ||||
| IAROC (net of income taxes of $1.0 million in 2005 and $4.7 million in 2004) | 10.9 | 43.7 | |||||||
| Goodwill impairment charge (net of income taxes of $10.9 million in 2005) | 232.1 | — | |||||||
| Adjusted net income from continuing operations | $ | 38.0 | $ | 90.0 | |||||
| Net income available to holders of preferred shares | 10.2 | 10.3 | |||||||
| Adjusted net income from continuing operations available to holders of equity shares | $ | 27.8 | $ | 79.7 | |||||
| Diluted average number of equity shares outstanding (in millions) | 131.0 | 132.7 | |||||||
| Earnings (loss) per share from continuing operations | |||||||||
| Diluted | $ | (1.64 | ) | $ | 0.27 | ||||
| Adjusted diluted | $ | 0.21 | $ | 0.59 | |||||
Free Cash Flow | |||||||||
| Cash provided by operating activities | $ | 278.3 | $ | 380.9 | |||||
| Dividends on preferred shares | (12.6 | ) | (12.7 | ) | |||||
| Additions to property, plant and equipment | (177.1 | ) | (31.8 | ) | |||||
| Net proceeds from disposal of assets | 6.9 | 1.3 | |||||||
| Proceeds from business disposals | 62.7 | — | |||||||
| Free cash flow | $ | 158.2 | $ | 337.7 | |||||
Figure 8
| Adjusted: Defined as before IAROC and before goodwill impairment charge (1) As reported in the Consolidated Statements of Cash Flows |
20
Selected Quarterly Financial Data (Continuing Operations)
(in millions of dollars, except per share data)
| | 2005 | 2004 | |||||||||||||||||||||||
|---|---|---|---|---|---|---|---|---|---|---|---|---|---|---|---|---|---|---|---|---|---|---|---|---|---|
| | Q4 | Q3 | Q2 | Q1 | Q4 | Q3 | Q2 | Q1 | |||||||||||||||||
| Consolidated Results | |||||||||||||||||||||||||
| Revenues | $ | 1,664.0 | $ | 1,577.2 | $ | 1,491.1 | $ | 1,551.0 | $ | 1,822.7 | $ | 1,569.6 | $ | 1,471.6 | $ | 1,475.6 | |||||||||
| Adjusted EBITDA | 167.9 | 178.7 | 167.4 | 174.7 | 251.9 | 197.4 | 193.4 | 179.5 | |||||||||||||||||
| Adjusted EBIT | 87.3 | 97.2 | 84.4 | 88.6 | 161.4 | 112.3 | 104.5 | 92.9 | |||||||||||||||||
| IAROC | 11.9 | 17.2 | 31.8 | 33.3 | 48.4 | 12.8 | 50.2 | 4.2 | |||||||||||||||||
| Goodwill impairment charge | 243.0 | — | — | — | — | — | — | — | |||||||||||||||||
| Operating income (loss) | (167.6 | ) | 80.0 | 52.6 | 55.3 | 113.0 | 99.5 | 54.3 | 88.7 | ||||||||||||||||
| Net income (loss) from continuing operations | (205.0 | ) | 30.9 | 9.5 | 15.8 | 46.3 | 45.8 | 15.1 | 32.7 | ||||||||||||||||
Per Share Data | |||||||||||||||||||||||||
| Earnings (loss) | �� | ||||||||||||||||||||||||
| Diluted | $ | (1.64 | ) | $ | 0.16 | $ | — | $ | 0.05 | $ | 0.27 | $ | 0.28 | $ | 0.05 | $ | 0.18 | ||||||||
| Adjusted diluted | $ | 0.21 | $ | 0.28 | $ | 0.22 | $ | 0.27 | $ | 0.59 | $ | 0.35 | $ | 0.30 | $ | 0.20 | |||||||||
| Dividends on equity shares | $ | 0.14 | $ | 0.14 | $ | 0.14 | $ | 0.14 | $ | 0.13 | $ | 0.13 | $ | 0.13 | $ | 0.13 | |||||||||
Adjusted: Defined as before IAROC and before goodwill impairment charge
IAROC: Impairment of assets, restructuring and other charges
QUARTERLY TRENDS
Revenue
Due to the seasonality of the printing business (higher volumes in the third and fourth quarters), an analysis of the consecutive quarters is not a true measurement of the revenue trend. In the first quarter of 2004, there was an increase in volume, but there was a continuing overcapacity in the printing industry and pricing pressures which negatively affected revenue. This trend continued through the remaining three quarters of 2004, while currency translation continued to have a positive impact on revenue in each of the quarters in 2004. Revenue increased in the first three quarters of 2005 due mainly to a favorable impact on currency translation and a higher volume of paper sold to customers. However, continued pricing pressures across the platform adversely affected revenues in all four quarters, and volume decreases were particularly felt in the North American platform, the British and the French operations.
Operating income before impairment of assets, restructuring and other charges
The first quarter of 2004 showed improved results attributed to the positive impact of the cost reduction efforts initiated in 2003 and the reduction in force. This positive trend continued through the next three quarters of 2004 but was partly offset by increased fringe benefits (including healthcare and pension), increased freight costs due to higher fuel prices and new government regulations on hours of service. Moreover, the third quarter of 2004 was negatively impacted by operational inefficiencies mainly at plants involved in the installation and transfer of equipment.
Operating income before impairment of assets, restructuring and other charges decreased in all four quarters of 2005 compared to the same periods in 2004. The positive effects on restructuring initiatives did not translate into an increase of operating income because of the continuing price reductions, rising energy costs and the underperformance of the French and British operations.
Operating income was affected in the fourth quarter of 2005 by a $243 million goodwill impairment charge as well as operational inefficiencies mainly at plants involved in the installation of new equipment.
Impairment of assets, restructuring and other charges
Impairment of assets, restructuring and other charges have been a major focus of the Company's cost reduction initiatives undertaken during the previous years that involved a reduction in force, closure or downsizing of facilities, decommissioning of under-performing assets, lowering of overhead expenses, consolidating corporate functions and relocating sales and administrative offices into plants. This determined focus on cost containment has reduced the Company's long-term cost structure and will improve efficiency across the platform.
In the first quarter of 2004, the Company continued the initiatives undertaken in 2003 with $4 million of restructuring and other charges. In the second quarter of 2004, the Company recorded a $50 million impairment of assets and restructuring charge, which reflected the closing of a facility, the downsizing of another facility in North America, and the continued reduction in force across all platforms. In the third quarter of 2004, the Company announced the reorganization of its Nordic Gravure platform and the closing of the Stockholm facility by the end of 2004. The Company also recorded additional impairment of assets, restructuring and other charges of $13 million. In the fourth quarter of 2004, the Company recorded $35 million of impairment of assets and $13 million in restructuring charges. In the first quarter of 2005 the Company took a $33 million charge mainly related to the impairment of long-lived assets and accelerated depreciation. For the second quarter of 2005, the Company booked a $32 million charge, approximately half of which was for impairment of assets and accelerated depreciation. The other half related to restructuring initiatives. In the third quarter of 2005, there was a $17 million charge for new impairment of assets, accelerated depreciation, restructuring and other charges. Finally, in the fourth quarter of 2005, the Company recorded a $12 million charge, of which $5 million was related to the impairment of long-lived assets and accelerated depreciation. The impairments and restructuring initiatives and accelerated depreciation in the four quarters of 2005 were related to European operations, mainly in France and the United Kingdom.
Net income
Net income was primarily affected by the negative impact of the difficult economic environment which more than offset the benefit from restructuring and cost containment initiatives mentioned above. In addition, unusual items impacting financial expenses and income taxes also affected the net income for specific quarters. Through the year 2004, financial expenses decreased mainly due to the favorable impact of the 2003 fourth quarter refinancing of long-term debt combined with a lower average debt compared to the previous year. Net income in all four quarters of 2005 was negatively affected by overall pricing erosion, the underperforming French operations as well as volume reductions in the United Kingdom and certain business groups in the North American platform.
Figure 9
21
CRITICAL ACCOUNTING ESTIMATES
The preparation of financial statements in conformity with Canadian GAAP requires the Company to make estimates and assumptions which affect the reported amounts of assets and liabilities, disclosure with respect to contingent assets and liabilities at the date of the financial statements and reported amounts of revenues and expenses during the reporting period. The Ontario Securities Commission defines critical accounting estimates as those requiring assumptions made about matters that are highly uncertain at the time the estimate is made, and when the use of different reasonable estimates or changes to the accounting estimates would have a material impact on a Company's financial condition or results of operations.
Based on this definition, the Company has identified the following critical accounting estimates:
REVENUE RECOGNITION
When the criteria for revenue recognition have been met, the Company recognizes revenue using the percentage of completion method over the contract term on the basis of production and service activity at the pro rata billing value of work completed. The method used when such progress needs to be measured reflects the output achieved. For example, one method is based on unit production for each of the significant production processes where each of these units is attributed a certain profit calculated by stage of production. Other methods used may be based on the hours of labor recorded or the costs incurred when these measures provide a better reflection of true output of the project. Sales revenues that do not meet the criteria for percentage of completion recognition are recorded when the performance of the agreed services is achieved. Provisions for estimated losses on contracts, if any, are recognized in the period in which the loss is determined based on analyses of cost recovery as compared to the contract value.
For services that are sold together, certain components of multiple service arrangements (such as pre-media, commercial impression and delivery) are separately accounted for provided the delivered elements have stand-alone value to the customer and the fair value of any undelivered elements can be objectively and reliably determined. Where the criteria for recognition as a multiple element arrangement are met, the total contract value is allocated to each element based on their relative fair values. Where criteria are not met, it is recognized as a single unit of accounting according to the revenue recognition criteria stated above.
GOODWILL
Goodwill is not amortized but tested for impairment annually or more frequently if events or changes in circumstances indicate a possible impairment. The Company compares the reporting unit's carrying value to its market value determined through a discounted cash flow analysis. In preparing discounted cash flows, the Company uses its judgment in estimating future profitability, growth, capital spending and discount rate. As an additional overall check on the reasonableness of the fair value attributed to reporting units, the Company performs a market comparable companies analysis, which takes into consideration 1) valuation multiples of comparable public companies to which a control premium is applied and 2) publicly-known acquisition multiples of recent transactions in the industry. If the carrying value of the reporting unit exceeds the market value the Company would then evaluate the impairment loss by comparing the fair value of the goodwill to its carrying amount.
Based on the results of the latest impairment test performed, the Company recorded a $243 million goodwill impairment charge for its European reporting unit. Management will continue to remain alert for any indicators that the fair value of a reporting unit could be below book value and will assess goodwill for impairment as appropriate.
IMPAIRMENT OF LONG-LIVED ASSETS
The Company tests the recoverability of long-lived assets, including property, machinery and equipment and other long-term assets, when events or changes in circumstances indicate that their carrying amounts may not be recoverable. Examples of such events and changes include: the decommissioning of an asset, assets rendered idle after plant shutdown, costs that significantly exceed the amount initially estimated for the acquisition or construction of an asset and adverse economic changes affecting a group of assets and causing continuing underperformance.
An impairment is recognized when the carrying amount of a long-lived asset is not fully recoverable and exceeds its fair value. A long-lived asset, or group of assets is considered unrecoverable when its carrying value exceeds the estimated undiscounted future cash flows directly associated with it. The Company estimates future cash flows based on historical and budgeted performance as well as assumptions on future economic environment, pricing and volume and in some cases alternative use for assets being reviewed. The fair value measurement is determined based on market prices when available, or on the discounted cash flow approach.
Different events occurred throughout 2005 that indicated that the carrying amounts of groups of assets might not be recoverable. First, the Company undertook new restructuring initiatives in 2005 and others were approved that will be implemented in coming years, triggering recoverability tests for plants involved in these initiatives. Furthermore, the financial results for the European segment in general were significantly lower than forecast also triggering recoverability tests, mostly for plants located in France and in the United Kingdom. Finally, events or changes in circumstances specific to certain plants across the platform triggered recoverability tests.
22
An impairment test was then performed in cases where the recoverability tests indicated that projected undiscounted future cash flows were not sufficient to recover the carrying value of the group of assets being tested. Consequently, a $5 million impairment charge was recorded in the fourth quarter of 2005 and a total impairment charge of $54 million was recorded for 2005.
Management concluded that at December 31, 2005, no further impairment charges were required other than those discussed above. The Company continues to monitor groups of assets to identify any new events or changes in circumstances that could indicate that their carrying values are not recoverable. Should any such situation be identified or in the event that actual results differ from management's estimates, an additional impairment charge could be necessary.
PENSION AND POSTRETIREMENT BENEFITS
The Company maintains defined benefit plans and postretirement benefits for its employees and ensures that contributions are sustained at a level sufficient to cover benefits. Actuarial valuations of the Company's various pension plans were performed during the last three years or more frequently where required by law. Plan assets are measured at fair value and consist of equity securities, corporate and government fixed income securities and cash or cash equivalents. Pension and other postretirement costs and obligations are based on various economic and demographic assumptions determined with the help of actuaries and are reviewed each year. Key assumptions include the discount rate, the expected long-term rate of return on plan assets, the rate of compensation increase and the health care cost trend rate (Figure 10).
The discount rate assumption used to calculate the present value of the plans' projected benefit payments was determined using a measurement date of September 30, 2005 and based on yields of long-term high-quality fixed income investments.
The expected long-term rate of return on pension plan assets was obtained by calculating a weighted average rate based on targeted asset allocations of the plans. The expected returns of each asset class are based on a combination of historical performance analyses and forward looking views of the financial markets. The targeted asset allocation of the plans is approximately 65% for equity and 35% for fixed income securities and cash.
The rate of compensation increase is used to project current plan earnings in order to estimate pension benefits at future dates. This assumption was determined based on historical pay increases, forecast of salary budgets, collective bargaining influence and competitive factors.
For postretirement benefits, the assumptions related to the health care cost trend rate are based on increases experienced by plan participants in recent years and national average cost increases.
The Company believes that the assumptions are reasonable based on information currently available, however, in the event that actual outcome differs from management's estimates, the provision for pension and postretirement benefit expenses and obligations may be adjusted.
Weighted average assumptions used in
the measurement of the Company's pension benefits
| | 2005 | 2004 | |||
|---|---|---|---|---|---|
| Accrued benefit obligation as of December 31: | |||||
| Discount rate | 5.4% | 6.0% | |||
| Rate of compensation increase | 3.4% | 3.4% | |||
| Benefit costs for year ended December 31: | |||||
| Discount rate | 6.0% | 6.0% | |||
| Expected return on plan assets | 7.6% | 7.8% | |||
| Rate of compensation increase | 3.4% | 3.5% | |||
Figure 10
HEALTH CARE COSTS
The Company provides health care benefits to employees in North America and covers approximately 75% of the costs under these employee health care plans. The Company actively manages its health care spendings with its vendors to maximize discounts in an attempt to limit the cost escalation experienced over the past years. Health care costs and liabilities are estimated with the help of actuaries. Health care costs continued to increase in 2005. However, due to a change in the workforce combined with changes in plan design, the Company's healthcare costs increase has been kept to a minimum. Trend assumption is the most important factor in estimating future costs. The Company uses the most recent twelve months of claims trended forward to estimate the next year's liability.
ALLOWANCE FOR DOUBTFUL ACCOUNTS
The Company maintains an allowance for doubtful accounts for expected losses from customers who are unable to pay their debts. The allowance is reviewed periodically and is based on an analysis of specific significant accounts outstanding, the age of the receivable, customer creditworthiness and historical collection experience. In addition, the Company maintains an allowance to cover a fixed percentage of all accounts for customers who have filed for bankruptcy protection under Chapter 11 and other critical accounts. These accounts may take several years before a settlement is reached. The allowance is reassessed on a quarterly basis.
INCOME TAXES
Management believes that it has adequately provided for income taxes based on all of the information that is currently available.
The provision for income taxes is calculated based on the expected tax treatment of transactions recorded in the Company's consolidated statements. In determining its provision for income taxes, the Company interprets tax legislation in a variety of jurisdictions and makes assumptions about the expected timing of the reversal of future tax assets and liabilities. Income tax assets and liabilities, both current and future, are measured according to enacted income tax legislation that is expected to apply when the asset is realized or the liability settled. The Company regularly reviews the recognized and unrecognized future income tax assets to determine if a valuation allowance is required or needs to be adjusted. The Company's future income tax assets are recognized only to the extent that, in the Company's opinion, it is more likely than not that the future income tax assets will be realized. This opinion is based on certain estimates, assumptions and judgments in assessing the potential for future recoverability, while at the same time considering past experience. If these estimates, assumptions or judgments change in the future, the Company could be required to reduce or increase the value of the future income tax assets resulting in income tax expense or recovery. The Company's tax legislation interpretations could differ from those of tax authorities and our tax filings are subject to Government audits, which both could materially change the amount of current and future income tax assets and liabilities. Any change would be recorded as a charge or a credit to income tax expense.
23
In addition, the Company has not recognized a future tax liability for the undistributed earnings of its subsidiaries in the current and prior years because the Company does not expect those unremitted earnings to reverse and become taxable in the foreseeable future.
WORKER'S COMPENSATION
U.S. worker's compensation claims tend to be relatively low in value on a case-by-case basis, and the Company self-insures against the majority of such claims.
The liability provision of such self-insurance is estimated based on reserves for claims that are established by an independent administrator and the provision is adjusted annually to reflect the estimated future development of the claims using Company specific factors provided by its actuaries. The adjustment is recorded in income or expense.
While the Company believes that the assumptions used are appropriate, in the event that actual outcome differs from management's estimates, the provision for U.S. worker's compensation costs may be adjusted.
The Company also maintains third-party insurance coverage against U.S. worker's compensation claims which could be unusually large in nature as discussed in the risks and uncertainties section hereafter.
FINANCIAL CONDITION, LIQUIDITY AND CAPITAL RESOURCES
One of the measures the Company uses to evaluate its liquidity is free cash flow as described in figures 7 and 8. Free cash flow reflects cash flow available for business acquisitions, dividends on equity shares, repayments of long-term debt and repurchases of equity securities. In 2005, free cash flow was $119 million, compared to $319 million in 2004. The decrease in free cash flow was due mainly to a significant increase in capital expenditures in 2005 compared to 2004 and a reduction in accounts receivable securitization, which were partly offset by proceeds from business disposals of $67 million. This trend is expected to continue through 2006 as the Company implements its retooling plans.
OPERATING ACTIVITIES
Cash flow from operating activities was $470 million in 2005, compared to $488 million in 2004. The decrease was mainly attributable to lower EBITDA in 2005. The deficiency in working capital was $59 million in 2005, compared to $35 million in 2004. The change is due mainly to a decrease in inventories and income tax receivables that were partly offset by a decrease in trade payables and accrued liabilities as well as an increase in trade receivables. The Company manages its trade payables in order to take advantage of prompt payment discounts. Also, the Company maximizes the use of its accounts receivable securitization program, since the cost of these programs is relatively low compared to that of the credit facility. The amount of trade receivables under securitization varies from month to month, based on the previous month's volume (for example, December securitization is based on receivables at the end of November).
FINANCING ACTIVITIES
The Company is subject to certain financial covenants in some of its major financing agreements. The key financial ratios are the interest coverage ratio, the debt-to-Adjusted-EBITDA ratio, and the debt-to-capitalization ratio. As at December 31, 2005, the Company is in compliance with all significant debt covenants.
The Company maintains a $1 billion revolving bank facility for general corporate purposes. In December 2005, the Company extended this facility until January 2009. The facility is composed of three tranches, which can be extended on a yearly basis. A total of $750 million is available to both the Company and its U.S. subsidiary and $250 million is available to the U.S. subsidiary only. All tranches are cross-guaranteed by the Company and the U.S. subsidiary.
On January 16, 2006, the Company announced it had concluded an agreement with Société Générale for the Canadian dollar equivalent of a 136 million Euros ($160 million) long-term committed credit facility relating to purchases of MAN Roland presses as part of the North American retooling program. The unsecured facility will be drawn over the course of the next 25 months and will be repaid over the next 10 years.
The Company's 7.20% Senior Notes for a principal amount of $250 million will mature in March 2006. The Company currently intends to repay these Senior Notes by using the proceeds of long-term debt financing and, as such, these Senior Notes have not been included in the current portion of long-term debt.
The Company's Series 4 Cumulative Redeemable First Preferred Shares are redeemable at its option on and after March 15, 2006 at Cdn$25.00 or, with regulatory approval, the preferred shares may be converted into Subordinate Voting Shares by the Company. On and after June 15, 2006, these Series 4 Preferred Shares may be converted at the option of the holder into Subordinate Voting Shares, subject to the right of the Company prior to the conversion date to redeem them for cash or find substitute purchasers for such preferred shares. The Company currently intends to redeem these shares prior to their conversion into common shares using its revolving bank facility. As at December 31, 2005, the unused portion of the bank facility was $782 million.
24
On May 13, 2005, the Company commenced a normal course issuer bid for a maximum of 7,300,000 Subordinate Voting Shares, which represented approximately 10% of the public float for the Subordinate Voting Shares at the time of the announcement. The Company has not repurchased any Subordinate Voting Shares since August 12, 2005 and does not have the intention of repurchasing any in the coming months. However, under the terms of the program, any purchases that would be made would be at prevailing market prices on the open market through the facilities of the Toronto Stock Exchange. The program expires on May 12, 2006. For the year 2005, the Company repurchased 2,438,500 shares at an average price of Cdn$23.85 for a net cash consideration of Cdn$58.2 million ($46.6 million). The excess of the price paid over the book value of the shares repurchased was $9.8 million and was charged to retained earnings in 2005. Purchases were funded using the Company's revolving bank facility.
On January 18, 2006, the Company announced that in light of the current capital spending program, the Board of Directors approved a reduction of the quarterly dividend on the Multiple Voting Shares and Subordinate Voting Shares to $0.10 per share from $0.14 per share. This will lower dividend payments by $21 million per year. Dividends paid to shareholders of Multiple Voting Shares and Subordinate Voting Shares totalled $0.56 per share in 2005 and $0.52 per share in for each of 2004 and 2003.
The Company paid dividends of Cdn$1.54 per share on the First Preferred Shares, Series 3 in 2005, 2004 and 2003. The Company paid dividends of Cdn$1.69 per share on the First Preferred Shares, Series 4 in 2005, 2004 and 2003 and Cdn$1.73 per share on the First Preferred Shares, Series 5, in 2005, 2004 and 2003.
INVESTING ACTIVITIES
Capital Expenditures
In the fourth quarter, the Company invested $177 million in capital projects compared to $32 million in 2004. On a year-to-date basis, $394 million was invested in capital projects in 2005 compared to $133 million in 2004. Of that amount approximately 80% was for organic growth, including expenditures for new capacity requirements and productivity improvement, and approximately 20% was for the maintenance of the Company's structure as was the case in 2004.
The bulk of the Company's capital expenditures in 2005 was for the North American and European platforms; $285 million for North America and $104 million for Europe.
North America
The Company invested $177 million in 2005 as part of its North American retooling plan. The main investments included deposits or installments for the purchase of eleven 64-Page Offset presses and three 48-Page Offset presses and will continue through 2006. A total of $191 million had been spent in connection with this plan at December 31, 2005.
Other key investments in North America included $44 million for the purchase of leased equipment and real estate assets. Also, the Company proceeded with the replacement of a bindery line, an investment for stitchers and an upgrade of a co-mailing system.
The Company also placed a firm order for a new directory press following the signature of a long-term printing agreement. This press was not part of the 2004 North American retooling plan.
In total, the Company has placed 19 firm orders for new presses of which 18 are part of the 2004 North American retooling plan. The total commitment for these presses with the press manufacturers amounted to $219 million, of which $162 million has already been disbursed. Of the 18 presses, 5 were installed and started during the fourth quarter of 2005. Finally, 4 additional presses will be ordered in 2006 under the 2004 North American retooling plan.
Europe
The Company invested $87 million in 2005 as part of its European retooling plan. The main investments included the deposits for the purchase of two Rotogravure presses and three 64-Page Offset presses, the relocation of presses and equipment between plants within the European platform and an efficiency improvement program. These measures will continue through 2006.
Other investments in Europe included $6 million for the purchase of leased equipment.
In the fourth quarter of 2005, the Company placed an additional firm order for a new press in Europe. In total, the Company has placed 5 firm orders for new presses, all of which are part of the European retooling plan. The total commitment for these presses with the press manufacturers amounted to $72 million, of which $58 million has been already disbursed.
Acquisitions and Disposals
In December 2005, the Company sold its interest in a subsidiary of its non-core commercial printing group in Canada, for a total consideration of $17.1 million that was received subsequent to December 31, 2005. The Company realized a gain of $2.6 million ($1.2 net of income tax).
In November 2005, the Company sold the operating assets of some of the units of its non-core commercial printing group in Canada for a total consideration of $34.6 million. The Company realized a loss amounting to $3.5 million ($6.4 million net of income tax). The selling price is subject to an adjustment based on the closing working capital.
In November 2005, the Company sold the operating assets of some units of its non-core commercial printing group in the United States for a total consideration of $61.3 million. The sale price was comprised of $32.8 million of cash, $20.0 million in preferred units of Matlet Group, LLC (purchaser) and $8.5 million in a promissory note receivable. The Company realized a gain amounting to $11.2 million (a loss of $1.9 million net of income tax). The selling price is subject to an adjustment based on the closing working capital.
On August 4, 2005, the Company concluded the sale of certain assets related to its Westwood, MA facility, one of the business units of its non-core Commercial Printing Group in the United States, for a cash consideration of $2.6 million, resulting in a loss on disposal of $0.8 million ($0.8 million, net of income tax).
25
Contractual Cash Obligations($ millions)
| | 2006 | 2007 | 2008 | 2009 | 2010 | 2011 and thereafter | ||||||||||||
|---|---|---|---|---|---|---|---|---|---|---|---|---|---|---|---|---|---|---|
| Long-term debt and convertible notes | $ | — | $ | 265 | $ | 202 | $ | 585 | $ | 175 | $ | 597 | ||||||
| Capital leases | 8 | 4 | 3 | 8 | 2 | 7 | ||||||||||||
| Operating leases | 102 | 70 | 45 | 30 | 19 | 69 | ||||||||||||
| Capital asset purchase commitments | 58 | 40 | — | — | — | — | ||||||||||||
| Total contractual cash obligations | $ | 168 | $ | 379 | $ | 250 | $ | 623 | $ | 196 | $ | 673 | ||||||
Figure 11
On June 30, 2005, the Company concluded the sale of certain assets related to its Los Angeles, CA facility, one of the business units of its non-core Commercial Printing Group in the United States, for a cash consideration of $0.5 million. On July 15, 2005, the Company sold additional assets related to this facility for a cash consideration of $0.8 million. This resulted in a loss on disposal of $6.3 million ($4.1 million net of income tax recovery).
In April 2005, the Company purchased assets of a web offset printing facility in Pittsburg, CA for a consideration of $9 million. This facility complements and strengthens the Company's Retail insert platform and adds capacity for customers in the West Coast market.
Also, in 2005, the Company acquired minority interests in its North American and French operations for a cash consideration of $7.0 million. The Company also sold investments in facilities in France for a total cash consideration of $0.3 million resulting in a loss on disposal of $4 million.
FINANCIAL POSITION
For the year ended December 31, 2005, the debt-to-capitalization ratio was 45:55, compared to 43:57 in 2004. As at December 31, 2005, total debt plus accounts receivable securitization was $2,548 million, $188 million lower than last year (Figure 7). Historically, the Company has acquired most of the equipment under leases when it is used for production. The total terminal value of these leases expiring after 2006 is approximately $116 million, of which $52 million is guaranteed.
The Company monitors the funded status of its pension plans very closely. During the year ended December 31, 2005, the Company made total contributions of $55 million ($77 million in 2004), which was in accordance with the minimum requirements as determined by the Company's actuaries.
The total mandatory principal payments on long-term debt, convertible notes and capital leases, excluding the Company's 7.20% Senior Notes due in March 2006, as previously discussed, are $8 million in 2006. Minimum pension contributions are estimated at $89 million for 2006.
As at January 30, 2006, the following credit ratings applied to the senior unsecured debt of the Company:
| Rating Agency | Rating | |
|---|---|---|
| Moody's Investors Service | Ba3 | |
| Standard & Poor's | BB | |
| Dominion Bond Rating Service Limited | BB (high) |
Standard & Poor's lowered the Company's credit rating from BB+ to BB on November 2, 2005. On December 23, 2005, Dominion Bond Rating Service Limited lowered the Company's credit rating from BBB (low) to BB (high). On January 12, 2006, Moody's Investors Service ("Moody's") changed the corporate family rating from Quebecor World Inc. to Quebecor World (USA) Inc. and lowered the credit rating from Ba2 to Ba3. It is expected that the Company's future borrowing costs will increase as a result of these rating changes.
The Company believes that its liquidity, capital resources and cash flows from operations are sufficient to fund planned capital expenditures, working capital requirements, pension contributions, interest and principal payment obligations for the foreseeable future.
IMPAIRMENT OF ASSETS AND RESTRUCTURING INITIATIVES
YEAR 2005
In 2005, the Company recorded impairment of long-lived assets, accelerated depreciation and restructuring charges of $98.1 million, composed of non-cash items of $53.9 million and cash items of $44.2 million, of which $3.9 million was related to discontinued operations.
Impairment of long-lived assets
In 2005, the Company performed a review of its long-lived assets. Following impairment tests on various specific units, the Company concluded that some assets, mainly in Europe, were impaired. Accordingly, for the year, the Company recorded an impairment of long-lived assets and accelerated depreciation related to facilities included in the 2005 restructuring initiatives of $53.7 million. The $53.7 million included $8.9 million for North America, $44.5 million for Europe and $0.3 million for Latin America.
During the fourth quarter of 2005, the Company recorded an impairment on long-lived assets and accelerated depreciation of $5.4 million. The impairment of assets and accelerated depreciation recorded for the first, second and third quarter were, respectively, $24.6 million, $16.0 million and $7.7 million.
2005 Restructuring initiatives
During the fourth quarter of 2005, the Company recorded cash costs of $4.8 million, of which $1.7 million was for new workforce reduction initiatives and $3.1 million resulting from the continuation of the previous quarter of 2005 initiatives. The Company also recorded a reversal of $0.2 million in the non-cash costs for the revised curtailment of one of the Canadian pension plans recorded in the first quarter.
During the third quarter of 2005, the Company continued its restructuring initiatives by approving the downsizing of operations in Helio Corbeil, France, and other workforce reductions across the Company. These initiatives were estimated at $7.4 million, of which $5.7 million was recorded during the third quarter. The Company also recorded $0.5 million related to first and second quarter initiatives.
26
During the second quarter of 2005, the Company approved restructuring initiatives for the second phase of the downsizing operations in Corby, United Kingdom, the closure of a Canadian facility and other workforce reductions across the Company. The cash costs of these initiatives were estimated at $18.2 million, of which $12.3 million was recorded during the second quarter. The Company had also recorded cash restructuring charges of $3.9 million for severance related to the disposal of a non-core facility.
During the first quarter of 2005, the Company approved the first phase of the downsizing operations in Corby, United Kingdom and other workforce reductions across the Company. The cash cost of these initiatives, estimated at $3.8 million, was recorded in the first quarter. The non-cash cost of these initiatives included $0.4 million for the curtailment of one of the Company's Canadian pension plans.
The 2005 restructuring initiatives affected 1,131 employees in total, of which 951 jobs have been eliminated as of December 31, 2005 and 180 are still to come in 2006. However, the Company estimated that 83 new jobs would be created in other facilities.
Prior years' restructuring initiatives
In 2005, the Company recorded $11.5 million resulting from the continuation of the 2004 initiatives and $2.2 million for the pension obligation related to the Effingham multiemployer benefit plan. The review and execution of the prior years' initiatives resulted in a net reversal of $0.5 million comprised of a cash overspending of $3.4 million, and $3.9 million reversal of prior years' restructuring and other charges.
During the fourth quarter of 2005, the Company recorded $1.1 million resulting from the continuation of the 2004 initiatives mainly in Sweden and a net overspending of $0.8 million on leasing and facility costs in North America resulting from the execution of prior year initiatives.
In summary, 335 jobs were eliminated in 2005 as a result of the execution of prior year initiatives and 32 are still to come in 2006.
YEAR 2004
In 2004, the Company recorded impairment of assets, restructuring and other charges of $122.1 million, of which $6.5 million was related to discontinued operations. Non-cash items amounted to $83.3 million, of which $4.3 million was related to discontinued operations and cash items amounted to $38.8 million with $2.2 million related to discontinued operations.
Impairment of assets
The execution of the 2004 restructuring initiatives resulted in certain long-lived assets being permanently idled. In addition, the initiatives and other events triggered a recoverability test on other groups of assets. Accordingly, for the year, the Company recorded an impairment of long-lived assets of $73.3 million of which $4.3 million were related to discontinued operations and $1.1 million of impairment on other assets.
2004 restructuring initiatives
During the fourth quarter, the Company recorded cash costs of $13.0 million, of which $0.4 million was for discontinued operations. The $13.0 million included $9.7 million for new initiatives and $3.3 million resulting from the continuation of the second and third quarter initiatives. Restructuring initiatives were pursued and resulted in the approval of the consolidation of four small facilities in North America, one in Europe and other workforce reductions across the Company. The cash costs of these initiatives were estimated at $14.5 million, of which $9.7 million was recorded in the fourth quarter. The non-cash cost of these initiatives included $0.9 million for the curtailment of one of the Company's U.S. pension plans.
In the third quarter, the Company approved the closure of the Stockholm facility in Sweden, the consolidation of a small facility in North America and other workforce reductions across the Company. The cash cost of these initiatives included $0.1 million related to discontinued operations and was initially estimated at $17.5 million, of which $6.9 million, mostly related to workforce reductions, was recorded in the third quarter. The Company also recorded $1.4 million resulting from the continuation of the second quarter initiatives and $2.7 million for the pension obligation related to the Effingham multi-employer benefit plan.
In the second quarter of 2004, the Company initiated other restructuring initiatives to improve asset utilization and enhance efficiency. The restructuring initiatives included the closure of the Effingham, IL facility in the Magazine platform, an important downsizing at the Kingsport, TN facility in the Book platform and other workforce reductions across the Company. The cash cost of these initiatives was initially estimated at $18.3 million, of which $11.2 million that included $1.6 million for discontinued operations, was recorded in the second quarter of 2004. These costs excluded a pension obligation related to the Effingham multi-employer benefit plan that could not be reasonably estimated at that time. The non-cash cost of these initiatives included $8.0 million for the curtailment and settlement of one of the Company's U.S. pension plans.
In the first quarter of 2004, the Company initiated restructuring initiatives and recorded $5.0 million for workforce reductions of which $0.1 million was related to discontinued operations.
Prior years' restructuring initiatives
In 2004, the review and execution of the prior years' initiatives resulted in a net reversal of $1.4 million comprised of a cash overspending of $6.6 million, and $8.0 million reversal of prior years' restructuring and other charges, mostly due to the cancellation of the termination of 75 employee positions.
27
In 2003, the company recorded an impairment of assets, restructuring and other charges of $98.3 million, of which $3.8 million was related to discontinued operations. Non-cash items amounted to $60.4 million, and cash items to $37.9 million. Of the $37.9 million in cash items, $31.7 million was spent in North America, including $3.1 million related to discontinued operations, $1.8 million in Europe and $3.6 million in Latin America.
Impairment of assets
During 2003, the Company reviewed the status of long-lived assets. Accordingly, the Company recorded an impairment of long-lived assets of $60.4 million. The $60.4 million included $46.7 million for North America of which $0.7 million was related to discontinued operations, $5.0 million to Europe and $8.2 million to Latin America.
2003 restructuring initiatives
In 2003, the Company continued its restructuring initiatives and recorded a cash cost of $38.9 million consisting of $33.1 million in workforce reductions and $5.8 million of additional closure costs of four smaller facilities. The restructuring charge related to discontinued operations was $3.1 million.
Prior years' restructuring initiatives
In 2003, the review and the execution of the 2002 and 2001 initiatives resulted in a net reversal of $1.0 million comprised of a cash overspending of $12.9 million and a $13.9 million reversal of prior years' restructuring and other charges. The cash overspending was related to the cost of closed facilities not yet disposed of, office leases not yet subleased, and other initiatives completed in 2005.
CONTINUITY OF THE RESERVE FOR RESTRUCTURING AND OTHER CHARGES
As at January 1, 2005, the balance of the restructuring reserve was $35.2 million. This amount related mostly to workforce reductions across the platform and lease and facility carrying costs. The Company utilized $49.9 million of the current and prior years' restructuring and other charges reserves during the twelve-month period ended December 31, 2005 and has a balance of $27.9 million at period end. Further to the disbursement of $27.9 million, $8.7 million of restructuring charges related to the 2005 and 2004 initiatives remain to be recorded in 2006 when the liabilities related to the initiatives will have been contracted.
FINANCIAL INSTRUMENTS
The Company uses a number of financial instruments including: cash and cash equivalents, trade receivables, receivables from related parties, bank indebtedness, trade payables, accrued liabilities, payables to related parties, long-term debt and convertible notes. The carrying amounts of these financial instruments, except for long-term debt and convertible notes, approximate their fair values due to their short-term nature. The fair values of long-term debt and convertible notes are estimated based on discounted cash flows using period-end market yields of similar instruments with the same maturity.
The Company uses various derivative financial instruments to manage its exposure to fluctuations in foreign currency exchange rates, interest rates and commodity prices. The Company does not hold or use any derivative instruments for speculative purposes and adheres to a financial risk management policy.
The Company manages interest rate exposure by having a balanced schedule of debt maturities, as well as a combination of fixed and floating interest rate obligations. In addition, the Company has entered into interest rate swap agreements to manage this exposure. Contracts outstanding at December 31, 2005 had a notional value of $233 million. Interest expense is adjusted to include amounts payable or receivable under the swap agreements. The total adjustment recorded to interest expense was a charge of $1 million for 2005 (a revenue of $2 million for 2004).
The Company enters into foreign-exchange forward contracts to hedge foreign denominated sales and related receivables and equipment purchases. The contracts outstanding at December 31, 2005 had a notional value of $370 million and expire in 2006 and 2007. The foreign exchange translation gains and losses and the deferred premiums and discounts are recognized as an adjustment to the corresponding revenues and exchange gain or losses when the transaction is recorded. The total amounts recorded to these accounts for 2005 for these contracts were a revenue of $24 million for foreign-denominated sales, and a loss of $1 million for equipment purchases (a revenue of $18 million, and a gain of $2 million, respectively for 2004). For Canada and Europe, the foreign-denominated revenues as a percentage of their total revenues were approximately 27% and 11%, respectively in 2005. The forward contracts used to manage exposure to currency fluctuations with respect to these foreign-denominated sales and related receivables were settled with highly favorable results in the current year. As we enter into 2006, the Company expects a lower level of revenues in its mitigation of exchange rate risk from foreign exports as a result of having fewer hedges in place and less favorable rates compared to 2005.
Fair Value of Derivative Financial Instruments
(Continuing Operations)
($ millions)
| | 2005 | 2004 | ||||||||||||
|---|---|---|---|---|---|---|---|---|---|---|---|---|---|---|
| | Book Value | Fair Value | Book Value | Fair Value | ||||||||||
| Derivative financial instruments | ||||||||||||||
| Interest rate swap agreements | $ | — | $ | (10.4 | ) | $ | — | $ | (5.1 | ) | ||||
| Foreign exchange forward contracts | 4.7 | 15.5 | 72.8 | 109.8 | ||||||||||
| Cross currency interest rate swaps | 3.6 | 3.6 | (16.7 | ) | (16.7 | ) | ||||||||
| Commodity swaps | (0.1 | ) | (0.5 | ) | (0.1 | ) | (1.4 | ) | ||||||
Figure 12
28
In February 2005, the Company sold foreign exchange forward contracts that were used to hedge its net investment in a foreign subsidiary for a cash consideration of $69 million. These foreign exchange forward contracts were already recorded at the fair market value and all resulting gains were previously recorded in cumulative translation adjustment.
The Company enters into foreign-exchange forward contracts and cross currency swaps to hedge foreign denominated asset exposures. The contracts outstanding at December 31, 2005 had a notional value of $344 million and $67 million, respectively and expire in 2006. The foreign exchange gains and losses on such foreign denominated assets are recorded to income. The changes in the fair value of the derivative instruments are also recorded to income to compensate the foreign exchange gain and loss on the translation of the foreign denominated assets. The total adjustment recorded to derivative gain or loss related to these contracts for 2005 was a gain of $48 million (a loss of $28 million for 2004).
The Company also enters into natural gas swap contracts to manage its exposure to the price of this commodity. Contracts outstanding at December 31, 2005 cover a notional quantity of 176,000 gigajoules in Canada and 2,201,000 MMBTU in the United States. These contracts expire between January 2006 and June 2008. Natural gas cost is adjusted to include amounts payable or receivable under the commodity hedge agreements. The total adjustment to gas cost for 2005 was a gain of $8 million (a gain of $2 million for 2004).
While the counterparties of these agreements expose the Company to credit loss in the event of non-performance, the Company believes that the possibility of incurring such a loss is remote due to the creditworthiness of the counterparties. Realized and unrealized gains or losses associated with derivative instruments, which have been terminated or have ceased to be effective prior to maturity, are deferred on the balance sheet and recognized in income during the period in which the underlying hedged transaction is recognized. For 2005, the total amount deferred as a liability in relation to terminated derivative instruments was $7 million ($9 million for 2004) and the total amount recognized as income was $2 million ($6 million for 2004).
The fair values of the derivative financial instruments are estimated using period-end market rates and reflect the amount that the Company would receive or pay if the instruments were closed out at these dates (Figure 12).
OFF-BALANCE SHEET ARRANGEMENTS
GUARANTEES
In the normal course of business, the Company enters into numerous agreements that contingently require it to make payments to a third party based on changes in an underlying item that is related to an asset, a liability or an equity of the guaranteed party, or failure of another party to perform under an obligating agreement.
The Company has provided significant guarantees to third parties including the following:
Operating Leases
The Company has guaranteed a portion of the residual values of certain assets under operating leases with expiry dates between 2007 and 2009, for the benefit of the lessor. If the fair value of the assets, at the end of their respective lease term is less than the residual value guaranteed, then the Company must, under certain conditions, compensate the lessor for a portion of the shortfall. The maximum exposure under these guarantees is $67.0 million. Of this amount, $61.9 million will expire in 2007. As at December 31, 2005, the Company has recorded a liability of $7.8 million associated with these guarantees.
Sub-Lease Agreements
The Company has, for some of its assets under operating leases, entered into sub-lease agreements with expiry dates between 2006 and 2008. If the sub-lessee defaults under the agreements, the Company must, under certain conditions, compensate the lessor for the defaults. The maximum exposure under these guarantees is $6.6 million. As at December 31, 2005, the Company had not recorded a liability associated with these guarantees, other than that provided for under unfavourable leases of $1.2 million, since it was not likely at that time that the sub-lessee would default under the agreement and that the Company would thus be required to honour the initial obligation. Recourse against the sub-lessee is also available, up to the total amount due.
Business and Real Estate Disposals
In connection with certain dispositions of businesses or real estate (note 7), the Company has provided customary representations and warranties whose terms range in duration and may not be explicitly defined. The Company has also retained certain liabilities for events occurring prior to sale, relating to tax, environmental, litigation and other matters. Generally, the Company has indemnified the purchasers in the event that a third party asserts a claim against the purchaser that relates to a liability retained by the Company.
These types of indemnification guarantees typically extend for a number of years. The nature of these indemnification agreements prevents the Company from estimating the maximum potential liability that it could be required to pay to guaranteed parties. These amounts are dependent upon the outcome of future contingent events, the nature and likelihood of which cannot be determined at this time.
Historically, the Company has not made any significant indemnification payments under such agreements and no amount has been accrued in the consolidated balance sheet with respect to these indemnification guarantees as at December 31, 2005. The Company continues to monitor the conditions that are subject to guarantees and indemnifications to identify whether it is probable that a loss has occurred and if so, would recognize any such losses under any guarantees or indemnifications when those losses are probable and estimable.
Debt Agreements
Under the terms of certain debt agreements, the Company has guaranteed the obligation of its US subsidiaries. In this context, the Company would have to indemnify the other parties against changes in regulation relative to withholding taxes, which would occur only if the Company was to make the payments on behalf of its US subsidiaries. These indemnifications extend for the term of the related financings and do not provide a limit on the maximum potential liabilities. The nature of the indemnification agreements prevents the Company from estimating the maximum potential liability it could be required to pay. However, the majority of the obligations to which such guarantees apply contain make-whole provisions which effectively limit the exposure associated with such an occurrence. Moreover, within the current structure of the transactions, the Company is not exposed to such liabilities. As such, the Company has not accrued any amount in the consolidated balance sheet with respect to this item.
29
Irrevocable standby letters of credit
The Company and certain of its subsidiaries have granted irrevocable standby letters of credit, issued by highly rated financial institutions, to third parties to indemnify them in the event the Company does not perform its contractual obligations. As of December 31, 2005, the guarantee instruments amounted to $86 million and were mainly related to worker's compensation liabilities. An amount of $33 million of cash was pledged at that date as collateral for one of the irrevocable standby letters of credit. The Company has not recorded an additional liability with respect to these guarantees, as the Company does not expect to make any payments in excess of what is recorded on the Company's financial statements. The guarantee instruments mature at various dates in fiscal 2006 and 2007.
ASSET SECURITIZATION
The Company is a party to securitization agreements to sell with limited recourse, and on a revolving basis, a portion of its Canadian, US, French and Spanish trade receivables, to unrelated trusts. The program limits under each of the Canadian, US and European securitization programs are Cdn$135 million, $510 million and 153 million Euros, respectively. The amounts outstanding under each program as at December 31, 2005 were Cdn$100 million, $467 million and 118 million Euros, respectively (Cdn$126 million, $500 million and 134 million Euros, respectively as at December 31, 2004).
As at December 31, 2005, the Company had a retained interest in the trade receivables sold of $133 million, which is recorded in the Company's trade receivables. As at December 31, 2005, an aggregate amount of $826 million ($936 million in 2004) of accounts receivable had been sold under the three programs, and securitization fees totalled $24 million for 2005 ($15 million for 2004). Servicing revenues and expenses did not have a material impact on the Company's results. The Company has amended its Canadian securitization program to accommodate its existing credit rating by DBRS.
In 2005, the Company renewed and amended its 1999 agreement to sell, with limited recourse, a portion of its U.S. trade receivables on a revolving basis. The $510 million program continues to be renewable annually and has been extended through September 29, 2006 with the option to extend the term for an additional year. The amendment allows for more flexibility in the Company's reporting requirements to the purchaser and maintains its liquidity horizon at 24 months.
The Company is subject to certain requirements under the securitization programs. In addition to financial covenants that mirror those contained in the bank facility, the Company is subject to other covenants typically found in securitization agreements. If such other covenants fail to be maintained, one or more of the securitization agreements could be terminated. If a termination event were to occur based on failure to meet one of these other covenants, the Company believes that it would be able to meet its cash obligations from other financing sources, such as its revolving bank facility, the issuance of debt or the issuance of equity.
LEASES
The Company rents premises and machinery and equipment under operating leases with third parties, which expire at various dates up to 2018 and for which undiscounted minimum lease payments total $334 million as at December 31, 2005. The minimum lease payments on continuing operations for the year 2005 were $85 million. Of the total minimum lease payments, approximately 50% is for machinery and equipment. The Company has guaranteed a portion of the total residual values for a maximum exposure of $67 million.
RELATED PARTY TRANSACTIONS
The Company has entered into transactions with the parent company and its other subsidiaries, which were accounted for at prices and conditions prevailing in the market. Intercompany revenues from the parent company's media subsidiaries involved mostly printing of magazines.
In March 2005, the Company sold certain operating assets to Quebecor Media inc., one of the parent company's subsidiaries, for a consideration of Cdn$3.3 million ($2.7 million). The transaction has been realized at the carrying amount and no gain or loss was recorded. In 2004, the Company transferred the benefit of a deduction for Part VI.I tax to subsidiaries of its parent company for a consideration of Cdn$12 million ($10 million), recorded in receivables from related parties. This reduced the Company's available future income tax assets by Cdn$13 million ($11 million), and decreased the additional paid-in capital by Cdn$0.6 million ($0.5 million). The transaction was recorded at the carrying amount. The 2004 transaction has been adjusted in 2005, resulting in a decrease of Cdn$0.2 million ($0.2 million) recorded in receivables from related parties and in the additional paid-in capital.
In 2004, the Company reached an agreement with one of the parent company's subsidiaries, Vidéotron Télécom Ltée (VTL), to outsource its information technology (IT) infrastructure and managed services in North America for a duration of 7 years in order to reduce the overall cost of its IT platform. As part of this agreement, VTL purchased a part of the Company's IT infrastructure equipment at a cost of $2 million. The outsourcing of services to VTL is estimated to cost the Company approximately $15 million annually. On January 1, 2006, VTL amalgamated with Vidéotron Ltée, another of the parent company's subsidiaries, to form Videotron Ltd. The transfer of equipment was completed in October 2004 and recorded at the carrying amount and no gain or loss was realized.
Related Party Transactions
($ millions)
| | 2005 | 2004 | 2003 | ||||||
|---|---|---|---|---|---|---|---|---|---|
| Year ended December 31, | |||||||||
| Revenues | $ | 64.9 | $ | 52.1 | $ | 42.5 | |||
| Purchases | 6.6 | 5.4 | 2.2 | ||||||
| Management fees billed by Quebecor inc. | 4.5 | 4.2 | 3.9 | ||||||
| IT services billed by VTL (net of incurred expenses billed to VTL of 3.5 (3.7 in 2004)) | 11.0 | 3.7 | — | ||||||
Figure 13
30
In 2000, the Company entered into a strategic agreement with Nurun inc. ("Nurun"). The agreement included a commitment from the Company to use Nurun services (information technology and E-Commerce services) for a minimum of $40 million over a five-year period. In 2004, an addendum was made to the agreement, extending the term for another five years from the date of the addendum. In addition, the minimum service revenues of $40 million committed to Nurun were modified to include services directly requested by the Company and its affiliates (Quebecor inc., Quebecor Media inc. and their subsidiaries) as well as business referred, under certain conditions, to Nurun by the Company and its affiliates. Finally, if the aggregate amount of the service revenues for the term of the agreement is lower than the minimum of $40 million, the Company has agreed to pay an amount to Nurun equal to 30% of the difference between the minimum guaranteed revenues and the aggregate amount of revenues. As of December 31, 2005, the cumulative services registered by Nurun, under this agreement, amounted to $11 million.
OUTSTANDING SHARE DATA
Figure 14 discloses the Company's outstanding share data as at January 30, 2006.
Outstanding Share Data($ millions and thousands of shares)
| | January 30, 2006 | ||||
|---|---|---|---|---|---|
| | Issued and outstanding shares | Book value | |||
| Equity Multiple Voting Shares | 46,987 | $ | 93.5 | ||
| Equity Subordinate Voting Shares | 84,085 | 1,140.0 | |||
| First Preferred Shares, Series 3 | 12,000 | 212.5 | |||
| First Preferred Shares, Series 4 | 8,000 | 130.2 | |||
| First Preferred Shares, Series 5 | 7,000 | 113.9 | |||
Figure 14
RISKS AND UNCERTAINTIES
The Company operates in the printing industry, which has a variety of risk factors and uncertainties. Due to the risks and uncertainties outlined below, the Company's operating environment and financial results may be materially affected.
SEASONALITY
The Company's business is sensitive to general economic cycles and may be adversely affected by the cyclical nature of the markets the Company serves as well as by local, regional, national and global economic conditions. The operations of the Company's business are seasonal, with a majority of historical operating income recognized in the second half of the fiscal year, primarily as a result of the higher number of magazine pages, new product launches and back-to-school, retail and holiday catalog promotions. Within any year, this seasonality could adversely affect the Company's cash flows and results of operations.
OPERATIONAL RISK
The industry that the Company operates is highly competitive in most print service categories and geographic regions. Competition is largely based on price, quality, range of services offered, distribution capabilities, customer service, availability of printing time on appropriate equipment and state-of-the-art technology. The Company competes for commercial business not only with large national printers, but also with smaller regional printers. Over the past four years, the printing industry has experienced a reduction in demand for printed materials and it is currently experiencing excess capacity. Furthermore, some of the industries that the Company services have been subject to consolidation efforts, leading to a smaller number of potential customers. Primarily as a result of this excess capacity and customer consolidation, there has been, and may continue to be, downward pricing pressures and increased competition in the printing industry. Any failure by the Company to compete effectively in the markets it serves could have an adverse, material effect on the results of operations, financial condition and cash flows.
The Company is unable to predict market conditions and only has a limited ability to affect changes in market conditions for printing services. The Company cannot be certain that prices and demand for printing services will not decline from current levels. Changes to the level of supply and demand could cause prices to continue to decline, and prolonged periods of low prices, weak demand and/or excess supply could have a material adverse effect on the Company's business growth, results of operations and liquidity.
In addition, a significant portion of the Company's revenues are derived from long-term contracts with important customers. If the company is unable to renew such contracts on similar terms and conditions, or at all, or if it is not awarded new long-term contracts with important customers in the future, its operating results, financial condition and cash flow may be significantly adversely affected.
INSURANCE
The Company is exposed, in the normal course of business, to a variety of operational risks, some of which are transferred to third parties by way of insurance agreements. It has also chosen to retain a portion of its losses in the form of self-insurance in order to reduce the cost of protecting such risks. The Company manages certain elements of its self-insurance retention through its captive insurance subsidiary.
The Company believes that it has in place a combination of third-party insurance and self-insurance that provides adequate protection against significant unexpected losses while minimizing costs and limiting its overall exposure.
RISKS ASSOCIATED WITH CAPITAL INVESTMENTS
Because production technologies continue to evolve, the Company must make capital expenditures to maintain its facilities and may be required to make significant capital expenditures to remain technologically and economically competitive. The Company may therefore be required to invest significant amounts of capital in improving production technologies. If the Company cannot obtain adequate capital, the operating results and financial condition may be adversely affected.
The Company is also subject to certain risks associated with the installation of new technology and equipment which may cause temporary disruption of operations and losses from operational inefficiencies. These disruptions are closely monitored in order to bring them under control within a short period of time. The impact on operational efficiency is affected by the length of the period of remediation.
31
ENVIRONMENTAL RISK
The Company is subject to various laws, regulations and government policies relating to the generation, storage, transportation and disposal of solid waste, to air and water releases of various substances into the environment and to the protection of the environment in general. The Company believes it is in compliance with applicable laws and requirements in all material respects.
The Company is also subject to various laws and regulations, which allow regulatory authorities to compel (or seek reimbursement for) cleanup of environmental contamination at the Company's own sites and at off-site facilities where its waste is or has been disposed of. The Company has established a provision for expenses associated with environmental remediation obligations, as well as other environmental matters when such amounts can be reasonably estimated. The amount of the provision is adjusted, as new information is known. The Company believes the provision is adequate to cover the potential costs associated with those contamination issues.
The Company expects to incur ongoing capital and operating costs to maintain compliance with existing and future applicable environmental laws and requirements. Furthermore, the Company does not anticipate that maintaining compliance with such environmental statutes will have a material adverse effect upon the Company's competitive or consolidated financial position. The Company believes that it has internal controls and personnel dedicated to compliance with all applicable environment laws and that it provides for adequate monitoring and management of the environmental risk related to its operations. For 2005, the Company believes that there are no new environmental matters (environmental incident, promulgation of new environmental laws and regulations, soil and underground contamination discovery, etc.) to be reported that could have a material impact on the Company's consolidated financial statements.
LABOR AGREEMENTS
While relations with employees have been stable to date and there has not been any material disruption in operations resulting from labor disputes, the Company cannot be certain that it will be able to maintain a productive and efficient labor environment. The Company cannot predict the outcome of any future negotiations relating to the renewal of the collective bargaining agreements, nor can it assure with certainty that work stoppages, strikes or other forms of labor protests pending the outcome of any future negotiations would not occur. Any strikes or other forms of labor protests in the future could disrupt the Company's operations and may have a material impact on business, financial condition or operating results.
As of December 31, 2005, the Company had 61 collective bargaining agreements in North America. Furthermore, 11 collective bargaining agreements were under negotiation at December 31, 2005 (7 of these agreements expired in 2005 and 4 expired prior to 2005). Two of the agreements under negotiation, covering approximately 400 employees, are first-time labor agreements. In addition, 22 collective bargaining agreements, covering approximately 2,450 employees, will expire in 2006. The Company has approximately 24,500 employees in North America. Of this number, approximately 8,600 employees are unionized. Moreover, 69 of the plants and related facilities in North America are non-unionized.
COMMODITY RISK
The Company uses paper and ink as its primary raw materials. The price of paper is volatile over time and may cause significant fluctuations in the Company's net sales and cost of sales. The Company uses its purchasing power as one of the major buyers in the printing industry to obtain the best prices, terms, quality control and service. To maximize its purchasing power, the Company also negotiates with a limited number of suppliers. In addition, most of the Company's long-term contracts with its customers include price-adjustment clauses based on the cost of materials. The Company believes that it has adequate allocations with paper and ink suppliers to meet the needs of its customers.
In addition, fuel and other energy costs represent a significant portion of the Company's overall costs. The Company may not be able to pass along a substantial portion of the rise in the price of fuel and other energy costs directly to its customers. In that instance, increases in fuel and other energy costs, particularly resulting from increased natural gas prices, could adversely affect operating costs or customer demand and thereby negatively impact the Company's operating results, financial condition or cash flows.
CREDIT RISK
The Company estimates that concentrations of credit risk with respect to trade receivables are limited due to its diverse operations and large customer base. The total sales related to the Company's top 100 customers represented approximately 45% of total revenues in 2005. As of December 31, 2005, the Company has no significant concentrations of credit risk and believes that the product and geographic diversity of its customer base reduces credit risk, as well as having a positive impact on local markets or product-line demand.
FINANCIAL RISK
The Company is exposed to a number of risks associated with fluctuations in foreign currency exchange rates, interest rates and commodity prices. The Company uses a number of derivative financial instruments to mitigate these risks such as foreign exchange forward contracts and cross currency swaps, interest rate swap agreements and commodity swap agreements. For more information, refer to the section entitled "Financial Instruments". The Company has established operating policies and processes, which prohibit the speculative use of financial instruments, document critical transactions and demonstrate the effectiveness of the financial instruments.
RECENT ACCOUNTING PRONOUNCEMENTS AND CHANGES IN ACCOUNTING POLICIES
Significant differences between Generally Accepted Accounting Principles (GAAP) in Canada and the United States are presented in Note 23 to the Consolidated Financial Statements. The Company generates approximately 65% of its revenues from the United States. In an effort to expand its investor base in the United States, the Company has made efforts to follow new disclosure guidelines and to harmonize disclosure based on accounting pronouncements in both Canada and the United States.
32
In January 2005, the CICA published Section 3855, Financial Instruments — Recognition and Measurement, Section 3865, Hedges, and Section 1530, Comprehensive Income. Section 3855 sets forth standards governing when and in what amount a financial instrument is to be recorded on the balance sheet. Financial instruments are to be recognized at fair value in some cases, at cost-based value in others. The section also sets forth standards for reporting gains and losses on financial instruments. Section 3865 is an optional application that allows entities to apply treatments other than those provided under Section 3855 to eligible operations they choose to designate, for accounting purposes, as being part of a hedging relationship. It expands on the guidance in Accounting Guideline 13, Hedging Relationships, and Section 1650, Foreign Currency Translation, specifying the application of hedge accounting and the information that is to be reported by the entity. Section 1530 sets forth a new requirement that certain gains and losses be temporarily accumulated outside net income and recognized in other comprehensive income. Application of these sections to interim and annual financial statements for financial periods beginning on or after October 1, 2006 will be mandatory. The Company is currently evaluating the impact of the new standards.
In June 2005, the CICA issued Section 3831, Non-Monetary Transactions. This revised standard requires all non-monetary transactions to be measured at fair value, subject to certain restrictions. This revised standard is effective for non-monetary transactions initiated in fiscal periods beginning on or after January 1, 2006 and early adoption is permitted only as of the beginning of a fiscal period beginning on or after July 1, 2005. The Company is currently evaluating the impact of this new standard.
ADDITIONAL INFORMATION
Additional information relating to the Company, including its most recent annual information form, is available on SEDAR at www.sedar.com and on EDGAR at www.sec.gov.
Montreal, Canada
February 16, 2006
33
MANAGEMENT'S RESPONSIBILITY FOR FINANCIAL STATEMENTS
The accompanying consolidated financial statements of Quebecor World Inc. and its subsidiaries are the responsibility of management and are approved by the Board of Directors of Quebecor World Inc.
These financial statements have been prepared by management in conformity with Canadian generally accepted accounting principles and include amounts that are based on best estimates and judgments.
Management of the Company and of its subsidiaries, in furtherance of the integrity and objectivity of data in the financial statements, have developed and maintain systems of internal accounting controls and support a program of internal audit. Management believes that the systems of internal accounting controls provide reasonable assurance that financial records are reliable and form a proper basis for the preparation of the financial statements and that assets are properly accounted for and safeguarded.
The Board of Directors carries out its responsibility for the financial statements principally through its Audit Committee, consisting solely of outside directors. The Audit Committee reviews the Company's annual consolidated financial statements and formulates the appropriate recommendations to the Board of Directors. The auditors appointed by the shareholders have full access to the Audit Committee, with and without management being present.
These financial statements have been examined by the auditors appointed by the shareholders, KPMG LLP, chartered accountants, and their report is presented hereafter.
| /s/ Brian Mulroney The Right Honourable Brian Mulroney Chairman of the Board | /s/ Jacques Mallette Jacques Mallette Executive Vice President and Chief Financial Officer | /s/ Mario Saucier Mario Saucier Senior Vice President and Chief Accounting Officer |
Montreal, Canada
February 16, 2006
AUDITORS' REPORT TO THE SHAREHOLDERS
We have audited the consolidated balance sheets of Quebecor World Inc. and its subsidiaries as at December 31, 2005 and 2004 and the consolidated statements of income, shareholders' equity and cash flows for the years ended December 31, 2005, 2004 and 2003. These financial statements are the responsibility of the Company's management. Our responsibility is to express an opinion on these financial statements based on our audits.
We conducted our audits in accordance with Canadian generally accepted auditing standards. Those standards require that we plan and perform an audit to obtain reasonable assurance whether the financial statements are free of material misstatement. An audit includes examining, on a test basis, evidence supporting the amounts and disclosures in the financial statements. An audit also includes assessing the accounting principles used and significant estimates made by management, as well as evaluating the overall financial statement presentation.
In our opinion, these consolidated financial statements present fairly, in all material respects, the financial position of the Company as at December 31, 2005 and 2004 and the results of its operations and its cash flows for the years ended December 31, 2005, 2004 and 2003 in accordance with Canadian generally accepted accounting principles.
![]()
Chartered Accountants
Montreal, Canada
February 10, 2006
34
CONSOLIDATED STATEMENTS OF INCOME
Years ended December 31
(in millions of US dollars, except per share amounts)
| | Note | 2005 | 2004 | 2003 | |||||||||
|---|---|---|---|---|---|---|---|---|---|---|---|---|---|
| Revenues | $ | 6,283.3 | $ | 6,339.5 | $ | 6,048.1 | |||||||
| Operating expenses: | |||||||||||||
| Cost of sales | 5,201.0 | 5,097.5 | 4,909.3 | ||||||||||
| Selling, general and administrative | 396.8 | 431.5 | 493.8 | ||||||||||
| Securitization fees | 23.8 | 14.5 | 13.7 | ||||||||||
| Depreciation and amortization | 304.2 | 324.9 | 324.9 | ||||||||||
| Impairment of assets, restructuring and other charges | 2 | 94.2 | 115.6 | 94.5 | |||||||||
| Goodwill impairment charge | 12 | 243.0 | — | — | |||||||||
| 6,263.0 | 5,984.0 | 5,836.2 | |||||||||||
| Operating income | 20.3 | 355.5 | 211.9 | ||||||||||
| Financial expenses | 3 | 119.0 | 133.1 | 204.5 | |||||||||
| Income (loss) from continuing operations before income taxes | (98.7 | ) | 222.4 | 7.4 | |||||||||
| Income taxes | 4 | 50.4 | 77.0 | 37.0 | |||||||||
| Income (loss) from continuing operations before minority interest | (149.1 | ) | 145.4 | (29.6 | ) | ||||||||
| Minority interest | (0.3 | ) | 5.5 | 3.1 | |||||||||
| Net income (loss) from continuing operations | (148.8 | ) | 139.9 | (32.7 | ) | ||||||||
| Net income (loss) from discontinued operations (net of tax) | 7 | (13.8 | ) | 3.8 | 1.3 | ||||||||
| Net income (loss) | $ | (162.6 | ) | $ | 143.7 | $ | (31.4 | ) | |||||
| Net income available to holders of preferred shares | 39.6 | 37.5 | 36.5 | ||||||||||
| Net income (loss) available to holders of equity shares | $ | (202.2 | ) | $ | 106.2 | $ | (67.9 | ) | |||||
| Earnings (loss) per share: | 5 | ||||||||||||
| Basic and Diluted: | |||||||||||||
| Continuing operations | $ | (1.43 | ) | $ | 0.77 | $ | (0.51 | ) | |||||
| Discontinued operations | (0.10 | ) | 0.03 | 0.01 | |||||||||
| $ | (1.53 | ) | $ | 0.80 | $ | (0.50 | ) | ||||||
| Weighted average number of equity shares outstanding: | 5 | ||||||||||||
| (in millions) | |||||||||||||
| Basic | 131.8 | 132.4 | 136.0 | ||||||||||
| Diluted | 131.8 | 132.6 | 136.0 | ||||||||||
See Notes to Consolidated Financial Statements.
35
CONSOLIDATED STATEMENTS OF SHAREHOLDERS' EQUITY
Years ended December 31
(in millions of US dollars, except per share amounts)
| | Note | Capital stock | Additional paid-in capital | Retained earnings | Translation adjustment | Total shareholders' equity | ||||||||||||
|---|---|---|---|---|---|---|---|---|---|---|---|---|---|---|---|---|---|---|
| Balance, December 31, 2002 | $ | 1,813.9 | $ | 103.6 | $ | 901.9 | $ | (115.6 | ) | $ | 2,703.8 | |||||||
| Net loss | — | — | (31.4 | ) | — | (31.4 | ) | |||||||||||
| Reduction of a net investment in self-sustaining foreign operations | 3, 18 | — | — | — | 5.3 | 5.3 | ||||||||||||
| Translation adjustment | 18 | — | — | — | 91.1 | 91.1 | ||||||||||||
| Shares repurchased | 16, 18 | (134.3 | ) | — | (39.3 | ) | — | (173.6 | ) | |||||||||
| Shares issued from stock plans | 16 | 13.5 | — | — | — | 13.5 | ||||||||||||
| Related party transactions | 21 | — | 0.4 | — | — | 0.4 | ||||||||||||
| Stock-based compensation | 17 | — | 1.9 | — | — | 1.9 | ||||||||||||
| Dividends on equity shares ($0.52 per share) | — | — | (71.1 | ) | — | (71.1 | ) | |||||||||||
| Dividends on preferred shares ($1.17 (Cdn $1.63) per share) | — | — | (36.5 | ) | — | (36.5 | ) | |||||||||||
| | | |||||||||||||||||
| Balance, December 31, 2003 | $ | 1,693.1 | $ | 105.9 | $ | 723.6 | $ | (19.2 | ) | $ | 2,503.4 | |||||||
| Net income | — | — | 143.7 | — | 143.7 | |||||||||||||
| Reduction of a net investment in self-sustaining foreign operations | 3, 18 | — | — | — | (1.0 | ) | (1.0 | ) | ||||||||||
| Translation adjustment | 18 | — | — | — | 56.8 | 56.8 | ||||||||||||
| Shares issued from stock plans | 16 | 12.2 | — | — | — | 12.2 | ||||||||||||
| Related party transactions | 21 | — | (0.5 | ) | — | — | (0.5 | ) | ||||||||||
| Stock-based compensation | 17 | — | 4.3 | — | — | 4.3 | ||||||||||||
| Dividends on equity shares ($0.52 per share) | — | — | (68.8 | ) | — | (68.8 | ) | |||||||||||
| Dividends on preferred shares ($1.26 (Cdn $1.63) per share) | — | — | (37.5 | ) | — | (37.5 | ) | |||||||||||
| | | |||||||||||||||||
| Balance, December 31, 2004 | $ | 1,705.3 | $ | 109.7 | $ | 761.0 | $ | 36.6 | $ | 2,612.6 | ||||||||
| Net loss | — | — | (162.6 | ) | — | (162.6 | ) | |||||||||||
| Translation adjustment | 18 | — | — | — | (57.0 | ) | (57.0 | ) | ||||||||||
| Shares repurchased | 16, 18 | (33.0 | ) | — | (9.8 | ) | (3.8 | ) | (46.6 | ) | ||||||||
| Shares issued from stock plans | 16 | 16.3 | — | — | — | 16.3 | ||||||||||||
| Related party transactions | 21 | — | (0.2 | ) | — | — | (0.2 | ) | ||||||||||
| Stock-based compensation | 17 | — | 1.1 | — | — | 1.1 | ||||||||||||
| Dividends on equity shares ($0.56 per share) | — | — | (73.4 | ) | — | (73.4 | ) | |||||||||||
| Dividends on preferred shares ($1.33 (Cdn $1.63) per share) | — | — | (39.6 | ) | — | (39.6 | ) | |||||||||||
| | | |||||||||||||||||
| Balance, December 31, 2005 | $ | 1,688.6 | $ | 110.6 | $ | 475.6 | $ | (24.2 | ) | $ | 2,250.6 | |||||||
| | | |||||||||||||||||
See Notes to Consolidated Financial Statements.
36
CONSOLIDATED STATEMENTS OF CASH FLOWS
Years ended December 31
(in millions of US dollars)
| | Note | 2005 | 2004 | 2003 | ||||||||||
|---|---|---|---|---|---|---|---|---|---|---|---|---|---|---|
| Operating activities: | ||||||||||||||
| Net income (loss) | $ | (162.6 | ) | $ | 143.7 | $ | (31.4 | ) | ||||||
| Non-cash items in net income (loss): | ||||||||||||||
| Depreciation of property, plant and equipment | 308.1 | 334.5 | 333.2 | |||||||||||
| Impairment of assets and non-cash portion of restructuring and other charges | 2 | 53.9 | 83.3 | 60.4 | ||||||||||
| Goodwill impairment charge | 12 | 243.0 | — | — | ||||||||||
| Future income taxes | 4 | (20.7 | ) | 42.8 | 15.1 | |||||||||
| Amortization of deferred charges | 27.3 | 27.0 | 26.2 | |||||||||||
| Loss on business disposals | 7 | 1.1 | — | — | ||||||||||
| Loss on extinguishment of long-term debt | 3 | — | 2.0 | 30.2 | ||||||||||
| Other | 5.1 | 13.8 | 16.0 | |||||||||||
| Changes in non-cash balances related to operations: | ||||||||||||||
| Trade receivables | (30.9 | ) | (28.8 | ) | 157.0 | |||||||||
| Inventories | 26.1 | (6.1 | ) | 30.8 | ||||||||||
| Trade payables and accrued liabilities | (27.3 | ) | (83.1 | ) | (121.4 | ) | ||||||||
| Other current assets and liabilities | 53.5 | 46.3 | (56.3 | ) | ||||||||||
| Other non-current assets and liabilities | (7.1 | ) | (87.6 | ) | 1.5 | |||||||||
| 14.3 | (159.3 | ) | 11.6 | |||||||||||
| Cash provided by operating activities | 469.5 | 487.8 | 461.3 | |||||||||||
Financing activities: | ||||||||||||||
| Net change in bank indebtedness | — | (1.3 | ) | 1.0 | ||||||||||
| Net proceeds from issuance of equity shares | 16 | 16.3 | 12.2 | 13.5 | ||||||||||
| Repurchase of shares for cancellation | 16 | (46.6 | ) | — | (173.6 | ) | ||||||||
| Issuance of long-term debt | 13 | — | — | 592.0 | ||||||||||
| Repayments of long-term debt | (19.2 | ) | (218.3 | ) | (582.4 | ) | ||||||||
| Net (repayments) borrowings under revolving bank facility and commercial paper | (88.4 | ) | 110.0 | 108.9 | ||||||||||
| Dividends on equity shares | (73.4 | ) | (68.8 | ) | (71.1 | ) | ||||||||
| Dividends on preferred shares | (39.6 | ) | (38.8 | ) | (37.7 | ) | ||||||||
| Dividends to minority shareholders | — | (0.8 | ) | (0.4 | ) | |||||||||
| Other | — | — | 5.7 | |||||||||||
| Cash used in financing activities | (250.9 | ) | (205.8 | ) | (144.1 | ) | ||||||||
Investing activities: | ||||||||||||||
| Business acquisitions, net of cash and cash equivalents | 6 | (7.0 | ) | (50.5 | ) | (7.5 | ) | |||||||
| Net proceeds from business disposals, net of cash and cash equivalents | 7 | 66.9 | — | — | ||||||||||
| Additions to property, plant and equipment | (394.0 | ) | (132.6 | ) | (243.1 | ) | ||||||||
| Net proceeds from disposal of assets | 16.4 | 3.0 | 2.8 | |||||||||||
| Net proceeds from disposal of derivative financial instruments | 19 | 69.2 | — | — | ||||||||||
| Restricted cash | 8 | (26.1 | ) | (7.0 | ) | — | ||||||||
| Other | — | — | (0.8 | ) | ||||||||||
| Cash used in investing activities | (274.6 | ) | (187.1 | ) | (248.6 | ) | ||||||||
| Effect of foreign currency | 22.5 | (58.2 | ) | (56.2 | ) | |||||||||
| Net increase (decrease) in cash and cash equivalents | (33.5 | ) | 36.7 | 12.4 | ||||||||||
| Cash and cash equivalents, beginning of year | 51.8 | 15.1 | 2.7 | |||||||||||
| Cash and cash equivalents, end of year | $ | 18.3 | $ | 51.8 | $ | 15.1 | ||||||||
See Notes to Consolidated Financial Statements.
37
December 31
(in millions of US dollars)
| | Note | 2005 | 2004 | ||||||
|---|---|---|---|---|---|---|---|---|---|
| Assets | |||||||||
| Current assets: | |||||||||
| Cash and cash equivalents | $ | 18.3 | $ | 51.8 | |||||
| Restricted cash | 8 | 33.1 | 7.0 | ||||||
| Trade receivables | 9 | 429.9 | 400.4 | ||||||
| Receivables from related parties | 21 | 14.3 | 19.7 | ||||||
| Inventories | 10 | 364.4 | 419.5 | ||||||
| Income taxes receivable | 3.0 | 33.0 | |||||||
| Future income taxes | 4 | 34.4 | 43.2 | ||||||
| Prepaid expenses | 18.9 | 24.5 | |||||||
| Total current assets | 916.3 | 999.1 | |||||||
| Property, plant and equipment, net | 11 | 2,295.9 | 2,373.6 | ||||||
| Goodwill | 12 | 2,305.7 | 2,651.9 | ||||||
| Other assets | 187.7 | 249.2 | |||||||
| Total assets | $ | 5,705.6 | $ | 6,273.8 | |||||
Liabilities and Shareholders' Equity | |||||||||
| Current liabilities: | |||||||||
| Trade payables and accrued liabilities | $ | 872.9 | $ | 931.9 | |||||
| Payables to related parties | 8.4 | 2.7 | |||||||
| Income and other taxes payable | 84.5 | �� | 83.7 | ||||||
| Future income taxes | 4 | 1.7 | 4.4 | ||||||
| Current portion of long-term debt | 13 | 7.7 | 11.7 | ||||||
| Total current liabilities | 975.2 | 1,034.4 | |||||||
| Long-term debt | 13 | 1,731.9 | 1,825.8 | ||||||
| Other liabilities | 14 | 259.3 | 277.5 | ||||||
| Future income taxes | 4 | 372.5 | 402.6 | ||||||
| Convertible notes | 15 | 115.5 | 112.6 | ||||||
| Minority interest | 0.6 | 8.3 | |||||||
| Shareholders' equity: | |||||||||
| Capital stock | 16 | 1,688.6 | 1,705.3 | ||||||
| Additional paid-in capital | 110.6 | 109.7 | |||||||
| Retained earnings | 475.6 | 761.0 | |||||||
| Translation adjustment | 18 | (24.2 | ) | 36.6 | |||||
| 2,250.6 | 2,612.6 | ||||||||
| Total liabilities and shareholders' equity | $ | 5,705.6 | $ | 6,273.8 | |||||
See Notes to Consolidated Financial Statements.
On behalf of the Board:
/s/ Brian Mulroney The Right Honourable Brian Mulroney, Director | /s/ Pierre Karl Péladeau Pierre Karl Péladeau, Director |
38
Notes to Consolidated Financial Statements
Years ended December 31, 2005, 2004 and 2003
(Tabular amounts are expressed in millions of US dollars, except for earnings per share and option amounts)
1. SUMMARY OF SIGNIFICANT ACCOUNTING POLICIES
(a) Principles of consolidation
The consolidated financial statements include the accounts of Quebecor World Inc. and all its subsidiaries (the "Company") and are prepared in conformity with Canadian generally accepted accounting principles.
(b) Use of estimates
The preparation of financial statements in conformity with Canadian generally accepted accounting principles requires management to make estimates and assumptions that affect the reported amounts of assets and liabilities and disclosure of contingent assets and liabilities at the date of the financial statements and the reported amounts of revenues and expenses during the reporting period. Financial results as determined by actual events could differ from those estimates.
Examples of significant estimates include: the key economic assumptions used in determining the allowance for doubtful accounts, the provision for obsolescence and some of the amounts accrued for restructuring and other charges; the composition of future income tax assets; the useful life of capital assets; certain actuarial and economic assumptions used in determining pension costs, accrued pension benefit obligations and pension plan assets; and the assumptions in property, plant and equipment and goodwill impairment tests.
(c) Foreign currency translation
The Company's functional currency is the Canadian dollar and its reporting currency for the presentation of its consolidated financial statements is the US dollar.
Financial statements of self-sustaining foreign operations are translated using the rate in effect at the balance sheet date for asset and liability items and the average exchange rates during the year for revenues and expenses. Adjustments arising from this translation are deferred and recorded in translation adjustment and are included in income only when a reduction in the investment in these foreign operations is realized.
Other foreign currency transactions are translated using the temporal method. Translation gains and losses are included in financial expenses.
(d) Revenue recognition
The Company provides a wide variety of print and print-related services to its customers, which usually require that the specifics be agreed upon prior to undertaking the process. Substantially all of the Company's revenues are derived from commercial printing and related services under the magazine, catalog, retail, book, direct and directory platforms.
Revenue is principally recognized when the following four revenue recognition criteria are met: persuasive evidence of an arrangement exists, services have been rendered, the price of the transaction is fixed or determinable, and collectibility is reasonably assured. Because the majority of services provided are customized, returns of media are not significant.
Contract revenue is recognized using the percentage of completion method over the contract term on the basis of production and service activity at the pro rata billing value of work completed. Sales revenues that do not meet the criteria for percentage of completion recognition are recorded when the performance of the agreed services is achieved. Under specified agreements with certain customers, the Company receives logistics and distribution management revenues for the future delivery of the products related to print services already provided for which the revenues are recognized once freight is received by the shipping facility.
Revenue is presented in the consolidated statements of income net of rebates, discounts, and amortization of contract acquisition costs. Discounts are recorded as reductions of revenue and the cost of free services is recorded as cost of goods sold when the revenue for the related purchase is recorded. Provisions for estimated losses, if any, are recognized in the period in which the loss is determinable.
Services are sold either stand-alone or together as a multiple service. Certain components of multiple service arrangements are separately accounted for provided the delivered elements have stand-alone value to the customer and the fair value of any undelivered elements can be objectively and reliably determined. These identifiable elements include pre-media manufacturing, commercial impression, and delivery. For arrangements which include multiple elements and for which the criteria for recognition as a multiple element arrangements are met, the total contract value is allocated to each element based on their relative fair values. Where the criteria are not met, it is recognized as a single unit of accounting according to revenue recognition criteria stated above.
(e) Contract acquisition costs
Contract acquisition costs consist of cash payments or accruals related to amounts payable or credits owed to customers in connection with long term agreements. Contract acquisition costs are generally amortized as reductions of revenue ratably over the related contract term or as related sales volume has been recognized. Whenever events or changes occur that impact the related contract, including significant declines in the anticipated profitability, the Company evaluate the carrying value of the contract acquisition costs to determine whether impairment has occurred. These costs are included in other assets in the consolidated balance sheets.
(f) Cash and cash equivalents
Cash and cash equivalents consist of highly liquid investments purchased three months or less from maturity and are stated at cost, which approximates market value.
39
1. SUMMARY OF SIGNIFICANT ACCOUNTING POLICIES (CONT'D)
(g) Trade receivables
Any gains or losses on the sale of trade receivables are calculated by comparing the carrying amount of the trade receivables sold to the total of the cash proceeds on sale and the fair value of the retained interest in such receivables on the date of transfer. The fair value of the retained interest approximates its carrying value given the short-term nature of associated cash-flows. Costs, including losses on the sale of trade receivables, are recognized in income in the period incurred and included in securitization fees.
(h) Inventories
Raw materials and supplies are valued at the lower of cost, as determined using the first in, first out method, or market being replacement cost. The work in process is valued at the pro rata billing value of the work completed.
(i) Property, plant and equipment
Property, plant and equipment are stated at cost. Cost represents acquisition or construction costs including preparation, installation, testing charges and interest incurred with respect to property, plant and equipment until they are ready for commercial production. Repair and maintenance are expensed as incurred.
Depreciation is provided using the straight-line basis over the estimated useful lives as follows:
| Assets | Estimated useful lives | |
|---|---|---|
| Buildings | 15 to 40 years | |
| Machinery and equipment | 3 to 18 years | |
| Leasehold improvements | Lesser of the term of the lease or useful life |
(j) Goodwill
Goodwill represents the excess of the purchase price over the fair value of net assets of acquired businesses. Goodwill is not amortized and is tested for impairment annually, or more frequently if events or changes in circumstances indicate that the asset might be impaired. When the carrying amount of a reporting unit's goodwill exceeds the implied fair value of the goodwill, an impairment loss is recognized in an amount equal to the excess and is presented as a separate line item in the income statement.
(k) Income taxes
The Company follows the asset and liability method of accounting for income taxes. Under the asset and liability method, future income tax assets and liabilities are recognized for the estimated future tax consequences attributable to differences between the financial statement carrying amounts of existing assets and liabilities and their respective tax bases. Future income tax assets and liabilities are measured using enacted or substantively enacted tax rates in effect for the year in which those temporary differences are expected to be recovered or settled. The effect on future income tax assets and liabilities of a change in tax rates is recognized in income in the period that includes the enactment, or substantively enactment, date. Future income tax assets are recognized and if realization is not considered more likely than not, a valuation allowance is provided.
(l) Stock-based compensation
The Company uses the fair value based method of accounting for all stock options granted to its employees, whereby a compensation expense is recognized over the vesting period of the options, with a corresponding increase to additional paid-in capital. When stock options are exercised, capital stock is credited with the sum of the consideration paid together with the related portion previously recorded to paid-in capital.
The Company adopted prospectively the fair value based method of accounting for stock-based compensation on January 1, 2003. Prior to that date, the Company, as permitted by Section 3870, had chosen to continue using the settlement based method and no compensation cost was recorded on the grant of stock options to employees. However, pro forma net income and diluted earnings per share for awards granted in 2002 are disclosed in Note 17 using the fair value based method.
40
1. SUMMARY OF SIGNIFICANT ACCOUNTING POLICIES (CONT'D)
(l) Stock-based compensation (cont'd)
For the employee share plans, the Company's contribution on the employee's behalf is recognized as compensation expense. Any consideration paid by the employee on purchase of stock together with any related compensation expense is recorded as an increase to capital stock.
Deferred Stock Units ("DSU") are recognized in compensation expense and accrued liabilities as they are awarded. DSU are remeasured at each reporting period, until settlement, using the trading price of the Subordinate Voting Shares.
(m) Derivative financial and commodity instruments
The Company uses various derivative financial instruments to manage its exposure to fluctuations in foreign currency exchange rates, interest rates and commodity pricing. The Company does not hold or use any derivative instruments for speculative purposes.
The Company enters into foreign exchange forward contracts to hedge anticipated foreign denominated sales and related receivables, raw materials and equipment purchases. Foreign exchange translation gains and losses are recognized as an adjustment of revenues, cost of goods sold and fixed assets, respectively when the transaction is recorded. The portion of the forward premium or discount on the contract relating to the period prior to consummation of the transaction is also recognized as an adjustment of revenues, cost of goods sold and fixed assets, respectively when the transaction is recorded.
The Company enters into foreign exchange forward contracts to hedge its net investments in foreign subsidiaries. Foreign exchange translation gains and losses are recorded under translation adjustment. Any realized or unrealized gain or loss on such derivative instruments is also recognized in translation adjustment.
The Company enters into foreign exchange forward contracts and cross currency swaps to hedge foreign denominated asset exposures. Foreign exchange translation gains and losses are recorded in income. Changes in the spot rates on the derivative instruments are recorded in income. The forward premium or discount on forward exchange contracts and the interest component of the cross currency swaps are amortized as an adjustment of interest expense over the term of the contract.
The Company enters into interest rate swaps in order to manage the impact of fluctuating interest rates on its short-term and long-term debt. These swap agreements require the periodic exchange of payments without the exchange of the notional principal amount on which the payments are based. The Company designates its interest rate hedge agreements as hedges of the underlying debt interest cost. Interest expense on the debt is adjusted to include amounts payable or receivable under the interest rate swaps.
The Company uses Treasury Lock Agreements in order to manage the impact of fluctuating interest rates on forecasted issuance of long-term debts. The Company designates its Treasury Lock Agreements as hedges of the future interest payments resulting from the issuance of long-term debt. The single payment from the derivative instrument at its maturity date is deferred and amortized over the term of the long-term debt.
The Company also enters into commodity swaps to manage a portion of its natural gas exposure. The Company is committed to exchange, on a monthly basis, the difference between a fixed price and a floating natural gas price index. The Company designates its commodity hedge agreements as hedges of the natural gas cost. Natural gas cost is adjusted to include amounts payable or receivable under the commodity hedge agreements.
Realized and unrealized gains or losses associated with derivative instruments, which have been terminated or have ceased to be effective prior to maturity, are deferred on the balance sheet and recognized in income in the period in which the underlying hedged transaction is recognized. In the event a designated hedged item is sold, extinguished or has matured prior to the termination of the related derivative instrument, any realized or unrealized gain or loss on such derivative instrument is recognized in income.
(n) Employee future benefits
i) Pensions
Pension costs are determined using actuarial methods and are funded through contributions determined in accordance with the projected benefit method pro rated on service as future salary levels affect the amount of future benefits. Pension expense is charged to operations and includes:
- •
- The cost of pension benefits provided in exchange for employees' services rendered during the year;
- •
- The amortization of the initial net transition asset on a straight-line basis over the expected average remaining service life of the active employees covered by the plans;
- •
- The amortization of prior service costs and amendments on a straight-line basis over the expected average remaining service life of the active employees covered by the plans;
- •
- The interest cost of pension obligations and the expected return on plan assets. For the purpose of calculating the expected return on plan assets, those assets are valued at market-related value, based on a combination of rigorous historical performance analysis and the forward-looking views of the financial markets as revealed through the yield on long-term bonds and the price-to-earnings ratios of the major stock market indices;
- •
- The amortization of cumulative unrecognized net actuarial gains and losses in excess of 10% of the greater of the benefit obligation or fair value of plan assets over the expected average remaining service life of active employees covered by the plans; and
- •
- When an event gives rise to both a curtailment and a settlement, the curtailment is accounted for prior to the settlement.
41
1. SUMMARY OF SIGNIFICANT ACCOUNTING POLICIES (CONT'D)
(n) Employee future benefits (cont'd)
The Company participates in a number of multiemployer defined benefit pension plans covering approximately 3,800 employees. These multiemployer plans are accounted for following the standards on defined contribution plans as the Company has insufficient information to apply defined benefit plan accounting.
ii) Other postretirement benefits
The Company determines the cost of postretirement benefits other than pensions using the accrued benefit method. These benefits, which are funded by the Company as they become due, include life insurance programs and medical benefits. The Company amortizes the cumulative unrecognized net actuarial gains and losses in excess of 10% of the projected benefit obligation over the expected average remaining service life of active employees covered by the plans.
(o) Environmental expenditures
Environmental expenditures that relate to current operations are expensed or capitalized as appropriate. Expenditures that relate to an existing condition caused by past operations and which are not expected to contribute to current or future operations are expensed. Liabilities are recorded when environmental assessments and/or remedial efforts are likely, and when the costs, based on a specific plan of action in terms of the technology to be used and the extent of the corrective action required, can be reasonably estimated.
(p) Impairment of long-lived assets
The Company reviews, when a triggering event occurs, the carrying values of its long-lived assets by comparing the carrying amount of the asset or group of assets to the expected future undiscounted cash flows to be generated by the asset or group of assets. An impairment loss is recognized when the carrying amount of an asset or group of assets held for use exceeds the sum of the undiscounted cash flows expected from its use and eventual disposition. The impairment loss is measured as the amount by which the asset's carrying amount exceeds its fair value, based on quoted market prices, when available, or on the estimated present value of future cash flows.
(q) Asset retirement obligations
The fair value of the future removal obligations on certain land and buildings is recorded as a liability on a discounted basis when it is incurred and an asset retirement cost of the equivalent amount is capitalized to fixed assets. The obligation is discounted using the Company's credit-adjusted risk free-rate and is reviewed periodically to reflect the passage of time and changes in the estimated future costs underlying the obligation. The Company amortizes the asset retirement cost capitalized to fixed assets and recognizes accretion expense in connection with the discounted liability over the estimated remaining useful life of the properties.
(r) Comparative figures
We have reclassified some of the figures for the comparative periods in the consolidated financial statements to make them consistent with the presentation adopted for the current period.
42
2. IMPAIRMENT OF ASSETS, RESTRUCTURING AND OTHER CHARGES
2005 IMPAIRMENT OF ASSETS, RESTRUCTURING AND OTHER CHARGES
In 2005, the Company recorded impairment of long-lived assets, accelerated depreciation and restructuring charges of $98.1 million, composed of non-cash items of $53.9 million and cash items of $44.2 million, of which $3.9 million was related to discontinued operations.
The following table sets forth the segmented information and the category of charges.
| | Workforce reduction costs | Leases, closed facilities carrying costs and other | Total restructuring charges | Impairment of assets, accelerated depreciation and pension curtailments | Total impairment of assets, restructuring and other charges | ||||||||||
|---|---|---|---|---|---|---|---|---|---|---|---|---|---|---|---|
| North America | $ | 12.7 | $ | 4.7 | $ | 17.4 | $ | 9.1 | $ | 26.5 | |||||
| Europe | 14.4 | 12.0 | 26.4 | 44.5 | 70.9 | ||||||||||
| Latin America | 0.3 | 0.1 | 0.4 | 0.3 | 0.7 | ||||||||||
| $ | 27.4 | $ | 16.8 | $ | 44.2 | $ | 53.9 | $ | 98.1 | ||||||
| Discontinued Operations | $ | 3.8 | $ | 0.1 | $ | 3.9 | $ | — | $ | 3.9 | |||||
| Continuing Operations | 23.6 | 16.7 | 40.3 | 53.9 | 94.2 | ||||||||||
| $ | 27.4 | $ | 16.8 | $ | 44.2 | $ | 53.9 | $ | 98.1 | ||||||
Impairment of long-lived assets
In 2005, the Company performed a review of its long-lived assets. Following impairment tests on various specific units, the Company concluded that some assets, mainly in Europe, were impaired. Accordingly, for the year, the Company recorded an impairment of long-lived assets and accelerated depreciation related to facilities included in the 2005 restructuring initiatives of $53.7 million. The $53.7 million included $8.9 million for North America, $44.5 million for Europe and $0.3 million for Latin America.
During the fourth quarter of 2005, the Company recorded an impairment on long-lived assets and accelerated depreciation of $5.4 million. The impairment of long-lived assets and accelerated depreciation recorded for the first, second and third quarter were respectively $24.6 million, $16.0 million and $7.7 million.
2005 restructuring initiatives
During the fourth quarter of 2005, the Company recorded cash costs of $4.8 million, of which $1.7 million was for new workforce reductions initiatives and $3.1 million resulting from the continuation of the previous quarter of 2005 initiatives. The Company also recorded a reversal of $0.2 million in the non-cash costs for the revised curtailment of one of the Canadian pension plans recorded in the first quarter.
During the third quarter of 2005, the Company continued its restructuring initiatives by approving the downsizing of operations in Helio Corbeil, France, and other workforce reductions across the Company. The cash costs of these initiatives were estimated at $7.4 million, of which $5.7 million were recorded during the third quarter. The Company also recorded $0.5 million related to first and second quarter initiatives.
During the second quarter of 2005, the Company approved restructuring initiatives for the second phase of the downsizing operations in Corby, the closure of a Canadian facility and other workforce reductions across the Company. These initiatives were estimated at $18.2 million, of which $12.3 million were recorded during the second quarter. The Company had also recorded cash restructuring charges of $3.9 million for severance related to the disposal of a non-core facility.
During the first quarter of 2005, the Company approved the first phase of the downsizing operations in Corby and other workforce reductions across the Company. The cash cost of these initiatives estimated at $3.8 million was recorded in the first quarter. The non-cash cost of these initiatives included $0.4 million for the curtailment of one of the Company's Canadian pension plans.
Prior years' restructuring initiatives
In 2005, the Company recorded $11.5 million resulting from the continuation of the 2004 initiatives and $2.2 million for the pension obligation related to the Effingham multiemployer benefit plan. The review and execution of the prior years' initiatives resulted in a net reversal of $0.5 million comprised of a cash overspending of $3.4 million, and $3.9 million reversal of prior years' restructuring and other charges.
During the fourth quarter of 2005, the Company recorded $1.1 million resulting from the continuation of the 2004 initiatives mainly in Sweden and a net overspending of $0.8 million on leasing and facility costs in North America resulting from the execution of prior year initiatives.
43
2. IMPAIRMENT OF ASSETS, RESTRUCTURING AND OTHER CHARGES (CONT'D)
2004 IMPAIRMENT OF ASSETS, RESTRUCTURING AND OTHER CHARGES
In 2004, the Company recorded impairment of assets, restructuring and other charges of $122.1 million of which $6.5 million were related to discontinued operations. Non-cash items amounted to $83.3 million of which $4.3 million were related to discontinued operations and cash items amounted to $38.8 million with $2.2 million related to discontinued operations.
The following table sets forth the segmented information and the category of charges.
| | Workforce reduction costs | Leases, closed facilities carrying costs and other | Total restructuring charges | Impairment of assets and pension curtailments | Total impairment of assets, restructuring and other charges | ||||||||||
|---|---|---|---|---|---|---|---|---|---|---|---|---|---|---|---|
| North America | $ | 22.2 | $ | 2.8 | $ | 25.0 | $ | 49.8 | $ | 74.8 | |||||
| Europe | 9.2 | 2.2 | 11.4 | 29.2 | 40.6 | ||||||||||
| Latin America | 1.7 | 0.1 | 1.8 | 3.9 | 5.7 | ||||||||||
| Other | 0.6 | — | 0.6 | 0.4 | 1.0 | ||||||||||
| $ | 33.7 | $ | 5.1 | $ | 38.8 | $ | 83.3 | $ | 122.1 | ||||||
| Discontinued Operations | $ | 1.6 | $ | 0.6 | $ | 2.2 | $ | 4.3 | $ | 6.5 | |||||
| Continuing Operations | 32.1 | 4.5 | 36.6 | 79.0 | 115.6 | ||||||||||
| $ | 33.7 | $ | 5.1 | $ | 38.8 | $ | 83.3 | $ | 122.1 | ||||||
Impairment of assets
The execution of the 2004 restructuring initiatives resulted in certain long-lived assets being permanently idled. In addition, the initiatives and other events triggered a recoverability test on other groups of assets. Accordingly, for the year, the Company recorded an impairment of long-lived assets of $73.3 million of which $4.3 million were related to discontinued operations, and $1.1 million of impairment on other assets.
2004 restructuring initiatives
During the fourth quarter, the Company recorded cash costs of $13.0 million, of which $0.4 million for discontinued operations. The $13.0 million included $9.7 million for new initiatives and $3.3 million resulting from the continuation of the second and third quarter initiatives. Restructuring initiatives were pursued and resulted in the approval of the consolidation of four small facilities in North America, one in Europe and other workforce reductions across the Company. The cash costs of these initiatives was estimated at $14.5 million, of which $9.7 million was recorded in the fourth quarter. The non-cash cost of these initiatives included $0.9 million for the curtailment of one of the Company's U.S. pension plans.
In the third quarter, the Company approved the closure of the Stockholm facility in Sweden, the consolidation of a small facility in North America and other workforce reductions across the Company. The cash cost of these initiatives includes $0.1 million related to discontinued operations and was initially estimated at $17.5 million, of which $6.9 million, mostly related to workforce reductions, was recorded in the third quarter. The Company also recorded $1.4 million resulting from the continuation of the second quarter initiatives and $2.7 million for the pension obligation related to the Effingham multiemployer benefit plan.
In the second quarter of 2004, the Company initiated other restructuring initiatives to improve asset utilization and enhance efficiency. The restructuring initiatives included the closure of the Effingham, Illinois facility in the Magazine platform, an important downsizing at the Kingsport, Tennessee facility in the Book platform and other workforce reductions across the Company. The cash cost of these initiatives was initially estimated at $18.3 million, of which $11.2 million that included $1.6 million for discontinued operations, was recorded in the second quarter of 2004. These costs excluded a pension obligation related to the Effingham multiemployer benefit plan that could not be reasonably estimated at that time. The non-cash cost of these initiatives included $8.0 million for the curtailment and settlement of one of the Company's U.S. pension plans.
In the first quarter of 2004, the Company initiated restructuring initiatives and recorded $5.0 million for workforce reductions of which $0.1 million was related to discontinued operations.
44
2. IMPAIRMENT OF ASSETS, RESTRUCTURING AND OTHER CHARGES (CONT'D)
Prior years' restructuring initiatives
In 2004, the review and execution of the prior years' initiatives resulted in a net reversal of $1.4 million comprised of a cash overspending of $6.6 million, and $8.0 million reversal of prior years' restructuring and other charges, mostly due to the cancellation or the termination of 75 employee positions.
2003 IMPAIRMENT OF ASSETS, RESTRUCTURING AND OTHER CHARGES
In 2003, the Company recorded an impairment of assets, restructuring and other charges of $98.3 million of which $3.8 million were related to discontinued operations. Non-cash items amounted to $60.4 million, and cash items to $37.9 million. Of the $37.9 million in cash items, $31.7 million was spent in North America, including $3.1 million related to discontinued operations, $1.8 million in Europe and $3.6 million in Latin America.
Impairment of assets
During 2003, the Company reviewed the status of long-lived assets. Accordingly, the Company recorded an impairment of long-lived assets of $60.4 million. The $60.4 million included $46.7 million for North America of which $0.7 million was related to discontinued operations, $5.0 million for Europe and $8.2 million for Latin America.
2003 restructuring initiatives
In 2003, the Company continued its restructuring initiatives and recorded a cash cost of $38.9 million consisting of $33.1 million in workforce reductions and $5.8 million of additional closure costs of four smaller facilities. The restructuring charge related to discontinued operations was $3.1 million.
Prior years' restructuring initiatives
In 2003, the review and the execution of the 2002 and 2001 initiatives resulted in a net reversal of $1.0 million comprised of a cash overspending of $12.9 million, and a $13.9 million reversal of prior year restructuring and other charges. The cash overspending was related to the cost of closed facilities not yet disposed of, office leases not yet subleased, and other completed initiatives.
45
2. IMPAIRMENT OF ASSETS, RESTRUCTURING AND OTHER CHARGES (CONT'D)
Continuity of the reserve for restructuring and other charges
As at January 1, 2005, the balance of the restructuring reserve was $35.2 million. This amount related mostly to workforce reductions across the platform and lease and facility carrying costs. The Company utilized $49.9 million of the current and prior years' restructuring and other charges reserves during the twelve-month period ended December 31, 2005.
The following table sets forth the Company's 2005 restructuring reserve and activities against the reserves carried forward from 2004:
| | Workforce reduction costs | Leases, closed facilities carrying costs and other | 2005 | 2004 | |||||||||
|---|---|---|---|---|---|---|---|---|---|---|---|---|---|
| Balance, beginning of year | $ | 21.3 | $ | 13.9 | $ | 35.2 | $ | 45.8 | |||||
| Overspending on prior years' initiatives | 0.9 | 2.5 | 3.4 | 6.6 | |||||||||
| Reversal of previous years' reserves | (2.9 | ) | (1.0 | ) | (3.9 | ) | (8.0 | ) | |||||
| 2004 initiatives | 3.9 | 9.8 | 13.7 | 40.2 | |||||||||
| 2005 initiatives | 25.5 | 5.5 | 31.0 | — | |||||||||
| 27.4 | 16.8 | 44.2 | 38.8 | ||||||||||
Reserve utilized in 2005 | (32.5 | ) | (17.4 | ) | (49.9 | ) | (50.6 | ) | |||||
| Foreign currency changes | (0.9 | ) | (0.7 | ) | (1.6 | ) | 1.2 | ||||||
| Balance, end of year | $ | 15.3 | $ | 12.6 | $ | 27.9 | $ | 35.2 | |||||
Cash disbursement related to this reserve are expected to be as follows:
| | Workforce reduction costs | Leases, closed facilities carrying costs and other | Total | ||||||
|---|---|---|---|---|---|---|---|---|---|
| 2006 | $ | 15.3 | $ | 7.2 | $ | 22.5 | |||
| 2007 | — | 2.7 | 2.7 | ||||||
| 2008 | — | 1.6 | 1.6 | ||||||
| 2009 | — | 0.8 | 0.8 | ||||||
| 2010 and thereafter | — | 0.3 | 0.3 | ||||||
| $ | 15.3 | $ | 12.6 | $ | 27.9 | ||||
Additional restructuring charges
Further to the disbursement of $27.9 million, $8.7 million of restructuring charges related to the 2005 and 2004 initiatives remain to be recorded in 2006 when the liabilities related to the initiatives will have been contracted.
46
| | Note | 2005 | 2004 | 2003 | ||||||||
|---|---|---|---|---|---|---|---|---|---|---|---|---|
| Interest on long-term debt and convertible notes | $ | 119.4 | $ | 123.5 | $ | 151.8 | ||||||
| Interest on short-term debt | 3.1 | 3.9 | 9.0 | |||||||||
| Amortization of deferred financing costs | 1.9 | 2.9 | 3.6 | |||||||||
| Exchange losses (gains) | 50.4 | (25.3 | ) | (45.7 | ) | |||||||
| Exchange losses (gains) from reductions of net investments in self-sustaining foreign operations | 18 | — | (1.0 | ) | 5.3 | |||||||
| Derivative financial instruments | (48.0 | ) | 28.7 | 54.9 | ||||||||
| Loss on extinguishment of long-term debt | — | 2.0 | 30.2 | |||||||||
| 126.8 | 134.7 | 209.1 | ||||||||||
| Interest capitalized to the cost of equipment | (7.6 | ) | (1.5 | ) | (2.3 | ) | ||||||
| $ | 119.2 | $ | 133.2 | $ | 206.8 | |||||||
| Portion included in discontinued operations | 7 | 0.2 | 0.1 | 2.3 | ||||||||
| $ | 119.0 | $ | 133.1 | $ | 204.5 | |||||||
| Cash interest payments | $ | 112.9 | $ | 130.8 | $ | 160.9 | ||||||
In February 2004, the Company redeemed the remainder of the 7.75% senior notes callable on or after February 15, 2004 that were not tendered in 2003, for a total cash consideration of $32.5 million. The loss on extinguishment was $2.0 million. In 2003, the Company repurchased 89.6% of the $300 million aggregate principal amount of the 7.75% senior notes pursuant to a tender offer. The Company also exercised its option to redeem all $257.6 million aggregate principal amount of the 8.375% senior notes. These extinguishments of long-term debt resulted in a loss of $30.2 million consisting of premium paid, write-off of discounts and deferred costs related to those transactions.
4. INCOME TAXES
The domestic and foreign components of income (loss) from continuing operations, before income taxes are as follows:
| | 2005 | 2004 | 2003 | |||||||
|---|---|---|---|---|---|---|---|---|---|---|
| Domestic | $ | 29.7 | $ | 0.4 | $ | (8.4 | ) | |||
| Foreign | (128.4 | ) | 222.0 | 15.8 | ||||||
| �� | $ | (98.7 | ) | $ | 222.4 | $ | 7.4 | |||
Total income tax expense was allocated as follows:
| | Note | 2005 | 2004 | 2003 | ||||||||
|---|---|---|---|---|---|---|---|---|---|---|---|---|
| Continuing operations | $ | 50.4 | $ | 77.0 | $ | 37.0 | ||||||
| Discontinued operations | 7 | 14.3 | 1.9 | 2.1 | ||||||||
| Shareholders' equity: | ||||||||||||
| Translation adjustment | (0.9 | ) | 6.7 | — | ||||||||
| Dividends on preferred shares | 4.0 | 3.8 | 5.3 | |||||||||
| $ | 67.8 | $ | 89.4 | $ | 44.4 | |||||||
Income tax expense (recovery) attributable to income consists of:
| | Note | 2005 | 2004 | 2003 | |||||||||
|---|---|---|---|---|---|---|---|---|---|---|---|---|---|
| Current: | |||||||||||||
| Domestic | $ | 23.4 | $ | 1.9 | $ | 8.2 | |||||||
| Foreign | 62.0 | 34.2 | 15.8 | ||||||||||
| 85.4 | 36.1 | 24.0 | |||||||||||
| Portion included in discontinued operations | 7 | 17.1 | 0.8 | 5.2 | |||||||||
| 68.3 | 35.3 | 18.8 | |||||||||||
| Future: | |||||||||||||
| Domestic | (5.1 | ) | 5.9 | (12.6 | ) | ||||||||
| Foreign | (15.6 | ) | 36.9 | 27.7 | |||||||||
| (20.7 | ) | 42.8 | 15.1 | ||||||||||
| Portion included in discontinued operations | 7 | (2.8 | ) | 1.1 | (3.1 | ) | |||||||
| (17.9 | ) | 41.7 | 18.2 | ||||||||||
| Total from continuing operations | $ | 50.4 | $ | 77.0 | $ | 37.0 | |||||||
47
4. INCOME TAXES (CONT'D)
The following table reconciles the difference between the domestic statutory tax rate and the effective tax rate used by the Company in the determination of net income (loss) from continuing operations:
| | 2005 | 2004 | 2003 | ||||||||
|---|---|---|---|---|---|---|---|---|---|---|---|
| Domestic statutory tax rate | 34.2 | % | 33.7 | % | 35.1 | % | |||||
| Increase (reduction) resulting from: | |||||||||||
| Change in valuation allowance | (42.0 | ) | 11.9 | 668.8 | |||||||
| Effect of foreign tax rate differences | 34.2 | (15.3 | ) | (536.5 | ) | ||||||
| Permanent differences | (3.9 | ) | 3.1 | (45.9 | ) | ||||||
| Changes in enacted and average tax rates on cumulative temporary differences | 0.1 | (0.8 | ) | 380.0 | |||||||
| Large corporation tax | (1.2 | ) | 0.2 | 8.3 | |||||||
| Goodwill impairment | (63.5 | ) | — | — | |||||||
| Other | (9.0 | ) | 1.8 | (7.0 | ) | ||||||
| Effective tax rate | (51.1 | )% | 34.6 | % | 502.8 | % | |||||
| Income taxes paid | $ | 22.3 | $ | 66.2 | $ | 17.0 | |||||
The tax effects of significant items comprising the Company's net future tax liability are as follows:
| | 2005 | 2004 | ||||||
|---|---|---|---|---|---|---|---|---|
| Future tax assets: | ||||||||
| Operating loss carryforwards | $ | 259.6 | $ | 180.6 | ||||
| Tax credit carryforwards | 17.3 | 14.0 | ||||||
| Trade receivables | 7.8 | 10.1 | ||||||
| Acquisition and restructuring reserves | 3.9 | 12.9 | ||||||
| Pension, postretirement and workers compensation benefits | 35.8 | 36.6 | ||||||
| Accrued compensation | 46.3 | 45.4 | ||||||
| Other | 20.4 | 20.6 | ||||||
| Gross future tax assets | 391.1 | 320.2 | ||||||
| Future tax liabilities: | ||||||||
| Property, plant and equipment | (388.7 | ) | (397.1 | ) | ||||
| Inventories | (31.0 | ) | (32.7 | ) | ||||
| Goodwill and other assets | (59.3 | ) | (68.0 | ) | ||||
| Other | (21.2 | ) | (15.6 | ) | ||||
| Gross future tax liabilities | (500.2 | ) | (513.4 | ) | ||||
| Valuation allowance | (230.7 | ) | (170.6 | ) | ||||
| Net future tax liability | (339.8 | ) | (363.8 | ) | ||||
| Less current portion of: | ||||||||
| Future tax assets | 34.4 | 43.2 | ||||||
| Future tax liabilities | (1.7 | ) | (4.4 | ) | ||||
| Future tax liability | $ | (372.5 | ) | $ | (402.6 | ) | ||
The 2005 and 2004 amounts above include a valuation allowance of $230.7 million and $170.6 million respectively, relating to loss carryforwards and other tax benefits available. The valuation allowance for future tax assets as of January 1, 2004 was $137.9 million. The net change in the total valuation allowance for the years ended December 31, 2005 and 2004 were explained by $41.5 million and $26.4 million respectively, allocated to income from operations.
48
4. INCOME TAXES (CONT'D)
Subsequent recognition of the tax benefits relating to the valuation allowance for future tax assets as of December 31, 2005 will be allocated as follows:
| Income tax benefit will be reported: | ||||
| In the consolidated statement of income | $ | 207.5 | ||
| As a reduction of goodwill | 23.2 | |||
| $ | 230.7 | |||
At December 31, 2005, the Company had net operating loss carryforwards for income tax purposes of $697.3 million, of which $613.9 million can be carried forward indefinitely and $83.4 million expire between 2006 and 2025. In the United States, the Company had no Federal net operating loss carryforwards. The amount of US Federal alternative minimum tax credit and general business tax credit available was $4.3 million, for which a full valuation allowance has been taken. The Company also had state net operating loss and state tax credit carryforwards valued net of federal tax benefit of approximately $35.2 million and $12.3 million, respectively. These loss and tax credit carryforwards expire between 2006 and 2025. Limitations on the utilization of these tax assets may apply and the Company has accordingly provided a valuation allowance in the amount of $26.4 million.
The Company has not recognized a future tax liability for the undistributed earnings of its subsidiaries in the current and prior years, because the Company currently does not expect those unremitted earnings to reverse and become taxable to the Company in the foreseeable future. Future income taxes will be recognized when the Company expects that it will recover those undistributed earnings in a taxable manner, such as through receipt of dividends or sale of the investments. Such liability is not reasonably determinable at the present time.
5. EARNINGS (LOSS) PER SHARE
Basic earnings per share are calculated by dividing net income available to holders of equity shares by the weighted average number of equity shares outstanding during the year. Net income available to holders of equity shares is computed by subtracting dividends on the preferred shares from net income. Diluted earnings per share are calculated by using the weighted average number of equity shares outstanding adjusted to include potentially the dilutive effect of convertible notes and stock options.
The following table sets forth the computation of basic and diluted earnings per share for continuing operations:
| | 2005 | 2004 | 2003 | ||||||||
|---|---|---|---|---|---|---|---|---|---|---|---|
| Net income (loss) | $ | (148.8 | ) | $ | 139.9 | $ | (32.7 | ) | |||
| Net income available to holders of preferred shares | 39.6 | 37.5 | 36.5 | ||||||||
| Net income (loss) available to holders of equity shares | $ | (188.4 | ) | $ | 102.4 | $ | (69.2 | ) | |||
| (in millions) | |||||||||||
| Weighted average number of equity shares outstanding | 131.8 | 132.4 | 136.0 | ||||||||
| Effect of dilutive stock options | — | 0.2 | — | ||||||||
| Weighted average number of diluted equity shares outstanding | 131.8 | 132.6 | 136.0 | ||||||||
| Earnings (loss) per share: | |||||||||||
| Basic and Diluted | $ | (1.43 | ) | $ | 0.77 | $ | (0.51 | ) | |||
For the purpose of calculating diluted earnings per share, the effects of the convertible notes were excluded, since their inclusion is anti-dilutive. For 2003 and 2005, the effects of all stock options were also excluded. For 2004, the effects of 2,684,309 options expiring between 2006 and 2014 were excluded, since their exercise price is greater than the average market price of shares of the same category.
Earnings (loss) per share for discontinued operations are calculated by dividing the net income (loss) from discontinued operations (net of tax) by the weighted average number of equity shares outstanding during the year.
49
6. BUSINESS ACQUISITIONS
During the years ended December 31, 2005, 2004 and 2003, the Company acquired the following businesses, which have been accounted for by the purchase method, and earnings are included in the consolidated statements of income since the date of acquisition.
2005
In August 2005, the Company acquired minority interests in its French operations for a cash consideration of $0.6 million, of which $0.2 million has been recorded in goodwill.
In March 2005, the Company acquired minority interests in its North American operations for a cash consideration of $6.4 million.
2004
In November 2004, the Company purchased the remaining 50% of the issued and outstanding shares of Helio Charleroi in Belgium, for a cash consideration of $45.8 million, of which $17.0 million has been recorded in goodwill.
In September 2004, the Company acquired a minority interest in its North American operations for a cash consideration of $2.4 million, of which $1.8 million has been recorded in goodwill.
In April 2004, the Company acquired a minority interest in its Spanish operations for a cash consideration of $1.7 million, of which $1.5 million has been recorded in goodwill.
In March 2004, the Company acquired a minority interest in its North American operations for a cash consideration of $0.6 million, of which $0.4 million has been recorded in goodwill.
2003
In May 2003, the Company acquired minority interests in North American operations for a cash consideration of $4.4 million, of which $3.0 million has been recorded in goodwill.
In March 2003, the Company acquired minority interests in its Spanish operations for a cash consideration of $3.1 million, of which $2.2 million has been recorded in goodwill.
Net assets acquired at fair value:
| | 2005 | 2004 | 2003 | |||||||
|---|---|---|---|---|---|---|---|---|---|---|
| Assets acquired: | ||||||||||
| Non-cash operating working capital | $ | — | $ | (0.8 | ) | $ | — | |||
| Property, plant and equipment | (0.5 | ) | 11.8 | — | ||||||
| Goodwill | 0.2 | 20.7 | 5.2 | |||||||
| Other assets | — | 0.2 | — | |||||||
| Minority interest | 7.1 | 22.6 | 2.3 | |||||||
| Liabilities assumed: | ||||||||||
| Future income taxes | (0.2 | ) | 4.0 | — | ||||||
| Net assets acquired | $ | 7.0 | $ | 50.5 | $ | 7.5 | ||||
| Consideration: | ||||||||||
| Cash | $ | 7.0 | $ | 50.5 | $ | 7.5 | ||||
7. DISCONTINUED OPERATIONS AND OTHER DISPOSALS
- (a)
- Discontinued Operations
On May 10, 2005, the Company announced its intention to divest its North American non-core Commercial Printing Group, one of the largest providers of general, financial, packaging and commercial specialty printing services throughout the United States, Canada, and Mexico, in order to focus on its core long-run print business. Consequently, the operating results related to these activities have been presented separately in the Company's consolidated statement of income as discontinued operations and comparative figures have been restated to conform to the presentation adopted in 2005.
In December 2005, the Company sold its interest in a subsidiary of its non-core commercial printing group in Canada, for a total consideration of $17.1 million that was received subsequently to December 31, 2005. The Company realized a gain amounting to $2.6 million ($1.2 net of income tax) which was recorded as an increase in the net income from discontinued operations. A reduction of $6.3 million relating to goodwill of the North American segment was recorded within discontinued operations.
In November 2005, the Company sold the operating assets in some of its subsidiaries in the non-core commercial printing group in Canada for a total consideration of $34.6 million. The Company realized a loss amounting to $3.5 million ($6.4 million net of income tax) which was recorded as a reduction in net income from discontinued operations. The selling price is subject to an adjustment based on the closing working capital. A reduction of $12.2 million relating to goodwill of the North American segment was recorded within discontinued operations.
In November 2005, the Company sold the operating assets of some units of its non-core commercial printing group in the United States for a total consideration of $61.3 million. The sales price was comprised of $32.8 million of cash, $20.0 million of preferred units of Matlet Group, LLC (purchaser) and $8.5 million in a promissory note receivable. The Company realized a gain amounting to $11.2 million (a loss of $1.9 million net of income tax), which was recorded as a reduction in net income from discontinued operations. The selling price is subject to an adjustment based on the closing working capital. A reduction of $23.1 million relating to goodwill of the North American segment was recorded within discontinued operations.
50
7. DISCONTINUED OPERATIONS AND OTHER DISPOSALS (CONT'D)
- (a)
- Discontinued Operations (cont'd)
On August 4, 2005, the Company concluded the sale of certain assets related to its Westwood, Massachusetts facility, one of the business units of its non-core commercial printing group in the United States, for a cash consideration of $2.6 million resulting in a loss on disposal of $0.8 million ($0.8 million, net of income tax). A reduction of $0.9 million relating to goodwill of the North American segment was recorded within discontinued operations.
On June 30, 2005, the Company concluded the sale of certain assets related to its Los Angeles, California facility, one of the business units of its non-core commercial printing group in the United States, for a cash consideration of $0.5 million. On July 19, 2005, the Company sold additional assets related to this facility for a cash consideration of $0.8 million. This resulted in a loss on disposal of $6.3 million ($4.1 million, net of income tax recovery). Under the terms of the agreement, the Company has assumed obligations for termination benefits relating to this business that have been recorded as part of restructuring and other charges, and has retained certain operating leases. A reduction of $0.4 million relating to goodwill of the North American segment was recorded within discontinued operations.
Summarized financial information for the discontinued operations is as follows:
Operations summary of discontinued operations
| | Note | 2005 | 2004 | 2003 | |||||||
|---|---|---|---|---|---|---|---|---|---|---|---|
| Revenues | $ | 212.7 | $ | 282.6 | $ | 343.4 | |||||
| Cost of sales and selling, general and administrative expenses | 207.1 | 259.9 | 322.9 | ||||||||
| Depreciation and amortization | 4.2 | 10.4 | 11.0 | ||||||||
| Restructuring and other charges | 2 | 3.9 | 6.5 | 3.8 | |||||||
| Gain on disposal of business units | (3.2 | ) | — | — | |||||||
| Operating income | 0.7 | 5.8 | 5.7 | ||||||||
| Financial expenses | 3 | 0.2 | 0.1 | 2.3 | |||||||
| Income before income taxes | 0.5 | 5.7 | 3.4 | ||||||||
| Income taxes | 4 | 14.3 | 1.9 | 2.1 | |||||||
| Net income (loss) from discontinued operations | $ | (13.8 | ) | $ | 3.8 | 1.3 | |||||
Summary of assets and liabilities sold
| For the year ended December 31, 2005 | Discontinued Operations | Other | Total | ||||||||
|---|---|---|---|---|---|---|---|---|---|---|---|
| Assets sold: | |||||||||||
| Cash and cash equivalents | $ | 0.8 | $ | 3.9 | $ | 4.7 | |||||
| Non-cash operating working capital | 21.3 | 1.3 | 22.6 | ||||||||
| Property, plant and equipment | 47.2 | 0.3 | 47.5 | ||||||||
| Goodwill | 42.9 | — | 42.9 | ||||||||
| Other assets | 0.3 | — | 0.3 | ||||||||
| Liabilities sold: | |||||||||||
| Long-term debt | — | 0.2 | 0.2 | ||||||||
| Other liabilities | 0.7 | 0.7 | 1.4 | ||||||||
| Net assets sold | $ | 111.8 | $ | 4.6 | $ | 116.4 | |||||
| Proceeds: | |||||||||||
| Cash | $ | 71.3 | $ | 0.3 | $ | 71.6 | |||||
| Preferred shares | 20.0 | — | 20.0 | ||||||||
| Balance of sales price receivable | 25.8 | — | 25.8 | ||||||||
| Sales price adjustment payable | (2.1 | ) | — | (2.1 | ) | ||||||
| $ | 115.0 | $ | 0.3 | $ | 115.3 | ||||||
- (b)
- Other Disposals
In November 2005, the Company sold its investment in a facility in Beaugency, France for a cash consideration of 1 Euro, resulting in a loss on disposal of $4.3 million, which was recorded as a reduction of selling, general and administrative expenses.
In March 2005, the Company sold its investment in a facility in Torcy, France for a cash consideration of 1 Euro. The Company also sold the operating assets of a division of a subsidiary in France for a total cash consideration of $0.3 million. No gain or loss was realized on these transactions in 2005.
51
On March 1, 2005, the Company pledged $33.1 million ($7.0 million on March 1, 2004) of cash held in a short-term liquidity fund, as collateral for a standby letter of credit issued to an insurer related to estimated disbursements for the settlement of claims to be incurred by the Company's captive insurance subsidiary. The standby letter of credit is automatically renewable annually for an indefinite period of time and accordingly, the pledged amount held in a liquidity fund will also be renewed annually.
9. TRADE RECEIVABLES
Asset securitization
In 2005, the Company renewed and amended its 1999 agreement to sell, with limited recourse, a portion of its US trade receivables on a revolving basis (the "US Program"). The amendment allows for more flexibility in the Company's reporting requirements to the purchaser and the Company continues to have the option to extend the term of the US Program for an additional year. The US Program limit is $510.0 million and has been extended through September 29, 2006. As at December 31, 2005, the amount outstanding under the US Program was $467.0 million ($500.0 million as at December 31, 2004).
In 2005, the Company amended its 2003 agreement to sell, with limited recourse, a portion of its Canadian trade receivables on a revolving basis (the "Canadian Program"). The Canadian Program limit is Cdn$135.0 million. As at December 31, 2005, the amount outstanding under the Canadian Program was Cdn $100.0 million ($86.0 million) (Cdn $126.0 million ($104.8 million) as at December 31, 2004). The program was amended to accommodate its existing credit rating by Dominion Bond Rating Service.
In 2005, the Company also sold, with limited recourse, a portion of its French and Spanish trade receivables on a revolving basis under the terms of a European securitization agreement dated June 2001 (the "European Program"). The European Program limit is 153.0 million Euro. As at December 31, 2005, the amount outstanding under the European Program was 118.0 million Euro ($139.8 million) (133.5 million Euro ($180.7 million) as at December 31, 2004).
The Company has retained the responsibility for servicing, administering and collecting trade receivables sold. No servicing asset or liability has been recognized, since the fees the Company receives for servicing the receivables approximate the related costs.
At December 31, 2005, an aggregate of $825.7 million ($936.1 million as at December 31, 2004) of trade receivables have been sold under the three programs, of which $132.9 million ($150.6 million as at December 31, 2004) were kept by the Company as a retained interest, resulting in a net aggregate consideration of $692.8 million ($785.5 million as at December 31, 2004) on the sale. The retained interest is recorded in the Company's trade receivables, and its fair market value approximates its cost, given the short nature of the collection period of the trade receivables sold. The rights of the Company on the retained interest are subordinated to the rights of the investors under the programs. There is no recourse under the programs on the Company's other assets for failure of debtors to pay when due, other than the retained interest of the Company.
Securitization fees vary based on commercial paper rates in Canada, the United States and Europe and, generally, provide a lower effective funding cost than available under the Company's bank facilities.
Proceeds from revolving sales between the securitization trusts and the Company in 2005 totalled $4.9 billion ($4.8 billion in 2004).
10. INVENTORIES
| | 2005 | 2004 | ||||
|---|---|---|---|---|---|---|
| Raw materials and supplies | $ | 239.4 | $ | 268.4 | ||
| Work in process | 125.0 | 151.1 | ||||
| $ | 364.4 | $ | 419.5 | |||
11. PROPERTY, PLANT AND EQUIPMENT
| | Cost | Accumulated depreciation | Net book value | |||||||
|---|---|---|---|---|---|---|---|---|---|---|
| December 31, 2005 | ||||||||||
| Land | $ | 90.5 | $ | — | $ | 90.5 | ||||
| Buildings and leasehold improvements | 801.8 | 252.3 | 549.5 | |||||||
| Machinery and equipment | 3,670.4 | 2,261.1 | 1,409.3 | |||||||
| Projects under development | 246.6 | — | 246.6 | |||||||
| $ | 4,809.3 | $ | 2,513.4 | $ | 2,295.9 | |||||
| December 31, 2004 | ||||||||||
| Land | $ | 92.5 | $ | — | $ | 92.5 | ||||
| Buildings and leasehold improvements | 876.6 | 270.6 | 606.0 | |||||||
| Machinery and equipment | 3,902.0 | 2,270.8 | 1,631.2 | |||||||
| Projects under development | 43.9 | — | 43.9 | |||||||
| $ | 4,915.0 | $ | 2,541.4 | $ | 2,373.6 | |||||
52
11. PROPERTY, PLANT AND EQUIPMENT (CONT'D)
As at December 31, 2005, the cost of property, plant and equipment and the corresponding accumulated depreciation balance included amounts of $152.2 million ($185.0 million as at December 31, 2004) and $70.1 million ($78.0 million as at December 31, 2004) respectively, for the assets held under capital leases. Depreciation expenses of property, plant and equipment held under capital leases amounted to $5.6 million in 2005 ($7.0 million in 2004, and $17.6 million in 2003).
12. GOODWILL
In the fourth quarter of 2005, the Company completed its annual goodwill impairment test. The European reporting unit has suffered from poor market conditions throughout 2005, namely continued price erosion and decreased volumes, as well as several production inefficiencies and the loss of an important client. As a result, the Company concluded that the carrying amount of goodwill for the European reporting unit was not fully recoverable and an impairment charge of $243 million was taken at December 31, 2005.
The changes in the carrying amount of goodwill for the year ended December 31, 2005 are as follows:
| | North America | Europe | Latin America | Total | |||||||||
|---|---|---|---|---|---|---|---|---|---|---|---|---|---|
| Balance as at December 31, 2004 | $ | 2,198.3 | $ | 445.4 | $ | 8.2 | $ | 2,651.9 | |||||
| Goodwill acquired | — | 0.2 | — | 0.2 | |||||||||
| Business disposal | (42.9 | ) | — | — | (42.9 | ) | |||||||
| Goodwill impairment | — | (243.0 | ) | — | (243.0 | ) | |||||||
| Foreign currency changes | 1.3 | (61.7 | ) | (0.1 | ) | (60.5 | ) | ||||||
| Balance as at December 31, 2005 | $ | 2,156.7 | $ | 140.9 | $ | 8.1 | $ | 2,305.7 | |||||
13. LONG-TERM DEBT
| | Maturity | 2005 | 2004 | |||||
|---|---|---|---|---|---|---|---|---|
| Revolving bank facility $1.0 B (a) | 2009 | $ | 334.2 | $ | 417.8 | |||
| Senior Notes 4.875% and 6.125% (b) | 2008, 2013 | 597.5 | 597.2 | |||||
| Senior Notes 8.42% and 8.52% (c) | 2010, 2012 | 250.0 | 250.0 | |||||
| Senior Notes 7.20% (d) | 2006 | 250.0 | 250.0 | |||||
| Senior Debentures 7.25% (e) | 2007 | 150.0 | 150.0 | |||||
| Senior Debentures 6.50% (f) | 2027 | 3.2 | 3.2 | |||||
| Senior Notes 8.54% and 8.69% (g) | 2015, 2020 | 121.0 | 121.0 | |||||
| Other debts and capital leases (h) | 2006-2016 | 33.7 | 48.3 | |||||
| 1,739.6 | 1,837.5 | |||||||
| Less current portion | 7.7 | 11.7 | ||||||
| $ | 1,731.9 | $ | 1,825.8 | |||||
- (a)
- In December 2005, the Company extended, for an additional year, its existing revolving bank facility. The bank facility is composed of three tranches each maturing in January 2009. All three tranches can be extended on a yearly basis. The facility contains certain restrictions, including the obligation to maintain certain financial ratios. The facility can be used for general corporate purposes. The Company paid fees for the unused portion of $1.8 million in 2005 ($1.2 million in 2004).
The revolving bank facility bears interest at variable rates based on Bankers' Acceptances or LIBOR rates. At December 31, 2005, the drawings under this facility are denominated in Canadian and US dollars and bear interest at 4.62% and 5.62%, respectively.
- (b)
- In November 2003, the Company issued, at a discount, Senior Notes for a principal amount of $600.0 million comprised of two tranches. The first tranche of $200.0 million matures on November 15, 2008 and the second tranche of $400.0 million matures on November 15, 2013. Issuance costs of $4.8 million were paid on this transaction.
- (c)
- In July 2000, the Company issued Senior Notes for a principal amount of $250.0 million comprised of two tranches. The first tranche of $175.0 million matures on July 15, 2010, while the second tranche of $75.0 million matures on July 15, 2012. These notes contain certain restrictions, which are generally less restrictive than those of the revolving bank facility.
53
13. LONG-TERM DEBT (CONT'D)
- (d)
- In March 2001, the Company issued Senior Notes for a principal amount of $250.0 million maturing in March 2006. A portion of $33.0 million of the notes bears a floating interest rate, but has been swapped to a fixed rate at the same rate as the coupon on the fixed rate portion (see Note 19 (c)). These notes contain certain restrictions, which are generally less restrictive than those of the revolving bank facility. At December 31, 2005, the Senior Notes were classified as long-term, since the Company has the ability and the intent to maintain such debt on a long-term basis and has long-term bank facilities available (see (a) above) to replace such debt, if necessary.
- (e)
- The Senior Debentures mature on January 15, 2007.
- (f)
- The Senior Debentures due on August 1, 2027 were redeemable at the option of the holder at their par value on August 1, 2004. Out of a principal amount of $150.0 million, $146.8 million Senior Debentures were tendered and repurchased at par value.
- (g)
- In September 2000, the Company issued Senior Notes for a principal amount of $121.0 million comprised of two tranches. The first tranche of $91.0 million matures on September 15, 2015 and the second tranche of $30.0 million matures on September 15, 2020. These Notes contain certain restrictions, which are generally less restrictive than those of the revolving bank facility.
- (h)
- Other debts and capital leases are partially secured by assets. An amount of $13.8 million ($23.0 million as at December 31, 2004) is denominated in Euro, an amount of $2.6 million ($3.3 million as at December 31, 2004) in Swedish kronas and an amount of $1.0 million ($ 1.4 million as at December 31, 2004) in Canadian dollars. At December 31, 2005, these debts and capital leases bear interest at rates ranging from 0.0% to 10.8%.
The Company was in compliance with all significant debt covenants at December 31, 2005.
Principal repayments on long-term debt are as follows:
| 2006 | $ | 7.7 | |
| 2007 | 153.8 | ||
| 2008 | 205.1 | ||
| 2009 | 592.0 | ||
| 2010 | 177.1 | ||
| 2011 and thereafter | 603.9 |
14. OTHER LIABILITIES
| | 2005 | 2004 | ||||
|---|---|---|---|---|---|---|
| Postretirement benefits | $ | 70.8 | $ | 73.5 | ||
| Pension liability | 82.8 | 86.3 | ||||
| Workers' compensation accrual | 40.8 | 30.3 | ||||
| Reserve for environmental matters | 13.2 | 15.9 | ||||
| Derivative financial instruments | 5.8 | 26.4 | ||||
| Other | 45.9 | 45.1 | ||||
| $ | 259.3 | $ | 277.5 | |||
15. CONVERTIBLE NOTES
| | Maturity | 2005 | 2004 | |||||
|---|---|---|---|---|---|---|---|---|
| Convertible senior subordinated notes 6.00% | 2007 | $ | 115.5 | $ | 112.6 | |||
54
15. CONVERTIBLE NOTES (CONT'D)
The convertible senior subordinated notes mature on October 1, 2007. The notes were issued by WCP and revalued at the time WCP was acquired by the Company in order to reflect their fair value based on the Company's borrowing rate for similar financial instruments. The equity component of the notes, which corresponds to the option of the holder to convert the notes into equity shares of the Company, was valued at the date of acquisition and classified as additional paid-in capital. Since the acquisition of WCP by the Company, each $1,000 tranche is convertible into 30.5884 Subordinate Voting Shares of the Company, which corresponds to a price of $26.24 per share and $197.25 in cash. The notes are convertible at the option of the holder at any time, and redeemable at the option of the Company at a decreasing premium from October 2002 to the final maturity. Pursuant to the terms of the convertible notes, the Company repurchased $7.6 million of the notes in 1999 following a tender offer at par for 100% of the face value of $151.8 million. The Company subsequently repurchased notes in the open market in 2000 for the principal amount of $24.7 million thereof. The aggregate principal amount of the notes, as at December 31, 2005, was $119.5 million ($119.5 million as at December 31, 2004). The number of equity shares to be issued upon conversion of the convertible notes would be 3,656,201.
16. CAPITAL STOCK
(a) Authorized
Equity shares:
Multiple Voting Shares, authorized in an unlimited number, without par value, carrying ten votes per share, convertible at any time into Subordinate Voting Shares on a one-to-one basis.
Subordinate Voting Shares, authorized in an unlimited number, without par value, carrying one vote per share.
Preferred shares, authorized in an unlimited number, without par value, issuable in series; the number of preferred shares in each series and the related characteristics, rights and privileges are to be determined by the Board of Directors prior to each issue.
The Series 2 Cumulative Redeemable First Preferred Shares may be converted at every fifth anniversary into Series 3 Cumulative Redeemable First Preferred Shares under certain conditions.
The Series 3 Cumulative Redeemable First Preferred Shares are entitled to a fixed cumulative preferential cash dividend of Cdn$1.5380 per share per annum, payable quarterly from December 1, 2002 to November 30, 2007. Thereafter, a new fixed cumulative preferential cash dividend will be set by the Company for another five-year period. On December 1, 2007, and at every 5th anniversary thereafter, these preferred shares may be converted into Series 2 Cumulative Redeemable First Preferred Shares under certain conditions.
The Series 4 Cumulative Redeemable First Preferred Shares are entitled to a fixed cumulative preferential cash dividend of Cdn$1.6875 per share per annum, payable quarterly, if declared. On and after March 15, 2006, these preferred shares are redeemable at the option of the Company at Cdn$25.00, or with regulatory approval, the preferred shares may be converted into equity shares by the Company. On and after June 15, 2006, these preferred shares may be converted at the option of the holder into equity shares, subject to the right of the Company prior to the conversion date to redeem for cash or find substitute purchasers for such preferred shares.
The Series 5 Cumulative Redeemable First Preferred Shares are entitled to a fixed cumulative preferential cash dividend of Cdn$1.725 per share per annum, payable quarterly, if declared. On and after December 1, 2007, these preferred shares are redeemable at the option of the Company at Cdn$25.00, or with regulatory approval, the preferred shares may be converted into equity shares by the Company. On and after March 1, 2008, these preferred shares may be converted at the option of the holder into equity shares, subject to the right of the Company prior to the conversion date to redeem for cash or find substitute purchasers for such preferred shares.
(b) Issued and outstanding
Each series of Preferred Shares ranks pari passu with every other series of Preferred Shares.
| | December 31, 2005 | December 31, 2004 | December 31, 2003 | |||||||||||||
|---|---|---|---|---|---|---|---|---|---|---|---|---|---|---|---|---|
| | Number | Amount | Number | Amount | Number | Amount | ||||||||||
| (Thousands of shares) | ||||||||||||||||
| Multiple voting shares | 46,987 | $ | 93.5 | 46,987 | $ | 93.5 | 46,987 | $ | 93.5 | |||||||
| Subordinate voting shares | 83,981 | 1,138.5 | 85,604 | 1,155.2 | 84,964 | 1,143.0 | ||||||||||
| Redeemable first preferred shares: | ||||||||||||||||
| Series 3 | 12,000 | 212.5 | 12,000 | 212.5 | 12,000 | 212.5 | ||||||||||
| Series 4 | 8,000 | 130.2 | 8,000 | 130.2 | 8,000 | 130.2 | ||||||||||
| Series 5 | 7,000 | 113.9 | 7,000 | 113.9 | 7,000 | 113.9 | ||||||||||
| 27,000 | 456.6 | 27,000 | 456.6 | 27,000 | 456.6 | |||||||||||
| Total capital stock | $ | 1,688.6 | $ | 1,705.3 | $ | 1,693.1 | ||||||||||
During 2005, there were 315,065 Subordinate Voting Shares issued under the Company's stock option plan (55,363 in 2004 and 27,346 in 2003) and 487,832 Subordinate Voting Shares issued under the Company's employee stock purchase plans (584,474 in 2004 and 779,499 in 2003) for a total cash consideration of $16.3 million ($12.2 million in 2004 and $13.5 million in 2003). Pursuant to the acquisition of World Color Press in 1999, the Company issued 11,371 Subordinate Voting Shares in 2005.
55
16. CAPITAL STOCK (CONT'D)
(c) Share repurchases
On May 10, 2005 the Company announced a Normal Course Issuer Bid Program (the "Program") under which a maximum of 7,300,000 Subordinate Voting Shares can be repurchased. The purchases will be made during a twelve-month period from May 13, 2005 to May 12, 2006. As at December 31, 2005, the Company repurchased for cancellation under the Program, a total of 2,438,500 Subordinate Voting Shares for a net cash consideration of Cdn $58.2 million ($46.6 million). The excess of the price paid over the book value of the shares repurchased amounting to Cdn $12.3 million ($9.8 million) was charged to retained earnings.
In June 2003, the Company repurchased for cancellation a total of 10,000,000 Subordinate Voting Shares pursuant to its Substantial Issuer Bid dated April 24, 2003 for a net cash consideration, including redemption fees, of Cdn$241.1 million ($173.6 million). The Substantial Issuer Bid expired at midnight (Montreal time) on the evening of June 2, 2003. The excess of the price paid over the book value of the shares repurchased, amounting to $39.3 million, was charged to retained earnings.
17. STOCK-BASED COMPENSATION PLANS
(a) Employee share purchase plans
The Employee Stock Purchase Plan gives eligible employees in the United States the opportunity to acquire shares of the Company's capital stock for up to 4% of their gross salaries and to have the Company contribute, on the employees' behalf, a further amount equal to 17.5% of the total amount invested by the employee. The number of shares that may be issued and sold under the plan is limited to 4,000,000 Subordinate Voting Shares, subject to adjustments in the event of stock dividends, stock splits and similar events. At December 31, 2005, 3,448 employees (4,107 as at December 31, 2004 and 6,559 as at December 2003) were participating in the plan. The total number of plan shares issued for employees was 333,646 in 2005, including the Company's contribution of 49,692 (417,769 in 2004, including the Company's contribution of 62,221 and 600,310 in 2003, including the Company's contribution of 89,408) which represented compensation expenses amounting to $1.0 million in 2005 ($1.1 million in 2004 and $1.9 million in 2003).
The Employee Share Investment Plan gives eligible employees in Canada the opportunity to subscribe for up to 4% of their gross salaries to purchase shares of the Company's capital stock and to have the Company invest, on the employee's behalf, a further 20% of the amount invested by the employee. The number of shares that may be issued and sold under this plan is limited to 3,000,000 Subordinate Voting Shares, subject to adjustments in the event of stock dividends, stock splits and similar events. At December 31, 2005, 1,861 employees (1,403 at December 31, 2004 and 2,281 at December 2003) were participating in the plan. The total number of shares issued for employees, was 154,186 in 2005, including the Company's contribution of 18,900 (166,705 in 2004, including the Company's contribution of 25,930 and 179,189 in 2003, including the Company's contribution of 30,085), which represented compensation expenses amounting to Cdn $0.6 million ($0.5 million) in 2005 (Cdn$0.6 million ($0.5 million) in 2004 and Cdn$0.6 million ($0.4 million) in 2003).
(b) Stock option plan
Under the stock option plan, a total of 7,204,734 Subordinate Voting Shares have been reserved for plan participants. As of December 31, 2005, the number of Subordinate Voting Shares related to the stock options outstanding was 5,947,970. The subscription price was usually equal to the share market price at the date the options were granted. The options vest over either four or five years.
In 2005, the Board of Directors approved certain changes to the stock option plan. As such, all new grants are now half vesting over four years and half vesting upon attainment of specific performance targets based on EPS and share price growth. Also, the options may be exercised during a period not exceeding ten years from the date they have been granted for options granted until 2004, or during a period not exceeding six years from the date they have been granted for options granted in 2005.
In 2004, the Board of Directors approved a special option grant of 1,000,000 Subordinate Voting Shares of the Company. The subscription price was equal to the share market price at the grant date and the options are half vesting over time and half vesting upon attainment of specific performance targets based on EPS and share price growth.
56
17. STOCK-BASED COMPENSATION PLANS (CONT'D)
(b) Stock option plan (cont'd)
The fair value of options granted during 2003, was estimated using the Black-Scholes option pricing model. Since 2004, the fair value of options granted during the year was estimated using the binomial option pricing model. The following weighted average assumptions were used:
| | 2005 | 2004 | 2003 | ||||
|---|---|---|---|---|---|---|---|
| Weighted-average grant date fair value of options | $4.32 | $7.01 | $5.74 | ||||
Assumptions: | |||||||
| Risk-free interest rate | 3.26% – 4.13% | 4.01% – 4.59% | 4.61% – 4.73% | ||||
| Dividend yield | 2% – 3% | 2% – 3% | 2% – 4% | ||||
| Expected volatility | 33% – 34% | 30% | 26% – 28% | ||||
| Expected life | 4.25 years | 7 years | 7 years | ||||
During the year, under the stock option plan and the special option grant, a compensation expense of $1.1 million ($4.3 million in 2004 and $1.9 million in 2003), was recognized with a corresponding increase in additional paid-in capital.
The number of stock options outstanding fluctuated as follows:
| | 2005 | 2004 | 2003 | ||||||||||||
|---|---|---|---|---|---|---|---|---|---|---|---|---|---|---|---|
| | Options | Weighted average exercise price | Options | Weighted average exercise price | Options | Weighted average exercise price | |||||||||
| Balance, beginning of year | 4,542,045 | $ | 23.81 | 3,699,061 | $ | 22.52 | 3,525,376 | $ | 20.42 | ||||||
| Issued | 1,930,120 | 20.57 | 1,181,023 | 23.83 | 916,911 | 22.54 | |||||||||
| Exercised | (315,065 | ) | 20.52 | (55,363 | ) | 14.38 | (27,346 | ) | 13.93 | ||||||
| Cancelled | (209,130 | ) | 22.24 | (282,676 | ) | 24.40 | (715,880 | ) | 23.01 | ||||||
| Balance, end of year | 5,947,970 | $ | 23.45 | 4,542,045 | $ | 23.81 | 3,699,061 | $ | 22.52 | ||||||
| Options exercisable, end of year | 2,709,003 | $ | 24.92 | 2,306,882 | $ | 23.81 | 1,939,486 | $ | 22.21 | ||||||
The following table summarizes information about stock options outstanding and exercisable at December 31, 2005
| | Options outstanding | Options exercisable | ||||||||||
|---|---|---|---|---|---|---|---|---|---|---|---|---|
| Range of exercise prices | Number outstanding | Weighted average remaining contractual life (in years) | Weighted average exercise price | Number exercisable | Weighted average exercise price | |||||||
| $15 – $18 | 84,009 | 1.33 | 16.65 | 84,009 | 16.65 | |||||||
| $18 – $21 | 1,185,332 | 5.50 | 19.76 | 256,982 | 19.47 | |||||||
| $21 – $24 | 2,336,322 | 4.80 | 22.04 | 1,058,717 | 22.90 | |||||||
| $24 – $29 | 1,872,606 | 6.70 | 26.37 | 848,003 | 27.53 | |||||||
| $29 – $32 | 469,701 | 4.37 | 29.33 | 461,292 | 29.28 | |||||||
| 5,947,970 | 5.46 | $ | 23.45 | 2,709,003 | $ | 24.92 | ||||||
57
17. STOCK-BASED COMPENSATION PLANS (CONT'D)
(b) Stock option plan (cont'd)
Prior to January 1, 2003, the Company used the settlement based method for its stock-based compensation plans. Had compensation cost been determined using the fair value based method at the date of grant for awards granted in 2002 under all plans, the Company's pro forma net income (loss), earnings (loss) per share and diluted earnings (loss) per share would have been as presented in the table below.
| | 2005 | 2004 | 2003 | ||||||||
|---|---|---|---|---|---|---|---|---|---|---|---|
| Pro forma net income (loss) | $ | (162.6 | ) | $ | 143.3 | $ | (31.8 | ) | |||
Pro forma earnings (loss) per share: | |||||||||||
| Basic and Diluted | $ | (1.54 | ) | $ | 0.80 | $ | (0.50 | ) | |||
The pro forma disclosure omits the effect of awards granted before January 1, 2002. These pro forma amounts include a compensation cost calculated using the Black-Scholes option pricing model with the following assumptions.
| Weighted-average grant date fair value of options | $ | 4.83 | ||
| Assumptions: | ||||
| Risk-free interest rate | 4.48% – 5.07% | |||
| Dividend yield | 2% | |||
| Expected volatility | 25% | |||
| Expected life | 7 years | |||
(c) Deferred stock unit plan
The deferred stock unit plan ("DSU plan") is for the benefit of the Company's directors. Under the DSU plan, a portion of each director's compensation package is received in the form of units. The value of a unit is based on the weighted average trading price of the Subordinate Voting Shares. Subject to certain limitations, the units will be redeemed by the Company when the director ceases to be a DSU participant. For the purpose of redeeming units, the value of a unit shall correspond to the fair market value of a Subordinate Voting Share on the date of redemption.
As of December 31, 2005, the number of units outstanding under this plan was 215,447 (153,948 in 2004 and 83,972 in 2003), which represented compensation expense (revenue) amounting to $(0.5) million in 2005 ($1.6 million in 2004 and $0.9 million in 2003).
18. TRANSLATION ADJUSTMENT
The change in the translation adjustment included in shareholders' equity is the result of the exchange rates fluctuation, on translation of net assets of self-sustaining foreign operations, exchange gains or losses on intercompany account balances that form part of the net investments, and foreign exchange gains or losses related to derivative financial instruments used to hedge the net investments, net of income taxes.
| | Note | 2005 | 2004 | 2003 | ||||||||
|---|---|---|---|---|---|---|---|---|---|---|---|---|
| Balance, beginning of year | $ | 36.6 | $ | (19.2 | ) | $ | (115.6 | ) | ||||
| Effect of exchange rate variation on translation of net assets of self-sustaining foreign operations and exchange gains or losses on intercompany account balances that form part of the net investments | (51.6 | ) | 37.3 | 48.0 | ||||||||
| Change in the fair value of foreign-exchange forward contracts to hedge net investment in a foreign subsidiary (net of income taxes) | (5.4 | ) | 19.5 | 43.1 | ||||||||
| Shares repurchased | 16 | (3.8 | ) | — | — | |||||||
| Portion included in income as a result of reductions in net investments in self-sustaining foreign operations | 3 | — | (1.0 | ) | 5.3 | |||||||
| Balance, end of year | $ | (24.2 | ) | $ | 36.6 | $ | (19.2 | ) | ||||
58
19. FINANCIAL INSTRUMENTS AND CONCENTRATIONS OF CREDIT RISK
(a) Fair value of financial instruments
The carrying values of cash and cash equivalents, trade receivables, receivables from related parties, bank indebtedness, trade payables, payables to related parties and accrued liabilities approximate their fair values because of the short-term nature of these items.
The following table summarizes the book value and fair value at December 31, 2005 and 2004 of those financial instruments having a fair value different from their book value as at December 31. The fair values of the financial liabilities are estimated based on discounted cash flows using year-end market yields of similar instruments having the same maturity. The fair values of the derivative financial instruments are estimated using year-end market rates, and reflect the amount that the Company would receive or pay if the instruments were closed out at these dates.
| | 2005 | 2004 | ||||||||||||
|---|---|---|---|---|---|---|---|---|---|---|---|---|---|---|
| | Book Value | Fair Value | Book Value | Fair Value | ||||||||||
| Financial liabilities | ||||||||||||||
| Long-term debt(1) | $ | (1,739.6 | ) | $ | (1,704.8 | ) | $ | (1,837.5 | ) | $ | (1,943.6 | ) | ||
| Convertible notes(1) | (115.5 | ) | (120.8 | ) | (112.6 | ) | (121.9 | ) | ||||||
| Derivative financial instruments | ||||||||||||||
| Interest rate swap agreements | — | (10.4 | ) | — | (5.1 | ) | ||||||||
| Foreign exchange forward contracts | 4.7 | 15.5 | 72.8 | 109.8 | ||||||||||
| Cross currency interest rate swaps | 3.6 | 3.6 | (16.7 | ) | (16.7 | ) | ||||||||
| Commodity swaps | (0.1 | ) | (0.5 | ) | (0.1 | ) | (1.4 | ) | ||||||
- (1)
- Including current portion
In February 2005, the Company sold foreign exchange forward contracts that were used to hedge its net investment in a foreign subsidiary for a cash consideration of $69.2 million. These foreign exchange forward contracts were already recorded at the fair market value and all resulting gains were previously recorded in cumulative translation adjustment.
(b) Foreign exchange risk management
The Company enters into foreign exchange forward contracts and cross-currency interest rate swaps to hedge the settlement of foreign denominated sales, related receivables, raw materials, equipment purchases and foreign denominated debt, and to manage its foreign exchange exposure on net investments and foreign denominated assets. The amounts of outstanding contracts at year-end, presented by currency, are included in the tables below:
(i) Foreign exchange forward contracts
| | 2005 | 2004 | |||||||||
|---|---|---|---|---|---|---|---|---|---|---|---|
| Currencies (sold / bought) | Notional amounts(2) | Average rate(3) | Notional amounts(2) | Average rate(3) | |||||||
| $ / Cdn $ | |||||||||||
| Less than 1 year | $ | 228.4 | 0.8125 | $ | 120.2 | 0.6534 | |||||
| Between 1 and 3 years | 34.1 | 0.8323 | 367.0 | 0.6323 | |||||||
| Euro / $ | |||||||||||
| Less than 1 year | 299.9 | 0.8276 | 186.1 | 0.7477 | |||||||
| SEK / $ | |||||||||||
| Less than 1 year | 44.4 | 7.7751 | 42.1 | 6.6918 | |||||||
| GBP / Euro | |||||||||||
| Less than 1 year | 10.7 | 0.6857 | 21.8 | 0.6956 | |||||||
| Between 1 and 3 years | — | — | 1.8 | 0.7068 | |||||||
| Other | |||||||||||
| Less than 1 year | 96.7 | — | 88.5 | — | |||||||
| Between 1 and 3 years | 0.1 | — | 9.4 | — | |||||||
| $ | 714.3 | $ | 836.9 | ||||||||
- (2)
- Transactions in foreign currencies are translated into dollars using the closing exchange rate as at December 31, 2005 and 2004.
- (3)
- Rates are expressed as the number of units of the currency sold for one unit of the currency bought.
59
19. FINANCIAL INSTRUMENTS AND CONCENTRATIONS OF CREDIT RISK (CONT'D)
(b) Foreign exchange risk management (cont'd)
(ii) Cross-currency swaps
| | 2005 | 2004 | |||||||||
|---|---|---|---|---|---|---|---|---|---|---|---|
| Currencies (sold / bought) | Notional amounts(1) | Average rate(2) | Notional amounts(1) | Average rate(2) | |||||||
| Euro / $ | |||||||||||
| Less than 1 year | $ | 67.1 | 0.7963 | $ | 83.3 | 0.7461 | |||||
| Between 1 and 3 years | — | — | 34.6 | 0.8226 | |||||||
| SEK / $ | |||||||||||
| Less than 1 year | — | — | 3.1 | 7.4000 | |||||||
| $ | 67.1 | $ | 121.0 | ||||||||
- (1)
- Transactions in foreign currencies are translated into dollars using the closing exchange rate as at December 31, 2005 and 2004.
- (2)
- Rates are expressed as the number of units of the currency sold for one unit of the currency bought.
(c) Interest rate risk management
The Company has entered into interest rate swaps to manage its interest rate exposure. The Company is committed to exchange, at specific intervals, the difference between the fixed and floating interest rate calculated by reference to the notional amounts.
The amounts of outstanding contracts at December 31, 2005 and 2004 are included in the table below:
| Maturity | Notional amount | Pay/Receive | Fixed Rate | Floating Rate | |||||
|---|---|---|---|---|---|---|---|---|---|
| March 2006 | $ | 33.0 | Company pays fixed/receives floating | 7.20% | Libor 3 months/plus 1.36% | ||||
| November 2008 | $ | 200.0 | Company pays floating/receives fixed | 4.875% | Libor 3 months/plus 1.53% – 1.58% | ||||
(d) Commodity risk
The Company has entered into commodity swap agreements to manage a portion of its North American natural gas exposure. The Company is committed to exchange, on a monthly basis, the difference between a fixed price and a floating natural gas price index calculated by reference to the notional amounts.
The amounts of outstanding contracts at year-end are included in the table below:
| | 2005 | 2004 | |||||||||
|---|---|---|---|---|---|---|---|---|---|---|---|
| Countries / Unit | Notional quantity | Average price(3) | Notional quantity | Average price(3) | |||||||
| Canada / millions of Gigajoules | |||||||||||
| Less than 1 year | 0.2 | $ | 9.845 | 0.2 | $ | 5.76 | |||||
| US / millions of MMBTU | |||||||||||
| Less than 1 year | 2.2 | $ | 10.909 | 2.0 | $ | 6.89 | |||||
- (3)
- Transactions in foreign currencies are translated into dollars using the closing exchange rate as at December 31, 2005 and 2004.
60
19. FINANCIAL INSTRUMENTS AND CONCENTRATIONS OF CREDIT RISK (CONT'D)
(e) Credit risk
The Company is exposed to credit losses resulting from defaults by counterparties when using financial instruments.
When the Company enters into derivative financial instruments, the counterparties are international and Canadian banks having a minimum credit rating of A- by Standard & Poor's or of A3 by Moody's and are subject to concentration limits. The Company does not foresee any failure by the counterparties in meeting their obligations.
The Company, in the normal course of business, continuously monitors the financial condition of its customers and reviews the credit history of each new customer. At December 31, 2005, no customer balance represents a significant portion of the Company's consolidated trade receivables. The Company establishes an allowance for doubtful accounts that corresponds to the specific credit risk of its customers, historical trends and other information on the state of the economy.
The Company believes that the product and geographic diversity of its customer base is instrumental in reducing its credit risk, as well as the impact on the Company of fluctuations in local market or product-line demand. The Company has long-term contracts with most of its largest customers. These contracts usually include price adjustment clauses based on the cost of paper, ink and labour. The Company does not believe that it is exposed to an unusual level of customer credit risk.
20. COMMITMENTS AND CONTINGENCIES
(a) Leases
The Company rents premises and machinery and equipment under operating leases which expire at various dates up to 2018 and for which minimum lease payments total $333.5 million.
Annual minimum payments under these leases are as follows:
| 2006 | $ | 101.6 | |
| 2007 | 70.0 | ||
| 2008 | 44.5 | ||
| 2009 | 29.6 | ||
| 2010 | 18.9 | ||
| 2011 and thereafter | 68.9 |
Rental expenses for operating leases from continuing operations were $84.5 million, $88.1 million and $80.5 million for the years 2005, 2004 and 2003. Rental expenses for operating leases from discontinued operations were $8.8 million, $9.0 million and $8.6 million for the years 2005, 2004 and 2003.
(b) Machinery and equipment
As at December 31, 2005, the Company had commitments to purchase 24 new presses for its North American and European segments for a total amount of $291.5 million, of which $220.7 million was already disbursed and the remaining payments amount to $31.0 million in 2006 and $39.8 million in 2007. The Company had also committed to purchase other equipment for a total value of approximately $27.1 million.
(c) Environment
The Company is subject to various laws, regulations and government policies principally in North America and Europe, relating to health and safety, to the generation, storage, transportation, disposal and environmental emissions of various substances, and to environment protection in general. The Company believes it is in compliance with such laws, regulations and government policies, in all material respects. Furthermore, the Company does not anticipate that maintaining compliance with such environmental statutes will have a material adverse effect upon the Company's competitive or consolidated financial position.
(d) Guarantees
Significant guarantees the Company has provided to third parties include the following:
Operating leases
The Company has guaranteed a portion of the residual values of certain of its assets under operating leases with expiry dates between 2007 and 2009, for the benefit of the lessor. If the fair value of the assets, at the end of their respective lease term, is less than the residual value guaranteed, then the Company must, under certain conditions, compensate the lessor for a portion of the shortfall. The maximum exposure in respect of these guarantees is $67.0 million. Of this amount, $61.9 million will expire in 2007. As at December 31, 2005, the Company has recorded a liability of $7.8 million associated with these guarantees.
Sub-lease agreements
The Company has, for some of its assets under operating leases, entered into sub-lease agreements with expiry dates between 2006 and 2008. If the sub-lessee defaults under the agreement, the Company must, under certain conditions, compensate the lessor for the defaults. The maximum exposure in respect of these guarantees is $6.6 million. As at December 31, 2005, the Company has not recorded a liability associated with these guarantees, other than that provided for under unfavourable leases of $1.2 million, since it is not likely at this time that the sub-lessee will default under the agreement and required to honour the initial obligation. Recourse against the sub-lessee is also available, up to the total amount due.
61
20. COMMITMENTS AND CONTINGENCIES (CONT'D)
(d) Guarantees (cont'd)
Business and real estate disposals
In connection with certain dispositions of businesses or real estate (note 7), the Company has provided customary representations and warranties whose terms range in duration and may not be explicitly defined. The Company has also retained certain liabilities for events that have occurred prior to the sale, relating to tax, environmental, litigation and other matters. Generally, the Company has indemnified the purchasers in the event that a third party asserts a claim against the purchaser that relate to a liability retained by the Company.
These types of indemnification guarantees typically extend for a number of years. The nature of these indemnification agreements prevents the Company from estimating the maximum potential liability that it could be required to pay to guaranteed parties. These amounts are dependent upon the outcome of future contingent events, the nature and likelihood of which cannot be determined at this time.
Historically, the Company has not made any significant indemnification payments under such agreements and no amount has been accrued in the consolidated balance sheet with respect to these indemnification guarantees as at December 31, 2005. The Company continues to monitor the conditions that are subject to guarantees and indemnifications to identify whether it is probable that a loss has occurred, and would recognize any such losses under any guarantees or indemnifications when those losses are probable and estimable.
Debt agreements
Under the terms of certain debt agreements, the Company has guaranteed the obligation of its US subsidiaries. In this context, the Company would have to indemnify the other parties against changes in regulation relative to withholding taxes, which would occur only if the Company was to perform the payments on behalf of its US subsidiaries. These indemnifications extend for the term of the related financings and do not provide any limit on the maximum potential liabilities. The nature of the indemnification agreements prevents the Company from estimating the maximum potential liability it could be required to pay. However, the majority of the obligations to which such guarantees apply, contain make-whole provisions which effectively limit the exposure associated with such an occurrence. Moreover, within the current structure of the transactions, the Company is not exposed to such liabilities. As such, the Company has not accrued any amount in the consolidated balance sheet with respect to this item.
Irrevocable standby letters of credit
The Company and certain of its subsidiaries have granted irrevocable standby letters of credit, issued by high rated financial institutions, to third parties to indemnify them in the event the Company does not perform its contractual obligations. As of December 31, 2005, the guarantee instruments amounted to $86.4 million. The Company has not recorded any additional liability with respect to these guarantees, as the Company does not expect to make any payments in excess of what is recorded in the Company's financial statements. The guarantee instruments mature at various dates in fiscal 2006 and 2007.
21. RELATED PARTY TRANSACTIONS
The Company entered into the following transactions, at prices and conditions prevailing in the market, with related parties (the parent company and its other subsidiaries) and were accounted for using the amount of cash consideration:
| | 2005 | 2004 | 2003 | ||||||
|---|---|---|---|---|---|---|---|---|---|
| Revenues | $ | 64.9 | $ | 52.1 | $ | 42.5 | |||
| Purchases | 6.6 | 5.4 | 2.2 | ||||||
| Management fees billed by Quebecor Inc. | 4.5 | 4.2 | 3.9 | ||||||
| IT services billed by VTL (net of incurred expenses billed to VTL of $3.5 ($3.7 in 2004)) | 11.0 | 3.7 | — | ||||||
In March 2005, the Company sold certain operating assets to Quebecor Media Inc., one of the parent company's subsidiaries, for a cash consideration of Cdn$3.3 million ($2.7 million). The transaction has been realized at the carrying amount and no gain or loss was recorded.
In 2004, the Company transferred the benefit of a deduction for Part VI. I tax to subsidiaries of its parent company for a consideration of Cdn$12.4 million ($10.3 million), (Cdn$11.4 million ($8.7 million) in 2003) recorded in receivables from related parties. This reduced the Company's available future income tax assets by Cdn$13.0 million ($10.8 million), (Cdn$10.8 million ($8.3 million) in 2003), and decreased the additional paid-in capital by Cdn$0.6 million ($0.5 million) (increase of Cdn$0.6 million ($0.4 million) in 2003). The transaction was recorded at the carrying amount. The 2004 transaction has been adjusted in 2005, resulting in a decrease of Cdn$0.2 million ($0.2 million) recorded in receivables from related parties and in the additional paid-in capital.
In 2004, the Company reached an agreement with one of the parent company's subsidiaries, Vidéotron Télécom Ltée (VTL), to outsource its information technology (IT) infrastructure in North America for a duration of 7 years. As part of this agreement, VTL has purchased some of the Company's IT infrastructure equipment at a cost of $2.4 million. The outsourcing of services to VTL is estimated to cost the Company approximately $15.1 million annually. The transfer of the equipment was completed in October 2004 and recorded at the carrying amount and no gain or loss was realized.
In 2000, the Company entered into a strategic agreement with Nurun Inc. ("Nurun"). The agreement included a commitment from the Company to use Nurun services (information technology and E-Commerce services) for a minimum of $40 million over a five-year period. In 2004, an addendum was made to the agreement, extending the term for another five years from the date of the addendum. In addition, the minimum service revenues of $40 million committed to Nurun were modified to include services directly requested by the Company and its affiliates (Quebecor Inc. and Quebecor Media Inc. and their subsidiaries) as well as business referred, under certain conditions, to Nurun by the Company and its affiliates. Finally, if the aggregate amount of the service revenues for the term of the agreement is lower than the minimum of $40 million, the Company has agreed to pay an amount to Nurun equal to 30% of the difference between the minimum guaranted revenues and the aggregate amount of revenues. As of December 31, 2005, the cumulative services registered by Nurun under this agreement, amounted to $11.4 million.
62
22. PENSION AND OTHER POSTRETIREMENT BENEFITS
The Company maintains defined benefit and contribution pension plans for its employees. The Company's policy is to maintain its contribution at a level sufficient to cover benefits. The effective dates of the most recent actuarial valuations for funding purposes were between December 2002 and May 2005, and the date of the next required actuarial valuation ranges between December 2005 and May 2008.
The Company provides postretirement benefits to eligible employees. The costs of these benefits, which are principally health care, are accounted for during the employees' active service period.
The following table is based on a September 30th measurement date. The table provides a reconciliation of the changes in the plan's benefit obligations and fair value of plan assets for the fiscal years ended December 31, 2005 and December 31, 2004, and a statement of the funded status as at December 31, 2005 and December 31, 2004:
| | Pension Benefits | Postretirement Benefits | ||||||||||||
|---|---|---|---|---|---|---|---|---|---|---|---|---|---|---|
| | 2005 | 2004 | 2005 | 2004 | ||||||||||
| Changes in benefit obligations | ||||||||||||||
| Benefit obligation, beginning of year | $ | 1,020.1 | $ | 971.0 | $ | 66.1 | $ | 100.3 | ||||||
| Service cost | 35.2 | 37.8 | 1.1 | 1.5 | ||||||||||
| Interest cost | 59.9 | 58.0 | 3.9 | 5.8 | ||||||||||
| Plan participants' contributions | 5.1 | 5.3 | 1.9 | 2.1 | ||||||||||
| Plan amendments | — | (1.5 | ) | (3.5 | ) | (13.0 | ) | |||||||
| Divestitures | (3.8 | ) | — | — | — | |||||||||
| Curtailment (gain) loss | (5.6 | ) | 1.2 | (0.7 | ) | (6.0 | ) | |||||||
| Actuarial (gain) loss | 80.4 | (16.4 | ) | 8.8 | (16.2 | ) | ||||||||
| Benefits paid | (76.7 | ) | (61.0 | ) | (8.5 | ) | (9.0 | ) | ||||||
| Foreign currency changes | (2.7 | ) | 25.7 | 0.3 | 0.6 | |||||||||
| Benefit obligation, end of year | $ | 1,111.9 | $ | 1,020.1 | $ | 69.4 | $ | 66.1 | ||||||
Changes in plan assets | ||||||||||||||
| Fair value of plan assets, beginning of year | $ | 619.2 | $ | 480.8 | $ | — | $ | — | ||||||
| Actual return on plan assets | 64.8 | 57.3 | — | — | ||||||||||
| Employer contributions | 53.4 | 120.5 | 6.6 | 6.9 | ||||||||||
| Plan participants' contributions | 5.1 | 5.3 | 1.9 | 2.1 | ||||||||||
| Benefits paid | (76.7 | ) | (61.0 | ) | (8.5 | ) | (9.0 | ) | ||||||
| Foreign currency changes | 1.2 | 16.3 | — | — | ||||||||||
| Fair value of plan assets, end of year | $ | 667.0 | $ | 619.2 | $ | — | $ | — | ||||||
| Reconciliation of funded status | ||||||||||||||
| Funded status | $ | (444.9 | ) | $ | (400.9 | ) | $ | (69.4 | ) | $ | (66.1 | ) | ||
| Unrecognized net transition asset | (3.6 | ) | (4.7 | ) | — | — | ||||||||
| Unrecognized prior service cost (benefit) | 13.9 | 18.4 | (16.1 | ) | (13.6 | ) | ||||||||
| Unrecognized actuarial loss | 414.7 | 372.3 | 13.0 | 4.4 | ||||||||||
| Adjustment for fourth quarter contributions | 5.0 | 3.6 | 1.7 | 1.8 | ||||||||||
| Net amount recognized | $ | (14.9 | ) | $ | (11.3 | ) | $ | (70.8 | ) | $ | (73.5 | ) | ||
Included in the above benefit obligation and fair value of plan assets at year-end are the following amounts in respect of plans that are not fully funded:
| | Pension Benefits | Postretirement Benefits | |||||||||||
|---|---|---|---|---|---|---|---|---|---|---|---|---|---|
| | 2005 | 2004 | 2005 | 2004 | |||||||||
| Benefit obligation | $ | (1,111.9 | ) | $ | (1,020.1 | ) | $ | (69.4 | ) | $ | (66.1 | ) | |
| Fair value of plan assets | 667.0 | 619.2 | — | — | |||||||||
| Funded status — plan deficit | $ | (444.9 | ) | $ | (400.9 | ) | $ | (69.4 | ) | $ | (66.1 | ) | |
63
22. PENSION AND OTHER POSTRETIREMENT BENEFITS (CONT'D)
The following table provides the amounts recognized in the consolidated balance sheets:
| | Pension Benefits | Postretirement Benefits | |||||||||||
|---|---|---|---|---|---|---|---|---|---|---|---|---|---|
| | 2005 | 2004 | 2005 | 2004 | |||||||||
| Accrued benefit liability | $ | (82.8 | ) | $ | (86.3 | ) | $ | (70.8 | ) | $ | (73.5 | ) | |
| Accrued benefit asset(1) | 67.9 | 75.0 | — | — | |||||||||
| Net amount recognized | $ | (14.9 | ) | $ | (11.3 | ) | $ | (70.8 | ) | $ | (73.5 | ) | |
- (1)
- Included in other assets.
The plan assets held in trust at the measurement date and their weighted average allocations were as follows:
| Asset category | 2005 | 2004 | |||
|---|---|---|---|---|---|
| Equity securities | 64 | % | 62 | % | |
| Corporate bonds | 33 | 33 | |||
| Others | 3 | 5 |
At December 31, 2005, the equity securities did not include any of the Company's or related parties' shares.
The following table provides the components of net periodic benefit cost:
| | Pension Benefits | Postretirement Benefits | ||||||||||||||||||
|---|---|---|---|---|---|---|---|---|---|---|---|---|---|---|---|---|---|---|---|---|
| | 2005 | 2004 | 2003 | 2005 | 2004 | 2003 | ||||||||||||||
| Defined benefit plans | ||||||||||||||||||||
| Service cost | $ | 35.2 | $ | 37.8 | $ | 35.4 | $ | 1.1 | $ | 1.5 | $ | 1.3 | ||||||||
| Interest cost | 59.9 | 58.0 | 54.5 | 3.9 | 5.8 | 6.0 | ||||||||||||||
| Actual return on plan assets | (64.8 | ) | (57.3 | ) | (64.9 | ) | — | — | — | |||||||||||
| Actuarial (gain) loss | 76.9 | (16.4 | ) | 85.3 | 8.8 | (16.1 | ) | 6.1 | ||||||||||||
| Plan amendments | — | (1.5 | ) | 2.4 | (3.5 | ) | (13.0 | ) | — | |||||||||||
| Curtailment loss | 3.7 | 1.9 | 2.1 | (0.3 | ) | — | — | |||||||||||||
| Settlement loss | 3.4 | 1.8 | — | — | — | — | ||||||||||||||
| Benefit cost before adjustments to recognize the long-term nature of the plans | 114.3 | 24.3 | 114.8 | 10.0 | (21.8 | ) | 13.4 | |||||||||||||
| Difference between expected return and actual return on plan assets | 14.1 | 6.7 | 14.8 | — | — | — | ||||||||||||||
| Difference between actuarial (gain) loss recognized for the year and actual actuarial (gain) loss on accrued benefit obligation for the year | (62.2 | ) | 28.8 | (79.9 | ) | (8.1 | ) | 18.1 | (4.7 | ) | ||||||||||
| Difference between amortization of prior service cost (benefit) for the year and actual plan amendments for the year | 0.7 | 3.0 | (2.4 | ) | 1.6 | 12.9 | (0.1 | ) | ||||||||||||
| Amortization of transitional asset | (0.8 | ) | (0.8 | ) | (0.7 | ) | — | — | — | |||||||||||
| Net periodic cost | 66.1 | 62.0 | 46.6 | 3.5 | 9.2 | 8.6 | ||||||||||||||
| Defined contribution plans | 11.4 | 12.7 | 19.7 | — | — | — | ||||||||||||||
| Total periodic benefit cost | $ | 77.5 | $ | 74.7 | $ | 66.3 | $ | 3.5 | $ | 9.2 | $ | 8.6 | ||||||||
64
22. PENSION AND OTHER POSTRETIREMENT BENEFITS (CONT'D)
The defined contribution pension plan benefit cost included contributions to multiemployer plans of $6.8 million for the year ended December 31, 2005 ($7.3 million in 2004 and $7.9 million in 2003), and $2.7 for the pension obligation related to the Effingham multiemployer benefit plan for the year ended December 31, 2004.
In February 2004, the Company has suspended the employer contribution matching program, except where required by union contracts. Effective January 1, 2005, the Company reinstated the matching contributions up to an annual maximum of $500 for the following employees:
— Hourly employees with earnings of $70,000 or less
— Salaried employees with earnings of $50,000 or less
There are no changes in the employer contribution matching program where required by union contracts.
The total cash amount paid or payable for employee future benefits for all plans, consisting of cash contributed by the Company to its funded pension plans, cash payment directly to beneficiaries for its unfunded other benefit plans and cash contributed to its defined contribution plans, was $61.3 million for the year ended December 31, 2005 ($83.8 million in 2004 and $74.4 million in 2003).
The weighted average assumptions used in the measurement of the Company's benefit obligation and cost are as follows:
| | Pension Benefits | Postretirement Benefits | |||||||||||
|---|---|---|---|---|---|---|---|---|---|---|---|---|---|
| | 2005 | 2004 | 2003 | 2005 | 2004 | 2003 | |||||||
| Accrued benefit obligation as of December 31: | |||||||||||||
| Discount rate | 5.4% | 6.0% | 6.0% | 5.6% | 6.1% | 6.0% | |||||||
| Rate of compensation increase | 3.4% | 3.4% | 3.5% | — | — | — | |||||||
| Benefit costs for years ended December 31: | |||||||||||||
| Discount rate | 6.0% | 6.0% | 6.7% | 6.1% | 6.0% | 6.8% | |||||||
| Expected return on plan assets | 7.6% | 7.8% | 8.2% | — | — | — | |||||||
| Rate of compensation increase | 3.4% | 3.5% | 3.4% | — | — | — | |||||||
The assumed health care cost trend rate used in measuring the accumulated postretirement benefit obligation was 8.2% at the end of 2005 (9.9% at the end of 2004) and is expected to decrease gradually to 4.5% in 2011 and remain at that level thereafter. A one percentage point change in assumed health care cost trend would have the following effects:
| | Postretirement Benefits | ||||||
|---|---|---|---|---|---|---|---|
| Sensitivity analysis | 1% increase | 1% decrease | |||||
| Effect on service and interest costs | $ | 0.4 | $ | (0.4 | ) | ||
| Effect on benefit obligation | 4.8 | (4.2 | ) | ||||
65
23. SIGNIFICANT DIFFERENCES BETWEEN GENERALLY ACCEPTED ACCOUNTING PRINCIPLES IN CANADA AND THE UNITED STATES
The Company's consolidated financial statements have been prepared in accordance with Canadian generally accepted accounting principles ("GAAP"), which differ in some respects from those applicable in the United States. The following are the significant differences in accounting principles as they pertain to the consolidated financial statements.
(a) Reconciliation of net income (loss) and earnings (loss) per share and presentation of financial statements
The application of GAAP in the United States would have the following effects on net income (loss) as reported:
| | 2005 | 2004 | 2003 | ||||||||
|---|---|---|---|---|---|---|---|---|---|---|---|
| Net income (loss), as reported in the consolidated statements of income per GAAP in Canada | $ | (162.6 | ) | $ | 143.7 | $ | (31.4 | ) | |||
| Adjustments with respect to the following items: | |||||||||||
| Stock-based compensation (a) (i) | — | (0.1 | ) | (1.9 | ) | ||||||
| Convertible senior subordinated notes (a) (ii) | 3.5 | 2.6 | 2.4 | ||||||||
| Hedge accounting (a) (iii) | (15.5 | ) | (7.6 | ) | 23.6 | ||||||
| Reduction of a net investment in a foreign operation (a) (iv) | — | (1.0 | ) | — | |||||||
| (12.0 | ) | (6.1 | ) | 24.1 | |||||||
| Income taxes (a) (iii) | 5.1 | 2.7 | (7.9 | ) | |||||||
| Asset retirement obligations (net of income taxes of $(0.8) in 2004 and $0.8 in 2003) (a) (v) | — | 1.2 | (1.2 | ) | |||||||
| Net adjustments | (6.9 | ) | (2.2 | ) | 15.0 | ||||||
| Net income (loss), as adjusted per GAAP in the United States | $ | (169.5 | ) | $ | 141.5 | $ | (16.4 | ) | |||
| Net income available to holders of preferred shares | 39.6 | 37.5 | 36.5 | ||||||||
| Net income (loss) per GAAP in the United States available to holders of equity shares | $ | (209.1 | ) | $ | 104.0 | $ | (52.9 | ) | |||
| Weighted average number of equity shares outstanding (in millions): | |||||||||||
| Basic | 131.8 | 132.4 | 136.0 | ||||||||
| Diluted | 131.8 | 132.6 | 136.0 | ||||||||
| Earnings (loss) per share as adjusted per GAAP in the United States: | |||||||||||
| Basic | $ | (1.59 | ) | $ | 0.79 | $ | (0.39 | ) | |||
| Diluted | (1.59 | ) | 0.78 | (0.39 | ) | ||||||
66
23. SIGNIFICANT DIFFERENCES BETWEEN GENERALLY ACCEPTED ACCOUNTING PRINCIPLES IN CANADA AND THE UNITED STATES (CONT'D)
(a) Reconciliation of net income (loss) and earnings (loss) per share and presentation of financial statements (cont'd)
(i) Stock-based compensation
Under GAAP in the United States, prior to fiscal year of 2003, in accordance with the provisions of Statement of Financial Accounting Standards ("SFAS") No. 123, "Accounting for Stock-Based Compensation", the Company applied Accounting Principles Board Opinion No. 25, "Accounting for Stock Issued to Employees" (APB 25) and related interpretations in accounting for its employee share plans and stock option plans. Effective January 1, 2003, the Company changed its method of accounting for stock-based compensation and decided to use the fair value based method of accounting for all its stock-based compensation plans. In accordance with the provisions of SFAS No. 148, "Accounting for Stock-Based Compensation — Transition and Disclosure, an amendment of SFAS No. 123", the Company adopted these changes using the prospective method. The adoption of SFAS No. 123 and No. 148 harmonizes accounting standards with CICA Handbook Section 3870.
Employee stock purchase plan in the United States:
Under the provisions of APB 25, applied by the Company prior to fiscal year of 2003, an Employee Share Plan was accounted for as non-compensatory. Under GAAP in Canada, the Company's contributions were accounted for as compensation expenses.
Stock option plans:
The Company awarded in 1999 a special performance grant to certain executives. Under the provisions of APB 25, which the Company applied prior to fiscal 2003, those grants were accounted for as a variable plan. Compensation costs of this grant were recognized over the vesting period. There were no similar requirements under GAAP in Canada.
(ii) Convertible senior subordinated notes
Under GAAP in Canada, the equity component of the convertible notes is recorded under shareholders' equity as additional paid-in capital. The difference between the carrying amount of the debt component and its face value is amortized as imputed interest to income over the life of the convertible senior subordinated note. Regarding the repurchase of convertible notes, the Company is required to allocate the consideration paid on extinguishment to the liability and equity components of the convertible notes based on their fair values at the date of the transaction. The amount of gain (loss) relating to the liability element is recorded to income and the difference between the carrying amount and the amount considered to be settled relating to the conversion option element is treated as an equity transaction. Under GAAP in the United States, the allocation to equity is not permitted, no imputed interest is needed in relation to the equity component and the gain (loss) on repurchase is recorded through income in the period of extinguishment.
(iii) Accounting for derivative instruments and hedging activities
Effective January 1, 2001, the Company adopted Statements of Financial Accounting Standards Nos. 133 and 138, "Accounting for Derivative Instruments and Hedging Activities", as amended (SFAS 133). SFAS 133 establishes accounting and reporting standards for derivative instruments and hedging activities and requires that all derivatives be recorded as either assets or liabilities in the balance sheet at fair value. In order to apply hedge accounting under SFAS 133, hedging relationships must be formally documented and highly effective at offsetting changes in hedged items.
Beginning in 2001, unrealized gains and losses resulting from the valuation at fair value of derivatives not meeting strict hedge accounting criteria are recognized in net income as the gains and losses arise and not concurrently with the recognition of the transactions being hedged. Under these rules, any derivative instrument that does not qualify for hedge accounting is reported on a mark-to-market basis in earnings. GAAP in Canada does not require the fair value recognition of derivatives qualified for hedge accounting and unrealized gains and losses from the fair valuation of hedged items associated with them.
Under GAAP in the United States, hedge ineffectiveness is recognized in the statement of income in the current period whereas under GAAP in Canada such recognition is elective.
The Company utilizes interest rate swaps and forward contracts to mitigate its risk related to changes in fair value of transactions with fixed cash flows. On the earlier of the date into which the derivative contract is entered or the date of transaction, the Company designates the derivative as a hedge. Under GAAP in the United States, the change in fair values of derivatives that are treated as fair value hedges is recorded in the income statement contemporaneously with the fair value changes of the hedged asset or liability. Under GAAP in Canada such fair value changes of derivatives and the hedged items in hedging relationships qualified for hedge accounting are not required to be recognized.
(iv) Reduction of a net investment in a foreign operation
Under GAAP in Canada, a gain or loss equivalent to a proportionate amount of the exchange gain or loss accumulated in the translation adjustment has to be recognized in income when there has been a reduction of a net investment in a foreign operation. Under GAAP in the United States, a gain or loss should only be recognized in income in the case of a substantial or complete liquidation of a net investment in a foreign operation.
67
23. SIGNIFICANT DIFFERENCES BETWEEN GENERALLY ACCEPTED ACCOUNTING PRINCIPLES IN CANADA AND THE UNITED STATES (CONT'D)
(a) Reconciliation of net income (loss) and earnings (loss) per share and presentation of financial statements (cont'd)
(v) Asset retirement obligations
Effective January 1, 2003, the Company adopted Statement of Financial Accounting Standards No. 143, "Accounting for Asset Retirement Obligations", (SFAS 143), which addresses financial accounting for legal obligations associated with the retirement of tangible long-lived assets and the associated asset retirement costs. SFAS 143 requires the recognition of the fair value of a liability for an asset retirement obligation in the period in which it is incurred. When a liability is initially recorded, the cost is capitalized by increasing the carrying amount of the related long-lived asset. Over time, the liability is increased at each period to reflect an interest element considered in its initial measurement at fair value, and the capitalized cost is amortized over the useful life of the related asset. Under GAAP in Canada, accounting for asset retirement obligations was adopted in 2004.
(b) Effect on consolidated balance sheets
The application of GAAP in the United States would have the following effects on the consolidated balance sheets, as reported:
| | 2005 | 2004 | ||||||||||||
|---|---|---|---|---|---|---|---|---|---|---|---|---|---|---|
| | Canada | United States | Canada | United States | ||||||||||
| Assets | ||||||||||||||
| Current future income taxes (a) (iii) (b) (i) (ii) | $ | 34.4 | $ | 63.8 | $ | 43.2 | $ | 58.7 | ||||||
| Other current assets (a) (iii) (b) (i) | — | 6.6 | — | 38.8 | ||||||||||
| Other assets (a) (iii) (b) (i) (ii) | 187.7 | 208.5 | 219.8 | 258.6 | ||||||||||
Liabilities and Shareholders' Equity | ||||||||||||||
| Trade payables and accrued liabilities (a) (iii) (b) (i) (ii) | 872.9 | 963.4 | 931.9 | 974.2 | ||||||||||
| Current future income taxes (a) (iii) (b) (i) (ii) | 1.7 | 10.4 | 4.4 | 25.3 | ||||||||||
| Long-term debt (a) (iii) (b) (i) | 1,731.9 | 1,722.1 | 1,825.8 | 1,874.4 | ||||||||||
| Other liabilities (a) (iii) (iv) (b) (i) (ii) | 259.3 | 467.9 | 248.1 | 481.6 | ||||||||||
| Long-term future income taxes (a) (i) (iii) (v) (b) (i) (ii) | 372.5 | 309.2 | 402.6 | 322.3 | ||||||||||
| Convertible notes (a) (ii) | 115.5 | 120.6 | 112.6 | 121.1 | ||||||||||
| Capital stock (b) (iii) | 1,688.6 | 1,658.3 | 1,705.3 | 1,674.3 | ||||||||||
| Additional paid-in capital (a) (i) (ii) | 110.6 | 94.6 | 109.7 | 93.7 | ||||||||||
| Retained earnings (a) (i) (ii) (iii) (iv) (v) (b) (i) (iii) | 475.6 | 515.2 | 761.0 | 808.2 | ||||||||||
| Translation adjustment (c) | (24.2 | ) | — | 36.6 | — | |||||||||
| Accumulated other comprehensive income (loss) (a) (iii) (iv) (b) (i) (ii) (c) | — | (200.3 | ) | — | (95.4 | ) | ||||||||
(i) Accounting for derivative instruments and hedging activities
Effective January 1, 2001, the Company adopted Statement of Financial Accounting Standards No. 133, "Accounting for Derivative Instruments and Hedging Activities", as amended (SFAS 133). The Company recorded the cumulative effect of change in other comprehensive income (loss) upon the adoption of SFAS 133 in 2001.
The Company utilizes interest rate and commodity SWAPS to enhance its ability to manage risk relating to cash flow exposure. On the earlier of the date at which the derivative contract is entered into or the date of transaction, the Company designates the derivative as a hedge. Changes in the derivative fair values of contracts that are designated effective and qualify as cash flow hedges are deferred and recorded as a component of accumulated other comprehensive income (loss) until the underlying transaction is recorded in earnings. When the hedged item affects earnings, gains or losses are reclassified from accumulated other comprehensive income (loss) to the consolidated statement of income on the same line as the underlying transaction. The ineffective portion of a hedging derivative's change in fair value is recognized immediately in earnings.
Under GAAP in Canada, these derivative financial instruments are accounted for on an accrual basis. Realized and unrealized gains and losses are deferred and recognized in income in the same period and in the same financial statement category as the income or expense arising from the corresponding hedged positions.
68
23. SIGNIFICANT DIFFERENCES BETWEEN GENERALLY ACCEPTED ACCOUNTING PRINCIPLES IN CANADA AND THE UNITED STATES (CONT'D)
(b) Effect on consolidated balance sheets (cont'd)
(ii) Pension and postretirement plans
GAAP in the United States requires recognition of an additional minimum liability that is at least equal to the unfunded accumulated benefit obligation, when the accumulated benefit obligation exceeds the fair value of plan assets. If an additional minimum liability is recognized, a portion is recognized as an intangible asset up to the amount of unrecognized prior service cost and net transition obligations, and the excess is recognized in a separate component in the other comprehensive income, net of tax benefits. Under GAAP in Canada, such adjustment is not required.
(iii) Share issue costs
Under GAAP in the United States, share issue costs are deducted from the value proceeds of the capital stock issued. Under GAAP in Canada, share issue costs are included in the Retained Earnings in the year when incurred.
(c) Comprehensive income
The application of GAAP in the United States requires the disclosure of comprehensive income (loss) in a separate financial statement, which includes net income as well as revenues, charges, gains and losses recorded directly to equity.
| | 2005 | 2004 | 2003 | |||||||
|---|---|---|---|---|---|---|---|---|---|---|
| Net income (loss), as adjusted per GAAP in the United States | $ | (169.5 | ) | $ | 141.5 | $ | (16.4 | ) | ||
Gain (loss) on hedging activities, net of income taxes of $7.8 ($(10.8) in 2004 and $(5.5) in 2003) (b) (i) | (16.5 | ) | 22.0 | 39.2 | ||||||
| Additional minimum liability, net of income taxes of $(3.8) ($(27.4) in 2004 and $37.3 in 2003) (b) (ii) | (27.6 | ) | 31.8 | (32.1 | ) | |||||
| Currency translation adjustment (a) (iv) | (60.8 | ) | 56.8 | 96.4 | ||||||
| Other comprehensive income (loss) | (104.9 | ) | 110.6 | 103.5 | ||||||
| Comprehensive income (loss) as per GAAP in the United States | $ | (274.4 | ) | $ | 252.1 | $ | 87.1 | |||
(d) Statements of cash flows
The adjustments to comply with GAAP in the United States, with respect to the consolidated statements of cash flows for the years ended December 31, 2005, 2004 and 2003 would have no effect on net cash used in operating activities, cash used in financing activities and cash used in investing activities.
24. SEGMENT DISCLOSURES
The Company operates in the printing industry. Its business groups are located in three main segments: North America, Europe and Latin America. These segments are managed separately, since they all require specific market strategies. The Company assesses the performance of each segment based on operating income before impairment of assets, restructuring and other charges.
69
24. SEGMENT DISCLOSURES (CONT'D)
Accounting policies relating to each segment are identical to those used for the purposes of the consolidated financial statements. Intersegment sales are made at fair market values, which approximate those prevailing on the markets serviced. Management of financial expenses and income tax expense is centralized and, consequently, these expenses are not allocated among these segments.
The following is a summary of the segmented information for the Company's Continuing Operations:
| | North America(1) | Europe | Latin America | Other | Inter- segment | Total | |||||||||||||
|---|---|---|---|---|---|---|---|---|---|---|---|---|---|---|---|---|---|---|---|
| Revenues | |||||||||||||||||||
| 2005 | $ | 4,881.1 | $ | 1,162.9 | $ | 241.7 | $ | 0.5 | $ | (2.9 | ) | $ | 6,283.3 | ||||||
| 2004 | 4,850.3 | 1,297.4 | 192.4 | 0.5 | (1.1 | ) | 6,339.5 | ||||||||||||
| 2003 | 4,721.8 | 1,151.4 | 177.3 | 0.3 | (2.7 | ) | 6,048.1 | ||||||||||||
Depreciation and amortization | |||||||||||||||||||
| 2005 | 235.8 | 56.9 | 10.5 | 1.0 | — | 304.2 | |||||||||||||
| 2004 | 243.1 | 69.9 | 10.7 | 1.2 | — | 324.9 | |||||||||||||
| 2003 | 250.4 | 62.7 | 10.2 | 1.6 | — | 324.9 | |||||||||||||
Impairment of assets, restructuring and other charges | |||||||||||||||||||
| 2005 | 22.6 | 70.9 | 0.7 | — | — | 94.2 | |||||||||||||
| 2004 | 68.3 | 40.6 | 5.7 | 1.0 | — | 115.6 | |||||||||||||
| 2003 | 74.7 | 6.8 | 11.8 | 1.2 | — | 94.5 | |||||||||||||
Goodwill impairment charge | |||||||||||||||||||
| 2005 | — | 243.0 | — | — | — | 243.0 | |||||||||||||
| 2004 | — | — | — | — | — | — | |||||||||||||
| 2003 | — | — | — | — | — | — | |||||||||||||
Operating income (loss) | |||||||||||||||||||
| 2005 | 330.9 | (317.5 | ) | 12.3 | (5.4 | ) | — | 20.3 | |||||||||||
| 2004 | 353.1 | 9.5 | (4.4 | ) | (2.7 | ) | — | 355.5 | |||||||||||
| 2003 | 219.9 | 17.5 | (15.5 | ) | (10.0 | ) | — | 211.9 | |||||||||||
Additions to property, plant and equipment(2) | |||||||||||||||||||
| 2005 | 286.4 | 103.3 | 4.1 | 0.2 | — | 394.0 | |||||||||||||
| 2004 | 106.5 | 22.2 | 3.8 | 0.1 | — | 132.6 | |||||||||||||
| 2003 | 187.9 | 45.6 | 8.9 | 0.7 | — | 243.1 | |||||||||||||
Property, plant and equipment(2) | |||||||||||||||||||
| 2005 | 1,758.6 | 451.5 | 83.5 | 2.3 | — | 2,295.9 | |||||||||||||
| 2004 | 1,778.3 | 509.2 | 83.0 | 3.1 | — | 2,373.6 | |||||||||||||
Goodwill(2) | |||||||||||||||||||
| 2005 | 2,156.7 | 140.9 | 8.1 | — | — | 2,305.7 | |||||||||||||
| 2004 | 2,198.3 | 445.4 | 8.2 | — | — | 2,651.9 | |||||||||||||
Total assets(2) | |||||||||||||||||||
| 2005 | 4,605.5 | 790.6 | 231.3 | 78.2 | — | 5,705.6 | |||||||||||||
| 2004 | 4,703.3 | 1,226.5 | 221.2 | 122.8 | — | 6,273.8 | |||||||||||||
- (1)
- Includes Revenues amounting to $912.2 million ($851.5 million in 2004 and $818.4 million in 2003) and, property, plant and equipment amounting to $238.0 million ($284.8 million in 2004) for Canada.
- (2)
- Including both continued and discontinued operations.
The Company carries out international commercial printing operations, and offers to its customers a broad range of print and related communication services, such as magazines, retail inserts, catalogs, direct mail, books, directories, logistics, pre-media, and other value-added services.
Revenues by print service are as follows:
| | 2005 | 2004 | 2003 | |||||||||||||
|---|---|---|---|---|---|---|---|---|---|---|---|---|---|---|---|---|
| Magazine | $ | 1,671.2 | 26.6 | % | $ | 1,776.6 | 28.0 | % | $ | 1,691.8 | 28.0 | % | ||||
| Retail inserts | 1,684.3 | 26.8 | 1,653.1 | 26.1 | 1,496.7 | 24.8 | ||||||||||
| Catalogs | 1,027.6 | 16.4 | 1,026.1 | 16.2 | 1,010.7 | 16.7 | ||||||||||
| Books | 691.4 | 11.0 | 697.3 | 11.0 | 696.0 | 11.5 | ||||||||||
| Directories | 390.6 | 6.2 | 384.4 | 6.1 | 354.4 | 5.9 | ||||||||||
| Direct mail | 240.0 | 3.8 | 246.3 | 3.9 | 244.6 | 4.0 | ||||||||||
| Logistics | 248.5 | 4.0 | 230.2 | 3.6 | 218.9 | 3.6 | ||||||||||
| Pre-media, and other value-added services | 329.7 | 5.2 | 325.5 | 5.1 | 335.0 | 5.5 | ||||||||||
| $ | 6,283.3 | 100.0 | % | $ | 6,339.5 | 100.0 | % | $ | 6,048.1 | 100.0 | % | |||||
70
25. SUBSEQUENT EVENTS
On January 16, 2006, the Company announced it had concluded an agreement with Société Générale Corporate and Investment Banking for a Canadian dollar equivalent of 136 million Euros ($160 million) long term committed credit facility relating to purchases of MAN Roland presses as part of the North American retooling program. The unsecured facility will be drawn over the course of the next 25 months and will be repaid over the next 10 years at lower costs than alternate financing.
71
SIGNATURES
Pursuant to the requirements of the Securities Exchange Act of 1934, the registrant has duly caused this report to be signed on its behalf by the undersigned, thereunto duly authorized.
QUEBECOR WORLD INC.
By:/s/ Marie Chlumecky
Name: Marie Chlumecky
Title: Assistant Secretary
Date: February 17, 2006
72
MANAGEMENT'S DISCUSSION AND ANALYSIS
MANAGEMENT'S RESPONSIBILITY FOR FINANCIAL STATEMENTS
AUDITORS' REPORT TO THE SHAREHOLDERS
CONSOLIDATED STATEMENTS OF INCOME
CONSOLIDATED STATEMENTS OF SHAREHOLDERS' EQUITY
CONSOLIDATED STATEMENTS OF CASH FLOWS
CONSOLIDATED BALANCE SHEETS
NOTES TO CONSOLIDATED FINANCIAL STATEMENTS