QuickLinks -- Click here to rapidly navigate through this document
SECURITIES AND EXCHANGE COMMISSION
Washington, DC 20549
FORM 6-K
REPORT OF FOREIGN ISSUER PURSUANT TO RULE 13a-16 or 15d-16 OF
THE SECURITIES EXCHANGE ACT OF 1934
For the month of November 2006
Commission File Number :1-14118
2006 THIRD QUARTER RESULTS
QUEBECOR WORLD INC.
(Translation of Registrant's Name into English)
612 Saint-Jacques Street, Montreal, Quebec H3C 4M8
(Address of Principal Executive Office)
Indicate by check mark whether the registrant files or will file annual reports under cover of Form 20-F or Form 40-F
Form 20-F Form 40-F X
Indicate by check mark if the registrant is submitting the Form 6-K in paper as permitted by Regulation S-T Rule 101 (b)(1): _____
Note:Regulation S-T Rule 101(b)(1) only permits the submission in paper of a Form 6-K if submitted solely to provide an attached annual report to security holders.
Indicate by check mark if the registrant is submitting the Fork 6-K in paper as permitted by Regulation S-T Rule 101 (b) (7): _____
Note: Regulation S-T Rule 101(b)(7) only permits the submission in paper of a Form 6-K if submitted to furnish a report or other document that the registrant foreign private issuer must furnish and make public under the laws of the jurisdiction in which the registrant is incorporated, domiciled or legally organized (the registrant's "home country"), or under the rules of the home country exchange on which the registrant's securities are traded, as long as the report or other document is not a press release, is not required to be and has not been distributed to the registrant's security holders, and, if discussing a material event, has already been the subject of a Form 6-K submission or other filing on EDGAR.
Indicate by check mark whether the registrant by furnishing the information contained in this form is also thereby furnishing the information to the Commission pursuant to Rule 12g3-2(b) under the Securities Exchange Act of 1934.
Yes No X
If "Yes" is marked, indicate below the file number assigned to the registrant in connection with Rule 12g3-2(b): 82-___________________.
QUEBECOR WORLD INC.
Filed in this Form 6-K
Documents index
- Press Release dated November 7, 2006; Financial Highlights
- Management's Discussion and Analysis of Financial Condition and Results of Operations
- Consolidated Financial Statements
- Certifications of Interim Filings
![]()
November 7, 2006 25/06
For immediate release Page 1 of 9
QUEBECOR WORLD ANNOUNCES
THIRD QUARTER 2006 RESULTS
HIGHLIGHTS
- CEO sets targets and makes progress on the 5 Point Transformation Plan to improve business in short-term and position Company for long-term shareholder value.
- Restructuring effort continues to be successful, broader and faster actions being taken to reduce costs in Europe and North America.
- Taking responsible actions to improve the balance sheet. Dividend on subordinate and multiple voting shares suspended.
- Revenue of $1.55 billion in third quarter.
- Diluted earnings per share before IAROC of $0.17 in third quarter.
Montréal, Canada - Quebecor World Inc. (NYSE:IQW, TSX:IQW) announces for the third quarter 2006 net income from continuing operations of $19.2 million or $0.09 diluted earnings per share compared to net income of $30.9 million or $0.16 diluted earnings per share in the third quarter of last year. These results incorporate impairment of assets, restructuring and other charges of $11.6 million or $0.08 diluted earnings per share compared with $17.2 million or $0.12 diluted earnings per share in 2005. Excluding impairment of assets, restructuring and other charges, diluted earnings per share were $0.17 compared to $0.28 in the third quarter of 2005. On the same basis, operating income in the third quarter was $55.7 million compared to $80 million during the third quarter last year. Consolidated revenues for the quarter were $1.55 billion compared to $1.58 billion in the third quarter of 2005.
"Our financial performance in the third quarter and year-to-date is not acceptable and does not meet the high expectations for our shareholders' investment," said Wes Lucas, President and CEO, Quebecor World Inc. "In the third quarter, we started a comprehensive and integrated 5 Point Transformation Plan, which should deliver short term benefits in 2007 and 2008, and create long-term earnings and free cash flow growth. All five of these initiatives are now underway, and are focused on achieving concrete financial and qualitative targets to deliver increased shareholder value."
1
For immediate release Page 2 of 9
Third quarter actions on 5 Point Transformation Plan
Customer value: Set initial target of at least a $300 million annualized revenue benefits based on the Customer Value Initiative, run rate by the end of 2008."The initial focus is on creating more value for our customers then just the printed product, by creating and providing complete, integrated, high-value solutions for our customers, " stated Mr. Lucas. The Company is driving more solutions and value before the printing process in terms of providing marketing campaign services, creative for ads, data optimization, content management, and complete solutions in premedia. The Company is also driving more solutions and value after the printing process in terms of providing comprehensive mail list optimization, co-mailing and complete logistics services. As an example, the recently announced long-term $1 billion CDN agreement with a major directory customer that contains new high value services before and after the printing processes including ad page makeup and logistics solutions.
Best People: During the third quarter, the Company started a process to build its organizational capabilities and to ensure the right people with the right skills are in the right positions. A key deliverable is that all teams and leaders have development plans and training programs. "The objective of our People Initiative is an increased execution capability and more value for our customers and shareholders, as our people are by far the most valuable part of our Company," stated Mr. Lucas.
Great Execution: Set initial target of at least $100 million annualized cost savings and productivity improvements, run rate by the end of 2008. In the Third Quarter, the Company kicked off a productivity and continuous improvement program based on Six Sigma and other proven approaches. This program will focus on high impact improvement areas with low capital requirements and high returns. Even though the Company is only at the beginning of the process, it is already working on high-return improvement projects in such areas as reducing paper waste, improving quality, increasing press speeds, and driving working capital improvements by eliminating inventory. The program will build a continuous improvement culture throughout the organization that is fact-based, and focuses on low-capital projects to maximize cash flow and shareholder value.
2
For immediate release Page 3 of 9
Retooling program: The Company's three-year retooling program is on schedule and is being optimized to be completed by the end of 2007. In the third quarter, Quebecor World initiated start-ups on five new wide-web offset presses, three in its U.S. magazine platform, one in its U.S. book platform and one in Europe. Two additional presses were started in the fourth quarter, one in the magazine platform and one in Europe. To date in 2006, nine new presses have been installed in the U.S. platform and two presses in Europe. The startup of this new equipment, the closing of old presses and the transfer of volume to other facilities, is creating some temporary inefficiencies that have negatively impacted third quarter and year-to-date results.
Balance sheet: The Company is committed to strengthening its balance sheet in a responsible manner, and is taking serious actions to increase shareholder value. The dividend is suspended on subordinate and multiple voting shares. The Company is also evaluating strategic and tactical actions to further strengthen the balance sheet, to return to a strong free cash flow position and to provide additional financial flexibility.
"We are setting goals and objectives, both financial and qualitative, that must be met as we move forward to demonstrate to all our stakeholders that we are 'making our numbers' and delivering measurable results to improving our performance," said Mr. Lucas. "We are extensively communicating these objectives both internally and externally so that our people know what is expected of them, and our shareholders know how we are progressing. We will be making regular reports and updates on the progress of our transformation plan and setting additional targets as we move forward."
Third Quarter Restructuring Initiatives
In the third quarter, the Company recorded restructuring charges of $11.6 million, which are composed of cash items related to workforce reductions at facilities in Europe and North America. The 2006 restructuring initiatives affected 1,948 staff positions in total, of which 1,247 positions were eliminated as of September 30, 2006 and 701 are still to come. The resulting productivity improvements can be concretely seen in that fact that out of the 1,948 positions to be eliminated, only 292 new positions will be created in other facilities.
North America
In North America, revenues for the third quarter were $1.24 billion, slightly down from $1.25 billion in 2005. On a year-to-date basis, revenues were $3.54 billion in 2006 compared to $3.56 billion in 2005 mainly due to lower prices and unfavorable product mix compared to last year.
Retail revenues for the third quarter of 2006 were up 5.9% from the same period in 2005. For the quarter, the increase in revenues is attributable to volume from new sales of offset retail inserts and to component price increases that helped mitigate increased costs.
3
For immediate release Page 4 of 9
Catalog revenues for the third quarter of 2006 decreased by 1.8%. Volume increased slightly but not enough to offset lower prices in this segment. Year-to-date revenues and volume increased in the catalog segment due to new customers and increased sales with existing ones, reflecting the development of the Company's offering of a complete marketing solution to enhance the marketing of branded goods companies' products and to increase in-store traffic for retail customers.
Combined Magazine & Direct revenues for the third quarter of 2006 were down 4.8% compared to the same period in 2005. Revenue decreased in the third quarter mainly due to lower volumes in both groups. The decrease in the Magazine Group is due in part to the closure of the Brookfield facility announced earlier in the year and lower page counts from major publishers. Direct mail revenues were up 4.9% year-to-date overall, but down slightly in the quarter due to the timing of volumes from key customers.
Book and Directory revenues for the third quarter of 2006 were down 2.4% primarily related to reduced capacity as a direct result of retooling activities by removing older presses and installing new presses in the book platform. Volume increased in the Directory group as the Company started to realize new volume from important contracts signed in 2005. These contracts will represent an additional 160 billion printed directory pages per year starting in the second quarter of 2007.
In Canada, revenues were lower in the quarter primarily attributable to the strong Canadian dollar negatively affecting Canada's print volumes and the sale of one of the Company's facilities earlier this year.
Logistics' revenues increased 4.4% in the third quarter of 2006. The revenue increase for the quarter is due to the success of the Company's integrated end-to-end solution in providing value-added services. One of those services is the Company's industry-leading co-mail services to magazine and catalog customers. The Company is increasing those services by adding a third co-mail machine at its Bolingbrook, Illinois facility. The new machine will be installed in the first quarter of 2007.
Premedia revenues for the third quarter of 2006 were down 2.4% from the same period in 2005. The decrease in revenues for the third quarter was attributable to a lower page count that was partly offset by a positive change in a higher value work mix.
4
For immediate release Page 5 of 9
Europe
European revenues for the third quarter of 2006 were $244.1 million, down 9.8% from $270.7 million in 2005, largely driven by poor market conditions in the United Kingdom and the restructuring of the Company's operations in France. On a year-to-date basis, revenues were $758.1 million in 2006, down 14.5% from $886.2 million in 2005. The implementation of the European retooling plan that began early in 2006 has impacted volume in certain countries for the third quarter of 2006, especially in France, as a result of plant closures and temporary press start-up inefficiencies. In France the Company is in the middle of a complete restructuring of its operations with the disposal of certain facilities in 2005, the downsizing of the Corbeil facility in the first quarter of 2006, the shutdown of the Strasbourg plant in the second quarter of 2006, and the recently announced closure of the Lille facility in the second quarter of 2007.
Latin America
Latin America's revenues increased 12.6% during the third quarter of 2006 to $61.2 million from $54.4 million in 2005. On a year-to-date basis, revenues were $170.5 million in 2006, down from $177.2 million in 2005. Overall volume increased for the quarter, positively impacting operating income.
Free cash flow
Free cash flow year to-date amounted to an outflow of $9.2 million compared to an outflow of $39 million during the same period in 2005.
Year-to-Date 2006
For the first nine months of 2006, revenues were $4.47 billion, down 3.3% from $4.62 billion in 2005. Operating income before impairment of assets, restructuring and other charges for the first nine months of 2006 was $167.3 million compared to $270.2 million in 2005. Impairment of assets restructuring and other charges for the first nine months of 2006 were $65.1 million compared to $82.3 million last year. Loss per share from continuing operations was $0.06 compared to diluted earnings per share of $0.20 in the first nine months of 2005. Excluding impairment of assets, restructuring and other charges, diluted earnings per share from continuing operations were $0.36 compared to $0.77 for the same period last year.
Dividend
To maximize shareholder value in the near and long-term the Company believes it is prudent to strengthen the balance sheet. Therefore the Board of Directors suspended the dividend on Multiple Voting Shares and Subordinate Voting Shares. This action was taken in light of the Company's current investment program in North America and Europe. The Board declared a dividend of CDN$0.3845 per share on Series 3 Preferred Shares and CDN$0.43125 on Series 5 Preferred Shares. The dividends are payable on December 1, 2006 to shareholders of record at the close of business November 20, 2006.
5
For immediate release Page 6 of 9
Fourth Quarter and Full-year 2006 Audited Financial Statements
The Company announced that it expects to release its annual audited consolidated financial statements, press release and management's Discussion and Analysis (MD&A) for the 2006 financial year in late March 2007. Exceptionally for the 2006 financial year, these documents will be released later than usual to afford additional time to complete, for the first time, the assessment of internal control over financial reporting as required under section 404 of the U.S. Sarbanes-Oxley Act of 2002, and thereafter the required reports of the Company's auditors on such assessment and the annual financial statements.
Full Financial Information
Management Discussion and Analysis ("MD&A")
Please refer to the MD&A for the reconciliation to Canadian generally accepted accounting principles of certain figures used to explain these results. The MD&A can be found on the Company's website atwww.quebecorworld.com and through the SEDAR and SEC filings.
Financial statements are available on the Company's website and through the SEDAR and SEC filings.
Sedar web address:www.sedar.com
SEC web address:www.sec.gov
Conference Call
Quebecor World To Webcast Investor Conference Call on November 7, 2006
Quebecor World Inc. will broadcast its third quarter 2006 conference call live over the Internet on November 7, 2006 at 4:00 PM (Eastern Time).
The conference call will be webcast live and can be accessed on the Quebecor World web site:
http://www.quebecorworldinc.com/main.aspx?id=209
Prior to the call please ensure that you have the appropriate software. The Quebecor World web address listed above has instructions and a direct link to download the necessary software, free of charge.
6
For immediate release Page 7 of 9
Anyone unable to attend this conference call may listen to the replay tape by phoning (877) 293-8133 or (403) 266-2079 - passcode 339945#, available from November 7, 2006 to December 11, 2006.
Forward looking statements
This press release includes "forward-looking statements" that involve risks and uncertainties. All statements other than statements of historical facts included in this press release, including statements regarding the prospects of the industry and prospects, plans, financial position and business strategy of the Company, may constitute forward-looking statements within the meaning of the U.S. Private Securities Litigation Reform Act of 1995 and Canadian securities legislation and regulations. Forward-looking statements generally can be identified by the use of forward-looking terminology such as "may," "will," "expect," "intend," "estimate," "anticipate," "plan," "foresee," "believe" or "continue" or the negatives of these terms or variations of them or similar terminology. Although the Company believes that the expectations reflected in these forward-looking statements are reasonable, it can give no assurance that these expectations will prove to have been correct. Forward-looking st atements do not take into account the effect that transactions or non-recurring or other special items announced or occurring after the statements are made have on the Company's business. For example, they do not include the effect of dispositions, acquisitions, other business transactions, asset writedowns or other charges announced or occurring after forward-looking statements are made.
Investors and others are cautioned that undue reliance should not be placed on any forward-looking statements. For more information on the risks, uncertainties and assumptions that could cause the Company's actual results to differ from current expectations, please refer to the Company's public filings available at www.sedar.com, www.sec.gov and www.quebecorworld.com. In particular, further details and descriptions of these and other factors are disclosed in the "Risks and Uncertainties" section of the Company's Management's Discussion and Analysis for the year ended December 31, 2005, and the "Risk Factors" section of the Company's Annual Information Form for the year ended December 31, 2005.
The forward-looking statements in this press release reflect the Company's expectations as of November 7, 2006 and are subject to change after this date. The Company expressly disclaims any obligation or intention to update or revise any forward-looking statements, whether as a result of new information, future events or otherwise, unless required by the applicable securities laws.
7
For immediate release Page 8 of 9
The Company
Quebecor World Inc. (NYSE:IQW, TSX:IQW) is a world leader in providing high-value, complete print solutions to leading publishers, retailers, catalogers and other businesses with marketing and advertising activities. It is a market leader in most of its major product categories which include magazines, inserts and circulars, books, catalogs, direct mail, directories, digital pre-media, logistics, mail list technologies and other value added services. Quebecor World has approximately 29,000 employees working in more than 120 printing and related facilities in the United States, Canada, Argentina, Austria, Belgium, Brazil, Chile, Colombia, Finland, France, India, Mexico, Peru, Spain, Sweden, Switzerland and the United Kingdom.
Web address:www.quebecorworld.com
- 30 -
For further Information contact:
Tony Ross | Roland Ribotti |
|
8
For immediate release Page 9 of 9
Quebecor World Inc.
FINANCIAL HIGHLIGHTS
(In millions of US dollars, except per share data)
(Unaudited)
| | Three-month periods ended September 30 | Nine-month periods ended September 30 | |||||||||||||
|---|---|---|---|---|---|---|---|---|---|---|---|---|---|---|---|
| | 2006 | 2005 | 2006 | 2005 | |||||||||||
| Consolidated Results from Continuing Operations | |||||||||||||||
| Revenues | $ | 1,546.2 | $ | 1,577.2 | $ | 4,465.9 | $ | 4,619.3 | |||||||
| Adjusted EBITDA | 150.6 | 178.7 | 409.7 | 520.8 | |||||||||||
| Adjusted EBIT | 67.3 | 97.2 | 167.3 | 270.2 | |||||||||||
| IAROC | 11.6 | 17.2 | 65.1 | 82.3 | |||||||||||
| Operating income | 55.7 | 80.0 | 102.2 | 187.9 | |||||||||||
| Net income | 19.2 | 30.9 | 19.0 | 56.2 | |||||||||||
| Adjusted EBITDA margin * | 9.7 | % | 11.3 | % | 9.2 | % | 11.3 | % | |||||||
| Adjusted EBIT margin * | 4.3 | % | 6.2 | % | 3.7 | % | 5.8 | % | |||||||
| Operating margin * | 3.6 | % | 5.1 | % | 2.3 | % | 4.1 | % | |||||||
Segmented Information from Continuing Operations | |||||||||||||||
Revenues | |||||||||||||||
| North America | $ | 1,241.1 | $ | 1,253.6 | $ | 3,537.6 | $ | 3,559.4 | |||||||
| Europe | 244.1 | 270.7 | 758.1 | 886.2 | |||||||||||
| Latin America | 61.2 | 54.4 | 170.5 | 177.2 | |||||||||||
Adjusted EBIT | |||||||||||||||
| North America | $ | 75.7 | $ | 100.0 | $ | 177.8 | $ | 264.3 | |||||||
| Europe | (6.0 | ) | (4.8 | ) | (8.6 | ) | (0.8 | ) | |||||||
| Latin America | 3.4 | 2.8 | 6.8 | 9.3 | |||||||||||
Adjusted EBIT margin * | |||||||||||||||
| North America | 6.1 | % | 8.0 | % | 5.0 | % | 7.4 | % | |||||||
| Europe | (2.5 | ) % | (1.8 | ) % | (1.1 | ) % | 0.1 | % | |||||||
| Latin America | 5.4 | % | 5.1 | % | 4.0 | % | 5.2 | % | |||||||
Selected Cash Flow information | |||||||||||||||
| Cash provided by operating activities | $ | 51.2 | $ | 6.3 | $ | 205.8 | $ | 191.2 | |||||||
| Free cash flow (outflow) ** | (40.5 | ) | (76.9 | ) | (9.2 | ) | (39.0 | ) | |||||||
Per Share Data | |||||||||||||||
| Earnings (loss) from continuing operations | |||||||||||||||
| Diluted | $ | 0.09 | $ | 0.16 | $ | (0.06 | ) | $ | 0.20 | ||||||
| Adjusted diluted | $ | 0.17 | $ | 0.28 | $ | 0.36 | $ | 0.77 | |||||||
| | Nine-month period ended September 30 2006 | Twelve-month period ended December 31 2005 | |||||||||||||||
|---|---|---|---|---|---|---|---|---|---|---|---|---|---|---|---|---|---|
| Financial Position | |||||||||||||||||
| Working capital | $ | (132.0 | ) | $ | (92.0 | ) | |||||||||||
| Total assets | 5,924.6 | 5,708.8 | |||||||||||||||
| Long-term debt | 2,138.7 | 1,855.1 | |||||||||||||||
| Shareholders' equity | 2,034.8 | 2,250.6 | |||||||||||||||
| Debt-to-capitalization | 51:49 | 45:55 | |||||||||||||||
| Debt-to-Adjusted-EBITDA ratio (times) *** | 3.7 | 2.7 | |||||||||||||||
| Interest coverage ratio (times) *** | 4.7 | 5.8 | |||||||||||||||
EBITDA: Operating income before depreciation and amortization.
IAROC: Impairment of assets, restructuring and other charges.
Adjusted: Defined as before IAROC and before goodwill impairment charge.
Debt-to-Ajusted-EBITDA ratio: Total debt divided by Adjusted EBITDA.
Interest coverage ratio: Adjusted EBITDA divided by financial expenses.
- *
- Margins calculated on revenues.
- **
- Cash provided by operating activities, less capital expenditures and preferred share dividends, net of proceeds from disposals of assets and proceeds from business disposals.
- ***
- For continuing operations.
9

MANAGEMENT'S DISCUSSION AND ANALYSIS
THIRD QUARTER ENDED SEPTEMBER 30, 2006
The following is a discussion of the consolidated financial condition and results of operations of Quebecor World Inc. (the "Company" or "Quebecor World") for the three-month and nine-month periods ended September 30, 2006 and 2005, and should be read together with the Company's corresponding interim consolidated financial statements and the annual Management's Discussion and Analysis ("MD&A") included in the 2005 Annual Report. The interim consolidated financial statements and MD&A have been reviewed by the Company's Audit Committee and approved by its Board of Directors. This discussion contains forward-looking information that is qualified by reference to, and should be read together with, the discussion regarding forward-looking statements that is part of this document. Management determines whether or not information is "material" based on whether it believes a reasonable investor's decision to buy, sell or hold securities in the Company would likely be influenced or changed if the information were omitted or misstated.
FORWARD-LOOKING STATEMENTS
This MD&A includes "forward-looking statements" that involve risks and uncertainties. All statements other than statements of historical facts included in this MD&A, including statements regarding the prospects of the industry and prospects, plans, financial position and business strategy of the Company, may constitute forward-looking statements within the meaning of the U.S. Private Securities Litigation Reform Act of 1995 and Canadian securities legislation and regulations. Forward-looking statements generally can be identified by the use of forward-looking terminology such as "may," "will," "expect," "intend," "estimate," "anticipate," "plan," "foresee," "believe" or "continue" or the negatives of these terms or variations of them or similar terminology. Although the Company believes that the expectations reflected in these forward-looking statements are reasonable, it can give no assurance that these expectations will prove to have been correct. Forward-looking statements do not take into account the effect that transactions or non-recurring or other special items announced or occurring after the statements are made have on the Company's business. For example, they do not include the effect of dispositions, acquisitions, other business transactions, asset write-downs or other charges announced or occurring after forward-looking statements are made.
Investors and others are cautioned that undue reliance should not be placed on any forward-looking statements. For more information on the risks, uncertainties and assumptions that could cause the Company's actual results to differ from current expectations, please refer to the Company's public filings available atwww.sedar.com,www.sec.gov andwww.quebecorworld.com. In particular, further details and descriptions of these and other factors are disclosed in the "Risks and Uncertainties" section of the Company's Management's Discussion and Analysis for the year ended December 31, 2005, and the "Risk Factors" section of the Company's Annual Information Form for the year ended December 31, 2005.
The forward-looking statements in this MD&A reflect the Company's expectations as of November 7, 2006 and are subject to change after this date. The Company expressly disclaims any obligation or intention to update or revise any forward-looking statements, whether as a result of new information, future events or otherwise, unless required by the applicable securities laws.
OVERVIEW
BUSINESS PROFILE
Quebecor World is a leading provider of high-value, complete print solutions to leading publishers, retailers, branded goods companies, catalogers and other businesses with marketing and advertising activities. The Company is a market leader in almost all of the product categories and geographies it serves. This market-leading position has been built through a combination of integrating acquisitions, investing in key strategic technologies, and through a commitment to building long-term partnerships with the world's leading print media customers.
Quebecor World has operations in the United States, Canada, Argentina, Austria, Belgium, Brazil, Chile, Colombia, Finland, France, India, Mexico, Peru, Spain, Sweden, Switzerland and the United Kingdom.
The Company offers its customers a complete and integrated, high value-added solution of a broad range of print and print related services. The primary focus of the Company is solutions consisting of magazines, retail inserts, catalogs, books, directories, direct mail, logistics, premedia, content and data management, business outsourcing, print marketing optimization, and other value-added services.
The Company operates in the commercial printing industry and its business groups are located in three geographical regions: North America, which has historically represented approximately 80% of the Company's revenues, Europe and Latin America.
INDUSTRY PROFILE
Quebecor World's customers are largely retailers, branded goods companies, publishers, ad agencies, and companies implementing significant marketing and advertising campaigns. The activity of the Company's customers is largely seasonal with a greater part of volume being realized in the second half of the year, primarily due to the higher number of magazine pages, new product launches, back-to-school ads, marketing by retailers, increased catalog activity, and holiday purchases and promotions.
| Management's Discussion and Analysis |
11
Consolidation of the printing industry is ongoing because of global overcapacity, which has led to negative price pressures. The overall decrease in number of smaller companies and plants creates the opportunity for larger companies and plants to continue to grow and deploy more efficient equipment. Global capacity is also affected by the emergence of Asian competitors, particularly in the Book segment where lead-times are longer for certain types of books. In response to this competition, the Company offers its customers a Latin American manufacturing platform as a competitive alternative to Asia. Overall, the Company believes that global overcapacity will remain an issue and will likely continue to impact prices in most print segments.
The primary drivers affecting the demand for the Company's services and solutions are consumer trends and purchasing activity, marketing and advertising dynamics, and general economic growth rates. These are the key drivers of the demand for integrated print solutions because they affect the level and type of advertising and merchandising activity. The Company uses magazine advertising pages as an indicator of the demand for printing products and services in North America. This indicator, as measured in the United States by the Publishers Information Bureau, was uneven through most of 2005 and 2006 (Figure 1).
U.S. Magazine Advertising Pages 2002-2006 (Monthly)
% Change Year-over-Year
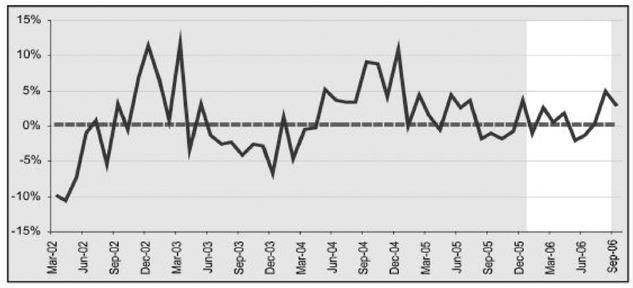
| Source: Publishers Information Bureau | FIGURE 1 |
STRATEGY
Quebecor World's commitment is to create the highest value for its customers, people and shareholders, a higher value than any other alternative. To achieve this objective, Quebecor World is focusing on being its customers' complete print solution partner, by providing sophisticated, turn-key solutions fully integrated with its customers' operations, marketing and advertising campaigns.
Quebecor World initiated a five-point transformation plan to improve its performance. This five-point plan was first introduced at the end of the second quarter of 2006. The Company's transformation plan focuses on five key areas. (1) Customer Value: Build the capability to create the highest value for Quebecor World's customers by providing differentiated, superior-value products and services to be the customers' complete print solution partner; (2) Best People: Develop the Company's people to be the best that they can be, through a comprehensive people development program consisting of training, new processes, and tools to build high-performance teams; (3) Great Execution: Implement a continuous improvement program to build superior execution capabilities producing the most efficient, most dependable, and highest quality results. Institute low-capital, high-return projects to begin a new cycle of high cash flow generation; (4) Retooling Program: Complete the Company's retooling program, which involves deploying state-of-the-art technology in fewer but larger facilities by running wider, faster, more energy-efficient next-generation technology, with a focus on maximizing return on capital; (5) Strengthen the Balance Sheet: Take the appropriate financing actions to improve Quebecor World's financial flexibility and reduce interest costs by strengthening the balance sheet.
This strategy focuses on positioning Quebecor World to provide best-in-class integrated print solutions that should create the highest value for customers, people and shareholders, an objective that is integral to the future success of the Company.
2006 AT A GLANCE
2006 has been a year during which the Company has continued through a transitional period that is related to its major retooling plans. The results of the first nine months of 2006 reflect this transition. To ensure that Quebecor World's retooling strategy will drive greater performance and shareholder value upon its complete implementation, the Company has embarked upon a five-point transformation plan, as discussed above. Although the full extent of this transformation plan will be realized over time, actions have already been taken in 2006 to begin the transformation process:
| Management's Discussion and Analysis |
12
Customer Value
Quebecor World is committed to creating the highest value for its customers by providing innovative and complete print solutions. The Company is committed to delivering a high quality print service and increasing its before and after print offering, creating additional customer value by increasing their marketing returns on investments as well as generating improved returns for Quebecor World shareholders.
As an example, in October 2006, the Company signed a significant long-term directory printing agreement with Yellow Pages Group valued at more than Cdn$1 billion through the year 2020. The agreement extends existing directory printing contracts in Eastern, Western and Central Canada and increases the volumes printed by Quebecor World. This contract includes expanded value added before and after print services including the use of Quebecor World proprietary AdMagic software and after press services including value-added fulfillment.
Best People
The Company has introduced a new people and organisation capability building program. The plan emphasizes building high performance teams, feedback, people development and training programs. In the third quarter, the Company kicked this off with reviews of its key leaders.
Great Execution
The Company has historically been committed to continuous improvement programs that complemented and enhanced its retooling efforts. With the development of the new five-point transformation plan, continuous improvement has become a focal point of the Company's strategy. As a result, Quebecor World has developed an improved and complete Continuous Improvement Program to be deployed across the entire platform. The program will include the use of Six Sigma, Lean Manufacturing and other tools to reduce costs and improve efficiencies and quality at the lowest capital expense. In the third quarter, Quebecor World identified the facilities and projects to kick off the program and began identifying key people who will be the leaders in the execution of these continuous improvement projects based on Six Sigma.
Retooling Program
The significant deployment of next-generation technology should create a highly competitive operating network, with superior quality, speed, and efficiency. Quebecor World is deploying the latest technology across its network in one wave of retooling while remaining capacity-neutral. The Company believes that this standardization, simplification, and focus on state-of-the-art technology across its platform will deliver the highest value to its customers and the highest returns to its shareholders. This new equipment, combined with the introduction of a new continuous improvement program, results in more productive operations; with lower operating costs, higher quality, less waste, fewer people, and fewer facilities that in the long run will deliver significant improvement in return on invested capital.
In 2006, the Company continued to implement its retooling program for North America and Europe. This program is now past the halfway point; Quebecor World has disbursed approximately $250 million with respect to the North American plan and approximately $150 million for the European plan for an investment totalling more than $400 million since the program began. The deployment of such an extensive program cannot be accomplished without experiencing certain plant closure and start-up related disruptions, which the Company experienced in the first nine months of 2006.
In combination with the retooling program, ongoing restructuring efforts continue to optimize the Company's overall platform as it concentrates on fewer but more efficient facilities with lower fixed costs. In 2006, Quebecor World announced the closure of two facilities in France, the reorganization of its U.S. Book platform that resulted in the closing of one facility and the reorganization of its U.S. Magazine platform resulting in the closure of two facilities in the U.S. by the end of 2006. These measures are further discussed in the "Impairment of Assets and Restructuring Initiatives" and "Segment Review" sections.
Strengthening the Balance Sheet
Efforts to reinforce Quebecor World's financial position have been underway with the extension of the Company's unsecured credit facility, the renewal and extension of two of its securitization programs, the issuance of new 10-year senior unsecured notes, the closing of a low cost equipment financing and the repurchase of its high-cost Series 4 Redeemable First Preferred Shares. In November 2006, Quebecor World suspended the dividend on Multiple and Subordinate Voting Shares with a view to strengthening the Company's balance sheet. In addition, the Company is evaluating strategic and tactical options to improve the balance sheet. All of these elements are discussed in the "Financial Condition, Liquidity and Capital Resources" section.
| Management's Discussion and Analysis |
13
The first nine months of 2006 have been difficult as the Company continues to face highly competitive market conditions coupled with temporary disruptions and volume losses caused by the installation of new presses, removal of older presses and plant shut-downs. As such, although the retooling and restructuring plans mentioned above are starting to generate some positive effects, they have not yet translated into increased operating income. As a result, Quebecor World's operating income is lower than the corresponding period in 2005. Management believes that the transformation plan discussed above will better position the Company to face these conditions and drive greater long-term performance.
Revenue by Print Service — Worldwide
($ millions)
For the quarter and the nine-month periods ended September 30
(Continuing Operations)
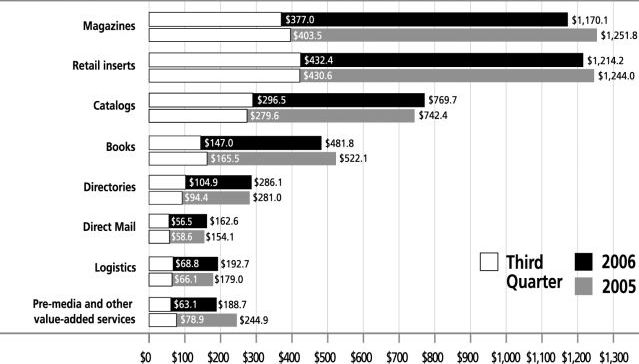
FIGURE 2
OUTLOOK 2006
For the remainder of 2006, Quebecor World anticipates its operations will continue to be affected by negative market and pricing conditions, inefficiencies from its retooling and restructuring programs, and previously announced volume reductions. The Company is addressing these challenges by focusing on the execution of the above stated strategy. The improvement actions contained in the transformation plan should deliver benefits. However, as the process is long-term and as the Company anticipates additional plant closure and start-up related inefficiencies in upcoming quarters associated with the retooling and restructuring plans, the full effect of these efforts will only be realized over time.
PRESENTATION OF FINANCIAL INFORMATION
Financial data have been prepared in conformity with Canadian generally accepted accounting principles ("Canadian GAAP"). However, certain measures used in this discussion and analysis do not have any standardized meaning under Canadian GAAP. When used, these measures are defined in such terms as to allow the reconciliation to the closest Canadian GAAP measure. Numerical reconciliation is provided in Figure 7. It is unlikely that these measures could be compared to similar measures presented by other companies.
The Company's functional currency is the Canadian dollar and its reporting currency is the U.S. dollar.
DISCONTINUED OPERATIONS
As discussed in the MD&A included in the Company's 2005 Annual Report, Quebecor World disposed of its North American non-core printing facilities in the second half of 2005. The loss from discontinued operations recorded in the first nine months of 2006 is related to the closing working capital adjustments of these facilities.
| Management's Discussion and Analysis |
14
FINANCIAL REVIEW
The Company assesses performance based on operating income before impairment of assets, restructuring and other charges ("Adjusted EBIT", Figure 7). The following operating analyses are before impairment of assets, restructuring and other charges, except where otherwise indicated. The review focuses only on continuing operations.
Segmented Results of Continuing Operations
($ millions)
Selected Performance Indicators
| | North America | Europe | Latin America | Inter-Segment and Others | Total | ||||||||||||||||||||||||||
|---|---|---|---|---|---|---|---|---|---|---|---|---|---|---|---|---|---|---|---|---|---|---|---|---|---|---|---|---|---|---|---|
| | 2006 | 2005 | 2006 | 2005 | 2006 | 2005 | 2006 | 2005 | 2006 | 2005 | |||||||||||||||||||||
| Three months ended September 30 | |||||||||||||||||||||||||||||||
| Revenues | $ | 1,241.1 | $ | 1,253.6 | $ | 244.1 | $ | 270.7 | $ | 61.2 | $ | 54.4 | $ | (0.2 | ) | $ | (1.5 | ) | $ | 1,546.2 | $ | 1,577.2 | |||||||||
| Adjusted EBITDA | 142.4 | 165.2 | 7.5 | 8.5 | 6.3 | 5.6 | (5.6 | ) | (0.6 | ) | 150.6 | 178.7 | |||||||||||||||||||
| Adjusted EBIT | 75.7 | 100.0 | (6.0 | ) | (4.8 | ) | 3.4 | 2.8 | (5.8 | ) | (0.8 | ) | 67.3 | 97.2 | |||||||||||||||||
| IAROC | 3.3 | 3.3 | 7.7 | 13.7 | 0.6 | 0.2 | — | — | 11.6 | 17.2 | |||||||||||||||||||||
| Operating income (loss) | 72.4 | 96.7 | (13.7 | ) | (18.5 | ) | 2.8 | 2.6 | (5.8 | ) | (0.8 | ) | 55.7 | 80.0 | |||||||||||||||||
| Adjusted EBITDA margin | 11.5 | % | 13.2 | % | 3.1 | % | 3.2 | % | 10.2 | % | 10.3 | % | 9.7 | % | 11.3 | % | |||||||||||||||
| Adjusted EBIT margin | 6.1 | % | 8.0 | % | (2.5 | )% | (1.8 | )% | 5.4 | % | 5.1 | % | 4.3 | % | 6.2 | % | |||||||||||||||
| Operating margin | 5.8 | % | 7.7 | % | (5.6 | )% | (6.8 | )% | 4.6 | % | 4.7 | % | 3.6 | % | 5.1 | % | |||||||||||||||
| Capital expenditures(1) | $ | 51.3 | $ | 64.3 | $ | 27.5 | $ | 22.8 | $ | 2.5 | $ | 1.2 | $ | 1.3 | $ | 0.2 | $ | 82.6 | $ | 88.5 | |||||||||||
| Change in non-cash balances related to operations, cash flow (outflow)(1) | (44.2 | ) | (129.1 | ) | 11.1 | 3.3 | 1.0 | (14.1 | ) | (12.9 | ) | 13.0 | (45.0 | ) | (126.9 | ) | |||||||||||||||
Nine months ended September 30 | |||||||||||||||||||||||||||||||
| Revenues | $ | 3,537.6 | $ | 3,559.4 | $ | 758.1 | $ | 886.2 | $ | 170.5 | $ | 177.2 | $ | (0.3 | ) | $ | (3.5 | ) | $ | 4,465.9 | $ | 4,619.3 | |||||||||
| Adjusted EBITDA | 372.9 | 462.1 | 29.8 | 43.2 | 15.3 | 17.4 | (8.3 | ) | (1.9 | ) | 409.7 | 520.8 | |||||||||||||||||||
| Adjusted EBIT | 177.8 | 264.3 | (8.6 | ) | (0.8 | ) | 6.8 | 9.3 | (8.7 | ) | (2.6 | ) | 167.3 | 270.2 | |||||||||||||||||
| IAROC | 29.4 | 19.7 | 34.5 | 61.9 | 1.2 | 0.7 | — | — | 65.1 | 82.3 | |||||||||||||||||||||
| Operating income (loss) | 148.4 | 244.6 | (43.1 | ) | (62.7 | ) | 5.6 | 8.6 | (8.7 | ) | (2.6 | ) | 102.2 | 187.9 | |||||||||||||||||
| Adjusted EBITDA margin | 10.5 | % | 13.0 | % | 3.9 | % | 4.9 | % | 9.0 | % | 9.8 | % | 9.2 | % | 11.3 | % | |||||||||||||||
| Adjusted EBIT margin | 5.0 | % | 7.4 | % | (1.1 | )% | (0.1 | )% | 4.0 | % | 5.2 | % | 3.7 | % | 5.8 | % | |||||||||||||||
| Operating margin | 4.2 | % | 6.9 | % | (5.7 | )% | (7.1 | )% | 3.3 | % | 4.9 | % | 2.3 | % | 4.1 | % | |||||||||||||||
| Capital expenditures(1) | $ | 134.5 | $ | 174.9 | $ | 58.4 | $ | 39.5 | $ | 26.4 | $ | 2.3 | $ | (0.3 | ) | $ | 0.2 | $ | 219.0 | $ | 216.9 | ||||||||||
| Change in non-cash balances related to operations, cash flow (outflow)(1) | (106.9 | ) | (123.8 | ) | 5.1 | (28.2 | ) | 2.3 | (19.0 | ) | 35.3 | (11.1 | ) | (64.2 | ) | (182.1 | ) | ||||||||||||||
| Adjusted: Defined as before IAROC and before goodwill impairment charge | FIGURE 3 | |
| IAROC: Impairment of assets, restructuring and other charges | ||
| (1) Including both continuing and discontinued operations |
THIRD QUARTER 2006
The Company's consolidated revenues for the third quarter of 2006 were $1,546.2 million, a 2.0% decrease when compared to $1,577.2 million for the same period in 2005. Excluding the impact of currency translation (Figure 4), revenues were $1,521.2 million for the quarter, down 3.6% compared to 2005. The situation is due mainly to decrease in volumes and continued price pressures as further discussed in the "Segment Review" section. In the third quarter of 2006, Adjusted EBIT decreased by 30.8% to $67.3 million compared to $97.2 million in 2005. Adjusted EBIT margin was 4.3% for the third quarter, down from 6.2% for the same period in 2005.
Impact of Foreign Currency
($ millions)
| | Three months ended September 30, 2006 | Nine months ended September 30, 2006 | |||||
|---|---|---|---|---|---|---|---|
| Foreign currency favorable impact on revenues | $ | 25.0 | $ | 35.7 | |||
| Foreign currency unfavorable impact on operating income | $ | (0.9 | ) | $ | (2.4 | ) | |
FIGURE 4
| Management's Discussion and Analysis |
15
Paper sales, excluding the effect of currency translation, decreased by 2.3% for the third quarter of 2006 compared to the same period in 2005. Although the variance in paper sales has an impact on revenues, it has little impact on operating income because the cost is generally passed on to the customer. Most of the Company's long-term contracts with its customers include price-adjustment clauses based on the cost of materials in order to minimize the effects of fluctuation in the price of paper.
Cost of sales for the third quarter of 2006 decreased by 0.7% to $1,295.9 million compared to $1,304.5 million for the corresponding period in 2005. The decrease compared to 2005 is explained mostly by a decrease in sales volume, a decrease in labor costs and a pension curtailment gain. Gross profit margin was 16.2% in the third quarter of 2006 compared to 17.3% in 2005. Currency translation did not have a significant impact on gross profit margin in the third quarter of 2006.
Selling, general and administrative expenses for the third quarter of 2006 were $98.5 million, a 3.2% increase compared with $95.4 million in 2005. Excluding the unfavorable impact of currency translation of $2.6 million, selling, general and administrative expenses were essentially flat.
Depreciation and amortization were $76.4 million in the third quarter of 2006 compared with $74.4 million in 2005. Excluding the unfavorable impact of currency translation of $1.2 million, depreciation and amortization were essentially flat compared to last year.
Securitization fees totaled $8.1 million for the third quarter of 2006 up from $5.7 million for the third quarter of 2005. The increase for the quarter was mainly due to higher interest rates underlying the program fees. Servicing revenues and expenses did not have a significant impact on the Company's results.
During the third quarter of 2006, the Company recorded impairment of assets, restructuring and other charges of $11.6 million, compared to $17.2 million last year. The amount for the quarter was mainly related to the closure and consolidation of facilities in North America and Europe. These measures are described in the "Impairment of Assets and Restructuring Initiatives" section.
Financial expenses were $33.7 million in the third quarter of 2006, compared to $31.0 million in 2005. The variance of $2.7 million was mainly explained by higher interest rates and a higher level of debt offset by an increase of interest capitalized to the cost of equipment and gains on derivative financial instruments.
Income tax expense was $2.7 million in the third quarter of 2006 compared to $18.2 million in 2005. Income tax expense before impairment of assets, restructuring and other charges was $4.0 million in the third quarter of 2006 compared to $19.4 million for the same period last year. The decrease in income tax expense in the third quarter of 2006 was mainly due to losses incurred in jurisdictions with higher tax rates and in which profits were generated in 2005.
For the third quarter ended September 30, 2006, the Company reported diluted earnings per share of $0.09 compared to $0.16 in 2005. These results incorporated impairment of assets, restructuring and other charges of $11.6 million ($10.3 million net of taxes) or $0.08 per share compared with $17.2 million ($16.0 million net of taxes) or $0.12 per share in 2005. Excluding the effect of impairment of assets, restructuring and other charges, the third quarter of 2006 resulted in diluted earnings per share of $0.17 compared with $0.28 in the same period of 2005.
YEAR-TO-DATE 2006
The Company's consolidated revenues for the first nine months of 2006 were $4.47 billion, down 3.3% from $4.62 billion in 2005. Excluding the impact of currency translation (Figure 4), revenues were $4.43 billion for the nine-month period of 2006, down 4.1% compared to 2005. The situation is due mainly to decrease in volumes and continued price pressures as further discussed in the "Segment Review" section. On a year-to-date basis, Adjusted EBIT was $167.3 million, down 38.1% from $270.2 million in 2005. Adjusted EBIT margin, on the same basis, was 3.7% for the first nine months, down from 5.8% in 2005.
Paper sales, excluding the effect of currency translation, decreased by 1.6% on a year-to-date basis, compared to the same period in 2005.
Cost of sales for the first nine months was $3.76 billion, a 1.3% decrease compared to $3.81 billion for the same period in 2005. The decrease compared to 2005 is explained mostly by a decrease in sales volume and a decrease in labor costs that were partly offset by higher energy costs. Gross profit margin was 15.8% in the first nine months of 2006 compared to 17.6% in 2005. Currency translation did not have a significant impact on gross profit margin on a year-to-date basis.
Selling, general and administrative expenses for the first nine months of 2006 were $293.4 million, essentially flat compared to $293.9 million in 2005. Excluding the unfavorable impact of currency translation of $6.2 million, selling, general and administrative expenses were lower by $6.7 million, or 2.3% for the first nine months of 2006 compared to last year. The savings were mostly explained by workforce reductions, which contributed to the decrease in salaries and benefits. The decrease was partly offset by a pension curtailment charge related to changes in Canadian pension plans.
| Management's Discussion and Analysis |
16
Depreciation and amortization were $223.4 million on a year-to-date basis compared with $231.0 million in 2005. Excluding the impact of currency translation, depreciation and amortization decreased by 3.9% for the nine-month period in 2006 compared to last year. The expense decreased compared to 2005 as a result of impairment charges on long-lived assets booked in 2005.
Securitization fees totaled $22.6 million for the first nine months of 2006 compared to $16.1 million for the same period in 2005. The increase for the year-to-date was mainly due to higher interest rates underlying the program fees. Servicing revenues and expenses did not have a significant impact on the Company's results.
During the first nine months of 2006, the Company recorded impairment of assets, restructuring and other charges of $65.1 million, compared to $82.3 million in 2005. The year-to-date charges were mainly related to the closure and consolidation of facilities in North America and Europe and also includes impairment charges on long-lived assets mainly in Europe as well as the continuation of previous initiatives. These measures are described in the "Impairment of Assets and Restructuring Initiatives" section.
Financial expenses were $94.8 million compared to $91.2 million in 2005 on a year-to-date basis. The variance of $3.6 million was mainly explained by higher interest rates and a higher level of debt offset by an increase of interest capitalized to the cost of equipment and gains on derivative financial instruments.
On a year-to-date basis, income tax recovery was $12.0 million in 2006, compared to an income tax expense of $40.8 million in 2005. Income tax recovery before impairment of assets, restructuring and other charges was $1.2 million compared to an income tax expense of $48.0 million in 2005 on the same basis. The income tax recovery in the first nine months of 2006 was mainly due to losses incurred in jurisdictions with higher tax rates and in which profits were generated in 2005.
Loss per share was $0.06 for the first nine months of 2006 compared to diluted earnings per share of $0.20 for the same period in 2005. These results incorporated impairment of assets, restructuring and other charges of $65.1 million ($54.3 million net of taxes) or $0.42 per share compared with $82.3 million ($75.1 million net of taxes) or $0.57 per share in 2005. Excluding the effect of impairment of assets, restructuring and other charges, the first nine months of 2006 resulted in diluted earnings per share of $0.36 compared with $0.77 in the same period in 2005.
QUARTERLY TRENDS
Selected Quarterly Financial Data
($ millions, except per share data)
(Continuing Operations)
| | 2006 | 2005 | 2004 | ||||||||||||||||||||||||||
|---|---|---|---|---|---|---|---|---|---|---|---|---|---|---|---|---|---|---|---|---|---|---|---|---|---|---|---|---|---|
| | Q3 | Q2 | Q1 | Q4 | Q3 | Q2 | Q1 | Q4 | |||||||||||||||||||||
| Consolidated Results | |||||||||||||||||||||||||||||
| Revenues | $ | 1,546.2 | $ | 1,452.2 | $ | 1,467.5 | $ | 1,664.0 | $ | 1,577.2 | $ | 1,491.1 | $ | 1,551.0 | $ | 1,822.7 | |||||||||||||
| Adjusted EBITDA | 150.6 | 130.6 | 128.5 | 167.9 | 178.7 | 167.4 | 174.7 | 251.9 | |||||||||||||||||||||
| Adjusted EBIT | 67.3 | 50.4 | 49.6 | 87.3 | 97.2 | 84.4 | 88.6 | 161.4 | |||||||||||||||||||||
| IAROC | 11.6 | 31.4 | 22.1 | 11.9 | 17.2 | 31.8 | 33.3 | 48.4 | |||||||||||||||||||||
| Goodwill impairment charge | — | — | — | 243.0 | — | — | — | — | |||||||||||||||||||||
| Operating income (loss) | 55.7 | 19.0 | 27.5 | (167.6 | ) | 80.0 | 52.6 | 55.3 | 113.0 | ||||||||||||||||||||
| Net income (loss) | 19.2 | (6.5 | ) | 6.3 | (205.0 | ) | 30.9 | 9.5 | 15.8 | 46.3 | |||||||||||||||||||
| Per Share Data | |||||||||||||||||||||||||||||
| Earnings (loss) | |||||||||||||||||||||||||||||
| Diluted | $ | 0.09 | $ | (0.11 | ) | $ | (0.04 | ) | $ | (1.64 | ) | $ | 0.16 | $ | — | $ | 0.05 | $ | 0.27 | ||||||||||
| Adjusted diluted | $ | 0.17 | $ | 0.10 | $ | 0.09 | $ | 0.21 | $ | 0.28 | $ | 0.22 | $ | 0.27 | $ | 0.59 | |||||||||||||
| Adjusted: Defined as before IAROC and before goodwill impairment charge IAROC: Impairment of assets, restructuring and other charges | FIGURE 5 | ||||||||||||||||||||||||||||
Revenues
Revenues generated by the Company are seasonal with a greater part of volume being realized in the second half of the fiscal year, primarily due to the higher number of magazine pages, new product launches, back-to-school ads, marketing by retailers, increased catalog activity, and holiday promotions. Therefore, an analysis of the consecutive quarters is not a true measurement of the revenue trend (Figure 5). Revenue in the last quarter of 2004 was positively impacted by volume increases and currency translation but that effect was partly offset by continuing overcapacity in the printing industry and ongoing pricing pressures. Revenues in 2005 reflected a favorable impact of currency translation and a higher volume of paper sold to customers. However, continued pricing pressures across the platform adversely affected revenues in all four quarters of 2005 and in the three quarters of 2006. Volume decreases were particularly felt in Europe in 2005, whereas the decrease also affected other platforms worldwide in the three quarters of 2006 as discussed in the "Segment Review" section.
| Management's Discussion and Analysis |
17
Adjusted EBITDA
The last quarter of 2004 showed improved results attributed to the positive impact of the cost reduction efforts initiated in 2003. For all four quarters of 2005, the positive effects of restructuring initiatives did not translate into an increase of operating income because of the continuing price reductions, rising energy costs and the underperformance of operations in France and the United Kingdom. Adjusted EBITDA decreased in the four most recent quarters compared to the same periods in 2005 and 2004. Adjusted EBITDA for the fourth quarter of 2005 was also affected by operational inefficiencies mainly in plants involved in the installation of new equipment or press closures. In the first three quarters of 2006, the Company continued to face more difficult market conditions than anticipated, resulting in price erosion worldwide, decreased volume in certain business groups and it continued to be affected by temporary inefficiencies related to the retooling and restructuring efforts.
Impairment of assets, restructuring and other charges
Impairment of assets, restructuring and other charges have been a major focus of the Company's cost reduction initiatives undertaken during the previous years that involved a reduction in force, closure or downsizing of facilities, decommissioning of under-performing assets, lowering of overhead expenses, consolidating corporate functions and relocating sales and administrative offices into plants. This determined focus on cost containment has reduced the Company's long-term cost structure and will improve efficiency across the platform.
In the fourth quarter of 2004, the Company recorded $34.6 million of impairment of assets mainly related to facilities in Europe and $13.8 million in restructuring charges for several smaller initiatives in North America and Europe. In the first quarter of 2005, the Company took a $33.3 million charge mainly related to the impairment of long-lived assets and accelerated depreciation. For the second quarter of 2005, the Company booked a $31.8 million charge, approximately half of which was for impairment of assets and accelerated depreciation and the other half was related to restructuring initiatives. In the third quarter of 2005, there was a $17.2 million charge for new impairment of assets, accelerated depreciation, restructuring and other charges. In the fourth quarter of 2005, the Company recorded a $11.9 million charge, of which $5.4 million was related to the impairment of long-lived assets and accelerated depreciation related to European operations, mainly in France and the United Kingdom. In the first quarter of 2006, the Company recorded $6.4 million of impairment of long-lived assets and $15.7 million in restructuring charges, mainly related to the closure of a facility in North America and workforce reductions in North America and Europe. The $31.4 million charges recorded in the second quarter of 2006 included $28.0 million of restructuring charges that were again essentially related to the closing and consolidation of facilities in North America and Europe. In the third quarter of 2006, there was an $11.6 million charge recorded, also related to North America and Europe.
Net income (loss)
Net income (loss) in the last eight quarters was primarily affected by the difficult market environment, which more than offset the initial benefits from the restructuring process and the decreased costs from other initiatives mentioned above. In addition, unusual items impacting financial expenses and income taxes also affected the net income for specific quarters. Through the year 2004, financial expenses decreased mainly due to the favorable impact of the refinancing of long-term debt in the fourth quarter of 2003 combined with a lower average debt compared to the previous year. Net income in all four quarters of 2005 was negatively affected by overall pricing erosion, the under-performing operations in France, as well as volume reductions in the United Kingdom and certain business groups in the North American platform. Net income for the fourth quarter of 2005 was significantly impacted by a $243.0 million pre-tax goodwill impairment charge. Net income for the first quarter of 2006 was impacted by price erosion and volume decreases as discussed above, as well as certain specific revenues, mainly a sales tax settlement in Europe. This trend continued in the second and third quarters of 2006, and the Company incurred additional costs and reduced volumes from start-up related inefficiencies.
| Management's Discussion and Analysis |
18
SEGMENT REVIEW
The following is a review of activities by segment. The operating analysis is before impairment of assets, restructuring and other charges. Also, the review focuses only on continuing operations.
Revenue by Business Group
($ millions)
For the quarter and the nine-month periods ended September 30
(Continuing Operations)
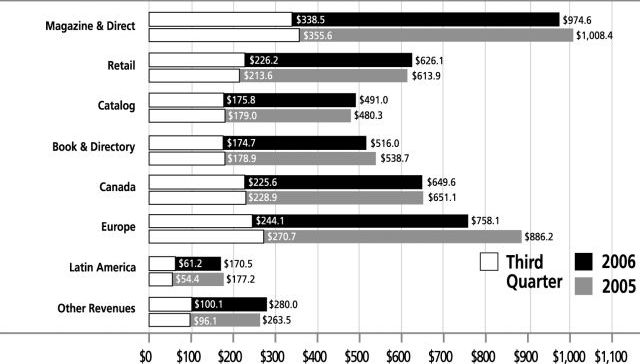
FIGURE 6
NORTH AMERICA
North American revenues for the third quarter of 2006 were $1,241.1 million, down 1.0% from $1,253.6 million in 2005. On a year-to-date basis, revenues were $3,537.6 million in 2006 compared to $3,559.4 million in 2005. Excluding the effect of currency translation and the favorable impact of paper sales, revenues decreased by 1.6% in the third quarter and 1.9% on a year-to-date basis mainly due to lower prices. The lower prices are the result of the combination of unfavorable product mix compared to last year and the continued difficult pricing environment impacting most of the North American business groups. Volume increased for the first nine months of 2006 in the Catalog and Directory groups, but decreased in the other North American business groups compared to last year.
Operating income and margin decreased in the third quarter of 2006 and on a year-to-date basis in 2006 compared to 2005. This was a result of the pricing pressures while overall volume remained more or less flat. Operating income was also negatively impacted by higher energy costs as well as temporary inefficiencies related to the installation and start-up of new presses. Year-over-year, the North American workforce was reduced by 1,793 employees, or approximately 7.0%, and the benefits of this improvement will positively impact the Company in future quarters.
The following is a review of the North American activities by business group. The North American segment is made up of the following business groups: Magazine & Direct, Retail, Catalog, Book & Directory, Canada and Other Revenues (Figure 6).
Magazine & Direct
Magazine & Direct revenues for the third quarter of 2006 were $338.5 million, down 4.8% from $355.6 million in 2005. On a year-to-date basis, revenues were $974.6 million in 2006, down 3.4% from $1,008.4 million in 2005. Revenue decreased in the third quarter and on a year-to-date basis due mainly to print volume decreases in both groups. The decrease in the Magazine Group is due in part to the closure of the Brookfield facility discussed below and lower pagination from major publishers whereas the decrease in the Direct Group results from lower volume from a large customer. Continued price erosion in the Magazine group also affected revenues for the quarter and year-to-date. These shortfalls were partially offset by increased paper sales year-to-date in both groups and a favorable work mix in the Direct group.
As part of deploying the improved operating network to increase quality and reduce costs, the Company's plan is to install ten new presses in seven facilities for magazine customers. Two of them were installed and operating in the fourth quarter of 2005, six additional presses have been installed and began operations in the first nine months of 2006 and one more is expected to be installed before the end of the year. The Company expects to complete the installation of the tenth press in the first quarter of 2007. This process resulted in inefficiencies and volume reductions common during start-ups, which stemmed from the preparation, installation, and start-up of new equipment and the temporary redistribution of print volume to other facilities.
| Management's Discussion and Analysis |
19
In April 2006, the Company announced its decision to close a facility in Brookfield, Wisconsin as part of the reorganization of its Magazine group. The closure has been completed in the third quarter of 2006. As part of the same plan, the Company announced in June 2006, its decision to consolidate its Cincinnati area magazine printing operations into one facility to improve customer service, maximize asset utilization and increase efficiency. This will result in the closure of the Red Bank, Ohio facility. Management expects to complete the closure in the fourth quarter of 2006.
Retail
Retail revenues for the third quarter of 2006 were $226.2 million, up 5.9% from $213.6 million in 2005. On a year-to-date basis, revenues were $626.1 million in 2006, up 2.0% compared to $613.9 million in 2005. For the quarter, the increase in revenues is attributable to volume from new sales of offset inserts in addition to material price increases. The year-to-date increase in revenues is also due to increased volume from the growth in offset inserts and material price increases, but partially offset by a change in product mix.
Catalog
Catalog revenues for the third quarter of 2006 decreased by 1.8% to $175.8 million, compared with $179.0 million in 2005. On a year-to-date basis, revenues were $491.0 million in 2006, up 2.2% from $480.3 million in 2005. The decrease in revenues for the third quarter was a result of slight increase in actual volume offset by the negative price pressures from the market. The increase in year-to-date revenues was attributable to volume growth due to the addition of new customers, such as Bass Pro Shops and Brookstone in addition to material price increases. Catalog also increased sales with several of its key customers. The Group's success in winning new customers and improving its position with key current customers reflects the development in the Company's complete solution offering to help the marketing of branded goods companies' products and to increase the store traffic at retail customers.
Book & Directory
Book & Directory revenues for the third quarter of 2006 were $174.7 million, down 2.4% from $178.9 million in 2005. On a year-to-date basis, revenues were $516.0 million in 2006, down 4.2% from $538.7 million in 2005. The decrease in quarterly revenues was due primarily to reduced capacity related to the Book retooling plan, resulting in lower volumes in the Book group. As part of this plan, the Company has closed its plant in Kingsport, Tennessee. This was completed at the end of the third quarter of 2006. The restructuring effort is resulting in decommissioning of assets and reducing staff by 8.0% in the Book group. The increased volume in the Directory group offset this reduction as the Company started to realize incremental volumes from important contracts signed in 2005. These contracts will represent an additional 160 billion printed directory pages per year starting in the second quarter of 2007.
In April 2006, the Company announced its plan to reorganize its Book platform in order to improve customer service, maximize asset utilization and increase efficiency. The plan provides for investments in new state-of-the-art equipment and the decommissioning or relocation of certain existing assets. As part of the reorganization, the Book group has continued to implement its portion of the North American retooling plan with the addition of two 64-page presses that are now fully operational. These presses, along with the two similar presses installed in the fourth quarter of 2005, will better serve clients, particularly where runs are short and time to market is the priority. However, the Company also offers a seamless and cost effective service for more labor-intensive products from its Latin American platform.
Canada
The Canadian business group operates mainly in the Retail, Magazine, Catalog and Directory markets. Canadian revenues for the third quarter of 2006 were $225.6 million, down 1.4% from $228.9 million in 2005. On a year-to-date basis, revenues were $649.6 million in 2006, essentially flat compared to 2005. The decrease in revenues for the quarter is primarily attributable to lower volume and continuing pricing erosion partly offset by the appreciating Canadian dollar. Excluding the impact of currency translation and the effect of paper sales, revenues decreased by 4.1% for the quarter and by 4.9% year-to-date compared to the same periods in 2005 due to reductions in prices and in volume. The decrease in prices is mainly attributable to less favorable foreign exchange contracts on sales to U.S. customers as well as ongoing pricing pressures from major contractual customers. Volume was down 5.3% in the third quarter, mostly due to decreased volume in Retail and the sale of a facility in Val-d'Or, Quebec, earlier this year. In October, the Company announced the signing of an important directory printing contract with Yellow Pages Group, which extends existing printing contracts and increases the volumes manufactured by Quebecor World.
Other Revenues
Other sources of revenues in North America include Quebecor World Premedia and Logistics.
The Quebecor World Premedia revenues for the third quarter of 2006 were $14.3 million, down 2.4% from $14.7 million in 2005. On a year-to-date basis, revenues were $41.6 million in 2006, down 3.4% from $43.1 million in 2005. The slight decrease in revenues for the third quarter was attributable to a lower page count that was partly offset by a positive change in work mix. In the third quarter of 2006, the decrease in lower-value Book page count was partly offset by increased volume of higher-value Book-page composition and more retail and catalog creative work that positively impacted the work mix. On a year-to-date basis, revenues were impacted by a decrease in volume, which was partly offset by an overall positive change in work mix.
| Management's Discussion and Analysis |
20
Logistics revenues for the third quarter of 2006 were $88.1 million, up 4.4% from $84.3 million in 2005. On a year-to-date basis, revenues were $245.0 million in 2006, up 7.3% from $228.4 million in 2005. The revenue increase for the quarter and nine-month periods of 2006 is due to the success of the Company's integrated end-to-end solution in providing value-added services. Such services include the new Co-Mailing facility in Bolingbrook, Illinois, which offers low-volume customers with significant reductions in delivery costs. This new facility continued to produce increased revenues, volume and margin over prior year, supporting the strong growth. Building on this success and the Company's leadership in this area, Quebecor World has ordered a third line to be installed in 2007. Overall, product mix compared to prior year improved with a shift towards higher margin services. These favorable impacts were coupled with cost containment and strategic cost savings initiatives, including more effective network utilization and strategic use of specific modes of transportation.
EUROPE
The European segment operates mainly in the Magazine, Retail, Catalog and Book markets. European revenues for the third quarter of 2006 were $244.1 million, down 9.8% from $270.7 million in 2005. On a year-to-date basis, revenues were $758.1 million in 2006, down 14.5% from $886.2 million in 2005. Excluding the impact of currency translation, revenues were down 13.7% for the third quarter and 12.9% year-to-date compared to the same periods last year. Overall, volume decreased in the third quarter and year-to-date, mainly in France and in the United Kingdom. The implementation of the European retooling plan that began early in 2006 has also impacted volume in most countries for the third quarter of 2006 as a result of temporary press start-up inefficiencies. Furthermore, France's volume shortfall is due to the disposal of certain facilities in 2005, and in the first quarter of 2006, the shutdown of a facility in the second quarter of 2006 and the reduced gravure printing work, mainly in the Catalog and Retail markets. Although restructuring measures have been undertaken at the Corby, United Kingdom facility, it is still negatively impacted by the non-renewal of a significant contract, which wound down in the first half of 2005 as well as the poor market conditions in the United Kingdom.
Prices continued to be a challenge in the third quarter and the first nine months of 2006, primarily due to difficult economic conditions in most regions, but also because of an unfavorable product mix in France, Belgium and Finland.
The operating income and margin for the European segment decreased in the third quarter and year-to-date compared to the same periods in 2005. The most important decreases in operating income and margin were in France and the United Kingdom but were essentially flat in Sweden, Austria and Spain. Operating margin in France and the United Kingdom was negative for both the third quarter and nine-month period of 2006. Third quarter results were also negatively impacted by decreased volume and inefficiencies related to the important restructuring of the Corby, United Kingdom facility. Start-up inefficiencies also continued to affect operating income in the first nine months of 2006, notably in Belgium and in Finland. Year-over-year, the European workforce was reduced by 18.6% or 910 employees.
As part of the European retooling plan, the Company has placed five firm orders to purchase new state-of-the-art equipment. Two of these presses were installed in Austria and the United Kingdom and were in operation at the end of the third quarter of 2006. The Company expects to install three additional presses, two in Belgium and one in Spain, that should be in operation at the end of the first quarter of 2007.
The Company completed the shutdown of the Strasbourg, France, facility in the second quarter of 2006. The closure was completed on time and within initial cost estimates. In October, the Company announced its decision to close a facility in Lille, France, which is further discussed in the "Impairment of Assets and Restructuring Initiatives" section.
LATIN AMERICA
Latin America operates mainly in the Book, Directory, Magazine, Catalog and Retail markets. Latin America's revenues for the third quarter of 2006 were $61.2 million, up 12.6% from $54.4 million in 2005. On a year-to-date basis, revenues were $170.5 million in 2006, down 3.7% from $177.2 million in 2005. Excluding the impact of foreign currency and paper sales, revenues for the third quarter of 2006 were up 4.0% compared to last year. For the first nine months of 2006, on the same basis, revenues decreased by 0.7%. Prices decreased in the third quarter while year-to-date prices increased compared to 2005 as a result of a favorable impact on export sales. Overall volume increased for the quarter, positively impacting operating income. On a year-to-date basis, volume decreased as well as operating income and margin. The majority of the annual decreases are explained by volume shortfalls in Peru in relation to the economic slowdown in the second quarter of 2006 relating to the presidential election in Peru, but management expects a partial recovery of lost volume in the fourth quarter of 2006. In addition, volumes were down in Mexico due mainly to lower directory volume.
| Management's Discussion and Analysis |
21
Approximately two years ago, the Company embarked on an initiative to further link the Latin American Book and Directory facilities with their North American counterparts to extend this capacity and capability to its overall customer base. Building on the success of this initiative in 2005, the Company announced, in April 2006, a plan to significantly enhance service to its global customers through improved integration of its North American and Latin American platforms. This involved the closure of a Book facility in the United States, as previously mentioned, and the redeployment of certain equipment to facilities in Latin America. Mexico, Colombia and Peru are directly involved in this equipment transfer because of their strategic geographical location and competitive book manufacturing capabilities that enable publishers to receive North American quality and service at a reduced cost.
| Management's Discussion and Analysis |
22
Reconciliation of non GAAP measures
(In millions of US dollars, except per share data)
| | Three months | Nine months | |||||||||||||
|---|---|---|---|---|---|---|---|---|---|---|---|---|---|---|---|
| | 2006 | 2005 | 2006 | 2005 | |||||||||||
| Operating Income from Continuing Operations | |||||||||||||||
| Operating income ("EBIT") | $ | 55.7 | $ | 80.0 | $ | 102.2 | $ | 187.9 | |||||||
| Impairment of assets, restructuring and other charges ("IAROC") | 11.6 | 17.2 | 65.1 | 82.3 | |||||||||||
| Adjusted EBIT | $ | 67.3 | $ | 97.2 | $ | 167.3 | $ | 270.2 | |||||||
| EBIT | $ | 55.7 | $ | 80.0 | $ | 102.2 | $ | 187.9 | |||||||
| Depreciation of property, plant and equipment(1) | 76.3 | 74.3 | 223.2 | 234.9 | |||||||||||
| Amortization of deferred charges(1) | 7.0 | 7.2 | 19.2 | 19.9 | |||||||||||
| Less depreciation and amortization from discontinued operations(2) | — | — | — | (4.2 | ) | ||||||||||
| Operating income before depreciation and amortization ("EBITDA") | $ | 139.0 | $ | 161.5 | $ | 344.6 | $ | 438.5 | |||||||
| IAROC | 11.6 | 17.2 | 65.1 | 82.3 | |||||||||||
| Adjusted EBITDA | $ | 150.6 | $ | 178.7 | $ | 409.7 | $ | 520.8 | |||||||
Earnings (loss) per share from Continuing Operations | |||||||||||||||
| Net income from Continuing Operations | $ | 19.2 | $ | 30.9 | $ | 19.0 | $ | 56.2 | |||||||
| IAROC(3) | 10.3 | 16.0 | 54.3 | 75.1 | |||||||||||
| Adjusted net income from continuing operations | $ | 29.5 | $ | 46.9 | $ | 73.3 | $ | 131.3 | |||||||
| Net income available to holders of preferred shares | 7.7 | 10.0 | 26.4 | 29.4 | |||||||||||
| Adjusted net income from continuing operations available to holders of equity shares | $ | 21.8 | $ | 36.9 | $ | 46.9 | $ | 101.9 | |||||||
| Diluted average number of equity shares outstanding (in millions) | 131.5 | 130.9 | 131.3 | 132.1 | |||||||||||
| Earnings (loss) per share from continuing operations | |||||||||||||||
| Diluted | $ | 0.09 | $ | 0.16 | $ | (0.06 | ) | $ | 0.20 | ||||||
| Adjusted diluted | $ | 0.17 | $ | 0.28 | $ | 0.36 | $ | 0.77 | |||||||
Free Cash Flow | |||||||||||||||
| Cash provided by operating activities | $ | 51.2 | $ | 6.3 | $ | 205.8 | $ | 191.2 | |||||||
| Dividends on preferred shares | (9.7 | ) | (2.4 | ) | (33.6 | ) | (27.0 | ) | |||||||
| Additions to property, plant and equipment | (82.6 | ) | (88.5 | ) | (219.0 | ) | (216.9 | ) | |||||||
| Net proceeds from disposal of assets | 0.2 | 4.3 | 9.2 | 9.5 | |||||||||||
| Net proceeds from business disposals | 0.4 | 3.4 | 28.4 | 4.2 | |||||||||||
| Free cash flow (outflow) | $ | (40.5 | ) | $ | (76.9 | ) | $ | (9.2 | ) | $ | (39.0 | ) | |||
| Adjusted: Defined as before IAROC and before goodwill impairment charge | FIGURE 7 | |
| (1) | As reported in the Consolidated Statements of Cash Flows | |
| (2) | As reported in Note 4 "Discontinued Operations and Other Disposals" | |
| (3) | Net of income taxes of $1.3 million for the third quarter of 2006 ($10.8 million year-to-date) and $1.2 million for the third quarter of 2005 ($7.2 million year-to-date) | |
| Management's Discussion and Analysis |
23
Reconciliation of non GAAP measures
(In millions of US dollars, except per share data)
| | Nine-month period ended September 30 2006 | Twelve-month period ended December 31 2005 | ||||||
|---|---|---|---|---|---|---|---|---|
| Debt-to-capitalization | ||||||||
| Current portion of long-term debt | $ | 4.3 | $ | 7.7 | ||||
| Long-term debt | 2,017.3 | 1,731.9 | ||||||
| Convertible notes | 117.1 | 115.5 | ||||||
| Total debt | $ | 2,138.7 | $ | 1,855.1 | ||||
| Minority interest | 0.8 | 0.6 | ||||||
| Shareholders' equity | 2,034.8 | 2,250.6 | ||||||
| Capitalization | $ | 4,174.3 | $ | 4,106.3 | ||||
| Debt-to-capitalization | 51:49 | 45:55 | ||||||
Total Debt and Accounts Receivable Securitization | ||||||||
| Total debt | $ | 2,138.7 | $ | 1,855.1 | ||||
| Accounts receivable securitization | 553.0 | 692.8 | ||||||
| Total debt and accounts receivable securitization | $ | 2,691.7 | $ | 2,547.9 | ||||
| Minority interest | 0.8 | 0.6 | ||||||
| Shareholders' equity | 2,034.8 | 2,250.6 | ||||||
| Capitalization, including securitization | $ | 4,727.3 | $ | 4,799.1 | ||||
| Debt-to-capitalization, including securitization | 57:43 | 53:47 | ||||||
Coverage Ratios from Continuing Operations | ||||||||
| Adjusted EBITDA | $ | 409.7 | $ | 688.7 | ||||
| YTD December previous year | 688.7 | — | ||||||
| Nine-month period previous year | (520.8 | ) | — | |||||
| Adjusted EBITDA — Last 12 months | $ | 577.6 | $ | 688.7 | ||||
| Financial expenses | $ | 94.8 | $ | 119.0 | ||||
| YTD December previous year | 119.0 | — | ||||||
| Nine-month period previous year | (91.2 | ) | — | |||||
| Financial expenses adjusted — Last 12 months | $ | 122.6 | $ | 119.0 | ||||
| Interest coverage ratio (times) | 4.7 | 5.8 | ||||||
| Total debt | $ | 2,138.7 | $ | 1,855.1 | ||||
| Debt-to-Adjusted-EBITDA ratio (times) | 3.7 | 2.7 | ||||||
Book value per share | ||||||||
| Shareholders' equity | $ | 2,034.8 | $ | 2,250.6 | ||||
| Preferred shares | (326.4 | ) | (456.6 | ) | ||||
| $ | 1,708.4 | $ | 1,794.0 | |||||
| Ending number of equity shares (in millions) | 131.5 | 131.0 | ||||||
| Book value per share | $ | 12.99 | $ | 13.69 | ||||
FIGURE 7
| Management's Discussion and Analysis |
24
The Company's critical accounting estimates are discussed in its annual MD&A included in the 2005 Annual Report. The preparation of financial statements in conformity with Canadian GAAP requires management to make estimates and assumptions that affect the reported amounts of assets and liabilities and disclosure of contingent assets and liabilities at the date of the financial statements and the reported amounts of revenues and expenses during the reporting period. Management has not made any significant changes to the estimates and assumptions in the quarter ended September 30, 2006 with the exception of Pension and Postretirement benefits. Actual results could differ from those estimates.
PENSION AND POSTRETIREMENT BENEFITS
During the second quarter of 2006, the Company announced modifications to the defined benefit plans for certain employees in Canada and in the United States, and the creation of a defined contribution Group Registered Retirement Savings Plan ("Group RRSP") for employees in Canada.
As of October 1st, 2006, affected Canadian employees had the choice to adhere to the Group RRSP, or to continue to participate in the modified plan, while future employees automatically adhere to the new Group RRSP. A $3.8 million curtailment charge was recorded in relation to these changes in the third quarter of 2006.
For employees in the United States, a portion of the defined benefit plans was frozen on October 1st, 2006, and an improved defined contribution plan has been offered to employees. A $1.9 million curtailment gain was recorded in relation to these changes in the third quarter of 2006, and a total gain of $5.5 million for the first nine months of 2006.
FINANCIAL CONDITION, LIQUIDITY AND CAPITAL RESOURCES
One of the measures the Company uses to evaluate its liquidity is free cash flow as described in Figure 7. Free cash flow reflects cash flow available for business acquisitions, dividends on equity shares, repayments of long-term debt and repurchases of equity securities. Free cash flow for the third quarter of 2006 amounted to an outflow of $40.5 million, compared to an outflow of $76.9 million for the corresponding quarter of the previous year. On a year-to-date basis, free cash flow for 2006 amounted to an outflow of $9.2 million, compared to an outflow of $39.0 million for the same period of 2005. The year-over-year lower outflow is mainly attributable to higher cash flows provided by operating activities and higher proceeds from business disposals in the first nine months of 2006 compared to the same period in 2005.
OPERATING ACTIVITIES
The deficiency in working capital was $132.0 million as at September 30, 2006, compared to $92.0 million as at December 31, 2005. This decrease in working capital of $40.0 million was mainly due to an increase in trade payables and accrued liabilities, resulting from the timing of payments, that was partly offset by a decrease in net income taxes payable as well as an increase in inventories and in trade receivables. The Company generally maximizes the use of its accounts receivable securitization programs, since the cost of these programs is relatively low compared to other sources of funds. The amount of trade receivables under securitization varies from month to month, based principally on the previous month's balance (September securitization is based on outstanding receivables at the end of August).
FINANCING ACTIVITIES
The Company is subject to certain financial covenants in some of its major financing agreements. The key financial ratios are the interest coverage ratio, the debt-to-Adjusted-EBITDA ratio and the debt-to-capitalization ratio. As at September 30, 2006, the Company was in compliance with all significant debt covenants.
On November 7, 2006, the Company suspended the dividend on Multiple and Subordinate Voting Shares. This action was taken in light of the Company's current investment program in North America and Europe, and with a view to strengthening the Company's balance sheet.
On July 28th, 2006 Quebecor World entered into an agreement with Banc of America Leasing and Capital, L.L.C. and Citigroup Global Markets, Inc. to arrange a lease financing of printing presses and related equipment currently being installed in various facilities in North America. The Company has received committed offers from various institutions representing $70 million of equipment, for lease terms up to 7 years. The Company expects this transaction to be finalized during the fourth quarter.
The Company's Series 4 Redeemable First Preferred Shares were redeemable at the option of the Company on and after March 15, 2006. On April 18, 2006, in accordance with provisions applicable to these shares, the 8,000,000 shares were redeemed at Cdn$25.2185 per share. This price represents Cdn$25.00 per share (for a total amount of Cdn$200.0 million ($175.9 million)) plus accrued dividends of Cdn$0.2185, accruing as of and from March 1, 2006. These shares were redeemed using the Company's revolving bank facility.
The 7.20% Senior Notes for a principal amount of $250.0 million matured on March 28, 2006. On March 6, 2006, the Company issued at par $450.0 million aggregate principal amount of 8.75% Senior Notes due March 15, 2016. Net proceeds from the issuance of the 8.75% Senior Notes were approximately $442.2 million and were used to repay in full the 7.20% Senior Notes and for general corporate purposes, including the reduction of other indebtedness.
| Management's Discussion and Analysis |
25
On January 18, 2006, the Company announced that in light of the current capital spending program, the Board of Directors approved a reduction of the quarterly dividend on the Multiple Voting Shares and Subordinate Voting Shares to $0.10 per share from $0.14 per share. This will lower dividend payments by $21.0 million per year.
On January 16, 2006, the Company announced it had concluded an agreement with Société Générale for the Canadian dollar equivalent of a 136.2 million Euros long-term committed credit facility relating to purchases of MAN Roland presses as part of the North American retooling program. The unsecured facility will be drawn over two years and will be repaid over the next ten years. At September 30, 2006, the drawings under this facility amount to Cdn$118.0 million ($105.6 million), bearing interest at 4.60%.
The Company's normal course issuer bid expired on May 12, 2006. A total of 2,438,500 Subordinate Voting Shares were repurchased under this program and the Company did not repurchase any Subordinate Voting Shares after August 12, 2005.
Contractual Cash Obligations
($ millions)
| | Remainder of 2006 | 2007 | 2008 | 2009 | 2010 | 2011 and thereafter | ||||||||||||
|---|---|---|---|---|---|---|---|---|---|---|---|---|---|---|---|---|---|---|
| Long-term debt and convertible notes | $ | — | $ | 117.1 | $ | 215.9 | $ | 477.2 | $ | 187.4 | $ | 1,115.9 | ||||||
| Capital leases | 0.9 | 3.9 | 3.1 | 7.9 | 2.3 | 7.1 | ||||||||||||
| Operating leases | 46.7 | 67.6 | 42.3 | 27.4 | 16.9 | 68.9 | ||||||||||||
| Capital asset purchase commitments | 43.1 | 67.9 | — | — | — | — | ||||||||||||
| Total contractual cash obligations | $ | 90.7 | $ | 256.5 | $ | 261.3 | $ | 512.5 | $ | 206.6 | $ | 1,191.9 | ||||||
FIGURE 8
INVESTING ACTIVITIES
In the third quarter of 2006, the Company invested $82.6 million in capital projects compared to $88.5 million in 2005. On a year-to-date basis, $219.0 million has been invested in capital projects in 2006, compared to $216.9 million in 2005. Of that amount, approximately 76% (87% excluding building purchases) was for organic growth, including expenditures for new capacity requirements and productivity improvement. The remaining portion was spent on the maintenance of the Company's structure. In 2005, the organic growth spending amounted to 80%.
Key year-to-date expenditures included approximately $76.0 million in North America and $53.0 million in Europe, as part of the strategic retooling plans and a customer related project. The Company has also invested $28.0 million for building and land purchases in Recife, Brazil, Mexico DF, Mexico and in Olive Branch, Tennessee. Other notable projects relate to bindery equipment upgrades to improve North American efficiency.
To date, the Company has placed 20 firm orders for new presses intended for the North American platform, of which 19 presses are part of the U.S. strategic plan announced in 2004. The total commitment for these 20 presses with the press manufacturers amounted to $239.6 million, of which $176.3 million has already been disbursed. Of these presses, five became operational in 2005, four during the first half of 2006, four during the third quarter of 2006 and one early in the fourth quarter of 2006.
As part of the European strategic plan announced in 2005, the Company has placed a total of five firm orders for new presses. The total commitment for these presses with the press manufacturers amounted to $74.5 million, of which $59.5 million has already been disbursed. Of these presses, one became operational during the third quarter of 2006 and one early in the fourth quarter of 2006.
For the remainder of 2006, the Company projects capital expenditures of approximately $150.0 million. Expected sources of funds to meet capital expenditures are cash flows from operations, drawings on the Company's revolving bank facility and the equipment financing loan.
FINANCIAL POSITION
As at September 30, 2006, the debt level was at $2,138.7 million, a $283.6 million increase compared to December 31, 2005 mainly due to the redemption of the Series 4 Preferred Shares and lower securitization drawings. The debt-to-capitalization ratio was 51:49 as at September 30, 2006 compared to 45:55 at December 31, 2005 (Figure 7). Including accounts receivable securitization, total debt would be $2,691.7 million, $143.8 million higher than December 31, 2005. The debt-to-capitalization ratio, including accounts receivable securitization, was 57:43 as at September 30, 2006, compared to 53:47 at 2005 year-end.
| Management's Discussion and Analysis |
26
The Company has no major operating leases expiring in 2006 where it would otherwise pay to purchase the underlying equipment (presses and binders). Historically, the Company has acquired most of the equipment under leases when it is used for production. The total terminal value of these leases expiring after 2006 is approximately $100.8 million, of which $52.2 million is guaranteed.
The minimum legal requirement for pension contributions is $82.5 million in 2006, of which $77.0 million has been paid as of September 30, 2006 (total annual contributions for 2005 were $51.0 million).
As at November 7, 2006, the following credit ratings applied to the senior unsecured debt of the Company:
| Rating Agency | Rating | |
|---|---|---|
| Moody's Investors Service | B1 | |
| Standard and Poor's | B+ | |
| Dominion Bond Rating Service Limited | BB | |
On August 9, 2006, Dominion Bond Rating Service Limited lowered the credit rating from BB (high) to BB. On September 28, 2006, Standard & Poor's lowered the credit rating from BB- to B+. On October 18, 2006, Moody's Investors Service reinstated the corporate rating to Quebecor World Inc. from Quebecor World (USA) Inc. and lowered the credit rating from Ba3 to B1. It is expected that the Company's future borrowing costs may increase as a result of these rating changes.
The Company believes that its liquidity, capital resources and cash flows from operations are sufficient to fund planned capital expenditures, working capital requirements, pension contributions, interest and principal payment obligations for the foreseeable future.
IMPAIRMENT OF ASSETS AND RESTRUCTURING INITIATIVES
As part of the Company's plan to improve its performance, restructuring initiatives are undertaken to review operations in order to ensure facilities are producing optimal pressroom efficiencies and higher returns. Restructuring costs relate largely to plant closures, workforce reductions, and the continuation of prior years' initiatives. A complete description of these initiatives is given in the Notes to the Consolidated Financial Statements at September 30, 2006.
The 2006 restructuring initiatives affected 1,948 employees in total, of which 1,247 jobs have been eliminated as of September 30, 2006 and 701 are still to come. However, the Company estimated that 292 new jobs would be created in other facilities. The execution of prior years' initiatives resulted in the elimination of 210 jobs for the first nine months of 2006 and 63 are still to come.
As at September 30, 2006, the balance of the restructuring reserve was $43.4 million. The cash disbursements related to this reserve are expected to be $27.2 million for the remainder of 2006.
On October 12, 2006, the Company announced to its employees its intention to close its rotogravure facility in Lille, France as part of its ongoing restructuring efforts. The Lille facility will be phased out during the coming months and is expected to close at the end of the second quarter of 2007. The closure will affect approximately 230 employee positions, some of which will have the opportunity to transfer to the Charleroi, Belgium facility. Taking into account earlier restructuring initiatives and the investment in the latest wide-web gravure technology in Charleroi, the Company estimates the impact to its European gravure capacity is essentially neutral.
| Management's Discussion and Analysis |
27
DERIVATIVE FINANCIAL INSTRUMENTS
The Company uses a number of derivative financial instruments to manage its exposure to fluctuations in foreign exchange, interest rates, and commodity prices. The MD&A included in the Company's 2005 Annual Report contains a complete description of these derivative financial instruments.
The estimated fair value of derivative financial instruments as at September 30, 2006 is detailed in Figure 9.
Fair Value of Derivative Financial Instruments
($ millions)
(Continuing Operations)
| | September 30, 2006 | December 31, 2005 | ||||||||||||
|---|---|---|---|---|---|---|---|---|---|---|---|---|---|---|
| | Book Value | Fair Value | Book Value | Fair Value | ||||||||||
| Derivative financial instruments | ||||||||||||||
| Interest rate swap agreements | $ | — | $ | (9.1 | ) | $ | — | $ | (10.4 | ) | ||||
| Foreign exchange forward contracts | (5.1 | ) | (0.8 | ) | 4.7 | 15.5 | ||||||||
| Cross currency interest rate swaps | — | — | 3.6 | 3.6 | ||||||||||
| Commodity swaps | (2.0 | ) | (16.2 | ) | (0.1 | ) | (0.5 | ) | ||||||
FIGURE 9
OFF-BALANCE SHEET ARRANGEMENTS
The Company is party to various off-balance sheet arrangements. The MD&A included in the Company's 2005 Annual Report contains a complete description of these arrangements.
ASSET SECURITIZATION
As at September 30, 2006, the amounts outstanding under the Canadian, U.S. and European securitization programs were Cdn$68.0 million, $377.0 million and 90.8 million Euro, respectively (Cdn$70.0 million, $417.0 million and 114.2 million Euro, as at September 30, 2005). The Company had a retained interest in the trade receivables sold of $129.9 million, which is recorded in the Company's trade receivables. As at September 30, 2006, an aggregate amount of $682.9 million ($745.4 million in 2005) of accounts receivable had been sold under the three programs. Consistent with its U.S. securitization agreement, the Company sells all of its U.S. receivables to a wholly-owned subsidiary, Quebecor World Finance Inc., through a true-sale transaction.
The Company is in compliance with all its covenants under the agreements governing its securitization programs as of September 30, 2006.
On October 20, 2006, the Company amended and extended the availability of its U.S. securitization program for a 3-year period through to August 28, 2009, increasing the liquidity horizon of the program. The program has been reduced to $408.0 million to take into account the sale of its North American non-core printing facilities in the second half of 2005. The program also has a seasonal peak limit of $459.0 million to permit greater utilization during peak volume periods of the year.
On July 31, 2006, the Company amended and extended its European securitization program for a 3-year period through May 29, 2009, increasing the liquidity horizon of the program.
RELATED PARTY TRANSACTIONS
The Company entered into transactions with Quebecor Inc. ("QI"), a related party, and other subsidiaries of QI, which were accounted for at prices and conditions prevailing in the market. Intercompany revenues from QI's media subsidiaries mostly involved magazine printing services.
Related Party Transactions
($ millions)
| | Three months | Nine months | ||||||||||
|---|---|---|---|---|---|---|---|---|---|---|---|---|
| Periods ended September 30 | 2006 | 2005 | 2006 | 2005 | ||||||||
| Revenues | $ | 17.0 | $ | 16.3 | $ | 49.8 | $ | 44.1 | ||||
| Purchases | 1.9 | 1.1 | 4.6 | 3.3 | ||||||||
| Management fees billed by Quebecor Inc. | 1.2 | 1.1 | 3.6 | 3.3 | ||||||||
| IT services billed by Videotron Ltd. (net of incurred expenses billed to Videotron Ltd. of $0.4 million for the third quarter of 2006 ($1.6 million year-to-date) and $1.0 million for the third quarter of 2005 ($2.8 million year-to-date)) | 1.3 | 3.0 | 6.4 | 8.4 | ||||||||
FIGURE 10
| Management's Discussion and Analysis |
28
OUTSTANDING SHARE DATA
The following figure discloses the Company's outstanding share data as at October 20, 2006:
Outstanding Share Data
($ millions and thousands of shares)
| | October 20, 2006 | ||||
|---|---|---|---|---|---|
| | Issued and outstanding shares | Book value | |||
| Multiple Voting Shares | 46,987 | $ | 93.5 | ||
| Subordinate Voting Shares | 84,611 | 1,145.3 | |||
| First Preferred Shares, Series 3 | 12,000 | 212.5 | |||
| First Preferred Shares, Series 5 | 7,000 | 113.9 | |||
FIGURE 11
ACCOUNTING POLICIES
The interim consolidated financial statements at September 30, 2006 have been prepared using the same accounting policies as described in the Company's Consolidated Financial Statements included in the 2005 Annual Report.
2006 AUDITED CONSOLIDATED FINANCIAL STATEMENTS
The Company announces that it expects to release its audited consolidated financial statements, press release and MD&A for the 2006 financial year in late March 2007. Exceptionally for the 2006 financial year, these documents will be released later than usual to complete, for the first time, the assessment of internal control over financial reporting as required under section 404 of the U.S. Sarbanes-Oxley Act of 2002, and thereafter the required reports of the Company's auditors on such assessment and the annual financial statements.
ADDITIONAL INFORMATION
Additional information relating to Quebecor World, including its most recent annual information form, is available on the Company's website atwww.quebecorworld.com, on SEDAR atwww.sedar.com and on EDGAR atwww.sec.gov.
Montreal, Canada
November 7, 2006
| Management's Discussion and Analysis |
29

CONSOLIDATED FINANCIAL STATEMENTS
THIRD QUARTER ENDED SEPTEMBER 30, 2006
Consolidated Statements of Income and Retained Earnings
Periods ended September 30
(In millions of US dollars, except per share amounts)
(Unaudited)
| | | Three months | Nine months | ||||||||||||||
|---|---|---|---|---|---|---|---|---|---|---|---|---|---|---|---|---|---|
| | Note | 2006 | 2005 | 2006 | 2005 | ||||||||||||
| Revenues | $ | 1,546.2 | $ | 1,577.2 | $ | 4,465.9 | $ | 4,619.3 | |||||||||
| Operating expenses: | |||||||||||||||||
| Cost of sales | 1,295.9 | 1,304.5 | 3,759.2 | 3,808.1 | |||||||||||||
| Selling, general and administrative | 98.5 | 95.4 | 293.4 | 293.9 | |||||||||||||
| Securitization fees | 8.1 | 5.7 | 22.6 | 16.1 | |||||||||||||
| Depreciation and amortization | 76.4 | 74.4 | 223.4 | 231.0 | |||||||||||||
| Impairment of assets, restructuring and other charges | 2 | 11.6 | 17.2 | 65.1 | 82.3 | ||||||||||||
| 1,490.5 | 1,497.2 | 4,363.7 | 4,431.4 | ||||||||||||||
| Operating income | 55.7 | 80.0 | 102.2 | 187.9 | |||||||||||||
| Financial expenses | 3 | 33.7 | 31.0 | 94.8 | 91.2 | ||||||||||||
| Income from continuing operations before income taxes | 22.0 | 49.0 | 7.4 | 96.7 | |||||||||||||
| Income taxes (recovery) | 2.7 | 18.2 | (12.0 | ) | 40.8 | ||||||||||||
| Income from continuing operations before minority interest | 19.3 | 30.8 | 19.4 | 55.9 | |||||||||||||
| Minority interest | 0.1 | (0.1 | ) | 0.4 | (0.3 | ) | |||||||||||
| Net income from continuing operations | 19.2 | 30.9 | 19.0 | 56.2 | |||||||||||||
| Loss from discontinued operations (net of tax) | 4 | (0.3 | ) | (1.2 | ) | (2.1 | ) | (8.2 | ) | ||||||||
| Net income | $ | 18.9 | $ | 29.7 | $ | 16.9 | $ | 48.0 | |||||||||
| Net income available to holders of preferred shares | 7.7 | 10.0 | 26.4 | 29.4 | |||||||||||||
| Net income (loss) available to holders of equity shares | $ | 11.2 | $ | 19.7 | $ | (9.5 | ) | $ | 18.6 | ||||||||
| Earnings (loss) per share: | 5 | ||||||||||||||||
| Basic and Diluted: | |||||||||||||||||
| Continuing operations | $ | 0.09 | $ | 0.16 | $ | (0.06 | ) | $ | 0.20 | ||||||||
| Discontinued operations | — | (0.01 | ) | (0.01 | ) | (0.06 | ) | ||||||||||
| $ | 0.09 | $ | 0.15 | $ | (0.07 | ) | $ | 0.14 | |||||||||
| Weighted average number of equity shares outstanding: | 5 | ||||||||||||||||
| (in millions) | |||||||||||||||||
| Basic and Diluted | 131.5 | 130.9 | 131.3 | 132.1 | |||||||||||||
| Retained earnings: | |||||||||||||||||
| Balance, beginning of period | $ | 428.4 | $ | 713.4 | $ | 475.6 | $ | 761.0 | |||||||||
| Net income | 18.9 | 29.7 | 16.9 | 48.0 | |||||||||||||
| Shares repurchased | — | (0.4 | ) | — | (9.8 | ) | |||||||||||
| Dividends: | |||||||||||||||||
| Equity shares | (13.3 | ) | (18.0 | ) | (39.8 | ) | (55.1 | ) | |||||||||
| Preferred shares | (7.7 | ) | (10.0 | ) | (26.4 | ) | (29.4 | ) | |||||||||
| Balance, end of period | $ | 426.3 | $ | 714.7 | $ | 426.3 | $ | 714.7 | |||||||||
See Notes to Consolidated Financial Statements.
![]()
31
Consolidated Statements of Cash Flows
Periods ended September 30
(In millions of US dollars)
(Unaudited)
| | | Three months | Nine months | ||||||||||||||
|---|---|---|---|---|---|---|---|---|---|---|---|---|---|---|---|---|---|
| | Note | 2006 | 2005 | 2006 | 2005 | ||||||||||||
| Operating activities: | |||||||||||||||||
| Net income | $ | 18.9 | $ | 29.7 | $ | 16.9 | $ | 48.0 | |||||||||
| Non-cash items in net income: | |||||||||||||||||
| Depreciation of property, plant and equipment | 76.3 | 74.3 | 223.2 | 234.9 | |||||||||||||
| Impairment of assets and non-cash portion of restructuring and other charges | 2 | — | 7.7 | 9.8 | 48.7 | ||||||||||||
| Future income taxes | (9.5 | ) | 12.0 | (11.6 | ) | 10.9 | |||||||||||
| Amortization of deferred charges | 7.0 | 7.2 | 19.2 | 19.9 | |||||||||||||
| Loss on business disposals | 4 | — | 3.8 | 3.8 | 7.1 | ||||||||||||
| Other | 3.5 | (1.5 | ) | 8.7 | 3.8 | ||||||||||||
| Changes in non-cash balances related to operations: | |||||||||||||||||
| Trade receivables | (66.8 | ) | (82.5 | ) | (67.6 | ) | (71.7 | ) | |||||||||
| Inventories | (52.0 | ) | (62.2 | ) | (53.1 | ) | (50.0 | ) | |||||||||
| Trade payables and accrued liabilities | 86.6 | 26.2 | 196.5 | (23.2 | ) | ||||||||||||
| Other current assets and liabilities | 17.1 | (2.5 | ) | (59.3 | ) | (36.8 | ) | ||||||||||
| Other non-current assets and liabilities | (29.9 | ) | (5.9 | ) | (80.7 | ) | (0.4 | ) | |||||||||
| (45.0 | ) | (126.9 | ) | (64.2 | ) | (182.1 | ) | ||||||||||
| Cash provided by operating activities | 51.2 | 6.3 | 205.8 | 191.2 | |||||||||||||
Financing activities: | |||||||||||||||||
| Net change in bank indebtedness | — | (0.2 | ) | — | — | ||||||||||||
| Net proceeds from issuance of equity shares | 9 | 1.6 | 2.3 | 5.5 | 14.1 | ||||||||||||
| Repurchases of preferred shares | 9 | — | — | (175.9 | ) | — | |||||||||||
| Repurchases of equity shares | — | (2.1 | ) | — | (46.6 | ) | |||||||||||
| Issuance of long-term debt, net of issuance costs | 7 | (0.6 | ) | — | 540.4 | — | |||||||||||
| Repayments of long-term debt | (2.5 | ) | (2.4 | ) | (257.3 | ) | (8.5 | ) | |||||||||
| Net borrowings (repayments) under revolving bank facility | 62.9 | 89.0 | (25.2 | ) | 50.7 | ||||||||||||
| Dividends on equity shares | (13.3 | ) | (18.0 | ) | (39.8 | ) | (55.1 | ) | |||||||||
| Dividends on preferred shares | (9.7 | ) | (2.4 | ) | (33.6 | ) | (27.0 | ) | |||||||||
| Cash provided by (used in) financing activities | 38.4 | 66.2 | 14.1 | (72.4 | ) | ||||||||||||
Investing activities: | |||||||||||||||||
| Business acquisitions, net of cash and cash equivalents | — | (0.6 | ) | (0.1 | ) | (7.0 | ) | ||||||||||
| Net proceeds from business disposals, net of cash and cash equivalents | 4 | 0.4 | 3.4 | 28.4 | 4.2 | ||||||||||||
| Additions to property, plant and equipment | (82.6 | ) | (88.5 | ) | (219.0 | ) | (216.9 | ) | |||||||||
| Net proceeds from disposal of assets | 0.2 | 4.3 | 9.2 | 9.5 | |||||||||||||
| Net proceeds from disposal of derivative financial instruments | — | — | — | 69.2 | |||||||||||||
| Restricted cash | (5.0 | ) | — | (15.0 | ) | (26.1 | ) | ||||||||||
| Cash used in investing activities | (87.0 | ) | (81.4 | ) | (196.5 | ) | (167.1 | ) | |||||||||
| Effect of foreign currency | (3.6 | ) | (7.6 | ) | (16.7 | ) | 17.6 | ||||||||||
| Net increase (decrease) in cash and cash equivalents | (1.0 | ) | (16.5 | ) | 6.7 | (30.7 | ) | ||||||||||
| Cash and cash equivalents, beginning of period | 26.0 | 37.6 | 18.3 | 51.8 | |||||||||||||
| Cash and cash equivalents, end of period | $ | 25.0 | $ | 21.1 | $ | 25.0 | $ | 21.1 | |||||||||
Supplemental cash flow information: | |||||||||||||||||
| Interest paid | $ | 48.8 | $ | 33.5 | $ | 104.6 | $ | 90.3 | |||||||||
| Income taxes paid | 6.3 | 9.0 | 54.3 | 50.9 | |||||||||||||
See Notes to Consolidated Financial Statements.
![]()
32
Consolidated Balance Sheets
(In millions of US dollars)
| | Note | September 30 2006 | December 31 2005 | |||||||
|---|---|---|---|---|---|---|---|---|---|---|
| | | (Unaudited) | (Audited) | |||||||
| Assets | ||||||||||
| Current assets: | ||||||||||
| Cash and cash equivalents | $ | 25.0 | $ | 18.3 | ||||||
| Trade receivables | 470.4 | 429.9 | ||||||||
| Receivables from related parties | 14.5 | 14.3 | ||||||||
| Inventories | 422.4 | 364.4 | ||||||||
| Income taxes receivable | 26.6 | 3.0 | ||||||||
| Future income taxes | 38.2 | 34.4 | ||||||||
| Prepaid expenses | 24.8 | 22.1 | ||||||||
| Total current assets | 1,021.9 | 886.4 | ||||||||
Property, plant and equipment, net | 2,327.2 | 2,295.9 | ||||||||
| Goodwill | 6 | 2,317.2 | 2,305.7 | |||||||
| Restricted cash | 48.1 | 33.1 | ||||||||
| Other assets | 210.2 | 187.7 | ||||||||
| Total assets | $ | 5,924.6 | $ | 5,708.8 | ||||||
Liabilities and Shareholders' Equity | ||||||||||
| Current liabilities: | ||||||||||
| Trade payables and accrued liabilities | $ | 1,089.6 | $ | 876.1 | ||||||
| Payables to related parties | 3.0 | 8.4 | ||||||||
| Income and other taxes payable | 54.7 | 84.5 | ||||||||
| Future income taxes | 2.3 | 1.7 | ||||||||
| Current portion of long-term debt | 7 | 4.3 | 7.7 | |||||||
| Total current liabilities | 1,153.9 | 978.4 | ||||||||
Long-term debt | 7 | 2,017.3 | 1,731.9 | |||||||
| Other liabilities | 232.2 | 259.3 | ||||||||
| Future income taxes | 368.5 | 372.5 | ||||||||
| Convertible notes | 117.1 | 115.5 | ||||||||
| Minority interest | 0.8 | 0.6 | ||||||||
Shareholders' equity: | ||||||||||
| Capital stock | 9 | 1,563.9 | 1,688.6 | |||||||
| Additional paid-in capital | 113.7 | 110.6 | ||||||||
| Retained earnings | 426.3 | 475.6 | ||||||||
| Translation adjustment | 10 | (69.1 | ) | (24.2 | ) | |||||
| 2,034.8 | 2,250.6 | |||||||||
Total liabilities and shareholders' equity | $ | 5,924.6 | $ | 5,708.8 | ||||||
See Notes to Consolidated Financial Statements.
![]()
33
Notes to Consolidated Financial Statements
Periods ended September 30, 2006 and 2005
(Tabular amounts are expressed in millions of US dollars, except per share amounts)
(Unaudited)
1. BASIS OF PRESENTATION
The consolidated financial statements included in this report are unaudited and reflect normal and recurring adjustments which are, in the opinion of the Company, considered necessary for a fair presentation. These consolidated financial statements have been prepared in conformity with Canadian generally accepted accounting principles ("Canadian GAAP"). The same accounting policies as described in the Company's latest Annual Report have been used. However, these consolidated financial statements do not include all disclosures required under Canadian GAAP and, accordingly, should be read in conjunction with the consolidated financial statements and the notes thereto included in the Company's latest Annual Report.
Seasonality
The operations of the Company's business are seasonal, with the majority of historical operating income recognized in the second half of the fiscal year, primarily as a result of the higher number of magazine pages, new product launches and back-to-school, retail and holiday catalog promotions. Within any year, the seasonality could adversely affect the Company's cash flow and results of operations.
Comparative figures
Certain comparative figures have been restated to conform to the presentation of the current period.
2. IMPAIRMENT OF ASSETS, RESTRUCTURING AND OTHER CHARGES
During the third quarter of 2006, the Company recorded restructuring charges of $11.6 million, which were only composed of cash items. For the nine-month period ended September 30, 2006, the Company recorded impairment of assets and restructuring charges of $65.1 million, composed of non-cash items of $9.8 million and cash items of $55.3 million.
The following tables set forth the segmented information and the category of charges:
| 2006 Third Quarter | Workforce reduction costs | Leases, closed facilities carrying costs and other | Total restructuring charges | Impairment of assets and pension curtailments | Total impairment of assets, restructuring and other charges | ||||||||||||||
|---|---|---|---|---|---|---|---|---|---|---|---|---|---|---|---|---|---|---|---|
| North America | $ | 0.7 | $ | 2.6 | $ | 3.3 | $ | — | $ | 3.3 | |||||||||
| Europe | 4.6 | 3.1 | 7.7 | — | 7.7 | ||||||||||||||
| Latin America | 0.6 | — | 0.6 | — | 0.6 | ||||||||||||||
| Continuing Operations | $ | 5.9 | $ | 5.7 | $ | 11.6 | $ | — | $ | 11.6 | |||||||||
| 2005 Third Quarter | Workforce reduction costs | Leases, closed facilities carrying costs and other | Total restructuring charges | Impairment of assets, accelerated depreciation and pension curtailments | Total impairment of assets, restructuring and other charges | ||||||||||||||
|---|---|---|---|---|---|---|---|---|---|---|---|---|---|---|---|---|---|---|---|
| North America | $ | 0.7 | $ | 1.2 | $ | 1.9 | $ | 1.4 | $ | 3.3 | |||||||||
| Europe | 6.1 | 1.3 | 7.4 | 6.3 | 13.7 | ||||||||||||||
| Latin America | 0.2 | — | 0.2 | — | 0.2 | ||||||||||||||
| Continuing Operations | $ | 7.0 | $ | 2.5 | $ | 9.5 | $ | 7.7 | $ | 17.2 | |||||||||
34
Notes to Consolidated Financial Statements
2. IMPAIRMENT OF ASSETS, RESTRUCTURING AND OTHER CHARGES (CONT'D)
| 2006 YTD | Workforce reduction costs | Leases, closed facilities carrying costs and other | Total restructuring charges | Impairment of assets and pension curtailments | Total impairment of assets, restructuring and other charges | ||||||||||||||
|---|---|---|---|---|---|---|---|---|---|---|---|---|---|---|---|---|---|---|---|
| North America | $ | 17.5 | $ | 4.5 | $ | 22.0 | $ | 7.4 | $ | 29.4 | |||||||||
| Europe | 25.2 | 7.4 | 32.6 | 1.9 | 34.5 | ||||||||||||||
| Latin America | 0.7 | — | 0.7 | 0.5 | 1.2 | ||||||||||||||
| Continuing Operations | $ | 43.4 | $ | 11.9 | $ | 55.3 | $ | 9.8 | $ | 65.1 | |||||||||
| 2005 YTD | Workforce reduction costs | Leases, closed facilities carrying costs and other | Total restructuring charges | Impairment of assets, accelerated depreciation and pension curtailments | Total impairment of assets, restructuring and other charges | ||||||||||||||
|---|---|---|---|---|---|---|---|---|---|---|---|---|---|---|---|---|---|---|---|
| North America | $ | 12.8 | $ | 3.9 | $ | 16.7 | $ | 6.9 | $ | 23.6 | |||||||||
| Europe | 13.4 | 7.0 | 20.4 | 41.5 | 61.9 | ||||||||||||||
| Latin America | 0.3 | 0.1 | 0.4 | 0.3 | 0.7 | ||||||||||||||
| $ | 26.5 | $ | 11.0 | $ | 37.5 | $ | 48.7 | $ | 86.2 | ||||||||||
| Discontinued Operations | $ | 3.8 | $ | 0.1 | $ | 3.9 | $ | — | $ | 3.9 | |||||||||
| Continuing Operations | 22.7 | 10.9 | 33.6 | 48.7 | 82.3 | ||||||||||||||
| $ | 26.5 | $ | 11.0 | $ | 37.5 | $ | 48.7 | $ | 86.2 | ||||||||||
Impairment of long-lived assets
The Company performed a review of its long-lived assets. Following impairment tests on various specific units, the Company concluded that no assets were impaired, and did not record impairment of long-lived assets during the third quarter. For the nine-month period ended September 30, 2006, the Company recorded impairments of long-lived assets, mainly in Europe and North America, totalling $7.9 million.
2006 Restructuring initiatives
During the third quarter of 2006, the Company continued its restructuring initiatives and approved workforce reductions across the Company. The cash costs of these initiatives were estimated at $5.8 million and were recorded during the third quarter. The Company also recorded $2.5 million related to first and second quarter initiatives.
During the second quarter of 2006, the Company approved the closure of the Kingsport, Tennessee facility in the Book and Directory group, the closure of the Red Bank, Ohio facility in the Magazine group, the closure of the Strasbourg facility in France and other workforce reductions across the Company. The cash costs of these initiatives were estimated at $30.1 million, of which $21.6 million were recorded during the second quarter. The non-cash costs of these initiatives for the pension curtailment and settlement of one of the Company's American pension plans were estimated at $13.1 million, of which $1.9 million was recorded during the second quarter. In the second quarter, the Company also recorded $2.4 million related to first quarter initiatives.
During the first quarter of 2006, the Company approved the closure of the Brookfield, Wisconsin facility in the Magazine group and other workforce reductions mainly in North America. The cash costs of these initiatives were estimated at $13.3 million, of which $10.2 million were recorded during the first quarter.
Prior years' restructuring initiatives
During the third quarter of 2006, the Company recorded $1.3 million, resulting from the continuation of the 2005 and 2004 initiatives and a net overspending of $1.0 million for prior year's initiatives. These charges, mainly incurred in Europe, were related to the downsizing of the operations in Helio Corbeil, France, and to leasing and facility costs in Sweden and the United Kingdom. The Company also recorded $1.0 million for the pension obligation related to the Effingham, Illinois, multiemployer benefit plan.
For the nine-month period ended September 30, 2006, the Company recorded $11.1 million, resulting from the continuation of the 2005 and 2004 initiatives and a net overspending of $1.7 million for prior years' initiatives. These charges, mainly incurred in Europe, were related to further headcount reductions and facility costs in Corby, United Kingdom, the downsizing of the operations in Helio Corbeil, France, and to leasing and facility costs in Sweden.
35
Notes to Consolidated Financial Statements
2. IMPAIRMENT OF ASSETS, RESTRUCTURING AND OTHER CHARGES (CONT'D)
Continuity of the reserve for restructuring and other charges
As at January 1, 2006, the balance of the restructuring reserve and other charges was $27.9 million. This amount related mostly to workforce reduction across the platform and leases and closed facilities carrying costs. The Company utilized $40.9 million of the current and prior years' restructuring and other charges reserves during the nine-month period ended September 30, 2006.
The following table sets forth the Company's 2006 restructuring reserve and other charges and activities against the reserve carried forward from 2005:
| | | | September 30, | ||||||||||
|---|---|---|---|---|---|---|---|---|---|---|---|---|---|
| | Workforce reduction costs | Leases, closed facilities carrying costs and other | |||||||||||
| | 2006 | 2005 | |||||||||||
| Balance, beginning of the year | $ | 15.3 | $ | 12.6 | $ | 27.9 | $ | 35.2 | |||||
| Overspending on prior years' initiatives | | | 1.4 | | | 1.5 | | | 2.9 | | | 2.2 | |
| Reversal of previous years' reserves | (1.1 | ) | (0.1 | ) | (1.2 | ) | (3.5 | ) | |||||
| 2005 & 2004 initiatives | 6.0 | 5.1 | 11.1 | 38.8 | |||||||||
| 2006 initiatives | 37.1 | 5.4 | 42.5 | — | |||||||||
| | | | 43.4 | | | 11.9 | | | 55.3 | | | 37.5 | |
| Reserve utilized during the nine-month period ended September 30 | (25.4 | ) | (15.5 | ) | (40.9 | ) | (40.5 | ) | |||||
| Foreign currency changes | 0.6 | 0.5 | 1.1 | (1.3 | ) | ||||||||
| Balance, end of period | $ | 33.9 | $ | 9.5 | $ | 43.4 | $ | 30.9 | |||||
Cash disbursement related to this reserve is expected to be as follows:
| | Workforce reduction costs | Leases, closed facilities carrying costs and other | Total | ||||||
|---|---|---|---|---|---|---|---|---|---|
| Remainder of 2006 | $ | 24.2 | $ | 3.0 | $ | 27.2 | |||
| 2007 | 8.8 | 3.0 | 11.8 | ||||||
| 2008 | 0.9 | 2.0 | 2.9 | ||||||
| 2009 | — | 1.1 | 1.1 | ||||||
| 2010 and thereafter | — | 0.4 | 0.4 | ||||||
| $ | 33.9 | $ | 9.5 | $ | 43.4 | ||||
Additional restructuring charges
In addition to the $43.4 million already recorded, $23.4 million of restructuring charges related to the above initiatives remain to be recorded mainly in 2006 when the liabilities related to the initiatives will have been contracted.
36
Notes to Consolidated Financial Statements
3. FINANCIAL EXPENSES
| | | Three months | Nine months | ||||||||||||
|---|---|---|---|---|---|---|---|---|---|---|---|---|---|---|---|
| | Note | 2006 | 2005 | 2006 | 2005 | ||||||||||
| Interest on long-term debt and convertible notes | $ | 39.4 | $ | 30.0 | $ | 110.9 | $ | 88.0 | |||||||
| Bank and other charges | 1.8 | 1.0 | 3.0 | 2.5 | |||||||||||
| Amortization of deferred financing costs | 0.7 | 0.4 | 2.1 | 1.4 | |||||||||||
| Exchange losses (gains) | 6.3 | 1.9 | (30.0 | ) | 44.7 | ||||||||||
| Exchange loss from reduction of net investments in self-sustaining foreign operations | 10 | — | — | 2.5 | — | ||||||||||
| Derivative financial instruments | (10.0 | ) | (0.7 | ) | 19.0 | (42.2 | ) | ||||||||
| 38.2 | 32.6 | 107.5 | 94.4 | ||||||||||||
| Interest capitalized to the cost of equipment | (4.5 | ) | (1.1 | ) | (12.5 | ) | (2.7 | ) | |||||||
| $ | 33.7 | $ | 31.5 | $ | 95.0 | $ | 91.7 | ||||||||
| Portion included in discontinued operations | 4 | — | 0.5 | 0.2 | 0.5 | ||||||||||
| $ | 33.7 | $ | 31.0 | $ | 94.8 | $ | 91.2 | ||||||||
4. DISCONTINUED OPERATIONS AND OTHER DISPOSALS
- (a)
- Discontinued Operations
On May 10, 2005, the Company announced its intention to divest its North American non-core Commercial Printing Group (the "non-core Group"), one of the largest providers of general, financial, packaging and commercial specialty printing services throughout the United States, Canada, and Mexico. During the second half of 2005, the Company completed the disposal of all the operating assets of its non-core Group. Consequently, the operating results related to these activities have been presented separately in the Company's consolidated statement of income as discontinued operations.
In January 2006, the Company received a cash consideration of $17.4 million for the balance of the sale price from the disposal of a Canadian subsidiary, which had occurred in December 2005.
In March 2006, the Company received a cash consideration of $8.5 million for the balance of the sale price from the disposal of operating assets in the United States, which occurred in November 2005, and paid $1.2 million in connection with a sale price adjustment based on the closing working capital. The Company realized a loss of $1.6 million in the first quarter of 2006.
In March 2006, the Company paid a cash consideration of $2.5 million in connection with a sale price adjustment based on the closing working capital from the sale of some operating assets in Canada which had occurred in November 2005. No gain or loss resulted from these adjustments.
37
Notes to Consolidated Financial Statements
4. DISCONTINUED OPERATIONS AND OTHER DISPOSALS (CONT'D)
(a) Discontinued Operations (cont'd)Summarized financial information for the discontinued operations is as follows:
| | | Three months | Nine months | ||||||||||||
|---|---|---|---|---|---|---|---|---|---|---|---|---|---|---|---|
| | Note | 2006 | 2005 | 2006 | 2005 | ||||||||||
| Revenues | $ | — | $ | 52.2 | $ | — | $ | 185.4 | |||||||
| Cost of sales and selling, general and administrative expenses | 0.4 | 51.4 | 1.5 | 182.1 | |||||||||||
| Depreciation and amortization | — | — | — | 4.2 | |||||||||||
| Restructuring and other charges | — | — | — | 3.9 | |||||||||||
| Loss on disposal of business units | — | 1.2 | 1.6 | 7.1 | |||||||||||
| Operating loss | (0.4 | ) | (0.4 | ) | (3.1 | ) | (11.9 | ) | |||||||
| Financial expenses | 3 | — | 0.5 | 0.2 | 0.5 | ||||||||||
| Loss before income taxes | (0.4 | ) | (0.9 | ) | (3.3 | ) | (12.4 | ) | |||||||
| Income taxes (recovery) | (0.1 | ) | 0.3 | (1.2 | ) | (4.2 | ) | ||||||||
| Net loss from discontinued operations | $ | (0.3 | ) | $ | (1.2 | ) | $ | (2.1 | ) | $ | (8.2 | ) | |||
- (b)
- Other Disposals
In March 2006, the Company sold its investment in a facility in its French operations for a cash consideration of 1 Euro (an outflow of $0.6 million, net of cash and cash equivalents), resulting in a loss on disposal of $0.2 million, which was recorded in selling, general and administrative expenses. The Company also sold the operating assets of a facility in its North American operations for a consideration of $1.2 million, of which $0.1 million was outstanding at the end of the quarter. The Company realized a loss on disposal of $2.0 million, which was recorded in selling, general and administrative expenses.
In January 2006, the Company sold its investment in a facility in its French operations for a cash consideration of $3.0 million ($5.7 million, net of cash and cash equivalents). No gain or loss was recognized on that transaction during the period.
38
Notes to Consolidated Financial Statements
5. EARNINGS (LOSS) PER SHARE
The following table sets forth the computation of basic and diluted earnings (loss) per share from continuing operations:
| | Three months | Nine months | |||||||||||
|---|---|---|---|---|---|---|---|---|---|---|---|---|---|
| | 2006 | 2005 | 2006 | 2005 | |||||||||
| Net income from continuing operations | $ | 19.2 | $ | 30.9 | $ | 19.0 | $ | 56.2 | |||||
| Net income available to holders of preferred shares | 7.7 | 10.0 | 26.4 | 29.4 | |||||||||
| Net income (loss) from continuing operations available to holders of equity shares | $ | 11.5 | $ | 20.9 | $ | (7.4 | ) | $ | 26.8 | ||||
(In millions) | |||||||||||||
| Weighted-average number of equity shares outstanding: | |||||||||||||
| Basic and Diluted | 131.5 | 130.9 | 131.3 | 132.1 | |||||||||
| Earnings (loss) per share: | |||||||||||||
| Basic and Diluted | $ | 0.09 | $ | 0.16 | $ | (0.06 | ) | $ | 0.20 | ||||
For the purpose of calculating diluted earnings (loss) per share, the effects of the convertible notes were excluded, since their inclusion is anti-dilutive. For the third quarter and the first nine months of 2006, the effect of all stock options was also excluded (5,739,716 options during the third quarter of 2005 and 4,891,664 options during the first nine months of 2005) since their exercise price is greater than the average market price of shares of the same category.
6. GOODWILL
The changes in the carrying amount of goodwill for the nine-month period ended September 30, 2006 are as follows:
| | North America | Europe | Latin America | Total | |||||||||
|---|---|---|---|---|---|---|---|---|---|---|---|---|---|
| Balance, beginning of year | $ | 2,156.7 | $ | 140.9 | $ | 8.1 | $ | 2,305.7 | |||||
| Business disposals | (0.4 | ) | (0.6 | ) | — | (1.0 | ) | ||||||
| Foreign currency changes | 1.3 | 11.0 | 0.2 | 12.5 | |||||||||
| Balance, end of period | $ | 2,157.6 | $ | 151.3 | $ | 8.3 | $ | 2,317.2 | |||||
39
Notes to Consolidated Financial Statements
7. LONG-TERM DEBT
| | Maturity | September 30, 2006 | December 31, 2005 | ||||||
|---|---|---|---|---|---|---|---|---|---|
| Revolving bank facility $1.0 B | 2009 | $ | 314.8 | $ | 334.2 | ||||
| Senior Notes 4.875% and 6.125% | 2008, 2013 | 597.8 | 597.5 | ||||||
| Senior Notes 8.42% and 8.52% | 2010, 2012 | 250.0 | 250.0 | ||||||
| Senior Notes 7.20% (a) | 2006 | — | 250.0 | ||||||
| Senior Debentures 7.25% (b) | 2007 | 150.0 | 150.0 | ||||||
| Senior Debentures 6.50% | 2027 | 3.2 | 3.2 | ||||||
| Senior Notes 8.54% and 8.69% | 2015, 2020 | 121.0 | 121.0 | ||||||
| Senior Notes 8.75% (c) | 2016 | 450.0 | — | ||||||
| Equipment financing credit facility (d) | 2016 | 105.6 | — | ||||||
| Other debts and capital leases | 2006-2016 | 29.2 | 33.7 | ||||||
| 2,021.6 | 1,739.6 | ||||||||
| Less current portion | 4.3 | 7.7 | |||||||
| $ | 2,017.3 | $ | 1,731.9 | ||||||
- (a)
- In March 2006, the Company repaid the Senior Notes.
- (b)
- At September 30, 2006, the Senior Debentures were classified as long-term, since the Company has the ability and the intent to maintain such debt on a long-term basis and has long-term bank facilities available to replace such debt, if necessary.
- (c)
- In March 2006, the Company issued Senior Notes for a principal amount of $450.0 million maturing in March 2016. Issuance costs of $7.3 million were paid on this transaction. These notes contain certain restrictions, which are generally less restrictive than those of the revolving bank facility.
- (d)
- In January 2006, the Company concluded an agreement with Société Générale Corporate and Investment Banking for Canadian dollar equivalent of 136.0 million Euro long-term committed credit facility. The unsecured facility will be drawn over 2 years, repaid over 10 years and bears interest at variable rate. At September 30, 2006, the drawings under this facility amounted to Cdn$118.0 million ($105.6 million) and bear interest at 4.6%. Issuance costs of $4.6 million were paid on this transaction. This credit facility contains certain restrictions, which are equally restrictive as those of the revolving bank facility.
Principal repayments on long-term debt are as follows:
| Remainder of 2006 | $ | 0.9 | |
| 2007 | 3.9 | ||
| 2008 | 219.0 | ||
| 2009 | 485.1 | ||
| 2010 | 189.7 | ||
| 2011 and thereafter | 1,123.0 | ||
40
Notes to Consolidated Financial Statements
8. STOCK-BASED COMPENSATION
The following table summarizes information about stock options:
| | September 30, 2006 | December 31, 2005 | |||
|---|---|---|---|---|---|
| Number of stock options at the end of the period (in thousands): | |||||
| Outstanding | 7,813.9 | 5,948.0 | |||
| Exercisable | 3,024.0 | 2,709.0 | |||
The total stock-based compensation expense recorded in the first nine months of 2006 was $3.1 million ($2.0 million in the first nine months of 2005).
9. CAPITAL STOCK
| | September 30, 2006 | December 31, 2005 | | ||||||||||
|---|---|---|---|---|---|---|---|---|---|---|---|---|---|
| | Convertible into | ||||||||||||
| | Number | Amount | Number | Amount | |||||||||
| (Thousands of shares) | |||||||||||||
| Multiple voting shares | 46,987 | $ | 93.5 | 46,987 | $ | 93.5 | Subordinate shares | ||||||
| Subordinate voting shares | 84,487 | 1,144.0 | 83,981 | 1,138.5 | N/A | ||||||||
| Redeemable first preferred shares: | |||||||||||||
| Series 3 | 12,000 | 212.5 | 12,000 | 212.5 | Series 2 preferred shares(1) | ||||||||
| Series 4 | — | — | 8,000 | 130.2 | Subordinate shares(1) | ||||||||
| Series 5 | 7,000 | 113.9 | 7,000 | 113.9 | Subordinate shares(1) | ||||||||
| 19,000 | 326.4 | 27,000 | 456.6 | ||||||||||
| Total capital stock | $ | 1,563.9 | $ | 1,688.6 | |||||||||
| (1) Under certain conditions | |||||||||||||
During the first nine months of 2006, no Subordinate Voting Shares were issued under the Company's stock option plan (315,065 in the first nine months of 2005) and 506,365 Subordinate Voting Shares were issued under the Company's employee stock purchase plans (357,979 in the first nine months of 2005) for a total cash consideration of $5.5 million ($14.1 million in the first nine months of 2005).
On April 18, 2006, the Company redeemed all of its cumulative redeemable 6.75% First Preferred Shares, Series 4 at a redemption price of Cdn$25.00 per share plus accrued dividends. Of the total consideration of $175.9 million (Cdn$200.0 million) an amount of $130.2 million was recorded in capital stock and $45.7 million in translation adjustment.
41
Notes to Consolidated Financial Statements
10. TRANSLATION ADJUSTMENT
The changes in the carrying amount of the translation adjustment included in shareholders' equity are as follows:
| | Note | September 30, 2006 | December 31, 2005 | ||||||
|---|---|---|---|---|---|---|---|---|---|
| Balance, beginning of year | $ | (24.2 | ) | $ | 36.6 | ||||
| Effect of exchange rate variation on translation of net assets of self-sustaining foreign operations and exchange gains or losses on intercompany account balances that form part of the net investments | (1.7 | ) | (51.6 | ) | |||||
| Change in the fair value of foreign-exchange forward contracts to hedge net investment in a foreign subsidiary (net of income taxes) | — | (5.4 | ) | ||||||
| Redemption of First Preferred Shares Series 4 | 9 | (45.7 | ) | — | |||||
| Shares repurchased | — | (3.8 | ) | ||||||
| Portion included in income as a result of reductions in net investments in self-sustaining foreign operations | 3 | 2.5 | — | ||||||
| Balance, end of period | $ | (69.1 | ) | $ | (24.2 | ) | |||
11. PENSION AND OTHER POSTRETIREMENT BENEFITS
The following table presents the Company's pension and other postretirement benefit costs:
| | Three months | Nine months | ||||||||||
|---|---|---|---|---|---|---|---|---|---|---|---|---|
| | 2006 | 2005 | 2006 | 2005 | ||||||||
| Pension benefits | $ | 22.1 | $ | 21.5 | $ | 60.4 | $ | 57.7 | ||||
| Postretirement benefits | 0.8 | 0.8 | 2.4 | 2.6 | ||||||||
| Total benefit cost | $ | 22.9 | $ | 22.3 | $ | 62.8 | $ | 60.3 | ||||
| Portion included in discontinued operations | — | 4.6 | — | 5.7 | ||||||||
| Total benefit cost from continuing operations | $ | 22.9 | $ | 17.7 | $ | 62.8 | $ | 54.6 | ||||
During the second quarter of 2006, the Company announced modifications to the defined benefit plans for certain employees in Canada and in the United States, and the creation of a defined contribution Group Registered Retirement Savings Plan ("Group RRSP") for employees in Canada.
As of October 1st, 2006, affected Canadian employees had the choice to adhere to the Group RRSP, or to continue to participate in the modified plan, while future employees automatically adhere to the new Group RRSP. A $3.8 million curtailment charge was recorded in relation to these changes in the third quarter of 2006.
For employees in the United States, a portion of the defined benefit plans was frozen on October 1st, 2006, and an improved defined contribution plan has been offered to employees. A $1.9 million curtailment gain was recorded in relation to these changes in the third quarter of 2006, and a total gain of $5.5 million for the first nine months of 2006.
The 2006 pension benefit costs included a $1.0 million charge related to plant closures recorded in the third quarter, a total charge of $2.9 million for the first nine months of 2006, as described in Note 2. The 2005 pension benefit costs included a $4.2 million pension curtailment related to plants included in the discontinued operations results.
12. COMMITMENTS
During the first nine months of 2006, the Company concluded agreements related to building and equipment expenditures for its European and North American segments. Future payments related to these commitments will amount to $18.0 million for the remainder of 2006 and $19.7 million for 2007.
42
Notes to Consolidated Financial Statements
13. SEGMENTED INFORMATION
The Company operates in the printing industry. Its business groups are located in three main segments: North America, Europe and Latin America. These segments are managed separately, since they all require specific market strategies. The Company assesses the performance of each segment based on operating income before impairment of assets, restructuring and other charges.
The following is a summary of the segmented information for the Company's continuing operations:
| | North America | Europe | Latin America | Other | Inter-Segment | Total | |||||||||||||
|---|---|---|---|---|---|---|---|---|---|---|---|---|---|---|---|---|---|---|---|
| Three months | |||||||||||||||||||
2006 | |||||||||||||||||||
| Revenues | $ | 1,241.1 | $ | 244.1 | $ | 61.2 | $ | 0.2 | $ | (0.4 | ) | $ | 1,546.2 | ||||||
| Impairment of assets, restructuring and other charges | 3.3 | 7.7 | 0.6 | — | — | 11.6 | |||||||||||||
| Operating income (loss) | 72.4 | (13.7 | ) | 2.8 | (5.8 | ) | — | 55.7 | |||||||||||
2005 | |||||||||||||||||||
| Revenues | $ | 1,253.6 | $ | 270.7 | $ | 54.4 | $ | — | $ | (1.5 | ) | $ | 1,577.2 | ||||||
| Impairment of assets, restructuring and other charges | 3.3 | 13.7 | 0.2 | — | — | 17.2 | |||||||||||||
| Operating income (loss) | 96.7 | (18.5 | ) | 2.6 | (0.8 | ) | — | 80.0 | |||||||||||
Nine months | |||||||||||||||||||
2006 | |||||||||||||||||||
| Revenues | $ | 3,537.6 | $ | 758.1 | $ | 170.5 | $ | 0.6 | $ | (0.9 | ) | $ | 4,465.9 | ||||||
| Impairment of assets, restructuring and other charges | 29.4 | 34.5 | 1.2 | — | — | 65.1 | |||||||||||||
| Operating income (loss) | 148.4 | (43.1 | ) | 5.6 | (8.7 | ) | — | 102.2 | |||||||||||
2005 | |||||||||||||||||||
| Revenues | $ | 3,559.4 | $ | 886.2 | $ | 177.2 | $ | 0.2 | $ | (3.7 | ) | $ | 4,619.3 | ||||||
| Impairment of assets, restructuring and other charges | 19.7 | 61.9 | 0.7 | — | — | 82.3 | |||||||||||||
| Operating income (loss) | 244.6 | (62.7 | ) | 8.6 | (2.6 | ) | — | 187.9 | |||||||||||
43
FORM 52-109F2
CERTIFICATION OF INTERIM FILINGS
I, Wes William Lucas, President and Chief Executive Officer of Quebecor World Inc., certify that:
- I have reviewed the interim filings (as this term is defined in Multilateral Instrument 52-109Certification of Disclosure in Issuers' Annual and Interim Filings) of Quebecor World Inc. (the issuer) for the interim period ending September 30, 2006;
- Based on my knowledge, the interim filings do not contain any untrue statement of a material fact or omit to state a material fact required to be stated or that is necessary to make a statement not misleading in light of the circumstances under which it was made, with respect to the period covered by the interim filings;
- Based on my knowledge, the interim financial statements together with the other financial information included in the interim filings fairly present in all material aspects the financial condition, results of operations and cash flows of the issuer, as of the date and for the periods presented in the interim filings.
- The issuer's other certifying officers and I are responsible for establishing and maintening disclosure controls and procedures for the issuer, and we have:
- designed such disclosure controls and procedures, or caused them to be designed under our supervision, to provide reasonable assurance that material information relating to the issuer, including its consolidated subsidiaries, is made known to us by others within those entities, particularly during the period in which the interim filings are being prepared.
Date: November 7, 2006
/s/Wes William Lucas
Wes William Lucas
President and Chief Executive Officer
Quebecor World Inc.
44
FORM 52-109F2
CERTIFICATION OF INTERIM FILINGS
I, Jacques Mallette, Executive Vice President and Chief Financial Officer of Quebecor World Inc., certify that:
- I have reviewed the interim filings (as this term is defined in Multilateral Instrument 52-109Certification of Disclosure in Issuers' Annual and Interim Filings) of Quebecor World Inc. (the issuer) for the interim period ending September 30, 2006;
- Based on my knowledge, the interim filings do not contain any untrue statement of a material fact or omit to state a material fact required to be stated or that is necessary to make a statement not misleading in light of the circumstances under which it was made, with respect to the period covered by the interim filings;
- Based on my knowledge, the interim financial statements together with the other financial information included in the interim filings fairly present in all material aspects the financial condition, results of operations and cash flows of the issuer, as of the date and for the periods presented in the interim filings.
- The issuer's other certifying officers and I are responsible for establishing and maintening disclosure controls and procedures for the issuer, and we have:
- designed such disclosure controls and procedures, or caused them to be designed under our supervision, to provide reasonable assurance that material information relating to the issuer, including its consolidated subsidiaries, is made known to us by others within those entities, particularly during the period in which the interim filings are being prepared.
Date: November 7, 2006
/s/ Jacques Mallette
Jacques Mallette
Executive Vice President and Chief Financial Officer
Quebecor World Inc.
45
SIGNATURES
Pursuant to the requirements of the Securities Exchange Act of 1934, the registrant has duly caused this report to be signed on its behalf by the undersigned, thereunto duly authorized.
QUEBECOR WORLD INC.
By:/s/ Marie-É. Chlumecky
Name: Marie-É. Chlumecky
Title: Assistant Secretary
Date: November 7, 2006
CONSOLIDATED STATEMENTS OF CASH FLOWS Periods ended September 30 (In millions of US dollars) (Unaudited)
CONSOLIDATED BALANCE SHEETS (In millions of US dollars)
NOTES TO CONSOLIDATED FINANCIAL STATEMENTS Periods ended September 30, 2006 and 2005 (Tabular amounts are expressed in millions of US dollars, except per share amounts) (Unaudited)