SECURITIES AND EXCHANGE COMMISSION
Washington, DC 20549
FORM 6-K
REPORT OF FOREIGN ISSUER
PURSUANT TO RULE 13a-16 or 15d-16 OF
THE SECURITIES EXCHANGE ACT OF 1934
For ANNUAL REPORT 2002 | ||
|
|
|
QUEBECOR WORLD INC. | ||
(Translation of Registrant’s Name into English) | ||
|
|
|
612 Saint-Jacques Street, Montreal, Quebec H3C 4M8 | ||
(Address of Principal Executive Office) | ||
(Indicate by check mark whether the registrant files or will file annual reports under cover of Form 20-F or Form 40-F)
Form 20-F o Form 40-F ý
(Indicate by check mark whether the registrant by furnishing the information contained in this form is also thereby furnishing the information to the Commission pursuant to Rule 12g3-2(b) under the Securities Exchange Act of 1934.)
Yes o No ý
QUEBECOR WORLD INC.
Filed in this Form 6-K
Documents index
1. Annual Report 2002
|
Table of Contents
| ||
|
| |
|
| |
|
| |
|
| |
|
| |
|
| |
|
| |
|
| |
|
| |
|
| |
|
| |
|
| |
|
| |
|
| |
|
| |
|
| |
|
| |
|
| |
|
| |
|
| |
|
| |
|
| |
| Quebecor World Inc. (NYSE; TSX: IQW) is the largest commercial printer in the world. It is a market leader in most of its major product categories, which include magazines, inserts and circulars, books, catalogs, specialty printing and direct mail, directories, digital premedia, logistics, mail list technologies and other value added services. Quebecor World Inc. has approximately 39,000 employees working in more than 160 printing and related facilities in the United States, Canada, Brazil, France, the United Kingdom, Belgium, Spain, Austria, Sweden, Switzerland, Finland, Chile, Argentina, Peru, Colombia, Mexico and India. |

Financial
Highlights
(In millions of U.S. dollars, except per share data) |
| 2002 |
| % Change |
| 2001 |
| % Change |
| 2000 |
| |||
|
|
|
|
|
|
|
|
|
|
|
| |||
Consolidated Results |
|
|
|
|
|
|
|
|
|
|
| |||
Revenues |
| $ | 6,242.0 |
| (1 | ) | $ | 6,320.1 |
| (3 | ) | $ | 6,521.1 |
|
Operating income before restructuring and other charges |
| 562.8 |
| (9 | ) | 617.8 |
| (15 | ) | 724.8 |
| |||
Restructuring and other charges |
| 19.6 |
|
|
| 270.0 |
|
|
| (2.7 | ) | |||
Operating income |
| 543.2 |
| 56 |
| 347.8 |
| (52 | ) | 727.5 |
| |||
Net income* |
| 279.3 |
| 1147 |
| 22.4 |
| (92 | ) | 295.4 |
| |||
Cash provided from operating activities |
| 513.4 |
| (11 | ) | 576.5 |
| (37 | ) | 917.8 |
| |||
Free cash flow from operations** |
| 319.8 |
| 11 |
| 287.2 |
| (62 | ) | 747.3 |
| |||
Operating margin before restructuring and other charges |
| 9.0 | % |
|
| 9.8 | % |
|
| 11.1 | % | |||
Operating margin |
| 8.7 | % |
|
| 5.5 | % |
|
| 11.2 | % | |||
|
|
|
|
|
|
|
|
|
|
|
| |||
Financial Position |
|
|
|
|
|
|
|
|
|
|
| |||
Working capital |
| $ | (209.3 | ) |
|
| $ | (194.5 | ) |
|
| $ | (66.5 | ) |
Property, plant and equipment |
| 2,610.6 |
|
|
| 2,634.0 |
|
|
| 2,683.0 |
| |||
Total assets |
| 6,205.5 |
|
|
| 6,186.5 |
|
|
| 6,520.8 |
| |||
Long-term debt (including convertible notes) |
| 1,822.1 |
|
|
| 2,132.2 |
|
|
| 2,208.7 |
| |||
Debt-to-capitalization |
| 40:60 |
|
|
| 46:54 |
|
|
| 47:53 |
| |||
|
|
|
|
|
|
|
|
|
|
|
| |||
Per Share Data |
|
|
|
|
|
|
|
|
|
|
| |||
Earnings* |
|
|
|
|
|
|
|
|
|
|
| |||
Diluted |
| $ | 1.76 |
|
|
| $ | — |
|
|
| $ | 1.91 |
|
Diluted before restructuring and other special charges |
| $ | 1.92 |
| 22 |
| $ | 1.58 |
| (17 | ) | $ | 1.90 |
|
Dividends on equity shares |
| $ | 0.49 |
| 7 |
| $ | 0.46 |
| 39 |
| $ | 0.33 |
|
Book value |
| $ | 15.92 |
| 11 |
| $ | 14.39 |
| (7 | ) | $ | 15.47 |
|
* Effective January 1, 2002, net income and earnings per share reflect the new accounting policy adopted by the Company
under which goodwill is no longer amortized.
** Cash provided from operating activities, less capital expenditures net of proceeds from disposals, and preferred share dividends.
Quebecor World
1
Our Commitment to You
Commitment is a word we don’t take lightly at Quebecor World. When we make one we do everything in our power to deliver. Going into 2002, our commitment was to focus on three key areas of discipline – restructuring and cost containment, strong free cash flow and debt repayment. The result is a more efficient manufacturing platform, with a lower cost base both in terms of operational costs and financial expense. This process is not yet completed and cost reduction will continue to be our major focus going forward.
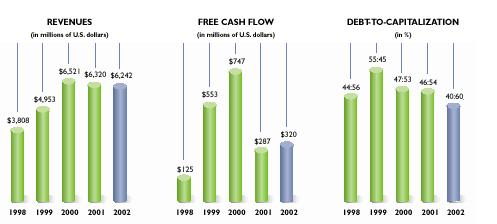
In the face of a significant economic headwind, Quebecor World’s diluted earnings per share, before restructuring and other special charges and removing the impact of goodwill amortization in previous years, held relatively steady at $1.92 in 2002 compared with $1.99 in 2001. Free cash flow increased 11% to $320 million. Much of this was used to pay down debt, reducing our debt-to-capitalization ratio to 40:60. These results were achieved despite weaker advertising spending in our key North America market causing volume and price pressures due to excess capacity in the industry.
New Business
Another commitment was to win new business and strengthen our existing customer franchise. We delivered. One example is our
2
“Quebecor World is committed to providing the strongest management team in the industry.”
agreement to print 100% of the catalogs for L.L. Bean, the leading cataloger in the United States. Another is our agreement to be the principal print supplier for Simon & Schuster. Still another is our agreement with U.S. retailer Albertsons to produce the lion’s share of their retail flyer program. Our message of one-stop global shopping and technological leadership is being heard and is paying off in expanded business as our customers use their relationship with us to capture their own economies of scale. The same is true for customers who are printing with us on more than one continent. Avon, Telefónica de España, Reader’s Digest, IKEA, Scholastic, Hachette, Forbes, and Office Depot are just a few examples of customers who are using our global platform to expand their business into new markets.
Restructuring Initiatives
Last year we committed to a restructuring program that centered on our strategy of having fewer, but larger, more specialized facilities. This involved the closing of more than 10 facilities during the year and the elimination of more than 3,000 employee positions, primarily in North America.
In the fourth quarter of 2002, the Company recognized restructuring and other special charges for a net of $19.6 million, pre-tax. The largest component of these charges is the cost of new restructuring initiatives being undertaken in France as a result of difficult market conditions, severe price pressures and a decrease in operating income. The charges also include the write-down of an investment in a CD ROM replication business.
North America
In North America, which accounts for over 80% of our revenues, we continued to experience soft demand in most of our markets as well as competitive pricing. Despite these conditions, operating income increased in all our business groups except for the Commercial/Direct Group, Premedia Services and East Group which have been affected by the weak market for promotional advertising.
Our message of one-stop global shopping and technological leadership is being heard and is paying off in expanded business.
European Revenues Increase
Quebecor World’s European operations, in countries outside of France, increased revenues and operating income in 2002 in spite of difficult print market conditions. Overall in Europe, operating margin declined as a result of our under-performing French operations. The Company is committed to correcting this situation through the aforementioned restructuring initiatives under way.
Continuing Double-Digit Growth in Latin America
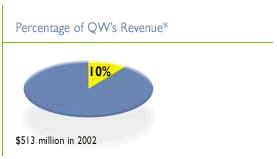
In Latin America, our business continued to grow. Revenues continued to grow at a double-digit rate of 13% to $183 million. Operating income before restructuring and other charges, increased by 37% for the year and the operating margin improved to 7.8% from 6.5% in 2001.
Through our commitment to providing world-class quality and service, our Latin American team is gaining market share and providing a Latin American solution for our North American and European customers.
3
A Strategy for Growth
Quebecor World remains committed to its long-term strategic plan to expand through acquisitions and internal investments. However, given the difficult economic environment, management decided, in mid-2001, to suspend all acquisitions. The only exception to this was the acquisition of the European printing assets of Hachette Filipacchi Medias, completed in March 2002, which came with an enabling contract for us to print many of Hachette’s magazines in France. As well, the benefits of our strategy of establishing closer ties with leaders such as Hachette has been confirmed with the subsequent signing of additional Hachette contracts in other parts of Europe as well as in the U.S.
Quebecor World remains committed to its long-term strategic plan to expand through acquisitions and internal investments.
We continue to invest in our existing operations, with much focus in 2002 on our retail platform, where we are investing in new presses as well as a new facility in Riverside, California. We are now the only printer in North America offering a coast-to-coast web offset and gravure platform for the production of retail inserts and Sunday magazines.
Leadership Transition
Quebecor World is committed to providing the strongest management team in the industry. On February 3, 2003, Charles G. Cavell became Deputy Chairman of the Board relinquishing his role of President and Chief Executive Officer of Quebecor World, the position he had held since December, 1997. Mr. Cavell, through his leadership of a strong executive team, has helped build a legacy, the world’s largest commercial printer. With the full support of the controlling shareholder Quebecor Inc., Charlie and Jean Neveu, our former Chairman and CEO, together with the rest of the senior management team, began an aggressive acquisition program in the late ‘80s that addressed the potential opportunity of the North American Free Trade Agreement and brought the Company to the number one position in just 10 years. As Deputy Chairman, Charlie will continue to contribute to the Company’s growth and success.
Michel Desbiens was appointed President and Chief Executive Officer effective February 3, 2003. To facilitate the transition process, Mr. Desbiens was appointed to the position of Chief Executive Officer, International Operations, in November 2002. He has also been a Board Member since April 2002. He brings many years of experience in the paper industry and in public company administration. As the former President and Chief Executive Officer of Donohue Inc., Mr. Desbiens is uniquely qualified for his new role, having led that corporation’s growth to become one of most profitable paper companies in the world. Claude Hélie, who worked closely with Mr. Desbiens at Donohue, will become Chief Financial Officer of Quebecor World effective February 17, 2003, thus reuniting this effective team to help ensure that your Company will continue to grow and deliver value to shareholders.
Another major leadership change has been the appointment in 2002 of John Paloian and David Boles as Chief Operating Officers of our North American operations. Together they
4
“Our focus will continue to be on cost containment and free cash flow. Our strategy of deploying assets into larger, more specialized facilities will help ensure that we remain the lowest cost provider.”
have more than 30 years of experience in the printing industry and were instrumental in implementing the merger of Quebecor Printing and World Color. Thanks to the strong “bench strength” of our management team, their former responsibilities as Group Presidents are being assumed by a new generation of talented and proven leaders.
Our Greatest Asset
As Quebecor World undergoes a year of leadership transition, it is important to acknowledge the fundamental role that each of our 39,000 employees has played in making us who we are today. While the Company’s leaders provide vision, values, and other direction, it is our employees who turn these guidelines into reality. We thank each of you for being true to our corporate values, for sharing our dreams, and especially for that extra caring you provide our customers. After all, machines don’t create customer satisfaction or shareholder value. People do.
Outlook
We believe that market conditions in our industry will remain difficult for the first half of 2003. Our focus will continue to be on cost containment and free cash flow. Our strategy of deploying assets into larger, more specialized facilities will help ensure that we remain the lowest cost provider. This will give us the necessary operating leverage to take advantage of an eventual economic and advertising recovery.
In 2002, we witnessed an accelerated trend toward vendor consolidation. Businesses are looking to fewer vendors who can provide more integrated turnkey services than ever before. Our breadth of capabilities coupled with our multi-plant platform position us to be a strategic partner to our customers and not just a vendor. By fine-tuning our equipment and leveraging the whole Quebecor World platform we can satisfy the most demanding customers whose requirements can only be met by a company with our resources and capabilities.
The difficult economic conditions we continue to face means that it is now more than ever time for the Company to stay true to its core values - the values against which we bench-mark our performance. That is what has made Quebecor World the number one global printer today, and that is what will ensure we continue to grow and evolve as the leader for many years to come.
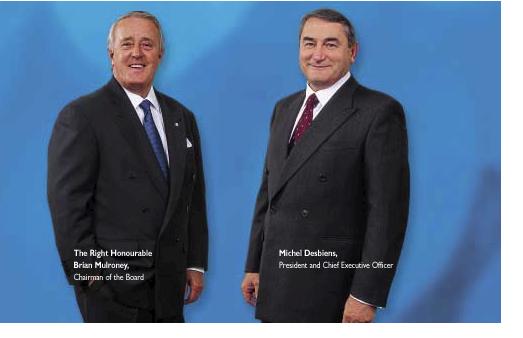
/s/ Brian Mulroney |
|
The Right Honourable Brian Mulroney, | |
Chairman of the Board | |
| |
/s/ Michel Desbiens, |
|
Michel Desbiens, | |
President and Chief Executive Officer | |
| |
February 3, 2003 | |
5
Quebecor World is committed to the focused, disciplined and ethical pursuit of value for all our stakeholders. We do this by optimizing the contribution of people, technology and capital to meet or exceed our customers’ expectations.
6
Our business practices are guided by a set of social, environmental and financial values based on the highest standards of excellence and integrity.
7
Our Customers |
| |
| ||
Quebecor World is committed to providing customers with superior printing and print-related services. Our customers expect us to meet our commitments and be proactive in always looking for ways to serve them better. We strive for long-term, mutually rewarding relationships that demonstrate a partnership approach to doing business. We actively engage the appropriate resources of our entire Company in helping customers be successful in their endeavors. | ||
| ||
| L.L. Bean was founded in 1912 by Leon Leonwood Bean (or “L.L.”) on a passion for the outdoors, a profound belief in honesty and an unwavering commitment to quality and customer satisfaction.
Quebecor World is proud to be the sole provider of print services for L.L. Bean’s extensive catalog program involving over 200 million catalogs per year. | |
| ||
| ||


8

“Our decision to move all of our work to Quebecor World was made after a careful assessment of all marketplace options. The strength and diversity of Quebecor World’s manufacturing platform offers us a level of flexibility that we feel is critical to the success of our catalog program.”
Steve Fuller, Vice President of Corporate Marketing, L.L.Bean
9
Albertsons is one of the world’s largest food and drug retailers with annual revenues in the $38 billion range. Quebecor World recently expanded its relationship with Albertsons to print a majority of its advertising inserts, some 40 million inserts per week placed in more than 250 newspapers across the U.S. Quebecor World is the only printer in North America that can offer a coast-to-coast web offset and gravure platform for the production of retailers’ inserts and mailers.

| “Quebecor World’s combination of service and its extensive platform offer us the geographic scope required by a company of our size, as well as a significant cost savings benefit.” |
| Pam Powell, Group Vice President, Marketing & Advertising, Albertsons
|

10
Time Inc. is the type of company Quebecor World has structured itself to support. Time’s ability to take advantage of the size, diversity and flexibility of our manufacturing and distribution platform – worldwide – leads to significant benefits for both companies.
In 2002, we signed another multi-year contract extension with Time Inc. to print 20 of its Time, Southern Progress and Oxmoor House titles. Additionally, Quebecor World took on the printing of This Old House magazine.
|
|
“Over the years, Time Inc. has enjoyed a very successful relationship with Quebecor World and we look forward to continuing to work with them in the future.”
|
|
Barry Meinerth, Senior Vice President, Production, Time Inc. | |
|
|


11
Our Edge
The employees of Quebecor World are the most important factor in the success of the Company. Employees at all levels are respected for the value they add to our products and services and are accorded an appropriate and equal opportunity for personal and professional growth, for reward and achievement within the organization. |
| |
|
| |
| Our ALLSTAR Customer Service Training program was recently selected by The American Society of Training & Development, the world’s premier resource on workplace learning and performance, to receive the coveted “Excellence in Practice” award. The program has been recognized for its effectiveness in helping Quebecor World standardize its account management practices throughout North America and reinforce a customer-centric corporate culture. Other organizations have noted the success of ALLSTAR’s banquet team-building activity and have used this model in management training efforts. | |


12
"ALLSTAR helped me realize that my customers could be on my team as well. It also gave me a lot of confidence in my ability to be a good CSR through teamwork, communication, and being really responsive to customer needs."
Rhonda Knopp,
Customer Service Representative (CSR), QW Dubuque
13
“By getting more involved in the reduction of unnecessary waste, we’re better able to have control over the bottom line.”
Mike Jacobs, Operator, QW Dyersberg | QWEST is a program aimed at providing employees with the tools they need to identify opportunities for process and cost improvements. For example, through a QWEST project at our Dyersberg, Tennessee plant, bindery waste is now measured daily and the results are released each week. Once a month, the Continuous Improvement Manager meets with the bindery supervisors and operators for a detailed review of the progress being made and how the results could be improved further. |
|
|
| The LEAD program was launched in 2002 to identify and develop the future leaders of this Company. More than 75 LEAD participants are being provided with special training, guidance and development opportunities to help fast track their careers.
“The LEAD program has been outstanding, as far as my experience in it. The coach that was assigned to me has helped me tremendously, especially with my new responsibility of helping develop the assistants for sales. When I run into a difficult situation, I can speak candidly with my coach and he helps guide me in the right direction.”
Debbie Leopoldi, |

14
“When a corporation is willing to invest in its people through this type of extensive training, it sends a message that they want us to succeed and that they care about building bench strength and getting the right people into the right positions.”
Rich Dunn, | Quebecor World’s Training Initiatives
ALLSTAR: Award-winning Customer Service Training
LEAD: Identification and development of High Potential Employees
CAP: “Corrective Action Process” for problem analysis and prevention
QWEST: Quebecor World Employee Suggestion Teams
CCHPL: Customer-Centric High Performance Leadership training for executives |
| |
|
|
CCHPL is a new program designed for executives at the Vice Presidential level and up. It aims to develop such skills as public speaking, interpreting financial statements, negotiating, and teambuilding. Shown above is Rich Dunn (second from right) addressing some of his employees (from left to right) Ramon Mejia, 3rd Press Operator; Shawn Fuller, 1st Press Operator; and Jamie Kruser, 2nd Press Operator. | |

15
Our Innovation |
| |
| ||
As the leader in our industry, Quebecor World carries the added responsibity of continuously improving all aspects of our business. We invest in the research and development of new printing technologies and materials that will bring new benefits to our customers and the marketplace. | ||
|
| |
| Process Neutrality — Quebecor World is the only printer with a coast-to-coast offset and rotogravure network that is dedicated to the production of retail inserts and Sunday magazines. This technological advantage provides us with the unique ability to offer our customers a choice between rotogravure and offset printing. Many of our large national customers will offset print their regional, highly versioned runs, and rotogravure print their national, longer runs.
Our process neutrality allows customers to take advantage of the high speed in rotogravure while not compromising the number of versions they require for regional runs. | |


16
| |
|
|
“The main reason we partnered with Quebecor World Retail was their ability to offer a “process neutral” manufacturing platform, where the focus in on the printed product, not on the process.”
Jim Pilsner, | |
17
| ||
| ||
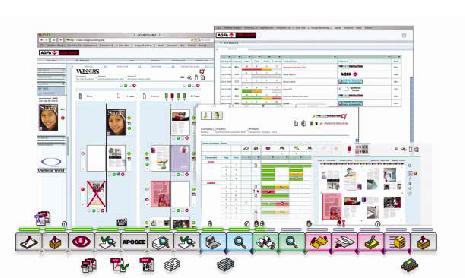
Agfa’s DelanoTM is a new software suite designed to facilitate communication and process management between pre-press and print professionals, creative and customer support personnel. What’s so unique about this web-enabled software is that it provides real time information on the status of print projects at every stage – initial customer contact, prepress, printing, post-press activity – as well as workflow analysis, regardless of the brand of the digital workflow systems in use. It puts a powerful set of project management tools at the fingertips of customer service representatives – helping printers create and deliver jobs more efficiently and productively than ever before.
Quebecor World demonstrated its technological leadership when it initiated the development of this software by approaching Agfa, the leading supplier of prepress solutions, to be its partner in this project. This revolutionary technology was pilot-tested in two of our plants last year and is currently being rolled out in additional plants. What’s more, through our continued partnership with Agfa, the Delano solution will continue to be enhanced and Agfa will soon be offering this software to other print media companies. | ||
|
| |
| One example of our technological leadership is the extent to which we can calibrate the quality and colors of high volume retail insert programs being printed in multiple plants. Any fine-tuning of color can be directed from the main plant and the customer can be provided with a statistical record of how the product was produced at every site. | |
This takes the guesswork out of the process and allows the customer to get uniform quality from a single supplier on a multi-plant program. | ||

18
Forbes Global is an example of a global customer benefiting from our technological leadership. Data for this magazine is transmitted from New York to Austria for printing 24 times per year. The magazines are then distributed throughout Europe, the Middle East, India and Pakistan. To maximize flexibility for the customer, Quebecor World utilizes the most up-to-date technology, including a PDF workflow, Mass Transit for data transmission from North America to Europe, and the latest in ink jet equipment which allows us to ink jet directly onto poly material rather than carrier card, saving time and money. | |
|
|
| |
|
|
“Quebecor World’s technology enhancements allow us to operate with a fast-paced schedule for Forbes Global, shrinking the time from writer/editor to reader. Technology affords us the flexibility of accommodating late-breaking editorials as well as limited late advertising. All of this ultimately means that we can insure the relevance of our publication in today’s fast-paced world, bring in more revenue and demonstrate our speed to market.”
Elaine Fry, Group Director, Manufacturing and Production, Forbes Global | |
19
Our Environment
Quebecor World aims to use resources efficiently and we apply pollution-prevention measures in all our printing and related operations worldwide in an effort to maintain a healthy environment for present and future generations. |
| |
|
| |
| Each year hundreds of Quebecor World employees participate in a variety of Earth Day events. One example is our employees’ efforts over the last three years in the reforestation of a large park near the Richmond Hill plant, just north of Toronto, Ontario, Canada. In 2002, employees planted 300 saplings and more mature trees, all donated by the Company. The reforestation project is expected to continue for another five years.
“The work is bringing back nature to an area that’s seen quite a lot of devastation. In the long term, the trees will grow and provide shade and cooling for the streams so that the fish can spawn. It’s very satisfying to know that, in a small way, we’ve done something to make that happen.” | |
Michael Druce, Environmental Coordinator, QW Aurora/Richmond Hill | ||


20
| |
|
|
“Quebecor World has been printing the Earth Day Canada posters and other critical communications pieces on our behalf since 1996. Not only do we get the work done for free, but they also make our work look so much more professional. This has been an invaluable resource to us and one that we value very much.”
Jed Goldberg, President, Earth Day Canada | |

21
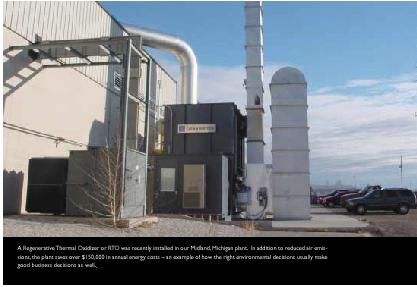
“Quebecor World is one of the first to install Regenerative Thermal Oxidizer technology in the printing industry where the destruction efficiency exceeds local and national Regulatory Compliances. We are proud to be a Supplier/Partner of a company such as Quebecor World that it is determined to always use cutting-edge technology to ensure a clean and safe environment.” | |
Alan Fiers, | |
|
|
| |
| |
Quebecor World makes it a point to have its printing plants equipped with the best available technology for emission control. That’s why we continue to invest in Regenerative Thermal Oxidizers or RTOs. Now, more than 50 RTOs are installed in 40 of our plants, replacing their less efficient, energy-consuming counterparts by outperforming them in every aspect. They destroy 99% of the pollutants that would otherwise be released into the atmosphere, and use up to 95% less fuel (natural gas) than the other most commonly used control device. In 2003, we plan to install at least five more RTOs. | |
22
Limiting air emissions is the main environmental concern that we face as a printer, but we are also concerned about recycling paper and ink, processing waste water, recovering solvent, and looking for other opportunities to reduce, reuse and recycle. Recycling initiatives are under way throughout Quebecor World. In North America alone, we sent close to 700,000 metric tonnes of paper for recycling last year.
As the largest buyer of paper in the world, we consider it an important responsibility to invest in better equipment for segregating, shredding and baling our waste paper for recycling. For example, our plant in Lebanon, Ohio recently installed two new baler systems and a vertical shredder which enable it to segregate waste paper and handle larger volumes. | |
| |
| |
|
|
Waste paper for recycling is headed to new shredder at Lebanon, Ohio facility (left). New paper balers at Lebanon facility (right) | |
|
|
| |
|
|
Our employees are instrumental in finding new ways to reduce, reuse and recycle. Our plant in Covington, Tennessee, for example, found an outlet for its core plugs, shown directly above, which come from each of the rolls of paper it uses. These plugs are now picked up free of charge to be reused by a nearby coated paper facility rather than being sent to the local landfill. The combined impact of projects such as these makes a huge difference to our impact on the environment. | |
|
|
Quebecor World is committed to: | |
Complying with applicable laws and regulations and other requirements pertaining to the environment. | |
Opting for processes and management practices that promote a more rational use of energy. | |
Optimizing the 3R (Reduce, Reuse, and Recycle) approach in its pollution-prevention strategy by adopting, as much as possible, products and processes that allow for reduction at source, and the reuse and recycling of waste materials and by-products. | |
Collaborating closely with clients, suppliers, and various stakeholders (government, industry, community groups, etc.) to improve the protection of the environment. | |
Maintaining an efficient organizational structure and developing methods and procedures to help fulfill its commitments. | |
Training, motivating, and educating its employees to ensure their support in implementing this policy. | |
Verifying periodically the compliance of its activities with its policy and submitting reports to the appropriate management bodies, headed by the Environment Committee. | |


23
Our Community
Across our global platform, Quebecor World and its employees are constantly looking for ways to reach out and make our communities better.
The Company believes in making a significant contribution to the growth and prosperity of the communities in which it operates through education, donation and social programs, and by providing employment. |
| |
|
| |
| Habitat For Humanity is one of the most successful continuous community service projects in history. Quebecor World, its employees and their families are enthusiastic supporters of this program, which helps provide housing for families in need. Over the last few years, employees assisted with the construction of homes for families in several U.S. communities — Versailles, Kentucky; Franklin, Kentucky; Mount Morris, Illinois and Buffalo, New York.
Our Buffalo plant has driven the fundraising of three Habitat houses over the last four years. Based on its unique fundraising approach and demonstrated commitment to Habitat for Humanity, our Buffalo plant was awarded the Oprah Winfrey Angel award. | |


24
| |
|
|
“There is a real reward in building a house. You can see what you accomplish and feel the difference. It’s almost magic when you help someone and the one thing you get in return is a smile."
Liz Cash, Production Assistant, QW Buffalo | |

25
| |
|
|
Quebecor World and our employees help support more than 100 educational and literacy institutions and associations across North America through donations and volunteer work. We are the global leader in books, with book printing facilities in North America, Europe and Latin America. As part of our desire to give back to the community, Quebecor World and our publishers donate books to schools and libraries in many countries. | |
Our book facility in Buffalo alone, in partnership with its publishers, has donated more than one million books for children’s literacy. We are also a founding member of Libraries for Kids, which donates books to schools in the area. In Latin America, we have donated books to schools and organizations in several countries. We believe that participating in local initiatives and giving back to the community adds value for our employees, customers and ultimately our shareholders. | |
|
|
| |


26
“Giving back is important. As a global Company, we believe it is important to invest in the communities where we operate to try to help improve people’s lives, especially in areas of education.”
Guy Trahan, President, | |
|
|
| |
|
|
| |
|
|
In 2002, Quebecor World initiated a project to build a school in Argentina in partnership with A-Z Editora. The school in Pampa del Infierno is now completed. The village’s first school will allow 70 local children to receive academic instruction without having to leave their home village. Quebecor World helped fund the project, while A-Z Editora donated books and other school materials. | |


27
|
Our Competitive Advantage
|
|
|
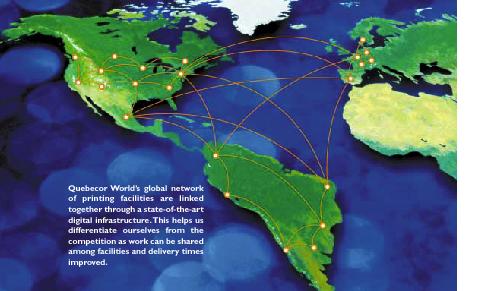
| Quebecor World’s global platform helps our customers expand their business into new markets. Publishers and retailers can benefit from the knowledge and support of a trusted supplier that is already established in those markets. |
| |
Our globally linked, diversified network, in North America, Europe and Latin America creates significant cross-selling opportunities, leverages our global purchasing power and makes us less dependent on any one economy.
| |||
|
| ||


28
|
Quebecor World’s global one-stop shopping is an important advantage for customers such as Forbes, Hachette, Office Depot, Avon, Scholastic, McGraw-Hill, IKEA, Santillana and many others who are doing business with us on more than one continent. Multinational customers can obtain print production from a single supplier and benefit from manufacturing in, or closer to, their foreign markets. |

29
Our Diversity
Magazines
Quebecor World is the world’s leading printer of consumer magazines. We print more than 1,000 magazine titles including: Time, Sports Illustrated, People, Rolling Stone, Elle, TV Guide, Good Housekeeping, Car and Driver, among others. Our customer list includes the major players in magazine publishing, such as AOL Time Warner, Primedia, Hachette Filipacchi Medias, Condé Nast Publications, Hearst Corporation, and Scholastic.
Catalogs
Quebecor World is the largest printer of catalogs in the world. We print several hundred different catalogs on an annual basis for many of North America’s retailers such as L.L. Bean, Office Depot, Brylane, JCPenney, Avon, Blair Corporation, Williams-Sonoma, Oriental Trading Company, United Stationers, and Spiegel, to name a few. We are also a leading catalog printer in Europe, where we print the IKEA catalog in four countries and serve most of the major mail-order companies.
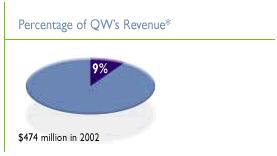
*For North America only.

30
Quebecor World offers an unrivaled range of print media products and services. Customers can call on us at every step of the way from premedia to distribution, for their local, national and even international print programs.
Retail Inserts and Sunday Magazines
Quebecor World is the leading North American printer of retail inserts and Sunday magazines. We offer the only coast-to-coast web offset and gravure platform for the North American retail sector. Our customers include almost every major national retailer and Sunday magazine, including Sears, Parade, CVS, USA Weekend, and JCPenney. We are also a major player in the European Sunday magazine market, particularly in the U.K., where we have 40 percent of the domestic market.
Specialty Printing and Direct Mail
These products include brochures, annual reports, calendars, promotional games, direct mail, highly personalized catalog and magazine cover wraps, and promotions for the automotive, travel, pharmaceutical, telecommunications, financial services and other industries. Our unparalleled in-line and offline finishing capabilities allow us to produce complex personalized promotional packages that add impact and increase response rates. Customers include News America, International Masters Publishers, AT&T Wireless, Pfizer, JCPenney, Tiffany and Co., Mary Kay Cosmetics, and Prudential Insurance of America.
|
|
|

31
Our Products
Our Diversity
Books
With manufacturing facilities in North America, Latin America and Europe, Quebecor World is the largest international manufacturer of books. We provide a wide range of services for the world’s leading publishers of consumer, educational, religious and specialty books including Simon & Schuster, McGraw-Hill, AOL Time Warner, Scholastic, Reed Elsevier, Thomson, Houghton Mifflin, Pearson and Reader’s Digest.
Directories
Quebecor World is a leading printer of directories in North America and Latin America, and we recently began printing directories in Europe. We are a major supplier to all of the leading directory publishers in North America including SBC SMART Yellow Pages, Qwest Dex, Verizon Information Services, TransWestern Publishing, Yellow Book USA, Yellow Pages Group, and MTS Advanced.
|
|
|

32
Premedia Services
Que-Net MediaTM provides premedia services primarily to our print customers. These services include a full array of capabilities including creative, photography, digital prepress, color management, content management, automated publishing and workflow solutions. Que-Net Media’sTM customers include Sears, McGraw Hill, Advo, Primedia, and Hachette Filipacchi Medias.
Logistics
Quebecor World Logistics is the industry leader in print logistics services, offering complete customized door-to-door distribution planning management, transportation, delivery and tracking solutions to our customers. We are the largest business partner of the United States Postal Service (USPS) and have been formally recognized by the USPS as having the best on-time delivery record in the industry. Our customer list includes major players in all classes of mail such as Scholastic, Sears, L.L. Bean and Forbes.

*North America only.

33
Strong Leadership

David Boles, | John Paloian, |
Chief Operating Officer, | Chief Operating Officer, |
|
|
• Retail and Sunday | • Magazine and Catalog |
• Commercial and Direct | |
• Book Services | • Logistics Services |
• Directory Group |
|
• Premedia Services |
|
In North America 2002 was, like 2001, a difficult year in the printing industry. Across most markets, we continued to see soft demand, extremely competitive pricing and pressure on our margins. As the market leader, our customers, employees, investors, and suppliers looked to us to provide leadership in these times, to show them that, as uncertain as the markets were, a strong company can weather such events, and forge a path toward profitable growth. That is what a leader does.
In 2002 Quebecor World fulfilled its obligation to lead. We invested in new equipment, we invested in training and we gained market share. As a leader committed to the printing industry, part of our strategy is independent of cyclical market swings. We are the leading printer in the world and we understand that we need to constantly invest in new technology, to train and empower our employees, and to constantly grow our market share. It is what we do, regardless of natural economic cycles. Our commitment to this strategy is what has made us a leader and what will keep us at the forefront in delivering value to our constituents. That is what a leader does.
In 2002 we had impressive wins in all our business groups, thanks in part to the growing success of our one-stop shopping concept.
34

Our North American coast-to-coast gravure and offset platform coupled with our logistics and premedia businesses offer an exceptional range and mix of services. Our Logistics group is recognized by the U.S. Postal Service as having the best on-time performance in the USPS network. These and other advantages continue to attract the biggest and best publishers and retailers. For example, we do business with the top twenty magazine and catalog publishers in the U.S. and these relationships are growing because of our multi-service offering. That is what a leader does.
A leader also develops a strong bench strength of management. In 2002 we saw just how strong that bench strength was with the appointment of John Paloian and David Boles as Chief Operating Officers of QW North America. Together, they have more than thirty years of experience in the printing industry. John Paloian continues to oversee the Magazine/Catalog Group, but has reached into the ranks to appoint new leaders to manage the day-to-day responsibilities of his Group. He now also oversees the Commercial/Direct and Logistics Groups. Similarly, David Boles continues to oversee the Retail/Sunday Magazine Group, and has added the Book Services, Directory and Premedia Groups to his responsibilities. They and their teams have stepped into their new roles with vigor and clarity of purpose, continuing the strategic vision that their mentors taught them. Without missing a beat, Quebecor World moves on, eyes on the future, investing in its platform and people, and delivering more value to its customers day by day. That is what a leader does.
35
QW Europe
Successes and Challenges

Vincent Bastien, | John Dickin, |
President, | Executive Vice President, |
QW Europe | QW Europe |
In Europe we are committed to delivering margins that are broadly in line with those we enjoy in North America, expanding the range of services we can offer our customers, and increasing our geographic reach. In 2002 we made tremendous strides toward delivering on those commitments.
Our businesses outside France have been successfully restructured and margins have improved substantially so that they are now broadly in line with North American levels. This is particularly encouraging, given the global economic recession. In France however, we have experienced delays and difficulties primarily related to social and legal issues that are unique to France. Our French management team has a clearly defined strategy that is designed to systematically tackle these issues, ultimately bringing down the cost base to ensure that we can increase margins to acceptable levels.
Our geographic reach was expanded in 2002 with the acquisition of the European printing assets of Hachette Filipacchi Medias. This acquisition provided us with a unique opportunity to expand our gravure platform in Europe, enter the Belgium market, and secure a 10-year $400 million contract with
36
one of the world’s major publishers. Our Belgian gravure facility will also allow us to produce work for the U.K. market. As well, we have recently signed new Hachette contracts and renewed existing agreements in Spain, the United Kingdom, Sweden and France. This demonstrates the clear benefits of our strategy of partnering with the largest and most successful users of print media products.
In Spain we entered into our first European directory agreement with Telefónica de España. Our greenfield directory operation, Roto Alpha, based in Barcelona, began printing telephone directories. This partnership with Telefónica is also leading to new agreements with their subsidiaries in Latin America.
Our sales and marketing personnel have also made great strides in working together to ensure that our customers have the benefits of our multi-plant network. We are witnessing a growing trend of international companies centralizing their own purchasing operations and we have been able to deal successfully with them and provide mutually beneficial print solutions. One such company, IKEA, through its offices in Belgium, deals with Quebecor World for all its global printing requirements. This has resulted in work for our plants in the U.S., France, Sweden and Finland for IKEA operating companies in Denmark, Norway, Finland, Russia, Canada, USA, Kuwait, Saudi Arabia and Dubai.
In summary, 2002 was a year that saw good progress in achieving our goals; however, there is still much to do in France. We are committed to working through the problems there and strongly believe that we have the basis of a solid business that offers strategic benefits to the whole platform.
37
QW Latin America
Opportunity for Growth
Pablo Petit, | Guy Trahan, | Pedro Isasi, |
Regional Vice President, | President, | Regional Vice President, |
Mexico | QW Latin America | Peru, Argentina and |
|
| Colombia |
Growth is defined as the act or process of development. For Quebecor World Latin America, growth is not an end in itself but rather the means to an end - improving shareholder value. We are confident that reasonable, medium-term improvements in Latin American personal disposable income will drive significant increases in print demand. In the short term, we believe that the regional market is sufficiently fragmented to allow Quebecor World to achieve double-digit growth through increases in market share.
For Latin America, 2002 was a year of economic challenge, but the real difficulties of a 0.5% decrease in regional Gross Domestic Product, average regional inflation of 12% and devaluations in Argentina and Brazil proved the soundness of Quebecor World’s strategy. Quebecor World Latin America marked its fifth year of operations in the region with a 13% growth in sales and a 37% increase in operating profit before restructuring and other charges, all calculated in U.S. dollars. The strategy to accomplish this was simple:
• Develop a network of plants, diversified by product and location, to minimize risks
• Cover all Latin American population centers with a global offering
• Leverage communication networks to standardize products and reduce costs
• Increase product specialization.
38
In five years, the Company has established operations in Mexico, Colombia, Peru, Chile, Argentina and Brazil. Acquisitions were complemented with substantial organic growth as the firm installed 23 presses and 18 binders to serve new clients. In 2002, weakness in the Southern Cone nations of Argentina, Brazil and Chile were offset by stronger economic performance in Peru and Mexico. Product diversification has increased as strong growth in books (particularly textbooks) and directories has balanced market weakness in magazines and inserts. Country and product specific risk has been reduced.
Latin America is a market of almost 500 million consumers but it is a region of large distances and great cultural diversity. To succeed, Quebecor World has located facilities in each of the largest population centers and staffed the plants with capable local management. Individual plants are linked with fibre optic and satellite communications and processes and quality are standardized. This permits our growing local sales forces to sell the network even as individual plants can specialize in particular products.
This network is also linked to the Company’s North American and European clients and facilities. Multinational clients can source print production from one supplier but benefit from distributed manufacturing. Less time-sensitive clients who may have moved production to Asia in search of reduced costs can now achieve the same financial benefits in Latin America but with dramatically improved delivery times.
These advantages have translated into results in 2002. Multi-year agreements have been signed with Telefónica de España, Reader’s Digest, Editora Abril, Book of Hope, Rezza Editores, Zamora Ediciones, and A-Z Editores, among others. Ongoing relationships have grown with multi-regional clients such as Wal-Mart, Planeta, Santillana, Avon, Thomas Nelson and McGraw Hill. Management looks to 2003 with confidence that the market successes of 2002 will be the basis for sustained earnings growth in the coming year.
39
Board of Directors
The Board of Directors of the Company considers good corporate governance practices an important factor in the overall success of Quebecor World Inc. The Company has recently approved and adopted various new and revised corporate governance practices following the comprehensive review of its corporate governance undertaken in 2002. These new and revised practices were adopted in order to best comply with the proposed TSX Disclosure and Continued Listing Requirements and Guidelines (and other Canadian securities legislation), as well as the NYSE proposed Corporate Governance Listing Standards, the Sarbanes-Oxley Act and other U.S. securities legislation to which the Company is subject.
Following its corporate governance review, the Board of Directors adopted new mandates (a general description of which is provided below), which will be effective immediately following Quebecor World’s Annual Meeting of Shareholders to be held on April 2, 2003:
• A new mandate for the Board of Directors, recognizing that, although Quebecor World’s management conducts the Company’s day-to-day operations, the Board of Directors has a duty of stewardship and will regularly assess and monitor the performance of management.
• A revised mandate for the Audit Committee, pursuant to which the Audit Committee will assist the Board of Directors in overseeing the Company’s financial controls and reporting. This committee will also monitor whether the Company is in compliance with its financial covenants and legal and regulatory requirements governing financial disclosure matters.
• A new mandate for the newly created “Nominating and Corporate Governance Committee,” pursuant to which the committee will be responsible for assisting the Board in developing the Company’s approach to corporate governance issues, proposing new board nominees and assessing the effectiveness of the Board and its committees, their respective chairs and individual directors.
• A revised mandate for the Human Resources and Compensation Committee (formerly “Compensation Committee”), pursuant to which the committee will assist the Board of Directors in discharging its responsibilities relating to executive and other human resources hiring, assessment, compensation and succession planning.
• A revised mandate for the Pension Committee, providing that the committee will assist the Board of Directors in discharging its responsibilities with respect to the Company’s pension plans.
• A new mandate for the Executive Committee, pursuant to which the Executive Committee will deal with such matters as cannot be effectively dealt with by the Board of Directors in a timely fashion.
• A formal mandate for the non-executive Chairman of the Board, confirming his responsibility for taking all reasonable measures to ensure that the Board of Directors fully executes its mandate and that directors clearly understand and respect the boundaries between Board and management responsibilities.
• A formal mandate for the Chief Executive Officer of the Company for the management of Quebecor World’s strategic and operational agenda, and for the execution of the Board’s decisions.
Effective February 3, 2003, the Company has also adopted:
• A policy that prohibits both the extension of any new personal loans to directors or executive officers of the Company and the renewal of, or material modification to, any existing personal loans to such persons.
• A policy that permits individual members of the Board of Directors and certain committees to seek legal or expert advice from a source independent of management at Quebecor World’s expense.
40
The Right Honourable Brian Mulroney |
| Raymond Lemay |
Chairman |
| Corporate Director |
QUEBECOR WORLD INC. |
|
|
Senior Partner |
| Eileen A. Mercier |
OGILVY RENAULT |
| Vice-Chair of the Board, |
|
| Workplace Safety and Insurance Board (Ontario) |
Érik Péladeau |
|
|
Vice Chairman and Senior Executive Vice President |
| Jean Neveu |
QUEBECOR WORLD INC. |
| Chairman |
Vice Chairman |
| QUEBECOR INC. |
QUEBECOR MEDIA INC. and QUEBECOR INC. |
| and GROUPE TVA INC. |
|
|
|
Reginald K. Brack |
| Robert Normand |
Former Chairman and Chief Executive Officer |
| Corporate Director |
TIME INC. |
|
|
|
| Pierre Karl Péladeau |
Charles G. Cavell |
| President and Chief Executive Officer |
Deputy Chairman |
| QUEBECOR MEDIA INC., QUEBECOR INC. |
QUEBECOR WORLD INC. |
| and Chairman, NURUN INC. |
|
|
|
Robert Coallier |
| Alain Rhéaume |
President and Chief Executive Officer |
| President and Chief Executive Officer |
CERVEJARIAS KAISER |
| MICROCELL PCS |
|
|
|
Michel Desbiens |
|
|
President and Chief Executive Officer |
|
|
QUEBECOR WORLD INC. |
|
|
|
|
|
James Doughan |
|
|
Corporate Director, Consultant |
|
|
|
|
|
|
|
|
|
|
|
41
SENIOR MANAGEMENT |
| Magazine and Catalog |
| Pedro Isasi |
QUEBECOR WORLD INC. |
|
|
| Regional Vice President, Peru, |
|
| Rick Marcoux |
| Argentina and Colombia |
|
| President, Magazine Services |
|
|
Michel Desbiens |
|
|
| Reynaldo Mina |
President and Chief Executive Officer |
| George Zengo |
| Vice President, Sales, Brazil |
|
| President, |
|
|
Érik Péladeau |
| Catalog and Direct Services |
| Pablo Petit |
Vice Chairman and |
|
|
| Regional Vice President, Mexico |
Senior Executive Vice President |
|
|
|
|
|
| Que-Net Media™ |
| Ron Steele |
Claude Hélie |
|
|
| Vice President, Operations, Directories |
Executive Vice President and |
| John Bertuccini |
|
|
Chief Financial Officer |
| President |
| Alberto Umaña |
|
|
|
| Vice President, Operations, Book Division |
|
| Retail and Sunday Magazine |
|
|
|
|
|
| Carlos Herman Aguirre Vargas |
QW NORTH AMERICA |
| Brian Freschi |
| General Manager, Quebecor World Chile |
|
| President |
|
|
David Boles |
|
|
| Ruben Vicente |
Chief Operating Officer, |
| Hans Nielsen |
| Vice President, Human Resources |
Quebecor World North America |
| President, Retail Offset Group |
|
|
|
|
|
|
|
John Paloian |
| Tony Galasso |
| CORPORATE OFFICERS |
Chief Operating Officer, |
| President, Magazine, Catalog and |
|
|
Quebecor World North America |
| Specialty Groups, Canada |
| Denis Aubin |
|
|
|
| Senior Vice President, |
John Bertuccini |
| East Group Canada |
| Corporate Finance and Treasury |
President, International Sales |
|
|
|
|
|
| Richard Tremblay |
| Yves Bertrand |
Rick Lane |
| President |
| Vice President, Internal Audit |
Executive Vice President, |
|
|
|
|
North America Services |
|
|
| David Blair |
|
|
|
| Senior Vice President, Manufacturing, |
Heidi Nolte |
| QW EUROPE |
| Environment and Technology |
Senior Vice President, |
|
|
|
|
Information Technology |
| Vincent Bastien |
| Diane Dubé |
|
| President |
| Assistant Vice President, |
Daniel O’Brien |
|
|
| Corporate Controller |
Senior Vice President, Paper Operations |
| John Dickin |
|
|
|
| Executive Vice President |
| Carl Gauvreau |
Paul Runko |
|
|
| Senior Vice President |
Vice President, Client Financial Services |
| Mike Young |
| and Chief Accounting Officer |
|
| Senior Vice President, |
|
|
Mark Shapiro |
| International Financial Operations |
| Bruce W. Hannah |
Senior Vice President, Human Resources |
| and Control |
| Vice President, Human Resources |
|
|
|
|
|
Troy Reed |
| Paul Jones |
| Claire Lanctôt |
Executive Vice President, Operations |
| Vice President, International Sales |
| Vice President, Business Development |
|
|
|
|
|
Robert Stepusin |
| Antonio Fernandez Jurado |
| Nicolas Lavoie |
Executive Vice President, Finance |
| Managing Director, Spain |
| Assistant Treasurer, Corporate Finance |
and Administration |
|
|
|
|
|
| Erwin Loderbauer |
| Raynald Lecavalier |
Book Services |
| Managing Director, Austria |
| Vice President, Corporate General |
|
|
|
| Counsel and Secretary |
Jerry Allee |
| Rainier Ruckelhausen |
|
|
President |
| Director Sales and Marketing, Germany |
| Sylvain Levert |
|
|
|
| Vice President, Corporate Services |
Commercial and Direct |
| Tomas Salzmann |
| and Logistics (Switzerland) |
|
| Managing Director, Nordic |
|
|
Fran Canzano |
|
|
| Pierre R.Martel |
President |
| Thierry Zemour |
| Vice President, Taxation and Real Estate |
|
| Chief Information Officer |
| (Switzerland) |
Directory Group |
|
|
|
|
|
|
|
| Jeremy Roberts |
David Bragen |
| QW LATIN AMERICA |
| Vice President, Corporate Finance |
President |
|
|
| and Investor Relations |
|
| Guy Trahan |
|
|
Logistics Services |
| President |
|
|
|
|
|
|
|
Daniel J. Scapin |
| Sean Twomey |
|
|
President |
| Senior Vice President |
|
|
|
|
|
|
|
|
| Tony Scaringi |
|
|
|
| Vice President, Finance |
|
|
42
|
|
|
|
| |
|
|
|
|
|
|
Quebecor World |
| Quebecor World |
| Quebecor World |
|
Head Office |
| North America |
| Latin America |
|
612 Saint Jacques Street |
| 340 Pemberwick Road |
| Maipu 939, 1 er piso |
|
Montreal, Quebec |
| Greenwich, CT 06831 |
| (1006) Buenos Aires |
|
Canada H3C 4M8 |
| United States |
| Argentina |
|
Tel.: (514) 954-0101 |
| Tel.: (203) 532-4200 |
| Tel.: 54 114 313 7107 |
|
(800) 567-7070 |
| Fax: (203) 532-4373 |
| Fax: 54 114 314 6266 |
|
Fax: (514) 954-9624 |
|
|
|
|
|
|
|
|
|
|
|
|
| Quebecor World Europe |
|
|
|
Quebecor World |
| 114, avenue Charles de Gaulle |
|
|
|
Route des Arsenaux 15 |
| 92522 Neuilly-sur-Seine |
|
|
|
1700 Fribourg |
| France |
|
|
|
Switzerland |
| Tel.: 33 (1) 55 62 11 11 |
|
|
|
Tel.: 41 26 347 4777 |
| Fax: 33 (1) 55 62 11 01 |
|
|
|
Fax: 41 26 347 4778 |
|
|
|
|
|
43
Five-Year Financial Review
Income, Cash Provided from Operating Activities and Free Cash Flow (in millions of U.S. dollars except per share data)
|
| 2002 |
| Q4 |
| Q3 |
| Q2 |
| Q1 |
| 2001 |
| 2000 |
| 1999 |
| 1998 |
|
|
|
|
|
|
|
|
|
|
|
|
|
|
|
|
|
|
|
|
|
Revenues |
| 6,242.0 |
| 1,693.4 |
| 1,617.9 |
| 1,471.5 |
| 1,459.2 |
| 6,320.1 |
| 6,521.1 |
| 4,952.5 |
| 3,808.2 |
|
Cost of sales |
| 4,842.9 |
| 1,324.1 |
| 1,238.7 |
| 1,140.0 |
| 1,140.1 |
| 4,878.9 |
| 4,991.7 |
| 3,846.1 |
| 2,979.9 |
|
Selling, general and administrative expenses |
| 500.7 |
| 123.1 |
| 127.9 |
| 120.3 |
| 129.4 |
| 485.6 |
| 459.5 |
| 347.9 |
| 287.4 |
|
Depreciation and amortization |
| 335.6 |
| 85.9 |
| 83.4 |
| 83.4 |
| 82.9 |
| 337.8 |
| 345.1 |
| 286.0 |
| 223.8 |
|
Operating income before restructuring and other charges |
| 562.8 |
| 160.3 |
| 167.9 |
| 127.8 |
| 106.8 |
| 617.8 |
| 724.8 |
| 472.5 |
| 317.1 |
|
Restructuring and other charges |
| 19.6 |
| 19.6 |
| — |
| — |
| — |
| 270.0 |
| (2.7 | ) | 180.0 |
| — |
|
Operating income |
| 543.2 |
| 140.7 |
| 167.9 |
| 127.8 |
| 106.8 |
| 347.8 |
| 727.5 |
| 292.5 |
| 317.1 |
|
Financial expenses |
| 170.2 |
| 42.7 |
| 39.8 |
| 42.2 |
| 45.5 |
| 208.8 |
| 231.5 |
| 122.2 |
| 64.3 |
|
Income taxes |
| 90.9 |
| 26.3 |
| 29.1 |
| 20.8 |
| 14.7 |
| 52.0 |
| 137.7 |
| 48.4 |
| 72.9 |
|
Minority interest |
| 2.8 |
| 1.1 |
| 0.5 |
| 0.6 |
| 0.6 |
| 3.2 |
| 2.4 |
| 12.7 |
| 3.2 |
|
Goodwill amortization, net of income taxes |
| — |
| — |
| — |
| — |
| — |
| 61.4 |
| 60.5 |
| 31.7 |
| 17.0 |
|
Net income before restructuring and other special charges |
| 303.4 |
| 94.7 |
| 98.5 |
| 64.2 |
| 46.0 |
| 248.7 |
| 293.4 |
| 204.5 |
| 159.7 |
|
Net income** |
| 279.3 |
| 70.6 |
| 98.5 |
| 64.2 |
| 46.0 |
| 22.4 |
| 295.4 |
| 77.5 |
| 159.7 |
|
Non-cash items in net income: |
|
|
|
|
|
|
|
|
|
|
|
|
|
|
|
|
|
|
|
Depreciation of property, plant and equipment |
| 313.2 |
| 79.9 |
| 77.8 |
| 78.2 |
| 77.3 |
| 314.9 |
| 325.3 |
| 269.7 |
| 214.2 |
|
Amortization of goodwill and deferred charges |
| 22.4 |
| 6.0 |
| 5.6 |
| 5.2 |
| 5.6 |
| 84.3 |
| 80.3 |
| 48.0 |
| 26.6 |
|
Non-cash portion of restructuring and other charges |
| (0.5 | ) | (0.5 | ) | — |
| — |
| — |
| 142.6 |
| (7.0 | ) | 111.3 |
| — |
|
Future income taxes |
| 56.7 |
| 16.5 |
| 17.9 |
| 10.0 |
| 12.3 |
| (42.8 | ) | 91.8 |
| (8.7 | ) | 29.6 |
|
Other |
| 8.3 |
| 5.3 |
| (1.1 | ) | 2.0 |
| 2.1 |
| 10.5 |
| (0.1 | ) | 10.1 |
| (5.3 | ) |
Changes in non-cash balances related to operations: |
|
|
|
|
|
|
|
|
|
|
|
|
|
|
|
|
|
|
|
Trade receivables |
| (91.0 | ) | 76.1 |
| (117.8 | ) | 89.1 |
| (138.4 | ) | 190.0 |
| 128.6 |
| 175.8 |
| 20.1 |
|
Inventories |
| (21.0 | ) | 30.0 |
| (17.7 | ) | (22.8 | ) | (10.5 | ) | 77.2 |
| 8.8 |
| 34.2 |
| 29.0 |
|
Trade payables and accrued liabilities |
| (18.4 | ) | 33.0 |
| 55.1 |
| (106.5 | ) | — |
| (138.9 | ) | 18.6 |
| (44.9 | ) | (49.8 | ) |
Other current assets and liabilities |
| 43.7 |
| 35.3 |
| 27.8 |
| (8.9 | ) | (10.5 | ) | 20.3 |
| (48.6 | ) | 33.0 |
| (4.7 | ) |
Other non-current assets and liabilities |
| (79.3 | ) | (51.3 | ) | (15.9 | ) | (1.1 | ) | (10.9 | ) | (104.0 | ) | 24.7 |
| 4.1 |
| (5.5 | ) |
Cash provided from operating activities |
| 513.4 |
| 300.8 |
| 130.2 |
| 109.4 |
| (27.0 | ) | 576.5 |
| 917.8 |
| 710.1 |
| 413.9 |
|
Free cash flow from operations* |
| 319.8 |
| 262.4 |
| 97.4 |
| 40.1 |
| (80.1 | ) | 287.2 |
| 747.3 |
| 552.6 |
| 124.8 |
|
Per share data |
|
|
|
|
|
|
|
|
|
|
|
|
|
|
|
|
|
|
|
Earnings** |
|
|
|
|
|
|
|
|
|
|
|
|
|
|
|
|
|
|
|
Diluted |
| 1.76 |
| 0.44 |
| 0.64 |
| 0.40 |
| 0.28 |
| — |
| 1.91 |
| 0.54 |
| 1.29 |
|
Diluted before restructuring and other special charges |
| 1.92 |
| 0.61 |
| 0.64 |
| 0.40 |
| 0.28 |
| 1.58 |
| 1.90 |
| 1.55 |
| 1.29 |
|
* Cash provided from operating activities, less capital expenditures net of proceeds from disposals, and preferred share dividends.
** Effective January 1, 2002, net income and earnings per share reflect the new accounting policy adopted by the Company under which goodwill is no longer amortized.
44
Consolidated Balance Sheets (in millions of U.S. dollars)
|
| 2002 |
| Q4 |
| Q3 |
| Q2 |
| Q1 |
| 2001 |
| 2000 |
| 1999 |
| 1998 |
|
|
|
|
|
|
|
|
|
|
|
|
|
|
|
|
|
|
|
|
|
Assets |
|
|
|
|
|
|
|
|
|
|
|
|
|
|
|
|
|
|
|
Cash and cash equivalents |
| 2.7 |
| 2.7 |
| 1.4 |
| 1.3 |
| 3.9 |
| 85.5 |
| 52.7 |
| 3.6 |
| 0.3 |
|
Trade receivables |
| 480.5 |
| 480.5 |
| 538.4 |
| 429.0 |
| 509.6 |
| 368.5 |
| 587.1 |
| 743.3 |
| 695.9 |
|
Inventories |
| 409.4 |
| 409.4 |
| 430.4 |
| 417.8 |
| 387.8 |
| 377.1 |
| 461.4 |
| 486.2 |
| 233.0 |
|
Income taxes receivable |
| 21.7 |
| 21.7 |
| 41.8 |
| 50.1 |
| 24.9 |
| 36.6 |
| 36.1 |
| 31.2 |
| 0.2 |
|
Future income taxes |
| 27.8 |
| 27.8 |
| 58.2 |
| 58.2 |
| 58.0 |
| 58.0 |
| 58.1 |
| 36.4 |
| 9.4 |
|
Prepaid expenses |
| 25.2 |
| 25.2 |
| 28.0 |
| 30.0 |
| 23.1 |
| 24.1 |
| 26.0 |
| 27.8 |
| 25.1 |
|
Total current assets |
| 967.3 |
| 967.3 |
| 1,098.2 |
| 986.4 |
| 1,007.3 |
| 949.8 |
| 1,221.4 |
| 1,328.5 |
| 963.9 |
|
Property, plant and equipment, net |
| 2,610.6 |
| 2,610.6 |
| 2,635.1 |
| 2,703.0 |
| 2,662.8 |
| 2,634.0 |
| 2,683.0 |
| 2,895.3 |
| 2,222.0 |
|
Goodwill |
| 2,514.3 |
| 2,514.3 |
| 2,493.3 |
| 2,500.0 |
| 2,462.9 |
| 2,470.7 |
| 2,459.5 |
| 2,526.7 |
| 639.4 |
|
Other assets |
| 113.3 |
| 113.3 |
| 123.8 |
| 123.5 |
| 130.7 |
| 132.0 |
| 156.9 |
| 153.8 |
| 81.2 |
|
Total assets |
| 6,205.5 |
| 6,205.5 |
| 6,350.4 |
| 6,312.9 |
| 6,263.7 |
| 6,186.5 |
| 6,520.8 |
| 6,904.3 |
| 3,906.5 |
|
|
|
|
|
|
|
|
|
|
|
|
|
|
|
|
|
|
|
|
|
Liabilities and shareholders’ equity |
|
|
|
|
|
|
|
|
|
|
|
|
|
|
|
|
|
|
|
Bank indebtedness |
| 0.3 |
| 0.3 |
| 0.1 |
| 0.1 |
| 0.1 |
| 0.1 |
| 3.1 |
| 5.6 |
| 15.6 |
|
Trade payables and accrued liabilities |
| 1,067.0 |
| 1,067.0 |
| 1,004.1 |
| 960.7 |
| 1,037.2 |
| 1,024.1 |
| 1,155.5 |
| 1,103.2 |
| 606.5 |
|
Income and other taxes payable |
| 70.8 |
| 70.8 |
| 89.8 |
| 70.2 |
| 46.9 |
| 63.1 |
| 42.1 |
| 70.0 |
| 42.4 |
|
Current portion of long-term debt and convertible notes |
| 38.5 |
| 38.5 |
| 43.2 |
| 49.3 |
| 50.2 |
| 57.0 |
| 87.2 |
| 77.2 |
| 51.1 |
|
Total current liabilities |
| 1,176.6 |
| 1,176.6 |
| 1,137.2 |
| 1,080.3 |
| 1,134.4 |
| 1,144.3 |
| 1,287.9 |
| 1,256.0 |
| 715.6 |
|
Long-term debt |
| 1,668.6 |
| 1,668.6 |
| 1,937.0 |
| 2,037.8 |
| 2,046.9 |
| 1,961.9 |
| 2,015.6 |
| 2,582.9 |
| 1,140.9 |
|
Other liabilities |
| 228.9 |
| 228.9 |
| 251.8 |
| 247.1 |
| 243.5 |
| 245.6 |
| 290.8 |
| 290.2 |
| 155.6 |
|
Future income taxes |
| 291.7 |
| 291.7 |
| 282.8 |
| 267.9 |
| 254.7 |
| 234.0 |
| 326.1 |
| 255.0 |
| 255.3 |
|
Convertible notes |
| 115.0 |
| 115.0 |
| 114.5 |
| 114.1 |
| 113.7 |
| 113.3 |
| 105.9 |
| 179.8 |
| 58.2 |
|
Minority interest |
| 20.9 |
| 20.9 |
| 9.8 |
| 13.2 |
| 14.4 |
| 14.2 |
| 20.6 |
| 22.0 |
| 17.4 |
|
Shareholders’ equity |
| 2,703.8 |
| 2,703.8 |
| 2,617.3 |
| 2,552.5 |
| 2,456.1 |
| 2,473.2 |
| 2,473.9 |
| 2,318.4 |
| 1,563.5 |
|
Total liabilities and shareholders’ equity |
| 6,205.5 |
| 6,205.5 |
| 6,350.4 |
| 6,312.9 |
| 6,263.7 |
| 6,186.5 |
| 6,520.8 |
| 6,904.3 |
| 3,906.5 |
|
45
Free Cash Flow vs
In the past three years, Quebecor World has generated $1.4 billion of free cash flow from operations compared to mandatory debt repayments over the coming three years of only $75 million.
* Funded debt (long-term debts and convertible notes).
|
|
|

Valuation Comparisons
During the period 1990-2002, diluted earnings per share grew 14% annually. With a price-earnings multiple of approximately 10 times, an investment in Quebecor World shares provides growth at a reasonable price when compared to the S&P/TSX or the S&P 500 companies generally.
(1) Using closing price as at February 7, 2003 and 2003 First Call consensus. (2) CAGR: Compounded Annual Growth Rate
|
|
|

46
Free Cash Flow Yield
Over the past 3 years, Quebecor World has generated $1.4 billion of free cash flow from operations, representing an average of $3.04 per share annually. |
|
|

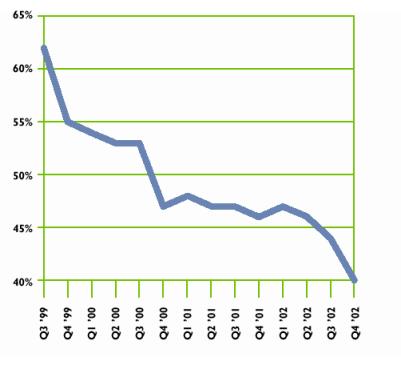
Debt-to-Capitalization Ratio
Quebecor World’s ability to generate free cash flow has allowed it to reduce its debt-to-capitalization ratio to 40:60 at December 31, 2002 compared with a high of 62:38 at the time of the World Color acquisition.
|
|
|
47
|
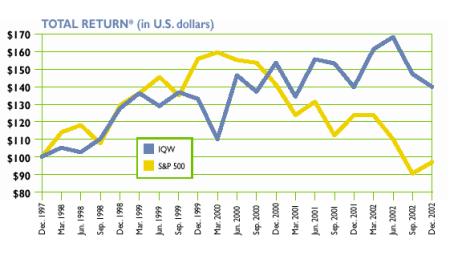
Average Trading Volume
2000 |
| 308,674 |
|
2001 |
| 369,838 |
|
2002 |
| 397,872 |
|
* Value of $100 invested at the end of 1997 in Quebecor World and the S&P 500.
New York Stock Exchange (in U.S.dollars)
|
| High(1) |
| Low(1) |
| Close |
| |||
2000 |
| $ | 26.25 |
| $ | 17.56 |
| $ | 25.19 |
|
2001 |
| $ | 27.61 |
| $ | 19.23 |
| $ | 22.56 |
|
2002 |
| $ | 29.60 |
| $ | 20.30 |
| $ | 22.32 |
|
Toronto Stock Exchange (in CDN dollars)
|
| High(1) |
| Low(1) |
| Close |
| |||
2000 |
| $ | 39.10 |
| $ | 25.60 |
| $ | 37.60 |
|
2001 |
| $ | 42.65 |
| $ | 30.25 |
| $ | 35.88 |
|
2002 |
| $ | 46.09 |
| $ | 32.25 |
| $ | 35.00 |
|
(1) Closing Prices
Stock Listing
Quebecor World Inc. Subordinate Voting Shares are listed on the New York Stock Exchange and on the Toronto Stock Exchange under the symbol IQW.
Annual Meeting
The Annual General Meeting will be held at 10:00 am on April 2, 2003, at:
Le Windsor |
1170 Peel Street |
Montreal, Quebec |
Annual Information Form
The Annual Information Form may be obtained by writing to:
Corporate Secretary Quebecor World Inc.
612 Saint Jacques Street
Montreal, Quebec
H3C 4M8
Or through SEDAR at www.sedar.com
Transfer Agent and Registrar
Computershare Trust Company of Canada
Place Montreal Trust
1800 McGill College
Montreal, Quebec
H3A 3K9
Co-Transfer Agents
Computershare Trust Company, Inc.
Denver, Colorado
Auditors
KPMG LLP
Pour obtenir la version française de ce rapport annuel, s’adresser à :
Quebecor World Inc., 612, rue Saint-Jacques, Montréal (Québec), H3C 4M8
Version électronique : www.quebecorworld.com
48
[GRAPHIC]
Produced by St. Remy Media Inc.
Concept and Design: Market Fusion
Designer: François Daxhelet
Photography: Jim Arbogast; Pierre Crié; Ghislain & Marie David de Lossy;
John Kelly; Malcolm Sanders; Micheal Simpson; The Buffalo News; Daniel Wiener.
Prepress and Printing: Imprimerie Quebecor World Graphique-Couleur
Cover: Centura Dull Cover 100 lb.
Text: Centura Dull Text 100 lb.
Financial Section: Domtar Cream Text 80 lb.
Printed in Canada
49
TABLE OF
Contents
MANAGEMENT’S DISCUSSION AND ANALYSIS OF FINANCIAL CONDITION AND RESULTS OF OPERATIONS | |
|
|
|
|
|
|
|
|
|
|
|
|
|
|
|
|
|
|
|
|
MANAGEMENT’S DISCUSSION AND ANALYSIS OF
Financial Condition and Results of Operations
OVERVIEW
Quebecor World Inc. is the largest commercial print media services company in the world. We are market leaders in most of our product categories and geographies. This market-leading position has been built through a combination of successfully integrated acquisitions, investment in key strategic technologies and a commitment to build long-term partnerships with the world’s leading print media customers.
We have facilities in the United States, Canada, France, the United Kingdom, Spain, Switzerland, Sweden, Finland, Austria, Belgium, Brazil, Chile, Argentina, Peru, Colombia, Mexico and India.
For the year ended December 31, 2002, the Company reported diluted earnings per share of $1.76 compared to nil in 2001. These results incorporate restructuring and other special charges of a net $19.6 million or $0.16 per share compared with $270 million or $1.58 per share in 2001. Excluding the effect of the restructuring and other special charges and removing the impact of goodwill amortization in the previous year, 2002 resulted in diluted earnings per share of $1.92 compared with $1.99 in 2001. The reduction in earnings, presented on a comparable basis, was affected mostly by market conditions in two major sectors of our business: the French operations and the Commercial & Direct segment in North America. However, the Company remained focused in its other business segments and on its financial condition as illustrated by the strong generation of free cash flow and repayment of debt.
We generated free cash flow of $320 million, compared with $287 million for the same period in 2001, an increase of 11%. Free cash flow was primarily dedicated to reduce our debt, and this contributed to an 18% reduction in our financial expenses this year compared with 2001. Our cash coverage of fixed charges ratio has increased to a comfortable level above five times and our debt to capitalization ratio decreased to 40:60 from 46:54 at the end of December 2001.
Also, in 2002, following the continued struggle in France and the identification of other cost reduction opportunities in North America, the Company took additional restructuring charges which also included asset and investment write-downs and overspending on its 2001 restructuring initiatives, net of the reversal of unused reserves from 2001.
In 2001, it was in response to the significant drop in volume, that we announced a restructuring plan to shut down under-performing business units, redeploy assets and reduce our workforce. We turned the problem of unsold capacity, impacting the entire industry, into an opportunity by undertaking a restructuring that would result in fewer, larger and more specialized plants, with essentially the same capacity, but approximately 8% fewer employees. Most of the 2001 restructuring program was completed in 2002 and benefits began to accrue to the income statement in the back half of the year for our North American business groups and in European countries other than France.
Management’s focus on cost reduction, free cash flow and debt repayment resulted in higher levels of efficiency, which has uniquely positioned us to benefit from operating leverage and a solid financial condition as we enter 2003.
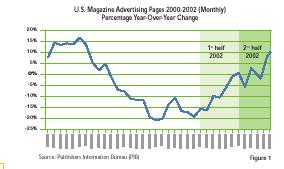
MARKET AND SEGMENT REVIEW
The print media industry ended a difficult year in 2001, facing unexpected declines in volume impacting most of our business groups in all three geographic regions. As we began 2002, it was expected that there would be little or no recovery in the industry, at least for the first six months.
The first half of 2002 turned out as expected, with the difficult economic environment persisting. Magazine advertising pages, as measured by the Publishers Information Bureau, remained down compared to last year for the first two quarters (figure 1). Volume pressures continued and prices were lower compared to 2001, resulting from excess industry capacity and an increased competitive environment. According to the U.S. Federal Reserve Board, the average printing capacity utilization in 2002 was 78.8%, which is one of the lowest rates in the last ten years (figure 2). The environment in the second half was stronger and allowed the Company to increase earnings and margin in the fourth quarter.
2
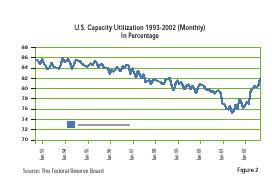
Magazine & Catalog
The Magazine & Catalog Group’s revenues fell by 6% to $1,671 million in 2002, from $1,785 million in 2001. The 4th quarter was the only period in which we benefited from an increase in revenues, as the magazine advertising pages (see figure 1) improved somewhat. Despite the revenue shortfall year-to-date, operating margins increased in each quarter in 2002, compared to the same periods in 2001. This is a direct result of the benefits of our restructuring programs and strict attention to costs.
The Magazine & Catalog Group is our largest business platform and contributed to our market share growth by attracting successful customers such as L.L.Bean, which recently contracted to place 100% of their catalog business and distribution with Quebecor World.
Commercial & Direct
The Commercial & Direct Group’s revenues fell by 17% to $687 million in 2002, from $829 million in 2001. This Group suffered significantly in the 4th quarter of 2001 and this trend continued in 2002 with the weak promotional advertising environment.
However, the impact on operating income was softened by plant closures and the redeployment of equipment as well as the cost reductions put in place in early 2002.
During 2002, we have seen an accelerated trend toward vendor consolidation. Businesses are looking to fewer vendors who can provide more integrated turn-key services than ever before. Our breadth of capabilities coupled with our multi-facility platform position us to be a strategic partner to our clients and not just a vendor. By fine-tuning our equipment and leveraging the whole Quebecor World platform, we can satisfy the most demanding customers, such as AT&T Wireless and Johnson & Johnson, whose requirements can only be met by a company with our resources and capabilities.
Retail
The Retail Group’s revenues increased by 9% to $1,173 million in 2002, from $1,074 million in 2001. This increase includes incremental revenue of $48 million from the acquisition of Retail Printing Corporation, which took place in July 2001. Excluding the incremental impact of this acquisition, revenues, as well as operating income, were favourable in 2002 when compared to 2001. The success in this market segment is derived from strategic capital investments in both rotogravure and offset, restructuring initiatives and our numerous gains in the area of new customer contracts. Our performance in 2002 is particularly rewarding given the price pressures we experienced in the retail print market in 2002. We have invested heavily in this market segment over the last few years to build the only coast-to-coast gravure and offset platform in North America. Our strategy is working, as a number of large, growing and successful retailers chose Quebecor World as their leading service provider in 2002.
Book Services
The Book Group’s revenues fell by 4% to $513 million in 2002, from $532 million in 2001, but operating income and margin improved compared to year 2001. Overall, our business performed well, with solid improvement in our trade book facilities and continuing strength in our educational markets. However, other book market segments remained soft, with a lower level of reprint activity.
The closing of the Hawkins facility, redeployment of assets to the Kingsport and Versailles plants, and the expansion of our Dubuque facility to service the growing educational market, better position the Group to compete in 2003. While the start-up of both new and transferred equipment at Kingsport presented challenges to us in 2002, we are confident that our turnaround plan will get the situation under control in 2003 as significant changes in executive management and plant management were made to specifically address this issue.
Directory
The Directory Group’s revenues fell by 5% to $474 million in 2002, from $501 million in 2001. This business has seen significant vendor consolidation primarily due to new single source outsourcing programs instituted at a few large publishers.
The Group’s focus in 2002 was on cost containment, which resulted in increased operating income and margin in 2002 when compared to 2001. Successful cost containment was achieved via the consolidation of group wide prepress operations into
3
Financial Condition and Results of Operations (cont'd)
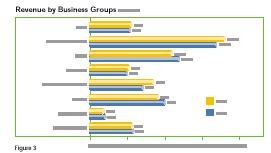
regional prepress centers and the continued investment in more efficient manufacturing equipment.
Other Revenues
Other sources of revenues in North America include Que-Net Media TM (pre-media services), Logistics and the Eastern Canada Group, which services eastern Canada and exports into the U.S from Canadian facilities.
The Que-Net Media TM Group’s revenues fell by 15% to $95 million in 2002, from $112 million in 2001. This business offers services to our main print media businesses, and therefore, has suffered from the decline in volume experienced elsewhere in the platform. 2002 was a year of transition for our pre media services group, as significant focus was placed on cost containment and restructuring. In addition, senior management changes were made to better position this business unit for success in 2003.
The Logistics Group’s revenues increased to $187 million in 2002, from $151 million in 2001, a 24% increase. We are an industry leader in logistics services, offering complete customized door-to-door distribution planning management, transportation, delivery and tracking solutions to our customers. We are recognized by the United States Postal Services as the largest client and of having the best on-time performance into their network.
The Eastern Canada Group’s revenues fell by 2% to $264 million in 2002, from $269 million in 2001. Approximately half of Eastern Canada’s revenue base has traditionally been generated by the U.S. market. The difficult economic environment in the United States had a shrinkage effect on those markets with depressed advertising page counts lingering on until late in the third quarter. Despite steady economic growth in the Canadian economy, the domestic printing markets were relatively stagnant.
Europe
The European revenues increased by 10% to $982 million in 2002, from $891 million in 2001. This increase is essentially due to the Company’s purchase of the printing assets of Hachette Filipacchi and the positive impact of currency movements. Our European operations, excluding France, improved revenues, operating income and margins compared to year 2001. However, our European results were negatively impacted by the underperformance of our French operations, which represent approximately half of our European platform.
The French operations were hard hit in 2002 with operating income and margins declining. France continues to feel the effect of industry over capacity and labor issues.
In the fourth quarter, the Company approved a restructuring plan to reduce costs, including the additional reduction of employee positions and the decommissioning of certain non-competitive assets.
Latin America
The Latin America Group’s revenues increased by 13% to $183 million in 2002, from $161 million in 2001. Overall, the Group’s operating income increased significantly from 2001 as did margin. This performance has
European Financial Highlights ($ millions)
(Before restructuring and other charges)
|
| 2002 |
| 2001 |
| 2000 |
| |||
Europe excluding France |
|
|
|
|
|
|
| |||
Revenues |
| $ | 534.9 |
| $ | 472.7 |
| $ | 458.1 |
|
Operating income |
| $ | 48.6 |
| $ | 42.0 |
| $ | 44.5 |
|
Operating margin |
| 9.1 | % | 8.9 | % | 9.7 | % | |||
|
|
|
|
|
|
|
| |||
France |
|
|
|
|
|
|
| |||
Revenues |
| $ | 447.4 |
| $ | 418.6 |
| $ | 432.3 |
|
Operating income |
| $ | (9.1 | ) | $ | 11.9 |
| $ | 16.6 |
|
Operating margin |
| (2.0 | )% | 2.8 | % | 3.8 | % | |||
|
|
|
|
|
|
|
| |||
Europe |
|
|
|
|
|
|
| |||
Revenues |
| $ | 982.3 |
| $ | 891.3 |
| $ | 890.4 |
|
Operating income |
| $ | 39.5 |
| $ | 53.9 |
| $ | 61.1 |
|
Operating margin |
| 4.0 | % | 6.1 | % | 6.9 | % | |||
Figure 4
4
been achieved despite the negative impact of currency movements, mainly in Argentina and Brazil. In the second half of the year, the Group focused on leveraging the Company’s relationship with key customer accounts in North America and Europe. This resulted, at the end of the year, in several new agreements with existing customers who are expanding their business in Latin America, including Telefónica de España, Reader’s Digest, Avon and Abril. We are still small in Latin America, but the opportunities offer great potential to expand our revenue base and market penetration.
YEAR 2002 COMPARED TO YEAR 2001
Year 2002 continued to be a difficult economic environment with declines in volumes and pressures on prices. However, restructuring activities and cost reduction initiatives mitigated the negative impact on our results and, resulted in increased operating margins for most of our North American and European (other than France) groups.
Revenue decreased from $6,320 million in 2001 to $6,242 million in 2002, a decrease of 1%, despite the impact of business acquisitions of $184 million. Operating income, before restructuring and other charges, fell by 9% to $563 million in 2002, from $618 million in 2001. Operating margin, on the same basis, declined to 9.0% in 2002 from 9.8% in 2001. Reduced capacity utilization and pricing pressures were largely responsible for the lower margin.
Depreciation and amortization was $336 million in 2002, compared to $338 million in 2001. This slight decrease was primarily due to the closure of facilities and the disposal of equipment following the 2001 restructuring initiatives.
Selling, general and administrative expenses were $501 million compared with $486 million in 2001. The increase of $15 million was primarily due to business acquisitions and reduction in suppliers cash discounts related to the cash management strategy. However, this strategy allowed us to reduce our financial expenses.
In 2002, restructuring and other charges of $20 million were recorded due to difficult market conditions in France, further integration of administrative functions in North America and the write-down of impaired or idle assets.
Financial expenses were $170 million in 2002, compared to $209 million in 2001. The significant decrease was due to lower levels of debt, together with reduced interest rates on long-term debt and on securitization programs.
Income taxes were $91 million in 2002 compared with $52 million in 2001. Before restructuring and other special charges, income taxes were $86 million or 22.0% compared to $96 million or 23.4% in 2001. The decrease in income taxes is due to lower profitability and an increase in profits generated in countries with a lower overall tax rate.
YEAR 2001 COMPARED TO YEAR 2000
Due to a soft world economy and the unprecedented economic fallout following September 11th, operating income before restructuring and other charges fell from $725 million in 2000 to $618 million in 2001, a 15% decrease.
Revenue decreased from $6,521 million in 2000 to $6,320 million in 2001, a decrease of 3%. This decrease included the impact of business acquisitions net of disposals of $51 million, offset by a negative impact of currency movements of $83 million. The decrease in revenue did not accurately reflect the overall volume decrease suffered in the year due to an increase in the proportion of paper purchased by us.
Operating margin, before restructuring charges, declined to 9.8% in 2001 from a record level of 11.1% in 2000, which still represented industry-leading margins. Higher paper sales, increased ink prices, higher energy costs and lower recovery from recycled materials combined with reduced capacity utilization, were largely responsible for lower margin.
Depreciation and amortization was $338 million in 2001, compared to $345 million in 2000. This decrease was primarily due to the closure of facilities and the disposal of equipment following the successful integration of World Color.
Selling, general and administrative expenses were $486 million compared to $459 million in 2000. Excluding a gain of $13 million on the disposition of our CD-ROM replication business, the year-on-year increase was $14 million, mainly due to increased selling costs incurred in the year to help maintain volumes in a rapidly weakening economic climate.
Restructuring and other charges were $270 million in 2001 and a net reversal of $3 million in 2000.
Financial expenses were $209 million in 2001, compared to $231 million in 2000. The decrease was due to lower levels of debt, together with reduced interest rates.
Income taxes were $52 million in 2001. Before restructuring and other special charges, income taxes were $96 million or 23.4% compared to $138 million in 2000, with an effective rate of 27.8%. The decrease in income taxes was due to lower profitability, and an increase in profits generated in countries with a lower overall tax rate.
PENSION AND OTHER POSTRETIREMENT BENEFITS
As at December 2002, the pension and other postretirement benefit costs were $40.8 million compared with $19.6 million in 2001 and the funded status decreased by
5
Financial Condition and Results of Operations (cont'd)
$171 million over last year. Calculation of pension and other postretirement benefit costs and obligations are based on various assumptions (see figure 5). Management is continuously assessing those assumptions for its funding exposure. In the last two years, we have experienced difficult capital market conditions and these results are now reflected in the discount rate and expected return on plan assets. However, Generally Accepted Accounting Principles recommend an accounting treatment to reduce the volatility of the pension plan expense in order to reflect the long-term nature of these obligations. Any actuarial gains or losses resulting from a turbulent capital market environment are amortized over a period of 15 years.
The Company is monitoring the funding of the pension plans very closely and is making contributions above the minimum legal requirements. A total of $38 million of cash contributions were made to the plans in 2002.
STOCK OPTION PLANS
During the year, the Company issued a total of 474,321 options. In respect of the new recommendations of the CICA Handbook, we presented, in note 16 (b) of the consolidated financial statements, compensation costs that would be determined using the fair value based method at the date of grant for those options. This would have resulted in a diluted earnings per share of $1.75 instead of $1.76 reported in the consolidated statements of income. Shares reserved for issuance total 7.6 million as at December 31, 2002, of which 3.5 million are currently outstanding.
FINANCIAL CONDITION, LIQUIDITY AND CAPITAL RESOURCES
Despite the difficult economic environment, our continuing focus on the execution of our initiatives and management discipline regarding cost containment resulted in strong cash flow from operations. In 2002, free cash flow from operations was $320 million, compared to $287 million in 2001. Free cash flow generation is being fully dedicated to improve our financial condition through repayment of long-term debt and increase returns to shareholders by increasing dividends on equity shares.
CASH FLOW FROM OPERATING ACTIVITIES
Cash flow from operating activities was $513 million in 2002, compared with $577 million in 2001. This reduction in the amount of funds generated from operations is mainly attributable to cash costs associated with our restructuring activities in 2002 and the significantly reduction of the investment in working capital in 2001 when compared to 2002.
Working capital in 2002 was ($209) million, compared to ($195) million in 2001. The increase in trade receivables due to the impact of business acquisitions and lower level of securitization, was offset by increased trade payables and accrued liabilities.
Weighted average assumptions used in the
measurement of the Company’s pension benefits
|
| 2002 |
| 2001 |
|
Discount rate |
| 6.7 | % | 7.0 | % |
Expected return on plan assets |
| 8.2 | % | 9.7 | % |
Rate of compensation increase |
| 3.4 | % | 3.4 | % |
Figure 5
FINANCING ACTIVITIES
During the first quarter of 2002, we repurchased for cancellation, under the Normal Course Issuer Bid program initiated in April 2001, a total of 148,500 Subordinate Voting Shares for a net cash consideration of Cdn$5.2 million ($3.5 million). In total, purchases made under the 2001 program were for 3,692,200 Subordinate Voting Shares for a net cash consideration of Cdn$149.0 million ($101.7 million).
In the fourth quarter of 2002, the holders of the Series 2 Preferred Shares exercised their right to convert their shares on a one-for-one basis into Series 3 Preferred Shares. The Series 3 Preferred Shares are entitled to a fixed quarterly dividend of Cdn$0.3845 per share.
Dividends paid to shareholders of Multiple Voting Shares and Subordinate Voting Shares totaled $0.49 per share, compared to $0.46 per share in 2001 and $0.33 per share in 2000, an increase of 7% over 2001 and 48% from 2000.
We paid dividends of Cdn$1.25 per share on our First Preferred Shares, Series 2 in 2002. Dividends of Cdn$1.25 per share were paid in 2001 and in 2000 on First Preferred Shares, Series 2. We paid dividends of Cdn$1.69 per share on our First Preferred Shares, Series 4, and Cdn$1.73 per share on our First Preferred Shares, Series 5, in 2002. In 2001, we paid Cdn$1.27 and Cdn$0.51 per share on our First Preferred Shares, Series 4 and 5 respectively.
CASH USED IN INVESTING ACTIVITIES
In 2002, capital expenditures were targeted to the implementation of the various restructuring initiatives together with customer-driven projects that will improve service and our cost position. We invested $185 million on capital expenditure projects, compared to $278 million in 2001. Key expenditures included the following items:
• North America
The expansion and improvements of our Retail platform including the
6
relocation of our Ontario, California facility to a new 196,000 square foot facility nearby Riverside.
A new 3.08 meters gravure press at our Franklin, Kentucky facility to service L.L. Bean and retail customers.
Several smaller projects related to our restructuring activities.
• Europe
The addition of a new 48-page commercial press to increase capacity in our Spanish platform.
• Latin America
The continued expansion of our Directory business in Mexico DF.
In March 2002, we acquired European Graphic Group S.A. (“E2G”), a subsidiary of Hachette Filipacchi Medias in Europe. E2G owns printing and bindery facilities in France and Belgium and a 50% ownership of Bayard Hachette Routage in France. This investment complements our European Gravure platform, and comes with a $400 million (exclusive of paper) long-term printing contract for Hachette’s magazines in Europe.
We also entered into a binding agreement to purchase, in 2004, the remaining 50% interest of Helio Charleroi in Belgium, an E2G’s subsidiary.
During the year 2002, we also acquired some minority interests in North America and in Europe.
FINANCIAL POSITION
Once again this year, we have succeeded in reducing debt levels, and our debt-to-capitalization ratio improved to 40:60, from 46:54 in 2001. As at December 31, 2002, our total debt, plus accounts receivable securitization, was $2,472 million, $357 million lower than last year (see figure 6). This improved financial condition, combined with the operating leverage resulting from the various restructuring initiatives, uniquely position us to grow as markets recover through organic growth and as we resume our external growth strategy.
The average annual cash obligations over the next three years represent approximately 10% of the 2002 EBITDA before restructuring and other charges (see figure 7).
We believe that our liquidity, capital resources and cash flows from operations are sufficient to fund planned capital expenditures, working capital requirements, interest and principal payments for the foreseeable future. Our total mandatory principal payments on long-term debt are $39 million in 2003 and $25 million in 2004.
Total Debt and Accounts Receivable Securitization ($ millions)
|
| December 31, 2002 |
| December 31, 2001 |
| ||
Bank indebtedness |
| $ | 0.3 |
| $ | 0.1 |
|
Current portion of long-term debt |
| 38.5 |
| 57.0 |
| ||
Long-term debt |
| 1,668.6 |
| 1,961.9 |
| ||
Convertible notes |
| 115.0 |
| 113.3 |
| ||
Total debt |
| $ | 1,822.4 |
| $ | 2,132.3 |
|
Accounts receivable securitization |
| 649.7 |
| 697.0 |
| ||
|
|
|
|
|
| ||
Total debt and accounts receivable securitization |
| $ | 2,472.1 |
| $ | 2,829.3 |
|
Figure 6
RESTRUCTURING
The restructuring initiatives announced in October 2001 were substantially completed as at December 31, 2002. Nearly 3,000 employees’ positions were eliminated, 10 facilities closed and more than 30 pieces of equipment have been successfully relocated. In the fourth quarter of 2002, one of the plant shutdowns that formed part of the 2001-2002 restructuring plan was cancelled due to continuation of a contract expected to be terminated. This provided sufficient work to utilize the equipment originally targeted for decommissioning. In addition, management addressed the French platform and approved new restructuring initiatives including further reduction of employee positions and decommissioning of certain non-competitive assets. This new plan includes also a new reduction in force program in North America resulting from duplication of activities.
Restructuring and other charges, as at December 31, 2002, were $19.6 million. This includes $13.3 million required to complete the 2001 restructuring initiatives, mostly related to employee
Contractual Cash Obligations ($ millions)
|
| 2003 |
| 2004 |
| 2005 |
| 2006 |
| 2007 |
| 2008 and |
|
Long-term debt and convertible notes |
| 2 |
| 6 |
| — |
| 250 |
| 406 |
| 1,074 |
|
Capital leases |
| 37 |
| 19 |
| 11 |
| 8 |
| 4 |
| 16 |
|
Operating leases |
| 88 |
| 75 |
| 67 |
| 55 |
| 42 |
| 80 |
|
Total contractual cash obligations |
| 127 |
| 100 |
| 78 |
| 313 |
| 452 |
| 1,170 |
|
Figure 7
7
Financial Condition and Results of Operations (cont'd)
termination costs. In addition, it also includes a reversal of $40.1 million, mainly related to our decision not to close a plant, as explained in the preceding paragraph. This reversal consists of $18.4 million of asset impairments and $21.7 million for related restructuring.
The new initiatives in 2002 comprise the following three basic components:
• Cash costs relating to the severance of employees and other restructuring costs of $30.0 million.
• Write-down of assets of $6.5 million associated with the impairment of assets that will no longer be used.
• Other special charges of $9.9 million for the write-down of investments to their expected realizable value. The large portion relates to our equity shares in Q-Media Services Corporation that went into receivership at the end of December 2002.
In 2001, due to the unprecedented economic fallout following September 11th, we announced that we would restructure our business with the aim of removing the least efficient equipment, without materially affecting the overall capacity of our platform. The restructuring and other charges required to achieve this goal totaled $273 million. The restructuring plan involved the closure of facilities, together with the rationalization of numerous other plants. The restructuring and other charges included the following three basic components:
• Cash costs relating to the severance of employees, real estate and other costs associated with exiting facilities;
• Non-cash costs of $114 million associated with the impairment of assets that will no longer be used in the business on an ongoing basis;
• Non-cash costs of $29 million associated with exiting investments and non-core businesses, together with cash costs of $15 million required in order to complete the World Color integration.
RISK MANAGEMENT
In the normal course of business, we are exposed to changes in interest rates and foreign exchange rates. We manage our interest rate exposure by having a balanced variety of debt maturities as well as a combination of fixed and floating rate obligations. In addition, we have entered into interest rate swap agreements to manage this exposure. Contracts outstanding at year-end have a notional value of $583 million. These contracts expire between January 2003 and March 2006.
We have also entered into foreign-exchange forward contracts and cross-currency interest rate swaps to hedge the settlement of raw materials and equipment purchases, to set the exchange rate for cross-border sales and to manage our foreign exchange exposure on our net investments. Foreign-exchange forward contracts and cross-currency interest rate swap contracts outstanding at year-end have a notional value of $589 million and $221 million respectively, and expire between January 2003 and December 2007.
While the counterpart of these agreements exposes us to credit loss in the event of non-performance, we believe that the possibility of incurring such a loss is remote due to the creditworthiness of the parties with whom we deal. We do not hold or issue any derivative financial instruments for speculative purposes. Concentrations of credit risk with respect to trade receivables are limited due to our diverse operations and large customer base.
As of December 31, 2002, we had no significant concentrations of credit risk. We believe that the product and geographic diversity of our customer base is instrumental in reducing our credit risk, as well as having a positive impact on our local market or product-line demand. We have long-term contracts with most of our largest customers. These contracts generally include price-adjustment clauses based on the cost of paper, ink and labor. We do not believe that we are exposed to an unusual level of customer credit risk.
The primary raw materials used in our manufacturing process are paper and ink. We use our purchasing power as one of the major buyers in the printing industry to obtain among the best prices, terms, quality control and service. To maximize our purchasing power, we negotiate with a limited number of suppliers.
In 2002, we had 74 collective bargaining agreements in North America. Of this total, 11 agreements expired in 2002 and 5 are still under negotiation. In addition, 10 collective bargaining agreements, covering 1,458 employees, will expire in 2003. We have approximately 10,678 unionized employees in North America. Moreover, 56 of our plants in North America are non-unionized.
SEASONALITY
The operations of our business are seasonal, with approximately two-thirds of operating income historically recognized in the second half of the fiscal year, primarily due to the higher number of magazine pages, new product launches and back-to-school, retail and holiday catalog promotions.
ENVIRONMENTAL MATTERS
During 2002, we have continued to strengthen our approach to environmental management. Eight facilities have now received the ISO-14001 certification, an
8
internationally recognized environmental management standard. Two other plants are planning to use a customized computer software to help them to implement the ISO-14001 environmental management system and to secure certification.
Energy and pollution control is at the center of our commitment to the environment, and this has been particularly important in a year where energy and pollution concerns have risen significantly. This is why we continue to invest in regenerative thermal-oxidizers or ‘RTOs’ in North America, Europe, as well as Latin America. Now, more than 50 RTOs are installed in 40 of our plants, replacing their less efficient, energy-consumming counterparts by outperforming them in every aspect. They destroy 99% of the pollutants that would otherwise be released into the atmosphere, and use up to 95% less fuel (natural gas) than the other most commonly used-up control device. In 2003, we plan to install at least 5 more RTOs.
RECENT ACCOUNTING PRONOUNCEMENTS AND CHANGES IN ACCOUNTING POLICIES
Significant differences between Generally Accepted Accounting Principles (GAAP) in Canada and the United States are presented in Note 22 to the Consolidated Financial Statements. We generate more than 65% of our revenues from the United States. In our efforts to expand our investor base in the United States, we have made significant efforts in the last 3 years to follow new disclosure guidelines and to harmonize our disclosure based on accounting pronouncements in both Canada and the United States.
In August 2001, the Canadian Institute of Chartered Accountants (“CICA”) issued Handbook Section 3062, Goodwill and Other Intangible Assets. Under Section 3062, goodwill is not amortized and is tested for impairment annually, or more frequently if events or changes in circumstances indicate that the asset might be impaired. The impairment test is carried out in two steps as explained in note 2(a) of the Consolidated Financial Statements.
We have adopted Section 3062 effective January 1, 2002. As of the date of adoption, we had unamortized goodwill of approximately $2.5 billion. In accordance with the requirements of Section 3062, this change in accounting policy is not applied retroactively and the amounts presented for prior periods have not been restated for this change. The Company conducted the first step of the transitional and annual goodwill impairment test and, based on these tests, determined that there is no impairment. The impact of that change is presented in note 2(a) of the Consolidated Financial Statements.
In November 2001, the CICA approved the modification of Section 1650 of the CICA handbook, Foreign Currency Translation, to eliminate the deferral and amortization of foreign currency translation gains and losses on long-lived monetary items. In the first quarter of 2002, we adopted the new recommendation retroactively. The effect of adopting the new recommendation did not have a significant impact on the consolidated balance sheet and consolidated statements of income and retained earnings and cash flows as at December 31, 2002.
Effective January 1, 2002, we adopted the new recommendations of CICA Handbook Section 3870, Stock-based Compensation and Other Stock-based Payments. This Section establishes standards for the recognition, measurement and disclosure of stock-based compensation and other stock-based payments made in exchange for goods and services. These new recommendations require that compensation for all awards made to non-employees and certain awards made to employees, including stock appreciation rights, direct awards of stock and awards that call for settlement in cash or other assets, be measured and recorded in the financial statements at fair value.
As permitted by Section 3870, we have chosen to continue our existing policy of recording no compensation cost on the grant of stock options to employees. Any consideration paid by employees on exercise of stock options is credited to capital stock. Please refer to note 2(c) for stock-based compensation.
FORWARD-LOOKING STATEMENTS
Except for historical information contained herein, the statements in this document are forward-looking and made pursuant to the safe harbor provisions of the Private Securities Litigation Reform Act of 1995. Forward-looking statements involve known and unknown risks and uncertainties, which may cause our actual results in future periods to differ materially from forecasted results. Those risks include, among others, changes in customer demand for our products, changes in raw material and equipment costs and availability, seasonal changes in customer orders, pricing actions by our competitors and general changes in economic conditions.
On behalf of Management,
/s/ Carl Gauvreau |
|
Carl Gauvreau | |
Senior Vice President | |
9
MANAGEMENT’S RESPONSIBILITY FOR
Financial Statements
The accompanying consolidated financial statements of Quebecor World Inc. and its subsidiaries and all the information in this Annual Report are the responsibility of management and are approved by the Board of Directors of Quebecor World Inc.
These financial statements have been prepared by management in conformity with Canadian generally accepted accounting principles and include amounts that are based on best estimates and judgments. The financial information used elsewhere in the Annual Report is consistent with that in the financial statements.
Management of the Company and of its subsidiaries, in furtherance of the integrity and objectivity of data in the financial statements, have developed and maintain systems of internal accounting controls and support a program of internal audit. Management believes that the systems of internal accounting controls provide reasonable assurance that financial records are reliable and form a proper basis for the preparation of the financial statements and that assets are properly accounted for and safeguarded.
The Board of Directors carries out its responsibility for the financial statements included in this Annual Report principally through its Audit Committee, consisting solely of outside directors. The Audit Committee reviews the Company’s annual consolidated financial statements and formulates the appropriate recommendations to the Board of Directors. The auditors appointed by the shareholders have full access to the Audit Committee, with and without management being present.
These financial statements have been examined by the auditors appointed by the shareholders, KPMG LLP, chartered accountants, and their report is presented hereafter.
/s/ Brian Mulroney |
| /s/ Christian M. Paupe |
| /s/ Carl Gauvreau |
The Right Honourable |
| Christian M. Paupe |
| Carl Gauvreau |
Montreal, Canada |
|
|
|
|
AUDITORS’ REPORT TO THE SHAREHOLDERS
We have audited the consolidated balance sheets of Quebecor World Inc. and its subsidiaries as at December 31, 2002 and 2001 and the consolidated statements of income, shareholders’equity and cash flows for the years ended December 31, 2002, 2001 and 2000. These financial statements are the responsibility of the Company’s management. Our responsibility is to express an opinion on these financial statements based on our audits.
We conducted our audits in accordance with Canadian generally accepted auditing standards. Those standards require that we plan and perform an audit to obtain reasonable assurance whether the financial statements are free of material misstatement. An audit includes examining, on a test basis, evidence supporting the amounts and disclosures in the financial statements. An audit also includes assessing the accounting principles used and significant estimates made by management, as well as evaluating the overall financial statement presentation.
In our opinion, these consolidated financial statements present fairly, in all material respects, the financial position of the Company as at December 31, 2002 and 2001 and the results of its operations and its cash flows for the years ended December 31, 2002, 2001 and 2000 in accordance with Canadian generally accepted accounting principles.
/s/ KPMG LLP |
|
| |
Chartered Accountants | |
Montreal, Canada | |
10
CONSOLIDATED STATEMENTS OF INCOME
Years ended December 31
(in millions of US dollars, except per share amounts)
|
| Notes |
| 2002 |
| 2001 |
| 2000 |
| |||
|
|
|
|
|
|
|
|
|
| |||
Revenues |
|
|
| $ | 6,242.0 |
| $ | 6,320.1 |
| $ | 6,521.1 |
|
|
|
|
|
|
|
|
|
|
| |||
Operating expenses: |
|
|
|
|
|
|
|
|
| |||
Cost of sales |
|
|
| 4,842.9 |
| 4,878.9 |
| 4,991.7 |
| |||
Selling, general and administrative |
| 7(b) |
| 500.7 |
| 485.6 |
| 459.5 |
| |||
Depreciation and amortization |
|
|
| 335.6 |
| 337.8 |
| 345.1 |
| |||
Restructuring and other charges |
| 3 |
| 19.6 |
| 270.0 |
| (2.7 | ) | |||
|
|
|
| 5,698.8 |
| 5,972.3 |
| 5,793.6 |
| |||
|
|
|
|
|
|
|
|
|
| |||
Operating income |
|
|
| 543.2 |
| 347.8 |
| 727.5 |
| |||
|
|
|
|
|
|
|
|
|
| |||
Financial expenses |
| 4 |
| 170.2 |
| 208.8 |
| 231.5 |
| |||
|
|
|
|
|
|
|
|
|
| |||
Income before income taxes |
|
|
| 373.0 |
| 139.0 |
| 496.0 |
| |||
|
|
|
|
|
|
|
|
|
| |||
Income taxes |
| 5 |
| 90.9 |
| 52.0 |
| 137.7 |
| |||
|
|
|
|
|
|
|
|
|
| |||
Income before minority interest |
|
|
| 282.1 |
| 87.0 |
| 358.3 |
| |||
|
|
|
|
|
|
|
|
|
| |||
Minority interest |
|
|
| 2.8 |
| 3.2 |
| 2.4 |
| |||
|
|
|
|
|
|
|
|
|
| |||
Net income before goodwill amortization |
|
|
| 279.3 |
| 83.8 |
| 355.9 |
| |||
|
|
|
|
|
|
|
|
|
| |||
Goodwill amortization, net of income taxes |
| 2(a) |
| — |
| 61.4 |
| 60.5 |
| |||
|
|
|
|
|
|
|
|
|
| |||
Net income |
|
|
| $ | 279.3 |
| $ | 22.4 |
| $ | 295.4 |
|
|
|
|
|
|
|
|
|
|
| |||
Net income available to holders of preferred shares |
|
|
| 28.9 |
| 21.9 |
| 10.1 |
| |||
|
|
|
|
|
|
|
|
|
| |||
Net income available to holders of equity shares |
|
|
| $ | 250.4 |
| $ | 0.5 |
| $ | 285.3 |
|
|
|
|
|
|
|
|
|
|
| |||
Earnings per share: |
| 6 |
|
|
|
|
|
|
| |||
Basic |
|
|
| $ | 1.78 |
| $ | — |
| $ | 1.94 |
|
Diluted |
|
|
| $ | 1.76 |
| $ | — |
| $ | 1.91 |
|
|
|
|
|
|
|
|
|
|
| |||
Weighted average number of equity shares outstanding (in millions): |
| 6 |
|
|
|
|
|
|
| |||
Basic |
|
|
| 140.7 |
| 142.2 |
| 147.0 |
| |||
Diluted |
|
|
| 145.4 |
| 143.0 |
| 151.7 |
| |||
See Notes to Consolidated Financial Statements.
11
CONSOLIDATED STATEMENTS OF SHAREHOLDERS’ EQUITY
Years ended December 31
(in millions of US dollars and thousands of shares)
|
|
|
| Equity Multiple |
| Equity Subordinate |
| First Preferred |
| ||||||||||||
|
| Notes |
| Issued and |
| Amount |
| Issued and |
| Amount |
| Issued and |
| Amount |
| ||||||
|
|
|
|
|
|
|
|
|
|
|
|
|
|
|
| ||||||
Balance, December 31, 1999 |
|
|
|
| 62,985 |
| $ | 152.2 |
|
| 84,690 |
| $ | 1,289.1 |
|
| 12,000 |
| $ | 212.5 |
|
|
|
|
|
|
|
|
|
|
|
|
|
|
|
|
| ||||||
Net income |
|
|
| — |
| — |
| — |
| — |
| — |
| — |
| ||||||
Translation adjustment |
| 17 |
| — |
| — |
| — |
| — |
| — |
| — |
| ||||||
|
|
|
|
|
|
|
|
|
|
|
|
|
|
|
| ||||||
Conversion of Equity Multiple Voting Shares into Equity Subordinate Voting Shares |
|
|
| (5,599 | ) | (33.6 | ) | 5,599 |
| 33.6 |
| — |
| — |
| ||||||
Shares repurchased |
| 15 |
| — |
| — |
| (1,752 | ) | (26.1 | ) | — |
| — |
| ||||||
Shares issued in connection with the acquisition of World Color Press, Inc. |
| 15 |
| — |
| — |
| 11 |
| 0.2 |
| — |
| — |
| ||||||
Shares issued from stock plans |
| 16 |
| — |
| — |
| 205 |
| 3.3 |
| — |
| — |
| ||||||
Convertible notes repurchased |
| 14 |
| — |
| — |
| — |
| — |
| — |
| — |
| ||||||
Dividends on equity shares ($0.33 per share) |
|
|
| — |
| — |
| — |
| — |
| — |
| — |
| ||||||
Dividends on preferred shares ($0.84 (Cdn $1.25) per share) |
|
|
| — |
| — |
| — |
| — |
| — |
| — |
| ||||||
Balance, December 31, 2000 |
|
|
| 57,386 |
| $ | 118.6 |
| 88,753 |
| $ | 1,300.1 |
| 12,000 |
| $ | 212.5 |
| |||
|
|
|
|
|
|
|
|
|
|
|
|
|
|
|
| ||||||
Net income |
|
|
| — |
| — |
| — |
| — |
| — |
| — |
| ||||||
Translation adjustment |
| 17 |
| — |
| — |
| — |
| — |
| — |
| — |
| ||||||
|
|
|
|
|
|
|
|
|
|
|
|
|
|
|
| ||||||
Conversion of Equity Multiple Voting Shares into Equity Subordinate Voting Shares |
|
|
| (2,650 | ) | (5.9 | ) | 2,650 |
| 5.9 |
| — |
| — |
| ||||||
Shares repurchased |
| 15 |
| — |
| — |
| (6,732 | ) | (96.7 | ) | — |
| — |
| ||||||
Shares issued from stock plans |
| 16 |
| — |
| — |
| 777 |
| 14.7 |
| — |
| — |
| ||||||
Issuance of First Preferred Shares Series 4 |
| 15 |
| — |
| — |
| — |
| — |
| 8,000 |
| 130.2 |
| ||||||
Issuance of First Preferred Shares Series 5 |
| 15 |
| — |
| — |
| — |
| — |
| 7,000 |
| 113.9 |
| ||||||
Share issue expenses (net of income taxes of $2.3) |
| 15 |
| — |
| — |
| — |
| — |
| — |
| — |
| ||||||
Dividends on equity shares ($0.46 per share) |
|
|
| — |
| — |
| — |
| — |
| — |
| — |
| ||||||
Dividends on preferred shares ($1.87 (Cdn $3.03) per share) |
|
|
| — |
| — |
| — |
| — |
| — |
| — |
| ||||||
Balance, December 31, 2001 |
|
|
| 54,736 |
| $ | 112.7 |
| 85,448 |
| $ | 1,224.0 |
| 27,000 |
| $ | 456.6 |
| |||
|
|
|
|
|
|
|
|
|
|
|
|
|
|
|
| ||||||
Net income |
|
|
| — |
| — |
| — |
| — |
| — |
| — |
| ||||||
Translation adjustment |
| 17 |
| — |
| — |
| — |
| — |
| — |
| — |
| ||||||
|
|
|
|
|
|
|
|
|
|
|
|
|
|
|
| ||||||
Conversion of Equity Multiple Voting Shares into Equity Subordinate Voting Shares |
|
|
| (7,749 | ) | (19.2 | ) | 7,749 |
| 19.2 |
| — |
| — |
| ||||||
Conversion of First Preferred Shares: |
| 15 |
|
|
|
|
|
|
|
|
|
|
|
|
| ||||||
Series 2 |
|
|
| — |
| — |
| — |
| — |
| (12,000 | ) | (212.5 | ) | ||||||
Series 3 |
|
|
| — |
| — |
| — |
| — |
| 12,000 |
| 212.5 |
| ||||||
Shares repurchased |
| 15 |
| — |
| — |
| (148 | ) | (2.1 | ) | — |
| — |
| ||||||
Shares issued from stock plans |
| 16 |
| — |
| — |
| 1,109 |
| 22.7 |
| — |
| — |
| ||||||
Related party transactions |
| 20 |
| — |
| — |
| — |
| — |
| — |
| — |
| ||||||
Dividends on equity shares ($0.49 per share) |
|
|
| — |
| — |
| — |
| — |
| — |
| — |
| ||||||
Dividends on preferred shares ($2.97 (Cdn $4.67) per share) |
|
|
| — |
| — |
| — |
| — |
| — |
| — |
| ||||||
Balance, December 31, 2002 |
|
|
| 46,987 |
| $ | 93.5 |
| 94,158 |
| $ | 1,263.8 |
| 27,000 |
| $ | 456.6 |
| |||
See Notes to Consolidated Financial Statements.
12
|
| Total |
| Additional |
| Retained |
| Translation |
| Total |
| |||||
|
|
|
|
|
|
|
|
|
|
|
| |||||
Balance, December 31, 1999 |
| $ | 1,653.8 |
| $ | 109.5 |
| $ | 650.2 |
| $ | (95.1 | ) | $ | 2,318.4 |
|
|
|
|
|
|
|
|
|
|
|
|
| |||||
Net income |
| — |
| — |
| 295.4 |
| — |
| 295.4 |
| |||||
Translation adjustment |
| — |
| — |
| — |
| (37.1 | ) | (37.1 | ) | |||||
|
|
|
|
|
|
|
|
|
|
|
| |||||
Conversion of Equity Multiple Voting Shares into Equity Subordinate Voting Shares |
| — |
| — |
| — |
| — |
| — |
| |||||
Shares repurchased |
| (26.1 | ) | — |
| (16.0 | ) | — |
| (42.1 | ) | |||||
|
|
|
|
|
|
|
|
|
|
|
| |||||
Shares issued in connection with the acquisition of World Color Press, Inc. |
| 0.2 |
| — |
| — |
| — |
| 0.2 |
| |||||
Shares issued from stock plans |
| 3.3 |
| — |
| — |
| — |
| 3.3 |
| |||||
Convertible notes repurchased |
| — |
| (4.9 | ) | (0.8 | ) | — |
| (5.7 | ) | |||||
Dividends on equity shares ($0.33 per share) |
| — |
| — |
| (48.5 | ) | — |
| (48.5 | ) | |||||
Dividends on preferred shares ($0.84 (Cdn $1.25) per share) |
| — |
| — |
| (10.0 | ) | — |
| (10.0 | ) | |||||
Balance, December 31, 2000 |
| $ | 1,631.2 |
| $ | 104.6 |
| $ | 870.3 |
| $ | (132.2 | ) | $ | 2,473.9 |
|
|
|
|
|
|
|
|
|
|
|
|
| |||||
Net income |
| — |
| — |
| 22.4 |
| — |
| 22.4 |
| |||||
Translation adjustment |
| — |
| — |
| — |
| (14.3 | ) | (14.3 | ) | |||||
|
|
|
|
|
|
|
|
|
|
|
| |||||
Conversion of Equity Multiple Voting Shares into Equity Subordinate Voting Shares |
| — |
| — |
| — |
| — |
| — |
| |||||
Shares repurchased |
| (96.7) |
| — |
| (80.7 | ) | — |
| (177.4 | ) | |||||
Shares issued from stock plans |
| 14.7 |
| — |
| — |
| — |
| 14.7 |
| |||||
Issuance of First Preferred Shares Series 4 |
| 130.2 |
| — |
| — |
| — |
| 130.2 |
| |||||
Issuance of First Preferred Shares Series 5 |
| 113.9 |
| — |
| — |
| — |
| 113.9 |
| |||||
Share issue expenses (net of income taxes of $2.3) |
| — |
| — |
| (4.5 | ) | — |
| (4.5 | ) | |||||
Dividends on equity shares ($0.46 per share) |
| — |
| — |
| (65.2 | ) | — |
| (65.2 | ) | |||||
Dividends on preferred shares ($1.87 (Cdn $3.03) per share) |
| — |
| — |
| (20.5 | ) | — |
| (20.5 | ) | |||||
Balance, December 31, 2001 |
| $ | 1,793.3 |
| $ | 104.6 |
| $ | 721.8 |
| $ | (146.5 | ) | $ | 2,473.2 |
|
|
|
|
|
|
|
|
|
|
|
|
| |||||
Net income |
| — |
| — |
| 279.3 |
| — |
| 279.3 |
| |||||
Translation adjustment |
| — |
| — |
| — |
| 30.9 |
| 30.9 |
| |||||
|
|
|
|
|
|
|
|
|
|
|
| |||||
Conversion of Equity Multiple Voting Shares into Equity Subordinate Voting Shares |
| — |
| — |
| — |
| — |
| — |
| |||||
Conversion of First Preferred Shares: |
|
|
|
|
|
|
|
|
|
|
| |||||
Series 2 |
| (212.5 | ) | — |
| — |
| — |
| (212.5 | ) | |||||
Series 3 |
| 212.5 |
| — |
| — |
| — |
| 212.5 |
| |||||
Shares repurchased |
| (2.1 | ) | — |
| (1.4 | ) | — |
| (3.5 | ) | |||||
Shares issued from stock plans |
| 22.7 |
| — |
| — |
| — |
| 22.7 |
| |||||
Related party transactions |
| — |
| (1.0 | ) | — |
| — |
| (1.0 | ) | |||||
Dividends on equity shares ($0.49 per share) |
| — |
| — |
| (69.0 | ) | — |
| (69.0 | ) | |||||
Dividends on preferred shares ($2.97 (Cdn $4.67) per share) |
| — |
| — |
| (28.8 | ) | — |
| (28.8 | ) | |||||
Balance, December 31, 2002 |
| $ | 1,813.9 |
| $ | 103.6 |
| $ | 901.9 |
| $ | (115.6 | ) | $ | 2,703.8 |
|
13
CONSOLIDATED STATEMENTS OF CASH FLOWS
Years ended December 31
(in millions of US dollars)
|
| Notes |
| 2002 |
| 2001 |
| 2000 |
| |||
|
|
|
|
|
|
|
|
|
| |||
Operating activities: |
|
|
|
|
|
|
|
|
| |||
Net income |
|
|
| $ | 279.3 |
| $ | 22.4 |
| $ | 295.4 |
|
Non-cash items in net income: |
|
|
|
|
|
|
|
|
| |||
Depreciation of property, plant and equipment |
|
|
| 313.2 |
| 314.9 |
| 325.3 |
| |||
Future income taxes |
| 5 |
| 56.7 |
| (42.8 | ) | 91.8 |
| |||
Amortization of goodwill and deferred charges |
|
|
| 22.4 |
| 84.3 |
| 80.3 |
| |||
Non-cash portion of restructuring and other charges |
| 3 |
| (0.5 | ) | 142.6 |
| (7.0 | ) | |||
Gain on sale of non-core businesses and investments |
|
|
| (3.9 | ) | — |
| (12.6 | ) | |||
Other |
|
|
| 12.2 |
| 10.5 |
| 12.5 |
| |||
|
|
|
|
|
|
|
|
|
| |||
Changes in non-cash balances related to operations: |
|
|
|
|
|
|
|
|
| |||
Trade receivables |
|
|
| (91.0 | ) | 190.0 |
| 128.6 |
| |||
Inventories |
|
|
| (21.0 | ) | 77.2 |
| 8.8 |
| |||
Trade payables and accrued liabilities |
|
|
| (18.4 | ) | (138.9 | ) | 18.6 |
| |||
Other current assets and liabilities |
|
|
| 43.7 |
| 20.3 |
| (48.6 | ) | |||
Other non-current assets and liabilities |
|
|
| (79.3 | ) | (104.0 | ) | 24.7 |
| |||
Cash provided from operating activities |
|
|
| 513.4 |
| 576.5 |
| 917.8 |
| |||
|
|
|
|
|
|
|
|
|
| |||
Financing activities: |
|
|
|
|
|
|
|
|
| |||
Net change in bank indebtedness |
|
|
| 0.2 |
| (2.3 | ) | (2.2 | ) | |||
Net proceeds from issuance of equity shares |
| 15 & 16 |
| 22.7 |
| 14.7 |
| 2.9 |
| |||
Repurchases of shares for cancellation |
| 15 |
| (3.5 | ) | (177.4 | ) | (41.6 | ) | |||
Net proceeds from issuance of preferred shares |
| 15 |
| — |
| 239.6 |
| — |
| |||
Issuance of long-term debt |
|
|
| — |
| 248.8 |
| 387.3 |
| |||
Repayments of long-term debt and convertible notes |
|
|
| (380.5 | ) | (379.8 | ) | (995.1 | ) | |||
Dividends on equity shares |
|
|
| (69.0 | ) | (65.2 | ) | (48.5 | ) | |||
Dividends on preferred shares |
|
|
| (36.2 | ) | (20.5 | ) | (10.0 | ) | |||
Dividends to minority shareholders |
|
|
| (2.0 | ) | (1.5 | ) | — |
| |||
Cash used by financing activities |
|
|
| (468.3 | ) | (143.6 | ) | (707.2 | ) | |||
|
|
|
|
|
|
|
|
|
| |||
Investing activities: |
|
|
|
|
|
|
|
|
| |||
Business acquisitions, net of cash and cash equivalents |
| 7 |
| (0.3 | ) | (138.9 | ) | (5.3 | ) | |||
Proceeds from disposal of non-core businesses and investments |
|
|
| — |
| — |
| 57.3 |
| |||
Additions to property, plant and equipment |
|
|
| (184.5 | ) | (278.3 | ) | (242.2 | ) | |||
Investment in an affiliated company |
|
|
| — |
| — |
| (13.5 | ) | |||
Net proceeds from disposal of assets |
|
|
| 27.1 |
| 9.5 |
| 24.4 |
| |||
Other |
|
|
| 19.6 |
| (15.8 | ) | — |
| |||
Cash used by investing activities |
|
|
| (138.1 | ) | (423.5 | ) | (179.3 | ) | |||
|
|
|
|
|
|
|
|
|
| |||
Effect of exchange rate changes on cash and cash equivalents |
|
|
| 10.2 |
| 23.4 |
| 17.8 |
| |||
|
|
|
|
|
|
|
|
|
| |||
Net (decrease) increase in cash and cash equivalents |
|
|
| (82.8 | ) | 32.8 |
| 49.1 |
| |||
|
|
|
|
|
|
|
|
|
| |||
Cash and cash equivalents, beginning of year |
|
|
| 85.5 |
| 52.7 |
| 3.6 |
| |||
|
|
|
|
|
|
|
|
|
| |||
Cash and cash equivalents, end of year |
|
|
| $ | 2.7 |
| $ | 85.5 |
| $ | 52.7 |
|
See Notes to Consolidated Financial Statements.
14
December 31
(in millions of US dollars)
|
| Notes |
| 2002 |
| 2001 |
| ||
|
|
|
|
|
|
|
| ||
Assets |
|
|
|
|
|
|
| ||
|
|
|
|
|
|
|
| ||
Current assets: |
|
|
|
|
|
|
| ||
Cash and cash equivalents |
|
|
| $ | 2.7 |
| $ | 85.5 |
|
Trade receivables |
| 8 |
| 466.9 |
| 366.6 |
| ||
Receivables from related parties |
| 20 |
| 13.6 |
| 1.9 |
| ||
Inventories |
| 9 |
| 409.4 |
| 377.1 |
| ||
Income taxes receivable |
|
|
| 21.7 |
| 36.6 |
| ||
Future income taxes |
| 5 |
| 27.8 |
| 58.0 |
| ||
Prepaid expenses |
|
|
| 25.2 |
| 24.1 |
| ||
Total current assets |
|
|
| 967.3 |
| 949.8 |
| ||
|
|
|
|
|
|
|
| ||
Property, plant and equipment, net |
| 10 |
| 2,610.6 |
| 2,634.0 |
| ||
Goodwill |
| 2 & 11 |
| 2,514.3 |
| 2,470.7 |
| ||
Other assets |
|
|
| 113.3 |
| 132.0 |
| ||
|
|
|
|
|
|
|
| ||
Total assets |
|
|
| $ | 6,205.5 |
| $ | 6,186.5 |
|
|
|
|
|
|
|
|
| ||
Liabilities and Shareholders’ Equity |
|
|
|
|
|
|
| ||
|
|
|
|
|
|
|
| ||
Current liabilities: |
|
|
|
|
|
|
| ||
Bank indebtedness |
|
|
| $ | 0.3 |
| $ | 0.1 |
|
Trade payables |
|
|
| 581.2 |
| 462.9 |
| ||
Accrued liabilities |
|
|
| 485.8 |
| 561.2 |
| ||
Income and other taxes payable |
|
|
| 70.8 |
| 63.1 |
| ||
Current portion of long-term debt |
| 12 |
| 38.5 |
| 57.0 |
| ||
Total current liabilities |
|
|
| 1,176.6 |
| 1,144.3 |
| ||
|
|
|
|
|
|
|
| ||
Long-term debt |
| 12 |
| 1,668.6 |
| 1,961.9 |
| ||
Other liabilities |
| 13 |
| 228.9 |
| 245.6 |
| ||
Future income taxes |
| 5 |
| 291.7 |
| 234.0 |
| ||
Convertible notes |
| 14 |
| 115.0 |
| 113.3 |
| ||
Minority interest |
|
|
| 20.9 |
| 14.2 |
| ||
|
|
|
|
|
|
|
| ||
Shareholders’equity: |
|
|
|
|
|
|
| ||
Capital stock |
| 15 |
| 1,813.9 |
| 1,793.3 |
| ||
Additional paid-in capital |
|
|
| 103.6 |
| 104.6 |
| ||
Retained earnings |
|
|
| 901.9 |
| 721.8 |
| ||
Translation adjustment |
| 17 |
| (115.6 | ) | (146.5 | ) | ||
|
|
|
| 2,703.8 |
| 2,473.2 |
| ||
|
|
|
|
|
|
|
| ||
Total liabilities and shareholders’equity |
|
|
| $ | 6,205.5 |
| $ | 6,186.5 |
|
See Notes to Consolidated Financial Statements.
On behalf of the Board:
/s/ Brian Mulroney |
| /s/ Charles G. Cavell |
|
The Right Honourable Brian Mulroney, Director | Charles G. Cavell, Director | ||
15
NOTES TO CONSOLIDATED FINANCIAL STATEMENTS
Years ended December 31, 2002, 2001 and 2000
(Tabular amounts are expressed in millions of US dollars, except for earnings per share and option amounts)
1. Summary of significant accounting policies
(a) Principles of consolidation
The consolidated financial statements include the accounts of Quebecor World Inc. and all its subsidiaries (the “Company”) and are prepared in conformity with Canadian generally accepted accounting principles.
(b) Use of estimates
The preparation of financial statements in conformity with Canadian generally accepted accounting principles requires management to make estimates and assumptions that affect the reported amounts of assets and liabilities and disclosure of contingent assets and liabilities at the date of the financial statements and the reported amounts of revenues and expenses during the reporting period. Financial results as determined by actual events could differ from those estimates.
(c) Foreign currency translation
Financial statements of self-sustaining foreign operations are translated using the rate in effect at the balance sheet date for asset and liability items and the average exchange rates during the year for revenues and expenses. Adjustments arising from this translation are deferred and recorded in translation adjustment and are included in income only when a reduction in the investment in these foreign operations is realized.
Other foreign currency transactions are translated using the temporal method. Translation gains and losses are included in financial expenses.
(d) Revenue recognition
The Company provides a wide variety of print and print-related services and products to its customers, which usually require that the specifics be agreed upon prior to process. Sales are recognized by the Company either when the production process is completed or services are performed, or on the basis of production and service activity at the pro rata billing value of work completed.
(e) Cash and cash equivalents
Cash and cash equivalents consist of highly liquid investments purchased three months or less from maturity and are stated at cost, which approximates market value.
(f) Trade receivables
Any gains or losses on the sale of trade receivables are calculated by comparing the carrying amount of the trade receivables sold to the total of the cash proceeds on sale and the fair value of the retained interest in such receivables on the date of transfer. Fair values are determined on a discounted cash flow basis. Costs including losses on sales of trade receivables are recognized in earnings in the period incurred and included in financial expenses.
(g) Inventories
Raw materials and supplies are valued at the lower of cost, as determined, using the first in, first out method, or market being replacement cost. The work in process is valued at the pro rata billing value of the work completed.
16
1. Summary of significant accounting policies (cont'd)
(h) Property, plant and equipment
Property, plant and equipment are stated at cost. Cost represents acquisition or construction costs including preparation, installation and testing charges and interest incurred with respect to property, plant and equipment until they are ready for commercial production. Repair and maintenance are expensed as incurred.
Depreciation is provided using the straight-line basis over the estimated useful lives as follows:
Assets |
| Estimated |
|
Buildings and leasehold improvements |
| 15 to 40 years |
|
Machinery and equipment |
| 3 to 18 years |
|
(i) Income taxes
The Company follows the asset and liability method of accounting for income taxes. Under the asset and liability method, future income tax assets and liabilities are recognized for the estimated future tax consequences attributable to differences between the financial statement carrying amounts of existing assets and liabilities and their respective tax bases. Future income tax assets and liabilities are measured using enacted or substantively enacted tax rates in effect for the year in which those temporary differences are expected to be recovered or settled. The effect on future income tax assets and liabilities of a change in tax rates is recognized in income in the period that includes the enactment, or substantively enactment, date. Future income tax assets are recognized and if realization is not considered “more likely than not”, a valuation allowance is provided.
(j) Derivative financial and commodity instruments
The Company uses various derivative financial instruments to manage its exposure to fluctuations in foreign currency exchange rates, interest rates and commodity pricing. The Company does not hold or use any derivative instruments for speculative trading purposes.
The Company formally documents all relationships between hedging instruments and hedged items, as well as its risk management objective and strategy for undertaking various hedge transactions. This process includes linking all derivatives to specific assets and liabilities or to specific firm commitments or forecasted transactions. The Company also formally assesses, both at the hedge’s inception and on an ongoing basis, whether the derivatives that are used in hedging transactions are highly effective in offsetting changes in fair values or cash flows of hedged items.
The Company enters into foreign exchange forward contracts to hedge anticipated foreign denominated sales and raw material and equipment purchases. Foreign exchange translation gains and losses are recognized as an adjustment of the revenues, of the cost of good sold and of the fixed assets respectively when the transaction is recorded. The portion of the forward premium or discount on the contract relating to the period prior to consummation of the transaction is also recognized as an adjustment of the revenues, of the cost of good sold and of the fixed assets respectively when the transaction is recorded.
The Company also enters into foreign exchange forward contracts and cross currency swaps to hedge its net investments in foreign subsidiaries. Foreign exchange translation gains and losses are deferred and recorded under translation adjustment. The forward premium or discount on forward foreign exchange contracts and the interest component of the cross currency swap is amortized as an adjustment of interest expense over the term of the forward contract.
17
1. Summary of significant accounting policies (cont'd)
(j) Derivative financial and commodity instruments (cont'd)
The Company also enters into interest rate swaps in order to manage the impact of fluctuating interest rates on its short-term and long-term debt. These swap agreements require the periodic exchange of payments without the exchange of the notional principal amount on which the payments are based. The Company designates its interest rate hedge agreements as hedges of the underlying debt. Interest expense on the debt is adjusted to include the payments made or received under the interest rate swaps.
The Company also entered into a commodity swap to manage a portion of its Canadian natural gas exposure. The Company is commited to exchange, on a monthly basis, the difference between a fixed price and a floating Canadian natural gas price index. The Company designated its commodity hedge agreements as a hedge of the natural gas cost. Natural gas cost is adjusted to include the payments made or received under the commodity hedge agreements.
Realized and unrealized gains or losses associated with derivative instruments, which have been terminated or cease to be effective prior to maturity, are deferred under other current or non-current assets or liabilities on the balance sheet and recognized in income in the period in which the underlying hedged transaction is recognized. In the event a designated hedged item is sold, extinguished or matures prior to the termination of the related derivative instrument, any realized or unrealized gain or loss on such derivative instrument is recognized in income.
(k) Employee future benefits
i) Pensions
Pension costs are determined using actuarial methods and are funded through contributions determined in accordance with the projected benefit method pro rated on service. Pension expense is charged to operations and includes:
• |
| The cost of pension benefits provided in exchange for employees’ services rendered during the year; |
|
|
|
• |
| The amortization of the initial net transition asset on a straight-line basis over the expected average remaining service life of the employee group covered by the plans; |
|
|
|
• |
| The amortization of prior service costs and amendments on a straight-line basis over the expected average remaining service life of the employee group covered by the plans; and |
|
|
|
• |
| The interest cost of pension obligations, the expected return on plan assets, and the amortization of cumulative unrecognized net actuarial gains and losses in excess of 10% of the greater of the benefit obligation or fair value of plan assets over the expected average remaining service life of the employee group covered by the plans. For the purpose of calculating the expected return on plan assets, those assets are valued at market-related value. |
ii) Other postretirement benefits
The Company accrues the cost of postretirement benefits other than pensions. These benefits, which are funded by the Company as they become due, include life insurance programs and medical benefits. The Company amortizes the cumulative unrecognized net actuarial gains and losses in excess of 10% of the projected benefit obligation over the expected average remaining service life of the employee group covered by the plans.
(l) Environmental expenditures
Environmental expenditures that relate to current operations are expensed or capitalized as appropriate. Expenditures that relate to an existing condition caused by past operations and which are not expected to contribute to current or future operations are expensed. Liabilities are recorded when environmental assessments and/or remedial efforts are likely, and when the costs, based on a specific plan of action in terms of the technology to be used and the extent of the corrective action required, can be reasonably estimated.
(m) Reclassifications
Certain reclassifications have been made to prior years’ amounts to conform with the basis of presentation adopted in the current year.
18
2. Accounting changes
The Company has made certain changes in accounting policies to conform to new accounting standards.
(a) Goodwill and other intangible assets
In August 2001, the Canadian Institute of Chartered Accountants (“CICA”) issued Handbook Section 3062, Goodwill and Other Intangible Assets. Under Section 3062, goodwill is not amortized and is tested for impairment annually, or more frequently if events or changes in circumstances indicate that the asset might be impaired. The impairment test is carried out in two steps. In the first step, the carrying amount of the reporting unit is compared with its fair value. When the fair value of a reporting unit exceeds its carrying amount, goodwill of the reporting unit is considered not to be impaired and the second step of the impairment test is unnecessary. The second step is carried out when the carrying amount of a reporting unit exceeds its fair value, in which case the implied fair value of the reporting unit’s goodwill is compared with its carrying amount to measure the amount of the impairment loss, if any. When the carrying amount of a reporting unit’s goodwill exceeds the implied fair value of the goodwill, an impairment loss is recognized in an amount equal to the excess and is presented as a separate line item in the income statement before extraordinary items and discontinued operations.
Intangible assets acquired in business combinations and intangible assets acquired individually or with a group of other assets, which have indefinite lives, are not amortized, and are tested for impairment annually, or more frequently if events or changes in circumstances indicate that the asset might be impaired. The impairment test compares the carrying amount of the intangible asset with its fair value, and an impairment loss is recognized in income for the excess, if any. Intangible assets with definite useful lives are amortized over their useful life.
The Company has adopted Section 3062 effective January 1, 2002. As of the date of adoption, the Company had unamortized goodwill of $2,470.7 million. In accordance with the requirements of Section 3062, this change in accounting policy is not applied retroactively and the amounts presented for prior periods have not been restated for this change. This change in accounting policy resulted in a reduction in amortization expense related to goodwill of $57.0 million (net of taxes of $10.3 million) for the year ended December 31, 2002. The following summarizes the effect of the accounting change if it had been applied retroactively:
|
| 2002 |
| 2001 |
| 2000 |
| |||
Net income, as reported in the consolidated statements of income |
| $ | 279.3 |
| $ | 22.4 |
| $ | 295.4 |
|
Goodwill amortization, net of income taxes |
| — |
| 61.4 |
| 60.5 |
| |||
Net income, adjusted |
| $ | 279.3 |
| $ | 83.8 |
| $ | 355.9 |
|
|
|
|
|
|
|
|
|
|
|
|
Earnings per share, adjusted: |
|
|
|
|
|
|
| |||
Basic |
| $ | 1.78 |
| $ | 0.44 |
| $ | 2.35 |
|
Diluted |
| $ | 1.76 |
| $ | 0.43 |
| $ | 2.31 |
|
The Company conducted the first step of the transitional and annual goodwill impairment test and, based on these tests, determined that there is no impairment.
(b) Foreign currency translation
In November 2001, the CICA approved the modification of Section 1650 of the CICA handbook, Foreign Currency Translation, to eliminate the deferral and amortization of foreign currency translation gains and losses on long-lived monetary items. The Company adopted the new recommendations effective January 1, 2002 and its adoption has been applied retroactively. The effect of adopting the new recommendations did not have a significant impact on the consolidated balance sheet and consolidated statements of income and retained earnings and cash flows as at December 31, 2002.
19
2. Accounting changes (cont'd)
(c) Stock-based compensation
Effective January 1, 2002, the Company adopted the new recommendations of CICA Handbook Section 3870, Stock-based Compensation and Other Stock-based Payments. This Section establishes standards for the recognition, measurement and disclosure of stock-based compensation and other stock-based payments made in exchange for goods and services. These new recommendations require that compensation for all awards made to non-employees and certain awards made to employees, including stock appreciation rights, direct awards of stock and awards that call for settlement in cash or other assets, be measured and recorded in the financial statements at fair value. This Section also sets out a fair value based method of accounting for stock options issued to employees and applies to awards granted on or after January 1, 2002.
The Company, as permitted by Section 3870, has chosen to continue its existing policy of recording no compensation cost on the grant of stock options to employees. Any consideration paid by employees on exercise of stock options is credited to capital stock. For the employee share plans, the Company’s contribution on the employee’s behalf is recognized as a compensation expense. Any consideration paid by employees on purchase of stock is credited to capital stock.
3. Restructuring and other charges
In 2002, the Company reported restructuring and other charges of $19.6 million. The charges are detailed as follows and discussed below:
• 2002 initiatives amount to $46.4 million, while overspending on 2001 initiatives stands at $13.3 million for total costs of $59.7 million.
• The reversal of unused reserves for restructuring from 2001 amounts to $40.1 million and was applied against the 2002 charges.
In 2001, the Company recorded restructuring and other charges of $270.0 million, net of a $3.2 million reversal from the 2000 initiatives.
2002 restructuring initiatives:
In 2002, the Company has initiated new restructuring initiatives in France due to difficult market conditions, severe price competition and a decrease in sales volume. In addition, reduction in force programs were initiated in North America and will be completed in 2003. This initiative to reduce headcount was the result of volume declines in certain business segments and overlapping activities across the platform.
The charges of $46.4 million consist of $6.5 million totally utilized in 2002 relating to impaired property, plant and equipment, $30.0 million in workforce reduction costs and other restructuring charges (of which $5.9 million was utilized in 2002), and $9.9 million mostly for the write-down of the investment in Q-Media Services Corporation, which went into receivership at the end of 2002. The $30 million in workforce reduction costs and other restructuring charges includes $18.6 million for France and $8.6 million for North America.
As at December 31, 2002, 545 employees had been terminated under these new restructuring initiatives and 364 are expected to be terminated in 2003.
2001 and 2000 restructuring initiatives:
As at December 31, 2002, the restructuring initiatives announced in 2001 were substantially completed. Nearly 3,000 employees’ positions were eliminated, 10 facilities closed and more than 30 pieces of equipment have been successfully relocated.
In 2002, the Company utilized $73.3 million from restructuring reserves set up for 2001 initiatives; a cash portion of $66.0 million for severance payments for employee terminations and other restructuring charges, $5.9 million for other special charges and a non-cash portion of $1.4 million for additional plant and equipment write-downs. These costs do not reflect the progress of the restructuring due to trailing severance payments, future lease payments and other delayed exit costs.
The continuation of a contract with a customer, previously expected to be terminated, is providing sufficient work to utilize equipment originally targeted for shutdown. As a result, the Company decided to stop one plant shutdown which mainly explains the balance of the 2001 restructuring reserve reversed in 2002 of $40.1 million consisting of $18.4 million of asset impairments and $21.7 million for related restructuring charges. In addition, the execution of the 2001 initiatives resulted in an overspending of $13.3 million recorded in the 2002 restructuring and other charges.
In 2001, in response to difficult market conditions, the Company had committed itself to restructuring initiatives aimed at eliminating non-competitive assets and consolidating its platform into fewer facilities. These initiatives focused the Company’s efforts on reducing operating expenses and maximizing capacity utilization in larger and more specialized facilities.
20
3. Restructuring and other charges (cont'd)
2001 and 2000 restructuring initiatives: (cont'd)
Therefore, the Company recorded restructuring and other charges of $273.2 million. The restructuring plan consisted of $114.0 million relating primarily to impaired property, plant and equipment as a result of planned facility closures, together with other associated closure costs, $115.5 million in workforce reduction costs resulting from planned closures and other headcount reductions and other restructuring charges, and $43.7 million of other related restructuring and exit costs.
The other special charges of $43.7 million included an additional charge of $13.1 million relating to an increase in costs associated with implementing the 1999 restructuring plan, to the costs of exiting unfavourable contracts, and the write-down of investments to their expected realizable value.
In 2001, the Company utilized $179.7 million of the restructuring and other charges which consisted of $31.0 million for employees terminated during 2001 and other restructuring charges, $114.0 million for facility closings and $34.7 million for other special charges.
In 2000, as a result of changing market conditions, and particularly strong growth in North American volumes, the Company decided not to implement some planned facility closures, but concluded that other restructuring initiatives relating to Europe, and its digital strategy should be recorded. These initiatives consisted of $10.1 million of asset write-downs, utilized in 2000, and $17.9 million of severance costs, of which $3.4 million was utilized in 2000 with the balance being utilized in 2001.
Continuity of the reserve for restructuring and other charges:
The following table sets forth the Company’s 2002 restructuring reserve and activities against the reserves carried forward from 2001:
|
|
|
| Write-down |
| Restructuring |
| Other special |
| Total |
| ||||
Balance as at December 31, 2001 |
|
|
| $ | 16.6 |
| $ | 98.5 |
| $ | 10.8 |
| $ | 125.9 |
|
|
|
|
|
|
|
|
|
|
|
|
| ||||
Overspending of 2001 initiatives |
|
|
| 1.4 |
| 10.6 |
| 1.3 |
| 13.3 |
| ||||
New initiatives in 2002 |
|
|
| 6.5 |
| 30.0 |
| 9.9 |
| 46.4 |
| ||||
Reversal |
| Cash |
| — |
| (18.5 | ) | (3.2 | ) | (21.7 | ) | ||||
|
| Non-Cash |
| (16.6 | ) | — |
| (1.8 | ) | (18.4 | ) | ||||
|
|
|
| (8.7 | ) | 22.1 |
| 6.2 |
| 19.6 |
| ||||
|
|
|
|
|
|
|
|
|
|
|
| ||||
2001 reserve utilized in 2002 |
| Cash |
| — |
| (66.0 | ) | (5.9 | ) | (71.9 | ) | ||||
|
| Non-Cash |
| (1.4 | ) | — |
| — |
| (1.4 | ) | ||||
|
|
|
|
|
|
|
|
|
|
|
| ||||
2002 reserve utilized in 2002 |
| Cash |
| — |
| (5.9 | ) | — |
| (5.9 | ) | ||||
|
| Non-Cash |
| (6.5 | ) | — |
| (9.9 | ) | (16.4 | ) | ||||
|
|
|
| (7.9 | ) | (71.9 | ) | (15.8 | ) | (95.6 | ) | ||||
|
|
|
|
|
|
|
|
|
|
|
| ||||
Foreign currency changes |
|
|
| — |
| 1.3 |
| — |
| 1.3 |
| ||||
|
|
|
|
|
|
|
|
|
|
|
| ||||
Balance as at December 31, 2002 |
|
|
| $ | — |
| $ | 50.0 |
| $ | 1.2 |
| $ | 51.2 |
|
4. Financial expenses
|
| 2002 |
| 2001 |
| 2000 |
| |||
|
|
|
|
|
|
|
| |||
Interest on long-term debt and convertible notes |
| $ | 146.1 |
| $ | 173.2 |
| $ | 189.5 |
|
Interest on short-term debt |
| 5.6 |
| 7.2 |
| 6.2 |
| |||
Securitization fees |
| 15.6 |
| 28.9 |
| 33.2 |
| |||
Amortization of deferred financing costs |
| 3.5 |
| 4.5 |
| 8.3 |
| |||
Exchange losses (gains) |
| 3.4 |
| (2.2 | ) | (2.2 | ) | |||
|
| 174.2 |
| 211.6 |
| 235.0 |
| |||
|
|
|
|
|
|
|
| |||
Interest capitalized to the cost of equipment |
| (4.0 | ) | (2.8 | ) | (3.5 | ) | |||
|
|
|
|
|
|
|
| |||
|
| $ | 170.2 |
| $ | 208.8 |
| $ | 231.5 |
|
|
|
|
|
|
|
|
| |||
Cash interest payments |
| $ | 165.1 |
| $ | 199.7 |
| $ | 228.1 |
|
21
5. Income taxes
The domestic and foreign components of income before income taxes are as follows:
|
| 2002 |
| 2001 |
| 2000 |
| |||
|
|
|
|
|
|
|
| |||
Domestic |
| $ | 5.1 |
| $ | 10.4 |
| $ | 39.2 |
|
Foreign |
| 367.9 |
| 128.6 |
| 456.8 |
| |||
|
|
|
|
|
|
|
| |||
|
| $ | 373.0 |
| $ | 139.0 |
| $ | 496.0 |
|
Total income tax expense was allocated as follows:
|
| 2002 |
| 2001 |
| 2000 |
| |||
|
|
|
|
|
|
|
| |||
Income taxes |
| $ | 90.9 |
| $ | 52.0 |
| $ | 137.7 |
|
Goodwill amortization |
| — |
| (5.2 | ) | (3.7 | ) | |||
Shareholders’equity: |
|
|
|
|
|
|
| |||
Share issue expenses |
| — |
| (2.3 | ) | — |
| |||
Dividends on preferred shares |
| 3.0 |
| 2.1 |
| — |
| |||
|
|
|
|
|
|
|
| |||
|
| $ | 93.9 |
| $ | 46.6 |
| $ | 134.0 |
|
Income tax expense (recovery) attributable to income consists of:
|
| 2002 |
| 2001 |
| 2000 |
| |||
|
|
|
|
|
|
|
| |||
Current: |
|
|
|
|
|
|
| |||
Domestic |
| $ | 3.1 |
| $ | 27.1 |
| $ | (4.4 | ) |
Foreign |
| 31.1 |
| 67.7 |
| 50.3 |
| |||
|
| 34.2 |
| 94.8 |
| 45.9 |
| |||
|
|
|
|
|
|
|
| |||
Future: |
|
|
|
|
|
|
| |||
Domestic |
| (17.2 | ) | (7.1 | ) | 4.4 |
| |||
Foreign |
| 73.9 |
| (35.7 | ) | 87.4 |
| |||
|
| 56.7 |
| (42.8 | ) | 91.8 |
| |||
|
|
|
|
|
|
|
| |||
|
| $ | 90.9 |
| $ | 52.0 |
| $ | 137.7 |
|
The following table reconciles the difference between the domestic statutory tax rate and the effective tax rate used by the Company in the determination of net income:
|
| 2002 |
| 2001 |
| 2000 |
| |||
|
|
|
|
|
|
|
| |||
Domestic statutory tax rate |
| 37.2 | % | 40.4 | % | 41.5 | % | |||
Effect of foreign tax rate differences |
| (14.0 | ) | (6.0 | ) | (13.5 | ) | |||
International rates |
| 23.2 |
| 34.4 |
| 28.0 |
| |||
|
|
|
|
|
|
|
| |||
Increase (reduction) resulting from: |
|
|
|
|
|
|
| |||
Change in valuation allowance |
| 1.8 |
| 10.1 |
| (0.5 | ) | |||
Permanent differences |
| (4.7 | ) | (15.6 | ) | (2.8 | ) | |||
Large corporation and American state taxes |
| 1.5 |
| 5.7 |
| 2.2 |
| |||
Other |
| 2.6 |
| 2.8 |
| 0.9 |
| |||
|
|
|
|
|
|
|
| |||
Effective tax rate |
| 24.4 | % | 37.4 | % | 27.8 | % | |||
|
|
|
|
|
|
|
| |||
Income taxes (received) paid |
| $ | (3.6 | ) | $ | 114.7 |
| $ | 51.7 |
|
22
5. Income taxes (cont'd)
The tax effects of significant items comprising the Company’s net future tax liability are as follows:
|
| 2002 |
| 2001 |
| ||
Future tax assets: |
|
|
|
|
| ||
Operating loss carryforwards |
| $ | 92.4 |
| $ | 60.7 |
|
Tax credit carryforwards |
| 10.8 |
| 42.4 |
| ||
Accounts receivable |
| 19.4 |
| 13.7 |
| ||
Acquisition and restructuring reserves |
| 30.0 |
| 45.1 |
| ||
Pension, postretirement and workers compensation benefits |
| 50.9 |
| 68.8 |
| ||
Accrued compensation |
| 12.7 |
| 19.9 |
| ||
Other |
| 85.3 |
| 63.9 |
| ||
|
|
|
|
|
| ||
Gross future tax assets |
| 301.5 |
| 314.5 |
| ||
|
|
|
|
|
| ||
Future tax liabilities: |
|
|
|
|
| ||
Property, plant and equipment |
| (391.2 | ) | (328.1 | ) | ||
Capital leases |
| (26.4 | ) | (28.9 | ) | ||
Goodwill and other assets |
| (17.3 | ) | — |
| ||
Other |
| (74.6 | ) | (86.2 | ) | ||
|
|
|
|
|
| ||
Gross future tax liabilities |
| (509.5 | ) | (443.2 | ) | ||
|
|
|
|
|
| ||
Valuation allowance |
| (55.9 | ) | (47.3 | ) | ||
|
|
|
|
|
| ||
Net future tax liability |
| (263.9 | ) | (176.0 | ) | ||
Less current portion of future tax asset |
| 27.8 |
| 58.0 |
| ||
|
|
|
|
|
| ||
Future tax liability |
| $ | (291.7 | ) | $ | (234.0 | ) |
The 2002 and 2001 amounts above include a valuation allowance of $55.9 million and $47.3 million respectively, relating to loss carryforwards and other tax benefits available. The valuation allowance for future tax assets as of January 1, 2001 was $34.9 million. The net change in the total valuation allowance for the years ended December 31, 2002 and 2001 was explained by $6.8 million and $14.1 million respectively, allocated to income from operations.
Subsequent recognized tax benefits relating to the valuation allowance for future tax assets as of December 31, 2002 will be allocated as follows:
Income tax benefit that would be reported in the consolidated statement of income |
| $ | 33.2 |
|
Goodwill |
| 22.7 |
| |
|
|
|
| |
|
| $ | 55.9 |
|
At December 31, 2002, the Company had net operating loss carryforwards for income tax purposes available to reduce future taxable income of $175.7 million, expiring from 2003 to 2017, and $132.5 million which can be carried forward indefinitely. The Company also has state net operating losses and tax credits of $238.1 million in the United States, which expire from 2004 to 2020.
The Company has not recognized a future tax liability for the undistributed earnings of its subsidiaries in the current and prior years because the Company currently does not expect those unremitted earnings to reverse and become taxable to the Company in the foreseeable future. A future tax liability will be recognized when the Company expects that it will recover those undistributed earnings in a taxable manner, such as through receipt of dividends or sale of the investments. Such liability is not reasonably determinable at the present time.
23
6. Earnings per share
Basic earnings per share are calculated by dividing net income available to holders of equity shares by the weighted daily average number of equity shares outstanding during the year. Net income available to holders of equity shares is computed by subtracting dividends on the preferred shares from net income.
Diluted earnings per share are calculated by using the weighted average number of equity shares outstanding adjusted to include potentially dilutive effect of convertible notes and stock options.
The following table sets forth the computation of basic and diluted earnings per share:
|
| 2002 |
| 2001 |
| 2000 |
| |||
|
|
|
|
|
|
|
| |||
Net income available to holders of equity shares |
| $ | 250.4 |
| $ | 0.5 |
| $ | 285.3 |
|
|
|
|
|
|
|
|
| |||
Income impact on assumed conversion of convertible notes, net of applicable income taxes |
| 4.8 |
| — |
| 4.5 |
| |||
|
|
|
|
|
|
|
| |||
Net income adjusted for dilution effect |
| $ | 255.2 |
| $ | 0.5 |
| $ | 289.8 |
|
|
|
|
|
|
|
|
| |||
(In millions) |
|
|
|
|
|
|
| |||
Weighted average number of equity shares outstanding |
| 140.7 |
| 142.2 |
| 147.0 |
| |||
|
|
|
|
|
|
|
| |||
Effect of dilutive convertible notes and stock options |
| 4.7 |
| 0.8 |
| 4.7 |
| |||
|
|
|
|
|
|
|
| |||
Weighted average number of diluted equity shares outstanding |
| 145.4 |
| 143.0 |
| 151.7 |
| |||
|
|
|
|
|
|
|
| |||
Earnings per share: |
|
|
|
|
|
|
| |||
Basic |
| $ | 1.78 |
| $ | — |
| $ | 1.94 |
|
Diluted |
| $ | 1.76 |
| $ | — |
| $ | 1.91 |
|
In 2001, diluted net income available to holders of equity shares does not include the effects of the convertible notes as the effect of their inclusion was anti-dilutive.
7. Business acquisitions and disposals
(a) Acquisitions
During the years ended December 31, 2002, 2001 and 2000, the Company acquired the following businesses, which have been accounted for by the purchase method, and earnings are included in the consolidated statements of income since the date of acquisition.
2002
In March 2002, the Company purchased all of the issued and outstanding shares of European Graphic Group S.A. (“E2G”), a subsidiary of Hachette Filipacchi Medias in France, for a cash consideration of $3.3 million. The purchase price will be adjusted by contingent considerations of a maximum of 6.1 million Euro ($6.4 million), based on achieving a specific performance level, and will be payable in 2004 and 2007. The contingent considerations, if any, will be recorded as an increase of the fixed assets. E2G owns printing and bindery facilities in France and Belgium and a 50% ownership of Bayard Hachette Routage in France. No goodwill resulted from this acquisition. The allocation purchase price process was not completed as at December 31, 2002 and the amounts assigned to the assets and liabilities may be subsequently adjusted.
During the year, the Company also acquired minority interests in North America and Europe for a cash consideration of $4.5 million for which $1.3 million has been recorded in goodwill.
24
7. Business acquisitions and disposals (cont'd)
(a) Acquisitions (cont'd)
2001
In February 2001, the Company acquired a 70% controlling interest in Espacio Y Punto, in Spain, for a cash consideration of $8.2 million.
In March 2001, the Company acquired a 75% controlling interest in Grafica Melhoramentos, in Brazil, for a cash consideration of $3.3 million.
In March 2001, the Company also acquired minority interests in its Latin American operations for a cash consideration of $15.0 million, a convertible subordinated debenture of $6.0 million and a promissory note of $2.0 million.
In July 2001, the Company acquired all of the issued and outstanding shares of Retail Printing Corporation, in Massachusetts, United States, to expand its North American retail network for a cash consideration of $97.6 million.
In August 2001, the Company purchased manufacturing assets of Grupo Serla, in Mexico, for a cash consideration of $13.0 million.
During the year, the Company also completed other business acquisitions complementary to its operations for a cash consideration of $1.8 million.
Goodwill recognized in those transactions amounted to $98.7 million and was assigned to the North America, Europe and Latin America segments in the amounts of $85.7 million, $8.4 million and $4.6 million, respectively.
2000
During 2000, the Company completed the purchase price allocation of World Color Press (“WCP”) acquired in 1999 and adjusted the assets and liabilities by $78.6 million. The adjustment related to the impairment of assets resulted in a write-off of $52.1 million. Other costs included $21.3 million for plant shutdowns, $7.3 million related to workers’compensation which was based on underestimated claims, $21.2 million for contract termination and write-down of related assets and $23.3 million for other reserves recorded at acquisition. The tax impact on these adjustments was $46.6 million.
During 2000, the Company paid an amount of $1.0 million for the adjustment in the purchase price of prior years’ business acquisitions in the United States and in Peru. This amount was accounted for as an increase of goodwill. In addition, the Company acquired the remaining minority interest in Inter-Routage in France for an amount of $4.3 million.
Net assets acquired at fair value:
|
| 2002 |
| 2001 |
| 2000 |
| |||
|
|
|
|
|
|
|
| |||
Assets acquired: |
|
|
|
|
|
|
| |||
Cash and cash equivalent |
| $ | 7.5 |
| $ | 1.8 |
| $ | — |
|
Non-cash operating working capital |
| 1.0 |
| 3.4 |
| — |
| |||
Property, plant and equipment |
| 63.6 |
| 73.8 |
| (56.5 | ) | |||
Goodwill |
| 1.3 |
| 98.7 |
| 71.2 |
| |||
Other assets |
| — |
| 0.8 |
| (8.3 | ) | |||
Future income taxes |
| — |
| — |
| 57.7 |
| |||
Minority interest |
| 3.2 |
| 7.2 |
| 2.3 |
| |||
|
|
|
|
|
|
|
| |||
Liabilities assumed: |
|
|
|
|
|
|
| |||
Bank indebtedness |
| — |
| 2.3 |
| — |
| |||
Non-cash operating working capital deficiency |
| — |
| — |
| 32.0 |
| |||
Long-term debt |
| 55.5 |
| 31.2 |
| — |
| |||
Other liabilities |
| 4.8 |
| 0.4 |
| 33.4 |
| |||
Future income taxes |
| 0.1 |
| 3.1 |
| — |
| |||
Convertible notes |
| — |
| — |
| (4.3 | ) | |||
Minority interest |
| 8.4 |
| — |
| — |
| |||
Net assets acquired |
| $ | 7.8 |
| $ | 148.7 |
| $ | 5.3 |
|
|
|
|
|
|
|
|
| |||
Consideration: |
|
|
|
|
|
|
| |||
Cash |
| $ | 7.8 |
| $ | 140.7 |
| $ | 5.3 |
|
Issuance of convertible subordinated debenture and promissory note |
| — |
| 8.0 |
| — |
| |||
|
| $ | 7.8 |
| $ | 148.7 |
| $ | 5.3 |
|
25
7. Business acquisitions and disposals (cont'd)
(b) Disposals
In August 2000, the Company sold the operating assets of its North American CD-Rom replication business for a total consideration of $68.0 million. The sale price was comprised of $47.0 million of cash and $21.0 million in special warrants and promissory notes convertible into the buyer’s, Q-Media Services Corporation, shares. The Company realized a gain amounting to $13.4 million which was recorded as a reduction of selling, general and administrative expenses.
8. Trade receivables
Asset securitization
During 2002, the Company sold, with limited recourse, a portion of its Canadian trade receivables on a revolving basis under the terms of a Canadian securitization agreement dated March 1998 (the “Canadian Program”). The Canadian Program limit is Cdn $125.0 million ($79.6 million). As at December 31, 2002, the amount outstanding under the Canadian Program was Cdn $125.0 million ($79.6 million) (Cdn $116.0 million ($72.9 million) as at December 31, 2001).
During 2002, the Company also sold, with limited recourse, a portion of its US trade receivables on a revolving basis under the terms of a US securitization agreement dated December 1999 (the “US Program”). The US Program limit is $510.0 million. As at December 31, 2002, the amount outstanding under the US Program was $435.0 million ($500.0 million as at December 31, 2001).
During 2002, the Company also sold, with limited recourse, a portion of its French and Spanish trade receivables on a revolving basis under the terms of a European securitization agreement dated June 2001 (the “European Program”). The European Program limit is 153.0 million Euro ($159.5 million). As at December 31, 2002, the amount outstanding under the European Program was 129.5 million Euro ($135.0 million) (140.4 million Euro ($124.1 million) as at December 31, 2001).
The Company has retained the responsibility for servicing, administering and collecting trade receivables sold. No servicing asset or liability has been recorded, since the fees the Company receives for servicing the receivables approximate the related costs.
At December 31, 2002, an aggregate of $747.2 million ($802.0 million as at December 31, 2001) of accounts receivable have been sold under the three programs, of which $97.5 million ($105.0 million as at December 31, 2001) were kept by the Company as a retained interest, resulting in a net aggregate consideration of $649.7 million ($697.0 million as at December 31, 2001) on the sale.The retained interest is recorded in the Company’s accounts receivable, and its fair market value approximates its cost given the short nature of the collection period of the accounts receivable sold.The rights of the Company on the retained interest are subordinated to the rights of the investors under the programs.There is no recourse under the programs on the Company’s other assets for failure of debtors to pay when due, other than the retained interest of the Company.
Securitization fees vary based on commercial paper rates in Canada, the United States and Europe and, generally, provide a lower effective funding cost than available under the Company’s bank facilities.
Proceeds from revolving sales between the securitization trusts and the Company in 2002 total $4.5 billion ($4.5 billion in 2001).
9. Inventories
|
| 2002 |
| 2001 |
| ||
|
|
|
|
|
| ||
Raw materials and supplies |
| $ | 234.0 |
| $ | 203.1 |
|
Work in process |
| 175.4 |
| 174.0 |
| ||
|
|
|
|
|
| ||
|
| $ | 409.4 |
| $ | 377.1 |
|
26
10. Property, plant and equipment
|
| Cost |
| Accumulated |
| Net book |
| |||
|
|
|
|
|
|
|
| |||
December 31, 2002 |
|
|
|
|
|
|
| |||
Land |
| $ | 83.4 |
| $ | — |
| $ | 83.4 |
|
Buildings and leasehold improvements |
| 783.7 |
| 172.3 |
| 611.4 |
| |||
Machinery and equipment |
| 3,433.6 |
| 1,605.7 |
| 1,827.9 |
| |||
Projects under development |
| 87.9 |
| — |
| 87.9 |
| |||
|
|
|
|
|
|
|
| |||
|
| $ | 4,388.6 |
| $ | 1,778.0 |
| $ | 2,610.6 |
|
|
|
|
|
|
|
|
| |||
December 31, 2001 |
|
|
|
|
|
|
| |||
Land |
| $ | 81.3 |
| $ | — |
| $ | 81.3 |
|
Buildings and leasehold improvements |
| 729.4 |
| 147.8 |
| 581.6 |
| |||
Machinery and equipment |
| 3,181.7 |
| 1,355.9 |
| 1,825.8 |
| |||
Projects under development |
| 145.3 |
| — |
| 145.3 |
| |||
|
|
|
|
|
|
|
| |||
|
| $ | 4,137.7 |
| $ | 1,503.7 |
| $ | 2,634.0 |
|
As at December 31, 2002, the cost of property, plant and equipment and the corresponding accumulated depreciation balance included amounts of $355.0 million ($292.5 million as at December 31, 2001) and $189.3 million ($148.8 million as at December 31, 2001) respectively, for the assets held under capital leases. Depreciation expenses of property, plant and equipment held under capital leases amounted to $19.4 million in 2002 ($17.5 million in 2001 and $16.0 million in 2000).
11. Goodwill
The changes in the carrying amount of goodwill for the year ended December 31, 2002 are as follows:
|
| North |
| Europe |
| Latin |
| Total |
| ||||
|
|
|
|
|
|
|
|
|
| ||||
Balance as at December 31, 2001 |
| $ | 2,181.5 |
| $ | 270.8 |
| $ | 18.4 |
| $ | 2,470.7 |
|
Goodwill acquired during the period |
| 0.3 |
| 1.0 |
| — |
| 1.3 |
| ||||
Foreign currency changes |
| 0.5 |
| 53.0 |
| (11.2 | ) | 42.3 |
| ||||
|
|
|
|
|
|
|
|
|
| ||||
Balance as at December 31, 2002 |
| $ | 2,182.3 |
| $ | 324.8 |
| $ | 7.2 |
| $ | 2,514.3 |
|
12. Long-term debt
|
| Maturity |
| 2002 |
| 2001 |
| ||
|
|
|
|
|
|
|
| ||
Revolving bank facility $1.0 B (a) |
| 2005-2007 |
| $ | 34.8 |
| $ | 267.9 |
|
Commercial paper (b) |
| 2005-2007 |
| 101.9 |
| 147.0 |
| ||
Senior debentures 7.25% (c) |
| 2007 |
| 150.0 |
| 150.0 |
| ||
Senior debentures 6.50% (d) |
| 2027 |
| 150.0 |
| 150.0 |
| ||
Senior Notes 8.375% (e) |
| 2008 |
| 258.5 |
| 258.6 |
| ||
Senior Notes 7.75% (f) |
| 2009 |
| 292.8 |
| 291.7 |
| ||
Senior Notes 8.42% and 8.52% (g) |
| 2010, 2012 |
| 250.0 |
| 250.0 |
| ||
Senior Notes 8.54% and 8.69% (h) |
| 2015, 2020 |
| 121.0 |
| 121.0 |
| ||
Senior Notes 7.20% (i) |
| 2006 |
| 250.0 |
| 250.0 |
| ||
Other debts and capital leases (j) |
| 2003-2016 |
| 98.1 |
| 132.7 |
| ||
|
|
|
| 1,707.1 |
| 2,018.9 |
| ||
Less current portion |
|
|
| 38.5 |
| 57.0 |
| ||
|
|
|
|
|
|
|
| ||
|
|
|
| $ | 1,668.6 |
| $ | 1,961.9 |
|
27
12. Long-term debt (cont'd)
(a) In April 2002, the Company restructured its existing revolving bank facility composed of three tranches. The first and the second tranches of $250.0 million each mature in 2005, while the third tranche of $500.0 million matures in 2007. All tranches are fully revolving until their maturity dates. The Company paid fees for the unused portion of $1.0 million in 2002 ($0.9 million in 2001). The credit agreement contains certain restrictions, including the obligation to maintain certain financial ratios. The facility can be used for general corporate purposes and as liquidity back-up for the Company’s commercial paper program.
The revolving bank facility bears interest at variable rates based on LIBOR or Bankers’ Acceptances rates. At December 31, 2002, the drawings under this facility are denominated in dollars only and bear interest at 2.17%.
(b) At December 31, 2002, Cdn $156.4 million ($99.6 million) (Cdn $226.3 million ($142.3 million) as at December 31, 2001) and $2.3 million ($4.7 million as at December 31, 2001) of notes are outstanding under the Commercial paper program bearing interest at rates ranging from 2.85% to 3.30% in Canadian dollars and 1.86% in dollars. The program limit is $350.0 million. At December 31, 2002, the Commercial paper program was classified as long-term, since the Company has the ability and the intent to maintain such debt on a long-term basis and has long-term bank facilities available (see (a) above) to replace such debt, if necessary. Included in the outstanding balance is an amount of Cdn$10.0 million ($6.4 million) held by an affiliated company.
(c) The senior debentures mature on January 15, 2007.
(d) The senior debentures mature on August 1, 2027 and are redeemable at the option of the holder at their par value on August 1, 2004.
(e) The Senior Notes mature on November 15, 2008 and are redeemable at the option of the Company at a decreasing premium between November 2003 and November 2006, and thereafter at par value until their final maturity. The notes were issued by WCP for an original aggregate principal of $300.0 million. They were subsequently revalued in order to reflect their fair value at the time WCP was acquired, based on the Company’s borrowing rate for similar financial instruments. During 2000, the Company repurchased in the open market $42.4 million face value thereof. The aggregate principal amount of the notes, as at December 31, 2002, is $257.6 million ($257.6 million as at December 31, 2001). In August 2001, the Company obtained the consent from the noteholders to generally conform the restrictions on the Notes with the Company’s other Senior Public Debentures. At the same time, the Notes which were Senior Subordinated Notes became Senior Notes.
(f) The Senior Notes mature on February 15, 2009. The aggregate principal amount of the notes is $300.0 million and the notes are redeemable at the option of the Company at a decreasing premium between February 2004 and February 2007, and thereafter at par value until their final maturity. The notes were issued by WCP and revalued in order to reflect their fair value at the time WCP was acquired based on the Company’s borrowing rate for similar financial instruments. In August 2001, the Company obtained the consent from the noteholders to generally conform the restrictions on the Notes with the Company’s other Senior Public Debentures. At the same time, the Notes which were Senior Subordinated Notes became Senior Notes.
(g) In July 2000, the Company issued Senior Notes for a principal amount of $250.0 million comprised of two tranches. The first tranche of $175.0 million matures on July 15, 2010 while the second tranche of $75.0 million matures on July 15, 2012. These notes contain certain restrictions which are generally less restrictive than those of the revolving bank facility.
(h) In September 2000, the Company issued Senior Notes for a principal amount of $121.0 million comprised of two tranches. The first tranche of $91.0 million matures on September 15, 2015 and the second tranche of $30.0 million matures on September 15, 2020. These notes contain certain restrictions which are generally less restrictive than those of the revolving bank facility.
(i) In March 2001, the Company issued Senior Notes for a principal amount of $250.0 million maturing in March 2006. A portion of $33.0 million of the Notes bears a floating interest rate, but has been swapped to fixed at the same rate as the coupon on the fixed rate portion (see Note 18 (c)).These Notes contain certain restrictions which are generally less restrictive than those of the revolving bank facility.
(j) Other debts and capital leases are partially secured by assets. An amount of $37.6 million ($38.6 million as at December 31, 2001) is denominated in Euro currency, an amount of $18.9 million ($18.8 million as at December 31, 2001) is denominated in British pounds and an amount of $4.9 million ($5.1 million as at December 31, 2001) in Swedish krona. At December 31, 2002, these debts and capital leases bear interest at rates ranging from 0% to 10.26%.
The Company was in compliance with all significant debt covenants at December 31, 2002.
28
12. Long-term debt (cont’d)
Principal repayments on long-term debt are as follows:
2003 |
| $ | 38.5 |
|
2004 |
| 18.8 |
| |
2005 |
| 10.7 |
| |
2006 |
| 258.3 |
| |
2007 |
| 290.5 |
| |
2008 and thereafter |
| 1,090.3 |
| |
13. Other liabilities
|
| 2002 |
| 2001 |
| ||
|
|
|
|
|
| ||
Pension liability |
| $ | 58.3 |
| $ | 72.7 |
|
Postretirement benefits |
| 65.8 |
| 65.6 |
| ||
Reserve for unfavourable leases acquired |
| 35.6 |
| 42.3 |
| ||
Workers’compensation accrual |
| 18.3 |
| 24.0 |
| ||
Reserve for environmental matters |
| 16.3 |
| 16.8 |
| ||
Other |
| 34.6 |
| 24.2 |
| ||
|
|
|
|
|
| ||
|
| $ | 228.9 |
| $ | 245.6 |
|
14. Convertible notes
|
| Maturity |
| 2002 |
| 2001 |
| ||
|
|
|
|
|
|
|
| ||
Convertible senior subordinated notes 6.00% (a) |
| 2007 |
| $ | 109.0 |
| $ | 107.3 |
|
Convertible subordinated debentures 7.00% (b) |
| 2004 |
| 6.0 |
| 6.0 |
| ||
|
|
|
|
|
|
|
| ||
|
|
|
| $ | 115.0 |
| $ | 113.3 |
|
(a) The convertible senior subordinated notes mature on October 1, 2007. The notes were issued by WCP and revalued in order to reflect their fair value at the time WCP was acquired based on the Company’s borrowing rate for similar financial instruments. The equity component of the notes, which corresponds to the option of the holder to convert the notes into equity shares of the Company, was valued at the date of acquisition and classified as additional paid-in capital. Since the acquisition of WCP by the Company, each $1,000 tranche is convertible into 30.5884 Subordinate Voting Shares of the Company which corresponds to a price of $26.24 per share and $197.25 in cash. The notes are convertible at the option of the holder at any time, and redeemable at the option of the Company at a decreasing premium from October 2000 to the final maturity. Certain conditions applied to a redemption between October 2000 and October 2002. Pursuant to the terms of the convertible notes, the Company repurchased $7.6 million of the notes in 1999 following a tender offer at par for 100% of the face value of $151.8 million. The Company subsequently repurchased notes in the open market in 2000 for the principal amount of $24.7 million thereof. The aggregate principal amount of the notes, as at December 31, 2002, is $119.5 million ($119.5 million as at December 31, 2001). The number of equity shares to be issued upon conversion of the convertible notes would be 3,656,201.
(b) In March 2001, a subsidiary of the Company issued convertible subordinated debentures maturing in May 2004. These debentures are convertible in subordinate voting shares of the Company at a conversion price of $25.00 per share. The debentures are not redeemable prior to maturity. The number of equity shares to be issued upon conversion of the debentures would be 240,000.
29
15. Capital stock
(a) Authorized capital stock
Equity shares:
Multiple Voting Shares, authorized in an unlimited number, without par value, carrying ten votes per share, convertible at any time into Subordinate Voting Shares on a one-to-one basis.
Subordinate Voting Shares, authorized in an unlimited number, without par value, carrying one vote per share.
Preferred shares, authorized in an unlimited number, without par value, issuable in series; the number of preferred shares in each series and the related characteristics, rights and privileges are to be determined by the Board of Directors prior to each issue.
The Series 2 Cumulative Redeemable First Preferred Shares were entitled to a fixed cumulative preferential cash dividend of Cdn $1.25 per share per annum, payable quarterly from March 1, 1998 to November 30, 2002, if declared. Since then, the annual dividend represents a floating adjustable cumulative preferential cash dividend based on prime rate and payable on a monthly basis, if declared. These preferred shares are redeemable in whole but not in part, at the Company’s option, on December 1, 2002 at Cdn $25.00 per share and, subsequent to December 1, 2002, at Cdn $25.50. On December 1, 2002, and at every 5th anniversary thereafter, these preferred shares may be converted into Series 3 Cumulative Redeemable First Preferred Shares under certain conditions.
The Series 3 Cumulative Redeemable First Preferred Shares are entitled to a fixed cumulative preferential cash dividend of Cdn $1.5380 per share per annum, payable quarterly from December 1, 2002 to November 30, 2007. Thereafter, a new fixed cumulative preferential cash dividend will be set by the Company for another five-year period. On December 1, 2007, and at every 5th anniversary thereafter, these preferred shares may be converted into Series 2 Cumulative Redeemable First Preferred Shares under certain conditions.
The Series 4 Cumulative Redeemable First Preferred Shares are entitled to a fixed cumulative preferential cash dividend of Cdn $1.6875 per share per annum, payable quarterly, if declared. On and after March 15, 2006, these preferred shares are redeemable at the option of the Company at Cdn$25.00, or with regulatory approval, the preferred shares may be converted into equity shares by the Company. On and after June 15, 2006, these preferred shares may be converted at the option of the holder into equity shares, subject to the right of the Company prior to the conversion date to redeem for cash or find substitute purchasers for such preferred shares.
The Series 5 Cumulative Redeemable First Preferred Shares are entitled to a fixed cumulative preferential cash dividend of Cdn $1.725 per share per annum, payable quarterly, if declared. On and after December 1, 2007, these preferred shares are redeemable at the option of the Company at Cdn$25.00, or with regulatory approval, the preferred shares may be converted into equity shares by the Company. On and after March 1, 2008, these preferred shares may be converted at the option of the holder into equity shares, subject to the right of the Company prior to the conversion date to redeem for cash or find substitute purchasers for such preferred shares.
Each series of Preferred Shares ranks on a parity with every other series of Preferred Shares.
(b) Issued and outstanding Subordinate Voting Shares
Pursuant to the acquisition of WCP in 1999, the Company issued 10,927 Subordinate Voting Shares in 2000 for a value determined at $23.61 per share based on an average market price before and after the date of the transaction.
(c) Issued and outstanding Redeemable First Preferred Shares
In December 2002, the holders of the Series 2 Cumulative Redeemable First Preferred Shares elected to convert more than 11 million preferred shares into Series 3 Cumulative Redeemable First Preferred Shares. Consequently, in accordance with the Articles of the Company for these preferred shares, all remaining Series 2 Cumulative Redeemable First Preferred Shares were automatically converted into Series 3 Cumulative Redeemable First Preferred Shares.
In February 2001, the Company issued 8,000,000 Series 4 Cumulative Redeemable First Preferred Shares for a cash consideration of Cdn $200.0 million ($130.2 million) before share issue expenses of Cdn $4.8 million ($3.1 million) recorded as a reduction of retained earnings.
In August 2001, the Company issued 7,000,000 Series 5 Cumulative Redeemable First Preferred Shares for a cash consideration of Cdn $175.0 million ($113.9 million) before share issue expenses of Cdn $5.7 million ($3.7 million) recorded as a reduction of retained earnings.
30
15. Capital stock (cont'd)
(d) Share repurchase program
In 2000, the Company initiated a normal course issuer bid for a maximum of 8,000,000 Subordinate Voting Shares over the period from April 6, 2000 to April 5, 2001. During 2001, under this normal course issuer bid program, the Company had repurchased for cancellation 3,188,492 Subordinate Voting Shares for a net cash consideration of Cdn $114.9 million ($79.2 million). As at December 31, 2000, the Company had repurchased for cancellation 1,751,508 Subordinate Voting Shares for a net cash consideration of Cdn $59.2 million ($41.6 million).
In 2001, the Company initiated another normal course issuer bid for a maximum of 8,800,000 Subordinate Voting Shares over the period from April 6, 2001 to April 5, 2002. During 2002, under this normal course issuer bid program, the Company had repurchased for cancellation 148,500 Subordinate Voting Shares for a net cash consideration of Cdn $5.2 million ($3.5 million). As at December 31, 2001, the Company had repurchased for cancellation 3,543,700 Subordinate Voting Shares for a net cash consideration of Cdn $143.8 million ($98.2 million).
16. Stock-based compensation
(a) Employee share plans
The Employee Stock Purchase Plan gives eligible employees in the United States the opportunity to acquire shares of the Company’s capital stock for up to 4% of their gross salaries and to have the Company contribute, on the employees’ behalf, a further amount equal to 17.5% of the total amount invested by the employee. The number of shares that may be issued and sold under this plan is limited to 2,000,000 Subordinate Voting Shares, subject to adjustments in the event of stock dividends, stock splits and similar events. At December 31, 2002, 6,199 employees (6,372 as at December 31, 2001) were participating in this plan. The total number of plan shares issued on behalf of employees, including the Company’s contribution, was 468,267 in 2002, (270,843 in 2001) which represents compensation expenses amounting to $1.6 million in 2002 ($1.0 million in 2001).
The Employee Share Investment Plan gives eligible employees in Canada the opportunity to subscribe for up to 4% of their gross salaries to purchase shares of the Company’s capital stock and to have the Company invest, on the employee’s behalf, a further 20% of the amount invested by the employee. The number of shares that may be issued and sold under this plan is limited to 3,000,000 Subordinate Voting Shares, subject to adjustments in the event of stock dividends, stock splits and similar events. At December 31, 2002, 2,249 employees (2,072 as at December 31, 2001) were participating in this plan. The total number of shares issued on behalf of employees, under this plan, including the Company’s contribution, was 117,162 in 2002,(120,494 in 2001 and 121,975 in 2000), which represents compensation expenses amounting to $0.4 million in 2002 ($0.4 million in 2001 and $0.3 million in 2000).
(b) Stock option plans
Under stock option plans, a total of 7,602,049 Subordinate Voting Shares have been reserved for plan participants. As at December 31, 2002, the number of Subordinate Voting Shares related to the stock options outstanding was 3,525,376. The subscription price is equal to the share market price at the date the options were granted. The options may be exercised during a period not exceeding ten years from the date they have been granted.
The number of stock options outstanding fluctuated as follows:
|
| 2002 |
| 2001 |
| 2000 |
| |||||||||
|
| Options |
| Weighted |
| Options |
| Weighted |
| Options |
| Weighted |
| |||
|
|
|
|
|
|
|
|
|
|
|
|
|
| |||
Balance, beginning of year |
| 4,563,330 |
| $ | 20.07 |
| 4,297,478 |
| $ | 19.73 |
| 4,127,254 |
| $ | 19.82 |
|
Issued |
| 474,321 |
| 22.51 |
| 651,276 |
| 22.01 |
| 252,495 |
| 20.68 |
| |||
Exercised |
| (525,069 | ) | 16.77 |
| (385,424 | ) | 12.91 |
| (82,271 | ) | 7.77 |
| |||
Cancelled |
| (987,206 | ) | 22.33 |
| — |
| — |
| — |
| — |
| |||
|
|
|
|
|
|
|
|
|
|
|
|
|
| |||
Balance, end of year |
| 3,525,376 |
| $ | 20.42 |
| 4,563,330 |
| $ | 20.07 |
| 4,297,478 |
| $ | 19.73 |
|
|
|
|
|
|
|
|
|
|
|
|
|
|
| |||
Options exercisable, end of year |
| 1,271,529 |
| $ | 19.54 |
| 2,444,969 |
| $ | 19.05 |
| 1,897,680 |
| $ | 17.83 |
|
31
NOTES TO CONSOLIDATED FINANCIAL STATEMENTS
16. Stock-based compensation (cont'd)
(b) Stock option plans (cont'd)
The following table summarizes information about stock options outstanding and exercisable at December 31, 2002:
|
| Options outstanding |
| Options exercisable |
| ||||||||
Range of exercise prices |
| Number |
| Weighted |
| Weighted |
| Number |
| Weighted |
| ||
|
|
|
|
|
|
|
|
|
|
|
| ||
$9 - $12 |
| 60,004 |
| 1.77 |
| $ | 10.50 |
| 60,004 |
| $ | 10.50 |
|
$12 - $15 |
| 31,992 |
| 1.15 |
| 13.21 |
| 31,992 |
| 13.21 |
| ||
$15 - $18 |
| 752,707 |
| 5.15 |
| 16.71 |
| 326,753 |
| 16.36 |
| ||
$18 - $21 |
| 647,760 |
| 6.17 |
| 20.49 |
| 249,521 |
| 20.52 |
| ||
$21 - $24 |
| 2,032,913 |
| 7.72 |
| 22.17 |
| 603,259 |
| 22.09 |
| ||
|
|
|
|
|
|
|
|
|
|
|
| ||
|
| 3,525,376 |
| 6.89 |
| $ | 20.42 |
| 1,271,529 |
| $ | 19.54 |
|
Had compensation cost been determined using the fair value based method at the date of grant for awards granted in 2002 under all plans, the Company’s pro forma net income, earnings per share and diluted earnings per share would have been as presented in the table below.
|
| 2002 |
| |
Pro forma net income |
| $ | 278.8 |
|
|
|
|
| |
Pro forma earnings per share: |
|
|
| |
Basic |
| $ | 1.78 |
|
Diluted |
| $ | 1.75 |
|
The pro forma disclosure omits the effect of awards granted before January 1, 2002. These pro forma amounts include a compensation cost calculated using the Black-Scholes option pricing model with the following assumptions.
|
| 2002 |
| |
Weighted-average grant date fair value of options |
| $ | 4.97 |
|
Risk-free interest rate |
| 4.48 - 5.07 | % | |
Dividend yield |
| 2 | % | |
Expected volatility |
| 25 | % | |
Expected life |
| 7 years |
| |
17. Translation adjustment
The change in the translation adjustment included in shareholders’ equity is the result of the fluctuation of the exchange rates on translation of net assets of self-sustaining foreign operations not denominated in US dollars and foreign exchange gains or losses related to derivative financial instruments used to hedge the net investments.
32
18. Financial instruments and concentrations of credit risk
(a) Fair value of financial instruments
The carrying values of cash and cash equivalents, trade receivables, receivables from related parties, bank indebtedness, trade payables and accrued liabilities approximate their fair values because of the short-term nature of these items.
The following table summarizes the book value and fair value at December 31, 2002 and 2001 of those financial instruments having a fair value different from their book value as at December 31. The fair values of the financial liabilities are estimated based on discounted cash flows using year-end market yields of similar instruments having the same maturity. The fair values of the derivative financial instruments are estimated using year-end market rates, and reflect the amount that the Company would receive or pay if the instruments were closed out at these dates.
|
| 2002 |
| 2001 |
| ||||||||
|
| Book Value |
| Fair Value |
| Book Value |
| Fair Value |
| ||||
|
|
|
|
|
|
|
|
|
| ||||
Financial liabilities |
|
|
|
|
|
|
|
|
| ||||
Long-term debt(1) |
| $ | (1,707.1 | ) | $ | (1,861.5 | ) | $ | (2,018.9 | ) | $ | (2,073.9 | ) |
Convertible notes |
| (115.0 | ) | (123.8 | ) | (113.3 | ) | (119.5 | ) | ||||
|
|
|
|
|
|
|
|
|
| ||||
Derivative financial instruments |
|
|
|
|
|
|
|
|
| ||||
Interest rate swap agreements |
| — |
| (8.2 | ) | — |
| (11.7 | ) | ||||
Foreign exchange forward contracts |
| — |
| (8.9 | ) | — |
| (17.5 | ) | ||||
Cross currency interest rate swaps |
| — |
| (29.7 | ) | — |
| 3.0 |
| ||||
Commodity swaps |
| — |
| — |
| — |
| (1.7 | ) | ||||
(1) Including current portion
(b) Foreign exchange risk management
The Company enters into foreign exchange forward contracts and cross-currency interest rate swaps to hedge the settlement of raw materials and equipment purchases, to set the exchange rate for foreign denominated sales and to manage its foreign exchange exposure on its net investments. The amounts of outstanding contracts at year end, presented by currency, are included in the tables below:
Foreign exchange forward contracts
|
| 2002 |
| 2001 |
| ||||||
Currencies |
| Notional |
| Average |
| Notional |
| Average |
| ||
|
|
|
|
|
|
|
|
|
| ||
$ / Cdn $ |
|
|
|
|
|
|
|
|
| ||
Less than 1 year |
| $ | 116.2 |
| 0.6528 |
| $ | 124.1 |
| 0.6981 |
|
Between 1 and 3 years |
| 141.9 |
| 0.6269 |
| 115.6 |
| 0.6526 |
| ||
Between 3 and 5 years |
| 249.3 |
| 0.6213 |
| — |
| — |
| ||
|
|
|
|
|
|
|
|
|
| ||
Euro / $ |
|
|
|
|
|
|
|
|
| ||
Less than 1 year |
| 30.6 |
| 1.0056 |
| 23.3 |
| 0.9155 |
| ||
|
|
|
|
|
|
|
|
|
| ||
SEK / $ |
|
|
|
|
|
|
|
|
| ||
Less than 1 year |
| 12.9 |
| 8.92 |
| 19.6 |
| 10.56 |
| ||
|
|
|
|
|
|
|
|
|
| ||
GBP / Euro |
|
|
|
|
|
|
|
|
| ||
Less than 1 year |
| 6.4 |
| 0.6370 |
| 13.3 |
| 0.6238 |
| ||
|
|
|
|
|
|
|
|
|
| ||
Other |
|
|
|
|
|
|
|
|
| ||
Less than 1 year |
| 31.9 |
| — |
| 39.8 |
| — |
| ||
|
|
|
|
|
|
|
|
|
| ||
|
| $ | 589.2 |
|
|
| $ | 335.7 |
|
|
|
(2) Transactions in foreign currencies translated into dollars using the closing exchange rate as at December 31, 2002
and 2001.
33
18. Financial instruments and concentrations of credit risk (cont'd)
(b) Foreign exchange risk management (cont'd)
Cross-currency interest rate swaps
|
| 2002 |
| 2001 |
| ||||||
Currencies |
| Notional |
| Average |
| Notional |
| Average |
| ||
|
|
|
|
|
|
|
|
|
| ||
Euro / $ |
|
|
|
|
|
|
|
|
| ||
Less than 1 year |
| $ | 70.5 |
| 1.0760 |
| $ | 51.1 |
| 1.1151 |
|
Between 1 and 3 years |
| 119.8 |
| 1.0961 |
| 81.7 |
| 1.1144 |
| ||
|
|
|
|
|
|
|
|
|
| ||
SEK / $ |
|
|
|
|
|
|
|
|
| ||
Less than 1 year |
| 14.2 |
| 10.56 |
| 15.2 |
| 9.84 |
| ||
Between 1 and 2 years |
| 16.2 |
| 9.24 |
| 14.2 |
| 10.56 |
| ||
|
|
|
|
|
|
|
|
|
| ||
|
| $ | 220.7 |
|
|
| $ | 162.2 |
|
|
|
(1) Transactions in foreign currencies translated into dollars using the closing exchange rate as at December 31, 2002 and 2001.
(c) Interest rate risk management
The Company has entered into interest rate swaps to manage its interest rate exposure. The Company is committed to exchange, at specific intervals, the difference between the fixed and floating interest rate calculated by reference to the notional amounts.
The amounts of outstanding contracts at year end are included in the table below:
Maturity |
| Notional amount |
| Pay/Receive |
| Fixed Rate |
| Floating Rate |
| |
|
|
|
|
|
|
|
|
|
| |
Less than 1 year |
| $ | 550.0 |
| Company pay fixed/ |
| 1.67 – 5.30 | % | Libor 1 month/ |
|
|
|
|
| receive floating |
|
|
| Libor 3 months |
| |
|
|
|
|
|
|
|
|
|
| |
Between 1 and 4 years |
| $ | 33.0 |
| Company pay fixed/ |
| 7.20 | % | Libor 3 months/ |
|
|
|
|
| receive floating |
|
|
| plus 1.36% |
| |
(d) Commodity risk
The Company has entered into a commodity swap to manage a portion of its Canadian natural gas exposure. The Company is committed to exchange, on a monthly basis, the difference between a fixed price and a floating Canadian natural gas price index on a notional quantity of 323,000 gigajoules in total for 2003.
(e) Credit risk
The Company is exposed to credit losses resulting from defaults by counterparties when using financial instruments.
When the Company enters into derivative financial instruments, the counterparties are international and Canadian banks having a minimum credit rating of A- by Standard & Poor’s or of A3 by Moody’s and are subject to concentration limits. The Company does not foresee any failure by the counterparties in meeting their obligations.
The Company, in the normal course of business, continuously monitors the financial condition of its customers and reviews the credit history of each new customer. At December 31, 2002, no customer balance represents a significant portion of the Company’s consolidated trade receivables. The Company establishes an allowance for doubtful accounts that corresponds to the specific credit risk of its customers, historical trends and other information on the state of the economy.
34
18. Financial instruments and concentrations of credit risk (cont'd)
(e) Credit risk (cont'd)
The Company believes that the product and geographic diversity of its customer base is instrumental in reducing its credit risk, as well as the impact on the Company of fluctuations in local market or product-line demand. The Company has long-term contracts with most of its largest customers. These contracts usually include price adjustment clauses based on the cost of paper, ink and labor. The Company does not believe that it is exposed to an unusual level of customer credit risk.
19. Commitments and contingencies
(a) Leases
The Company rents premises and machinery and equipment under operating leases which expire at various dates up to 2014 and for which minimum lease payments total $407.0 million.
Annual minimum payments under these leases are as follows:
2003 |
| $ | 88.0 |
|
2004 |
| 74.7 |
| |
2005 |
| 67.1 |
| |
2006 |
| 55.4 |
| |
2007 |
| 41.5 |
| |
2008 and thereafter |
| 80.3 |
| |
Rental expenses for operating leases were $91.4 million, $83.0 million and $102.8 million for the years 2002, 2001 and 2000.
(b) Machinery and equipment
As at December 31, 2002, the Company had commitments to purchase equipment for a total value of approximately $11.9 million.
(c) Environment
The Company is subject to various laws, regulations and government policies principally in North America and Europe, relating to health and safety, to the generation, storage, transportation, disposal and environmental emissions of various substances, and to environment protection in general. The Company believes it is in compliance with such laws, regulations and government policies, in all material respects. Furthermore, the Company does not anticipate that maintaining compliance with such environmental statutes will have a material adverse effect upon the Company’s competitive or consolidated financial position.
(d) Business acquisitions
The Company signed a binding agreement to purchase, in September 2004, the remaining 50% of Helio Charleroi in Belgium, a subsidiary of European Graphic Group, SA. The transaction should amount to 24.9 million Euro ($26.0 million), adjusted by a contingent consideration based on achieving a specific performance level over the period ending September 2004.
20. Related party transactions
The Company entered into the following transactions, at prices and conditions prevailing on the market, with related parties (the parent company and its subsidiaries) and were accounted for the amount of cash consideration:
|
| 2002 |
| 2001 |
| 2000 |
| |||
|
|
|
|
|
|
|
| |||
Revenues |
| $ | 38.0 |
| $ | 32.0 |
| $ | 19.0 |
|
Purchases |
| 1.0 |
| 1.7 |
| 13.5 |
| |||
Management fees charged by Quebecor Inc. |
| 3.5 |
| 3.8 |
| 3.6 |
| |||
During the year, the Company transferred the benefit of a deduction for Part VI.I tax to a subsidiary of its parent company for a consideration of Cdn $9.9 million ($6.4 million) recorded in receivables from related parties. This reduced the Company’s available future income tax assets by Cdn $11.5 million ($7.4 million), and decreased the additional paid-in capital by Cdn $1.6 million ($1.0 million). The transaction was recorded at the carrying amount.
35
21. Pension and other postretirement benefits
The Company maintains defined benefit pension plans for its employees. The Company’s policy is to maintain its contribution at a level sufficient to cover benefits. Actuarial valuations of the Company’s various pension plans were performed during the last three years.
The Company provides postretirement benefits to eligible employees. The costs of these benefits, which are principally health care, are accounted for during the employees’ active service period.
The following table is based on a September 30th measurement date. The table provides a reconciliation of the changes in the plans’ benefit obligations and fair value of plan assets for the fiscal years ended December 31, 2002 and December 31, 2001 and a statement of the funded status as at December 31, 2002 and December 31, 2001:
|
| Pension |
| Postretirement |
| ||||||||
|
| 2002 |
| 2001 |
| 2002 |
| 2001 |
| ||||
|
|
|
|
|
|
|
|
|
| ||||
Changes in benefit obligations |
|
|
|
|
|
|
|
|
| ||||
Benefit obligation, beginning of year |
| $ | 731.5 |
| $ | 624.4 |
| $ | 77.0 |
| $ | 70.5 |
|
Change in measurement date |
| — |
| (26.4 | ) | — |
| 1.1 |
| ||||
Service cost |
| 31.5 |
| 25.0 |
| 0.9 |
| 0.8 |
| ||||
Interest cost |
| 52.3 |
| 48.5 |
| 5.3 |
| 5.4 |
| ||||
Plan participants’ contributions |
| 4.4 |
| 4.0 |
| 2.2 |
| 2.0 |
| ||||
Plan amendments |
| 6.4 |
| 5.3 |
| (0.7 | ) | (1.1 | ) | ||||
Curtailment loss (gain) |
| — |
| 0.9 |
| — |
| (2.4 | ) | ||||
Acquisitions |
| 1.6 |
| — |
| — |
| — |
| ||||
Actuarial loss |
| 33.6 |
| 77.7 |
| 16.5 |
| 8.5 |
| ||||
Change in assumptions |
| — |
| 3.9 |
| — |
| 0.2 |
| ||||
Benefits paid |
| (58.2 | ) | (40.8 | ) | (9.0 | ) | (7.8 | ) | ||||
Foreign currency changes |
| 6.4 |
| 9.0 |
| 0.1 |
| (0.2 | ) | ||||
|
|
|
|
|
|
|
|
|
| ||||
Benefit obligation, end of year |
| $ | 809.5 |
| $ | 731.5 |
| $ | 92.3 |
| $ | 77.0 |
|
|
|
|
|
|
|
|
|
|
| ||||
Changes in plan assets |
|
|
|
|
|
|
|
|
| ||||
Fair value of plan assets, beginning of year |
| $ | 481.9 |
| $ | 566.0 |
| $ | — |
| $ | — |
|
Change in measurement date |
| — |
| 47.7 |
| — |
| — |
| ||||
Actual return on plan assets |
| (52.8 | ) | (123.6 | ) | — |
| — |
| ||||
Employer contributions |
| 24.6 |
| 17.3 |
| 6.8 |
| 5.8 |
| ||||
Plan participants’ contributions |
| 4.4 |
| 4.0 |
| 2.2 |
| 2.0 |
| ||||
Benefits paid |
| (58.2 | ) | (40.8 | ) | (9.0 | ) | (7.8 | ) | ||||
Foreign currency changes |
| 4.2 |
| 11.3 |
| — |
| — |
| ||||
|
|
|
|
|
|
|
|
|
| ||||
Fair value of plan assets, end of year |
| $ | 404.1 |
| $ | 481.9 |
| $ | — |
| $ | — |
|
36
21. Pension and other postretirement benefits (cont'd)
|
| Pension |
| Postretirement |
| ||||||||
|
| 2002 |
| 2001 |
| 2002 |
| 2001 |
| ||||
|
|
|
|
|
|
|
|
|
| ||||
Reconciliation of funded status |
|
|
|
|
|
|
|
|
| ||||
Funded status |
| $ | (405.4 | ) | $ | (249.6 | ) | $ | (92.3 | ) | $ | (77.0 | ) |
Unrecognized net transition asset |
| (5.1 | ) | (5.4 | ) | — |
| — |
| ||||
Unrecognized prior service cost (benefit) |
| 13.6 |
| 7.0 |
| (0.6 | ) | (0.6 | ) | ||||
Unrecognized actuarial loss |
| 330.6 |
| 194.0 |
| 23.9 |
| 7.7 |
| ||||
Adjustment for fourth quarter contributions |
| 19.8 |
| 4.2 |
| 1.7 |
| 1.4 |
| ||||
Valuation allowance |
| — |
| (0.1 | ) | — |
| — |
| ||||
|
|
|
|
|
|
|
|
|
| ||||
Net amount recognized |
| $ | (46.5 | ) | $ | (49.9 | ) | $ | (67.3 | ) | $ | (68.5 | ) |
Included in the above benefit obligation and fair value of plan assets at year end are the following amounts in respect of plans that are not fully funded:
|
| Pension |
| Postretirement |
| ||||||||
|
| 2002 |
| 2001 |
| 2002 |
| 2001 |
| ||||
|
|
|
|
|
|
|
|
|
| ||||
Benefit obligation |
| $ | (809.5 | ) | $ | (719.1 | ) | $ | (92.3 | ) | $ | (77.0 | ) |
Fair value of plan assets |
| 404.1 |
| 467.6 |
| — |
| — |
| ||||
|
|
|
|
|
|
|
|
|
| ||||
Funded status - plan deficit |
| $ | (405.4 | ) | $ | (251.5 | ) | $ | (92.3 | ) | $ | (77.0 | ) |
The following table provides the amounts recognized in the consolidated balance sheets:
|
| Pension |
| Postretirement |
| ||||||||
|
| 2002 |
| 2001 |
| 2002 |
| 2001 |
| ||||
|
|
|
|
|
|
|
|
|
| ||||
Accrued benefit liability(1) |
| $ | (77.7 | ) | $ | (74.2 | ) | $ | (67.3 | ) | $ | (68.5 | ) |
Prepaid benefit costs(2) |
| 31.2 |
| 24.3 |
| — |
| — |
| ||||
|
|
|
|
|
|
|
|
|
| ||||
Net amount recognized |
| $ | (46.5 | ) | $ | (49.9 | ) | $ | (67.3 | ) | $ | (68.5 | ) |
(1) Current portion recorded as accrued liabilities and long-term portion recorded as other liabilities.
(2) Included in other assets.
37
21. Pension and other postretirement benefits (cont'd)
The following table provides the components of net periodic benefit cost:
|
| Pension |
| Postretirement |
| ||||||||||||||
|
| 2002 |
| 2001 |
| 2000 |
| 2002 |
| 2001 |
| 2000 |
| ||||||
|
|
|
|
|
|
|
|
|
|
|
|
|
| ||||||
Service cost |
| $ | 31.5 |
| $ | 25.0 |
| $ | 21.2 |
| $ | 0.9 |
| $ | 0.8 |
| $ | 0.7 |
|
Interest cost |
| 52.3 |
| 48.5 |
| 45.3 |
| 5.3 |
| 5.4 |
| 5.3 |
| ||||||
Expected return on plan assets |
| (50.6 | ) | (58.1 | ) | (53.8 | ) | — |
| — |
| — |
| ||||||
Amortization of transitional assets |
| (0.6 | ) | (0.6 | ) | (0.5 | ) | — |
| — |
| — |
| ||||||
Amortization of prior service cost (benefit) |
| — |
| 0.3 |
| 0.3 |
| (0.6 | ) | (0.4 | ) | — |
| ||||||
Amortization of actuarial loss (gain) |
| 2.5 |
| (0.9 | ) | (1.8 | ) | 0.2 |
| — |
| — |
| ||||||
Curtailment loss (gain) |
| — |
| 0.9 |
| — |
| — |
| (0.4 | ) | (0.5 | ) | ||||||
Valuation allowance |
| (0.1 | ) | (0.9 | ) | (3.0 | ) | — |
| — |
| — |
| ||||||
|
|
|
|
|
|
|
|
|
|
|
|
|
| ||||||
Net periodic cost |
| $ | 35.0 |
| $ | 14.2 |
| $ | 7.7 |
| $ | 5.8 |
| $ | 5.4 |
| $ | 5.5 |
|
The weighted average assumptions used in the measurement of the Company’s benefit obligation are as follows:
|
| Pension |
| Postretirement |
| ||||||||
|
| 2002 |
| 2001 |
| 2000 |
| 2002 |
| 2001 |
| 2000 |
|
|
|
|
|
|
|
|
|
|
|
|
|
|
|
Discount rate |
| 6.7 | % | 7.0 | % | 7.7 | % | 6.8 | % | 7.2 | % | 7.7 | % |
Expected return on plan assets |
| 8.2 | % | 9.7 | % | 9.7 | % | — |
| — |
| — |
|
Rate of compensation increase |
| 3.4 | % | 3.4 | % | 3.7 | % | — |
| — |
| — |
|
The assumed health care cost trend rate used in measuring the accumulated postretirement benefit obligation was 8.7% at the end of 2002 (8.8% at the end of 2001) and is expected to decrease gradually to 6.0% in 2008 and remain at that level thereafter. A one percentage point change in assumed health care cost trend would have the following effects:
|
| Postretirement benefits |
| ||||
Sensitivity analysis |
| 1% increase |
| 1% decrease |
| ||
|
|
|
|
|
| ||
Effect on service and interest costs |
| $ | 0.5 |
| $ | (0.4 | ) |
Effect on benefit obligation |
| 6.5 |
| (5.7 | ) | ||
38
22. Significant differences between generally accepted accounting principles in Canada and the United States
The Company’s consolidated financial statements have been prepared in accordance with Canadian generally accepted accounting principles (“GAAP”), which differ in some respects from those applicable in the United States. The following are the significant differences in accounting principles as they pertain to the consolidated statements.
(a) Reconciliation of net income and earnings per share
The application of GAAP in the United States would have the following effects on net income as reported:
|
| 2002 |
| 2001 |
| 2000 |
| |||
|
|
|
|
|
|
|
| |||
Net income, as reported in the consolidated statements of income per GAAP in Canada |
| $ | 279.3 |
| $ | 22.4 |
| $ | 295.4 |
|
|
|
|
|
|
|
|
| |||
Adjustments before income taxes: |
|
|
|
|
|
|
| |||
Employee stock purchase plan in the United States (a) (i) |
| 1.6 |
| 1.0 |
| — |
| |||
Stock option plans (a) (i) |
| 0.5 |
| (0.9 | ) | — |
| |||
Convertible senior subordinated notes (a) (ii) |
| 2.3 |
| — |
| (1.3 | ) | |||
|
| 4.4 |
| 0.1 |
| (1.3 | ) | |||
|
|
|
|
|
|
|
| |||
Income taxes |
| (0.6 | ) | (0.4 | ) | 0.5 |
| |||
|
|
|
|
|
|
|
| |||
Net adjustments |
| 3.8 |
| (0.3 | ) | (0.8 | ) | |||
|
|
|
|
|
|
|
| |||
Net income, as adjusted per GAAP in the United States |
| $ | 283.1 |
| $ | 22.1 |
| $ | 294.6 |
|
|
|
|
|
|
|
|
| |||
Net income available to holders of preferred shares |
| (28.9 | ) | (21.9 | ) | (10.1 | ) | |||
|
|
|
|
|
|
|
| |||
Net income per GAAP in the United States available to holders of equity shares |
| 254.2 |
| 0.2 |
| 284.5 |
| |||
|
|
|
|
|
|
|
| |||
Income impact on assumed conversion of convertible notes, net of applicable income taxes |
| 3.8 |
| — |
| 4.5 |
| |||
|
|
|
|
|
|
|
| |||
Net income per GAAP in the United States adjusted for dilution effect |
| $ | 258.0 |
| $ | 0.2 |
| $ | 289.0 |
|
|
|
|
|
|
|
|
| |||
Average number of equity shares outstanding (in millions): |
|
|
|
|
|
|
| |||
Basic |
| 140.7 |
| 142.2 |
| 147.0 |
| |||
Diluted |
| 145.4 |
| 143.0 |
| 151.7 |
| |||
|
|
|
|
|
|
|
| |||
Earnings per share as adjusted per GAAP in the United States: |
|
|
|
|
|
|
| |||
Basic |
| $ | 1.81 |
| $ | — |
| $ | 1.93 |
|
Diluted |
| $ | 1.77 |
| $ | — |
| $ | 1.90 |
|
39
22. Significant differences between generally accepted accounting principles in Canada and the United States (cont'd)
(a) Reconciliation of net income and earnings per share (cont'd)
(i) Stock-based compensation
Under GAAP in the United States, in accordance with the provisions of Statement of Financial Accounting Standards (“SFAS”) No. 123, “Accounting for stock-based compensation”, the Company applies Accounting Principles Board Opinion No. 25, "Accounting for stock issued to employees” (APB 25) and related interpretations in accounting for its employee share plans and stock option plans.
Employee stock purchase plan in the United States:
Under the provisions of APB 25, the Employee Share Plans are accounted for as non-compensatory. Under GAAP in Canada, the Company’s contribution is accounted for as compensation expenses.
Stock option plans:
The Company awarded in 1999 a special performance grant to certain executives. Under the provisions of APB 25, those grants are accounted for as a variable plan. There are no similar requirements under GAAP in Canada. In 2002, some of the options awarded were cancelled.
(ii) Convertible senior subordinated notes
Under GAAP in Canada, the equity component of the convertible notes is recorded under shareholders’ equity as additional paid-in capital. The difference between the carrying amount of the debt component and its face value is amortized as imputed interest to income over the life of the convertible senior subordinated note. Regarding the repurchase of convertible notes, the Company is required to allocate the consideration paid on extinguishment to the liability and equity components of the convertible notes based on their fair values at the date of the transaction. The amount of gain (loss) relating to the liability element is recorded to income and the difference between the carrying amount and the amount considered to be settled relating to the conversion option element is treated as an equity transaction. Under GAAP in the United States, the allocation to equity is not required, no imputed interest is needed in relation to the equity component and the gain (loss) on repurchase is recorded through income in the period of extinguishment.
(iii) Presentation of goodwill amortization
Under GAAP in Canada, prior to fiscal 2002, goodwill amortization was presented, net of related income taxes, and was excluded from the calculation of operating income. Under GAAP in the United States, goodwill amortization was included in the computation of operating income and was presented as an operating expense. For the current year, the Company adopted the new CICA accounting standard related to goodwill and other intangible assets (see note 2 (a)). Under the new accounting standard, goodwill is not amortized. This new CICA accounting standard harmonizes with SFAS No. 142 “Goodwill and Other Intangible Assets”(“SFAS 142”) effective January 1, 2002.
40
22. Significant differences between generally accepted accounting principles in Canada and the United States (cont'd)
(b) Effect on consolidated balance sheets
The application of GAAP in the United States would have the following effects on the consolidated balance sheets, as reported:
|
| 2002 |
| 2001 |
| ||||||||
|
| Canada |
| United States |
| Canada |
| United States |
| ||||
|
|
|
|
|
|
|
|
|
| ||||
Assets |
|
|
|
|
|
|
|
|
| ||||
Future income taxes (b) (i) |
| $ | 27.8 |
| $ | 31.0 |
| $ | 58.0 |
| $ | 68.6 |
|
Prepaid expenses (b) (i) |
| 25.2 |
| 25.7 |
| 24.1 |
| 27.1 |
| ||||
Other assets (b) (ii) |
| 113.3 |
| 133.6 |
| 132.0 |
| 134.0 |
| ||||
|
|
|
|
|
|
|
|
|
| ||||
Liabilities and Sharesholders’ Equity |
|
|
|
|
|
|
|
|
| ||||
Accrued liabilities (b) (i) |
| 485.8 |
| 506.5 |
| 561.2 |
| 592.1 |
| ||||
Other liabilities (b) (ii) |
| 228.9 |
| 510.5 |
| 245.6 |
| 319.2 |
| ||||
Future income taxes (a) (i) (ii) (b) (i) (ii) |
| 291.7 |
| 207.7 |
| 234.0 |
| 207.4 |
| ||||
Convertible Notes (a) (ii) |
| 115.0 |
| 128.5 |
| 113.3 |
| 129.1 |
| ||||
Additional paid-in capital (a) (i) (ii) |
| 103.6 |
| 86.2 |
| 104.6 |
| 89.3 |
| ||||
Translation adjustment (c) |
| (115.6 | ) | — |
| (146.5 | ) | — |
| ||||
Accumulated other comprehensive income (loss) (b) (i) (ii) (c) |
| — |
| (309.5 | ) | — |
| (209.0 | ) | ||||
(i) Accounting for derivative instruments and hedging activities
Effective since January 1, 2001, the Company adopted Statement of Financial Accounting Standards No.133, “Accounting for Derivative Instruments and Hedging Activities”, as amended (SFAS 133). SFAS 133 establishes accounting and reporting standards for derivative instruments and hedging activities and requires that all derivatives be recorded as either assets or liabilities in the balance sheet at fair value. The Company recorded the cumulative effect of change in other comprehensive income (loss) upon the adoption of SFAS 133 in 2001.
The Company utilizes forward exchange currency contracts, interest rate and commodity SWAP to enhance its ability to manage risk relating to cash flow exposure, and forward exchange currency contracts and cross currency swaps to manage exchange risk related to its net investment exposure. The Company does not enter into contracts for speculative purposes. On the earlier of the date into which the derivative contract is entered or the date of transaction, the Company designates the derivative as a hedge. Changes in the derivative fair values of contracts that are designated effective and qualify as cash flow hedges or hedging of net investments are deferred and recorded as a component of accumulated other comprehensive income (loss) until the underlying transaction is recorded in earnings. When the hedged item affects earnings, gains or losses are reclassified from accumulated other comprehensive income (loss) to the consolidated statement of income on the same line as the underlying transaction. The ineffective portion of a hedging derivative’s change in fair value is recognized immediately in earnings.
Under GAAP in Canada, derivative financial instruments are accounted for on an accrual basis. Realized and unrealized gains and losses are deferred and recognized in income in the same period and in the same financial statement category as the income or expense arising from the corresponding hedged positions.
41
22. Significant differences between generally accepted accounting principles in Canada and the United States (cont'd)
(b) Effect on consolidated balance sheets (cont'd)
(ii) Pension and postretirement plans
GAAP in the United States requires recognition of an additional minimum liability when the accumulated benefit obligation exceeds the fair value of plan assets. If an additional minimum liability is recognized, a portion is recognized as an intangible asset up to the amount of unrecognized prior service cost (including unrecognized net transition obligations) and the excess is recognized in a separate component in the other comprehensive income, net of tax benefits. Under GAAP in Canada, such adjustment is not required.
(c) Comprehensive income (loss)
Moreover, the application of GAAP in the United States requires the disclosure of comprehensive income (loss) in a separate financial statement, which includes the net income as well as revenues, charges, gains and losses recorded directly to equity.
|
| 2002 |
| 2001 |
| 2000 |
| |||
|
|
|
|
|
|
|
| |||
Net income, as adjusted per GAAP in the United States |
| $ | 283.1 |
| $ | 22.1 |
| $ | 294.6 |
|
|
|
|
|
|
|
|
| |||
Cumulative effect of changes in accounting principles, net of income taxes ($3.3 in 2001) b) (i) |
| — |
| (6.3 | ) | — |
| |||
(Loss) gain on hedging of net investments, net of income taxes of $3.5 (($1.1) in 2001) b) (i) |
| (34.8 | ) | 2.0 |
| — |
| |||
Gain (loss) on cash flow hedge, net of income taxes of ($6.7) ($7.4 in 2001) b) (i) |
| 12.6 |
| (14.0 | ) | — |
| |||
Additional minimum liability, net of income taxes of $53.8 ($27.4 in 2001) b) (ii) |
| (109.2 | ) | (44.2 | ) | — |
| |||
Currency translation adjustment |
| 30.9 |
| (14.3 | ) | (37.1 | ) | |||
Other comprehensive income (loss) |
| (100.5 | ) | (76.8 | ) | (37.1 | ) | |||
|
|
|
|
|
|
|
| |||
Comprehensive income (loss) as per GAAP in the United States |
| $ | 182.6 |
| $ | (54.7 | ) | $ | 257.5 |
|
23. Segment disclosures
The Company operates in the printing industry. Its business groups are located in three main segments: North America, Europe and Latin America. These segments are managed separately, since they all require specific market strategies. The Company assesses the performance of each segment based on operating income before restructuring and other charges.
42
23. Segment disclosures (cont'd)
Accounting policies relating to each segment are identical to those used for the purposes of the consolidated financial statements. Intersegment sales are made at fair market values, which approximate those prevailing on the markets serviced. Management of financial expenses and income tax expense is centralized and, consequently, these expenses are not allocated among these segments.
|
| North America |
| Europe |
| Latin |
| Other |
| Inter - |
| Total |
| ||||||
|
|
|
|
|
|
|
|
|
|
|
|
|
| ||||||
Revenues |
|
|
|
|
|
|
|
|
|
|
|
|
| ||||||
2002 |
| $ | 5,078.6 |
| $ | 982.3 |
| $ | 183.0 |
| $ | — |
| $ | (1.9 | ) | $ | 6,242.0 |
|
2001 |
| 5,268.1 |
| 891.3 |
| 161.4 |
| — |
| (0.7 | ) | 6,320.1 |
| ||||||
2000 |
| 5,518.9 |
| 890.4 |
| 112.0 |
| — |
| (0.2 | ) | 6,521.1 |
| ||||||
|
|
|
|
|
|
|
|
|
|
|
|
|
| ||||||
Depreciation and amortization |
|
|
|
|
|
|
|
|
|
|
|
|
| ||||||
2002 |
| 269.7 |
| 57.4 |
| 7.5 |
| 1.0 |
| — |
| 335.6 |
| ||||||
2001 |
| 277.9 |
| 50.7 |
| 8.2 |
| 1.0 |
| — |
| 337.8 |
| ||||||
2000 |
| 289.0 |
| 48.8 |
| 5.6 |
| 1.7 |
| — |
| 345.1 |
| ||||||
|
|
|
|
|
|
|
|
|
|
|
|
|
| ||||||
Restructuring and other charges |
|
|
|
|
|
|
|
|
|
|
|
|
| ||||||
2002 |
| (9.0 | ) | 22.1 |
| 1.0 |
| 5.5 |
| — |
| 19.6 |
| ||||||
2001 |
| 194.4 |
| 22.6 |
| 14.6 |
| 38.4 |
| — |
| 270.0 |
| ||||||
2000 |
| (15.9 | ) | 10.8 |
| — |
| 2.4 |
| — |
| (2.7 | ) | ||||||
|
|
|
|
|
|
|
|
|
|
|
|
|
| ||||||
Operating income |
|
|
|
|
|
|
|
|
|
|
|
|
| ||||||
2002 |
| 536.3 |
| 17.4 |
| 13.2 |
| (23.7 | ) | — |
| 543.2 |
| ||||||
2001 |
| 370.1 |
| 31.3 |
| (4.2 | ) | (49.4 | ) | — |
| 347.8 |
| ||||||
2000 |
| 644.3 |
| 50.2 |
| 6.5 |
| 26.5 |
| — |
| 727.5 |
| ||||||
|
|
|
|
|
|
|
|
|
|
|
|
|
| ||||||
Goodwill amortization, net of income taxes |
|
|
|
|
|
|
|
|
|
|
|
|
| ||||||
2002 |
| — |
| — |
| — |
| — |
| — |
| — |
| ||||||
2001 |
| 55.5 |
| 5.4 |
| 0.5 |
| — |
| — |
| 61.4 |
| ||||||
2000 |
| 51.0 |
| 9.1 |
| 0.4 |
| — |
| — |
| 60.5 |
| ||||||
|
|
|
|
|
|
|
|
|
|
|
|
|
| ||||||
Additions to property, plant and equipment |
|
|
|
|
|
|
|
|
|
|
|
|
| ||||||
2002 |
| 139.9 |
| 29.5 |
| 14.1 |
| 1.0 |
| — |
| 184.5 |
| ||||||
2001 |
| 180.6 |
| 43.3 |
| 40.8 |
| 13.6 |
| — |
| 278.3 |
| ||||||
2000 |
| 198.7 |
| 27.5 |
| 12.0 |
| 4.0 |
| — |
| 242.2 |
| ||||||
|
|
|
|
|
|
|
|
|
|
|
|
|
| ||||||
Property, plant and equipment |
|
|
|
|
|
|
|
|
|
|
|
|
| ||||||
2002 |
| 2,024.1 |
| 489.8 |
| 94.4 |
| 2.3 |
| — |
| 2,610.6 |
| ||||||
2001 |
| 2,138.7 |
| 389.1 |
| 110.5 |
| (4.3 | ) | — |
| 2,634.0 |
| ||||||
|
|
|
|
|
|
|
|
|
|
|
|
|
| ||||||
Goodwill |
|
|
|
|
|
|
|
|
|
|
|
|
| ||||||
2002 |
| 2,182.3 |
| 324.8 |
| 7.2 |
| — |
| — |
| 2,514.3 |
| ||||||
2001 |
| 2,181.5 |
| 270.8 |
| 18.4 |
| — |
| — |
| 2,470.7 |
| ||||||
|
|
|
|
|
|
|
|
|
|
|
|
|
| ||||||
Total assets |
|
|
|
|
|
|
|
|
|
|
|
|
| ||||||
2002 |
| 4,974.5 |
| 1,003.3 |
| 215.4 |
| 12.3 |
| — |
| 6,205.5 |
| ||||||
2001 |
| 5,032.1 |
| 803.9 |
| 246.9 |
| 103.6 |
| — |
| 6,186.5 |
| ||||||
(1) Includes Revenues amounting to $857.0 million ($887.5 million in 2001 and $876.7 million in 2000), Property, plant and equipment amounting to $253.5 million ($266.0 million in 2001) and Goodwill amounting to $33.0 million ($32.2 million in 2001) for Canada.
43
23. Segment disclosures (cont'd)
The Company’s operations are managed by eight distinct business groups. Each business group is accountable primarily for one product, group of products or geographic region.
Revenues per business groups are as follows:
|
| 2002 |
| 2001 |
| 2000 |
| |||||||||
|
|
|
|
|
|
|
|
|
|
|
|
|
| |||
Magazine & Catalog |
| $ | 1,671.5 |
| 26.8 | % | $ | 1,785.4 |
| 28.3 | % | $ | 2,023.4 |
| 31.0 | % |
|
|
|
|
|
|
|
|
|
|
|
|
|
| |||
Retail |
| 1,172.5 |
| 18.8 |
| 1,074.1 |
| 17.0 |
| 910.0 |
| 13.9 |
| |||
|
|
|
|
|
|
|
|
|
|
|
|
|
| |||
Commercial & Direct |
| 687.2 |
| 11.0 |
| 829.3 |
| 13.1 |
| 961.0 |
| 14.7 |
| |||
|
|
|
|
|
|
|
|
|
|
|
|
|
| |||
Book |
| 512.5 |
| 8.3 |
| 532.1 |
| 8.4 |
| 619.2 |
| 9.5 |
| |||
|
|
|
|
|
|
|
|
|
|
|
|
|
| |||
Directory |
| 473.8 |
| 7.4 |
| 500.9 |
| 7.9 |
| 466.5 |
| 7.2 |
| |||
|
|
|
|
|
|
|
|
|
|
|
|
|
| |||
Other revenues |
| 559.2 |
| 9.0 |
| 545.6 |
| 8.6 |
| 538.6 |
| 8.3 |
| |||
|
|
|
|
|
|
|
|
|
|
|
|
|
| |||
Europe |
| 982.3 |
| 15.8 |
| 891.3 |
| 14.1 |
| 890.4 |
| 13.7 |
| |||
|
|
|
|
|
|
|
|
|
|
|
|
|
| |||
Latin America |
| 183.0 |
| 2.9 |
| 161.4 |
| 2.6 |
| 112.0 |
| 1.7 |
| |||
|
|
|
|
|
|
|
|
|
|
|
|
|
| |||
|
| $ | 6,242.0 |
| 100.0 | % | $ | 6,320.1 |
| 100.0 | % | $ | 6,521.1 |
| 100.0 | % |
44
(In millions of US dollars, except per share date & other statistics)
|
| 2002 |
| 2001 |
| 2000 |
| 1999 |
| 1998 |
| |||||
|
|
|
|
|
|
|
|
|
|
|
| |||||
Consolidated Results |
|
|
|
|
|
|
|
|
|
|
| |||||
Revenues |
| $ | 6,242.0 |
| $ | 6,320.1 |
| $ | 6,521.1 |
| $ | 4,952.5 |
| $ | 3,808.2 |
|
Operating income before depreciation and amortization* |
| 898.4 |
| 955.6 |
| 1,069.9 |
| 758.5 |
| 540.9 |
| |||||
Operating income before restructuring and other charges |
| 562.8 |
| 617.8 |
| 724.8 |
| 472.5 |
| 317.1 |
| |||||
Restructuring and other charges |
| 19.6 |
| 270.0 |
| (2.7 | ) | 180.0 |
| — |
| |||||
Operating income |
| 543.2 |
| 347.8 |
| 727.5 |
| 292.5 |
| 317.1 |
| |||||
Net income** |
| 279.3 |
| 22.4 |
| 295.4 |
| 77.5 |
| 159.7 |
| |||||
Cash provided from operating activities |
| 513.4 |
| 576.5 |
| 917.8 |
| 710.1 |
| 413.9 |
| |||||
Free cash flow from operations*** |
| 319.8 |
| 287.2 |
| 747.3 |
| 552.6 |
| 124.8 |
| |||||
Operating margin before depreciation and amortization* |
| 14.4 | % | 15.1 | % | 16.4 | % | 15.3 | % | 14.2 | % | |||||
Operating margin before restructuring and other charges |
| 9.0 | % | 9.8 | % | 11.1 | % | 9.5 | % | 8.3 | % | |||||
Operating margin |
| 8.7 | % | 5.5 | % | 11.2 | % | 5.9 | % | 8.3 | % | |||||
|
|
|
|
|
|
|
|
|
|
|
| |||||
Financial Position |
|
|
|
|
|
|
|
|
|
|
| |||||
Working capital |
| $ | (209.3 | ) | $ | (194.5 | ) | $ | (66.5 | ) | $ | 72.5 |
| $ | 248.3 |
|
Property, plant and equipment |
| 2,610.6 |
| 2,634.0 |
| 2,683.0 |
| 2,895.3 |
| 2,222.0 |
| |||||
Total assets |
| 6,205.5 |
| 6,186.5 |
| 6,520.8 |
| 6,904.3 |
| 3,906.5 |
| |||||
Long-term debt (including convertible notes) |
| 1,822.1 |
| 2,132.2 |
| 2,208.7 |
| 2,839.9 |
| 1,250.2 |
| |||||
First Preferred Shares |
| 456.6 |
| 456.6 |
| 212.5 |
| 212.5 |
| 212.5 |
| |||||
Equity Multiple and Subordinate Voting Shares |
| 1,357.3 |
| 1,336.7 |
| 1,418.7 |
| 1,441.3 |
| 685.6 |
| |||||
Debt-to-capitalization |
| 40:60 |
| 46:54 |
| 47:53 |
| 55:45 |
| 44:56 |
| |||||
|
|
|
|
|
|
|
|
|
|
|
| |||||
Per Share Data |
|
|
|
|
|
|
|
|
|
|
| |||||
Earnings** |
|
|
|
|
|
|
|
|
|
|
| |||||
Diluted |
| $ | 1.76 |
| $ | — |
| $ | 1.91 |
| $ | 0.54 |
| $ | 1.29 |
|
Diluted before restructuring and other special charges |
| $ | 1.92 |
| $ | 1.58 |
| $ | 1.90 |
| $ | 1.55 |
| $ | 1.29 |
|
Dividends on equity shares |
| $ | 0.49 |
| $ | 0.46 |
| $ | 0.33 |
| $ | 0.28 |
| $ | 0.24 |
|
Book value |
| $ | 15.92 |
| $ | 14.39 |
| $ | 15.47 |
| $ | 14.26 |
| $ | 11.67 |
|
Market price - TSX close in CDN$ |
| $ | 35.00 |
| $ | 35.88 |
| $ | 37.60 |
| $ | 32.25 |
| $ | 33.18 |
|
Market price - NYSE close |
| $ | 22.32 |
| $ | 22.56 |
| $ | 25.19 |
| $ | 21.94 |
| $ | 21.15 |
|
|
|
|
|
|
|
|
|
|
|
|
| |||||
Other statistics |
|
|
|
|
|
|
|
|
|
|
| |||||
Capital expenditures |
| $ | 184.5 |
| $ | 278.3 |
| $ | 242.2 |
| $ | 194.7 |
| $ | 312.1 |
|
Return on capital employed |
| 17.3 | % | 17.9 | % | 19.5 | % | 19.0 | % | 18.5 | % | |||||
* Before restructuring and other charges.
** Effective January 1, 2002, net income and earnings per share reflect the new accounting policy adopted by the Company under which goodwill is no longer amortized.
*** Cash provided from operating activities, less capital expenditures net of proceeds from disposals, and preferred share dividends.
45
SELECTED QUARTERLY FINANCIAL DATA
(In millions of US dollars, except per share amounts)
|
| 2002 |
| 2001 |
| |||||||||||||||||
|
| First |
| Second |
| Third |
| Fourth |
| Year |
| First |
| Second |
| |||||||
|
|
|
|
|
|
|
|
|
|
|
|
|
|
|
| |||||||
Consolidated Results |
|
|
|
|
|
|
|
|
|
|
|
|
|
|
| |||||||
Revenues |
| $ | 1,459.2 |
| $ | 1,471.5 |
| $ | 1,617.9 |
| $ | 1,693.4 |
| $ | 6,242.0 |
| $ | 1,576.7 |
| $ | 1,502.3 |
|
Operating income before depreciation and amortization* |
| 189.7 |
| 211.2 |
| 251.3 |
| 246.2 |
| 898.4 |
| 219.2 |
| 243.0 |
| |||||||
Operating income before restructuring and other special charges |
| 106.8 |
| 127.8 |
| 167.9 |
| 160.3 |
| 562.8 |
| 136.4 |
| 159.0 |
| |||||||
Restructuring and other charges |
| — |
| — |
| — |
| 19.6 |
| 19.6 |
| — |
| — |
| |||||||
Operating income |
| 106.8 |
| 127.8 |
| 167.9 |
| 140.7 |
| 543.2 |
| 136.4 |
| 159.0 |
| |||||||
Net income** |
| 46.0 |
| 64.2 |
| 98.5 |
| 70.6 |
| 279.3 |
| 42.5 |
| 63.2 |
| |||||||
Cash provided from operating activities |
| (27.0 | ) | 109.4 |
| 130.2 |
| 300.8 |
| 513.4 |
| (153.5 | ) | 277.2 |
| |||||||
Free cash flow from operations*** |
| (80.1 | ) | 40.1 |
| 97.4 |
| 262.4 |
| 319.8 |
| (218.6 | ) | 178.9 |
| |||||||
Operating margin before depreciation and amortization* |
| 13.0 | % | 14.4 | % | 15.5 | % | 14.5 | % | 14.4 | % | 13.9 | % | 16.2 | % | |||||||
Operating margin before restructuring and other charges |
| 7.3 | % | 8.7 | % | 10.4 | % | 9.5 | % | 9.0 | % | 8.7 | % | 10.6 | % | |||||||
Operating margin |
| 7.3 | % | 8.7 | % | 10.4 | % | 8.3 | % | 8.7 | % | 8.7 | % | 10.6 | % | |||||||
|
|
|
|
|
|
|
|
|
|
|
|
|
|
|
| |||||||
Segmented Information |
|
|
|
|
|
|
|
|
|
|
|
|
|
|
| |||||||
Revenues |
|
|
|
|
|
|
|
|
|
|
|
|
|
|
| |||||||
North America |
| $ | 1,201.0 |
| $ | 1,189.6 |
| $ | 1,324.2 |
| $ | 1,363.8 |
| $ | 5,078.6 |
| $ | 1,315.6 |
| $ | 1,252.5 |
|
Europe |
| 211.8 |
| 239.0 |
| 248.5 |
| 283.0 |
| 982.3 |
| 227.1 |
| 213.3 |
| |||||||
Latin America |
| 46.7 |
| 43.3 |
| 45.2 |
| 47.8 |
| 183.0 |
| 34.2 |
| 36.6 |
| |||||||
|
|
|
|
|
|
|
|
|
|
|
|
|
|
|
| |||||||
Operating income* |
|
|
|
|
|
|
|
|
|
|
|
|
|
|
| |||||||
North America |
| 107.5 |
| 123.8 |
| 157.8 |
| 138.2 |
| 527.3 |
| 125.0 |
| 139.0 |
| |||||||
Europe |
| 5.3 |
| 8.4 |
| 13.3 |
| 12.5 |
| 39.5 |
| 12.8 |
| 16.3 |
| |||||||
Latin America |
| 2.3 |
| 2.7 |
| 5.2 |
| 4.0 |
| 14.2 |
| 1.9 |
| 2.4 |
| |||||||
|
|
|
|
|
|
|
|
|
|
|
|
|
|
|
| |||||||
Operating margins* |
|
|
|
|
|
|
|
|
|
|
|
|
|
|
| |||||||
North America |
| 9.0 | % | 10.4 | % | 11.9 | % | 10.1 | % | 10.4 | % | 9.5 | % | 11.1 | % | |||||||
Europe |
| 2.5 | % | 3.5 | % | 5.3 | % | 4.4 | % | 4.0 | % | 5.6 | % | 7.6 | % | |||||||
Latin America |
| 4.9 | % | 6.1 | % | 11.6 | % | 8.5 | % | 7.8 | % | 5.6 | % | 6.6 | % | |||||||
|
|
|
|
|
|
|
|
|
|
|
|
|
|
|
| |||||||
Per Share Data |
|
|
|
|
|
|
|
|
|
|
|
|
|
|
| |||||||
Earnings (losses)** |
|
|
|
|
|
|
|
|
|
|
|
|
|
|
| |||||||
Diluted |
| $ | 0.28 |
| $ | 0.40 |
| $ | 0.64 |
| $ | 0.44 |
| $ | 1.76 |
| $ | 0.27 |
| $ | 0.41 |
|
Diluted before restructuring and other special charges |
| $ | 0.28 |
| $ | 0.40 |
| $ | 0.64 |
| $ | 0.61 |
| $ | 1.92 |
| $ | 0.27 |
| $ | 0.41 |
|
Dividends on equity shares |
| $ | 0.12 |
| $ | 0.12 |
| $ | 0.12 |
| $ | 0.13 |
| $ | 0.49 |
| $ | 0.10 |
| $ | 0.12 |
|
* Before restructuring and other charges.
** Effective January 1, 2002, net income and earnings per share reflect the new accounting policy adopted by the Company under which goodwill is no longer amortized.
*** Cash provided from operating activities, less capital expenditures net of proceeds from disposals, and preferred share dividends.
46
|
| 2001 |
| 2000 |
| |||||||||||||||||||||
|
| Third |
| Fourth |
| Year |
| First |
| Second |
| Third |
| Fourth |
| Year |
| |||||||||
|
|
|
|
|
|
|
|
|
|
|
|
|
|
|
|
|
| |||||||||
Consolidated Results |
|
|
|
|
|
|
|
|
|
|
|
|
|
|
|
|
| |||||||||
Revenues |
| $ | 1,625.2 |
| $ | 1,615.9 |
| $ | 6,320.1 |
| $ | 1,630.4 |
| $ | 1,549.1 |
| $ | 1,633.8 |
| $ | 1,707.8 |
| $ | 6,521.1 |
| |
Operating income before depreciation and amortization* |
| 258.5 |
| 234.9 |
| 955.6 |
| 231.7 |
| 255.9 |
| 286.7 |
| 295.6 |
| 1,069.9 |
| |||||||||
Operating income before restructuring and other special charges |
| 172.7 |
| 149.7 |
| 617.8 |
| 138.2 |
| 167.7 |
| 202.4 |
| 216.5 |
| 724.8 |
| |||||||||
Restructuring and other charges |
| — |
| 270.0 |
| 270.0 |
| — |
| — |
| — |
| (2.7 | ) | (2.7 | ) | |||||||||
Operating income |
| 172.7 |
| (120.3 | ) | 347.8 |
| 138.2 |
| 167.7 |
| 202.4 |
| 219.2 |
| 727.5 |
| |||||||||
Net income** |
| 70.8 |
| (154.1 | ) | 22.4 |
| 37.6 |
| 62.8 |
| 88.7 |
| 106.3 |
| 295.4 |
| |||||||||
Cash provided from operating activities |
| 12.1 |
| 440.7 |
| 576.5 |
| 72.6 |
| 216.9 |
| 17.5 |
| 610.8 |
| 917.8 |
| |||||||||
Free cash flow from operations*** |
| (58.2 | ) | 385.1 |
| 287.2 |
| 42.9 |
| 163.0 |
| 0.1 |
| 541.3 |
| 747.3 |
| |||||||||
Operating margin before depreciation and amortization* |
| 15.9 | % | 14.5 | % | 15.1 | % | 14.2 | % | 16.5 | % | 17.5 | % | 17.3 | % | 16.4 | % | |||||||||
Operating margin before restructuring and other charges |
| 10.6 | % | 9.3 | % | 9.8 | % | 8.5 | % | 10.8 | % | 12.4 | % | 12.7 | % | 11.1 | % | |||||||||
Operating margin |
| 10.6 | % | (7.4% | ) | 5.5 | % | 8.5 | % | 10.8 | % | 12.4 | % | 12.8 | % | 11.2 | % | |||||||||
|
|
|
|
|
|
|
|
|
|
|
|
|
|
|
|
|
| |||||||||
Segmented Information |
|
|
|
|
|
|
|
|
|
|
|
|
|
|
|
|
| |||||||||
Revenues |
|
|
|
|
|
|
|
|
|
|
|
|
|
|
|
|
| |||||||||
North America |
| $ | 1,373.4 |
| $ | 1,326.6 |
| $ | 5,268.1 |
| $ | 1,377.7 |
| $ | 1,304.8 |
| $ | 1,398.4 |
| $ | 1,438.0 |
| $ | 5,518.9 |
| |
Europe |
| 211.5 |
| 239.4 |
| 891.3 |
| 227.3 |
| 217.9 |
| 208.9 |
| 236.3 |
| 890.4 |
| |||||||||
Latin America |
| 40.5 |
| 50.1 |
| 161.4 |
| 25.5 |
| 26.2 |
| 26.7 |
| 33.6 |
| 112.0 |
| |||||||||
|
|
|
|
|
|
|
|
|
|
|
|
|
|
|
|
|
| |||||||||
Operating income* |
|
|
|
|
|
|
|
|
|
|
|
|
|
|
|
|
| |||||||||
North America |
| 163.0 |
| 137.5 |
| 564.5 |
| 119.7 |
| 145.5 |
| 176.0 |
| 187.2 |
| 628.4 |
| |||||||||
Europe |
| 9.7 |
| 15.1 |
| 53.9 |
| 13.4 |
| 14.9 |
| 13.9 |
| 18.9 |
| 61.1 |
| |||||||||
Latin America |
| 1.2 |
| 4.9 |
| 10.4 |
| 1.7 |
| 1.2 |
| 0.7 |
| 2.9 |
| 6.5 |
| |||||||||
|
|
|
|
|
|
|
|
|
|
|
|
|
|
|
|
|
| |||||||||
Operating margins* |
|
|
|
|
|
|
|
|
|
|
|
|
|
|
|
|
| |||||||||
North America |
| 11.9 | % | 10.4 | % | 10.7 | % | 8.7 | % | 11.2 | % | 12.6 | % | 13.0 | % | 11.4 | % | |||||||||
Europe |
| 4.6 | % | 6.3 | % | 6.1 | % | 5.9 | % | 6.8 | % | 6.7 | % | 8.0 | % | 6.9 | % | |||||||||
Latin America |
| 2.9 | % | 9.9 | % | 6.5 | % | 6.7 | % | 4.7 | % | 2.5 | % | 8.6 | % | 5.8 | % | |||||||||
|
|
|
|
|
|
|
|
|
|
|
|
|
|
|
|
|
| |||||||||
Per Share Data |
|
|
|
|
|
|
|
|
|
|
|
|
|
|
|
|
| |||||||||
Earnings (losses)** |
|
|
|
|
|
|
|
|
|
|
|
|
|
|
|
|
| |||||||||
Diluted |
| $ | 0.46 |
| $ | (1.16 | ) | $ | — |
| $ | 0.24 |
| $ | 0.40 |
| $ | 0.58 |
| $ | 0.70 |
| $ | 1.91 |
| |
Diluted before restructuring and other special charges |
| $ | 0.46 |
| $ | 0.45 |
| $ | 1.58 |
| $ | 0.24 |
| $ | 0.40 |
| $ | 0.58 |
| $ | 0.69 |
| $ | 1.90 |
| |
Dividends on equity shares |
| $ | 0.12 |
| $ | 0.12 |
| $ | 0.46 |
| $ | 0.07 |
| $ | 0.08 |
| $ | 0.08 |
| $ | 0.10 |
| $ | 0.33 |
| |
47
Stock Listing
Quebecor World Inc. Subordinate Voting Shares are listed on the New York Stock Exchange and on the Toronto Stock Exchange under the symbol IQW.
Annual Meeting
The Annual Meeting of Shareholders will be held at: 10:00 am on April 2nd, 2003 at:
Le Windsor,
1170 Peel Street,
Montreal, Quebec
Annual Information Form
The Annual Information Form may be obtained by writing to:
Corporate Secretary
Quebecor World Inc.
612 St. Jacques Street
Montreal, Quebec
H3C 4M8
Transfer Agent & Registrar
Montreal Trust Company
Place Montreal Trust
1800 McGill College
Montreal, Quebec
H3A 3K9
Co-Transfer Agents
American Securities Transfer & Trust Inc.
Denver, Colorado
Auditors
KPMG LLP
Vous pouvez vous procurer une version française de ce rapport annuel en vous adressant à :
Quebecor World Inc.
612, rue Saint-Jacques
Montréal (Québec)
H3C 4M8
48

49
SIGNATURES
Pursuant to the requirements of the Securities Exchange Act of 1934, the registrant has duly caused this report to be signed on its behalf by the undersigned, thereto duly authorized.
| QUEBECOR WORLD INC. | ||
|
| ||
|
| ||
| By: | /s/ Raynald Lecavalier |
|
|
|
|
|
| Name: | Raynald Lecavalier | |
| Title: | Vice President, Corporate General Counsel and Secretary | |
Date: March 7, 2003
50