Table of Contents
UNITED STATES
SECURITIES AND EXCHANGE COMMISSION
Washington, D.C. 20549
FORM N-CSRS
CERTIFIED SHAREHOLDER REPORT OF REGISTERED MANAGEMENT
INVESTMENT COMPANIES
Investment Company Act file number 811-07445
SEI Asset Allocation Trust
(Exact name of registrant as specified in charter)
SEI Investments
One Freedom Valley Drive
Oaks, PA 19456
(Address of principal executive offices) (Zip code)
SEI Investments
One Freedom Valley Drive
Oaks, PA 19456
CT Corporation
101 Federal Street
Boston, MA 02110
(Name and address of agent for service)
Registrant’s telephone number, including area code: 1-800-342-5734
Date of fiscal year end: March 31, 2010
Date of reporting period: September 30, 2009
Table of Contents
| Item 1. | Reports to Stockholders. |
Table of Contents

SEI Asset Allocation Trust
Semi-Annual Report as of September 30, 2009
Diversified Conservative Income Fund
Diversified Conservative Fund
Diversified Global Moderate Growth Fund
Diversified Moderate Growth Fund
Diversified Global Growth Fund
Diversified Global Stock Fund
Diversified U.S. Stock Fund
Defensive Strategy Fund
Defensive Strategy Allocation Fund
Conservative Strategy Fund
Conservative Strategy Allocation Fund
Moderate Strategy Fund
Moderate Strategy Allocation Fund
Aggressive Strategy Fund
Tax-Managed Aggressive Strategy Fund
Core Market Strategy Fund
Core Market Strategy Allocation Fund
Market Growth Strategy Fund
Market Growth Strategy Allocation Fund
Table of Contents
| 1 | ||
| 20 | ||
| 26 | ||
| 32 | ||
| 38 | ||
| 43 | ||
| 52 | ||
Supplemental Financial Information: | 54 | |
The Trust files its complete schedule of investments of portfolio holdings with the Securities and Exchange Commission for the first and third quarter of each fiscal year on Form N-Q within sixty days after period end. The Trust’s Form N-Q is available on the Commission’s website at http://www.sec.gov, and may be reviewed and copied at the Commission’s Public Reference Room in Washington, DC. Information on the operation of the Public Reference Room may be obtained by calling 1-800-SEC-0330.
A description of the policies and procedures that the Trust uses to determine how to vote proxies relating to portfolio securities, as well as information relating to how a Fund voted proxies relating to portfolio securities during the most recent 12-month period ended June 30, is available (i) without charge, upon request, by calling 1 800-DIAL-SEI; and (ii) on the Commission’s website at http://www.sec.gov.
Table of Contents
SCHEDULE OF INVESTMENTS (Unaudited)
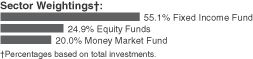
Diversified Conservative Income Fund
September 30, 2009
| Description | Shares | Market Value ($ Thousands) | |||
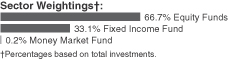
AFFILIATED INVESTMENT FUNDS — 100.1% | |||||
FIXED INCOME FUND — 55.2% | |||||
SEI Institutional Managed Trust U.S. Fixed Income Fund, Class A* | 2,338,922 | $ | 24,044 | ||
Total Fixed Income Fund | 24,044 | ||||
EQUITY FUNDS — 24.9% | |||||
SEI Institutional Managed Trust Large Cap Diversified Alpha Fund, Class A | 1,450,146 | 10,412 | |||
SEI Institutional Managed Trust Small Cap Growth Fund, Class A | 11,600 | 150 | |||
SEI Institutional Managed Trust Small Cap Value Fund, Class A | 10,933 | 149 | |||
SEI Institutional Managed Trust Small/Mid Cap Diversified Alpha Fund, Class A | 24,696 | 151 | |||
Total Equity Funds | 10,862 | ||||
MONEY MARKET FUND (A) — 20.0% | |||||
SEI Liquid Asset Trust Prime Obligation Fund, Class A, 0.010% | 8,725,513 | 8,726 | |||
Total Money Market Fund | 8,726 | ||||
Total Investments — 100.1% | $ | 43,632 | |||
Percentages are based on Net Assets of $43,604 ($ Thousands).
| (A) | Rate shown is the 7-day effective yield as of September 30, 2009. |
| * | The Fund’s investment in the SEI Institutional Managed Trust U.S. Fixed Income Fund, Class A represents greater than 50% of the Fund’s total investments. The SEI Institutional Managed Trust U.S. Fixed Income Fund seeks to have current income consistent with the preservation of capital. For further financial information, available upon request at no charge, on the SEI Institutional Managed Trust U.S. Fixed Income Fund please go to the Securities Exchange Commission’s website at http://www.sec.gov or call 1-800-DIAL-SEI. |
The accompanying notes are an integral part of the financial statements.
| SEI Asset Allocation Trust / Semi-Annual Report / September 30, 2009 | 1 |
Table of Contents
SCHEDULE OF INVESTMENTS (Unaudited)
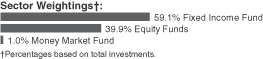
Diversified Conservative Fund
September 30, 2009
| Description | Shares | Market Value ($ Thousands) | |||
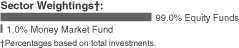
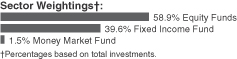
AFFILIATED INVESTMENT FUNDS — 100.0% | |||||
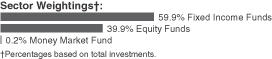
FIXED INCOME FUND — 59.1% | |||||
SEI Institutional Managed Trust U.S. Fixed Income Fund, Class A* | 2,741,447 | $ | 28,182 | ||
Total Fixed Income Fund | 28,182 | ||||
EQUITY FUNDS — 39.9% | |||||
SEI Institutional International Trust International Equity Fund, Class A | 486,041 | 3,830 | |||
SEI Institutional Managed Trust Large Cap Diversified Alpha Fund, Class A | 2,027,723 | 14,559 | |||
SEI Institutional Managed Trust Small Cap Growth Fund, Class A | 16,615 | 215 | |||
SEI Institutional Managed Trust Small Cap Value Fund, Class A | 15,692 | 215 | |||
SEI Institutional Managed Trust Small/Mid Cap Diversified Alpha Fund, Class A | 35,045 | 214 | |||
Total Equity Funds | 19,033 | ||||
MONEY MARKET FUND (A) — 1.0% | |||||
SEI Liquid Asset Trust Prime Obligation Fund, Class A, 0.010% | 468,041 | 468 | |||
Total Money Market Fund | 468 | ||||
Total Investments — 100.0% | $ | 47,683 | |||
Percentages are based on Net Assets of $47,679 ($ Thousands).
| (A) | Rate shown is the 7-day effective yield as of September 30, 2009. |
| * | The Fund’s investment in the SEI Institutional Managed Trust U.S. Fixed Income Fund, Class A represents greater than 50% of the Fund’s total investments. The SEI Institutional Managed Trust U.S. Fixed Income Fund seeks to have current income consistent with the preservation of capital. For further financial information, available upon request at no charge, on the SEI Institutional Managed Trust U.S. Fixed Income Fund please go to the Securities Exchange Commission’s website at http://www.sec.gov or call 1-800-DIAL-SEI. |
The accompanying notes are an integral part of the financial statements.
| 2 | SEI Asset Allocation Trust / Semi-Annual Report / September 30, 2009 |
Table of Contents
SCHEDULE OF INVESTMENTS (Unaudited)
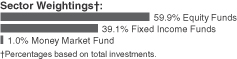
Diversified Global Moderate Growth Fund
September 30, 2009
| Description | Shares | Market Value ($ Thousands) | |||
AFFILIATED INVESTMENT FUNDS — 100.0% | |||||
EQUITY FUNDS — 59.9% | |||||
SEI Institutional International Trust Emerging Markets Equity Fund, Class A | 130,371 | $ | 1,257 | ||
SEI Institutional International Trust International Equity Fund, Class A | 2,230,607 | 17,577 | |||
SEI Institutional Managed Trust Large Cap Diversified Alpha Fund, Class A | 7,479,412 | 53,702 | |||
SEI Institutional Managed Trust Small Cap Growth Fund, Class A | 60,349 | 782 | |||
SEI Institutional Managed Trust Small Cap Value Fund, Class A | 57,501 | 786 | |||
SEI Institutional Managed Trust Small/Mid Cap Diversified Alpha Fund, Class A | 128,417 | 783 | |||
Total Equity Funds | 74,887 | ||||
FIXED INCOME FUNDS — 39.1% | |||||
SEI Institutional International Trust Emerging Markets Debt Fund, Class A | 122,284 | 1,252 | |||
SEI Institutional Managed Trust High Yield Bond Fund, Class A | 1,160,717 | 7,568 | |||
SEI Institutional Managed Trust U.S. Fixed Income Fund, Class A | 3,899,305 | 40,085 | |||
Total Fixed Income Funds | 48,905 | ||||
MONEY MARKET FUND (A) — 1.0% | |||||
SEI Liquid Asset Trust Prime Obligation Fund, Class A, 0.010% | 1,258,281 | 1,258 | |||
Total Money Market Fund | 1,258 | ||||
Total Investments — 100.0% | $ | 125,050 | |||
Percentages are based on Net Assets of $125,046 ($ Thousands).
| (A) | Rate shown is the 7-day effective yield as of September 30, 2009. |
The accompanying notes are an integral part of the financial statements.
| SEI Asset Allocation Trust / Semi-Annual Report / September 30, 2009 | 3 |
Table of Contents
SCHEDULE OF INVESTMENTS (Unaudited)
Diversified Moderate Growth Fund
September 30, 2009

| Description | Shares | Market Value ($ Thousands) | |||
AFFILIATED INVESTMENT FUNDS — 100.0% | |||||
EQUITY FUNDS — 60.0% | |||||
SEI Institutional International Trust International Equity Fund, Class A | 1,192,081 | $ | 9,394 | ||
SEI Institutional Managed Trust Large Cap Diversified Alpha Fund, Class A | 4,974,485 | 35,717 | |||
SEI Institutional Managed Trust Small Cap Growth Fund, Class A | 40,200 | 521 | |||
SEI Institutional Managed Trust Small Cap Value Fund, Class A | 38,619 | 527 | |||
SEI Institutional Managed Trust Small/Mid Cap Diversified Alpha Fund, Class A | 84,261 | 514 | |||
Total Equity Funds | 46,673 | ||||
FIXED INCOME FUND — 39.1% | |||||
SEI Institutional Managed Trust U.S. Fixed Income Fund, Class A | 2,963,002 | 30,460 | |||
Total Fixed Income Fund | 30,460 | ||||
MONEY MARKET FUND (A) — 0.9% | |||||
SEI Liquid Asset Trust Prime Obligation Fund, Class A, 0.010% | 710,000 | 710 | |||
Total Money Market Fund | 710 | ||||
Total Investments — 100.0% | $ | 77,843 | |||
Percentages are based on Net Assets of $77,864 ($ Thousands).
| (A) | Rate shown is the 7-day effective yield as of September 30, 2009. |
| The | accompanying notes are an integral part of the financial statements. |
| 4 | SEI Asset Allocation Trust / Semi-Annual Report / September 30, 2009 |
Table of Contents
SCHEDULE OF INVESTMENTS (Unaudited)
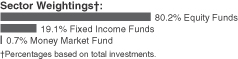
Diversified Global Growth Fund
September 30, 2009
| Description | Shares | Market Value ($ Thousands) | |||
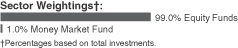
AFFILIATED INVESTMENT FUNDS — 99.9% | |||||
EQUITY FUNDS — 80.1% | |||||
SEI Institutional International Trust Emerging Markets Equity Fund, Class A | 274,846 | $ | 2,649 | ||
SEI Institutional International Trust International Equity Fund, Class A | 3,031,963 | 23,892 | |||
SEI Institutional Managed Trust Large Cap Diversified Alpha Fund, Class A* | 10,540,825 | 75,683 | |||
SEI Institutional Managed Trust Small Cap Growth Fund, Class A | 85,239 | 1,105 | |||
SEI Institutional Managed Trust Small Cap Value Fund, Class A | 81,271 | 1,110 | |||
SEI Institutional Managed Trust Small/Mid Cap Diversified Alpha Fund, Class A | 181,511 | 1,107 | |||
Total Equity Funds | 105,546 | ||||
FIXED INCOME FUNDS — 19.1% | |||||
SEI Institutional Managed Trust High Yield Bond Fund, Class A | 613,521 | 4,000 | |||
SEI Institutional Managed Trust U.S. Fixed Income Fund, Class A | 2,061,103 | 21,188 | |||
Total Fixed Income Funds | 25,188 | ||||
MONEY MARKET FUND (A) — 0.7% | |||||
SEI Liquid Asset Trust Prime Obligation Fund, Class A, 0.010% | 933,511 | 934 | |||
Total Money Market Fund | 934 | ||||
Total Investments — 99.9% | $ | 131,668 | |||
Percentages are based on Net Assets of $131,843 ($ Thousands).
| (A) | Rate shown is the 7-day effective yield as of September 30, 2009. |
| * | The Fund’s investment in the SEI Institutional Managed Trust Large Cap Diversified Alpha Fund, Class A represents greater than 50% of the Fund’s total investments. The SEI Institutional Managed Trust Large Cap Diversified Alpha Fund seeks to provide capital appreciation. Since the investment in the SEI Institutional Managed Trust Large Cap Diversified Alpha Fund represents greater than 75% of the total investments of another fund included in this Semi-Annual Report, the Annual Report as of September 30, 2009 for the SEI Institutional Managed Trust Large Cap Diversified Alpha Fund is included in the back of these financial statements. For further financial information, available upon request at no charge, on the SEI Institutional Managed Trust Large Cap Diversified Alpha Fund please go to the Securities Exchange Commission’s website at http://www.sec.gov or call 1-800-DIAL-SEI. |
The accompanying notes are an integral part of the financial statements.
| SEI Asset Allocation Trust / Semi-Annual Report / September 30, 2009 | 5 |
Table of Contents
SCHEDULE OF INVESTMENTS (Unaudited)
Diversified Global Stock Fund
September 30, 2009
| Description | Shares | Market Value ($ Thousands) | |||
AFFILIATED INVESTMENT FUNDS — 100.0% | |||||
EQUITY FUNDS — 99.0% | |||||
SEI Institutional International Trust Emerging Markets Equity Fund, Class A | 149,208 | $ | 1,438 | ||
SEI Institutional International Trust International Equity Fund, Class A | 2,103,199 | 16,573 | |||
SEI Institutional Managed Trust Large Cap Diversified Alpha Fund, Class A* | 7,057,721 | 50,675 | |||
SEI Institutional Managed Trust Small Cap Growth Fund, Class A | 57,356 | 743 | |||
SEI Institutional Managed Trust Small Cap Value Fund, Class A | 54,432 | 744 | |||
SEI Institutional Managed Trust Small/Mid Cap Diversified Alpha Fund, Class A | 121,681 | 742 | |||
Total Equity Funds | 70,915 | ||||
MONEY MARKET FUND (A) — 1.0% | |||||
SEI Liquid Asset Trust Prime Obligation Fund, Class A, 0.010% | 688,575 | 689 | |||
Total Money Market Fund | 689 | ||||
Total Investments — 100.0% | $ | 71,604 | |||
Percentages are based on Net Assets of $71,606 ($ Thousands).
| (A) | Rate shown is the 7-day effective yield as of September 30, 2009. |
| * | The Fund’s investment in the SEI Institutional Managed Trust Large Cap Diversified Alpha Fund, Class A represents greater than 50% of the Fund’s total investments. The SEI Institutional Managed Trust Large Cap Diversified Alpha Fund seeks to provide capital appreciation. Since the investment in the SEI Institutional Managed Trust Large Cap Diversified Alpha Fund represents greater than 75% of the total investments of another fund included in this Semi-Annual Report, the Annual Report as of September 30, 2009 for the SEI Institutional Managed Trust Large Cap Diversified Alpha Fund is included in the back of these financial statements. For further financial information, available upon request at no charge, on the SEI Institutional Managed Trust Large Cap Diversified Alpha Fund please go to the Securities Exchange Commission’s website at http://www.sec.gov or call 1-800-DIAL-SEI. |
The accompanying notes are an integral part of the financial statements.
| 6 | SEI Asset Allocation Trust / Semi-Annual Report / September 30, 2009 |
Table of Contents
SCHEDULE OF INVESTMENTS (Unaudited)
Diversified U.S. Stock Fund
September 30, 2009
| Description | Shares | Market Value ($ Thousands) | |||
AFFILIATED INVESTMENT FUNDS — 100.0% | |||||
EQUITY FUNDS — 99.0% | |||||
SEI Institutional Managed Trust | 5,828,404 | $ | 41,848 | ||
SEI Institutional Managed Trust | 47,322 | 613 | |||
SEI Institutional Managed Trust | 45,068 | 616 | |||
SEI Institutional Managed Trust | 99,785 | 609 | |||
Total Equity Funds | 43,686 | ||||
MONEY MARKET FUND (A) — 1.0% | |||||
SEI Liquid Asset Trust | 430,272 | 430 | |||
Total Money Market Fund | 430 | ||||
Total Investments — 100.0% | $ | 44,116 | |||
Percentages are based on Net Assets of $44,126 ($ Thousands).
| (A) | Rate shown is the 7-day effective yield as of September 30, 2009. |
| * | The Fund’s investment in the SEI Institutional Managed Trust Large Cap Diversified Alpha Fund, Class A represents greater than 75% of the Fund’s total investments. The SEI Institutional Managed Trust Large Cap Diversified Alpha Fund seeks to provide capital appreciation. The Annual Report as of September 30, 2009 for the SEI Institutional Managed Trust Large Cap Diversified Alpha Fund is included at the back of the financial statements. For further financial information, available upon request at no charge, on the SEI Institutional Managed Trust Large Cap Diversified Alpha Fund please go to the Securities Exchange Commission’s website at http://www.sec.gov or call 1-800-DIAL-SEI. |
The accompanying notes are an integral part of the financial statements.
| SEI Asset Allocation Trust / Semi-Annual Report / September 30, 2009 | 7 |
Table of Contents
SCHEDULE OF INVESTMENTS (Unaudited)
Defensive Strategy Fund
September 30, 2009

| Description | Shares | Market Value ($ Thousands) | |||
AFFILIATED INVESTMENT FUNDS — 100.3% | |||||
FIXED INCOME FUNDS — 25.1% | |||||
SEI Institutional Managed Trust Enhanced Income Fund, Class A | 230,188 | $ | 1,660 | ||
SEI Institutional Managed Trust High Yield Bond Fund, Class A | 320,645 | 2,091 | |||
SEI Institutional Managed Trust Real Return Fund, Class A | 244,069 | 2,490 | |||
SEI Institutional Managed Trust U.S. Fixed Income Fund, Class A | 403,630 | 4,149 | |||
Total Fixed Income Funds | 10,390 | ||||
MONEY MARKET FUND (A) — 75.2% | |||||
SEI Liquid Asset Trust Prime Obligation Fund, Class A, 0.010%* | 31,029,449 | 31,029 | |||
Total Money Market Fund | 31,029 | ||||
Total Investments — 100.3% | $ | 41,419 | |||
Percentages are based on Net Assets of $41,289 ($ Thousands).
| (A) | Rate shown is the 7-day effective yield as of September 30, 2009. |
| * | The Fund’s investment in the SEI Liquid Asset Trust Prime Obligation Fund, Class A represents greater than 50% of the Fund’s total investments. The SEI Liquid Asset Trust Prime Obligation Fund seeks to preserve principal value and maintain a high degree of liquidity while providing current income For further financial information, available upon request at no charge, on the SEI Liquid Asset Trust Prime Obligation Fund please go to the Securities Exchange Commission’s website at http://www.sec.gov or call 1-800-DIAL-SEI. |
The accompanying notes are an integral part of the financial statements.
| 8 | SEI Asset Allocation Trust / Semi-Annual Report / September 30, 2009 |
Table of Contents
SCHEDULE OF INVESTMENTS (Unaudited)
Defensive Strategy Allocation Fund
September 30, 2009
| Description | Shares | Market Value | |||
AFFILIATED INVESTMENT FUNDS — 101.5% | |||||
EQUITY FUNDS — 59.8% | |||||
SEI Institutional Managed Trust Real Estate Fund, Class A | 198,936 | $ | 1,874 | ||
SEI Institutional Managed Trust U.S. Managed Volatility Fund, Class A | 389,994 | 3,763 | |||
Total Equity Funds | 5,637 | ||||
FIXED INCOME FUND — 40.1% | |||||
SEI Institutional Managed Trust High Yield Bond Fund, Class A | 580,200 | 3,783 | |||
Total Fixed Income Fund | 3,783 | ||||
MONEY MARKET FUND (A) — 1.6% | |||||
SEI Liquid Asset Trust Prime Obligation Fund, Class A, 0.010% | 146,621 | 147 | |||
Total Money Market Fund | 147 | ||||
Total Investments — 101.5% | $ | 9,567 | |||
| Percentages | are based on Net Assets of $9,428 ($ Thousands). |
| (A) | Rate shown is the 7-day effective yield as of September 30, 2009. |
The accompanying notes are an integral part of the financial statements.
| SEI Asset Allocation Trust / Semi-Annual Report / September 30, 2009 | 9 |
Table of Contents
SCHEDULE OF INVESTMENTS (Unaudited)
Conservative Strategy Fund
September 30, 2009
| Description | Shares | Market Value ($ Thousands) | |||
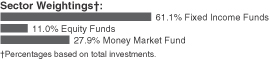
AFFILIATED INVESTMENT FUNDS — 100.3% | |||||
FIXED INCOME FUNDS — 61.3% | |||||
SEI Daily Income Trust Ultra Short Bond Fund, Class A | 2,818,024 | $ | 25,475 | ||
SEI Institutional Managed Trust Enhanced Income Fund, Class A | 1,535,777 | 11,073 | |||
SEI Institutional Managed Trust High Yield Bond Fund, Class A | 2,051,502 | 13,376 | |||
SEI Institutional Managed Trust Real Return Fund, Class A | 651,460 | 6,645 | |||
SEI Institutional Managed Trust U.S. Fixed Income Fund, Class A | 1,077,188 | 11,073 | |||
Total Fixed Income Funds | 67,642 | ||||
EQUITY FUNDS — 11.0% | |||||
SEI Institutional Managed Trust Global Managed Volatility Fund, Class A | 423,587 | 3,312 | |||
SEI Institutional Managed Trust Real Estate Fund, Class A | 232,892 | 2,194 | |||
SEI Institutional Managed Trust U.S. Managed Volatility Fund, Class A | 685,144 | 6,612 | |||
Total Equity Funds | 12,118 | ||||
MONEY MARKET FUND (A) — 28.0% | |||||
SEI Liquid Asset Trust Prime Obligation Fund, Class A, 0.010% | 30,898,564 | 30,899 | |||
Total Money Market Fund | 30,899 | ||||
Total Investments — 100.3% | $ | 110,659 | |||
Percentages are based on Net Assets of $110,309 ($ Thousands).
| (A) | Rate shown is the 7-day effective yield as of September 30, 2009. |
The accompanying notes are an integral part of the financial statements.
| 10 | SEI Asset Allocation Trust / Semi-Annual Report / September 30, 2009 |
Table of Contents
SCHEDULE OF INVESTMENTS (Unaudited)
Conservative Strategy Allocation Fund
September 30, 2009
| Description | Shares | Market Value ($ Thousands) | |||
AFFILIATED INVESTMENT FUNDS — 100.1% | |||||
EQUITY FUNDS — 66.8% | |||||
SEI Institutional Managed Trust Real Estate Fund, Class A | 592,968 | $ | 5,586 | ||
SEI Institutional Managed Trust U.S. Managed Volatility Fund, Class A | 1,188,941 | 11,473 | |||
Total Equity Funds | 17,059 | ||||
FIXED INCOME FUND — 33.1% | |||||
SEI Institutional Managed Trust High Yield Bond Fund, Class A | 1,295,792 | 8,448 | |||
Total Fixed Income Fund | 8,448 | ||||
MONEY MARKET FUND (A) — 0.2% | |||||
SEI Liquid Asset Trust Prime Obligation Fund, Class A, 0.010% | 58,539 | 59 | |||
Total Money Market Fund | 59 | ||||
Total Investments — 100.1% | $ | 25,566 | |||
Percentages are based on Net Assets of $25,548 ($ Thousands).
| (A) | Rate shown is the 7-day effective yield as of September 30, 2009. |
The accompanying notes are an integral part of the financial statements.
| SEI Asset Allocation Trust / Semi-Annual Report / September 30, 2009 | 11 |
Table of Contents
SCHEDULE OF INVESTMENTS (Unaudited)
Moderate Strategy Fund
September 30, 2009
| Description | Shares | Market Value ($ Thousands) | |||
AFFILIATED INVESTMENT FUNDS — 100.3% | |||||
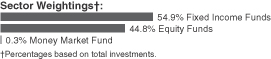
FIXED INCOME FUNDS — 55.0% | |||||
SEI Institutional Managed Trust Enhanced Income Fund, Class A | 7,067,697 | $ | 50,958 | ||
SEI Institutional Managed Trust High Yield Bond Fund, Class A | 6,017,736 | 39,236 | |||
SEI Institutional Managed Trust Real Return Fund, Class A | 1,766,057 | 18,014 | |||
SEI Institutional Managed Trust U.S. Fixed Income Fund, Class A | 5,467,226 | 56,203 | |||
Total Fixed Income Funds | 164,411 | ||||
EQUITY FUNDS — 45.0% | |||||
SEI Institutional Managed Trust Global Managed Volatility Fund, Class A | 5,741,099 | 44,895 | |||
SEI Institutional Managed Trust Large Cap Growth Fund, Class A | 847,513 | 14,933 | |||
SEI Institutional Managed Trust Large Cap Value Fund, Class A | 1,075,231 | 14,871 | |||
SEI Institutional Managed Trust Real Estate Fund, Class A | 1,576,755 | 14,853 | |||
SEI Institutional Managed Trust U.S. Managed Volatility Fund, Class A | 4,636,814 | 44,745 | |||
Total Equity Funds | 134,297 | ||||
MONEY MARKET FUND (A) — 0.3% | |||||
SEI Liquid Asset Trust Prime Obligation Fund, Class A, 0.010% | 751,891 | 752 | |||
Total Money Market Fund | 752 | ||||
Total Investments — 100.3% | $ | 299,460 | |||
Percentages are based on Net Assets of $298,665 ($ Thousands).
| (A) | Rate shown is the 7-day effective yield as of September 30, 2009. |
The accompanying notes are an integral part of the financial statements.
| 12 | SEI Asset Allocation Trust / Semi-Annual Report / September 30, 2009 |
Table of Contents
SCHEDULE OF INVESTMENTS (Unaudited)
Moderate Strategy Allocation Fund
September 30, 2009
| Description | Shares | Market Value ($ Thousands) | |||
AFFILIATED INVESTMENT FUNDS — 100.1% | |||||
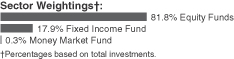
EQUITY FUNDS — 81.9% | |||||
SEI Institutional International Trust International Equity Fund, Class A | 813,213 | $ | 6,408 | ||
SEI Institutional Managed Trust Real Estate Fund, Class A | 672,615 | 6,336 | |||
SEI Institutional Managed Trust Tax-Managed Large Cap Fund, Class A | 1,247,603 | 12,713 | |||
SEI Institutional Managed Trust U.S. Managed Volatility Fund, Class A | 3,369,903 | 32,520 | |||
Total Equity Funds | 57,977 | ||||
FIXED INCOME FUND — 17.9% | |||||
SEI Institutional Managed Trust High Yield Bond Fund, Class A | 1,947,358 | 12,697 | |||
Total Fixed Income Fund | 12,697 | ||||
MONEY MARKET FUND (A) — 0.3% | |||||
SEI Liquid Asset Trust Prime Obligation Fund, Class A, 0.010% | 205,046 | 205 | |||
Total Money Market Fund | 205 | ||||
Total Investments — 100.1% | $ | 70,879 | |||
Percentages are based on Net Assets of $70,841 ($ Thousands).
| (A) | Rate shown is the 7-day effective yield as of September 30, 2009. |
The accompanying notes are an integral part of the financial statements.
| SEI Asset Allocation Trust / Semi-Annual Report / September 30, 2009 | 13 |
Table of Contents
SCHEDULE OF INVESTMENTS (Unaudited)
Aggressive Strategy Fund
September 30, 2009
| Description | Shares | Market Value ($ Thousands) | |||
AFFILIATED INVESTMENT FUNDS — 100.0% | |||||
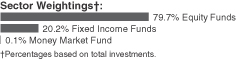
EQUITY FUNDS — 79.7% | |||||
SEI Institutional International Trust Emerging Markets Equity Fund, Class A | 664,161 | $ | 6,402 | ||
SEI Institutional International Trust International Equity Fund, Class A | 7,301,499 | 57,536 | |||
SEI Institutional Managed Trust Large Cap Diversified Alpha Fund, Class A | 21,091,116 | 151,434 | |||
SEI Institutional Managed Trust Small Cap Growth Fund, Class A | 974,350 | 12,628 | |||
SEI Institutional Managed Trust Small Cap Value Fund, Class A | 920,272 | 12,571 | |||
SEI Institutional Managed Trust Small/Mid Cap Diversified Alpha Fund, Class A | 2,060,221 | 12,567 | |||
Total Equity Funds | 253,138 | ||||
FIXED INCOME FUNDS — 20.2% | |||||
SEI Institutional International Trust Emerging Markets Debt Fund, Class A | 2,186,899 | 22,394 | |||
SEI Institutional Managed Trust High Yield Bond Fund, Class A | 5,909,744 | 38,532 | |||
SEI Institutional Managed Trust U.S. Fixed Income Fund, Class A | 308,878 | 3,175 | |||
Total Fixed Income Funds | 64,101 | ||||
MONEY MARKET FUND (A) — 0.1% | |||||
SEI Liquid Asset Trust Prime Obligation Fund, Class A, 0.010% | 324,491 | 324 | |||
Total Money Market Fund | 324 | ||||
Total Investments — 100.0% | $ | 317,563 | |||
Percentages are based on Net Assets of $317,692 ($ Thousands).
| (A) | Rate shown is the 7-day effective yield as of September 30, 2009. |
The accompanying notes are an integral part of the financial statements.
| 14 | SEI Asset Allocation Trust / Semi-Annual Report / September 30, 2009 |
Table of Contents
SCHEDULE OF INVESTMENTS (Unaudited)
Tax-Managed Aggressive Strategy Fund
September 30, 2009

| Description | Shares | Market Value ($ Thousands) | |||
AFFILIATED INVESTMENT FUNDS — 100.0% | |||||
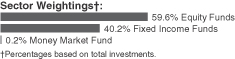
EQUITY FUNDS — 87.9% | |||||
SEI Institutional International Trust Emerging Markets Equity Fund, Class A | 115,194 | $ | 1,110 | ||
SEI Institutional International Trust International Equity Fund, Class A | 1,129,557 | 8,901 | |||
SEI Institutional Managed Trust Tax-Managed Large Cap Fund, Class A* | 3,032,714 | 30,903 | |||
SEI Institutional Managed Trust Tax-Managed Small Cap Fund, Class A | 817,388 | 7,700 | |||
Total Equity Funds | 48,614 | ||||
FIXED INCOME FUNDS — 11.9% | |||||
SEI Institutional International Trust Emerging Markets Debt Fund, Class A | 217,489 | 2,227 | |||
SEI Institutional Managed Trust High Yield Bond Fund, Class A | 664,290 | 4,331 | |||
Total Fixed Income Funds | 6,558 | ||||
MONEY MARKET FUND (A) — 0.2% | |||||
SEI Liquid Asset Trust Prime Obligation Fund, Class A, 0.010% | 131,543 | 132 | |||
Total Money Market Fund | 132 | ||||
Total Investments — 100.0% | $ | 55,304 | |||
Percentages are based on Net Assets of $55,285 ($ Thousands).
| (A) | Rate shown is the 7-day effective yield as of September 30, 2009. |
| * | The Fund’s investment in the SEI Institutional Managed Trust Tax-Managed Large Cap Fund, Class A represents greater than 50% of the Fund’s total investments. The SEI Institutional Managed Trust Tax-Managed Large Cap Fund seeks to provide high long-term after-tax returns. For further financial information, available upon request at no charge, on the SEI Institutional Managed Trust Tax-Managed Large Cap Fund please go to the Securities Exchange Commission’s website at http://www.sec.gov or call 1-800-DIAL-SEI. |
The accompanying notes are an integral part of the financial statements.
| SEI Asset Allocation Trust / Semi-Annual Report / September 30, 2009 | 15 |
Table of Contents
SCHEDULE OF INVESTMENTS (Unaudited)
Core Market Strategy Fund
September 30, 2009
| Description | Shares | Market Value ($ Thousands) | |||
AFFILIATED INVESTMENT FUNDS — 99.8% | |||||
FIXED INCOME FUNDS — 59.8% | |||||
SEI Institutional International Trust Emerging Markets Debt Fund, Class A | 144,635 | $ | 1,481 | ||
SEI Institutional Managed Trust High Yield Bond Fund, Class A | 794,653 | 5,181 | |||
SEI Institutional Managed Trust U.S. Fixed Income Fund, Class A* | 3,629,039 | 37,306 | |||
Total Fixed Income Funds | 43,968 | ||||
EQUITY FUNDS — 39.8% | |||||
SEI Institutional International Trust Emerging Markets Equity Fund, Class A | 76,807 | 741 | |||
SEI Institutional International Trust International Equity Fund, Class A | 841,517 | 6,631 | |||
SEI Institutional Managed Trust Large Cap Diversified Alpha Fund, Class A | 2,443,583 | 17,545 | |||
SEI Institutional Managed Trust Small Cap Growth Fund, Class A | 111,979 | 1,451 | |||
SEI Institutional Managed Trust Small Cap Value Fund, Class A | 105,762 | 1,445 | |||
SEI Institutional Managed Trust Small/Mid Cap Diversified Alpha Fund, Class A | 236,773 | 1,444 | |||
Total Equity Funds | 29,257 | ||||
MONEY MARKET FUND (A) — 0.2% | |||||
SEI Liquid Asset Trust Prime Obligation Fund, Class A, 0.010% | 176,615 | 177 | |||
Total Money Market Fund | 177 | ||||
Total Investments — 99.8% | $ | 73,402 | |||
Percentages are based on Net Assets of $73,584 ($ Thousands).
| (A) | Rate shown is the 7-day effective yield as of September 30, 2009. |
| * | The Fund’s investment in the SEI Institutional Managed Trust U.S. Fixed Income Fund, Class A represents greater than 50% of the Fund’s total investments. The SEI Institutional Managed Trust U.S. Fixed Income Fund seeks to have current income consistent with the preservation of capital. For further financial information, available upon request at no charge, on the SEI Institutional Managed Trust U.S. Fixed Income Fund please go to the Securities Exchange Commission’s website at http://www.sec.gov or call 1-800-DIAL-SEI. |
The accompanying notes are an integral part of the financial statements.
| 16 | SEI Asset Allocation Trust / Semi-Annual Report / September 30, 2009 |
Table of Contents
SCHEDULE OF INVESTMENTS (Unaudited)
Core Market Strategy Allocation Fund
September 30, 2009
| Description | Shares | Market Value ($ Thousands) | |||
AFFILIATED INVESTMENT FUNDS — 100.4% | |||||
EQUITY FUNDS — 88.0% | |||||
SEI Institutional International Trust Emerging Markets Equity Fund, Class A | 38,827 | $ | 374 | ||
SEI Institutional International Trust International Equity Fund, Class A | 379,489 | 2,990 | |||
SEI Institutional Managed Trust Tax-Managed Large Cap Fund, Class A* | 1,018,949 | 10,383 | |||
SEI Institutional Managed Trust Tax-Managed Small Cap Fund, Class A | 274,621 | 2,587 | |||
Total Equity Funds | 16,334 | ||||
FIXED INCOME FUNDS — 11.9% | |||||
SEI Institutional International Trust Emerging Markets Debt Fund, Class A | 73,217 | 750 | |||
SEI Institutional Managed Trust High Yield Bond Fund, Class A | 223,311 | 1,456 | |||
Total Fixed Income Funds | 2,206 | ||||
MONEY MARKET FUND (A) — 0.5% | |||||
SEI Liquid Asset Trust Prime Obligation Fund, Class A, 0.010% | 95,744 | 96 | |||
Total Money Market Fund | 96 | ||||
Total Investments — 100.4% | $ | 18,636 | |||
Percentages are based on Net Assets of $18,557 ($ Thousands).
| (A) | Rate shown is the 7-day effective yield as of September 30, 2009. |
| * | The Fund’s investment in the SEI Institutional Managed Trust Tax-Managed Large Cap Fund, Class A represents greater than 50% of the Fund’s total investments. The SEI Institutional Managed Trust Tax-Managed Large Cap Fund seeks to provide high long-term after-tax returns. For further financial information, available upon request at no charge, on the SEI Institutional Managed Trust Tax-Managed Large Cap Fund please go to the Securities Exchange Commission’s website at http://www.sec.gov or call 1-800-DIAL-SEI. |
The accompanying notes are an integral part of the financial statements.
| SEI Asset Allocation Trust / Semi-Annual Report / September 30, 2009 | 17 |
Table of Contents
SCHEDULE OF INVESTMENTS (Unaudited)
Market Growth Strategy Fund
September 30, 2009
| Description | Shares | Market Value ($ Thousands) | |||
AFFILIATED INVESTMENT FUNDS — 100.0% | |||||
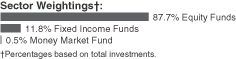
EQUITY FUNDS — 59.6% | |||||
SEI Institutional International Trust Emerging Markets Equity Fund, Class A | 491,606 | $ | 4,739 | ||
SEI Institutional International Trust International Equity Fund, Class A | 8,421,183 | 66,359 | |||
SEI Institutional Managed Trust Large Cap Diversified Alpha Fund, Class A | 22,761,139 | 163,425 | |||
SEI Institutional Managed Trust Small Cap Growth Fund, Class A | 1,081,482 | 14,016 | |||
SEI Institutional Managed Trust Small Cap Value Fund, Class A | 1,021,431 | 13,953 | |||
SEI Institutional Managed Trust Small/Mid Cap Diversified Alpha Fund, Class A | 3,057,450 | 18,650 | |||
Total Equity Funds | 281,142 | ||||
FIXED INCOME FUNDS — 40.2% | |||||
SEI Institutional International Trust Emerging Markets Debt Fund, Class A | 1,853,088 | 18,976 | |||
SEI Institutional Managed Trust High Yield Bond Fund, Class A | 7,303,382 | 47,618 | |||
SEI Institutional Managed Trust U.S. Fixed Income Fund, Class A | 11,960,806 | 122,957 | |||
Total Fixed Income Funds | 189,551 | ||||
MONEY MARKET FUND (A) — 0.2% | |||||
SEI Liquid Asset Trust Prime Obligation Fund, Class A, 0.010% | 1,126,072 | 1,126 | |||
Total Money Market Fund | 1,126 | ||||
Total Investments — 100.0% | $ | 471,819 | |||
Percentages are based on Net Assets of $471,636 ($ Thousands).
| (A) | Rate shown is the 7-day effective yield as of September 30, 2009. |
The accompanying notes are an integral part of the financial statements.
| 18 | SEI Asset Allocation Trust / Semi-Annual Report / September 30, 2009 |
Table of Contents
SCHEDULE OF INVESTMENTS (Unaudited)
Market Growth Strategy Allocation Fund
September 30, 2009

| Description | Shares | Market Value ($ Thousands) | |||
AFFILIATED INVESTMENT FUNDS — 99.8% | |||||
EQUITY FUNDS — 87.9% | |||||
SEI Institutional International Trust Emerging Markets Equity Fund, Class A | 206,083 | $ | 1,987 | ||
SEI Institutional International Trust International Equity Fund, Class A | 2,020,798 | 15,924 | |||
SEI Institutional Managed Trust Tax-Managed Large Cap Fund, Class A* | 5,425,731 | 55,288 | |||
SEI Institutional Managed Trust Tax-Managed Small Cap Fund, Class A | 1,462,286 | 13,775 | |||
Total Equity Funds | 86,974 | ||||
FIXED INCOME FUNDS — 11.9% | |||||
SEI Institutional International Trust Emerging Markets Debt Fund, Class A | 389,094 | 3,984 | |||
SEI Institutional Managed Trust High Yield Bond Fund, Class A | 1,188,443 | 7,749 | |||
Total Fixed Income Funds | 11,733 | ||||
MONEY MARKET FUND (A) — 0.0% | |||||
SEI Liquid Asset Trust Prime Obligation Fund, Class A, 0.010% | 17,371 | 17 | |||
Total Money Market Fund | 17 | ||||
Total Investments — 99.8% | $ | 98,724 | |||
Percentages are based on Net Assets of $98,923 ($ Thousands).
| (A) | Rate shown is the 7-day effective yield as of September 30, 2009. |
| * | The Fund’s investment in the SEI Institutional Managed Trust Tax-Managed Large Cap Fund, Class A represents greater than 50% of the Fund’s total investments. The SEI Institutional Managed Trust Tax-Managed Large Cap Fund seeks to provide high long-term after-tax returns. For further financial information, available upon request at no charge, on the SEI Institutional Managed Trust Tax-Managed Large Cap Fund please go to the Securities Exchange Commission’s website at http://www.sec.gov or call 1-800-DIAL-SEI. |
The accompanying notes are an integral part of the financial statements.
| SEI Asset Allocation Trust / Semi-Annual Report / September 30, 2009 | 19 |
Table of Contents
Statements of Assets and Liabilities ($ Thousands)
September 30, 2009 (Unaudited)
| Diversified Conservative Income Fund | Diversified Conservative Fund | Diversified Global Moderate Growth Fund | ||||||||||
ASSETS: | ||||||||||||
Investments in affiliated funds, at market value† | $ | 43,632 | $ | 47,683 | $ | 125,050 | ||||||
Income distribution receivable from affiliated funds | 67 | 78 | 177 | |||||||||
Receivable for investment securities sold | 18 | 39 | 102 | |||||||||
Prepaid expenses | 5 | 6 | 15 | |||||||||
Receivable for fund shares sold | 3 | 13 | 48 | |||||||||
Receivable from administrator | 1 | 2 | 4 | |||||||||
Total Assets | 43,726 | 47,821 | 125,396 | |||||||||
LIABILITIES: | ||||||||||||
Bank overdraft | 66 | 78 | 177 | |||||||||
Payable for investment securities purchased | 22 | 38 | 125 | |||||||||
Payable for fund shares redeemed | 14 | 7 | 7 | |||||||||
Distribution fees payable | 6 | 4 | 3 | |||||||||
Investment advisory fees payable | 4 | 4 | 10 | |||||||||
Administrative servicing fees payable | 1 | 1 | 4 | |||||||||
Trustees’ fees payable | 1 | 1 | 1 | |||||||||
Chief Compliance Officer fees payable | — | — | 1 | |||||||||
Accrued expenses | 8 | 9 | 22 | |||||||||
Total Liabilities | 122 | 142 | 350 | |||||||||
Net Assets | $ | 43,604 | $ | 47,679 | $ | 125,046 | ||||||
† Cost of investments in affiliated funds | 44,183 | 49,599 | 115,386 | |||||||||
NET ASSETS: | ||||||||||||
Paid in Capital — (unlimited authorization — no par value) | $ | 49,686 | $ | 58,805 | $ | 164,698 | ||||||
Undistributed (distributions in excess of) net investment income | 147 | 176 | 405 | |||||||||
Accumulated net realized loss on investments | (5,678 | ) | (9,386 | ) | (49,721 | ) | ||||||
Net unrealized appreciation (depreciation) on investments | (551 | ) | (1,916 | ) | 9,664 | |||||||
Net Assets | $ | 43,604 | $ | 47,679 | $ | 125,046 | ||||||
Net Asset Value, Offering and Redemption Price Per Share — Class A | $9.90 | $8.68 | $8.82 | |||||||||
| | ($33,055,311 ÷ 3,339,138 shares | ) | | ($38,335,300 ÷ 4,418,721 shares | ) | | ($99,065,225 ÷ 11,228,031 shares | ) | ||||
Net Asset Value, Offering and Redemption Price Per Share — Class D | $9.81 | $8.64 | $8.71 | |||||||||
| | ($6,196,720 ÷ 631,855 shares | ) | | ($4,319,312 ÷ 500,029 shares | ) | | ($2,731,904 ÷ 313,682 shares | ) | ||||
Net Asset Value, Offering and Redemption Price Per Share — Class I | $9.87 | $8.65 | $8.79 | |||||||||
| | ($4,351,493 ÷ 440,696 shares | ) | | ($5,024,350 ÷ 580,519 shares | ) | | ($23,249,060 ÷ 2,646,389 shares | ) | ||||
Amounts designated as “—” are $0 or have been rounded to $0.
The accompanying notes are an integral part of the financial statements.
| 20 | SEI Asset Allocation Trust / Semi-Annual Report / September 30, 2009 |
Table of Contents
| Diversified Moderate Growth Fund | Diversified Global Growth Fund | Diversified Global Stock Fund | Diversified U.S. Stock Fund | |||||||||
| $ 77,843 | $131,668 | $ 71,604 | $ 44,116 | |||||||||
| 84 | 93 | — | — | |||||||||
| 89 | 390 | 56 | 5 | |||||||||
| 10 | 16 | 8 | 11 | |||||||||
| 25 | 55 | 36 | 13 | |||||||||
| 3 | 4 | 2 | 1 | |||||||||
| 78,054 | 132,226 | 71,706 | 44,146 | |||||||||
| 84 | 93 | — | — | |||||||||
| 32 | 19 | 43 | — | |||||||||
| 39 | 223 | 32 | 2 | |||||||||
| 11 | 7 | 5 | 6 | |||||||||
| 6 | 11 | 6 | 4 | |||||||||
| 2 | 6 | 2 | 1 | |||||||||
| 1 | 1 | 1 | — | |||||||||
| — | 1 | — | — | |||||||||
| 15 | 22 | 11 | 7 | |||||||||
| 190 | 383 | 100 | 20 | |||||||||
| $ 77,864 | $131,843 | $ 71,606 | $ 44,126 | |||||||||
| 78,335 | 153,098 | 81,107 | 57,414 | |||||||||
| $109,735 | $186,949 | $102,968 | $ 73,392 | |||||||||
| 170 | 174 | (35 | ) | (23 | ) | |||||||
| (31,549 | ) | (33,850 | ) | (21,824 | ) | (15,945 | ) | |||||
| (492 | ) | (21,430 | ) | (9,503 | ) | (13,298 | ) | |||||
| $ 77,864 | $131,843 | $ 71,606 | $ 44,126 | |||||||||
| $9.50 | $9.23 | $9.32 | $11.07 | |||||||||
| ($56,619,252 ÷ 5,958,592 shares | ) | ($91,253,401 ÷ 9,884,357 shares | ) | ($54,977,885 ÷ 5,898,065 shares | ) | ($35,987,493 ÷ 3,249,580 shares | ) | |||||
| $9.44 | $9.14 | $8.66 | $10.31 | |||||||||
| ($9,562,191 ÷ 1,012,872 shares | ) | ($6,388,322 ÷ 698,811 shares | ) | ($3,986,128 ÷ 460,380 shares | ) | ($4,160,330 ÷ 403,661 shares | ) | |||||
| $9.49 | $9.22 | $9.29 | $11.03 | |||||||||
| ($11,682,278 ÷ 1,231,128 shares | ) | ($34,200,904 ÷ 3,711,353 shares | ) | ($12,641,657 ÷ 1,360,477 shares | ) | ($3,978,409 ÷ 360,648 shares | ) |
| SEI Asset Allocation Trust / Semi-Annual Report / September 30, 2009 | 21 |
Table of Contents
Statements of Assets and Liabilities ($ Thousands)
September 30, 2009 (Unaudited)
| Defensive Strategy Fund | Defensive Strategy Allocation Fund | Conservative Strategy Fund | ||||||||||
ASSETS: | ||||||||||||
Investments in affiliated funds, at market value† | $ | 41,419 | $ | 9,567 | $ | 110,659 | ||||||
Income distributions receivable from affiliated funds | 30 | 32 | 200 | |||||||||
Prepaid expenses | 6 | 1 | 14 | |||||||||
Receivable from administrator | 2 | 1 | 5 | |||||||||
Receivable for investment securities sold | — | — | 25 | |||||||||
Receivable for fund shares sold | — | — | 6 | |||||||||
Total Assets | 41,457 | 9,601 | 110,909 | |||||||||
LIABILITIES: | ||||||||||||
Payable for fund shares redeemed | 123 | 14 | 325 | |||||||||
Bank overdraft | 30 | 32 | 199 | |||||||||
Investment advisory fees payable | 3 | 1 | 9 | |||||||||
Trustees’ fees payable | 1 | — | 2 | |||||||||
Payable for investment securities purchased | — | 123 | 39 | |||||||||
Chief Compliance Officer fees payable | — | — | 1 | |||||||||
Accrued expenses | 11 | 3 | 25 | |||||||||
Total Liabilities | 168 | 173 | 600 | |||||||||
Net Assets | $ | 41,289 | $ | 9,428 | $ | 110,309 | ||||||
† Cost of investments in affiliated funds | 41,363 | 9,764 | 114,943 | |||||||||
NET ASSETS: | ||||||||||||
Paid in Capital — (unlimited authorization — no par value) | $ | 47,002 | $ | 14,002 | $ | 136,266 | ||||||
Undistributed net investment income | 71 | 79 | 518 | |||||||||
Accumulated net realized loss on investments | (5,840 | ) | (4,456 | ) | (22,191 | ) | ||||||
Net unrealized appreciation (depreciation) on investments | 56 | (197 | ) | (4,284 | ) | |||||||
Net Assets | $ | 41,289 | $ | 9,428 | $ | 110,309 | ||||||
Net Asset Value, Offering and Redemption Price Per Share — Class A | $9.30 | $8.94 | $9.10 | |||||||||
| | ($41,288,630 ÷ 4,441,666 shares | ) | | ($9,427,975 ÷ 1,054,388 shares | ) | | ($108,607,373 ÷ 11,929,490 shares | ) | ||||
Net Asset Value, Offering and Redemption Price Per Share — Class I | $9.28 | N/A | $9.23 | |||||||||
| | ($113.39 ÷ 12.213 shares | ) | | ($1,701,197 ÷ 184,315 shares | ) | |||||||
Amounts designated as “—” are $0 or have been rounded to $0.
N/A — Not applicable. Class I shares currently not offered.
The accompanying notes are an integral part of the financial statements.
| 22 | SEI Asset Allocation Trust / Semi-Annual Report / September 30, 2009 |
Table of Contents
| Conservative Strategy Allocation Fund | Moderate Strategy Fund | Moderate Strategy Allocation Fund | |||||||||||
| $ 25,566 | $299,460 | $ 70,879 | |||||||||||
| 73 | 493 | 110 | |||||||||||
| 3 | 37 | 8 | |||||||||||
| 1 | 15 | 4 | |||||||||||
| 86 | 330 | 104 | |||||||||||
| — | 131 | 30 | |||||||||||
| 25,729 | 300,466 | 71,135 | |||||||||||
| 21 | 865 | 34 | |||||||||||
| 73 | 493 | 110 | |||||||||||
| 2 | 24 | 6 | |||||||||||
| — | 3 | 1 | |||||||||||
| 81 | 359 | 131 | |||||||||||
| — | 1 | — | |||||||||||
| 4 | 56 | 12 | |||||||||||
| 181 | 1,801 | 294 | |||||||||||
| $ 25,548 | $298,665 | $ 70,841 | |||||||||||
| 23,127 | 310,368 | 72,060 | |||||||||||
| $ 33,775 | $395,489 | $ 93,320 | |||||||||||
| 173 | 1,170 | 256 | |||||||||||
| (10,839 | ) | (87,086 | ) | (21,554 | ) | ||||||||
| 2,439 | (10,908 | ) | (1,181 | ) | |||||||||
| $ 25,548 | $298,665 | $ 70,841 | |||||||||||
| $8.46 | $9.41 | $10.93 | |||||||||||
| ($25,548,450 ÷ 3,021,368 shares | ) | ($297,080,226 ÷ 31,572,662 shares | ) | ($70,840,520 ÷ 6,482,211 shares | ) | ||||||||
| N/A | $9.61 | N/A | |||||||||||
| ($1,585,019 ÷ 164,926 shares | ) |
| SEI Asset Allocation Trust / Semi-Annual Report / September 30, 2009 | 23 |
Table of Contents
Statements of Assets and Liabilities ($ Thousands)
September 30, 2009 (Unaudited)
| Aggressive Strategy Fund | Tax-Managed Aggressive Strategy Fund | Core Market Strategy Fund | ||||||||||
ASSETS: | ||||||||||||
Investments in affiliated funds, at market value† | $ | 317,563 | $ | 55,304 | $ | 73,402 | ||||||
Receivable for investment securities sold | 584 | 47 | 64 | |||||||||
Receivable for fund shares sold | 538 | 26 | 219 | |||||||||
Income distributions receivable from affiliated funds | 341 | 37 | 147 | |||||||||
Prepaid expenses | 35 | 7 | 9 | |||||||||
Receivable from administrator | 16 | 3 | 3 | |||||||||
Total Assets | 319,077 | 55,424 | 73,844 | |||||||||
LIABILITIES: | ||||||||||||
Payable for fund shares redeemed | 842 | 49 | 37 | |||||||||
Bank overdraft | 341 | 37 | 147 | |||||||||
Payable for investment securities purchased | 124 | 39 | 56 | |||||||||
Investment advisory fees payable | 26 | 4 | 6 | |||||||||
Trustees’ fees payable | 3 | 1 | 1 | |||||||||
Distribution fees payable | 1 | — | — | |||||||||
Chief Compliance Officer fees payable | 1 | — | — | |||||||||
Accrued expenses | 47 | 9 | 13 | |||||||||
Total Liabilities | 1,385 | 139 | 260 | |||||||||
Net Assets | $ | 317,692 | $ | 55,285 | $ | 73,584 | ||||||
† Cost of investments in affiliated funds | 371,533 | 47,217 | 77,148 | |||||||||
NET ASSETS: | ||||||||||||
Paid in Capital — (unlimited authorization — no par value) | $ | 456,668 | $ | 73,514 | $ | 91,195 | ||||||
Undistributed net investment income | 774 | 85 | 361 | |||||||||
Accumulated net realized loss on investments | (85,780 | ) | (26,401 | ) | (14,226 | ) | ||||||
Net unrealized appreciation (depreciation) on investments | (53,970 | ) | 8,087 | (3,746 | ) | |||||||
Net Assets | $ | 317,692 | $ | 55,285 | $ | 73,584 | ||||||
Net Asset Value, Offering and Redemption Price Per Share — Class A | $8.99 | $10.33 | $9.19 | |||||||||
| | ($310,587,052 ÷ 34,529,945 shares | ) | | ($55,285,183 ÷ 5,350,775 shares | ) | | ($73,584,063 ÷ 8,006,732 shares | ) | ||||
Net Asset Value, Offering and Redemption Price Per Share — Class I | $8.81 | N/A | $9.47 | |||||||||
| | ($7,104,517 ÷ 806,522 shares | ) | | ($123.76 ÷ 13.062 shares | ) | |||||||
Amounts designated as “—” are $0 or have been rounded to $0.
N/A — Not applicable. Class I shares currently not offered.
The accompanying notes are an integral part of the financial statements.
| 24 | SEI Asset Allocation Trust / Semi-Annual Report / September 30, 2009 |
Table of Contents
| Core Market Strategy Allocation Fund | Market Growth Strategy Fund | Market Growth Strategy Allocation Fund | |||||||||
| $18,636 | $ 471,819 | $ 98,724 | |||||||||
| — | 537 | 265 | |||||||||
| — | 111 | 29 | |||||||||
| 13 | 753 | 67 | |||||||||
| 2 | 57 | 13 | |||||||||
| 1 | 24 | 5 | |||||||||
| 18,652 | 473,301 | 99,103 | |||||||||
| 25 | 337 | 53 | |||||||||
| 12 | 754 | 67 | |||||||||
| 53 | 448 | 35 | |||||||||
| 2 | 38 | 8 | |||||||||
| — | 5 | 1 | |||||||||
| — | 1 | — | |||||||||
| — | 2 | — | |||||||||
| 3 | 80 | 16 | |||||||||
| 95 | 1,665 | 180 | |||||||||
| $18,557 | $ 471,636 | $ 98,923 | |||||||||
| 16,259 | 534,769 | 89,756 | |||||||||
| $23,200 | $ 659,524 | $136,131 | |||||||||
| 29 | 1,804 | 152 | |||||||||
| (7,049 | ) | (126,742 | ) | (46,328 | ) | ||||||
| 2,377 | (62,950 | ) | 8,968 | ||||||||
| $18,557 | $ 471,636 | $ 98,923 | |||||||||
| $9.38 | $9.08 | $11.27 | |||||||||
| ($18,556,510 ÷ 1,979,140 shares | ) | ($464,050,771 ÷ 51,132,607 shares | ) | ($98,922,811 ÷ 8,781,027 shares | ) | ||||||
| N/A | $8.97 | N/A | |||||||||
| ($7,584,860 ÷ 845,879 shares | ) |
| SEI Asset Allocation Trust / Semi-Annual Report / September 30, 2009 | 25 |
Table of Contents
Statements of Operations ($ Thousands)
For the six months ended September 30, 2009 (Unaudited)
| Diversified Conservative Income Fund | Diversified Conservative Fund | Diversified Global Moderate Growth Fund | ||||||||||
Investment Income: | ||||||||||||
Income Distributions from Affiliated Funds | $ | 490 | $ | 572 | $ | 1,170 | ||||||
Expenses: | ||||||||||||
Administration Fees | 41 | 45 | 116 | |||||||||
Distribution Fees — Class D | 22 | 16 | 9 | |||||||||
Investment Advisory Fees | 21 | 23 | 58 | |||||||||
Shareholder Servicing Fees — Class D | 7 | 5 | 3 | |||||||||
Administrative Servicing Fees — Class I | 5 | 6 | 26 | |||||||||
Trustees’ Fees | 1 | 1 | 2 | |||||||||
Registration Fees | 4 | 4 | 11 | |||||||||
Professional Fees | 3 | 4 | 10 | |||||||||
Printing Fees | 3 | 3 | 10 | |||||||||
Custodian Fees/Wire Agent Fees | 1 | 1 | 2 | |||||||||
Other Expenses | 1 | 1 | 2 | |||||||||
Total Expenses | 109 | 109 | 249 | |||||||||
Less: | ||||||||||||
Administration Fees Waived | (41 | ) | (45 | ) | (116 | ) | ||||||
Reimbursement from Administrator | (9 | ) | (10 | ) | (25 | ) | ||||||
Net Expenses | 59 | 54 | 108 | |||||||||
Net Investment Income (Loss) | 431 | 518 | 1,062 | |||||||||
Net Realized and Unrealized Gain (Loss) from Affiliated Funds: | ||||||||||||
Net Realized Loss from Sales of Affiliated Funds | (1,288 | ) | (833 | ) | (15,320 | ) | ||||||
Net Change in Unrealized Appreciation from Affiliated Funds | 6,231 | 8,670 | 43,025 | |||||||||
Net Realized and Unrealized Gain from Affiliated Funds | 4,943 | 7,837 | 27,705 | |||||||||
Net Increase in Net Assets Resulting from Operations | $ | 5,374 | $ | 8,355 | $ | 28,767 | ||||||
The accompanying notes are an integral part of the financial statements.
| 26 | SEI Asset Allocation Trust / Semi-Annual Report / September 30, 2009 |
Table of Contents
| Diversified Moderate Growth Fund | Diversified Global Growth Fund | Diversified Global Stock Fund | Diversified U.S. Stock Fund | |||||||||||||
| $ | 639 | $ | 672 | $ | 67 | $ | 56 | |||||||||
| 73 | 121 | 64 | 39 | |||||||||||||
| 32 | 21 | 13 | 14 | |||||||||||||
| 36 | 60 | 32 | 20 | |||||||||||||
| 11 | 7 | 4 | 5 | |||||||||||||
| 14 | 40 | 14 | 4 | |||||||||||||
| 1 | 2 | 1 | 1 | |||||||||||||
| 9 | 12 | 6 | 3 | |||||||||||||
| 6 | 10 | 5 | 3 | |||||||||||||
| 6 | 10 | 6 | 3 | |||||||||||||
| 1 | 2 | 1 | 1 | |||||||||||||
| 1 | 2 | 1 | 1 | |||||||||||||
| 190 | 287 | 147 | 94 | |||||||||||||
| (73 | ) | (121 | ) | (64 | ) | (39 | ) | |||||||||
| (17 | ) | (26 | ) | (13 | ) | (8 | ) | |||||||||
| 100 | 140 | 70 | 47 | |||||||||||||
| 539 | 532 | (3 | ) | 9 | ||||||||||||
| (2,938 | ) | (6,114 | ) | (10,124 | ) | (1,829 | ) | |||||||||
| 19,013 | 39,784 | 30,117 | 13,343 | |||||||||||||
| 16,075 | 33,670 | 19,993 | 11,514 | |||||||||||||
| $ | 16,614 | $ | 34,202 | $ | 19,990 | $ | 11,523 | |||||||||
| SEI Asset Allocation Trust / Semi-Annual Report / September 30, 2009 | 27 |
Table of Contents
Statements of Operations ($ Thousands)
For the six months ended September 30, 2009 (Unaudited)
| Defensive Strategy Fund | Defensive Strategy Allocation Fund | Conservative Strategy Fund | ||||||||||
Investment Income: | ||||||||||||
Income Distributions from Affiliated Funds | $ | 207 | $ | 168 | $ | 1,213 | ||||||
Expenses: | ||||||||||||
Administration Fees | 44 | 9 | 110 | |||||||||
Investment Advisory Fees | 22 | 5 | 55 | |||||||||
Trustees’ Fees | 1 | — | 2 | |||||||||
Administrative Servicing Fees — Class I | — | — | 2 | |||||||||
Chief Compliance Officer Fees | — | — | — | |||||||||
Professional Fees | 4 | 1 | 10 | |||||||||
Printing Fees | 4 | 1 | 9 | |||||||||
Registration Fees | 3 | 1 | 9 | |||||||||
Custodian Fees/Wire Agent Fees | 1 | — | 2 | |||||||||
Other Expenses | 1 | — | 1 | |||||||||
Total Expenses | 80 | 17 | 200 | |||||||||
Less: | ||||||||||||
Administration Fees Waived | (44 | ) | (9 | ) | (110 | ) | ||||||
Reimbursement from Administrator | (14 | ) | (3 | ) | (34 | ) | ||||||
Net Expenses | 22 | 5 | 56 | |||||||||
Net Investment Income | 185 | 163 | 1,157 | |||||||||
Net Realized and Unrealized Gain (Loss) from Affiliated Funds: | ||||||||||||
Net Realized Gain (Loss) from Affiliated Funds | (1,190 | ) | (51 | ) | (4,563 | ) | ||||||
Net Change in Unrealized Appreciation from Affiliated Funds | 2,521 | 2,964 | 16,400 | |||||||||
Net Realized and Unrealized Gain from Affiliated Funds | 1,331 | 2,913 | 11,837 | |||||||||
Net Increase in Net Assets Resulting from Operations | $ | 1,516 | $ | 3,076 | $ | 12,994 | ||||||
Amounts Designated as “—” are $0 or have been rounded to $0.
The accompanying notes are an integral part of the financial statements.
| 28 | SEI Asset Allocation Trust / Semi-Annual Report / September 30, 2009 |
Table of Contents
| Conservative Strategy Allocation Fund | Moderate Strategy Fund | Moderate Strategy Allocation Fund | ||||||||||||||
| $ | 348 | $ | 3,131 | $ | 651 | |||||||||||
| 22 | 276 | 65 | ||||||||||||||
| 11 | 138 | 33 | ||||||||||||||
| — | 5 | 1 | ||||||||||||||
| — | 2 | — | ||||||||||||||
| — | 1 | — | ||||||||||||||
| 2 | 24 | 5 | ||||||||||||||
| 2 | 23 | 5 | ||||||||||||||
| 2 | 28 | 7 | ||||||||||||||
| — | 5 | 1 | ||||||||||||||
| 1 | 4 | 1 | ||||||||||||||
| 40 | 506 | 118 | ||||||||||||||
| (22 | ) | (276 | ) | (65 | ) | |||||||||||
| (7 | ) | (90 | ) | (21 | ) | |||||||||||
| 11 | 140 | 32 | ||||||||||||||
| 337 | 2,991 | 619 | ||||||||||||||
| 502 | (4,601 | ) | (1,149 | ) | ||||||||||||
| 6,391 | 58,055 | 19,690 | ||||||||||||||
| 6,893 | 53,454 | 18,541 | ||||||||||||||
| $ | 7,230 | $ | 56,445 | $ | 19,160 | |||||||||||
| SEI Asset Allocation Trust / Semi-Annual Report / September 30, 2009 | 29 |
Table of Contents
Statements of Operations ($ Thousands)
For the six months ended September 30, 2009 (Unaudited)
| Aggressive Strategy Fund | Tax-Managed Aggressive Strategy Fund | Core Market Strategy Fund | ||||||||||
Investment Income: | ||||||||||||
Income Distributions from Affiliated Funds | $ | 2,098 | $ | 303 | $ | 950 | ||||||
Expenses: | ||||||||||||
Administration Fees | 279 | 52 | 66 | |||||||||
Investment Advisory Fees | 140 | 26 | 33 | |||||||||
Administrative Servicing Fees — Class I | 7 | — | — | |||||||||
Trustees’ Fees | 5 | 1 | 1 | |||||||||
Chief Compliance Officer Fees | 1 | — | — | |||||||||
Registration Fees | 26 | 6 | 6 | |||||||||
Printing Fees | 23 | 4 | 6 | |||||||||
Professional Fees | 22 | 4 | 6 | |||||||||
Custodian Fees/Wire Agent Fees | 4 | 1 | 1 | |||||||||
Other Expenses | 4 | 1 | 1 | |||||||||
Total Expenses | 511 | 95 | 120 | |||||||||
Less: | ||||||||||||
Administration Fees Waived | (279 | ) | (52 | ) | (66 | ) | ||||||
Reimbursement from Administrator | (86 | ) | (17 | ) | (21 | ) | ||||||
Net Expenses | 146 | 26 | 33 | |||||||||
Net Investment Income | 1,952 | 277 | 917 | |||||||||
Net Realized and Unrealized Gain (Loss) from Affiliated Funds: | ||||||||||||
Net Realized Loss from Affiliated Funds | (29,206 | ) | (1,531 | ) | (1,473 | ) | ||||||
Net Change in Unrealized Appreciation from Affiliated Funds | 116,354 | 17,917 | 14,666 | |||||||||
Net Realized and Unrealized Gain from Affiliated Funds | 87,148 | 16,386 | 13,193 | |||||||||
Net Increase in Net Assets Resulting from Operations | $ | 89,100 | $ | 16,663 | $ | 14,110 | ||||||
Amounts Designated as “—” are $0 or have been rounded to $0.
The accompanying notes are an integral part of the financial statements.
| 30 | SEI Asset Allocation Trust / Semi-Annual Report / September 30, 2009 |
Table of Contents
Core Market Strategy | Market Growth Strategy Fund | Market Growth Strategy Allocation Fund | ||||||||||||
| $ | 98 | $ | 4,759 | $ | 534 | |||||||||
| 17 | 430 | 91 | ||||||||||||
| 8 | 215 | 46 | ||||||||||||
| — | 8 | 2 | ||||||||||||
| — | 8 | — | ||||||||||||
| — | 1 | — | ||||||||||||
| 2 | 44 | 10 | ||||||||||||
| 1 | 36 | 7 | ||||||||||||
| 2 | 36 | 8 | ||||||||||||
| — | 8 | 2 | ||||||||||||
| — | 6 | 1 | ||||||||||||
| 30 | 792 | 167 | ||||||||||||
| (17 | ) | (430 | ) | (91 | ) | |||||||||
| (5 | ) | (139 | ) | (31 | ) | |||||||||
| 8 | 223 | 45 | ||||||||||||
| 90 | 4,536 | 489 | ||||||||||||
| (290 | ) | (13,503 | ) | (1,869 | ) | |||||||||
| 5,588 | 124,189 | 30,707 | ||||||||||||
| 5,298 | 110,686 | 28,838 | ||||||||||||
| $ | 5,388 | $ | 115,222 | $ | 29,327 | |||||||||
| SEI Asset Allocation Trust / Semi-Annual Report / September 30, 2009 | 31 |
Table of Contents
Statements of Changes in Net Assets ($ Thousands)
For the six months ended September 30, 2009 (Unaudited) and the year ended March 31, 2009
| Diversified Conservative Income Fund | Diversified Conservative Fund | Diversified Global Moderate Growth Fund | ||||||||||||||||||||||
| 4/01/09 – 9/30/09 | 4/01/08 – 3/31/09 | 4/01/09 – 9/30/09 | 4/01/08 – 3/31/09 | 4/01/09 – 9/30/09 | 4/01/08 – 3/31/09 | |||||||||||||||||||
Operations: | ||||||||||||||||||||||||
Net Investment Income (Loss) | $ | 431 | $ | 1,627 | $ | 518 | $ | 2,053 | $ | 1,062 | $ | 4,566 | ||||||||||||
Net Realized Loss from Affiliated Funds | (1,288 | ) | (4,275 | ) | (833 | ) | (8,323 | ) | (15,320 | ) | (33,837 | ) | ||||||||||||
Capital Gain Distributions Received from Affiliated Funds | — | 3 | — | 5 | — | 382 | ||||||||||||||||||
Net Change in Unrealized Appreciation (Depreciation) from Affiliated Funds | 6,231 | (4,871 | ) | 8,670 | (8,673 | ) | 43,025 | (28,347 | ) | |||||||||||||||
Net Increase (Decrease) in Net Assets Resulting from Operations | 5,374 | (7,516 | ) | 8,355 | (14,938 | ) | 28,767 | (57,236 | ) | |||||||||||||||
Dividends and Distributions From: | ||||||||||||||||||||||||
Net Investment Income: | ||||||||||||||||||||||||
Class A | (240 | ) | (1,346 | ) | (293 | ) | (1,739 | ) | (564 | ) | (3,761 | ) | ||||||||||||
Class D | (30 | ) | (160 | ) | (25 | ) | (125 | ) | (9 | ) | (65 | ) | ||||||||||||
Class I | (29 | ) | (124 | ) | (39 | ) | (196 | ) | (114 | ) | (813 | ) | ||||||||||||
Net Realized Gains: | ||||||||||||||||||||||||
Class A | — | (227 | ) | — | (717 | ) | — | (3,378 | ) | |||||||||||||||
Class D | — | (39 | ) | — | (72 | ) | — | (75 | ) | |||||||||||||||
Class I | — | (23 | ) | — | (89 | ) | — | (796 | ) | |||||||||||||||
Total Dividends and Distributions | (299 | ) | (1,919 | ) | (357 | ) | (2,938 | ) | (687 | ) | (8,888 | ) | ||||||||||||
Capital Share Transactions(1): | ||||||||||||||||||||||||
Class A: | ||||||||||||||||||||||||
Proceeds from Shares Issued | 2,343 | 10,034 | 3,596 | 11,058 | 5,697 | 24,396 | ||||||||||||||||||
Reinvestment of Dividends and Distributions | 235 | 1,542 | 275 | 2,360 | 563 | 7,105 | ||||||||||||||||||
Cost of Shares Redeemed | (4,862 | ) | (17,510 | ) | (6,396 | ) | (28,761 | ) | (10,755 | ) | (38,371 | ) | ||||||||||||
Decrease in Net Assets Derived from Class A Transactions | (2,284 | ) | (5,934 | ) | (2,525 | ) | (15,343 | ) | (4,495 | ) | (6,870 | ) | ||||||||||||
Class D: | ||||||||||||||||||||||||
Proceeds from Shares Issued | 148 | 1,240 | 252 | 822 | 167 | 470 | ||||||||||||||||||
Reinvestment of Dividends and Distributions | 30 | 197 | 23 | 190 | 8 | 124 | ||||||||||||||||||
Cost of Shares Redeemed | (171 | ) | (1,029 | ) | (442 | ) | (973 | ) | (71 | ) | (2,505 | ) | ||||||||||||
Increase (Decrease) in Net Assets Derived from Class D Transactions | 7 | 408 | (167 | ) | 39 | 104 | (1,911 | ) | ||||||||||||||||
Class I: | ||||||||||||||||||||||||
Proceeds from Shares Issued | 1,109 | 2,047 | 876 | 2,307 | 2,488 | 6,955 | ||||||||||||||||||
Reinvestment of Dividends and Distributions | 29 | 147 | 39 | 281 | 115 | 1,603 | ||||||||||||||||||
Cost of Shares Redeemed | (317 | ) | (2,547 | ) | (1,066 | ) | (2,543 | ) | (3,896 | ) | (7,915 | ) | ||||||||||||
Increase (Decrease) in Net Assets Derived From Class I Transactions | 821 | (353 | ) | (151 | ) | 45 | (1,293 | ) | 643 | |||||||||||||||
Decrease in Net Assets Derived from Capital Share Transactions | (1,456 | ) | (5,879 | ) | (2,843 | ) | (15,259 | ) | (5,684 | ) | (8,138 | ) | ||||||||||||
Net Increase (Decrease) in Net Assets | 3,619 | (15,314 | ) | 5,155 | (33,135 | ) | 22,396 | (74,262 | ) | |||||||||||||||
Net Assets: | ||||||||||||||||||||||||
Beginning of Period | 39,985 | 55,299 | 42,524 | 75,659 | 102,650 | 176,912 | ||||||||||||||||||
End of Period | $ | 43,604 | $ | 39,985 | $ | 47,679 | $ | 42,524 | $ | 125,046 | $ | 102,650 | ||||||||||||
Undistributed (Distributions in Excess of) Net Investment Income Included in Net Assets at End of Period | $ | 147 | $ | 15 | $ | 176 | $ | 15 | $ | 405 | $ | 30 | ||||||||||||
| (1) | For Capital Share Transactions see footnote 4 in the notes to financial statements. |
Amounts designated as “—” are $0 or have been rounded to $0.
The accompanying notes are an integral part of the financial statements.
| 32 | SEI Asset Allocation Trust / Semi-Annual Report / September 30, 2009 |
Table of Contents
| Diversified Moderate Growth Fund | Diversified Global Growth Fund | Diversified Global Stock Fund | Diversified U.S. Stock Fund | |||||||||||||||||||||||||||
| 4/01/09 – 9/30/09 | 4/01/08 – 3/31/09 | 4/01/09 – 9/30/09 | 4/01/08 – 3/31/09 | 4/01/09 – 9/30/09 | 4/01/08 – 3/31/09 | 4/01/09 – 9/30/09 | 4/01/08 – 3/31/09 | |||||||||||||||||||||||
| $ | 539 | $ | 3,123 | $ | 532 | $ | 3,446 | $ | (3 | ) | $ | 944 | $ | 9 | $ | 494 | ||||||||||||||
| (2,938 | ) | (28,482 | ) | (6,114 | ) | (27,533 | ) | (10,124 | ) | (10,665 | ) | (1,829 | ) | (2,824 | ) | |||||||||||||||
| — | | 13 | | — | 684 | — | 311 | — | 11 | |||||||||||||||||||||
| 19,013 | | (15,182 | ) | 39,784 | (56,061 | ) | 30,117 | (36,115 | ) | 13,343 | (22,815 | ) | ||||||||||||||||||
| 16,614 | | (40,528 | ) | 34,202 | (79,464 | ) | 19,990 | (45,525 | ) | 11,523 | (25,134 | ) | ||||||||||||||||||
| (303 | ) | (2,580 | ) | (281 | ) | (2,651 | ) | (31 | ) | (776 | ) | (31 | ) | (440 | ) | |||||||||||||||
| (28 | ) | (200 | ) | (5 | ) | (83 | ) | — | (24 | ) | — | (21 | ) | |||||||||||||||||
| (55 | ) | (362 | ) | (88 | ) | (753 | ) | (1 | ) | (148 | ) | (1 | ) | (36 | ) | |||||||||||||||
| — | (2,352 | ) | — | (5,466 | ) | — | — | — | — | |||||||||||||||||||||
| — | (298 | ) | — | (310 | ) | — | — | — | — | |||||||||||||||||||||
| — | (393 | ) | — | (1,753 | ) | — | — | — | — | |||||||||||||||||||||
| (386 | ) | (6,185 | ) | (374 | ) | (11,016 | ) | (32 | ) | (948 | ) | (32 | ) | (497 | ) | |||||||||||||||
| 5,420 | 14,567 | 6,148 | 26,069 | 6,335 | 20,455 | 3,677 | 7,843 | |||||||||||||||||||||||
| 302 | 4,843 | 280 | 8,091 | 29 | 732 | 30 | 431 | |||||||||||||||||||||||
| (11,592 | ) | (79,432 | ) | (15,371 | ) | (61,734 | ) | (8,221 | ) | (27,062 | ) | (4,310 | ) | (13,527 | ) | |||||||||||||||
| (5,870) | | (60,022 | ) | (8,943 | ) | (27,574 | ) | (1,857 | ) | (5,875 | ) | (603 | ) | (5,253 | ) | |||||||||||||||
| 554 | 1,362 | 381 | 1,111 | 223 | 1,051 | 282 | 863 | |||||||||||||||||||||||
| 27 | 472 | 5 | 375 | — | 24 | — | 20 | |||||||||||||||||||||||
| (393 | ) | (3,494 | ) | (260 | ) | (1,857 | ) | (263 | ) | (1,087 | ) | (390 | ) | (1,624 | ) | |||||||||||||||
| 188 | | (1,660 | ) | 126 | (371 | ) | (40 | ) | (12 | ) | (108 | ) | (741 | ) | ||||||||||||||||
| 1,365 | 4,248 | 3,505 | 10,074 | 1,510 | 6,810 | 695 | 1,207 | |||||||||||||||||||||||
| 55 | 744 | 88 | 2,495 | 1 | 144 | 1 | 36 | |||||||||||||||||||||||
| (1,630 | ) | (5,174 | ) | (4,411 | ) | (12,320 | ) | (1,595 | ) | (5,990 | ) | (415 | ) | (1,150 | ) | |||||||||||||||
| (210) | | (182 | ) | (818 | ) | 249 | (84 | ) | 964 | 281 | 93 | |||||||||||||||||||
| (5,892) | | (61,864 | ) | (9,635 | ) | (27,696 | ) | (1,981 | ) | (4,923 | ) | (430 | ) | (5,901 | ) | |||||||||||||||
| 10,336 | (108,577 | ) | 24,193 | (118,176 | ) | 17,977 | (51,396 | ) | 11,061 | (31,532 | ) | |||||||||||||||||||
| 67,528 | 176,105 | 107,650 | 225,826 | 53,629 | 105,025 | 33,065 | 64,597 | |||||||||||||||||||||||
| $ | 77,864 | $ | 67,528 | $ | 131,843 | $ | 107,650 | $ | 71,606 | $ | 53,629 | $ | 44,126 | $ | 33,065 | |||||||||||||||
| $ | 170 | $ | 17 |
| $ | 174 | $ | 16 | $ | (35 | ) | $ | — | $ | (23 | ) | $ | — | ||||||||||||
| SEI Asset Allocation Trust / Semi-Annual Report / September 30, 2009 | 33 |
Table of Contents
Statements of Changes in Net Assets ($ Thousands)
For the six months ended September 30, 2009 (Unaudited) and the year ended March 31, 2009
Defensive Strategy Fund | Defensive Strategy Allocation Fund | |||||||||||||||
| 4/01/09 – 9/30/09 | 4/01/08 – 3/31/09 | 4/01/09 – 9/30/09 | 4/01/08 – 3/31/09 | |||||||||||||
Operations: | ||||||||||||||||
Net Investment Income | $ | 185 | $ | 1,269 | $ | 163 | $ | 696 | ||||||||
Net Realized Gain (Loss) from Affiliated Funds | (1,190 | ) | (1,673 | ) | (51 | ) | (4,310 | ) | ||||||||
Capital Gain Distributions Received from Affiliated Funds | — | 33 | — | 75 | ||||||||||||
Net Change in Unrealized Appreciation (Depreciation) from Affiliated Funds | 2,521 | (1,570 | ) | 2,964 | (2,720 | ) | ||||||||||
Net Increase (Decrease) in Net Assets Resulting from Operations | 1,516 | (1,941 | ) | 3,076 | (6,259 | ) | ||||||||||
Dividends and Distributions From: | ||||||||||||||||
Net Investment Income: | ||||||||||||||||
Class A | (121 | ) | (1,312 | ) | (89 | ) | (771 | ) | ||||||||
Class I | — | — | N/A | N/A | ||||||||||||
Net Realized Gains: | ||||||||||||||||
Class A | — | — | — | (259 | ) | |||||||||||
Class I | — | — | N/A | N/A | ||||||||||||
Total Dividends and Distributions | (121 | ) | (1,312 | ) | (89 | ) | (1,030 | ) | ||||||||
Capital Share Transactions(1): | ||||||||||||||||
Class A: | ||||||||||||||||
Proceeds from Shares Issued | 5,472 | 40,482 | 926 | 12,560 | ||||||||||||
Reinvestment of Dividends and Distributions | 114 | 1,240 | 85 | 955 | ||||||||||||
Cost of Shares Redeemed | (15,399 | ) | (40,045 | ) | (3,129 | ) | (14,794 | ) | ||||||||
Increase (Decrease) in Net Assets Derived from Class A Transactions | (9,813 | ) | 1,677 | (2,118 | ) | (1,279 | ) | |||||||||
Class I: | ||||||||||||||||
Proceeds from Shares Issued | — | — | N/A | N/A | ||||||||||||
Reinvestment of Dividends and Distributions | — | — | N/A | N/A | ||||||||||||
Cost of Shares Redeemed | — | — | N/A | N/A | ||||||||||||
Increase in Net Assets Derived from Class I Transactions | — | — | N/A | N/A | ||||||||||||
Increase (Decrease) in Net Assets Derived from Capital Share Transactions | (9,813 | ) | 1,677 | (2,118 | ) | (1,279 | ) | |||||||||
Net Increase (Decrease) in Net Assets | (8,418 | ) | (1,576 | ) | 869 | (8,568 | ) | |||||||||
Net Assets: | ||||||||||||||||
Beginning of Period | 49,707 | 51,283 | 8,559 | 17,127 | ||||||||||||
End of Period | $ | 41,289 | $ | 49,707 | $ | 9,428 | $ | 8,559 | ||||||||
Undistributed Net Investment Income Included in Net Assets at End of Period | $ | 71 | $ | 7 | $ | 79 | $ | 5 | ||||||||
| (1) | For Capital Share Transactions see footnote 4 in the notes to financial statements. |
Amounts designated as “—” are $0 or have been rounded to $0.
N/A — Not applicable. Class I shares currently not offered.
The accompanying notes are an integral part of the financial statements.
| 34 | SEI Asset Allocation Trust / Semi-Annual Report / September 30, 2009 |
Table of Contents
Conservative Strategy Fund | Conservative Strategy Allocation Fund | Moderate Strategy Fund | Moderate Strategy Allocation Fund | |||||||||||||||||||||||||||
| 4/01/09 – 9/30/09 | 4/01/08 – 3/31/09 | 4/01/09 – 9/30/09 | 4/01/08 – 3/31/09 | 4/01/09 – 9/30/09 | 4/01/08 – 3/31/09 | 4/01/09 – 9/30/09 | 4/01/08 – 3/31/09 | |||||||||||||||||||||||
| $ | 1,157 | $ | 4,533 | $ | 337 | $ | 1,479 | $ | 2,991 | $ | 14,443 | $ | 619 | $ | 2,856 | |||||||||||||||
| (4,563 | ) | (12,528 | ) | 502 | (11,050 | ) | (4,601 | ) | (81,322 | ) | (1,149 | ) | (20,130 | ) | ||||||||||||||||
| — | 185 | — | 101 | — | 671 | — | 175 | |||||||||||||||||||||||
| 16,400 |
| (16,946 | ) | 6,391 | (4,106 | ) | 58,055 | (46,216 | ) | 19,690 | (22,806 | ) | ||||||||||||||||||
| | 12,994 | | (24,756 | ) | 7,230 | (13,576 | ) | 56,445 | (112,424 | ) | 19,160 | (39,905 | ) | |||||||||||||||||
| (665 | ) | (4,673 | ) | (173 | ) | (1,582 | ) | (1,893 | ) | (15,089 | ) | (376 | ) | (3,031 | ) | |||||||||||||||
| (8 | ) | (45 | ) | N/A | N/A | (8 | ) | (43 | ) | N/A | N/A | |||||||||||||||||||
| — | — | — | (553 | ) | — | (1,807 | ) | — | (1,432 | ) | ||||||||||||||||||||
| — | — | N/A | N/A | — | (5 | ) | N/A | N/A | ||||||||||||||||||||||
| (673 | ) | (4,718 | ) | (173 | ) | (2,135 | ) | (1,901 | ) | (16,944 | ) | (376 | ) | (4,463 | ) | |||||||||||||||
| 14,650 | 95,455 | 4,849 | 28,275 | 29,258 | 93,801 | 6,549 | 65,914 | |||||||||||||||||||||||
| 640 | 4,481 | 153 | 1,923 | 1,838 | 16,475 | 350 | 4,202 | |||||||||||||||||||||||
| (24,767 | ) | (94,551 | ) | (3,759 | ) | (39,141 | ) | (36,717 | ) | (210,446 | ) | (11,447 | ) | (89,508 | ) | |||||||||||||||
| (9,477 | ) |
| 5,385 |
| 1,243 | (8,943 | ) | (5,621 | ) | (100,170 | ) | (4,548 | ) | (19,392 | ) | |||||||||||||||
| 318 | 788 | N/A | N/A | 295 | 944 | N/A | N/A | |||||||||||||||||||||||
| 8 | 45 | N/A | N/A | 8 | 48 | N/A | N/A | |||||||||||||||||||||||
| (164 | ) | (649 | ) | N/A | N/A | (266 | ) | (772 | ) | N/A | N/A | |||||||||||||||||||
| 162 | 184 | N/A | N/A | 37 | 220 | N/A | N/A | |||||||||||||||||||||||
| (9,315 | ) |
| 5,569 |
| 1,243 | (8,943 | ) | (5,584 | ) | (99,950 | ) | (4,548 | ) | (19,392 | ) | |||||||||||||||
| 3,006 | (23,905 | ) | 8,300 | (24,654 | ) | 48,960 | (229,318 | ) | 14,236 | (63,760 | ) | |||||||||||||||||||
| 107,303 |
| 131,208 |
| 17,248 | 41,902 | 249,705 | 479,023 | 56,605 | 120,365 | |||||||||||||||||||||
| $ | 110,309 | $ | 107,303 | $ | 25,548 | $ | 17,248 | $ | 298,665 | $ | 249,705 | $ | 70,841 | $ | 56,605 | |||||||||||||||
| $ | 518 | $ | 34 |
| $ | 173 | $ | 9 | $ | 1,170 | $ | 80 | $ | 256 | $ | 13 | ||||||||||||||
| SEI Asset Allocation Trust / Semi-Annual Report / September 30, 2009 | 35 |
Table of Contents
Statements of Changes in Net Assets ($ Thousands)
For the six months ended September 30, 2009 (Unaudited) and the year ended March 31, 2009
Aggressive Strategy Fund | Tax-Managed Aggressive Strategy | |||||||||||||||
| 4/01/09 – 9/30/09 | 4/01/08 – 3/31/09 | 4/01/09 – 9/30/09 | 4/01/08 – 3/31/09 | |||||||||||||
Operations: | ||||||||||||||||
Net Investment Income | $ | 1,952 | $ | 9,835 | $ | 277 | $ | 1,926 | ||||||||
Net Realized Loss from Affiliated Funds | (29,206 | ) | (56,170 | ) | (1,531 | ) | (24,948 | ) | ||||||||
Capital Gain Distributions Received from Affiliated Funds | — | 1,774 | — | 392 | ||||||||||||
Net Change in Unrealized Appreciation (Depreciation) from Affiliated Funds | 116,354 | (132,871 | ) | 17,917 | (12,243 | ) | ||||||||||
Net Increase (Decrease) in Net Assets Resulting from Operations | 89,100 | (177,432 | ) | 16,663 | (34,873 | ) | ||||||||||
Dividends and Distributions From: | ||||||||||||||||
Net Investment Income: | ||||||||||||||||
Class A | (1,197 | ) | (10,115 | ) | (197 | ) | (1,981 | ) | ||||||||
Class I | (21 | ) | (106 | ) | N/A | N/A | ||||||||||
Net Realized Gains: | ||||||||||||||||
Class A | — | (14,041 | ) | — | (149 | ) | ||||||||||
Class I | — | (155 | ) | N/A | N/A | |||||||||||
Total Dividends and Distributions | (1,218 | ) | (24,417 | ) | (197 | ) | (2,130 | ) | ||||||||
Capital Share Transactions(1): | ||||||||||||||||
Class A: | ||||||||||||||||
Proceeds from Shares Issued | 35,654 | 193,303 | 3,940 | 96,200 | ||||||||||||
Reinvestment of Dividends and Distributions | 1,173 | 23,722 | 192 | 2,074 | ||||||||||||
Cost of Shares Redeemed | (36,715 | ) | (203,135 | ) | (10,593 | ) | (104,998 | ) | ||||||||
Increase (Decrease) in Net Assets Derived from Class A Transactions | 112 | 13,890 | (6,461 | ) | (6,724 | ) | ||||||||||
Class I: | ||||||||||||||||
Proceeds from Shares Issued | 2,751 | 3,326 | N/A | N/A | ||||||||||||
Reinvestment of Dividends and Distributions | 21 | 261 | N/A | N/A | ||||||||||||
Cost of Shares Redeemed | (411 | ) | (3,656 | ) | N/A | N/A | ||||||||||
Increase (Decrease) in Net Assets Derived from Class I Transactions | 2,361 | (69 | ) | N/A | N/A | |||||||||||
Increase (Decrease) in Net Assets Derived from Capital Share Transactions | 2,473 | 13,821 | (6,461 | ) | (6,724 | ) | ||||||||||
Net Increase (Decrease) in Net Assets | 90,355 | (188,028 | ) | 10,005 | (43,727 | ) | ||||||||||
Net Assets: | ||||||||||||||||
Beginning of Period | 227,337 | 415,365 | 45,280 | 89,007 | ||||||||||||
End of Period | $ | 317,692 | $ | 227,337 | $ | 55,285 | $ | 45,280 | ||||||||
Undistributed Net Investment Income Included in Net Assets at End of Period | $ | 774 | $ | 40 | $ | 85 | $ | 5 | ||||||||
| (1) | For Capital Share Transactions see footnote 4 in the notes to financial statements. |
Amounts designated as “—” are $0 or have been rounded to $0.
N/A — Not applicable. Class I shares currently not offered.
The accompanying notes are an integral part of the financial statements.
| 36 | SEI Asset Allocation Trust / Semi-Annual Report / September 30, 2009 |
Table of Contents
Core Market Strategy Fund | Core Market Strategy Allocation Fund | Market Growth Strategy Fund | Market Growth Strategy Allocation Fund | |||||||||||||||||||||||||||
| 4/01/09 – 9/30/09 | 4/01/08 – 3/31/09 | 4/01/09 – 9/30/09 | 4/01/08 – 3/31/09 | 4/01/09 – 9/30/09 | 4/01/08 – 3/31/09 | 4/01/09 – 9/30/09 | 4/01/08 – 3/31/09 | |||||||||||||||||||||||
| $ | 917 | $ | 3,390 | $ | 90 | $ | 519 | $ | 4,536 | $ | 20,286 | $ | 489 | $ | 3,472 | |||||||||||||||
| (1,473 | ) | (12,331 | ) | (290 | ) | (6,780 | ) | (13,503 | ) | (112,660 | ) | (1,869 | ) | (44,635 | ) | |||||||||||||||
| — | 230 | — | 118 | — | 1,752 | — | 668 | |||||||||||||||||||||||
| 14,666 | (14,020 | ) | 5,588 | (4,179 | ) | 124,189 | (142,466 | ) | 30,707 | (25,945 | ) | |||||||||||||||||||
| 14,110 | (22,731 | ) | 5,388 | (10,322 | ) | 115,222 | (233,088 | ) | 29,327 | (66,440 | ) | |||||||||||||||||||
| (581 | ) | (3,447 | ) | (63 | ) | (535 | ) | (2,806 | ) | (20,672 | ) | (346 | ) | (3,562 | ) | |||||||||||||||
| — | — | N/A | N/A | (37 | ) | (173 | ) | N/A | N/A | |||||||||||||||||||||
| — | (1,891 | ) | — | (406 | ) | — | (17,260 | ) | — | (2,633 | ) | |||||||||||||||||||
| — | — | N/A | N/A | — | (143 | ) | N/A | N/A | ||||||||||||||||||||||
| (581 | ) | (5,338 | ) | (63 | ) | (941 | ) | (2,843 | ) | (38,248 | ) | (346 | ) | (6,195 | ) | |||||||||||||||
| 9,752 | 38,563 | 1,103 | 34,611 | 45,903 | 256,727 | 6,047 | 168,530 | |||||||||||||||||||||||
| 575 | 5,273 | 62 | 877 | 2,747 | 37,316 | 329 | 5,960 | |||||||||||||||||||||||
| (9,149 | ) | (63,137 | ) | (2,211 | ) | (31,343 | ) | (65,167 | ) | (372,564 | ) | (16,862 | ) | (187,971 | ) | |||||||||||||||
| 1,178 | (19,301 | ) | (1,046 | ) | 4,145 | (16,517 | ) | (78,521 | ) | (10,486 | ) | (13,481 | ) | |||||||||||||||||
| — | — | N/A | N/A | 1,594 | 4,658 | N/A | N/A | |||||||||||||||||||||||
| — | — | N/A | N/A | 37 | 316 | N/A | N/A | |||||||||||||||||||||||
| — | — | N/A | N/A | (956 | ) | (4,790 | ) | N/A | N/A | |||||||||||||||||||||
| — | — | N/A | N/A | 675 | 184 | N/A | N/A | |||||||||||||||||||||||
| 1,178 | (19,301 | ) | (1,046 | ) | 4,145 | (15,842 | ) | (78,337 | ) | (10,486 | ) | (13,481 | ) | |||||||||||||||||
| 14,707 | (47,370 | ) | 4,279 | (7,118 | ) | 96,537 | (349,673 | ) | 18,495 | (86,116 | ) | |||||||||||||||||||
| 58,877 | 106,247 | 14,278 | 21,396 | 375,099 | 724,772 | 80,428 | 166,544 | |||||||||||||||||||||||
| $ | 73,584 | $ | 58,877 | $ | 18,557 | $ | 14,278 | $ | 471,636 | $ | 375,099 | $ | 98,923 | $ | 80,428 | |||||||||||||||
| $ | 361 | $ | 25 | $ | 29 | $ | 2 | $ | 1,804 | $ | 111 | $ | 152 | $ | 9 | |||||||||||||||
| SEI Asset Allocation Trust / Semi-Annual Report / September 30, 2009 | 37 |
Table of Contents
For the six months ended September 30, 2009 (Unaudited) and the years ended March 31,
For a Share Outstanding Throughout each Period
| Net Asset Value, Beginning of Year | Net Investment Income* | Net Realized and Unrealized Gains (Losses) from Affiliated Funds* | Total from Operations | Dividends from Net Investment Income | Distributions from Realized Capital Gains | Total Dividends and Distributions | Net Asset Value, End of Year | Total Return† | Net Assets End of Year ($ Thousands) | Ratio of Net Expenses to Average Net Assets** | Ratio of Net Investment Income to Average Net Assets | Ratio of Expenses | Portfolio Turnover Rate | ||||||||||||||||||||||||||||||||||
Diversified Conservative Income Fund |
| ||||||||||||||||||||||||||||||||||||||||||||||
Class A | |||||||||||||||||||||||||||||||||||||||||||||||
2009@ | $ | 8.74 | $ | 0.11 | $ | 1.12 | $ | 1.23 | $ | (0.07 | ) | $ | — | $ | (0.07 | ) | $ | 9.90 | 14.16 | % | $ | 33,055 | 0.12 | % | 2.25 | % | 0.36 | % | 99 | % | |||||||||||||||||
2009 | 10.75 | 0.36 | (1.95 | ) | (1.59 | ) | (0.36 | ) | (0.06 | ) | (0.42 | ) | 8.74 | (14.94 | ) | 31,430 | 0.12 | 3.61 | 0.35 | 87 | |||||||||||||||||||||||||||
2008 | 11.35 | 0.44 | (0.48 | ) | (0.04 | ) | (0.49 | ) | (0.07 | ) | (0.56 | ) | 10.75 | (0.41 | ) | 44,804 | 0.12 | 3.89 | 0.34 | 20 | |||||||||||||||||||||||||||
2007 | 11.28 | 0.43 | 0.36 | 0.79 | (0.46 | ) | (0.26 | ) | (0.72 | ) | 11.35 | 7.21 | 47,155 | 0.12 | 3.76 | 0.35 | 17 | ||||||||||||||||||||||||||||||
2006 | 11.07 | 0.34 | 0.29 | 0.63 | (0.35 | ) | (0.07 | ) | (0.42 | ) | 11.28 | 5.70 | 56,119 | 0.12 | 3.04 | 0.36 | 41 | ||||||||||||||||||||||||||||||
2005 | 11.22 | 0.27 | 0.02 | 0.29 | (0.32 | ) | (0.12 | ) | (0.44 | ) | 11.07 | 2.62 | 57,892 | 0.12 | 2.40 | 0.41 | 27 | ||||||||||||||||||||||||||||||
Class D | |||||||||||||||||||||||||||||||||||||||||||||||
2009@ | $ | 8.68 | $ | 0.06 | $ | 1.12 | $ | 1.18 | $ | (0.05 | ) | $ | — | $ | (0.05 | ) | $ | 9.81 | 13.61 | % | $ | 6,197 | 1.12 | % | 1.25 | % | 1.36 | % | 99 | % | |||||||||||||||||
2009 | 10.68 | 0.26 | (1.94 | ) | (1.68 | ) | (0.26 | ) | (0.06 | ) | (0.32 | ) | 8.68 | (15.81 | ) | 5,485 | 1.12 | 2.64 | 1.35 | 87 | |||||||||||||||||||||||||||
2008 | 11.28 | 0.32 | (0.47 | ) | (0.15 | ) | (0.38 | ) | (0.07 | ) | (0.45 | ) | 10.68 | (1.40 | ) | 6,298 | 1.12 | 2.89 | 1.34 | 20 | |||||||||||||||||||||||||||
2007 | 11.21 | 0.31 | 0.36 | 0.67 | (0.34 | ) | (0.26 | ) | (0.60 | ) | 11.28 | 6.17 | 7,258 | 1.12 | 2.77 | 1.35 | 17 | ||||||||||||||||||||||||||||||
2006 | 11.01 | 0.22 | 0.28 | 0.50 | (0.23 | ) | (0.07 | ) | (0.30 | ) | 11.21 | 4.53 | 8,453 | 1.12 | 2.02 | 1.36 | 41 | ||||||||||||||||||||||||||||||
2005 | 11.13 | 0.15 | 0.03 | 0.18 | (0.18 | ) | (0.12 | ) | (0.30 | ) | 11.01 | 1.63 | 12,177 | 1.12 | 1.39 | 1.41 | 27 | ||||||||||||||||||||||||||||||
Class I | |||||||||||||||||||||||||||||||||||||||||||||||
2009@ | $ | 8.73 | $ | 0.09 | $ | 1.12 | $ | 1.21 | $ | (0.07 | ) | $ | — | $ | (0.07 | ) | $ | 9.87 | 13.88 | % | $ | 4,352 | 0.37 | % | 1.99 | % | 0.61 | % | 99 | % | |||||||||||||||||
2009 | 10.73 | 0.33 | (1.93 | ) | (1.60 | ) | (0.34 | ) | (0.06 | ) | (0.40 | ) | 8.73 | (15.09 | ) | 3,070 | 0.37 | 3.38 | 0.60 | 87 | |||||||||||||||||||||||||||
2008 | 11.33 | 0.41 | (0.48 | ) | (0.07 | ) | (0.46 | ) | (0.07 | ) | (0.53 | ) | 10.73 | (0.67 | ) | 4,197 | 0.37 | 3.63 | 0.59 | 20 | |||||||||||||||||||||||||||
2007 | 11.26 | 0.40 | 0.36 | 0.76 | (0.43 | ) | (0.26 | ) | (0.69 | ) | 11.33 | 6.96 | 4,739 | 0.37 | 3.51 | 0.60 | 17 | ||||||||||||||||||||||||||||||
2006 | 11.06 | 0.32 | 0.27 | 0.59 | (0.32 | ) | (0.07 | ) | (0.39 | ) | 11.26 | 5.36 | 4,165 | 0.37 | 2.79 | 0.61 | 41 | ||||||||||||||||||||||||||||||
2005 | 11.20 | 0.24 | 0.03 | 0.27 | (0.29 | ) | (0.12 | ) | (0.41 | ) | 11.06 | 2.41 | 3,660 | 0.37 | 2.16 | 0.66 | 27 | ||||||||||||||||||||||||||||||
Diversified Conservative Fund |
| ||||||||||||||||||||||||||||||||||||||||||||||
Class A | |||||||||||||||||||||||||||||||||||||||||||||||
2009@ | $ | 7.25 | $ | 0.10 | $ | 1.40 | $ | 1.50 | $ | (0.07 | ) | $ | — | $ | (0.07 | ) | $ | 8.68 | 20.73 | % | $ | 38,336 | 0.12 | % | 2.42 | % | 0.36 | % | 96 | % | |||||||||||||||||
2009 | 10.06 | 0.33 | (2.65 | ) | (2.32 | ) | (0.34 | ) | (0.15 | ) | (0.49 | ) | 7.25 | (23.40 | ) | 34,445 | 0.12 | 3.69 | 0.35 | 91 | |||||||||||||||||||||||||||
2008 | 11.03 | 0.38 | (0.60 | ) | (0.22 | ) | (0.50 | ) | (0.25 | ) | (0.75 | ) | 10.06 | (2.28 | ) | 64,565 | 0.12 | 3.49 | 0.34 | 24 | |||||||||||||||||||||||||||
2007 | 10.97 | 0.37 | 0.57 | 0.94 | (0.41 | ) | (0.47 | ) | (0.88 | ) | 11.03 | 8.79 | 80,537 | 0.12 | 3.34 | 0.35 | 32 | ||||||||||||||||||||||||||||||
2006 | 10.48 | 0.30 | 0.55 | 0.85 | (0.30 | ) | (0.06 | ) | (0.36 | ) | 10.97 | 8.21 | 94,597 | 0.12 | 2.80 | 0.36 | 43 | ||||||||||||||||||||||||||||||
2005 | 10.50 | 0.27 | 0.14 | 0.41 | (0.31 | ) | (0.12 | ) | (0.43 | ) | 10.48 | 3.93 | 92,261 | 0.12 | 2.55 | 0.41 | 18 | ||||||||||||||||||||||||||||||
Class D | |||||||||||||||||||||||||||||||||||||||||||||||
2009@ | $ | 7.24 | $ | 0.06 | $ | 1.39 | $ | 1.45 | $ | (0.05 | ) | $ | — | $ | (0.05 | ) | $ | 8.64 | 20.03 | % | $ | 4,319 | 1.12 | % | 1.42 | % | 1.36 | % | 96 | % | |||||||||||||||||
2009 | 10.03 | 0.24 | (2.63 | ) | (2.39 | ) | (0.25 | ) | (0.15 | ) | (0.40 | ) | 7.24 | (24.06 | ) | 3,757 | 1.12 | 2.77 | 1.35 | 91 | |||||||||||||||||||||||||||
2008 | 11.01 | 0.27 | (0.61 | ) | (0.34 | ) | (0.39 | ) | (0.25 | ) | (0.64 | ) | 10.03 | (3.37 | ) | 5,099 | 1.12 | 2.50 | 1.34 | 24 | |||||||||||||||||||||||||||
2007 | 10.96 | 0.26 | 0.56 | 0.82 | (0.30 | ) | (0.47 | ) | (0.77 | ) | 11.01 | 7.62 | 6,559 | 1.12 | 2.34 | 1.35 | 32 | ||||||||||||||||||||||||||||||
2006 | 10.47 | 0.19 | 0.56 | 0.75 | (0.20 | ) | (0.06 | ) | (0.26 | ) | 10.96 | 7.15 | 8,942 | 1.12 | 1.80 | 1.36 | 43 | ||||||||||||||||||||||||||||||
2005 | 10.46 | 0.16 | 0.15 | 0.31 | (0.18 | ) | (0.12 | ) | (0.30 | ) | 10.47 | 2.96 | 9,062 | 1.12 | 1.53 | 1.41 | 18 | ||||||||||||||||||||||||||||||
Class I | |||||||||||||||||||||||||||||||||||||||||||||||
2009@ | $ | 7.24 | $ | 0.09 | $ | 1.38 | $ | 1.47 | $ | (0.06 | ) | $ | — | $ | (0.06 | ) | $ | 8.65 | 20.41 | % | $ | 5,024 | 0.37 | % | 2.17 | % | 0.61 | % | 96 | % | |||||||||||||||||
2009 | 10.04 | 0.31 | (2.64 | ) | (2.33 | ) | (0.32 | ) | (0.15 | ) | (0.47 | ) | 7.24 | (23.54 | ) | 4,322 | 0.37 | 3.54 | 0.60 | 91 | |||||||||||||||||||||||||||
2008 | 11.02 | 0.35 | (0.61 | ) | (0.26 | ) | (0.47 | ) | (0.25 | ) | (0.72 | ) | 10.04 | (2.63 | ) | 5,995 | 0.37 | 3.23 | 0.59 | 24 | |||||||||||||||||||||||||||
2007 | 10.96 | 0.34 | 0.57 | 0.91 | (0.38 | ) | (0.47 | ) | (0.85 | ) | 11.02 | 8.54 | 8,010 | 0.37 | 3.12 | 0.60 | 32 | ||||||||||||||||||||||||||||||
2006 | 10.47 | 0.27 | 0.56 | 0.83 | (0.28 | ) | (0.06 | ) | (0.34 | ) | 10.96 | 7.95 | 7,250 | 0.37 | 2.54 | 0.61 | 43 | ||||||||||||||||||||||||||||||
2005 | 10.49 | 0.24 | 0.14 | 0.38 | (0.28 | ) | (0.12 | ) | (0.40 | ) | 10.47 | 3.62 | 7,571 | 0.37 | 2.31 | 0.66 | 18 | ||||||||||||||||||||||||||||||
Diversified Global Moderate Growth Fund |
| ||||||||||||||||||||||||||||||||||||||||||||||
Class A | |||||||||||||||||||||||||||||||||||||||||||||||
2009@ | $ | 6.88 | $ | 0.08 | $ | 1.91 | $ | 1.99 | $ | (0.05 | ) | $ | — | $ | (0.05 | ) | $ | 8.82 | 29.00 | % | $ | 99,065 | 0.12 | % | 1.90 | % | 0.36 | % | 70 | % | |||||||||||||||||
2009 | 10.99 | 0.29 | (3.82 | ) | (3.53 | ) | (0.30 | ) | (0.28 | ) | (0.58 | ) | 6.88 | (32.59 | ) | 81,133 | 0.12 | 3.17 | 0.35 | 96 | |||||||||||||||||||||||||||
2008 | 12.38 | 0.37 | (0.93 | ) | (0.56 | ) | (0.56 | ) | (0.27 | ) | (0.83 | ) | 10.99 | (4.94 | ) | 140,606 | 0.12 | 2.99 | 0.34 | 25 | |||||||||||||||||||||||||||
2007 | 11.96 | 0.35 | 0.87 | 1.22 | (0.42 | ) | (0.38 | ) | (0.80 | ) | 12.38 | 10.44 | 168,886 | 0.12 | 2.86 | 0.34 | 28 | ||||||||||||||||||||||||||||||
2006 | 10.92 | 0.27 | 1.09 | 1.36 | (0.27 | ) | (0.05 | ) | (0.32 | ) | 11.96 | 12.64 | 178,977 | 0.12 | 2.40 | 0.36 | 58 | ||||||||||||||||||||||||||||||
2005 | 11.12 | 0.25 | 0.41 | 0.66 | (0.30 | ) | (0.56 | ) | (0.86 | ) | 10.92 | 5.99 | 158,229 | 0.12 | 2.24 | 0.41 | 24 | ||||||||||||||||||||||||||||||
Class D | |||||||||||||||||||||||||||||||||||||||||||||||
2009@ | $ | 6.81 | $ | 0.04 | $ | 1.89 | $ | 1.93 | $ | (0.03 | ) | $ | — | $ | (0.03 | ) | $ | 8.71 | 28.38 | % | $ | 2,732 | 1.12 | % | 0.90 | % | 1.36 | % | 70 | % | |||||||||||||||||
2009 | 10.87 | 0.19 | (3.77 | ) | (3.58 | ) | (0.20 | ) | (0.28 | ) | (0.48 | ) | 6.81 | (33.24 | ) | 2,049 | 1.12 | 2.01 | 1.35 | 96 | |||||||||||||||||||||||||||
2008 | 12.26 | 0.25 | (0.92 | ) | (0.67 | ) | (0.45 | ) | (0.27 | ) | (0.72 | ) | 10.87 | (5.90 | ) | 5,325 | 1.12 | 2.09 | 1.34 | 25 | |||||||||||||||||||||||||||
2007 | 11.85 | 0.23 | 0.85 | 1.08 | (0.29 | ) | (0.38 | ) | (0.67 | ) | 12.26 | 9.32 | 4,739 | 1.12 | 1.89 | 1.34 | 28 | ||||||||||||||||||||||||||||||
2006 | 10.82 | 0.16 | 1.07 | 1.23 | (0.15 | ) | (0.05 | ) | (0.20 | ) | 11.85 | 11.51 | 7,674 | 1.12 | 1.38 | 1.36 | 58 | ||||||||||||||||||||||||||||||
2005 | 11.00 | 0.14 | 0.40 | 0.54 | (0.16 | ) | (0.56 | ) | (0.72 | ) | 10.82 | 4.96 | 8,347 | 1.12 | 1.29 | 1.41 | 24 | ||||||||||||||||||||||||||||||
Class I | |||||||||||||||||||||||||||||||||||||||||||||||
2009@ | $ | 6.86 | $ | 0.07 | $ | 1.90 | $ | 1.97 | $ | (0.04 | ) | $ | — | $ | (0.04 | ) | $ | 8.79 | 28.85 | % | $ | 23,249 | 0.37 | % | 1.65 | % | 0.61 | % | 70 | % | |||||||||||||||||
2009 | 10.95 | 0.27 | (3.80 | ) | (3.53 | ) | (0.28 | ) | (0.28 | ) | (0.56 | ) | 6.86 | (32.70 | ) | 19,468 | 0.37 | 2.97 | 0.60 | 96 | |||||||||||||||||||||||||||
2008 | 12.34 | 0.34 | (0.93 | ) | (0.59 | ) | (0.53 | ) | (0.27 | ) | (0.80 | ) | 10.95 | (5.19 | ) | 30,981 | 0.37 | 2.78 | 0.59 | 25 | |||||||||||||||||||||||||||
2007 | 11.93 | 0.33 | 0.85 | 1.18 | (0.39 | ) | (0.38 | ) | (0.77 | ) | 12.34 | 10.13 | 31,814 | 0.37 | 2.70 | 0.59 | 28 | ||||||||||||||||||||||||||||||
2006 | 10.89 | 0.24 | 1.09 | 1.33 | (0.24 | ) | (0.05 | ) | (0.29 | ) | 11.93 | 12.41 | 18,748 | 0.37 | 2.15 | 0.61 | 58 | ||||||||||||||||||||||||||||||
2005 | 11.08 | 0.23 | 0.41 | 0.64 | (0.27 | ) | (0.56 | ) | (0.83 | ) | 10.89 | 5.80 | 13,973 | 0.37 | 2.10 | 0.67 | 24 | ||||||||||||||||||||||||||||||
| 38 | SEI Asset Allocation Trust / Semi-Annual Report / September 30, 2009 |
Table of Contents
Financial Highlights
For the six months ended September 30, 2009 (Unaudited) and the years ended March 31,
For a Share Outstanding Throughout each Period
| Net Asset Value, Beginning of Year | Net Investment Income (Loss)* | Net Realized and Unrealized Gains (Losses) from Affiliated Funds* | Total from Operations | Dividends from Net Investment Income | Distributions from Realized Capital Gains | Total Dividends and Distributions | Net Asset Value, End of Year | Total Return† | Net Assets End of Year ($ Thousands) | Ratio of Net Expenses to Average Net Assets** | Ratio of Net Investment Income (Loss) to Average Net Assets | Ratio of Expenses to Average Net Assets (Excluding Waivers and Reimbursement)** | Portfolio Turnover Rate | |||||||||||||||||||||||||||||||||||
Diversified Moderate Growth Fund |
| |||||||||||||||||||||||||||||||||||||||||||||||
Class A | ||||||||||||||||||||||||||||||||||||||||||||||||
2009@ | $ | 7.57 | $ | 0.07 | $ | 1.91 | $ | 1.98 | $ | (0.05 | ) | $ | — | $ | (0.05 | ) | $ | 9.50 | 26.23 | % | $ | 56,619 | 0.12 | % | 1.63 | % | 0.37 | % | 80 | % | ||||||||||||||||||
2009 | 11.81 | 0.28 | (3.92 | ) | (3.64 | ) | (0.30 | ) | (0.30 | ) | (0.60 | ) | 7.57 | (31.17 | ) | 50,544 | 0.12 | 2.73 | 0.35 | 76 | ||||||||||||||||||||||||||||
2008 | 13.64 | 0.37 | (0.96 | ) | (0.59 | ) | (0.56 | ) | (0.68 | ) | (1.24 | ) | 11.81 | (4.95 | ) | 147,548 | 0.12 | 2.77 | 0.34 | 13 | ||||||||||||||||||||||||||||
2007 | 13.29 | 0.34 | 0.94 | 1.28 | (0.45 | ) | (0.48 | ) | (0.93 | ) | 13.64 | 9.85 | 194,744 | 0.12 | 2.55 | 0.35 | 15 | |||||||||||||||||||||||||||||||
2006 | 12.20 | 0.27 | 1.11 | 1.38 | (0.28 | ) | (0.01 | ) | (0.29 | ) | 13.29 | 11.41 | 338,254 | 0.12 | 2.15 | 0.36 | 52 | |||||||||||||||||||||||||||||||
2005 | 11.91 | 0.25 | 0.35 | 0.60 | (0.27 | ) | (0.04 | ) | (0.31 | ) | 12.20 | 5.09 | 337,643 | 0.12 | 2.08 | 0.40 | 18 | |||||||||||||||||||||||||||||||
Class D | ||||||||||||||||||||||||||||||||||||||||||||||||
2009@ | $ | 7.54 | $ | 0.03 | $ | 1.90 | $ | 1.93 | $ | (0.03 | ) | $ | — | $ | (0.03 | ) | $ | 9.44 | 25.61 | % | $ | 9,562 | 1.12 | % | 0.63 | % | 1.37 | % | 80 | % | ||||||||||||||||||
2009 | 11.75 | 0.19 | (3.90 | ) | (3.71 | ) | (0.20 | ) | (0.30 | ) | (0.50 | ) | 7.54 | (31.81 | ) | 7,490 | 1.12 | 1.87 | 1.35 | 76 | ||||||||||||||||||||||||||||
2008 | 13.58 | 0.24 | (0.96 | ) | (0.72 | ) | (0.43 | ) | (0.68 | ) | (1.11 | ) | 11.75 | (5.94 | ) | 13,301 | 1.12 | 1.78 | 1.34 | 13 | ||||||||||||||||||||||||||||
2007 | 13.24 | 0.22 | 0.92 | 1.14 | (0.32 | ) | (0.48 | ) | (0.80 | ) | 13.58 | 8.70 | 17,844 | 1.12 | 1.67 | 1.35 | 15 | |||||||||||||||||||||||||||||||
2006 | 12.16 | 0.15 | 1.09 | 1.24 | (0.15 | ) | (0.01 | ) | (0.16 | ) | 13.24 | 10.27 | 19,586 | 1.12 | 1.15 | 1.36 | 52 | |||||||||||||||||||||||||||||||
2005 | 11.84 | 0.12 | 0.36 | 0.48 | (0.12 | ) | (0.04 | ) | (0.16 | ) | 12.16 | 4.08 | 18,569 | 1.12 | 1.03 | 1.40 | 18 | |||||||||||||||||||||||||||||||
Class I | ||||||||||||||||||||||||||||||||||||||||||||||||
2009@ | $ | 7.57 | $ | 0.06 | $ | 1.90 | $ | 1.96 | $ | (0.04 | ) | $ | — | $ | (0.04 | ) | $ | 9.49 | 26.01 | % | $ | 11,683 | 0.37 | % | 1.39 | % | 0.62 | % | 80 | % | ||||||||||||||||||
2009 | 11.80 | 0.26 | (3.91 | ) | (3.65 | ) | (0.28 | ) | (0.30 | ) | (0.58 | ) | 7.57 | (31.29 | ) | 9,494 | 0.37 | 2.64 | 0.60 | 76 | ||||||||||||||||||||||||||||
2008 | 13.63 | 0.34 | (0.96 | ) | (0.62 | ) | (0.53 | ) | (0.68 | ) | (1.21 | ) | 11.80 | (5.20 | ) | 15,256 | 0.37 | 2.53 | 0.59 | 13 | ||||||||||||||||||||||||||||
2007 | 13.29 | 0.32 | 0.92 | 1.24 | (0.42 | ) | (0.48 | ) | (0.90 | ) | 13.63 | 9.49 | 23,382 | 0.37 | 2.42 | 0.60 | 15 | |||||||||||||||||||||||||||||||
2006 | 12.20 | 0.24 | 1.11 | 1.35 | (0.25 | ) | (0.01 | ) | (0.26 | ) | 13.29 | 11.14 | 23,262 | 0.37 | 1.91 | 0.61 | 52 | |||||||||||||||||||||||||||||||
2005 | 11.90 | 0.22 | 0.35 | 0.57 | (0.23 | ) | (0.04 | ) | (0.27 | ) | 12.20 | 4.87 | 19,137 | 0.37 | 1.81 | 0.65 | 18 | |||||||||||||||||||||||||||||||
Diversified Global Growth Fund |
| |||||||||||||||||||||||||||||||||||||||||||||||
Class A | ||||||||||||||||||||||||||||||||||||||||||||||||
2009@ | $ | 6.92 | $ | 0.04 | $ | 2.30 | $ | 2.34 | $ | (0.03 | ) | $ | — | $ | (0.03 | ) | $ | 9.23 | 33.85 | % | $ | 91,254 | 0.12 | % | 0.99 | % | 0.36 | % | 49 | % | ||||||||||||||||||
2009 | 12.51 | 0.22 | (5.11 | ) | (4.89 | ) | (0.22 | ) | (0.48 | ) | (0.70 | ) | 6.92 | (39.45 | ) | 76,704 | 0.12 | 2.12 | 0.35 | 70 | ||||||||||||||||||||||||||||
2008 | 14.45 | 0.31 | (1.23 | ) | (0.92 | ) | (0.61 | ) | (0.41 | ) | (1.02 | ) | 12.51 | (7.04 | ) | 170,825 | 0.12 | 2.14 | 0.34 | 17 | ||||||||||||||||||||||||||||
2007 | 13.61 | 0.29 | 1.22 | 1.51 | (0.39 | ) | (0.28 | ) | (0.67 | ) | 14.45 | 11.29 | 213,992 | 0.12 | 2.07 | 0.34 | 23 | |||||||||||||||||||||||||||||||
2006 | 12.01 | 0.21 | 1.67 | 1.88 | (0.21 | ) | (0.07 | ) | (0.28 | ) | 13.61 | 15.81 | 236,477 | 0.12 | 1.64 | 0.36 | 69 | |||||||||||||||||||||||||||||||
2005 | 11.63 | 0.20 | 0.60 | 0.80 | (0.22 | ) | (0.20 | ) | (0.42 | ) | 12.01 | 6.89 | 206,579 | 0.12 | 1.69 | 0.40 | 16 | |||||||||||||||||||||||||||||||
Class D | ||||||||||||||||||||||||||||||||||||||||||||||||
2009@ | $ | 6.87 | $ | — | $ | 2.28 | $ | 2.28 | $ | (0.01 | ) | $ | — | $ | (0.01 | ) | $ | 9.14 | 33.17 | % | $ | 6,388 | 1.12 | % | (0.01 | )% | 1.36 | % | 49 | % | ||||||||||||||||||
2009 | 12.42 | 0.12 | (5.07 | ) | (4.95 | ) | (0.12 | ) | (0.48 | ) | (0.60 | ) | 6.87 | (40.07 | ) | 4,705 | 1.12 | 1.19 | 1.35 | 70 | ||||||||||||||||||||||||||||
2008 | 14.36 | 0.17 | (1.23 | ) | (1.06 | ) | (0.47 | ) | (0.41 | ) | (0.88 | ) | 12.42 | (8.02 | ) | 8,649 | 1.12 | 1.16 | 1.34 | 17 | ||||||||||||||||||||||||||||
2007 | 13.52 | 0.16 | 1.21 | 1.37 | (0.25 | ) | (0.28 | ) | (0.53 | ) | 14.36 | 10.25 | 11,161 | 1.12 | 1.13 | 1.34 | 23 | |||||||||||||||||||||||||||||||
2006 | 11.93 | 0.08 | 1.66 | 1.74 | (0.08 | ) | (0.07 | ) | (0.15 | ) | 13.52 | 14.69 | 14,026 | 1.12 | 0.62 | 1.36 | 69 | |||||||||||||||||||||||||||||||
2005 | 11.54 | 0.07 | 0.60 | 0.67 | (0.08 | ) | (0.20 | ) | (0.28 | ) | 11.93 | 5.76 | 13,309 | 1.12 | 0.63 | 1.40 | 16 | |||||||||||||||||||||||||||||||
Class I | ||||||||||||||||||||||||||||||||||||||||||||||||
2009@ | $ | 6.91 | $ | 0.03 | $ | 2.30 | $ | 2.33 | $ | (0.02 | ) | $ | — | $ | (0.02 | ) | $ | 9.22 | 33.81 | % | $ | 34,201 | 0.37 | % | 0.74 | % | 0.61 | % | 49 | % | ||||||||||||||||||
2009 | 12.49 | 0.20 | (5.10 | ) | (4.90 | ) | (0.20 | ) | (0.48 | ) | (0.68 | ) | 6.91 | (39.60 | ) | 26,241 | 0.37 | 1.98 | 0.60 | 70 | ||||||||||||||||||||||||||||
2008 | 14.44 | 0.28 | (1.24 | ) | (0.96 | ) | (0.58 | ) | (0.41 | ) | (0.99 | ) | 12.49 | (7.34 | ) | 46,352 | 0.37 | 1.96 | 0.59 | 17 | ||||||||||||||||||||||||||||
2007 | 13.61 | 0.27 | 1.20 | 1.47 | (0.36 | ) | (0.28 | ) | (0.64 | ) | 14.44 | 10.95 | 45,378 | 0.37 | 1.96 | 0.59 | 23 | |||||||||||||||||||||||||||||||
2006 | 12.00 | 0.18 | 1.68 | 1.86 | (0.18 | ) | (0.07 | ) | (0.25 | ) | 13.61 | 15.63 | 32,240 | 0.37 | 1.44 | 0.61 | 69 | |||||||||||||||||||||||||||||||
2005 | 11.62 | 0.17 | 0.60 | 0.77 | (0.19 | ) | (0.20 | ) | (0.39 | ) | 12.00 | 6.59 | 22,177 | 0.37 | 1.47 | 0.66 | 16 | |||||||||||||||||||||||||||||||
Diversified Global Stock Fund |
| |||||||||||||||||||||||||||||||||||||||||||||||
Class A | ||||||||||||||||||||||||||||||||||||||||||||||||
2009@ | $ | 6.74 | $ | — | $ | 2.59 | $ | 2.59 | $ | (0.01 | ) | $ | — | $ | (0.01 | ) | $ | 9.32 | 38.37 | % | $ | 54,978 | 0.12 | % | 0.09 | % | 0.36 | % | 25 | % | ||||||||||||||||||
2009 | 12.52 | 0.13 | (5.79 | ) | (5.66 | ) | (0.12 | ) | — | (0.12 | ) | 6.74 | (45.31 | ) | 41,488 | 0.12 | 1.27 | 0.35 | 50 | |||||||||||||||||||||||||||||
2008 | 14.40 | 0.20 | (1.50 | ) | (1.30 | ) | (0.58 | ) | — | (0.58 | ) | 12.52 | (9.49 | ) | 82,495 | 0.12 | 1.36 | 0.34 | 20 | |||||||||||||||||||||||||||||
2007 | 13.11 | 0.18 | 1.41 | 1.59 | (0.30 | ) | — | (0.30 | ) | 14.40 | 12.18 | 120,818 | 0.12 | 1.36 | 0.34 | 23 | ||||||||||||||||||||||||||||||||
2006 | 11.16 | 0.11 | 1.97 | 2.08 | (0.11 | ) | (0.02 | ) | (0.13 | ) | 13.11 | 18.75 | 142,449 | 0.12 | 0.95 | 0.36 | 86 | |||||||||||||||||||||||||||||||
2005 | 10.52 | 0.11 | 0.69 | 0.80 | (0.12 | ) | (0.04 | ) | (0.16 | ) | 11.16 | 7.62 | 123,048 | 0.12 | 1.07 | 0.41 | 19 | |||||||||||||||||||||||||||||||
Class D | ||||||||||||||||||||||||||||||||||||||||||||||||
2009@ | $ | 6.29 | $ | (0.03 | ) | $ | 2.40 | $ | 2.37 | $ | — | $ | — | $ | — | $ | 8.66 | 37.68 | % | $ | 3,986 | 1.12 | % | (0.90 | )% | 1.36 | % | 25 | % | |||||||||||||||||||
2009 | 11.71 | 0.03 | (5.40 | ) | (5.37 | ) | (0.05 | ) | — | (0.05 | ) | 6.29 | (45.84 | ) | 2,924 | 1.12 | 0.30 | 1.35 | 50 | |||||||||||||||||||||||||||||
2008 | 13.52 | 0.06 | (1.42 | ) | (1.36 | ) | (0.45 | ) | — | (0.45 | ) | 11.71 | (10.43 | ) | 5,204 | 1.12 | 0.45 | 1.34 | 20 | |||||||||||||||||||||||||||||
2007 | 12.36 | 0.05 | 1.31 | 1.36 | (0.20 | ) | — | (0.20 | ) | 13.52 | 11.03 | 5,908 | 1.12 | 0.43 | 1.34 | 23 | ||||||||||||||||||||||||||||||||
2006 | 10.57 | (0.01 | ) | 1.86 | 1.85 | (0.04 | ) | (0.02 | ) | (0.06 | ) | 12.36 | 17.53 | 6,046 | 1.12 | (0.10 | ) | 1.36 | 86 | |||||||||||||||||||||||||||||
2005 | 10.01 | — | 0.66 | 0.66 | (0.06 | ) | (0.04 | ) | (0.10 | ) | 10.57 | 6.57 | 6,920 | 1.12 | 0.05 | 1.41 | 19 | |||||||||||||||||||||||||||||||
Class I | ||||||||||||||||||||||||||||||||||||||||||||||||
2009@ | $ | 6.73 | $ | (0.01 | ) | $ | 2.57 | $ | 2.56 | $ | — | $ | — | $ | — | $ | 9.29 | 38.06 | % | $ | 12,642 | 0.37 | % | (0.15 | )% | 0.61 | % | 25 | % | |||||||||||||||||||
2009 | 12.49 | 0.10 | (5.76 | ) | (5.66 | ) | (0.10 | ) | — | (0.10 | ) | 6.73 | (45.41 | ) | 9,217 | 0.37 | 1.01 | 0.60 | 50 | |||||||||||||||||||||||||||||
2008 | 14.36 | 0.18 | (1.51 | ) | (1.33 | ) | (0.54 | ) | — | (0.54 | ) | 12.49 | (9.67 | ) | 17,326 | 0.37 | 1.26 | 0.59 | 20 | |||||||||||||||||||||||||||||
2007 | 13.08 | 0.18 | 1.36 | 1.54 | (0.26 | ) | — | (0.26 | ) | 14.36 | 11.88 | 17,836 | 0.37 | 1.37 | 0.59 | 23 | ||||||||||||||||||||||||||||||||
2006 | 11.14 | 0.10 | 1.94 | 2.04 | (0.08 | ) | (0.02 | ) | (0.10 | ) | 13.08 | 18.40 | 9,110 | 0.37 | 0.82 | 0.61 | 86 | |||||||||||||||||||||||||||||||
2005 | 10.50 | 0.10 | 0.67 | 0.77 | (0.09 | ) | (0.04 | ) | (0.13 | ) | 11.14 | 7.35 | 8,445 | 0.37 | 0.96 | 0.66 | 19 | |||||||||||||||||||||||||||||||
| SEI Asset Allocation Trust / Semi-Annual Report / September 30, 2009 | 39 |
Table of Contents
Financial Highlights
For the six months ended September 30, 2009 (Unaudited) and the years ended March 31,
For a Share Outstanding Throughout each Period
| Net Asset Value, Beginning of Year | Net Investment Income (Loss)* | Net Realized and Unrealized Gains (Losses) from Affiliated Funds* | Total from Operations | Dividends from Net Investment Income | Distributions from Realized Capital Gains | Return of | Total Dividends and Distributions | Net Assets Value, End of Year | Total Return† | Net Assets End of Year ($ Thousands) | Ratio of Net Expenses to Average Net Assets** | Ratio of Net Investment Income (Loss) to Average Net Assets | Ratio of Expenses to Average Net Assets (Excluding Waivers and Reimbursement)** | Portfolio Rate | ||||||||||||||||||||||||||||||||||||||
Diversified U.S. Stock Fund |
| |||||||||||||||||||||||||||||||||||||||||||||||||||
Class A | ||||||||||||||||||||||||||||||||||||||||||||||||||||
2009@ | $ | 8.19 | $ | 0.01 | $ | 2.88 | $ | 2.89 | $ | (0.01 | ) | $ | — | $ | — | $ | (0.01 | ) | $ | 11.07 | 35.30 | % | $ | 35,988 | 0.12 | % | 0.16 | % | 0.36 | % | 18 | % | ||||||||||||||||||||
2009 | 14.52 | 0.13 | (6.33 | ) | (6.20 | ) | (0.13 | ) | — | — | (0.13 | ) | 8.19 | (42.84 | ) | 27,174 | 0.12 | 1.12 | 0.35 | 23 | ||||||||||||||||||||||||||||||||
2008 | 16.76 | 0.18 | (1.92 | ) | (1.74 | ) | (0.50 | ) | — | — | (0.50 | ) | 14.52 | (10.71 | ) | 53,598 | 0.12 | 1.09 | 0.34 | 11 | ||||||||||||||||||||||||||||||||
2007 | 15.52 | 0.15 | 1.36 | 1.51 | (0.27 | ) | — | — | (0.27 | ) | 16.76 | 9.80 | 74,105 | 0.12 | 0.92 | 0.34 | 15 | |||||||||||||||||||||||||||||||||||
2006 | 13.46 | 0.08 | 2.08 | 2.16 | (0.07 | ) | (0.03 | ) | — | (0.10 | ) | 15.52 | 16.10 | 89,770 | 0.12 | 0.57 | 0.37 | 101 | ||||||||||||||||||||||||||||||||||
2005 | 12.91 | 0.10 | 0.62 | 0.72 | (0.11 | ) | (0.06 | ) | — | (0.17 | ) | 13.46 | 5.62 | 89,902 | 0.12 | 0.79 | 0.41 | 11 | ||||||||||||||||||||||||||||||||||
Class D | ||||||||||||||||||||||||||||||||||||||||||||||||||||
2009@ | $ | 7.65 | $ | (0.04 | ) | $ | 2.70 | $ | 2.66 | $ | — | $ | — | $ | — | $ | — | $ | 10.31 | 34.77 | % | $ | 4,160 | 1.12 | % | (0.83 | )% | 1.36 | % | 18 | % | |||||||||||||||||||||
2009 | 13.61 | 0.01 | (5.92 | ) | (5.91 | ) | (0.05 | ) | — | — | (0.05 | ) | 7.65 | (43.42 | ) | 3,169 | 1.12 | 0.13 | 1.35 | 23 | ||||||||||||||||||||||||||||||||
2008 | 15.75 | 0.01 | (1.81 | ) | (1.80 | ) | (0.34 | ) | — | — | (0.34 | ) | 13.61 | (11.66 | ) | 6,311 | 1.12 | 0.08 | 1.34 | 11 | ||||||||||||||||||||||||||||||||
2007 | 14.60 | (0.01 | ) | 1.29 | 1.28 | (0.13 | ) | — | — | (0.13 | ) | 15.75 | 8.78 | 11,205 | 1.12 | (0.10 | ) | 1.34 | 15 | |||||||||||||||||||||||||||||||||
2006 | 12.73 | (0.06 | ) | 1.96 | 1.90 | — | (0.03 | ) | — | (0.03 | ) | 14.60 | 14.91 | 13,190 | 1.12 | (0.43 | ) | 1.37 | 101 | |||||||||||||||||||||||||||||||||
2005 | 12.25 | (0.03 | ) | 0.59 | 0.56 | (0.02 | ) | (0.06 | ) | — | (0.08 | ) | 12.73 | 4.57 | 12,676 | 1.12 | (0.21 | ) | 1.41 | 11 | ||||||||||||||||||||||||||||||||
Class I | ||||||||||||||||||||||||||||||||||||||||||||||||||||
2009@ | $ | 8.16 | $ | — | $ | 2.87 | $ | 2.87 | $ | — | $ | — | $ | — | $ | — | $ | 11.03 | 35.23 | % | $ | 3,978 | 0.37 | % | (0.09 | )% | 0.61 | % | 18 | % | ||||||||||||||||||||||
2009 | 14.48 | 0.11 | (6.32 | ) | (6.21 | ) | (0.11 | ) | — | — | (0.11 | ) | 8.16 | (43.01 | ) | 2,722 | 0.37 | 0.92 | 0.60 | 23 | ||||||||||||||||||||||||||||||||
2008 | 16.72 | 0.14 | (1.92 | ) | (1.78 | ) | (0.46 | ) | — | — | (0.46 | ) | 14.48 | (10.96 | ) | 4,688 | 0.37 | 0.85 | 0.59 | 11 | ||||||||||||||||||||||||||||||||
2007 | 15.48 | 0.11 | 1.36 | 1.47 | (0.23 | ) | — | — | (0.23 | ) | 16.72 | 9.56 | 5,775 | 0.37 | 0.69 | 0.59 | 15 | |||||||||||||||||||||||||||||||||||
2006 | 13.44 | 0.05 | 2.07 | 2.12 | (0.05 | ) | (0.03 | ) | — | (0.08 | ) | 15.48 | 15.78 | 5,936 | 0.37 | 0.35 | 0.62 | 101 | ||||||||||||||||||||||||||||||||||
2005 | 12.89 | 0.08 | 0.61 | 0.69 | (0.08 | ) | (0.06 | ) | — | (0.14 | ) | 13.44 | 5.35 | 4,323 | 0.37 | 0.58 | 0.66 | 11 | ||||||||||||||||||||||||||||||||||
Defensive Strategy Fund |
| |||||||||||||||||||||||||||||||||||||||||||||||||||
Class A | ||||||||||||||||||||||||||||||||||||||||||||||||||||
2009@ | $ | 9.01 | $ | 0.04 | $ | 0.28 | $ | 0.32 | $ | (0.03 | ) | $ | — | $ | — | $ | (0.03 | ) | $ | 9.30 | 3.50 | % | $ | 41,289 | 0.10 | % | 0.84 | % | 0.36 | % | 82 | % | ||||||||||||||||||||
2009 | 9.68 | 0.25 | (0.66 | ) | (0.41 | ) | (0.26 | ) | — | — | (0.26 | ) | 9.01 | (4.30 | ) | 49,707 | 0.10 | 2.69 | 0.35 | 64 | ||||||||||||||||||||||||||||||||
2008 | 10.90 | 0.45 | (1.04 | ) | (0.59 | ) | (0.51 | ) | (0.12 | ) | — | (0.63 | ) | 9.68 | (5.63 | ) | 51,283 | 0.10 | 4.25 | 0.34 | 40 | |||||||||||||||||||||||||||||||
2007 | 10.58 | 0.48 | 0.36 | 0.84 | (0.50 | ) | (0.02 | ) | — | (0.52 | ) | 10.90 | 8.08 | 109,333 | 0.10 | 4.48 | 0.34 | 94 | ||||||||||||||||||||||||||||||||||
2006 | 10.34 | 0.39 | 0.20 | 0.59 | (0.33 | ) | (0.02 | ) | — | (0.35 | ) | 10.58 | 5.81 | 99,511 | 0.10 | 3.69 | 0.35 | 46 | ||||||||||||||||||||||||||||||||||
2005 | 10.29 | 0.29 | 0.06 | 0.35 | (0.25 | ) | (0.05 | ) | — | (0.30 | ) | 10.34 | 3.44 | 26,587 | 0.10 | 2.78 | 0.49 | 52 | ||||||||||||||||||||||||||||||||||
Class I | ||||||||||||||||||||||||||||||||||||||||||||||||||||
2009@ | $ | 9.04 | $ | — | $ | 0.27 | $ | 0.27 | $ | (0.03 | ) | $ | — | $ | — | $ | (0.03 | ) | $ | 9.28 | 2.94 | % | $ | — | 0.10 | %†† | 0.09 | % | 0.36 | % | 82 | % | ||||||||||||||||||||
2009 | 9.68 | 0.25 | (0.63 | ) | (0.38 | ) | (0.26 | ) | — | — | (0.26 | ) | 9.04 | (3.98 | )(1)(2) | — | 0.10 | †† | 2.66 | 0.35 | 64 | |||||||||||||||||||||||||||||||
2008 | 10.96 | 0.39 | (1.04 | ) | (0.65 | ) | (0.51 | ) | (0.12 | ) | — | (0.63 | ) | 9.68 | (6.22 | )(1) | — | 0.10 | †† | 3.68 | 0.34 | 40 | ||||||||||||||||||||||||||||||
2007 | 10.70 | 0.43 | 0.35 | 0.78 | (0.50 | ) | (0.02 | ) | — | (0.52 | ) | 10.96 | 7.42 | (1) | — | 0.10 | †† | 3.96 | 0.34 | 94 | ||||||||||||||||||||||||||||||||
2006 | 10.46 | 0.37 | ^ | 0.22 | 0.59 | (0.33 | ) | (0.02 | ) | — | (0.35 | ) | 10.70 | 5.74 | (1) | — | 0.10 | †† | 3.69 | 0.35 | 46 | |||||||||||||||||||||||||||||||
2005 | 10.30 | 0.38 | ^ | 0.08 | 0.46 | (0.25 | ) | (0.05 | ) | — | (0.30 | ) | 10.46 | 4.51 | (1)(2) | — | 0.10 | †† | 2.78 | 0.49 | 52 | |||||||||||||||||||||||||||||||
Defensive Strategy Allocation Fund |
| |||||||||||||||||||||||||||||||||||||||||||||||||||
Class A | ||||||||||||||||||||||||||||||||||||||||||||||||||||
2009@ | $ | 6.42 | $ | 0.14 | $ | 2.45 | $ | 2.59 | $ | (0.07 | ) | $ | — | $ | — | $ | (0.07 | ) | $ | 8.94 | 40.59 | % | $ | 9,428 | 0.10 | % | 3.57 | % | 0.37 | % | 59 | % | ||||||||||||||||||||
2009 | 11.48 | 0.50 | (4.64 | ) | (4.14 | ) | (0.64 | ) | (0.28 | ) | — | (0.92 | ) | 6.42 | (37.14 | ) | 8,559 | 0.10 | 5.16 | 0.35 | 143 | |||||||||||||||||||||||||||||||
2008 | 13.55 | 0.51 | (1.48 | ) | (0.97 | ) | (0.72 | ) | (0.38 | ) | — | (1.10 | ) | 11.48 | (7.61 | ) | 17,127 | 0.10 | 3.95 | 0.34 | 37 | |||||||||||||||||||||||||||||||
2007 | 12.68 | 0.51 | 1.19 | 1.70 | (0.63 | ) | (0.20 | ) | — | (0.83 | ) | 13.55 | 13.85 | 20,856 | 0.10 | 3.90 | 0.33 | 34 | ||||||||||||||||||||||||||||||||||
2006(6) | 11.48 | 0.40 | 1.31 | 1.71 | (0.36 | ) | (0.15 | ) | — | (0.51 | ) | 12.68 | 15.10 | 20,027 | 0.10 | 3.74 | 0.36 | 49 | ||||||||||||||||||||||||||||||||||
2005(4) | 40.84 | 0.88 | 0.16 | 1.04 | (0.80 | ) | (0.16 | ) | (29.44 | )(3) | (30.40 | ) | 11.48 | 3.09 | 4,608 | 0.10 | 2.14 | 0.59 | 212 | |||||||||||||||||||||||||||||||||
Conservative Strategy Fund |
| |||||||||||||||||||||||||||||||||||||||||||||||||||
Class A | ||||||||||||||||||||||||||||||||||||||||||||||||||||
2009@ | $ | 8.13 | $ | 0.09 | $ | 0.93 | $ | 1.02 | $ | (0.05 | ) | $ | — | $ | — | $ | (0.05 | ) | $ | 9.10 | 12.62 | % | $ | 108,608 | 0.10 | % | 2.11 | % | 0.36 | % | 41 | % | ||||||||||||||||||||
2009 | 10.30 | 0.35 | (2.16 | ) | (1.81 | ) | (0.36 | ) | — | — | (0.36 | ) | 8.13 | (17.85 | ) | 105,925 | 0.10 | 3.71 | 0.36 | 72 | ||||||||||||||||||||||||||||||||
2008 | 11.68 | 0.44 | (1.19 | ) | (0.75 | ) | (0.54 | ) | (0.09 | ) | — | (0.63 | ) | 10.30 | (6.73 | ) | 129,724 | 0.10 | 3.90 | 0.34 | 66 | |||||||||||||||||||||||||||||||
2007 | 11.13 | 0.45 | 0.63 | 1.08 | (0.51 | ) | (0.02 | ) | — | (0.53 | ) | 11.68 | 9.88 | 146,872 | 0.10 | 3.98 | 0.35 | 103 | ||||||||||||||||||||||||||||||||||
2006 | 10.61 | 0.38 | 0.53 | 0.91 | (0.34 | ) | (0.05 | ) | — | (0.39 | ) | 11.13 | 8.72 | 110,248 | 0.10 | 3.48 | 0.35 | 15 | ||||||||||||||||||||||||||||||||||
2005 | 10.43 | 0.31 | 0.22 | 0.53 | (0.28 | ) | (0.07 | ) | — | (0.35 | ) | 10.61 | 5.12 | 47,268 | 0.10 | 2.97 | 0.46 | 49 | ||||||||||||||||||||||||||||||||||
Class I | ||||||||||||||||||||||||||||||||||||||||||||||||||||
2009@ | $ | 8.25 | $ | 0.08 | $ | 0.95 | $ | 1.03 | $ | (0.05 | ) | $ | — | $ | — | $ | (0.05 | ) | $ | 9.23 | 12.49 | % | $ | 1,701 | 0.35 | % | 1.86 | % | 0.61 | % | 41 | % | ||||||||||||||||||||
2009 | 10.44 | 0.32 | (2.17 | ) | (1.85 | ) | (0.34 | ) | — | — | (0.34 | ) | 8.25 | (18.02 | ) | 1,378 | 0.35 | 3.43 | 0.61 | 72 | ||||||||||||||||||||||||||||||||
2008 | 11.83 | 0.43 | (1.22 | ) | (0.79 | ) | (0.51 | ) | (0.09 | ) | — | (0.60 | ) | 10.44 | (6.95 | ) | 1,484 | 0.35 | 3.83 | 0.59 | 66 | |||||||||||||||||||||||||||||||
2007 | 11.29 | 0.53 | 0.52 | 1.05 | (0.49 | ) | (0.02 | ) | — | (0.51 | ) | 11.83 | 9.49 | 518 | 0.35 | 4.47 | 0.59 | 103 | ||||||||||||||||||||||||||||||||||
2006 | 10.75 | 0.39 | ^ | 0.54 | 0.93 | (0.34 | ) | (0.05 | ) | — | (0.39 | ) | 11.29 | 8.79 | (2) | — | 0.10 | †† | 3.48 | 0.35 | 15 | |||||||||||||||||||||||||||||||
2005 | 10.46 | 0.37 | ^ | 0.27 | 0.64 | (0.28 | ) | (0.07 | ) | — | (0.35 | ) | 10.75 | 6.17 | (2) | — | 0.10 | †† | 2.97 | 0.46 | 49 | |||||||||||||||||||||||||||||||
| 40 | SEI Asset Allocation Trust / Semi-Annual Report / September 30, 2009 |
Table of Contents
Financial Highlights
For the six months ended September 30, 2009 (Unaudited) and the years ended March 31,
For a Share Outstanding Throughout each Period
| Net Asset Value, Beginning of Year | Net Investment Income* | Net Realized and Unrealized Gains (Losses) from Affiliated Funds* | Total from Operations | Dividends from Net Investment Income | Distributions from Realized Capital Gains | Return of Capital | Total Dividends and Distributions | Net Assets Value, End of Year | Total Return† | Net Assets End of Year ($ Thousands) | Ratio of Net Expenses to Average Net Assets** | Ratio of Net Investment Income to Average Net Assets | Ratio of Expenses to Average Net Assets (Excluding Waivers and Reimbursement)** | Portfolio Turnover Rate | ||||||||||||||||||||||||||||||||||||||
Conservative Strategy Allocation Fund |
| |||||||||||||||||||||||||||||||||||||||||||||||||||
Class A | ||||||||||||||||||||||||||||||||||||||||||||||||||||
2009@ | $ | 6.08 | $ | 0.11 | $ | 2.33 | $ | 2.44 | $ | (0.06 | ) | $ | — | $ | — | $ | (0.06 | ) | $ | 8.46 | 40.25 | % | $ | 25,548 | 0.10 | % | 3.03 | % | 0.36 | % | 60 | % | ||||||||||||||||||||
2009 | 10.50 | 0.41 | (4.20 | ) | (3.79 | ) | (0.45 | ) | (0.18 | ) | — | (0.63 | ) | 6.08 | (36.98 | ) | 17,248 | 0.10 | 4.65 | 0.35 | 135 | |||||||||||||||||||||||||||||||
2008 | 12.20 | 0.41 | (1.34 | ) | (0.93 | ) | (0.61 | ) | (0.16 | ) | — | (0.77 | ) | 10.50 | (7.98 | ) | 41,902 | 0.10 | 3.53 | 0.34 | 37 | |||||||||||||||||||||||||||||||
2007 | 11.30 | 0.40 | 1.18 | 1.58 | (0.52 | ) | (0.16 | ) | — | (0.68 | ) | 12.20 | 14.27 | 47,553 | 0.10 | 3.42 | 0.34 | 25 | ||||||||||||||||||||||||||||||||||
2006(7) | 10.18 | 0.32 | 1.30 | 1.62 | (0.32 | ) | (0.18 | ) | — | (0.50 | ) | 11.30 | 16.29 | 37,197 | 0.10 | 3.22 | 0.37 | 28 | ||||||||||||||||||||||||||||||||||
2005(5) | 20.90 | 0.52 | 0.48 | 1.00 | (0.50 | ) | (0.14 | ) | (11.08 | )(3) | (11.72 | ) | 10.18 | 5.18 | 25,443 | 0.10 | 2.48 | 0.45 | 167 | |||||||||||||||||||||||||||||||||
Moderate Strategy Fund |
| |||||||||||||||||||||||||||||||||||||||||||||||||||
Class A | ||||||||||||||||||||||||||||||||||||||||||||||||||||
2009@ | $ | 7.70 | $ | 0.09 | $ | 1.68 | $ | 1.77 | $ | (0.06 | ) | $ | — | $ | — | $ | (0.06 | ) | $ | 9.41 | 23.07 | % | $ | 297,080 | 0.10 | % | 2.17 | % | 0.37 | % | 60 | % | ||||||||||||||||||||
2009 | 11.05 | 0.37 | (3.27 | ) | (2.90 | ) | (0.40 | ) | (0.05 | ) | — | (0.45 | ) | 7.70 | (26.71 | ) | 248,422 | 0.10 | 3.77 | 0.35 | 76 | |||||||||||||||||||||||||||||||
2008 | 12.43 | 0.44 | (1.16 | ) | (0.72 | ) | (0.55 | ) | (0.11 | ) | — | (0.66 | ) | 11.05 | (6.15 | ) | 477,612 | 0.10 | 3.64 | 0.34 | 31 | |||||||||||||||||||||||||||||||
2007 | 11.82 | 0.43 | 0.78 | 1.21 | (0.47 | ) | (0.13 | ) | — | (0.60 | ) | 12.43 | 10.49 | 529,251 | 0.10 | 3.54 | 0.34 | 49 | ||||||||||||||||||||||||||||||||||
2006 | 11.03 | �� | 0.37 | 0.82 | 1.19 | (0.34 | ) | (0.06 | ) | — | (0.40 | ) | 11.82 | 10.89 | 342,663 | 0.10 | 3.22 | 0.35 | 6 | |||||||||||||||||||||||||||||||||
2005 | 10.69 | 0.34 | 0.33 | 0.67 | (0.28 | ) | (0.05 | ) | — | (0.33 | ) | 11.03 | 6.32 | 163,817 | 0.10 | 3.06 | 0.41 | 27 | ||||||||||||||||||||||||||||||||||
Class I | ||||||||||||||||||||||||||||||||||||||||||||||||||||
2009@ | $ | 7.87 | $ | 0.08 | $ | 1.71 | $ | 1.79 | $ | (0.05 | ) | $ | — | $ | — | $ | (0.05 | ) | $ | 9.61 | 22.88 | % | $ | 1,585 | 0.35 | % | 1.92 | % | 0.62 | % | 60 | % | ||||||||||||||||||||
2009 | 11.28 | 0.36 | (3.34 | ) | (2.98 | ) | (0.38 | ) | (0.05 | ) | — | (0.43 | ) | 7.87 | (26.88 | ) | 1,283 | 0.35 | 3.66 | 0.60 | 76 | |||||||||||||||||||||||||||||||
2008 | 12.67 | 0.45 | (1.21 | ) | (0.76 | ) | (0.52 | ) | (0.11 | ) | — | (0.63 | ) | 11.28 | (6.32 | ) | 1,411 | 0.35 | 3.69 | 0.59 | 31 | |||||||||||||||||||||||||||||||
2007 | 12.05 | 0.48 | 0.72 | 1.20 | (0.45 | ) | (0.13 | ) | — | (0.58 | ) | 12.67 | 10.22 | 691 | 0.35 | 3.82 | 0.59 | 49 | ||||||||||||||||||||||||||||||||||
2006 | 11.18 | 0.42 | ^ | 0.85 | 1.27 | (0.34 | ) | (0.06 | ) | — | (0.40 | ) | 12.05 | 11.46 | (1)(2) | — | 0.10 | †† | 3.22 | 0.35 | 6 | |||||||||||||||||||||||||||||||
2005 | 10.73 | 0.42 | ^ | 0.36 | 0.78 | (0.28 | ) | (0.05 | ) | — | (0.33 | ) | 11.18 | 7.34 | (1)(2) | — | 0.10 | †† | 3.06 | 0.41 | 27 | |||||||||||||||||||||||||||||||
Moderate Strategy Allocation Fund |
| |||||||||||||||||||||||||||||||||||||||||||||||||||
Class A | ||||||||||||||||||||||||||||||||||||||||||||||||||||
2009@ | $ | 8.15 | $ | 0.09 | $ | 2.75 | $ | 2.84 | $ | (0.06 | ) | $ | — | $ | — | $ | (0.06 | ) | $ | 10.93 | 34.91 | % | $ | 70,841 | 0.10 | % | 1.89 | % | 0.36 | % | 35 | % | ||||||||||||||||||||
2009 | 13.65 | 0.35 | (5.27 | ) | (4.92 | ) | (0.39 | ) | (0.19 | ) | — | (0.58 | ) | 8.15 | (36.58 | ) | 56,605 | 0.10 | 3.05 | 0.35 | 86 | |||||||||||||||||||||||||||||||
2008 | 15.41 | 0.37 | (1.33 | ) | (0.96 | ) | (0.63 | ) | (0.17 | ) | — | (0.80 | ) | 13.65 | (6.65 | ) | 120,365 | 0.10 | 2.45 | 0.34 | 16 | |||||||||||||||||||||||||||||||
2007 | 14.03 | 0.35 | 1.53 | 1.88 | (0.47 | ) | (0.03 | ) | — | (0.50 | ) | 15.41 | 13.56 | 128,135 | 0.10 | 2.44 | 0.34 | 12 | ||||||||||||||||||||||||||||||||||
2006(7) | 12.54 | 0.28 | 1.58 | 1.86 | (0.27 | ) | (0.10 | ) | — | (0.37 | ) | 14.03 | 14.98 | 91,539 | 0.10 | 2.26 | 0.36 | 12 | ||||||||||||||||||||||||||||||||||
2005(5) | 21.16 | 0.52 | 0.58 | 1.10 | (0.46 | ) | (0.14 | ) | (9.12 | )(3) | (9.72 | ) | 12.54 | 5.61 | 40,281 | 0.10 | 2.39 | 0.43 | 137 | |||||||||||||||||||||||||||||||||
Aggressive Strategy Fund |
| |||||||||||||||||||||||||||||||||||||||||||||||||||
Class A | ||||||||||||||||||||||||||||||||||||||||||||||||||||
2009@ | $ | 6.50 | $ | 0.06 | $ | 2.46 | $ | 2.52 | $ | (0.03 | ) | $ | — | $ | — | $ | (0.03 | ) | $ | 8.99 | 38.94 | % | $ | 310,587 | 0.10 | % | 1.40 | % | 0.36 | % | 31 | % | ||||||||||||||||||||
2009 | 12.09 | 0.27 | (5.18 | ) | (4.91 | ) | (0.28 | ) | (0.40 | ) | — | (0.68 | ) | 6.50 | (41.12 | ) | 224,237 | 0.10 | 2.82 | 0.35 | 89 | |||||||||||||||||||||||||||||||
2008 | 13.96 | 0.34 | (1.35 | ) | (1.01 | ) | (0.64 | ) | (0.22 | ) | — | (0.86 | ) | 12.09 | (7.83 | ) | 410,235 | 0.10 | 2.46 | 0.34 | 18 | |||||||||||||||||||||||||||||||
2007 | 13.18 | 0.36 | 1.16 | 1.52 | (0.41 | ) | (0.33 | ) | — | (0.74 | ) | 13.96 | 11.74 | 404,880 | 0.10 | 2.68 | 0.34 | 14 | ||||||||||||||||||||||||||||||||||
2006 | 11.45 | 0.28 | 1.75 | 2.03 | (0.24 | ) | (0.06 | ) | — | (0.30 | ) | 13.18 | 17.90 | 192,654 | 0.10 | 2.27 | 0.35 | 60 | ||||||||||||||||||||||||||||||||||
2005 | 10.89 | 0.30 | 0.56 | 0.86 | (0.24 | ) | (0.06 | ) | — | (0.30 | ) | 11.45 | 7.87 | 73,500 | 0.10 | 2.66 | 0.43 | 13 | ||||||||||||||||||||||||||||||||||
Class I | ||||||||||||||||||||||||||||||||||||||||||||||||||||
2009@ | $ | 6.37 | $ | 0.04 | $ | 2.43 | $ | 2.47 | $ | (0.03 | ) | $ | — | $ | — | $ | (0.03 | ) | $ | 8.81 | 38.86 | % | $ | 7,105 | 0.35 | % | 1.15 | % | 0.61 | % | 31 | % | ||||||||||||||||||||
2009 | 11.87 | 0.25 | (5.09 | ) | (4.84 | ) | (0.26 | ) | (0.40 | ) | — | (0.66 | ) | 6.37 | (41.28 | ) | 3,100 | 0.35 | 2.66 | 0.60 | 89 | |||||||||||||||||||||||||||||||
2008 | 13.73 | 0.33 | (1.36 | ) | (1.03 | ) | (0.61 | ) | (0.22 | ) | — | (0.83 | ) | 11.87 | (8.10 | ) | 5,130 | 0.35 | 2.42 | 0.59 | 18 | |||||||||||||||||||||||||||||||
2007 | 12.99 | 0.37 | 1.09 | 1.46 | (0.39 | ) | (0.33 | ) | — | (0.72 | ) | 13.73 | 11.47 | 3,777 | 0.35 | 2.74 | 0.59 | 14 | ||||||||||||||||||||||||||||||||||
2006 | 11.36 | 0.18 | ^ | 1.75 | 1.93 | (0.24 | ) | (0.06 | ) | — | (0.30 | ) | 12.99 | 17.16 | (1) | — | 0.10 | †† | 2.27 | 0.35 | 60 | |||||||||||||||||||||||||||||||
2005 | 10.87 | 0.17 | ^ | 0.62 | 0.79 | (0.24 | ) | (0.06 | ) | — | (0.30 | ) | 11.36 | 7.24 | (1) | — | 0.10 | †† | 2.66 | 0.43 | 13 | |||||||||||||||||||||||||||||||
Tax-Managed Aggressive Strategy Fund |
| |||||||||||||||||||||||||||||||||||||||||||||||||||
Class A | ||||||||||||||||||||||||||||||||||||||||||||||||||||
2009@ | $ | 7.47 | $ | 0.05 | $ | 2.84 | $ | 2.89 | $ | (0.03 | ) | $ | — | $ | — | $ | (0.03 | ) | $ | 10.33 | 38.84 | % | $ | 55,285 | 0.10 | % | 1.08 | % | 0.37 | % | 24 | % | ||||||||||||||||||||
2009 | 12.85 | 0.26 | (5.38 | ) | (5.12 | ) | (0.24 | ) | (0.02 | ) | — | (0.26 | ) | 7.47 | (40.20 | ) | 45,280 | 0.10 | 2.57 | 0.35 | 126 | |||||||||||||||||||||||||||||||
2008 | 14.29 | 0.27 | (1.06 | ) | (0.79 | ) | (0.42 | ) | (0.23 | ) | — | (0.65 | ) | 12.85 | (6.05 | ) | 89,007 | 0.10 | 1.85 | 0.34 | 28 | |||||||||||||||||||||||||||||||
2007 | 13.26 | 0.26 | 1.15 | 1.41 | (0.30 | ) | (0.08 | ) | — | (0.38 | ) | 14.29 | 10.76 | 101,161 | 0.10 | 1.95 | 0.34 | 12 | ||||||||||||||||||||||||||||||||||
2006 | 11.54 | 0.21 | 1.78 | 1.99 | (0.19 | ) | (0.08 | ) | — | (0.27 | ) | 13.26 | 17.35 | 66,660 | 0.10 | 1.69 | 0.35 | 12 | ||||||||||||||||||||||||||||||||||
2005 | 10.89 | 0.24 | 0.62 | 0.86 | (0.19 | ) | (0.02 | ) | — | (0.21 | ) | 11.54 | 7.90 | 34,131 | 0.10 | 2.11 | 0.50 | 18 | ||||||||||||||||||||||||||||||||||
| SEI Asset Allocation Trust / Semi-Annual Report / September 30, 2009 | 41 |
Table of Contents
Financial Highlights
For the six months ended September 30, 2009 (Unaudited) and the years ended March 31,
For a Share Outstanding Throughout each Period
| Net Asset Value, Beginning of Year | Net Investment Income* | Net Realized and Unrealized Gains (Losses) from Affiliated Funds* | Total from Operations | Dividends from Net Investment Income | Distributions from Realized Capital Gains | Return of Capital | Total Dividends and Distributions | Net Asset Value, End of Year | Total Return† | Net Assets End of Year ($ Thousands) | Ratio of Net Expenses to Average Net Assets** | Ratio of Net Investment Income to Average Net Assets | Ratio of Expenses to Average Net Assets (Excluding Waivers and Reimbursement)** | Portfolio Turnover Rate | ||||||||||||||||||||||||||||||||||||||
Core Market Strategy Fund |
| |||||||||||||||||||||||||||||||||||||||||||||||||||
Class A | ||||||||||||||||||||||||||||||||||||||||||||||||||||
2009@ | $ | 7.47 | $ | 0.12 | $ | 1.68 | $ | 1.80 | $ | (0.08 | ) | $ | — | $ | — | $ | (0.08 | ) | $ | 9.19 | 24.15 | % | $ | 73,584 | 0.10 | % | 2.77 | % | 0.36 | % | 87 | % | ||||||||||||||||||||
2009 | 10.73 | 0.38 | (3.01 | ) | (2.63 | ) | (0.40 | ) | (0.23 | ) | — | (0.63 | ) | 7.47 | (24.87 | ) | 58,877 | 0.10 | 4.11 | 0.35 | 98 | |||||||||||||||||||||||||||||||
2008 | 11.72 | 0.43 | (0.70 | ) | (0.27 | ) | (0.55 | ) | (0.17 | ) | — | (0.72 | ) | 10.73 | (2.61 | ) | 106,247 | 0.10 | 3.72 | 0.34 | 22 | |||||||||||||||||||||||||||||||
2007 | 11.37 | 0.42 | 0.62 | 1.04 | (0.45 | ) | (0.24 | ) | — | (0.69 | ) | 11.72 | 9.35 | 99,465 | 0.10 | 3.62 | 0.34 | 37 | ||||||||||||||||||||||||||||||||||
2006 | 10.73 | 0.35 | 0.67 | 1.02 | (0.32 | ) | (0.06 | ) | — | (0.38 | ) | 11.37 | 9.68 | 84,048 | 0.10 | 3.18 | 0.35 | 42 | ||||||||||||||||||||||||||||||||||
2005 | 10.60 | 0.33 | 0.16 | 0.49 | (0.28 | ) | (0.08 | ) | — | (0.36 | ) | 10.73 | 4.66 | 40,602 | 0.10 | 3.09 | 0.46 | 55 | ||||||||||||||||||||||||||||||||||
Class I | ||||||||||||||||||||||||||||||||||||||||||||||||||||
2009@ | $ | 7.68 | $ | 0.15 | $ | 1.72 | $ | 1.87 | $ | (0.08 | ) | $ | — | $ | — | $ | (0.08 | ) | $ | 9.47 | 24.40 | % | $ | — | 0.10 | %†† | 3.53 | % | 0.36 | % | 87 | % | ||||||||||||||||||||
2009 | 11.00 | 0.41 | (3.10 | ) | (2.69 | ) | (0.40 | ) | (0.23 | ) | — | (0.63 | ) | 7.68 | (24.80 | )(1) | — | 0.10 | †† | 4.30 | 0.35 | 98 | ||||||||||||||||||||||||||||||
2008 | 12.01 | 0.43 | (0.73 | ) | (0.30 | ) | (0.54 | ) | (0.17 | ) | — | (0.71 | ) | 11.00 | (2.78 | )(1)(2) | — | 0.10 | †† | 3.60 | 0.34 | 22 | ||||||||||||||||||||||||||||||
2007 | 11.63 | 0.46 | 0.61 | 1.07 | (0.45 | ) | (0.24 | ) | — | (0.69 | ) | 12.01 | 9.40 | (1)(2) | — | 0.10 | †† | 3.94 | 0.34 | 37 | ||||||||||||||||||||||||||||||||
2006 | 10.88 | 0.43 | ^ | 0.70 | 1.13 | (0.32 | ) | (0.06 | ) | — | (0.38 | ) | 11.63 | 10.57 | (1)(2) | — | 0.10 | †† | 3.18 | 0.35 | 42 | |||||||||||||||||||||||||||||||
2005 | 10.62 | 0.43 | ^ | 0.19 | 0.62 | (0.28 | ) | (0.08 | ) | — | (0.36 | ) | 10.88 | 5.89 | (1)(2) | — | 0.10 | †† | 3.09 | 0.46 | 55 | |||||||||||||||||||||||||||||||
Core Market Strategy Allocation Fund |
| |||||||||||||||||||||||||||||||||||||||||||||||||||
Class A | ||||||||||||||||||||||||||||||||||||||||||||||||||||
2009@ | $ | 6.78 | $ | 0.04 | $ | 2.59 | $ | 2.63 | $ | (0.03 | ) | $ | — | $ | — | $ | (0.03 | ) | $ | 9.38 | 38.90 | % | $ | 18,557 | 0.10 | % | 1.06 | % | 0.36 | % | 27 | % | ||||||||||||||||||||
2009 | 12.12 | 0.25 | (5.20 | ) | (4.96 | ) | (0.23 | ) | (0.15 | ) | — | (0.38 | ) | 6.78 | (41.37 | ) | 14,278 | 0.10 | 2.55 | 0.35 | 165 | |||||||||||||||||||||||||||||||
2008 | 13.61 | 0.25 | (0.99 | ) | (0.74 | ) | (0.39 | ) | (0.36 | ) | — | (0.75 | ) | 12.12 | (6.01 | ) | 21,396 | 0.10 | 1.83 | 0.34 | 24 | |||||||||||||||||||||||||||||||
2007 | 12.92 | 0.25 | 1.12 | 1.37 | (0.30 | ) | (0.38 | ) | — | (0.68 | ) | 13.61 | 10.74 | 25,915 | 0.10 | 1.92 | 0.34 | 21 | ||||||||||||||||||||||||||||||||||
2006(7) | 11.32 | 0.19 | 1.74 | 1.93 | (0.17 | ) | (0.16 | ) | — | (0.33 | ) | 12.92 | 17.29 | 20,456 | 0.10 | 1.67 | 0.36 | 34 | ||||||||||||||||||||||||||||||||||
2005(5) | 21.08 | 0.56 | 0.46 | 1.02 | (0.42 | ) | (0.10 | ) | (10.26 | )(3) | (10.78 | ) | 11.32 | 5.53 | 13,474 | 0.10 | 2.61 | 0.57 | 159 | |||||||||||||||||||||||||||||||||
Market Growth Strategy Fund |
| |||||||||||||||||||||||||||||||||||||||||||||||||||
Class A | ||||||||||||||||||||||||||||||||||||||||||||||||||||
2009@ | $ | 6.94 | $ | 0.09 | $ | 2.10 | $ | 2.19 | $ | (0.05 | ) | $ | — | $ | — | $ | (0.05 | ) | $ | 9.08 | 31.73 | % | $ | 464,051 | 0.10 | % | 2.11 | % | 0.36 | % | 62 | % | ||||||||||||||||||||
2009 | 11.30 | 0.32 | (4.04 | ) | (3.72 | ) | (0.34 | ) | (0.30 | ) | — | (0.64 | ) | 6.94 | (33.37 | ) | 369,810 | 0.10 | 3.46 | 0.35 | 95 | |||||||||||||||||||||||||||||||
2008 | 12.71 | 0.39 | (1.03 | ) | (0.64 | ) | (0.59 | ) | (0.18 | ) | — | (0.77 | ) | 11.30 | (5.43 | ) | 717,739 | 0.10 | 3.11 | 0.34 | 18 | |||||||||||||||||||||||||||||||
2007 | 12.18 | 0.39 | 0.86 | 1.25 | (0.43 | ) | (0.29 | ) | — | (0.72 | ) | 12.71 | 10.50 | 726,306 | 0.10 | 3.15 | 0.34 | 14 | ||||||||||||||||||||||||||||||||||
2006 | 11.02 | 0.32 | 1.17 | 1.49 | (0.28 | ) | (0.05 | ) | — | (0.33 | ) | 12.18 | 13.72 | 466,959 | 0.10 | 2.74 | 0.35 | 44 | ||||||||||||||||||||||||||||||||||
2005 | 10.63 | 0.33 | 0.36 | 0.69 | (0.25 | ) | (0.05 | ) | — | (0.30 | ) | 11.02 | 6.50 | 208,538 | 0.10 | 2.98 | 0.40 | 8 | ||||||||||||||||||||||||||||||||||
Class I | ||||||||||||||||||||||||||||||||||||||||||||||||||||
2009@ | $ | 6.87 | $ | 0.07 | $ | 2.08 | $ | 2.15 | $ | (0.05 | ) | $ | — | $ | — | $ | (0.05 | ) | $ | 8.97 | 31.39 | % | $ | 7,585 | 0.35 | % | 1.85 | % | 0.61 | % | 62 | % | ||||||||||||||||||||
2009 | 11.18 | 0.31 | (4.00 | ) | (3.69 | ) | (0.32 | ) | (0.30 | ) | — | (0.62 | ) | 6.87 | (33.45 | ) | 5,289 | 0.35 | 3.39 | 0.60 | 95 | |||||||||||||||||||||||||||||||
2008 | 12.59 | 0.38 | (1.05 | ) | (0.67 | ) | (0.56 | ) | (0.18 | ) | — | (0.74 | ) | 11.18 | (5.70 | ) | 7,033 | 0.35 | 3.09 | 0.59 | 18 | |||||||||||||||||||||||||||||||
2007 | 12.04 | 0.41 | 0.84 | 1.25 | (0.41 | ) | (0.29 | ) | — | (0.70 | ) | 12.59 | 10.66 | (1)(2) | 4,650 | 0.35 | 3.23 | 0.59 | 14 | |||||||||||||||||||||||||||||||||
2006 | 10.84 | 0.36 | ^ | 1.17 | 1.53 | (0.28 | ) | (0.05 | ) | — | (0.33 | ) | 12.04 | 14.32 | (1)(2) | — | 0.10 | †† | 2.74 | 0.35 | 44 | |||||||||||||||||||||||||||||||
2005 | 10.58 | 0.15 | 0.41 | 0.56 | (0.25 | ) | (0.05 | ) | — | (0.30 | ) | 10.84 | 5.29 | — | 0.10 | †† | 2.98 | 0.40 | 8 | |||||||||||||||||||||||||||||||||
Market Growth Strategy Allocation Fund |
| |||||||||||||||||||||||||||||||||||||||||||||||||||
Class A | ||||||||||||||||||||||||||||||||||||||||||||||||||||
2009@ | $ | 8.15 | $ | 0.05 | $ | 3.11 | $ | 3.16 | $ | (0.04 | ) | $ | — | $ | — | $ | (0.04 | ) | $ | 11.27 | 38.83 | % | $ | 98,923 | 0.10 | % | 1.07 | % | 0.37 | % | 22 | % | ||||||||||||||||||||
2009 | 14.33 | 0.28 | (5.99 | ) | (5.71 | ) | (0.26 | ) | (0.21 | ) | — | (0.47 | ) | 8.15 | (40.18 | ) | 80,428 | 0.10 | 2.51 | 0.35 | 110 | |||||||||||||||||||||||||||||||
2008 | 15.95 | 0.30 | (1.20 | ) | (0.90 | ) | (0.46 | ) | (0.26 | ) | — | (0.72 | ) | 14.33 | (6.10 | ) | 166,544 | 0.10 | 1.85 | 0.34 | 21 | |||||||||||||||||||||||||||||||
2007 | 14.82 | 0.29 | 1.28 | 1.57 | (0.34 | ) | (0.10 | ) | — | (0.44 | ) | 15.95 | 10.69 | 185,677 | 0.10 | 1.91 | 0.34 | 10 | ||||||||||||||||||||||||||||||||||
2006(9) | 12.89 | 0.24 | 1.94 | 2.18 | (0.22 | ) | (0.03 | ) | — | (0.25 | ) | 14.82 | 17.02 | 127,791 | 0.10 | 1.77 | 0.36 | 8 | ||||||||||||||||||||||||||||||||||
2005(8) | 15.99 | 0.36 | 0.62 | 0.98 | (0.35 | ) | (0.16 | ) | (3.57 | )(3) | (4.08 | ) | 12.89 | 6.42 | 55,765 | 0.10 | 2.25 | 0.43 | 71 | |||||||||||||||||||||||||||||||||
| @ | For the six months ended September 30, 2009 (Unaudited). All ratios have been annualized. |
| (1) | Class I shares have not been marketed and have a limited number of shares outstanding. |
| (2) | The total return in Class I exceeds Class A due to rounding. |
| (3) | For more information see footnote 7 in the Notes to Financial Statements. |
| (4) | Per share amounts have been restated for a 1 for 4 reverse stock split paid to shareholders of record on May 6, 2005. For more information see Notes 8 and 11 in the Notes to Financial Statements. |
| (5) | Per share amounts have been restated for a 1 for 2 reverse stock split paid to shareholders of record on May 6, 2005. For more information see Notes 8 and 11 in the Notes to Financial Statements. |
| (6) | Per share amounts have been adjusted for a 1 for 4 reverse stock split paid to shareholders of record on May 6, 2005. For more information see Note 8 in the Notes to Financial Statements. |
| (7) | Per share amounts have been adjusted for a 1 for 2 reverse stock split paid to shareholders of record on May 6, 2005. For more information see Note 8 in the Notes to Financial Statements. |
| (8) | Per share amounts have been restated for a 2 for 3 reverse stock split paid to shareholders of record on May 6, 2005. For more information see Notes 8 and 11 in the Notes to Financial Statements. |
| (9) | Per share amounts have been adjusted for a 2 for 3 reverse stock split paid to shareholders of record on May 6, 2005. For more information see Note 8 in the Notes to Financial Statements. |
| † | Returns are for the period indicated and have not been annualized. Returns shown do not reflect the deduction of taxes that a shareholder would pay on fund distributions or the redemption of fund shares. |
| †† | Excludes a 0.25% Administrative Servicing Fee which currently is not being charged due to the immaterial amount. |
| * | Per share calculations were performed using average shares. |
| ** | The expense ratios do not include expenses of the underlying affiliated investment companies. |
| ^ | The per share amounts for net investment income (loss) between classes does not accord with the ratios of net investment income (loss) between classes due to the size of Class I relative to the other classes. |
The accompanying notes are an integral part of the financial statements.
| 42 | SEI Asset Allocation Trust / Semi-Annual Report / September 30, 2009 |
Table of Contents
Notes to Financial Statements (Unaudited)
September 30, 2009
1. ORGANIZATION
SEI Asset Allocation Trust (the “Trust”) is organized as a Massachusetts Business Trust under a Declaration of Trust dated November 20, 1995. The Trust is registered under the Investment Company Act of 1940, as amended (“1940 Act”), as an open-end investment company with nineteen diversified Funds: Diversified Conservative Income Fund, Diversified Conservative Fund, Diversified Global Moderate Growth Fund, Diversified Moderate Growth Fund, Diversified Global Growth Fund, Diversified Global Stock Fund, Diversified U.S. Stock Fund, Defensive Strategy Fund, Defensive Strategy Allocation Fund, Conservative Strategy Fund, Conservative Strategy Allocation Fund, Moderate Strategy Fund, Moderate Strategy Allocation Fund, Aggressive Strategy Fund, Tax-Managed Aggressive Strategy Fund, Core Market Strategy Fund, Core Market Strategy Allocation Fund, Market Growth Strategy Fund and Market Growth Strategy Allocation Fund (each a “Fund,” collectively the “Funds”). Each Fund is a “fund of funds” and offers shareholders the opportunity to invest in certain underlying affiliated investment companies, which are separately-managed series of the following investment companies: SEI Daily Income Trust, SEI Institutional Managed Trust, SEI Institutional International Trust, and SEI Liquid Asset Trust. The Declaration of Trust permits the Trust to offer separate classes of shares in each Fund, as follows: Diversified Conservative Income Fund, Diversified Conservative Fund, Diversified Global Moderate Growth Fund, Diversified Moderate Growth Fund, Diversified Global Growth Fund, Diversified Global Stock Fund and Diversified U.S. Stock Fund offer Class A Shares, Class D Shares, and Class I Shares; Defensive Strategy Fund, Conservative Strategy Fund, Moderate Strategy Fund, Aggressive Strategy Fund, Core Market Strategy Fund and Market Growth Strategy Fund offer Class A and Class I Shares (formerly Class D Shares); Defensive Strategy Allocation Fund, Conservative Strategy Allocation Fund, Moderate Strategy Allocation Fund, Tax-Managed Aggressive Strategy Fund, Core Market Strategy Allocation Fund, and Market Growth Strategy Allocation Fund offer Class A Shares. The assets of each Fund are segregated, and a shareholder’s interest is limited to the Fund in which shares are held. The Trust’s prospectus provides a description of each Fund’s investment objective, policies and strategies.
2. SIGNIFICANT ACCOUNTING POLICIES
The following is a summary of the significant accounting policies followed by the Funds.
Financial Accounting Standards Board (“FASB”) Launches Accounting Standards Codification — The FASB has issued FASB ASC 105 (formerly FASB Statement No. 168), The “FASB Accounting Standards Codification™” and the Hierarchy of Generally Accepted Accounting Principles (“ASC 105”). ASC 105 established the FASB Accounting Standards Codification™ (“Codification” or “ASC”) as the single source of authoritative U.S. generally accepted accounting principles (“GAAP”) recognized by the FASB to be applied by
nongovernmental entities. Rules and interpretive releases of the Securities and Exchange Commission (“SEC”) under authority of federal securities laws are also sources of authoritative GAAP for SEC registrants. The Codification supersedes all existing non-SEC accounting and reporting standards. All other non-grandfathered, non-SEC accounting literature not included in the Codification will become non-authoritative.
Following the Codification, the FASB will not issue new standards in the form of Statements, FASB Staff Positions or Emerging Issues Task Force Abstracts. Instead, it will issue Accounting Standards Updates, which will serve to update the Codification, provide background information about the guidance and provide the basis for conclusions on the changes to the Codification.
GAAP is not intended to be changed as a result of the FASB’s Codification project, but it will change the way the guidance is organized and presented. As a result, these changes will have a significant impact on how companies reference GAAP in their financial statements and in their accounting policies for financial statements issued for interim and annual periods ending after September 15, 2009. The Trust has implemented the Codification as of September 30, 2009.
Use of Estimates — The preparation of financial statements, in conformity with accounting principles generally accepted in the United States of America, requires management to make estimates and assumptions that affect the reported amount of assets and liabilities and disclosure of contingent assets at the date of the financial statements, and the reported results of operations during the reporting period. Actual results could differ from those estimates.
Security Valuation — The assets of each Fund consist primarily of the investments in underlying affiliated investment companies, which are valued at their respective daily net asset values in accordance with Board-approved pricing procedures.
In accordance with ASC 820 (formerly known as FAS 157 “Fair Value Measurements”), fair value is defined as the price that a Fund would receive upon selling an investment in a timely transaction to an independent buyer in the principal or most advantageous market of the investment. ASC 820 established a three-tier hierarchy to maximize the use of observable and minimize the use of unobservable inputs and to establish classification of fair value measurements for disclosure purposes. Inputs refer broadly to the assumptions that market participants would use in pricing an asset. Inputs may be observable or unobservable. Observable inputs are inputs that reflect the assumptions market participants would use in pricing the asset or liability based on market data obtained from sources independent of the reporting entity. Unobservable inputs are inputs that reflect the reporting entity’s own assumptions about the assumptions market participants would use in pricing the asset or liability based on the best information available in the circumstances.
| SEI Asset Allocation Trust / Semi-Annual Report / September 30, 2009 | 43 |
Table of Contents
Notes to Financial Statements (Unaudited) (Continued)
September 30, 2009
The three-tier hierarchy of inputs is summarized in the three broad Levels listed below:
Level 1 — quoted prices in active markets for identical investments
Level 2 — other significant observable inputs (including quoted prices for similar investments, interest rates, prepayment speeds, credit risks, etc.)
Level 3 — significant unobservable inputs (including the Fund’s own assumptions in determining the fair value of investments)
The valuation techniques used by the Funds to measure fair value in accordance with ASC 820 during the six months ended September 30, 2009 maximized the use of observable inputs and minimized the use of unobservable inputs.
As of September 30, 2009, all of the Fund’s investments are Level 1.
For the six months ended September 30, 2009, there have been no significant changes to the Funds’ fair valuation methodologies.
Security Transactions and Related Income — Security transactions are accounted for on trade date. Dividend income received from the affiliated funds is recognized on the ex-dividend date and is recorded as income distributions in the Statement of Operations. Capital gain distributions received from the affiliated funds are recognized on ex-dividend date and are recorded on the Statement of Operations as such. Costs used in determining realized gains and losses on the sales of investment securities are on the basis of specific identification.
Classes — Class-specific expenses are borne by that class of shares. Income, realized and unrealized gains/losses and non-class-specific expenses are allocated to the respective classes on the basis of relative daily net assets.
Expenses — Expenses that are directly related to one of the Funds are charged directly to that Fund. Other operating expenses of the Trust are allocated to the Funds on the basis of relative daily net assets.
Expenses included in the accompanying financial statements reflect the expenses of each Fund and do not include any expenses associated with the underlying funds.
Dividends and Distributions to Shareholders — Dividends and distributions to shareholders which are determined in accordance with Federal tax regulations are recorded on the ex-dividend date. Distributions from net investment income are declared and paid to shareholders periodically for each Fund. Any net realized capital gain for each Fund is distributed to shareholders at least annually.
3. AGREEMENTS AND OTHER TRANSACTIONS WITH AFFILIATES
Administration and Transfer Agency Agreement — SEI Investments Global Funds Services (the “Administrator”) provides the Trust with administrative and transfer agency services. For its services, the Administrator is entitled to a fee, which is calculated daily and paid
monthly, at an annual rate of 0.20% of the average daily net assets of each Fund. The Administrator has voluntarily agreed to waive all or a portion of its fees, exclusive of Acquired Fund Fee Expenses and to reimburse the Funds so that the total annual expenses of each Fund will not exceed the expense limitations adopted by the Administrator. These waivers and reimbursements may be terminated by the Administrator at any time at its sole discretion. The following are the voluntary expense limitations:
| Class A | Class D | Class I | |||||||
Diversified Conservative Income Fund | 0.12 | % | 1.12 | % | 0.37 | % | |||
Diversified Conservative Fund | 0.12 | % | 1.12 | % | 0.37 | % | |||
Diversified Global Moderate Growth Fund | 0.12 | % | 1.12 | % | 0.37 | % | |||
Diversified Moderate Growth Fund | 0.12 | % | 1.12 | % | 0.37 | % | |||
Diversified Global Growth Fund | 0.12 | % | 1.12 | % | 0.37 | % | |||
Diversified Global Stock Fund | 0.12 | % | 1.12 | % | 0.37 | % | |||
Diversified U.S. Stock Fund | 0.12 | % | 1.12 | % | 0.37 | % | |||
Defensive Strategy Fund | 0.10 | % | — | 0.35 | %* | ||||
Defensive Strategy Allocation Fund | 0.10 | % | — | — | |||||
Conservative Strategy Fund | 0.10 | % | — | 0.35 | % | ||||
Conservative Strategy Allocation Fund | 0.10 | % | — | — | |||||
Moderate Strategy Fund | 0.10 | % | — | 0.35 | % | ||||
Moderate Strategy Allocation Fund | 0.10 | % | — | — | |||||
Aggressive Strategy Fund | 0.10 | % | — | 0.35 | % | ||||
Tax-Managed Aggressive Strategy Fund | 0.10 | % | — | — | |||||
Core Market Strategy Fund | 0.10 | % | — | 0.35 | %* | ||||
Core Market Strategy Allocation Fund | 0.10 | % | — | — | |||||
Market Growth Strategy Fund | 0.10 | % | — | 0.35 | % | ||||
Market Growth Strategy Allocation Fund | 0.10 | % | — | — |
* Includes a 0.25% Administrative Servicing Fee which currently is not being charged to the Class due to the immaterial amount.
Distribution, Administrative Servicing and Shareholder Servicing Agreements — SEI Investments Distribution Co. (the “Distributor”), a wholly owned subsidiary of SEI Investments Company (“SEI”) and a registered broker-dealer, acts as the Distributor of the shares of the Trust under a Distribution Agreement. The Trust has adopted plans under which firms, including the Distributor, that provide shareholder and administrative services may receive compensation thereof. Specific classes of certain funds have also adopted distribution plans, pursuant to Rule 12b-1 under the Investment Company Act of 1940. Such plans provide fees payable to the Distributor equal to the following amounts, calculated as a percentage of the average daily net assets attributable to each particular class of each respective fund.
| 44 | SEI Asset Allocation Trust / Semi-Annual Report / September 30, 2009 |
Table of Contents
Shareholder Servicing Fees | Administrative Servicing Fees | Distribution Fees* | |||||||
Diversified Conservative Income Fund | |||||||||
Class D | 0.25 | % | — | 0.75 | % | ||||
Class I | — | 0.25 | % | — | |||||
Diversified Conservative Fund | |||||||||
Class D | 0.25 | % | — | 0.75 | % | ||||
Class I | — | 0.25 | % | — | |||||
Diversified Global Moderate Growth Fund | |||||||||
Class D | 0.25 | % | — | 0.75 | % | ||||
Class I | — | 0.25 | % | — | |||||
Diversified Moderate Growth Fund | |||||||||
Class D | 0.25 | % | — | 0.75 | % | ||||
Class I | — | 0.25 | % | — | |||||
Diversified Global Growth Fund | |||||||||
Class D | 0.25 | % | — | 0.75 | % | ||||
Class I | — | 0.25 | % | — | |||||
Diversified Global Stock Fund | |||||||||
Class D | 0.25 | % | — | 0.75 | % | ||||
Class I | — | 0.25 | % | — | |||||
Diversified U.S. Stock Fund | |||||||||
Class D | 0.25 | % | — | 0.75 | % | ||||
Class I | — | 0.25 | % | — | |||||
Defensive Strategy Fund | |||||||||
Class I | — | 0.25 | %** | — | |||||
Conservative Strategy Fund | |||||||||
Class I | — | 0.25 | % | — | |||||
Moderate Strategy Fund | |||||||||
Class I | — | 0.25 | % | — | |||||
Aggressive Strategy Fund | |||||||||
Class I | — | 0.25 | % | — | |||||
Core Market Strategy Fund | |||||||||
Class I | — | 0.25 | %** | — | |||||
Market Growth Strategy Fund | |||||||||
Class I | — | 0.25 | % | — |
* These payments are characterized as “compensation” and are not directly tied to expenses incurred by the Distributor. The payments the Distributor receives during any year may therefore be higher or lower than its actual expenses.
** This fee is not currently being charged to the Class due to the immaterial amount.
The Distributor may voluntarily waive all or a portion of the shareholder servicing fees for Class D of each fund. Such waivers are voluntary and may be discontinued at any time. There were no waivers by the Distributor during the six months ended September 30, 2009.
Certain officers and Trustees of the Trust are also officers and/or Directors of the Administrator or the Adviser. The Trust pays each unaffiliated Trustee an annual fee for attendance at quarterly, interim, and committee meetings. The Administrator or the Adviser pays compensation of officers and affiliated Trustees.
A portion of the services provided by the Chief Compliance Officer (“CCO”) and his staff, whom are employees of the Administrator, are paid for by the Trust as incurred. The services include regulatory oversight of the Trust’s Adviser and service providers as required by SEC regulations. The CCO’s services have been approved by and are reviewed by the Board.
Investment Advisory Agreement — SEI Investments Management Corporation (“SIMC”) serves as investment adviser (the “Adviser”) to each Fund. In connection with serving as investment adviser, SIMC is entitled to a fee, which is calculated daily and paid monthly, at an annual rate of 0.10% of each Fund’s average daily net assets.
The Administrator, Distributor, and Adviser for the Trust serve in the same capacity for the underlying affiliated investment companies.
SIMC is the sole shareholder of Class I Shares of Defensive Strategy Fund and Core Market Strategy Fund.
| SEI Asset Allocation Trust / Semi-Annual Report / September 30, 2009 | 45 |
Table of Contents
Notes to Financial Statements (Unaudited) (Continued)
September 30, 2009
4. CAPITAL SHARE TRANSACTIONS
Capital Share Transactions for the Funds were as follows (Thousands):
For the six months ended September 30, 2009 and the year ended March 31, 2009
| Diversified Conservative Income Fund | Diversified Conservative Fund | Diversified Global Moderate Growth Fund | Diversified Moderate Growth Fund | |||||||||||||||||||||
| 4/01/09 – 9/30/09 | 4/01/08 – 3/31/09 | 4/01/09 – 9/30/09 | 4/01/08 – 3/31/09 | 4/01/09 – 9/30/09 | 4/01/08 – 3/31/09 | 4/01/09 – 9/30/09 | 4/01/08 – 3/31/09 | |||||||||||||||||
Shares Issued and Redeemed: |
| |||||||||||||||||||||||
Class A: | ||||||||||||||||||||||||
Shares Issued | 248 | 1,044 | 443 | 1,284 | 712 | 2,557 | 626 | 1,475 | ||||||||||||||||
Shares Issued in Lieu of Cash Distributions | 25 | 164 | 35 | 295 | 72 | 925 | 36 | 568 | ||||||||||||||||
Shares Redeemed | (528 | ) | (1,781 | ) | (809 | ) | (3,250 | ) | (1,340 | ) | (4,494 | ) | (1,378 | ) | (7,866 | ) | ||||||||
Total Class A Transactions | (255 | ) | (573 | ) | (331 | ) | (1,671 | ) | (556 | ) | (1,012 | ) | (716 | ) | (5,823 | ) | ||||||||
Class D: | ||||||||||||||||||||||||
Shares Issued | 16 | 125 | 31 | 96 | 21 | 52 | 64 | 140 | ||||||||||||||||
Shares Issued in Lieu of Cash Distributions | 4 | 21 | 3 | 24 | 1 | 17 | 3 | 58 | ||||||||||||||||
Shares Redeemed | (19 | ) | (105 | ) | (53 | ) | (109 | ) | (9 | ) | (258 | ) | (47 | ) | (337 | ) | ||||||||
Total Class D Transactions | 1 | 41 | (19 | ) | 11 | 13 | (189 | ) | 20 | (139 | ) | |||||||||||||
Class I: | ||||||||||||||||||||||||
Shares Issued | 120 | 211 | 109 | 271 | 309 | 782 | 160 | 416 | ||||||||||||||||
Shares Issued in Lieu of Cash Distributions | 3 | 16 | 5 | 36 | 15 | 211 | 6 | 89 | ||||||||||||||||
Shares Redeemed | (34 | ) | (266 | ) | (130 | ) | (306 | ) | (516 | ) | (985 | ) | (190 | ) | (543 | ) | ||||||||
Total Class I Transactions | 89 | (39 | ) | (16 | ) | 1 | (192 | ) | 8 | (24 | ) | (38 | ) | |||||||||||
Decrease in Capital Shares | (165 | ) | (571 | ) | (366 | ) | (1,659 | ) | (735 | ) | (1,193 | ) | (720 | ) | (6,000 | ) | ||||||||
Diversified Global Growth Fund | Diversified Global Stock Fund | Diversified U.S. Stock Fund | ||||||||||||||||
| 4/01/09 – 9/30/09 | 4/01/08 – 3/31/09 | 4/01/09 – 9/30/09 | 4/01/08 – 3/31/09 | 4/01/09 – 9/30/09 | 4/01/08 – 3/31/09 | |||||||||||||
Shares Issued and Redeemed: | ||||||||||||||||||
Class A: | ||||||||||||||||||
Shares Issued | 745 | 2,514 | 757 | 2,238 | 377 | 730 | ||||||||||||
Shares Issued in Lieu of Cash Distributions | 35 | 1,052 | 4 | 92 | 3 | 43 | ||||||||||||
Shares Redeemed | (1,975 | ) | (6,142 | ) | (1,017 | ) | (2,764 | ) | (449 | ) | (1,145 | ) | ||||||
Total Class A Transactions | (1,195 | ) | (2,576 | ) | (256 | ) | (434 | ) | (69 | ) | (372 | ) | ||||||
Class D: | ||||||||||||||||||
Shares Issued | 46 | 112 | 29 | 116 | 32 | 84 | ||||||||||||
Shares Issued in Lieu of Cash Distributions | 1 | 50 | — | 4 | — | 2 | ||||||||||||
Shares Redeemed | (32 | ) | (175 | ) | (34 | ) | (99 | ) | (42 | ) | (136 | ) | ||||||
Total Class D Transactions | 15 | (13 | ) | (5 | ) | 21 | (10 | ) | (50 | ) | ||||||||
Class I: | ||||||||||||||||||
Shares Issued | 427 | 1,012 | 183 | 664 | 69 | 106 | ||||||||||||
Shares Issued in Lieu of Cash Distributions | 11 | 329 | — | 19 | — | 4 | ||||||||||||
Shares Redeemed | (522 | ) | (1,256 | ) | (193 | ) | (700 | ) | (42 | ) | (100 | ) | ||||||
Total Class I Transactions | (84 | ) | 85 | (10 | ) | (17 | ) | 27 | 10 | |||||||||
Decrease in Capital Shares | (1,264 | ) | (2,504 | ) | (271 | ) | (430 | ) | (52 | ) | (412 | ) | ||||||
| 46 | SEI Asset Allocation Trust / Semi-Annual Report / September 30, 2009 |
Table of Contents
Capital Share Transactions for the Funds were as follows (Thousands):
For the six months ended September 30, 2009 and the year ended March 31, 2009
Defensive Strategy Fund | Defensive Strategy Allocation Fund | Conservative Strategy Fund | ||||||||||||||||
| 4/01/09 – 9/30/09 | 4/01/08 – 3/31/09 | 4/01/09 – 9/30/09 | 4/01/08 – 3/31/09 | 4/01/09 – 9/30/09 | 4/01/08 – 3/31/09 | |||||||||||||
Shares Issued and Redeemed: | ||||||||||||||||||
Class A: | ||||||||||||||||||
Shares Issued | 597 | 4,390 | 115 | 1,557 | 1,693 | 10,510 | ||||||||||||
Shares Issued in Lieu of Cash Distributions | 12 | 133 | 11 | 118 | 74 | 501 | ||||||||||||
Shares Redeemed | (1,685 | ) | (4,304 | ) | (405 | ) | (1,834 | ) | (2,863 | ) | (10,580 | ) | ||||||
Total Class A Transactions | (1,076 | ) | 219 | (279 | ) | (159 | ) | (1,096 | ) | 431 | ||||||||
Class I: | ||||||||||||||||||
Shares Issued | — | — | N/A | N/A | 35 | 89 | ||||||||||||
Shares Issued in Lieu of Cash Distributions | — | — | N/A | N/A | 1 | 5 | ||||||||||||
Shares Redeemed | — | — | N/A | N/A | (19 | ) | (69 | ) | ||||||||||
Total Class I Transactions | — | — | N/A | N/A | 17 | 25 | ||||||||||||
Increase (Decrease) in | ||||||||||||||||||
Capital Shares | (1,076 | ) | 219 | (279 | ) | (159 | ) | (1,079 | ) | 456 | ||||||||
| Amounts | designated as “—” are $0 or have been rounded to $0. |
| N/A | — Not applicable. Class I shares currently not offered. |
Conservative Strategy Allocation Fund | Moderate Strategy Fund | Moderate Strategy Allocation Fund | ||||||||||||||||
| 4/01/09 – 9/30/09 | 4/01/08 – 3/31/09 | 4/01/09 – 9/30/09 | 4/01/08 – 3/31/09 | 4/01/09 – 9/30/09 | 4/01/08 – 3/31/09 | |||||||||||||
Shares Issued and Redeemed: | ||||||||||||||||||
Class A: | ||||||||||||||||||
Shares Issued | 664 | 3,822 | 3,374 | 10,318 | 677 | 6,656 | ||||||||||||
Shares Issued in Lieu of Cash Distributions | 21 | 256 | 216 | 1,834 | 37 | 432 | ||||||||||||
Shares Redeemed | (500 | ) | (5,234 | ) | (4,275 | ) | (23,102 | ) | (1,175 | ) | (8,960 | ) | ||||||
Total Class A Transactions | 185 | (1,156 | ) | (685 | ) | (10,950 | ) | (461 | ) | (1,872 | ) | |||||||
Class I: | ||||||||||||||||||
Shares Issued | N/A | N/A | 33 | 110 | N/A | N/A | ||||||||||||
Shares Issued in Lieu of Cash Distributions | N/A | N/A | 1 | 5 | N/A | N/A | ||||||||||||
Shares Redeemed | N/A | N/A | (32 | ) | (77 | ) | N/A | N/A | ||||||||||
Total Class I Transactions | N/A | N/A | 2 | 38 | N/A | N/A | ||||||||||||
Increase (Decrease) in Capital Shares | 185 | (1,156 | ) | (683 | ) | (10,912 | ) | (461 | ) | (1,872 | ) | |||||||
| Aggressive Strategy Fund | Tax-Managed Aggressive Strategy Fund | Core Market Strategy Fund | ||||||||||||||||
| 4/01/09 – 9/30/09 | 4/01/08 – 3/31/09 | 4/01/09 – 9/30/09 | 4/01/08 – 3/31/09 | 4/01/09 – 9/30/09 | 4/01/08 – 3/31/09 | |||||||||||||
Shares Issued and Redeemed: | ||||||||||||||||||
Class A: | ||||||||||||||||||
Shares Issued | 4,526 | 22,088 | 438 | 11,529 | 1,142 | 4,545 | ||||||||||||
Shares Issued in Lieu of Cash Distributions | 154 | 3,249 | 22 | 236 | 69 | 641 | ||||||||||||
Shares Redeemed | (4,673 | ) | (24,742 | ) | (1,170 | ) | (12,630 | ) | (1,088 | ) | (7,208 | ) | ||||||
Total Class A Transactions | 7 | 595 | (710 | ) | (865 | ) | 123 | (2,022 | ) | |||||||||
Class I: | ||||||||||||||||||
Shares Issued | 370 | 447 | N/A | N/A | — | — | ||||||||||||
Shares Issued in Lieu of Cash Distributions | 3 | 37 | N/A | N/A | — | — | ||||||||||||
Shares Redeemed | (53 | ) | (429 | ) | N/A | N/A | — | — | ||||||||||
Total Class I Transactions | 320 | 55 | N/A | N/A | — | — | ||||||||||||
Increase (Decrease) in Capital Shares | 327 | 650 | (710 | ) | (865 | ) | 123 | (2,022 | ) | |||||||||
| SEI Asset Allocation Trust / Semi-Annual Report / September 30, 2009 | 47 |
Table of Contents
Notes to Financial Statements (Unaudited) (Continued)
September 30, 2009
Capital Share Transactions for the Funds were as follows (Thousands):
For the six months ended September 30, 2009 and the year ended March 31, 2009
| Core Market Strategy Allocation Fund | Market Growth Strategy Fund | Market Growth Strategy Allocation Fund | ||||||||||||||||
| 4/01/09 – 9/30/09 | 4/01/08 – 3/31/09 | 4/01/09 – 9/30/09 | 4/01/08 – 3/31/09 | 4/01/09 – 9/30/09 | 4/01/08 – 3/31/09 | |||||||||||||
Shares Issued and Redeemed: | ||||||||||||||||||
Class A: | ||||||||||||||||||
Shares Issued | 135 | 4,296 | 5,621 | 30,426 | 609 | 18,167 | ||||||||||||
Shares Issued in Lieu of Cash Distributions | 8 | 113 | 346 | 4,792 | 35 | 643 | ||||||||||||
Shares Redeemed | (269 | ) | (4,069 | ) | (8,085 | ) | (45,498 | ) | (1,732 | ) | (20,561 | ) | ||||||
Total Class A Transactions | (126 | ) | 340 | (2,118 | ) | (10,280 | ) | (1,088 | ) | (1,751 | ) | |||||||
Class I: | ||||||||||||||||||
Shares Issued | N/A | N/A | 195 | 615 | N/A | N/A | ||||||||||||
Shares Issued in Lieu of Cash Distributions | N/A | N/A | 5 | 42 | N/A | N/A | ||||||||||||
Shares Redeemed | N/A | N/A | (124 | ) | (516 | ) | N/A | N/A | ||||||||||
Total Class I Transactions | N/A | N/A | 76 | 141 | N/A | N/A | ||||||||||||
Increase (Decrease) in Capital Shares | (126 | ) | 340 | (2,042 | ) | (10,139 | ) | (1,088 | ) | (1,751 | ) | |||||||
Amounts designated as “—” are $0 or have been rounded to $0.
N/A — Not applicable. Class I shares currently not offered.
5. INVESTMENT TRANSACTIONS
The cost of security purchases and the proceeds from the sale of securities during the period ended September 30, 2009, were as follows ($ Thousands):
| Total | |||
Diversified Conservative Income Fund | |||
Purchases | $ | 32,805 | |
Sales | 35,031 | ||
Diversified Conservative Fund | |||
Purchases | 42,850 | ||
Sales | 46,055 | ||
Diversified Global Moderate Growth Fund | |||
Purchases | 79,863 | ||
Sales | 88,219 | ||
Diversified Moderate Growth Fund | |||
Purchases | 57,349 | ||
Sales | 63,907 | ||
Diversified Global Growth Fund | |||
Purchases | 57,794 | ||
Sales | 68,485 | ||
Diversified Global Stock Fund | |||
Purchases | 15,467 | ||
Sales | 18,191 | ||
Diversified U.S. Stock Fund | |||
Purchases | 6,852 | ||
Sales | 7,465 | ||
Defensive Strategy Fund | |||
Purchases | 8,038 | ||
Sales | 9,032 | ||
Defensive Strategy Allocation Fund | |||
Purchases | 5,387 | ||
Sales | 7,414 | ||
Conservative Strategy Fund | |||
Purchases | 32,391 | ||
Sales | 41,055 | ||
Conservative Strategy Allocation Fund | |||
Purchases | 14,500 | ||
Sales | 13,113 | ||
Moderate Strategy Fund | |||
Purchases | 163,708 | ||
Sales | 167,973 | ||
| Total | ||
Moderate Strategy Allocation Fund | ||
Purchases | 22,756 | |
Sales | 27,222 | |
Aggressive Strategy Fund | ||
Purchases | 86,644 | |
Sales | 84,750 | |
Tax-Managed Aggressive Strategy Fund | ||
Purchases | 12,189 | |
Sales | 18,594 | |
Core Market Strategy Fund | ||
Purchases | 58,535 | |
Sales | 57,503 | |
Core Market Strategy Allocation Fund | ||
Purchases | 4,540 | |
Sales | 5,573 | |
Market Growth Strategy Fund | ||
Purchases | 264,351 | |
Sales | 279,922 | |
Market Growth Strategy Allocation Fund | ||
Purchases | 20,349 | |
Sales | 30,841 |
6. FEDERAL TAX INFORMATION
It is each Fund’s intention to continue to qualify as a regulated investment company under Subchapter M of the Internal Revenue Code for Federal income tax purposes and distribute all of its taxable income (including net capital gains). Accordingly, no provision for Federal income taxes is required.
Management has analyzed the Funds’ tax position taken on federal income tax returns for all open tax years and has concluded that as of March 31, 2009, no provision for income tax would be required in the Funds’ financial statements. The Funds’ federal and state income and federal excise tax returns for tax years for which the applicable statutes of limitations have not expired are subject to examination by the Internal Revenue Service and state departments of revenue.
| 48 | SEI Asset Allocation Trust / Semi-Annual Report / September 30, 2009 |
Table of Contents
Reclassification of Components of Net Assets — The timing and characterization of certain income and capital gains distributions are determined annually in accordance with Federal tax regulations which may differ from accounting principles generally accepted in the United States of America. As a result, net investment income (loss) and net realized gain (loss) on investment transactions for a
reporting period may differ significantly from distributions during such period. These book/tax differences may be temporary or permanent in nature. To the extent these differences are permanent, they are charged or credited to paid-in capital, accumulated net realized gain (loss) or undistributed net investment income (loss), as appropriate, in the period that the differences arise.
The tax character of dividends and distributions paid during the years ended March 31, 2009 and March 31, 2008 were as follows ($ Thousands):
Ordinary Income | Long-term Capital Gain | Totals | ||||||||||||||||
| 2009 | 2008 | 2009 | 2008 | 2009 | 2008 | |||||||||||||
Diversified Conservative Income Fund | $ | 1,631 | $ | 2,675 | $ | 288 | $ | 245 | $ | 1,919 | $ | 2,920 | ||||||
Diversified Conservative Fund | 2,096 | 4,239 | 842 | 1,514 | 2,938 | 5,753 | ||||||||||||
Diversified Global Moderate Growth Fund | 4,640 | 10,031 | 4,248 | 3,826 | 8,888 | 13,857 | ||||||||||||
Diversified Moderate Growth Fund | 3,143 | 13,446 | 3,042 | 6,740 | 6,185 | 20,186 | ||||||||||||
Diversified Global Growth Fund | 3,488 | 12,749 | 7,528 | 5,865 | 11,016 | 18,614 | ||||||||||||
Diversified Global Stock Fund | 948 | 5,241 | — | — | 948 | 5,241 | ||||||||||||
Diversified U.S. Stock Fund | 497 | 2,278 | — | — | 497 | 2,278 | ||||||||||||
Defensive Strategy Fund | 1,312 | 4,280 | — | 562 | 1,312 | 4,842 | ||||||||||||
Defensive Strategy Allocation Fund | 771 | 1,103 | 259 | 555 | 1,030 | 1,658 | ||||||||||||
Conservative Strategy Fund | 4,718 | 7,487 | — | 1,003 | 4,718 | 8,490 | ||||||||||||
Conservative Strategy Allocation Fund | 1,583 | 2,439 | 552 | 617 | 2,135 | 3,056 | ||||||||||||
Moderate Strategy Fund | 15,134 | 24,890 | 1,810 | 4,359 | 16,944 | 29,249 | ||||||||||||
Moderate Strategy Allocation Fund | 3,032 | 5,709 | 1,431 | 1,421 | 4,463 | 7,130 | ||||||||||||
Aggressive Strategy Fund | 10,221 | 21,199 | 14,196 | 6,679 | 24,417 | 27,878 | ||||||||||||
Tax-Managed Aggressive Strategy Fund | 1,981 | 3,352 | 149 | 1,652 | 2,130 | 5,004 | ||||||||||||
Core Market Strategy Fund | 3,470 | 5,407 | 1,868 | 1,323 | 5,338 | 6,730 | ||||||||||||
Core Market Strategy Allocation Fund | 535 | 846 | 406 | 581 | 941 | 1,427 | ||||||||||||
Market Growth Strategy Fund | 20,850 | 37,690 | 17,398 | 10,383 | 38,248 | 48,073 | ||||||||||||
Market Growth Strategy Allocation Fund | 3,563 | 5,900 | 2,632 | 3,089 | 6,195 | 8,989 | ||||||||||||
As of March 31, 2009, the components of Accumulated Losses on a tax basis were as follows ($ Thousands):
| Undistributed Ordinary Income | Undistributed Long-Term Capital Gain | Capital Loss Carryforwards | Post- October Losses | Unrealized Depreciation | Total Accumulated Losses | |||||||||||||||||
Diversified Conservative Income Fund | $ | 14 | $ | — | $ | (565 | ) | $ | (210 | ) | $ | (10,396 | ) | $ | (11,157 | ) | ||||||
Diversified Conservative Fund | 16 | — | (1,716 | ) | (603 | ) | (16,821 | ) | (19,124 | ) | ||||||||||||
Diversified Global Moderate Growth Fund | 30 | — | (1,861 | ) | (165 | ) | (65,736 | ) | (67,732 | ) | ||||||||||||
Diversified Moderate Growth Fund | 16 | — | (3,583 | ) | (4,046 | ) | (40,486 | ) | (48,099 | ) | ||||||||||||
Diversified Global Growth Fund | 15 | — | (4,200 | ) | (2,479 | ) | (82,270 | ) | (88,934 | ) | ||||||||||||
Diversified Global Stock Fund | 731 | — | — | (1 | ) | (52,050 | ) | (51,320 | ) | |||||||||||||
Diversified U.S. Stock Fund | — | — | (12,041 | ) | (144 | ) | (28,572 | ) | (40,757 | ) | ||||||||||||
Defensive Strategy Fund | 7 | — | (3,961 | ) | (1 | ) | (3,153 | ) | (7,108 | ) | ||||||||||||
Defensive Strategy Allocation Fund | 5 | — | (94 | ) | (1,968 | ) | (5,504 | ) | (7,561 | ) | ||||||||||||
Conservative Strategy Fund | 33 | — | (10,204 | ) | (975 | ) | (27,132 | ) | (38,278 | ) | ||||||||||||
Conservative Strategy Allocation Fund | 7 | — | (455 | ) | (2,834 | ) | (12,002 | ) | (15,284 | ) | ||||||||||||
Moderate Strategy Fund | 266 | 3,575 | — | — | (155,209 | ) | (151,368 | ) | ||||||||||||||
Moderate Strategy Allocation Fund | 13 | — | (1,670 | ) | (4,918 | ) | (34,688 | ) | (41,263 | ) | ||||||||||||
Aggressive Strategy Fund | 39 | — | (3,291 | ) | (2,994 | ) | (220,612 | ) | (226,858 | ) | ||||||||||||
Tax-Managed Aggressive Strategy Fund | 5 | — | (889 | ) | (19,587 | ) | (14,224 | ) | (34,695 | ) | ||||||||||||
Core Market Strategy Fund | 25 | — | (2,462 | ) | (1,809 | ) | (26,894 | ) | (31,140 | ) | ||||||||||||
Core Market Strategy Allocation Fund | 1 | — | (159 | ) | (5,088 | ) | (4,722 | ) | (9,968 | ) | ||||||||||||
Market Growth Strategy Fund | 110 | — | (12,072 | ) | (22,415 | ) | (265,890 | ) | (300,267 | ) | ||||||||||||
Market Growth Strategy Allocation Fund | 8 | — | (1,288 | ) | (33,287 | ) | (31,622 | ) | (66,189 | ) | ||||||||||||
Amounts designated as “—” are $0 or have been rounded to $0.
Post-October losses represent losses realized on investment transactions from November 1, 2008 through March 31, 2009 that, in accordance with Federal income tax regulations, the Trust has elected to defer and treat as having arisen in the following fiscal year.
| SEI Asset Allocation Trust / Semi-Annual Report / September 30, 2009 | 49 |
Table of Contents
Notes to Financial Statements (Unaudited) (Continued)
September 30, 2009
The Funds had capital loss carryforwards at March 31, 2009 as follows ($ Thousands):
Years Expiring | Amounts | ||||
Diversified Conservative Income Fund | 2017 | $ | 565 | ||
Diversified Conservative Fund | 2017 | $ | 1,716 | ||
Diversified Global Moderate Growth Fund | 2017 | $ | 1,861 | ||
Diversified Moderate Growth Fund | 2017 | $ | 3,583 | ||
Diversified Global Growth Fund | 2017 | $ | 4,200 | ||
Diversified U.S. Stock Fund | 2017 | $ | 840 | ||
| 2015 | 11,201 | ||||
| $ | 12,041 | ||||
Defensive Strategy Fund | 2017 | $ | 3,961 | ||
Defensive Strategy Allocation Fund | 2017 | $ | 94 | ||
Conservative Strategy Fund | 2017 | $ | 10,077 | ||
| 2016 | 127 | ||||
| $ | 10,204 | ||||
Conservative Strategy Allocation Fund | 2017 | $ | 455 | ||
Moderate Strategy Allocation Fund | 2017 | $ | 1,670 | ||
Aggressive Strategy Fund | 2017 | $ | 3,291 | ||
Tax-Managed Aggressive Strategy Fund | 2017 | $ | 889 | ||
Core Market Strategy Fund | 2017 | $ | 2,462 | ||
Core Market Strategy Allocation Fund | 2017 | $ | 159 | ||
Market Growth Strategy Fund | 2017 | $ | 12,072 | ||
Market Growth Strategy Allocation Fund | 2017 | $ | 1,288 | ||
During the year ended March 31, 2009, the Diversified Global Stock Fund utilized $780,386 of capital loss carryforwards to offset capital gains.
For Federal income tax purposes, the capital loss carryforwards may be carried forward for a maximum of eight years to offset any net realized capital gains.
The Federal tax cost and aggregate gross unrealized appreciation and depreciation on investments held by the Funds at September 30, 2009, were as follows ($ Thousands):
| Federal Tax Cost | Appreciated Securities | Depreciated Securities | Net Unrealized Appreciation (Depreciation) | |||||||||||
Diversified Conservative Income Fund | $ | 45,878 | $ | 1,039 | $ | (3,285 | ) | $ | (2,246 | ) | ||||
Diversified Conservative Fund | 52,525 | 1,075 | (5,917 | ) | (4,842 | ) | ||||||||
Diversified Global Moderate Growth Fund | 122,191 | 12,683 | (9,824 | ) | 2,859 | |||||||||
Diversified Moderate Growth Fund | 90,845 | 879 | (13,881 | ) | (13,002 | ) | ||||||||
Diversified Global Growth Fund | 165,085 | 2,000 | (35,417 | ) | (33,417 | ) | ||||||||
Diversified Global Stock Fund | 87,298 | 4,302 | (19,996 | ) | (15,694 | ) | ||||||||
| Federal Tax Cost | Appreciated Securities | Depreciated Securities | Net Unrealized Appreciation (Depreciation) | |||||||||||
Diversified US Stock Fund | $ | 59,410 | $ | 170 | $ | (15,464 | ) | $ | (15,294 | ) | ||||
Defensive Strategy Fund | 41,937 | 294 | (812 | ) | (518 | ) | ||||||||
Defensive Strategy Allocation Fund | 11,571 | 185 | (2,189 | ) | (2,004 | ) | ||||||||
Conservative Strategy Fund | 120,094 | 510 | (9,945 | ) | (9,435 | ) | ||||||||
Conservative Strategy Allocation Fund | 25,588 | 1,827 | (1,849 | ) | (22 | ) | ||||||||
Moderate Strategy Fund | 351,569 | 2,488 | (54,597 | ) | (52,109 | ) | ||||||||
Moderate Strategy Allocation Fund | 82,034 | 339 | (11,494 | ) | (11,155 | ) | ||||||||
Aggressive Strategy Fund | 394,390 | 10,538 | (87,365 | ) | (76,827 | ) | ||||||||
Tax-Managed Aggressive Strategy Fund | 49,313 | 7,502 | (1,511 | ) | 5,991 | |||||||||
Core Market Strategy Fund | 81,408 | 2,433 | (10,439 | ) | (8,006 | ) | ||||||||
Core Market Strategy Allocation Fund | 16,705 | 2,421 | (490 | ) | 1,931 | |||||||||
Market Growth Strategy Fund | 566,670 | 13,016 | (107,867 | ) | (94,851 | ) | ||||||||
Market Growth Strategy Allocation Fund | 93,911 | 10,079 | (5,266 | ) | 4,813 | |||||||||
The difference between tax cost and book cost is primarily attributable to wash sales.
7. IN-KIND DISTRIBUTION
During a review of March 31, 2005 year-end tax information, it was determined that certain distributions of interest income derived from underlying municipal bond funds were classified as taxable interest income when distributed to shareholders of the Defensive Strategy Allocation, Conservative Strategy Allocation, Moderate Strategy Allocation, Core Market Strategy Allocation and Market Growth Strategy Allocation Funds (the “Strategy Allocation Funds”). It was determined that under the current tax code, the fund-of-funds structure caused distributions of interest income from underlying municipal bond funds to lose their tax-exempt character when the Strategy Allocation Funds distributed that income to their shareholders. The tax characteristics would be preserved, however, if the shareholders held the municipal bond funds directly rather than through a fund of funds. As a result, the Funds’ Board of Trustees decided to distribute shares of the underlying municipal bond funds held in the Strategy Allocation Funds to shareholders in the form of an in-kind distribution. This option had the benefit of enabling shareholders to hold interests in the municipal bond funds directly, thereby being able to take advantage of the tax-exempt character of the interest distributed by those funds, while also preserving for such investors the original investment strategy they sought to achieve within the Strategy Allocation Funds.
| 50 | SEI Asset Allocation Trust / Semi-Annual Report / September 30, 2009 |
Table of Contents
On March 29, 2005, each Strategy Allocation Fund recorded an in-kind dividend equal to the fair market value of the municipal bond funds held by the Funds. The tax character of this in-kind distribution is presented below ($ Thousands):
| Income | Realized Gains | Return of Capital | Total Value | |||||||||
Defensive Strategy Allocation Fund | $ | 104 | $ | 1 | $ | 11,847 | $ | 11,952 | ||||
Conservative Strategy Allocation Fund | 319 | 12 | 27,664 | 27,995 | ||||||||
Moderate Strategy Allocation Fund | 330 | 23 | 28,181 | 28,534 | ||||||||
Core Market Strategy Allocation | 146 | 78 | 12,227 | 12,451 | ||||||||
Market Growth Strategy Allocation Fund | 481 | 369 | 15,411 | 16,261 | ||||||||
SEI has made certain payments to shareholders of the Funds related to this matter. These payments were made from SEI’s own assets and had no impact on the assets of the Funds.
8. REVERSE SHARE SPLIT
On May 6, 2005, the Defensive Strategy Allocation Fund, Conservative Strategy Allocation Fund, Moderate Strategy Allocation Fund, Core Market Strategy Allocation Fund and Market Growth Strategy Allocation Fund (the “Strategy Allocation Funds”) declared a reverse share split, as approved by the Board of Trustees, in order to bring the NAV of each Fund above $10 per share. The details of the reverse split are as follows:
Split Ratio | ||
Defensive Strategy Allocation Fund | 1 for 4 | |
Conservative Strategy Allocation Fund | 1 for 2 | |
Moderate Strategy Allocation Fund | 1 for 2 | |
Core Market Strategy Allocation Fund | 1 for 2 | |
Market Growth Strategy Allocation Fund | 2 for 3 |
9. INVESTMENT RISKS
In the normal course of business, the Funds enter into contracts that provide general indemnifications by the Fund to the counterparty of the contract. The Funds’ maximum exposure under these arrangements is dependent on future claims that may be made against the Funds and, therefore, cannot be established; however, based on experience, the risk of loss from such claims is considered remote.
10. CONCENTRATION RISK
In the normal course of business, the Funds invest solely in underlying funds that are comprised of fixed income and equity securities in specific industries, and that may engage in short selling activities, writing option contracts, and equity swaps, and therefore, the Funds may be affected by events in these industries. The Funds’ Statement of Additional Information provides a description of concentration and risk associated with the different investments in the underlying affiliated investment companies.
11. RESTATEMENT OF PREVIOUSLY ISSUED FINANCIAL STATEMENTS
On May 6, 2005, prior to the issuance of the 2005 financial statements, the Strategy Allocation Funds declared reverse stock splits (see Note 8). The effects of the reverse stock splits should have been reflected retro-actively in the March 31, 2005 financial statements. The per share information included in the financial highlights has been restated to properly reflect the effects of the reverse split on a retroactive basis.
12. SUBSEQUENT EVENT
The Trust has evaluated the need for disclosures and/or adjustments resulting from subsequent events through November 30, 2009, the date the financial statements were available to be issued. Based on this evaluation, no adjustments were required to the financial statements as of September 30, 2009.
| SEI Asset Allocation Trust / Semi-Annual Report / September 30, 2009 | 51 |
Table of Contents
SEI ASSET ALLOCATION TRUST — SEPTEMBER 30, 2009
Disclosure of Fund Expenses (Unaudited)
All mutual funds have operating expenses. As a shareholder of a mutual fund, your investment is affected by these ongoing costs, which include among others costs for portfolio management, administrative services, and shareholder reports like this one. It is important for you to understand the impact of these costs on your investment returns.
Operating expenses such as these are deducted from a mutual fund’s gross income and directly reduce your final investment return. These expenses are expressed as a percentage of a mutual fund’s average net assets; this percentage is known as a mutual fund’s expense ratio.
The following examples use the expense ratio and are intended to help you understand the ongoing costs (in dollars) of investing in your Fund and to compare these costs with those of other mutual funds. The examples are based on an investment of $1,000 made at the beginning of the period shown and held for the entire period.
The table below illustrates your Fund’s costs in two ways.
• Actual Fund Return. This section helps you to estimate the actual expenses after fee waivers that your Fund incurred over the period. The “Expenses Paid During Period” column shows the actual dollar expense cost incurred by a $1,000 investment in the Fund, and the “Ending Account Value” number is derived from deducting that expense cost from the Fund’s gross investment return.
You can use the information, together with the actual amount you invested in the Fund, to estimate the expenses that you paid over that period. Simply divide your ending starting account value by $1,000 to arrive at the ratio (for example, an $8,600 account value divided by $1,000 = 8.6), then multiply that ratio by the number shown for your Fund under “Expenses Paid During Period.”
• Hypothetical 5% Return. This section helps you compare your Fund’s costs with those of other mutual funds. It assumes that the Fund had an annual 5% return before expenses during the year, but that the expense ratio (Column 3) for the period is unchanged. This example is useful in making comparisons because the Securities and Exchange Commission requires all mutual funds to make this 5% calculation. You can assess your Fund’s comparative cost by comparing the hypothetical result of your Fund in the “Expenses Paid During Period” column with the those that appear in the same charts in the shareholder reports for other mutual funds.
NOTE: Because the return is set at 5% for comparison purposes — NOT your Fund’s actual return — the account values shown may not apply to your specific investment.
| Beginning Account Value 4/1/09 | Ending Account Value 9/30/09 | Annualized Expense Ratios | Expenses Paid During Period* | |||||||||
Diversified Conservative Income Fund |
| |||||||||||
Actual Fund Return | ||||||||||||
Class A | $ | 1,000.00 | $ | 1,141.60 | 0.12 | % | $ | 0.64 | ||||
Class D | 1,000.00 | 1,136.10 | 1.12 | 6.00 | ||||||||
Class I | 1,000.00 | 1,138.80 | 0.37 | 1.98 | ||||||||
Hypothetical 5% Return | ||||||||||||
Class A | $ | 1,000.00 | $ | 1,024.47 | 0.12 | % | $ | 0.61 | ||||
Class D | 1,000.00 | 1,019.45 | 1.12 | 5.67 | ||||||||
Class I | 1,000.00 | 1,023.21 | 0.37 | 1.88 | ||||||||
| Beginning Account Value 4/1/09 | Ending Account Value 9/30/09 | Annualized Expense Ratios | Expenses Paid During Period* | |||||||||
Diversified Conservative Fund | ||||||||||||
Actual Fund Return | ||||||||||||
Class A | $ | 1,000.00 | $ | 1,207.30 | 0.12 | % | $ | 0.66 | ||||
Class D | 1,000.00 | 1,200.30 | 1.12 | 6.18 | ||||||||
Class I | 1,000.00 | 1,204.10 | 0.37 | 2.04 | ||||||||
Hypothetical 5% Return | ||||||||||||
Class A | $ | 1,000.00 | $ | 1,024.47 | 0.12 | % | $ | 0.61 | ||||
Class D | 1,000.00 | 1,019.45 | 1.12 | 5.67 | ||||||||
Class I | 1,000.00 | 1,023.21 | 0.37 | 1.88 | ||||||||
| 52 | SEI Asset Allocation Trust / Semi-Annual Report / September 30, 2009 |
Table of Contents
| Beginning Account Value 4/1/09 | Ending Account Value 9/30/09 | Annualized Expense Ratios | Expenses Paid During Period* | |||||||||
Diversified Global Moderate Growth Fund |
| |||||||||||
Actual Fund Return | ||||||||||||
Class A | $ | 1,000.00 | $ | 1,290.00 | 0.12 | % | $ | 0.69 | ||||
Class D | 1,000.00 | 1,283.80 | 1.12 | 6.41 | ||||||||
Class I | 1,000.00 | 1,288.50 | 0.37 | 2.12 | ||||||||
Hypothetical 5% Return | ||||||||||||
Class A | $ | 1,000.00 | $ | 1,024.47 | 0.12 | % | $ | 0.61 | ||||
Class D | 1,000.00 | 1,019.45 | 1.12 | 5.67 | ||||||||
Class I | 1,000.00 | 1,023.21 | 0.37 | 1.88 | ||||||||
Diversified Moderate Growth Fund | ||||||||||||
Actual Fund Return | ||||||||||||
Class A | $ | 1,000.00 | $ | 1,262.30 | 0.12 | % | $ | 0.68 | ||||
Class D | 1,000.00 | 1,256.10 | 1.12 | 6.33 | ||||||||
Class I | 1,000.00 | 1,260.10 | 0.37 | 2.10 | ||||||||
Hypothetical 5% Return | ||||||||||||
Class A | $ | 1,000.00 | $ | 1,024.47 | 0.12 | % | $ | 0.61 | ||||
Class D | 1,000.00 | 1,019.45 | 1.12 | 5.67 | ||||||||
Class I | 1,000.00 | 1,023.21 | 0.37 | 1.88 | ||||||||
Diversified Global Growth Fund |
| |||||||||||
Actual Fund Return | ||||||||||||
Class A | $ | 1,000.00 | $ | 1,338.50 | 0.12 | % | $ | 0.70 | ||||
Class D | 1,000.00 | 1,331.70 | 1.12 | 6.55 | ||||||||
Class I | 1,000.00 | 1,338.10 | 0.37 | 2.17 | ||||||||
Hypothetical 5% Return | ||||||||||||
Class A | $ | 1,000.00 | $ | 1,024.47 | 0.12 | % | $ | 0.61 | ||||
Class D | 1,000.00 | 1,019.45 | 1.12 | 5.67 | ||||||||
Class I | 1,000.00 | 1,023.21 | 0.37 | 1.88 | ||||||||
Diversified Global Stock Fund | ||||||||||||
Actual Fund Return | ||||||||||||
Class A | $ | 1,000.00 | $ | 1,383.70 | 0.12 | % | $ | 0.72 | ||||
Class D | 1,000.00 | 1,376.80 | 1.12 | 6.67 | ||||||||
Class I | 1,000.00 | 1,380.60 | 0.37 | 2.21 | ||||||||
Hypothetical 5% Return | ||||||||||||
Class A | $ | 1,000.00 | $ | 1,024.47 | 0.12 | % | $ | 0.61 | ||||
Class D | 1,000.00 | 1,019.45 | 1.12 | 5.67 | ||||||||
Class I | 1,000.00 | 1,023.21 | 0.37 | 1.88 | ||||||||
Diversified U.S. Stock Fund | ||||||||||||
Actual Fund Return | ||||||||||||
Class A | $ | 1,000.00 | $ | 1,353.00 | 0.12 | % | $ | 0.71 | ||||
Class D | 1,000.00 | 1,347.70 | 1.12 | 6.59 | ||||||||
Class I | 1,000.00 | 1,352.30 | 0.37 | 2.18 | ||||||||
Hypothetical 5% Return | ||||||||||||
Class A | $ | 1,000.00 | $ | 1,024.47 | 0.12 | % | $ | 0.61 | ||||
Class D | 1,000.00 | 1,019.45 | 1.12 | 5.67 | ||||||||
Class I | 1,000.00 | 1,023.21 | 0.37 | 1.88 | ||||||||
Defensive Strategy Fund | ||||||||||||
Actual Fund Return | ||||||||||||
Class A | $ | 1,000.00 | $ | 1,035.00 | 0.10 | % | $ | 0.51 | ||||
Class I | 1,000.00 | 1,029.40 | 0.10 | 0.51 | ||||||||
Hypothetical 5% Return | ||||||||||||
Class A | $ | 1,000.00 | $ | 1,024.57 | 0.10 | % | $ | 0.51 | ||||
Class I | 1,000.00 | 1,024.57 | 0.10 | 0.51 | ||||||||
Defensive Strategy Allocation Fund | ||||||||||||
Actual Fund Return | ||||||||||||
Class A | $ | 1,000.00 | $ | 1,405.90 | 0.10 | % | $ | 0.60 | ||||
Hypothetical 5% Return | ||||||||||||
Class A | $ | 1,000.00 | $ | 1,024.57 | 0.10 | % | $ | 0.51 | ||||
Conservative Strategy Fund | ||||||||||||
Actual Fund Return | ||||||||||||
Class A | $ | 1,000.00 | $ | 1,126.20 | 0.10 | % | $ | 0.53 | ||||
Class I | 1,000.00 | 1,124.90 | 0.35 | 1.86 | ||||||||
Hypothetical 5% Return | ||||||||||||
Class A | $ | 1,000.00 | $ | 1,024.57 | 0.10 | % | $ | 0.51 | ||||
Class I | 1,000.00 | 1,023.31 | 0.35 | 1.78 | ||||||||
| Beginning Account Value 4/1/09 | Ending Account Value 9/30/09 | Annualized Expense Ratios | Expenses Paid During Period* | |||||||||
Conservative Strategy Allocation Fund | ||||||||||||
Actual Fund Return | ||||||||||||
Class A | $ | 1,000.00 | $ | 1,402.50 | 0.10 | % | $ | 0.60 | ||||
Hypothetical 5% Return | ||||||||||||
Class A | $ | 1,000.00 | $ | 1,024.57 | 0.10 | % | $ | 0.51 | ||||
Moderate Strategy Fund | ||||||||||||
Actual Fund Return | ||||||||||||
Class A | $ | 1,000.00 | $ | 1,230.70 | 0.10 | % | $ | 0.56 | ||||
Class I | 1,000.00 | 1,228.80 | 0.35 | 1.96 | ||||||||
Hypothetical 5% Return | ||||||||||||
Class A | $ | 1,000.00 | $ | 1,024.57 | 0.10 | % | $ | 0.51 | ||||
Class I | 1,000.00 | 1,023.31 | 0.35 | 1.78 | ||||||||
Moderate Strategy Allocation Fund | ||||||||||||
Actual Fund Return | ||||||||||||
Class A | $ | 1,000.00 | $ | 1,349.10 | 0.10 | % | $ | 0.59 | ||||
Hypothetical 5% Return | ||||||||||||
Class A | $ | 1,000.00 | $ | 1,024.57 | 0.10 | % | $ | 0.51 | ||||
Aggressive Strategy Fund | ||||||||||||
Actual Fund Return | ||||||||||||
Class A | $ | 1,000.00 | $ | 1,390.90 | 0.10 | % | $ | 0.60 | ||||
Class I | 1,000.00 | 1,388.60 | 0.35 | 2.10 | ||||||||
Hypothetical 5% Return | ||||||||||||
Class A | $ | 1,000.00 | $ | 1,024.57 | 0.10 | % | $ | 0.51 | ||||
Class I | 1,000.00 | 1,023.31 | 0.35 | 1.78 | ||||||||
Tax-Managed Aggressive Strategy Fund | ||||||||||||
Actual Fund Return | ||||||||||||
Class A | $ | 1,000.00 | $ | 1,388.40 | 0.10 | % | $ | 0.60 | ||||
Hypothetical 5% Return | ||||||||||||
Class A | $ | 1,000.00 | $ | 1,024.57 | 0.10 | % | $ | 0.51 | ||||
Core Market Strategy Fund | ||||||||||||
Actual Fund Return | ||||||||||||
Class A | $ | 1,000.00 | $ | 1,241.50 | 0.10 | % | $ | 0.56 | ||||
Class I | 1,000.00 | 1,245.30 | 0.10 | 0.56 | ||||||||
Hypothetical 5% Return | ||||||||||||
Class A | $ | 1,000.00 | $ | 1,024.57 | 0.10 | % | $ | 0.51 | ||||
Class I | 1,000.00 | 1,024.57 | 0.10 | 0.51 | ||||||||
Core Market Strategy Allocation Fund | ||||||||||||
Actual Fund Return | ||||||||||||
Class A | $ | 1,000.00 | $ | 1,389.00 | 0.10 | % | $ | 0.60 | ||||
Hypothetical 5% Return | ||||||||||||
Class A | $ | 1,000.00 | $ | 1,024.57 | 0.10 | % | $ | 0.51 | ||||
Market Growth Strategy Fund | ||||||||||||
Actual Fund Return | ||||||||||||
Class A | $ | 1,000.00 | $ | 1,317.30 | 0.10 | % | $ | 0.58 | ||||
Class I | 1,000.00 | 1,313.90 | 0.35 | 2.03 | ||||||||
Hypothetical 5% Return | ||||||||||||
Class A | $ | 1,000.00 | $ | 1,024.57 | 0.10 | % | $ | 0.51 | ||||
Class I | 1,000.00 | 1,023.31 | 0.35 | 1.78 | ||||||||
Market Growth Strategy Allocation Fund | ||||||||||||
Actual Fund Return | ||||||||||||
Class A | $ | 1,000.00 | $ | 1,388.30 | 0.10 | % | $ | 0.60 | ||||
Hypothetical 5% Return | ||||||||||||
Class A | $ | 1,000.00 | $ | 1,024.57 | 0.10 | % | $ | 0.51 | ||||
| * | Expenses are equal to the Fund’s annualized expense ratio multiplied by the average account value over the period, multiplied by 183/365 (to reflect the one-half year period shown). |
| SEI Asset Allocation Trust / Semi-Annual Report / September 30, 2009 | 53 |
Table of Contents
Information
SIMT Large Cap Diversified Alpha Fund:
Annual Report as of September 30, 2009
Table of Contents
| 56 | ||
| 58 | ||
| 60 | ||
| 61 | ||
| 62 | ||
| 63 | ||
| 64 | ||
| 72 | ||
| 73 | ||
| 76 | ||
| 77 | ||
The Trust files its complete schedule of portfolio holdings with the Securities and Exchange Commission (“Commission”) for the first and third quarters of each fiscal year on Form N-Q within sixty days after period end. The Trust’s Form N-Q is available on the Commission’s website at http://www.sec.gov, and may be reviewed and copied at the Commission’s Public Reference Room in Washington, DC. Information on the operation of the Public Reference Room may be obtained by calling 1-800-SEC-0330.
A description of the policies and procedures that the Trust uses to determine how to vote proxies relating to portfolio securities, as well as information relating to how a Fund voted proxies relating to portfolio securities during the most recent 12-month period ended June 30, is available (i) without charge, upon request, by calling 1-800-DIAL-SEI; and (ii) on the Commission’s website at http://www.sec.gov.
Table of Contents
MANAGEMENT’S DISCUSSION AND ANALYSIS OF FUND PERFORMANCE
SEI INSTITUTIONAL MANAGED TRUST — SEPTEMBER 30, 2009
Large Cap Diversified Alpha Fund
I. Objective
The Large Cap Diversified Alpha Fund (“the Fund”) seeks to provide capital appreciation by investing in the equity securities of large companies in the U.S. as well as other equity securities, derivatives and fixed-income securities, with the aim of diversifying the relative risk of the Fund and adding to the Fund’s excess returns.
II. Multi-Manager Approach Statement
The Fund uses a multi-manager approach, relying on a number of sub-advisers with differing investment approaches to manage portions of the Fund’s portfolio under the general supervision of SEI Investments Management Corp. The Fund utilizes the following sub-advisers as of September 30, 2009: Analytic, Aronson+Johnson+Ortiz, LLC, Declaration Management and Research LLC, Delaware Management Company, INTECH Investment Management, LLC, Legg Mason Capital Management Inc., and Quantitative Management Associates LLC. During the year ended September 30, 2009, the Fund terminated Smith Breeden Associates, Inc. and added Declaration Management and Research LLC. At the end of the fiscal year, the fund was closed.
III. Market Commentary
For the first six months of the fiscal year leading up to the March lows, equity markets were under sharp pressure. In March, there was a sharp inflection point in the markets, as trends reversed and valuations reverted back to the mean. Following the collapse of Lehman Brothers, companies’ earnings and forward outlooks deteriorated, and economic output came to a screeching halt. Job losses accelerated throughout the first half of the fiscal period, exacerbating the loss of consumer confidence. As credit markets seized up and liquidity became scarce, and the Federal Reserve (the “Fed”) and Treasury responded by instituting programs of historic proportion in order to stave off a complete collapse of the U.S. financial system.
The Fed and Treasury provided ample liquidity by boosting the money supply and driving interest rates lower. With the creation of the Troubled Asset Relief Programs I and II, as well as the Term Asset-Backed Securities Loan Facility and Public Private Investment Program, credit markets began to thaw and credit spreads narrowed.
Government policies combined with the Fed’s decision to use quantitative easing were the main catalysts to the March reversal. Also, several of the major banks indicated that their operating revenues for the first nine months of 2009 were positive, setting a bullish tone in the Financials sector, which had sold off nearly 50% heading into early March amidst concerns of potential nationalization. Heading into the second half of the fiscal year, markets rebounded strongly as leading economic indicators pointed to “green shoots.” Economic deterioration began to decelerate; most notably, consumer sentiment rebounded, manufacturing activity strengthened and orders for durable and capital goods increased. Investors were hopeful that recovery would follow, driven by businesses re-stocking inventory in anticipation of future growth. The jobs picture also improved although it remains weak; the U.S. economy shed jobs at a much slower pace for the second half of the fiscal year than it did for the first half. Monetary policy remains aggressively positioned, and the Fed has indicated that it intends to keep rates low to fight the possibility of further asset deflation.
In the period, small-cap stocks outperformed their large-cap brethren, and growth-oriented stocks outperformed their value-oriented counterparts across all market caps. The reversal in U.S. markets off of the March lows continued throughout the third quarter of 2009, as cyclical and higher beta stocks led the charge. The U.S. dollar weakened considerably in the second half of the year as investors increased their risk tolerance and commodity prices moved higher. The Technology sector, which was the only sector that had positive absolute performance for the fiscal year, continued to fare well as investors rewarded companies with high levels of free cash flow and solid balance sheets that have gained market share and are well-positioned to capitalize on the potential economic rebound. From a factor perspective, momentum and historical-growth factors underperformed dramatically, while small-size and traditional-value factors outperformed on a relative basis.
IV. Return vs. Benchmark
For the year ended September 30, 2009, the Large Cap Diversified Alpha Fund, Class A, underperformed the Russell 1000 Index (the “Index”), returning (11.51)% versus the Index return of (6.14)%.
| 56 | SEI Asset Allocation Trust / Semi-Annual Report / September 30, 2009 |
Table of Contents
MANAGEMENT’S DISCUSSION AND ANALYSIS OF FUND PERFORMANCE
SEI INSTITUTIONAL MANAGED TRUST — SEPTEMBER 30, 2009
Large Cap Diversified Alpha Fund (Concluded)
V. Fund Attribution
The Fund dramatically unperformed for the fiscal year, primarily because of its allocation to the portable-alpha strategy, which underperformed as credit spreads widened to historic levels. The portable-alpha component of the Fund detracted from performance, particularly in the first half of the fiscal period, due to dramatic underperformance in the spread sectors of the fixed-income markets. The portable-alpha component had large overweight’s to mortgage-backed securities and asset-backed securities, which lost value as securitized markets all but evaporated and formalized pricing mechanisms disappeared. Also, the Fund’s quantitative managers struggled in an environment marked by volatile factor performance. Value and momentum exposures drove poor security selection, as those factors were severely punished in the market rally from the March lows. In particular, the Fund’s dynamic factor model detracted from performance due to its underweight to low-quality assets as measured by higher leverage. Also, the Fund’s exposure to a volatility-capture strategy struggled, as there was not enough intra-stock volatility to make this a successful endeavor. On the positive side, the Fund’s growth exposure positively contributed to performance with broad-based, strong stock selection driven by a focus on high earnings growth. On the value side, the Fund ultimately benefited from strong stock selection in the Financial sector driven by contrarian stock positions and from quality exposures before the market nadir.
Large Cap Diversified Alpha Fund:
AVERAGE ANNUAL TOTAL RETURN1
| One Year Return | Annualized 3 Year Return | Annualized Inception to Date | ||||
| Large Cap Diversified Alpha Fund, Class A | (11.51)% | (9.03)% | (6.14)% | |||
| Large Cap Diversified Alpha Fund, Class I | (11.69)% | (9.26)% | (6.33)% |
Comparison of Change in the Value of a $100,000 Investment in the Large Cap Diversified Alpha Fund, Class A and Class I, versus the Russell 1000 Index
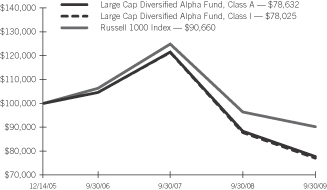
| 1 | For the period ended 9/30/09. Past performance is no indication of future performance. Class I Shares performance for the period prior to 9/14/06 is performance derived from the performance of the Class A Shares. The performance of the Class I Shares may be lower than the performance of Class A Shares because of different distribution fees paid by Class I shareholders. Class A Shares were offered beginning 12/14/05 and Class I Shares were offered beginning 9/14/06. Returns shown do not reflect the deduction of taxes that a shareholder would pay on fund distributions or the redemption of fund shares. The returns for certain periods reflect fee waivers and/or reimbursements in effect for that period; absent fee waivers and reimbursements, performance would have been lower. |
| SEI Asset Allocation Trust / Semi-Annual Report / September 30, 2009 | 57 |
Table of Contents
SUMMARY SCHEDULE OF INVESTMENTS
Large Cap Diversified Alpha Fund
September 30, 2009
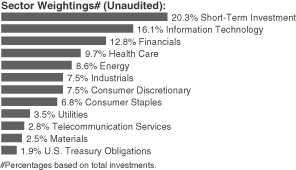
| Description | Percentage of Net Assets (%) | Shares | Market Value ($ Thousands) | |||||
COMMON STOCK — 77.8% | ||||||||
Consumer Discretionary — 7.5% | ||||||||
Amazon.com* | 0.5 | % | 58,200 | $ | 5,434 | |||
Comcast, Cl A | 0.8 | 486,448 | 8,216 | |||||
Time Warner | 0.5 | 196,656 | 5,660 | |||||
Other Securities | 5.7 | 63,323 | ||||||
| 82,633 | ||||||||
Consumer Staples — 6.8% | ||||||||
PepsiCo | 0.6 | 108,847 | 6,385 | |||||
Philip Morris International | 0.4 | 88,009 | 4,290 | |||||
Procter & Gamble | 1.0 | 199,249 | 11,540 | |||||
SYSCO | 0.4 | 174,266 | 4,331 | |||||
Walgreen | 0.6 | 188,964 | 7,080 | |||||
Other Securities | 3.8 | 41,219 | ||||||
| 74,845 | ||||||||
Energy — 8.6% | ||||||||
Chevron | 1.5 | 233,021 | 16,412 | |||||
ConocoPhillips | 0.7 | 166,279 | 7,509 | |||||
Exxon Mobil | 2.5 | 394,987 | 27,100 | |||||
Occidental Petroleum | 0.7 | 95,407 | 7,480 | |||||
Other Securities | 3.2 | 36,574 | ||||||
| 95,075 | ||||||||
Financials — 12.8% | ||||||||
Aflac | 0.4 | 113,316 | 4,843 | |||||
American Express | 0.4 | 134,823 | 4,571 | |||||
American International Group* | 0.0 | 1,600 | 71 | |||||
Bank of America | 1.1 | 694,778 | 11,756 | |||||
Bank of New York Mellon | 0.5 | 195,744 | 5,675 | |||||
Goldman Sachs Group | 0.9 | 56,349 | 10,388 | |||||
JPMorgan Chase | 1.3 | 317,311 | 13,904 | |||||
T. Rowe Price Group | 0.4 | 93,381 | 4,268 | |||||
| Description | Percentage of Net Assets (%) | Shares | Market Value ($ Thousands) | |||||
Wells Fargo | 0.9 | % | 343,555 | $ | 9,681 | |||
Other Securities | 6.9 | 75,689 | ||||||
| 140,846 | ||||||||
Health Care — 9.7% | ||||||||
Aetna | 0.4 | 159,600 | 4,442 | |||||
Allergan | 0.4 | 80,300 | 4,558 | |||||
AmerisourceBergen | 0.4 | 202,422 | 4,530 | |||||
Amgen* | 0.8 | 134,188 | 8,082 | |||||
Gilead Sciences* | 0.5 | 111,100 | 5,175 | |||||
Johnson & Johnson | 1.0 | 175,343 | 10,677 | |||||
Pfizer | 0.9 | 588,646 | 9,742 | |||||
UnitedHealth Group | 0.7 | 285,200 | 7,141 | |||||
Other Securities | 4.6 | 52,353 | ||||||
| 106,700 | ||||||||
Industrials — 7.5% | ||||||||
General Electric | 1.0 | 664,444 | 10,910 | |||||
Lockheed Martin | 0.4 | 56,693 | 4,427 | |||||
United Parcel Service, Cl B | 0.4 | 75,359 | 4,256 | |||||
Other Securities | 5.7 | 63,393 | ||||||
| 82,986 | ||||||||
Information Technology — 16.1% | ||||||||
Adobe Systems* | 0.4 | 142,600 | 4,712 | |||||
Apple* | 1.1 | 66,898 | 12,401 | |||||
Cisco Systems* | 0.9 | 433,098 | 10,195 | |||||
eBay* | 0.5 | 237,669 | 5,611 | |||||
EMC* | 0.5 | 312,200 | 5,320 | |||||
Google, Cl A* | 1.1 | 22,775 | 11,293 | |||||
Hewlett-Packard | 0.9 | 214,623 | 10,132 | |||||
Intel | 0.9 | 476,032 | 9,316 | |||||
International Business Machines | 1.0 | 89,977 | 10,762 | |||||
Microsoft | 1.2 | 514,026 | 13,308 | |||||
Qualcomm | 0.7 | 167,100 | 7,516 | |||||
Texas Instruments | 0.5 | 240,077 | 5,687 | |||||
Visa, Cl A | 0.6 | 101,992 | 7,049 | |||||
Yahoo!* | 0.5 | 309,600 | 5,514 | |||||
Other Securities | 5.3 | 58,696 | ||||||
| 177,512 | ||||||||
Materials — 2.5% | ||||||||
Other Securities | 2.5 | 27,904 | ||||||
Telecommunication Services — 2.8% | ||||||||
AT&T | 1.4 | 574,037 | 15,505 | |||||
Verizon Communications | 0.7 | 247,745 | 7,499 | |||||
Other Securities | 0.7 | 7,859 | ||||||
| 30,863 | ||||||||
| 58 | SEI Asset Allocation Trust / Semi-Annual Report / September 30, 2009 |
Table of Contents
SUMMARY SCHEDULE OF INVESTMENTS
Large Cap Diversified Alpha Fund (Concluded)
September 30, 2009
| Description | Percentage of Net Assets (%) | Shares/Face Amount ($ Thousands) | Market Value ($ Thousands) | |||||
Utilities — 3.5% | ||||||||
AES* | 0.7 | % | 503,701 | $ | 7,465 | |||
Other Securities | 2.8 | 31,178 | ||||||
| 38,643 | ||||||||
Total Common Stock | 858,007 | |||||||
CASH EQUIVALENT — 20.3% | ||||||||
SEI Daily Income Trust, Prime Obligation Fund, Cl A, 0.110%**† | 20.3 | 223,317,662 | 223,318 | |||||
Total Cash Equivalent | 223,318 | |||||||
U.S. TREASURY OBLIGATIONS (A) (B) — 1.9% | ||||||||
U.S. Treasury Bills, | ||||||||
0.164%, | 0.6 | $ 6,307 | 6,306 | |||||
0.055%, 01/07/10 | 1.3 | 14,500 | 14,496 | |||||
Total U.S. Treasury Obligations | 20,802 | |||||||
Total Investments — 100.0% | $ | 1,102,127 | ||||||
A summary of the open futures contracts held by the Fund at September 30, 2009, is as follows:
Type of Contract | Number of Contracts Long (Short) | Expiration Date | Unrealized Appreciation ($ Thousands) | ||||
S&P Composite Index | 902 | Dec-2009 | $ | 1,359 | |||
For the year ended September 30, 2009, the total amount of all open futures contracts, as presented in the table above, are representative of the volume of activity for this derivative type during the period.
Percentages are based on Net Assets of $1,102,521 ($ Thousands).
| * | Non-income producing security. |
| ** | Rate shown is the 7-day effective yield as of September 30, 2009. |
| † | Investment in Affiliated Security (see Note 5). |
| (A) | Security, or portion thereof, has been pledged on open futures contracts. |
| (B) | The rate reported is the effective yield at the time of purchase. |
Cl — Class
The Summary Schedule of Investments does not reflect the complete portfolio holdings. It includes the Fund’s 50 largest holdings and each investment of any issuer that exceeds 1% of the Fund’s net assets. “Other Securities” represent all issues not required to be disclosed under the rules adopted by the U.S. Securities and Exchange Commission (“SEC”). Footnotes above may apply to securities that are included in “Other Securities”. For further detail, the complete schedule of portfolio holdings is available (i) without charge, upon request, by calling (800) 342-5734; and (ii) on the SEC’s website at http://www.sec.gov.
The following is a summary of the inputs used as of September 30, 2009 in valuing the Fund’s investments carried at value ($ Thousands):
| Investments in Securities | Level 1 | Level 2 | Level 3 | Total | ||||||||
Common Stock | $ | 858,007 | $ | — | $ | — | $ | 858,007 | ||||
U.S. Treasury Obligations | — | 20,802 | — | 20,802 | ||||||||
Cash Equivalent | 223,318 | — | — | 223,318 | ||||||||
Total Investments in Securities | $ | 1,081,325 | $ | 20,802 | $ | — | $ | 1,102,127 | ||||
| Other Financial Instruments | Level 1 | Level 2 | Level 3 | Total | ||||||||
Futures* | $ | 1,359 | $ | — | $ | — | $ | 1,359 | ||||
| * | Futures contracts are valued at the unrealized appreciation on the instrument. |
For more information on valuation inputs, see Note 2 — Significant Accounting Policies in Notes to Financial Statements.
For the year ended September 30, 2009, the total notional amount of $0 is not representative of the volume of activity for the swap derivatives during the period. During the fiscal year, due to a sub-advisor change, the volume of swap derivatives has been reduced from the notional amounts at the beginning of the fiscal year.
The accompanying notes are an integral part of the financial statements.
| SEI Asset Allocation Trust / Semi-Annual Report / September 30, 2009 | 59 |
Table of Contents
Statement of Assets and Liabilities ($ Thousands)
September 30, 2009
| Large Cap Diversified Alpha Fund | ||||
ASSETS: | ||||
Investments, at value† | $ | 878,809 | ||
Affiliated investment, at value†† | 223,318 | |||
Cash | 24 | |||
Receivable for fund shares sold | 2,010 | |||
Dividends and interest receivable | 944 | |||
Receivable for investment securities sold | 30 | |||
Receivable for variation margin | 6 | |||
Prepaid Expenses | 11 | |||
Total Assets | 1,105,152 | |||
LIABILITIES: | ||||
Payable for fund shares redeemed | 1,322 | |||
Payable for variation margin | 428 | |||
Administration fees payable | 311 | |||
Investment advisory fees payable | 292 | |||
Shareholder servicing fees payable A | 202 | |||
Chief Compliance Officer fees payable | 1 | |||
Accrued expense payable | 75 | |||
Total Liabilities | 2,631 | |||
Net Assets | $ | 1,102,521 | ||
† Cost of investments | 798,333 | |||
†† Cost of affiliated investments | 223,318 | |||
NET ASSETS: | ||||
Paid-in-Capital — (unlimited authorization — no par value) | $ | 1,607,242 | ||
Accumulated net realized loss on investments, securities sold short, option contracts, futures, swap contracts, and foreign currency | (586,555 | ) | ||
Net unrealized appreciation on investments, affiliated investments, securities sold short and option contracts | 80,476 | |||
Net unrealized appreciation on futures contracts | 1,359 | |||
Net unrealized depreciation on forward foreign currency contracts, foreign currencies and translation of other assets and liabilities denominated in foreign currencies | (1 | ) | ||
Net Assets | $ | 1,102,521 | ||
Net Asset Value, Offering and Redemption Price Per Share — Class A | $ | 7.18 | ||
| | ($1,101,993,406 ÷ 153,415,053 shares | ) | ||
Net Asset Value, Offering and Redemption Price Per Share — Class I | $ | 7.17 | ||
| | ($527,293 ÷ 73,501 shares | ) | ||
The accompanying notes are an integral part of the financial statements.
| 60 | SEI Asset Allocation Trust / Semi-Annual Report / September 30, 2009 |
Table of Contents
Statement of Operations ($ Thousands)
For the year ended September 30, 2009
| Large Cap Diversified Alpha Fund | ||||
Investment Income: | ||||
Dividends | $ | 17,206 | ||
Dividends from Affiliated Investments* | 485 | |||
Interest Income | 3,272 | |||
Less: Foreign Taxes Witheld | (29 | ) | ||
Total Investment Income | 20,934 | |||
Expenses: | ||||
Investment Advisory Fees | 3,698 | |||
Administration Fees | 3,236 | |||
Shareholder Servicing Fees Class (A) | 2,310 | |||
Shareholder Servicing Fees Class (I) | 1 | |||
Trustee Fees | 23 | |||
Chief Compliance Officer Fees | 4 | |||
Administration Servicing Fees Class (I) | 1 | |||
Dividend Expense on Securities Sold Short | 436 | |||
Interest Expense on Securities Sold Short | 182 | |||
Printing Fees | 101 | |||
Professional Fees | 80 | |||
Custodian/Wire Agent Fees | 90 | |||
Registration Fees | 36 | |||
Other Expenses | 46 | |||
Total Expenses | 10,244 | |||
Less: | ||||
Waiver of Investment Advisory Fees | (321 | ) | ||
Waiver of Shareholder Servicing Fees Class (A) | (522 | ) | ||
Net Expenses | 9,401 | |||
Net Investment Income | 11,533 | |||
Net Realized and Unrealized Gain (Loss) on Investments: | ||||
Net Realized Gain (Loss) on: | ||||
Investments | (415,476 | ) | ||
Securities Sold Short | 84,795 | |||
Futures Contracts | (40,905 | ) | ||
Swap Contracts | (29,757 | ) | ||
Foreign Currency Transactions | 1 | |||
Net Change in Unrealized Appreciation (Depreciation) on: | ||||
Investments | 249,470 | |||
Securities Sold Short | (35,062 | ) | ||
Futures Contracts | 15,068 | |||
Swap Contracts | 3,501 | |||
Foreign Currency and Translation of Other Assets and Liabilities Denominated in Foreign Currency | (2 | ) | ||
Net Decrease in Net Assets from Operations | $ | (156,834 | ) | |
Amounts designated as “—” are $0 or have been rounded to $0.
| * | See Note 5 in Notes to Financial Statements. |
The accompanying notes are an integral part of the financial statements.
| SEI Asset Allocation Trust / Semi-Annual Report / September 30, 2009 | 61 |
Table of Contents
Statement of Changes in Net Assets ($ Thousands)
For the years ended September 30,
| Large Cap Diversified Alpha Fund | ||||||||
| 2009 | 2008 | |||||||
Operations: | ||||||||
Net Investment Income | $ | 11,533 | $ | 17,757 | ||||
Net Realized Loss from Investments, Securities Sold Short, Futures Contracts, Written Options and Swap Contracts | (401,343 | ) | (163,795 | ) | ||||
Net Realized Gain on Foreign Currency Transactions | 1 | — | ||||||
Net Change in Unrealized Appreciation (Depreciation) of Investments, Affiliated Investments, Securities Sold Short, Futures Contracts, Written Options and Swap Contracts | 232,977 | (302,473 | ) | |||||
Net Change in Unrealized Appreciation (Depreciation) on Foreign Currency and Translation of Other Assets and Liabilities Denominated in Foreign Currency | (2 | ) | 2 | |||||
Net Decrease in Net Assets from Operations | (156,834 | ) | (448,509 | ) | ||||
Dividends and Distributions From: | ||||||||
Net Investment Income: | ||||||||
Class A | (10,559 | ) | (19,433 | ) | ||||
Class I | (5 | ) | (5 | ) | ||||
Net Capital Gains: | ||||||||
Class A | — | (63,042 | ) | |||||
Class I | — | (19 | ) | |||||
Return of Capital: | ||||||||
Class A | (2,122 | ) | — | |||||
Class I | (1 | ) | — | |||||
Total Dividends and Distributions | (12,687 | ) | (82,499 | ) | ||||
Capital Share Transactions(1): | ||||||||
Class A: | ||||||||
Proceeds from Shares Issued | 701,137 | 510,287 | ||||||
Reinvestment of Dividends and Distributions | 12,425 | 81,901 | ||||||
Cost of Shares Redeemed | (692,368 | ) | (465,367 | ) | ||||
Increase in Net Assets Derived from Class A Transactions | 21,194 | 126,821 | ||||||
Class I: | ||||||||
Proceeds from Shares Issued | 150 | 61 | ||||||
Reinvestment of Dividends and Distributions | 5 | 24 | ||||||
Cost of Shares Redeemed | (11 | ) | (35 | ) | ||||
Increase in Net Assets Derived from Class I Transactions | 144 | 50 | ||||||
Increase in Net Assets Derived from Capital Share Transactions | 21,338 | 126,871 | ||||||
Net Decrease in Net Assets | (148,183 | ) | (404,137 | ) | ||||
Net Assets: | ||||||||
Beginning of Year | 1,250,704 | 1,654,841 | ||||||
End of Year | $ | 1,102,521 | $ | 1,250,704 | ||||
Undistributed Net Investment Income Included in Net Assets at Year End | $ | — | $ | 2,555 | ||||
| (1) | See Note 6 in Notes to Financial Statements for additional information. |
Amounts designated as “—” are $0 or have been rounded to $0.
The accompanying notes are an integral part of the financial statements.
| 62 | SEI Asset Allocation Trust / Semi-Annual Report / September 30, 2009 |
Table of Contents
For the years or period ended September 30, (unless otherwise indicated)
For a Share Outstanding Throughout the Periods
| Net Asset Value, Beginning of Period | Net Investment Income(1) | Net Realized and Unrealized Gains (Losses) on Securities(1) | Total from Operations | Dividends from Net Investment Income | Distributions from Realized Capital Gains | Total Dividends, Distributions and Return of Capital | Net Asset Value, End of Period | Total Return† | Net Assets End of Period ($Thousands) | Ratio of Expenses to Average Net Assets | Ratio of Expenses to Average Net Assets (Excluding Fees Paid Indirectly) | Ratio of Expenses to Average Net Assets (Excluding Fees Paid Indirectly and Waivers) | Ratio of Net Investment Income (Loss) to Average Net Assets | Portfolio Turnover Rate† | ||||||||||||||||||||||||||||||||||||
Large Cap Diversified Alpha Fund |
| |||||||||||||||||||||||||||||||||||||||||||||||||
Class A | ||||||||||||||||||||||||||||||||||||||||||||||||||
2009 | $ | 8.23 | $ | 0.08 | $ | (1.04 | ) | $ | (0.96 | ) | $ | (0.09 | )(7) | $ | — | $ | (0.09 | ) | $ | 7.18 | (11.51 | )% | $ | 1,101,994 | 1.02 | %(6) | 1.02 | %(6) | 1.11 | % | 1.25 | % | 182 | % | ||||||||||||||||
2008 | 11.78 | 0.13 | (3.11 | ) | (2.98 | ) | (0.13 | ) | (0.44 | ) | (0.57 | ) | 8.23 | (26.42 | ) | 1,250,304 | 1.35 | (5) | 1.35 | (5) | 1.41 | 1.17 | 93 | |||||||||||||||||||||||||||
2007 | 10.38 | 0.14 | 1.47 | 1.61 | (0.13 | ) | (0.08 | ) | (0.21 | ) | 11.78 | 15.64 | 1,654,324 | 1.21 | (4) | 1.21 | (4) | 1.29 | 1.25 | 84 | ||||||||||||||||||||||||||||||
2006(2) | 10.00 | 0.10 | 0.34 | 0.44 | (0.06 | ) | — | (0.06 | ) | 10.38 | 4.44 | 1,082,101 | 1.09 | ‡ | 1.09 | ‡ | 1.16 | 1.18 | 72 | |||||||||||||||||||||||||||||||
Class I | ||||||||||||||||||||||||||||||||||||||||||||||||||
2009 | $ | 8.22 | $ | 0.06 | $ | (1.04 | ) | $ | (0.98 | ) | $ | (0.07 | )(7) | $ | — | $ | (0.07 | ) | $ | 7.17 | (11.69 | )% | $ | 527 | 1.26 | %(6) | 1.26 | %(6) | 1.35 | % | 0.93 | % | 182 | % | ||||||||||||||||
2008 | 11.78 | 0.09 | (3.11 | ) | (3.02 | ) | (0.10 | ) | (0.44 | ) | (0.54 | ) | 8.22 | (26.70 | ) | 400 | 1.60 | (5) | 1.60 | (5) | 1.66 | 0.92 | 93 | |||||||||||||||||||||||||||
2007 | 10.38 | 0.11 | 1.48 | 1.59 | (0.11 | ) | (0.08 | ) | (0.19 | ) | 11.78 | 15.42 | 517 | 1.46 | (4) | 1.46 | (4) | 1.54 | 0.99 | 84 | ||||||||||||||||||||||||||||||
2006(3) | 10.28 | 0.01 | 0.09 | 0.10 | — | — | — | 10.38 | 0.97 | 21 | 1.08 | ‡ | 1.08 | ‡ | 1.15 | 1.12 | 72 | |||||||||||||||||||||||||||||||||
| † | Returns and turnover rates are for the period indicated and have not been annualized. |
| ‡ | The expense ratios include dividend expense and interest expense on securities sold short. Had these expenses been excluded the ratios would have been 0.95% and 0.75% for Class A and Class I Shares, respectively. |
| * | Amount represents less than $0.01. |
| (1) | Per share net investment income and net realized and unrealized gains/(losses) calculated using average shares. |
| (2) | Commenced operations on December 14, 2005. All ratios for the period have been annualized. |
| (3) | Commenced operations on September 14, 2006. All ratios for the period have been annualized. |
| (4) | The expense ratios include dividend expense and interest expense on securities sold short. Had these expenses been excluded the ratios would have been 0.94% and 1.20% for Class A and Class I Shares, respectively. |
| (5) | The expense ratios include dividend expense and interest expense on securities sold short. Had these expenses been excluded the ratios would have been 1.15% and 1.40% for Class A and Class I, respectively. |
| (6) | The expense ratios include dividend expense and interest expense on securities sold short. Had these expenses been excluded the ratios would have been 0.95% and 1.20% for Class A and Class I, respectively. |
| (7) | Includes a return of capital of $0.01 and $0.00 for Class A and Class I, respectively. |
Amounts designated as “—” are $0 or have been rounded to $0.
The accompanying notes are an integral part of the financial statements.
| SEI Asset Allocation Trust / Semi-Annual Report / September 30, 2009 | 63 |
Table of Contents
September 30, 2009
1. ORGANIZATION
SEI Institutional Managed Trust (the “Trust”) is organized as a Massachusetts business trust under a Declaration of Trust dated October 20, 1986.
The Trust is registered under the Investment Company Act of 1940, as amended, as an open-end investment company with 22 Funds: Large Cap Value, Large Cap Growth, Tax-Managed Large Cap, Large Cap Diversified Alpha, S&P 500 Index, Small Cap Value, Small Cap Growth, Tax-Managed Small Cap, Small/Mid Cap Diversified Alpha, Mid-Cap, U.S. Managed Volatility, Global Managed Volatility, Tax-Managed Managed Volatility, Real Estate, Enhanced Income, Core Fixed Income, U.S. Fixed Income, High Yield Bond, Real Return and Prime Obligation Funds (each a “Fund,” collectively the “Funds”). The Trust is registered to offer: Class A shares of the Funds; Class E shares of the S&P 500 Fund; Class I shares of the Large Cap Value, Large Cap Growth, Large Cap Diversified Alpha, S&P 500 Index, Small Cap Value, Small Cap Growth, Small/Mid Cap Diversified Alpha, Mid-Cap, U.S. Managed Volatility, Global Managed Volatility, Real Estate, Enhanced Income, Core Fixed Income, High Yield Bond and Real Return Plus Funds; and Class Y shares of the Tax-Managed Large Cap Fund. The assets of each Fund are segregated, and a shareholder’s interest is limited to the Fund in which shares are held. The Funds’ prospectuses provide a description of each Fund’s investment objective, policies, and strategies.
On September 30, 2009, the Trust registered the Large Cap and Small Cap Funds which commenced operations on October 1, 2009. As of September 30, 2009, the Prime Obligation Fund had not yet commenced operations.
The Large Cap Diversified Alpha and Small/Mid Cap Diversified Alpha Funds have closed effective October 5, 2009. See Note 11 for further details.
2. SIGNIFICANT ACCOUNTING POLICIES
The following is a summary of the significant accounting policies followed by the Fund.
Financial Accounting Standards Board (“FASB”) Launches Accounting Standards Codification — The FASB previously issued FASB ASC 105 (formerly FASB Statement No. 168), The “FASB Accounting Standards Codification™” and the Hierarchy of Generally Accepted Accounting Principles (“ASC 105”). ASC 105 established the FASB Accounting Standards Codification™ (“Codification” or “ASC”) as the single source of authoritative U.S. generally accepted accounting principles (“GAAP”) recognized by the FASB to be applied by nongovernmental entities. Rules and interpretive releases of the Securities and Exchange Commission (“SEC”) under authority of federal securities laws were also sources of authoritative GAAP for SEC registrants. The Codification superseded all existing non-SEC accounting and reporting standards. All other non-grandfathered, non-SEC accounting literature not included in the Codification have become non-authoritative.
Following the Codification, the FASB will not issue new standards in the form of Statements, FASB Staff Positions or Emerging Issues Task Force Abstracts. Instead, it will issue Accounting Standards Updates, which will serve to update the Codification, provide background information about the guidance and provide the basis for conclusions on the changes to the Codification.
GAAP was not intended to be changed as a result of the FASB’s Codification project, but it has changed the way the guidance is organized and presented. As a result, these changes have had an impact on how companies reference GAAP in their financial statements and in their accounting policies for financial statements issued for interim and annual periods ending after September 15, 2009. The Trust implemented the Codification as of September 30, 2009.
Use of Estimates — The preparation of financial statements, in conformity with U.S. generally accepted accounting principles requires management to make estimates and assumptions that affect the reported amounts of assets and liabilities and disclosure of contingent assets and liabilities at the date of the financial statements and the reported amounts of increases and decreases in net assets from operations during the reporting period. Actual results could differ from those estimates.
Security Valuation — Securities listed on a securities exchange, market or automated quotation system for which quotations are readily available (except for securities traded on NASDAQ) are valued at the last quoted sale price on the primary exchange or market (foreign or domestic) on which they are traded, or, if there is no such reported sale, at the most recent quoted bid price. For securities traded on NASDAQ, the NASDAQ Official Closing Price will be used. If available, debt securities are priced based upon valuations provided by independent, third-party pricing agents. Such values generally reflect the last reported sales price if the security is actively traded. The third-party pricing agents may also value debt securities at an evaluated bid price by employing methodologies that utilize actual market transactions, broker-supplied valuations, or other methodologies designed to identify the market value for such securities. Debt obligations with remaining maturities of sixty days or less may be valued at their amortized cost, which approximates market value. Prices for most securities held in the Fund are provided daily by recognized independent pricing agents. If a security price cannot be obtained from an independent, third-party pricing agent, the Fund seeks to obtain a bid price from at least one independent broker.
Securities for which market prices are not “readily available” are valued in accordance with Fair Value Procedures established by the Trust’s Board of Trustees. The Trust’s Fair Value Procedures are implemented through a Fair Value Committee (the “Committee”) designated by the Trust’s Board of Trustees. Some of the more common reasons that may necessitate that a security be valued using Fair Value Procedures include: the security’s trading has been halted or suspended; the security has been de-listed from a national exchange;
| 64 | SEI Asset Allocation Trust / Semi-Annual Report / September 30, 2009 |
Table of Contents
the security’s primary trading market is temporarily closed at a time when, under normal conditions, it would be open; or the security’s primary pricing source is not able or willing to provide a price. When a security is valued in accordance with the Fair Value Procedures, the Committee will determine the value after taking into consideration relevant information reasonably available to the Committee.
For securities that principally trade on a foreign market or exchange, a significant gap in time can exist between the time of a particular security’s last trade and the time at which the Fund calculates its net asset value. The closing prices of such securities may no longer reflect their market value at the time the Fund calculates net asset value if an event that could materially affect the value of those securities (a “Significant Event”) has occurred between the time of the security’s last close and the time that the Fund calculates net asset value. A Significant Event may relate to a single issuer or to an entire market sector. If the adviser or sub-adviser of the Fund becomes aware of a Significant Event that has occurred with respect to a security or group of securities after the closing of the exchange or market on which the security or securities principally trade, but before the time at which the Fund calculates net asset value, it may request that a Committee Meeting be called. In addition, the Trust’s administrator monitors price movements among certain selected indices, securities and/or baskets of securities that may be an indicator that the closing prices received earlier from foreign exchanges or markets may not reflect market value at the time the Fund calculates net asset value. If price movements in a monitored index or security exceed levels established by the administrator, the administrator notifies the adviser or sub-adviser for the Fund holding the relevant securities that such limits have been exceeded. In such event, the adviser or sub-adviser makes the determination whether a Committee meeting should be called based on the information provided.
Options and warrants for which the primary market is a national securities exchange are valued at the last sale price on the exchange on which they are traded, or, in the absence of any sale, at the closing bid price. Options and warrants not traded on a national securities exchange are valued at the last quoted bid price.
In accordance with FASB ASC 820 (formerly known as FAS 157 “Fair Value Measurements”), Fair Value is defined as the price that the Fund would receive upon selling an investment in a timely transaction to an independent buyer in the principal or most advantageous market of the investment. A three-tier hierarchy has been established to maximize the use of observable and minimize the use of unobservable inputs and to establish classification of fair value measurements for disclosure purposes. Inputs refer broadly to the assumptions that market participants would use in pricing an asset. Inputs may be observable or unobservable. Observable inputs are inputs that reflect the assumptions market participants would use in pricing the asset or liability based on market data obtained from sources independent of the reporting entity. Unobservable inputs are inputs that reflect the reporting entity’s own assumptions about the assumptions market partic-
ipants would use in pricing the asset or liability based on the best information available in the circumstances.
The three-tier hierarchy of inputs is summarized in the three broad Levels listed below:
Level 1 — quoted prices in active markets for identical investments
Level 2 — other significant observable inputs (including quoted prices for similar investments, interest rates, prepayment speeds, credit risks, etc.)
Level 3 — significant unobservable inputs (including the Fund’s own assumptions in determining the fair value of investments)
The valuation techniques used by the Fund to measure fair value during the year ended September 30, 2009 maximized the use of observable inputs and minimized the use of unobservable inputs.
For the year ended September 30, 2009, there have been no significant changes to the Trust’s fair valuation methodologies.
Security Transactions and Investment Income — Security transactions are recorded on the trade date. Costs used in determining net realized capital gains and losses on the sale of securities are on the basis of specific identification. Dividend income is recognized on the ex-dividend date, and interest income is recognized using the accrual basis of accounting. Income from payment-in-kind securities is recorded daily based on the effective interest method of accrual.
Distributions received on securities that represent a return of capital or capital gain are recorded as a reduction of cost of investments and/or as a realized gain. The Trust estimates the components of distributions received that may be considered nontaxable distributions or capital gain distributions.
Amortization and accretion is calculated using the scientific interest method, which approximates the effective interest method over the holding period of the security. Amortization of premiums and discounts is included in interest income.
Repurchase Agreements — Securities pledged as collateral for repurchase agreements are held by the Fund’s custodian bank until the repurchase date of the repurchase agreement. The Fund also invests in tri-party repurchase agreements. Securities held as collateral for tri-party repurchase agreements are maintained by the broker’s custodian bank in a segregated account until the repurchase date of the repurchase agreement. Provisions of the repurchase agreements and the Trust’s policies require that the market value of the collateral, including accrued interest thereon, is sufficient in the event of default by the counterparty. If the counterparty defaults and the value of the collateral declines, or if the counterparty enters into an insolvency proceeding, realization of the collateral by the Fund may be delayed or limited.
| SEI Asset Allocation Trust / Semi-Annual Report / September 30, 2009 | 65 |
Table of Contents
Notes to Financial Statements (Continued)
September 30, 2009
Reverse Repurchase Agreements — The Fund may issue reverse repurchase agreements. A reverse repurchase agreement involves the sale of portfolio assets together with an agreement to repurchase the same assets later at a fixed price. Additional assets are maintained in an account with the broker. The segregated assets may consist of cash, U.S. Government securities, or other liquid securities at least equal in value to the obligations under the reverse repurchase agreements. In the event the buyer of securities under a reverse repurchase agreement files for bankruptcy or becomes insolvent, the Fund’s use of the proceeds under the agreement may be restricted pending a determination by the other party, or its trustee or receiver, whether to enforce the obligation to repurchase the securities. There were no reverse repurchase agreements outstanding as of September 30, 2009.
Compensating Balances — Funds with cash overdrafts in excess of $100,000 are required to leave 112% in compensating balance with US Bank, the custodian of the Trust, on the following day. Funds with positive cash balances in excess of $100,000 are allowed to overdraw 90% of the balance with US Bank on the following day.
Expenses — Expenses that are directly related to a Fund are charged directly to that Fund. Other operating expenses of the Funds are prorated to the Funds on the basis of relative daily net assets.
Classes — Class-specific expenses are borne by that class of shares. Income, realized and unrealized gains/losses and non class-specific expenses are allocated to the respective class on the basis of relative daily net assets.
Foreign Currency Translation — The books and records of the Fund are maintained in U.S. dollars on the following basis:
(I) market value of investment securities, assets and liabilities at the current rate of exchange; and
(II) purchases and sales of investment securities, income and expenses at the relevant rates of exchange prevailing on the respective dates of such transactions.
The Fund does not isolate that portion of gains and losses on investments in equity securities that is due to changes in the foreign exchange rates from that which is due to changes in market prices of equity securities.
The Fund reports certain foreign-currency-related transactions as components of realized gains for financial reporting purposes, whereas such components are treated as ordinary income for Federal income tax purposes.
Futures Contracts — The Fund utilized futures contracts during the year ended September 30, 2009. The Fund’s investments in futures contracts are designed to enable the Fund to more closely approximate the performance of their benchmark indices. Initial margin deposits of cash or securities are made upon entering into futures contracts. The contracts are marked to market daily and the resulting
changes in value are accounted for as unrealized gains and losses. Variation margin payments are paid or received, depending upon whether unrealized gains or losses are incurred. When the contract is closed, the Fund record a realized gain or loss equal to the difference between the proceeds from (or cost of) the closing transaction and the amount invested in the contract.
Risks of entering into futures contracts include the possibility that there will be an imperfect price correlation between the futures and the underlying securities. Second, it is possible that a lack of liquidity for futures contracts could exist in the secondary market, resulting in an inability to close a position prior to its maturity date. Third, the futures contract involves the risk that the Fund could lose more than the original margin deposit required to initiate a futures transaction.
Finally, the risk exists that losses could exceed amounts disclosed on the Statements of Assets and Liabilities.
Options/Swaptions Writing/Purchasing — The Fund may invest in financial options/swaptions contracts for the purpose of hedging its existing fund securities, or securities that the Fund intends to purchase, against fluctuations in fair value caused by changes in prevailing market interest rates. When the Fund writes or purchases an option/swaption, an amount equal to the premium received or paid by the Fund is recorded as a liability or an asset and is subsequently adjusted to the current market value of the option/swaption written or purchased. Premiums received or paid from writing or purchasing options/swaptions which expire unexercised are treated by the Fund on the expiration date as realized gains or losses. The difference between the premium and the amount paid or received on effecting a closing purchase or sale transaction, including brokerage commissions, is also treated as a realized gain or loss. If an option/swaption is exercised, the premium paid or received is added to the cost of the purchase or proceeds from the sale in determining whether the Fund has realized a gain or a loss on investment transactions. The Fund had no option/swaption contracts as of September 30, 2009.
The risk in writing a call option/swaption is that the Fund gives up the opportunity for profit if the market price of the security increases. The risk in writing a put option/swaption is that the Fund may incur a loss if the market price of the security decreases and the option/swaption is exercised. The risk in purchasing an option/swaption is that the Fund pays a premium whether or not the option/swaption is exercised. The Fund also has the additional risk of being unable to enter into a closing transaction at an acceptable price if a liquid secondary market does not exist. Option/swaption contracts also involve the risk that they may not work as intended due to unanticipated developments in market conditions or other causes.
Finally, the risk exists that losses on written options could exceed amounts disclosed on the Statements of Assets and Liabilities.
Securities Sold Short — As consistent with the Fund’s investment objectives, the Fund may engage in short sales. Short sales are transactions under which the Fund sells a security it does not own. To
| 66 | SEI Asset Allocation Trust / Semi-Annual Report / September 30, 2009 |
Table of Contents
complete such a transaction, the Fund must borrow the security to make delivery to the buyer. The Fund then is obligated to replace the security borrowed by purchasing the security at the market price at the time of the replacement. The price at such time may be more or less than the price at which the security was sold by the Fund. Until the security is replaced, the Fund is required to pay the lender amounts equal to any dividends or interest that accrue during the period of the loan. Dividends and interest are shown as an expense for financial reporting purposes. To borrow the security, the Fund also may be required to pay a premium, which would decrease proceeds of the security sold. The proceeds of the short sale are retained by the broker, to the extent necessary to meet margin requirements, until the short position is closed out. A gain, limited to the price at which the Fund sold the security short, or a loss, unlimited in size, will be recognized upon the close of a short sale.
Until the Fund closes its short position or replaces the borrowed security, the Fund will: (a) maintain a segregated account containing cash or liquid securities at such a level that (i) the amount deposited in the account plus the amount deposited with the broker as collateral will equal the current value of the security sold short; and (ii) the amount deposited in the segregated account plus the amount deposited with the broker as collateral will not be less than the market value of the security at the time the security was sold short, or (b) otherwise cover the Fund’s short positions. At September 30, 2009, the Fund did not hold any short positions.
Swap Agreements — The Fund may enter into swap contracts to manage interest rate risk and credit risk. The Fund’s investments in swap contracts is mainly for tactical hedging purposes rather than leveraging. A swap agreement is a two-party contract under which an agreement is made to exchange returns from predetermined investments or instruments, including a particular interest rate, foreign currency, or “basket” of securities representing a particular index. Interest rate swaps involve the exchange by the Fund with another party of their respective commitments to pay or receive interest (e.g., an exchange of floating rate payments for fixed rate payments) with respect to a notional amount of principal. Credit-default swaps involve periodic payments by the Fund or counterparty based on a specified rate multiplied by a notional amount assigned to an underlying debt instrument or group of debt instruments in exchange for the assumption of credit risk on the same instruments. In the event of a credit event, usually in the form of a credit rating downgrade, the party receiving periodic payments (i.e. floating rate payer) must pay the other party (i.e. fixed rate payer) an amount equal to the recovery rate used to settle the contracts. The recovery rate is a function of how many credit default swap investors wish to deliver the security or receive the security. The recovery rate is determined through an auction process. Total return swaps allow an investor to benefit from the cash flow without ever actually owning the underlying security. The receiver must pay any decline in value to the payer at the end of the total return swap. However, the investor does not need to make a payment if there is no decline in
price. Payments can be made on various indices, bonds (i.e. mortgage backed securities, bank debt and corporate), loans or commodities. The value of a total return swap is equal to the change in value of the underlying asset versus the accrued income payment based on LIBOR or some other form of indices on the notional amount. Interest rate swaps involve the exchange by the Fund with another party of their respective commitments to pay or receive interest (e.g., an exchange of floating rate payments for fixed rate payments) with respect to a notional amount of principal to manage the Fund’s exposure to interest rates. Payments received or made are recorded as realized gains or loss. The Fund could be exposed to credit or market risk due to unfavorable changes in the fluctuation of interest rates or if the counterparty defaults on its obligation to perform. Risk of loss may exceed amounts recognized on the statement of assets and liabilities. Interest rate swap contracts outstanding at period end, if any, are listed after the Fund’s portfolio. In connection with swap agreements securities may be set aside as collateral by the Fund’s custodian. The Fund may enter into swap agreements in order to, among other things, change the maturity or duration of the investment portfolio, to protect the Fund’s value from changes in interest rates, or to expose the Fund to a different security or market.
Swaps are marked-to-market daily based upon quotations from market makers and the resulting changes in market values, if any, are recorded as an unrealized gain or loss in the Statement of Operations. Net payments of interest are recorded as realized gains or losses.
Entering into swap agreements involves, to varying degrees, elements of credit and market risk in excess of the amounts recognized on the Statement of Assets and Liabilities. Such risks involve the possibility that there will be no liquid market for these agreements, that the counterparty to the agreement may default on its obligation to perform and that there may be unfavorable changes in the fluctuation of interest rates. Risks also arise from potential losses from adverse market movements.
This risk is mitigated by having a master netting arrangement between the Fund and the counterparty and by having the counterparty post collateral to cover the Fund’s exposure to the counterparty. See Note 3 for further details.
Collateralized Debt Obligations — The Fund may invest in collateralized debt obligations (“CDOs”), which include collateralized loan obligations (“CLOs”) and other similarly structured securities. CLOs are a type of asset-backed securities. A CLO is a trust typically collateralized by a pool of loans, which may include, among others, domestic and foreign senior secured loans, senior unsecured loans, and subordinate corporate loans, including loans that may be rated below investment grade or equivalent unrated loans. CDOs may charge management fees and administrative expenses.
For CDOs, the cashflows from the trust are split into two or more portions, called tranches, varying in risk and yield. The riskiest portion is the “equity” tranche which bears the bulk of defaults from the bonds
| SEI Asset Allocation Trust / Semi-Annual Report / September 30, 2009 | 67 |
Table of Contents
Notes to Financial Statements (Continued)
September 30, 2009
or loans in the trust and serves to protect the other, more senior tranches from default in all but the most severe circumstances. Since it is partially protected from defaults, a senior tranche from a CDO trust typically has a higher rating and lower yield than its underlying securities, and can be rated investment grade. Despite the protection from the equity tranche, CDO tranches can experience substantial losses due to actual defaults, increased sensitivity to defaults due to collateral default and disappearance of protecting tranches, market anticipation of defaults, as well as aversion to CDO securities as a class.
The risks of an investment in a CDO depend largely on its Class and its collateral securities. Normally, CLOs and other CDOs are privately offered and sold, and thus, are not registered under the securities laws. As a result, investments in CDOs may be characterized by the Fund as illiquid securities; however, an active dealer market may exist for CDOs, allowing a CDO to qualify for Rule 144A transactions. In addition to the normal risks associated with fixed income securities (e.g., interest rate risk and default risk), CDOs carry additional risks including, but not limited to: (i) the possibility that distributions from
collateral securities will not be adequate to make interest or other payments; (ii) the quality of the collateral may decline in value or default; (iii) the Fund may invest in CDOs that are subordinate to other classes; and (iv) the complex structure of the security may not be fully understood at the time of investment and may produce disputes with the issuer or unexpected investment results.
Illiquid Securities — A security is considered illiquid if it cannot be sold or disposed of in the ordinary course of business within seven days or less for its approximate carrying value on the books of the Fund. Valuations of illiquid securities may differ significantly from the values that would have been used had an active market value for these securities existed.
Dividends and Distributions to Shareholders — Dividends from net investment income are declared and paid to shareholders quarterly for the Fund. Any net realized capital gains on sales of securities are distributed to shareholders at least annually. Dividends and distributions are recorded on the ex-dividend date.
3. DERIVATIVE TRANSACTIONS
The effect of derivative instruments on the Statement of Operations for the year ended September 30, 2009.
Amount of realized Gain or (Loss) on Derivatives Recognized in Income ($ Thousands)
| Derivatives Not Accounted for as Hedging Instruments | Options | Swaptions | Futures | Forward Currency Contracts | Swaps | Total | |||||||||||||||
| Large Cap Diversified Alpha Fund | |||||||||||||||||||||
Interest Rate contracts | $ | — | $ | — | $ | (1,699 | ) | $ | — | $ | — | $ | (1,699 | ) | |||||||
Equity contracts | — | — | (39,206 | ) | — | (7,151 | ) | (46,357 | ) | ||||||||||||
Credit contracts | — | — | — | — | (22,606 | ) | (22,606 | ) | |||||||||||||
Total | $ | — | $ | — | $ | (40,905 | ) | $ | — | $ | (29,757 | ) | $ | (70,662 | ) | ||||||
Change in Unrealized Appreciation or (Depreciation) on Derivatives Recognized in Income ($ Thousands):
| Derivatives Not Accounted for as Hedging Instruments: | Options | Futures | Forward Currency Contracts | Swaps | Total | ||||||||||||
| Large Cap Diversified Alpha Fund | |||||||||||||||||
Interest Rate contracts | $ | — | $ | (1,023 | ) | $ | — | $ | — | $ | (1,023 | ) | |||||
Equity contracts | — | 16,091 | — | 1,628 | 17,719 | ||||||||||||
Credit contracts | — | — | — | 1,873 | 1,873 | ||||||||||||
Total | $ | — | $ | 15,068 | $ | — | $ | 3,501 | $ | 18,569 | |||||||
The ISDA Master Agreements maintain provisions for general obligations, representations, agreements, collateral, and events of default or termination. The occurrence of a specified event of termination may give a counterparty the right to terminate all of its contracts and affect settlement of all outstanding transactions under the applicable ISDA Master Agreement.
4. AGREEMENTS AND OTHER TRANSACTIONS WITH AFFILIATES
Administration and Transfer Agency Agreement — The Trust and SEI Investments Global Funds Services (the “Administrator”) are parties to
an amended and restated Administration and Transfer Agency Agreement dated December 10, 2003 under which the Administrator provides administrative and transfer agency services to the Fund for an annual fee of 0.35% of the average daily net assets of the Large Cap Diversified Alpha Fund. The Administrator has agreed voluntarily to waive all or a portion of its fee in order to limit the operating expenses of the Fund. Any such waiver is voluntary and may be terminated at any time at the Administrator’s sole discretion.
Investment Advisory Agreement — SEI Investments Management Corporation (“SIMC”) serves as investment adviser (the “Adviser”) to
| 68 | SEI Asset Allocation Trust / Semi-Annual Report / September 30, 2009 |
Table of Contents
the Fund. In connection with serving as Adviser, SIMC is entitled to a fee, which is calculated daily and paid monthly, based on the average daily net assets of the Fund. SIMC has voluntarily agreed to waive a portion of its fee so that the total annual expenses of the Fund, exclusive of short sale expenses and acquired fund fee expenses, will not exceed certain voluntary expense limitations adopted by SIMC. These waivers may be terminated at any time. Accordingly, the advisory fee and voluntary expense limitations for the Fund are as follows:
| Advisory Fees | Voluntary Expense Limitations | |||||
Large Cap Diversified Alpha Fund, Class A | 0.4000 | % | 0.9500 | % | ||
Large Cap Diversified Alpha Fund, Class I | 0.4000 | 1.2000 |
As of September 30, 2009, SIMC has entered into investment sub-advisory agreements with the following parties:
| Investment Sub-Adviser |
Large Cap Diversified Alpha Fund |
Analytic Investors, LLC |
Aronson + Johnson + Ortiz, LP |
Declaration Management and Research LLC |
Delaware Management Company |
INTECH Investment Management, LLC |
Legg Mason Capital Management Inc. |
Quantitative Management Associates LLC |
Under the investment sub-advisory agreements, each party receives an annual fee paid by SIMC.
Distribution Agreement — SEI Investments Distribution Co. (the “Distributor”), a wholly owned subsidiary of SEI Investments Company (“SEI”), serves as the Fund’s Distributor pursuant to a distribution agreement with the Trust. The Trust has adopted a shareholder servicing plan for Class A and Class I shares (the “Shareholder Servicing Plans”) under which a shareholder servicing fee of up to 0.25% of average daily net assets attributable to Class A and Class I shares will be paid to the Distributor. In addition to the Shareholder Servicing Plans, the Class I shares have adopted administrative service plans that provide for administrative service fees payable to the Distributor of up to 0.25% of the average daily net assets attributed to that class.
Other — The Distribution Agreement between the Distributor and the Trust provides that the Distributor may receive compensation on fund transactions effected for the Trust in accordance with the rules of the Securities and Exchange Commission (“SEC”). Accordingly, it is expected that fund transactions may result in brokerage commissions being paid to the Distributor. SEC rules require that such commissions not exceed usual and customary commissions.
Such commissions for the year ended September 30, 2009 were as follows ($ Thousands):
| Large Cap Diversified Alpha Fund | $ | 168 |
Under both the Shareholder Servicing Plans and administrative service plan, the Distributor may retain as profit any difference between
the fee it receives and the amount it pays to third parties. For the year ended September 30, 2009, the Distributor retained 100% of the shareholder servicing fees, less the waiver, and 100% of the administration servicing fees.
Certain officers and/or trustees of the Trust are also officers of the Administrator or the Distributor. The Trust pays each unaffiliated Trustee an annual fee for attendance at quarterly, interim and committee meetings. Compensation of officers and affiliated Trustees of the Trust is paid by the Administrator or Distributor.
A portion of the services provided by the Chief Compliance Officer (“CCO”) and his staff, whom are employees of the Administrator, are paid for by the Trust as incurred. The services include regulatory oversight of the Trust’s Adviser, sub-advisers and service providers as required by SEC regulations. The CCO’s services have been approved by and are reviewed annually by the Board.
Fees Paid Indirectly — The Fund may direct certain fund trades to the Distributor who pays a portion of the Fund’s expenses. Accordingly, the expenses reduced, which were used to pay third party expenses, and the effect on the Fund’s expense ratio, as a percentage of the Fund’s average daily net assets for the year ended September 30, 2009, can be found on the Statement of Operations and Financial Highlights, respectively.
Investment in Affiliated Security — The Fund may invest the cash collateral from the securities lending program in the SEI Liquidity Fund, L.P.
6. CAPITAL SHARE TRANSACTIONS
Capital Share Transactions for the Fund were as follows (000):
| Large Cap Diversified Alpha Fund | ||||||
| 2009 | 2008 | |||||
Class A: | ||||||
Shares Issued | 115,689 | 51,288 | ||||
Shares Issued in Lieu of Cash Distributions | 2,064 | 7,606 | ||||
Shares Redeemed | (116,320 | ) | (47,337 | ) | ||
Total Class A Transactions | 1,433 | 11,557 | ||||
Class I: | ||||||
Shares Issued | 26 | 6 | ||||
Shares Issued in Lieu of Cash Distributions | 1 | 2 | ||||
Shares Redeemed | (2 | ) | (3 | ) | ||
Total Class I Transactions | 25 | 5 | ||||
Increase in Share Transactions | 1,458 | 11,562 | ||||
7. INVESTMENT TRANSACTIONS
The cost of security purchases and proceeds from the sale of securities, other than temporary cash investments and futures, during the year ended September 30, 2009, were as follows:
| U.S. Gov’t ($ Thousands) | Other ($ Thousands) | Total ($ Thousands) | |||||||
Large Cap Diversified Alpha Fund | |||||||||
Purchases | $ | 446,087 | $ | 1,179,790 | $ | 1,625,877 | |||
Sales | 571,164 | 1,422,618 | 1,993,782 | ||||||
| SEI Asset Allocation Trust / Semi-Annual Report / September 30, 2009 | 69 |
Table of Contents
Notes to Financial Statements (Continued)
September 30, 2009
8. FEDERAL TAX INFORMATION
It is the Fund’s intention to continue to qualify as a regulated investment company under Subchapter M of The Internal Revenue Code and distribute all of its taxable income (including net capital gains). Accordingly, no provision for Federal income taxes is required.
Dividends from net investment income and distributions from net realized capital gains are determined in accordance with U.S. Federal income tax regulations, which may differ from those amounts determined under accounting principles generally accepted in the United States. These book/tax differences are either temporary or permanent in nature. To the extent these differences are permanent, they are charged or credited to paid-in capital, undistributed net investment income or accumulated net realized gain, as appropriate, in the period that the differences arise. Accordingly, the following permanent differences, primarily attributable to different treatment for gains and losses on paydowns of mortgage- and asset-backed securities for tax purposes, return of capital, swap income reclassification, nontaxable redemption in-kind gain/loss, distribution reclassification, REIT income reclassification foreign currency transactions and utilization of earnings and profits on shareholder redemptions and net operating losses have been reclassified to/from the following accounts as of September 30, 2009:
| Paid-in- Capital ($ Thousands) | Undistributed Net Investment Loss ($ Thousands) | Accumulated Realized Gain ($ Thousands) | |||||||||
Large Cap Diversified Alpha Fund | $ | (2,123 | ) | $ | (1,401 | ) | $ | 3,524 | |||
The tax character of dividends and distributions paid during the years ended September 30, 2009 and September 30, 2008 (unless otherwise indicated) was as follows:
| Ordinary Income ($ Thousands) | Long-Term Capital Gain ($ Thousands) | Return of Capital ($ Thousands) | Total ($ Thousands) | |||||||||||
Large Cap Diversified Alpha Fund | 2009 | $ | 10,564 | $ | — | $ | 2,123 | $ | 12,687 | |||||
| 2008 | 51,516 | 30,983 | — | 82,499 | ||||||||||
As of September 30, 2009, the components of Distributable Earnings were as follows:
| Undistributed Ordinary Income ($ Thousands) | Undistributed Long-Term Capital Gain ($ Thousands) | Capital Loss Carryforwards ($ Thousands) | Post October Losses ($ Thousands) | Post October Currency Losses ($ Thousands) | Unrealized Appreciation ($ Thousands) | Other Temporary Differences ($ Thousands) | Total Distrib Earnings ($ Thousands) | |||||||||||||||||||
Large Cap Diversified Alpha Fund | $ | — | $ | — | $ | (211,802 | ) | $ | (305,913 | ) | $ | — | $ | 12,994 | $ | — | $ | 504,721 | ||||||||
Post October losses represent losses realized on investment transactions from November 1, 2008 through September 30, 2009 that, in accordance with Federal income tax regulations, the Fund may defer and treat as having arisen in the following fiscal year. For Federal income tax purposes, capital loss carryforwards may be carried forward and applied against future capital gains as follows:
| Expires 2017 ($ Thousands) | Expires 2016 ($ Thousands) | Expires 2015 ($ Thousands) | Expires 2014 ($ Thousands) | Expires 2013 ($ Thousands) | Expires 2012 ($ Thousands) | Expires 2011 ($ Thousands) | Expires 2010 ($ Thousands) | Total Carryforwards ($ Thousands) | |||||||||||||||||||
Large Cap Diversified Alpha Fund | $ | 208,313 | $ | 3,489 | $ | — | $ | — | $ | — | $ | — | $ | — | $ | — | $ | 211,802 | |||||||||
During the year ended September 30, 2009, the Fund did not utilize capital loss carryforward to offset capital gains.
For Federal income tax purposes, the cost of securities owned at September 30, 2009, and the net realized gains or losses on securities sold for the period, were different from amounts reported for financial reporting purposes, primarily due to wash sales which cannot be used for Federal income tax purposes in the current year and have been deferred for use in future years. The Federal tax cost and aggregate gross unrealized appreciation and depreciation on investments held by the Fund at September 30, 2009, were as follows:
| Federal Tax Cost ($ Thousands) | Appreciated Securities ($ Thousands) | Depreciated Securities ($ Thousands) | Net Unrealized Appreciation ($ Thousands) | ||||||||||
Large Cap Diversified Alpha Fund | $ | 1,089,112 | $ | 117,889 | $ | (104,874 | ) | $ | 13,015 | ||||
Management has analyzed the Fund’s tax position taken on federal income tax returns for all open tax years and has concluded that as of September 30, 2009, no provision for income tax would be required in the Fund’s financial statements. The Fund’s federal and state income and federal excise tax returns for tax years for which the applicable statutes of limitations have not expired are subject to examination by the Internal Revenue Service and state departments of revenue.
9. SECURITIES LENDING
The Fund may lend portfolio securities to brokers, dealers and other financial organizations that meet capital and other credit requirements or other criteria established by the Trust’s Board of Trustees. These loans may not exceed 33 1/3% of the total asset value of the Fund (including the loan collateral). The Fund may not lend portfolio
| 70 | SEI Asset Allocation Trust / Semi-Annual Report / September 30, 2009 |
Table of Contents
securities to its Adviser, sub-adviser or their affiliates unless it has applied for and received specific authority to do so from the SEC. Loans of portfolio securities will be fully collateralized by cash. Collateral will be maintained in an amount equal to at least 100% of the current market value of the loaned securities by marking to market daily, although the borrower will be required to deliver collateral between 102% and 105% of the market value of borrowed securities for domestic and foreign securities, respectively. However, due to market fluctuations during the day, the value of securities loaned on a particular day may, during the course of the day, exceed the value of collateral. On each business day, the amount of collateral is adjusted based on the prior day’s market fluctuations and the current day’s lending activity. Income from lending activity is determined by the amount of interest earned on collateral, less any amounts payable to the borrowers of the securities and the lending agent. Lending securities involves certain risks, including the risk that the Fund may be delayed or prevented from recovering the collateral if the borrower fails to return the securities.
Cash collateral received in connection with securities lending is invested in short-term investments by the lending agent. These investments may include the SEI Liquidity Fund L.P., repurchase agreements, which are collateralized by United States Treasury and Government Agency securities, and high-quality, short-term instruments, such as floating rate corporate obligations, commercial paper, and private placements with an average weighted maturity not to exceed 60 days and a maturity not to exceed 397 days. Cash collateral is invested on behalf of the Fund in a manner similar to the Fund’s investments of its cash reserves and the Fund bears all of the gains and losses on such investment. There is no guarantee that these investments will not lose value.
10. CONCENTRATIONS/RISKS
In the normal course of business, the Trust enters into contracts that provide general indemnifications by the Trust to the counterparty to the contract. The Trust’s maximum exposure under these arrangements is dependent on future claims that may be made against the Trust’s and, therefore, cannot be estimated; however, Management believes that, based on experience, the risk of loss from such claims is considered remote.
11. SUBSEQUENT EVENTS
Management has evaluated the need for disclosures and/or adjustments resulting from subsequent events through November 30, 2009, the date the financial statements were issued. Based on this evaluation, no adjustments were required to the Financial Statements as of September 30, 2009. However, the following are details relating to a subsequent event that has occurred since September 30, 2009 through November 30, 2009. At a meeting of the Board of Trustees held on August 31, 2009, the Board of Trustees approved the closing and liquidation of the Large Cap Diversified Alpha Fund (the “Fund”) pursuant to a plan of liquidation (the “Plan”) — approved by the Board. The Fund was liquidated in accordance with the Plan on October 5, 2009.
Accounting rules require that financial statements for entities in liquidation, or for which liquidation appears imminent, be prepared on a liquidation basis of accounting. Liquidation basis of accounting requires the Funds to record assets and liabilities at values expected to be achieved in liquidation. A change to the liquidation basis of accounting would not have a material effect on the Funds carrying value of assets and liabilities nor its operations. There were no adjustments necessary to the financial statements, which are prepared on a going-concern basis, to conform to a liquidation basis of accounting.
Based on Managements evaluation, no other adjustments were required to the Financial Statements and no other subsequent events required recognition or disclosure in the Financial Statements as of September 30, 2009 through November 30, 2009.
12. OTHER MATTERS (Unaudited)
Due to volatility in the fixed income and equity markets, the market value of a Fund’s holdings may currently be lower than shown in the Summary Schedules of Investments (“SOI”). The values shown in the SOI’s were the market values as of September 30, 2009 and do not reflect any market events after September 30, 2009.
| SEI Asset Allocation Trust / Semi-Annual Report / September 30, 2009 | 71 |
Table of Contents
Report of Independent Registered Public Accounting Firm
To the Board of Trustees and Shareholders of
SEI Institutional Managed Trust:
We have audited the accompanying statements of assets and liabilities of the SEI Institutional Managed Trust, comprising the Large Cap Value Fund, Large Cap Growth Fund, Tax-Managed Large Cap Fund, Large Cap Diversified Alpha Fund, S&P 500 Index Fund, Small Cap Value Fund, Small Cap Growth Fund, Tax-Managed Small Cap Fund, Small/Mid Cap Diversified Alpha Fund, Mid-Cap Fund, U.S. Managed Volatility Fund, Global Managed Volatility Fund, Tax-Managed Managed Volatility Fund, Real Estate Fund, Enhanced Income Fund, Core Fixed Income Fund, U.S. Fixed Income Fund, High Yield Bond Fund and Real Return Fund (nineteen of the funds constituting the SEI Institutional Managed Trust, collectively, the “Funds”) as of September 30, 2009, including the schedules of investments or summary schedules of investments, as applicable, and the related statements of operations for the year or period then ended, the statements of changes in net assets for each of the years or periods in the two-year period then ended, and the financial highlights for each of the years or periods in the four-year period then ended. These financial statements and financial highlights are the responsibility of the Funds’ management. Our responsibility is to express an opinion on these financial statements and financial highlights based on our audits. The financial highlights of the Large Cap Value Fund, Large Cap Growth Fund, Tax-Managed Large Cap Fund, Small Cap Value Fund, Small Cap Growth Fund, Tax-Managed Small Cap Fund, Mid-Cap Fund, U.S. Managed Volatility Fund, Real Estate Fund, Core Fixed Income Fund and High Yield Bond Fund for the year or period presented through September 30, 2005, were audited by other auditors, whose report dated November 28, 2005 expressed an unqualified opinion thereon. The financial highlights of the S&P 500 Index Fund for the year ended March 31, 2005 were audited by other auditors whose report dated May 31, 2005 expressed an unqualified opinion thereon.
We conducted our audits in accordance with the standards of the Public Company Accounting Oversight Board (United States). Those standards require that we plan and perform the audit to obtain reasonable assurance about whether the financial statements and financial highlights are free of material misstatement. An audit includes examining, on a test basis, evidence supporting the amounts and disclosures in the financial statements. Our procedures included confirmation of securities owned as of September 30, 2009, by correspondence with the custodian and brokers or other appropriate auditing procedures. An audit also includes assessing the accounting principles used and significant estimates made by management, as well as evaluating the overall financial statement presentation. We believe that our audits provide a reasonable basis for our opinion.
In our opinion, the financial statements and financial highlights referred to above present fairly, in all material respects, the financial position of each of the funds comprising SEI Institutional Managed Trust as of September 30, 2009, the results of their operations for the year or period then ended, the changes in their net assets for each of the years or periods in the two-year period then ended, and the financial highlights for each of the years or periods in the four-year period then ended, in conformity with U.S. generally accepted accounting principles.
As further explained in Note 11, the Large Cap Diversified Alpha Fund and the Small/Mid Cap Diversified Alpha Fund were liquidated subsequent to year end.

Philadelphia, Pennsylvania
November 30, 2009
| 72 | SEI Asset Allocation Trust / Semi-Annual Report / September 30, 2009 |
Table of Contents
TRUSTEES AND OFFICERS OF THE TRUST (Unaudited)
The following chart lists Trustees and Officers as of November 21, 2009.
Set forth below are the names, addresses, ages, position with the Trust, Term of Office and Length of Time Served, the principal occupations for the last five years, number of portfolios in fund complex overseen by trustee, and other directorships outside the fund complex of each of the persons currently serving as Trustees and Officers of the Trust. The Trust’s Statement of Additional Information (“SAI”) includes additional information about the Trustees and Officers. The SAI may be obtained without charge by calling 1-800-342-5734.
| Name Address, and Age | Position(s) Held with Trusts | Term of Office and Length of Time Served1 | Principal Occupation(s) During Past Five Years | Number of Portfolios in Fund Complex Overseen by Trustee2 | Other Directorships Held by Trustee | |||||
| INTERESTED TRUSTEES | ||||||||||
Robert A. Nesher One Freedom Valley Drive, Oaks, PA 19456 63 yrs. old | Chairman of the Board of Trustees* | since 1982 | Currently performs various services on behalf of SEI Investments for which Mr. Nesher is compensated. | 80 | Trustee of The Advisors’ Inner Circle Fund, The Advisors’ Inner Circle Fund II, Bishop Street Funds, Director of SEI Global Master Fund, plc, SEI Global Assets Fund, plc, SEI Global Investments Fund, plc, SEI Investments Global, Limited, SEI Investments — Global Fund Services, Limited, SEI Investments (Europe), Limited, SEI Investments — Unit Trust Management (UK), Limited, SEI Global Nominee Ltd., SEI Structured Credit Fund, L.P., and SEI Multi-Strategy Funds plc. | |||||
William M. Doran 1701 Market Street Philadelphia, PA 19103 69 yrs. old | Trustee* | since 1982 | Self-employed consultant since 2003. Partner, Morgan, Lewis & Bockius LLP (law firm) from 1976 to 2003, counsel to the Trust, SEI, SIMC, the Administrator and the Distributor. Secretary of SEI since 1978. | 80 | Trustee of The Advisors’ Inner Circle Fund, The Advisors’ Inner Circle Fund II, Bishop Street Funds, Director of SEI since 1974. Director of the Distributor since 2003. Director of SEI Investments — Global Fund Services, Limited, SEI Investments Global, Limited, SEI Investments (Europe), Limited, SEI Investments (Asia), Limited and SEI Asset Korea Co., Ltd. | |||||
| TRUSTEES | ||||||||||
James M. Storey One Freedom Valley Drive, Oaks, PA 19456 78 yrs. old | Trustee | since 1995 | Attorney, sole practitioner since 1994. Partner, Dechert Price & Rhoads, September 1987-December 1993. | 80 | Trustee of The Advisors’ Inner Circle Fund, The Advisors’ Inner Circle Fund II, Bishop Street Funds, and U.S. Charitable Gift Trust. | |||||
| * | Messrs. Nesher and Doran are Trustees who may be deemed as “interested” persons of the Trust as that term is defined in the 1940 Act by virtue of their affiliation with SIMC and the Trust’s Distributor. |
| 1 | Each trustee shall hold office during the lifetime of this Trust until the election and qualification of his or her successor, or until he or she sooner dies, resigns or is removed in accordance with the Trust’s Declaration of Trust. |
| 2 | The Fund Complex includes the following Trusts: SEI Asset Allocation Trust, SEI Daily Income Trust, SEI Institutional Investments Trust, SEI Institutional International Trust, SEI Institutional Managed Trust, SEI Liquid Asset Trust, SEI Tax Exempt Trust and SEI Alpha Strategy Portfolios, L.P. |
| SEI Asset Allocation Trust / Semi-Annual Report / September 30, 2009 | 73 |
Table of Contents
TRUSTEES AND OFFICERS OF THE TRUST (Unaudited)
| Name Address, and Age | Position(s) Held with Trusts | Term of Office and Length of Time Served1 | Principal Occupation(s) During Past Five Years | Number of Portfolios in Fund Complex Overseen by Trustee2 | Other Directorships Held by Trustee | |||||
| TRUSTEES (continued) | ||||||||||
George J. Sullivan, Jr. One Freedom Valley Drive Oaks, PA 19456 66 yrs. old | Trustee | since 1996 | Self-Employed Consultant, Newfound Consultants Inc. since April 1997. | 80 | Trustee of The Advisors’ Inner Circle Fund, The Advisors’ Inner Circle Fund II, Bishop Street Funds, State Street Navigator Securities Lending Trust, and SEI Structured Credit Fund, L.P. Member of the independent review committee for SEI’s Canadian — registered mutual funds. | |||||
Rosemarie B. Greco One Freedom Valley Drive Oaks, PA 19456 63 yrs. old | Trustee | since 1999 | Director, Governor’s Office of Health Care Reform, Commonwealth of Pennsylvania since 2003. Founder and Principal, Grecoventures Ltd. from 1999 to 2002. | 80 | Director, Sonoco, Inc.; Director, Exelon Corporation; Trustee, Pennsylvania Real Estate Investment Trust. | |||||
Nina Lesavoy One Freedom Valley Drive, Oaks, PA 19456 52 yrs. old | Trustee | since 2003 | Founder and Managing Director, Avec Capital since 2008. Managing Director, Cue Capital from March 2002-March 2008. | 80 | Director of SEI Structured Credit Fund, L.P. | |||||
James M. Williams One Freedom Valley Drive, Oaks, PA 19456 62 yrs. old | Trustee | since 2004 | Vice President and Chief Investment Officer, J. Paul Getty Trust, Non-Profit Foundation for Visual Arts, since December 2002. President, Harbor Capital Advisors and Harbor Mutual Funds, 2000-2002. | 80 | Trustee/Director of Ariel Mutual Funds, and SEI Structured Credit Fund, L.P. | |||||
Mitchell A. Johnson One Freedom Valley Drive, Oaks, PA 19456 67 yrs. old | Trustee | since 2007 | Private Investor since 1994. | 80 | Trustee of the Advisors’ Inner Circle Fund, The Advisor’s Inner Circle Fund II, and Bishop Street Funds. | |||||
Hubert L. Harris, Jr. One Freedom Valley Drive, Oaks, PA 19456 66 yrs. old | Trustee | since 2008 | Retired since December 2005. Chief Executive Officer and Chair of the Board of Directors, AMVESCAP Retirement, Inc., 1997-December 2005. Chief Executive Officer, INVESCO North America, September 2003-December 2005. | 80 | Director of Colonial BancGroup, Inc. and Chair of the Board of Trustees, Georgia Tech Foundation, Inc. (nonprofit corporation). | |||||
| OFFICERS | ||||||||||
Robert A. Nesher One Freedom Valley Drive, Oaks, PA 19456 63 yrs. old | President & CEO | since 2005 | Currently performs various services on behalf of SEI for which Mr. Nesher is compensated. | N/A | N/A | |||||
Stephen F. Panner One Freedom Valley Drive, Oaks, PA 19456 39 yrs. old | Controller and Chief Financial Officer | since 2005 | Fund Accounting Director of the Administrator since 2005. Fund Administration Manager, Old Mutual Fund Services, 2000-2005. Chief Financial Officer, Controller and Treasurer, PBHG Funds and PBHG Insurance Series Fund, 2004-2005. Assistant Treasurer, PBHG Funds and PBHG Insurance Series Fund, 2000-2004. Assistant Treasurer, Old Mutual Advisors Fund, 2004-2005. | N/A | N/A | |||||
| 74 | SEI Asset Allocation Trust / Semi-Annual Report / September 30, 2009 |
Table of Contents
| Name Address, and Age | Position(s) Held with Trusts | Term of Office and Length of Time Served1 | Principal Occupation(s) During Past Five Years | Number of Portfolios in Fund Complex Overseen by Trustee2 | Other Directorships Held by Trustee | |||||
| OFFICERS (continued) | ||||||||||
| Russell Emery One Freedom Valley Drive Oaks, PA 19456 46 yrs. old | Chief Compliance Officer | since 2006 | Chief Compliance Officer of SEI Institutional Managed Trust, SEI Asset Allocation Trust, SEI Institutional International Trust, SEI Liquid Asset Trust, SEI Daily Income Trust, SEI Tax Exempt Trust, SEI Institutional Investments Trust, The Advisors’ Inner Circle Fund, The Advisors’ Inner Circle Fund II, and Bishop Street Funds, since March 2006. Chief Compliance Officer of SEI Structured Credit Fund, LP and SEI Alpha Strategy Portfolio, LP since June 2007. Director of Investment Product Management and Development of SIMC, February 2003-March 2006. | N/A | N/A | |||||
Timothy D. Barto Oaks, PA 19456 | Vice President and Secretary | since 2002 | General Counsel, Vice President and Secretary of SIMC and the Administrator since 2004. Vice President and Assistant Secretary of SEI since 2001. Vice President of SIMC and the Administrator since 1999. Assistant Secretary of SIMC, the Administrator and the Distributor and Vice President of the Distributor, 1999-2003. | N/A | N/A | |||||
| James Ndiaye One Freedom Valley Drive Oaks, PA 19456 41 yrs. old | Vice President and Assistant Secretary | since 2005 | Vice President and Assistant Secretary of SIMC since 2005. Vice President, Deutsche Asset Management (2003-2004). Associate, Morgan, Lewis & Bockius LLP (2000-2003). | N/A | N/A | |||||
| Michael T. Pang One Freedom Valley Drive Oaks, PA 19456 37 yrs. old | Vice President and Assistant Secretary | since 2005 | Vice President and Assistant Secretary of SIMC since 2005. Counsel, Caledonian Bank & Trust’s Mutual Funds Group (2004). Counsel, Permal Asset Management (2001-2004). | N/A | N/A | |||||
| Aaron Buser One Freedom Valley Drive Oaks, PA 19456 38 yrs. old | Vice President and Assistant Secretary | since 2008 | Vice President and Assistant Secretary of SIMC since 2007. Associate at Stark & Stark (2004-2007). Associate at Flaster/Greenberg, P.C. (2000-2004). | N/A | N/A | |||||
| David F. McCann One Freedom Valley Drive Oaks, PA 19456 33 yrs. old | Vice President and Assistant Secretary | since 2009 | Vice President and Assistant Secretary of SIMC since 2008. Attorney Drinker Biddle & Reath, LLP (law firm) May 2005-October 2008. Attorney, Pepper Hamilton, LLP (law firm), September 2001-May 2005. | N/A | N/A | |||||
| John J. McCue One Freedom Valley Drive Oaks, PA 19456 46 yrs. old | Vice President | since 2004 | Director of Portfolio Implementations for SIMC since 1995. Managing Director of Money Market Investments for SIMC since 2003. | N/A | N/A | |||||
| Andrew S. Decker One Freedom Valley Drive Oaks, PA 19456 45 yrs. old | Anti-Money Laundering Compliance Officer | since 2008 | Compliance Officer and Product Manager, SEI 2005-2008. Vice President, Old Mutual Capital, 2000-2005. | N/A | N/A | |||||
| 1 | Each trustee shall hold office during the lifetime of this Trust until the election and qualification of his or her successor, or until he or she sooner dies, resigns or is removed in accordance with the Trust’s Declaration of Trust. |
| 2 | The Fund Complex includes the following Trusts: SEI Asset Allocation Trust, SEI Daily Income Trust, SEI Institutional Investments Trust, SEI Institutional International Trust, SEI Institutional Managed Trust, SEI Liquid Asset Trust, SEI Tax Exempt Trust and SEI Alpha Strategy Portfolios, L.P. |
| SEI Asset Allocation Trust / Semi-Annual Report / September 30, 2009 | 75 |
Table of Contents
Disclosure of Fund Expenses (Unaudited)
All mutual funds have operating expenses. As a shareholder of a mutual fund, your investment is affected by these ongoing costs, which include (among others) costs for portfolio management, administrative services, and shareholder reports like this one. It is important for you to understand the impact of these costs on your investment returns.
Operating expenses such as these are deducted from the mutual fund’s gross income and directly reduce your final investment return. These expenses are expressed as a percentage of the mutual fund’s average net assets; this percentage is known as the mutual fund’s expense ratio.
The following examples use the expense ratio and are intended to help you understand the ongoing costs (in dollars) of investing in your Fund and to compare these costs with those of other mutual funds. The examples are based on an investment of $1,000 made at the beginning of the period shown and held for the entire period.
The table on the next page illustrates your Fund’s costs in two ways:
• Actual Fund return. This section helps you to estimate the actual expenses after fee waivers that your Fund incurred over the period. The “Expenses Paid During Period” column shows the actual dollar expense cost incurred by a $1,000 investment in the Fund, and the “Ending Account Value” number is derived from deducting that expense cost from the Fund’s gross investment return.
You can use this information, together with the actual amount you invested in your Fund, to estimate the expenses you paid over that period. Simply divide your actual starting account value by $1,000 to arrive at a ratio (for example, an $8,600 account value divided by $1,000 = 8.6), then multiply that ratio by the number shown for your Fund under “Expenses Paid During Period.”
• Hypothetical 5% return. This section helps you compare your Fund’s costs with those of other mutual funds. It assumes that your Fund had an annual 5% return before expenses during the year, but that the expense ratio (Column 3) is unchanged. This example is useful in making comparisons because the Securities and Exchange Commission requires all mutual funds to make this 5% calculation. You can assess your Fund’s comparative cost by comparing the hypothetical result for your Fund in the “Expense Paid During Period” column with those that appear in the same charts in the shareholder reports for other mutual funds.
NOTE: Because the return is set at 5% for comparison purposes — NOT your Fund’s actual return — the account values shown do not apply to your specific investment.
| Beginning Account Value 4/1/09 | Ending Account Value 9/30/09 | Annualized Expense Ratios | Expense Paid During Period* | |||||||||
Large Cap Diversifeid Alpha Fund | ||||||||||||
Actual Fund Return | ||||||||||||
Class A Shares | $ | 1,000.00 | $ | 1,346.80 | 0.95 | % | $ | 5.59 | ||||
Class I Shares | 1,000.00 | 1,344.00 | 1.20 | 7.05 | ||||||||
Hypothetical 5% Return | ||||||||||||
Class A Shares | $ | 1,000.00 | $ | 1,020.31 | 0.95 | % | $ | 4.81 | ||||
Class I Shares | 1,000.00 | 1,019.05 | 1.20 | 6.07 | ||||||||
| * | Expenses are equal to the Fund’s annualized expense ratio multiplied by the average account value over the period, multiplied by 183/365 (to reflect one-half year period shown). |
| 76 | SEI Asset Allocation Trust / Semi-Annual Report / September 30, 2009 |
Table of Contents
Notice to Shareholders (Unaudited)
For shareholders who do not have a September 30, 2009, taxable year end, this notice is for informational purposes only. For shareholders with a September 30, 2009, taxable year end, please consult your tax adviser as to the pertinence of this notice.
For the fiscal year ended September 30, 2009, the Funds are designating long term and qualifying dividend income with regard to distributions paid during the year as follows:
| Fund | (A) Long-Term Capital Gain Distribution | (B) Ordinary | Return of Capital | Total Distributions (Tax Basis) | (C) Dividends Qualifying for Corporate Dividends Rec. Deduction (1) | ||||||||||
| Large Cap Diversified Alpha Fund | 0 | % | 83 | % | 17 | % | 100 | % | 100 | % |
| Fund | (D) Qualifying Dividend Income (15% Tax Rate for QDI) (2) | (E) U.S. Government Interest (3) | Interest Related Dividends (4) | Short-Term Capital Gain Dividends (5) | ||||||||
| Large Cap Diversified Alpha Fund | 98 | % | 1 | % | 15 | % | 0 | % |
| (1) | Qualifying dividends represent dividends which qualify for the corporate dividends received deduction and is reflected as a percentage of ordinary income distributions (the total of short term capital gain and net investment income distributions). |
| (2) | The percentage in this column represents the amount of “Qualifying Dividend Income” and is reflected as a percentage of ordinary income distributions (the total of short term capital gain and net investment income distributions). |
| (3) | “U.S. Government Interest” represents the amount of interest that was derived from direct U.S. Government obligations and distributed during the fiscal year. This amount is reflected as a percentage of total ordinary income distributions (the total of short term capital gain and net investment income distributions). Generally, interest from direct U.S. Government obligations is exempt from state income tax. However, for shareholders who are residents of California, Connecticut and New York, the statutory threshold requirements were not satisfied to permit exemption of these amounts from state income. |
| (4) | The percentage in this column represents the amount of “Interest Related Dividends” and is reflected as a percentage of net investment income distributions that is exempt from U.S. withholding tax when paid to foreign investors. This provision of the IRC will be expiring for years beginning after January 1, 2010. |
| (5) | The percentage in this column represents the amount of “Short-Term Capital Gain Dividends” and is reflected as a percentage of short-term capital gain distributions that is exempt from U.S. withholding tax when paid to foreign investors. This provision of the IRC will be expiring for years beginning after January 1, 2010. |
Items (A) and (B) are based on the percentages of each Fund’s total distribution.
Items (C) and (D) are based on the percentage of ordinary income distributions of each Fund.
Item (E) is based on the percentage of gross income of each Fund.
Please consult your tax adviser for proper treatment of this information. This notification should be kept with your permanent tax records.
| SEI Asset Allocation Trust / Semi-Annual Report / September 30, 2009 | 77 |
Table of Contents
SEI ASSET ALLOCATION TRUST SEMI-ANNUAL REPORT SEPTEMBER 30, 2009
Robert A. Nesher, Chairman
Trustees
William M. Doran
James M. Storey
George J. Sullivan, Jr.
Rosemarie B. Greco
Nina Lesavoy
James M. Williams
Mitchell A. Johnson
Hubert L. Harris, Jr.
Officers
Robert A. Nesher
President and Chief Executive Officer
Stephen F. Panner
Controller and Chief Financial Officer
Russell Emery
Chief Compliance Officer
Timothy D. Barto
Vice President, Secretary
James Ndiaye
Vice President, Assistant Secretary
Michael T. Pang
Vice President, Assistant Secretary
Aaron Buser
Vice President, Assistant Secretary
David F. McCann
Vice President, Assistant Secretary
John J. McCue
Vice President
Andrew S. Decker
Anti-Money Laundering Compliance Officer
Investment Adviser
SEI Investments Management Corporation
Administrator
SEI Investments Global Funds Services
Distributor
SEI Investments Distribution Co.
Legal Counsel
Morgan, Lewis & Bockius LLP
Independent Registered Public Accounting Firm
KPMG LLP
This report and the financial statements contained herein are submitted for the general information of the shareholders of the Trust and must be preceded or accompanied by a current prospectus. Shares of the Funds are not deposits or obligations of, or guaranteed or endorsed by, any bank. The shares are not federally insured by the Federal Deposit Insurance Corporation (FDIC), the Federal Reserve Board, or any other government agency. Investment in the shares involves risk, including the possible loss of principal.
For more information call
1 800 DIAL SEI
(1 800 342 5734)
Table of Contents
SEI Investments Distribution Co.
Oaks, PA 19456 1.800.DIAL.SEI (1.800.342.5734)
SEI-F-118 (9/09)
Table of Contents
| Item 2. | Code of Ethics. |
Not applicable for semi-annual report.
| Item 3. | Audit Committee Financial Expert. |
Not applicable for semi-annual report.
| Item 4. | Principal Accountant Fees and Services. |
Not applicable for semi-annual report.
| Item 5. | Audit Committee of Listed Registrants. |
Not applicable.
Table of Contents
| Item 6. | Schedule of Investments. |
Schedule of Investments
Large Cap Diversified Alpha Fund
September 30, 2009
Description | Shares | Market Value ($ Thousands) | |||
COMMON STOCK — 77.8% | |||||
Consumer Discretionary — 7.5% | |||||
Advance Auto Parts | 6,300 | $ | 247 | ||
Aeropostale * | 700 | 30 | |||
Amazon.com * | 58,200 | 5,434 | |||
American Eagle Outfitters | 5,600 | 94 | |||
American Greetings, Cl A | 3,700 | 83 | |||
Apollo Group, Cl A * | 10,100 | 744 | |||
Autoliv | 15,900 | 534 | |||
Autonation * | 2,700 | 49 | |||
Autozone * | 4,783 | 699 | |||
Bed Bath & Beyond * | 3,000 | 113 | |||
Best Buy | 46,900 | 1,760 | |||
Big Lots * | 19,300 | 483 | |||
BorgWarner | 2,200 | 67 | |||
Brinker International | 4,000 | 63 | |||
Brink’s Home Security Holdings * | 1,400 | 43 | |||
Cablevision Systems, Cl A | 7,210 | 171 | |||
California Pizza Kitchen * | 3,600 | 56 | |||
Career Education * | 5,600 | 137 | |||
Carmax * | 7,400 | 155 | |||
Carmike Cinemas * | 1,400 | 14 | |||
Carnival | 2,100 | 70 | |||
Carter’s * | 2,300 | 61 | |||
CBS, Cl B | 2,200 | 26 | |||
Chico’s FAS * | 47,100 | 612 | |||
Chipotle Mexican Grill, Cl A * | 6,000 | 582 | |||
Coach | 47,600 | 1,567 | |||
Comcast, Cl A | 486,448 | 8,216 | |||
Core-Mark Holding * | 900 | 26 | |||
Darden Restaurants | 18,000 | 614 | |||
Dick’s Sporting Goods * | 6,500 | 146 | |||
DIRECTV Group * | 121,120 | 3,340 | |||
Discovery Communications, Cl C * | 1,500 | 39 | |||
DISH Network, Cl A * | 33,199 | 639 | |||
Dollar Tree * | 900 | 44 | |||
DR Horton | 4,100 | 47 | |||
DreamWorks Animation SKG, Cl A * | 900 | 32 | |||
Eastman Kodak | 268,700 | 1,285 | |||
Expedia * | 6,800 | 163 | |||
Family Dollar Stores | 6,800 | 180 | |||
Ford Motor * | 230,781 | 1,664 | |||
GameStop, Cl A * | 800 | 21 | |||
Gannett | 41,500 | 519 | |||
Gap | 81,800 | 1,751 | |||
Garmin | 16,700 | 630 | |||
Genuine Parts | 4,763 | 181 | |||
Goodyear Tire & Rubber * | 10,000 | 170 | |||
Grand Canyon Education * | 6,000 | 107 | |||
H&R Block | 11,500 | 211 | |||
Hanesbrands * | 27,100 | 580 | |||
Harley-Davidson | 300 | 7 | |||
Harman International Industries | 1,100 | 37 | |||
Hasbro | 9,900 | 275 | |||
Home Depot | 46,000 | 1,225 | |||
International Game Technology | 12,700 | 273 | |||
ITT Educational Services * | 1,400 | 155 | |||
J.C. Penney | 111,700 | 3,770 | |||
Description | Shares | Market Value ($ Thousands) | |||
Jarden | 2,100 | $ | 59 | ||
John Wiley & Sons, Cl A | 800 | 28 | |||
Johnson Controls | 51,009 | 1,304 | |||
JOS A Bank Clothiers * | 500 | 22 | |||
KB Home | 3,400 | 56 | |||
Kenneth Cole Productions, Cl A | 1,900 | 19 | |||
Kohl’s * | 5,256 | 300 | |||
Las Vegas Sands * | 2,300 | 39 | |||
Leggett & Platt | 36,900 | 716 | |||
Lennar, Cl A | 8,100 | 115 | |||
Liberty Global, Cl A * | 18,800 | 424 | |||
Liberty Media - Capital, Ser A * | 3,600 | 75 | |||
Liberty Media - Entertainment, Cl A * | 6,900 | 215 | |||
Liberty Media - Interactive, Cl A * | 2,300 | 25 | |||
Limited Brands | 5,400 | 92 | |||
Lowe’s | 86,700 | 1,815 | |||
Macy’s | 70,500 | 1,289 | |||
Marriott International, Cl A | 3,506 | 97 | |||
Marvel Entertainment * | 9,400 | 466 | |||
McDonald’s | 28,442 | 1,623 | |||
McGraw-Hill | 9,800 | 246 | |||
MDC Holdings | 1,400 | 49 | |||
Meredith | 800 | 24 | |||
MGM Mirage * | 9,000 | 108 | |||
NetFlix * | 500 | 23 | |||
Newell Rubbermaid | 1,800 | 28 | |||
News, Cl A | 8,500 | 102 | |||
Nike, Cl B | 52,624 | 3,405 | |||
Nordstrom | 2,100 | 64 | |||
Office Depot * | 17,800 | 118 | |||
Omnicom Group | 12,200 | 451 | |||
O’Reilly Automotive * | 7,000 | 253 | |||
Panera Bread, Cl A * | 300 | 17 | |||
Penn National Gaming * | 5,600 | 155 | |||
PetSmart | 28,400 | 618 | |||
Polo Ralph Lauren | 9,000 | 690 | |||
priceline.com * | 5,000 | 829 | |||
Pulte Homes | 5,527 | 61 | |||
RadioShack | 33,600 | 557 | |||
Regal Entertainment Group, Cl A | 3,700 | 46 | |||
Rent-A-Center * | 1,100 | 21 | |||
Ross Stores | 16,200 | 774 | |||
Royal Caribbean Cruises | 3,000 | 72 | |||
Sally Beauty Holdings * | 11,400 | 81 | |||
Scientific Games, Cl A * | 2,100 | 33 | |||
Scripps Networks Interactive, Cl A | 800 | 30 | |||
Sears Holdings * | 35,500 | 2,318 | |||
Shaw Communications, Cl B | 13,300 | 240 | |||
Sherwin-Williams | 2,480 | 149 | |||
Signet Jewelers * | 1,100 | 29 | |||
Smith & Wesson Holding * | 29,700 | 155 | |||
Sonic Automotive, Cl A | 13,700 | 144 | |||
Stanley Works | 1,200 | 51 | |||
Staples | 164,300 | 3,815 | |||
Starbucks * | 11,201 | 231 | |||
Starwood Hotels & Resorts Worldwide | 800 | 26 | |||
Steven Madden * | 1,700 | 63 | |||
Strayer Education | 1,800 | 392 | |||
1 | SEI Institutional Managed Trust / Annual Report / September 30, 2009 |
Table of Contents
Schedule of Investments
Large Cap Diversified Alpha Fund
September 30, 2009
Description | Shares | Market Value ($ Thousands) | |||
Sturm Ruger | 2,500 | $ | 32 | ||
Target | 40,845 | 1,907 | |||
Tempur-Pedic International | 2,200 | 42 | |||
Texas Roadhouse, Cl A * | 8,200 | 87 | |||
Tim Hortons | 10,400 | 294 | |||
Time Warner | 196,656 | 5,660 | |||
Time Warner Cable, Cl A | 46,615 | 2,009 | |||
TJX | 34,400 | 1,278 | |||
Toll Brothers * | 1,800 | 35 | |||
TravelCenters of America LLC * | 1 | — | |||
TRW Automotive Holdings * | 12,600 | 211 | |||
Universal Technical Institute * | 2,000 | 39 | |||
VF | 2,918 | 211 | |||
Viacom, Cl B * | 7,900 | 222 | |||
Virgin Media | 13,200 | 184 | |||
Walt Disney | 59,010 | 1,620 | |||
Weight Watchers International | 42,000 | 1,152 | |||
Wendy’s, Cl A | 9,200 | 44 | |||
Whirlpool | 7,400 | 518 | |||
Williams-Sonoma | 6,300 | 127 | |||
WMS Industries * | 2,400 | 107 | |||
Wyndham Worldwide | 26,700 | 436 | |||
Wynn Resorts * | 1,400 | 99 | |||
Yum! Brands | 24,600 | 831 | |||
| 82,633 | |||||
Consumer Staples — 6.8% | |||||
Altria Group | 42,952 | 765 | |||
American Italian Pasta, Cl A * | 5,900 | 160 | |||
Archer-Daniels-Midland | 28,500 | 833 | |||
Avon Products | 22,000 | 747 | |||
Brown-Forman, Cl B | 4,975 | 240 | |||
Bunge | 15,200 | 952 | |||
Campbell Soup | 13,800 | 450 | |||
Casey’s General Stores | 11,500 | 361 | |||
Central European Distribution * | 1,600 | 53 | |||
Chiquita Brands International * | 15,500 | 251 | |||
Church & Dwight | 300 | 17 | |||
Clorox | 11,000 | 647 | |||
Coca-Cola | 47,005 | 2,524 | |||
Coca-Cola Enterprises | 59,600 | 1,276 | |||
Colgate-Palmolive | 9,512 | 725 | |||
ConAgra Foods | 85,900 | 1,862 | |||
Constellation Brands, Cl A * | 1,600 | 24 | |||
Corn Products International | 600 | 17 | |||
Costco Wholesale | 65,917 | 3,722 | |||
CVS Caremark | 109,488 | 3,913 | |||
Dean Foods * | 3,900 | 69 | |||
Del Monte Foods | 48,900 | 566 | |||
Dr Pepper Snapple Group * | 500 | 14 | |||
Energizer Holdings * | 900 | 60 | |||
Estee Lauder, Cl A | 600 | 22 | |||
General Mills | 18,900 | 1,217 | |||
Green Mountain Coffee Roasters * | 400 | 30 | |||
Hansen Natural * | 1,200 | 44 | |||
Herbalife | 29,100 | 953 | |||
Hershey | 14,200 | 552 | |||
HJ Heinz | 9,674 | 385 | |||
Hormel Foods | 3,500 | 124 | |||
JM Smucker | 4,700 | 249 | |||
Kellogg | 15,775 | 777 | |||
Kimberly-Clark | 18,835 | 1,111 | |||
Description | Shares | Market Value ($ Thousands) | |||
Kraft Foods, Cl A | 37,739 | $ | 991 | ||
Kroger | 83,121 | 1,716 | |||
Lancaster Colony | 1,800 | 92 | |||
Lorillard | 2,150 | 160 | |||
McCormick | 953 | 32 | |||
NBTY * | 800 | 32 | |||
Pepsi Bottling Group | 4,806 | 175 | |||
PepsiAmericas | 1,800 | 52 | |||
PepsiCo | 108,847 | 6,385 | |||
Philip Morris International | 88,009 | 4,290 | |||
Prestige Brands Holdings * | 5,200 | 36 | |||
Procter & Gamble | 199,249 | 11,540 | |||
Ralcorp Holdings * | 600 | 35 | |||
Reynolds American | 29,166 | 1,298 | |||
Safeway | 38,100 | 751 | |||
Sanderson Farms | 7,100 | 267 | |||
Sara Lee | 226,442 | 2,523 | |||
Smithfield Foods * | 5,200 | 72 | |||
SUPERVALU | 28,500 | 429 | |||
SYSCO | 174,266 | 4,331 | |||
Tyson Foods, Cl A | 210,373 | 2,657 | |||
Walgreen | 188,964 | 7,080 | |||
Wal-Mart Stores | 81,950 | 4,023 | |||
Weis Markets | 1,000 | 32 | |||
Whole Foods Market * | 4,400 | 134 | |||
| 74,845 | |||||
Energy — 8.6% | |||||
Anadarko Petroleum | 6,800 | 427 | |||
Apache | 16,400 | 1,506 | |||
Arch Coal | 2,600 | 58 | |||
Atwood Oceanics * | 900 | 32 | |||
Baker Hughes | 330 | 14 | |||
BJ Services | 5,326 | 104 | |||
Cabot Oil & Gas | 3,900 | 139 | |||
Cameron International * | 1,176 | 45 | |||
Canadian Natural Resources | 31,700 | 2,130 | |||
Chesapeake Energy | 19,400 | 551 | |||
Chevron | 233,021 | 16,412 | |||
Concho Resources * | 3,783 | 137 | |||
ConocoPhillips | 166,279 | 7,509 | |||
Consol Energy | 2,300 | 104 | |||
Denbury Resources * | 8,700 | 132 | |||
Devon Energy | 13,400 | 902 | |||
Diamond Offshore Drilling | 5,300 | 506 | |||
Dresser-Rand Group * | 17,800 | 553 | |||
El Paso | 58,200 | 601 | |||
Encore Acquisition * | 3,000 | 112 | |||
EOG Resources | 31,700 | 2,647 | |||
EXCO Resources | 1,700 | 32 | |||
Exterran Holdings * | 1,000 | 24 | |||
Exxon Mobil | 394,987 | 27,100 | |||
FMC Technologies * | 4,400 | 230 | |||
Forest Oil * | 1,500 | 29 | |||
Frontier Oil | 8,900 | 124 | |||
Frontline | 900 | 21 | |||
Halliburton | 48,400 | 1,313 | |||
Harvest Natural Resources * | 4,200 | 22 | |||
Helix Energy Solutions Group * | 47,000 | 704 | |||
Hess | 845 | 45 | |||
Marathon Oil | 97,710 | 3,117 | |||
Massey Energy | 3,600 | 100 | |||
Murphy Oil | 32,399 | 1,865 | |||
2 | SEI Institutional Managed Trust / Annual Report / September 30, 2009 |
Table of Contents
Schedule of Investments
Large Cap Diversified Alpha Fund
September 30, 2009
Description | Shares | Market Value ($ Thousands) | |||
Nabors Industries * | 500 | $ | 10 | ||
National Oilwell Varco * | 87,534 | 3,775 | |||
Newfield Exploration * | 2,500 | 106 | |||
Noble Energy | 2,200 | 145 | |||
Occidental Petroleum | 95,407 | 7,480 | |||
Oceaneering International * | 2,100 | 119 | |||
Oil States International * | 13,500 | 474 | |||
Patterson-UTI Energy | 52,000 | 785 | |||
Peabody Energy | 2,800 | 104 | |||
PetroHawk Energy * | 5,800 | 140 | |||
Petroleo Brasileiro ADR | 26,100 | 1,198 | |||
Pioneer Natural Resources | 1,100 | 40 | |||
Plains Exploration & Production * | 900 | 25 | |||
Pride International * | 1,000 | 30 | |||
Quicksilver Resources * | 7,300 | 104 | |||
Range Resources | 21,700 | 1,071 | |||
Rowan | 18,600 | 429 | |||
SandRidge Energy * | 7,400 | 96 | |||
Schlumberger | 33,600 | 2,003 | |||
SEACOR Holdings * | 9,400 | 767 | |||
Seahawk Drilling * | 193 | 6 | |||
Smith International | 1,300 | 37 | |||
Southwestern Energy * | 2,600 | 111 | |||
Spectra Energy | 23,700 | 449 | |||
St. Mary Land & Exploration | 1,200 | 39 | |||
Sunoco | 18,400 | 524 | |||
Superior Energy Services * | 200 | 5 | |||
Tesoro | 4,500 | 67 | |||
Tidewater | 3,500 | 165 | |||
Transocean * | 30,600 | 2,617 | |||
Valero Energy | 1,600 | 31 | |||
Venoco * | 2,900 | 33 | |||
Western Refining * | 8,400 | 54 | |||
Whiting Petroleum * | 1,300 | 75 | |||
Williams | 59,800 | 1,069 | |||
XTO Energy | 37,391 | 1,545 | |||
| 95,075 | |||||
Financials — 12.8% | |||||
Affiliated Managers Group * | 1,600 | 104 | |||
Aflac | 113,316 | 4,843 | |||
Allied World Assurance Holdings | 10,900 | 522 | |||
Allstate | 102,760 | 3,146 | |||
AMB Property † | 1,500 | 34 | |||
American Express | 134,823 | 4,571 | |||
American Financial Group | 26,600 | 678 | |||
American International Group * | 1,600 | 71 | |||
AmeriCredit * | 7,100 | 112 | |||
Ameriprise Financial | 37,800 | 1,373 | |||
Annaly Capital Management † | 81,100 | 1,471 | |||
Anworth Mortgage Asset † | 12,500 | 99 | |||
AON | 786 | 32 | |||
Arch Capital Group * | 1,100 | 74 | |||
Argo Group International Holdings * | 4,800 | 162 | |||
Aspen Insurance Holdings | 7,100 | 188 | |||
Associated Banc-Corp | 8,100 | 93 | |||
Assurant | 16,974 | 544 | |||
Astoria Financial | 11,400 | 126 | |||
AvalonBay Communities † | 215 | 16 | |||
Axis Capital Holdings | 31,400 | 948 | |||
Description | Shares | Market Value ($ Thousands) | |||
Bancorpsouth | 7,000 | $ | 171 | ||
Bank of America | 694,778 | 11,756 | |||
Bank of Hawaii | 2,080 | 86 | |||
Bank of New York Mellon | 195,744 | 5,675 | |||
BB&T | 7,539 | 205 | |||
BlackRock | 2,300 | 499 | |||
Boston Properties † | 600 | 39 | |||
Brandywine Realty Trust † | 38,000 | 420 | |||
Brookfield Asset Management, Cl A | 25,100 | 570 | |||
Brown & Brown | 8,300 | 159 | |||
Camden Property Trust † | 500 | 20 | |||
Capital One Financial | 79,200 | 2,830 | |||
CapitalSource | 5,500 | 24 | |||
CB Richard Ellis Group, Cl A * | 8,100 | 95 | |||
Charles Schwab | 106,579 | 2,041 | |||
Chimera Investment † | 40,500 | 155 | |||
Chubb | 50,718 | 2,557 | |||
Cincinnati Financial | 9,300 | 242 | |||
Citigroup | 638,048 | 3,088 | |||
City National | 2,800 | 109 | |||
CME Group | 10,650 | 3,282 | |||
CNA Financial | 14,600 | 352 | |||
Colonial Properties Trust † | 7,700 | 75 | |||
Comerica | 20,700 | 614 | |||
Commerce Bancshares | 3,890 | 145 | |||
Compass Diversified Holdings | 1,800 | 19 | |||
Corporate Office Properties Trust † | 600 | 22 | |||
Credicorp | 9,300 | 723 | |||
Cullen/Frost Bankers | 3,700 | 191 | |||
Digital Realty Trust † | 500 | 23 | |||
Dime Community Bancshares | 4,600 | 53 | |||
Discover Financial Services | 96,545 | 1,567 | |||
Duke Realty † | 3,700 | 44 | |||
Eaton Vance | 3,800 | 106 | |||
Endurance Specialty Holdings | 38,800 | 1,415 | |||
Equity Residential † | 700 | 21 | |||
Erie Indemnity, Cl A | 1,500 | 56 | |||
Everest Re Group | 1,500 | 132 | |||
Fairfax Financial Holdings | 400 | 148 | |||
Federal Realty Investment Trust † | 400 | 25 | |||
Federated Investors, Cl B | 24,000 | 633 | |||
Fidelity National Financial, Cl A | 300 | 5 | |||
Fifth Third Bancorp | 82,300 | 834 | |||
First American | 800 | 26 | |||
First Cash Financial Services * | 1,300 | 22 | |||
First Community Bancshares | 1,700 | 21 | |||
First Horizon National * | 5,717 | 76 | |||
Flagstone Reinsurance Holdings | 4,100 | 46 | |||
Forest City Enterprises, Cl A | 69,400 | 928 | |||
Fpic Insurance Group * | 700 | 23 | |||
Franklin Resources | 10,781 | 1,085 | |||
Fulton Financial | 800 | 6 | |||
Genworth Financial, Cl A | 5,600 | 67 | |||
GFI Group | 6,000 | 43 | |||
Goldman Sachs Group | 56,349 | 10,388 | |||
Greenhill | 1,300 | 116 | |||
Greenlight Capital Re * | 1,100 | 21 | |||
Hartford Financial Services Group | 33,803 | 896 | |||
3 | SEI Institutional Managed Trust / Annual Report / September 30, 2009 |
Table of Contents
Schedule of Investments
Large Cap Diversified Alpha Fund
September 30, 2009
Description | Shares | Market Value ($ Thousands) | |||
HCC Insurance Holdings | 9,600 | $ | 263 | ||
HCP † | 4,100 | 118 | |||
Health Care † | 700 | 29 | |||
Hospitality Properties Trust † | 20,887 | 425 | |||
Host Hotels & Resorts † | 8,000 | 94 | |||
HRPT Properties Trust † | 16,500 | 124 | |||
Hudson City Bancorp | 140,368 | 1,846 | |||
Huntington Bancshares | 113,300 | 534 | |||
IntercontinentalExchange * | 27,500 | 2,673 | |||
Invesco | 9,400 | 214 | |||
Jefferies Group | 8,000 | 218 | |||
Jones Lang LaSalle | 2,100 | 99 | |||
JPMorgan Chase | 317,311 | 13,904 | |||
Keycorp | 13,600 | 88 | |||
Lazard, Cl A | 3,600 | 149 | |||
Legg Mason | 1,000 | 31 | |||
Leucadia National | 600 | 15 | |||
Liberty Property Trust † | 2,700 | 88 | |||
Lincoln National | 5,600 | 145 | |||
Loews | 11,957 | 410 | |||
M&T Bank | 1,700 | 106 | |||
Mack-Cali Realty † | 100 | 3 | |||
Marsh & McLennan | 3,197 | 79 | |||
Marshall & Ilsley | 13,200 | 107 | |||
MetLife | 22,742 | 866 | |||
MFA Financial † | 22,900 | 182 | |||
Montpelier Re Holdings | 12,300 | 201 | |||
Moody’s | 38,600 | 790 | |||
Morgan Stanley | 56,062 | 1,731 | |||
MSCI, Cl A * | 800 | 24 | |||
NASDAQ OMX Group * | 4,300 | 90 | |||
Northern Trust | 49,818 | 2,897 | |||
NYSE Euronext | 91,100 | 2,632 | |||
Old Republic International | 4,500 | 55 | |||
OneBeacon Insurance Group, Cl A | 4,100 | 56 | |||
optionsXpress Holdings | 14,000 | 242 | |||
PartnerRe | 5,900 | 454 | |||
People’s United Financial | 11,000 | 171 | |||
PHH * | 7,900 | 157 | |||
Platinum Underwriters Holdings | 20,200 | 724 | |||
PNC Financial Services Group | 19,146 | 930 | |||
Principal Financial Group | 4,300 | 118 | |||
Progressive | 9,800 | 162 | |||
Protective Life | 3,400 | 73 | |||
Prudential Financial | 41,800 | 2,086 | |||
Public Storage † | 2,600 | 196 | |||
Ramco-Gershenson Properties † | 4,400 | 39 | |||
Raymond James Financial | 5,400 | 126 | |||
Realty Income † | 1,200 | 31 | |||
Regions Financial | 13,584 | 84 | |||
Reinsurance Group of America, Cl A | 10,500 | 468 | |||
RenaissanceRe Holdings | 2,500 | 137 | |||
Senior Housing Properties Trust † | 25,100 | 480 | |||
Simon Property Group † | 259 | 18 | |||
SL Green Realty † | 1,200 | 53 | |||
SLM * | 7,900 | 69 | |||
StanCorp Financial Group | 2,000 | 81 | |||
State Street | 51,700 | 2,719 | |||
Description | Shares | Market Value ($ Thousands) | |||
SunTrust Banks | 1,300 | $ | 29 | ||
T. Rowe Price Group | 93,381 | 4,268 | |||
Taubman Centers † | 18,900 | 682 | |||
TCF Financial | 10,700 | 140 | |||
TD Ameritrade Holding * | 25,600 | 502 | |||
TFS Financial | 4,500 | 53 | |||
Torchmark | 12,971 | 563 | |||
Transatlantic Holdings | 500 | 25 | |||
Travelers | 67,152 | 3,306 | |||
Trustco Bank NY | 12,100 | 76 | |||
United America Indemnity, Cl A * | 4,400 | 32 | |||
Unum Group | 45,300 | 971 | |||
US Bancorp | 173,739 | 3,798 | |||
Valley National Bancorp | 4,647 | 57 | |||
Ventas † | 600 | 23 | |||
Vornado Realty Trust † | 532 | 34 | |||
Waddell & Reed Financial, Cl A | 7,700 | 219 | |||
Webster Financial | 7,500 | 94 | |||
Wells Fargo | 343,555 | 9,681 | |||
White Mountains Insurance Group | 100 | 31 | |||
World Acceptance * | 2,700 | 68 | |||
WR Berkley | 7,000 | 177 | |||
XL Capital, Cl A | 45,900 | 801 | |||
Zions Bancorporation | 6,400 | 115 | |||
| 140,846 | |||||
Health Care — 9.7% | |||||
Abbott Laboratories | 67,875 | 3,358 | |||
Aetna | 159,600 | 4,442 | |||
Alexion Pharmaceuticals * | 300 | 13 | |||
Allergan | 80,300 | 4,558 | |||
Allscripts Healthcare Solutions | 1,600 | 32 | |||
American Medical Systems Holdings * | 9,500 | 161 | |||
AmerisourceBergen | 202,422 | 4,530 | |||
Amgen * | 134,188 | 8,082 | |||
Amylin Pharmaceuticals * | 2,400 | 33 | |||
Baxter International | 36,989 | 2,109 | |||
Becton Dickinson | 14,286 | 997 | |||
Biogen Idec * | 40,203 | 2,031 | |||
Boston Scientific * | 8,900 | 94 | |||
Bristol-Myers Squibb | 150,167 | 3,382 | |||
C.R. Bard | 2,700 | 212 | |||
Cantel Medical * | 3,400 | 51 | |||
Cardinal Health | 17,500 | 469 | |||
CareFusion * | 19,600 | 427 | |||
Celgene * | 3,206 | 179 | |||
Cephalon * | 1,200 | 70 | |||
Cerner * | 1,200 | 90 | |||
Cigna | 2,891 | 81 | |||
Coventry Health Care * | 3,700 | 74 | |||
DaVita * | 2,300 | 130 | |||
Dendreon * | 4,500 | 126 | |||
Dentsply International | 1,200 | 41 | |||
Edwards Lifesciences * | 4,000 | 280 | |||
Eli Lilly | 77,389 | 2,556 | |||
Endo Pharmaceuticals Holdings * | 29,600 | 670 | |||
Enzon Pharmaceuticals * | 12,300 | 102 | |||
Express Scripts * | 1,100 | 85 | |||
Forest Laboratories * | 59,500 | 1,752 | |||
4 | SEI Institutional Managed Trust / Annual Report / September 30, 2009 |
Table of Contents
Schedule of Investments
Large Cap Diversified Alpha Fund
September 30, 2009
Description | Shares | Market Value ($ Thousands) | |||
Gen-Probe * | 300 | $ | 12 | ||
Genzyme * | 800 | 45 | |||
Gilead Sciences * | 111,100 | 5,175 | |||
Health Management Associates, Cl A * | 4,300 | 32 | |||
Health Net * | 31,800 | 490 | |||
HLTH * | 4,500 | 66 | |||
Hologic * | 4,500 | 74 | |||
Hospira * | 7,800 | 348 | |||
Humana * | 16,818 | 627 | |||
ICU Medical * | 2,500 | 92 | |||
Illumina * | 600 | 25 | |||
IMS Health | 5,600 | 86 | |||
Intuitive Surgical * | 1,600 | 420 | |||
Inverness Medical Innovations * | 1,700 | 66 | |||
Isis Pharmaceuticals * | 6,600 | 96 | |||
Johnson & Johnson | 175,343 | 10,677 | |||
King Pharmaceuticals * | 39,700 | 427 | |||
Laboratory Corp of America Holdings * | 3,945 | 259 | |||
LifePoint Hospitals * | 2,900 | 79 | |||
Lincare Holdings * | 30,000 | 938 | |||
McKesson | 41,517 | 2,472 | |||
Medco Health Solutions * | 68,328 | 3,779 | |||
Medtronic | 55,292 | 2,035 | |||
Merck | 66,336 | 2,098 | |||
Meridian Bioscience | 3,600 | 90 | |||
Mettler Toledo International * | 4,700 | 426 | |||
Millipore * | 500 | 35 | |||
Mylan Laboratories * | 46,400 | 743 | |||
Myriad Genetics * | 100 | 3 | |||
Novo Nordisk ADR | 37,500 | 2,360 | |||
Omnicare | 2,300 | 52 | |||
Perrigo | 9,200 | 313 | |||
Pfizer | 588,646 | 9,742 | |||
Psychiatric Solutions * | 1,000 | 27 | |||
Quest Diagnostics | 19,200 | 1,002 | |||
Quidel * | 6,700 | 109 | |||
ResMed * | 1,400 | 63 | |||
Schering-Plough | 45,169 | 1,276 | |||
Sepracor * | 1,400 | 32 | |||
St. Jude Medical * | 38,300 | 1,494 | |||
Stryker | 28,596 | 1,299 | |||
Teva Pharmaceutical Industries ADR | 21,400 | 1,082 | |||
Thermo Fisher Scientific * | 7,112 | 311 | |||
United Therapeutics * | 200 | 10 | |||
UnitedHealth Group | 285,200 | 7,141 | |||
Valeant Pharmaceuticals International * | 13,400 | 376 | |||
Varian Medical Systems * | 900 | 38 | |||
VCA Antech * | 800 | 22 | |||
Vertex Pharmaceuticals * | 2,500 | 95 | |||
Watson Pharmaceuticals * | 2,300 | 84 | |||
WellPoint * | 50,700 | 2,401 | |||
Wyeth | 59,030 | 2,868 | |||
Zimmer Holdings * | 29,398 | 1,571 | |||
| 106,700 | |||||
Industrials — 7.5% | |||||
3M | 17,345 | 1,280 | |||
Aecom Technology * | 6,500 | 176 | |||
AGCO * | 74,128 | 2,048 | |||
Description | Shares | Market Value ($ Thousands) | |||
Alliant Techsystems * | 5,300 | $ | 413 | ||
Ampco-Pittsburgh | 1,000 | 27 | |||
AO Smith | 4,600 | 175 | |||
BE Aerospace * | 4,000 | 80 | |||
Boeing | 32,309 | 1,749 | |||
Bucyrus International, Cl A | 1,000 | 36 | |||
Burlington Northern Santa Fe | 14,200 | 1,134 | |||
C.H. Robinson Worldwide | 12,283 | 709 | |||
Carlisle | 3,500 | 119 | |||
Caterpillar | 29,100 | 1,494 | |||
Cintas | 4,100 | 124 | |||
Continental Airlines, Cl B * | 900 | 15 | |||
Con-way | 2,300 | 88 | |||
Cooper Industries, Cl A | 10,900 | 409 | |||
CSX | 23,442 | 981 | |||
Cummins | 46,400 | 2,079 | |||
Danaher | 17,245 | 1,161 | |||
Deere | 11,900 | 511 | |||
Dover | 19,400 | 752 | |||
Dun & Bradstreet | 1,674 | 126 | |||
EMCOR Group * | 16,300 | 413 | |||
Emerson Electric | 33,700 | 1,351 | |||
Equifax | 18,100 | 527 | |||
Expeditors International of Washington | 82,200 | 2,889 | |||
Fastenal | 3,500 | 135 | |||
FedEx | 6,100 | 459 | |||
First Solar * | 700 | 107 | |||
Flowserve | 600 | 59 | |||
Fluor | 68,607 | 3,489 | |||
Foster Wheeler * | 14,200 | 453 | |||
Gardner Denver * | 21,300 | 743 | |||
General Cable * | 3,900 | 153 | |||
General Dynamics | 63,174 | 4,081 | |||
General Electric | 664,444 | 10,910 | |||
Goodrich | 19,800 | 1,076 | |||
Harsco | 12,162 | 431 | |||
Hertz Global Holdings * | 9,000 | 97 | |||
Honeywell International | 30,621 | 1,138 | |||
Hubbell, Cl B | 1,400 | 59 | |||
IDEX | 900 | 25 | |||
Illinois Tool Works | 17,365 | 742 | |||
ITT | 17,318 | 903 | |||
Jacobs Engineering Group * | 1,900 | 87 | |||
JB Hunt Transport Services | 700 | 23 | |||
Joy Global | 37,100 | 1,816 | |||
KBR | 91,593 | 2,133 | |||
Kennametal | 1,600 | 39 | |||
L-3 Communications Holdings | 17,900 | 1,438 | |||
Lennox International | 600 | 22 | |||
Lincoln Electric Holdings | 100 | 5 | |||
Lockheed Martin | 56,693 | 4,427 | |||
Manpower | 2,100 | 119 | |||
Masco | 1,600 | 20 | |||
McDermott International * | 20,100 | 508 | |||
Monster Worldwide * | 3,700 | 65 | |||
Multi-Color | 1,900 | 29 | |||
Navistar International * | 600 | 22 | |||
Norfolk Southern | 5,400 | 233 | |||
Northrop Grumman | 54,206 | 2,805 | |||
Oshkosh Truck | 2,200 | 68 | |||
Parker Hannifin | 21,900 | 1,135 | |||
Pentair | 2,100 | 62 | |||
5 | SEI Institutional Managed Trust / Annual Report / September 30, 2009 |
Table of Contents
Schedule of Investments
Large Cap Diversified Alpha Fund
September 30, 2009
Description | Shares | Market Value ($ Thousands) | |||
Pitney Bowes | 2,000 | $ | 50 | ||
Precision Castparts | 580 | 59 | |||
Quanta Services * | 44,600 | 987 | |||
Raytheon | 41,900 | 2,010 | |||
Republic Services | 1,335 | 36 | |||
Robert Half International | 600 | 15 | |||
Rockwell Automation | 1,900 | 81 | |||
Rockwell Collins | 3,200 | 162 | |||
Roper Industries | 900 | 46 | |||
RR Donnelley & Sons | 47,000 | 999 | |||
Shaw Group * | 2,800 | 90 | |||
Southwest Airlines | 134,783 | 1,294 | |||
Spirit Aerosystems Holdings, Cl A * | 2,900 | 52 | |||
SPX | 7,500 | 459 | |||
Stericycle * | 2,470 | 120 | |||
SunPower, Cl A * | 500 | 15 | |||
Teleflex | 800 | 39 | |||
Tennant | 1,400 | 41 | |||
Terex * | 4,300 | 89 | |||
Textron | 2,300 | 44 | |||
Thomas & Betts * | 17,900 | 538 | |||
Toro | 7,200 | 286 | |||
TransDigm Group * | 1,900 | 95 | |||
Tyco International | 36,300 | 1,251 | |||
Union Pacific | 48,378 | 2,823 | |||
United Parcel Service, Cl B | 75,359 | 4,256 | |||
United Technologies | 67,604 | 4,119 | |||
URS * | 8,700 | 380 | |||
UTI Worldwide | 2,000 | 29 | |||
Waste Connections * | 800 | 23 | |||
Waste Management | 22,193 | 662 | |||
Waste Services * | 2,000 | 9 | |||
Watson Wyatt Worldwide, Cl A | 2,500 | 109 | |||
WW Grainger | 8,232 | 736 | |||
| 82,986 | |||||
Information Technology — 16.1% | |||||
Accenture, Cl A | 44,600 | 1,662 | |||
Acme Packet * | 7,300 | 73 | |||
Adobe Systems * | 142,600 | 4,712 | |||
Advanced Micro Devices * | 17,100 | 97 | |||
Affiliated Computer Services, Cl A * | 4,100 | 222 | |||
Akamai Technologies * | 7,600 | 150 | |||
Alliance Data Systems * | 3,000 | 183 | |||
Altera | 10,300 | 211 | |||
Amdocs * | 17,900 | 481 | |||
Analog Devices | 43,900 | 1,211 | |||
Apple * | 66,898 | 12,401 | |||
Applied Micro Circuits * | 7,900 | 79 | |||
Arris Group * | 3,900 | 51 | |||
ASML Holding, Cl G | 43,500 | 1,286 | |||
Autodesk * | 33,700 | 802 | |||
Automatic Data Processing | 12,701 | 499 | |||
Avnet * | 19,100 | 496 | |||
BMC Software * | 12,600 | 473 | |||
Brightpoint * | 5,400 | 47 | |||
Broadcom, Cl A * | 58,100 | 1,783 | |||
Broadridge Financial Solutions | 8,200 | 165 | |||
CA | 106,300 | 2,338 | |||
Cadence Design Systems * | 12,200 | 90 | |||
Ciena * | 2,100 | 34 | |||
Description | Shares | Market Value ($ Thousands) | |||
Cirrus Logic * | 6,500 | $ | 36 | ||
Cisco Systems * | 433,098 | 10,195 | |||
Citrix Systems * | 1,300 | 51 | |||
Cognizant Technology Solutions, Cl A * | 3,100 | 120 | |||
CommScope * | 1,100 | 33 | |||
Computer Sciences * | 47,879 | 2,524 | |||
Convergys * | 4,400 | 44 | |||
Corning | 215,391 | 3,298 | |||
Cree * | 8,100 | 298 | |||
CTS | 1,600 | 15 | |||
Cypress Semiconductor * | 12,100 | 125 | |||
DealerTrack Holdings * | 6,600 | 125 | |||
Dell * | 22,800 | 348 | |||
Diebold | 15,500 | 511 | |||
Dolby Laboratories, Cl A * | 5,600 | 214 | |||
Earthlink | 3,400 | 29 | |||
eBay * | 237,669 | 5,611 | |||
Electronic Arts * | 104,323 | 1,987 | |||
EMC * | 312,200 | 5,320 | |||
Equinix * | 800 | 74 | |||
F5 Networks * | 3,200 | 127 | |||
Factset Research Systems | 1,000 | 66 | |||
Fidelity National Information Services | 5,246 | 134 | |||
Fiserv * | 8,800 | 424 | |||
Flextronics International * | 94,200 | 703 | |||
Global Payments | 600 | 28 | |||
Google, Cl A * | 22,775 | 11,293 | |||
Harris | 12,300 | 463 | |||
Hewitt Associates, Cl A * | 16,800 | 612 | |||
Hewlett-Packard | 214,623 | 10,132 | |||
IAC * | 8,000 | 161 | |||
Ingram Micro, Cl A * | 109,258 | 1,841 | |||
Intel | 476,032 | 9,316 | |||
Interactive Intelligence * | 2,100 | 40 | |||
International Business Machines | 89,977 | 10,762 | |||
International Rectifier * | 1,400 | 27 | |||
Intuit * | 102,900 | 2,933 | |||
Iron Mountain * | 4,300 | 114 | |||
Itron * | 500 | 32 | |||
j2 Global Communications * | 1,700 | 39 | |||
Jabil Circuit | 4,100 | 55 | |||
JDS Uniphase * | 16,500 | 117 | |||
Juniper Networks * | 3,600 | 97 | |||
Kla-Tencor | 800 | 29 | |||
Lam Research * | 2,700 | 92 | |||
Linear Technology | 8,000 | 221 | |||
Loral Space & Communications * | 500 | 14 | |||
Marvell Technology Group * | 12,500 | 202 | |||
Mastercard, Cl A | 14,700 | 2,971 | |||
Maxim Integrated Products | 2,200 | 40 | |||
McAfee * | 7,100 | 311 | |||
MEMC Electronic Materials * | 5,500 | 91 | |||
Metavante Technologies * | 5,100 | 176 | |||
Microchip Technology | 2,100 | 56 | |||
Micron Technology * | 11,200 | 92 | |||
Micros Systems * | 1,900 | 57 | |||
Microsoft | 514,026 | 13,308 | |||
Molex | 3,900 | 82 | |||
Motorola | 56,604 | 486 | |||
6 | SEI Institutional Managed Trust / Annual Report / September 30, 2009 |
Table of Contents
Schedule of Investments
Large Cap Diversified Alpha Fund
September 30, 2009
Description | Shares | Market Value ($ Thousands) | |||
National Instruments | 1,100 | $ | 30 | ||
National Semiconductor | 2,000 | 28 | |||
NetApp * | 4,100 | 109 | |||
NeuStar, Cl A * | 2,300 | 52 | |||
Nokia ADR | 73,000 | 1,067 | |||
Novatel Wireless * | 17,000 | 193 | |||
Novellus Systems * | 4,900 | 103 | |||
Nuance Communications * | 1,900 | 28 | |||
NVE * | 300 | 16 | |||
Nvidia * | 9,100 | 137 | |||
ON Semiconductor * | 4,600 | 38 | |||
Oplink Communications * | 900 | 13 | |||
Oracle | 163,208 | 3,401 | |||
Paychex | 32,900 | 956 | |||
Pegasystems | 1,300 | 45 | |||
Qualcomm | 167,100 | 7,516 | |||
Quest Software * | 1,500 | 25 | |||
Rackspace Hosting * | 49,700 | 848 | |||
Rambus * | 2,100 | 37 | |||
Red Hat * | 5,500 | 152 | |||
RightNow Technologies * | 7,600 | 110 | |||
Rovi * | 1,800 | 61 | |||
SAIC * | 32,800 | 575 | |||
Salesforce.com * | 500 | 28 | |||
SanDisk * | 3,600 | 78 | |||
Seagate Technology | 101,500 | 1,544 | |||
Semtech * | 900 | 15 | |||
Silicon Laboratories * | 3,200 | 148 | |||
Sohu.com * | 400 | 27 | |||
Sun Microsystems * | 23,507 | 214 | |||
Sybase * | 2,700 | 105 | |||
Symantec * | 173,756 | 2,862 | |||
Synopsys * | 22,300 | 500 | |||
Tech Data * | 43,836 | 1,824 | |||
Tellabs * | 10,100 | 70 | |||
Teradata * | 81,500 | 2,243 | |||
Teradyne * | 7,000 | 65 | |||
Texas Instruments | 240,077 | 5,687 | |||
THQ * | 3,600 | 25 | |||
Total System Services | 6,900 | 111 | |||
Trimble Navigation * | 2,300 | 55 | |||
Varian Semiconductor Equipment Associates * | 900 | 30 | |||
VeriSign * | 99,000 | 2,345 | |||
Visa, Cl A | 101,992 | 7,049 | |||
VMware, Cl A * | 2,100 | 84 | |||
Volterra Semiconductor * | 4,400 | 81 | |||
Western Digital * | 38,600 | 1,410 | |||
Western Union | 41,900 | 793 | |||
Xerox | 81,400 | 630 | |||
Xilinx | 8,000 | 187 | |||
Yahoo! * | 309,600 | 5,514 | |||
| 177,512 | |||||
Materials — 2.5% | |||||
Air Products & Chemicals | 600 | 46 | |||
Airgas | 200 | 10 | |||
AK Steel Holding | 600 | 12 | |||
Albemarle | 2,400 | 83 | |||
Allegheny Technologies | 4,600 | 161 | |||
Alpha Natural Resources * | 4,292 | 150 | |||
Ashland | 11,100 | 480 | |||
Ball | 12,500 | 615 | |||
Description | Shares | Market Value ($ Thousands) | |||
Bemis | 56,492 | $ | 1,464 | ||
BHP Billiton ADR | 17,300 | 1,142 | |||
Brush Engineered Materials * | 900 | 22 | |||
Cabot | 5,587 | 129 | |||
Celanese, Ser A | 5,300 | 132 | |||
CF Industries Holdings | 518 | 45 | |||
Cliffs Natural Resources | 1,701 | 55 | |||
Commercial Metals | 4,900 | 88 | |||
Crown Holdings * | 4,500 | 122 | |||
E.I. Du Pont de Nemours | 1,600 | 51 | |||
Eagle Materials | 1,900 | 54 | |||
Eastman Chemical | 13,500 | 723 | |||
Ecolab | 47,802 | 2,210 | |||
FMC | 1,000 | 56 | |||
Freeport-McMoRan Copper & Gold, Cl B | 36,100 | 2,477 | |||
Greif, Cl A | 500 | 28 | |||
Hawkins | 1,100 | 26 | |||
Huntsman | 3,400 | 31 | |||
International Flavors & Fragrances | 1,400 | 53 | |||
International Paper | 25,600 | 569 | |||
Intrepid Potash * | 3,000 | 71 | |||
Koppers Holdings | 900 | 27 | |||
Lubrizol | 17,700 | 1,265 | |||
Martin Marietta Materials | 300 | 28 | |||
Monsanto | 21,112 | 1,634 | |||
Mosaic | 800 | 38 | |||
NewMarket | 2,900 | 270 | |||
Newmont Mining | 4,600 | 202 | |||
Nucor | 29,500 | 1,387 | |||
Owens-Illinois * | 1,400 | 52 | |||
Packaging Corp of America | 1,300 | 27 | |||
Pactiv * | 25,201 | 656 | |||
Potash Corp of Saskatchewan | 14,800 | 1,337 | |||
PPG Industries | 4,500 | 262 | |||
Praxair | 50,115 | 4,094 | |||
Reliance Steel & Aluminum | 500 | 21 | |||
Rock-Tenn, Cl A | 8,600 | 405 | |||
Schnitzer Steel Industries, Cl A | 1,400 | 75 | |||
Scotts Miracle-Gro, Cl A | 7,700 | 331 | |||
Sealed Air | 2,100 | 41 | |||
Sigma-Aldrich | 700 | 38 | |||
Sonoco Products | 35,766 | 985 | |||
Southern Copper | 45,700 | 1,402 | |||
Steel Dynamics | 2,100 | 32 | |||
Stepan | 600 | 36 | |||
Syngenta ADR | 36,800 | 1,691 | |||
Temple-Inland | 3,600 | 59 | |||
Terra Industries | 1,716 | 59 | |||
Valspar | 5,200 | 143 | |||
Vulcan Materials | 700 | 38 | |||
Walter Energy | 2,300 | 138 | |||
Weyerhaeuser | 700 | 26 | |||
| 27,904 | |||||
Telecommunication Services — 2.8% | |||||
American Tower, Cl A * | 43,500 | 1,583 | |||
AT&T | 574,037 | 15,505 | |||
Atlantic Telegraph- Network | 1,700 | 91 | |||
CenturyTel | 23,701 | 796 | |||
Crown Castle International * | 85,800 | 2,691 | |||
Frontier Communications | 11,411 | 86 | |||
7 | SEI Institutional Managed Trust / Annual Report / September 30, 2009 |
Table of Contents
Schedule of Investments
Large Cap Diversified Alpha Fund
September 30, 2009
Description | Shares | Market Value ($ Thousands) | |||
iPCS * | 2,300 | $ | 40 | ||
Leap Wireless International * | 3,400 | 66 | |||
MetroPCS Communications * | 8,900 | 83 | |||
NII Holdings * | 28,456 | 853 | |||
NTELOS Holdings | 7,600 | 134 | |||
Qwest Communications International | 32,800 | 125 | |||
SBA Communications, Cl A * | 2,500 | 68 | |||
Sprint Nextel * | 177,439 | 701 | |||
Telephone & Data Systems | 15,800 | 490 | |||
USA Mobility | 1,600 | 21 | |||
Verizon Communications | 247,745 | 7,499 | |||
Windstream | 3,052 | 31 | |||
| 30,863 | |||||
Utilities — 3.5% | |||||
AES * | 503,701 | 7,465 | |||
AGL Resources | 5,300 | 187 | |||
Alliant Energy | 13,400 | 373 | |||
Ameren | 2,600 | 66 | |||
American Electric Power | 16,400 | 508 | |||
American Water Works | 10,700 | 214 | |||
Aqua America | 4,700 | 83 | |||
Atmos Energy | 22,100 | 623 | |||
Calpine * | 12,300 | 142 | |||
CMS Energy | 14,000 | 188 | |||
Consolidated Edison | 13,400 | 548 | |||
Constellation Energy Group | 22,800 | 738 | |||
Dominion Resources | 44,694 | 1,542 | |||
DPL | 5,500 | 144 | |||
DTE Energy | 25,500 | 896 | |||
Duke Energy | 7,300 | 115 | |||
Edison International | 57,100 | 1,917 | |||
Energen | 18,700 | 806 | |||
Entergy | 600 | 48 | |||
Equities | 5,800 | 247 | |||
Exelon | 53,974 | 2,678 | |||
FirstEnergy | 22,065 | 1,009 | |||
FPL Group | 9,300 | 514 | |||
Hawaiian Electric Industries | 12,100 | 219 | |||
Integrys Energy Group | 500 | 18 | |||
ITC Holdings | 1,000 | 45 | |||
MDU Resources Group | 600 | 12 | |||
Mirant * | 63,400 | 1,041 | |||
NiSource | 35,400 | 492 | |||
Northeast Utilities | 8,200 | 195 | |||
NRG Energy * | 100,172 | 2,824 | |||
NSTAR | 9,800 | 312 | |||
NV Energy | 87,100 | 1,009 | |||
OGE Energy | 17,500 | 579 | |||
Oneok | 600 | 22 | |||
PG&E | 8,136 | 329 | |||
Pinnacle West Capital | 9,100 | 299 | |||
PPL | 101,577 | 3,082 | |||
Progress Energy | 6,500 | 254 | |||
Public Service Enterprise Group | 80,402 | 2,528 | |||
Questar | 1,400 | 53 | |||
SCANA | 5,900 | 206 | |||
Sempra Energy | 47,892 | 2,385 | |||
Southern | 9,727 | 308 | |||
Southern Union | 23,000 | 478 | |||
TECO Energy | 2,600 | 37 | |||
Description | Shares/Face Amount ($ Thousands) | Market Value ($ Thousands) | ||||
UGI | 8,000 | $ | 200 | |||
Vectren | 600 | 14 | ||||
Westar Energy | 6,100 | 119 | ||||
Wisconsin Energy | 4,100 | 185 | ||||
Xcel Energy | 17,971 | 347 | ||||
| 38,643 | ||||||
Total Common Stock | 858,007 | |||||
CASH EQUIVALENT — 20.3% | ||||||
SEI Daily Income Trust, Prime Obligation Fund, Cl A, 0.110% ** †† | 223,317,662 | 223,318 | ||||
Total Cash Equivalent | 223,318 | |||||
U.S. TREASURY OBLIGATIONS — 1.9% | ||||||
U.S. Treasury Bills | ||||||
0.164%, 12/03/09 (A) (B) | $ | 6,307 | 6,306 | |||
0.055%, 01/07/10 (A) (B) | 14,500 | 14,496 | ||||
Total U.S. Treasury Obligations | 20,802 | |||||
Total Investments — 100.0% | $ | 1,102,127 | ||||
A summary of the open futures contracts held by the Fund at September 30, 2009, is as follows:
Type of Contract | Number of Contracts Long (Short) | Expiration Date | Unrealized Appreciation ($ Thousands) | ||||
S&P Composite Index | 902 | Dec-2009 | $ | 1,359 | |||
For the year ended September 30, 2009, the total amount of all open futures contracts, as presented in the table above, are representative of the volume of activity for this derivative type during the period.
Percentages are based on Net Assets of $1,102,521 ($ Thousands).
| * | Non-income producing security. |
| ** | Rate shown is the 7-day effective yield as of September 30, 2009. |
| † | Real Estate Investment Trust. |
| †† | Investment in Affiliated Security. |
| (A) | The rate reported is the effective yield at the time of purchase. |
| (B) | Security, or portion thereof, has been pledged as collateral on open futures contracts. |
ADR – American Depositary Receipt
Cl – Class
LLC – Limited Liability Company
Ser – Series
Amounts designated as “–” are $0 or have been rounded to $0.
8 | SEI Institutional Managed Trust / Annual Report / September 30, 2009 |
Table of Contents
| Item 7. | Disclosure of Proxy Voting Policies and Procedures for Closed-End Management Investment Companies. |
Not applicable.
| Item 8. | Portfolio Managers of Closed-End Management Investment Companies. |
Not applicable.
| Item 9. | Purchases of Equity Securities by Closed-End Management Company and Affiliated Purchasers. |
Not applicable.
| Item 10. | Submission of Matters to a Vote of Security Holders. |
The Registrant has a standing Nominating Committee (the “Committee”) currently consisting of the Independent Trustees. The Committee is responsible for evaluating and recommending nominees for election to the registrant’s Board of Trustees (the “Board”). Pursuant to the Committee’s Charter, adopted on June 18th 2004 and as amended, the Committee will review all shareholder recommendations for nominations to fill vacancies on the Board if such recommendations are submitted in writing and addressed to the Committee at the Registrant’s office.
| Item 11. | Controls and Procedures. |
(a) The certifying officers, whose certifications are included herewith, have evaluated the Registrant’s disclosure controls and procedures within 90 days of the filing date of this report. Based on their evaluation, the certifying officers have concluded that the Registrant’s disclosure controls and procedures are adequately designed, and are operating effectively to ensure, that information required to be disclosed by the Registrant in the reports it files or submits under the Securities Exchange Act of 1934 is recorded, processed, summarized and reported within the time periods specified in the Securities and Exchange Commission’s rules and forms.
Table of Contents
(b) There were no significant changes in the Registrant’s internal control over financial reporting that occurred during the Registrant’s last fiscal half-year that have materially affected, or are reasonably likely to materially affect, the Registrant’s internal control over financial reporting.
| Items 12. | Exhibits. |
(a)(1) Not applicable for semi-annual report.
(a)(2) A separate certification for the principal executive officer and the principal financial officer of the Registrant as required by Rule 30a-2(a) under the Investment Company Act of 1940, as amended (17 CFR 270.30a-2(a)), are filed herewith.
(b) Officer certifications as required by Rule 30a-2(b) under the Investment Company Act of 1940, as amended (17 CFR 270.30a-2(b)) also accompany this filing as an exhibit.
Table of Contents
SIGNATURES
Pursuant to the requirements of the Securities Exchange Act of 1934 and the Investment Company Act of 1940, the Registrant has duly caused this report to be signed on its behalf by the undersigned, thereunto duly authorized.
| (Registrant) | SEI Asset Allocation Trust | |||||||
| By (Signature and Title) | /s/ Robert A. Nesher | |||||||
Robert A. Nesher President & CEO | ||||||||
Date December 7, 2009
Pursuant to the requirements of the Securities Exchange Act of 1934 and the Investment Company Act of 1940, this report has been signed below by the following persons on behalf of the registrant and in the capacities and on the dates indicated.
| By (Signature and Title) | /s/ Robert A. Nesher | |||||||
Robert A. Nesher President & CEO | ||||||||
Date December 7, 2009
| By (Signature and Title) | /s/ Stephen F. Panner | |||||||
Stephen F. Panner Controller & CFO | ||||||||
Date December 7, 2009