UNITED STATES
SECURITIES AND EXCHANGE COMMISSION
Washington, D.C. 20549
FORM N-CSRS
CERTIFIED SHAREHOLDER REPORT OF REGISTERED
MANAGEMENT INVESTMENT COMPANIES
Investment Company Act file number 811-07445
SEI Asset Allocation Trust
(Exact name of registrant as specified in charter)
SEI Investments
One Freedom Valley Drive
Oaks, PA 19456
(Address of principal executive offices)
c/o CT Corporation
155 Federal Street
Boston, MA 02110
(Name and address of agent for service)
Registrant’s telephone number, including area code: 1-800-342-5734
Date of fiscal year end: March 31, 2016
Date of reporting period: September 30, 2015
| Item 1. | Reports to Stockholders. |

September 30, 2015
SEMI-ANNUAL REPORT
SEI Asset Allocation Trust
➤ Defensive Strategy Fund
➤ Defensive Strategy Allocation Fund
➤ Conservative Strategy Fund
➤ Conservative Strategy Allocation Fund
➤ Moderate Strategy Fund
➤ Moderate Strategy Allocation Fund
➤ Aggressive Strategy Fund
➤ Tax-Managed Aggressive Strategy Fund
➤ Core Market Strategy Fund
➤ Core Market Strategy Allocation Fund
➤ Market Growth Strategy Fund
➤ Market Growth Strategy Allocation Fund

TABLE OF CONTENTS
| 1 | ||||
| 16 | ||||
| 18 | ||||
| 20 | ||||
| 24 | ||||
| 27 | ||||
| 35 | ||||
The Trust files its complete schedule of portfolio holdings with the Securities and Exchange Commission for the first and third quarter of each fiscal year on Form N-Q within sixty days after the end of the period. The Trust’s Forms N-Q are available on the Commission’s website at http://www.sec.gov, and may be reviewed and copied at the Commission’s Public Reference Room in Washington, DC. Information on the operation of the Public Reference Room may be obtained by calling 1-800-SEC-0330.
A description of the policies and procedures that the Trust uses to determine how to vote proxies relating to portfolio securities, as well as information relating to how a Fund voted proxies relating to portfolio securities during the most recent 12-month period ended June 30, is available (i) without charge, upon request, by calling 1-800-DIAL-SEI; and (ii) on the Commission’s website at http://www.sec.gov.
SCHEDULE OF INVESTMENTS (Unaudited)
September 30, 2015
| Description | Shares | Market Value ($ Thousands) | ||||||
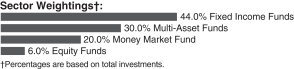
AFFILIATED INVESTMENT FUNDS — 100.0% |
| |||||||
FIXED INCOME FUNDS — 44.0% |
| |||||||
SEI Daily Income Trust Short-Duration Government Fund, Class Y | 878,303 | $ | 9,213 | |||||
SEI Daily Income Trust | 114,102 | 1,061 | ||||||
SEI Institutional Managed Trust High Yield Bond Fund, Class Y | 150,853 | 1,059 | ||||||
SEI Institutional Managed Trust Real Return Fund, Class Y | 214,069 | 2,124 | ||||||
SEI Institutional Managed Trust U.S. Fixed Income Fund, Class Y | 205,207 | 2,130 | ||||||
|
| |||||||
Total Fixed Income Funds | 15,587 | |||||||
|
| |||||||
MULTI-ASSET FUNDS — 30.0% |
| |||||||
SEI Institutional Managed Trust | 698,800 | 7,072 | ||||||
SEI Institutional Managed Trust | 168,984 | 1,768 | ||||||
SEI Institutional Managed Trust | 201,522 | 1,767 | ||||||
|
| |||||||
Total Multi-Asset Funds | 10,607 | |||||||
|
| |||||||
EQUITY FUNDS — 6.0% |
| |||||||
SEI Institutional Managed Trust | 97,959 | 1,063 | ||||||
SEI Institutional Managed Trust | 65,360 | 1,062 | ||||||
|
| |||||||
Total Equity Funds | 2,125 | |||||||
|
| |||||||
| Description | Shares | Market Value ($ Thousands) | ||||||
MONEY MARKET FUND (A) — 20.0% |
| |||||||
SEI Liquid Asset Trust | 7,075,469 | $ | 7,075 | |||||
|
| |||||||
Total Money Market Fund | 7,075 | |||||||
|
| |||||||
Total Investments — 100.0% | $ | 35,394 | ||||||
|
| |||||||
Percentages are based on Net Assets of $35,400 ($ Thousands).
| * | Non-Income Producing Fund. |
| (A) | Rate shown is the 7-day effective yield as of September 30, 2015. |
EUR — Euro
USD — U.S. Dollar
A list of the open forward foreign currency contracts held by the Fund at September 30, 2015, is as follows:
| Settlement Date | Counterparty | Currency to Deliver (Thousands) | Currency to Receive (Thousands) | Unrealized Appreciation ($ Thousands) | ||||||||||||||||||
10/30/15 | Brown Brothers Harriman | USD | 158 | EUR | 177 | $ | 1 | |||||||||||||||
|
| |||||||||||||||||||||
For the period ended September 30, 2015, the total amount of all open forward foreign currency contracts, as presented in the table above, are representative of the volume of activity for this derivative type during the period.
The following is a list of the inputs used as of September 30, 2015, in valuing the Fund’s investments and other financial instruments carried at value ($ Thousands):
| Investments in Securities | Level 1 | Level 2 | Level 3 | Total | ||||||||||||
Affiliated Investment Funds | $ | 35,394 | $ | — | $ | — | $ | 35,394 | ||||||||
|
|
|
|
|
|
|
| |||||||||
Total Investments in Securities | $ | 35,394 | $ | — | $ | — | $ | 35,394 | ||||||||
|
|
|
|
|
|
|
| |||||||||
| Other Financial Instruments | Level 1 | Level 2 | Level 3 | Total | ||||||||||||
Forwards Contracts * | $ | — | $ | 1 | $ | — | $ | 1 | ||||||||
|
|
|
|
|
|
|
| |||||||||
Total Other Financial Instruments | $ | — | $ | 1 | $ | — | $ | 1 | ||||||||
|
|
|
|
|
|
|
| |||||||||
| * | Forwards contracts are valued at unrealized appreciation on the instrument. |
As of September 30, 2015, there were no transfers between Level 1 and Level 2 assets and liabilities. As of September 30, 2015, there were no Level 3 securities.
For more information on valuation inputs, see Note 2 — Significant Accounting Policies in Notes to Financial Statements.
Amounts designated as “—” are $0 or have been rounded to $0.
| SEI Asset Allocation Trust / Semi-Annual Report / September 30, 2015 | 1 |
SCHEDULE OF INVESTMENTS (Unaudited)
Defensive Strategy Fund (Concluded)
September 30, 2015
The following is summary of the transactions with affiliates for the period ended September 30, 2015 ($ Thousands):
| Purchases at Cost | Proceeds from Sales | Realized Gain (Loss) | Change in Unrealized Appreciation (Depreciation) | Value 9/30/2015 | Dividend Income | |||||||||||||||||||||||||
SEI Daily Income Trust Short Duration Government Fund, Class Y | $ | 2,146 | $ | (1,379 | ) | $ | 8 | $ | (39 | ) | $ | 9,213 | $ | 40 | ||||||||||||||||
SEI Daily Income Trust Ultra Short Duration Bond Fund, Class Y | 99 | (190 | ) | — | (4 | ) | 1,061 | 5 | ||||||||||||||||||||||
SEI Institutional Managed Trust Enhanced Income Fund, Class Y | 141 | (1,660 | ) | (26 | ) | 4 | — | — | ||||||||||||||||||||||
SEI Institutional Managed Trust High Yield Bond Fund, Class Y | 196 | (200 | ) | 29 | (125 | ) | 1,059 | 33 | ||||||||||||||||||||||
SEI Institutional Managed Trust Real Return Fund, Class Y | 204 | (385 | ) | — | (6 | ) | 2,124 | — | ||||||||||||||||||||||
SEI Institutional Managed Trust U.S. Fixed Income Fund, Class Y | 255 | (397 | ) | 14 | (54 | ) | 2,130 | 26 | ||||||||||||||||||||||
SEI Institutional Managed Trust Multi-Asset Capital Stability Fund, Class Y | 643 | (1,224 | ) | 27 | (37 | ) | 7,072 | — | ||||||||||||||||||||||
SEI Institutional Managed Trust Multi-Asset Income Fund, Class Y | 212 | (318 | ) | 21 | (72 | ) | 1,768 | 40 | ||||||||||||||||||||||
SEI Institutional Managed Trust Multi-Asset Inflation Managed Fund, Class Y | 220 | (327 | ) | (5 | ) | (46 | ) | 1,767 | — | |||||||||||||||||||||
SEI Institutional Managed Trust Global Managed Volatility Fund, Class Y | 213 | (268 | ) | 84 | (110 | ) | 1,063 | 17 | ||||||||||||||||||||||
SEI Institutional Managed Trust U.S. Managed Volatility Fund, Class Y | 208 | (267 | ) | 138 | (169 | ) | 1,062 | 9 | ||||||||||||||||||||||
SEI Liquid Asset Trust Prime Obligation Fund, Class Y | 637 | (1,264 | ) | — | — | 7,075 | — | |||||||||||||||||||||||
|
|
|
|
|
|
|
|
|
|
|
| |||||||||||||||||||
Totals | $ | 5,174 | $ | (7,879 | ) | $ | 290 | $ | (658 | ) | $ | 35,394 | $ | 170 | ||||||||||||||||
|
|
|
|
|
|
|
|
|
|
|
| |||||||||||||||||||
The accompanying notes are an integral part of the financial statements.
| 2 | SEI Asset Allocation Trust / Semi-Annual Report / September 30, 2015 |
SCHEDULE OF INVESTMENTS (Unaudited)
Defensive Strategy Allocation Fund
September 30, 2015
| Description | Shares | Market Value ($ Thousands) | ||||||
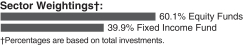
AFFILIATED INVESTMENT FUNDS — 100.0% |
| |||||||
EQUITY FUNDS — 60.1% |
| |||||||
SEI Institutional Managed Trust | 90,629 | $ | 1,628 | |||||
SEI Institutional Managed Trust | 200,189 | 3,251 | ||||||
|
| |||||||
Total Equity Funds | 4,879 | |||||||
|
| |||||||
| Description | Shares | Market Value ($ Thousands) | ||||||
FIXED INCOME FUND — 39.9% |
| |||||||
SEI Institutional Managed Trust | 461,914 | $ | 3,242 | |||||
|
| |||||||
Total Fixed Income Fund | 3,242 | |||||||
|
| |||||||
Total Investments — 100.0% | $ | 8,121 | ||||||
|
| |||||||
Percentages are based on Net Assets of $8,119 ($ Thousands).
As of September 30, 2015, all of the Fund’s investments in securities were considered Level 1, in accordance with the authoritative guidance on fair value measurements and disclosure under U.S. GAAP.
As of September 30, 2015, there were no transfers between Level 1 and Level 2 assets and liabilities. As of September 30, 2015, there were no Level 3 securities.
For more information on valuation inputs, see Note 2 — Significant Accounting Policies in Notes to Financial Statements.
Amounts designated as “—” are $0 or have been rounded to $0.
The following is summary of the transactions with affiliates for the period ended September 30, 2015 ($ Thousands):
| Security Description | Purchases at Cost | Proceeds from Sales | Realized Gain | Change in Unrealized Depreciation | Value 9/30/2015 | Dividend Income | ||||||||||||||||||||||||
SEI Institutional Managed Trust Real Estate Fund, Class Y | $ | 340 | $ | (533 | ) | $ | 155 | $ | (290 | ) | $ | 1,628 | $ | 13 | ||||||||||||||||
SEI Institutional Managed Trust U.S. Managed Volatility Fund, Class Y | 426 | (879 | ) | 386 | (603 | ) | 3,251 | 29 | ||||||||||||||||||||||
SEI Institutional Managed Trust High Yield Bond Fund, Class Y | 434 | (891 | ) | — | (231 | ) | 3,242 | 105 | ||||||||||||||||||||||
|
|
|
|
|
|
|
|
|
|
|
| |||||||||||||||||||
Totals | $ | 1,200 | $ | (2,303 | ) | $ | 541 | $ | (1,124 | ) | $ | 8,121 | $ | 147 | ||||||||||||||||
|
|
|
|
|
|
|
|
|
|
|
| |||||||||||||||||||
The accompanying notes are an integral part of the financial statements.
| SEI Asset Allocation Trust / Semi-Annual Report / September 30, 2015 | 3 |
SCHEDULE OF INVESTMENTS (Unaudited)
Conservative Strategy Fund
September 30, 2015
| Description | Shares | Market Value ($ Thousands) | ||||||
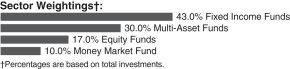
AFFILIATED INVESTMENT FUNDS — 100.0% |
| |||||||
FIXED INCOME FUNDS — 43.0% |
| |||||||
SEI Daily Income Trust Short-Duration Government Fund, Class Y | 1,320,235 | $ | 13,849 | |||||
SEI Daily Income Trust Ultra Short Duration Bond Fund, Class Y | 572,732 | 5,326 | ||||||
SEI Institutional International Trust | 243,661 | 2,130 | ||||||
SEI Institutional Managed Trust | 428,340 | 3,195 | ||||||
SEI Institutional Managed Trust | 909,927 | 6,388 | ||||||
SEI Institutional Managed Trust | 644,325 | 6,392 | ||||||
SEI Institutional Managed Trust | 821,878 | 8,531 | ||||||
|
| |||||||
Total Fixed Income Funds | 45,811 | |||||||
|
| |||||||
MULTI-ASSET FUNDS — 30.0% |
| |||||||
SEI Institutional Managed Trust | 1,578,858 | 15,978 | ||||||
SEI Institutional Managed Trust | 712,780 | 7,456 | ||||||
SEI Institutional Managed Trust Multi-Asset Inflation Managed Fund, Class Y* | 971,716 | 8,522 | ||||||
|
| |||||||
Total Multi-Asset Funds | 31,956 | |||||||
|
| |||||||
EQUITY FUNDS — 17.0% |
| |||||||
SEI Institutional Managed Trust | 883,659 | 9,588 | ||||||
SEI Institutional Managed Trust | 524,662 | 8,520 | ||||||
|
| |||||||
Total Equity Funds | 18,108 | |||||||
|
| |||||||
| Description | Shares | Market Value ($ Thousands) | ||||||
MONEY MARKET FUND (A) — 10.0% |
| |||||||
SEI Liquid Asset Trust | 10,652,881 | $ | 10,653 | |||||
|
| |||||||
Total Money Market Fund | 10,653 | |||||||
|
| |||||||
Total Investments — 100.0% | $ | 106,528 | ||||||
|
| |||||||
Percentages are based on Net Assets of $106,512 ($ Thousands).
| * | Non-Income Producing Fund. |
| (A) | Rate shown is the 7-day effective yield as of September 30, 2015. |
EUR — Euro
USD — U.S. Dollar
A list of the open forward foreign currency contracts held by the Fund at September 30, 2015, is as follows:
| Settlement Date | Counterparty | Currency to Deliver (Thousands) | Currency to Receive (Thousands) | Unrealized Appreciation ($ Thousands) | ||||||||||||||||||
10/30/15 | Brown Brothers Harriman | USD | 473 | EUR | 531 | $ | 3 | |||||||||||||||
|
| |||||||||||||||||||||
For the period ended September 30, 2015, the total amount of all open forward foreign currency contracts, as presented in the table above, are representative of the volume of activity for this derivative type during the period.
The following is a list of the inputs used as of September 30, 2015, in valuing the Fund’s investments and other financial instruments carried at value ($ Thousands):
| Investments in Securities | Level 1 | Level 2 | Level 3 | Total | ||||||||||||
Affiliated Investment Funds | $ | 106,528 | $ | — | $ | — | $ | 106,528 | ||||||||
|
|
|
|
|
|
|
| |||||||||
Total Investments in Securities | $ | 106,528 | $ | — | $ | — | $ | 106,528 | ||||||||
|
|
|
|
|
|
|
| |||||||||
| Other Financial Instruments | Level 1 | Level 2 | Level 3 | Total | ||||||||||||
Forwards Contracts* | $ | — | $ | 3 | $ | — | $ | 3 | ||||||||
|
|
|
|
|
|
|
| |||||||||
Total Other Financial Instruments | $ | — | $ | 3 | $ | — | $ | 3 | ||||||||
|
|
|
|
|
|
|
| |||||||||
| * | Forwards contracts are valued at unrealized appreciation on the instrument. |
As of September 30, 2015, there were no transfers between Level 1 and Level 2 assets and liabilities. As of September 30, 2015, there were no Level 3 securities.
For more information on valuation inputs, see Note 2 — Significant Accounting Policies in Notes to Financial Statements
Amounts designated as “—” are $0 or have been rounded to $0.
| 4 | SEI Asset Allocation Trust / Semi-Annual Report / September 30, 2015 |
The following is summary of the transactions with affiliates for the period ended September 30, 2015 ($ Thousands):
| Security Description | Purchases at Cost | Proceeds from Sales | Realized Gain (Loss) | Change in Unrealized Depreciation | Value 9/30/2015 | Dividend Income | ||||||||||||||||||||||||
SEI Daily Income Trust Short-Duration Government Fund, Class Y | $ | 7,563 | $ | (707 | ) | $ | 4 | $ | (24 | ) | $ | 13,849 | $ | 32 | ||||||||||||||||
SEI Daily Income Trust Ultra Short Duration Bond Fund, Class Y | 111 | (611 | ) | 4 | (22 | ) | 5,326 | 25 | ||||||||||||||||||||||
SEI Institutional International Trust Emerging Markets Debt Fund, Class Y | 218 | (228 | ) | — | (195 | ) | 2,130 | 12 | ||||||||||||||||||||||
SEI Institutional Managed Trust Enhanced Income Fund, Class Y | 309 | (8,629 | ) | 9 | (183 | ) | 3,195 | 118 | ||||||||||||||||||||||
SEI Institutional Managed Trust High Yield Bond Fund, Class Y | 549 | (733 | ) | 22 | (476 | ) | 6,388 | 201 | ||||||||||||||||||||||
SEI Institutional Managed Trust Real Return Fund, Class Y | 128 | (729 | ) | (2 | ) | (16 | ) | 6,392 | — | |||||||||||||||||||||
SEI Institutional Managed Trust U.S. Fixed Income Fund, Class Y | 286 | (954 | ) | 37 | (196 | ) | 8,531 | 105 | ||||||||||||||||||||||
SEI Institutional Managed Trust Multi-Asset Capital Stability Fund, Class Y | 275 | (1,772 | ) | 37 | (57 | ) | 15,978 | — | ||||||||||||||||||||||
SEI Institutional Managed Trust Multi-Asset Income Fund, Class Y | 316 | (825 | ) | 51 | (269 | ) | 7,456 | 181 | ||||||||||||||||||||||
SEI Institutional Managed Trust Multi-Asset Inflation Managed Fund, Class Y | 352 | (927 | ) | (25 | ) | (222 | ) | 8,522 | — | |||||||||||||||||||||
SEI Institutional Managed Trust Global Managed Volatility Fund, Class Y | 1,131 | (1,805 | ) | 561 | (791 | ) | 9,588 | — | ||||||||||||||||||||||
SEI Institutional Managed Trust U.S. Managed Volatility Fund, Class Y | 1,087 | (1,479 | ) | 602 | (1,034 | ) | 8,520 | 74 | ||||||||||||||||||||||
SEI Liquid Asset Trust Prime Obligation Fund, Class Y | 191 | (1,222 | ) | — | — | 10,653 | — | |||||||||||||||||||||||
|
|
|
|
|
|
|
|
|
|
|
| |||||||||||||||||||
Totals | $ | 12,516 | $ | (20,621 | ) | $ | 1,300 | $ | (3,485 | ) | $ | 106,528 | $ | 748 | ||||||||||||||||
|
|
|
|
|
|
|
|
|
|
|
| |||||||||||||||||||
The accompanying notes are an integral part of the financial statements.
| SEI Asset Allocation Trust / Semi-Annual Report / September 30, 2015 | 5 |
SCHEDULE OF INVESTMENTS (Unaudited)
Conservative Strategy Allocation Fund
September 30, 2015
| Description | Shares | Market Value ($ Thousands) | ||||||
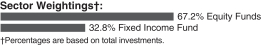
AFFILIATED INVESTMENT FUNDS — 100.0% |
| |||||||
EQUITY FUNDS — 67.2% |
| |||||||
SEI Institutional Managed Trust | 502,614 | $ | 9,027 | |||||
SEI Institutional Managed Trust | 1,131,785 | 18,380 | ||||||
|
| |||||||
Total Equity Funds | 27,407 | |||||||
|
| |||||||
| Description | Shares | Market Value ($ Thousands) | ||||||
FIXED INCOME FUND — 32.8% |
| |||||||
SEI Institutional Managed Trust | 1,901,725 | $ | 13,350 | |||||
|
| |||||||
Total Fixed Income Fund | 13,350 | |||||||
|
| |||||||
Total Investments — 100.0% | $ | 40,757 | ||||||
|
| |||||||
Percentages are based on Net Assets of $40,746 ($ Thousands).
As of September 30, 2015, all of the Fund’s investments in securities were considered Level 1, in accordance with the authoritative guidance on fair value measurements and disclosure under U.S. GAAP.
As of September 30, 2015, there were no transfers between Level 1 and Level 2 assets and liabilities. As of September 30, 2015, there were no Level 3 securities.
For more information on valuation inputs, see Note 2 — Significant Accounting Policies in Notes to Financial Statements.
The following is summary of the transactions with affiliates for the period ended September 30, 2015 ($ Thousands):
| Security Description | Purchases at Cost | Proceeds from Sales | Realized Gain | Change in Unrealized Depreciation | Value 9/30/2015 | Dividend Income | ||||||||||||||||||||||||
| SEI Institutional Managed Trust Real Estate Fund, Class Y | $ | 1,795 | $ | (1,498 | ) | $ | 782 | $ | (1,721 | ) | $ | 9,027 | $ | 71 | ||||||||||||||||
| SEI Institutional Managed Trust U.S. Managed Volatility Fund, Class Y | 1,300 | (1,779 | ) | 810 | (1,800 | ) | 18,380 | 158 | ||||||||||||||||||||||
| SEI Institutional Managed Trust High Yield Bond Fund, Class Y | 1,532 | (1,785 | ) | 649 | (1,626 | ) | 13,350 | 425 | ||||||||||||||||||||||
|
|
|
|
|
|
|
|
|
|
|
| |||||||||||||||||||
| Totals | $ | 4,627 | $ | (5,062 | ) | $ | 2,241 | $ | (5,147 | ) | $ | 40,757 | $ | 654 | ||||||||||||||||
|
|
|
|
|
|
|
|
|
|
|
| |||||||||||||||||||
The accompanying notes are an integral part of the financial statements.
| 6 | SEI Asset Allocation Trust / Semi-Annual Report / September 30, 2015 |
SCHEDULE OF INVESTMENTS (Unaudited)
Moderate Strategy Fund
September 30, 2015

| Description | Shares | Market Value ($ Thousands) | ||||||
AFFILIATED INVESTMENT FUNDS — 100.0% |
| |||||||
FIXED INCOME FUNDS — 38.0% |
| |||||||
SEI Daily Income Trust | 1,925,653 | $ | 20,200 | |||||
SEI Institutional International Trust Emerging Markets Debt Fund, Class Y | 1,145,466 | 10,011 | ||||||
SEI Institutional Managed Trust | 1,013,957 | 7,564 | ||||||
SEI Institutional Managed Trust | 2,852,921 | 20,028 | ||||||
SEI Institutional Managed Trust | 1,526,557 | 15,144 | ||||||
SEI Institutional Managed Trust | 2,191,071 | 22,743 | ||||||
|
| |||||||
Total Fixed Income Funds | 95,690 | |||||||
|
| |||||||
MULTI-ASSET FUNDS — 35.0% |
| |||||||
SEI Institutional Managed Trust | 2,645,879 | 25,268 | ||||||
SEI Institutional Managed Trust | 2,492,208 | 25,221 | ||||||
SEI Institutional Managed Trust | 1,205,212 | 12,607 | ||||||
SEI Institutional Managed Trust | 2,875,148 | 25,215 | ||||||
|
| |||||||
Total Multi-Asset Funds | 88,311 | |||||||
|
| |||||||
EQUITY FUNDS — 27.0% |
| |||||||
SEI Institutional Managed Trust | 3,258,473 | 35,354 | ||||||
SEI Institutional Managed Trust | 545,054 | 7,473 | ||||||
SEI Institutional Managed Trust | 1,550,875 | 25,186 | ||||||
Total Equity Funds | 68,013 | |||||||
|
| |||||||
Total Investments — 100.0% | $ | 252,014 | ||||||
|
| |||||||
Percentages are based on Net Assets of $251,944 ($ Thousands).
| * | Non-Income Producing Fund. |
EUR — Euro
USD — U.S. Dollar
A list of the open forward foreign currency contracts held by the Fund at September 30, 2015, is as follows:
| Settlement Date | Counterparty | Currency to Deliver (Thousands) | Currency to Receive (Thousands) | Unrealized Appreciation ($ Thousands) | ||||||||||||||||||
10/30/15 | Brown Brothers Harriman | USD | 2,257 | EUR | 2,536 | $ | 16 | |||||||||||||||
|
| |||||||||||||||||||||
For the period ended September 30, 2015, the total amount of all open forward foreign currency contracts, as presented in the table above, are representative of the volume of activity for this derivative type during the period.
The following is a list of the inputs used as of September 30, 2015, in valuing the Fund’s investments and other financial instruments carried at value ($ Thousands):
| Investments in Securities | Level 1 | Level 2 | Level 3 | Total | ||||||||||||
Affiliated Investment Funds | $ | 252,014 | $ | — | $ | — | $ | 252,014 | ||||||||
|
|
|
|
|
|
|
| |||||||||
Total Investments in Securities | $ | 252,014 | $ | — | $ | — | $ | 252,014 | ||||||||
|
|
|
|
|
|
|
| |||||||||
| Other Financial Instruments | Level 1 | Level 2 | Level 3 | Total | ||||||||||||
Forwards Contracts* | $ | — | $ | 16 | $ | — | $ | 16 | ||||||||
|
|
|
|
|
|
|
| |||||||||
Total Other Financial Instruments | $ | — | $ | 16 | $ | — | $ | 16 | ||||||||
|
|
|
|
|
|
|
| |||||||||
* Forwards contracts are valued at unrealized appreciation on the instrument.
As of September 30, 2015, there were no transfers between Level 1 and Level 2 assets and liabilities. As of September 30, 2015, there were no Level 3 securities.
For more information on valuation inputs, see Note 2 — Significant Accounting Policies in Notes to Financial Statements
Amounts designated as “—” are $0 or have been rounded to $0.
| SEI Asset Allocation Trust / Semi-Annual Report / September 30, 2015 | 7 |
SCHEDULE OF INVESTMENTS (Unaudited)
Moderate Strategy Fund (Concluded)
September 30, 2015
The following is summary of the transactions with affiliates for the period ended September 30, 2015 ($ Thousands):
| Security Description | Purchases at Cost | Proceeds from Sales | Realized Gain (Loss) | Change in Unrealized Depreciation | Value 9/30/2015 | Dividend Income | ||||||||||||||||||||||||
SEI Daily Income Trust Short-Duration Government Fund, Class Y | $ | 10,406 | $ | (1,094 | ) | $ | — | $ | (32 | ) | $ | 20,200 | $ | 51 | ||||||||||||||||
SEI Institutional International Trust Emerging Markets Debt Fund, Class Y | 591 | (561 | ) | 6 | (943 | ) | 10,011 | 57 | ||||||||||||||||||||||
SEI Institutional Managed Trust Enhanced Income Fund, Class Y | 500 | (11,747 | ) | (152 | ) | (142 | ) | 7,564 | 208 | |||||||||||||||||||||
SEI Institutional Managed Trust High Yield Bond Fund, Class Y | 1,079 | (1,455 | ) | (10 | ) | (1,440 | ) | 20,028 | 621 | |||||||||||||||||||||
SEI Institutional Managed Trust Real Return Fund, Class Y | 372 | (1,557 | ) | (4 | ) | (41 | ) | 15,144 | — | |||||||||||||||||||||
SEI Institutional Managed Trust U.S. Fixed Income Fund, Class Y | 838 | (2,262 | ) | 88 | (505 | ) | 22,743 | 280 | ||||||||||||||||||||||
SEI Institutional Managed Trust Multi-Asset Accumulation Fund, Class Y | 1,978 | (1,372 | ) | 65 | (2,692 | ) | 25,268 | — | ||||||||||||||||||||||
SEI Institutional Managed Trust Multi-Asset Capital Stability Fund, Class Y | 335 | (2,360 | ) | 49 | (86 | ) | 25,221 | — | ||||||||||||||||||||||
SEI Institutional Managed Trust Multi-Asset Income Fund, Class Y | 442 | (1,114 | ) | 2 | (373 | ) | 12,607 | 307 | ||||||||||||||||||||||
SEI Institutional Managed Trust Multi-Asset Inflation Managed Fund, Class Y | 659 | (1,976 | ) | (30 | ) | (708 | ) | 25,215 | — | |||||||||||||||||||||
SEI Institutional Managed Trust Global Managed Volatility Fund, Class Y | 2,114 | (3,981 | ) | 994 | (1,887 | ) | 35,354 | — | ||||||||||||||||||||||
SEI Institutional Managed Trust Large Cap Fund, Class Y | 806 | (887 | ) | 292 | (907 | ) | 7,473 | 41 | ||||||||||||||||||||||
SEI Institutional Managed Trust U.S. Managed Volatility Fund, Class Y | 1,820 | (2,616 | ) | 1,067 | (2,371 | ) | 25,186 | 217 | ||||||||||||||||||||||
|
|
|
|
|
|
|
|
|
|
|
| |||||||||||||||||||
Totals | $ | 21,940 | $ | (32,982 | ) | $ | 2,367 | $ | (12,127 | ) | $ | 252,014 | $ | 1,782 | ||||||||||||||||
|
|
|
|
|
|
|
|
|
|
|
| |||||||||||||||||||
The accompanying notes are an integral part of the financial statements.
| 8 | SEI Asset Allocation Trust / Semi-Annual Report / September 30, 2015 |
SCHEDULE OF INVESTMENTS (Unaudited)
Moderate Strategy Allocation Fund
September 30, 2015
| Description | Shares | Market Value ($ Thousands) | ||||||
AFFILIATED INVESTMENT FUNDS — 100.0% |
| |||||||
EQUITY FUNDS — 82.0% |
| |||||||
SEI Institutional International Trust International Equity Fund, Class Y | 860,762 | $ | 7,902 | |||||
SEI Institutional Managed Trust | 440,029 | 7,903 | ||||||
SEI Institutional Managed Trust | 826,119 | 15,804 | ||||||
SEI Institutional Managed Trust | 2,486,966 | 40,388 | ||||||
|
| |||||||
Total Equity Funds | 71,997 | |||||||
|
| |||||||
| Description | Shares | Market Value ($ Thousands) | ||||||
FIXED INCOME FUND — 18.0% |
| |||||||
SEI Institutional Managed Trust | 2,250,323 | $ | 15,797 | |||||
|
| |||||||
Total Fixed Income Fund | 15,797 | |||||||
|
| |||||||
Total Investments — 100.0% | $ | 87,794 | ||||||
|
| |||||||
Percentages are based on Net Assets of $87,782 ($ Thousands).
As of September 30, 2015, all of the Fund’s investments in securities were considered Level 1, in accordance with the authoritative guidance on fair value measurements and disclosure under U.S. GAAP.
As of September 30, 2015, there were no transfers between Level 1 and Level 2 assets and liabilities. As of September 30, 2015, there were no Level 3 securities.
For more information on valuation inputs, see Note 2 — Significant Accounting Policies in
Notes to Financial Statements.
Amount designated as “—” are $0 or have been rounded to $0
The following is summary of the transactions with affiliates for the period ended September 30, 2015 ($ Thousands):
| Security Description | Purchases at Cost | Proceeds from Sales | Realized Gain | Change in Unrealized Depreciation | Value | Dividend Income | ||||||||||||||||||
SEI Institutional International Trust International Equity Fund, Class Y | $ | 595 | $ | (594 | ) | $ | 199 | $ | (798 | ) | $ | 7,902 | $ | — | ||||||||||
SEI Institutional Managed Trust Real Estate Fund, Class Y | 1,243 | (1,035 | ) | 456 | (1,295 | ) | 7,903 | 63 | ||||||||||||||||
SEI Institutional Managed Trust Tax-Managed Large Cap Fund, Class Y | 925 | (775 | ) | 387 | (1,748 | ) | 15,804 | 89 | ||||||||||||||||
SEI Institutional Managed Trust U.S. Managed Volatility Fund, Class Y | 1,490 | (2,407 | ) | 976 | (3,188 | ) | 40,388 | 349 | ||||||||||||||||
SEI Institutional Managed Trust High Yield Bond Fund, Class Y | 1,464 | (1,600 | ) | 20 | (1,193 | ) | 15,797 | 499 | ||||||||||||||||
|
|
|
|
|
|
|
|
|
|
|
| |||||||||||||
Totals | $ | 5,717 | $ | (6,411 | ) | $ | 2,038 | $ | (8,222 | ) | $ | 87,794 | $ | 1,000 | ||||||||||
|
|
|
|
|
|
|
|
|
|
|
| |||||||||||||
The accompanying notes are an integral part of the financial statements.
| SEI Asset Allocation Trust / Semi-Annual Report / September 30, 2015 | 9 |
SCHEDULE OF INVESTMENTS (Unaudited)
Aggressive Strategy Fund
September 30, 2015
| Description | Shares | Market Value ($ Thousands) | ||||||
AFFILIATED INVESTMENT FUNDS — 100.0% |
| |||||||
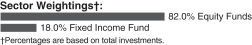
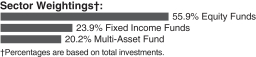
EQUITY FUNDS — 55.9% |
| |||||||
SEI Institutional International Trust Emerging Markets Equity Fund, Class Y | 2,264,391 | $ | 19,134 | |||||
SEI Institutional International Trust International Equity Fund, Class Y | 4,747,167 | 43,579 | ||||||
SEI Institutional Managed Trust | 5,314,091 | 72,856 | ||||||
SEI Institutional Managed Trust | 1,323,333 | 15,893 | ||||||
|
| |||||||
Total Equity Funds | 151,462 | |||||||
|
| |||||||
FIXED INCOME FUNDS — 23.9% |
| |||||||
SEI Institutional International Trust | 2,474,760 | 21,629 | ||||||
SEI Institutional Managed Trust | 2,390,806 | 21,733 | ||||||
SEI Institutional Managed Trust | 3,074,917 | 21,586 | ||||||
|
| |||||||
Total Fixed Income Funds | 64,948 | |||||||
|
| |||||||
| Description | Shares | Market Value ($ Thousands) | ||||||
MULTI-ASSET FUND — 20.2% | ||||||||
SEI Institutional Managed Trust | 5,733,620 | $ | 54,756 | |||||
|
| |||||||
Total Multi-Asset Fund | 54,756 | |||||||
|
| |||||||
Total Investments — 100.0% (Cost $261,526) ($ Thousands) | $ | 271,166 | ||||||
|
| |||||||
Percentages are based on Net Assets of $271,043 ($ Thousands).
As of September 30, 2015, all of the Fund’s investments were considered Level 1, in accordance with the authoritative guidance on fair value measurements and disclosure under U.S. GAAP.
As of September 30, 2015, there were no transfers between Level 1 and Level 2 assets and liabilities. As of September 30, 2015, there were no Level 3 securities.
For more information on valuation inputs, see Note 2 — Significant Accounting Policies in
Notes to Financial Statements
Amounts designated as “—” are $0 or have been rounded to $0.
The following is summary of the transactions with affiliates for the period ended September 30, 2015 ($ Thousands):
| Security Description | Purchases at Cost | Proceeds from Sales | Realized Gain (Loss) | Change in Unrealized Depreciation | Value 9/30/2015 | Dividend Income | ||||||||||||||||||||||||
SEI Institutional International Trust Emerging Markets Equity Fund, Class Y | $ | 2,933 | $ | (1,855 | ) | $ | 785 | $ | (4,182 | ) | $ | 19,134 | $ | — | ||||||||||||||||
SEI Institutional International Trust International Equity Fund, Class Y | 2,654 | (4,662 | ) | 1,503 | (4,774 | ) | 43,579 | — | ||||||||||||||||||||||
SEI Institutional Managed Trust Large Cap Fund, Class Y | 3,895 | (31,919 | ) | 11,083 | (16,995 | ) | 72,856 | 548 | ||||||||||||||||||||||
SEI Institutional Managed Trust Small Cap Fund, Class Y | 1,037 | (1,766 | ) | 540 | (2,451 | ) | 15,893 | — | ||||||||||||||||||||||
SEI Institutional International Trust Emerging Markets Debt Fund, Class Y | 1,120 | (1,909 | ) | 15 | (2,134 | ) | 21,629 | 131 | ||||||||||||||||||||||
SEI Institutional Managed Trust Dynamic Asset Allocation Fund, Class Y | 24,489 | (620 | ) | 14 | (2,150 | ) | 21,733 | — | ||||||||||||||||||||||
SEI Institutional Managed Trust High Yield Bond Fund, Class Y | 1,579 | (2,836 | ) | 885 | (2,510 | ) | 21,586 | 716 | ||||||||||||||||||||||
SEI Institutional Managed Trust Multi-Asset Accumulation Fund, Class Y | 2,347 | (3,304 | ) | (6 | ) | (5,950 | ) | 54,756 | — | |||||||||||||||||||||
|
|
|
|
|
|
|
|
|
|
|
| |||||||||||||||||||
Totals | $ | 40,054 | $ | (48,871 | ) | $ | 14,819 | $ | (41,146 | ) | $ | 271,166 | $ | 1,395 | ||||||||||||||||
|
|
|
|
|
|
|
|
|
|
|
| |||||||||||||||||||
The accompanying notes are an integral part of the financial statements.
| 10 | SEI Asset Allocation Trust / Semi-Annual Report / September 30, 2015 |
SCHEDULE OF INVESTMENTS (Unaudited)
Tax-Managed Aggressive Strategy Fund
September 30, 2015
 ..
..
| Description | Shares | Market Value ($ Thousands) | ||||||
AFFILIATED INVESTMENT FUNDS — 100.0% |
| |||||||
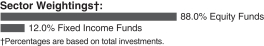
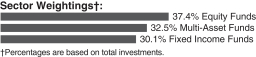
EQUITY FUNDS — 88.0% |
| |||||||
SEI Institutional International Trust | 134,864 | $ | 1,140 | |||||
SEI Institutional International Trust | 987,578 | 9,066 | ||||||
SEI Institutional Managed Trust | 1,635,515 | 31,287 | ||||||
SEI Institutional Managed Trust | 441,083 | 7,741 | ||||||
|
| |||||||
Total Equity Funds | 49,234 | |||||||
|
| |||||||
| Description | Shares | Market Value ($ Thousands) | ||||||
FIXED INCOME FUNDS — 12.0% |
| |||||||
SEI Institutional International Trust | 256,978 | $ | 2,246 | |||||
SEI Institutional Managed Trust | 637,687 | 4,477 | ||||||
|
| |||||||
Total Fixed Income Funds | 6,723 | |||||||
|
| |||||||
Total Investments — 100.0% | $ | 55,957 | ||||||
|
| |||||||
Percentages are based on Net Assets of $55,934 ($ Thousands).
| * | The Fund’s investment in the SEI Institutional Managed Trust Tax-Managed Large Cap Fund, Class Y represents greater than 50% of the Fund’s total investments. The SEI Institutional Managed Trust Tax-Managed Large Cap Fund seeks to provide high long-term after-tax returns. For further financial information, available upon request at no charge, on the SEI Institutional Managed Trust Tax-Managed Large Cap Fund please go to the Securities Exchange Commission’s website at http://www.sec.gov or call 1-800-DIAL-SEI. |
As of September 30, 2015, all of the Fund’s investments in securities were considered Level 1, in accordance with the authoritative guidance on fair value measurement and disclosure under U.S. GAAP.
As of September 30, 2015, there were no transfers between Level 1 and Level 2 assets and liabilities. As of September 30, 2015, there were no Level 3 securities.
For more information on valuation inputs, see Note 2 — Significant Accounting Policies in Notes to Financial Statements.
Amounts designated as “—” are $0 or have been rounded to $0.
The following is summary of the transactions with affiliates for the period ended September 30, 2015 ($ Thousands):
| Security Description | Purchases at Cost | Proceeds from Sales | Realized Gain | Change in Unrealized Depreciation | Value 9/30/2015 | Dividend Income | ||||||||||||||||||||||||
SEI Institutional International Trust Emerging Markets Equity Fund, Class Y | $ | 228 | $ | (163 | ) | $ | 71 | $ | (281 | ) | $ | 1,140 | $ | — | ||||||||||||||||
SEI Institutional International Trust International Equity Fund, Class Y | 761 | (1,083 | ) | 409 | (1,137 | ) | 9,066 | — | ||||||||||||||||||||||
SEI Institutional Managed Trust Large Cap Fund, Class Y | 1,457 | (3,037 | ) | 1,817 | (4,641 | ) | 31,287 | 177 | ||||||||||||||||||||||
SEI Institutional Managed Trust Tax-Managed Small/Mid Cap Fund, Class Y | 443 | (872 | ) | 562 | (1,349 | ) | 7,741 | 7 | ||||||||||||||||||||||
SEI Institutional International Trust Emerging Markets Debt Fund, Class Y | 311 | (409 | ) | 33 | (258 | ) | 2,246 | 14 | ||||||||||||||||||||||
SEI Institutional Managed Trust High Yield Bond Fund, Class Y | 558 | (896 | ) | 328 | (673 | ) | 4,477 | 151 | ||||||||||||||||||||||
|
|
|
|
|
|
|
|
|
|
|
| |||||||||||||||||||
Totals | $ | 3,758 | $ | (6,460 | ) | $ | 3,220 | $ | (8,339 | ) | $ | 55,957 | $ | 349 | ||||||||||||||||
|
|
|
|
|
|
|
|
|
|
|
| |||||||||||||||||||
The accompanying notes are an integral part of the financial statements.
| SEI Asset Allocation Trust / Semi-Annual Report / September 30, 2015 | 11 |
SCHEDULE OF INVESTMENTS (Unaudited)
Core Market Strategy Fund
September 30, 2015
| Description | Shares | Market Value ($ Thousands) | ||||||
AFFILIATED INVESTMENT FUNDS — 100.0% |
| |||||||
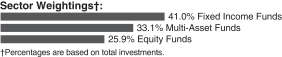
FIXED INCOME FUNDS — 41.0% |
| |||||||
SEI Institutional International Trust Emerging Markets Debt Fund, Class Y | 850,683 | $ | 7,435 | |||||
SEI Institutional Managed Trust Dynamic Asset Allocation Fund, Class Y | 588,156 | 5,346 | ||||||
SEI Institutional Managed Trust | 1,360,517 | 9,551 | ||||||
SEI Institutional Managed Trust | 2,074,082 | 21,529 | ||||||
|
| |||||||
Total Fixed Income Funds | 43,861 | |||||||
|
| |||||||
MULTI-ASSET FUNDS — 33.1% |
| |||||||
SEI Institutional Managed Trust Multi-Asset Accumulation Fund, Class Y | 2,248,889 | 21,477 | ||||||
SEI Institutional Managed Trust Multi-Asset Income Fund, Class Y | 306,751 | 3,209 | ||||||
SEI Institutional Managed Trust Multi-Asset Inflation Managed Fund, Class Y* | 1,220,126 | 10,700 | ||||||
|
| |||||||
Total Multi-Asset Funds | 35,386 | |||||||
|
| |||||||
| Description | Shares | Market Value ($ Thousands) | ||||||
EQUITY FUNDS — 25.9% |
| |||||||
SEI Institutional International Trust Emerging Markets Equity Fund, Class Y | 380,613 | $ | 3,216 | |||||
SEI Institutional International Trust International Equity Fund, Class Y | 936,157 | 8,594 | ||||||
SEI Institutional Managed Trust Large Cap Fund, Class Y | 932,009 | 12,778 | ||||||
SEI Institutional Managed Trust Small Cap Fund, Class Y | 262,139 | 3,148 | ||||||
|
| |||||||
Total Equity Funds | 27,736 | |||||||
|
| |||||||
Total Investments — 100.0% | $ | 106,983 | ||||||
|
| |||||||
Percentages are based on Net Assets of $106,942 ($ Thousands).
| * | Non-Income Producing Fund. |
As of September 30, 2015, all of the Fund’s investments were considered Level 1, in accordance with the authoritative guidance on fair value measurements and disclosure under U.S. GAAP.
As of September 30, 2015, there were no transfers between Level 1 and Level 2 assets and liabilities. As of September 30, 2015, there were no Level 3 securities.
For more information on valuation inputs, see Note 2 — Significant Accounting Policies in
Notes to Financial Statements
Amounts designated as “—” are $0 or have been rounded to $0.
The following is summary of the transactions with affiliates for the period ended September 30, 2015 ($ Thousands):
| Security Description | Purchases at Cost | Proceeds from Sales | Realized Gain (Loss) | Change in Unrealized Depreciation | Value 9/30/2015 | Dividend Income | ||||||||||||||||||||||||
SEI Institutional International Trust Emerging Markets Debt Fund, Class Y | $ | 485 | $ | (566 | ) | $ | (8 | ) | $ | (689 | ) | $ | 7,435 | $ | 43 | |||||||||||||||
SEI Institutional Managed Trust Dynamic Asset Allocation Fund, Class Y | 5,921 | (72 | ) | 1 | (504 | ) | 5,346 | — | ||||||||||||||||||||||
SEI Institutional Managed Trust High Yield Bond Fund, Class Y | 649 | (1,004 | ) | 328 | (1,021 | ) | 9,551 | 302 | ||||||||||||||||||||||
SEI Institutional Managed Trust U.S. Fixed Income Fund, Class Y | 1,137 | (2,755 | ) | 105 | (501 | ) | 21,529 | 263 | ||||||||||||||||||||||
SEI Institutional Managed Trust Multi-Asset Accumulation Fund, Class Y | 983 | (732 | ) | 33 | (2,279 | ) | 21,477 | — | ||||||||||||||||||||||
SEI Institutional Managed Trust Multi-Asset Income Fund, Class Y | 150 | (366 | ) | 1 | (95 | ) | 3,209 | 77 | ||||||||||||||||||||||
SEI Institutional Managed Trust Multi-Asset Inflation Managed Fund, Class Y | 286 | (985 | ) | (25 | ) | (290 | ) | 10,700 | — | |||||||||||||||||||||
SEI Institutional International Trust Emerging Markets Equity Fund, Class Y | 548 | (319 | ) | 56 | (596 | ) | 3,216 | — | ||||||||||||||||||||||
SEI Institutional International Trust International Equity Fund, Class Y | 598 | (698 | ) | 258 | (879 | ) | 8,594 | — | ||||||||||||||||||||||
SEI Institutional Managed Trust Large Cap Fund, Class Y | 912 | (7,016 | ) | 2,420 | (3,372 | ) | 12,778 | 99 | ||||||||||||||||||||||
SEI Institutional Managed Trust Small Cap Fund, Class Y | 231 | (245 | ) | 72 | (434 | ) | 3,148 | — | ||||||||||||||||||||||
|
|
|
|
|
|
|
|
|
|
|
| |||||||||||||||||||
Totals | $ | 11,900 | $ | (14,758 | ) | $ | 3,241 | $ | (10,660 | ) | $ | 106,983 | $ | 784 | ||||||||||||||||
|
|
|
|
|
|
|
|
|
|
|
| |||||||||||||||||||
The accompanying notes are an integral part of the financial statements.
| 12 | SEI Asset Allocation Trust / Semi-Annual Report / September 30, 2015 |
SCHEDULE OF INVESTMENTS (Unaudited)
Core Market Strategy Allocation Fund
September 30, 2015
| Description | Shares | Market Value ($ Thousands) | ||||||
AFFILIATED INVESTMENT FUNDS — 100.0% |
| |||||||
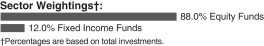
EQUITY FUNDS — 88.2% |
| |||||||
SEI Institutional International Trust | 56,942 | $ | 481 | |||||
SEI Institutional International Trust | 417,541 | 3,833 | ||||||
SEI Institutional Managed Trust | 700,704 | 13,404 | ||||||
SEI Institutional Managed Trust | 189,726 | 3,330 | ||||||
|
| |||||||
Total Equity Funds | 21,048 | |||||||
|
| |||||||
| Description | Shares | Market Value ($ Thousands) | ||||||
FIXED INCOME FUNDS — 11.8% |
| |||||||
SEI Institutional International Trust | 108,055 | $ | 945 | |||||
SEI Institutional Managed Trust | 268,828 | 1,887 | ||||||
|
| |||||||
Total Fixed Income Funds | 2,832 | |||||||
|
| |||||||
Total Investments — 100.0% | $ | 23,880 | ||||||
|
| |||||||
Percentages are based on Net Assets of $23,872 ($ Thousands).
| * | The Fund’s investment in the SEI Institutional Managed Trust Tax-Managed Large Cap Fund, Class Y represents greater than 50% of the Fund’s total investments. The SEI Institutional Managed Trust Tax-Managed Large Cap Fund seeks to provide high long-term after-tax returns. For further financial information, available upon request at no charge, on the SEI Institutional Managed Trust Tax-Managed Large Cap Fund please go to the Securities Exchange Commission’s website at http://www.sec.gov or call 1-800-DIAL-SEI. |
As of September 30, 2015, all of the Fund’s investments in securities were considered Level 1, in accordance with the authoritative guidance on fair value measurements and disclosure under U.S. GAAP.
As of September 30, 2015, there were no transfers between Level 1 and Level 2 assets and liabilities. As of September 30, 2015, there were no Level 3 securities.
For more information on valuation inputs, see Note 2 — Significant Accounting Policies in Notes to Financial Statements.
Amounts designated as “—” are $0 or have been rounded to $0.
The following is summary of the transactions with affiliates for the period ended September 30, 2015 ($ Thousands):
| Security Description | Purchases at Cost | Proceeds from Sales | Realized Gain | Change in Unrealized Depreciation | Value 9/30/2015 | Dividend Income | ||||||||||||||||||||||||
| SEI Institutional International Trust Emerging Markets Equity Fund, Class Y | $ | 111 | $ | (87 | ) | $ | 33 | $ | (121 | ) | $ | 481 | $ | — | ||||||||||||||||
| SEI Institutional International Trust International Equity Fund, Class Y | 470 | (643 | ) | 220 | (527 | ) | 3,833 | — | ||||||||||||||||||||||
| SEI Institutional Managed Trust Tax-Managed Large Cap Fund, Class Y | 1,526 | (1,910 | ) | 1,128 | (2,336 | ) | 13,404 | 74 | ||||||||||||||||||||||
| SEI Institutional Managed Trust Tax-Managed Small/Mid Cap Fund, Class Y | 359 | (476 | ) | 295 | (634 | ) | 3,330 | 3 | ||||||||||||||||||||||
| SEI Institutional International Trust Emerging Markets Debt Fund, Class Y | 195 | (249 | ) | 4 | (100 | ) | 945 | 6 | ||||||||||||||||||||||
| SEI Institutional Managed Trust High Yield Bond Fund, Class Y | 402 | (538 | ) | 156 | (304 | ) | 1,887 | 64 | ||||||||||||||||||||||
|
|
|
|
|
|
|
|
|
|
|
| |||||||||||||||||||
| Totals | $ | 3,063 | $ | (3,903 | ) | $ | 1,836 | $ | (4,022 | ) | $ | 23,880 | $ | 147 | ||||||||||||||||
|
|
|
|
|
|
|
|
|
|
|
| |||||||||||||||||||
The accompanying notes are an integral part of the financial statements.
| SEI Asset Allocation Trust / Semi-Annual Report / September 30, 2015 | 13 |
SCHEDULE OF INVESTMENTS (Unaudited)
Market Growth Strategy Fund
September 30, 2015
| Description | Shares | Market Value ($ Thousands) | ||||||
AFFILIATED INVESTMENT FUNDS — 100.0% |
| |||||||
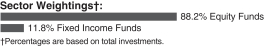
EQUITY FUNDS — 37.4% |
| |||||||
SEI Institutional International Trust | 1,978,960 | $ | 16,722 | |||||
SEI Institutional International Trust | 3,944,080 | 36,207 | ||||||
SEI Institutional Managed Trust | 4,333,225 | 59,409 | ||||||
SEI Institutional Managed Trust | 1,082,937 | 13,006 | ||||||
|
| |||||||
Total Equity Funds | 125,344 | |||||||
|
| |||||||
MULTI-ASSET FUNDS — 32.5% |
| |||||||
SEI Institutional Managed Trust | 7,117,843 | 67,976 | ||||||
SEI Institutional Managed Trust | 646,580 | 6,763 | ||||||
SEI Institutional Managed Trust | 3,875,529 | 33,988 | ||||||
|
| |||||||
Total Multi-Asset Funds | 108,727 | |||||||
|
| |||||||
| Description | Shares | Market Value ($ Thousands) | ||||||
FIXED INCOME FUNDS — 30.1% |
| |||||||
SEI Institutional International Trust | 2,674,060 | $ | 23,371 | |||||
SEI Institutional Managed Trust | 2,202,055 | 20,017 | ||||||
SEI Institutional Managed Trust | 3,781,751 | 26,548 | ||||||
SEI Institutional Managed Trust | 2,956,892 | 30,692 | ||||||
|
| |||||||
Total Fixed Income Funds | 100,628 | |||||||
|
| |||||||
Total Investments — 100.0% | $ | 334,699 | ||||||
|
| |||||||
Percentages are based on Net Assets of $334,559 ($ Thousands).
| * | Non-Income Producing Fund. |
As of September 30, 2015, all of the Fund’s investments were considered Level 1, in accordance with the authoritative guidance on fair value measurements and disclosure under U.S. GAAP.
As of September 30, 2015, there were no transfers between Level 1 and Level 2 assets and liabilities. As of September 30, 2015, there were no Level 3 securities.
For more information on valuation inputs, see Note 2 — Significant Accounting Policies in Notes to Financial Statements
Amounts designated as “—” are $0 or have been rounded to $0.
The following is summary of the transactions with affiliates for the period ended September 30, 2015 ($ Thousands):
| Security Description | Purchases at Cost | Proceeds from Sales | Realized Gain (Loss) | Change in Unrealized Depreciation | Value 9/30/2015 | Dividend Income | ||||||||||||||||||||||||
| SEI Institutional International Trust Emerging Markets Equity Fund, Class Y | $ | 2,862 | $ | (2,231 | ) | $ | 935 | $ | (3,857 | ) | $ | 16,722 | $ | 140 | ||||||||||||||||
| SEI Institutional International Trust International Equity Fund, Class Y | 1,299 | (3,845 | ) | 1,471 | (4,199 | ) | 36,207 | — | ||||||||||||||||||||||
| SEI Institutional Managed Trust Large Cap Fund, Class Y | 3,333 | (30,014 | ) | 10,468 | (15,168 | ) | 59,409 | 461 | ||||||||||||||||||||||
| SEI Institutional Managed Trust Small Cap Fund, Class Y | 835 | (1,474 | ) | 424 | (1,985 | ) | 13,006 | — | ||||||||||||||||||||||
| SEI Institutional Managed Trust Multi-Asset Accumulation Fund, Class Y | 2,238 | (2,968 | ) | 82 | (7,372 | ) | 67,976 | — | ||||||||||||||||||||||
| SEI Institutional Managed Trust Multi-Asset Income Fund, Class Y | 289 | (926 | ) | 1 | (204 | ) | 6,763 | 160 | ||||||||||||||||||||||
| SEI Institutional Managed Trust Multi-Asset Inflation Managed Fund, Class Y | 660 | (3,630 | ) | (132 | ) | (899 | ) | 33,988 | — | |||||||||||||||||||||
| SEI Institutional International Trust Emerging Markets Debt Fund, Class Y | 957 | (1,951 | ) | (22 | ) | (2,229 | ) | 23,371 | — | |||||||||||||||||||||
| SEI Institutional Managed Trust Dynamic Asset Allocation Fund, Class Y | 22,639 | (663 | ) | 25 | (1,984 | ) | 20,017 | — | ||||||||||||||||||||||
| SEI Institutional Managed Trust High Yield Bond Fund, Class Y | 1,377 | (3,311 | ) | 1,079 | (3,055 | ) | 26,548 | 875 | ||||||||||||||||||||||
| SEI Institutional Managed Trust U.S. Fixed Income Fund, Class Y | 1,555 | (4,544 | ) | 173 | (753 | ) | 30,692 | 382 | ||||||||||||||||||||||
|
|
|
|
|
|
|
|
|
|
|
| |||||||||||||||||||
| Totals | $ | 38,044 | $ | (55,557 | ) | $ | 14,504 | $ | (41,705 | ) | $ | 334,699 | $ | 2,018 | ||||||||||||||||
|
|
|
|
|
|
|
|
|
|
|
| |||||||||||||||||||
The accompanying notes are an integral part of the financial statements.
| 14 | SEI Asset Allocation Trust / Semi-Annual Report / September 30, 2015 |
SCHEDULE OF INVESTMENTS (Unaudited)
Market Growth Strategy Allocation Fund
September 30, 2015
| Description | Shares | Market Value ($ Thousands) | ||||||
AFFILIATED INVESTMENT FUNDS — 100.0% |
| |||||||
EQUITY FUNDS — 88.0% |
| |||||||
SEI Institutional International Trust | 285,356 | $ | 2,411 | |||||
SEI Institutional International Trust | 2,090,063 | 19,187 | ||||||
SEI Institutional Managed Trust | 3,493,497 | 66,830 | ||||||
SEI Institutional Managed Trust | 946,255 | 16,607 | ||||||
|
| |||||||
Total Equity Funds | 105,035 | |||||||
|
| |||||||
| Description | Shares | Market Value ($ Thousands) | ||||||
FIXED INCOME FUNDS — 12.0% |
| |||||||
SEI Institutional International Trust | 548,798 | $ | 4,797 | |||||
SEI Institutional Managed Trust | 1,367,388 | 9,599 | ||||||
|
| |||||||
Total Fixed Income Funds | 14,396 | |||||||
|
| |||||||
Total Investments — 100.0% | $ | 119,431 | ||||||
|
| |||||||
Percentages are based on Net Assets of $119,383 ($ Thousands).
| * | The Fund’s investment in the SEI Institutional Managed Trust Tax-Managed Large Cap Fund, Class Y represents greater than 50% of the Fund’s total investments. The SEI Institutional Managed Trust Tax-Managed Large Cap Fund seeks to provide high long-term after-tax returns. For further financial information, available upon request at no charge, on the SEI Institutional Managed Trust Tax-Managed Large Cap Fund please go to the Securities Exchange Commission’s website at http://www.sec.gov or call 1-800-DIAL-SEI. |
As of September 30, 2015, all of the Fund’s investments in securities were considered Level 1, in accordance with the authoritative guidance on fair value measurements and disclosure under U.S. GAAP.
As of September 30, 2015, there were no transfers between Level 1 and Level 2 assets and liabilities. As of September 30, 2015, there were no Level 3 securities.
For more information on valuation inputs, see Note 2 — Significant Accounting Policies in Notes to Financial Statements.
Amounts designated as “—” are $0 or have been rounded to $0.
The following is summary of the transactions with affiliates for the period ended September 30, 2015 ($ Thousands):
| Security Description | Purchases at Cost | Proceeds from Sales | Realized Gain (Loss) | Change in Unrealized Depreciation | Value 9/30/2015 | Dividend Income | ||||||||||||||||||||||||
| SEI Institutional International Trust Emerging Markets Equity Fund, Class Y | $ | 492 | $ | (361 | ) | $ | 163 | $ | (601 | ) | $ | 2,411 | $ | — | ||||||||||||||||
| SEI Institutional International Trust International Equity Fund, Class Y | 1,508 | (2,365 | ) | 918 | (2,407 | ) | 19,187 | — | ||||||||||||||||||||||
| SEI Institutional Managed Trust Tax-Managed Large Cap Fund, Class Y | 3,731 | (6,537 | ) | 3,954 | (9,813 | ) | 66,830 | 370 | ||||||||||||||||||||||
| SEI Institutional Managed Trust Tax-Managed Small/Mid Cap Fund, Class Y | 836 | (1,562 | ) | 1,003 | (2,634 | ) | 16,607 | 14 | ||||||||||||||||||||||
| SEI Institutional International Trust Emerging Markets Debt Fund, Class Y | 679 | (861 | ) | (13 | ) | (455 | ) | 4,797 | 30 | |||||||||||||||||||||
| SEI Institutional Managed Trust High Yield Bond Fund, Class Y | 1,220 | (1,794 | ) | (17 | ) | (705 | ) | 9,599 | 316 | |||||||||||||||||||||
|
|
|
|
|
|
|
|
|
|
|
| |||||||||||||||||||
| Totals | $ | 8,466 | $ | (13,480 | ) | $ | 6,008 | $ | (16,615 | ) | $ | 119,431 | $ | 730 | ||||||||||||||||
|
|
|
|
|
|
|
|
|
|
|
| |||||||||||||||||||
The accompanying notes are an integral part of the financial statements.
| SEI Asset Allocation Trust / Semi-Annual Report / September 30, 2015 | 15 |
Statements of Assets and Liabilities ($ Thousands)
September 30, 2015 (Unaudited)
Defensive Strategy Fund | Defensive Allocation Fund | Conservative Strategy Fund | Conservative Allocation Fund | |||||||||||||
ASSETS: | ||||||||||||||||
Investments in affiliated funds, at market value† | $ | 35,394 | $ | 8,121 | $ | 106,528 | $ | 40,757 | ||||||||
Receivable for fund shares sold | 120 | 10 | 496 | 5 | ||||||||||||
Income distribution receivable from affiliated funds | 23 | 18 | 88 | 76 | ||||||||||||
Receivable for investment securities sold | 4 | 1 | 12 | 105 | ||||||||||||
Receivable from administrator | 2 | 1 | 6 | 2 | ||||||||||||
Unrealized gain on forward foreign currency contracts | 1 | — | 3 | — | ||||||||||||
Prepaid expenses | 17 | 1 | 22 | 5 | ||||||||||||
Total Assets | 35,561 | 8,152 | 107,155 | 40,950 | ||||||||||||
LIABILITIES: | ||||||||||||||||
Payable for fund shares redeemed | 100 | 7 | 99 | 105 | ||||||||||||
Payable for investment securities purchased | 43 | 21 | 484 | 75 | ||||||||||||
Investment advisory fees payable | 3 | 1 | 9 | 3 | ||||||||||||
Administrative servicing fees payable | 1 | — | 1 | — | ||||||||||||
Distribution fees payable | — | — | 4 | — | ||||||||||||
Shareholder servicing fees payable | — | — | 14 | 9 | ||||||||||||
Trustees’ fees payable | — | — | — | — | ||||||||||||
Chief Compliance Officers fees payable | — | — | — | — | ||||||||||||
Accrued expenses | 14 | 4 | 32 | 12 | ||||||||||||
Total Liabilities | 161 | 33 | 643 | 204 | ||||||||||||
Net Assets | $ | 35,400 | $ | 8,119 | $ | 106,512 | $ | 40,746 | ||||||||
† Cost of investments in affiliated funds | $ | 35,240 | $ | 7,442 | $ | 104,174 | $ | 35,057 | ||||||||
NET ASSETS: | ||||||||||||||||
Paid in Capital (unlimited authorization — no par value) | $ | 39,456 | $ | 8,066 | $ | 122,163 | $ | 34,880 | ||||||||
Undistributed net investment income | 47 | 41 | 472 | 164 | ||||||||||||
Accumulated net realized gain (loss) on investments | (4,258 | ) | (667 | ) | (18,480 | ) | 2 | |||||||||
Net unrealized appreciation (depreciation) on investments | 154 | 679 | 2,354 | 5,700 | ||||||||||||
Net unrealized appreciation on forward foreign currency contracts | 1 | — | 3 | — | ||||||||||||
Net Assets | $ | 35,400 | $ | 8,119 | $ | 106,512 | $ | 40,746 | ||||||||
Net Asset Value, Offering and Redemption Price Per Share — Class A | $9.72 | $ | 13.94 | $10.26 | $13.81 | |||||||||||
| | ($31,714,313 ÷ 3,261,850 shares | ) | | ($8,118,914 ÷ 582,437 shares | ) | | ($97,257,339 ÷ 9,482,122 shares | ) | | ($40,746,089 ÷ 2,949,786 shares | ) | |||||
Net Asset Value, Offering and Redemption Price Per Share — Class D | N/A | N/A | $10.24 | N/A | ||||||||||||
| | ($4,838,863 ÷ 472,337 shares | ) | ||||||||||||||
Net Asset Value, Offering and Redemption Price Per Share — Class I | $9.56 | N/A | $10.42 | N/A | ||||||||||||
| | ($3,685,581 ÷ 385,437 shares | ) | | ($4,415,962 ÷ 423,889 shares | ) | |||||||||||
Amounts designated as “—” are $0 or have been rounded to $0.
N/A — Not applicable. Class D and/or Class I shares currently not offered.
The accompanying notes are an integral part of the financial statements.
| 16 | SEI Asset Allocation Trust / Semi-Annual Report / September 30, 2015 |
| Moderate Strategy Fund | Moderate Strategy Allocation Fund | Aggressive Strategy Fund | Tax-Managed Aggressive Strategy Fund | Core Market Strategy Fund | Core Market Strategy Allocation Fund | Market Growth Strategy Fund | Market Growth Strategy Allocation Fund | |||||||||||||||||||||||
| | $252,014 | | $87,794 | $271,166 | $55,957 | $106,983 | $23,880 | $334,699 | $119,431 | |||||||||||||||||||||
| 12 | 2 | 79 | 10 | — | — | 55 | 72 | |||||||||||||||||||||||
| 209 | 90 | 122 | 26 | 104 | 11 | 230 | 55 | |||||||||||||||||||||||
| 372 | 273 | 279 | 14 | 60 | 10 | 171 | 35 | |||||||||||||||||||||||
| 13 | 5 | 14 | 3 | 5 | 1 | 17 | 6 | |||||||||||||||||||||||
| 16 | — | — | — | — | — | — | — | |||||||||||||||||||||||
| 20 | 20 | 23 | 3 | 7 | 3 | 26 | 8 | |||||||||||||||||||||||
| 252,656 | 88,184 | 271,683 | 56,013 | 107,159 | 23,905 | 335,198 | 119,607 | |||||||||||||||||||||||
| 353 | 264 | 325 | 16 | 47 | 7 | 187 | 93 | |||||||||||||||||||||||
| 207 | 88 | 120 | 26 | 103 | 11 | 226 | 54 | |||||||||||||||||||||||
| 21 | 7 | 23 | 5 | 9 | 2 | 28 | 10 | |||||||||||||||||||||||
| 1 | — | 6 | — | — | — | 3 | — | |||||||||||||||||||||||
| 3 | — | 14 | — | — | — | 8 | — | |||||||||||||||||||||||
| 44 | — | 57 | 12 | 22 | — | 70 | 25 | |||||||||||||||||||||||
| 2 | �� | — | 2 | — | 1 | — | 3 | 1 | ||||||||||||||||||||||
| 1 | — | 2 | — | — | — | 1 | — | |||||||||||||||||||||||
| 80 | 43 | 91 | 20 | 35 | 13 | 113 | 41 | |||||||||||||||||||||||
| 712 | 402 | 640 | 79 | 217 | 33 | 639 | 224 | |||||||||||||||||||||||
| $251,944 | $87,782 | $271,043 | $55,934 | $106,942 | $23,872 | $334,559 | $119,383 | |||||||||||||||||||||||
| $246,902 | $71,463 | $261,526 | $38,209 | $109,772 | $17,745 | $333,742 | $83,657 | |||||||||||||||||||||||
| $302,510 | $75,954 | $375,421 | $51,916 | $111,375 | $19,772 | $463,508 | $109,663 | |||||||||||||||||||||||
| 1,760 | 161 | 2,331 | 20 | 1,102 | 10 | 2,891 | 41 | |||||||||||||||||||||||
| (57,454) | (4,664 | ) | (116,349 | ) | (13,750 | ) | (2,746 | ) | (2,045 | ) | (132,797 | ) | (26,095 | ) | ||||||||||||||||
| 5,112 | 16,331 | 9,640 | 17,748 | (2,789 | ) | 6,135 | 957 | 35,774 | ||||||||||||||||||||||
| 16 |
| — | — | — | — | — | — | — | |||||||||||||||||||||
| $251,944 | $87,782 | $271,043 | $55,934 | $106,942 | $23,872 | $334,559 | $119,383 | |||||||||||||||||||||||
| $11.27 |
| $18.46 | $12.22 | $16.65 | $10.89 | $15.10 | $11.31 | $18.19 | |||||||||||||||||||||
| | ($242,117,767 ÷ 21,491,431 shares | ) | | ($87,781,528 ÷ 4,755,343 shares | ) | | ($231,146,657 ÷ 18,922,437 shares | ) | | ($55,933,961 ÷ 3,359,672 shares | ) | | ($106,399,633 ÷ 9,766,330 shares | ) | | ($23,872,387 ÷ 1,580,813 shares | ) | | ($318,740,355 ÷ 28,194,587 shares | ) | | ($119,383,128 ÷ 6,563,953 shares | ) | |||||||
| $11.24 |
| N/A | $12.15 | N/A | N/A | N/A | $11.26 | N/A | |||||||||||||||||||||
| | ($3,125,045 ÷ 278,131 shares | ) | | ($13,592,909 ÷ 1,119,068 shares | ) | | ($5,874,443 ÷ 521,661 shares | ) | ||||||||||||||||||||||
| $11.54 |
| N/A | $11.91 | N/A | $11.37 | N/A | $11.14 | N/A | |||||||||||||||||||||
| | ($6,700,769 ÷ 580,438 shares | ) | | ($26,303,376 ÷ 2,208,690 shares | ) | | ($541,946 ÷ 47,672 shares | ) | | ($9,944,200 ÷ 892,517 shares | ) | |||||||||||||||||||
| SEI Asset Allocation Trust / Semi-Annual Report / September 30, 2015 | 17 |
Statements of Operations ($ Thousands)
For the six months ended September 30, 2015 (Unaudited)
| Defensive Strategy Fund | Defensive Strategy Allocation Fund | Conservative Strategy Fund | Conservative Strategy Allocation Fund | |||||||||||||
Investment Income: | ||||||||||||||||
Income Distributions from Affiliated Funds | $ | 170 | $ | 147 | $ | 748 | $ | 654 | ||||||||
Expenses | ||||||||||||||||
Administration Fees | 38 | 9 | 113 | 43 | ||||||||||||
Investment Advisory Fees | 19 | 4 | 56 | 22 | ||||||||||||
Shareholder Servicing Fees — Class A | 42 | 11 | 128 | 54 | ||||||||||||
Shareholder Servicing Fees — Class D | — | — | 6 | — | ||||||||||||
Shareholder Servicing Fees — Class I | 5 | — | 6 | — | ||||||||||||
Administrative Servicing Fees — Class I | 5 | — | 6 | — | ||||||||||||
Distribution Fees — Class D | — | — | 19 | — | ||||||||||||
Registration Fees | 4 | 1 | 13 | 4 | ||||||||||||
Professional Fees | 3 | 1 | 7 | 3 | ||||||||||||
Printing Fees | 3 | 1 | 11 | 5 | ||||||||||||
Custodian/Wire Agent Fees | 1 | — | 2 | 1 | ||||||||||||
Chief Compliance Officer Fees | — | — | — | — | ||||||||||||
Trustees’ Fees | — | — | 1 | — | ||||||||||||
Other Expenses | 1 | — | 2 | 1 | ||||||||||||
Total Expenses | 121 | 27 | 370 | 133 | ||||||||||||
Less: | ||||||||||||||||
Administration Fees Waived | (38 | ) | (9 | ) | (113 | ) | (43 | ) | ||||||||
Reimbursement from Administrator | (12 | ) | (2 | ) | (35 | ) | (14 | ) | ||||||||
Waiver of Shareholder Servicing Fees — Class A | (24 | ) | — | (46 | ) | — | ||||||||||
Waiver of Shareholder Servicing Fees — Class D | — | — | (2 | ) | — | |||||||||||
Waiver of Shareholder Servicing Fees — Class I | (3 | ) | — | (2 | ) | — | ||||||||||
Net Expenses | 44 | 16 | 172 | 76 | ||||||||||||
Net Investment Income | 126 | 131 | 576 | 578 | ||||||||||||
Net Realized and Unrealized Gain (Loss) from Affiliated Funds: | ||||||||||||||||
Net Realized Gain from Sales of Affiliated Funds | 290 | 541 | 1,300 | 2,241 | ||||||||||||
Net Realized Gain on Foreign Currency Transactions | 3 | — | 9 | — | ||||||||||||
Capital Gain Distributions Received from Affiliated Funds | — | 31 | — | 173 | ||||||||||||
Net Change in Unrealized Depreciation from Affiliated Funds | (658 | ) | (1,124 | ) | (3,485 | ) | (5,147 | ) | ||||||||
Net Change in Unrealized Appreciation (Depreciation) on Foreign Currency Translation | 1 | — | 3 | — | ||||||||||||
Net Realized and Unrealized Loss from Affiliated Funds | (364 | ) | (552 | ) | (2,173 | ) | (2,733 | ) | ||||||||
Net Decrease in Net Assets Resulting from Operations | $ | (238 | ) | $ | (421 | ) | $ | (1,597 | ) | $ | (2,155 | ) | ||||
Amounts designated as “—” are $0 or have been rounded to $0.
The accompanying notes are an integral part of the financial statements.
| 18 | SEI Asset Allocation Trust / Semi-Annual Report / September 30, 2015 |
| Moderate Strategy Fund | Moderate Strategy Allocation Fund | Aggressive Strategy Fund | Tax-Managed Aggressive Strategy Fund | Core Market Strategy Fund | Core Market Strategy Allocation Fund | Market Growth Strategy Fund | Market Growth Strategy Allocation Fund | |||||||||||||||||||||||
| $ | 1,782 | $ | 1,000 | $ | 1,395 | $ | 349 | $ | 784 | $ | 147 | $ | 2,018 | $ | 730 | |||||||||||||||
| 267 | 94 | 301 | 64 | 114 | 27 | 368 | 133 | |||||||||||||||||||||||
| 133 | 47 | 150 | 32 | 57 | 13 | 184 | 66 | |||||||||||||||||||||||
| 320 | 117 | 320 | 79 | 141 | 34 | 438 | 166 | |||||||||||||||||||||||
| 4 | — | 18 | — | — | — | 8 | — | |||||||||||||||||||||||
| 9 | — | 38 | — | 1 | — | 14 | — | |||||||||||||||||||||||
| 9 | — | 38 | — | 1 | — | 14 | — | |||||||||||||||||||||||
| 11 | — | 54 | — | — | — | 23 | — | |||||||||||||||||||||||
| 27 | 9 | 31 | 6 | 11 | 3 | 37 | 13 | |||||||||||||||||||||||
| 18 | 7 | 20 | 4 | 8 | 2 | 24 | 9 | |||||||||||||||||||||||
| 27 | 10 | 29 | 7 | 11 | 2 | 37 | 14 | |||||||||||||||||||||||
| 6 | 2 | 6 | 1 | 2 | 1 | 8 | 3 | |||||||||||||||||||||||
| 1 | — | 1 | — | — | — | 1 | 1 | |||||||||||||||||||||||
| 2 | 1 | 3 | 1 | 1 | — | 3 | 1 | |||||||||||||||||||||||
| 4 | 2 | 5 | 1 | 2 | — | 6 | 2 | |||||||||||||||||||||||
| 838 | 289 | 1,014 | 195 | 349 | 82 | 1,165 | 408 | |||||||||||||||||||||||
| (267 | ) | (94 | ) | (301 | ) | (64 | ) | (114 | ) | (27 | ) | (368 | ) | (133 | ) | |||||||||||||||
| (82 | ) | (30 | ) | (92 | ) | (19 | ) | (35 | ) | (8 | ) | (113 | ) | (41 | ) | |||||||||||||||
| (51 | ) | — | — | — | — | — | — | — | ||||||||||||||||||||||
| (1 | ) | — | — | — | — | — | — | — | ||||||||||||||||||||||
| (1 | ) | — | — | — | — | — | — | — | ||||||||||||||||||||||
| 436 | 165 | 621 | 112 | 200 | 47 | 684 | 234 | |||||||||||||||||||||||
| 1,346 | 835 | 774 | 237 | 584 | 100 | 1,334 | 496 | |||||||||||||||||||||||
| 2,367 | 2,038 | 14,819 | 3,220 | 3,241 | 1,836 | 14,504 | 6,008 | |||||||||||||||||||||||
| 71 | — | 106 | — | 34 | — | 131 | — | |||||||||||||||||||||||
| — | 151 | — | — | — | — | — | — | |||||||||||||||||||||||
| (12,127 | ) | (8,222 | ) | (41,146 | ) | (8,339 | ) | (10,660 | ) | (4,022 | ) | (41,705 | ) | (16,615 | ) | |||||||||||||||
| (24 | ) | — | (135 | ) | — | (43 | ) | — | (168 | ) | — | ||||||||||||||||||
| (9,713 | ) | (6,033 | ) | (26,356 | ) | (5,119 | ) | (7,428 | ) | (2,186 | ) | (27,238 | ) | (10,607 | ) | |||||||||||||||
| $ | (8,367 | ) | $ | (5,198 | ) | $ | (25,582 | ) | $ | (4,882 | ) | $ | (6,844 | ) | $ | (2,086 | ) | $ | (25,904 | ) | $ | (10,111 | ) | |||||||
| SEI Asset Allocation Trust / Semi-Annual Report / September 30, 2015 | 19 |
Statements of Changes in Net Assets ($ Thousands)
For the six months ended September 30, 2015 (Unaudited) and the year ended March 31, 2015.
| Defensive Strategy Fund | Defensive Strategy Allocation Fund | |||||||||||||||
| 4/01/15 – 9/30/15 | 4/01/14 – 3/31/15 | 4/01/15 – 9/30/15 | 4/01/14 – 3/31/15 | |||||||||||||
Operations: | ||||||||||||||||
Net Investment Income | $ | 126 | $ | 347 | $ | 131 | $ | 260 | ||||||||
Net Realized Gain from sale of Affiliated Funds | 290 | 662 | 541 | 1,133 | ||||||||||||
Net Realized Gain on Foreign Currency Transactions | 3 | 50 | — | — | ||||||||||||
Capital Gain Distributions Received from Affiliated Funds | — | 372 | 31 | 433 | ||||||||||||
Net Change in Unrealized Depreciation from Affiliated Funds | (658 | ) | (558 | ) | (1,124 | ) | (839 | ) | ||||||||
Net Change in Unrealized Appreciation (Depreciation) on Foreign Currency Translation | 1 | 3 | — | — | ||||||||||||
Net Increase (Decrease) in Net Assets Resulting from Operations | (238 | ) | 876 | (421 | ) | 987 | ||||||||||
Dividends and Distributions from: | ||||||||||||||||
Net Investment Income: | ||||||||||||||||
Class A | (120 | ) | (494 | ) | (136 | ) | (327 | ) | ||||||||
Class D | N/A | N/A | N/A | N/A | ||||||||||||
Class I | (9 | ) | (48 | ) | N/A | N/A | ||||||||||
Total Dividends and Distributions | (129 | ) | (542 | ) | (136 | ) | (327 | ) | ||||||||
Capital Share Transactions(1): | ||||||||||||||||
Class A | ||||||||||||||||
Proceeds from Shares Issued | 4,367 | 9,934 | 1,095 | 2,666 | ||||||||||||
Reinvestment of Dividends & Distributions | 116 | 481 | 127 | 309 | ||||||||||||
Cost of Shares Redeemed | (7,160 | ) | (14,814 | ) | (2,349 | ) | (4,122 | ) | ||||||||
Increase (Decrease) in Net Assets Derived from Class A Transactions | (2,677 | ) | (4,399 | ) | (1,127 | ) | (1,147 | ) | ||||||||
Class D | ||||||||||||||||
Proceeds from Shares Issued | N/A | N/A | N/A | N/A | ||||||||||||
Reinvestment of Dividends & Distributions | N/A | N/A | N/A | N/A | ||||||||||||
Cost of Shares Redeemed | N/A | N/A | N/A | N/A | ||||||||||||
Increase (Decrease) in Net Assets Derived from Class D Transactions | N/A | N/A | N/A | N/A | ||||||||||||
Class I | ||||||||||||||||
Proceeds from Shares Issued | 221 | 658 | N/A | N/A | ||||||||||||
Reinvestment of Dividends & Distributions | 9 | 48 | N/A | N/A | ||||||||||||
Cost of Shares Redeemed | (241 | ) | (2,063 | ) | N/A | N/A | ||||||||||
Decrease in Net Assets Derived from Class I Transactions | (11 | ) | (1,357 | ) | N/A | N/A | ||||||||||
Increase (Decrease) in Net Assets Derived From Capital Share Transactions | (2,688 | ) | (5,756 | ) | (1,127 | ) | (1,147 | ) | ||||||||
Net Increase (Decrease) in Net Assets | (3,055 | ) | (5,422 | ) | (1,684 | ) | (487 | ) | ||||||||
Net Assets: | ||||||||||||||||
Beginning of Period | 38,455 | 43,877 | 9,803 | 10,290 | ||||||||||||
End of Period | $ | 35,400 | $ | 38,455 | $ | 8,119 | $ | 9,803 | ||||||||
Undistributed Net Investment Income Included in Net Assets at End of Period | $ | 47 | $ | 50 | $ | 41 | $ | 46 | ||||||||
| (1) | For Capital Share Transactions see footnote 4 in the notes to financial statements. |
Amounts designated as “—” are $0 or have been rounded to $0.
N/A — Not applicable. Class D and/or Class I shares currently not offered.
The accompanying notes are an integral part of the financial statements.
| 20 | SEI Asset Allocation Trust / Semi-Annual Report / September 30, 2015 |
| Conservative Strategy Fund | Conservative Strategy Allocation Fund | Moderate Strategy Fund | Moderate Strategy Allocation Fund | |||||||||||||||||||||||||||
| 4/01/15 – 9/30/15 | 4/01/14 – 3/31/15 | 4/01/15 – 9/30/15 | 4/01/14 – 3/31/15 | 4/01/15 – 9/30/15 | 4/01/14 – 3/31/15 | 4/01/15 – 9/30/15 | 4/01/14 – 3/31/15 | |||||||||||||||||||||||
| $ | 576 | $ | 1,749 | $ | 578 | $ | 1,051 | $ | 1,346 | $ | 5,038 | $ | 835 | $ | 1,511 | |||||||||||||||
| 1,300 | 2,900 | 2,241 | 4,058 | 2,367 | 7,200 | 2,038 | 3,902 | |||||||||||||||||||||||
| 9 | 147 | — | — | 71 | 1,143 | — | — | |||||||||||||||||||||||
| — | 1,989 | 173 | 2,271 | — | 8,522 | 151 | 4,531 | |||||||||||||||||||||||
| (3,485 | ) | (2,675 | ) | (5,147 | ) | (2,482 | ) | (12,127 | ) | (6,955 | ) | (8,222 | ) | (895 | ) | |||||||||||||||
| 3 |
| 8 | — | — | (24 | ) | 72 | — | — | ||||||||||||||||||||
| (1,597 | ) | 4,118 | (2,155 | ) | 4,898 | (8,367 | ) | 15,020 | (5,198 | ) | 9,049 | |||||||||||||||||||
| (555 | ) | (2,079 | ) | (575 | ) | (1,450 | ) | (1,312 | ) | (7,768 | ) | (824 | ) | (2,483 | ) | |||||||||||||||
| (7 | ) | (63 | ) | N/A | N/A | (4 | ) | (67 | ) | N/A | N/A | |||||||||||||||||||
| (19 | ) | (85 | ) | N/A | N/A | (27 | ) | (213 | ) | N/A | N/A | |||||||||||||||||||
| (581 | ) | (2,227 | ) | (575 | ) | (1,450 | ) | (1,343 | ) | 8,048 | (824 | ) | (2,483 | ) | ||||||||||||||||
| 5,816 | 16,379 | 3,871 | 8,998 | 15,488 | 40,945 | 7,625 | 20,465 | |||||||||||||||||||||||
| 513 | 1,932 | 509 | 1,283 | 1,233 | 7,330 | 770 | 2,306 | |||||||||||||||||||||||
| (13,591 | ) | (31,710 | ) | (4,982 | ) | (10,846 | ) | (27,799 | ) | (45,999 | ) | (9,289 | ) | (17,656 | ) | |||||||||||||||
| (7,262 | ) | (13,399 | ) | (602 | ) | (565 | ) | (11,078 | ) | 2,276 | (894 | ) | 5,115 | |||||||||||||||||
| 255 | 507 | N/A | N/A | 901 | 476 | N/A | N/A | |||||||||||||||||||||||
| 7 | 61 | N/A | N/A | 4 | 67 | N/A | N/A | |||||||||||||||||||||||
| (648 | ) | (502 | ) | N/A | N/A | (523 | ) | (716 | ) | N/A | N/A | |||||||||||||||||||
| (386 | ) | 66 | N/A | N/A | 382 | (173 | ) | N/A | N/A | |||||||||||||||||||||
| 280 | 829 | N/A | N/A | 733 | 1,703 | N/A | N/A | |||||||||||||||||||||||
| 19 | 85 | N/A | N/A | 27 | 213 | N/A | N/A | |||||||||||||||||||||||
| (737 | ) | (1,434 | ) | N/A | N/A | (1,170 | ) | (3,463 | ) | N/A | N/A | |||||||||||||||||||
| (438 | ) | (520 | ) | N/A | N/A | (410 | ) | (1,547 | ) | N/A | N/A | |||||||||||||||||||
| (8,086 | ) | (13,853 | ) | (602 | ) | (565 | ) | (11,106 | ) | 556 | (894 | ) | 5,115 | |||||||||||||||||
| (10,264 | ) | (11,962 | ) | (3,332 | ) | 2,883 | (20,816 | ) | 7,528 | (6,916 | ) | 11,681 | ||||||||||||||||||
| 116,776 | 128,738 | 44,078 | 41,195 | 272,760 | 265,232 | 94,698 | 83,017 | |||||||||||||||||||||||
| $ | 106,512 | $ | 116,776 | $ | 40,746 | $ | 44,078 | $ | 251,944 | $ | 272,760 | $ | 87,782 | $ | 94,698 | |||||||||||||||
| $ | 472 | $ | 447 | $ | 164 | $ | 161 | $ | 1,760 | $ | 1,757 | $ | 161 | $ | 150 | |||||||||||||||
| SEI Asset Allocation Trust / Semi-Annual Report / September 30, 2015 | 21 |
Statements of Changes in Net Assets ($ Thousands)
For the six months ended September 30, 2015 (Unaudited) and the year ended March 31, 2015.
| Aggressive Strategy Fund | Tax-Managed Aggressive Strategy Fund | |||||||||||||||
| 4/01/15 – 9/30/15 | 4/01/14 – 3/31/15 | 4/01/15 – 9/30/15 | 4/01/14 – 3/31/15 | |||||||||||||
Operations: | ||||||||||||||||
Net Investment Income | $ | 774 | $ | 3,682 | $ | 237 | $ | 616 | ||||||||
Net Realized Gain from sale of Affiliated Funds | 14,819 | 14,317 | 3,220 | 3,437 | ||||||||||||
Net Realized Gain on Foreign Currency Transactions | 106 | 2,600 | — | — | ||||||||||||
Capital Gain Distributions Received from Affiliated Funds | — | 14,932 | — | 120 | ||||||||||||
Net Change in Unrealized Appreciation (Depreciation) from Affiliated Funds | (41,146 | ) | (15,941 | ) | (8,339 | ) | (8 | ) | ||||||||
Net Change in Unrealized Appreciation (Depreciation) on Foreign Currency Translation | (135 | ) | 183 | — | — | |||||||||||
Net Increase (Decrease) in Net Assets Resulting from Operations | (25,582 | ) | 19,773 | (4,882 | ) | 4,165 | ||||||||||
Dividends and Distributions from: | ||||||||||||||||
Net Investment Income: | ||||||||||||||||
Class A | (702 | ) | (7,554 | ) | (232 | ) | (633 | ) | ||||||||
Class D | — | (328 | ) | N/A | N/A | |||||||||||
Class I | (48 | ) | (874 | ) | N/A | N/A | ||||||||||
Total Dividends and Distributions | (750 | ) | (8,756 | ) | (232 | ) | (633 | ) | ||||||||
Capital Share Transactions(1): | ||||||||||||||||
Class A | ||||||||||||||||
Proceeds from Shares Issued | 14,352 | 34,223 | 3,357 | 7,696 | ||||||||||||
Reinvestment of Dividends & Distributions | 654 | 7,046 | 225 | 614 | ||||||||||||
Cost of Shares Redeemed | (22,352 | ) | (54,417 | ) | (6,289 | ) | (7,831 | ) | ||||||||
Increase (Decrease) in Net Assets Derived from Class A Transactions | (7,346 | ) | (13,148 | ) | (2,707 | ) | 479 | |||||||||
Class D | ||||||||||||||||
Proceeds from Shares Issued | 1,012 | 1,533 | N/A | N/A | ||||||||||||
Reinvestment of Dividends & Distributions | — | 315 | N/A | N/A | ||||||||||||
Cost of Shares Redeemed | (226 | ) | (2,055 | ) | N/A | N/A | ||||||||||
Increase (Decrease) in Net Assets Derived from Class D Transactions | 786 | (207 | ) | N/A | N/A | |||||||||||
Class I | ||||||||||||||||
Proceeds from Shares Issued | 2,936 | 3,937 | N/A | N/A | ||||||||||||
Reinvestment of Dividends & Distributions | 48 | 873 | N/A | N/A | ||||||||||||
Cost of Shares Redeemed | (5,354 | ) | (14,058 | ) | N/A | N/A | ||||||||||
Increase (Decrease) in Net Assets Derived from Class I Transactions | (2,370 | ) | (9,248 | ) | N/A | N/A | ||||||||||
Increase (Decrease) in Net Assets Derived From Capital Share Transactions | (8,930 | ) | (22,603 | ) | (2,707 | ) | 479 | |||||||||
Net Increase (Decrease) in Net Assets | (35,262 | ) | (11,586 | ) | (7,821 | ) | 4,011 | |||||||||
Net Assets: | ||||||||||||||||
Beginning of Period | 306,305 | 317,891 | 63,755 | 59,744 | ||||||||||||
End of Period | $ | 271,043 | $ | 306,305 | $ | 55,934 | $ | 63,755 | ||||||||
Undistributed Net Investment Income Included in Net Assets at End of Period | $ | 2,331 | $ | 2,307 | $ | 20 | $ | 15 | ||||||||
| (1) | For Capital Share Transactions see footnote 4 in the notes to financial statements. |
Amounts designated as “—” are $0 or have been rounded to $0.
N/A — Not applicable. Class D and/or Class I shares currently not offered.
The accompanying notes are an integral part of the financial statements.
| 22 | SEI Asset Allocation Trust / Semi-Annual Report / September 30, 2015 |
| Core Market Strategy Fund | Core Market Strategy Allocation Fund | Market Growth Strategy Fund | Market Growth Strategy Allocation Fund | |||||||||||||||||||||||||||
| 4/01/15 – 9/30/15 | 4/01/14 – 3/31/15 | 4/01/15 – 9/30/15 | 4/01/14 – 3/31/15 | 4/01/15 – 9/30/15 | 4/01/14 – 3/31/15 | 4/01/15 – 9/30/15 | 4/01/14 – 3/31/15 | |||||||||||||||||||||||
| $ | 584 | $ | 1,774 | $ | 100 | $ | 249 | $ | 1,334 | $ | 4,870 | $ | 496 | $ | 1,281 | |||||||||||||||
| 3,241 | 3,393 | 1,836 | 1,300 | 14,504 | 12,552 | 6,008 | 8,417 | |||||||||||||||||||||||
| 34 | 782 | — | — | 131 | 3,131 | — | — | |||||||||||||||||||||||
| — | 3,695 | — | 49 | — | 14,269 | — | 252 | |||||||||||||||||||||||
| (10,660 | ) | (3,654 | ) | (4,022 | ) | 53 | (41,705 | ) | (14,739 | ) | (16,615 | ) | (1,305 | ) | ||||||||||||||||
| (43 | ) | 57 | — | — | (168 | ) | 225 | — | — | ||||||||||||||||||||
| (6,844 | ) | 6,047 | (2,086 | ) | 1,651 | (25,904 | ) | 20,308 | (10,111 | ) | 8,645 | |||||||||||||||||||
| (581 | ) | (3,016 | ) | (98 | ) | (255 | ) | (1,293 | ) | (10,104 | ) | (486 | ) | (1,317 | ) | |||||||||||||||
| N/A | N/A | N/A | N/A | — | (141 | ) | N/A | N/A | ||||||||||||||||||||||
| (2 | ) | (10 | ) | N/A | N/A | (29 | ) | (348 | ) | N/A | N/A | |||||||||||||||||||
| (583 | ) | (3,026 | ) | (98 | ) | (255 | ) | (1,322 | ) | (10,593 | ) | (486 | ) | (1,317 | ) | |||||||||||||||
| 6,366 | 23,508 | 3,305 | 5,968 | 18,654 | 53,748 | 9,099 | 24,289 | |||||||||||||||||||||||
| 468 | 2,415 | 94 | 249 | 1,214 | 9,526 | 455 | 1,229 | |||||||||||||||||||||||
| (9,763 | ) | (24,935 | ) | (4,239 | ) | (3,636 | ) | (35,407 | ) | (67,617 | ) | (14,576 | ) | (23,956 | ) | |||||||||||||||
| (2,929 | ) | 988 | (840 | ) | 2,581 | (15,539 | ) | (4,343 | ) | (5,022 | ) | 1,562 | ||||||||||||||||||
| N/A | N/A | N/A | N/A | 380 | 545 | N/A | N/A | |||||||||||||||||||||||
| N/A | N/A | N/A | N/A | — | 136 | N/A | N/A | |||||||||||||||||||||||
| N/A | N/A | N/A | N/A | (47 | ) | (2,213 | ) | N/A | N/A | |||||||||||||||||||||
| N/A | N/A | N/A | N/A | 333 | (1,532 | ) | N/A | N/A | ||||||||||||||||||||||
| 211 | 252 | N/A | N/A | 680 | 1,489 | N/A | N/A | |||||||||||||||||||||||
| 2 | 10 | N/A | N/A | 29 | 348 | N/A | N/A | |||||||||||||||||||||||
| (173 | ) | (63 | ) | N/A | N/A | (3,142 | ) | (4,234 | ) | N/A | N/A | |||||||||||||||||||
| 40 | 199 | N/A | N/A | (2,433 | ) | (2,397 | ) | N/A | N/A | |||||||||||||||||||||
| (2,889 | ) | 1,187 | (840 | ) | 2,581 | (17,639 | ) | (8,272 | ) | (5,022 | ) | 1,562 | ||||||||||||||||||
| (10,316 | ) | 4,208 | (3,024 | ) | 3,977 | (44,865 | ) | 1,443 | (15,619 | ) | 8,890 | |||||||||||||||||||
| 117,258 | 113,050 | 26,896 | 22,919 | 379,424 | 377,981 | 135,002 | 126,112 | |||||||||||||||||||||||
| $ | 106,942 | $ | 117,258 | $ | 23,872 | $ | 26,896 | $ | 334,559 | $ | 379,424 | $ | 119,383 | $ | 135,002 | |||||||||||||||
| $ | 1,102 | $ | 1,101 | $ | 10 | $ | 8 | $ | 2,891 | $ | 2,879 | $ | 41 | $ | 31 | |||||||||||||||
| SEI Asset Allocation Trust / Semi-Annual Report / September 30, 2015 | 23 |
For six months ended September 30, 2015 (Unaudited) and the periods ended March 31,
For a Share Outstanding Throughout Each Period
| Net Asset Value, Beginning of Period | Net Investment Income* | Net Realized and Unrealized Gains (Losses) from Affiliated Funds* | Total from Operations | Dividends from Net Investment Income | Total Dividends and Distributions | Net Asset Value, End of Period | Total Return† | Net Assets End of Period ($ Thousands) | Ratio of to Average Net Assets***‡ | Ratio of to Average | Ratio of Net Investment Income to Average Net Assets | Portfolio Turnover Rate† | ||||||||||||||||||||||||||||||||||||||||
Defensive Strategy Fund |
| |||||||||||||||||||||||||||||||||||||||||||||||||||
Class A |
| |||||||||||||||||||||||||||||||||||||||||||||||||||
2015@ | $ | 9.82 | $ | 0.03 | $ | (0.10 | ) | $ | (0.07 | ) | $ | (0.03 | ) | $ | (0.03 | ) | $ | 9.72 | (0.67 | )% | $ | 31,714 | 0.21 | % | 0.62 | % | 0.69 | % | 15 | % | ||||||||||||||||||||||
2015 | 9.74 | 0.08 | 0.13 | 0.21 | (0.13 | ) | (0.13 | ) | 9.82 | 2.17 | 34,720 | 0.13 | 0.41 | 0.86 | 19 | |||||||||||||||||||||||||||||||||||||
2014 | 9.80 | 0.09 | (0.06 | ) | 0.03 | (0.09 | ) | (0.09 | ) | 9.74 | 0.36 | 38,819 | 0.11 | 0.36 | 0.93 | 60 | ||||||||||||||||||||||||||||||||||||
2013 | 9.62 | 0.11 | 0.24 | 0.35 | (0.17 | ) | (0.17 | ) | 9.80 | 3.63 | 43,880 | 0.11 | 0.38 | 1.14 | 56 | |||||||||||||||||||||||||||||||||||||
2012 | 9.52 | 0.13 | 0.13 | 0.26 | (0.16 | ) | (0.16 | ) | 9.62 | 2.77 | 34,240 | 0.12 | 0.38 | 1.36 | 48 | |||||||||||||||||||||||||||||||||||||
2011 | 9.39 | 0.12 | 0.19 | 0.31 | (0.18 | ) | (0.18 | ) | 9.52 | 3.35 | 33,376 | 0.11 | 0.37 | 1.32 | 73 | |||||||||||||||||||||||||||||||||||||
Class I |
| |||||||||||||||||||||||||||||||||||||||||||||||||||
2015@ | $ | 9.66 | $ | 0.02 | $ | (0.10 | ) | $ | (0.08 | ) | $ | (0.02 | ) | $ | (0.02 | ) | $ | 9.56 | (0.81 | )% | $ | 3,686 | 0.46 | % | 0.87 | % | 0.44 | % | 15 | % | ||||||||||||||||||||||
2015 | 9.59 | 0.06 | 0.12 | 0.18 | (0.11 | ) | (0.11 | ) | 9.66 | 1.90 | 3,735 | 0.38 | 0.66 | 0.59 | 19 | |||||||||||||||||||||||||||||||||||||
2014 | 9.64 | 0.06 | (0.04 | ) | 0.02 | (0.07 | ) | (0.07 | ) | 9.59 | 0.21 | 5,058 | 0.36 | 0.61 | 0.67 | 60 | ||||||||||||||||||||||||||||||||||||
2013 | 9.48 | 0.11 | 0.20 | 0.31 | (0.15 | ) | (0.15 | ) | 9.64 | 3.28 | 7,062 | 0.36 | 0.63 | 1.19 | 56 | |||||||||||||||||||||||||||||||||||||
2012 | 9.38 | 0.11 | 0.13 | 0.24 | (0.14 | ) | (0.14 | ) | 9.48 | 2.58 | 24 | 0.37 | 0.63 | 1.13 | 48 | |||||||||||||||||||||||||||||||||||||
2011 | 9.35 | 0.01 | 0.20 | 0.21 | (0.18 | ) | (0.18 | ) | 9.38 | 2.27 | 5 | 0.36 | 0.70 | 3.15 | 73 | |||||||||||||||||||||||||||||||||||||
Defensive Strategy Allocation Fund |
| |||||||||||||||||||||||||||||||||||||||||||||||||||
Class A |
| |||||||||||||||||||||||||||||||||||||||||||||||||||
2015@ | $ | 14.88 | $ | 0.22 | $ | (0.94 | ) | $ | (0.72 | ) | $ | (0.22 | ) | $ | (0.22 | ) | $ | 13.94 | (4.88 | )% | $ | 8,119 | 0.35 | % | 0.62 | % | 3.00 | % | 14 | % | ||||||||||||||||||||||
2015 | 13.86 | 0.40 | 1.13 | 1.53 | (0.51 | ) | (0.51 | ) | 14.88 | 11.19 | 9,803 | 0.16 | 0.41 | 2.76 | 33 | |||||||||||||||||||||||||||||||||||||
2014 | 12.98 | 0.39 | 0.99 | 1.38 | (0.50 | ) | (0.50 | ) | 13.86 | 10.83 | 10,290 | 0.11 | 0.36 | 2.94 | 64 | |||||||||||||||||||||||||||||||||||||
2013 | 11.66 | 0.42 | 1.32 | 1.74 | (0.42 | ) | (0.42 | ) | 12.98 | 15.23 | 10,711 | 0.11 | 0.38 | 3.46 | 54 | |||||||||||||||||||||||||||||||||||||
2012 | 11.14 | 0.38 | 0.53 | 0.91 | (0.39 | ) | (0.39 | ) | 11.66 | 8.46 | 10,471 | 0.12 | 0.38 | 3.42 | 72 | |||||||||||||||||||||||||||||||||||||
2011 | 9.84 | 0.42 | 1.34 | 1.76 | (0.46 | ) | (0.46 | ) | 11.14 | 18.38 | 9,715 | 0.11 | 0.37 | 4.14 | 72 | |||||||||||||||||||||||||||||||||||||
Conservative Strategy Fund |
| |||||||||||||||||||||||||||||||||||||||||||||||||||
Class A |
| |||||||||||||||||||||||||||||||||||||||||||||||||||
2015@ | $ | 10.46 | $ | 0.06 | $ | (0.20 | ) | $ | (0.14 | ) | $ | (0.06 | ) | $ | (0.06 | ) | $ | 10.26 | (1.39 | )% | $ | 97,257 | 0.26 | % | 0.62 | % | 1.07 | % | 12 | % | ||||||||||||||||||||||
2015 | 10.31 | 0.15 | 0.20 | 0.35 | (0.20 | ) | (0.20 | ) | 10.46 | 3.40 | 106,515 | 0.14 | 0.41 | 1.48 | 12 | |||||||||||||||||||||||||||||||||||||
2014 | 10.25 | 0.16 | 0.08 | 0.24 | (0.18 | ) | (0.18 | ) | 10.31 | 2.39 | 118,163 | 0.11 | 0.36 | 1.60 | 47 | |||||||||||||||||||||||||||||||||||||
2013 | 9.85 | 0.18 | 0.45 | 0.63 | (0.23 | ) | (0.23 | ) | 10.25 | 6.49 | 122,319 | 0.11 | 0.38 | 1.77 | 62 | |||||||||||||||||||||||||||||||||||||
2012 | 9.68 | 0.18 | 0.21 | 0.39 | (0.22 | ) | (0.22 | ) | 9.85 | 4.10 | 117,365 | 0.12 | 0.38 | 1.84 | 61 | |||||||||||||||||||||||||||||||||||||
2011 | 9.38 | 0.19 | 0.36 | 0.55 | (0.25 | ) | (0.25 | ) | 9.68 | 5.89 | 120,659 | 0.11 | 0.37 | 1.95 | 110 | |||||||||||||||||||||||||||||||||||||
Class D |
| |||||||||||||||||||||||||||||||||||||||||||||||||||
2015@ | $ | 10.45 | $ | 0.02 | $ | (0.22 | ) | $ | (0.20 | ) | $ | (0.01 | ) | $ | (0.01 | ) | $ | 10.24 | (1.87 | )% | $ | 4,839 | 1.01 | % | 1.37 | % | 0.32 | % | 12 | % | ||||||||||||||||||||||
2015 | 10.31 | 0.07 | 0.20 | 0.27 | (0.13 | ) | (0.13 | ) | 10.45 | 2.59 | 5,321 | 1.01 | 1.35 | 0.65 | 12 | |||||||||||||||||||||||||||||||||||||
2014 | 10.26 | 0.08 | 0.06 | 0.14 | (0.09 | ) | (0.09 | ) | 10.31 | 1.41 | 5,186 | 1.04 | 1.36 | 0.74 | 47 | |||||||||||||||||||||||||||||||||||||
2013 | 9.86 | 0.07 | 0.47 | 0.54 | (0.14 | ) | (0.14 | ) | 10.26 | 5.48 | 1,078 | 1.04 | 1.38 | 0.70 | 62 | |||||||||||||||||||||||||||||||||||||
2012 | 9.68 | 0.09 | 0.21 | 0.30 | (0.12 | ) | (0.12 | ) | 9.86 | 3.16 | 1,450 | 1.07 | 1.38 | 0.88 | 61 | |||||||||||||||||||||||||||||||||||||
2011** | 9.69 | 0.01 | 0.02 | 0.03 | (0.04 | ) | (0.04 | ) | 9.68 | 0.26 | 1,956 | 1.11 | 1.55 | 10.56 | 110 | |||||||||||||||||||||||||||||||||||||
Class I |
| |||||||||||||||||||||||||||||||||||||||||||||||||||
2015@ | $ | 10.63 | $ | 0.04 | $ | (0.21 | ) | $ | (0.17 | ) | $ | (0.04 | ) | $ | (0.04 | ) | $ | 10.42 | (1.59 | )% | $ | 4,416 | 0.51 | % | 0.87 | % | 0.82 | % | 12 | % | ||||||||||||||||||||||
2015 | 10.47 | 0.13 | 0.21 | 0.34 | (0.18 | ) | (0.18 | ) | 10.63 | 3.25 | 4,940 | 0.39 | 0.66 | 1.27 | 12 | |||||||||||||||||||||||||||||||||||||
2014 | 10.41 | 0.14 | 0.07 | 0.21 | (0.15 | ) | (0.15 | ) | 10.47 | 2.09 | 5,389 | 0.36 | 0.61 | 1.32 | 47 | |||||||||||||||||||||||||||||||||||||
2013 | 9.99 | 0.15 | 0.47 | 0.62 | (0.20 | ) | (0.20 | ) | 10.41 | 6.31 | 5,742 | 0.36 | 0.63 | 1.52 | 62 | |||||||||||||||||||||||||||||||||||||
2012 | 9.82 | 0.16 | 0.21 | 0.37 | (0.20 | ) | (0.20 | ) | 9.99 | 3.78 | 5,067 | 0.37 | 0.63 | 1.61 | 61 | |||||||||||||||||||||||||||||||||||||
2011 | 9.52 | 0.18 | 0.34 | 0.52 | (0.22 | ) | (0.22 | ) | 9.82 | 5.57 | 5,494 | 0.36 | 0.62 | 1.86 | 110 | |||||||||||||||||||||||||||||||||||||
Conservative Strategy Allocation Fund |
| |||||||||||||||||||||||||||||||||||||||||||||||||||
Class A |
| |||||||||||||||||||||||||||||||||||||||||||||||||||
2015@ | $ | 14.73 | $ | 0.19 | $ | (0.92 | ) | $ | (0.73 | ) | $ | (0.19 | ) | $ | (0.19 | ) | $ | 13.81 | (5.00 | )% | $ | 40,746 | 0.35 | % | 0.62 | % | 2.68 | % | 11 | % | ||||||||||||||||||||||
2015 | 13.58 | 0.35 | 1.29 | 1.64 | (0.49 | ) | (0.49 | ) | 14.73 | 12.22 | 44,078 | 0.17 | 0.41 | 2.47 | 25 | |||||||||||||||||||||||||||||||||||||
2014 | 12.60 | 0.34 | 1.09 | 1.43 | (0.45 | ) | (0.45 | ) | 13.58 | 11.61 | 41,195 | 0.11 | 0.36 | 2.64 | 64 | |||||||||||||||||||||||||||||||||||||
2013 | 11.25 | 0.37 | 1.34 | 1.71 | (0.36 | ) | (0.36 | ) | 12.60 | 15.47 | 37,104 | 0.11 | 0.38 | 3.15 | 37 | |||||||||||||||||||||||||||||||||||||
2012 | 10.67 | 0.32 | 0.59 | 0.91 | (0.33 | ) | (0.33 | ) | 11.25 | 8.77 | 28,317 | 0.12 | 0.38 | 3.02 | 61 | |||||||||||||||||||||||||||||||||||||
2011 | 9.34 | 0.36 | 1.36 | 1.72 | (0.39 | ) | (0.39 | ) | 10.67 | 18.83 | 24,287 | 0.11 | 0.37 | 3.70 | 65 | |||||||||||||||||||||||||||||||||||||
Moderate Strategy Fund |
| |||||||||||||||||||||||||||||||||||||||||||||||||||
Class A |
| |||||||||||||||||||||||||||||||||||||||||||||||||||
2015@ | $ | 11.69 | $ | 0.06 | $ | (0.42 | ) | $ | (0.36 | ) | $ | (0.06 | ) | $ | (0.06 | ) | $ | 11.27 | (3.10 | )% | $ | 242,118 | 0.31 | % | 0.62 | % | 1.03 | % | 8 | % | ||||||||||||||||||||||
2015 | 11.39 | 0.22 | 0.43 | 0.65 | (0.35 | ) | (0.35 | ) | 11.69 | 5.77 | 262,515 | 0.15 | 0.41 | 1.89 | 14 | |||||||||||||||||||||||||||||||||||||
2014 | 11.25 | 0.20 | 0.17 | 0.37 | (0.23 | ) | (0.23 | ) | 11.39 | 3.34 | 253,566 | 0.11 | 0.36 | 1.76 | 47 | |||||||||||||||||||||||||||||||||||||
2013 | 10.59 | 0.21 | 0.75 | 0.96 | (0.30 | ) | (0.30 | ) | 11.25 | 9.16 | 280,634 | 0.11 | 0.38 | 1.97 | 68 | |||||||||||||||||||||||||||||||||||||
2012 | 10.29 | 0.23 | 0.36 | 0.59 | (0.29 | ) | (0.29 | ) | 10.59 | 5.83 | 270,940 | 0.12 | 0.38 | 2.23 | 54 | |||||||||||||||||||||||||||||||||||||
2011 | 9.79 | 0.23 | 0.60 | 0.83 | (0.33 | ) | (0.33 | ) | 10.29 | 8.58 | 286,732 | 0.11 | 0.37 | 2.27 | 79 | |||||||||||||||||||||||||||||||||||||
| 24 | SEI Asset Allocation Trust / Semi-Annual Report / September 30, 2015 |
| Net Asset Value, Beginning of Period | Net Investment Income (Loss)* | Net Realized and Unrealized Gains (Losses) from Affiliated Funds* | Total from Operations | Dividends from Net Investment Income | Total Dividends and Distributions | Net Asset Value, End of Period | Total Return† | Net Assets End of Period ($ Thousands) | Ratio of to Average Net Assets***‡ | Ratio of to Average | Ratio of Net Investment Income to Average Net Assets | Portfolio Turnover Rate† | ||||||||||||||||||||||||||||||||||||||||
Moderate Strategy Fund (continued) |
| |||||||||||||||||||||||||||||||||||||||||||||||||||
Class D |
| |||||||||||||||||||||||||||||||||||||||||||||||||||
2015@ | $ | 11.66 | $ | 0.02 | $ | (0.42 | ) | $ | (0.40 | ) | $ | (0.02 | ) | $ | (0.02 | ) | $ | 11.24 | (3.48 | )% | $ | 3,125 | 1.06 | % | 1.37 | % | 0.27 | % | 8 | % | ||||||||||||||||||||||
2015 | 11.38 | 0.12 | 0.43 | 0.55 | (0.27 | ) | (0.27 | ) | 11.66 | 4.88 | 2,866 | 1.00 | 1.35 | 1.00 | 14 | |||||||||||||||||||||||||||||||||||||
2014 | 11.25 | 0.10 | 0.18 | 0.28 | (0.15 | ) | (0.15 | ) | 11.38 | 2.48 | 2,964 | 1.01 | 1.36 | 0.93 | 47 | |||||||||||||||||||||||||||||||||||||
2013 | 10.60 | 0.12 | 0.74 | 0.86 | (0.21 | ) | (0.21 | ) | 11.25 | 8.17 | 1,713 | 0.96 | 1.38 | 1.10 | 68 | |||||||||||||||||||||||||||||||||||||
2012 | 10.29 | 0.13 | 0.37 | 0.50 | (0.19 | ) | (0.19 | ) | 10.60 | 4.90 | 1,513 | 1.07 | 1.38 | 1.22 | 54 | |||||||||||||||||||||||||||||||||||||
2011** | 10.28 | 0.02 | 0.04 | 0.06 | (0.05 | ) | (0.05 | ) | 10.29 | 0.60 | 1,691 | 1.11 | 1.66 | 13.95 | 79 | |||||||||||||||||||||||||||||||||||||
Class I |
| |||||||||||||||||||||||||||||||||||||||||||||||||||
2015@ | $ | 11.98 | $ | 0.05 | $ | (0.45 | ) | $ | (0.40 | ) | $ | (0.04 | ) | $ | (0.04 | ) | $ | 11.54 | (3.32 | )% | $ | 6,701 | 0.56 | % | 0.87 | % | 0.77 | % | 8 | % | ||||||||||||||||||||||
2015 | 11.67 | 0.19 | 0.45 | 0.64 | (0.33 | ) | (0.33 | ) | 11.98 | 5.51 | 7,379 | 0.40 | 0.66 | 1.57 | 14 | |||||||||||||||||||||||||||||||||||||
2014 | 11.52 | 0.17 | 0.18 | 0.35 | (0.20 | ) | (0.20 | ) | 11.67 | 3.08 | 8,702 | 0.36 | 0.61 | 1.46 | 47 | |||||||||||||||||||||||||||||||||||||
2013 | 10.84 | 0.20 | 0.75 | 0.95 | (0.27 | ) | (0.27 | ) | 11.52 | 8.89 | 12,204 | 0.36 | 0.63 | 1.84 | 68 | |||||||||||||||||||||||||||||||||||||
2012 | 10.53 | 0.21 | 0.36 | 0.57 | (0.26 | ) | (0.26 | ) | 10.84 | 5.54 | 7,269 | 0.37 | 0.63 | 2.01 | 54 | |||||||||||||||||||||||||||||||||||||
2011 | 10.01 | 0.23 | 0.59 | 0.82 | (0.30 | ) | (0.30 | ) | 10.53 | 8.36 | 6,239 | 0.36 | 0.63 | 2.30 | 79 | |||||||||||||||||||||||||||||||||||||
Moderate Strategy Allocation Fund |
| |||||||||||||||||||||||||||||||||||||||||||||||||||
Class A |
| |||||||||||||||||||||||||||||||||||||||||||||||||||
2015@ | $ | 19.71 | $ | 0.17 | $ | (1.25 | ) | $ | (1.08 | ) | $ | (0.17 | ) | $ | (0.17 | ) | $ | 18.46 | (5.51 | )% | $ | 87,782 | 0.35 | % | 0.62 | % | 1.78 | % | 6 | % | ||||||||||||||||||||||
2015 | 18.28 | 0.33 | 1.64 | 1.97 | (0.54 | ) | (0.54 | ) | 19.71 | 10.89 | 94,698 | 0.17 | 0.41 | 1.74 | 18 | |||||||||||||||||||||||||||||||||||||
2014 | 16.21 | 0.33 | 2.20 | 2.53 | (0.46 | ) | (0.46 | ) | 18.28 | 15.77 | 83,017 | 0.11 | 0.36 | 1.93 | 41 | |||||||||||||||||||||||||||||||||||||
2013 | 14.36 | 0.34 | 1.86 | 2.20 | (0.35 | ) | (0.35 | ) | 16.21 | 15.58 | 69,465 | 0.11 | 0.38 | 2.32 | 48 | |||||||||||||||||||||||||||||||||||||
2012 | 13.66 | 0.30 | 0.70 | 1.00 | (0.30 | ) | (0.30 | ) | 14.36 | 7.52 | 71,572 | 0.12 | 0.38 | 2.22 | 67 | |||||||||||||||||||||||||||||||||||||
2011 | 11.98 | 0.30 | 1.70 | 2.00 | (0.32 | ) | (0.32 | ) | 13.66 | 17.02 | 64,585 | 0.11 | 0.37 | 2.46 | 42 | |||||||||||||||||||||||||||||||||||||
Aggressive Strategy Fund |
| |||||||||||||||||||||||||||||||||||||||||||||||||||
Class A |
| |||||||||||||||||||||||||||||||||||||||||||||||||||
2015@ | $ | 13.39 | $ | 0.04 | $ | (1.17 | ) | $ | (1.13 | ) | $ | (0.04 | ) | $ | (0.04 | ) | $ | 12.22 | (8.49 | )% | $ | 231,147 | 0.35 | % | 0.61 | % | 0.58 | % | 13 | % | ||||||||||||||||||||||
2015 | 12.93 | 0.17 | 0.67 | 0.84 | (0.38 | ) | (0.38 | ) | 13.39 | 6.58 | 260,917 | 0.16 | 0.41 | 1.25 | 21 | |||||||||||||||||||||||||||||||||||||
2014 | 11.75 | 0.12 | 1.26 | 1.38 | (0.20 | ) | (0.20 | ) | 12.93 | 11.83 | 264,665 | 0.11 | 0.36 | 0.99 | 50 | |||||||||||||||||||||||||||||||||||||
2013 | 10.83 | 0.17 | 1.02 | 1.19 | (0.27 | ) | (0.27 | ) | 11.75 | 11.17 | 247,732 | 0.11 | 0.38 | 1.57 | 74 | |||||||||||||||||||||||||||||||||||||
2012 | 10.69 | 0.18 | 0.26 | 0.44 | (0.30 | ) | (0.30 | ) | 10.83 | 4.37 | 263,957 | 0.12 | 0.37 | 1.79 | 54 | |||||||||||||||||||||||||||||||||||||
2011 | 9.74 | 0.18 | 1.17 | 1.35 | (0.40 | ) | (0.40 | ) | 10.69 | 14.12 | 326,069 | 0.11 | 0.37 | 1.80 | 120 | |||||||||||||||||||||||||||||||||||||
Class D |
| |||||||||||||||||||||||||||||||||||||||||||||||||||
2015@ | $ | 13.33 | $ | (0.01 | ) | $ | (1.17 | ) | $ | (1.18 | ) | $ | — | $ | — | $ | 12.15 | (8.85 | )% | $ | 13,593 | 1.10 | % | 1.37 | % | (0.18 | )% | 13 | % | |||||||||||||||||||||||
2015 | 12.90 | 0.06 | 0.67 | 0.73 | (0.30 | ) | (0.30 | ) | 13.33 | 5.74 | 14,130 | 0.94 | 1.35 | 0.46 | 21 | |||||||||||||||||||||||||||||||||||||
2014 | 11.75 | 0.02 | 1.27 | 1.29 | (0.14 | ) | (0.14 | ) | 12.90 | 11.01 | 13,859 | 0.88 | 1.36 | 0.20 | 50 | |||||||||||||||||||||||||||||||||||||
2013 | 10.83 | 0.09 | 1.02 | 1.11 | (0.19 | ) | (0.19 | ) | 11.75 | 10.34 | 12,425 | 0.86 | 1.38 | 0.83 | 74 | |||||||||||||||||||||||||||||||||||||
2012 | 10.69 | 0.08 | 0.26 | 0.34 | (0.20 | ) | (0.20 | ) | 10.83 | 3.35 | 13,494 | 1.07 | 1.37 | 0.83 | 54 | |||||||||||||||||||||||||||||||||||||
2011** | 10.61 | 0.02 | 0.09 | 0.11 | (0.03 | ) | (0.03 | ) | 10.69 | 1.00 | 17,033 | 1.11 | 1.45 | 16.77 | 120 | |||||||||||||||||||||||||||||||||||||
Class I |
| |||||||||||||||||||||||||||||||||||||||||||||||||||
2015@ | $ | 13.06 | $ | 0.02 | $ | (1.15 | ) | $ | (1.13 | ) | $ | (0.02 | ) | $ | (0.02 | ) | $ | 11.91 | (8.66 | )% | $ | 26,303 | 0.60 | % | 0.87 | % | 0.34 | % | 13 | % | ||||||||||||||||||||||
2015 | 12.62 | 0.12 | 0.68 | 0.80 | (0.36 | ) | (0.36 | ) | 13.06 | 6.38 | 31,258 | 0.41 | 0.66 | 0.91 | 21 | |||||||||||||||||||||||||||||||||||||
2014 | 11.48 | 0.09 | 1.23 | 1.32 | (0.18 | ) | (0.18 | ) | 12.62 | 11.55 | 39,367 | 0.36 | 0.61 | 0.74 | 50 | |||||||||||||||||||||||||||||||||||||
2013 | 10.58 | 0.13 | 1.01 | 1.14 | (0.24 | ) | (0.24 | ) | 11.48 | 10.97 | 42,396 | 0.36 | 0.63 | 2.17 | 74 | |||||||||||||||||||||||||||||||||||||
2012 | 10.46 | 0.16 | 0.23 | 0.39 | (0.27 | ) | (0.27 | ) | 10.58 | 4.01 | 47,553 | 0.37 | 0.62 | 1.61 | 54 | |||||||||||||||||||||||||||||||||||||
2011 | 9.54 | 0.22 | 1.08 | 1.30 | (0.38 | ) | (0.38 | ) | 10.46 | 13.87 | 54,914 | 0.36 | 0.63 | 2.27 | 120 | |||||||||||||||||||||||||||||||||||||
Tax-Managed Aggressive Strategy Fund |
| |||||||||||||||||||||||||||||||||||||||||||||||||||
Class A |
| |||||||||||||||||||||||||||||||||||||||||||||||||||
2015@ | $ | 18.12 | $ | 0.07 | $ | (1.47 | ) | $ | (1.40 | ) | $ | (0.07 | ) | $ | (0.07 | ) | $ | 16.65 | (7.78 | )% | $ | 55,934 | 0.35 | % | 0.62 | % | 0.75 | % | 6 | % | ||||||||||||||||||||||
2015 | 17.13 | 0.17 | 1.00 | 1.17 | (0.18 | ) | (0.18 | ) | 18.12 | 6.85 | 63,755 | 0.16 | 0.41 | 0.99 | 15 | |||||||||||||||||||||||||||||||||||||
2014 | 14.52 | 0.17 | 2.63 | 2.80 | (0.19 | ) | (0.19 | ) | 17.13 | 19.39 | 59,744 | 0.11 | 0.36 | 1.10 | 37 | |||||||||||||||||||||||||||||||||||||
2013 | 13.14 | 0.21 | 1.39 | 1.60 | (0.22 | ) | (0.22 | ) | 14.52 | 12.32 | 44,131 | 0.11 | 0.38 | 1.59 | 34 | |||||||||||||||||||||||||||||||||||||
2012 | 12.90 | 0.18 | 0.25^ | 0.43 | (0.19 | ) | (0.19 | ) | 13.14 | 3.51 | 45,700 | 0.12 | 0.38 | 1.44 | 45 | |||||||||||||||||||||||||||||||||||||
2011 | 11.30 | 0.17 | 1.60 | 1.77 | (0.17 | ) | (0.17 | ) | 12.90 | 15.86 | 59,522 | 0.11 | 0.37 | 1.44 | 49 | |||||||||||||||||||||||||||||||||||||
Core Market Strategy Fund |
| |||||||||||||||||||||||||||||||||||||||||||||||||||
Class A |
| |||||||||||||||||||||||||||||||||||||||||||||||||||
2015@ | $ | 11.66 | $ | 0.06 | $ | (0.77 | ) | $ | (0.71 | ) | $ | (0.06 | ) | $ | (0.06 | ) | $ | 10.89 | (6.13 | )% | $ | 106,400 | 0.35 | % | 0.61 | % | 1.03 | % | 11 | % | ||||||||||||||||||||||
2015 | 11.36 | 0.18 | 0.42 | 0.60 | (0.30 | ) | (0.30 | ) | 11.66 | 5.37 | 116,725 | 0.16 | 0.41 | 1.53 | 20 | |||||||||||||||||||||||||||||||||||||
2014 | 10.96 | 0.15 | 0.43 | 0.58 | (0.18 | ) | (0.18 | ) | 11.36 | 5.39 | 112,727 | 0.11 | 0.36 | 1.33 | 52 | |||||||||||||||||||||||||||||||||||||
2013 | 10.39 | 0.21 | 0.70 | 0.91 | (0.34 | ) | (0.34 | ) | 10.96 | 8.88 | 98,471 | 0.11 | 0.38 | 2.01 | 86 | |||||||||||||||||||||||||||||||||||||
2012 | 10.19 | 0.25 | 0.33 | 0.58 | (0.38 | ) | (0.38 | ) | 10.39 | 5.94 | 82,413 | 0.12 | 0.38 | 2.53 | 82 | |||||||||||||||||||||||||||||||||||||
2011 | 9.57 | 0.26 | 0.84 | 1.10 | (0.48 | ) | (0.48 | ) | 10.19 | 11.79 | 83,453 | 0.11 | 0.37 | 2.65 | 98 | |||||||||||||||||||||||||||||||||||||
| SEI Asset Allocation Trust / Semi-Annual Report / September 30, 2015 | 25 |
Financial Highlights
For six months ended September 30, 2015 (Unaudited) and the periods ended March 31,
For a Share Outstanding Throughout Each Period
| Net Asset Value, Beginning of Period | Net Investment Income* | Net Realized and Unrealized Gains (Losses) from Affiliated Funds* | Total from Operations | Dividends from Net Investment Income | Total Dividends and Distributions | Net Asset Value, End of Period | Total Return† | Net Assets End of Period ($ Thousands) | Ratio of to Average Net Assets***‡ | Ratio of to Average | Ratio of Net Investment Income to Average Net Assets | Portfolio Turnover Rate† | ||||||||||||||||||||||||||||||||||||||||
Core Market Strategy Fund (continued) |
| |||||||||||||||||||||||||||||||||||||||||||||||||||
Class I |
| |||||||||||||||||||||||||||||||||||||||||||||||||||
2015@ | $ | 12.16 | $ | 0.05 | $ | (0.80 | ) | $ | (0.75 | ) | $ | (0.04 | ) | $ | (0.04 | ) | $ | 11.37 | (6.16 | )% | $ | 542 | 0.60 | % | 0.87 | % | 0.78 | % | 11 | % | ||||||||||||||||||||||
2015 | 11.84 | 0.18 | 0.42 | 0.60 | (0.28 | ) | (0.28 | ) | 12.16 | 5.13 | 533 | 0.43 | 0.67 | 1.46 | 20 | |||||||||||||||||||||||||||||||||||||
2014 | 11.42 | 0.14 | 0.44 | 0.58 | (0.16 | ) | (0.16 | ) | 11.84 | 5.10 | 323 | 0.36 | 0.61 | 1.18 | 52 | |||||||||||||||||||||||||||||||||||||
2013 | 10.81 | 0.13 | 0.79 | 0.92 | (0.31 | ) | (0.31 | ) | 11.42 | 8.63 | 167 | 0.36 | 0.63 | 1.16 | 86 | |||||||||||||||||||||||||||||||||||||
2012 | 10.59 | 0.21 | 0.36 | 0.57 | (0.35 | ) | (0.35 | ) | 10.81 | 5.64 | 294 | 0.37 | 0.63 | 2.04 | 82 | |||||||||||||||||||||||||||||||||||||
2011 | 9.90 | 0.34 | 0.83 | 1.17 | (0.48 | ) | (0.48 | ) | 10.59 | 12.09 | 322 | 0.36 | 0.68 | 3.27 | 98 | |||||||||||||||||||||||||||||||||||||
Core Market Strategy Allocation Fund |
| |||||||||||||||||||||||||||||||||||||||||||||||||||
Class A |
| |||||||||||||||||||||||||||||||||||||||||||||||||||
2015@ | $ | 16.43 | $ | 0.06 | $ | (1.33 | ) | $ | (1.27 | ) | $ | (0.06 | ) | $ | (0.06 | ) | $ | 15.10 | (7.76 | )% | $ | 23,872 | 0.35 | % | 0.62 | % | 0.74 | % | 12 | % | ||||||||||||||||||||||
2015 | 15.53 | 0.16 | 0.90 | 1.06 | (0.16 | ) | (0.16 | ) | 16.43 | 6.86 | 26,896 | 0.17 | 0.41 | 0.99 | 15 | |||||||||||||||||||||||||||||||||||||
2014 | 13.17 | 0.16 | 2.37 | 2.53 | (0.17 | ) | (0.17 | ) | 15.53 | 19.32 | 22,919 | 0.11 | 0.36 | 1.09 | 49 | |||||||||||||||||||||||||||||||||||||
2013 | 11.93 | 0.20 | 1.24 | 1.44 | (0.20 | ) | (0.20 | ) | 13.17 | 12.21 | 19,034 | 0.11 | 0.38 | 1.63 | 43 | |||||||||||||||||||||||||||||||||||||
2012 | 11.68 | 0.17 | 0.25 | 0.42 | (0.17 | ) | (0.17 | ) | 11.93 | 3.77 | 16,618 | 0.12 | 0.38 | 1.49 | 52 | |||||||||||||||||||||||||||||||||||||
2011 | 10.26 | 0.15 | 1.43 | 1.58 | (0.16 | ) | (0.16 | ) | 11.68 | 15.54 | 18,188 | 0.11 | 0.37 | 1.44 | 50 | |||||||||||||||||||||||||||||||||||||
Market Growth Strategy Fund |
| |||||||||||||||||||||||||||||||||||||||||||||||||||
Class A |
| |||||||||||||||||||||||||||||||||||||||||||||||||||
2015@ | $ | 12.21 | $ | 0.05 | $ | (0.91 | ) | $ | (0.86 | ) | $ | (0.04 | ) | $ | (0.04 | ) | $ | 11.31 | (7.03 | )% | $ | 318,740 | 0.35 | % | 0.61 | % | 0.75 | % | 10 | % | ||||||||||||||||||||||
2015 | 11.91 | 0.16 | 0.49 | 0.65 | (0.35 | ) | (0.35 | ) | 12.21 | 5.49 | 360,251 | 0.16 | 0.41 | 1.31 | 20 | |||||||||||||||||||||||||||||||||||||
2014 | 11.27 | 0.12 | 0.69 | 0.81 | (0.17 | ) | (0.17 | ) | 11.91 | 7.27 | 355,359 | 0.11 | 0.36 | 1.08 | 50 | |||||||||||||||||||||||||||||||||||||
2013 | 10.60 | 0.19 | 0.78 | 0.97 | (0.30 | ) | (0.30 | ) | 11.27 | 9.36 | 355,650 | 0.11 | 0.38 | 1.77 | 85 | |||||||||||||||||||||||||||||||||||||
2012 | 10.47 | 0.22 | 0.26 | 0.48 | (0.35 | ) | (0.35 | ) | 10.60 | 4.83 | 391,812 | �� | 0.12 | 0.38 | 2.21 | 73 | ||||||||||||||||||||||||||||||||||||
2011 | 9.64 | 0.21 | 1.05 | 1.26 | (0.43 | ) | (0.43 | ) | 10.47 | 13.42 | 453,836 | 0.11 | 0.37 | 2.19 | 118 | |||||||||||||||||||||||||||||||||||||
Class D |
| |||||||||||||||||||||||||||||||||||||||||||||||||||
2015@ | $ | 12.17 | $ | — | $ | (0.91 | ) | $ | (0.91 | ) | $ | — | $ | — | $ | 11.26 | (7.47 | )% | $ | 5,875 | 1.10 | % | 1.37 | % | (0.01 | )% | 10 | % | ||||||||||||||||||||||||
2015 | 11.88 | 0.06 | 0.50 | 0.56 | (0.27 | ) | (0.27 | ) | 12.17 | 4.76 | 6,010 | 0.96 | 1.35 | 0.52 | 20 | |||||||||||||||||||||||||||||||||||||
2014 | 11.27 | 0.03 | 0.68 | 0.71 | (0.10 | ) | (0.10 | ) | 11.88 | 6.37 | 7,391 | 0.94 | 1.36 | 0.25 | 50 | |||||||||||||||||||||||||||||||||||||
2013 | 10.61 | 0.11 | 0.77 | 0.88 | (0.22 | ) | (0.22 | ) | 11.27 | 8.44 | 6,704 | 0.86 | 1.38 | 0.99 | 85 | |||||||||||||||||||||||||||||||||||||
2012 | 10.47 | 0.11 | 0.28 | 0.39 | (0.25 | ) | (0.25 | ) | 10.61 | 3.87 | 7,190 | 1.07 | 1.38 | 1.05 | 73 | |||||||||||||||||||||||||||||||||||||
2011** | 10.42 | 0.01 | 0.08 | 0.09 | (0.04 | ) | (0.04 | ) | 10.47 | 0.85 | 11,760 | 1.11 | 1.51 | 12.72 | 118 | |||||||||||||||||||||||||||||||||||||
Class I |
| |||||||||||||||||||||||||||||||||||||||||||||||||||
2015@ | $ | 12.04 | $ | 0.03 | $ | (0.90 | ) | $ | (0.87 | ) | $ | (0.03 | ) | $ | (0.03 | ) | $ | 11.14 | (7.25 | )% | $ | 9,944 | 0.60 | % | 0.87 | % | 0.51 | % | 10 | % | ||||||||||||||||||||||
2015 | 11.75 | 0.12 | 0.49 | 0.61 | (0.32 | ) | (0.32 | ) | 12.04 | 5.27 | 13,163 | 0.41 | 0.66 | 0.99 | 20 | |||||||||||||||||||||||||||||||||||||
2014 | 11.12 | 0.09 | 0.69 | 0.78 | (0.15 | ) | (0.15 | ) | 11.75 | 7.04 | 15,231 | 0.36 | 0.61 | 0.80 | 50 | |||||||||||||||||||||||||||||||||||||
2013 | 10.46 | 0.10 | 0.83 | 0.93 | (0.27 | ) | (0.27 | ) | 11.12 | 9.06 | 17,097 | 0.36 | 0.63 | 1.00 | 85 | |||||||||||||||||||||||||||||||||||||
2012 | 10.33 | 0.20 | 0.25 | 0.45 | (0.32 | ) | (0.32 | ) | 10.46 | 4.64 | 38,904 | 0.37 | 0.63 | 1.98 | 73 | |||||||||||||||||||||||||||||||||||||
2011 | 9.53 | 0.22 | 0.99 | 1.21 | (0.41 | ) | (0.41 | ) | 10.33 | 13.01 | 42,680 | 0.36 | 0.63 | 2.28 | 118 | |||||||||||||||||||||||||||||||||||||
Market Growth Strategy Allocation Fund |
| |||||||||||||||||||||||||||||||||||||||||||||||||||
Class A |
| |||||||||||||||||||||||||||||||||||||||||||||||||||
2015@ | $ | 19.79 | $ | 0.07 | $ | (1.60 | ) | $ | (1.53 | ) | $ | (0.07 | ) | $ | (0.07 | ) | $ | 18.19 | (7.75 | )% | $ | 119,383 | 0.35 | % | 0.61 | % | 0.75 | % | 6 | % | ||||||||||||||||||||||
2015 | 18.71 | 0.19 | 1.08 | 1.27 | (0.19 | ) | (0.19 | ) | 19.79 | 6.84 | 135,002 | 0.16 | 0.41 | 0.99 | 17 | |||||||||||||||||||||||||||||||||||||
2014 | 15.86 | 0.19 | 2.87 | 3.06 | (0.21 | ) | (0.21 | ) | 18.71 | 19.37 | 126,112 | 0.11 | 0.36 | 1.10 | 34 | |||||||||||||||||||||||||||||||||||||
2013 | 14.37 | 0.23 | 1.50 | 1.73 | (0.24 | ) | (0.24 | ) | 15.86 | 12.19 | 98,358 | 0.11 | 0.38 | 1.60 | 34 | |||||||||||||||||||||||||||||||||||||
2012 | 14.04 | 0.20 | 0.34 | 0.54 | (0.21 | ) | (0.21 | ) | 14.37 | 3.98 | 92,034 | 0.12 | 0.38 | 1.51 | 44 | |||||||||||||||||||||||||||||||||||||
2011 | 12.33 | 0.18 | 1.72 | 1.90 | (0.19 | ) | (0.19 | ) | 14.04 | 15.58 | 95,416 | 0.11 | 0.37 | 1.43 | 36 | |||||||||||||||||||||||||||||||||||||
| (1) | Amount represents less than $0.01 per share. |
| * | Per share calculations were performed using average shares. |
| ** | Class D commenced operations on March 31, 2011. All ratios have been annualized. |
| *** | The expense ratios do not include expenses of the underlying affiliated investment companies. |
| @ | For the six month period ended September 30, 2015. All ratios for the period have been annualized. |
| ^ | The amount shown for a share outstanding throughout the period does not accord with the aggregate net gains on investments for the period because of the sales and repurchases of fund shares in relation to fluctuating market value of the investments of the Fund. |
| † | Returns and portfolio turnover rate are for the period indicated and have not been annualized. Returns shown do not reflect the deduction of taxes that a shareholder would pay on Fund distributions or the redemption of Fund shares. |
| ‡ | The expense ratio includes Trustee and Proxy fees that are not subject to any voluntary expense waiver or reimbursement agreement. Had the fees been excluded the ratios would have been 0.10%, 1.10%, and 0.35% for classes A, D, and I respectively. |
Amounts designated as “—” are $0 or have been rounded to $0.
The accompanying notes are an integral part of the financial statements.
| 26 | SEI Asset Allocation Trust / Semi-Annual Report / September 30, 2015 |
Notes to Financial Statements (Unaudited)
September 30, 2015
1. ORGANIZATION
SEI Asset Allocation Trust (the “Trust”) is organized as a Massachusetts Business Trust under a Declaration of Trust dated November 20, 1995. The Trust is registered under the Investment Company Act of 1940, as amended (“1940 Act”), as an open-end investment company with twelve funds: Defensive Strategy Fund, Defensive Strategy Allocation Fund, Conservative Strategy Fund, Conservative Strategy Allocation Fund, Moderate Strategy Fund, Moderate Strategy Allocation Fund, Aggressive Strategy Fund, Tax- Managed Aggressive Strategy Fund, Core Market Strategy Fund, Core Market Strategy Allocation Fund, Market Growth Strategy Fund and Market Growth Strategy Allocation Fund (each a “Fund,” collectively the “Funds”). Each Fund is a “fund of funds” and offers shareholders the opportunity to invest in certain underlying affiliated investment companies, which are separately managed series of the following investment companies: SEI Daily Income Trust, SEI Institutional Managed Trust, SEI Institutional International Trust, and SEI Liquid Asset Trust. The Declaration of Trust permits the Trust to offer separate classes of shares in each Fund, as follows: Defensive Strategy Fund, Conservative Strategy Fund, Moderate Strategy Fund, Aggressive Strategy Fund, Core Market Strategy Fund and Market Growth Strategy Fund offer Class A, Class D and Class I Shares; Defensive Strategy Allocation Fund, Conservative Strategy Allocation Fund, Moderate Strategy Allocation Fund, Tax-Managed Aggressive Strategy Fund, Core Market Strategy Allocation Fund, and Market Growth Strategy Allocation Fund offer Class A Shares. The assets of each Fund are segregated, and a shareholder’s interest is limited to the Fund in which shares are held. The Trust’s prospectuses provide a description of each Fund’s investment objective and strategies.
As of September 30, 2015, the Class D shares of Defensive Strategy Fund and Core Market Strategy Fund had not yet commenced operations.
2. SIGNIFICANT ACCOUNTING POLICIES
The following is a summary of the significant accounting policies followed by the Funds.
Use of Estimates — The preparation of financial statements, in conformity with U.S. generally accepted accounting principles (“U.S. GAAP”), requires management to make estimates and assumptions that affect the reported amount of assets and liabilities and disclosure of contingent assets at the date of the financial statements, and the reported results of operations during the reporting period. Actual results could differ from those estimates.
Security Valuation — The assets of each Fund consist primarily of the investments in underlying affiliated investment companies, which are valued at their respective daily net asset values in accordance with Board-approved pricing procedures.
In accordance with U.S. GAAP, fair value is defined as the price that a Fund would receive upon selling an investment in an orderly transaction to an independent buyer in the principal or most advantageous
market of the investment. A three tier hierarchy has been established to maximize the use of observable and minimize the use of unobservable inputs and to establish classification of fair value measurements for disclosure purposes. Inputs refer broadly to the assumptions that market participants would use in pricing an asset. Inputs may be observable or unobservable. Observable inputs are inputs that reflect the assumptions market participants would use in pricing the asset or liability based on market data obtained from sources independent of the reporting entity. Unobservable inputs are inputs that reflect the reporting entity’s own assumptions about the assumptions market participants would use in pricing the asset or liability based on the best information available in the circumstances.
The three-tier hierarchy of inputs is summarized in the three broad Levels listed below:
Level 1 — quoted prices in active markets for identical investments
Level 2 — other significant observable inputs (including quoted prices for similar investments, interest rates, prepayment speeds, credit risks, etc.)
Level 3 — significant unobservable inputs (including the Fund’s own assumptions in determining the fair value of investments)
The valuation techniques used by the Funds to measure fair value during the six months ended September 30, 2015 maximized the use of observable inputs and minimized the use of unobservable inputs.
During the six months period ended September 30, 2015, there were no significant changes to the Trust’s fair valuation methodologies. For details of the investment classification, reference the Schedules of Investments.
Security Transactions and Related Income — Security transactions are accounted for on trade date. Dividend income received from the affiliated funds is recognized on the ex-dividend date and is recorded as income distributions in the Statement of Operations. Capital gain distributions received from the affiliated funds are recognized on ex-dividend date and are recorded on the Statement of Operations as such. Costs used in determining realized gains and losses on the sales of investment securities are on the basis of specific identification.
Expenses — Expenses that are directly related to one of the Funds are charged directly to that Fund. Other operating expenses of the Trust are allocated to the Funds on the basis of relative daily net assets.
Expenses included in the accompanying financial statements reflect the expenses of each Fund and do not include any expenses associated with the underlying funds.
Classes — Class-specific expenses are borne by that class of shares. Income, realized and unrealized gains/ losses and non-class-specific expenses are allocated to the respective classes on the basis of relative daily net assets.
Dividends and Distributions to Shareholders — Dividends and distributions to shareholders which are determined in accordance with
| SEI Asset Allocation Trust / Semi-Annual Report / September 30, 2015 | 27 |
Notes to Financial Statements (Unaudited) (Continued)
September 30, 2015
Federal tax regulations are recorded on the ex-dividend date. Distributions from net investment income are declared and paid to shareholders periodically for each Fund. Any net realized capital gain for each Fund is distributed to shareholders at least annually.
Forward Foreign Currency Contracts — To the extent consistent with its investment objective and strategies, a Fund may enter into forward foreign currency contracts as hedges against either specific transactions, fund positions or anticipated fund positions. A Fund may also engage in currency transactions to enhance that Fund’s returns. All commitments are “marked-to-market” daily at the applicable foreign exchange rate, and any resulting unrealized gains or losses are recorded currently. The Funds realize gains and losses at the time forward contracts are extinguished. Unrealized gains or losses on outstanding positions in forward foreign currency contracts held at the close of the period are recognized as ordinary income or loss for Federal income tax purposes. The Funds could be exposed to risk if the counterparties to the contracts are unable to meet the terms of the contract and from unanticipated movements in the value of a foreign currency relative to the U.S. dollar. Finally, the risk exists that losses could exceed amounts disclosed on the Statements of Assets and Liabilities. It is the Funds’ policy to present the gross unrealized appreciation and gross unrealized depreciation of the forward foreign currency contracts separately on the Statements of Assets and Liabilities, as the Funds do not have a master netting agreement with the counterparty to the forward foreign currency contracts. Refer to each Fund’s Schedule of Investments for details regarding open forward foreign currency contracts as of September 30, 2015, if applicable.
3. INVESTMENT ADVISORY, ADMINISTRATION AND DISTRIBUTION AGREEMENTS AND OTHER TRANSACTIONS WITH AFFILIATES
Investment Advisory, Administration and Distribution Agreements — SEI Investments Management Corporation (“SIMC”) serves as investment adviser (the “Adviser”) to each Fund. In connection with serving as Adviser, SIMC is entitled to a fee, which is calculated daily and paid monthly, based on each Fund’s average daily net assets.
SEI Investments Global Funds Services (the “Administrator”) provides the Trust with administrative and transfer agency services. For its services, the Administrator is entitled to a fee, which is calculated daily and paid monthly, based on the average daily net assets of each fund.
SEI Investments Distribution Co. (the “Distributor”), a wholly owned subsidiary of SEI Investments Company (“SEI”) and a registered broker-dealer, acts as the Distributor of the shares of the Trust. Pursuant to Rule 12b-1 under the 1940 Act, the Funds have adopted a distribution and shareholder services plan (the Distribution Plan) with respect to Class D Shares that allows Class D Shares to pay fees to service providers, based on average daily net assets of the Class D Shares, to compensate them for distribution services or shareholder services with respect to Class D Shares.
In addition, the Funds have adopted a shareholder services plan (the Service Plan) with respect to Class A, D and I Shares that allows such Shares to pay service providers a fee, based on average daily net assets of each respective Class of Shares, in connection with the ongoing servicing of shareholder accounts owning such Shares. The Funds have also adopted an administrative services plan and agreement (the “Administrative Service Plan”) with respect to Class I Shares that allows such Shares to pay service providers a fee, based on average daily net assets of the Class I Shares, in connection with ongoing administrative services for shareholder accounts owning such Shares.
The Funds’ Distribution, Service and Administrative Service Plans provide that distribution fees, shareholder service fees and administrative service fees, as applicable, will be paid to SIDCo., which may then be used by SIDCO to compensate financial intermediaries for providing distribution, shareholder services or administrative services with respect to the Shares.
The Adviser, Administrator and/or Distributor have voluntarily agreed to waive all or a portion of their fees in order to keep total annual fund operating expenses (exclusive of acquired fund fees and expenses, interest from borrowings, brokerage commissions, taxes, trustees fees and extraordinary expenses not incurred in the ordinary course of the Funds’ business) at a specified level. These waivers and reimbursements are voluntary and the Funds’ Adviser, Administrator and/or Distributor may discontinue all or part of any of these waivers at any time.
The Administrator, Distributor, and Adviser for the Trust serve in the same capacity for the underlying affiliated investment companies.
| 28 | SEI Asset Allocation Trust / Semi-Annual Report / September 30, 2015 |
The following is a summary of annual fees payable to the Adviser, Administrator and Distributor and the voluntary expense limitations for each Fund:
| Advisory Fees | Administration Fees | Shareholder Servicing Fees | Administrative Servicing Fees | Distribution Fees* | Voluntary Expense Limitations | |||||||||||||||||||
Defensive Strategy Fund | ||||||||||||||||||||||||
Class A | 0.10 | % | 0.20 | % | 0.25 | % | — | — | 0.21 | % | ||||||||||||||
Class I | 0.10 | % | 0.20 | % | 0.25 | % | 0.25 | % | — | 0.46 | % | |||||||||||||
Defensive Strategy Allocation Fund | ||||||||||||||||||||||||
Class A | 0.10 | % | 0.20 | % | 0.25 | % | — | — | 0.35 | % | ||||||||||||||
Conservative Strategy Fund | ||||||||||||||||||||||||
Class A | 0.10 | % | 0.20 | % | 0.25 | % | — | — | 0.26 | % | ||||||||||||||
Class D | 0.10 | % | 0.20 | % | 0.25 | % | — | 0.75 | % | 1.01 | % | |||||||||||||
Class I | 0.10 | % | 0.20 | % | 0.25 | % | 0.25 | % | 0.51 | % | ||||||||||||||
Conservative Strategy Allocation Fund | ||||||||||||||||||||||||
Class A | 0.10 | % | 0.20 | % | 0.25 | % | — | — | 0.35 | % | ||||||||||||||
Moderate Strategy Fund | ||||||||||||||||||||||||
Class A | 0.10 | % | 0.20 | % | 0.25 | % | — | — | 0.31 | % | ||||||||||||||
Class D | 0.10 | % | 0.20 | % | 0.25 | % | — | 0.75 | % | 1.06 | % | |||||||||||||
Class I | 0.10 | % | 0.20 | % | 0.25 | % | 0.25 | % | — | 0.56 | % | |||||||||||||
Moderate Strategy Allocation Fund | ||||||||||||||||||||||||
Class A | 0.10 | % | 0.20 | % | 0.25 | % | — | — | 0.35 | % | ||||||||||||||
Aggressive Strategy Fund | ||||||||||||||||||||||||
Class A | 0.10 | % | 0.20 | % | 0.25 | % | — | — | 0.35 | % | ||||||||||||||
Class D | 0.10 | % | 0.20 | % | 0.25 | % | — | 0.75 | % | 1.10 | % | |||||||||||||
Class I | 0.10 | % | 0.20 | % | 0.25 | % | 0.25 | % | — | 0.60 | % | |||||||||||||
Tax-Managed Aggressive Strategy Fund | ||||||||||||||||||||||||
Class A | 0.10 | % | 0.20 | % | 0.25 | % | — | — | 0.35 | % | ||||||||||||||
Core Market Strategy Fund | ||||||||||||||||||||||||
Class A | 0.10 | % | 0.20 | % | 0.25 | % | — | — | 0.35 | % | ||||||||||||||
Class I | 0.10 | % | 0.20 | % | 0.25 | % | 0.25 | % | — | 0.60 | % | |||||||||||||
Core Market Strategy Allocation Fund | ||||||||||||||||||||||||
Class A | 0.10 | % | 0.20 | % | 0.25 | % | — | — | 0.35 | % | ||||||||||||||
Market Growth Strategy Fund | ||||||||||||||||||||||||
Class A | 0.10 | % | 0.20 | % | 0.25 | % | — | — | 0.35 | % | ||||||||||||||
Class D | 0.10 | % | 0.20 | % | 0.25 | % | — | 0.75 | % | 1.10 | % | |||||||||||||
Class I | 0.10 | % | 0.20 | % | 0.25 | % | 0.25 | % | — | 0.60 | % | |||||||||||||
Market Growth Strategy Allocation Fund | ||||||||||||||||||||||||
Class A | 0.10 | % | 0.20 | % | 0.25 | % | — | — | 0.35 | % | ||||||||||||||
| * | These payments are characterized as “compensation” and are not directly tied to expenses incurred by the Distributor. The payments the Distributor receives during any year may therefore be higher or lower than its actual expenses. |
Interfund Lending — The SEC has granted an exemption that permits the Trust to participate in an interfund lending program (the “Program”) with existing or future investment companies registered under the 1940 Act that are advised by SIMC (the “SEI Funds”). The Program allows the SEI Funds to lend money to and borrow money from each other for temporary or emergency purposes. Participation in the Program is voluntary for both borrowing and lending funds. Interfund loans may be made only when the rate of interest to be charged is more favorable to the lending fund than an investment in overnight repurchase agreements (“Repo Rate”), and more favorable to the borrowing fund than the rate of interest that would be charged by a bank for short-term borrowings (“Bank Loan Rate”). The Bank Loan Rate will be determined using a formula reviewed annually by the SEI Funds’ Board of Trustees. The interest rate imposed on inter fund loans is the average of the Repo Rate and the Bank Loan Rate.
The Trust did not utilize the Program as of and for the six months ended September 30, 2015.
Other — Certain officers and Trustees of the Trust are also officers and/or Directors of the Administrator, the Adviser and/or the Distributor. The Trust pays each unaffiliated Trustee an annual fee for attendance at quarterly, interim, and committee meetings. The Administrator or the Adviser pays compensation of officers and affiliated Trustees.
A portion of the services provided by the Chief Compliance Officer (“CCO”) and his staff, whom are employees of the Administrator, are paid for by the Trust as incurred. The services include regulatory oversight of the Trust’s Adviser and service providers as required by SEC regulations.
| SEI Asset Allocation Trust / Semi-Annual Report / September 30, 2015 | 29 |
Notes to Financial Statements (Unaudited) (Continued)
September 30, 2015
4. CAPITAL SHARE TRANSACTIONS
Capital Share Transactions for the Funds were as follows (Thousands):
For the six month period ended September 30, 2015 (Unaudited) and the year ended March 31, 2015
| Defensive Strategy Fund | Defensive Strategy Allocation Fund | Conservative Strategy Fund | Conservative Strategy Allocation Fund | |||||||||||||||||||||||||||||
| 4/01/15 – 9/30/15 | 4/01/14 – 3/31/15 | 4/01/15 – 9/30/15 | 4/01/14 – 3/31/15 | 4/01/15 – 9/30/15 | 4/01/14 – 3/31/15 | 4/01/15 – 9/30/15 | 4/01/14 – 3/31/15 | |||||||||||||||||||||||||
Shares Issued and Redeemed: | ||||||||||||||||||||||||||||||||
Class A: | ||||||||||||||||||||||||||||||||
Shares Issued | 445 | 1,012 | 75 | 184 | 558 | 1,571 | 269 | 634 | ||||||||||||||||||||||||
Shares Issued in Lieu of Cash Distributions | 12 | 49 | 9 | 21 | 49 | 186 | 35 | 90 | ||||||||||||||||||||||||
Shares Redeemed | (730 | ) | (1,510 | ) | (161 | ) | (288 | ) | (1,305 | ) | (3,041 | ) | (347 | ) | (766 | ) | ||||||||||||||||
Total Class A Transactions | (273 | ) | (449 | ) | (77 | ) | (83 | ) | (698 | ) | (1,284 | ) | (43 | ) | (42 | ) | ||||||||||||||||
Class D: | ||||||||||||||||||||||||||||||||
Shares Issued | N/A | N/A | N/A | N/A | 24 | 48 | N/A | N/A | ||||||||||||||||||||||||
Shares Issued in Lieu of Cash Distributions | N/A | N/A | N/A | N/A | 1 | 6 | N/A | N/A | ||||||||||||||||||||||||
Shares Redeemed | N/A | N/A | N/A | N/A | (62 | ) | (48 | ) | N/A | N/A | ||||||||||||||||||||||
Total Class D Transactions | N/A | N/A | N/A | N/A | (37 | ) | 6 | N/A | N/A | |||||||||||||||||||||||
Class I: | ||||||||||||||||||||||||||||||||
Shares Issued | 22 | 69 | N/A | N/A | 27 | 79 | N/A | N/A | ||||||||||||||||||||||||
Shares Issued in Lieu of Cash Distributions | 1 | 5 | N/A | N/A | 2 | 8 | N/A | N/A | ||||||||||||||||||||||||
Shares Redeemed | (25 | ) | (214 | ) | N/A | N/A | (69 | ) | (136 | ) | N/A | N/A | ||||||||||||||||||||
Total Class I Transactions | (2 | ) | (140 | ) | N/A | N/A | (40 | ) | (49 | ) | N/A | N/A | ||||||||||||||||||||
Decrease in Capital Shares | (275 | ) | (589 | ) | (77 | ) | (83 | ) | (775 | ) | (1,327 | ) | (43 | ) | (42 | ) | ||||||||||||||||
Moderate Strategy Fund | Moderate Strategy Allocation Fund | Aggressive Strategy Fund | Tax-Managed Aggressive Strategy Fund | |||||||||||||||||||||||||||||
4/01/15 – 9/30/15 | 4/01/14 – 3/31/15 | 4/01/15 – 9/30/15 | 4/01/14 – 3/31/15 | 4/01/15 – 9/30/15 | 4/01/14 – 3/31/15 | 4/01/15 – 9/30/15 | 4/01/14 – 3/31/15 | |||||||||||||||||||||||||
Shares Issued and Redeemed: | ||||||||||||||||||||||||||||||||
Class A: | ||||||||||||||||||||||||||||||||
Shares Issued | 1,339 | 3,516 | 391 | 1,076 | 1,090 | 2,586 | 186 | 441 | ||||||||||||||||||||||||
Shares Issued in Lieu of Cash Distributions | 106 | 636 | 39 | 120 | 49 | 538 | 13 | 35 | ||||||||||||||||||||||||
Shares Redeemed | (2,402 | ) | (3,959 | ) | (479 | ) | (934 | ) | (1,696 | ) | (4,114 | ) | (358 | ) | (445 | ) | ||||||||||||||||
Total Class A Transactions | (957 | ) | 193 | (49 | ) | 262 | (557 | ) | (990 | ) | (159 | ) | 31 | |||||||||||||||||||
Class D: | ||||||||||||||||||||||||||||||||
Shares Issued | 79 | 41 | N/A | N/A | 76 | 117 | N/A | N/A | ||||||||||||||||||||||||
Shares Issued in Lieu of Cash Distributions | — | 6 | N/A | N/A | — | 24 | N/A | N/A | ||||||||||||||||||||||||
Shares Redeemed | (47 | ) | (61 | ) | N/A | N/A | (17 | ) | (156 | ) | N/A | N/A | ||||||||||||||||||||
Total Class D Transactions | 32 | (14 | ) | N/A | N/A | 59 | (15 | ) | N/A | N/A | ||||||||||||||||||||||
Class I: | ||||||||||||||||||||||||||||||||
Shares Issued | 61 | 143 | N/A | N/A | 229 | 304 | N/A | N/A | ||||||||||||||||||||||||
Shares Issued in Lieu of Cash Distributions | 2 | 18 | N/A | N/A | 4 | 68 | N/A | N/A | ||||||||||||||||||||||||
Shares Redeemed | (99 | ) | (291 | ) | N/A | N/A | (418 | ) | (1,097 | ) | N/A | N/A | ||||||||||||||||||||
Total Class I Transactions | (36 | ) | (130 | ) | N/A | N/A | (185 | ) | (725 | ) | N/A | N/A | ||||||||||||||||||||
Increase (Decrease) in Capital Shares | (961 | ) | 49 | (49 | ) | 262 | (683 | ) | (1,730 | ) | (159 | ) | 31 | |||||||||||||||||||
Amounts designated as “—” are zero or have been rounded to zero.
N/A — Not applicable. Class D and Class I shares currently not offered.
| 30 | SEI Asset Allocation Trust / Semi-Annual Report / September 30, 2015 |
Core Market | Core Market Strategy Allocation Fund | Market Growth Strategy Fund | Market Growth | |||||||||||||||||||||||||||||
| 4/01/15 – 9/30/15 | 4/01/14 – 3/31/15 | 4/01/15 – 9/30/15 | 4/01/14 – 3/31/15 | 4/01/15 – 9/30/15 | 4/01/14 – 3/31/15 | 4/01/15 – 9/30/15 | 4/01/14 – 3/31/15 | |||||||||||||||||||||||||
Shares Issued and Redeemed: | ||||||||||||||||||||||||||||||||
Class A: | ||||||||||||||||||||||||||||||||
Shares Issued | 562 | 2,034 | 202 | 374 | 1,548 | 4,430 | 463 | 1,266 | ||||||||||||||||||||||||
Shares Issued in Lieu of Cash Distributions | 40 | 211 | 6 | 16 | 101 | 795 | 23 | 63 | ||||||||||||||||||||||||
Shares Redeemed | (850 | ) | (2,155 | ) | (264 | ) | (229 | ) | (2,949 | ) | (5,574 | ) | (742 | ) | (1,250 | ) | ||||||||||||||||
Total Class A Transactions | (248 | ) | 90 | (56 | ) | 161 | (1,300 | ) | (349 | ) | (256 | ) | 79 | |||||||||||||||||||
Class D: | ||||||||||||||||||||||||||||||||
Shares Issued | N/A | N/A | N/A | N/A | 32 | 45 | N/A | N/A | ||||||||||||||||||||||||
Shares Issued in Lieu of Cash Distributions | N/A | N/A | N/A | N/A | — | 11 | N/A | N/A | ||||||||||||||||||||||||
Shares Redeemed | N/A | N/A | N/A | N/A | (4 | ) | (184 | ) | N/A | N/A | ||||||||||||||||||||||
Total Class D Transactions | N/A | N/A | N/A | N/A | 28 | (128 | ) | N/A | N/A | |||||||||||||||||||||||
Class I: | ||||||||||||||||||||||||||||||||
Shares Issued | 18 | 21 | N/A | N/A | 58 | 124 | N/A | N/A | ||||||||||||||||||||||||
Shares Issued in Lieu of Cash Distributions | — | 1 | N/A | N/A | 2 | 29 | N/A | N/A | ||||||||||||||||||||||||
Shares Redeemed | (14 | ) | (5 | ) | N/A | N/A | (261 | ) | (357 | ) | N/A | N/A | ||||||||||||||||||||
Total Class I Transactions | 4 | 17 | N/A | N/A | (201 | ) | (204 | ) | N/A | N/A | ||||||||||||||||||||||
Increase (Decrease) in Capital Shares | (244 | ) | 107 | (56 | ) | 161 | (1,473 | ) | (681 | ) | (256 | ) | 79 | |||||||||||||||||||
Amounts designated as “—” are zero or have been rounded to zero.
N/A — Not applicable. Class D and Class I shares currently not offered.
5. INVESTMENT TRANSACTIONS
The cost of security purchases and the proceeds from the sale of securities during the period ended September 30, 2015, were as follows ($ Thousands):
| Total | ||||
Defensive Strategy Fund | ||||
Purchases | $ | 4,537 | ||
Sales | 6,616 | |||
Defensive Strategy Allocation Fund | ||||
Purchases | 1,202 | |||
Sales | 2,304 | |||
Conservative Strategy Fund | ||||
Purchases | 12,326 | |||
Sales | 19,401 | |||
Conservative Strategy Allocation Fund | ||||
Purchases | 4,628 | |||
Sales | 5,062 | |||
Moderate Strategy Fund | ||||
Purchases | 21,943 | |||
Sales | 32,984 | |||
Moderate Strategy Allocation Fund | ||||
Purchases | 5,717 | |||
Sales | 6,411 | |||
Aggressive Strategy Fund | ||||
Purchases | 40,055 | |||
Sales | 48,871 | |||
Tax-Managed Aggressive Strategy Fund | ||||
Purchases | 3,756 | |||
Sales | 6,460 | |||
Core Market Strategy Fund | ||||
Purchases | 11,900 | |||
Sales | 14,758 | |||
Core Market Strategy Allocation Fund | ||||
Purchases | 3,064 | |||
Sales | 3,904 | |||
Market Growth Strategy Fund | ||||
Purchases | 38,045 | |||
Sales | 55,557 | |||
Market Growth Strategy Allocation Fund | ||||
Purchases | 8,466 | |||
Sales | 13,480 | |||
6. FEDERAL TAX INFORMATION
It is each Fund’s intention to continue to qualify as a regulated investment company under Subchapter M of the Internal Revenue Code for Federal income tax purposes and distribute all of its taxable income (including net capital gains). Accordingly, no provision for Federal income taxes is required.
It is each Fund’s intention to continue to qualify as a regulated investment company under Subchapter M of the Internal Revenue Code for Federal income tax purposes and distribute all of its taxable income (including net capital gains). Accordingly, no provision for Federal income taxes is required.
Reclassification of Components of Net Assets — The timing and characterization of certain income and capital gains distributions are determined annually in accordance with Federal tax regulations which may differ from accounting principles generally accepted in the United States of America. As a result, net investment income (loss) and net realized gain (loss) on investment transactions for a reporting period may differ significantly from distributions during such period. These book/tax differences may be temporary or permanent in nature. To the extent these differences are permanent, they are charged or credited to paid-in capital, accumulated net realized gain (loss) or undistributed net investment income (loss), as appropriate, in the period that the differences arise.
| SEI Asset Allocation Trust / Semi-Annual Report / September 30, 2015 | 31 |
Notes to Financial Statements (Unaudited) (Continued)
September 30, 2015
Accordingly, the following permanent differences, primarily attributable to the re-classification of short-term capital gains received from affiliated funds and foreign exchange gain/loss have been reclassified to/from the following accounts as of March 31, 2015 ($ Thousands):
| Undistributed Net Investment Income | Accumulated Net | Paid-in- Capital | ||||||||||
Defensive Strategy Fund | $ | 204 | $ | (204 | ) | $ | — | |||||
Defensive Strategy Allocation Fund | 110 | (110 | ) | — | ||||||||
Conservative Strategy Fund | 811 | (811 | ) | — | ||||||||
Conservative Strategy Allocation Fund | 554 | (554 | ) | — | ||||||||
Moderate Strategy Fund | 4,272 | (4,272 | ) | — | ||||||||
Moderate Strategy Allocation Fund | 1,115 | (1,115 | ) | — | ||||||||
Aggressive Strategy Fund | 7,170 | (7,170 | ) | — | ||||||||
Tax-Managed Aggressive Strategy Fund | 30 | (30 | ) | — | ||||||||
Core Market Strategy Fund | 2,234 | (2,234 | ) | — | ||||||||
Core Market Strategy Allocation Fund | 13 | (13 | ) | — | ||||||||
Market Growth Strategy Fund | 8,125 | (8,125 | ) | — | ||||||||
Market Growth Strategy Allocation Fund | 63 | (63 | ) | — | ||||||||
The tax character of dividends and distributions declared during the years ended March 31, 2015 and March 31, 2014 were as follows ($ Thousands):
| Ordinary Income | Totals | |||||||||||||||
| 2015 | 2014 | 2015 | 2014 | |||||||||||||
Defensive Strategy Fund | $ | 542 | $ | 431 | $ | 542 | $ | 431 | ||||||||
Defensive Strategy Allocation Fund | 327 | 390 | 327 | 390 | ||||||||||||
Conservative Strategy Fund | 2,227 | 2,215 | 2,227 | 2,215 | ||||||||||||
Conservative Strategy Allocation Fund | 1,450 | 1,373 | 1,450 | 1,373 | ||||||||||||
Moderate Strategy Fund | 8,048 | 5,584 | 8,048 | 5,584 | ||||||||||||
Moderate Strategy Allocation Fund | 2,483 | 1,973 | 2,483 | 1,973 | ||||||||||||
Aggressive Strategy Fund | 8,756 | 4,969 | 8,756 | 4,969 | ||||||||||||
Tax-Managed Aggressive Strategy Fund | 633 | 630 | 633 | 630 | ||||||||||||
Core Market Strategy Fund | 3,026 | 1,741 | 3,026 | 1,741 | ||||||||||||
Core Market Strategy Allocation Fund | 255 | 252 | 255 | 252 | ||||||||||||
Market Growth Strategy Fund | 10,593 | 5,591 | 10,593 | 5,591 | ||||||||||||
Market Growth Strategy Allocation Fund | 1,317 | 1,364 | 1,317 | 1,364 | ||||||||||||
As of March 31, 2015, the components of Distributable Earnings (Accumulated Losses) on a tax basis were as follows ($ Thousands):
| Undistributed Ordinary Income | Undistributed Long-Term Capital Gain | Capital Loss Carryforwards | Post-October Losses | Other Temporary Differences | Unrealized Appreciation | Total Distributable Earnings/ (Accumulated Losses) | ||||||||||||||||||||||
Defensive Strategy Fund | $ | 50 | $ | — | $ | (4,301 | ) | $ | (3 | ) | $ | — | $ | 565 | $ | (3,689 | ) | |||||||||||
Defensive Strategy Allocation Fund | 45 | — | (851 | ) | — | — | 1,416 | 610 | ||||||||||||||||||||
Conservative Strategy Fund | 477 | — | (18,549 | ) | — | 3 | 4,596 | (13,473 | ) | |||||||||||||||||||
Conservative Strategy Allocation Fund | 162 | — | (1,564 | ) | — | 1 | 9,997 | �� | 8,596 | |||||||||||||||||||
Moderate Strategy Fund | 1,796 | — | (55,302 | ) | — | (41 | ) | 12,691 | (40,856 | ) | ||||||||||||||||||
Moderate Strategy Allocation Fund | 150 | — | (2,948 | ) | — | (1 | ) | 20,649 | 17,850 | |||||||||||||||||||
Aggressive Strategy Fund | 2,443 | — | (125,066 | ) | — | (136 | ) | 44,713 | (78,046 | ) | ||||||||||||||||||
Tax-Managed Aggressive Strategy Fund | 15 | — | (16,719 | ) | — | 1 | 25,835 | 9,132 | ||||||||||||||||||||
Core Market Strategy Fund | 1,143 | — | (3,048 | ) | — | (43 | ) | 4,942 | 2,994 | |||||||||||||||||||
Core Market Strategy Allocation Fund | 6 | — | (3,707 | ) | — | 1 | 9,984 | 6,284 | ||||||||||||||||||||
Market Growth Strategy Fund | 3,046 | — | (142,158 | ) | — | (167 | ) | 37,556 | (101,723 | ) | ||||||||||||||||||
Market Growth Strategy Allocation Fund | 31 | — | (30,080 | ) | — | 1 | 50,365 | 20,317 | ||||||||||||||||||||
Post-October losses represent losses realized on investments from November 1, 2014 through March 31, 2015 that, in accordance with Federal income tax regulations, the Funds defer and treat as having arisen in the following fiscal year.
| 32 | SEI Asset Allocation Trust / Semi-Annual Report / September 30, 2015 |
The Funds had capital loss carryforwards at March 31, 2014 as follows ($ Thousands):
| Years Expiring | Amounts | |||||||
Defensive Strategy Fund | 2019 | $ | 126 | |||||
| 2018 | 1,458 | |||||||
| 2017 | 2,717 | |||||||
|
| |||||||
| $ | 4,301 | |||||||
|
| |||||||
Defensive Strategy Allocation Fund | 2019 | $ | 608 | |||||
| 2018 | 243 | |||||||
|
| |||||||
| $ | 851 | |||||||
|
| |||||||
Conservative Strategy Fund | 2019 | $ | 783 | |||||
| 2018 | 7,821 | |||||||
| 2017 | 9,945 | |||||||
|
| |||||||
| $ | 18,549 | |||||||
|
| |||||||
Conservative Strategy Allocation Fund | 2018 | $ | 1,564 | |||||
|
| |||||||
Moderate Strategy Fund | 2019 | $ | 8,241 | |||||
| 2018 | 44,294 | |||||||
| 2017 | 2,767 | |||||||
|
| |||||||
| $ | 55,302 | |||||||
|
| |||||||
Moderate Strategy Allocation Fund | 2019 | $ | 2,948 | |||||
|
| |||||||
Aggressive Strategy Fund | 2018 | $ | 103,141 | |||||
| 2017 | 21,925 | |||||||
|
| |||||||
| $ | 125,066 | |||||||
|
| |||||||
Tax-Managed Aggressive Strategy Fund | 2018 | $ | 16,719 | |||||
|
| |||||||
Core Market Strategy Fund | 2018 | $ | 3,048 | |||||
|
| |||||||
Core Market Strategy Allocation Fund | 2018 | $ | 3,707 | |||||
|
| |||||||
Market Growth Strategy Fund | 2019 | $ | 1,511 | |||||
| 2018 | 127,490 | |||||||
| 2017 | 13,157 | |||||||
|
| |||||||
| $ | 142,158 | |||||||
|
| |||||||
Market Growth Strategy Allocation Fund | 2019 | $ | 1,088 | |||||
| 2018 | 28,992 | |||||||
|
| |||||||
| $ | 30,080 | |||||||
|
| |||||||
For Federal income tax purposes, the capital loss carryforwards may be carried forward and applied against future capital gains. It is the Funds’ intent that they will not distribute any realized gain distributions until the carryforwards have been offset or expired. The Funds’ use of capital loss carryforwards acquired by Conservative Strategy Fund, Moderate Strategy Fund, Aggressive Strategy Fund and Market Growth Strategy Fund are subject to annual limitations.
During the fiscal year ended March 31, 2015, the following Funds utilized capital loss carryforwards to offset capital gains ($ Thousands):
| Utilized Capital Loss Carryfowards | ||||
Defensive Strategy Fund | $ | 839 | ||
Defensive Strategy Allocation Fund | 1,161 | |||
Conservative Strategy Fund | 3,793 | |||
Conservative Strategy Allocation Fund | 5,650 | |||
Moderate Strategy Fund | 9,791 | |||
Moderate Strategy Allocation Fund | 7,128 | |||
Aggressive Strategy Fund | 24,342 | |||
Tax Managed Aggressive Strategy Fund | 3,536 | |||
Core Market Strategy Fund | 5,599 | |||
Core Market Strategy Allocation Fund | 1,332 | |||
Market Growth Strategy Fund | 20,774 | |||
Market Growth Strategy Allocation Fund | 8,504 | |||
The Federal tax cost and aggregate gross unrealized appreciation and depreciation on investments held by the Funds at September 30, 2015, were as follows ($ Thousands):
Federal Tax Cost | Appreciated Securities | Depreciated Securities | Net (Depreciation) | |||||||||||||
Defensive Strategy Fund | $ | 35,329 | $ | 463 | $ | (398 | ) | $ | 65 | |||||||
Defensive Strategy Allocation Fund | 7,676 | 856 | (411 | ) | 445 | |||||||||||
Conservative Strategy Fund | 104,346 | 4,317 | (2,135 | ) | 2,182 | |||||||||||
Conservative Strategy Allocation Fund | 35,199 | 6,620 | (1,062 | ) | 5,558 | |||||||||||
Moderate Strategy Fund | 249,769 | 12,105 | (9,860 | ) | 2,245 | |||||||||||
Moderate Strategy Allocation Fund | 72,490 | 17,490 | (2,186 | ) | 15,304 | |||||||||||
Aggressive Strategy Fund | 262,469 | 23,649 | (14,951 | ) | 8,698 | |||||||||||
Tax-Managed Aggressive Strategy Fund | 38,296 | 18,886 | (1,225 | ) | 17,661 | |||||||||||
Core Market Strategy Fund | 109,877 | 2,982 | (5,876 | ) | (2,894 | ) | ||||||||||
Core Market Strategy Allocation Fund | 17,758 | 6,839 | (717 | ) | 6,122 | |||||||||||
Market Growth Strategy Fund | 335,550 | 18,690 | (19,541 | ) | (851 | ) | ||||||||||
Market Growth Strategy Allocation Fund | 84,435 | 38,080 | (3,084 | ) | 34,996 | |||||||||||
7. INDEMNIFICATIONS
In the normal course of business, a Fund may enter into contracts that provide general indemnifications by a Fund to the counterparty of the contract. A Fund’s maximum exposure under these arrangements is dependent on future claims that may be made against a Fund and, therefore, cannot be established; however, based on experience, management believes the risk of loss from such claims is considered remote.
| SEI Asset Allocation Trust / Semi-Annual Report / September 30, 2015 | 33 |
Notes to Financial Statements (Unaudited) (Concluded)
September 30, 2015
8. CONCENTRATION RISK
The Underlying SEI Funds and other investment companies and exchange traded products in which the Funds invest may apply any of a variety of investment strategies and may invest in a broad range of asset classes, securities and other investments to attempt to achieve their designated investment goals. The foregoing is not intended to be a complete discussion of all risks associated with the investment strategies of the Funds. Please refer to each current prospectus for a discussion of the risks associated with investing in the Funds.
9. SUBSEQUENT EVENTS
The Trust, on behalf of the Funds, has evaluated the need for dis-closures and/or adjustments resulting from subsequent events. Based on this evaluation, no disclosures and/or adjustments were required to the financial statements through the date of issuance.
| 34 | SEI Asset Allocation Trust / Semi-Annual Report / September 30, 2015 |
SEI ASSET ALLOCATION TRUST — September 30, 2015
Disclosure of Fund Expenses (Unaudited)
All mutual funds have operating expenses. As a shareholder of a fund, your investment is affected by these ongoing costs, which include (among others) costs for portfolio management, administrative services, and shareholder reports like this one. It is important for you to understand the impact of these costs on your investment returns.
Operating expenses such as these are deducted from the fund’s gross income and directly reduce your final investment return. These expenses are expressed as a percentage of the fund’s average net assets; this percentage is known as the fund’s expense ratio.
The following examples use the expense ratio and are intended to help you understand the ongoing costs (in dollars) of investing in your fund and to compare these costs with those of other mutual funds. The examples are based on an investment of $1,000 made at the beginning of the period shown and held for the entire period from April 1, 2015 to September 30, 2015.
The table on this page illustrates your fund’s costs in two ways:
• Actual fund return. This section helps you to estimate the actual expenses after fee waivers that your Fund incurred over the period. The “Expenses Paid During Period” column shows the actual dollar expense cost incurred by a $1,000 investment in the Fund, and the “Ending Account Value” number is derived from deducting that expense cost from the Fund’s gross investment return.
You can use this information, together with the actual amount you invested in the Fund, to estimate the expenses you paid over that period. Simply divide your actual account value by $1,000 to arrive at a ratio (for example, an $8,600 account value divided by $1,000 = 8.6), then multiply that ratio by the number shown for your Fund under “Expenses Paid During Period.”
• Hypothetical 5% return. This section helps you compare your Fund’s costs with those of other mutual funds. It assumes that the fund had an annual 5% return before expenses during the year, but that the expense ratio (Column 3) for the period is unchanged. This example is useful in making comparisons because the Securities and Exchange Commission requires all mutual funds to make this 5% calculation. You can assess your Fund’s comparative cost by comparing the hypothetical result for your Fund in the “Expense Paid During Period” column with those that appear in the same charts in the shareholder reports for other funds.
NOTE: Because the return is set at 5% for comparison purposes — NOT your Fund’s actual return — the account values shown may not apply to your specific investment.
| Beginning Account Value 4/1/15 | Ending Account Value 9/30/15 | Annualized Expense Ratios | Expenses Paid During Period* | |||||||||||||
Defensive Strategy Fund |
| |||||||||||||||
Actual Fund Return |
| |||||||||||||||
Class A | $ | 1,000.00 | $ | 993.30 | 0.21 | % | $ | 1.06 | ||||||||
Class I | 1,000.00 | 991.90 | 0.46 | 2.31 | ||||||||||||
Hypothetical 5% Return |
| |||||||||||||||
Class A | $ | 1,000.00 | $ | 1,023.94 | 0.21 | % | $ | 1.08 | ||||||||
Class I | 1,000.00 | 1,022.68 | 0.46 | 2.34 | ||||||||||||
Defensive Strategy Allocation Fund |
| |||||||||||||||
Actual Fund Return |
| |||||||||||||||
Class A | $ | 1,000.00 | $ | 951.20 | 0.35 | % | $ | 1.72 | ||||||||
Hypothetical 5% Return |
| |||||||||||||||
Class A | $ | 1,000.00 | $ | 1,023.24 | 0.35 | % | $ | 1.78 | ||||||||
Conservative Strategy Fund |
| |||||||||||||||
Actual Fund Return |
| |||||||||||||||
Class A | $ | 1,000.00 | $ | 986.10 | 0.26 | % | $ | 1.30 | ||||||||
Class D | 1,000.00 | 981.30 | 1.01 | 5.03 | ||||||||||||
Class I | 1,000.00 | 984.10 | 0.51 | 2.55 | ||||||||||||
Hypothetical 5% Return |
| |||||||||||||||
Class A | $ | 1,000.00 | $ | 1,023.69 | 0.26 | % | $ | 1.33 | ||||||||
Class D | 1,000.00 | 1,019.68 | 1.01 | 5.12 | ||||||||||||
Class I | 1,000.00 | 1,022.43 | 0.51 | 2.59 | ||||||||||||
| Beginning Account Value 4/1/15 | Ending Account Value 9/30/15 | Annualized Expense Ratios | Expenses Paid During Period* | |||||||||||||
Conservative Strategy Allocation Fund |
| |||||||||||||||
Actual Fund Return |
| |||||||||||||||
Class A | $ | 1,000.00 | $ | 950.00 | 0.35 | % | $ | 1.72 | ||||||||
Hypothetical 5% Return |
| |||||||||||||||
Class A | $ | 1,000.00 | $ | 1,023.24 | 0.35 | % | $ | 1.78 | ||||||||
Moderate Strategy Fund |
| |||||||||||||||
Actual Fund Return |
| |||||||||||||||
Class A | $ | 1,000.00 | $ | 969.00 | 0.31 | % | $ | 1.54 | ||||||||
Class D | 1,000.00 | 965.20 | 1.06 | 5.23 | ||||||||||||
Class I | 1,000.00 | 966.80 | 0.56 | 2.77 | ||||||||||||
Hypothetical 5% Return |
| |||||||||||||||
Class A | $ | 1,000.00 | $ | 1,023.44 | 0.31 | % | $ | 1.58 | ||||||||
Class D | 1,000.00 | 1,019.68 | 1.06 | 5.38 | ||||||||||||
Class I | 1,000.00 | 1,022.18 | 0.56 | 2.85 | ||||||||||||
Moderate Strategy Allocation Fund |
| |||||||||||||||
Actual Fund Return |
| |||||||||||||||
Class A | $ | 1,000.00 | $ | 944.90 | 0.35 | % | $ | 1.72 | ||||||||
Hypothetical 5% Return |
| |||||||||||||||
Class A | $ | 1,000.00 | $ | 1,023.24 | 0.35 | % | $ | 1.78 | ||||||||
| SEI Asset Allocation Trust / Semi-Annual Report / September 30, 2015 | 35 |
Disclosure of Fund Expenses (Unaudited) (Concluded)
| Beginning Account Value 4/1/15 | Ending Account Value 9/30/15 | Annualized Expense Ratios | Expenses Paid During Period* | |||||||||||||
Aggressive Strategy Fund |
| |||||||||||||||
Actual Fund Return |
| |||||||||||||||
Class A | $ | 1,000.00 | $ | 915.10 | 0.35 | % | $ | 1.69 | ||||||||
Class D | 1,000.00 | 911.50 | 1.10 | 5.28 | ||||||||||||
Class I | 1,000.00 | 913.40 | 0.60 | 2.89 | ||||||||||||
Hypothetical 5% Return |
| |||||||||||||||
Class A | $ | 1,000.00 | $ | 1,023.24 | 0.35 | % | $ | 1.78 | ||||||||
Class D | 1,000.00 | 1,019.48 | 1.10 | 5.58 | ||||||||||||
Class I | 1,000.00 | 1,021.98 | 0.60 | 3.05 | ||||||||||||
Tax-Managed Aggressive Strategy Fund |
| |||||||||||||||
Actual Fund Return |
| |||||||||||||||
Class A | $ | 1,000.00 | $ | 922.20 | 0.35 | % | $ | 1.69 | ||||||||
Hypothetical 5% Return |
| |||||||||||||||
Class A | $ | 1,000.00 | $ | 1,023.24 | 0.35 | % | $ | 1.78 | ||||||||
Core Market Strategy Fund |
| |||||||||||||||
Actual Fund Return |
| |||||||||||||||
Class A | $ | 1,000.00 | $ | 938.70 | 0.35 | % | $ | 1.71 | ||||||||
Class I | 1,000.00 | 938.40 | 0.60 | 2.92 | ||||||||||||
Hypothetical 5% Return |
| |||||||||||||||
Class A | $ | 1,000.00 | $ | 1,023.24 | 0.35 | % | $ | 1.78 | ||||||||
Class I | 1,000.00 | 1,021.98 | 0.60 | 3.05 | ||||||||||||
Core Market Strategy Allocation Fund |
| |||||||||||||||
Actual Fund Return |
| |||||||||||||||
Class A | $ | 1,000.00 | $ | 922.40 | 0.35 | % | $ | 1.70 | ||||||||
Hypothetical 5% Return |
| |||||||||||||||
Class A | $ | 1,000.00 | $ | 1,023.24 | 0.35 | % | $ | 1.78 | ||||||||
Market Growth Strategy Fund |
| |||||||||||||||
Actual Fund Return |
| |||||||||||||||
Class A | $ | 1,000.00 | $ | 929.70 | 0.35 | % | $ | 1.70 | ||||||||
Class D | 1,000.00 | 925.30 | 1.10 | 5.32 | ||||||||||||
Class I | 1,000.00 | 927.50 | 0.60 | 2.91 | ||||||||||||
Hypothetical 5% Return |
| |||||||||||||||
Class A | $ | 1,000.00 | $ | 1,023.24 | 0.35 | % | $ | 1.78 | ||||||||
Class D | 1,000.00 | 1,019.48 | 1.10 | 5.58 | ||||||||||||
Class I | 1,000.00 | 1,021.98 | 0.60 | 3.05 | ||||||||||||
Market Growth Strategy Allocation Fund |
| |||||||||||||||
Actual Fund Return |
| |||||||||||||||
Class A | $ | 1,000.00 | $ | 922.50 | 0.35 | % | $ | 1.70 | ||||||||
Hypothetical 5% Return |
| |||||||||||||||
Class A | $ | 1,000.00 | $ | 1,023.24 | 0.35 | % | $ | 1.78 | ||||||||
| * | Expenses are equal to the Fund’s annualized expense ratio multiplied by the average account value over the period, multiplied by 183/366 (to reflect the one- half year period shown). |
| 36 | SEI Asset Allocation Trust / Semi-Annual Report / September 30, 2015 |
SEI ASSET ALLOCATION TRUST SEMI-ANNUAL REPORT SEPTEMBER 30, 2015
Robert A. Nesher, Chairman
Trustees
William M. Doran
George J. Sullivan, Jr.
Nina Lesavoy
James M. Williams
Mitchell A. Johnson
Hubert L. Harris, Jr.
Officers
Robert A. Nesher
President and Chief Executive Officer
Arthur Ramanjulu
Controller and Chief Financial Officer
Russell Emery
Chief Compliance Officer
Timothy D. Barto
Vice President, Secretary
David F. McCann
Vice President, Assistant Secretary
Aaron Buser
Vice President, Assistant Secretary
Stephen G. MacRae
Vice President
Bridget E. Sudall
Anti-Money Laundering Compliance Officer
Privacy Officer
Investment Adviser
SEI Investments Management Corporation
Administrator
SEI Investments Global Funds Services
Distributor
SEI Investments Distribution Co.
Legal Counsel
Morgan, Lewis & Bockius LLP
Independent Registered Public Accounting Firm
KPMG LLP
This report and the financial statements contained herein are submitted for the general information of the shareholders of the Trust and must be preceded or accompanied by a current prospectus. Shares of the Funds are not deposits or obligations of, or guaranteed or endorsed by, any bank. The shares are not federally insured by the Federal Deposit Insurance Corporation (FDIC), the Federal Reserve Board, or any other government agency. Investment in the shares involves risk, including the possible loss of principal.
For more information call
1 800 DIAL SEI
(1 800 342 5734)

1 Freedom Valley Drive P.O. Box 1100 Oaks, PA 19456
SEI-F-118 (9/15)
| Item 2. | Code of Ethics. |
Not applicable for semi-annual report.
| Item 3. | Audit Committee Financial Expert. |
Not applicable for semi-annual report.
| Item 4. | Principal Accountant Fees and Services. |
Not applicable for semi-annual report.
| Item 5. | Audit Committee of Listed Registrants. |
Not applicable.
| Item 6. | Schedule of Investments. |
Not applicable.
| Item 7. | Disclosure of Proxy Voting Policies and Procedures for Closed-End Management Investment Companies. |
Not applicable.
| Item 8. | Portfolio Managers of Closed-End Management Investment Companies. |
Not applicable.
| Item 9. | Purchases of Equity Securities by Closed-End Management Company and Affiliated Purchasers. |
Not applicable.
| Item 10. | Submission of Matters to a Vote of Security Holders. |
The Registrant has a standing Governance Committee (the “Committee”) currently consisting of the Independent Trustees. The Committee is responsible for evaluating and recommending nominees for election to the Registrant’s Board of Trustees (the “Board”). Pursuant to the Committee’s Charter, adopted on June 18th 2004, as amended, the Committee will review all shareholder recommendations for nominations to fill vacancies on the Board if such recommendations are submitted in writing and addressed to the Committee at the Registrant’s office.
| Item 11. | Controls and Procedures. |
(a) The Registrant’s principal executive and principal financial officers, or persons performing similar functions, have concluded that the Registrant’s disclosure controls and procedures (as defined in Rule 30a-3(c) under the Investment Company Act of 1940 (the “1940 Act”)) are effective, based on the evaluation of these controls and procedures required by Rule 30a-3(b) under the 1940 Act and Rules 13a-15(b) or 15d-15(b) under the Securities Exchange Act of 1934 as of a date within 90 days of the filing date of this report.
(b) There were no changes in the Registrant’s internal control over financial reporting (as defined in Rule 30a-3(d) under the 1940 Act) that occurred during the second fiscal quarter of the period covered by this report that have materially affected, or are reasonably likely to materially affect, the Registrant’s internal control over financial reporting.
| Items 12. | Exhibits. |
(a)(1) Not applicable for semi-annual report.
(a)(2) A separate certification for the principal executive officer and the principal financial officer of the Registrant as required by Rule 30a-2(a) under the 1940 Act, as amended (17 CFR 270.30a-2(a)), are filed herewith.
(b) Officer certifications as required by Rule 30a-2(b) under the 1940 Act, as amended (17 CFR 270.30a-2(b)) also accompany this filing as an exhibit.
SIGNATURES
Pursuant to the requirements of the Securities Exchange Act of 1934 and the Investment Company Act of 1940, the Registrant has duly caused this report to be signed on its behalf by the undersigned, thereunto duly authorized.
| SEI Asset Allocation Trust | ||||||
| By: | /s/ Robert A. Nesher | |||||
| Robert A. Nesher, President and CEO | ||||||
Date: December 4, 2015
Pursuant to the requirements of the Securities Exchange Act of 1934 and the Investment Company Act of 1940, this report has been signed below by the following persons on behalf of the Registrant and in the capacities and on the dates indicated.
| By: | /s/ Robert A. Nesher | |||||
| Robert A. Nesher, President and CEO |
Date: December 4, 2015
| By: | /s/ Arthur Ramanjulu | |||||
| Arthur Ramanjulu, Controller and CFO |
Date: December 4, 2015