UNITED STATES
SECURITIES AND EXCHANGE COMMISSION
Washington, D.C. 20549
FORM N-CSR
CERTIFIED SHAREHOLDER REPORT OF REGISTERED MANAGEMENT
INVESTMENT COMPANIES
Investment Company Act File Number 811-07445
SEI Asset Allocation Trust
(Exact name of registrant as specified in charter)
SEI Investments
One Freedom Valley Drive
Oaks, Pennsylvania 19456
(Address of principal executive offices)
Timothy D. Barto, Esq.
SEI Investments
One Freedom Valley Drive
Oaks, Pennsylvania 19456
(Name and address of agent for service)
Registrant’s telephone number, including area code: 1-610-676-1000
Date of fiscal year end: March 31, 2021
Date of reporting period: March 31, 2021
Item 1. Reports to Stockholders.

SEI Asset Allocation Trust
| › | Defensive Strategy Fund |
| › | Defensive Strategy Allocation Fund |
| › | Conservative Strategy Fund |
| › | Conservative Strategy Allocation Fund |
| › | Moderate Strategy Fund |
| › | Moderate Strategy Allocation Fund |
| › | Aggressive Strategy Fund |
| › | Tax-Managed Aggressive Strategy Fund |
| › | Core Market Strategy Fund |
| › | Core Market Strategy Allocation Fund |
| › | Market Growth Strategy Fund |
| › | Market Growth Strategy Allocation Fund |
Paper copies of the Funds’ shareholder reports are no longer sent by mail, unless you specifically request them from the Funds or from your financial intermediary, such as a broker-dealer or bank. Shareholder reports are available online and you will be notified by mail each time a report is posted on the Funds’ website and provided with a link to access the report online.
You may elect to receive all future reports in paper free of charge. If you invest through a financial intermediary, you can contact your financial intermediary to inform it that you wish to continue receiving paper copies of your shareholder reports. If you invest directly with the Funds, you can inform the Funds that you wish to continue receiving paper copies of your shareholder reports by calling 1-800-DIAL-SEI. Your election to receive reports in paper will apply to all funds held with the SEI Funds or your financial intermediary.

| 1 | ||
| 6 | ||
| 30 | ||
| 48 | ||
| 50 | ||
| 52 | ||
| 56 | ||
| 60 | ||
| 71 | ||
| 72 | ||
| 75 | ||
Board of Trustees Considerations in Approving the Advisory Agreement | 77 | |
| 80 | ||
The Trust files its complete schedule of portfolio holdings with the Securities and Exchange Commission for the first and third quarters of each fiscal year as an exhibit to its reports on Form N-PORT. The Trust’s Form N-PORT reports are available on the Commission’s website at http://www.sec.gov.
A description of the policies and procedures that the Trust uses to determine how to vote proxies relating to portfolio securities, as well as information relating to how a Fund voted proxies relating to portfolio securities during the most recent 12-month period ended June 30, is available (i) without charge, upon request, by calling 1-800-DIAL-SEI; and (ii) on the Commission’s website at http://www.sec.gov.
March 31, 2021 (Unaudited)
To our Shareholders:
The fiscal year ending March 31, 2021, began with unease about the international spread of a novel coronavirus (COVID-19) that dominated investor concerns; by the end of March, most equity indexes had already fallen into bear-market territory as the period began after earlier hitting all-time highs. Plans to reopen economic activity and developments in the race for COVID-19 treatments eventually encouraged investors as the year went on. Global financial markets rallied sharply amid renewed “risk-on” sentiment, with U.S. equity markets eclipsing their pre-pandemic peaks and finishing the fiscal year near all-time highs.
Central bank intervention largely succeeded in restraining a rapidly developing financial crisis in early 2020. Their actions—ensuring ample liquidity across markets and driving borrowing costs downward—created opportunities in rates markets, fixed-income spread sectors and inflation-sensitive asset classes.
Central banks aggressively pursued accommodative monetary policy, asset purchase programs and record-fiscal stimulus measures during the fiscal year. Financial markets anticipated increased volatility around the U.S. presidential election, but with Joe Biden winning a close election for U.S. president and the announcement of effective vaccines thereafter, markets advanced higher and volatility declined. Despite no sign of the Federal Reserve tightening in the near term, the U.S. Treasury yield curve steepened over the course of the fiscal year, especially as future expectations for a rebound in economic growth increased along with rising inflation expectations; long-term yields rose more than shorter-term yields.
The Federal Reserve’s federal-funds rate target continued to range between 0.0% and 0.25%, and the Federal Open Market Committee (“FOMC”) remained committed to purchasing Treasurys and agency mortgage-backed securities (“MBS”). Federal Reserve (“Fed”) Chair Jerome Powell pledged to continue supporting the economy via monetary policy during his semi-annual congressional testimony on February 24, 2021.
The year was also characterized by a polarized equity market. Over the first half of the period, high-flying technology companies shared the spotlight with businesses that benefited from the pandemic. A narrow band of extraordinarily high-priced stocks led the market higher as reasonably priced, fundamentally sound businesses languished. However, a reflationary theme dominated the second half of the period as markets anticipated economic reopening and additional rounds of massive U.S. fiscal easing. Equities continued to roll along, although work-from-home and mega-cap stocks gave up ground to cyclical and “go-out” names.
Geopolitical Events
Market volatility accelerated just before the start of the fiscal year following concerns about COVID-19 and its eventual economic effect: as the outbreak spread from China to other countries, governments issued stay-at-home orders and initiated widespread lockdowns. Beyond the threat to public health, the outbreak and resulting containment measures evoked concerns about the potential halt to global economic activity. Nevertheless, markets rebounded and remained optimistic at the end of the reporting period as investors spotted sources of encouragement.
In the U.S. general election in November, Joe Biden was declared the winner of the presidential race in early November. Most candidates from the Republican Party performed better in their races for state- and national-level offices compared to President Trump’s quest for a second term; in January, a violent security breach of the U.S. Capitol by a mob of protesters delayed—but did not stop—the counting of electoral votes in the U.S. Congress. Trump was impeached by the House of Representatives for inciting an insurrection—the first president in U.S. history to be impeached twice. Two weeks later, Joe Biden was inaugurated as president under heavy security provided by 25,000 National Guard troops.
The new Biden administration worked with the Congress to confirm top-level cabinet positions, enacted a series of COVID-19-related executive actions, and began to tackle a range of other priorities, including signing an aid package totaling $1.9 trillion in March providing funding for extended and expanded unemployment benefits, direct stimulus payments, child tax credits, schools, state and local governments and elsewhere. On the last day of March, Biden announced a $2.3 trillion package targeted at modernizing travel and utility infrastructure, care for the elderly and disabled, manufacturing, affordable housing and expanded access to broadband internet, coupled with a broad low-carbon electricity generation mandate. This was the first of a two-part long-term economic plan with costs spread
| SEI Asset Allocation Trust / Annual Report / March 31, 2021 | 1 |
LETTER TO SHAREHOLDERS (Continued)
March 31, 2021 (Unaudited)
over eight years; the second part will focus on childcare and health care, and more details are expected in late April. The price tag for Biden’s proposal would be offset by increasing the corporate tax rate from 21% to 28% for a 15-year period and raising taxes on overseas corporate profits.
China and the U.S. formalized a “phase one” trade deal just before the start of the reporting period in mid-January 2020 that offered tariff relief to China (via the reduction of existing tariffs and the delay of additional scheduled tariffs). In exchange, China committed to purchasing $200 billion in U.S. products over a two-year period; addressing its long-standing practice of forcing the transfer of intellectual property and technology to Chinese counterparts in exchange for access to the Chinese market; and promising to continue opening its financial-services industry to foreign investors. The tense U.S.-China relationship was stressed in May by a U.S. push for more transparency in the ownership of U.S.-listed Chinese companies and the U.S. government’s barring of certain Chinese securities from its retirement plans.
The United States-Mexico-Canada trade agreement was ratified by all three countries and officially replaced the North American Free Trade Agreement on July 1. The Trump administration announced in September that it would not pursue a 10% tariff on U.S. imports of Canadian aluminum previously announced in August, as trade is now expected to normalize following high import levels earlier in 2020. President Trump and France’s President Emmanuel Macron successfully walked back threats of tariffs that originated with French plans for a digital tax that would have targeted U.S.-based multi-national technology companies.
Economic Performance
U.S. gross domestic product (“GDP”) declined 5.0% in the first quarter of 2020, the largest drop since the global financial crisis, although it reflected just two weeks of lockdowns that began across the country in March. The economy then contracted by a worst-ever 31.4% in the second quarter, falling in all 50 states. The abrupt halt to the 10-year economic expansion came amid mandated lockdowns throughout most of the country. The third quarter saw a record 33.4% rebound, fueled by over $3 trillion in pandemic relief. A 4.0% gain in the fourth quarter resulted in a decline of 3.5% for the full year, the worst figure since at least the end of World War II.
The U.S. unemployment rate touched a 50-year low of 3.5% at the start of the fiscal year before jumping as high as 14.8% in April and remaining over 10.0% through July, with the final figure settling at 6.0% in March 2021; the number of Americans filing for initial unemployment benefits hit record numbers as many non-essential businesses were forced to close in the wake of the pandemic. The labor-force participation rate ended at 61.5%, down from 62.6% a year earlier. Average hourly earnings gained 4.2% over the fiscal year, as the increase in unemployment tended to hit lower-wage workers hardest.
Two off-cycle moves just before the start of the fiscal year brought the federal-funds rate to near zero and were designed to bolster the economy in response to the economic threat posed by the coronavirus outbreak; the emergency actions were the first since the global financial crisis. Additionally, the Fed committed to purchasing unlimited amounts of Treasurys and established or renewed multiple facilities designed to support the economy.
Market Developments
The S&P 500 Index returned 56.35% during the fiscal year. Growth stocks, dominated by the information technology sector, outperformed value stocks. At the sector level, materials, energy and consumer discretionary stocks led, while utilities, consumer staples and real estate lagged. Overall, U.S. equities outpaced major developed markets during the fiscal year.
Small-cap stocks, which tend to be value-oriented and sensitive to the success or decline in a local economy, outperformed large caps overall. U.S. large-cap stocks (Russell 1000 Index) finished the reporting period up 60.59%, while small-cap stocks (Russell 2000 Index) finished the period ahead 94.85%.
The MSCI Emerging Markets Index (Net) finished the reporting period up 58.39% in U.S. dollar terms. Emerging-market equities were on a tear since bottoming in March. Emerging-market stocks edged out developed markets, as measured by the MSCI World Index (Net), which finished up 54.03% for the year. China led among major emerging markets, masking weaker performance in other emerging countries, particularly Brazil.
| 2 | SEI Asset Allocation Trust / Annual Report / March 31, 2021 |
The MSCI Europe Index (Net) advanced 44.95% in U.S. dollar terms. The MSCI ACWI Index (Net), a proxy for global equities in both developed and emerging markets, rose 54.60% in U.S. dollar terms. The FTSE UK Series All-Share Index recorded a 40.25% gain in U.S. dollar terms over the full reporting period.
The U.S. high-yield market, as measured by the ICE BofA US High Yield Constrained Index, was up 23.22% during the reporting period, while global fixed income, as measured by the Bloomberg Barclays Global Aggregate Index, climbed 4.67%. Within the high-yield market, BB rated bonds hit an all-time high Index share of 57% during July 2020 compared to a long-term average of 43%. The investment-grade market’s loss was the high-yield market’s gain.
U.S. investment-grade corporate debt, as represented by the Bloomberg Barclays US Corporate Investment Grade Index, returned 8.73%. U.S. asset- and mortgage-backed securities also managed gains during the fiscal year, benefiting from improving supply-and-demand dynamics.
Emerging-market debt (“EMD”) delivered positive performance due to an improving growth outlook in the region relative to developed markets. The J.P. Morgan Global Bond Index-Emerging Markets (“GBI-EM”) Global Diversified Index, which tracks local-currency-denominated EM bonds, gained 13.03% in U.S. dollar terms. The J.P. Morgan Emerging Markets Bond Index (“EMBI”) Global Diversified Index, which tracks EMD denominated in external currencies (such as the U.S. dollar), was up 16.00%.
The U.S. dollar rebounded some from its January low (relative to a trade-weighted basket of foreign currencies) as the fiscal year closed, but remained in an overall downward trend for the full period. After hitting an all-time low just before the start of the reporting period, the West Texas Intermediate crude-oil price reached a 30-month high near the end of the fiscal year due to optimistic forecasts for global economic growth and increased demand for crude.
Our View
The war against COVID-19 is not over, but the path to victory has become clearer. Investors are anticipating the return to a more normal world. This is reflected in the rapid rise in bond yields, the most important change in the financial environment so far this year. This jump has caused outsized price drops in long-term fixed-income securities and has helped fuel the sharp rotation in the equity market away from expensive growth shares and into value-oriented and cyclical sectors, both in the U.S. and internationally.
At the start of the year, most economists and bond investors expected higher rates. Few, however, predicted the speed and extent of the increases. While yields on U.S. sovereign debt are setting the pace, they are rising in other countries too.
With the passage of the latest U.S. fiscal stimulus package, the cumulative amount of U.S. fiscal support over the past 12 months totals a remarkable $6 trillion, approaching 30% of U.S. GDP. The Fed has gone to great lengths to protect the bond market from the rising tide of Treasury issuance with its purchases of outstanding issues. In the 12 months ended March 26, 2021, the Fed has bought $2.1 trillion of Treasury securities; just one month prior, the federal deficit over the past 12 months amounted to $3.55 trillion.
Higher bond yields may cause bouts of indigestion for equities, but they should not derail the bull market. We expect to see cyclical and value-oriented shares continue to advance relative to growth and defensively oriented sectors. In most cycles, value shares outperform growth when the yield curve is rising or is very wide (rates on long-term Treasury bonds are well above those on short-term securities). Value’s performance against growth bottomed on September 1, and has been on a tear since.
While value-oriented shares have been making a comeback against growth in the U.S., other countries’ equity markets are making a comeback against the U.S.
Japan has been a strong performer among countries with the highest market capitalizations. The economy has benefited from strong exports to China and the U.S. over the past year. Real GDP at the end of 2020 was only 1.3% below the year-ago level, better than most other developed countries, including the United States.
France also has seen a 20%-plus gain in its equity market since August. This might be an even greater surprise than the run-up in Japanese share prices, since the country has been enduring a difficult COVID-19 wave like much of Europe.
| SEI Asset Allocation Trust / Annual Report / March 31, 2021 | 3 |
LETTER TO SHAREHOLDERS (Concluded)
March 31, 2021 (Unaudited)
Although the U.K. has lagged the MSCI World Index over the past seven months, its 14.53% total return nonetheless was slightly ahead of that of the U.S. Considering all the uncertainty surrounding Brexit and the harsh lockdowns associated with COVID-19 in recent months, this is not a bad outcome.
As spring arrives and lockdowns end on the back of the country’s successful vaccination effort, we look for the U.K. to experience a strong recovery in consumer demand and business activity that should outpace the rest of Europe’s.
U.K. government policy remains supportive in the near term. But the recently-proposed fiscal budget appears rather restrained compared to the measures taken by the Biden Administration, adding only about 3% of GDP to the budget deficit for the 2021/22 fiscal year. From fiscal year 2023/24 and beyond, policy actions begin to reduce the deficit, mostly through an increase in the corporation tax rate from 19% to 25% and through the freezing of income tax thresholds.
Although not as high as the valuation metrics found in the U.S. equity market, shares outside the U.S. still appear expensive. Currently, the MSCI World ex USA Index is priced at almost 17 times the earnings per share forecast for the next 12 months, the highest level since 2004.
To repeat, developed equity markets still look cheap compared to the U.S. The forward price-to-earnings ratio for the MSCI USA index is still above 22. The MSCI World ex USA Index therefore trades at an unusually wide 25% discount. Although longer-term growth differentials justify a structurally higher multiple for U.S. equities, rebounding economies and rising interest rates should lead to a narrower valuation gap.
The jump in U.S. bond yields this year has raised investor concerns that emerging markets will be the victims of a 2013-style taper tantrum. Rising rates are a headwind, but we believe emerging economies are generally in a better position to withstand the pressure than they were eight years ago. Strong growth in the world economy over the next year should help lift most emerging markets. World trade volumes, for example, had already reached pre-pandemic levels by the end of last year. Over the course of 2021, the expansion in trade should continue. When trade volumes are strong, developing equity markets tend to perform well against those of the economically advanced countries.
We believe the economic backdrop strongly supports cyclical and value-oriented equities in the emerging markets, just as it does in developed markets. The MSCI Emerging Markets Value total-return Index is highly correlated with industrial commodity prices, which have already vaulted higher from their year-ago lows.
We project that more commodity price gains are on the way. Strong manufacturing and construction demand in the U.S. and China, recovery in Europe and Latin America as vaccines become more widely available, the global push into electric vehicles and other climate projects, and the major infrastructure package that is next on the Biden Administration’s to-do list all promise to stoke demand for metals and other commodities.
Emerging economies also look less susceptible to a 2013-style taper tantrum because their external positions are much healthier. Current account balances as a percentage of GDP are generally much smaller now than eight years ago. Emerging-market local-currency and US-dollar bond yields have moved higher this year, but the increase has so far been quite modest. Option-adjusted spreads are still near their lows of the past three years, certainly not qualifying as a taper tantrum. Granted, some big countries face continuing problems. Besides Turkey, debt dynamics among the larger countries appear most worrying in Brazil and South Africa. However, most of the debt in these two countries is denominated in local currency, allowing their governments to engage in some form of financial repression (like quantitative easing) in order to temper the pressure on their bond markets.
SEI’s base case is an optimistic one. Developing countries will likely take longer to reopen fully since vaccination distribution will take time. Yet, even these countries will benefit economically from the upswing in developed-market consumer demand.
Having confidence is not the same as being complacent, however. Beyond COVID concerns, investors will be increasingly focused on the next multi-trillion dollar U.S. infrastructure package. Tax increases on corporations and high-income households will also be part of this package. Compromises will be needed to keep the Democratic caucus unified.
Generally speaking, the tax and regulatory changes championed by the Biden administration are not business-or equity-market friendly. But the same could be said of the economic policies pursued during the Obama
| 4 | SEI Asset Allocation Trust / Annual Report / March 31, 2021 |
Administration. That did not prevent one of the strongest and most enduring bull-market runs in U.S. history. We caution against making broad asset-allocation changes based on perceived shifts in the political winds.
As for monetary policy, we will be watching whether the Fed can maintain its stance of a near-zero federal funds rate through 2023. If the acceleration in inflation proves stronger and longer-lasting than investors expect, bond yields could climb appreciably from today’s levels.
If the Fed accelerates policy rate hikes, we would expect a neutral-to-negative reaction in equities and other risk assets. Suppressing the rise in bond yields through even more aggressive policy actions, on the other hand, could lead to a weaker dollar and a sharper investor focus on inflation-hedging. Equity valuations could get even more expensive than they are now as investors grow even more exuberant. Interesting times, indeed.
Sincerely,

| James Smigiel |
| Head and Chief Investment Officer of Non-Traditional Asset Management |
| SEI Asset Allocation Trust / Annual Report / March 31, 2021 | 5 |
MANAGEMENT’S DISCUSSION AND ANALYSIS OF FUND PERFORMANCE
March 31, 2021 (Unaudited)
Defensive Strategy Fund
I. Objective
The Defensive Strategy Fund (the “Fund”) seeks to manage the risk of loss while providing current income and the opportunity for limited capital appreciation.
II. Investment Approach
The Fund’s assets are managed under the direction of SEI Investments Management Corporation (“SIMC”), which manages the Fund’s assets in a way that it believes will achieve the Fund’s investment objective. In order to achieve its investment objective, SIMC allocates the Fund’s assets among certain underlying SEI funds. These underlying SEI funds, in turn, invest directly in securities in accordance with their own varying investment objectives and policies. SIMC may change the allocations to the particular asset classes represented by the underlying SEI funds when it deems it appropriate. The underlying SEI funds are separately managed series of the following investment companies: SEI Institutional Managed Trust (“SIMT”), SEI Institutional International Trust (“SIT”) and SEI Daily Income Trust (“SDIT”).
III. Return vs. Benchmark
For the full year ended March 31, 2021, the Fund’s Class F shares returned 5.99%. The Fund’s primary benchmark—the Bloomberg Barclays US Aggregate Bond Index, which tracks the performance of the investment-grade, U.S. dollar-denominated, fixed-rate taxable bond market—returned 0.71%.
IV. Fund Attribution
Asset class performance was strong during the reporting period ending March 31, 2021. As noted in the shareholder letter, the fiscal year started off with lockdowns and uncertainty across the globe, but despite concerns, global equities roared back after the pandemic-driven market correction. This was largely due to the easing of monetary policy, highly supportive fiscal policies, lockdown restrictions slowly reversing, and vaccine and therapeutic developments. In general, equity markets recovered from the correction by the fall of 2020, with brief selloffs in September and October. U.S. and emerging-market equities performed the strongest, followed by developed markets outside the U.S.
Global credit and high-yield fixed income produced positive returns during the period. Between March and December, the Federal Reserve’s (“Fed”) portfolio increased from roughly $4 trillion to over $6.5 trillion.
Additionally, throughout the second half of 2020 and into 2021, the Fed continued its direct lending to major corporate firms, as well as its Main Street Lending Program to support small- and mid-sized businesses. On the European front, in response to COVID-19, the European Central Bank, through its Pandemic Emergency Purchase Programme, increased its stimulus total to €1850 billion by the end of 2020. In this reflationary environment, global commodities produced strong returns over the fiscal year. As noted in the shareholder letter, oil prices dropped significantly at the start of the 12 months as the pandemic drove oil demand to its lowest levels in over 20 years; however, crude climbed steadily higher through the end of the period as the ease in lockdowns led to increased demand. Gold prices spiked to an all-time high over the summer as countries took on record debt in response to the pandemic, only to revert back later in the year. The U.S. dollar fell from a peak seen at the height of the pandemic as “risk-on” assets recovered over the remainder of the 12 months.
The Fund’s largest allocations were in the SDIT Short-Duration Government Fund, SIMT Multi-Asset Capital Stability Fund and SIMT Conservative Income Fund. Of the three, SIMT Multi-Asset Capital Stability Fund was the top absolute performer. The largest absolute contributors overall were the SIMT U.S. Managed Volatility Fund and SIMT Global Managed Volatility Fund. These funds seek to achieve equity-like returns with lower levels of volatility than their respective benchmarks. The funds performed well in absolute terms given their exposure to broad equity markets. However, the Managed Volatility funds lagged their respective benchmarks on a relative basis as higher-volatility stocks rebounded from the March 2020 market lows of to a greater degree.
The SIMT Multi-Asset Income Fund and SIMT Multi-Asset Inflation Managed Fund also performed well on an absolute basis as credit risk and commodity exposure were rewarded during the recovery. Continued and increasing expectations of a recovery in economic growth helped push prices in these assets higher. The smallest contributors to absolute performance were money markets and short duration fixed income, as higher-risk assets generally outperformed.
There were no tactical tilts during the reporting period.
The Fund outperformed the Bloomberg Barclays U.S. Aggregate Bond Index over the fiscal year, as all funds except SDIT Government and SIMT Conservative Income outperformed the Fund’s primary benchmark.
| 6 | SEI Asset Allocation Trust / Annual Report / March 31, 2021 |
| AVERAGE ANNUAL TOTAL RETURN1 | ||||||||||||||||||
| Annualized | Annualized | Annualized | Annualized | |||||||||||||||
| One Year Return | 3-Year Return | 5-Year Return | 10-Year Return | Inception to Date | ||||||||||||||
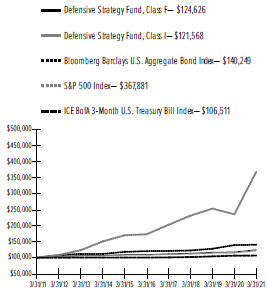
| Defensive Strategy Fund, Class F | 5.99% | 3.15% | 2.66% | 2.23% | 2.33% | |||||||||||||
| Defensive Strategy Fund, Class I | 5.84% | 2.91% | 2.40% | 1.97% | 2.09% | |||||||||||||
| Bloomberg Barclays U.S. Aggregate Bond Index* | 0.71% | 4.65% | 3.10% | 3.44% | 4.08% | |||||||||||||
| S&P 500 Index** | 56.35% | 16.78% | 16.29% | 13.91% | 10.21% | |||||||||||||
| ICE BofA 3-Month U.S. Treasury Bill Index*** | 0.12% | 1.49% | 1.19% | 0.63% | 1.32% | |||||||||||||
Comparison of Change in the Value of a $100,000 Investment in the Defensive Strategy Fund, Class F and Class I, the S&P 500 Index, the Bloomberg Barclays U.S. Aggregate Bond Index, and the ICE BofA 3-Month U.S. Treasury Bill Index
| 1 | For the period ended March 31, 2021. Past performance is no indication of future performance. Class F (formerly Class A) and Class I shares were offered beginning November 17, 2003. Returns shown do not reflect the deduction of taxes that a shareholder would pay on Fund distributions or the redemption of Fund Shares. |
| * | The Bloomberg Barclays U.S. Aggregate Bond Index is a widely-recognized, market value-weighted (higher market value bonds have more influence than lower market value bonds) index of U.S. government obligations, corporate debt securities, and AAA rated mortgage-backed securities. All securities in the index are rated investment grade (BBB) or higher, with maturities of at least one year. |
| ** | The S&P 500 Index is designed to measure performance of the broad domestic economy through changes in the aggregate market value of 500 stocks representing all major industries. |
| *** | The ICE BofA 3-Month U.S. Treasury Bill Index measures total return on cash, including price and interest income, based on short-term government Treasury Bills of about 90-day maturity. |
| SEI Asset Allocation Trust / Annual Report / March 31, 2021 | 7 |
MANAGEMENT’S DISCUSSION AND ANALYSIS OF FUND PERFORMANCE
March 31, 2021 (Unaudited)
Defensive Strategy Allocation Fund
I. Objective
The Defensive Strategy Allocation Fund (the “Fund”) seeks to generate investment income while providing the opportunity for capital appreciation.
II. Investment Approach
The Fund’s assets are managed under the direction of SEI Investments Management Corporation (“SIMC”), which manages the Fund’s assets in a way that it believes will achieve the Fund’s investment objective. In order to achieve its investment objective, SIMC allocates the Fund’s assets among certain underlying SEI funds. These underlying SEI funds, in turn, invest directly in securities in accordance with their own varying investment objectives and policies. SIMC may change the allocations to the particular asset classes represented by the underlying SEI funds when it deems it appropriate. The underlying SEI funds are separately managed series of the following investment companies: SEI Institutional Managed Trust (“SIMT”) and SEI Daily Income Trust (“SDIT”).
III. Return vs. Benchmark
For the full year ended March 31, 2021, the Fund’s Class F shares returned 4.88%. The Fund’s primary benchmark—the S&P 500 Index (Gross), which tracks the performance of approximately 500 large U.S. companies that are considered representative of the broad U.S. stock market—returned 56.35%.
IV. Fund Attribution
Asset class performance was strong during the reporting period ending March 31, 2021. As noted in the shareholder letter, the fiscal year started off with lockdowns and uncertainty across the globe, but despite concerns, global equities roared back after the pandemic-driven market correction. This was largely due to the easing of monetary policy, highly supportive fiscal policies, lockdown restrictions slowly reversing, and vaccine and therapeutic developments. In general, equity markets recovered from the correction by the fall of 2020, with brief selloffs in September and October. U.S. and emerging-market equities performed the strongest, followed by developed markets outside the U.S.
Global credit and high-yield fixed income produced positive returns during the period. Between March and December, the Federal Reserve’s (“Fed”) portfolio increased from roughly $4 trillion to over $6.5 trillion. Additionally, throughout the second half of 2020
and into 2021, the Fed continued its direct lending to major corporate firms, as well as its Main Street Lending Program to support small- and mid-sized businesses. On the European front, in response to COVID-19, the European Central Bank, through its Pandemic Emergency Purchase Programme, increased its stimulus total to €1850 billion by the end of 2020. In this reflationary environment, global commodities produced strong returns over the fiscal year. As noted in the shareholder letter, oil prices dropped significantly at the start of the 12 months as the pandemic drove oil demand to its lowest levels in over 20 years; however, crude climbed steadily higher through the end of the period as the ease in lockdowns led to increased demand. Gold prices spiked to an all-time high over the summer as countries took on record debt in response to the pandemic, only to revert back later in the year. The U.S. dollar fell from a peak seen at the height of the pandemic as “risk-on” assets recovered over the remainder of the 12 months.
The Fund’s largest allocations were in the SDIT Short-Duration Government Fund and the SIMT High Yield Bond Fund. The High Yield Bond Fund performed strongly on an absolute basis over the 12 months as credit spreads tightened and credit assets were rewarded during the “risk-on” period. Continued and increasing expectations of a recovery to economic growth helped push prices in these assets higher. The smallest contributors to absolute performance were money markets and short duration fixed income, as higher-risk assets generally outperformed.
Although the Fund trailed the primary benchmark, the Fund’s overall performance was in line with our expectations for the Fund’s asset allocation.
The Fund is designed to have exposure to a range of asset classes, not all of which are reflected in the primary benchmark of the Fund. Although it trailed the primary benchmark, the Fund’s overall performance was in line with our expectations for the Fund’s asset allocation.
| AVERAGE ANNUAL TOTAL RETURN1 | ||||||||||||||||||||
| One Year Return | Annualized 3-Year Return | Annualized 5-Year Return | Annualized 10-Year Return | Annualized Inception to Date | ||||||||||||||||
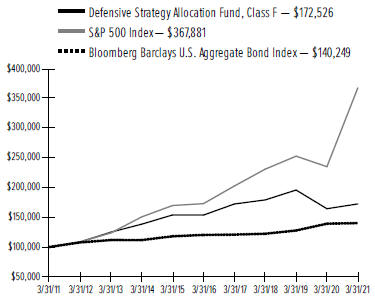
| Defensive Strategy Allocation Fund, Class F | 4.88% | -1.28% | 2.34% | 5.61% | 5.70% | |||||||||||||||
| S&P 500 Index* | 56.35% | 16.78% | 16.29% | 13.91% | 10.21% | |||||||||||||||
| Bloomberg Barclays U.S. Aggregate Bond Index** | 0.71% | 4.65% | 3.10% | 3.44% | 4.08% | |||||||||||||||
| 8 | SEI Asset Allocation Trust / Annual Report / March 31, 2021 |
Comparison of Change in the Value of a $100,000 Investment in the Defensive Strategy Allocation Fund, Class F, the S&P 500 Index, and the Bloomberg Barclays U.S. Aggregate Bond Index
¹ For the year ended March 31, 2021. Past performance is no indication of future performance. Class F (formerly Class A) shares were offered beginning November 17, 2003. Returns shown do not reflect the deduction of taxes that a shareholder would pay on Fund distributions or the redemption of Fund Shares.
* The S&P 500 Index is designed to measure performance of the broad domestic economy through changes in the aggregate market value of 500 stocks representing all major industries.
** The Bloomberg Barclays U.S. Aggregate Bond Index is a widely-recognized, market value-weighted (higher market value bonds have more influence than lower market value bonds) index of U.S. government obligations, corporate debt securities, and AAA rated mortgage-backed securities. All securities in the index are rated investment grade (BBB) or higher, with maturities of at least one year. |
| SEI Asset Allocation Trust / Annual Report / March 31, 2021 | 9 |
MANAGEMENT’S DISCUSSION AND ANALYSIS OF FUND PERFORMANCE
March 31, 2021 (Unaudited)
Conservative Strategy Fund
I. Objective
The Conservative Strategy Fund (the “Fund”) seeks to manage the risk of loss while providing the opportunity for modest capital appreciation.
II. Investment Approach
The Fund’s assets are managed under the direction of SEI Investments Management Corporation (“SIMC”), which manages the Fund’s assets in a way that it believes will achieve the Fund’s investment objective. In order to achieve its investment objective, SIMC allocates the Fund’s assets among certain underlying SEI funds. These underlying SEI funds, in turn, invest directly in securities in accordance with their own varying investment objectives and policies. SIMC may change the allocations to the particular asset classes represented by the underlying SEI funds when it deems it appropriate. The underlying SEI funds are separately managed series of the following investment companies: SEI Institutional Managed Trust (“SIMT”), SEI Institutional International Trust (“SIT”) and SEI Daily Income Trust (“SDIT”).
III. Return vs. Benchmark
For the full year ended March 31, 2021, the Fund’s Class F shares returned 10.71%. The Fund’s primary benchmark—the Bloomberg Barclays US Aggregate Bond Index, which tracks the performance of the investment-grade, U.S. dollar-denominated, fixed-rate taxable bond market—returned 0.71%.
IV. Fund Attribution
Asset class performance was strong during the reporting period ending March 31, 2021. As noted in the shareholder letter, the fiscal year started off with lockdowns and uncertainty across the globe, but despite concerns, global equities roared back after the pandemic-driven market correction. This was largely due to the easing of monetary policy, highly supportive fiscal policies, lockdown restrictions slowly reversing, and vaccine and therapeutic developments. In general, equity markets recovered from the correction by the fall of 2020, with brief selloffs in September and October. U.S. and emerging-market equities performed the strongest, followed by developed markets outside the U.S.
Global credit and high-yield fixed income produced positive returns during the period. Between March and December, the Federal Reserve’s (“Fed”) portfolio increased from roughly $4 trillion to over $6.5 trillion.
Additionally, throughout the second half of 2020 and into 2021, the Fed continued its direct lending to major corporate firms, as well as its Main Street Lending Program to support small- and mid-sized businesses. On the European front, in response to COVID-19, the European Central Bank, through its Pandemic Emergency Purchase Programme, increased its stimulus total to €1850 billion by the end of 2020. In this reflationary environment, global commodities produced strong returns over the fiscal year. As noted in the shareholder letter, oil prices dropped significantly at the start of the 12 months as the pandemic drove oil demand to its lowest levels in over 20 years; however, crude climbed steadily higher through the end of the period as the ease in lockdowns led to increased demand. Gold prices spiked to an all-time high over the summer as countries took on record debt in response to the pandemic, only to revert back later in the year. The U.S. dollar fell from a peak seen at the height of the pandemic as “risk-on” assets recovered over the remainder of the 12 months.
The Fund’s largest allocations were in the SIMT Multi-Asset Capital Stability Fund, SDIT Short-Duration Government Fund and SIMT Core Fixed Income Fund. All three funds had positive absolute returns, with the largest absolute contribution coming from SIMT Multi-Asset Capital Stability Fund. The largest absolute contributors overall were the SIMT Global Managed Volatility Fund and SIMT U.S. Managed Volatility Fund. These funds seek to achieve equity-like returns with lower levels of volatility than their respective benchmarks. The funds performed well in absolute terms given their exposure to broad equity markets. However, the Managed Volatility funds lagged their respective benchmarks on a relative basis as higher-volatility stocks rebounded from the March 2020 market lows to a greater degree. The SIMT Multi-Asset Income Fund, SIMT High Yield Bond Fund and SIMT Multi-Asset Inflation Managed Fund also performed well on an absolute basis as credit risk and commodity exposure were rewarded during the recovery. Continued and increasing expectations of a recovery in economic growth helped push prices in these assets higher. The smallest contributors to absolute performance were money markets and short duration fixed income, as higher-risk assets generally outperformed.
There were no tactical tilts during the reporting period.
The Fund outperformed the Bloomberg Barclays U.S. Aggregate Bond Index over the fiscal year, as all funds except SDIT Government and SIMT Conservative Income outperformed the Fund’s primary benchmark.
| 10 | SEI Asset Allocation Trust / Annual Report / March 31, 2021 |
| AVERAGE ANNUAL TOTAL RETURN1 | ||||||||||||||||||
| One Year Return | Annualized 3-Year Return | Annualized 5-Year Return | Annualized 10-Year Return | Annualized Inception to Date | ||||||||||||||
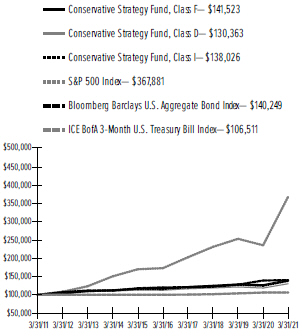
| Conservative Strategy Fund, Class F | 10.71% | 3.90% | 3.75% | 3.53% | 3.37% | |||||||||||||
| Conservative Strategy Fund, Class D | 9.91% | 3.13% | 2.98% | 2.69% | 2.34% | |||||||||||||
| Conservative Strategy Fund, Class I | 10.35% | 3.64% | 3.50% | 3.28% | 3.23% | |||||||||||||
| S&P 500 Index* | 56.35% | 16.78% | 16.29% | 13.91% | 10.21% | |||||||||||||
| Bloomberg Barclays U.S. Aggregate Bond Index** | 0.71% | 4.65% | 3.10% | 3.44% | 4.08% | |||||||||||||
| ICE BofA 3-Month U.S. Treasury Bill Index*** | 0.12% | 1.49% | 1.19% | 0.63% | 1.32% | |||||||||||||
Comparison of Change in the Value of a $100,000 Investment in the Conservative Strategy Fund, Class F, Class D and Class I, the S&P 500 Index, the Bloomberg Barclays U.S. Aggregate Bond Index, and the ICE BofA 3-Month U.S. Treasury Bill Index
| ¹ | For the year ended March 31, 2021. Past performance is no indication of future performance. Class F (formerly Class A) and Class I shares were offered beginning November 17, 2003. The Fund’s Class D Shares commenced operations on March 25, 2011. For periods prior to March 25, 2011, the performance of the Fund’s Class F Shares, adjusted for the higher total annual fund operating expenses of the Class D Shares has been used. Returns for Class |
D Shares would have been substantially similar to those of Class F Shares and would have differed only to the extent that Class D Shares have higher total annual fund operating expenses than Class F Shares. Returns shown do not reflect the deduction of taxes that a shareholder would pay on Fund distributions or the redemption of Fund Shares. |
| * | The S&P 500 Index is designed to measure performance of the broad domestic economy through changes in the aggregate market value of 500 stocks representing all major industries. |
| ** | The Bloomberg Barclays U.S. Aggregate Bond Index is a widely-recognized, market value-weighted (higher market value bonds have more influence than lower market value bonds) index of U.S. government obligations, corporate debt securities, and AAA rated mortgage-backed securities. All securities in the index are rated investment grade (BBB) or higher, with maturities of at least one year. |
| *** | The ICE BofA 3-Month U.S. Treasury Bill Index measures total return on cash, including price and interest income, based on short-term government Treasury Bills of about 90-day maturity. |
| SEI Asset Allocation Trust / Annual Report / March 31, 2021 | 11 |
MANAGEMENT’S DISCUSSION AND ANALYSIS OF FUND PERFORMANCE
March 31, 2021 (Unaudited)
Conservative Strategy Allocation Fund
I. Objective
The Conservative Strategy Allocation Fund (the “Fund”) seeks to generate investment income while providing an opportunity for capital appreciation.
II. Investment Approach
The Fund’s assets are managed under the direction of SEI Investments Management Corporation (“SIMC”), which manages the Fund’s assets in a way that it believes will achieve the Fund’s investment objective. In order to achieve its investment objective, SIMC allocates the Fund’s assets among certain underlying SEI funds. These underlying SEI funds, in turn, invest directly in securities in accordance with their own varying investment objectives and policies. SIMC may change the allocations to the particular asset classes represented by the underlying SEI funds when it deems it appropriate. The underlying SEI funds are separately managed series of the following investment companies: SEI Institutional Managed Trust (“SIMT”) and SEI Daily Income Trust (“SDIT”).
III. Return vs. Benchmark
For the full year ended March 31, 2021, the Fund’s Class F shares returned 26.55%. The Fund’s primary benchmark—the S&P 500 Index (Gross), which tracks the performance of approximately 500 large U.S. companies that are considered representative of the broad U.S. stock market—returned 56.35%.
IV. Fund Attribution
Asset class performance was strong during the reporting period ending March 31, 2021. As noted in the shareholder letter, the fiscal year started off with lockdowns and uncertainty across the globe, but despite concerns, global equities roared back after the pandemic-driven market correction. This was largely due to the easing of monetary policy, highly supportive fiscal policies, lockdown restrictions slowly reversing, and vaccine and therapeutic developments. In general, equity markets recovered from the correction by the fall of 2020, with brief selloffs in September and October. U.S. and emerging-market equities performed the strongest, followed by developed markets outside the U.S.
Global credit and high-yield fixed income produced positive returns during the period. Between March and December, the Federal Reserve’s (“Fed”) portfolio increased from roughly $4 trillion to over $6.5 trillion. Additionally, throughout the second half of 2020
and into 2021, the Fed continued its direct lending to major corporate firms, as well as its Main Street Lending Program to support small- and mid-sized businesses. On the European front, in response to COVID-19, the European Central Bank, through its Pandemic Emergency Purchase Programme, increased its stimulus total to €1850 billion by the end of 2020. In this reflationary environment, global commodities produced strong returns over the fiscal year. As noted in the shareholder letter, oil prices dropped significantly at the start of the 12 months as the pandemic drove oil demand to its lowest levels in over 20 years; however, crude climbed steadily higher through the end of the period as the ease in lockdowns led to increased demand. Gold prices spiked to an all-time high over the summer as countries took on record debt in response to the pandemic, only to revert back later in the year. The U.S. dollar fell from a peak seen at the height of the pandemic as “risk-on” assets recovered over the remainder of the 12 months.
The Fund’s largest allocations were in the SIMT High Yield Bond Fund and SIMT U.S. Managed Volatility Fund. The SIMT U.S Managed Volatility Fund is designed to achieve equity-like returns with lower levels of volatility than its respective benchmark. The fund performed well in absolute terms given its exposure to U.S. equity markets in general. However, the U.S. Managed Volatility fund lagged its respective benchmarks on a relative basis as higher-volatility stocks rebounded from the March 2020 market lows to a greater degree. The SIMT High Yield Bond Fund performed strongly on an absolute basis over the period as credit spreads tightened and credit assets were rewarded during the “risk-on” period. Continued and increasing expectations of a recovery in economic growth helped push prices in these assets higher. The smallest contributors to absolute performance were money markets and short duration fixed income, as higher-risk assets generally outperformed.
The Fund is designed to have exposure to a range of asset classes, not all of which are reflected in the primary benchmark of the Fund. Although it trailed the primary benchmark, the Fund’s overall performance was in line with our expectations for the Fund’s asset allocation.
| 12 | SEI Asset Allocation Trust / Annual Report / March 31, 2021 |
| AVERAGE ANNUAL TOTAL RETURN1 | ||||||||||||||||||
| One Year Return | Annualized 3-Year Return | Annualized 5-Year Return | Annualized 10-Year Return | Annualized Inception to Date | ||||||||||||||
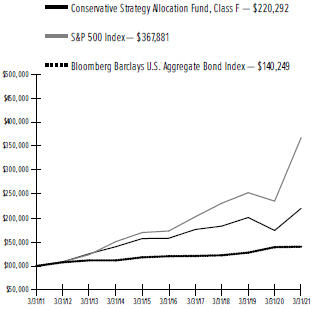
| Conservative Strategy Allocation Fund, Class F | 26.55% | 6.33% | 6.88% | 8.22% | 7.55% | |||||||||||||
| S&P 500 Index* | 56.35% | 16.78% | 16.29% | 13.91% | 10.21% | |||||||||||||
| Bloomberg Barclays U.S. Aggregate Bond Index** | 0.71% | 4.65% | 3.10% | 3.44% | 4.08% | |||||||||||||
Comparison of Change in the Value of a $100,000 Investment in the Conservative Strategy Allocation Fund, Class F, the S&P 500 Index, and the Bloomberg Barclays U.S. Aggregate Bond Index
| ¹ | For the year ended March 31, 2020. Past performance is no indication of future performance. Class F (formerly Class A) shares were offered beginning November 17, 2003. Returns shown do not reflect the deduction of taxes that a shareholder would pay on Fund distributions or the redemption of Fund Shares. |
| * | The S&P 500 Index is designed to measure performance of the broad domestic economy through changes in the aggregate market value of 500 stocks representing all major industries. |
| ** | The Bloomberg Barclays U.S. Aggregate Bond Index is a widely-recognized, market value-weighted (higher market value bonds have more influence than lower market value bonds) index of U.S. government obligations, corporate debt securities, and AAA rated mortgage-backed securities. All securities in the index are rated investment grade (BBB) or higher, with maturities of at least one year. |
| SEI Asset Allocation Trust / Annual Report / March 31, 2021 | 13 |
MANAGEMENT’S DISCUSSION AND ANALYSIS OF FUND PERFORMANCE
March 31, 2021 (Unaudited)
Moderate Strategy Fund
I. Objective
The Moderate Strategy Fund (the “Fund”) seeks capital appreciation while managing the risk of loss.
II. Investment Approach
The Fund’s assets are managed under the direction of SEI Investments Management Corporation (“SIMC”), which manages the Fund’s assets in a way that it believes will achieve the Fund’s investment objective. In order to achieve its investment objective, SIMC allocates the Fund’s assets among certain underlying SEI funds. These underlying SEI funds, in turn, invest directly in securities in accordance with their own varying investment objectives and policies. SIMC may change the allocations to the particular asset classes represented by the underlying SEI funds when it deems it appropriate. The underlying SEI funds are separately managed series of the following investment companies: SEI Institutional Managed Trust (“SIMT”), SEI Institutional International Trust (“SIT”) and SEI Daily Income Trust (“SDIT”).
III. Return vs. Benchmark
For the full year ended March 31, 2021, the Fund’s Class F shares returned 16.32%. The Fund’s primary benchmark—the Bloomberg Barclays US Aggregate Bond Index, which tracks the performance of the investment-grade, U.S. dollar-denominated, fixed-rate taxable bond market—returned 0.71%.
IV. Fund Attribution
Asset class performance was strong during the reporting period ending March 31, 2021. As noted in the shareholder letter, the fiscal year started off with lockdowns and uncertainty across the globe, but despite concerns, global equities roared back after the pandemic-driven market correction. This was largely due to the easing of monetary policy, highly supportive fiscal policies, lockdown restrictions slowly reversing, and vaccine and therapeutic developments. In general, equity markets recovered from the correction by the fall of 2020, with brief selloffs in September and October. U.S. and emerging-market equities performed the strongest, followed by developed markets outside the U.S.
Global credit and high-yield fixed income produced positive returns during the period. Between March and December, the Federal Reserve’s (“Fed”) portfolio increased from roughly $4 trillion to over $6.5 trillion. Additionally, throughout the second half of 2020
and into 2021, the Fed continued its direct lending to major corporate firms, as well as its Main Street Lending Program to support small- and mid-sized businesses. On the European front, in response to COVID-19, the European Central Bank, through its Pandemic Emergency Purchase Programme, increased its stimulus total to €1850 billion by the end of 2020. In this reflationary environment, global commodities produced strong returns over the fiscal year. As noted in the shareholder letter, oil prices dropped significantly at the start of the 12 months as the pandemic drove oil demand to its lowest levels in over 20 years; however, crude climbed steadily higher through the end of the period as the ease in lockdowns led to increased demand. Gold prices spiked to an all-time high over the summer as countries took on record debt in response to the pandemic, only to revert back later in the year. The U.S. dollar fell from a peak seen at the height of the pandemic as “risk-on” assets recovered over the remainder of the 12 months.
The Fund’s largest allocations were in the SIMT Core Fixed Income Fund, SIMT Multi-Asset Accumulation Fund and SIMT Global Managed Volatility Fund, and all three funds had positive absolute returns. The largest absolute contributors overall were the SIMT Global Managed Volatility Fund, SIMT U.S. Managed Volatility Fund, SIMT Multi-Asset Accumulation Fund and SIMT Large Cap Fund. The Managed Volatility funds are designed to achieve equity-like returns with lower levels of volatility than their respective benchmarks. The funds performed well in absolute terms given their exposure to broad equity markets. However, the Managed Volatility funds lagged their respective benchmarks on a relative basis as higher volatility stocks rebounded from the March 2020 market lows to a greater degree. The SIMT Multi-Asset Accumulation Fund and SIMT Large Cap Fund also benefited on an absolute basis from their equity exposure given the general “risk-on” environment over the fiscal year. The SIMT Large Cap Fund underperformed its benchmark on a relative basis over the period as technology and “stay-at-home” stocks showed more resiliency during the pandemic versus traditional value stocks.
The SIMT Multi-Asset Income Fund, SIMT High Yield Bond Fund and SIMT Multi-Asset Inflation Managed Fund also performed well on an absolute basis as credit risk and commodity exposure were rewarded during the recovery. Continued and increasing expectations of a recovery in economic growth helped push prices in these assets higher. The smallest contributors to absolute performance were money markets and short
| 14 | SEI Asset Allocation Trust / Annual Report / March 31, 2021 |
duration fixed income, as higher-risk assets generally outperformed.
There were no tactical tilts during the reporting period.
The Fund outperformed the Bloomberg Barclays U.S. Aggregate Bond Index over the fiscal year, as all funds except SDIT Government Fund and SIMT Conservative Income Fund outperformed the Fund’s primary benchmark.
| AVERAGE ANNUAL TOTAL RETURN1 | ||||||||||||||||||
| One Year Return | Annualized 3-Year Return | Annualized 5-Year Return | Annualized 10-Year Return | Annualized Inception to Date | ||||||||||||||
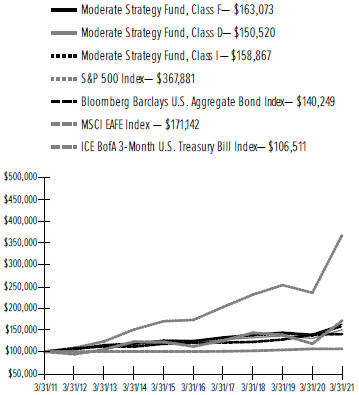
| Moderate Strategy Fund, Class F | 16.32% | 5.22% | 5.34% | 5.01% | 4.78% | |||||||||||||
| Moderate Strategy Fund, Class D | 15.40% | 4.42% | 4.55% | 4.17% | 3.74% | |||||||||||||
| Moderate Strategy Fund, Class I | 15.91% | 4.91% | 5.06% | 4.74% | 4.66% | |||||||||||||
| S&P 500 Index* | 56.35% | 16.78% | 16.29% | 13.91% | 10.21% | |||||||||||||
| Bloomberg Barclays U.S. Aggregate Bond Index** | 0.71% | 4.65% | 3.10% | 3.44% | 4.08% | |||||||||||||
| MSCI EAFE Index*** | 44.57% | 6.02% | 8.85% | 5.52% | 6.56% | |||||||||||||
| ICE BofA 3-Month U.S. Treasury Bill Index**** | 0.12% | 1.49% | 1.19% | 0.63% | 1.32% | |||||||||||||
Comparison of Change in the Value of a $100,000 Investment in the Moderate Strategy Fund, Class F, Class D and Class I, the Bloomberg Barclays U.S. Aggregate Bond Index, the S&P 500 Index, the MSCI EAFE Index, and the ICE BofA 3-Month U.S. Treasury Bill Index
| ¹ | For the year ended March 31, 2021. Past performance is no indication of future performance. Class F (formerly Class A) and Class I shares were offered beginning November 17, 2003. The Fund’s Class D Shares commenced operations on March 25, 2011. For periods prior to March 25, 2011, the performance of the Fund’s Class F Shares, adjusted for the higher total annual fund operating expenses of the Class D Shares has been used. Returns for Class D Shares would have been substantially similar to those of Class F Shares and would have differed only to the extent that Class D Shares have higher total annual fund operating expenses than Class F Shares. Returns shown do not reflect the deduction of taxes that a shareholder would pay on Fund distributions or the redemption of Fund Shares. |
| * | The S&P 500 Index is designed to measure performance of the broad domestic economy through changes in the aggregate market value of 500 stocks representing all major industries. |
| ** | The Bloomberg Barclays U.S. Aggregate Bond Index is a widely-recognized, market value-weighted (higher market value bonds have more influence than lower market value bonds) index of U.S. government obligations, corporate debt securities, and AAA rated mortgage-backed securities. All securities in the index are rated investment grade (BBB) or higher, with maturities of at least one year. |
| *** | The MSCI EAFE Index is a widely-recognized, capitalization-weighted (companies with larger market capitalizations have more influence than those with smaller capitalizations) index of over 1,000 securities listed on the stock exchanges in Europe, Australasia and the Far East. |
| **** | The ICE BofA 3-Month U.S. Treasury Bill Index measures total return on cash, including price and interest income, based on short-term government Treasury Bills of about 90-day maturity. |
| SEI Asset Allocation Trust / Annual Report / March 31, 2021 | 15 |
MANAGEMENT’S DISCUSSION AND ANALYSIS OF FUND PERFORMANCE
March 31, 2021 (Unaudited)
Moderate Strategy Allocation Fund
I. Objective
The Moderate Strategy Allocation Fund (the “Fund”) seeks to provide the opportunity for capital appreciation with some opportunity to generate income.
II. Investment Approach
The Fund’s assets are managed under the direction of SEI Investments Management Corporation (“SIMC”), which manages the Fund’s assets in a way that it believes will achieve the Fund’s investment objective. In order to achieve its investment objective, SIMC allocates the Fund’s assets among certain underlying SEI funds. These underlying SEI funds, in turn, invest directly in securities in accordance with their own varying investment objectives and policies. SIMC may change the allocations to the particular asset classes represented by the underlying SEI funds when it deems it appropriate. The underlying SEI funds are separately managed series of the following investment companies: SEI Institutional Managed Trust (“SIMT”), SEI Institutional International Trust (“SIT”) and SEI Daily Income Trust (“SDIT”).
III. Return vs. Benchmark
For the full year ended March 31, 2021, the Fund’s Class F shares returned 32.25%. The Fund’s primary benchmark—the S&P 500 Index (Gross), which tracks the performance of approximately 500 large U.S. companies that are considered representative of the broad U.S. stock market—returned 56.35%.
IV. Fund Attribution
Asset class performance was strong during the reporting period ending March 31, 2021. As noted in the shareholder letter, the fiscal year started off with lockdowns and uncertainty across the globe, but despite concerns, global equities roared back after the pandemic-driven market correction. This was largely due to the easing of monetary policy, highly supportive fiscal policies, lockdown restrictions slowly reversing, and vaccine and therapeutic developments. In general, equity markets recovered from the correction by the fall of 2020, with brief selloffs in September and October. U.S. and emerging-market equities performed the strongest, followed by developed markets outside the U.S.
Global credit and high-yield fixed income produced positive returns during the period. Between March and December, the Federal Reserve’s (“Fed”) portfolio increased from roughly $4 trillion to over $6.5 trillion.
Additionally, throughout the second half of 2020 and into 2021, the Fed continued its direct lending to major corporate firms, as well as its Main Street Lending Program to support small- and mid-sized businesses. On the European front, in response to COVID-19, the European Central Bank, through its Pandemic Emergency Purchase Programme, increased its stimulus total to €1850 billion by the end of 2020. In this reflationary environment, global commodities produced strong returns over the fiscal year. As noted in the shareholder letter, oil prices dropped significantly at the start of the 12 months as the pandemic drove oil demand to its lowest levels in over 20 years; however, crude climbed steadily higher through the end of the period as the ease in lockdowns led to increased demand. Gold prices spiked to an all-time high over the summer as countries took on record debt in response to the pandemic, only to revert back later in the year. The U.S. dollar fell from a peak seen at the height of the pandemic as “risk-on” assets recovered over the remainder of the 12 months.
The Fund’s largest allocations were in the SIMT U.S. Managed Volatility Fund and SIMT High Yield Bond Fund, while the top absolute contributors were the SIMT U.S. Managed Volatility Fund and SIMT Large Cap Fund. The Managed Volatility Fund is designed to achieve equity-like returns with lower levels of volatility than its respective benchmark. The fund performed well in absolute terms given its exposure to U.S. equity markets in general. However, the U.S. Managed Volatility Fund lagged its respective benchmark on a relative basis as higher-volatility stocks rebounded from the March 2020 market lows to a greater degree. The SIMT Large Cap Fund also benefited on an absolute basis from its equity exposure given the general “risk-on” environment over the fiscal year. The SIMT Large Cap Fund underperformed its benchmark on a relative basis over the period as technology and “stay-at-home” stocks showed more resiliency during the pandemic versus traditional value stocks. The SIMT High Yield Bond Fund performed strongly on an absolute basis over the period as credit spreads tightened and credit assets were rewarded during the “risk-on” period. Continued and increasing expectations of a recovery in economic growth helped push prices in these assets higher. The smallest contributors to absolute performance were money markets and short duration fixed income, as higher-risk assets generally outperformed.
The Fund is designed to have exposure to a range of asset classes, not all of which are reflected in the primary benchmark of the Fund. Although it trailed the primary
| 16 | SEI Asset Allocation Trust / Annual Report / March 31, 2021 |
benchmark, the Fund’s overall performance was in line with our expectations for the Fund’s asset allocation.
| AVERAGE ANNUAL TOTAL RETURN1 | ||||||||||||||||||
| One Year Return | Annualized 3-Year Return | Annualized 5-Year Return | Annualized 10-Year Return | Annualized Inception to Date | ||||||||||||||
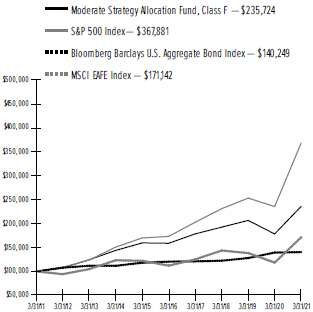
| Moderate Strategy Allocation Fund, Class F | 32.25% | 7.02% | 8.23% | 8.95% | 7.64% | |||||||||||||
| S&P 500 Index* | 56.35% | 16.78% | 16.29% | 13.91% | 10.21% | |||||||||||||
| Bloomberg Barclays U.S. Aggregate Bond Index** | 0.71% | 4.65% | 3.10% | 3.44% | 4.08% | |||||||||||||
| MSCI EAFE Index*** | 44.57% | 6.02% | 8.85% | 5.52% | 6.56% | |||||||||||||
Comparison of Change in the Value of a $100,000 Investment in the Moderate Strategy Allocation Fund, Class F, the S&P 500 Index, the Bloomberg Barclays U.S. Aggregate Bond Index, and the MSCI EAFE Index
| ¹ | For the year ended March 31, 2021. Past performance is no indication of future performance. Class F (formerly Class A) shares were offered beginning November 17, 2003. Returns shown do not reflect the deduction of taxes that a shareholder would pay on Fund distributions or the redemption of Fund Shares. |
| * | The S&P 500 Index is designed to measure performance of the broad domestic economy through changes in the aggregate market value of 500 stocks representing all major industries. |
| ** | The Bloomberg Barclays U.S. Aggregate Bond Index is a widely-recognized, market value-weighted (higher market value bonds have more influence than lower market value bonds) index of U.S. government obligations, corporate debt securities, and AAA rated mortgage-backed securities. All securities in the index are rated investment grade (BBB) or higher, with maturities of at least one year. |
| *** | The MSCI EAFE Index is a widely-recognized, capitalization-weighted (companies with larger market capitalizations have more influence than those with smaller capitalizations) index of over 1,000 securities listed on the stock exchanges in Europe, Australasia and the Far East. |
| SEI Asset Allocation Trust / Annual Report / March 31, 2021 | 17 |
MANAGEMENT’S DISCUSSION AND ANALYSIS OF FUND PERFORMANCE
March 31, 2021 (Unaudited)
Aggressive Strategy Fund
I. Objective
The Aggressive Strategy Fund (the “Fund”) seeks to generate long-term capital appreciation.
II. Investment Approach
The Fund’s assets are managed under the direction of SEI Investments Management Corporation (“SIMC”), which manages the Fund’s assets in a way that it believes will achieve the Fund’s investment objective. In order to achieve its investment objective, SIMC allocates the Fund’s assets among certain underlying SEI funds. These underlying SEI funds, in turn, invest directly in securities in accordance with their own varying investment objectives and policies. SIMC may change the allocations to the particular asset classes represented by the underlying SEI funds when it deems it appropriate. The underlying SEI funds are separately managed series of the following investment companies: SEI Institutional Managed Trust (“SIMT”), SEI Institutional International Trust (“SIT”) and SEI Daily Income Trust (“SDIT”).
III. Return vs. Benchmark
For the full year ended March 31, 2021, the Fund’s Class F shares returned 43.43%. The Fund’s primary benchmark—the S&P 500 Index (Gross), which tracks the performance of approximately 500 large U.S. companies that are considered representative of the broad U.S. stock market—returned 56.35%.
IV. Fund Attribution
Asset class performance was strong during the reporting period ending March 31, 2021. As noted in the shareholder letter, the fiscal year started off with lockdowns and uncertainty across the globe, but despite concerns, global equities roared back after the pandemic-driven market correction. This was largely due to the easing of monetary policy, highly supportive fiscal policies, lockdown restrictions slowly reversing, and vaccine and therapeutic developments. In general, equity markets recovered from the correction by the fall of 2020, with brief selloffs in September and October. U.S. and emerging-market equities performed the strongest, followed by developed markets outside the U.S.
Global credit and high-yield fixed income produced positive returns during the period. Between March and December, the Federal Reserve’s (“Fed”) portfolio increased from roughly $4 trillion to over $6.5 trillion. Additionally, throughout the second half of 2020
and into 2021, the Fed continued its direct lending to major corporate firms, as well as its Main Street Lending Program to support small- and mid-sized businesses. On the European front, in response to COVID-19, the European Central Bank, through its Pandemic Emergency Purchase Programme, increased its stimulus total to €1850 billion by the end of 2020. In this reflationary environment, global commodities produced strong returns over the fiscal year. As noted in the shareholder letter, oil prices dropped significantly at the start of the 12 months as the pandemic drove oil demand to its lowest levels in over 20 years; however, crude climbed steadily higher through the end of the period as the ease in lockdowns led to increased demand. Gold prices spiked to an all-time high over the summer as countries took on record debt in response to the pandemic, only to revert back later in the year. The U.S. dollar fell from a peak seen at the height of the pandemic as “risk-on” assets recovered over the remainder of the 12 months.
The Fund’s largest allocations were in the SIMT Large Cap Fund, SIT International Equity Fund and SIMT Multi-Asset Accumulation Fund. All three funds had positive absolute returns. The largest contributors overall in absolute terms were the SIMT Large Cap Fund, SIT International Equity Fund, SIMT Small Cap Fund and SIMT Dynamic Asset Allocation Fund. These funds performed well given their exposure to equities, which was the best performing asset class for the period. Generally, technology and “stay-at-home” stocks outperformed during 2020, while some of the more value-oriented and cyclical names showed some positive momentum toward the end of 2020 and through the first quarter of 2021. This caused the SIMT Large Cap Fund to underperform its benchmark on a relative basis. The SIMT Dynamic Asset Allocation Fund had positive relative performance as it benefited from exposures to gold, broad commodities and a steeper U.S. yield curve. The other equity funds were also large absolute contributors.
The SIMT High Yield Bond Fund and SIMT Multi-Asset Inflation Managed Fund also performed well on an absolute basis as credit risk and commodity exposure were rewarded during the recovery. Continued and increasing expectations of a recovery in economic growth helped push prices in these assets higher. The smallest contributors to absolute performance were the SIT Emerging Markets Debt Portfolio and SIMT Core Fixed Income Fund. Fixed-income assets generally did not perform as well as equity assets during the period.
| 18 | SEI Asset Allocation Trust / Annual Report / March 31, 2021 |
The Fund underperformed its primary benchmark, the S&P 500 Index, over the fiscal year as underlying fund performance was mixed relative to the primary benchmark. The SIMT Small Cap Fund, SIT Emerging Markets Equity Fund, SIMT Dynamic Asset Allocation Fund, SIMT Large Cap Fund and SIT International Equity Fund all outperformed the S&P 500 Index. All other funds underperformed relative to the index.
| AVERAGE ANNUAL TOTAL RETURN1 | ||||||||||||||||||
| One Year Return | Annualized 3-Year Return | Annualized 5-Year Return | Annualized 10-Year Return | Annualized Inception to Date | ||||||||||||||
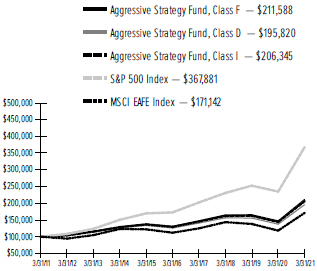
| Aggressive Strategy Fund, Class F | 43.43% | 8.57% | 10.05% | 7.78% | 6.74% | |||||||||||||
| Aggressive Strategy Fund, Class D | 42.37% | 7.76% | 9.23% | 6.95% | 5.69% | |||||||||||||
| Aggressive Strategy Fund, Class I | 43.13% | 8.31% | 9.76% | 7.51% | 6.42% | |||||||||||||
| S&P 500 Index* | 56.35% | 16.78% | 16.29% | 13.91% | 10.21% | |||||||||||||
| MSCI EAFE Index** | 44.57% | 6.02% | 8.85% | 5.52% | 6.56% | |||||||||||||
Comparison of Change in the Value of a $100,000 Investment in the Aggressive Strategy Fund, Class F, Class D and Class I, versus the S&P 500 Index and the MSCI EAFE Index
| ¹ | For the year ended March 31, 2021. Past performance is no indication of future performance. Class F (formerly Class A) and Class I shares were offered beginning November 17, 2003. The Fund’s Class D Shares commenced operations on March 25, 2011. For periods prior to March 25, 2011, the performance of the Fund’s Class F Shares, adjusted for the higher total annual fund operating expenses of the Class D Shares has been used. Returns for Class D Shares would have been substantially similar to those of Class F Shares and would have differed only to the extent that Class D Shares have higher total annual fund operating expenses than Class F Shares. Returns shown do not reflect the deduction of taxes that a shareholder would pay on Fund distributions or the redemption of Fund Shares. |
| * | The S&P 500 Index is designed to measure performance of the broad domestic economy through changes in the aggregate market value of 500 stocks representing all major industries. |
| ** | The MSCI EAFE Index is a widely-recognized, capitalization-weighted (companies with larger market capitalizations have more influence than those with smaller capitalizations) index of over 1,000 securities listed on the stock exchanges in Europe, Australasia and the Far East. |
| SEI Asset Allocation Trust / Annual Report / March 31, 2021 | 19 |
MANAGEMENT’S DISCUSSION AND ANALYSIS OF FUND PERFORMANCE
March 31, 2021 (Unaudited)
Tax-Managed Aggressive Strategy Fund
I. Objective
The Tax-Managed Strategy Fund (the “Fund”) seeks to generate long-term capital appreciation.
Investment Approach
The Fund’s assets are managed under the direction of SEI Investments Management Corporation (“SIMC”), which manages the Fund’s assets in a way that it believes will achieve the Fund’s investment objective. In order to achieve its investment objective, SIMC allocates the Fund’s assets among certain underlying SEI funds. These underlying SEI funds, in turn, invest directly in securities in accordance with their own varying investment objectives and policies. SIMC may change the allocations to the particular asset classes represented by the underlying SEI funds when it deems it appropriate. The underlying SEI funds are separately managed series of the following investment companies: SEI Institutional Managed Trust (“SIMT”), SEI Institutional International Trust (“SIT”) and SEI Daily Income Trust (“SDIT”).
II. Return vs. Benchmark
For the full year ended March 31, 2021, the Fund’s Class F shares returned 54.85%. The Fund’s primary benchmark—the S&P 500 Index (Gross), which tracks the performance of approximately 500 large U.S. companies that are considered representative of the broad U.S. stock market—returned 56.35%.
III. Fund Attribution
Asset class performance was strong during the reporting period ending March 31, 2021. As noted in the shareholder letter, the fiscal year started off with lockdowns and uncertainty across the globe, but despite concerns, global equities roared back after the pandemic-driven market correction. This was largely due to the easing of monetary policy, highly supportive fiscal policies, lockdown restrictions slowly reversing, and vaccine and therapeutic developments. In general, equity markets recovered from the correction by the fall of 2020, with brief selloffs in September and October. U.S. and emerging-market equities markets performed the strongest, followed by developed markets outside the U.S.
Global credit and high-yield fixed income produced positive returns during the period. Between March and December, the Federal Reserve’s (“Fed”) portfolio increased from roughly $4 trillion to over $6.5 trillion. Additionally, throughout the second half of 2020 and into 2021, the Fed continued its direct lending
to major corporate firms, as well as its Main Street Lending Program to support small- and mid-sized businesses. On the European front, in response to COVID-19, the European Central Bank, through its Pandemic Emergency Purchase Programme, increased its stimulus total to €1850 billion by the end of 2020. In this reflationary environment, global commodities produced strong returns over the fiscal year. As noted in the shareholder letter, oil prices dropped significantly at the start of the 12 months as the pandemic drove oil demand to its lowest levels in over 20 years; however, crude climbed steadily higher through the end of the period as the ease in lockdowns led to increased demand. Gold prices spiked to an all-time high over the summer as countries took on record debt in response to the pandemic, only to revert back later in the year. The U.S. dollar fell from a peak seen at the height of the pandemic as “risk-on” assets recovered over the remainder of the 12 months.
The Fund’s largest allocations were in the SIMT Tax-Managed Large Cap Fund, SIT International Equity Fund, and SIMT Tax-Managed Small/Mid Cap Fund. These three funds were also the largest absolute contributors to overall performance over the 12 months. These funds performed well in absolute terms given their exposure to equities, which was the best performing asset class for the fiscal year. Generally, technology and “stay-at-home” stocks outperformed during 2020, while some of the more value-oriented and cyclical names showed some positive momentum toward the end of 2020 and through the first quarter of 2021. This caused both the SIMT Tax-Managed Large Cap Fund and SIMT Tax-Managed Small/ Mid Cap Fund to underperform their benchmarks on a relative basis.
The smallest contributors to absolute performance were the SIT Emerging Markets Debt Portfolio and SIMT High Yield Bond Fund. These funds still performed strongly over the period on an absolute basis as credit spreads tightened and credit assets were rewarded during the “risk-on” period. Continued and increasing expectations of a recovery in economic growth helped push prices in these assets higher.
The Fund is designed to have exposure to a range of asset classes, not all of which are reflected in the primary benchmark of the Fund. Although it trailed the primary benchmark, the Fund’s overall performance was in line with our expectations for the Fund’s asset allocation.
| 20 | SEI Asset Allocation Trust / Annual Report / March 31, 2021 |
| AVERAGE ANNUAL TOTAL RETURN1 | ||||||||||||||||||
| One Year Return | Annualized 3-Year Return | Annualized 5-Year Return | Annualized 10-Year Return | Annualized Inception to Date | ||||||||||||||
| Tax-Managed Aggressive Strategy Fund, Class F | 54.85% | 10.73% | 12.13% | 9.56% | 8.00% | |||||||||||||
| S&P 500 Index* | 56.35% | 16.78% | 16.29% | 13.91% | 10.21% | |||||||||||||
| MSCI EAFE Index** | 44.57% | 6.02% | 8.85% | 5.52% | 6.56% | |||||||||||||
Comparison of Change in the Value of a $100,000 Investment in the Tax-Managed Aggressive Strategy Fund, Class F, the S&P 500 Index, and the MSCI EAFE Index
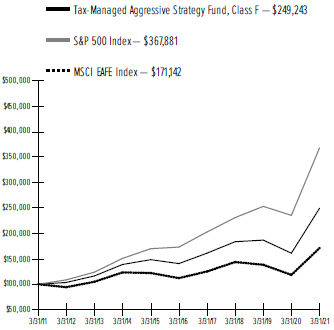
| ¹ | For the year ended March 31, 2021. Past performance is no indication of future performance. Class F (formerly Class A) shares were offered beginning November 17, 2003. Returns shown do not reflect the deduction of taxes that a shareholder would pay on Fund distributions or the redemption of Fund Shares. |
| * | The S&P 500 Index is designed to measure performance of the broad domestic economy through changes in the aggregate market value of 500 stocks representing all major industries. |
| ** | The MSCI EAFE Index is a widely-recognized, capitalization-weighted (companies with larger market capitalizations have more influence than those with smaller capitalizations) index of over 1,000 securities listed on the stock exchanges in Europe, Australasia and the Far East. |
| SEI Asset Allocation Trust / Annual Report / March 31, 2021 | 21 |
MANAGEMENT’S DISCUSSION AND ANALYSIS OF FUND PERFORMANCE
March 31, 2021 (Unaudited)
Core Market Strategy Fund
I. Objective
The Core Market Strategy Fund (the “Fund”) seeks to provide capital appreciation while maintaining broad equity and fixed-income market participation.
II. Investment Approach
The Fund’s assets are managed under the direction of SEI Investments Management Corporation (“SIMC”), which manages the Fund’s assets in a way that it believes will achieve the Fund’s investment objective. In order to achieve its investment objective, SIMC allocates the Fund’s assets among certain underlying SEI funds. These underlying SEI funds, in turn, invest directly in securities in accordance with their own varying investment objectives and policies. SIMC may change the allocations to the particular asset classes represented by the underlying SEI funds when it deems it appropriate. The underlying SEI funds are separately managed series of the following investment companies: SEI Institutional Managed Trust (“SIMT”), SEI Institutional International Trust (“SIT”) and SEI Daily Income Trust (“SDIT”).
III. Return vs. Benchmark
For the full year ended March 31, 2021, the Fund’s Class F shares returned 26.72%. The Fund’s primary benchmark—the Bloomberg Barclays US Aggregate Bond Index, which tracks the performance of the investment-grade, U.S. dollar-denominated, fixed-rate taxable bond market—returned 0.71%.
IV. Fund Attribution
Asset class performance was strong during the reporting period ending March 31, 2021. As noted in the shareholder letter, the fiscal year started off with lockdowns and uncertainty across the globe, but despite concerns, global equities roared back after the pandemic-driven market correction. This was largely due to the easing of monetary policy, highly supportive fiscal policies, lockdown restrictions slowly reversing, and vaccine and therapeutic developments. In general, equity markets recovered from the correction by the fall of 2020, with brief selloffs in September and October. U.S. and emerging-market equities performed the strongest, followed by developed markets outside the U.S.
Global credit and high-yield fixed income produced positive returns during the period. Between March and December, the Federal Reserve’s (“Fed”) portfolio increased from roughly $4 trillion to over $6.5 trillion.
Additionally, throughout the second half of 2020 and into 2021, the Fed continued its direct lending to major corporate firms, as well as its Main Street Lending Program to support small- and mid-sized businesses. On the European front, in response to COVID-19, the European Central Bank, through its Pandemic Emergency Purchase Programme, increased its stimulus total to €1850 billion by the end of 2020. In this reflationary environment, global commodities produced strong returns over the fiscal year. As noted in the shareholder letter, oil prices dropped significantly at the start of the 12 months as the pandemic drove oil demand to its lowest levels in over 20 years; however, crude climbed steadily higher through the end of the period as the ease in lockdowns led to increased demand. Gold prices spiked to an all-time high over the summer as countries took on record debt in response to the pandemic, only to revert back later in the year. The U.S. dollar fell from a peak seen at the height of the pandemic as “risk-on” assets recovered over the remainder of the 12 months.
The Fund’s largest allocations were in the SIMT Core Fixed Income Fund, SIMT Multi-Asset Accumulation Fund and SIMT Large Cap Fund, and all three funds had positive absolute returns. The largest absolute contributors overall were the SIMT Large Cap Fund, SIT International Equity Fund, SIMT Multi-Asset Accumulation Fund and SIMT Dynamic Asset Allocation Fund. These funds performed well in absolute terms given their exposure to equities, which was the best performing asset class for the period. Generally, technology and “stay-at-home” stocks outperformed during 2020, while some of the more value-oriented and cyclical names showed positive momentum toward the end of 2020 and during the first quarter of 2021. This caused the SIMT Large Cap Fund to underperform its benchmark on a relative basis. The SIMT Dynamic Asset Allocation Fund had positive relative performance as it benefited from exposures to gold, broad commodities and a steeper U.S. yield curve. The other equity funds were also large absolute contributors.
The SIMT Multi-Asset Income Fund, SIMT High Yield Bond Fund and SIMT Multi-Asset Inflation Managed Fund also performed well on an absolute basis as credit risk and commodity exposure were rewarded during the recovery. Continued and increasing expectations of a recovery in economic growth helped push prices in these assets higher. The smallest contributors to absolute performance were the SIT Emerging Markets Debt Portfolio and SIMT Core Fixed Income Fund. Fixed-
| 22 | SEI Asset Allocation Trust / Annual Report / March 31, 2021 |
income assets generally did not perform as well as equities during the period.
The Fund outperformed the Bloomberg Barclays U.S. Aggregate Bond Index over the fiscal year, as all funds outperformed the Fund’s primary benchmark.
| AVERAGE ANNUAL TOTAL RETURN1 | ||||||||||||||||||
| One Year Return | Annualized 3-Year Return | Annualized 5-Year Return | Annualized 10-Year Return | Annualized Inception to Date | ||||||||||||||
| Core Market Strategy Fund, Class F | 26.72% | 6.90% | 7.30% | 5.79% | 5.48% | |||||||||||||
| Core Market Strategy Fund, Class I | 27.44% | 7.38% | 7.50% | 5.96% | 5.75% | |||||||||||||
| S&P 500 Index* | 56.35% | 16.78% | 16.29% | 13.91% | 10.21% | |||||||||||||
| Bloomberg Barclays U.S. Aggregate Bond Index** | 0.71% | 4.65% | 3.10% | 3.44% | 4.08% | |||||||||||||
| MSCI EAFE Index*** | 44.57% | 6.02% | 8.85% | 5.52% | 6.56% | |||||||||||||
Comparison of Change in the Value of a $100,000 Investment in the Core Market Strategy Fund, Class F and Class I, versus the S&P 500 Index, the Bloomberg Barclays U.S. Aggregate Bond Index and the MSCI EAFE Index
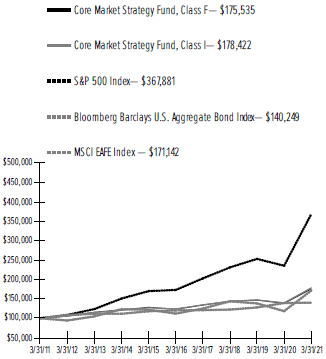
| ¹ | For the year ended March 31, 2021. Past performance is no indication of future performance. Class F (formerly Class A) and Class I shares were offered beginning November 17, 2003. Returns shown do not reflect the deduction of taxes that a shareholder would pay on Fund distributions or the redemption of Fund Shares. |
| * | The S&P 500 Index is designed to measure performance of the broad domestic economy through changes in the aggregate market value of 500 stocks representing all major industries. |
| ** | The Bloomberg Barclays U.S. Aggregate Bond Index is a widely-recognized, market value-weighted (higher market value bonds have more influence than lower market value bonds) index of U.S. government obligations, corporate debt securities, and AAA rated mortgage-backed securities. All securities in the index are rated investment grade (BBB) or higher, with maturities of at least one year. |
| *** | The MSCI EAFE Index is a widely-recognized, capitalization-weighted (companies with larger market capitalizations have more influence than those with smaller capitalizations) index of over 1,000 securities listed on the stock exchanges in Europe, Australasia and the Far East. |
| SEI Asset Allocation Trust / Annual Report / March 31, 2021 | 23 |
MANAGEMENT’S DISCUSSION AND ANALYSIS OF FUND PERFORMANCE
March 31, 2021 (Unaudited)
Core Market Strategy Allocation Fund
I. Objective
The Core Market Strategy Allocation Fund (the “Fund”) seeks to provide the opportunity for capital appreciation with some opportunity to generate income.
II. Investment Approach
The Fund’s assets are managed under the direction of SEI Investments Management Corporation (“SIMC”), which manages the Fund’s assets in a way that it believes will achieve the Fund’s investment objective. In order to achieve its investment objective, SIMC allocates the Fund’s assets among certain underlying SEI funds. These underlying SEI funds, in turn, invest directly in securities in accordance with their own varying investment objectives and policies. SIMC may change the allocations to the particular asset classes represented by the underlying SEI funds when it deems it appropriate. The underlying SEI funds are separately managed series of the following investment companies: SEI Institutional Managed Trust (“SIMT”), SEI Institutional International Trust (“SIT”) and SEI Daily Income Trust (“SDIT”).
III. Return vs. Benchmark
For the full year ended March 31, 2021, the Fund’s Class F shares returned 54.79%. The Fund’s primary benchmark—the S&P 500 Index (Gross), which tracks the performance of approximately 500 large U.S. companies that are considered representative of the broad U.S. stock market—returned 56.35%.
IV. Fund Attribution
Asset class performance was strong during the reporting period ending March 31, 2021. As noted in the shareholder letter, the fiscal year started off with lockdowns and uncertainty across the globe, but despite concerns, global equities roared back after the pandemic-driven market correction. This was largely due to the easing of monetary policy, highly supportive fiscal policies, lockdown restrictions slowly reversing, and vaccine and therapeutic developments. In general, equity markets recovered from the correction by the fall of 2020, with brief selloffs in September and October. U.S. and emerging-market equities performed the strongest, followed by developed markets outside the U.S.
Global credit and high-yield fixed income produced positive returns during the period. Between March and December, the Federal Reserve’s (“Fed”) portfolio increased from roughly $4 trillion to over $6.5 trillion.
Additionally, throughout the second half of 2020 and into 2021, the Fed continued its direct lending to major corporate firms, as well as its Main Street Lending Program to support small- and mid-sized businesses. On the European front, in response to COVID-19, the European Central Bank, through its Pandemic Emergency Purchase Programme, increased its stimulus total to €1850 billion by the end of 2020. In this reflationary environment, global commodities produced strong returns over the fiscal year. As noted in the shareholder letter, oil prices dropped significantly at the start of the 12 months as the pandemic drove oil demand to its lowest levels in over 20 years; however, crude climbed steadily higher through the end of the period as the ease in lockdowns led to increased demand. Gold prices spiked to an all-time high over the summer as countries took on record debt in response to the pandemic, only to revert back later in the year. The U.S. dollar fell from a peak seen at the height of the pandemic as “risk-on” assets recovered over the remainder of the 12 months.
The Fund’s largest allocations were in the SIMT Tax-Managed Large Cap Fund, SIT International Equity Fund, and SIMT Tax-Managed Small/Mid Cap Fund. These three funds were also the largest absolute contributors to overall performance. These funds performed well in absolute terms given their exposure to equities, which was the best performing asset class over the 12 months. Generally, technology and “stay-at-home” stocks outperformed through 2020, while the more value-oriented and cyclical names showed positive momentum toward the end of 2020 and through the first quarter of 2021. This caused both the SIMT Tax-Managed Large Cap Fund and SIMT Tax-Managed Small/Mid Cap Fund to underperform their benchmarks on a relative basis.
The smallest contributors to absolute performance were the SIT Emerging Markets Debt Portfolio and SIMT High Yield Bond Fund. These funds performed strongly on an absolute basis over the period as credit spreads tightened and credit assets were rewarded during the “risk-on” period. Continued and increasing expectations of a recovery in economic growth helped push prices in these assets higher.
The Fund is designed to have exposure to a range of asset classes, not all of which are reflected in the primary benchmark of the Fund. Although it trailed the primary benchmark, the Fund’s overall performance was in line with our expectations for the Fund’s asset allocation.
| 24 | SEI Asset Allocation Trust / Annual Report / March 31, 2021 |
| AVERAGE ANNUAL TOTAL RETURN1 | ||||||||||||||||||
| One Year Return | Annualized 3-Year Return | Annualized 5-Year Return | Annualized 10-Year Return | Annualized Inception to Date | ||||||||||||||
| Core Market Strategy Allocation Fund, Class F | 54.79% | 10.69% | 12.10% | 9.57% | 7.52% | |||||||||||||
| S&P 500 Index* | 56.35% | 16.78% | 16.29% | 13.91% | 10.21% | |||||||||||||
| Bloomberg Barclays U.S. Aggregate Bond Index** | 0.71% | 4.65% | 3.10% | 3.44% | 4.08% | |||||||||||||
| MSCI EAFE Index*** | 44.57% | 6.02% | 8.85% | 5.52% | 6.56% | |||||||||||||
Comparison of Change in the Value of a $100,000 Investment in the Core Market Strategy Allocation Fund, Class F, versus the S&P 500 Index, the Bloomberg Barclays U.S. Aggregate Bond Index and the MSCI EAFE Index
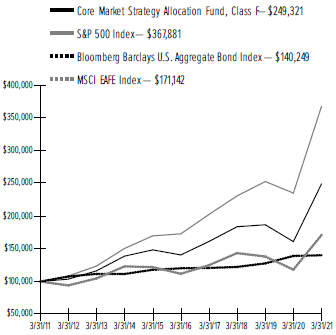
| ¹ | For the period ended March 31, 2021. Past performance is no indication of future performance. Class F (formerly Class A) shares were offered beginning November 17, 2003. Returns shown do not reflect the deduction of taxes that a shareholder would pay on Fund distributions or the redemption of Fund Shares. |
| * | The S&P 500 Index is designed to measure performance of the broad domestic economy through changes in the aggregate market value of 500 stocks representing all major industries. |
| ** | The Bloomberg Barclays U.S. Aggregate Bond Index is a widely-recognized, market value-weighted (higher market value bonds have more influence than lower market value bonds) index of U.S. government obligations, corporate debt securities, and AAA rated mortgage-backed securities. All securities in the index are rated investment grade (BBB) or higher, with maturities of at least one year. |
| *** | The MSCI EAFE Index is a widely-recognized, capitalization-weighted (companies with larger market capitalizations have more influence than those with smaller capitalizations) index of over 1,000 securities listed on the stock exchanges in Europe, Australasia and the Far East. |
| SEI Asset Allocation Trust / Annual Report / March 31, 2021 | 25 |
MANAGEMENT’S DISCUSSION AND ANALYSIS OF FUND PERFORMANCE
March 31, 2021 (Unaudited)
Market Growth Strategy Fund
I. Objective
The Market Growth Strategy Fund (the “Fund”) seeks to generate capital appreciation while maintaining broad equity and fixed income market participation.
II. Investment Approach
The Fund’s assets are managed under the direction of SEI Investments Management Corporation (“SIMC”), which manages the Fund’s assets in a way that it believes will achieve the Fund’s investment objective. In order to achieve its investment objective, SIMC allocates the Fund’s assets among certain underlying SEI funds. These underlying SEI funds, in turn, invest directly in securities in accordance with their own varying investment objectives and policies. SIMC may change the allocations to the particular asset classes represented by the underlying SEI funds when it deems it appropriate. The underlying SEI funds are separately managed series of the following investment companies: SEI Institutional Managed Trust (“SIMT”), SEI Institutional International Trust (“SIT”) and SEI Daily Income Trust (“SDIT”).
III. Return vs. Benchmark
For the full year ended March 31, 2021, the Fund’s Class F shares returned 33.05%. The Fund’s primary benchmark—the S&P 500 Index (Gross), which tracks the performance of approximately 500 large U.S. companies that are considered representative of the broad U.S. stock market—returned 56.35%.
IV. Fund Attribution
Asset class performance was strong during the reporting period ending March 31, 2021. As noted in the shareholder letter, the fiscal year started off with lockdowns and uncertainty across the globe, but despite concerns, global equities roared back after the pandemic-driven market correction. This was largely due to the easing of monetary policy, highly supportive fiscal policies, lockdown restrictions slowly reversing, and vaccine and therapeutic developments. In general, equity markets recovered from the correction by the fall of 2020, with brief selloffs in September and October. U.S. and emerging-market equities performed the strongest, followed by developed markets outside the U.S.
Global credit and high-yield fixed income produced positive returns during the period. Between March and December, the Federal Reserve’s (“Fed”) portfolio increased from roughly $4 trillion to over $6.5 trillion.
Additionally, throughout the second half of 2020 and into 2021, the Fed continued its direct lending to major corporate firms, as well as its Main Street Lending Program to support small- and mid-sized businesses. On the European front, in response to COVID-19, the European Central Bank, through its Pandemic Emergency Purchase Programme, increased its stimulus total to €1850 billion by the end of 2020. In this reflationary environment, global commodities produced strong returns over the fiscal year. As noted in the shareholder letter, oil prices dropped significantly at the start of the 12 months as the pandemic drove oil demand to its lowest levels in over 20 years; however, crude climbed steadily higher through the end of the period as the ease in lockdowns led to increased demand. Gold prices spiked to an all-time high over the summer as countries took on record debt in response to the pandemic, only to revert back later in the year. The U.S. dollar fell from a peak seen at the height of the pandemic as “risk-on” assets recovered over the remainder of the 12 months.
The Fund’s largest allocations were in the SIMT Multi-Asset Accumulation Fund, SIMT Large Cap Fund, and SIT International Equity Fund. All three funds had positive absolute returns. The largest absolute contributors overall were the SIMT Large Cap Fund, SIT International Equity Fund, SIMT Multi-Asset Accumulation Fund and SIMT Dynamic Asset Allocation Fund. These funds performed well in absolute terms given their exposure to equities, which was the best performing asset class for the 12 months. Generally, technology and “stay-at-home” stocks outperformed during 2020, while more value-oriented and cyclical names showed positive momentum toward the end of 2020 and through the first quarter of 2021. This caused the SIMT Large Cap fund to underperform its benchmark on a relative basis. The SIMT Dynamic Asset Allocation Fund had positive relative performance as it benefited from exposures to gold, broad commodities and a steeper U.S. yield curve. The other equity funds were also large absolute contributors.
The SIMT High Yield Bond Fund and SIMT Multi-Asset Inflation Managed Fund also performed well on an absolute basis as credit risk and commodity exposure were rewarded during the recovery. Continued and increasing expectations of a recovery in economic growth helped push prices in these assets higher. The smallest contributors to absolute performance were the SIT Emerging Markets Debt Portfolio, SIMT Multi-Asset Income Fund and SIMT Core Fixed Income Fund.
| 26 | SEI Asset Allocation Trust / Annual Report / March 31, 2021 |
Fixed-income assets generally did not perform as well as equity assets during the period.
The Fund underperformed its primary benchmark, the S&P 500 Index, over the fiscal year as underlying fund performance was mixed relative to the primary benchmark. The SIMT Small Cap Fund, SIT Emerging Markets Equity Fund, SIMT Dynamic Asset Allocation Fund, SIMT Large Cap Fund and SIT International Equity Fund all outperformed the S&P 500 Index. All other funds underperformed relative to the index.
| AVERAGE ANNUAL TOTAL RETURN1 | ||||||||||||||||||
| One Year Return | Annualized 3-Year Return | Annualized 5-Year Return | Annualized 10-Year Return | Annualized Inception to Date | ||||||||||||||
| Market Growth Strategy Fund, Class F | 33.05% | 7.48% | 8.29% | 6.33% | 5.83% | |||||||||||||
| Market Growth Strategy Fund, Class D | 32.00% | 6.67% | 7.50% | 5.50% | 4.80% | |||||||||||||
| Market Growth Strategy Fund, Class I | 32.71% | 7.22% | 8.04% | 6.08% | 5.56% | |||||||||||||
| S&P 500 Index* | 56.35% | 16.78% | 16.29% | 13.91% | 10.21% | |||||||||||||
| Bloomberg Barclays U.S. Aggregate Bond Index** | 0.71% | 4.65% | 3.10% | 3.44% | 4.08% | |||||||||||||
| MSCI EAFE Index*** | 44.57% | 6.02% | 8.85% | 5.52% | 6.56% | |||||||||||||
Comparison of Change in the Value of a $100,000 Investment in the Market Growth Strategy Fund, Class F, Class D and Class I, the S&P 500 Index, the Bloomberg Barclays U.S. Aggregate Bond Index, and the MSCI EAFE Index
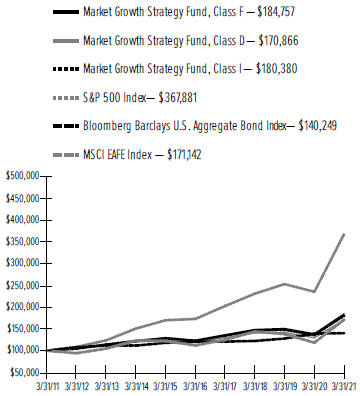
| ¹ | For the year ended March 31, 2021. Past performance is no indication of future performance. Class F (formerly Class A) and Class I shares were offered beginning November 17, 2003. The Fund’s Class D Shares commenced operations on March 25, 2011. For periods prior to March 25, 2011, the performance of the Fund’s Class F Shares, adjusted for the higher total annual fund operating expenses of the Class D Shares has been used. Returns for Class D Shares would have been substantially similar to those of Class F Shares and would have differed only to the extent that Class D Shares have higher total annual fund operating expenses than Class F Shares. Returns shown do not reflect the deduction of taxes that a shareholder would pay on Fund distributions or the redemption of Fund Shares. |
| * | The S&P 500 Index is designed to measure performance of the broad domestic economy through changes in the aggregate market value of 500 stocks representing all major industries. |
| ** | The Bloomberg Barclays U.S. Aggregate Bond Index is a widely-recognized, market value-weighted (higher market value bonds have more influence than lower market value bonds) index of U.S. government obligations, corporate debt securities, and AAA rated mortgage-backed securities. All securities in the index are rated investment grade (BBB) or higher, with maturities of at least one year. |
| *** | The MSCI EAFE Index is a widely-recognized, capitalization-weighted (companies with larger market capitalizations have more influence than those with smaller capitalizations) index of over 1,000 securities listed on the stock exchanges in Europe, Australasia and the Far East. |
| SEI Asset Allocation Trust / Annual Report / March 31, 2021 | 27 |
MANAGEMENT’S DISCUSSION AND ANALYSIS OF FUND PERFORMANCE
March 31, 2021 (Unaudited)
Market Growth Strategy Allocation Fund
I. Objective
The Market Growth Strategy Allocation Fund (the “Fund”) seeks to provide the opportunity for capital appreciation with some opportunity to generate income.
II. Investment Approach
The Fund’s assets are managed under the direction of SEI Investments Management Corporation (“SIMC”), which manages the Fund’s assets in a way that it believes will achieve the Fund’s investment objective. In order to achieve its investment objective, SIMC allocates the Fund’s assets among certain underlying SEI funds. These underlying SEI funds, in turn, invest directly in securities in accordance with their own varying investment objectives and policies. SIMC may change the allocations to the particular asset classes represented by the underlying SEI funds when it deems it appropriate. The underlying SEI funds are separately managed series of the following investment companies: SEI Institutional Managed Trust (“SIMT”), SEI Institutional International Trust (“SIT”) and SEI Daily Income Trust (“SDIT”).
III. Return vs. Benchmark
For the full year ended March 31, 2021, the Fund’s Class F shares returned 54.87%. The Fund’s primary benchmark—the S&P 500 Index (Gross), which tracks the performance of approximately 500 large U.S. companies that are considered representative of the broad U.S. stock market—returned 56.35%.
IV. Fund Attribution
Asset class performance was strong during the reporting period ending March 31, 2021. As noted in the shareholder letter, the fiscal year started off with lockdowns and uncertainty across the globe, but despite concerns, global equities roared back after the pandemic-driven market correction. This was largely due to the easing of monetary policy, highly supportive fiscal policies, lockdown restrictions slowly reversing, and vaccine and therapeutic developments. In general, equity markets recovered from the correction by the fall of 2020, with brief selloffs in September and October. U.S. and emerging-market equities performed the strongest, followed by developed markets outside the U.S.
Global credit and high-yield fixed income produced positive returns during the period. Between March and December, the Federal Reserve’s (“Fed”) portfolio increased from roughly $4 trillion to over $6.5 trillion.
Additionally, throughout the second half of 2020 and into 2021, the Fed continued its direct lending to major corporate firms, as well as its Main Street Lending Program to support small- and mid-sized businesses. On the European front, in response to COVID-19, the European Central Bank, through its Pandemic Emergency Purchase Programme, increased its stimulus total to €1850 billion by the end of 2020. In this reflationary environment, global commodities produced strong returns over the fiscal year. As noted in the shareholder letter, oil prices dropped significantly at the start of the 12 months as the pandemic drove oil demand to its lowest levels in over 20 years; however, crude climbed steadily higher through the end of the period as the ease in lockdowns led to increased demand. Gold prices spiked to an all-time high over the summer as countries took on record debt in response to the pandemic, only to revert back later in the year. The U.S. dollar fell from a peak seen at the height of the pandemic as “risk-on” assets recovered over the remainder of the 12 months.
The Fund’s largest allocations were in the SIMT Tax-Managed Large Cap Fund, SIT International Equity Fund, and SIMT Tax-Managed Small/Mid Cap Fund. These three funds were also the largest absolute contributors to overall performance over the period. These funds performed well on an absolute basis given their exposure to equities, which was the best performing asset class for the 12 months. Generally, technology and “stay-at-home” stocks outperformed during 2020, while some of the more value-oriented and cyclical names showed some positive momentum toward the end of 2020 and during the first quarter of 2021. This caused both the SIMT Tax-Managed Large Cap Fund and SIMT Tax-Managed Small/Mid Cap Fund to underperform their benchmarks on a relative basis.
The smallest contributors to absolute performance were the SIT Emerging Markets Debt Portfolio and SIMT High Yield Bond Fund. These funds still performed strongly in absolute terms over the 12 months as credit spreads tightened and credit assets were rewarded during the “risk-on” period. Continued and increasing expectations of a recovery in economic growth helped push prices in these assets higher.
The Fund is designed to have exposure to a range of asset classes, not all of which are reflected in the primary benchmark of the Fund. Although it trailed the primary benchmark, the Fund’s overall performance was in line with our expectations for the Fund’s asset allocation.
| 28 | SEI Asset Allocation Trust / Annual Report / March 31, 2021 |
| AVERAGE ANNUAL TOTAL RETURN1 | ||||||||||||||||||
| One Year Return | Annualized 3-Year Return | Annualized 5-Year Return | Annualized 10-Year Return | Annualized Inception to Date | ||||||||||||||
| Market Growth Strategy Allocation Fund, Class F | 54.87% | 10.70% | 12.11% | 9.59% | 7.76% | |||||||||||||
| S&P 500 Index* | 56.35% | 16.78% | 16.29% | 13.91% | 10.21% | |||||||||||||
| Bloomberg Barclays U.S. Aggregate Bond Index** | 0.71% | 4.65% | 3.10% | 3.44% | 4.08% | |||||||||||||
| MSCI EAFE Index*** | 44.57% | 6.02% | 8.85% | 5.52% | 6.56% | |||||||||||||
Comparison of Change in the Value of a $100,000 Investment in the Market Growth Strategy Allocation Fund, Class F, versus the S&P 500 Index, the Bloomberg Barclays U.S. Aggregate Bond Index and the MSCI EAFE Index
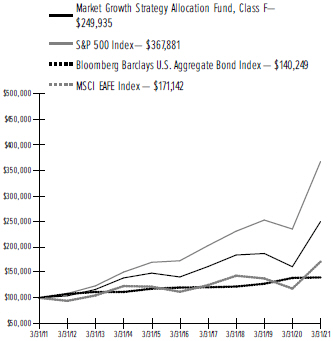
| ¹ | For the period ended March 31, 2021. Past performance is no indication of future performance. Class F (formerly Class A) shares were offered beginning November 17, 2003. Returns shown do not reflect the deduction of taxes that a shareholder would pay on Fund distributions or the redemption of Fund Shares. |
| * | The S&P 500 Index is designed to measure performance of the broad domestic economy through changes in the aggregate market value of 500 stocks representing all major industries. |
| ** | The Bloomberg Barclays U.S. Aggregate Bond Index is a widely-recognized, market value-weighted (higher market value bonds have more influence than lower market value bonds) index of U.S. government obligations, corporate debt securities, and AAA rated mortgage-backed securities. All securities in the index are rated investment grade (BBB) or higher, with maturities of at least one year. |
| *** | The MSCI EAFE Index is a widely-recognized, capitalization-weighted (companies with larger market capitalizations have more influence than those with smaller capitalizations) index of over 1,000 securities listed on the stock exchanges in Europe, Australasia and the Far East. |
| SEI Asset Allocation Trust / Annual Report / March 31, 2021 | 29 |
March 31, 2021
Defensive Strategy Fund
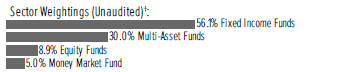
†Percentages are based on total investments.
| Description | Shares | Market Value ($ Thousands) | ||||||
AFFILIATED INVESTMENT FUNDS — 100.0% |
| |||||||
Fixed Income Funds — 56.1% |
| |||||||
SEI Daily Income Trust Short Duration Government Fund, Cl Y | 505,132 | $ | 5,319 | |||||
SEI Institutional Managed Trust Conservative Income Fund, Cl Y | 265,458 | 2,657 | ||||||
SEI Institutional Managed Trust Core Fixed Income Fund, Cl Y | 93,656 | 1,064 | ||||||
SEI Institutional Managed Trust Real Return Fund, Cl Y | 83,090 | 885 | ||||||
|
|
| ||||||
Total Fixed Income Funds (Cost $9,832) ($ Thousands) | 9,925 | |||||||
|
|
| ||||||
Multi-Asset Funds — 30.0% |
| |||||||
SEI Institutional Managed Trust Multi-Asset Capital Stability Fund, Cl Y | 339,998 | 3,546 | ||||||
SEI Institutional Managed Trust Multi-Asset Income Fund, Cl Y | 78,775 | 886 | ||||||
SEI Institutional Managed Trust Multi-Asset Inflation Managed Fund, Cl Y | 105,194 | 881 | ||||||
|
|
| ||||||
Total Multi-Asset Funds (Cost $5,061) ($ Thousands) | 5,313 | |||||||
|
|
| ||||||
Equity Funds — 8.9% |
| |||||||
SEI Institutional Managed Trust Global Managed Volatility Fund, Cl Y | 77,762 | 876 | ||||||
SEI Institutional Managed Trust U.S. Managed Volatility Fund, Cl Y | 40,676 | 700 | ||||||
|
|
| ||||||
Total Equity Funds (Cost $1,358) ($ Thousands) | 1,576 | |||||||
|
|
| ||||||
Money Market Fund — 5.0% |
| |||||||
SEI Daily Income Trust Government Fund, Cl F, 0.010%** | 885,745 | 886 | ||||||
|
|
| ||||||
Total Money Market Fund (Cost $886) ($ Thousands) | 886 | |||||||
|
|
| ||||||
Total Investments in Securities — 100.0% |
| $ | 17,700 | |||||
|
|
| ||||||
Percentages are based on Net Assets of $17,700 ($ Thousands).
** Rate shown is the 7-day effective yield as of March 31, 2021.
Cl — Class
As of March 31, 2021, all of the Fund’s investments in securities were considered Level 1 in accordance with the authoritative guidance on fair value measurements and disclosure under U.S. GAAP.
As of March 31, 2021, there were no transfers in or out of Level 3.
For more information on valuation inputs, see Note 2 — Significant Accounting Policies in Notes to Financial Statements.
| 30 | SEI Asset Allocation Trust / Annual Report / March 31, 2021 |
The following is a summary of the transactions with affiliates for the year ended March 31, 2021 ($ Thousands):
| Security Description | Value 3/31/2020 | Purchases at Cost | Proceeds from Sales | Realized Gain/ (Loss) | Change in Unrealized Appreciation/ (Depreciation) | Value 3/31/2021 | Shares | Dividend Income | Capital Gains | |||||||||
| SEI Daily Income Trust Short Duration Government Fund, Cl Y | $4,903 | $12,615 | $(12,159) | $(21) | $(19) | $5,319 | 505,132 | $126 | $— | |||||||||
| SEI Institutional Managed Trust Conservative Income, Cl Y | 2,424 | 6,261 | (6,029) | (2) | 3 | 2,657 | 265,458 | 8 | — | |||||||||
| SEI Institutional Managed Trust Core Fixed Income Fund, Cl Y | 1,002 | 2,651 | (2,521) | (46) | (22) | 1,064 | 93,656 | 39 | 115 | |||||||||
| SEI Institutional Managed Trust Real Return Fund, Cl Y | 810 | 2,048 | (2,064) | 46 | 45 | 885 | 83,090 | 11 | — | |||||||||
| SEI Institutional Managed Trust Multi-Asset Capital Stability, Cl Y | 3,240 | 8,311 | (8,260) | 130 | 125 | 3,546 | 339,998 | 9 | 85 | |||||||||
| SEI Institutional Managed Trust Multi-Asset Income Fund, Cl Y | 856 | 2,031 | (2,268) | 102 | 165 | 886 | 78,775 | 46 | — | |||||||||
| SEI Institutional Managed Trust Multi-Asset Inflation Managed Fund, Cl Y | 827 | 2,094 | (2,206) | (91) | 257 | 881 | 105,194 | 14 | — | |||||||||
| SEI Institutional Managed Trust Global Managed Volatility Fund, Cl Y | 887 | 2,195 | (2,512) | 37 | 269 | 876 | 77,762 | 9 | 4 | |||||||||
| SEI Institutional Managed Trust U.S. Managed Volatility Fund, Cl Y | 705 | 1,821 | (2,108) | 80 | 202 | 700 | 40,676 | 19 | 57 | |||||||||
| SEI Daily Income Trust Government Fund, Cl F | 808 | 2,087 | (2,009) | — | — | 886 | 885,745 | — | — | |||||||||
|
|
|
|
|
|
|
| |||||||||||
| Totals | $16,462 | $42,114 | $(42,136) | $235 | $1,025 | $17,700 | $281 | $261 | ||||||||||
|
|
|
|
|
|
|
| |||||||||||
Amounts designated as “—” are $0 or have been rounded to $0.
The accompanying notes are an integral part of the financial statements.
| SEI Asset Allocation Trust / Annual Report / March 31, 2021 | 31 |
SCHEDULE OF INVESTMENTS
March 31, 2021
Defensive Strategy Allocation Fund
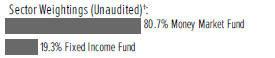
†Percentages are based on total investments.
| Description | Shares | Market Value ($ Thousands) | ||||||
AFFILIATED INVESTMENT FUNDS — 100.0% |
| |||||||
Money Market Fund — 80.7% |
| |||||||
SEI Daily Income Trust Government Fund, Cl F, | 5,033,140 | $ | 5,033 | |||||
|
|
| ||||||
Total Money Market Fund (Cost $5,033) ($ Thousands) | 5,033 | |||||||
|
|
| ||||||
Fixed Income Fund — 19.3% |
| |||||||
SEI Institutional Managed Trust High Yield Bond Fund, Cl Y | 174,347 | 1,205 | ||||||
|
|
| ||||||
Total Fixed Income Fund (Cost $1,132) ($ Thousands) | 1,205 | |||||||
|
|
| ||||||
Total Investments in Securities — 100.0% |
| $ | 6,238 | |||||
|
|
| ||||||
Percentages are based on Net Assets of $6,236 ($ Thousands).
Cl — Class
* Represents greater than 50% of the Fund’s total investments. For further financial information, available upon request at no charge, please go to the Securities Exchange Commission’s website at http://www.sec.gov or call 1-800-DIAL-SEI.
† Rate shown is the 7-day effective yield as of March 31, 2021.
As of March 31, 2021, all of the Fund’s investments in securities were considered Level 1, in accordance with the authoritative guidance on fair value measurements and disclosure under U.S. GAAP.
As of March 31, 2021, there were no transfers in or out of Level 3.
For more information on valuation inputs, see Note 2 — Significant Accounting Policies in Notes to Financial Statements.
The following is a summary of the transactions with affiliates for the year ended March 31, 2021 ($ Thousands):
| Security Description | Value 3/31/2020 | Purchases at Cost | Proceeds from Sales | Realized Gain/ (Loss) | Change in Unrealized Appreciation/ (Depreciation) | Value 3/31/2021 | Shares | Dividend Income | Capital Gains | |||||||||
| SEI Daily Income Trust Government Fund, Cl F | $6,090 | $1,310 | $(2,367) | $ — | $ — | $5,033 | 5,033,140 | $3 | $— | |||||||||
| SEI Institutional Managed Trust High Yield Bond Fund, Cl Y | 1,484 | 357 | (872) | (89) | 325 | 1,205 | 174,347 | 78 | 23 | |||||||||
|
|
|
|
|
|
|
| |||||||||||
| Totals | $7,574 | $1,667 | $(3,239) | $(89) | $325 | $6,238 | $81 | $23 | ||||||||||
|
|
|
|
|
|
|
|
Amounts designated as “—” are either $0 or have been rounded to $0.
The accompanying notes are an integral part of the financial statements.
| 32 | SEI Asset Allocation Trust / Annual Report / March 31, 2021 |
SCHEDULE OF INVESTMENTS
March 31, 2021
Conservative Strategy Fund
†Percentages are based on total investments.
| ||||||||
| Description | Shares | Market Value ($ Thousands) | ||||||
AFFILIATED INVESTMENT FUNDS — 100.0% |
| |||||||
Fixed Income Funds — 51.0% |
| |||||||
SEI Daily Income Trust Short Duration Government Fund, Cl Y | 992,281 | $ | 10,449 | |||||
SEI Daily Income Trust Ultra Short Duration Bond Fund, Cl Y | 297,472 | 2,787 | ||||||
SEI Institutional International Trust Emerging Markets Debt Fund, Cl Y | 208,296 | 2,083 | ||||||
SEI Institutional Managed Trust Conservative Income Fund, Cl Y | 695,641 | 6,963 | ||||||
SEI Institutional Managed Trust Core Fixed Income Fund, Cl Y | 735,145 | 8,351 | ||||||
SEI Institutional Managed Trust High Yield Bond Fund, Cl Y | 304,313 | 2,103 | ||||||
SEI Institutional Managed Trust Real Return Fund, Cl Y | 261,447 | 2,785 | ||||||
|
|
| ||||||
Total Fixed Income Funds (Cost $35,067) ($ Thousands) | 35,521 | |||||||
|
|
| ||||||
Multi-Asset Funds — 31.0% |
| |||||||
SEI Institutional Managed Trust Multi-Asset Accumulation Fund, Cl Y | 213,638 | 2,077 | ||||||
SEI Institutional Managed Trust Multi-Asset Capital Stability Fund, Cl Y | 1,134,958 | 11,838 | ||||||
SEI Institutional Managed Trust Multi-Asset Income Fund, Cl Y | 371,823 | 4,183 | ||||||
SEI Institutional Managed Trust Multi-Asset Inflation Managed Fund, Cl Y | 414,140 | 3,466 | ||||||
|
|
| ||||||
Total Multi-Asset Funds (Cost $21,023) ($ Thousands) | 21,564 | |||||||
|
|
| ||||||
Equity Funds — 18.0% |
| |||||||
SEI Institutional Managed Trust Global Managed Volatility Fund, Cl Y | 675,960 | 7,618 | ||||||
SEI Institutional Managed Trust U.S. Managed Volatility Fund, Cl Y | 280,907 | 4,834 | ||||||
|
|
| ||||||
Total Equity Funds (Cost $11,310) ($ Thousands) |
| 12,452 | ||||||
|
|
| ||||||
Total Investments in Securities — 100.0% |
| $ | 69,537 | |||||
|
|
| ||||||

Percentages are based on Net Assets of $69,519 ($ Thousands).
Cl — Class
As of March 31, 2021, all of the Fund’s investments in securities were considered Level 1, in accordance with the authoritative guidance on fair value measurements and disclosure under U.S. GAAP.
As of March 31, 2021, there were no transfers in or out of Level 3.
For more information on valuation inputs, see Note 2 — Significant Accounting Policies in Notes to Financial Statements
| SEI Asset Allocation Trust / Annual Report / March 31, 2021 | 33 |
SCHEDULE OF INVESTMENTS
March 31, 2021
Conservative Strategy Fund (Concluded)
The following is a summary of the transactions with affiliates for the year ended March 31, 2021 ($ Thousands):
| Security Description | Value 3/31/2020 | Purchases at Cost | Proceeds from Sales | Realized Gain/ (Loss) | Change in Unrealized Appreciation/ (Depreciation) | Value 3/31/2021 | Shares | Dividend Income | Capital Gains | |||||||||
| SEI Daily Income Trust Short Duration Government Fund, Cl Y | $10,110 | $2,118 | $(1,737) | $(2) | $(40) | $10,449 | 992,281 | $140 | $— | |||||||||
| SEI Daily Income Trust Ultra Short Duration Bond Fund, Cl Y | 2,697 | 514 | (491) | — | 67 | 2,787 | 297,472 | 35 | — | |||||||||
| SEI Institutional International Trust Emerging Markets Debt Fund, Cl Y | 2,005 | 452 | (718) | (15) | 359 | 2,083 | 208,296 | 18 | — | |||||||||
| SEI Institutional Managed Trust Conservative Income Fund, Cl Y | 6,706 | 1,348 | (1,098) | — | 7 | 6,963 | 695,641 | 16 | — | |||||||||
| SEI Institutional Managed Trust Core Fixed Income Fund, Cl Y | 8,118 | 1,936 | (1,528) | (2) | (173) | 8,351 | 735,145 | 179 | 326 | |||||||||
| SEI Institutional Managed Trust High Yield Bond Fund, Cl Y | 2,035 | 475 | (802) | (75) | 470 | 2,103 | 304,313 | 131 | 40 | |||||||||
| SEI Institutional Managed Trust Real Return Fund, Cl Y | 2,677 | 453 | (525) | 9 | 171 | 2,785 | 261,447 | 19 | — | |||||||||
| SEI Institutional Managed Trust Multi-Asset Accumulation Fund, Cl Y | 2,012 | 447 | (618) | (21) | 257 | 2,077 | 213,638 | — | 110 | |||||||||
| SEI Institutional Managed Trust Multi-Asset Capital Stability Fund, Cl Y | 11,387 | 1,938 | (1,999) | 19 | 493 | 11,838 | 1,134,958 | 36 | 101 | |||||||||
| SEI Institutional Managed Trust Multi-Asset Income Fund, Cl Y | 4,064 | 649 | (1,257) | 2 | 725 | 4,183 | 371,823 | 130 | — | |||||||||
| SEI Institutional Managed Trust Multi-Asset Inflation Managed Fund, Cl Y | 3,370 | 591 | (907) | (204) | 616 | 3,466 | 414,140 | 64 | — | |||||||||
| SEI Institutional Managed Trust Global Managed Volatility Fund, Cl Y | 7,315 | 1,736 | (3,160) | (198) | 1,925 | 7,618 | 675,960 | 91 | 13 | |||||||||
| SEI Institutional Managed Trust U.S. Managed Volatility Fund, Cl Y | 4,624 | 1,664 | (2,579) | (93) | 1,218 | 4,834 | 280,907 | 94 | 423 | |||||||||
|
|
|
|
|
|
|
| |||||||||||
| Totals | $67,120 | $14,321 | $(17,419) | $(580) | $6,095 | $69,537 | $953 | $1,013 | ||||||||||
|
|
|
|
|
|
|
|
Amounts designated as “—” are $0 or have been rounded to $0.
The accompanying notes are an integral part of the financial statements.
| 34 | SEI Asset Allocation Trust / Annual Report / March 31, 2021 |
SCHEDULE OF INVESTMENTS
March 31, 2021
Conservative Strategy Allocation Fund
†Percentages are based on total investments.
| ||||||||
| Description | Shares | Market Value ($ Thousands) | ||||||
AFFILIATED INVESTMENT FUNDS — 100.0% |
| |||||||
Equity Funds — 46.6% |
| |||||||
SEI Institutional Managed Trust Real Estate Fund, Cl Y | 289,839 | $ | 4,498 | |||||
SEI Institutional Managed Trust U.S. Managed Volatility Fund, Cl Y | 528,642 | 9,098 | ||||||
|
|
| ||||||
Total Equity Funds (Cost $9,550) ($ Thousands) | 13,596 | |||||||
|
|
| ||||||
Fixed Income Fund — 33.3% |
| |||||||
SEI Institutional Managed Trust High Yield Bond Fund, Cl Y | 1,405,918 | 9,715 | ||||||
|
|
| ||||||
Total Fixed Income Fund (Cost $9,134) ($ Thousands) | 9,715 | |||||||
|
|
| ||||||
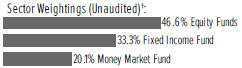
| Description | Shares | Market Value ($Thousands) | ||||||
AFFILIATED INVESTMENT FUNDS (continued) |
| |||||||
Money Market Fund — 20.1% |
| |||||||
SEI Daily Income Trust Government Fund, Cl F, 0.010%* | 5,852,805 | $ | 5,853 | |||||
|
|
| ||||||
Total Money Market Fund (Cost $5,853) ($ Thousands) | 5,853 | |||||||
|
|
| ||||||
Total Investments in Securities — 100.0% |
| $ | 29,164 | |||||
|
|
| ||||||
Percentages are based on Net Assets of $29,156 ($ Thousands).
| * | Rate shown is the 7-day effective yield as of March 31, 2021. |
| Cl | — Class |
As of March 31, 2021, all of the Fund’s investments in securities were considered Level 1, in accordance with the authoritative guidance on fair value measurements and disclosure under U.S. GAAP.
As of March 31, 2021, there were no transfers in or out of Level 3.
For more information on valuation inputs, see Note 2 — Significant Accounting Policies in Notes to Financial Statements.
The following is a summary of the transactions with affiliates for the year ended March 31, 2021 ($ Thousands):
| Security Description | Value 3/31/2020 | Purchases at Cost | Proceeds from Sales | Realized Gain/ (Loss) | Change in Unrealized Appreciation/ (Depreciation) | Value 3/31/2021 | Shares | Dividend Income | Capital Gains | |||||||||
| SEI Institutional Managed Trust Real Estate Fund, Cl Y | $4,920 | $1,839 | $(3,588) | $(483) | $1,810 | $4,498 | 289,839 | $98 | $216 | |||||||||
| SEI Institutional Managed Trust U.S. Managed Volatility Fund, Cl Y | 9,645 | 1,847 | (4,617) | 182 | 2,041 | 9,098 | 528,642 | 182 | 751 | |||||||||
| SEI Institutional Managed Trust High Yield Bond Fund, Cl Y | 10,517 | 1,854 | (4,522) | (543) | 2,409 | 9,715 | 1,405,918 | 621 | 190 | |||||||||
| SEI Daily Income Trust Government Fund, Cl F | 6,227 | 1,560 | (1,932) | (1) | (1) | 5,853 | 5,852,805 | 3 | — | |||||||||
|
|
|
|
|
|
|
| |||||||||||
| Totals | $31,309 | $7,100 | $(14,659) | $(845) | $6,259 | $29,164 | $904 | $1,157 | ||||||||||
|
|
|
|
|
|
|
|
Amounts designated as “—” are $0 or have been rounded to $0.
The accompanying notes are an integral part of the financial statements.
| SEI Asset Allocation Trust / Annual Report / March 31, 2021 | 35 |
SCHEDULE OF INVESTMENTS
March 31, 2021
Moderate Strategy Fund
†Percentages are based on total investments.
| ||||||||
| Description | Shares | Market Value ($ Thousands) | ||||||
AFFILIATED INVESTMENT FUNDS — 100.0% |
| |||||||
Fixed Income Funds — 36.1% |
| |||||||
SEI Daily Income Trust Short Duration Government Fund, Cl Y | 1,130,578 | $ | 11,905 | |||||
SEI Daily Income Trust Ultra Short Duration Bond Fund, Cl Y | 476,370 | 4,464 | ||||||
SEI Institutional International Trust Emerging Markets Debt Fund, Cl Y | 446,092 | 4,461 | ||||||
SEI Institutional Managed Trust Core Fixed Income Fund, Cl Y | 2,097,721 | 23,830 | ||||||
SEI Institutional Managed Trust High Yield Bond Fund, Cl Y | 649,824 | 4,490 | ||||||
SEI Institutional Managed Trust Real Return Fund, Cl Y | 418,811 | 4,460 | ||||||
|
|
| ||||||
Total Fixed Income Funds |
| 53,610 | ||||||
|
|
| ||||||
Multi-Asset Funds — 35.0% |
| |||||||
SEI Institutional Managed Trust Multi-Asset Accumulation Fund, Cl Y | 2,278,391 | 22,146 | ||||||
SEI Institutional Managed Trust Multi-Asset Capital Stability Fund, Cl Y | 1,425,482 | 14,868 | ||||||
SEI Institutional Managed Trust Multi-Asset Income Fund, Cl Y | 661,736 | 7,444 | ||||||
SEI Institutional Managed Trust Multi-Asset Inflation Managed Fund, Cl Y | 884,774 | 7,405 | ||||||
|
|
| ||||||
Total Multi-Asset Funds (Cost $51,278) ($ Thousands) |
| 51,863 | ||||||
|
|
| ||||||
Equity Funds — 28.9% |
| |||||||
SEI Institutional Managed Trust Global Managed Volatility Fund, Cl Y | 1,969,288 | 22,194 | ||||||
SEI Institutional Managed Trust Large Cap Fund, Cl Y | 357,906 | 5,938 | ||||||
SEI Institutional Managed Trust U.S. Managed Volatility Fund, Cl Y | 857,344 | 14,755 | ||||||
|
|
| ||||||
Total Equity Funds (Cost $38,211) ($ Thousands) | 42,887 | |||||||
|
|
| ||||||
Total Investments in Securities — 100.0% (Cost $142,768) ($ Thousands) |
| $ | 148,360 | |||||
|
|
| ||||||
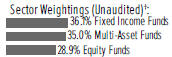
Percentages are based on Net Assets of $148,319 ($ Thousands).
Cl — Class
As of March 31, 2021, all of the Fund’s investments in securities were considered Level 1, in accordance with the authoritative guidance on fair value measurements and disclosure under U.S. GAAP.
As of March 31, 2021, there were no transfers in or out of Level 3.
For more information on valuation inputs, see Note 2 — Significant Accounting Policies in Notes to Financial Statements
| 36 | SEI Asset Allocation Trust / Annual Report / March 31, 2021 |
The following is a summary of the transactions with affiliates for the year ended March 31, 2021 ($ Thousands):
| Security Description | Value 3/31/2020 | Purchases at Cost | Proceeds from Sales | Realized Gain/ (Loss) | Change in Unrealized Appreciation/ (Depreciation) | Value 3/31/2021 | Shares | Dividend Income | Capital Gains | |||||||||
| SEI Daily Income Trust Short Duration Government Fund, Cl Y | $11,841 | $4,525 | $(4,411) | $(10) | $(40) | $11,905 | 1,130,578 | $168 | $— | |||||||||
| SEI Daily Income Trust Ultra Short Duration Bond Fund, Cl Y | 4,450 | 1,611 | (1,711) | 1 | 113 | 4,464 | 476,370 | 60 | — | |||||||||
| SEI Institutional International Trust Emerging Markets Debt Fund, Cl Y | 4,375 | 1,611 | (2,293) | (107) | 875 | 4,461 | 446,092 | 39 | — | |||||||||
| SEI Institutional Managed Trust Core Fixed Income Fund, Cl Y | 23,759 | 9,687 | (9,110) | (10) | (496) | 23,830 | 2,097,721 | 538 | 934 | |||||||||
| SEI Institutional Managed Trust High Yield Bond Fund, Cl Y | 4,465 | 1,727 | (2,589) | (138) | 1,025 | 4,490 | 649,824 | 294 | 86 | |||||||||
| SEI Institutional Managed Trust Real Return Fund, Cl Y | 4,388 | 1,517 | (1,745) | 26 | 274 | 4,460 | 418,811 | 32 | — | |||||||||
| SEI Institutional Managed Trust Multi-Asset Accumulation Fund, Cl Y | 21,954 | 7,855 | (10,310) | (440) | 3,087 | 22,146 | 2,278,391 | — | 1,181 | |||||||||
| SEI Institutional Managed Trust Multi-Asset Capital Stability Fund, Cl Y | 14,655 | 5,118 | (5,568) | 42 | 621 | 14,868 | 1,425,482 | 48 | 128 | |||||||||
| SEI Institutional Managed Trust Multi-Asset Income Fund, Cl Y | 7,433 | 2,206 | (3,541) | (7) | 1,353 | 7,444 | 661,736 | 244 | — | |||||||||
| SEI Institutional Managed Trust Multi-Asset Inflation Managed Fund, Cl Y | 7,394 | 2,556 | (3,462) | (800) | 1,717 | 7,405 | 884,774 | 147 | — | |||||||||
| SEI Institutional Managed Trust Global Managed Volatility Fund, Cl Y | 21,844 | 6,732 | (11,411) | (602) | 5,631 | 22,194 | 1,969,288 | 284 | 39 | |||||||||
| SEI Institutional Managed Trust Large Cap Fund, Cl Y | 5,768 | 2,049 | (4,625) | 103 | 2,643 | 5,938 | 357,906 | 89 | 166 | |||||||||
| SEI Institutional Managed Trust U.S. Managed Volatility Fund, Cl Y | 14,464 | 5,760 | (8,886) | (364) | 3,781 | 14,755 | 857,344 | 295 | 1,339 | |||||||||
|
|
|
|
|
|
|
| |||||||||||
| Totals | $146,790 | $52,954 | $(69,662) | $(2,306) | $20,584 | $148,360 | $2,238 | $3,873 | ||||||||||
|
|
|
|
|
|
|
|
Amounts designated as “—” are $0 or have been rounded to $0.
The accompanying notes are an integral part of the financial statements.
| SEI Asset Allocation Trust / Annual Report / March 31, 2021 | 37 |
SCHEDULE OF INVESTMENTS
March 31, 2021
Moderate Strategy Allocation Fund
†Percentages are based on total investments.
| ||||||||
| Description | Shares | Market Value ($ Thousands) | ||||||
AFFILIATED INVESTMENT FUNDS — 100.0% |
| |||||||
Equity Funds — 67.4% |
| |||||||
SEI Institutional International Trust International Equity Fund, Cl Y | 285,956 | $ | 3,769 | |||||
SEI Institutional Managed Trust Real Estate Fund, Cl Y | 241,007 | 3,740 | ||||||
SEI Institutional Managed Trust Tax- Managed Large Cap Fund, Cl Y | 219,487 | 7,208 | ||||||
SEI Institutional Managed Trust U.S. Managed Volatility Fund, Cl Y | 1,826,586 | 31,435 | ||||||
|
|
| ||||||
Total Equity Funds (Cost $27,962) ($ Thousands) | 46,152 | |||||||
|
|
| ||||||
Fixed Income Fund — 18.1% | ||||||||
SEI Institutional Managed Trust High Yield Bond Fund, Cl Y | 1,797,940 | 12,424 | ||||||
|
|
| ||||||
Total Fixed Income Fund (Cost $12,221) ($ Thousands) | 12,424 | |||||||
|
|
| ||||||
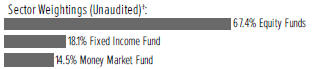
| Description | Shares | Market Value ($ Thousands) | ||||||
AFFILIATED INVESTMENT FUNDS (continued) |
| |||||||
Money Market Fund — 14.5% |
| |||||||
SEI Daily Income Trust Government Fund, Cl F, 0.010%* | 9,943,843 | $ | 9,944 | |||||
|
|
| ||||||
Total Money Market Fund (Cost $9,944) ($ Thousands) | 9,944 | |||||||
|
|
| ||||||
Total Investments in Securities — 100.0% (Cost $50,127) ($ Thousands) |
| $ | 68,520 | |||||
|
|
| ||||||
Percentages are based on Net Assets of $68,502 ($ Thousands).
| * | Rate shown is the 7-day effective yield as of March 31, 2021. |
Cl — Class
As of March 31, 2021, all of the Fund’s investments in securities were considered Level 1, in accordance with the authoritative guidance on fair value measurements and disclosure under U.S. GAAP.
As of March 31, 2021, there were no transfers in or out of Level 3.
For more information on valuation inputs, see Note 2 — Significant Accounting Policies in Notes to Financial Statements.
The following is a summary of the transactions with affiliates for the year ended March 31, 2021 ($ Thousands):
| Security Description | Value 3/31/2020 | Purchases at Cost | Proceeds from Sales | Realized Gain/ (Loss) | Change in Unrealized Appreciation/ (Depreciation) | Value 3/31/2021 | Shares | Dividend Income | Capital Gains | |||||||||
| SEI Institutional International Trust International Equity Fund, Cl Y | $3,303 | $350 | $(1,427) | $318 | $1,225 | $3,769 | 285,956 | $43 | $— | |||||||||
| SEI Institutional Managed Trust Real Estate Fund, Cl Y | 3,320 | 1,052 | (1,549) | (100) | 1,017 | 3,740 | 241,007 | 70 | 163 | |||||||||
| SEI Institutional Managed Trust Tax-Managed Large Cap Fund, Cl Y | 6,287 | 731 | (2,658) | 1,181 | 1,667 | 7,208 | 219,487 | 100 | 94 | |||||||||
| SEI Institutional Managed Trust U.S. Managed Volatility Fund, Cl Y | 27,648 | 4,528 | (7,305) | 56 | 6,508 | 31,435 | 1,826,586 | 544 | 2,375 | |||||||||
| SEI Institutional Managed Trust High Yield Bond Fund, Cl Y | 11,119 | 2,446 | (3,221) | (537) | 2,617 | 12,424 | 1,797,940 | 708 | 220 | |||||||||
| SEI Daily Income Trust Government Fund, Cl F | 8,834 | 2,857 | (1,747) | — | — | 9,944 | 9,943,843 | 4 | — | |||||||||
|
|
|
|
|
|
|
| |||||||||||
| Totals | $60,511 | $11,964 | $(17,907) | $918 | $13,034 | $68,520 | $1,469 | $2,852 | ||||||||||
|
|
|
|
|
|
|
|
Amount designated as “— “ are $0 or have been rounded to $0.
The accompanying notes are an integral part of the financial statements.
| 38 | SEI Asset Allocation Trust / Annual Report / March 31, 2021 |
SCHEDULE OF INVESTMENTS
March 31, 2021
Aggressive Strategy Fund
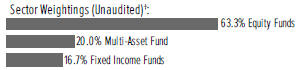
†Percentages are based on total investments.
| Description | Shares | Market Value ($ Thousands) | ||||||
AFFILIATED INVESTMENT FUNDS — 100.0% |
| |||||||
Equity Funds — 63.3% |
| |||||||
SEI Institutional International Trust Emerging Markets Equity Fund, Cl Y | 843,327 | $ | 12,583 | |||||
SEI Institutional International Trust International Equity Fund, Cl Y | 2,938,499 | 38,730 | ||||||
SEI Institutional Managed Trust Dynamic Asset Allocation Fund, Cl Y | 883,046 | 14,879 | ||||||
SEI Institutional Managed Trust Large Cap Fund, Cl Y | 2,355,841 | 39,083 | ||||||
SEI Institutional Managed Trust Small Cap Fund, Cl Y | 671,879 | 10,797 | ||||||
|
|
| ||||||
Total Equity Funds | 116,072 | |||||||
|
|
| ||||||
Multi-Asset Fund — 20.0% |
| |||||||
SEI Institutional Managed Trust Multi-Asset Accumulation Fund, Cl Y | 3,774,171 | 36,685 | ||||||
|
|
| ||||||
Total Multi-Asset Fund | 36,685 | |||||||
|
|
| ||||||
Fixed Income Funds — 16.7% |
| |||||||
SEI Institutional International Trust Emerging Markets Debt Fund, Cl Y | 1,071,335 | 10,713 | ||||||
SEI Institutional Managed Trust Core Fixed Income Fund, Cl Y | 797,447 | 9,059 | ||||||
SEI Institutional Managed Trust High Yield Bond Fund, Cl Y | 1,588,756 | 10,978 | ||||||
|
|
| ||||||
Total Fixed Income Funds | 30,750 | |||||||
|
|
| ||||||
Total Investments in Securities — 100.0% |
| $ | 183,507 | |||||
|
|
| ||||||
Percentages are based on Net Assets of $183,436 ($ Thousands).
Cl — Class
As of March 31, 2021, all of the Fund’s investments were considered Level 1, in accordance with the authoritative guidance on fair value measurements and disclosure under U.S. GAAP.
As of March 31, 2021, there were no transfers in or out of Level 3.
For more information on valuation inputs, see Note 2 — Significant Accounting Policies in Notes to Financial Statements
| SEI Asset Allocation Trust / Annual Report / March 31, 2021 | 39 |
SCHEDULE OF INVESTMENTS
March 31, 2021
Aggressive Strategy Fund (Concluded)
The following is a summary of the transactions with affiliates for the year ended March 31, 2021 ($ Thousands):
| Security Description | Value 3/31/2020 | Purchases at Cost | Proceeds from Sales | Realized Gain/ (Loss) | Change in Unrealized Appreciation/ (Depreciation) | Value 3/31/2021 | Shares | Dividend Income | Capital Gains | |||||||||
| SEI Institutional International Trust Emerging Markets Equity Fund, Cl Y | $9,931 | $1,555 | $(4,424) | $568 | $4,953 | $12,583 | 843,327 | $92 | $— | |||||||||
| SEI Institutional International Trust International Equity Fund, Cl Y | 30,041 | 2,618 | (8,669) | 1,041 | 13,699 | 38,730 | 2,938,499 | 439 | — | |||||||||
| SEI Institutional Managed Trust Dynamic Asset Allocation Fund, Cl Y | 11,395 | 2,290 | (3,937) | 705 | 4,426 | 14,879 | 883,046 | 782 | 225 | |||||||||
| SEI Institutional Managed Trust Large Cap Fund, Cl Y | 29,985 | 4,475 | (9,952) | (314) | 14,889 | 39,083 | 2,355,841 | 463 | 974 | |||||||||
| SEI Institutional Managed Trust Small Cap Fund, Cl Y | 8,452 | 1,820 | (6,192) | (445) | 7,162 | 10,797 | 671,879 | 46 | — | |||||||||
| SEI Institutional Managed Trust Multi-Asset Accumulation Fund, Cl Y | 28,694 | 10,111 | (5,421) | (355) | 3,656 | 36,685 | 3,774,171 | — | 1,737 | |||||||||
| SEI Institutional International Trust Emerging Markets Debt Fund, Cl Y | 8,577 | 2,301 | (1,574) | (90) | 1,499 | 10,713 | 1,071,335 | 77 | — | |||||||||
| SEI Institutional Managed Trust Core Fixed Income Fund, Cl Y | 7,238 | 3,769 | (1,723) | 67 | (292) | 9,059 | 797,447 | 171 | 322 | |||||||||
| SEI Institutional Managed Trust High Yield Bond Fund, Cl Y | 8,715 | 2,366 | (1,833) | (267) | 1997 | 10,978 | 1,588,756 | 602 | 191 | |||||||||
|
|
|
|
|
|
|
| |||||||||||
| Totals | $143,028 | $31,305 | $(43,725) | $910 | $51,989 | $183,507 | $2,672 | $3,449 | ||||||||||
|
|
|
|
|
|
|
|
Amounts designated as “—” are $0 or have been rounded to $0.
The accompanying notes are an integral part of the financial statements.
| 40 | SEI Asset Allocation Trust / Annual Report / March 31, 2021 |
SCHEDULE OF INVESTMENTS
March 31, 2021
Tax-Managed Aggressive Strategy Fund
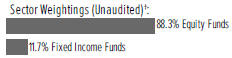
†Percentages are based on total investments.
| Description | Shares | Market Value | ||||||
AFFILIATED INVESTMENT FUNDS — 100.0% |
| |||||||
Equity Funds — 88.3% |
| |||||||
SEI Institutional International Trust Emerging Markets Equity Fund, Cl Y | 115,611 | $ | 1,725 | |||||
SEI Institutional International Trust International Equity Fund, Cl Y | 1,036,034 | 13,655 | ||||||
SEI Institutional Managed Trust Tax-Managed Large Cap Fund, Cl Y * | 1,496,460 | 49,144 | ||||||
SEI Institutional Managed Trust Tax-Managed Small/Mid Cap Fund, Cl Y | 448,946 | 12,270 | ||||||
Total Equity Funds | 76,794 | |||||||
Fixed Income Funds — 11.7% |
| |||||||
SEI Institutional International Trust Emerging Markets Debt Fund, Cl Y | 337,658 | 3,376 | ||||||
| Description | Shares | Market Value | ||||||
AFFILIATED INVESTMENT FUNDS (continued) |
| |||||||
SEI Institutional Managed Trust High Yield Bond Fund, Cl Y | 985,126 | $ | 6,807 | |||||
Total Fixed Income Funds | 10,183 | |||||||
Total Investments in Securities — 100.0% |
| $ | 86,977 | |||||
Percentages are based on Net Assets of $86,953 ($ Thousands).
Cl — Class
* Represents greater than 50% of the Fund’s total investments. For further financial information, available upon request at no charge, please go to the Securities Exchange Commission’s website at http://www.sec.gov or call 1-800-DIAL-SEI.
As of March 31, 2021, all of the Fund’s investments in securities were considered Level 1, in accordance with the authoritative guidance on fair value measurement and disclosure under U.S. GAAP.
As of March 31, 2021, there were no transfers in or out of Level 3.
For more information on valuation inputs, see Note 2 — Significant Accounting Policies in Notes to Financial Statements.
The following is a summary of the transactions with affiliates for the year ended March 31, 2021 ($ Thousands):
| Security Description | Value 3/31/2020 | Purchases at Cost | Proceeds from Sales | Realized Gain/ (Loss) | Change in Unrealized Appreciation/ (Depreciation) | Value 3/31/2021 | Shares | Dividend Income | Capital Gains | |||||||||
| SEI Institutional International Trust Emerging Markets Equity Fund, Cl Y | $1,169 | $166 | $(290) | $15 | $665 | $1,725 | 115,611 | $12 | $— | |||||||||
| SEI Institutional International Trust International Equity Fund, Cl Y | 9,479 | 627 | (1,321) | (31) | 4,901 | 13,655 | 1,036,034 | 156 | — | |||||||||
| SEI Institutional Managed Trust Tax-Managed Large Cap Fund, Cl Y | 33,041 | 2,228 | (2,679) | 63 | 16,491 | 49,144 | 1,496,460 | 576 | 601 | |||||||||
| SEI Institutional Managed Trust Tax-Managed Small/Mid Cap Fund, Cl Y | 8,238 | 230 | (2,191) | 113 | 5,880 | 12,270 | 448,946 | 44 | — | |||||||||
| SEI Institutional International Trust Emerging Markets Debt Fund, Cl Y | 2,310 | 780 | (93) | (10) | 389 | 3,376 | 337,658 | 23 | — | |||||||||
| SEI Institutional Managed Trust High Yield Bond Fund, Cl Y | 4,684 | 1,457 | (294) | (57) | 1,017 | 6,807 | 985,126 | 345 | 114 | |||||||||
|
|
|
|
|
|
|
| |||||||||||
Totals | $58,921 | $5,488 | $(6,868) | $93 | $29,343 | $86,977 | $1,156 | $715 | ||||||||||
|
|
|
|
|
|
|
|
Amounts designated as “—” are $0 or have been rounded to $0.
The accompanying notes are an integral part of the financial statements.
| SEI Asset Allocation Trust / Annual Report / March 31, 2021 | 41 |
SCHEDULE OF INVESTMENTS
March 31, 2021
Core Market Strategy Fund
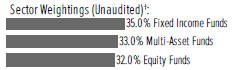
†Percentages are based on total investments.
| Description | Shares | Market Value ($ Thousands) | ||||||
AFFILIATED INVESTMENT FUNDS — 100.0% |
| |||||||
Fixed Income Funds — 35.0% |
| |||||||
SEI Institutional International Trust Emerging Markets Debt Fund, Cl Y | 393,225 | $ | 3,932 | |||||
SEI Institutional Managed Trust Core Fixed Income Fund, Cl Y | 1,734,477 | 19,704 | ||||||
SEI Institutional Managed Trust High Yield Bond Fund, Cl Y | 576,123 | 3,981 | ||||||
Total Fixed Income Funds | 27,617 | |||||||
Multi-Asset Funds — 33.0% |
| |||||||
SEI Institutional Managed Trust Multi-Asset Accumulation Fund, Cl Y | 1,624,765 | 15,793 | ||||||
SEI Institutional Managed Trust Multi-Asset Income Fund, Cl Y | 352,044 | 3,960 | ||||||
SEI Institutional Managed Trust Multi-Asset Inflation Managed Fund, Cl Y | 756,902 | 6,335 | ||||||
Total Multi-Asset Funds | 26,088 | |||||||
Equity Funds — 32.0% |
| |||||||
SEI Institutional International Trust Emerging Markets Equity Fund, Cl Y | 158,615 | 2,367 | ||||||
SEI Institutional International Trust International Equity Fund, Cl Y | 597,391 | 7,874 | ||||||
SEI Institutional Managed Trust Dynamic Asset Allocation Fund, Cl Y | 235,831 | 3,974 | ||||||
SEI Institutional Managed Trust Large Cap Fund, Cl Y | 525,082 | 8,711 | ||||||
SEI Institutional Managed Trust Small Cap Fund, Cl Y | 148,310 | 2,383 | ||||||
Total Equity Funds | 25,309 | |||||||
Total Investments in Securities — 100.0% |
| $ | 79,014 | |||||
Percentages are based on Net Assets of $78,992 ($ Thousands).
Cl — Class
As of March 31, 2021, all of the Fund’s investments were considered Level 1, in accordance with the authoritative guidance on fair value measurements and disclosure under U.S. GAAP.
As of March 31, 2021, there were no transfers in or out of Level 3.
For more information on valuation inputs, see Note 2 — Significant Accounting Policies in Notes to Financial Statements
| 42 | SEI Asset Allocation Trust / Annual Report / March 31, 2021 |
The following is a summary of the transactions with affiliates for the year ended March 31, 2021 ($ Thousands):
| Security Description | Value 3/31/2020 | Purchases at Cost | Proceeds from Sales | Realized Gain/ (Loss) | Change in Unrealized Appreciation/ (Depreciation) | Value 3/31/2021 | Shares | Dividend Income | Capital Gains | |||||||||
| SEI Institutional International Trust Emerging Markets Debt Fund, Cl Y | $3,628 | $349 | $(618) | $(47) | $620 | $3,932 | 393,225 | $31 | $— | |||||||||
| SEI Institutional Managed Trust Core Fixed Income Fund, Cl Y | 18,371 | 4,731 | (2,937) | 7 | (468) | 19,704 | 1,734,477 | 401 | 735 | |||||||||
| SEI Institutional Managed Trust High Yield Bond Fund, Cl Y | 3,687 | 428 | (815) | (85) | 766 | 3,981 | 576,123 | 235 | 74 | |||||||||
| SEI Institutional Managed Trust Multi-Asset Accumulation Fund, Cl Y | 14,567 | 2,060 | (2,438) | (150) | 1,754 | 15,793 | 1,624,765 | — | 806 | |||||||||
| SEI Institutional Managed Trust Multi-Asset Income Fund, Cl Y | 3,683 | 279 | (628) | (27) | 653 | 3,960 | 352,044 | 117 | — | |||||||||
| SEI Institutional Managed Trust Multi-Asset Inflation Managed Fund, Cl Y | 5,861 | 819 | (1,039) | (196) | 890 | 6,335 | 756,902 | 108 | — | |||||||||
| SEI Institutional International Trust Emerging Markets Equity Fund, Cl Y | 2,159 | 335 | (1,259) | 234 | 898 | 2,367 | 158,615 | 18 | — | |||||||||
| SEI Institutional International Trust International Equity Fund, Cl Y | 7,294 | 684 | (3,447) | 426 | 2,917 | 7,874 | 597,391 | 96 | — | |||||||||
| SEI Institutional Managed Trust Dynamic Asset Allocation Fund, Cl Y | 3,612 | 876 | (2,050) | 345 | 1,191 | 3,974 | 235,831 | 226 | 66 | |||||||||
| SEI Institutional Managed Trust Large Cap Fund, Cl Y | 7,977 | 1,589 | (4,485) | 348 | 3,282 | 8,711 | 525,082 | 117 | 238 | |||||||||
| SEI Institutional Managed Trust Small Cap Fund, Cl Y | 2,154 | 538 | (1,897) | 152 | 1,436 | 2,383 | 148,310 | 11 | — | |||||||||
|
|
|
|
|
|
|
| |||||||||||
Totals | $72,993 | $12,688 | $(21,613) | $1,007 | $13,939 | $79,014 | $1,360 | $1,919 | ||||||||||
|
|
|
|
|
|
|
|
Amounts designated as “— “ are $0 or have been rounded to $0.
The accompanying notes are an integral part of the financial statements.
| SEI Asset Allocation Trust / Annual Report / March 31, 2021 | 43 |
SCHEDULE OF INVESTMENTS
March 31, 2021
Core Market Strategy Allocation Fund

†Percentages are based on total investments.
| Description | Shares | Market Value ($ Thousands) | ||||||
AFFILIATED INVESTMENT FUNDS — 100.0% |
| |||||||
Equity Funds — 88.0% | ||||||||
SEI Institutional International Trust Emerging Markets Equity Fund, Cl Y | 34,278 | $ | 511 | |||||
SEI Institutional International Trust International Equity Fund, Cl Y | 313,525 | 4,132 | ||||||
SEI Institutional Managed Trust Tax-Managed Large Cap Fund, Cl Y * | 441,910 | 14,512 | ||||||
SEI Institutional Managed Trust Tax-Managed Small/Mid Cap Fund, Cl Y | 132,496 | 3,621 | ||||||
|
| |||||||
Total Equity Funds (Cost $9,514) ($ Thousands) | 22,776 | |||||||
|
| |||||||
Fixed Income Funds — 12.0% |
| |||||||
SEI Institutional International Trust Emerging Markets Debt Fund, Cl Y | 101,751 | 1,018 | ||||||
| Description | Shares | Market Value ($ Thousands) | ||||||
AFFILIATED INVESTMENT FUNDS (continued) |
| |||||||
SEI Institutional Managed Trust High Yield Bond Fund, Cl Y | 302,405 | $ | 2,090 | |||||
|
| |||||||
Total Fixed Income Funds | 3,108 | |||||||
|
| |||||||
Total Investments in Securities — 100.0% |
| $ | 25,884 | |||||
|
| |||||||
Percentages are based on Net Assets of $25,876 ($ Thousands).
Cl — Class
* Represents greater than 50% of the Fund’s total investments. For further financial information, available upon request at no charge, please go to the Securities Exchange Commission’s website at http://www.sec.gov or call 1-800-DIAL-SEI.
As of March 31, 2021, all of the Fund’s investments in securities were considered Level 1, in accordance with the authoritative guidance on fair value measurements and disclosure under U.S. GAAP.
As of March 31, 2021, there were no transfers in or out of Level 3.
For more information on valuation inputs, see Note 2 — Significant Accounting Policies in Notes to Financial Statements.
The following is a summary of the transactions with affiliates for the year ended March 31, 2021 ($ Thousands):
| Security Description | Value 3/31/2020 | Purchases at Cost | Proceeds from Sales | Realized Gain/ (Loss) | Change in Unrealized Appreciation/ (Depreciation) | Value 3/31/2021 | Shares | Dividend Income | Capital Gains | |||||||||
| SEI Institutional International Trust Emerging Markets Equity Fund, Class Y | $408 | $17 | $(145) | $22 | $209 | $511 | 34,278 | $4 | $— | |||||||||
| SEI Institutional International Trust International Equity Fund, Class Y | 3,325 | 161 | (996) | 108 | 1,534 | 4,132 | 313,525 | 51 | — | |||||||||
| SEI Institutional Managed Trust Tax Managed Large Cap Fund, Class Y | 11,522 | 451 | (3,030) | 796 | 4,773 | 14,512 | 441,910 | 194 | 197 | |||||||||
| SEI Institutional Managed Trust Tax-Managed Small/Mid Cap Fund, Class Y | 2,872 | 102 | (1,362) | 201 | 1,808 | 3,621 | 132,496 | 15 | — | |||||||||
| SEI Institutional International Trust Emerging Markets Debt Fund, Class Y | 800 | 120 | (36) | (3) | 137 | 1,018 | 101,751 | 8 | — | |||||||||
| SEI Institutional Managed Trust High Yield Bond Fund, Class Y | 1,575 | 363 | (178) | (17) | 347 | 2,090 | 302,405 | 116 | 38 | |||||||||
|
|
|
|
|
|
|
| |||||||||||
Totals | $20,502 | $1,214 | $(5,747) | $1,107 | $8,808 | $25,884 | $388 | $235 | ||||||||||
|
|
|
|
|
|
|
|
Amounts designated as “— “ are $0 or have been rounded to $0.
The accompanying notes are an integral part of the financial statements.
| 44 | SEI Asset Allocation Trust / Annual Report / March 31, 2021 |
SCHEDULE OF INVESTMENTS
March 31, 2021
Market Growth Strategy Fund
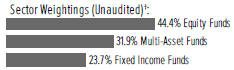
†Percentages are based on total investments.
Description | Shares | Market Value ($ Thousands) | ||||||
AFFILIATED INVESTMENT FUNDS — 100.0% |
| |||||||
Equity Funds — 44.4% | ||||||||
SEI Institutional International Trust Emerging Markets Equity Fund, Cl Y | 514,811 | $ | 7,681 | |||||
SEI Institutional International Trust International Equity Fund, Cl Y | 2,235,797 | 29,468 | ||||||
SEI Institutional Managed Trust Dynamic Asset Allocation Fund, Cl Y | 706,073 | 11,897 | ||||||
SEI Institutional Managed Trust Large Cap Fund, Cl Y | 1,904,962 | 31,603 | ||||||
SEI Institutional Managed Trust Small Cap Fund, Cl Y | 363,346 | 5,839 | ||||||
|
| |||||||
Total Equity Funds (Cost $57,962) ($ Thousands) |
| 86,488 | ||||||
|
| |||||||
Multi-Asset Funds — 31.9% | ||||||||
SEI Institutional Managed Trust Multi-Asset Accumulation Fund, Cl Y | 3,988,124 | 38,764 | ||||||
SEI Institutional Managed Trust Multi-Asset Income Fund, Cl Y | 686,033 | 7,718 | ||||||
SEI Institutional Managed Trust Multi-Asset Inflation Managed Fund, Cl Y | 1,856,611 | 15,540 | ||||||
|
| |||||||
Total Multi-Asset Funds (Cost $63,245) ($ Thousands) | 62,022 | |||||||
|
| |||||||
Fixed Income Funds — 23.7% |
| |||||||
SEI Institutional International Trust Emerging Markets Debt Fund, Cl Y | 956,623 | 9,566 | ||||||
SEI Institutional Managed Trust Core Fixed Income Fund, Cl Y | 2,365,550 | 26,873 | ||||||
SEI Institutional Managed Trust High Yield Bond Fund, Cl Y | 1,410,550 | 9,747 | ||||||
|
| |||||||
Total Fixed Income Funds |
| 46,186 | ||||||
|
| |||||||
Total Investments in Securities — 100.0% (Cost $166,889) ($ Thousands) |
| $ | 194,696 | |||||
|
| |||||||
Percentages are based on Net Assets of $194,633 ($ Thousands).
Cl — Class
As of March 31, 2021, all of the Fund’s investments in securities were considered Level 1, in accordance with the authoritative guidance on fair value measurement and disclosure under U.S. GAAP.
As of March 31, 2021, there were no transfers in our out of Level 3.
For more information on valuation inputs, see Note 2 — Significant Accounting Policies in Notes to Financial Statements
| SEI Asset Allocation Trust / Annual Report / March 31, 2021 | 45 |
SCHEDULE OF INVESTMENTS
March 31, 2021
Market Growth Strategy Fund (Concluded)
The following is a summary of the transactions with affiliates for the year ended March 31, 2021 ($ Thousands):
| Security Description | Value 3/31/2020 | Purchases at Cost | Proceeds from Sales | Realized Gain/ (Loss) | Change in Unrealized Appreciation/ (Depreciation) | Value 3/31/2021 | Shares | Dividend Income | Capital Gains | |||||||||
| SEI Institutional International Trust Emerging Markets Equity Fund, Cl Y | $6,713 | $335 | $(2,985) | $441 | $3,177 | $7,681 | 514,811 | $59 | $— | |||||||||
| SEI Institutional International Trust International Equity Fund, Cl Y | 25,629 | 1,523 | (9,746) | 1,186 | 10,876 | 29,468 | 2,235,797 | 351 | — | |||||||||
| SEI Institutional Managed Trust Dynamic Asset Allocation Fund, Cl Y | 10,151 | 1,276 | (3,913) | 762 | 3,621 | 11,897 | 706,073 | 661 | 194 | |||||||||
| SEI Institutional Managed Trust Large Cap Fund, Cl Y | 27,175 | 2,681 | (10,896) | 376 | 12,267 | 31,603 | 1,904,962 | 406 | 844 | |||||||||
| SEI Institutional Managed Trust Small Cap Fund, Cl Y | 5,121 | 680 | (3,774) | (203) | 4,015 | 5,839 | 363,346 | 26 | — | |||||||||
| SEI Institutional Managed Trust Multi-Asset Accumulation Fund, Cl Y | 33,413 | 5,787 | (4,228) | (208) | 4,000 | 38,764 | 3,988,124 | — | 1,989 | |||||||||
| SEI Institutional Managed Trust Multi-Asset Income Fund, Cl Y | 6,906 | 682 | (1,075) | (39) | 1,244 | 7,718 | 686,033 | 224 | — | |||||||||
| SEI Institutional Managed Trust Multi-Asset Inflation Managed Fund, Cl Y | 13,501 | 2,315 | (1,941) | (494) | 2,159 | 15,540 | 1,856,611 | 262 | — | |||||||||
| SEI Institutional International Trust Emerging Markets Debt Fund, Cl Y | 8,499 | 982 | (1,299) | (118) | 1,502 | 9,566 | 956,623 | 75 | — | |||||||||
| SEI Institutional Managed Trust Core Fixed Income Fund, Cl Y | 23,776 | 7,373 | (3,605) | (20) | (651) | 26,873 | 2,365,550 | 539 | 1,030 | |||||||||
| SEI Institutional Managed Trust High Yield Bond Fund, Cl Y | 8,641 | 1,152 | (1,690) | (285) | 1,929 | 9,747 | 1,410,550 | 567 | 183 | |||||||||
|
|
|
|
|
|
|
| |||||||||||
Totals | $169,525 | $24,786 | $(45,152) | $1,398 | $44,139 | $194,696 | $3,170 | $4,240 |
Amounts designated as “ – “ are $0 or have been rounded to $0.
The accompanying notes are an integral part of the financial statements.
| 46 | SEI Asset Allocation Trust / Annual Report / March 31, 2021 |
SCHEDULE OF INVESTMENTS
March 31, 2021
Market Growth Strategy Allocation Fund
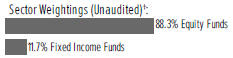
† Percentages are based on total investments.
| Description | Shares | Market Value ($ Thousands) | ||||||
AFFILIATED INVESTMENT FUNDS — 100.0% |
| |||||||
Equity Funds — 88.3% |
| |||||||
SEI Institutional International Trust Emerging Markets Equity Fund, Cl Y | 173,980 | $ | 2,596 | |||||
SEI Institutional International Trust International Equity Fund, Cl Y | 1,644,073 | 21,669 | ||||||
SEI Institutional Managed Trust Tax-Managed Large Cap Fund, Cl Y * | 2,318,380 | 76,136 | ||||||
SEI Institutional Managed Trust Tax-Managed Small/Mid Cap Fund, Cl Y | 695,798 | 19,016 | ||||||
|
| |||||||
Total Equity Funds (Cost $51,416) ($ Thousands) |
| 119,417 | ||||||
|
| |||||||
Fixed Income Funds — 11.7% |
| |||||||
SEI Institutional International Trust Emerging Markets Debt Fund, Cl Y | 512,236 | 5,122 | ||||||
| Description | Shares | Market Value ($ Thousands) | ||||||
AFFILIATED INVESTMENT FUNDS (continued) |
| |||||||
SEI Institutional Managed Trust High Yield Bond Fund, Cl Y | 1,557,226 | $ | 10,760 | |||||
|
| |||||||
Total Fixed Income Funds |
| 15,882 | ||||||
|
| |||||||
Total Investments in Securities — 100.0% |
| $ | 135,299 | |||||
|
| |||||||
Percentages are based on Net Assets of $135,260 ($ Thousands).
Cl — Class
* Represents greater than 50% of the Fund’s total investments. For further financial information, available upon request at no charge, please go to the Securities Exchange Commission’s website at http://www.sec.gov or call 1-800-DIAL-SEI.
As of March 31, 2021, all of the Fund’s investments in securities were considered Level 1, in accordance with the authoritative guidance on fair value measurements and disclosure under U.S. GAAP.
As of March 31, 2021, there were no transfers in or out of Level 3.
For more information on valuation inputs, see Note 2 — Significant Accounting Policies in Notes to Financial Statements.
The following is a summary of the transactions with affiliates for the year ended March 31, 2021 ($ Thousands):
| Security Description | Value 3/31/2020 | Purchases at Cost | Proceeds from Sales | Realized Gain/ (Loss) | Change in Unrealized Appreciation/ (Depreciation) | Value 3/31/2021 | Shares | Dividend Income | Capital Gains | |||||||||
| SEI Institutional International Trust Emerging Markets Equity Fund, Class Y | $1,988 | $20 | $(567) | $82 | $1,073 | $2,596 | 173,980 | $20 | $— | |||||||||
| SEI Institutional International Trust International Equity Fund, Class Y | 16,157 | 261 | (2,977) | 277 | 7,951 | 21,669 | 1,644,073 | 256 | — | |||||||||
| SEI Institutional Managed Trust Tax-Managed Large Cap Fund, Class Y | 56,045 | 1,973 | (9,854) | 2,418 | 25,554 | 76,136 | 2,318,380 | 973 | 1,000 | |||||||||
| SEI Institutional Managed Trust Tax-Managed Small/Mid Cap Fund, Class Y | 14,144 | 146 | (5,351) | 629 | 9,448 | 19,016 | 695,798 | 74 | — | |||||||||
| SEI Institutional International Trust Emerging Markets Debt Fund, Class Y | 3,933 | 575 | (44) | (10) | 668 | 5,122 | 512,236 | 38 | — | |||||||||
| SEI Institutional Managed Trust High Yield Bond Fund, Class Y | 7,983 | 1,469 | (331) | (66) | 1,705 | 10,760 | 1,557,226 | 581 | 188 | |||||||||
|
|
|
|
|
|
|
| |||||||||||
| Totals | $100,250 | $4,444 | $(19,124) | $3,330 | $46,399 | $135,299 | $1,942 | $1,188 | ||||||||||
|
|
|
|
|
|
|
|
Amounts designated as “— “ are $0 or have been rounded to $0.
The accompanying notes are an integral part of the financial statements.
| SEI Asset Allocation Trust / Annual Report / March 31, 2021 | 47 |
STATEMENTS OF ASSETS AND LIABILITIES ($ Thousands)
March 31, 2021
| Defensive Strategy Fund | Defensive Strategy Allocation Fund | Conservative Strategy Fund | Conservative Strategy Allocation Fund | |||||||||||||
Assets: | ||||||||||||||||
Investments in affiliated funds, at market | $ | 17,700 | $ | 6,238 | $ | 69,537 | $ | 29,164 | ||||||||
Income distribution receivable from affiliated funds | 8 | 6 | 42 | 49 | ||||||||||||
Receivable for fund shares sold | 3 | — | 13 | — | ||||||||||||
Receivable for investment securities sold | — | 1 | 27 | 5 | ||||||||||||
Receivable from adviser | — | — | — | — | ||||||||||||
Prepaid expenses | 6 | 1 | 11 | 5 | ||||||||||||
Total Assets | 17,717 | 6,246 | 69,630 | 29,223 | ||||||||||||
Liabilities: | ||||||||||||||||
Payable for investment securities purchased | 8 | 6 | 42 | 49 | ||||||||||||
Shareholder servicing fees payable | 2 | 1 | 10 | 6 | ||||||||||||
Payable for fund shares redeemed | 1 | — | 30 | 2 | ||||||||||||
Investment advisory fees payable | 1 | — | — | — | ||||||||||||
Distribution fees payable | — | — | 4 | — | ||||||||||||
Administrative servicing fees payable | — | — | — | — | ||||||||||||
Trustees’ fees payable | — | — | — | — | ||||||||||||
Accrued expenses | 5 | 3 | 25 | 10 | ||||||||||||
Total Liabilities | 17 | 10 | 111 | 67 | ||||||||||||
Net Assets | $ | 17,700 | $ | 6,236 | $ | 69,519 | $ | 29,156 | ||||||||
† Cost of investments in affiliated funds | $ | 17,137 | $ | 6,165 | $ | 67,400 | $ | 24,537 | ||||||||
Net Assets: | ||||||||||||||||
Paid in Capital (unlimited authorization - no par value) | $ | 17,086 | $ | 7,855 | $ | 68,527 | $ | 27,119 | ||||||||
Total distributable earnings/(loss) | 614 | (1,619 | ) | 992 | 2,037 | |||||||||||
Net Assets | $ | 17,700 | $ | 6,236 | $ | 69,519 | $ | 29,156 | ||||||||
| Net Asset Value, Offering and Redemption Price Per Share — Class F | $10.11 | $11.71 | $10.99 | $12.78 | ||||||||||||
| ($17,329,521 ÷ | ($6,236,268 ÷ | ($64,669,430 ÷ | ($29,155,714 ÷ | |||||||||||||
| 1,713,674 shares | ) | 532,746 shares | ) | 5,884,932 shares | ) | 2,282,095 shares | ) | |||||||||
| Net Asset Value, Offering and Redemption Price Per Share — Class D | N/A | N/A | $10.97 | N/A | ||||||||||||
| ($4,506,706 | ÷ | |||||||||||||||
| 410,721 shares) | ||||||||||||||||
| Net Asset Value, Offering and Redemption Price Per Share — Class I | $9.93 | N/A | $11.20 | N/A | ||||||||||||
| ($370,143 | ÷ | ($342,372 | ÷ | |||||||||||||
| 37,261 shares | ) | 30,558 shares | ) | |||||||||||||
(1) Net assets divided by shares does not calculate to the stated NAV because net assets and shares are shown rounded.
Amounts designated as “—” are $0 or have been rounded to $0.
N/A - Not applicable. Class D and/or Class I shares currently not offered.
The accompanying notes are an integral part of the financial statements.
| 48 | SEI Asset Allocation Trust / Annual Report / March 31, 2021 |
Moderate Strategy Fund | Moderate Strategy Allocation Fund | Aggressive Strategy Fund | Tax-Managed Aggressive Strategy Fund | Core Market Strategy Fund | Core Market Strategy Allocation Fund | Market Growth Strategy Fund | Market Growth Strategy Allocation Fund | |||||||||||||||||||||||
| $ | 148,360 | $ | 68,520 | $ | 183,507 | $ | 86,977 | $ | 79,014 | $ | 25,884 | $ | 194,696 | $ | 135,299 | |||||||||||||||
| 89 | 62 | 71 | 33 | 60 | 11 | 107 | 55 | |||||||||||||||||||||||
| 27 | 67 | 31 | 5 | 6 | — | 14 | — | |||||||||||||||||||||||
| 82 | 8 | — | 6 | 141 | 4 | 29 | 33 | |||||||||||||||||||||||
| 1 | 1 | 5 | 2 | 1 | 1 | 4 | 3 | |||||||||||||||||||||||
| 25 | 10 | 25 | 11 | 12 | 4 | 29 | 19 | |||||||||||||||||||||||
| 148,584 | 68,668 | 183,639 | 87,034 | 79,234 | 25,904 | 194,879 | 135,409 | |||||||||||||||||||||||
| 90 | 62 | 75 | 33 | 60 | 11 | 107 | 55 | |||||||||||||||||||||||
| 27 | 14 | 39 | 18 | 17 | 6 | 41 | 29 | |||||||||||||||||||||||
| 89 | 68 | 6 | 1 | 138 | 1 | 19 | 17 | |||||||||||||||||||||||
| — | — | — | — | — | — | — | — | |||||||||||||||||||||||
| 3 | — | 17 | — | — | — | 7 | — | |||||||||||||||||||||||
| 1 | — | 3 | — | — | — | 2 | — | |||||||||||||||||||||||
| 1 | — | 1 | 1 | — | — | 1 | 1 | |||||||||||||||||||||||
| 54 | 22 | 62 | 28 | 27 | 10 | 69 | 47 | |||||||||||||||||||||||
| 265 | 166 | 203 | 81 | 242 | 28 | 246 | 149 | |||||||||||||||||||||||
| $ | 148,319 | $ | 68,502 | $ | 183,436 | $ | 86,953 | $ | 78,992 | $ | 25,876 | $ | 194,633 | $ | 135,260 | |||||||||||||||
| $ | 142,768 | $ | 50,127 | $ | 145,650 | $ | 45,347 | $ | 68,561 | $ | 12,599 | $ | 166,889 | $ | 67,243 | |||||||||||||||
| $ | 144,025 | $ | 50,958 | $ | 150,247 | $ | 46,528 | $ | 70,977 | $ | 11,791 | $ | 170,111 | $ | 65,850 | |||||||||||||||
| 4,294 | 17,544 | 33,189 | 40,425 | 8,015 | 14,085 | 24,522 | 69,410 | |||||||||||||||||||||||
| $ | 148,319 | $ | 68,502 | $ | 183,436 | $ | 86,953 | $ | 78,992 | $ | 25,876 | $ | 194,633 | $ | 135,260 | |||||||||||||||
| $12.87 | $19.71 | $17.09 | $26.03 | $12.52 | $22.35 | $14.60 | $28.65 | |||||||||||||||||||||||
| ($142,002,034 ÷ | ($68,501,613 ÷ | ($154,482,320 ÷ | ($86,952,759 ÷ | ($78,989,954 ÷ | ($25,876,408 ÷ | ($184,903,252 ÷ | ($135,259,812 ÷ | |||||||||||||||||||||||
| 11,036,402 shares) | 3,474,869 shares) | 9,036,937 shares) | 3,340,683 shares) | 6,311,323 shares) | 1,157,609 shares) | 12,665,693 shares) | 4,720,626 shares) | |||||||||||||||||||||||
| $12.83 | N/A | $16.83 | N/A | N/A | N/A | $14.51 | N/A | |||||||||||||||||||||||
| ($3,908,142 ÷ | ($19,092,966 ÷ | ($5,307,599 ÷ | ||||||||||||||||||||||||||||
| 304,692 shares) | 1,134,425 shares) | 365,868 shares) | ||||||||||||||||||||||||||||
| $13.24 | N/A | $16.58 | N/A | $14.03 | N/A | $14.36 | N/A | |||||||||||||||||||||||
| ($2,409,093 ÷ | ($9,860,814 ÷ | ($2,252 ÷ | ($4,422,618 ÷ | |||||||||||||||||||||||||||
| 181,891 shares) | 594,597 shares) | 161 shares)(1) | 308,088 shares) | |||||||||||||||||||||||||||
| SEI Asset Allocation Trust / Annual Report / March 31, 2021 | 49 |
STATEMENTS OF OPERATIONS ($ Thousands)
For the year ended March 31, 2021
| Defensive Strategy Fund | Defensive Strategy Allocation Fund | Conservative Strategy Fund | Conservative Strategy Allocation Fund | |||||||||||||
Investment Income: | ||||||||||||||||
Income distributions from affiliated funds | $ | 281 | $ | 81 | $ | 953 | $ | 904 | ||||||||
Expenses | ||||||||||||||||
Administration fees | 47 | 10 | 107 | 46 | ||||||||||||
Investment advisory fees | 32 | 7 | 72 | 31 | ||||||||||||
Shareholder servicing fees — Class F | 78 | 17 | 168 | 77 | ||||||||||||
Shareholder servicing fees — Class D | — | — | 10 | — | ||||||||||||
Shareholder servicing fees — Class I | 1 | — | 1 | — | ||||||||||||
Administrative servicing fees — Class I | 1 | — | 1 | — | ||||||||||||
Trustees’ fees | — | — | 1 | — | ||||||||||||
Distribution fees — Class D | — | — | 29 | — | ||||||||||||
Printing fees | 9 | 2 | 26 | 11 | ||||||||||||
Registration fees | 8 | 3 | 23 | 11 | ||||||||||||
Professional fees | 4 | 1 | 15 | 6 | ||||||||||||
Custodian/wire agent fees | 2 | — | 5 | 2 | ||||||||||||
Chief compliance officer fees | — | — | — | — | ||||||||||||
Other expenses | 2 | — | 4 | 2 | ||||||||||||
Total expenses | 184 | 40 | 462 | 186 | ||||||||||||
Less: | ||||||||||||||||
Administration fees waived | (47 | ) | (10 | ) | (107 | ) | (46 | ) | ||||||||
Investment advisory fees waived | (26 | ) | (7 | ) | (72 | ) | (32 | ) | ||||||||
Waiver of shareholder servicing fees — Class F | (44 | ) | — | (60 | ) | — | ||||||||||
Waiver of shareholder servicing fees — Class D | — | — | (3 | ) | — | |||||||||||
Waiver of shareholder servicing fees — Class I | — | — | (1 | ) | — | |||||||||||
Net Expenses | 67 | 23 | 219 | 108 | ||||||||||||
Net Investment Income | 214 | 58 | 734 | 796 | ||||||||||||
Net Realized and Unrealized Gain (Loss) from Affiliated Funds: | ||||||||||||||||
Net realized gain (loss) from sales of affiliated funds | 235 | (89 | ) | (580 | ) | (845 | ) | |||||||||
Capital gain distributions received from affiliated funds | 261 | 23 | 1,013 | 1,157 | ||||||||||||
Net change in unrealized appreciation from affiliated funds | 1,025 | 325 | 6,095 | 6,259 | ||||||||||||
Net Realized and Unrealized gain from Affiliated Funds | 1,521 | 259 | 6,528 | 6,571 | ||||||||||||
Net Increase in Net Assets Resulting from Operations | $ | 1,735 | $ | 317 | $ | 7,262 | $ | 7,367 | ||||||||
Amounts designated as “—” are $0 or have been rounded to $0.
The accompanying notes are an integral part of the financial statements.
| 50 | SEI Asset Allocation Trust / Annual Report / March 31, 2021 |
| Moderate Strategy Fund | Moderate Strategy Allocation Fund | Aggressive Strategy Fund | Tax-Managed Aggressive Strategy Fund | Core Market Strategy Fund | Core Market Strategy Allocation Fund | Market Growth Strategy Fund | Market Growth Strategy Allocation Fund | |||||||||||||||||||||||
| $ | 2,238 | $ | 1,469 | $ | 2,672 | $ | 1,156 | $ | 1,360 | $ | 388 | $ | 3,170 | $ | 1,942 | |||||||||||||||
| 241 | 97 | 249 | 110 | 116 | 37 | 280 | 185 | |||||||||||||||||||||||
| 161 | 65 | 166 | 73 | 77 | 24 | 187 | 123 | |||||||||||||||||||||||
| 386 | 162 | 353 | 184 | 193 | 61 | 444 | 309 | |||||||||||||||||||||||
| 10 | — | 42 | — | — | — | 12 | — | |||||||||||||||||||||||
| 6 | — | 21 | — | — | — | 10 | — | |||||||||||||||||||||||
| 6 | — | 21 | — | — | — | 10 | — | |||||||||||||||||||||||
| 2 | 1 | 2 | 1 | 1 | — | 3 | 2 | |||||||||||||||||||||||
| 29 | — | 125 | — | — | — | 37 | — | |||||||||||||||||||||||
| 59 | 24 | 64 | 28 | 29 | 9 | 70 | 47 | |||||||||||||||||||||||
| 50 | 23 | 54 | 23 | 25 | 8 | 61 | 38 | |||||||||||||||||||||||
| 33 | 13 | 35 | 16 | 16 | 5 | 38 | 26 | |||||||||||||||||||||||
| 11 | 4 | 11 | 5 | 5 | 2 | 12 | 8 | |||||||||||||||||||||||
| 1 | — | 1 | — | — | — | 1 | 1 | |||||||||||||||||||||||
| 8 | 3 | 9 | 4 | 4 | 1 | 10 | 6 | |||||||||||||||||||||||
| 1,003 | 392 | 1,153 | 444 | 466 | 147 | 1,175 | 745 | |||||||||||||||||||||||
| (241) | (97) | (249) | (110) | (116) | (37) | (280) | (185) | |||||||||||||||||||||||
| (162) | (67) | (173) | (76) | (80) | (25) | (192) | (125) | |||||||||||||||||||||||
| (62) | — | — | — | — | — | — | — | |||||||||||||||||||||||
| (2) | — | — | — | — | — | — | — | |||||||||||||||||||||||
| (1) | — | — | — | — | — | — | — | |||||||||||||||||||||||
| 535 | 228 | 731 | 258 | 270 | 85 | 703 | 435 | |||||||||||||||||||||||
| 1,703 | 1,241 | 1,941 | 898 | 1,090 | 303 | 2,467 | 1,507 | |||||||||||||||||||||||
| (2,306) | 918 | 910 | 93 | 1,007 | 1,107 | 1,398 | 3,330 | |||||||||||||||||||||||
| 3,873 | 2,852 | 3,449 | 715 | 1,919 | 235 | 4,240 | 1,188 | |||||||||||||||||||||||
| 20,584 | 13,034 | 51,989 | 29,343 | 13,939 | 8,808 | 44,139 | 46,399 | |||||||||||||||||||||||
| 22,151 | 16,804 | 56,348 | 30,151 | 16,865 | 10,150 | 49,777 | 50,917 | |||||||||||||||||||||||
| $ | 23,854 | $ | 18,045 | $ | 58,289 | $ | 31,049 | $ | 17,955 | $ | 10,453 | $ | 52,244 | $ | 52,424 | |||||||||||||||
| SEI Asset Allocation Trust / Annual Report / March 31, 2021 | 51 |
STATEMENTS OF CHANGES IN NET ASSETS ($ Thousands)
For the year ended March 31,
| Defensive Strategy Fund | Defensive Strategy Allocation Fund | |||||||||||||||
| 4/01/20 - 3/31/21 | 4/01/19 - 3/31/20 | 4/01/20 - 3/31/21 | 4/01/19 - 3/31/20 | |||||||||||||
Operations: | ||||||||||||||||
Net investment income | $ | 214 | $ | 363 | $ | 58 | $ | 311 | ||||||||
Net realized gain (loss) from sales of affiliated funds | 235 | (126 | ) | (89 | ) | (1,421 | ) | |||||||||
Capital gain distributions received from affiliated funds | 261 | 129 | 23 | 290 | ||||||||||||
Net change in unrealized appreciation (depreciation) from affiliated funds | 1,025 | (164 | ) | 325 | (697 | ) | ||||||||||
Net Increase (Decrease) in Net Assets Resulting from Operations | 1,735 | 202 | 317 | (1,517 | ) | |||||||||||
Distributions: | ||||||||||||||||
Class F | (365 | ) | (447 | ) | (118 | ) | (529 | ) | ||||||||
Class D | N/A | N/A | N/A | N/A | ||||||||||||
Class I | (6 | ) | (8 | ) | N/A | N/A | ||||||||||
Return of Capital | ||||||||||||||||
Class F | — | — | (1 | ) | — | |||||||||||
Class D | — | — | — | — | ||||||||||||
Class I | — | — | — | — | ||||||||||||
Total Distributions | (371 | ) | (455 | ) | (119 | ) | (529 | ) | ||||||||
Capital Share Transactions:(1) | ||||||||||||||||
Class F | ||||||||||||||||
Proceeds from shares issued | 44,930 | 2,990 | 1,645 | 3,832 | ||||||||||||
Reinvestment of dividends & distributions | 360 | 443 | 112 | 500 | ||||||||||||
Cost of shares redeemed | (45,341 | ) | (6,782 | ) | (3,291 | ) | (2,882 | ) | ||||||||
Increase (Decrease) in Net Assets Derived from Class F Transactions | (51 | ) | (3,349 | ) | (1,534 | ) | 1,450 | |||||||||
Class D | ||||||||||||||||
Proceeds from shares issued | N/A | N/A | N/A | N/A | ||||||||||||
Reinvestment of dividends & distributions | N/A | N/A | N/A | N/A | ||||||||||||
Cost of shares redeemed | N/A | N/A | N/A | N/A | ||||||||||||
Increase in Net Assets Derived from Class D Transactions | N/A | N/A | N/A | N/A | ||||||||||||
Class I | ||||||||||||||||
Proceeds from shares issued | 101 | 187 | N/A | N/A | ||||||||||||
Reinvestment of dividends & distributions | 6 | 8 | N/A | N/A | ||||||||||||
Cost of shares redeemed | (180 | ) | (85 | ) | N/A | N/A | ||||||||||
Increase (Decrease) in Net Assets Derived from Class I Transactions | (73 | ) | 110 | N/A | N/A | |||||||||||
Increase (Decrease) in Net Assets Derived From Capital Share Transactions | (124 | ) | (3,239 | ) | (1,534 | ) | 1,450 | |||||||||
Net Increase (Decrease) in Net Assets | 1,240 | (3,492 | ) | (1,336 | ) | (596 | ) | |||||||||
Net Assets: | ||||||||||||||||
Beginning of Year | 16,460 | 19,952 | 7,572 | 8,168 | ||||||||||||
End of Year | $ | 17,700 | $ | 16,460 | $ | 6,236 | $ | 7,572 | ||||||||
| (1) | For Capital Share Transactions see footnote 4 in the notes to financial statements. |
Amounts designated as “—” are $0 or have been rounded to $0.
N/A — Not applicable. Class D and Class I shares currently not offered.
The accompanying notes are an integral part of the financial statements.
| 52 | SEI Asset Allocation Trust / Annual Report / March 31, 2021 |
| Conservative Strategy Fund | Conservative Strategy Allocation Fund | Moderate Strategy Fund | Moderate Strategy Allocation Fund | |||||||||||||||||||||||||||
| 4/01/20 - 3/31/21 | 4/01/19 - 3/31/20 | 4/01/20 - 3/31/21 | 4/01/19 - 3/31/20 | 4/01/20 - 3/31/21 | 4/01/19 - 3/31/20 | 4/01/20 - 3/31/21 | 4/01/19 - 3/31/20 | |||||||||||||||||||||||
| $ | 734 | $ | 1,598 | $ | 796 | $ | 1,140 | $ | 1,703 | $ | 3,460 | $ | 1,241 | $ | 1,857 | |||||||||||||||
| (580 | ) | (712 | ) | (845 | ) | (2,558 | ) | (2,306 | ) | (3,287 | ) | 918 | 573 | |||||||||||||||||
| 1,013 | 957 | 1,157 | 1,209 | 3,873 | 4,772 | 2,852 | 2,769 | |||||||||||||||||||||||
| 6,095 | (2,817 | ) | 6,259 | (4,781 | ) | 20,584 | (9,524 | ) | 13,034 | (14,787 | ) | |||||||||||||||||||
| 7,262 | (974 | ) | 7,367 | (4,990 | ) | 23,854 | (4,579 | ) | 18,045 | (9,588 | ) | |||||||||||||||||||
| (1,531 | ) | (2,291 | ) | (1,074 | ) | (3,564 | ) | (4,208 | ) | (5,327 | ) | (4,314 | ) | (6,657 | ) | |||||||||||||||
| (60 | ) | (92 | ) | N/A | N/A | (79 | ) | (93 | ) | N/A | N/A | |||||||||||||||||||
| (9 | ) | (26 | ) | N/A | N/A | (57 | ) | (69 | ) | N/A | N/A | |||||||||||||||||||
| — | — | — | — | — | — | — | — | |||||||||||||||||||||||
| — | — | — | — | �� | — | — | — | |||||||||||||||||||||||
| — | — | — | — | — | — | — | — | |||||||||||||||||||||||
| (1,600 | ) | (2,409 | ) | (1,074 | ) | (3,564 | ) | (4,344 | ) | (5,489 | ) | (4,314 | ) | (6,657 | ) | |||||||||||||||
| 14,203 | 6,938 | 1,837 | 4,119 | 53,266 | 18,593 | 6,176 | 4,416 | |||||||||||||||||||||||
| 1,445 | 2,157 | 962 | 3,162 | 4,017 | 5,164 | 3,991 | 6,265 | |||||||||||||||||||||||
| (19,024 | ) | (17,529 | ) | (11,238 | ) | (7,253 | ) | (75,268 | ) | (40,955 | ) | (15,893 | ) | (19,252 | ) | |||||||||||||||
| (3,376 | ) | (8,434 | ) | (8,439 | ) | 28 | (17,985 | ) | (17,198 | ) | (5,726 | ) | (8,571 | ) | ||||||||||||||||
| 1,647 | 1,022 | N/A | N/A | 462 | 539 | N/A | N/A | |||||||||||||||||||||||
| 57 | 87 | N/A | N/A | 74 | 86 | N/A | N/A | |||||||||||||||||||||||
| (1,059 | ) | (1,046 | ) | N/A | N/A | (500 | ) | (539 | ) | N/A | N/A | |||||||||||||||||||
| 645 | 63 | N/A | N/A | 36 | 86 | N/A | N/A | |||||||||||||||||||||||
| 81 | 480 | N/A | N/A | 335 | 351 | N/A | N/A | |||||||||||||||||||||||
| 9 | 25 | N/A | N/A | 57 | 69 | N/A | N/A | |||||||||||||||||||||||
| (608 | ) | (647 | ) | N/A | N/A | (392 | ) | (437 | ) | N/A | N/A | |||||||||||||||||||
| (518 | ) | (142 | ) | N/A | N/A | — | (17 | ) | N/A | N/A | ||||||||||||||||||||
| (3,249 | ) | (8,513 | ) | (8,439 | ) | 28 | (17,949 | ) | (17,129 | ) | (5,726 | ) | (8,571 | ) | ||||||||||||||||
| 2,413 | (11,896 | ) | (2,146 | ) | (8,526 | ) | 1,561 | (27,197 | ) | 8,005 | (24,816 | ) | ||||||||||||||||||
| 67,106 | 79,002 | 31,302 | 39,828 | 146,758 | 173,955 | 60,497 | 85,313 | |||||||||||||||||||||||
| $ | 69,519 | $ | 67,106 | $ | 29,156 | $ | 31,302 | $ | 148,319 | $ | 146,758 | $ | 68,502 | $ | 60,497 | |||||||||||||||
| SEI Asset Allocation Trust / Annual Report / March 31, 2021 | 53 |
STATEMENTS OF CHANGES IN NET ASSETS ($ Thousands) (Concluded)
For the year ended March 31,
| Aggressive Strategy Fund | Tax-Managed Aggressive Strategy Fund | |||||||||||||||
| 4/01/20 - 3/31/21 | 4/01/19 - 3/31/20 | 4/01/20 - 3/31/21 | 4/01/19 - 3/31/20 | |||||||||||||
Operations: | ||||||||||||||||
Net investment income | $ | 1,941 | $ | 2,970 | $ | 898 | $ | 1,179 | ||||||||
Net realized gain (loss) from sales of affiliated funds | 910 | (4,006 | ) | 93 | (1,775 | ) | ||||||||||
Capital gain distributions received from affiliated funds | 3,449 | 6,379 | 715 | 3,444 | ||||||||||||
Net change in unrealized appreciation (depreciation) from affiliated funds | 51,989 | (22,203 | ) | 29,343 | (13,105 | ) | ||||||||||
Net Increase (Decrease) in Net Assets Resulting from Operations | 58,289 | (16,860 | ) | 31,049 | (10,257 | ) | ||||||||||
Distributions: | ||||||||||||||||
Class F | (5,821 | ) | (9,257 | ) | (3,186 | ) | (2,258 | ) | ||||||||
Class D | (645 | ) | (781 | ) | N/A | N/A | ||||||||||
Class I | (346 | ) | (463 | ) | N/A | N/A | ||||||||||
Total Distributions | (6,812 | ) | (10,501 | ) | (3,186 | ) | (2,258 | ) | ||||||||
Capital Share Transactions:(1) | ||||||||||||||||
Class F | ||||||||||||||||
Proceeds from shares issued | 17,233 | 14,494 | 4,565 | 4,307 | ||||||||||||
Reinvestment of dividends & distributions | 5,623 | 8,940 | 2,994 | 2,152 | ||||||||||||
Cost of shares redeemed | (35,561 | ) | (48,726 | ) | (7,376 | ) | (11,401 | ) | ||||||||
Increase (Decrease) in Net Assets Derived from Class F Transactions | (12,705 | ) | (25,292 | ) | 183 | (4,942 | ) | |||||||||
Class D | ||||||||||||||||
Proceeds from shares issued | 1,953 | 1,915 | N/A | N/A | ||||||||||||
Reinvestment of dividends & distributions | 637 | 769 | N/A | N/A | ||||||||||||
Cost of shares redeemed | (1,417 | ) | (1,352 | ) | N/A | N/A | ||||||||||
Increase (Decrease) in Net Assets Derived from Class D Transactions | 1,173 | 1,332 | N/A | N/A | ||||||||||||
Class I | ||||||||||||||||
Proceeds from shares issued | 1,126 | 1,170 | N/A | N/A | ||||||||||||
Reinvestment of dividends & distributions | 346 | 462 | N/A | N/A | ||||||||||||
Cost of shares redeemed | (960 | ) | (2,207 | ) | N/A | N/A | ||||||||||
Increase (Decrease) in Net Assets Derived from Class I Transactions | 512 | (575 | ) | N/A | N/A | |||||||||||
Increase (Decrease) in Net Assets Derived From Capital Share Transactions | (11,020 | ) | (24,535 | ) | 183 | (4,942 | ) | |||||||||
Net Increase (Decrease) in Net Assets | 40,457 | (51,896 | ) | 28,046 | (17,457 | ) | ||||||||||
Net Assets: | ||||||||||||||||
Beginning of Year | 142,979 | 194,875 | 58,907 | 76,364 | ||||||||||||
End of Year | $ | 183,436 | $ | 142,979 | $ | 86,953 | $ | 58,907 | ||||||||
| (1) | For Capital Share Transactions see footnote 4 in the notes to financial statements. |
Amounts designated as “—” are $0 or have been rounded to $0.
N/A — Not applicable. Class D and Class I shares currently not offered.
The accompanying notes are an integral part of the financial statements.
| 54 | SEI Asset Allocation Trust / Annual Report / March 31, 2021 |
| Core Market Strategy Fund | Core Market Strategy Allocation Fund | Market Growth Strategy Fund | Market Growth Strategy Allocation Fund | |||||||||||||||||||||||||||
| 4/01/20 - 3/31/21 | 4/01/19 - 3/31/20 | 4/01/20 - 3/31/21 | 4/01/19 - 3/31/20 | 4/01/20 - 3/31/21 | 4/01/19 - 3/31/20 | 4/01/20 - 3/31/21 | 4/01/19 - 3/31/20 | |||||||||||||||||||||||
| $ | 1,090 | $ | 1,750 | $ | 303 | $ | 409 | $ | 2,467 | $ | 3,898 | $ | 1,507 | $ | 1,992 | |||||||||||||||
| 1,007 | (778 | ) | 1,107 | 236 | 1,398 | (3,603 | ) | 3,330 | (497 | ) | ||||||||||||||||||||
| 1,919 | 2,569 | 235 | 1,166 | 4,240 | 6,825 | 1,188 | 5,742 | |||||||||||||||||||||||
| 13,939 | (7,479 | ) | 8,808 | (5,038 | ) | 44,139 | (20,231 | ) | 46,399 | (23,390 | ) | |||||||||||||||||||
| 17,955 | (3,938 | ) | 10,453 | (3,227 | ) | 52,244 | (13,111 | ) | 52,424 | (16,153 | ) | |||||||||||||||||||
| (3,499 | ) | (4,552 | ) | (1,468 | ) | (1,320 | ) | (7,301 | ) | (8,960 | ) | (6,671 | ) | (4,841 | ) | |||||||||||||||
| N/A | N/A | N/A | N/A | (166 | ) | (197 | ) | N/A | N/A | |||||||||||||||||||||
| — | — | N/A | N/A | (164 | ) | (176 | ) | N/A | N/A | |||||||||||||||||||||
| (3,499 | ) | (4,552 | ) | (1,468 | ) | (1,320 | ) | (7,631 | ) | (9,333 | ) | (6,671 | ) | (4,841 | ) | |||||||||||||||
| 5,228 | 9,271 | 930 | 1,029 | 14,177 | 11,556 | 3,393 | 4,369 | |||||||||||||||||||||||
| 3,413 | 4,402 | 1,298 | 1,191 | 7,109 | 8,667 | 6,208 | 4,518 | |||||||||||||||||||||||
| (17,082 | ) | (26,968 | ) | (5,835 | ) | (4,861 | ) | (40,246 | ) | (58,918 | ) | (20,320 | ) | (20,863 | ) | |||||||||||||||
| (8,441 | ) | (13,295 | ) | (3,607 | ) | (2,641 | ) | (18,960 | ) | (38,695 | ) | (10,719 | ) | (11,976 | ) | |||||||||||||||
| N/A | N/A | N/A | N/A | 616 | 782 | N/A | N/A | |||||||||||||||||||||||
| N/A | N/A | N/A | N/A | 164 | 194 | N/A | N/A | |||||||||||||||||||||||
| N/A | N/A | N/A | N/A | (1,408 | ) | (790 | ) | N/A | N/A | |||||||||||||||||||||
| N/A | N/A | N/A | N/A | (628 | ) | 186 | N/A | N/A | ||||||||||||||||||||||
| 2 | — | N/A | N/A | 295 | 340 | N/A | N/A | |||||||||||||||||||||||
| — | — | N/A | N/A | 164 | 177 | N/A | N/A | |||||||||||||||||||||||
| — | — | N/A | N/A | (328 | ) | (3,400 | ) | N/A | N/A | |||||||||||||||||||||
| 2 | — | N/A | N/A | 131 | (2,883 | ) | N/A | N/A | ||||||||||||||||||||||
| (8,439 | ) | (13,295 | ) | (3,607 | ) | (2,641 | ) | (19,457 | ) | (41,392 | ) | (10,719 | ) | (11,976 | ) | |||||||||||||||
| 6,017 | (21,785 | ) | 5,378 | (7,188 | ) | 25,156 | (63,836 | ) | 35,034 | (32,970 | ) | |||||||||||||||||||
| 72,975 | 94,760 | 20,498 | 27,686 | 169,477 | 233,313 | 100,226 | 133,196 | |||||||||||||||||||||||
| $ | 78,992 | $ | 72,975 | $ | 25,876 | $ | 20,498 | $ | 194,633 | $ | 169,477 | $ | 135,260 | $ | 100,226 | |||||||||||||||
| SEI Asset Allocation Trust / Annual Report / March 31, 2021 | 55 |
For the years ended March 31,
For a Share Outstanding Throughout Each Year
| Net Asset Value, Beginning of Year | Net Investment Income* | Net Realized and Unrealized Gains (Losses) from Affiliated Funds* | Total from | Dividends from Net Investment Income | Distributions from Realized Capital Gains | Total Dividends and Distributions | Net Asset of Year | Total Return† | Net Assets Thousands) | Ratio of Expenses to Average Net Assets** | Ratio of Expenses to Average Net Assets (Excluding Waivers)** | Ratio of Net to Average | Portfolio Turnover Rate† | |||||||||||||||||||||||||||||||||||||||||||
Defensive Strategy Fund |
| |||||||||||||||||||||||||||||||||||||||||||||||||||||||
Class F |
| |||||||||||||||||||||||||||||||||||||||||||||||||||||||
2021 | $ | 9.72 | $ | 0.07 | $ | 0.51 | $ | 0.58 | $ | (0.19 | ) | $ — | $ | (0.19 | ) | $ | 10.11 | 5.99 | % | $ | 17,330 | 0.21 | % | 0.58 | % | 0.68 | % | 143 | % | |||||||||||||||||||||||||||
2020 | 9.88 | 0.19 | (0.11) | 0.08 | (0.24 | ) | — | (0.24 | ) | 9.72 | 0.77 | 16,031 | 0.21 | 0.59 | 1.92 | 17 | ||||||||||||||||||||||||||||||||||||||||
2019 | 9.79 | 0.17 | 0.09 | 0.26 | (0.17 | ) | — | (0.17 | ) | 9.88 | 2.75 | 19,624 | 0.21 | 0.57 | 1.77 | 24 | ||||||||||||||||||||||||||||||||||||||||
2018 | 9.83 | 0.16 | (0.02) | 0.14 | (0.18 | ) | — | (0.18 | ) | 9.79 | 1.45 | 28,203 | 0.21 | 0.57 | 1.58 | 19 | ||||||||||||||||||||||||||||||||||||||||
2017 | 9.71 | 0.10 | 0.14 | 0.24 | (0.12 | ) | — | (0.12 | ) | 9.83 | 2.44 | 32,489 | 0.23 | (1) | 0.64 | 1.05 | 69 | |||||||||||||||||||||||||||||||||||||||
Class I | ||||||||||||||||||||||||||||||||||||||||||||||||||||||||
2021 | $ | 9.54 | $ | 0.04 | $ | 0.52 | $ | 0.56 | $ | (0.17 | ) | $ — | $ | (0.17 | ) | $ | 9.93 | 5.84 | % | $ | 370 | 0.46 | % | 0.83 | % | 0.43 | % | 143 | % | |||||||||||||||||||||||||||
2020 | 9.70 | 0.16 | (0.10) | 0.06 | (0.22 | ) | — | (0.22 | ) | 9.54 | 0.53 | 429 | 0.46 | 0.84 | 1.67 | 17 | ||||||||||||||||||||||||||||||||||||||||
2019 | 9.62 | 0.16 | 0.07 | 0.23 | (0.15 | ) | — | (0.15 | ) | 9.70 | 2.44 | 328 | 0.46 | 0.82 | 1.67 | 24 | ||||||||||||||||||||||||||||||||||||||||
2018 | 9.66 | 0.13 | (0.02) | 0.11 | (0.15 | ) | — | (0.15 | ) | 9.62 | 1.18 | 472 | 0.46 | 0.82 | 1.29 | 19 | ||||||||||||||||||||||||||||||||||||||||
2017 | 9.55 | 0.06 | 0.14 | 0.20 | (0.09 | ) | — | (0.09 | ) | 9.66 | 2.09 | 979 | 0.48 | (1) | 0.90 | 0.61 | 69 | |||||||||||||||||||||||||||||||||||||||
Defensive Strategy Allocation Fund |
| |||||||||||||||||||||||||||||||||||||||||||||||||||||||
Class F | ||||||||||||||||||||||||||||||||||||||||||||||||||||||||
2021 | $ | 11.36 | $ | 0.10 | $ | 0.45 | $ | 0.55 | $ | (0.20 | ) | $ —^ | $ | (0.20 | ) | $ | 11.71 | 4.88 | % | $ | 6,236 | 0.35 | % | 0.61 | % | 0.86 | % | 27 | % | |||||||||||||||||||||||||||
2020 | 14.25 | 0.44 | (2.56) | (2.12) | (0.53 | ) | (0.24) | (0.77 | ) | 11.36 | (16.02 | ) | 7,572 | 0.35 | 0.58 | 3.07 | 49 | |||||||||||||||||||||||||||||||||||||||
2019 | 14.13 | 0.43 | 0.79 | 1.22 | (0.59 | ) | (0.51) | (1.10 | ) | 14.25 | 9.22 | 8,168 | 0.35 | 0.57 | 3.05 | 44 | ||||||||||||||||||||||||||||||||||||||||
2018 | 14.54 | 0.43 | 0.16 | 0.59 | (0.62 | ) | (0.38) | (1.00 | ) | 14.13 | 4.02 | 10,125 | 0.35 | 0.57 | 2.95 | 31 | ||||||||||||||||||||||||||||||||||||||||
2017 | 14.31 | 0.46 | 1.21 | 1.67 | (0.60 | ) | (0.84) | (1.44 | ) | 14.54 | 12.15 | 8,341 | 0.37 | (2) | 0.63 | 3.17 | 30 | |||||||||||||||||||||||||||||||||||||||
Conservative Strategy Fund |
| |||||||||||||||||||||||||||||||||||||||||||||||||||||||
Class F | ||||||||||||||||||||||||||||||||||||||||||||||||||||||||
2021 | $ | 10.15 | $ | 0.12 | $ | 0.96 | $ | 1.08 | $ | (0.19 | ) | $(0.05) | $ | (0.24 | ) | $ | 10.99 | 10.71 | % | $ | 64,670 | 0.26 | % | 0.60 | % | 1.07 | % | 20 | % | |||||||||||||||||||||||||||
2020 | 10.66 | 0.23 | (0.39) | (0.16) | (0.30 | ) | (0.05) | (0.35 | ) | 10.15 | (1.68 | ) | 62,724 | 0.26 | 0.59 | 2.12 | 18 | |||||||||||||||||||||||||||||||||||||||
2019 | 10.56 | 0.21 | 0.10 | 0.31 | (0.21 | ) | — | (0.21 | ) | 10.66 | 3.04 | 74,320 | 0.26 | 0.57 | 2.00 | 13 | ||||||||||||||||||||||||||||||||||||||||
2018 | 10.49 | 0.19 | 0.11 | 0.30 | (0.23 | ) | — | (0.23 | ) | 10.56 | 2.85 | 80,886 | 0.26 | 0.57 | 1.78 | 17 | ||||||||||||||||||||||||||||||||||||||||
2017 | 10.26 | 0.16 | 0.27 | 0.43 | (0.20 | ) | — | (0.20 | ) | 10.49 | 4.22 | 86,219 | 0.28 | (3) | 0.63 | 1.52 | 55 | |||||||||||||||||||||||||||||||||||||||
Class D | ||||||||||||||||||||||||||||||||||||||||||||||||||||||||
2021 | $ | 10.13 | $ | 0.04 | $ | 0.96 | $ | 1.00 | $ | (0.11 | ) | $(0.05) | $ | (0.16 | ) | $ | 10.97 | 9.91 | % | $ | 4,507 | 1.01 | % | 1.35 | % | 0.34 | % | 20 | % | |||||||||||||||||||||||||||
2020 | 10.64 | 0.15 | (0.39) | (0.24) | (0.22 | ) | (0.05) | (0.27 | ) | 10.13 | (2.43 | ) | 3,580 | 1.01 | 1.34 | 1.39 | 18 | |||||||||||||||||||||||||||||||||||||||
2019 | 10.54 | 0.13 | 0.11 | 0.24 | (0.14 | ) | — | (0.14 | ) | 10.64 | 2.28 | 3,700 | 1.01 | 1.32 | 1.28 | 13 | ||||||||||||||||||||||||||||||||||||||||
2018 | 10.48 | 0.11 | 0.10 | 0.21 | (0.15 | ) | — | (0.15 | ) | 10.54 | 1.97 | 3,506 | 1.01 | 1.32 | 1.02 | 17 | ||||||||||||||||||||||||||||||||||||||||
2017 | 10.24 | 0.08 | 0.28 | 0.36 | (0.12 | ) | — | (0.12 | ) | 10.48 | 3.55 | 3,609 | 1.02 | (3) | 1.38 | 0.79 | 55 | |||||||||||||||||||||||||||||||||||||||
Class I | ||||||||||||||||||||||||||||||||||||||||||||||||||||||||
2021 | $ | 10.34 | $ | 0.06 | $ | 1.00 | $ | 1.06 | $ | (0.15 | ) | $(0.05) | $ | (0.20 | ) | $ | 11.20 | 10.35 | % | $ | 342 | 0.51 | % | 0.85 | % | 0.58 | % | 20 | % | |||||||||||||||||||||||||||
2020 | 10.85 | 0.20 | (0.38) | (0.18) | (0.28 | ) | (0.05) | (0.33 | ) | 10.34 | (1.89 | ) | 802 | 0.51 | 0.84 | 1.86 | 18 | |||||||||||||||||||||||||||||||||||||||
2019 | 10.74 | 0.19 | 0.11 | 0.30 | (0.19 | ) | — | (0.19 | ) | 10.85 | 2.83 | 982 | 0.51 | 0.82 | 1.75 | 13 | ||||||||||||||||||||||||||||||||||||||||
2018 | 10.67 | 0.11 | 0.16 | 0.27 | (0.20 | ) | — | (0.20 | ) | 10.74 | 2.49 | 1,023 | 0.51 | 0.82 | 1.03 | 17 | ||||||||||||||||||||||||||||||||||||||||
2017 | 10.42 | 0.13 | 0.29 | 0.42 | (0.17 | ) | — | (0.17 | ) | 10.67 | 4.09 | 4,030 | 0.53 | (3) | 0.88 | 1.23 | 55 | |||||||||||||||||||||||||||||||||||||||
| * | Per share calculations were performed using average shares. |
| ** | The expense ratios do not include expenses of the underlying affiliated investment companies. |
| † | Returns and portfolio turnover rate are for the period indicated and have not been annualized. Returns shown do not reflect the deduction of taxes that a shareholder would pay on Fund distributions or the redemption of Fund shares. |
| ^ | Includes return of capital less than $0.005. |
| (1) | The expense ratio includes Trustee and Proxy fees that are not subject to any voluntary expense waiver or reimbursement agreement. Had the fees been excluded the ratios would have been 0.21%, and 0.46% for classes F, and I, respectively. |
| (2) | The expense ratio includes Trustee and Proxy fees that are not subject to any voluntary expense waiver or reimbursement agreement. Had the fees been excluded the ratio would have been 0.35% for class F. |
| (3) | The expense ratio includes Trustee and Proxy fees that are not subject to any voluntary expense waiver or reimbursement agreement. Had the fees been excluded the ratios would have been 0.26%, 1.01%, and 0.51% for classes F, D, and I, respectively. |
Amounts designated as “—” are $0 or have been rounded to $0.
| 56 | SEI Asset Allocation Trust / Annual Report / March 31, 2021 |
FINANCIAL HIGHLIGHTS
For the years ended March 31,
For a Share Outstanding Throughout Each Year
| Net Asset Value, Beginning of Year | Net Investment Income* | Net Realized and Unrealized Gains (Losses) from Affiliated Funds* | Total from | Dividends from Net Investment Income | Distributions from Realized Capital Gains | Total Dividends and Distributions | Net Asset of Year | Total Return† | Net Assets Thousands) | Ratio of Expenses to Average Net Assets** | Ratio of Expenses to Average Net Assets (Excluding Waivers)** | Ratio of Net to Average | Portfolio Turnover Rate† | |||||||||||||||||||||||||||||||||||||||||
Conservative Strategy Allocation Fund |
| |||||||||||||||||||||||||||||||||||||||||||||||||||||
Class F | ||||||||||||||||||||||||||||||||||||||||||||||||||||||
2021 | $ | 10.46 | $ | 0.30 | $ | 2.42 | $ | 2.72 | $ | (0.40 | ) | $ — | $ | (0.40 | ) | $ | 12.78 | 26.55 | % | $ | 29,156 | 0.35 | % | 0.60 | % | 2.57 | % | 23 | % | |||||||||||||||||||||||||
2020 | 13.21 | 0.38 | (1.94) | (1.56) | (0.45 | ) | (0.74) | (1.19 | ) | 10.46 | (13.46 | ) | 31,302 | 0.35 | 0.59 | 2.86 | 22 | |||||||||||||||||||||||||||||||||||||
2019 | 13.18 | 0.37 | 0.83 | 1.20 | (0.48 | ) | (0.69) | (1.17 | ) | 13.21 | 9.78 | 39,828 | 0.35 | 0.57 | 2.75 | 15 | ||||||||||||||||||||||||||||||||||||||
2018 | 13.59 | 0.38 | 0.17 | 0.55 | (0.54 | ) | (0.42) | (0.96 | ) | 13.18 | 3.98 | 39,443 | 0.35 | 0.57 | 2.79 | 16 | ||||||||||||||||||||||||||||||||||||||
2017 | 13.86 | 0.40 | 1.13 | 1.53 | (0.52 | ) | (1.28) | (1.80 | ) | 13.59 | 11.57 | 44,284 | 0.37 | (1) | 0.63 | 2.84 | 23 | |||||||||||||||||||||||||||||||||||||
Moderate Strategy Fund |
| |||||||||||||||||||||||||||||||||||||||||||||||||||||
Class F | ||||||||||||||||||||||||||||||||||||||||||||||||||||||
2021 | $ | 11.37 | $ | 0.13 | $ | 1.71 | $ | 1.84 | $ | (0.22 | ) | $(0.12) | $ | (0.34 | ) | $ | 12.87 | 16.32 | % | $ | 142,002 | 0.31 | % | 0.60 | % | 1.08 | % | 33 | % | |||||||||||||||||||||||||
2020 | 12.17 | 0.26 | (0.64) | (0.38) | (0.42 | ) | — | (0.42 | ) | 11.37 | (3.45 | ) | 141,208 | 0.31 | 0.59 | 2.06 | 27 | |||||||||||||||||||||||||||||||||||||
2019 | 12.01 | 0.26 | 0.17 | 0.43 | (0.27 | ) | — | (0.27 | ) | 12.17 | 3.72 | 168,079 | 0.31 | 0.57 | 2.17 | 12 | ||||||||||||||||||||||||||||||||||||||
2018 | 11.75 | 0.18 | 0.33 | 0.51 | (0.25 | ) | — | (0.25 | ) | 12.01 | 4.38 | 194,123 | 0.31 | 0.57 | 1.53 | 16 | ||||||||||||||||||||||||||||||||||||||
2017 | 11.30 | 0.20 | 0.55 | 0.75 | (0.30 | ) | — | (0.30 | ) | 11.75 | 6.68 | 212,074 | 0.33 | (2) | 0.63 | 1.70 | 30 | |||||||||||||||||||||||||||||||||||||
Class D | ||||||||||||||||||||||||||||||||||||||||||||||||||||||
2021 | $ | 11.34 | $ | 0.05 | $ | 1.69 | $ | 1.74 | $ | (0.13 | ) | $(0.12) | $ | (0.25 | ) | $ | 12.83 | 15.40 | % | $ | 3,908 | 1.06 | % | 1.35 | % | 0.38 | % | 33 | % | |||||||||||||||||||||||||
2020 | 12.13 | 0.17 | (0.64) | (0.47) | (0.32 | ) | — | (0.32 | ) | 11.34 | (4.10 | ) | 3,419 | 1.06 | 1.34 | 1.37 | 27 | |||||||||||||||||||||||||||||||||||||
2019 | 11.98 | 0.17 | 0.16 | 0.33 | (0.18 | ) | — | (0.18 | ) | 12.13 | 2.87 | 3,574 | 1.06 | 1.32 | 1.45 | 12 | ||||||||||||||||||||||||||||||||||||||
2018 | 11.71 | 0.09 | 0.34 | 0.43 | (0.16 | ) | — | (0.16 | ) | 11.98 | 3.68 | 3,461 | 1.06 | 1.32 | 0.76 | 16 | ||||||||||||||||||||||||||||||||||||||
2017 | 11.27 | 0.11 | 0.54 | 0.65 | (0.21 | ) | — | (0.21 | ) | 11.71 | 5.82 | 3,646 | 1.07 | (2) | 1.37 | 0.95 | 30 | |||||||||||||||||||||||||||||||||||||
Class I | ||||||||||||||||||||||||||||||||||||||||||||||||||||||
2021 | $ | 11.70 | $ | 0.11 | $ | 1.74 | $ | 1.85 | $ | (0.19 | ) | $(0.12) | $ | (0.31 | ) | $ | 13.24 | 15.91 | % | $ | 2,409 | 0.56 | % | 0.85 | % | 0.87 | % | 33 | % | |||||||||||||||||||||||||
2020 | 12.50 | 0.23 | (0.64) | (0.41) | (0.39 | ) | — | (0.39 | ) | 11.70 | (3.60 | ) | 2,131 | 0.56 | 0.84 | 1.82 | 27 | |||||||||||||||||||||||||||||||||||||
2019 | 12.34 | 0.24 | 0.16 | 0.40 | (0.24 | ) | — | (0.24 | ) | 12.50 | 3.35 | 2,302 | 0.56 | 0.82 | 1.97 | 12 | ||||||||||||||||||||||||||||||||||||||
2018 | 12.05 | 0.16 | 0.35 | 0.51 | (0.22 | ) | — | (0.22 | ) | 12.34 | 4.25 | 3,598 | 0.56 | 0.82 | 1.28 | 16 | ||||||||||||||||||||||||||||||||||||||
2017 | 11.59 | 0.14 | 0.58 | 0.72 | (0.26 | ) | — | (0.26 | ) | 12.05 | 6.32 | 4,284 | 0.58 | (2) | 0.88 | 1.20 | 30 | |||||||||||||||||||||||||||||||||||||
Moderate Strategy Allocation Fund |
| |||||||||||||||||||||||||||||||||||||||||||||||||||||
Class F | ||||||||||||||||||||||||||||||||||||||||||||||||||||||
2021 | $ | 15.94 | $ | 0.35 | $ | 4.67 | $ | 5.02 | $ | (0.43 | ) | $(0.82) | $ | (1.25 | ) | $ | 19.71 | 32.25 | % | $ | 68,502 | 0.35 | % | 0.60 | % | 1.92 | % | 17 | % | |||||||||||||||||||||||||
2020 | 20.00 | 0.46 | (2.85) | (2.39) | (0.51 | ) | (1.16) | (1.67 | ) | 15.94 | (13.64 | ) | 60,497 | 0.35 | 0.59 | 2.25 | 11 | |||||||||||||||||||||||||||||||||||||
2019 | 20.35 | 0.42 | 0.95 | 1.37 | (0.56 | ) | (1.16) | (1.72 | ) | 20.00 | 7.32 | 85,313 | 0.35 | 0.57 | 2.08 | 15 | ||||||||||||||||||||||||||||||||||||||
2018 | 19.87 | 0.41 | 1.15 | 1.56 | (0.59 | ) | (0.49) | (1.08 | ) | 20.35 | 7.87 | 92,109 | 0.35 | 0.57 | 1.98 | 14 | ||||||||||||||||||||||||||||||||||||||
2017 | 19.16 | 0.40 | 1.88 | 2.28 | (0.48 | ) | (1.09) | (1.57 | ) | 19.87 | 12.35 | 93,996 | 0.37 | (1) | 0.63 | 2.03 | 16 | |||||||||||||||||||||||||||||||||||||
| * | Per share calculations were performed using average shares. |
| ** | The expense ratios do not include expenses of the underlying affiliated investment companies. |
| † | Returns and portfolio turnover rate are for the period indicated and have not been annualized. Returns shown do not reflect the deduction of taxes that a shareholder would pay on Fund distributions or the redemption of Fund shares. |
| (1) | The expense ratio includes Trustee and Proxy fees that are not subject to any voluntary expense waiver or reimbursement agreement. Had the fees been excluded the ratio would have been 0.35% for class F. |
| (2) | The expense ratio includes Trustee and Proxy fees that are not subject to any voluntary expense waiver or reimbursement agreement. Had the fees been excluded the ratios would have been 0.31%, 1.06%, and 0.56% for classes F, D, and I, respectively. |
Amounts designated as “—” are $0 or have been rounded to $0.
| SEI Asset Allocation Trust / Annual Report / March 31, 2021 | 57 |
FINANCIAL HIGHLIGHTS
For the years ended March 31,
For a Share Outstanding Throughout Each Year
| Net Asset Value, Beginning of Year | Net Investment Income* | Net Realized and Unrealized Gains (Losses) from Affiliated Funds* | Total from | Dividends from Net Investment Income | Distributions from Realized Capital Gains | Total Dividends and Distributions | Net Asset of Year | Total Return† | Net Assets Thousands) | Ratio of Expenses to Average Net Assets** | Ratio of Expenses to Average Net Assets (Excluding Waivers)** | Ratio of Net to Average | Portfolio Turnover Rate† | |||||||||||||||||||||||||||||||||||||||||||
Aggressive Strategy Fund |
| |||||||||||||||||||||||||||||||||||||||||||||||||||||||
Class F |
| |||||||||||||||||||||||||||||||||||||||||||||||||||||||
2021 | $ | 12.41 | $ | 0.19 | $ | 5.16 | $ | 5.35 | $ | (0.28 | ) | $ | (0.39 | ) | $ | (0.67 | ) | $ | 17.09 | 43.43 | % | $ | 154,482 | 0.35 | % | 0.60 | % | 1.25 | % | 19 | % | |||||||||||||||||||||||||
2020 | 14.76 | 0.25 | (1.73) | (1.48) | (0.44 | ) | (0.43) | (0.87 | ) | 12.41 | (11.14 | ) | 123,231 | 0.35 | 0.59 | 1.63 | 21 | |||||||||||||||||||||||||||||||||||||||
2019 | 15.08 | 0.26 | (0.23) | 0.03 | (0.35 | ) | — | (0.35 | ) | 14.76 | 0.42 | 172,138 | 0.35 | 0.57 | 1.73 | 12 | ||||||||||||||||||||||||||||||||||||||||
2018 | 13.71 | 0.17 | 1.45 | 1.62 | (0.25 | ) | — | (0.25 | ) | 15.08 | 11.86 | 203,817 | 0.35 | 0.57 | 1.18 | 7 | ||||||||||||||||||||||||||||||||||||||||
2017 | 12.42 | 0.16 | 1.41 | 1.57 | (0.28 | ) | — | (0.28 | ) | 13.71 | 12.75 | 213,248 | 0.37 | (1) | 0.63 | 1.21 | 19 | |||||||||||||||||||||||||||||||||||||||
Class D | ||||||||||||||||||||||||||||||||||||||||||||||||||||||||
2021 | $ | 12.25 | $ | 0.09 | $ | 5.07 | $ | 5.16 | $ | (0.19 | ) | $(0.39) | $ | (0.58 | ) | $ | 16.83 | 42.37 | % | $ | 19,093 | 1.10 | % | 1.35 | % | 0.57 | % | 19 | % | |||||||||||||||||||||||||||
2020 | 14.59 | 0.15 | (1.72) | (1.57) | (0.34 | ) | (0.43) | (0.77 | ) | 12.25 | (11.79 | ) | 12,914 | 1.10 | 1.34 | 0.97 | 21 | |||||||||||||||||||||||||||||||||||||||
2019 | 14.93 | 0.15 | (0.23) | (0.08) | (0.26) | — | (0.26) | 14.59 | (0.36 | ) | 14,087 | 1.10 | 1.32 | 1.04 | 12 | |||||||||||||||||||||||||||||||||||||||||
2018 | 13.60 | 0.05 | 1.46 | 1.51 | (0.18 | ) | — | (0.18 | ) | 14.93 | 11.06 | 14,419 | 1.10 | 1.32 | 0.34 | 7 | ||||||||||||||||||||||||||||||||||||||||
2017 | 12.35 | 0.07 | 1.39 | 1.46 | (0.21 | ) | — | (0.21 | ) | 13.60 | 11.91 | 16,610 | 1.11 | (1) | 1.38 | 0.52 | 19 | |||||||||||||||||||||||||||||||||||||||
Class I | ||||||||||||||||||||||||||||||||||||||||||||||||||||||||
2021 | $ | 12.05 | $ | 0.15 | $ | 5.01 | $ | 5.16 | $ | (0.24 | ) | $(0.39) | $ | (0.63 | ) | $ | 16.58 | 43.13 | % | $ | 9,861 | 0.60 | % | 0.85 | % | 1.04 | % | 19 | % | |||||||||||||||||||||||||||
2020 | 14.36 | 0.21 | (1.69) | (1.48) | (0.40 | ) | (0.43) | (0.83 | ) | 12.05 | (11.40 | ) | 6,834 | 0.60 | 0.84 | 1.40 | 21 | |||||||||||||||||||||||||||||||||||||||
2019 | 14.68 | 0.24 | (0.24) | — | (0.32 | ) | — | (0.32 | ) | 14.36 | 0.18 | 8,650 | 0.60 | 0.82 | 1.65 | 12 | ||||||||||||||||||||||||||||||||||||||||
2018 | 13.35 | 0.11 | 1.44 | 1.55 | (0.22 | ) | — | (0.22 | ) | 14.68 | 11.60 | 11,405 | 0.60 | 0.82 | 0.77 | 7 | ||||||||||||||||||||||||||||||||||||||||
2017 | 12.11 | 0.11 | 1.38 | 1.49 | (0.25 | ) | — | (0.25 | ) | 13.35 | 12.38 | 21,720 | 0.62 | (1) | 0.88 | 0.84 | 19 | |||||||||||||||||||||||||||||||||||||||
Tax-Managed Aggressive Strategy Fund |
| |||||||||||||||||||||||||||||||||||||||||||||||||||||||
Class F |
| |||||||||||||||||||||||||||||||||||||||||||||||||||||||
2021 | $ | 17.53 | $ | 0.27 | $ | 9.21 | $ | 9.48 | $ | (0.31 | ) | $(0.67) | $ | (0.98 | ) | $ | 26.03 | 54.85 | % | $ | 86,953 | 0.35 | % | 0.60 | % | 1.22 | % | 8 | % | |||||||||||||||||||||||||||
2020 | 20.91 | 0.32 | (3.08) | (2.76) | (0.33 | ) | (0.29) | (0.62 | ) | 17.53 | (13.77 | ) | 58,907 | 0.35 | 0.59 | 1.51 | 12 | |||||||||||||||||||||||||||||||||||||||
2019 | 21.61 | 0.27 | 0.02 | 0.29 | (0.29 | ) | (0.70) | (0.99 | ) | 20.91 | 1.68 | 76,364 | 0.35 | 0.57 | 1.25 | 8 | ||||||||||||||||||||||||||||||||||||||||
2018 | 19.20 | 0.24 | 2.44 | 2.68 | (0.27 | ) | — | (0.27 | ) | 21.61 | 14.00 | 75,709 | 0.35 | 0.57 | 1.16 | 7 | ||||||||||||||||||||||||||||||||||||||||
2017 | 16.99 | 0.21 | 2.24 | 2.45 | (0.24 | ) | — | (0.24 | ) | 19.20 | 14.51 | 64,802 | 0.37 | (2) | 0.63 | 1.17 | 11 | |||||||||||||||||||||||||||||||||||||||
Core Market Strategy Fund |
| |||||||||||||||||||||||||||||||||||||||||||||||||||||||
Class F |
| |||||||||||||||||||||||||||||||||||||||||||||||||||||||
2021 | $ | 10.33 | $ | 0.17 | $ | 2.56 | $ | 2.73 | $ | (0.30 | ) | $(0.24) | $ | (0.54 | ) | $ | 12.52 | 26.72 | % | $ | 78,990 | 0.35 | % | 0.60 | % | 1.40 | % | 16 | % | |||||||||||||||||||||||||||
2020 | 11.52 | 0.23 | (0.80) | (0.57) | (0.41 | ) | (0.21) | (0.62 | ) | 10.33 | (5.56 | ) | 72,975 | 0.35 | 0.59 | 1.95 | 27 | |||||||||||||||||||||||||||||||||||||||
2019 | 11.76 | 0.26 | (0.05) | 0.21 | (0.29 | ) | (0.16) | (0.45 | ) | 11.52 | 2.08 | 94,760 | 0.35 | 0.57 | 2.22 | 14 | ||||||||||||||||||||||||||||||||||||||||
2018 | 11.19 | 0.17 | 0.63 | 0.80 | (0.23 | ) | — | (0.23 | ) | 11.76 | 7.17 | 105,341 | 0.35 | 0.57 | 1.42 | 11 | ||||||||||||||||||||||||||||||||||||||||
2017 | 10.90 | 0.17 | 0.75 | 0.92 | (0.30 | ) | (0.33) | (0.63 | ) | 11.19 | 8.65 | 106,398 | 0.37 | (3) | 0.63 | 1.48 | 23 | |||||||||||||||||||||||||||||||||||||||
Class I | ||||||||||||||||||||||||||||||||||||||||||||||||||||||||
2021 | $ | 11.45 | $ | 0.10 | $ | 3.01 | $ | 3.11 | $ | (0.29 | ) | $(0.24) | $ | (0.53 | ) | $ | 14.03 | 27.44 | % | $ | 2 | 0.33 | %‡ | 0.38 | %‡ | 0.70 | % | 16 | % | |||||||||||||||||||||||||||
2020 | 12.63 | 0.35 | (0.92) | (0.57) | (0.40 | ) | (0.21) | (0.61 | ) | 11.45 | (5.04 | ) | — | —^^ | —^^ | 2.68 | 27 | |||||||||||||||||||||||||||||||||||||||
2019 | 12.78 | 0.31 | (0.05) | 0.26 | (0.25 | ) | (0.16) | (0.41 | ) | 12.63 | 2.30 | — | —^ | —^ | 2.44 | 14 | ||||||||||||||||||||||||||||||||||||||||
2018 | 12.13 | 0.19 | 0.66 | 0.85 | (0.20 | ) | — | (0.20 | ) | 12.78 | 7.00 | 1 | 0.60 | 0.82 | 1.49 | 11 | ||||||||||||||||||||||||||||||||||||||||
2017 | 11.77 | 0.25 | 0.71 | 0.96 | (0.27 | ) | (0.33) | (0.60 | ) | 12.13 | 8.37 | 103 | 0.60 | (3) | 0.86 | 2.05 | 23 | |||||||||||||||||||||||||||||||||||||||
| * | Per share calculations were performed using average shares. |
| ** | The expense ratios do not include expenses of the underlying affiliated investment companies. |
| † | Returns and portfolio turnover rate are for the period indicated and have not been annualized. Returns shown do not reflect the deduction of taxes that a shareholder would pay on Fund distributions or the redemption of Fund shares. |
| ^ | The ratio appears lower due to the relative net asset value of Class I. Prospectively, it is expected the ratio of net expenses to average net assets would approximate 0.60% (0.82% excluding waivers). |
| ^^ | The ratio appears lower due to the relative net asset value of Class I. Prospectively, it is expected the ratio of net expenses to average net assets would approximate 0.60% (0.84% excluding waivers). |
| ‡ | The ratio appears lower due to the relative net asset value of Class I. Prospectively, it is expected the ratio of net expenses to average net assets would approximate 0.60% (0.85% excluding waivers). |
| (1) | The expense ratio includes Trustee and Proxy fees that are not subject to any voluntary expense waiver or reimbursement agreement. Had the fees been excluded the ratios would have been 0.35%, 1.10%, and 0.60%, for classes F, D, and I, respectively. |
| (2) | The expense ratio includes Trustee and Proxy fees that are not subject to any voluntary expense waiver or reimbursement agreement. Had the fees been excluded the ratio would have been 0.35% for class F. |
| (3) | The expense ratio includes Trustee and Proxy fees that are not subject to any voluntary expense waiver or reimbursement agreement. Had the fees been excluded the ratio would have been 0.35% and 0.60% for class F and I, respectively. |
Amounts designated as “—” are $0 or have been rounded to $0.
| 58 | SEI Asset Allocation Trust / Annual Report / March 31, 2021 |
FINANCIAL HIGHLIGHTS
For the years ended March 31,
For a Share Outstanding Throughout Each Year
| Net Asset Value, Beginning of Year | Net Investment Income* | Net Realized and Unrealized Gains (Losses) from Affiliated Funds* | Total from | Dividends from Net Investment Income | Distributions from Realized Capital Gains | Total Dividends and Distributions | Net Asset of Year | Total Return† | Net Assets Thousands) | Ratio of Expenses to Average Net Assets** | Ratio of Expenses to Average Net Assets (Excluding Waivers)** | Ratio of Net to Average | Portfolio Turnover Rate† | |||||||||||||||||||||||||||||||||||||||||
Core Market Strategy Allocation Fund |
| |||||||||||||||||||||||||||||||||||||||||||||||||||||
Class F | ||||||||||||||||||||||||||||||||||||||||||||||||||||||
2021 | $ | 15.31 | $ | 0.24 | $ | 8.00 | $ | 8.24 | $ | (0.27 | ) | $(0.93) | $ | (1.20 | ) | $ | 22.35 | 54.79 | % | $ | 25,876 | 0.35 | % | 0.60 | % | 1.23 | % | 5 | % | |||||||||||||||||||||||||
2020 | 18.64 | 0.29 | (2.66) | (2.37) | (0.30 | ) | (0.66) | (0.96 | ) | 15.31 | (13.80 | ) | 20,498 | 0.35 | 0.59 | 1.51 | 10 | |||||||||||||||||||||||||||||||||||||
2019 | 18.99 | 0.24 | 0.03 | 0.27 | (0.26 | ) | (0.36) | (0.62 | ) | 18.64 | 1.64 | 27,686 | 0.35 | 0.57 | 1.25 | 17 | ||||||||||||||||||||||||||||||||||||||
2018 | 17.42 | 0.22 | 2.20 | 2.42 | (0.24 | ) | (0.61) | (0.85 | ) | 18.99 | 13.98 | 28,825 | 0.35 | 0.57 | 1.16 | 13 | ||||||||||||||||||||||||||||||||||||||
2017 | 15.41 | 0.19 | 2.03 | 2.22 | (0.21 | ) | — | (0.21 | ) | 17.42 | 14.55 | 26,980 | 0.37 | (1) | 0.63 | 1.18 | 15 | |||||||||||||||||||||||||||||||||||||
Market Growth Strategy Fund |
| |||||||||||||||||||||||||||||||||||||||||||||||||||||
Class F | ||||||||||||||||||||||||||||||||||||||||||||||||||||||
2021 | $ | 11.42 | $ | 0.18 | $ | 3.56 | $ | 3.74 | $ | (0.29 | ) | $(0.27) | $ | (0.56 | ) | $ | 14.60 | 33.05 | % | $ | 184,903 | 0.35 | % | 0.60 | % | 1.34 | % | 13 | % | |||||||||||||||||||||||||
2020 | 12.96 | 0.24 | (1.19) | (0.95) | (0.43 | ) | (0.16) | (0.59 | ) | 11.42 | (8.00 | ) | 161,376 | 0.35 | 0.59 | 1.83 | 20 | |||||||||||||||||||||||||||||||||||||
2019 | 13.11 | 0.26 | (0.10) | 0.16 | (0.31 | ) | — | (0.31 | ) | 12.96 | 1.42 | 221,526 | 0.35 | 0.57 | 2.01 | 12 | ||||||||||||||||||||||||||||||||||||||
2018 | 12.26 | 0.17 | 0.92 | 1.09 | (0.24 | ) | — | (0.24 | ) | 13.11 | 8.92 | 263,954 | 0.35 | 0.57 | 1.29 | 7 | ||||||||||||||||||||||||||||||||||||||
2017 | 11.40 | 0.16 | 0.98 | 1.14 | (0.28 | ) | — | (0.28 | ) | 12.26 | 10.15 | 286,089 | 0.37 | (2) | 0.63 | 1.33 | 20 | |||||||||||||||||||||||||||||||||||||
Class D | ||||||||||||||||||||||||||||||||||||||||||||||||||||||
2021 | $ | 11.36 | $ | 0.07 | $ | 3.55 | $ | 3.62 | $ | (0.20 | ) | $(0.27) | $ | (0.47 | ) | $ | 14.51 | 32.00 | % | $ | 5,307 | 1.10 | % | 1.35 | % | 0.56 | % | 13 | % | |||||||||||||||||||||||||
2020 | 12.89 | 0.15 | (1.19) | (1.04) | (0.33 | ) | (0.16) | (0.49 | ) | 11.36 | (8.65 | ) | 4,749 | 1.10 | 1.34 | 1.12 | 20 | |||||||||||||||||||||||||||||||||||||
2019 | 13.04 | 0.17 | (0.10) | 0.07 | (0.22 | ) | — | (0.22 | ) | 12.89 | 0.66 | 5,203 | 1.10 | 1.32 | 1.33 | 12 | ||||||||||||||||||||||||||||||||||||||
2018 | 12.20 | 0.06 | 0.93 | 0.99 | (0.15 | ) | — | (0.15 | ) | 13.04 | 8.13 | 5,779 | 1.10 | 1.32 | 0.49 | 7 | ||||||||||||||||||||||||||||||||||||||
2017 | 11.35 | 0.08 | 0.98 | 1.06 | (0.21 | ) | — | (0.21 | ) | 12.20 | 9.37 | 6,496 | 1.11 | (2) | 1.38 | 0.66 | 20 | |||||||||||||||||||||||||||||||||||||
Class I | ||||||||||||||||||||||||||||||||||||||||||||||||||||||
2021 | $ | 11.24 | $ | 0.15 | $ | 3.50 | $ | 3.65 | $ | (0.26 | ) | $(0.27) | $ | (0.53 | ) | $ | 14.36 | 32.71 | % | $ | 4,423 | 0.60 | % | 0.85 | % | 1.14 | % | 13 | % | |||||||||||||||||||||||||
2020 | 12.76 | 0.15 | (1.11) | (0.96) | (0.40 | ) | (0.16) | (0.56 | ) | 11.24 | (8.21 | ) | 3,352 | 0.60 | 0.84 | 1.12 | 20 | |||||||||||||||||||||||||||||||||||||
2019 | 12.91 | 0.22 | (0.09) | 0.13 | (0.28 | ) | — | (0.28 | ) | 12.76 | 1.18 | 6,584 | 0.60 | 0.82 | 1.76 | 12 | ||||||||||||||||||||||||||||||||||||||
2018 | 12.08 | 0.12 | 0.92 | 1.04 | (0.21 | ) | — | (0.21 | ) | 12.91 | 8.61 | 7,527 | 0.60 | 0.82 | 0.97 | 7 | ||||||||||||||||||||||||||||||||||||||
2017 | 11.23 | 0.11 | 0.99 | 1.10 | (0.25 | ) | — | (0.25 | ) | 12.08 | 9.94 | 8,658 | 0.62 | (2) | 0.88 | 0.98 | 20 | |||||||||||||||||||||||||||||||||||||
Market Growth Strategy Allocation Fund |
| |||||||||||||||||||||||||||||||||||||||||||||||||||||
Class F | ||||||||||||||||||||||||||||||||||||||||||||||||||||||
2021 | $ | 19.50 | $ | 0.30 | $ | 10.22 | $ | 10.52 | $ | (0.34 | ) | $(1.03) | $ | (1.37 | ) | $ | 28.65 | 54.87 | % | $ | 135,260 | 0.35 | % | 0.60 | % | 1.22 | % | 4 | % | |||||||||||||||||||||||||
2020 | 23.46 | 0.36 | (3.42) | (3.06) | (0.37 | ) | (0.53) | (0.90 | ) | 19.50 | (13.83 | ) | 100,226 | 0.35 | 0.59 | 1.51 | 10 | |||||||||||||||||||||||||||||||||||||
2019 | 23.61 | 0.29 | 0.07 | 0.36 | (0.32 | ) | (0.19) | (0.51 | ) | 23.46 | 1.66 | 133,196 | 0.35 | 0.57 | 1.23 | 9 | ||||||||||||||||||||||||||||||||||||||
2018 | 20.98 | 0.26 | 2.66 | 2.92 | (0.29 | ) | — | (0.29 | ) | 23.61 | 13.99 | 134,878 | 0.35 | 0.57 | 1.17 | 7 | ||||||||||||||||||||||||||||||||||||||
2017 | 18.56 | 0.23 | 2.45 | 2.68 | (0.26 | ) | — | (0.26 | ) | 20.98 | 14.55 | 128,414 | 0.37 | (1) | 0.63 | 1.17 | 9 | |||||||||||||||||||||||||||||||||||||
| * | Per share calculations were performed using average shares. |
| ** | The expense ratios do not include expenses of the underlying affiliated investment companies. |
| † | Returns and portfolio turnover rate are for the period indicated and have not been annualized. Returns shown do not reflect the deduction of taxes that a shareholder would pay on Fund distributions or the redemption of Fund shares. |
| (1) | The expense ratio includes Trustee and Proxy fees that are not subject to any voluntary expense waiver or reimbursement agreement. Had the fees been excluded the ratio would have been 0.35% for class F. |
| (2) | The expense ratio includes Trustee and Proxy fees that are not subject to any voluntary expense waiver or reimbursement agreement. Had the fees been excluded the ratios would have been 0.35%, 1.10% and 0.60% for classes F, D, and I, respectively. |
Amounts designated as “—” are $0 or have been rounded to $0.
The accompanying notes are an integral part of the financial statements.
| SEI Asset Allocation Trust / Annual Report / March 31, 2021 | 59 |
March 31, 2021
1. ORGANIZATION
SEI Asset Allocation Trust (the “Trust”) is organized as a Massachusetts Business Trust under a Declaration of Trust dated November 20, 1995. The Trust is registered under the Investment Company Act of 1940, as amended (“1940 Act”), as an open-end investment company with twelve funds: Defensive Strategy Fund, Defensive Strategy Allocation Fund, Conservative Strategy Fund, Conservative Strategy Allocation Fund, Moderate Strategy Fund, Moderate Strategy Allocation Fund, Aggressive Strategy Fund, Tax- Managed Aggressive Strategy Fund, Core Market Strategy Fund, Core Market Strategy Allocation Fund, Market Growth Strategy Fund and Market Growth Strategy Allocation Fund (each a “Fund,” collectively the “Funds”). Each Fund is a “fund of funds” and offers shareholders the opportunity to invest in certain underlying affiliated investment companies, which are separately managed series of the following investment companies: SEI Daily Income Trust, SEI Institutional Managed Trust, and SEI Institutional International Trust. The Declaration of Trust permits the Trust to offer separate classes of shares in each Fund, as follows: Defensive Strategy Fund, Conservative Strategy Fund, Moderate Strategy Fund, Aggressive Strategy Fund, Core Market Strategy Fund and Market Growth Strategy Fund offer Class F (formerly Class A), Class D and Class I Shares; Defensive Strategy Allocation Fund, Conservative Strategy Allocation Fund, Moderate Strategy Allocation Fund, Tax-Managed Aggressive Strategy Fund, Core Market Strategy Allocation Fund, and Market Growth Strategy Allocation Fund offer Class F Shares. The assets of each Fund are segregated, and a shareholder’s interest is limited to the Fund in which shares are held. The Trust’s prospectuses provide a description of each Fund’s investment objective and strategies.
As of March 31, 2021, the Class D shares of Defensive Strategy Fund and Core Market Strategy Fund had not yet commenced operations.
2. SIGNIFICANT ACCOUNTING POLICIES
The following are significant accounting policies, which are consistently followed in the preparation of its financial statements by the Funds. The Funds are investment companies that apply the accounting and reporting guidance issued in Topic 946 by the U.S. Financial Accounting Standards Board (“FASB”).
Use of Estimates — The preparation of financial statements, in conformity with U.S. generally accepted accounting principles (“U.S. GAAP”), requires management to make estimates and assumptions that affect the reported amount of assets and liabilities and disclosure of contingent assets at the date of
the financial statements, and the reported results of operations during the reporting period. Actual results could differ from those estimates.
Security Valuation — The assets of each Fund consist primarily of the investments in underlying affiliated investment companies, which are valued at their respective daily net asset values in accordance with Board-approved pricing procedures.
In accordance with U.S. GAAP, fair value is defined as the price that a Fund would receive upon selling an investment in an orderly transaction to an independent buyer in the principal or most advantageous market of the investment. A three tier hierarchy has been established to maximize the use of observable and minimize the use of unobservable inputs and to establish classification of fair value measurements for disclosure purposes. Inputs refer broadly to the assumptions that market participants would use in pricing an asset. Inputs may be observable or unobservable. Observable inputs are inputs that reflect the assumptions market participants would use in pricing the asset or liability based on market data obtained from sources independent of the reporting entity. Unobservable inputs are inputs that reflect the reporting entity’s own assumptions about the assumptions market participants would use in pricing the asset or liability based on the best information available in the circumstances.
The three-tier hierarchy of inputs is summarized in the three broad Levels listed below:
Level 1 — quoted prices in active markets for identical investments
Level 2 — other significant observable inputs (including quoted prices for similar investments, interest rates, prepayment speeds, credit risks, etc.)
Level 3 — significant unobservable inputs (including the Fund’s own assumptions in determining the fair value of investments)
The valuation techniques used by the Funds to measure fair value during the year ended March 31, 2021 maximized the use of observable inputs and minimized the use of unobservable inputs.
During the year ended March 31, 2021, there were no significant changes to the Trust’s fair valuation methodologies. For details of the investment classification, reference the Schedules of Investments.
Security Transactions and Related Income — Security transactions are accounted for on trade date. Dividend income received from the affiliated funds is recognized on the ex-dividend date and is recorded as income distributions in the Statement of Operations. Capital gain distributions received from the affiliated funds
| 60 | SEI Asset Allocation Trust / Annual Report / March 31, 2021 |
are recognized on ex-dividend date and are recorded on the Statement of Operations as such. Costs used in determining realized gains and losses on the sales of investment securities are on the basis of specific identification.
Expenses — Expenses that are directly related to one of the Funds are charged directly to that Fund. Other operating expenses of the Trust are allocated to the Funds on the basis of relative daily net assets.
Expenses included in the accompanying financial statements reflect the expenses of each Fund and do not include any expenses associated with the underlying funds.
Classes — Class-specific expenses are borne by that class of shares. Income, realized and unrealized gains/ losses and non-class-specific expenses are allocated to the respective classes on the basis of relative daily net assets.
Dividends and Distributions to Shareholders — Dividends and distributions to shareholders which are determined in accordance with Federal tax regulations are recorded on the ex-dividend date. Distributions from net investment income are declared and paid to shareholders periodically for each Fund. Any net realized capital gain for each Fund is distributed to shareholders at least annually.
Forward Foreign Currency Contracts — To the extent consistent with its investment objective and strategies, a Fund may enter into forward foreign currency contracts as hedges against either specific transactions, fund positions or anticipated fund positions. A Fund may also engage in currency transactions to enhance that Fund’s returns. All commitments are “marked-to-market” daily at the applicable foreign exchange rate, and any resulting unrealized gains or losses are recorded currently. The Funds realize gains and losses at the time forward contracts are extinguished. Unrealized gains or losses on outstanding positions in forward foreign currency contracts held at the close of the period are recognized as ordinary income or loss for Federal income tax purposes. The Funds could be exposed to risk if the counterparties to the contracts are unable to meet the terms of the contract and from unanticipated movements in the value of a foreign currency relative to the U.S. dollar. Finally, the risk exists that losses could exceed amounts disclosed on the Statements of Assets and Liabilities. It is the Funds’ policy to present the gross unrealized appreciation and gross unrealized depreciation of the forward foreign currency contracts separately on the Statements of Assets and Liabilities, as the Funds do not have a master netting agreement with the counterparty to the forward foreign currency contracts. As of and for the year ended March 31, 2021
the Funds did not utilize forward foreign currency contracts.
3. INVESTMENT ADVISORY, ADMINISTRATION AND DISTRIBUTION AGREEMENTS AND OTHER TRANSACTIONS WITH AFFILIATES
Investment Advisory, Administration and Distribution Agreements — SEI Investments Management Corporation (“SIMC”) serves as investment adviser (the “Adviser”) to each Fund. In connection with serving as Adviser, SIMC is entitled to a fee, which is calculated daily and paid monthly, based on each Fund’s average daily net assets.
SEI Investments Global Funds Services (the “Administrator”) provides the Trust with administrative and transfer agency services. For its services, the Administrator is entitled to a fee, which is calculated daily and paid monthly, based on the average daily net assets of each Fund.
SEI Investments Distribution Co. (the “Distributor”), a wholly owned subsidiary of SEI Investments Company (“SEI”) and a registered broker-dealer, acts as the Distributor of the shares of the Trust. Pursuant to Rule 12b-1 under the 1940 Act, the Funds have adopted a distribution and shareholder services plan (the Distribution Plan) with respect to Class D Shares that allows Class D Shares to pay fees to service providers, based on average daily net assets of the Class D Shares, to compensate them for distribution services or shareholder services with respect to Class D Shares.
In addition, the Funds have adopted a shareholder services plan (the Service Plan) with respect to Class F, D and I Shares that allows such Shares to pay service providers a fee, based on average daily net assets of each respective Class of Shares, in connection with the ongoing servicing of shareholder accounts owning such Shares. The Funds have also adopted an administrative services plan and agreement (the “Administrative Service Plan”) with respect to Class I Shares that allows such Shares to pay service providers a fee, based on average daily net assets of the Class I Shares, in connection with ongoing administrative services for shareholder accounts owning such Shares.
The Funds’ Distribution, Service and Administrative Service Plans provide that distribution fees, shareholder service fees and administrative service fees, as applicable, will be paid to SEI Investments Distribution Co., which may then be used by SEI Investments Distribution Co. to compensate financial intermediaries for providing distribution, shareholder services or administrative services with respect to the Shares.
| SEI Asset Allocation Trust / Annual Report / March 31, 2021 | 61 |
NOTES TO FINANCIAL STATEMENTS (Continued)
March 31, 2021
The Adviser, Administrator and/or Distributor have voluntarily agreed to waive or reimburse the Funds for all or a portion of their fees in order to keep total annual fund operating expenses (exclusive of acquired fund fees and expenses, interest from borrowings, brokerage commissions, taxes, trustees fees, proxy fees and extraordinary expenses not incurred in the ordinary course of the Funds’ business) at a specified
level. These waivers and reimbursements are voluntary and the Funds’ Adviser, Administrator and/or Distributor may discontinue all or part of any of these waivers at any time.
The Administrator, Distributor, and Adviser for the Trust serve in the same capacity for the underlying affiliated investment companies.
The following is a summary of annual fees payable to the Adviser, and Distributor and the voluntary expense limitations for each Fund:
| Advisory Fees | Shareholder Servicing Fees | Administrative Servicing Fees | Distribution Fees* | Voluntary Expense Limitations | |||||||||||||||||||||
Defensive Strategy Fund | |||||||||||||||||||||||||
Class F | 0.10% | 0.25 | % | — | — | 0.21 | % | ||||||||||||||||||
Class I | 0.10% | 0.25 | % | 0.25 | % | — | 0.46 | % | |||||||||||||||||
Defensive Strategy Allocation Fund |
| ||||||||||||||||||||||||
Class F | 0.10% | 0.25 | % | — | — | 0.35 | % | ||||||||||||||||||
Conservative Strategy Fund |
| ||||||||||||||||||||||||
Class F | 0.10% | 0.25 | % | — | — | 0.26 | % | ||||||||||||||||||
Class D | 0.10% | 0.25 | % | — | 0.75 | % | 1.01 | % | |||||||||||||||||
Class I | 0.10% | 0.25 | % | 0.25 | % | — | 0.51 | % | |||||||||||||||||
Conservative Strategy Allocation Fund |
| ||||||||||||||||||||||||
Class F | 0.10% | 0.25 | % | — | — | 0.35 | % | ||||||||||||||||||
Moderate Strategy Fund |
| ||||||||||||||||||||||||
Class F | 0.10% | 0.25 | % | — | — | 0.31 | % | ||||||||||||||||||
Class D | 0.10% | 0.25 | % | — | 0.75 | % | 1.06 | % | |||||||||||||||||
Class I | 0.10% | 0.25 | % | 0.25 | % | — | 0.56 | % | |||||||||||||||||
Moderate Strategy Allocation Fund |
| ||||||||||||||||||||||||
Class F | 0.10% | 0.25 | % | — | — | 0.35 | % | ||||||||||||||||||
Aggressive Strategy Fund |
| ||||||||||||||||||||||||
Class F | 0.10% | 0.25 | % | — | — | 0.35 | % | ||||||||||||||||||
Class D | 0.10% | 0.25 | % | — | 0.75 | % | 1.10 | % | |||||||||||||||||
Class I | 0.10% | 0.25 | % | 0.25 | % | — | 0.60 | % | |||||||||||||||||
Tax-Managed Aggressive Strategy Fund |
| ||||||||||||||||||||||||
Class F | 0.10% | 0.25 | % | — | — | 0.35 | % | ||||||||||||||||||
Core Market Strategy Fund |
| ||||||||||||||||||||||||
Class F | 0.10% | 0.25 | % | — | — | 0.35 | % | ||||||||||||||||||
Class I | 0.10% | 0.25 | % | 0.25 | % | — | 0.60 | % | |||||||||||||||||
Core Market Strategy Allocation Fund |
| ||||||||||||||||||||||||
Class F | 0.10% | 0.25 | % | — | — | 0.35 | % | ||||||||||||||||||
Market Growth Strategy Fund |
| ||||||||||||||||||||||||
Class F | 0.10% | 0.25 | % | — | — | 0.35 | % | ||||||||||||||||||
Class D | 0.10% | 0.25 | % | — | 0.75 | % | 1.10 | % | |||||||||||||||||
Class I | 0.10% | 0.25 | % | 0.25 | % | — | 0.60 | % | |||||||||||||||||
Market Growth Strategy Allocation Fund |
| ||||||||||||||||||||||||
Class F | 0.10% | 0.25 | % | — | — | 0.35 | % | ||||||||||||||||||
| * | These payments are characterized as “compensation” and are not directly tied to expenses incurred by the Distributor. The payments the Distributor receives during any year may therefore be higher or lower than its actual expenses. |
| 62 | SEI Asset Allocation Trust / Annual Report / March 31, 2021 |
The Trust will pay the Administrator the following fees at the annual rate set forth below based upon the aggregate average daily net assets of the Trust:
| First $1.5 Billion | Next $500 Million | Next $500 Million | Next $500 Million | Over $3 Billion | ||||||||||||||||
| Defensive Strategy Fund | 0.150 | % | 0.1375 | % | 0.1250 | % | 0.1125 | % | 0.10 | % | ||||||||||
| Defensive Strategy Allocation Fund | 0.150 | % | 0.1375 | % | 0.1250 | % | 0.1125 | % | 0.10 | % | ||||||||||
| Conservative Strategy Fund | 0.150 | % | 0.1375 | % | 0.1250 | % | 0.1125 | % | 0.10 | % | ||||||||||
| Conservative Strategy Allocation Fund | 0.150 | % | 0.1375 | % | 0.1250 | % | 0.1125 | % | 0.10 | % | ||||||||||
| Moderate Strategy Fund | 0.150 | % | 0.1375 | % | 0.1250 | % | 0.1125 | % | 0.10 | % | ||||||||||
| Moderate Strategy Allocation Fund | 0.150 | % | 0.1375 | % | 0.1250 | % | 0.1125 | % | 0.10 | % | ||||||||||
| Aggressive Strategy Fund | 0.150 | % | 0.1375 | % | 0.1250 | % | 0.1125 | % | 0.10 | % | ||||||||||
| Tax-Managed Aggressive Strategy Fund | 0.150 | % | 0.1375 | % | 0.1250 | % | 0.1125 | % | 0.10 | % | ||||||||||
| Core Market Strategy Fund | 0.150 | % | 0.1375 | % | 0.1250 | % | 0.1125 | % | 0.10 | % | ||||||||||
| Core Market Strategy Allocation Fund | 0.150 | % | 0.1375 | % | 0.1250 | % | 0.1125 | % | 0.10 | % | ||||||||||
| Market Growth Strategy Fund | 0.150 | % | 0.1375 | % | 0.1250 | % | 0.1125 | % | 0.10 | % | ||||||||||
| Market Growth Strategy Allocation Fund | 0.150 | % | 0.1375 | % | 0.1250 | % | 0.1125 | % | 0.10 | % | ||||||||||
Interfund Lending — The SEC has granted an exemption that permits the Trust to participate in an interfund lending program (the “Program”) with existing or future investment companies registered under the 1940 Act that are advised by SIMC (the “SEI Funds”). The Program allows the SEI Funds to lend money to and borrow money from each other for temporary or emergency purposes. Participation in the Program is voluntary for both borrowing and lending funds. Interfund loans may be made only when the rate of interest to be charged is more favorable to the lending fund than an investment in overnight repurchase agreements (“Repo Rate”), and more favorable to the borrowing fund than the rate of interest that would be charged by a bank for short-term borrowings (“Bank Loan Rate”). The Bank Loan Rate will be determined using a formula reviewed annually by the SEI Funds’ Board of Trustees. The interest rate imposed on interfund loans is the average of the Repo Rate and the Bank Loan Rate. For the year ended March 31, 2021, the Trust has not participated in the Program.
Other — Certain officers and Trustees of the Trust are also officers and/or Directors of the Administrator, the Adviser and/or the Distributor. The Trust pays each unaffiliated Trustee an annual fee for attendance at quarterly, interim, and committee meetings. The Administrator or the Adviser pays compensation of officers and affiliated Trustees.
A portion of the services provided by the Chief Compliance Officer (“CCO”) and his staff, whom are employees of the Administrator, are paid for by the Trust as incurred. The services include regulatory oversight of the Trust’s Adviser and service providers.
| SEI Asset Allocation Trust / Annual Report / March 31, 2021 | 63 |
NOTES TO FINANCIAL STATEMENTS (Continued)
March 31, 2021
4. CAPITAL SHARE TRANSACTIONS
For the year ended March 31, Capital Share transactions for the Funds were as follows (Thousands):
| Defensive Strategy Fund | Defensive Strategy Allocation Fund | Conservative Strategy Fund | Conservative Strategy Allocation Fund | |||||||||||||||||||||||||||||
| 2021 | 2020 | 2021 | 2020 | 2021 | 2020 | 2021 | 2020 | |||||||||||||||||||||||||
Shares Issued and Redeemed: | ||||||||||||||||||||||||||||||||
Class F: | ||||||||||||||||||||||||||||||||
Shares Issued | 4,488 | 302 | 143 | 267 | 1,327 | 644 | 162 | 306 | ||||||||||||||||||||||||
Shares Issued in Lieu of Cash Distributions | 37 | 44 | 10 | 34 | 134 | 199 | 85 | 240 | ||||||||||||||||||||||||
Shares Redeemed | (4,459 | ) | (684 | ) | (286 | ) | (208 | ) | (1,758 | ) | (1,635 | ) | (958 | ) | (569 | ) | ||||||||||||||||
Total Class F Transactions | 66 | (338 | ) | (133 | ) | 93 | (297 | ) | (792 | ) | (711 | ) | (23 | ) | ||||||||||||||||||
Shares Issued and Redeemed: | ||||||||||||||||||||||||||||||||
Class D: | ||||||||||||||||||||||||||||||||
Shares Issued | N/A | N/A | N/A | N/A | 152 | 95 | N/A | N/A | ||||||||||||||||||||||||
Shares Issued in Lieu of Cash Distributions | N/A | N/A | N/A | N/A | 5 | 8 | N/A | N/A | ||||||||||||||||||||||||
Shares Redeemed | N/A | N/A | N/A | N/A | (100 | ) | (98 | ) | N/A | N/A | ||||||||||||||||||||||
Total Class D Transactions | N/A | N/A | N/A | N/A | 57 | 5 | N/A | N/A | ||||||||||||||||||||||||
Shares Issued and Redeemed: | ||||||||||||||||||||||||||||||||
Class I: | ||||||||||||||||||||||||||||||||
Shares Issued | 10 | 19 | N/A | N/A | 7 | 44 | N/A | N/A | ||||||||||||||||||||||||
Shares Issued in Lieu of Cash Distributions | 1 | 1 | N/A | N/A | 1 | 2 | N/A | N/A | ||||||||||||||||||||||||
Shares Redeemed | (19 | ) | (9 | ) | N/A | N/A | (55 | ) | (59 | ) | N/A | N/A | ||||||||||||||||||||
Total Class I Transactions | (8 | ) | 11 | N/A | N/A | (47 | ) | (13 | ) | N/A | N/A | |||||||||||||||||||||
Increase (Decrease) in Capital Shares | 58 | (327 | ) | (133 | ) | 93 | (287 | ) | (800 | ) | (711 | ) | (23 | ) | ||||||||||||||||||
| Moderate Strategy Fund | Moderate Strategy Allocation Fund | Aggressive Strategy Fund | Tax-Managed Aggressive Strategy Fund | |||||||||||||||||||||||||||||
| 2021 | 2020 | 2021 | 2020 | 2021 | 2020 | 2021 | 2020 | |||||||||||||||||||||||||
Shares Issued and Redeemed: | ||||||||||||||||||||||||||||||||
Class F: | ||||||||||||||||||||||||||||||||
Shares Issued | 4,315 | 1,486 | 329 | 219 | 1,059 | 982 | 202 | 211 | ||||||||||||||||||||||||
Shares Issued in Lieu of Cash Distributions | 321 | 411 | 219 | 308 | 349 | 577 | 130 | 97 | ||||||||||||||||||||||||
Shares Redeemed | (6,017 | ) | (3,293 | ) | (868 | ) | (998 | ) | (2,301 | ) | (3,295 | ) | (352 | ) | (599 | ) | ||||||||||||||||
Total Class F Transactions | (1,381 | ) | (1,396 | ) | (320 | ) | (471 | ) | (893 | ) | (1,736 | ) | (20 | ) | (291 | ) | ||||||||||||||||
Shares Issued and Redeemed: | ||||||||||||||||||||||||||||||||
Class D: | ||||||||||||||||||||||||||||||||
Shares Issued | 37 | 43 | N/A | N/A | 131 | 133 | N/A | N/A | ||||||||||||||||||||||||
Shares Issued in Lieu of Cash Distributions | 6 | 7 | N/A | N/A | 40 | 50 | N/A | N/A | ||||||||||||||||||||||||
Shares Redeemed | (40 | ) | (43 | ) | N/A | N/A | (91 | ) | (95 | ) | N/A | N/A | ||||||||||||||||||||
Total Class D Transactions | 3 | 7 | N/A | N/A | 80 | 88 | N/A | N/A | ||||||||||||||||||||||||
Shares Issued and Redeemed: | ||||||||||||||||||||||||||||||||
Class I: | ||||||||||||||||||||||||||||||||
Shares Issued | 26 | 28 | N/A | N/A | 74 | 81 | N/A | N/A | ||||||||||||||||||||||||
Shares Issued in Lieu of Cash Distributions | 4 | 5 | N/A | N/A | 22 | 31 | N/A | N/A | ||||||||||||||||||||||||
Shares Redeemed | (30 | ) | (35 | ) | N/A | N/A | (68 | ) | (148 | ) | N/A | N/A | ||||||||||||||||||||
Total Class I Transactions | — | (2 | ) | N/A | N/A | 28 | (36 | ) | N/A | N/A | ||||||||||||||||||||||
Decrease in Capital Shares | (1,378 | ) | (1,391 | ) | (320 | ) | (471 | ) | (785 | ) | (1,684 | ) | (20 | ) | (291 | ) | ||||||||||||||||
| 64 | SEI Asset Allocation Trust / Annual Report / March 31, 2021 |
| Core Market Strategy Fund | Core Market Strategy Allocation Fund | Market Growth Strategy Fund | Market Growth Strategy Allocation Fund | |||||||||||||||||||||||||||||
| 2021 | 2020 | 2021 | 2020 | 2021 | 2020 | 2021 | 2020 | |||||||||||||||||||||||||
Shares Issued and Redeemed: | ||||||||||||||||||||||||||||||||
Class F: | ||||||||||||||||||||||||||||||||
Shares Issued | 448 | 784 | 51 | 55 | 1,031 | 887 | 144 | 192 | ||||||||||||||||||||||||
Shares Issued in Lieu of Cash Distributions | 281 | 369 | 65 | 61 | 509 | 638 | 244 | 183 | ||||||||||||||||||||||||
Shares Redeemed | (1,486 | ) | (2,309 | ) | (298 | ) | (262 | ) | (3,002 | ) | (4,485 | ) | (805 | ) | (913 | ) | ||||||||||||||||
Total Class F Transactions | (757 | ) | (1,156 | ) | (182 | ) | (146 | ) | (1,462 | ) | (2,960 | ) | (417 | ) | (538 | ) | ||||||||||||||||
Shares Issued and Redeemed: | ||||||||||||||||||||||||||||||||
Class D: | ||||||||||||||||||||||||||||||||
Shares Issued | N/A | N/A | N/A | N/A | 46 | 59 | N/A | N/A | ||||||||||||||||||||||||
Shares Issued in Lieu of Cash Distributions | N/A | N/A | N/A | N/A | 12 | 14 | N/A | N/A | ||||||||||||||||||||||||
Shares Redeemed | N/A | N/A | N/A | N/A | (110 | ) | (59 | ) | N/A | N/A | ||||||||||||||||||||||
Total Class D Transactions | N/A | N/A | N/A | N/A | (52 | ) | 14 | N/A | N/A | |||||||||||||||||||||||
Shares Issued and Redeemed: | ||||||||||||||||||||||||||||||||
Class I: | ||||||||||||||||||||||||||||||||
Shares Issued | — | — | N/A | N/A | 22 | 26 | N/A | N/A | ||||||||||||||||||||||||
Shares Issued in Lieu of Cash Distributions | — | — | N/A | N/A | 12 | 13 | N/A | N/A | ||||||||||||||||||||||||
Shares Redeemed | — | — | N/A | N/A | (24 | ) | (257 | ) | N/A | N/A | ||||||||||||||||||||||
Total Class I Transactions | — | — | N/A | N/A | 10 | (218 | ) | N/A | N/A | |||||||||||||||||||||||
Decrease in Capital Shares | (757 | ) | (1,156 | ) | (182 | ) | (146 | ) | (1,504 | ) | (3,164 | ) | (417 | ) | (538 | ) | ||||||||||||||||
Amounts designated as “ —” are zero or have been rounded to zero.
N/A — Not applicable. Class D and Class I shares currently not offered.
5. INVESTMENT TRANSACTIONS
The cost of security purchases and the proceeds from the sale of securities, other than temporary cash investments and futures, during the year ended March 31, 2021 were as follows ($ Thousands):
| Total | ||||
Defensive Strategy Fund |
| |||
Purchases | $ | 40,027 | ||
Sales | 40,127 | |||
Defensive Strategy Allocation Fund |
| |||
Purchases | 357 | |||
Sales | 872 | |||
Conservative Strategy Fund |
| |||
Purchases | 14,321 | |||
Sales | 17,419 | |||
Conservative Strategy Allocation Fund |
| |||
Purchases | 5,540 | |||
Sales | 12,726 | |||
Moderate Strategy Fund |
| |||
Purchases | 52,954 | |||
Sales | 69,662 | |||
Moderate Strategy Allocation Fund |
| |||
Purchases | 9,107 | |||
Sales | 16,160 | |||
Aggressive Strategy Fund |
| |||
Purchases | 31,305 | |||
Sales | 43,725 | |||
Tax-Managed Aggressive Strategy |
| |||
Fund | ||||
Purchases | 5,488 | |||
Sales | 6,868 | |||
| Total | ||||
Core Market Strategy Fund |
| |||
Purchases | 12,688 | |||
Sales | 21,613 | |||
Core Market Strategy Allocation Fund |
| |||
Purchases | 1,214 | |||
Sales | 5,747 | |||
Market Growth Strategy Fund |
| |||
Purchases | 24,786 | |||
Sales | 45,152 | |||
Market Growth Strategy Allocation |
| |||
Fund | ||||
Purchases | 4,444 | |||
Sales | 19,124 | |||
6. FEDERAL TAX INFORMATION
It is each Fund’s intention to qualify as a regulated investment company for Federal income tax purposes and distribute all of its taxable income (including net capital gains). Accordingly, no provision for Federal income taxes is required.
Management has analyzed the Funds’ tax positions taken on federal income tax returns for all open tax years (current and prior three tax years) and has concluded that as of March 31, 2021, no provision for income tax is required in the Funds’ financial statements. The Funds’ federal and state income and federal excise tax returns for tax years for which the applicable statutes of limitations have not expired are subject to examination by the Internal Revenue Service and state departments of revenue.
Reclassification of Components of Net Assets — The timing and characterization of certain income and
| SEI Asset Allocation Trust / Annual Report / March 31, 2021 | 65 |
NOTES TO FINANCIAL STATEMENTS (Continued)
March 31, 2021
capital gains distributions are determined annually in accordance with Federal tax regulations which may differ from accounting principles generally accepted in the United States of America. As a result, net investment income (loss) and net realized gain (loss) on investment transactions for a reporting period may differ significantly from distributions during such period. These book/tax differences may be temporary or permanent in nature. To the extent these differences are permanent, they are charged or credited to paid-in capital, or distributable earnings (accumulated losses), as appropriate, in the period that the differences arise. Permanent differences are primarily attributed to the reclassification of short-term capital gains received from
affiliated funds, the reclassification of distributions and non-deductible excise tax.
Accordingly, the following permanent differences, primarily attributable to the re-classification of short-term capital gains received from affiliated funds, the reclassification of distributions and non-deductible excise tax have been reclassified to/from the following accounts as of March 31, 2021 ($ Thousands):
| Distributable Earnings* | Paid-in- Capital* | |||
Tax-Managed Aggressive Strategy Fund | $128 | $(128) |
*Amounts designated as “—” are $0 or have been rounded to $0.
These classifications have no impact on net assets or net asset value per share.
The tax character of dividends and distributions declared during the years ended March 31, 2021 and March 31, 2020 were as follows ($ Thousands):
| Ordinary Income | Long-Term Capital Gains | Return of Capital | Totals | |||||||||||||||||||||||||||||
| 2021 | 2020 | 2021 | 2020 | 2021 | 2020 | 2021 | 2020 | |||||||||||||||||||||||||
Defensive Strategy Fund | $ | 371 | $ | 455 | $ | – | $ | – | $ | – | $ | – | $ | 371 | $ | 455 | ||||||||||||||||
Defensive Strategy Allocation Fund | 118 | 368 | – | 161 | 1 | – | 119 | 529 | ||||||||||||||||||||||||
Conservative Strategy Fund | 1,248 | 2,096 | 352 | 313 | – | – | 1,600 | 2,409 | ||||||||||||||||||||||||
Conservative Strategy Allocation Fund | 1,074 | 1,373 | – | 2,191 | – | – | 1,074 | 3,564 | ||||||||||||||||||||||||
Moderate Strategy Fund | 2,942 | 5,488 | 1,402 | – | – | – | 4,344 | 5,488 | ||||||||||||||||||||||||
Moderate Strategy Allocation Fund | 1,529 | 2,099 | 2,785 | 4,559 | – | – | 4,314 | 6,658 | ||||||||||||||||||||||||
Aggressive Strategy Fund | 2,816 | 5,357 | 3,996 | 5,143 | – | – | 6,812 | 10,500 | ||||||||||||||||||||||||
Tax-Managed Aggressive Strategy Fund | 1,043 | 1,211 | 2,143 | 1,047 | – | – | 3,186 | 2,258 | ||||||||||||||||||||||||
Core Market Strategy Fund | 1,961 | 3,084 | 1,538 | 1,468 | – | – | 3,499 | 4,552 | ||||||||||||||||||||||||
Core Market Strategy Allocation Fund | 339 | 425 | 1,129 | 895 | – | – | 1,468 | 1,320 | ||||||||||||||||||||||||
Market Growth Strategy Fund | 3,974 | 6,867 | 3,657 | 2,466 | – | – | 7,631 | 9,333 | ||||||||||||||||||||||||
Market Growth Strategy Allocation Fund | 1,709 | 2,073 | 4,962 | 2,768 | – | – | 6,671 | 4,841 | ||||||||||||||||||||||||
As of March 31, 2021, the components of Distributable Earnings (Accumulated Losses) on a tax basis were as follows
($ Thousands):
Undistributed Ordinary Income | Undistributed Long-Term Capital Gain | Capital Loss Carryforwards | Post- October Losses | Other Temporary Differences | Unrealized Appreciation (Depreciation) | Total Distributable Earnings/ (Accumulated Losses) | ||||||||||||||||||||||
Defensive Strategy Fund | $ | 190 | $ | 65 | $ | — | $ | — | $ | 4 | $ | 355 | $ | 614 | ||||||||||||||
Defensive Strategy Allocation Fund | — | — | (1,585 | ) | — | 1 | (35 | ) | (1,619 | ) | ||||||||||||||||||
Conservative Strategy Fund | 150 | 170 | — | — | — | 672 | 992 | |||||||||||||||||||||
Conservative Strategy Allocation Fund | 238 | — | (1,089 | ) | — | — | 2,888 | 2,037 | ||||||||||||||||||||
Moderate Strategy Fund | 751 | 1,299 | — | — | (3 | ) | 2,247 | 4,294 | ||||||||||||||||||||
Moderate Strategy Allocation Fund | 499 | 2,700 | — | — | (3 | ) | 14,348 | 17,544 | ||||||||||||||||||||
Aggressive Strategy Fund | 56 | 4,145 | — | — | (2 | ) | 28,990 | 33,189 | ||||||||||||||||||||
Tax-Managed Aggressive Strategy Fund | — | — | — | — | 2 | 40,423 | 40,425 | |||||||||||||||||||||
Core Market Strategy Fund | 109 | 1,948 | — | — | — | 5,958 | 8,015 | |||||||||||||||||||||
Core Market Strategy Allocation Fund | — | 1,152 | — | — | 1 | 12,932 | 14,085 | |||||||||||||||||||||
Market Growth Strategy Fund | 195 | 4,661 | — | — | — | 19,666 | 24,522 | |||||||||||||||||||||
Market Growth Strategy Allocation Fund | 2 | 4,185 | — | — | (1 | ) | 65,224 | 69,410 | ||||||||||||||||||||
| 66 | SEI Asset Allocation Trust / Annual Report / March 31, 2021 |
The Funds had capital loss carryforwards at March 31, 2021 as follows ($ Thousands):
| Short-Term Loss | Long-Term Loss | Total | ||||
Defensive Strategy Allocation Fund | $545 | $1,040 | $1,585 | |||
Conservative Strategy Allocation Fund | 290 | 799 | 1,089 |
The Defensive Strategy Fund utilized capital loss carryforward to offset capital gains of $73 ($ Thousands).
For Federal income tax purposes, the cost of investments owned at March 31, 2021, and the net realized gains or losses on investments sold for the period were different from amounts reported for financial reporting purposes. These differences are primarily due to wash sales which cannot be used for Federal income tax purposes in the current year and have been deferred for use in future years. The aggregate gross unrealized appreciation and depreciation on total investments held by the Funds at March 31, 2021, was as follows ($ Thousands):
Federal Tax Cost | Appreciated Securities | Depreciated Securities | Net Unrealized Appreciation (Depreciation) | |||||||||||||
Defensive Strategy Fund | $17,345 | $563 | $(208 | ) | $355 | |||||||||||
Defensive Strategy Allocation Fund | 6,273 | 73 | (108 | ) | (35 | ) | ||||||||||
Conservative Strategy Fund | 68,865 | 2,506 | (1,834 | ) | 672 | |||||||||||
Conservative Strategy Allocation Fund | 26,276 | 4,626 | (1,738 | ) | 2,888 | |||||||||||
Moderate Strategy Fund | 146,113 | 6,492 | (4,245 | ) | 2,247 | |||||||||||
Moderate Strategy Allocation Fund | 54,172 | 18,394 | (4,046 | ) | 14,348 | |||||||||||
Aggressive Strategy Fund | 154,517 | 38,004 | (9,014 | ) | 28,990 | |||||||||||
Tax-Managed Aggressive Strategy Fund | 46,554 | 41,731 | (1,308 | ) | 40,423 | |||||||||||
Core Market Strategy Fund | 73,056 | 10,581 | (4,623 | ) | 5,958 | |||||||||||
Core Market Strategy Allocation Fund | 12,952 | 13,294 | (362 | ) | 12,932 | |||||||||||
Market Growth Strategy Fund | 175,030 | 29,577 | (9,911 | ) | 19,666 | |||||||||||
Market Growth Strategy Allocation Fund | 70,075 | 68,308 | (3,084 | ) | 65,224 | |||||||||||
7. INDEMNIFICATIONS
In the normal course of business, a Fund may enter into contracts that provide general indemnifications by a Fund to the counterparty of the contract. A Fund’s maximum exposure under these arrangements is dependent on future claims that may be made against a Fund and, therefore, cannot be established; however, based on experience, management believes the risk of loss from such claims is considered remote.
8. CONCENTRATION RISK
The Underlying SEI Funds and other investment companies and exchange traded products in which the Funds invest may apply any of a variety of investment strategies and may invest in a broad range of asset classes, securities and other investments to attempt to achieve their designated investment goals.
The following descriptions provide additional information about some of the risks of investing in the Funds:
Asset Allocation Risk — The risk that SIMC’s decisions regarding asset classes and Underlying SEI Funds will not anticipate market trends successfully.
Below Investment Grade Securities (Junk Bonds) Risk — Fixed income securities rated below investment grade ( junk bonds) involve greater risk of default or downgrade and are generally more volatile than investment grade securities because the prospect for repayment of principal and interest of many of these securities is speculative. Because these securities typically offer a higher rate of return to compensate for these risks, they are sometimes referred to as “high yield bonds,” but there is no guarantee that an investment in these securities will result in a high rate of return.
Exchange-Traded Products (ETPs) Risk — The risks of owning interests of an ETP, such as an ETF, ETN or exchange-traded commodity pool, generally reflect the same risks as owning the underlying securities or other instruments that the ETP is designed to track. The shares of certain ETPs may trade at a premium or discount to their intrinsic value (i.e., the market value may differ from the net asset value (NAV) of an ETP’s shares). For example, supply and demand for shares of an ETF or market disruptions may cause the market price of the ETF to deviate from the value of the ETF’s investments, which may be emphasized in less liquid markets. The value of an ETN may also differ from the valuation of its reference market or instrument due to changes in the issuer’s credit rating. By investing in an ETP, the Fund or an Underlying SEI Fund indirectly bears the proportionate share of any fees and expenses of the ETP in addition to the fees and expenses that the Fund and its shareholders directly bear in connection with the Fund’s operations. Because certain ETPs may have a significant portion of their assets exposed directly or indirectly to commodities or commodity-linked securities, developments affecting commodities may have a disproportionate impact on such ETPs and may subject the ETPs to greater volatility than investments in traditional securities.
Foreign Investment/Emerging Markets Risk — The risk that non-U.S. securities may be subject to additional risks due to, among other things, political, social and economic developments abroad, currency movements, and different legal, regulatory and tax environments. These additional risks may be heightened with respect to emerging market countries because political turmoil and rapid changes in economic conditions are more likely to occur in these countries.
Investment Company Risk — When the Fund or an Underlying SEI Fund invests in an investment company, in addition to directly bearing the expenses associated with its own operations, it will bear a pro rata portion of
| SEI Asset Allocation Trust / Annual Report / March 31, 2021 | 67 |
NOTES TO FINANCIAL STATEMENTS (Continued)
March 31, 2021
the investment company’s expenses. In addition, while the risks of owning shares of an investment company generally reflect the risks of owning the underlying investments of the investment company, the Fund may be subject to additional or different risks than if the Fund or an Underlying SEI Fund had invested directly in the underlying investments.
Portfolio Turnover Risk — Due to its investment strategy, a Fund may buy and sell securities frequently. This may result in higher transaction costs and additional capital gains tax liabilities, which may affect the Fund’s performance.
Real Estate Industry Risk — Securities of companies principally engaged in the real estate industry may be subject to the risks associated with the direct ownership of real estate. Risks commonly associated with the direct ownership of real estate include fluctuations in the value of underlying properties, defaults by borrowers or tenants, changes in interest rates and risks related to general or local economic conditions.
Short Sales Risk — A short sale involves the sale of a security that a fund does not own in the expectation of purchasing the same security (or a security exchangeable therefore) at a later date at a lower price. Short sales entered into by an Underlying SEI Fund expose the Fund to the risk that the Underlying SEI Fund will be required to buy a security sold short (also known as “covering” the short position) at a time when the security has appreciated in value, thus resulting in a loss to the Underlying SEI Fund and, therefore, the Fund, that is potentially unlimited. Reinvesting proceeds received from short selling may create leverage, which can amplify the effects of market volatility on the share price of an Underlying SEI Fund and, therefore, the Fund. Investment in short sales may also cause an Underlying SEI Fund to incur expenses related to borrowing securities. In addition, shorting a future contract may require posting only a margin that may amount to less than the notional exposure of the contract. Such a practice may exacerbate the loss in a case of adverse price action.
Small and Medium Capitalization Risk — Small and medium capitalization companies may be more vulnerable to adverse business or economic events than larger, more established companies. In particular, small and medium capitalization companies may have limited product lines, markets and financial resources and may depend upon a relatively small management group. Therefore, small and medium capitalization stocks may be more volatile than those of larger companies. Small and medium capitalization stocks may be traded over-the-counter (OTC). OTC stocks may trade less frequently and in smaller volume than exchange listed stocks and
may have more price volatility than that of exchange listed stocks.
Large Capitalization Risk — The risk that larger, more established companies may be unable to respond quickly to new competitive challenges such as changes in technology and consumer tastes. Larger companies also may not be able to attain the high growth rates of successful smaller companies.
U.S. Government Securities Risk — Although U.S. Government securities are considered to be among the safest investments, they are still subject to the credit risk of the U.S. Government and are not guaranteed against price movements due to changing interest rates. Obligations issued by some U.S. Government agencies are backed by the U.S. Treasury, while others are backed solely by the ability of the agency to borrow from the U.S. Treasury or by the agency’s own resources. No assurance can be given that the U.S. Government will provide financial support to its agencies and instrumentalities if it is not obligated by law to do so.
Interest Rate Risk — The risk that a rise in interest rates will cause a fall in the value of fixed income securities, including U.S. Government securities, in which the Underlying SEI Funds invest. A low interest rate environment may present greater interest rate risk because there may be a greater likelihood of rates increasing and rates may increase more rapidly.
Commodity Investments Risk — Certain Underlying SEI Funds may invest a portion of their assets in a wholly owned subsidiary that is not registered under the Investment Company Act of 1940, as amended (1940 Act), and invests directly in commodities and commodity-related instruments. Other Underlying SEI Funds may have indirect exposure to commodities by investing in commodity-related instruments. Commodity investments and derivatives may be more volatile and less liquid than direct investments in the underlying commodities themselves. Commodity-related equity returns can also be affected by the issuer’s financial structure or the performance of unrelated businesses. The value of a commodity investment or a derivative investment in commodities is typically based upon the price movements of a physical commodity, a commodity futures contract or commodity index or some other readily measurable economic variable that is dependent upon changes in the value of commodities or the commodities markets. The value of these securities will rise or fall in response to changes in the underlying commodity or related benchmark or investment, changes in interest rates, or factors affecting a particular industry or commodity, such as natural disasters,
| 68 | SEI Asset Allocation Trust / Annual Report / March 31, 2021 |
weather and U.S. and international economic, political and regulatory developments.
Currency Risk — As a result of the Fund’s and certain Underlying SEI Funds’ investments in securities or other investments denominated in, and/or receiving revenues in, foreign currencies, the Fund will be subject to currency risk. Currency risk is the risk that foreign currencies will decline in value relative to the U.S. dollar or, in the case of hedging positions, that the U.S. dollar will decline in value relative to the currency hedged. In either event, the dollar value of an investment in the Fund or an Underlying SEI Fund would be adversely affected. Currency exchange rates may fluctuate in response to, among other things, changes in interest rates, intervention (or failure to intervene) by U.S. or foreign governments, central banks or supranational entities, or by the imposition of currency controls or other political developments in the United States or abroad.
Derivatives Risk — The use of futures contracts, forward contracts, options and swaps is subject to market risk, leverage risk, correlation risk and liquidity risk. Many over-the-counter (OTC) derivative instruments will not have liquidity beyond the counterpart to the instrument. Market risk is the risk that the market value of an investment may move up and down, sometimes rapidly and unpredictably. Leverage risk is the risk that a small percentage of assets invested in a derivative can have a disproportionately larger impact on the Fund or an Underlying SEI Fund. Correlation risk is the risk that changes in the value of a derivative instrument may not correlate perfectly with changes in the value of the derivative instrument’s underlying asset, rate or index. Liquidity risk is the risk that the derivative may be difficult or impossible to sell at the time and the price that the Fund or an Underlying SEI Fund would like, which may cause the Fund or the Underlying SEI Fund to have to lower the selling price, sell other securities instead or forego an investment opportunity, any of which could have a negative effect on the Fund’s or the Underlying SEI Fund’s management or performance. The use of swaps and over-the-counter forward contracts and options is also subject to credit risk and valuation risk. Credit risk is the risk that the issuer of a security or counterparty to a derivatives contract will default or otherwise become unable to honor its financial obligation to the Fund or the Underlying SEI Fund under the contract. Valuation risk is the risk that the derivative may be difficult to value. Each of the above risks could cause the Fund or an Underlying SEI Fund to lose more than the principal amount invested in a derivative instrument. Some derivatives have the potential for unlimited loss, regardless of the size of the Fund’s or an Underlying SEI Fund’s initial investment.
The other parties to certain derivative contracts present the same types of credit risk as issuers of fixed income securities. The Fund’s or an Underlying SEI Fund’s use of derivatives may also increase the amount of taxes payable by shareholders. Both U.S. and non-U.S. regulators are in the process of adopting and implementing regulations governing derivatives markets, the ultimate impact of which remains unclear.
Equity Market Risk — The risk that the market value of a security may move up and down, sometimes rapidly and unpredictably. Market risk may affect a single issuer, an industry, a sector or the equity or bond market as a whole. Equity markets may decline significantly in response to adverse issuer, political, regulatory, market, economic or other developments that may cause broad changes in market value, public perceptions concerning these developments, and adverse investor sentiment or publicity. Similarly, environmental and public health risks, such as natural disasters or epidemics, or widespread Fear that such events may occur, may impact markets adversely and cause market volatility in both the short- and long-term.
Fixed Income Market Risk — The prices of fixed income securities respond to economic developments, particularly interest rate changes, as well as to perceptions about the creditworthiness of individual issuers, including governments and their agencies. Generally, an Underlying SEI Fund’s fixed income securities will decrease in value if interest rates rise and vice versa. In a low interest rate environment, risks associated with rising rates are heightened. Declines in dealer market-making capacity as a result of structural or regulatory changes could decrease liquidity and/or increase volatility in the fixed income markets. Markets for fixed income securities may decline significantly in response to adverse issuer, political, regulatory, market, economic or other developments that may cause broad changes in market value, public perceptions concerning these developments, and adverse investor sentiment or publicity. Similarly, environmental and public health risks, such as natural disasters or epidemics, or widespread fear that such events may occur, may impact markets adversely and cause market volatility in both the short- and long-term. In response to these events, the Underlying SEI Fund’s and, in turn, the Fund’s value may fluctuate and/or the Underlying SEI Fund and the Fund may experience increased redemptions from shareholders, which may impact the Underlying SEI Fund’s and the Fund’s liquidity or force the Underlying SEI Fund and the Fund to sell securities into a declining or illiquid market.
Economic Risks of Global Health Events — Global health events and pandemics, such as COVID-19, have the ability to affect—quickly, drastically and substantially
| SEI Asset Allocation Trust / Annual Report / March 31, 2021 | 69 |
NOTES TO FINANCIAL STATEMENTS (Concluded)
March 31, 2021
the economies of many nations, states, individual companies and the markets in general and can cause disruptions that cannot necessarily be foreseen. The spread of COVID-19 around the world in 2020 resulted in a substantial number of nations implementing social distancing measures, quarantines, and the shutdown of non-essential businesses and governmental services. Further, it has caused significant volatility in U.S. and international markets. The impact of the outbreak may be short term or may last for an extended period of time.
The foregoing is not intended to be a complete discussion of all risks associated with the investment strategies of the Funds. Please refer to the current prospectus for a discussion of the risks associated with investing in the Funds.
9. CONCENTRATION OF SHAREHOLDERS
SEI Private Trust Company (“SPTC”) and SIMC are subsidiaries of SEI Investments Company. As of March 31, 2021, SPTC held of record the following:
Defensive Strategy Fund - Class F | 68.99% | |
Defensive Strategy Allocation Fund - Class F | 66.83% | |
Conservative Strategy Fund - Class F | 77.91% | |
Conservative Strategy Fund - Class D | 39.64% | |
Conservative Strategy Allocation Fund - Class F | 89.07% | |
Moderate Strategy Fund - Class F | 88.99% | |
Moderate Strategy Fund - Class D | 66.03% | |
Moderate Strategy Allocation Fund - Class F | 79.77% | |
Aggressive Strategy Fund - Class F | 71.29% | |
Tax-Managed Aggressive Strategy Fund - Class F | 94.01% | |
Core Market Strategy Fund - Class F | 96.21% | |
Core Market Strategy Allocation Fund - Class F | 94.81% | |
Market Growth Strategy Fund - Class F | 86.15% | |
Market Growth Strategy Fund - Class D | 31.77% | |
Market Growth Strategy Allocation Fund - Class F | 89.51% |
SPTC is not a direct service provider to the SEI Funds. However, SPTC performs a role in the comprehensive investment solution that SEI provides to investors. SPTC holds shares in the Funds as custodian for shareholders that are clients of independent registered investment advisers, financial planners, bank trust departments and other financial advisers. SPTC maintains omnibus accounts at the Fund’s transfer agent.
10. SUBSEQUENT EVENTS
The Trust, on behalf of the Funds, has evaluated the need for disclosures and/or adjustments resulting from subsequent events. Based on this evaluation, no disclosures and/or adjustments were required to the financial statements through the date of issuance.
| 70 | SEI Asset Allocation Trust / Annual Report / March 31, 2021 |
REPORT OF INDEPENDENT REGISTERED PUBLIC ACCOUNTING FIRM
To the Shareholders of the Funds and Board of Trustees
SEI Asset Allocation Trust:
Opinion on the Financial Statements
We have audited the accompanying statements of assets and liabilities of SEI Asset Allocation Trust, comprised of the Defensive Strategy Fund, Defensive Strategy Allocation Fund, Conservative Strategy Fund, Conservative Strategy Allocation Fund, Moderate Strategy Fund, Moderate Strategy Allocation Fund, Aggressive Strategy Fund, Tax-Managed Aggressive Strategy Fund, Core Market Strategy Fund, Core Market Strategy Allocation Fund, Market Growth Strategy Fund, and Market Growth Strategy Allocation Fund (collectively, the Funds), including the schedules of investments, as of March 31, 2021, the related statements of operations for the year then ended, the statements of changes in net assets for each of the years in the two-year period then ended, and the related notes (collectively, the financial statements) and the financial highlights for each of the years in the five-year period then ended. In our opinion, the financial statements and financial highlights present fairly, in all material respects, the financial position of the Funds as of March 31, 2021, the results of their operations for the year then ended, the changes in their net assets for each of the years in the two-year period then ended, and the financial highlights for each of the years in the five-year period then ended, in conformity with U.S. generally accepted accounting principles.
Basis for Opinion
These financial statements and financial highlights are the responsibility of the Funds’ management. Our responsibility is to express an opinion on these financial statements and financial highlights based on our audits. We are a public accounting firm registered with the Public Company Accounting Oversight Board (United States) (PCAOB) and are required to be independent with respect to the Funds in accordance with the U.S. federal securities laws and the applicable rules and regulations of the Securities and Exchange Commission and the PCAOB.
We conducted our audits in accordance with the standards of the PCAOB. Those standards require that we plan and perform the audit to obtain reasonable assurance about whether the financial statements and financial highlights are free of material misstatement, whether due to error or fraud. Our audits included performing procedures to assess the risks of material misstatement of the financial statements and financial highlights, whether due to error or fraud, and performing procedures that respond to those risks. Such procedures included examining, on a test basis, evidence regarding the amounts and disclosures in the financial statements and financial highlights. Such procedures also included confirmation of securities owned as of March 31, 2021, by correspondence with the transfer agent. Our audits also included evaluating the accounting principles used and significant estimates made by management, as well as evaluating the overall presentation of the financial statements and financial highlights. We believe that our audits provide a reasonable basis for our opinion.

We have served as the auditor of one or more SEI Funds investment companies since 2005.
Philadelphia, Pennsylvania
May 27, 2021
| SEI Asset Allocation Trust / Annual Report / March 31, 2021 | 71 |
TRUSTEES AND OFFICERS OF THE TRUST (Unaudited)
The following chart lists Trustees and Officers as of March 31, 2021
Set forth below are the names, addresses, ages, position with the Trust, Term of Office and Length of Time Served, the principal occupations for the last five years, number of positions in fund complex overseen by trustee, and other directorships outside the fund complex of each of the persons currently serving as Trustees and Officers of the Trust. The Trust’s Statement of Additional Information (“SAI”) includes additional information about the Trustees and Officers. The SAI may be obtained without charge by calling 1-800-342-5734.
Name, Address, and Age | Position(s) Held with Trusts | Term of Office and Length of Time Served1 | Principal Occupation(s) During Past Five Years | Number of Portfolios in Fund Complex Overseen by Trustee2 | Other Directorships Held by Trustee | |||||||||
| INTERESTED TRUSTEES | ||||||||||||||
Robert A. Nesher One Freedom Valley Drive Oaks, PA 19456 74 yrs. old | | Chairman of the Board of Trustees* | | | since 1995 | | Currently performs various services on behalf of SEI for which Mr. Nesher is compensated. | 93 | President and Director of SEI Structured Credit Fund, LP. Director of SEI Global Master Fund plc, SEI Global Assets Fund plc, SEI Global Investments Fund plc, SEI Investments—Global Funds Services, Limited, SEI Investments Global, Limited, SEI Investments (Europe) Ltd., SEI Multi-Strategy Funds PLC, SEI Global Nominee Ltd and SEI Investments—Unit Trust Management (UK) Limited. President, Director and Chief Executive Officer of SEI Alpha Strategy Portfolios, LP from 2007 to 2013. Trustee of SEI Liquid Asset Trust from 1989 to 2016. Trustee of SEI Insurance Products Trust from 2013 to 2020. Vice Chairman of O’Connor EQUUS (closed-end investment company) from 2014 to 2016. Vice Chairman of Winton Series Trust from 2014 to 2017. Vice Chairman of The Advisors’ Inner Circle Fund III and Winton Diversified Opportunities Fund (closed-end investment company) from 2014 to 2018. Vice Chairman of Gallery Trust, Schroder Series Trust and Schroder Global Series Trust from 2015 to 2018. Trustee of The Advisors’ Inner Circle Fund, The Advisors’ Inner Circle Fund II, Bishop Street Funds, and the KP Funds. President, Chief Executive Officer and Trustee of SEI Asset Allocation Trust, SEI Daily Income Trust, SEI Institutional Managed Trust, SEI Institutional International Trust, SEI Institutional Investments Trust, SEI Tax Exempt Trust, Adviser Managed Trust, The New Covenant Funds and SEI Catholic Values Trust. | |||||
William M. Doran One Freedom Valley Drive Oaks, PA 19456 80 yrs. old | Trustee* | | since 1995 | | Self-employed consultant since 2003.Partner, Morgan, Lewis & Bockius LLP (law firm) from 1976 to 2003. Counsel to the Trust, SEI, SIMC, the Administrator and the Distributor. | 93 | Director of SEI since 1974; Secretary of SEI since 1978. Director of SEI Investments Distribution Co. since 2003. Director of SEI Investments—Global Funds Services, Limited, SEI Investments Global, Limited, SEI Investments (Europe), Limited, SEI Investments (Asia) Limited, SEI Global Nominee Ltd. and SEI Investments—Unit Trust Management (UK) Limited. Trustee of SEI Liquid Asset Trust from 1982 to 2016. Trustee of O’Connor EQUUS from 2014 to 2016. Director of SEI Alpha Strategy Portfolios, LP from 2007 to 2013. Trustee of Winton Series Trust from 2014 to 2017. Trustee of The Advisors’ Inner Circle Fund, The Advisors’ Inner Circle Fund II and Bishop Street Funds from 1991 to 2018. Trustee of SEI Insurance Products Trust from 2013 to 2020. Trustee of The KP Funds from 2013 to 2018. Trustee of Winton Diversified Opportunities Fund from 2014 to 2018. Trustee of The Advisors’ Inner Circle Fund III, Gallery Trust, SEI Asset Allocation Trust, SEI Daily Income Trust, SEI Institutional Managed Trust, SEI Institutional International Trust, SEI Institutional Investments Trust, SEI Tax Exempt Trust, Adviser Managed Trust, New Covenant Funds, Schroder Series Trust, Schroder Global Series Trust and SEI Catholic Values Trust. | |||||||
TRUSTEES | ||||||||||||||
George J. Sullivan Jr. One Freedom Valley Drive, Oaks, PA 19456 78 yrs. old | Trustee | | since 1996 | | Retired since January 2012. Self-Employed Consultant, Newfound Consultants Inc. April 1997-December 2011. | 93 | Member of the independent review committee for SEI’s Canadian-registered mutual funds from 2011 to 2017. Director of SEI Alpha Strategy Portfolios, LP from 2007 to 2013. Trustee of SEI Liquid Asset Trust from 1996 to 2016. Trustee/Director of State Street Navigator Securities Lending Trust from 1996 to 2017. Trustee of SEI Insurance Products Trust from 2013 to 2020. Trustee/Director of The Advisors’ Inner Circle Fund, The Advisors’ Inner Circle Fund II, Bishop Street Funds, SEI Structured Credit Fund, LP, SEI Asset Allocation Trust, SEI Daily Income Trust, SEI Institutional Managed Trust, SEI Institutional International Trust, SEI Institutional Investments Trust, SEI Tax Exempt Trust, Adviser Managed Trust, New Covenant Funds, The KP Funds and SEI Catholic Values Trust. | |||||||
| * | Messrs. Nesher and Doran are Trustees who may be deemed as “interested” persons of the Trust as that term is defined in the 1940 Act by virtue of their affiliation with SIMC and the Trust’s Distributor. |
| 1 | Each trustee shall hold office during the lifetime of this Trust until the election and qualification of his or her successor, or until he or she sooner dies, resigns or is removed in accordance with the Trust’s Declaration of Trust |
| 2 | The Fund Complex includes the following Trusts: SEI Asset Allocation Trust, SEI Daily Income Trust, SEI Institutional Investments Trust, Adviser Managed Trust, SEI Institutional International Trust, SEI Institutional Managed Trust, SEI Catholic Values Trust, SEI Tax Exempt Trust and New Covenant Funds. |
| 72 | SEI Asset Allocation Trust / Annual Report / March 31, 2021 |
Name Address, and Age | Position(s) Held with Trusts | Term of Office and Length of Time Served1 | Principal Occupation(s) During Past Five Years | Number of Portfolios in Fund Complex Overseen by Trustee2 | Other Directorships Held by Trustee | |||||
TRUSTEES (continued) | ||||||||||
| Nina Lesavoy One Freedom Valley Drive, Oaks, PA 19456 63 yrs. old | Trustee | since 2003 | Founder and Managing Director, Avec Capital (strategic fundraising firm) since 2008. Managing Director, Cue Capital (strategic fundraising firm) from March 2002-March 2008. | 93 | Director of SEI Alpha Strategy Portfolios, LP from 2007 to 2013. Trustee of SEI Liquid Asset Trust from 2003 to 2016. Trustee of SEI Insurance Products Trust from 2013 to 2020. Trustee/ Director of SEI Structured Credit Fund, L.P., SEI Asset Allocation Trust, SEI Daily Income Trust, SEI Institutional Managed Trust, SEI Institutional International Trust, SEI Institutional Investments Trust, SEI Tax Exempt Trust, New Covenant Funds, Adviser Managed Trust and SEI Catholic Values Trust. | |||||
James M. Williams One Freedom Valley Drive, Oaks, PA 19456 73 yrs. old | Trustee | since 2004 | Vice President and Chief Investment Officer, J. Paul Getty Trust, Non-Profit Foundation for Visual Arts, since December 2002. President, Harbor Capital Advisors and Harbor Mutual Funds, 2000-2002. Manager, Pension Asset Management, Ford Motor Company, 1997-1999. | 93 | Director of SEI Alpha Strategy Portfolios, LP from 2007 to 2013, Trustee of SEI Liquid Asset Trust from 2004 to 2016. Trustee of SEI Insurance Products Trust from 2013 to 2020. Trustee/ Director of Ariel Mutual Funds, SEI Structured Credit Fund, LP, SEI Asset Allocation Trust, SEI Daily Income Trust, SEI Institutional Managed Trust, SEI Institutional International Trust, SEI Institutional Investments Trust, SEI Tax Exempt Trust, New Covenant Funds, Adviser Managed Trust and SEI Catholic Values Trust. | |||||
Mitchell A. Johnson One Freedom Valley Drive, Oaks, PA 19456 79 yrs. old | Trustee | since 2007 | Retired Private Investor since 1994. | 93 | Director, Federal Agricultural Mortgage Corporation (Farmer Mac) since 1997. Director of SEI Alpha Strategy Portfolios, LP from 2007 to 2013. Trustee of SEI Liquid Asset Trust from 2007 to 2016. Trustee of SEI Insurance Products Trust from 2013 to 2020. Trustee of the Advisors’ Inner Circle Fund, The Advisors’ Inner Circle Fund II, Bishop Street Funds, SEI Asset Allocation Trust, SEI Daily Income Trust, SEI Institutional Managed Trust, SEI Institutional International Trust, SEI Institutional Investments Trust, SEI Tax Exempt Trust, Adviser Managed Trust, The KP Funds, New Covenant Funds and SEI Catholic Values Trust. | |||||
Hubert L. Harris, Jr. One Freedom Valley Drive, Oaks, PA 19456 77 yrs. old | Trustee | since 2008 | Retired since December 2005. Owner of Harris Plantation, Inc. since 1995. Chief Executive Officer of Harris CAPM, a consulting asset and property management entity. Chief Executive Officer, INVESCO North America, August 2003-December 2005. Chief Executive Officer and Chair of the Board of Directors, AMVESCAP Retirement, Inc., January 1998- August 2003. | 93 | Director of AMVESCAP PLC from 1993-2004. Served as a director of a bank holding company, 2003-2009. Director, Aaron’s Inc., 2012-present. President and CEO of Oasis Ornamentals LLC since 2011. Member of the Board of Councilors of the Carter Center (nonprofit corporation) and served on the board of other non-profit organizations. Director of SEI Alpha Strategy Portfolios, LP from 2008 to 2013. Trustee of SEI Liquid Asset Trust from 2008 to 2016. Trustee of SEI Insurance Products Trust from 2013 to 2020. Trustee of SEI Asset Allocation Trust, SEI Daily Income Trust, SEI Institutional Managed Trust, SEI Institutional International Trust, SEI Institutional Investments Trust, SEI Tax Exempt Trust, New Covenant Funds, Adviser Managed Trust and SEI Catholic Values Trust. | |||||
Susan C. Cote One Freedom Valley Drive Oaks, PA 19456 66 years old | Trustee | since 2016 | Retired since July 2015. Treasurer and Chair of Finance, Investment and Audit Committee of the New York Women’s Foundation from 2009 to 2017. Americas Director of Asset Management, Ernst & Young LLP from 2006-2013. Global Asset Management Assurance Leader, Ernst & Young LLP from 2006- 2015. Partner Ernst & Young LLP from 1997-2015. Prudential, 1983-1997. Member of the Ernst & Young LLP Retirement Investment Committee. | 93 | Trustee of SEI Insurance Products Trust from 2016 to 2020. Trustee of SEI Structured Credit Fund, LP, SEI Tax Exempt Trust, SEI Daily Income Trust, SEI Institutional International Trust, SEI Institutional Managed Trust, SEI Asset Allocation Trust, SEI Institutional Investments Trust, New Covenant Funds, Adviser Managed Trust and SEI Catholic Values Trust. | |||||
James B. Taylor One Freedom Valley Drive Oaks, PA 19456 70 years old | Trustee | since 2018 | Retired since December 2017. Chief Investment Officer at Georgia Teach Foundation from 2008 to 2017. Chief Investment Officer at Delta Air Lines from 1983 to 2007. Member of the Investment Committee at the Institute of Electrical and Electronic Engineers from 1999 to 2004. President, Vice President and Treasurer at Southern Benefits Conference from 1998 to 2000. | 93 | Trustee of SEI Insurance Products Trust from 2018 to 2020. Trustee of SEI Daily Income Trust, SEI Tax Exempt Trust, SEI Institutional Managed Trust, SEI Institutional International Trust, SEI Institutional Investments Trust, SEI Asset Allocation Trust, Adviser Managed Trust, New Covenant Funds and SEI Catholic Values Trust. | |||||
Christine Reynolds One Freedom Valley Drive Oaks, PA 19456 62 years old | Trustee | since 2019 | Retired since December 2016. Executive Vice President, Fidelity Investments from 2014-2016. President, Fidelity Pricing and Cash Management Services and Chief Financial Officer of Fidelity Funds from 2008-2014. Chief Operating Officer, Fidelity Pricing and Cash Management Services from 2007-2008. President and Treasurer, Fidelity Funds from 2004-2007. Anti-Money Laundering Officer, Fidelity Funds in 2004. Executive Vice President, Fidelity Funds from 2002-2004. Audit Partner, PricewaterhouseCoopers from 1992-2002. | 93 | Trustee of SEI Insurance Products Trust from 2019 to 2020. Trustee of SEI Daily Income Trust, SEI Tax Exempt Trust, SEI Institutional Managed Trust, SEI Institutional International Trust, SEI Institutional Investments Trust, SEI Asset Allocation Trust, Adviser Managed Trust, New Covenant Funds and SEI Catholic Values Trust. | |||||
| 1 | Each trustee shall hold office during the lifetime of this Trust until the election and qualification of his or her successor, or until he or she sooner dies, resigns or is removed in accordance with the Trust’s Declaration of Trust. |
| 2 | The Fund Complex includes the following Trusts: SEI Asset Allocation Trust, SEI Daily Income Trust, SEI Institutional Investments Trust, Adviser Managed Trust, SEI Institutional International Trust, SEI Institutional Managed Trust, SEI Catholic Values Trust, SEI Tax Exempt Trust and New Covenant Funds. |
| SEI Asset Allocation Trust / Annual Report / March 31, 2021 | 73 |
TRUSTEES AND OFFICERS OF THE TRUST (Unaudited) (Concluded)
Name Address, and Age | Position(s) Held with Trusts | Term of Office and Length of Time Served1 | Principal Occupation(s) During Past Five Years | Number of Fund Complex by Trustee2 | Other Directorships Held by Trustee | |||||||||
OFFICERS | ||||||||||||||
Robert A. Nesher One Freedom Valley Drive, Oaks, PA 19456 74 yrs. Old | | President and CEO | | | since 2005 | | Currently performs various services on behalf of SEI for which Mr. Nesher is compensated. | N/A | N/A | |||||
Peter A. Rodriguez One Freedom Valley Drive Oaks, PA 19456 59 yrs. old | | Controller and Chief Financial Officer | | | since 2020 | | Director, Fund Accounting, SEI Investments Global Funds Services since April 2020 and previously from March 2011 to March 2015; Director, Financial Reporting from June 2017 to March 2020. Director, Centralized Operations from March 2015 to June 2017. | N/A | N/A | |||||
Glenn R. Kurdziel One Freedom Valley Drive Oaks, PA 19456 47 yrs. old | | Assistant Controller | | | since 2017 | | Assistant Controller, Funds Accounting, SEI Investments Global Funds Services (March 2017); Senior Manager, Funds Accounting, SEI Investments Global Funds Services since 2005. | N/A | N/A | |||||
Russell Emery One Freedom Valley Drive Oaks, PA 19456 58 yrs. old | | Chief Compliance Officer | | | since 2006 | | Chief Compliance Officer of SEI Daily Income Trust, SEI Institutional Investments Trust, SEI Institutional Managed Trust, SEI Asset Allocation Trust, SEI Institutional International Trust, SEI Tax Exempt Trust, The Advisors’ Inner Circle Fund, The Advisors’ Inner Circle Fund II and Bishop Street Funds since March 2006. Chief Compliance Officer of SEI Liquid Asset Trust from 2006 to 2016. Chief Compliance Officer of SEI Structured Credit Fund, LP since June 2007. Chief Compliance Officer of Adviser Managed Trust since December 2010. Chief Compliance Officer of SEI Alpha Strategy Portfolios, LP from 2007 to 2013. Chief Compliance Officer of New Covenant Funds since February 2012. Chief Compliance Officer of SEI Insurance Products Trust from 2013 to 2020. Chief Compliance Officer of The KP Funds from 2013 to 2020. Chief Compliance Officer of O’Connor EQUUS from 2014 to 2016. Chief Compliance Officer of The Advisors’ Inner Circle Fund III since 2014. Chief Compliance Officer of Winton Series Trust from 2014 to 2017. Chief Compliance Officer of Winton Diversified Opportunities Fund from 2014 to 2018. Chief Compliance Officer of SEI Catholic Values Trust and Gallery Trust since 2015. Chief Compliance Officer of Schroder Series Trust and Schroder Global Series Trust since 2017. | N/A | N/A | |||||
Timothy D Barto One Freedom Valley Drive Oaks, PA 19456 53 yrs. old | | Vice President and Secretary | | | since 2002 | | Vice President and Secretary of SEI Institutional Transfer Agent, Inc. since 2009. General Counsel and Secretary of SIMC and the Administrator since 2004. Vice President of SIMC and the Administrator since 1999. Vice President and Assistant Secretary of SEI since 2001. | N/A | N/A | |||||
Aaron Buser One Freedom Valley Drive, Oaks, PA 19456 50 yrs. old | | Vice President and Assistant Secretary | | | since 2008 | | Vice President and Assistant Secretary of SEI Institutional Transfer Agent, Inc. since 2009. Vice President and Assistant Secretary of SIMC since 2007. Attorney Stark & Stark (law firm), March 2004-July 2007. | N/A | N/A | |||||
David F. McCann One Freedom Valley Drive, Oaks, PA 19456 45 yrs. old | | Vice President and Assistant Secretary | | | since 2009 | | Vice President and Assistant Secretary of SEI Institutional Transfer Agent, Inc. since 2009. Vice President and Assistant Secretary of SIMC since 2008. Attorney, Drinker Biddle & Reath, LLP (law firm), May 2005 - October 2008. | N/A | N/A | |||||
Stephen G. MacRae One Freedom Valley Drive, Oaks, PA 19456 53 yrs. old | | Vice President | | | since 2012 | | Director of Global Investment Product Management since January 2004. | N/A | N/A | |||||
Bridget E. Sudall One Freedom Valley Drive Oaks, PA 19456 40 yrs. old | | Anti-Money Laundering Compliance Officer and Privacy Officer | | | since 2015 | | Anti-Money Laundering Compliance Officer and Privacy Officer (since 2015), Senior Associate and AML Officer, Morgan Stanley Alternative Investment Partners, April 2011-March 2015, Investor Services Team Lead, Morgan Stanley Alternative Investment Partners, July 2007-April 2011. | N/A | N/A | |||||
| 1 | Each trustee shall hold office during the lifetime of this Trust until the election and qualification of his or her successor, or until he or she sooner dies, resigns or is removed in accordance with the Trust’s Declaration of Trust. |
| 2 | The Fund Complex includes the following Trusts: SEI Asset Allocation Trust, SEI Daily Income Trust, SEI Institutional Investments Trust, Adviser Managed Trust, SEI Institutional International Trust, SEI Institutional Managed Trust, SEI Catholic Values Trust, SEI Tax Exempt Trust, and New Covenant Funds. |
| 74 | SEI Asset Allocation Trust / Annual Report / March 31, 2021 |
DISCLOSURE OF FUND EXPENSES (Unaudited)
March 31, 2021
All mutual funds have operating expenses. As a shareholder of a fund, your investment is affected by these ongoing costs, which include (among others) costs for portfolio management, administrative services, and shareholder reports like this one. It is important for you to understand the impact of these costs on your investment returns.
Operating expenses such as these are deducted from the fund’s gross income and directly reduce your final investment return. These expenses are expressed as a percentage of the fund’s average net assets; this percentage is known as the fund’s expense ratio.
The following examples use the expense ratio and are intended to help you understand the ongoing costs (in dollars) of investing in your fund and to compare these costs with those of other mutual funds. The examples are based on an investment of $1,000 made at the beginning of the period shown and held for the entire period from October 1, 2020 to March 31, 2021.
The table on this page illustrates your fund’s costs in two ways:
• Actual fund return. This section helps you to estimate the actual expenses after fee waivers that your Fund incurred over the period. The “Expenses Paid During Period” column shows the actual dollar expense cost incurred by a $1,000 investment in the Fund, and the “Ending Account Value” number is derived from deducting that expense cost from the Fund’s gross investment return.
You can use this information, together with the actual amount you invested in the Fund, to estimate the expenses you paid over that period. Simply divide your actual account value by $1,000 to arrive at a ratio (for example, an $8,600 account value divided by $1,000 = 8.6), then multiply that ratio by the number shown for your Fund under “Expenses Paid During Period.”
• Hypothetical 5% return. This section helps you compare your Fund’s costs with those of other mutual funds. It assumes that the fund had an annual 5% return before expenses during the year, but that the expense ratio (Column 3) for the period is unchanged. This example is useful in making comparisons because the Securities and Exchange Commission requires all mutual funds to make this 5% calculation. You can assess your Fund’s comparative cost by comparing the hypothetical result for your Fund in the “Expenses Paid During Period” column with those that appear in the same charts in the shareholder reports for other funds.
NOTE: Because the return is set at 5% for comparison purposes — NOT your Fund’s actual return — the account values shown may not apply to your specific investment.
| Beginning Account Value 10/1/20 | Ending Account Value 3/31/21 | Annualized Expense Ratios | Expenses Paid During Period* | |||||||||||||
Defensive Strategy Fund |
| |||||||||||||||
Actual Fund Return | ||||||||||||||||
Class F | $1,000.00 | $1,020.60 | 0.21 | % | $1.06 | |||||||||||
Class I | 1,000.00 | 1,019.80 | 0.46 | 2.27 | ||||||||||||
Hypothetical 5% Return | ||||||||||||||||
Class F | $1,000.00 | $1,023.88 | 0.21 | % | $1.06 | |||||||||||
Class I | 1,000.00 | 1,022.69 | 0.46 | 2.27 | ||||||||||||
Defensive Strategy Allocation Fund |
| |||||||||||||||
Actual Fund Return |
| |||||||||||||||
Class F | $1,000.00 | $1,021.90 | 0.35 | % | $1.76 | |||||||||||
Hypothetical 5% Return | ||||||||||||||||
Class F | $1,000.00 | $1,023.19 | 0.35 | % | $1.77 | |||||||||||
| ||||||||||||||||
| Beginning Account Value 10/1/20 | Ending Account Value 3/31/21 | Annualized Expense Ratios | Expenses Paid During Period* | |||||||||||||
Conservative Strategy Fund |
| |||||||||||||||
Actual Fund Return | ||||||||||||||||
Class F | $1,000.00 | $1,036.60 | 0.26 | % | $1.32 | |||||||||||
Class D | 1,000.00 | 1,032.00 | 1.01 | 5.12 | ||||||||||||
Class I | 1,000.00 | 1,034.90 | 0.51 | 2.59 | ||||||||||||
Hypothetical 5% Return | ||||||||||||||||
Class F | $1,000.00 | $1,023.64 | 0.26 | % | $1.31 | |||||||||||
Class D | 1,000.00 | 1,019.90 | 1.01 | 5.09 | ||||||||||||
Class I | 1,000.00 | 1,022.39 | 0.51 | 2.57 | ||||||||||||
Conservative Strategy Allocation Fund |
| |||||||||||||||
Actual Fund Return | ||||||||||||||||
Class F | $1,000.00 | $1,124.50 | 0.35 | % | $1.85 | |||||||||||
Hypothetical 5% Return | ||||||||||||||||
Class F | $1,000.00 | $1,023.19 | 0.35 | % | $1.77 | |||||||||||
| SEI Asset Allocation Trust / Annual Report / March 31, 2021 | 75 |
DISCLOSURE OF FUND EXPENSES (Unaudited) (Concluded)
March 31, 2021
Beginning Account Value 10/1/20 | Ending Account Value 3/31/21 | Annualized Expense Ratios | Expenses Paid During Period* | |||||||||||||
Moderate Strategy Fund |
| |||||||||||||||
Actual Fund Return | ||||||||||||||||
Class F | $1,000.00 | $1,057.70 | 0.31 | % | $1.59 | |||||||||||
Class D | 1,000.00 | 1,054.10 | 1.06 | 5.43 | ||||||||||||
Class I | 1,000.00 | 1,056.40 | 0.56 | 2.87 | ||||||||||||
Hypothetical 5% Return | ||||||||||||||||
Class F | $1,000.00 | $1,023.39 | 0.31 | % | $1.56 | |||||||||||
Class D | 1,000.00 | 1,019.65 | 1.06 | 5.34 | ||||||||||||
Class I | 1,000.00 | 1,022.14 | 0.56 | 2.82 | ||||||||||||
Moderate Strategy Allocation Fund |
| |||||||||||||||
Actual Fund Return | ||||||||||||||||
Class F | $1,000.00 | $1,143.70 | 0.35 | % | $1.87 | |||||||||||
Hypothetical 5% Return | ||||||||||||||||
Class F | $1,000.00 | $1,023.19 | 0.35 | % | $1.77 | |||||||||||
Aggressive Strategy Fund |
| |||||||||||||||
Actual Fund Return | ||||||||||||||||
Class F | $1,000.00 | $1,173.10 | 0.35 | % | $1.90 | |||||||||||
Class D | 1,000.00 | 1,169.70 | 1.10 | 5.95 | ||||||||||||
Class I | 1,000.00 | 1,172.20 | 0.60 | 3.25 | ||||||||||||
Hypothetical 5% Return | ||||||||||||||||
Class F | $1,000.00 | $1,023.19 | 0.35 | % | $1.77 | |||||||||||
Class D | 1,000.00 | 1,019.45 | 1.10 | 5.54 | ||||||||||||
Class I | 1,000.00 | 1,021.94 | 0.60 | 3.02 | ||||||||||||
Tax-Managed Aggressive Strategy Fund |
| |||||||||||||||
Actual Fund Return | ||||||||||||||||
Class F | $1,000.00 | $1,234.40 | 0.35 | % | $1.95 | |||||||||||
Hypothetical 5% Return | ||||||||||||||||
Class F | $1,000.00 | $1,023.19 | 0.35 | % | $1.77 | |||||||||||
Core Market Strategy Fund |
| |||||||||||||||
Actual Fund Return |
| |||||||||||||||
Class F | $1,000.00 | $1,098.60 | 0.35 | % | $1.83 | |||||||||||
Class I | 1,000.00 | 1,099.20 | —^ | —^ | ||||||||||||
Hypothetical 5% Return | ||||||||||||||||
Class F | $1,000.00 | $1,023.19 | 0.35 | % | $1.77 | |||||||||||
Class I | 1,000.00 | 1,022.74 | —^ | —^ | ||||||||||||
Core Market Strategy Allocation Fund |
| |||||||||||||||
Actual Fund Return | ||||||||||||||||
Class F | $1,000.00 | $1,234.00 | 0.35 | % | $1.95 | |||||||||||
Hypothetical 5% Return | ||||||||||||||||
Class F | $1,000.00 | $1,023.19 | 0.35 | % | $1.77 | |||||||||||
Market Growth Strategy Fund |
| |||||||||||||||
Actual Fund Return | ||||||||||||||||
Class F | $1,000.00 | $1,128.40 | 0.35 | % | $1.86 | |||||||||||
Class D | 1,000.00 | 1,123.80 | 1.10 | 5.82 | ||||||||||||
Class I | 1,000.00 | 1,126.80 | 0.60 | 3.18 | ||||||||||||
Hypothetical 5% Return |
| |||||||||||||||
Class F | $1,000.00 | $1,023.19 | 0.35 | % | $1.77 | |||||||||||
Class D | 1,000.00 | 1,019.45 | 1.10 | 5.54 | ||||||||||||
Class I | 1,000.00 | 1,021.94 | 0.60 | 3.02 | ||||||||||||
Beginning Account Value 10/1/20 | Ending Account Value 3/31/21 | Annualized Expense Ratios | Expenses Paid During Period* | |||||||||||||
Market Growth Strategy Allocation Fund |
| |||||||||||||||
Actual Fund Return | ||||||||||||||||
Class F | $1,000.00 | $1,233.90 | 0.35 | % | $1.95 | |||||||||||
Hypothetical 5% Return |
| |||||||||||||||
Class F | $1,000.00 | $1,023.19 | 0.35 | % | $1.77 | |||||||||||
| * | Expenses are equal to the Fund’s annualized expense ratio multiplied by the average account value over the period, multiplied by 182/365 (to reflect the one-half year period shown). |
| ^ | The class I is expected to run at the expense limit of 0.60% when assets increase. |
| 76 | SEI Asset Allocation Trust / Annual Report / March 31, 2021 |
BOARD OF TRUSTEES’ CONSIDERATIONS IN APPROVING THE ADVISORY AND SUB-ADVISORY AGREEMENTS (Unaudited)
SEI Asset Allocation Trust (the “Trust”) and SEI Investments Management Corporation (“SIMC”) have entered into an investment advisory agreement (the “Advisory Agreement”), pursuant to which SIMC provides investment advisory services to the series of the Trust (the “Funds”), which are primarily invested in affiliated underlying funds. The management and affairs of the Trust are supervised by the Board of Trustees (each member, a “Trustee” and, collectively, the “Trustees” or the “Board”).
The Investment Company Act of 1940, as amended (the “1940 Act”), requires that the initial approval of a Fund’s Advisory Agreement be specifically approved by the vote of a majority of the outstanding shareholders of the Funds and the vote of a majority of the Trustees who are not parties to the Advisory Agreement or “interested persons” of any party (the “Independent Trustees”) cast in person (or otherwise, as consistent with applicable laws, regulations and related guidance and relief) at a meeting called for such purpose. In addition, the 1940 Act requires that the continuation or renewal of the Advisory Agreement be approved at least annually (after an initial period of up to two years), which also requires the vote of a majority of the Board, including a majority of the Independent Trustees. In connection with their consideration of the initial approval and such renewals, the Funds’ Trustees must request and evaluate, and SIMC is required to furnish, such information as may be reasonably necessary to evaluate the terms of the Advisory Agreement. In addition, the Securities and Exchange Commission takes the position that, as part of their fiduciary duties with respect to a mutual fund’s fees, mutual fund boards are required to evaluate the material factors applicable to a decision to approve an investment advisory agreement.
Consistent with these responsibilities, the Board calls and holds meetings each year to consider whether to approve the existing Advisory Agreement between the Trust and SIMC with respect to the Funds of the Trust. In preparation for these meetings, the Board requests and reviews a wide variety of materials provided by SIMC, including information about SIMC’s affiliates, personnel and operations and the services provided pursuant to the Advisory Agreement. The Board also receives data from third parties. This information is provided in addition to the detailed information about the Funds that the Board reviews during the course of each year, including information that relates to Fund operations and Fund performance. The Trustees also receive a memorandum from counsel regarding the responsibilities of Trustees in connection with their consideration of whether to approve the Trust’s Advisory Agreement. Finally, the Independent Trustees receive advice from independent counsel to the Independent Trustees, meet in executive sessions outside the presence of Fund management and participate in question and answer sessions with representatives of SIMC.
Specifically, during the course of the Trust’s fiscal year, the Board requested and received written materials from SIMC regarding: (i) the quality of SIMC’s investment management and other services; (ii) SIMC’s investment management personnel; (iii) SIMC’s operations and financial condition; (iv) SIMC’s brokerage practices (including any soft dollar arrangements) and investment strategies; (v) the level of the advisory fees that SIMC charges the Funds compared with fees each charge to comparable accounts; (vi) the advisory fees charged by SIMC and the Funds’ overall fees and operating expenses compared with peer groups of mutual funds prepared by Broadridge, an independent provider of investment company data; (vii) the level of SIMC’s profitability from its Fund-related operations; (viii) SIMC’s compliance program, including a description of material compliance matters and material compliance violations; (ix) SIMC’s potential economies of scale; (x) SIMC’s policies on and compliance procedures for personal securities transactions; (xi) SIMC’s expertise and resources in domestic and/or international financial markets; and (xii) the Funds’ performance over various periods of time compared with peer groups of mutual funds prepared by Broadridge and the Funds’ benchmark indexes.
At the March 22-24, 2021 meeting of the Board, the Trustees, including a majority of the Independent Trustees, approved the renewal of the Advisory Agreement. The Board’s renewal was based on its consideration and evaluation of the factors described above, as discussed at the meeting and at prior meetings. The following discusses some, but not all, of the factors that were considered by the Board in connection with its assessment of the Advisory Agreement.
Nature, Extent and Quality of Services. The Board considered the nature, extent and quality of the services provided by SIMC to the Funds and the resources of SIMC and its affiliates dedicated to the Funds. In this regard, the Trustees evaluated, among other things, SIMC’s personnel, experience, track record and compliance program. Following evaluation, the Board concluded that, within the context of its full deliberations, the nature, extent and quality of services provided by SIMC to the Funds and the resources of SIMC and its affiliates dedicated to the Funds were sufficient to support the renewal of the Advisory Agreement. In addition to advisory services, the Board
| SEI Asset Allocation Trust / Annual Report / March 31, 2021 | 77 |
BOARD OF TRUSTEES’ CONSIDERATIONS IN APPROVING THE ADVISORY AND SUB-ADVISORY AGREEMENTS (Unaudited) (Concluded)
considered the nature and quality of certain administrative, transfer agency and other non-investment advisory services provided to the Funds by SIMC and/or its affiliates.
Performance. In determining whether to renew SIMC’s Advisory Agreement, the Trustees considered the Funds’ performance relative to their peer groups and appropriate indexes/benchmarks. The Trustees reviewed performance information for each Fund, noting that they receive performance reports that permit them to monitor each Fund’s performance at board meetings throughout the year. As part of this review, the Trustees considered the composition of each peer group and selection criteria. In assessing Fund performance, the Trustees considered a report compiled by Broadridge, an independent third-party that was engaged to prepare an assessment of the Funds in connection with the renewal of the Advisory Agreement (the “Broadridge Report”). The Broadridge Report included metrics on risk analysis, volatility versus total return, net total return and performance consistency for the Funds and a universe of comparable funds. Based on the materials considered and discussed at the meeting, the Trustees found Fund performance satisfactory, or, where performance was materially below the benchmark and/or peer group, the Trustees were satisfied with the reasons provided to explain such performance. Following evaluation, the Board concluded that, within the context of its full deliberations, the performance of the Funds was sufficient to support renewal of SIMC’s Advisory Agreement.
Fees. With respect to the Funds’ expenses under the Advisory Agreement, the Trustees considered the rate of compensation called for by the Advisory Agreement and the Funds’ net operating expense ratios in comparison to those of the Funds’ respective peer groups. In assessing Fund expenses, the Trustees considered the information in the Broadridge Report, which included various metrics related to fund expenses, including, but not limited to, contractual management fees at various asset levels, actual management fees (including transfer agent expenses), and actual total expenses (including underlying fund expenses) for the Funds and a universe of comparable funds. Based on the materials considered and discussion at the meeting, the Trustees further determined that fees were either shown to be below the peer average in the comparative fee analysis, or that there was a reasonable basis for the fee level. The Trustees also considered the effects of SIMC’s and its affiliates’ voluntary waivers of management and other fees to prevent total Fund operating expenses from exceeding any applicable cap and concluded that SIMC, through waivers, has maintained the Funds’ net operating expenses at competitive levels for its distribution channels. In determining the appropriateness of fees, the Board also took into consideration the impact of fees incurred indirectly by the Funds as a result of investments into underlying funds, including funds from which SIMC or its affiliates earn fees. The Board also took into consideration compensation earned from the Funds by SIMC or its affiliates for non-advisory services, such as administration, transfer agency, shareholder services or brokerage, and considered whether SIMC and its affiliates may have realized other benefits from their relationship with the Funds, such as any research and brokerage services received under soft dollar arrangements. Following evaluation, the Board concluded that, within the context of its full deliberations, the expenses of the Funds are reasonable and supported renewal of the Advisory Agreement.
Profitability. With regard to profitability, the Trustees considered compensation flowing to SIMC and its affiliates, directly or indirectly. The Trustees considered whether the levels of compensation and profitability were reasonable. Based on this evaluation, the Board concluded that, within the context of its full deliberations, the profitability of SIMC is reasonable and supported renewal of the Advisory Agreement.
Economies of Scale. With respect to the Advisory Agreement, the Trustees considered whether any economies of scale were being realized by SIMC and its affiliates and, if so, whether the benefits of such economies of scale were passed along to the Funds’ shareholders through a graduated investment advisory fee schedule or other means, including any fee waivers by SIMC and its affiliates. The Trustees recognized that economies of scale are difficult to identify and quantify and are rarely identifiable on a fund-by-fund basis. Based on this evaluation, the Board determined that the fees were reasonable in light of the information that was provided by SIMC with respect to economies of scale.
Based on the Trustees’ deliberation and their evaluation of the information described above, the Board, including all of the Independent Trustees, with the assistance of Fund counsel and Independent Trustees’ counsel, unanimously approved the renewal of the Advisory Agreement and concluded that the compensation under the Advisory Agreement is fair and reasonable in light of such services and expenses and such other matters as the Trustees considered to be relevant in the exercise of their reasonable judgment. In the course of its deliberations, the Board did not identify any particular factor (or conclusion with respect thereto) or single piece of information that was all-
| 78 | SEI Asset Allocation Trust / Annual Report / March 31, 2021 |
important, controlling or determinative of its decision, but considered all of the factors together, and each Trustee may have attributed different weights to the various factors (and conclusions with respect thereto) and information.
REVIEW OF LIQUIDITY RISK MANAGEMENT PROGRAM
Pursuant to Rule 22e-4 under the 1940 Act, the Trust, on behalf of the Funds, has adopted a liquidity risk management program (the “Program”) to govern the Trust’s approach to managing liquidity risk. The Program is overseen by the SIMC Liquidity Risk Oversight Committee, and the Program’s principal objectives include assessing, managing and periodically reviewing each Fund’s liquidity risk, based on factors specific to the circumstances of the Fund.
At a meeting of the Board held on March 23, 2021, the Trustees received a report from the SIMC Liquidity Risk Oversight Committee addressing the operations of the Program and assessing its adequacy and effectiveness of implementation. The SIMC Liquidity Risk Oversight Committee determined, and reported to the Board, that the Program is reasonably designed to assess and manage each Fund’s liquidity risk and has operated adequately and effectively to manage each Fund’s liquidity risk since the Program was implemented on December 1, 2018. The SIMC Liquidity Risk Oversight Committee reported that during the period covered by the report, there were no liquidity events that impacted the Funds or their ability to timely meet redemptions without dilution to existing shareholders. The SIMC Liquidity Risk Oversight Committee further noted that no material changes have been made to the Program since its implementation.
There can be no assurance that the Program will achieve its objectives in the future. Please refer to the prospectus for more information regarding a Fund’s exposure to liquidity risk and other principal risks to which an investment in the Funds may be subject.
| SEI Asset Allocation Trust / Annual Report / March 31, 2021 | 79 |
NOTICE TO SHAREHOLDERS (Unaudited)
For shareholders that do not have a March 31, 2021 taxable year end, this notice is for informational purposes only. For shareholders with a March 31, 2021 year end, please consult your tax advisor as to the pertinence of this notice. For the fiscal year ended March 31, 2021, the funds of the SEI Asset Allocation Trust are designating the following items with regard to distributions paid during the year:
| Fund | (A) Return of Capital | (B) Long-Term Capital Gains Distributions (Tax Basis) | (C) Ordinary | Total Distributions (Tax Basis) | Corporate Dividends Received Deduction (1) | |||||
Defensive Strategy Fund | 0.00% | 0.00% | 100.00% | 100.00% | 9.53% | |||||
Defensive Strategy Allocation Fund | 1.07% | 0.00% | 98.93% | 100.00% | 6.88% | |||||
Conservative Strategy Fund | 0.00% | 22.05% | 77.95% | 100.00% | 21.33% | |||||
Conservative Strategy Allocation Fund | 0.00% | 0.00% | 100.00% | 100.00% | 27.04% | |||||
Moderate Strategy Fund | 0.00% | 32.29% | 67.71% | 100.00% | 19.61% | |||||
Moderate Strategy Allocation Fund | 0.00% | 64.56% | 35.44% | 100.00% | 54.97% | |||||
Aggressive Strategy Fund | 0.00% | 58.67% | 41.33% | 100.00% | 26.98% | |||||
Tax-Managed Aggressive Strategy Fund | 0.00% | 67.28% | 32.72% | 100.00% | 60.65% | |||||
Core Market Strategy Fund | 0.00% | 43.97% | 56.03% | 100.00% | 0.67% | |||||
Core Market Strategy Allocation Fund | 0.00% | 76.89% | 23.11% | 100.00% | 61.34% | |||||
Market Growth Strategy Fund | 0.00% | 47.92% | 52.08% | 100.00% | 19.37% | |||||
Market Growth Strategy Allocation Fund | 0.00% | 74.38% | 25.62% | 100.00% | 61.53% |
| Fund | Qualifying Dividend Income (2) | U.S. Government Interest (3) | Interest Related Dividends (4) | Short-Term Capital Gains Distribution (5) | Qualifying Business Income (6) | |||||
Defensive Strategy Fund | 10.49% | 8.24% | 27.56% | 0.00% | 0.00% | |||||
Defensive Strategy Allocation Fund | 6.88% | 0.00% | 10.66% | 0.00% | 0.00% | |||||
Conservative Strategy Fund | 23.01% | 4.33% | 20.50% | 100.00% | 0.25% | |||||
Conservative Strategy Allocation Fund | 27.04% | 0.17% | 5.13% | 0.00% | 0.00% | |||||
Moderate Strategy Fund | 22.32% | 4.32% | 17.62% | 0.00% | 0.00% | |||||
Moderate Strategy Allocation Fund | 57.06% | 0.16% | 2.88% | 0.00% | 0.00% | |||||
Aggressive Strategy Fund | 46.69% | 0.33% | 2.25% | 100.00% | 1.00% | |||||
Tax-Managed Aggressive Strategy Fund | 77.35% | 0.00% | 0.84% | 100.00% | 0.00% | |||||
Core Market Strategy Fund | 1.16% | 1.29% | 4.09% | 0.00% | 0.00% | |||||
Core Market Strategy Allocation Fund | 77.40% | 0.00% | 0.06% | 0.00% | 0.00% | |||||
Market Growth Strategy Fund | 30.69% | 4.62% | 10.27% | 0.00% | 0.98% | |||||
Market Growth Strategy Allocation Fund | 77.88% | 0.00% | 0.37% | 0.00% | 0.00% |
Items (A), (B) and (C) are based on the percentage of the Funds total distribution.
| (1) | The percentage in this column represents dividends which qualify for the Corporate “Dividends Received Deduction,” and is reflected as a percentage of ordinary income distributions (the total of short-term capital gain and net investment income distributions). |
| (2) | The percentage in this column represents the amount of “Qualifying Dividend Income” and is reflected as a perecentage of ordinary income distributions (the total of short-term capital gain and net investment income distrubtions). It is the intention of the Fund to designate the maximum amount permitted by the Law. |
| (3) | “U.S. Government Interest” represents the amount of interest that was derived from direct U.S Government obligations and distributed during the fiscal year. This amount is reflected as a percentage of total ordinary income distributions (the total of short-term capital gain and net investment income distributions). Generally, interest from direct U.S. Government obligations is exempt from state income tax. However, for shareholders of these funds who are residents of California, Connecticut, and New York, the statutory threshold requirements were not met. |
| 80 | SEI Asset Allocation Trust / Annual Report / March 31, 2021 |
| (4) | The percentage in this column represents the amount of “Interest Related Dividend” is reflected as a percentage of ordinary income distribution. Interest related dividends is exempted from U.S. withholding tax when paid to foreign investors. |
| (5) | The percentage in this column represents the amount of short term capital gain distribution that is exempted from U.S. withholding tax when paid to foreign investors. |
| (6) | The percentage in this column represents that amount of ordinary dividend income that qualifed for 20% Business Income Deduction. |
| SEI Asset Allocation Trust / Annual Report / March 31, 2021 | 81 |
(This page intentionally left blank)
(This page intentionally left blank)
(This page intentionally left blank)
SEI ASSET ALLOCATION TRUST ANNUAL REPORT March 31, 2021
Robert A. Nesher, Chairman
Trustees
William M. Doran
George J. Sullivan, Jr.
Nina Lesavoy
James M. Williams
Mitchell A. Johnson
Hubert L. Harris, Jr.
Susan C. Cote
James B. Taylor
Christine Reynolds
Officers
Robert A. Nesher
President and Chief Executive Officer
Peter A. Rodriguez
Controller and Chief Financial Officer
Glenn R. Kurdziel
Assistant Controller
Russell Emery
Chief Compliance Officer
Timothy D. Barto
Vice President, Secretary
Aaron Buser
Vice President, Assistant Secretary
David F. McCann
Vice President, Assistant Secretary
Stephen G. MacRae
Vice President
Bridget E. Sudall
Anti-Money Laundering Compliance Officer
Privacy Officer
Investment Adviser
SEI Investments Management Corporation
Administrator
SEI Investments Global Funds Services
Distributor
SEI Investments Distribution Co.
Legal Counsel
Morgan, Lewis & Bockius LLP
Independent Registered Public Accounting Firm
KPMG LLP
This report and the financial statements contained herein are submitted for the general information of the shareholders of the Trust and must be preceded or accompanied by a current prospectus. Shares of the Funds are not deposits or obligations of, or guaranteed or endorsed by, any bank. The shares are not federally insured by the Federal Deposit Insurance Corporation (FDIC), the Federal Reserve Board, or any other government agency. Investment in the shares involves risk, including the possible loss of principal.
For more information call
1 800 DIAL SEI
(1 800 342 5734)

1 Freedom Valley Drive, P.O. Box 1100, Oaks, PA 19456
SEI-F-121 (3/21)
Item 2. Code of Ethics.
The Registrant has adopted a code of ethics that applies to the Registrant’s principal executive officer, principal financial officer, principal accounting officer or controller, or persons performing similar functions.
| Item 3. Audit | Committee Financial Expert. |
(a) (1) The Registrant’s Board of Trustees has determined that the Registrant has three audit committee financial experts serving on the audit committee.
(a) (2) The audit committee financial experts are Susan C. Cote, George J. Sullivan, Jr. and Hubert L. Harris, Jr. Ms. Cote and Messrs. Sullivan and Harris are independent as defined in Form N-CSR Item 3 (a) (2).
Item 4. Principal Accountant Fees and Services.
Fees billed by KPMG LLP (“KPMG”) related to the Registrant.
KPMG billed the Registrant aggregate fees for services rendered to the Registrant for the fiscal years 2021 and 2020 as follows:
Fiscal Year 2021
| Fiscal Year 2020
| |||||||||||||
All fees and approved | All fees and service approved | All other fees affiliates that | All fees and approved | All fees and service approved | All other fees
| |||||||||
| (a) | Audit Fees(1)
| $130,910 | $0 | N/A | $129,910 | $0 | N/A | |||||||
| (b) | Audit-Related Fees | $0 | $0 | $0 | $0 | $0 | $0 | |||||||
| (c) | Tax Fees
| $0 | $0 | $0 | $0 | $0 | $0 | |||||||
(d) | All Other Fees(2) | $0 | $402,250 | $0 | $0 | $412,463 | $0 | |||||||
Notes:
| (1) | Audit fees include amounts related to the audit of the Registrant’s annual financial statements and services normally provided by the accountant in connection with statutory and regulatory filings. |
| (2) | See Item 4(g) for a description of the services comprising the fees disclosed in this category. |
(e)(1) The Registrant’s Audit Committee has adopted and the Board of Trustees has ratified an Audit and Non-Audit Services Pre-Approval Policy (the “Policy”), which sets forth the procedures and the conditions pursuant to which services proposed to be performed by the independent auditor of the Registrant may be pre-approved. In any instance where services require pre-approval, the Audit Committee will consider whether such services are consistent with SEC’s rules on auditor independence and whether the provision of such services would compromise the auditor’s independence.
The Policy provides that all requests or applications for proposed services to be provided by the independent auditor must be submitted to the Registrant’s Chief Financial Officer (“CFO”) and must include a detailed description of the services proposed to be rendered. The CFO will determine whether such services: (1) require specific pre-approval; (2) are included within the list of services that have received the general pre-approval of the Audit Committee pursuant to the Policy; or (3) have been previously pre-approved in connection with the independent auditor’s annual engagement letter for the applicable year or otherwise.
Requests or applications to provide services that require specific pre-approval by the Audit Committee will be submitted to the Audit Committee by the CFO. The Audit Committee has delegated specific pre-approval authority to either the Audit Committee Chair or financial experts, provided that the estimated fee for any such proposed pre-approved service does not exceed $100,000 and any pre-approval decisions are reported to the Audit Committee at its next regularly scheduled meeting.
Services that have received the general pre-approval of the Audit Committee are identified and described in the Policy. In addition, the Policy sets forth a maximum fee per engagement with respect to each identified service that has received general pre-approval. The Audit Committee will annually review and pre-approve the services that may be provided by the independent auditor during the following twelve months without obtaining specific pre-approval from the Audit Committee.
The Audit Committee will be informed by the CFO on a quarterly basis of all services rendered by the independent auditor.
All services to be provided by the independent auditor shall be provided pursuant to a signed written engagement letter with the Registrant, the investment advisor or applicable control affiliate (except that matters as to which an engagement letter would be impractical because of timing issues or because the matter is small may not be the subject of an engagement letter) that sets forth both the services to be provided by the independent auditor and the total fees (or the manner of their determination) to be paid to the independent auditor for those services.
In addition, the Audit Committee has determined to take additional measures on an annual basis to meet its responsibility to oversee the work of the independent auditor and to assure the auditor’s independence from the Registrant, such as reviewing a formal written statement from the independent auditor delineating all relationships between the independent auditor and the Registrant, and discussing with the independent auditor its methods and procedures for ensuring independence.
(e)(2) Percentage of fees billed applicable to non-audit services pursuant to waiver of pre-approval requirement were as follows:
| Fiscal 2021 | Fiscal 2021 | |||
Audit-Related Fees | 0% | 0% |
Tax Fees | 0% | 0% | ||
All Other Fees | 0% | 0% |
(f) Not Applicable.
(g)(1) The aggregate non-audit fees and services billed by KPMG for the fiscal years 2021 and 2020 were $402,250 and $412,463, respectively. Non-audit fees consist of SSAE No. 16 review of fund accounting and administration operations and an attestation report in accordance with Rule 17 Ad-13.
(h) During the past fiscal year, Registrant’s principal accountant provided certain non-audit services to Registrant’s investment adviser or to entities controlling, controlled by, or under common control with Registrant’s investment adviser that provide ongoing services to Registrant that were not subject to pre-approval pursuant to paragraph (c)(7)(ii) of Rule 2-01 of Regulation S-X. The Audit Committee of Registrant’s Board of Trustees reviewed and considered these non-audit services provided by Registrant’s principal accountant to Registrant’s affiliates, including whether the provision of these non-audit services is compatible with maintaining the principal accountant’s independence.
Item 5. Audit Committee of Listed Registrants.
Not applicable.
Item 6. Schedule of Investments.
The Schedule of Investments in securities of unaffiliated issuers as of the close of the reporting period for the Defensive Strategy Fund, Defensive Strategy Allocation Fund, Conservative Strategy Fund, Conservative Strategy Allocation Fund, Moderate Strategy Fund, Moderate Strategy Allocation Fund, Aggressive Strategy Fund, Tax-Managed Aggressive Strategy Fund, Core Market Strategy Fund, Core Market Strategy Allocation Fund, Market Growth Strategy Fund, and Market Growth Strategy Allocation Fund are included as part of the report to shareholders filed under Item 1 of this form.
Item 7. Disclosure of Proxy Voting Policies and Procedures for Closed-End Management Investment Companies.
Not applicable.
Item 8. Portfolio Managers of Closed-End Management Investment Companies.
Not applicable.
Item 9. Purchases of Equity Securities by Closed-End Management Company and Affiliated Purchasers.
Not applicable.
Item 10. Submission of Matters to a Vote of Security Holders.
There have been no material changes to the procedures by which shareholders may recommend nominees to the Registrant’s Board of Trustees (the “Board”). The Registrant has a standing Governance Committee (the “Committee”) currently consisting of the independent trustees. The Committee is responsible for evaluating and recommending nominees for election to the Board. Pursuant to the Committee’s Charter, adopted on June 18, 2004, as amended, the Committee will review all shareholder recommendations for nominations to fill vacancies on the Board if such recommendations are submitted in writing and addressed to the Committee at the Registrant’s office.
Item 11. Controls and Procedures.
(a) The Registrant’s principal executive and principal financial officers, or persons performing similar functions, have concluded that the Registrant’s disclosure controls and procedures (as defined in Rule 30a-3(c) under the Investment Company Act of 1940 (the “1940 Act”) are effective based on the evaluation of these controls and procedures required by Rule 30a-3(b) under the 1940 Act and Rules 13a-15(b) or 15d-15(b) under the Securities Exchange Act of 1934 as of a date within 90 days of the filing date of this report.
(b) There were no changes in the Registrant’s internal control over financial reporting (as defined in Rule 30a-3(d) under the 1940 Act that occurred during the period covered by this report that have materially affected, or are reasonably likely to materially affect, the Registrant’s internal control over financial reporting.
Item 12. Disclosure of Securities Lending Activities for Closed-End Management Investment Companies.
Not applicable.
Item 13. Exhibits.
(a)(1) Code of Ethics attached hereto.
SIGNATURES
Pursuant to the requirements of the Securities Exchange Act of 1934 and the Investment Company Act of 1940, the Registrant has duly caused this report to be signed on its behalf by the undersigned, thereunto duly authorized.
| SEI Asset Allocation Trust | ||||
| By | /s/ Robert A. Nesher | |||
| Robert A. Nesher, President & CEO | ||||
| Date: | June 8, 2021 | |||
Pursuant to the requirements of the Securities Exchange Act of 1934 and the Investment Company Act of 1940, this report has been signed below by the following persons on behalf of the Registrant and in the capacities and on the dates indicated.
| By | /s/ Robert A. Nesher | |||
| Robert A. Nesher, President & CEO | ||||
| Date: | June 8, 2021 | |||
| By | /s/ Peter A. Rodriguez | |||
| Peter A. Rodriguez, Controller & CFO | ||||
| Date: | June 8, 2021 | |||