UNITED STATES SECURITIES AND EXCHANGE COMMISSION
WASHINGTON, D.C. 20549
FORM N-CSR
CERTIFIED SHAREHOLDER REPORT OF REGISTERED MANAGEMENT
INVESTMENT COMPANIES
Investment Company Act file number 811-09134
Manor Investment Funds Inc
(Exact name of registrant as specified in charter)
15 Chester Commons, Malvern, PA 19355
(Address of principal executive offices)
Daniel A. Morris
15 Chester Commons, Malvern, PA 19355
(Name and address of agent for service)
Registrant s telephone number, including area code: 610-722-0900
Date of fiscal year end: December 31
Date of reporting period: June 30, 2024
Form N-CSR is to be used by management investment companies to file reports with the Commission not later than 10 days after the transmission to stockholders of any report that is required to be transmitted to stockholders under Rule 30e-1 under the Investment Company Act of 1940 (17 CFR 270-30e-1). The Commission may use the information provided on Form N-CSR in its regulatory, disclosure review, inspection and policymaking roles.
A registrant is required to disclose the information specified by Form N-CSR, and the Commission will make this information public. A registrant is not required to respond to the collection of information contained in Form N-CSR unless the Form displays a currently valid Office of Management and Budget (OMB) control number. Please direct comments concerning the accuracy of the information collection burden estimate and any suggestions for reducing the burden to Secretary, Securities and Exchange Commission, 450 Fifth Street, NW, Washington, DC 20549-0609. The OMB has reviewed this collection if information under the clearance requirement of 44 U.S.C. 3507.
Item 1. Reports to Stockholders.

SEMI-ANNUAL SHAREHOLDER REPORT
June 30, 2024 (Unaudited)
MANOR FUND
MNRMX
ADDITIONAL INFORMATION
This semi-annual shareholder report contains important information about the Manor Fund - MNRMX for the period January 1, 2024 to June 30, 2024, as well as certain changes to the fund. You can find additional information about the fund at www.manorfunds.com. You can also request this information by contacting us at 1-800-787-3334.
expense Information
What were the Fund costs for the past six months?
(based on a hypothetical $10,000 investment)
| Fund Name | Costs of a $10,000 investment | Costs paid as a percentage of a $10,000 investment* |
| | | |
| Manor Fund | $69 | 1.25% |
*Annualized.
Performance graph
TOTAL RETURNS FOR THE PERIOD ENDED JUNE 30, 2024
| | ONE YEAR | FIVE YEARS | TEN YEARS |
| Manor Fund | 22.24% | 12.10% | 7.87% |
| Lipper Large Cap Core Index | 21.97% | 13.07% | 11.30% |
| S&P 500 | 24.56% | 15.03% | 12.85% |
Hypothetical Cumulative Performance Comparison of $10,000 Investment For the Past Ten Years
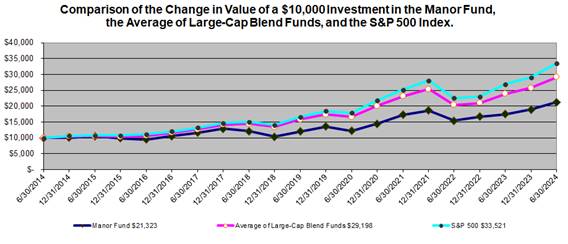
Past performance is not a good predictor of future performance. The returns shown do not reflect taxes that a shareholder would pay on Fund distributions or on the redemption of Fund shares. Updated performance data current to the most recent month-end can be obtained by calling 1-800-787-3334.
Fund statistics
NET ASSETS:
$9.3 MILLION
_________________________
PORTFOLIO HOLDINGS:
29
_________________________
PORTFOLIO TURNOVER:
5.77%
________________________
ADVISORY FEES PAID BY FUND:
$32,880
top ten holdings
| 1. | Applied Materials, Inc. | 9.25% |
| 2. | Microsoft Corp. | 6.61% |
| 3. | Avery Dennison Corp. | 5.28% |
| 4. | Elevance Health, Inc. | 4.69% |
| 5. | Valero Energy Corp. | 4.39% |
| 6. | Microchip Technology, Inc. | 4.21% |
| 7. | Apollo Global Management, Inc. Class A | 3.98% |
| 8. | JP Morgan Chase & Co. | 3.81% |
| 9. | Booking Holdings, Inc. | 3.75% |
| 10. | Devon Energy Corp. | 3.47% |
| | Total % of Net Assets | 49.44% |
PORTFOLIO ILLUSTRATION
The following chart gives a visual breakdown of the Fund by the industry sectors the underlying securities represent as a percentage of the portfolio of investments. Below Sectors are categorized using Morningstar® classifications.

How has the fund changed
As of April 26, 2024, the Fund changed their custodian from U.S. Bank N.A. to Huntington National Bank to perform all custodian services for the Fund.
Householding
To reduce Fund expenses, only one copy of most shareholder documents may be mailed to shareholders with multiple accounts at the same address (Householding). If you would prefer that your Manor Fund documents not be householded, please contact Manor Fund at 1-800-787-3334, or contact your financial intermediary. Your instructions will typically be effective within 30 days of receipt by Manor Fund or your financial intermediary.
For additional information about the Fund; including its prospectus, financial information, holdings and proxy information, visit www.manorfunds.com or contact us at 1-800-787-3334.
| Manor Fund Line Graph | Avg. Large | |
| | Manor Fund | Cap Blend | S&P 500 |
| 6/30/2014 | 10000 | 10000 | 10000 |
| 12/31/2014 | 10099 | 10469 | 10611 |
| 6/30/2015 | 10515 | 10545 | 10742 |
| 12/31/2015 | 9874 | 10396 | 10758 |
| 6/30/2016 | 9524 | 10702 | 11171 |
| 12/31/2016 | 10562 | 11670 | 12045 |
| 6/30/2017 | 11621 | 12708 | 13170 |
| 12/31/2017 | 12851 | 14205 | 14674 |
| 6/30/2018 | 12144 | 14468 | 15063 |
| 12/31/2018 | 10339 | 13475 | 14031 |
| 6/30/2019 | 12047 | 15779 | 16632 |
| 12/31/2019 | 13609 | 17356 | 18449 |
| 6/30/2020 | 12179 | 16557 | 17881 |
| 12/31/2020 | 14418 | 20150 | 21843 |
| 6/30/2021 | 17266 | 23155 | 25175 |
| 12/31/2021 | 18672 | 25397 | 28114 |
| 6/30/2022 | 15423 | 20404 | 22502 |
| 12/31/2022 | 16677 | 21016 | 23022 |
| 6/30/2023 | 17443 | 23939 | 26912 |
| 12/31/2023 | 18974 | 25795 | 29074 |
| 6/30/2024 | 21323 | 29198 | 33520 |
| Manor Fund Pie Chart | |
| | |
| Communication Services | 6.65% |
| Consumer Cyclical | 15.22% |
| Consumer Defensive | 4.13% |
| Energy | 7.86% |
| Financial Services | 12.04% |
| Healthcare | 11.31% |
| Industrials | 5.80% |
| Money Market Fund | 1.32% |
| Real Estate Investment | 3.11% |
| Technology | 31.87% |
| Utilities | 0.69% |
SEMI-ANNUAL SHAREHOLDER REPORT
June 30, 2024 (Unaudited)
MANOR GROWTH FUND
MNRGX
ADDITIONAL INFORMATION
This semi-annual shareholder report contains important information about the Manor Growth Fund - MNRGX for the period January 1, 2024 to June 30, 2024, as well as certain changes to the fund. You can find additional information about the fund at www.manorfunds.com. You can also request this information by contacting us at 1-800-787-3334.
expense Information
What were the Fund costs for the past six months?
(based on a hypothetical $10,000 investment)
| Fund Name | Costs of a $10,000 investment | Costs paid as a percentage of a $10,000 investment* |
| | | |
| Manor Growth Fund | $55 | 0.99% |
*Annualized
Performance graph
TOTAL RETURNS FOR THE PERIOD ENDED JUNE 30, 2024
| | ONE YEAR | FIVE YEARS | TEN YEARS |
| Manor Growth Fund | 21.11% | 15.41% | 12.05% |
| Lipper Large Cap Growth Index | 29.34% | 15.74% | 14.09% |
| S&P 500 | 24.56% | 15.03% | 12.85% |
Hypothetical Cumulative Performance Comparison of $10,000 Investment For the Past Ten Years

Past performance is not a good predictor of future performance. The returns shown do not reflect taxes that a shareholder would pay on Fund distributions or on the redemption of Fund shares. Updated performance data current to the most recent month-end can be obtained by calling 1-800-787-3334.
Fund statistics
NET ASSETS:
$16.2 MILLION
_________________________
PORTFOLIO HOLDINGS:
27
_________________________
PORTFOLIO TURNOVER:
3.90%
________________________
ADVISORY FEES PAID BY FUND:
$56,988
top ten holdings
| 1. | Apple, Inc. | 12.15% |
| 2. | Eli Lilly & Co. | 7.38% |
| 3. | Microsoft Corp. | 6.26% |
| 4. | Amazon.com, Inc. | 5.99% |
| 5. | United Rentals, Inc. | 5.94% |
| 6. | Apollo Global Management, Inc. Class A | 3.99% |
| 7. | Qualcomm, Inc. | 3.81% |
| 8. | Alphabet, Inc. Class C | 3.67% |
| 9. | Alphabet, Inc. Class A | 3.64% |
| 10. | Unitedhealth Group, Inc. | 3.55% |
| | Total % of Net Assets | 56.38% |
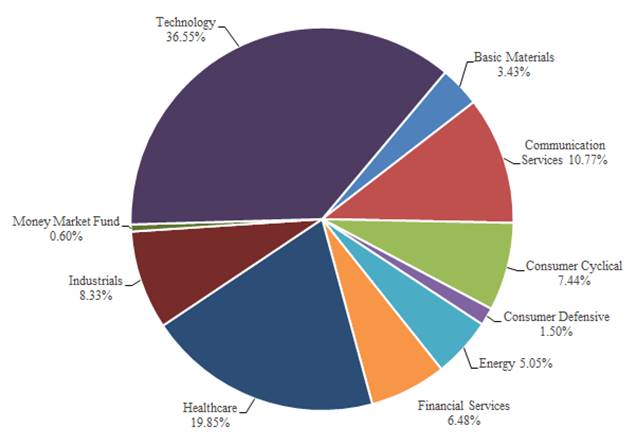
PORTFOLIO ILLUSTRATION
The following chart gives a visual breakdown of the Fund by the industry sectors the underlying securities represent as a percentage of the portfolio of investments. Below Sectors are categorized using Morningstar® classifications.
How has the fund changed
As of April 26, 2024, the Fund changed their custodian from U.S. Bank N.A. to Huntington National Bank to perform all custodian services for the Fund.
Householding
To reduce Fund expenses, only one copy of most shareholder documents may be mailed to shareholders with multiple accounts at the same address (Householding). If you would prefer that your Manor Growth Fund documents not be householded, please contact Manor Growth Fund at 1-800-787-3334, or contact your financial intermediary. Your instructions will typically be effective within 30 days of receipt by Manor Growth Fund or your financial intermediary.
For additional information about the Fund; including its prospectus, financial information, holdings and proxy information, visit www.manorfunds.com or contact us at 1-800-787-3334.
| Manor Growth Line Graph | Avg. Large | |
| | Growth Fund | Cap Growth | S&P500 |
| 6/30/2014 | 10000 | 10000 | 10000 |
| 12/31/2014 | 10668 | 10613 | 10611 |
| 6/30/2015 | 10780 | 11079 | 10742 |
| 12/31/2015 | 10653 | 11213 | 10758 |
| 6/30/2016 | 10505 | 10777 | 11171 |
| 12/31/2016 | 11131 | 11267 | 12045 |
| 6/30/2017 | 12371 | 13223 | 13170 |
| 12/31/2017 | 13933 | 14829 | 14674 |
| 6/30/2018 | 14237 | 16179 | 15063 |
| 12/31/2018 | 13029 | 14772 | 14031 |
| 6/30/2019 | 15232 | 17977 | 16632 |
| 12/31/2019 | 17037 | 19705 | 18449 |
| 6/30/2020 | 17628 | 21853 | 17881 |
| 12/31/2020 | 21578 | 27311 | 21843 |
| 6/30/2021 | 24070 | 31014 | 25175 |
| 12/31/2021 | 27598 | 33418 | 28114 |
| 6/30/2022 | 22812 | 23082 | 22502 |
| 12/31/2022 | 22803 | 23082 | 23022 |
| 6/30/2023 | 25755 | 28922 | 26912 |
| 12/31/2023 | 27996 | 31758 | 29074 |
| 6/30/2024 | 31193 | 37408 | 33520 |
| Growth Fund Pie Chart | |
| | |
| Basic Materials | 3.43% |
| Communications | 10.77% |
| Consumer Cyclical | 7.44% |
| Consumer Defensive | 1.50% |
| Energy | 5.05% |
| Financial Services | 6.48% |
| Healthcare | 19.85% |
| Industrials | 8.33% |
| Money Market Fund | 0.60% |
| Technology | 36.55% |
SEMI-ANNUAL SHAREHOLDER REPORT
June 30, 2024 (Unaudited)
MANOR BOND FUND
MNRBX
ADDITIONAL INFORMATION
This semi-annual shareholder report contains important information about the Manor Bond Fund - MNRBX for the period January 1, 2024 to June 30, 2024, as well as certain changes to the fund. You can find additional information about the fund at www.manorfunds.com. You can also request this information by contacting us at 1-800-787-3334.
expense Information
What were the Fund costs for the past six months?
(based on a hypothetical $10,000 investment)
| Fund Name | Costs of a $10,000 investment | Costs paid as a percentage of a $10,000 investment* |
| | | |
| Manor Bond Fund | $48 | 0.95% |
*Annualized
Performance graph
TOTAL RETURNS FOR THE PERIOD ENDED JUNE 30, 2024
| | ONE YEAR | FIVE YEARS | TEN YEARS |
| Manor Bond Fund | 2.49% | -0.29% | 0.10% |
| Lipper US Government Index | 1.72% | -0.63% | 0.80% |
| Bloomberg Barclays Intermediate Treasury Index | 3.37% | 0.28% | 1.11% |
Hypothetical Cumulative Performance Comparison of $10,000 Investment For the Past Ten Years

Past performance is not a good predictor of future performance. The returns shown do not reflect taxes that a shareholder would pay on Fund distributions or on the redemption of Fund shares. Updated performance data current to the most recent month-end can be obtained by calling 1-800-787-3334.
Fund statistics
NET ASSETS:
$1.8 MILLION
_________________________
PORTFOLIO HOLDINGS:
7
_________________________
PORTFOLIO TURNOVER:
0.00%
________________________
ADVISORY FEES PAID BY FUND:
$4,406
top SEVEN holdings
| 1. | US Treasury Note 4.125% Due 11/15/2032 | 36.29% |
| 2. | US Treasury Note 0.50% Due 02/28/2026 | 21.12% |
| 3. | US Treasury Note 1.75% Due 11/15/2029 | 16.20% |
| 4. | US Treasury Note, Series C, 0.625% Due 05/15/2030 | 8.03% |
| 5. | US Treasury Note 1.50% Due 08/15/2026 | 7.96% |
| 6. | US Treasury Note 2.875% Due 05/15/2028 | 5.36% |
| 7. | Goldman Sachs Financial Square Treasury Instruments Fund - Institutional Class | 4.77% |
| | Total % of Net Assets | 99.73% |
PORTFOLIO ILLUSTRATION
The following chart gives a visual breakdown of the Fund by the industry sectors the underlying securities represent as a percentage of the portfolio of investments. Below Sectors are categorized based on asset type.
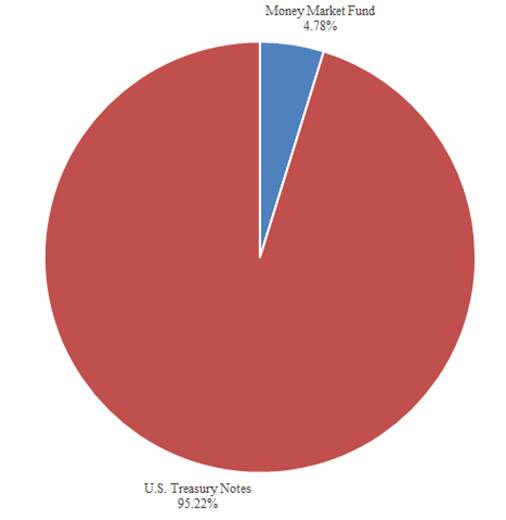
| Bond Fund Pie Chart | |
| | |
| Money Market Fund | 4.78% |
| US Treasury Notes | 95.22% |
How has the fund changed
As of April 26, 2024, the Fund changed their custodian from U.S. Bank N.A. to Huntington National Bank to perform all custodian services for the Fund.
Householding
To reduce Fund expenses, only one copy of most shareholder documents may be mailed to shareholders with multiple accounts at the same address (Householding). If you would prefer that your Manor Bond Fund documents not be householded, please contact Manor Bond Fund at 1-800-787-3334, or contact your financial intermediary. Your instructions will typically be effective within 30 days of receipt by Manor Bond Fund or your financial intermediary.
For additional information about the Fund; including its prospectus, financial information, holdings and proxy information, visit www.manorfunds.com or contact us at 1-800-787-3334.
| Manor Bond Line Graph | | BBG |
| | Bond Fund | U.S. Govt | Barclays |
| 6/30/2014 | 10000 | 10000 | 10000 |
| 12/31/2014 | 9988 | 10219 | 10098 |
| 6/30/2015 | 10026 | 10257 | 10180 |
| 12/31/2015 | 9983 | 10260 | 10218 |
| 6/30/2016 | 10137 | 10688 | 10591 |
| 12/31/2016 | 9858 | 10404 | 10326 |
| 6/30/2017 | 9887 | 10557 | 10451 |
| 12/31/2017 | 9847 | 10605 | 10443 |
| 6/30/2018 | 9751 | 10523 | 10371 |
| 12/31/2018 | 9913 | 10695 | 10591 |
| 6/30/2019 | 10253 | 11176 | 11013 |
| 12/31/2019 | 10332 | 11326 | 11144 |
| 6/30/2020 | 11029 | 12085 | 11792 |
| 12/31/2020 | 10940 | 12107 | 11788 |
| 6/30/2021 | 10713 | 11905 | 11653 |
| 12/31/2021 | 10619 | 11880 | 11585 |
| 6/30/2022 | 9981 | 10890 | 10913 |
| 12/31/2022 | 9768 | 10493 | 10684 |
| 6/30/2023 | 9858 | 10647 | 10802 |
| 12/31/2023 | 10174 | 10927 | 11142 |
| 6/30/2024 | 10103 | 10830 | 11166 |
ITEM 2. CODE OF ETHICS
The Registrant, as of the end of the period covered by this report, has adopted a code of ethics that applies to the Registrant’s principal executive officer, principal financial officer, principal account officer or controller, or persons performing similar functions. The registrant has not made any amendments to its code of ethics during the covered period. The registrant has not granted any waivers from any provisions of the code of ethics during the covered period.
ITEM 3. AUDIT COMMITTEE FINANCIAL EXPERT.
The Registrant’s audit committee consists of two independent directors, Chaired by John McGinn. The Board of Directors has determined that the Registrant has at least three financial experts serving on its Board. Mr. Daniel Morris, Mr. John Giles, and Mr. Fred Myers are the Board’s financial experts. Mr. Morris and Mr. Giles are “interested” directors, and Mr. Myers is an “independent” director.
ITEM 4. PRINCIPAL ACCOUNTANT FEES AND SERVICES.
The registrant has engaged its principal accountant to perform audit services. “Audit services” refer to performing an audit of the registrant’s annual financial statements or services that are normally provided by the accountant in connection with statutory and regulatory filings or engagements for those fiscal years. “Audit related services” refer to the assurance and related services by the principal accountant that are reasonably related to the performance of the audit. “Tax Services” refer to professional services rendered by the principal accountant for tax compliance, tax advice, and tax planning. The following table details the aggregate fees billed for each of the last two fiscal years for audit fees, audit-related fees, tax fees and other fees by the principal accountant.
Each year, the registrant’s Board of Directors recommend a principal accountant to perform audit services for the registrant. At the registrant’s Annual Meeting, the shareholders vote to approve or disapprove the principal accountant recommended by the Board.
ITEM 5. AUDIT-COMMITTEE OF LISTED REGISTRANTS.
Not applicable to open-end investment companies.
ITEM 6. SCHEDULE OF INVESTMENTS.
Schedule of Investments is included as part of the report filed under Item 7 of this form.
ITEM 7. FINANCIAL STATEMENTS AND FINANCIAL HIGHLIGHTS FOR OPEN-END MANAGEMENT COMPANIES.

Manor Fund (MNRMX)
Manor Growth Fund (MNRGX)
Manor Bond Fund (MNRBX)
Semi-Annual Report
June 30, 2024
(Unaudited)
Fund Office:
15 Chester Commons
Malvern, PA 19355
610-722-0900 800-787-3334
www.manorfunds.com
Managed by:
Smithbridge Asset Management, Inc.
Distributed by:
Foreside Funds Services, LLC
Performance quoted represents past performance and is no guarantee of future results. Current performance may be lower or higher than what is stated. Investment return and principal value will vary with market conditions so that an investor’s share, when redeemed, may be worth more or less than the original cost. Call us at 800-787-3334 for current and most recent month-end performance.
Manor Investment Funds
Manor Fund
SCHEDULE OF INVESTMENTS
JUNE 30, 2024 (UNAUDITED)
| Shares | | | Fair Value |
| | | | |
| COMMON STOCKS - 95.66% | |
| | | | |
| Beverages - 2.44% | |
| 1,376 | | PepsiCo, Inc. | $ 226,944 |
| | | | |
| Cogeneration Services & Small Power Producers - 0.69% | |
| 3,674 | | The AES Corp. | 64,552 |
| | | | |
| Computer Peripheral Equipment - 3.45% | |
| 945 | | Palo Alto Networks, Inc. * | 320,364 |
| | | | |
| Computer Storage Devices - 2.72% | |
| 1,961 | | NetApp, Inc. | 252,577 |
| | | | |
| Converted Paper & Paperboard Products (No Container/Boxes) - 5.28% | |
| 2,244 | | Avery Dennison Corp. | 490,651 |
| | | | |
| Crude Petroleum & Natural Gas - 3.47% | |
| 6,811 | | Devon Energy Corp. | 322,841 |
| | | | |
| Engines & Turbines - 3.47% | |
| 1,164 | | Cummins, Inc. | 322,346 |
| | | | |
| Hospital & Medical Service Plans - 4.69% | |
| 805 | | Elevance Health, Inc. | 436,197 |
| | | | |
| Investment Advice - 3.98% | |
| 3,136 | | Apollo Global Management, Inc. Class A | 370,268 |
| | | | |
| Life Insurance - 1.78% | |
| 2,358 | | Metlife, Inc. | 165,508 |
| | | | |
| National Commercial Banks - 6.29% | |
| 1,751 | | JP Morgan Chase & Co. | 354,157 |
| 1,479 | | PNC Financial Services Group, Inc. | 229,955 |
| | | | 584,112 |
| Operative Builders - 3.38% | |
| 2,226 | | D.R. Horton, Inc. | 313,710 |
| | | | |
| Petroleum Refining - 4.39% | |
| 2,603 | | Valero Energy Corp. | 408,046 |
| | | | |
| Pharmaceutical Preparations - 3.45% | |
| 1,871 | | AbbVie, Inc. | 320,914 |
| | | | |
| Retail-Grocery Stores - 1.69% | |
| 3,144 | | The Kroger Co. | 156,980 |
| | | | |
| Retail-Lumber & Other Building Materials Dealers - 2.83% | |
| 1,192 | | Lowes Cos., Inc. | $ 262,788 |
| | | | |
| Search, Detection, Navigation, Guidance, Aeronautical & Nautical Systems & Instruments - 2.34% | |
| 498 | | Northrop Grumman Corp. | 217,103 |
| | | | |
| Semiconductors & Related Devices - 19.12% | |
| 3,645 | | Applied Materials, Inc. | 860,184 |
| 4,272 | | Microchip Technology, Inc. | 390,888 |
| 2,400 | | NVIDIA Corp. | 296,496 |
| 2,155 | | Skyworks Solutions, Inc. | 229,680 |
| | | | 1,777,248 |
| Services-Computer Programming, Data Processing, Etc. - 3.25% | |
| 1,658 | | Alphabet, Inc. Class A | 302,005 |
| | | | |
| Services-Prepackaged Software - 6.61% | |
| 1,375 | | Microsoft Corp. | 614,556 |
| | | | |
| Services-Video Tape Rental - 3.41% | |
| 469 | | Netflix, Inc. * | 316,519 |
| | | | |
| Transportation Services - 3.75% | |
| 88 | | Booking Holdings, Inc. | 348,612 |
| | | | |
| Wholesale - Drugs, Proprietaries & Druggists' Sundries - 3.18% | |
| 1,310 | | Cencora, Inc. | 295,143 |
| | | | |
| TOTAL FOR COMMON STOCKS (Cost $3,622,698) - 95.66% | 8,889,984 |
| | | | |
| REAL ESTATE INVESTMENT TRUST - 3.11% | |
| 382 | | Equinix, Inc. | 289,021 |
| TOTAL FOR REAL ESTATE INVESTMENT TRUST (Cost $142,184) - 3.11% | 289,021 |
| | | | |
| MONEY MARKET FUND - 1.32% | |
| 122,743 | | Federated Hermes Government Obligations Fund - Institutional Class 5.18% ** (Cost $122,743) | 122,743 |
| | | | |
| TOTAL INVESTMENTS (Cost $3,887,625) - 100.09% | 9,301,748 |
| | | | |
| LIABILITIES IN EXCESS OF OTHER ASSETS, NET - (0.09)% | (7,930) |
| | | | |
| NET ASSETS - 100.00% | $9,293,818 |
* Non-income producing securities during the period.
** Variable rate security; the coupon rate shown represents the yield at June 30, 2024.
The accompanying notes are an integral part of these financial statements
Manor Investment Funds
Manor Growth Fund
SCHEDULE OF INVESTMENTS
JUNE 30, 2024 (UNAUDITED)
| Shares | | | Fair Value |
| | | | |
| COMMON STOCKS - 99.53% | |
| | | | |
| Computer Peripheral Equipment - 3.51% | |
| 1,671 | | Palo Alto Networks, Inc. * | $ 566,486 |
| | | | |
| Crude Petroleum & Natural Gas - 5.06% | |
| 3,128 | | EOG Resources, Inc. | 393,721 |
| 6,717 | | Occidental Petroleum Corp. | 423,372 |
| | | | 817,093 |
| Electronic Computers - 12.15% | |
| 9,317 | | Apple, Inc. | 1,962,347 |
| | | | |
| Hospital & Medical Service Plans - 3.55% | |
| 1,125 | | Unitedhealth Group, Inc. | 572,917 |
| | | | |
| Investment Advice - 3.99% | |
| 5,459 | | Apollo Global Management, Inc. Class A | 644,544 |
| | | | |
| Measuring & Controlling Devices - 3.06% | |
| 894 | | Thermo Fisher Scientific, Inc. | 494,382 |
| | | | |
| Pharmaceutical Preparations - 13.27% | |
| 2,360 | | AbbVie Inc. | 404,787 |
| 1,316 | | Eli Lilly & Co. | 1,191,480 |
| 521 | | Regeneron Pharmaceuticals, Inc. * | 547,587 |
| | | | 2,143,854 |
| Radio & TV Broadcasting & Communuications Equipment - 3.81% | |
| 3,088 | | Qualcomm, Inc. | 615,068 |
| | | | |
| Retail-Building Materials, Hardware, Garden Supply - 3.43% | |
| 1,858 | | The Sherwin-Williams Co. | 554,483 |
| | | | |
| Retail-Catalog & Mail-Order Houses - 5.99% | |
| 5,010 | | Amazon.com, Inc. * | 968,182 |
| | | | |
| Retail-Variety Stores - 1.50% | |
| 2,271 | | Dollar Tree, Inc. * | 242,475 |
| | | | |
| Semiconductors & Related Devices - 5.96% | |
| 4,100 | | NVIDIA Corp. | 506,514 |
| 6,665 | | On Semiconductor Corp. * | 456,886 |
| | | | 963,400 |
| Services-Business Services - 4.32% | |
| 3,258 | | Akamai Technologies, Inc. * | 293,481 |
| 915 | | MasterCard, Inc. Class A | 403,661 |
| | | | 697,142 |
| Services-Computer Programming, Data Processing, Etc. - 7.31% | |
| 3,232 | | Alphabet, Inc. Class A | $ 588,709 |
| | | | |
| 3,231 | | Alphabet, Inc. Class C | 592,630 |
| | | | 1,181,339 |
| Services-Equipment Rental & Leasing - 5.94% | |
| 1,485 | | United Rentals, Inc. | 960,394 |
| | | | |
| Services-Prepackaged Software - 9.36% | |
| 2,262 | | Microsoft Corp. | 1,011,001 |
| 1,946 | | Salesforce.com, Inc. | 500,317 |
| | | | 1,511,318 |
| Services-Video Tape Rental - 3.47% | |
| 831 | | Netflix, Inc. * | 560,825 |
| | | | |
| Trucking (No Local) - 2.40% | |
| 2,101 | | Landstar System, Inc. | 387,592 |
| | | | |
| Wholesale-Motor Vehicles & Motor Vehicle Parts & Supplies - 1.45% | |
| 5,645 | | LKQ Corp. | 234,776 |
| | | | |
| TOTAL FOR COMMON STOCKS (Cost $5,362,631) - 99.53% | 16,078,617 |
| | | | |
| MONEY MARKET FUND - 0.60% | |
| 96,294 | | Federated Hermes Government Obligations Fund - Institutional Class 5.18%** (Cost $96,294) | 96,294 |
| | | | |
| TOTAL INVESTMENTS (Cost $5,458,925) - 100.13% | 16,174,911 |
| | | | |
| LIABILITIES IN EXCESS OF OTHER ASSETS, NET - (0.13)% | (21,068) |
| | | | |
| NET ASSETS - 100.00% | $16,153,843 |
* Non-income producing securities during the period.
** Variable rate security; the coupon rate shown represents the yield at June 30, 2024.
The accompanying notes are an integral part of these financial statements
Manor Investment Funds
Manor Bond Fund
SCHEDULE OF INVESTMENTS
JUNE 30, 2024 (UNAUDITED)
| .Face Amount | Fair Value |
| | | | |
| US TREASURY NOTES - 94.96% | |
| 400,000 | | US Treasury Note 0.50% Due 02/28/2026 | $ 372,484 |
| 150,000 | | US Treasury Note 1.50% Due 08/15/2026 | 140,373 |
| 100,000 | | US Treasury Note 2.875% Due 05/15/2028 | 94,520 |
| 325,000 | | US Treasury Note 1.75% Due 11/15/2029 | 285,657 |
| 175,000 | | US Treasury Note, Series C, 0.625% Due 05/15/2030 | 141,600 |
| 650,000 | | US Treasury Note 4.125% Due 11/15/2032 | 640,123 |
| | | | |
| TOTAL FOR US TREASURY NOTES (Cost $1,782,150) - 94.96% | 1,674,757 |
| | | | |
| MONEY MARKET FUND - 4.77% | |
| | |
| Shares | | | |
| 84,119 | | Goldman Sachs Financial Square Treasury Instruments Fund – Institutional Class 5.16%* (Cost $84,119) | 84,119 |
| | | | |
| TOTAL INVESTMENTS (Cost $1,866,269) - 99.73% | 1,758,876 |
| | | | |
| OTHER ASSETS IN EXCESS OF LIABILITIES, NET - 0.27% | 4,811 |
| | | | |
| NET ASSETS - 100.00% | $ 1,763,687 |
* Variable rate security; the coupon rate shown represents the yield at June 30, 2024.
The accompanying notes are an integral part of these financial statements
Manor Investment Funds
STATEMENTS OF ASSETS AND LIABILITIES
JUNE 30, 2024 (UNAUDITED)
| .Assets: | | Manor Fund | Growth Fund | Bond Fund |
| Investments in Securities, at Value | | | |
| (Cost $3,887,625, $5,458,925, and $1,866,269, respectively) | $ 9,301,748 | $ 16,174,911 | $ 1,758,876 |
| Cash | | 711 | 16 | 83 |
| Receivables: | | | |
| Shareholder Subscriptions | 400 | 400 | 200 |
| Dividends and Interest | 396 | 2,147 | 6,152 |
| Total Assets | 9,303,255 | 16,177,474 | 1,765,311 |
| Liabilities: | | | | |
| Payables: | | | |
| Shareholder Redemptions | - | 10,750 | 250 |
| Due to Advisor | 9,437 | 12,881 | 1,374 |
| Total Liabilities | 9,437 | 23,631 | 1,624 |
| Net Assets | | $ 9,293,818 | $ 16,153,843 | $ 1,763,687 |
| | | | | |
| Net Assets Consist of: | | | |
| Capital Stock | $ 250 | $ 409 | $ 177 |
| Paid In Capital | 3,658,577 | 5,411,674 | 1,870,979 |
| Distributable Earnings (Deficit) | 5,634,991 | 10,741,760 | (107,469) |
Net Assets (10,000,000 shares authorized, $0.001 par value) for 249,658, 408,847, and 177,340 shares outstanding, respectively. | | | |
| $ 9,293,818 | $ 16,153,843 | $ 1,763,687 |
| | | | | |
| Net Asset Value and Offering Price Per Share | $ 37.23 | $ 39.51 | $ 9.95 |
The accompanying notes are an integral part of these financial statements
.
Manor Investment Funds
STATEMENTS OF OPERATIONS
JUNE 30, 2024 (UNAUDITED)
| | | Manor Fund | Growth Fund | Bond Fund |
| Investment Income: | | | |
| Dividends | $ 74,873 | $ 65,485 | $ - |
| Interest | | 3,108 | 5,760 | 24,287 |
| Total Investment Income | 77,981 | 71,245 | 24,287 |
| | | | | |
| Expenses: | | | | |
| Advisory | 32,880 | 56,988 | 4,406 |
| Administrative | 21,920 | 18,236 | 3,966 |
| Total Expenses | 54,800 | 75,224 | 8,372 |
| | | | | |
| Net Investment Income (Loss) | 23,181 | (3,979) | 15,915 |
| | | | | |
| Realized and Unrealized Gain (Loss) on Investments: | | | |
| Net Realized Gain on Investments | 197,687 | 31,880 | - |
Net Change in Unrealized Appreciation (Depreciation) on Investments | 804,259 | 1,634,524 | (28,766) |
| Net Realized and Unrealized Gain (Loss) on Investments | 1,001,946 | 1,666,404 | (28,766) |
| | | | | |
| Net Increase (Decrease) in Net Assets Resulting from Operations | $ 1,025,127 | $ 1,662,425 | $ (12,851) |
The accompanying notes are an integral part of these financial statements
Manor Investment Funds
Manor Fund
STATEMENTS OF CHANGES IN NET ASSETS
| | | (Unaudited) | |
| | | Six Months | |
| | | Ended | Year Ended |
| | | 6/30/2024 | 12/31/2023 |
| Increase in Net Assets From Operations: | | |
| Net Investment Income | $ 23,181 | $ 69,808 |
| Net Realized Gain on Investments | 197,687 | 12,270 |
| Net Change in Unrealized Appreciation on Investments | 804,259 | 932,303 |
| Net Increase in Net Assets Resulting from Operations | 1,025,127 | 1,014,381 |
| | | | |
| Distributions to Shareholders | - | (82,121) |
| | | | |
| Capital Share Transactions: | | |
| Proceeds from Shares Sold | 43,094 | 170,036 |
| Reinvestment of Distributions | - | 82,121 |
| Cost of Shares Redeemed | (62,269) | (460,978) |
| Net Decrease from Capital Shares Transactions | (19,175) | (208,821) |
| | | | |
| Total Increase | 1,005,952 | 723,439 |
| | | | |
| Net Assets | | | |
| Beginning of Period/Year | 8,287,866 | 7,564,427 |
| | | | |
| End of Period/Year | $ 9,293,818 | $ 8,287,866 |
| | | | |
| Capital Share Transactions: | | |
| Shares Sold | 1,216 | 5,650 |
| Shares Issued on Reinvestment of Distributions | - | 2,473 |
| Shares Redeemed | (1,750) | (15,179) |
| Net Decrease in Outstanding Shares of the Fund | (534) | (7,056) |
The accompanying notes are an integral part of these financial statements.
Manor Investment Funds
GROWTH FUND
STATEMENTS OF CHANGES IN NET ASSETS
| | | (Unaudited) | |
| | | Six Months | |
| | | Ended | Year Ended |
| | | 6/30/2024 | 12/31/2023 |
| Increase (Decrease) in Net Assets From Operations: | | |
| Net Investment Income (Loss) | $ (3,979) | $ 31,984 |
| Net Realized Gain on Investments | 31,880 | 390,002 |
| Net Change in Unrealized Appreciation on Investments | 1,634,524 | 2,319,347 |
| Net Increase in Net Assets Resulting from Operations | 1,662,425 | 2,741,333 |
| | | | |
| Distributions to Shareholders | - | (422,135) |
| | | | |
| Capital Share Transactions: | | |
| Proceeds from Shares Sold | 59,834 | 261,693 |
| Reinvestment of Distributions | - | 416,920 |
| Cost of Shares Redeemed | (160,059) | (796,733) |
| Net Decrease from Capital Shares Transactions | (100,225) | (118,120) |
| | | | |
| Total Increase | 1,562,200 | 2,201,078 |
| | | | |
| Net Assets | | | |
| Beginning of Period/Year | 14,591,643 | 12,390,565 |
| | | | |
| End of Period/Year | $16,153,843 | $14,591,643 |
| | | | |
| Capital Share Transactions: | | |
| Shares Sold | 1,636 | 8,087 |
| Shares Issued on Reinvestment of Distributions | - | 11,705 |
| Shares Redeemed | (4,289) | (24,898) |
| Net Decrease in Outstanding Shares of the Fund | (2,653) | (5,106) |
The accompanying notes are an integral part of these financial statements.
Manor Investment Funds
BOND Fund
STATEMENTS OF CHANGES IN NET ASSETS
| | | (Unaudited) | |
| | | Six Months | |
| | | Ended | Year Ended |
| | | 6/30/2024 | 12/31/2023 |
| Increase (Decrease) in Net Assets From Operations: | | |
| Net Investment Income | $ 15,915 | $ 22,080 |
| Net Realized Gain (Loss) on Investments | - | (6,414) |
| Net Change in Unrealized Appreciation (Depreciation) on Investments | (28,766) | 59,485 |
| Net Increase (Decrease) in Net Assets Resulting from Operations | (12,851) | 75,151 |
| | | | |
| Distributions to Shareholders | - | (22,353) |
| | | | |
| Capital Share Transactions: | | |
| Proceeds from Shares Sold | 2,479 | 463,995 |
| Shares Issued on Reinvestment of Distributions | - | 22,353 |
| Cost of Shares Redeemed | (37,323) | (404,888) |
| Net Increase (Decrease) from Capital Share Transactions | (34,844) | 81,460 |
| | | | |
| Total Increase (Decrease) | (47,695) | 134,258 |
| | | | |
| Net Assets | | | |
| Beginning of Period/Year | 1,811,382 | 1,677,124 |
| | | | |
| End of Period/Year | $ 1,763,687 | $ 1,811,382 |
| | | | |
| Capital Share Transactions: | | |
| Shares Sold | 250 | 47,693 |
| Shares Issued on Reinvestment of Distributions | - | 2,233 |
| Shares Redeemed | (3,771) | (41,187) |
| Net Increase (Decrease) in Outstanding Shares of the Fund | (3,521) | 8,739 |
The accompanying notes are an integral part of these financial statements.
Manor Investment Funds
Manor Fund
FINANCIAL HIGHLIGHTS
Selected data for a share outstanding throughout each period/year.
| | | (Unaudited) | | | | | | |
| | | Six Months | | | | | | |
| | | Ended | | Years Ended |
| | | 6/30/2024 | | 12/31/2023 | 12/31/2022 | 12/31/2021 | 12/31/2020 | 12/31/2019 |
| | | | | | | | | |
| Net Asset Value, at Beginning of Period/Year | $ 33.13 | | $ 29.41 | $ 34.48 | $ 27.54 | $ 26.46 | $ 20.33 |
| | | | | | | | | |
| Income From Investment Operations: | | | | | | | |
| Net Investment Income * | 0.09 | | 0.27 | 0.31 | 0.13 | 0.17 | 0.20 |
Net Gain (Loss) on Securities (Realized and Unrealized) | 4.01 | | 3.78 | (4.01) | 8.00 | 1.40 | 6.23 |
| Total from Investment Operations | 4.10 | | 4.05 | (3.70) | 8.13 | 1.57 | 6.43 |
| | | | | | | | | |
| Distributions: | | | | | | | | |
| Net Investment Income | - | | (0.28) | (0.32) | (0.14) | (0.17) | (0.20) |
| Realized Gains | | - | | (0.05) | (1.05) | (1.05) | (0.32) | (0.10) |
| Total from Distributions | - | | (0.33) | (1.37) | (1.19) | (0.49) | (0.30) |
| | | | | | | | | |
| Net Asset Value, at End of Period/Year | $ 37.23 | | $ 33.13 | $ 29.41 | $ 34.48 | $ 27.54 | $ 26.46 |
| | | | | | | | | |
| Total Return ** | | 12.38% | (b) | 13.77% | (10.69)% | 29.50% | 5.95% | 31.63% |
| | | | | | | | | |
| Ratios/Supplemental Data: | | | | | | | |
| Net Assets at End of PeriodYear (Thousands) | $ 9,294 | | $ 8,288 | $ 7,564 | $ 8,873 | $ 7,275 | $ 7,721 |
| Ratio of Expenses to Average Net Assets | 1.25% | (a) | 1.25% | 1.25% | 1.25% | 1.25% | 1.25% |
Ratio of Net Investment Income to Average Net Assets | 0.53% | (a) | 0.89% | 0.99% | 0.41% | 0.66% | 0.85% |
| Portfolio Turnover | 5.77% | (b) | 9.46% | 0.00% | 3.20% | 11.95% | 9.99% |
* Per share net investment income has been determined on the basis of average shares outstanding during the year.
** Total return in the above table represents the rate that the investor would have earned or lost on an investment in the Fund assuming reinvestment of dividends.
(a) Annualized.
(b) Not annualized.
The accompanying notes are an integral part of these financial statements.
Manor Investment Funds
GROWTH Fund
FINANCIAL HIGHLIGHTS
Selected data for a share outstanding throughout each period/year.
| | | (Unaudited) | | | | | | | |
| | | Six Months | | | | | | | |
| | | Ended | | Years Ended |
| | | 6/30/2024 | | 12/31/2023 | 12/31/2022 | 12/31/2021 | 12/31/2020 | | 12/31/2019 |
| | | | | | | | | | |
| Net Asset Value, at Beginning of Period/Year | $ 35.46 | | $ 29.74 | $ 37.94 | $ 31.08 | $ 27.41 | | $ 21.59 |
| | | | | | | | | | |
| Income From Investment Operations: | | | | | | | | |
| Net Investment Income (Loss) * | (0.01) | | 0.08 | 0.04 | (0.08) | - | *** | 0.01 |
Net Gain (Loss) on Securities (Realized and Unrealized) | 4.06 | | 6.70 | (6.65) | 8.77 | 7.29 | | 6.63 |
| Total from Investment Operations | 4.05 | | 6.78 | (6.61) | 8.69 | 7.29 | | 6.64 |
| | | | | | | | | | |
| Distributions: | | | | | | | | | |
| Net Investment Income | - | | (0.08) | (0.04) | - | - | | (0.01) |
| Realized Gains | | - | | (0.98) | (1.55) | (1.83) | (3.62) | | (0.81) |
| Total from Distributions | - | | (1.06) | (1.59) | (1.83) | (3.62) | | (0.82) |
| | | | | | | | | | |
| Net Asset Value, at End of Period/Year | $ 39.51 | | $ 35.46 | $ 29.74 | $ 37.94 | $ 31.08 | | $ 27.41 |
| | | | | | | | | | |
| Total Return ** | | 11.42% | (b) | 22.77% | 17.37)% | 27.90% | 26.65% | | 30.76% |
| | | | | | | | | | |
| Ratios/Supplemental Data: | | | | | | | | |
| Net Assets at End of Period/Year (Thousands) | $16,154 | | $ 14,592 | $ 12,391 | $ 15,388 | $ 13,024 | | $ 11,491 |
| Ratio of Expenses to Average Net Assets | 0.99% | (a) | 0.99% | 0.99% | 0.99% | 0.99% | | 0.99% |
Ratio of Net Investment Income (Loss) to Average Net Assets | (0.05)% | (a) | 0.24% | 0.11% | (0.22)% | 0.00% | | 0.05% |
| Portfolio Turnover | 3.90% | (b) | 12.87% | 6.05% | 6.41% | 16.29% | | 12.49% |
* Per share net investment income (loss) has been determined on the basis of average shares outstanding during the year.
** Total return in the above table represents the rate that the investor would have earned or lost on an investment in the Fund assuming reinvestment of dividends.
*** Less than $0.005 per share.
(a) Annualized.
(b) Not annualized.
The accompanying notes are an integral part of these financial statements.
Manor Investment Funds
BOND Fund
FINANCIAL HIGHLIGHTS
Selected data for a share outstanding throughout each period/year.
| | | (Unaudited) | | | | | | |
| | | Six Months | | | | | | |
| | | Ended | | Years Ended |
| | | 6/30/2024 | | 12/31/2023 | 12/31/2022 | 12/31/2021 | 12/31/2020 | 12/31/2019 |
| | | | | | | | | |
| Net Asset Value, at Beginning of Period/Year | $ 10.02 | | $ 9.74 | $ 10.66 | $ 11.05 | $ 10.53 | $ 10.19 |
| | | | | | | | | |
| Income From Investment Operations: | | | | | | | |
| Net Investment Income * | 0.09 | | 0.14 | 0.06 | 0.07 | 0.10 | 0.10 |
Net Gain (Loss) on Securities (Realized and Unrealized) | (0.16) | | 0.27 | (0.91) | (0.39) | 0.52 | 0.33 |
| Total from Investment Operations | (0.07) | | 0.41 | (0.85) | (0.32) | 0.62 | 0.43 |
| | | | | | | | | |
| Distributions: | | | | | | | | |
| Net Investment Income | - | | (0.13) | (0.07) | (0.07) | (0.10) | (0.09) |
| Total from Distributions | - | | (0.13) | (0.07) | (0.07) | (0.10) | (0.09) |
| | | | | | | | | |
| Net Asset Value, at End of Period/Year | $ 9.95 | | $ 10.02 | $ 9.74 | $ 10.66 | $ 11.05 | $ 10.53 |
| | | | | | | | | |
| Total Return ** | | (0.70)% | (b) | 4.16% | (8.01)% | (2.94)% | 5.89% | 4.23% |
| | | | | | | | | |
| Ratios/Supplemental Data: | | | | | | | |
| Net Assets at End of Period/Year (Thousands) | $ 1,764 | | $ 1,811 | $ 1,677 | $ 1,788 | $ 1,414 | $ 1,335 |
| Ratio of Expenses to Average Net Assets | 0.95% | (a) | 0.95% | 0.95% | 0.95% | 0.95% | 0.95% |
Ratio of Net Investment Income to Average Net Assets | 1.81% | (a) | 1.46% | 0.64% | 0.61% | 0.87% | 0.93% |
| Portfolio Turnover | 0.00% | (b) | 37.00% | 0.00% | 0.00% | 14.48% | 21.04% |
* Per share net investment income has been determined on the basis of average shares outstanding during the year.
** Total return in the above table represents the rate that the investor would have earned or lost on an investment in the Fund assuming reinvestment of dividends.
(a) Annualized.
(b) Not annualized.
The accompanying notes are an integral part of these financial statements
Manor Investment Funds
NOTES TO FINANCIAL STATEMENTS
JUNE 30, 2024 (UNAUDITED)
1. ORGANIZATION AND SIGNIFICANT ACCOUNTING POLICIES
Organization: Manor Investment Funds (the “Trust”) is a Delaware Business Trust, (effective January 1, 2012) comprising of Manor Fund, Growth Fund and Bond Fund (collectively the “Funds”), and is registered under the Investment Company Act of 1940, as amended, as an open-end diversified management investment company. The Trust was originally incorporated in the Commonwealth of Pennsylvania on September 13, 1995 and was dissolved by domestication in Pennsylvania on January 3, 2012. The primary investment objective of each of the Funds follows: Manor Fund – long-term capital appreciation and moderate level of income, investing primarily in common stocks of large U.S. corporations; Growth Fund – long-term capital appreciation, investing primarily in common stocks of large U.S corporations, Bond Fund – current income, investing primarily in U.S. Government obligations.
The following is a summary of the significant accounting policies followed by the Funds in the preparation of their financial statements. The Funds are investment companies and follow the accounting and reporting guidance of Accounting Standards Codification Topic 946 applicable to investment companies.
Security Valuation: All investments in securities are recorded at their estimated fair value, as described in Note 2.
Federal Income Taxes: The Funds make no provision for federal income or excise tax. The Funds intend to qualify each year as “regulated investment companies” (“RIC”) under subchapter M of the Internal Revenue Code of 1986, as amended, by complying with the requirements applicable to RICs and by distributing substantially all of their taxable income. The Funds also intend to distribute sufficient net investment income and net capital gains, if any, so that they will not be subject to excise tax on undistributed income and gains. If the required amount of net investment income or gains is not distributed, the Funds could incur a tax expense. Therefore, no federal income tax or excise provision is required.
The Funds recognize the tax benefits of uncertain tax positions only when the position is more likely than not to be sustained, assuming examination by tax authorities. Management has analyzed the Funds’ tax positions and concluded that no liability for unrecognized tax benefits should be recorded related to uncertain tax positions taken on returns filed for open tax years (2020-2022) or expected to be taken in the Funds’ 2023 tax returns. The Funds identify their major tax jurisdiction as U.S. Federal; however, the Funds are not aware of any tax positions for which it is reasonably possible that the total amounts of unrecognized tax benefits will change materially in the next 12 months.
The Funds recognize interest and penalties, if any, related to unrecognized tax benefits as income tax expense in the Statement of Operations. During the six months ended June 30, 2024, the Funds did not incur any interest or penalties.
Distributions to Shareholders: The Funds intend to distribute to their shareholders substantially all of their net realized capital gains and net investment income, if any, annually. Distributions will be recorded on ex-dividend date.
Security Transactions and Investment Income: The Funds follow industry practice and record security transactions on the trade date. The specific identification method is used for determining gains or losses for financial statements and income tax purposes. Dividend income is recorded on the ex-dividend date and interest income is recorded on an accrual basis. Discounts and premiums are amortized over the useful lives of the respective securities when determined to be material. Withholding taxes on foreign dividends will be provided for in accordance with the Funds’ understanding of the applicable country’s tax rules and rates.
Use of Estimates: The preparation of financial statements in conformity with U.S. generally accepted accounting principles ("GAAP") requires management to make estimates and assumptions that affect the reported amounts of assets and liabilities and disclosure of contingent assets and liabilities at the date of the financial statements and the reported amounts of increases and decreases in net assets from operations during the reporting period. Actual results could differ from those estimates.
2. SECURITIES VALUATIONS
Processes and Structure
The Funds’ Board of Trustees has adopted guidelines for valuing securities including in circumstances in which market quotes are not readily available and has delegated to the Adviser the responsibility for determining fair value prices, subject to review by the Board of Trustees.
Hierarchy of Fair Value Inputs
The Funds utilize various methods to measure the fair value of most of their investments on a recurring basis. GAAP establishes a hierarchy that prioritizes inputs to valuation techniques used to measure fair value. The three levels of inputs are as follows:
| · | Level 1. Unadjusted quoted prices in active markets for identical assets or liabilities that the Funds have the ability to access. |
| · | Level 2. Observable inputs other than quoted prices included in level 1 that are observable for the asset or liability either directly or indirectly. These inputs may include quoted prices for the identical instrument on an inactive market, prices for similar instruments in active markets, interest rates, implied volatilities, credit spreads, yield curves, and market-collaborated inputs. |
| · | Level 3. Unobservable inputs for the asset or liability to the extent that relevant observable inputs are not available, representing the Funds’ own assumptions about the assumptions that a market participant would use in valuing the asset or liability at measurement date, and that would be based on the best information available. |
The availability of observable inputs can vary from security to security and is affected by a wide variety of factors, including, for example, the type of security, whether the security is new and not yet established in the marketplace, the liquidity of markets, and other characteristics particular to the security. To the extent that valuation is based on models or inputs that are less observable or unobservable in the market, the determination of fair value requires more judgment. Accordingly, the degree of judgment exercised in determining fair value is greatest for instruments categorized in level 3.
The inputs used to measure fair value may fall into different levels of the fair value hierarchy. In such cases, for disclosure purposes, the level in the fair value hierarchy within which the fair value measurement falls in its entirety is determined based on the lowest level input that is significant to the fair value measurement in its entirety.
Fair Value Measurements
A description of the valuation techniques applied to the Funds’ major categories of assets and liabilities measured at fair value on a recurring basis follows.
Equity securities (common stocks and real estate investment trusts). Securities traded on a national securities exchange (or reported on the NASDAQ national market) are stated at the last reported sales price on the day of valuation. To the extent these securities are actively traded, and valuation adjustments are not applied, they are categorized in level 1 of the fair value hierarchy. Certain foreign securities may be fair valued using a pricing service that considers the correlation of the trading patterns of the foreign security to the intraday trading in the U.S. markets for investments such as American Depositary Receipts, financial futures, Exchange Traded Funds, and the movement of the certain indexes of securities based on a statistical analysis of the historical relationship and that are categorized in level 2. Preferred stock and other equities traded on inactive markets or valued by reference to similar instruments are also categorized in level 2.
U.S. government securities. U.S. government securities are normally valued using a model that incorporates market observable data, such as reported sales of similar securities, broker quotes, yields, bids, offers, and reference data. Certain securities are valued principally using dealer quotations. U.S. government securities are categorized in level 1 or level 2 of the fair value hierarchy, depending on the inputs used and market activity levels for specific securities.
Short-term investments. Investments in other open-end investment companies, including money market funds, are valued at the investment company's net asset value per share. These securities will be categorized Level 1 of the fair value hierarchy.
The following table summarizes the inputs used to value each Fund’s assets measured at fair value as of June 30, 2024:
| Manor Fund | Financial Instruments – Assets |
| | | | | |
| Categories | Level 1 | Level 2 | Level 3 | Fair Value |
| Common Stocks * | $ 8,889,984 | $ - | $ - | $ 8,889,984 |
| Real Estate Investment Trust | 289,021 | - | - | 289,021 |
| Money Market Fund | 122,743 | - | - | 122,743 |
| | $ 9,301,748 | $ - | $ - | $ 9,301,748 |
| Growth Fund | Financial Instruments – Assets |
| | | | | |
| Categories | Level 1 | Level 2 | Level 3 | Fair Value |
| Common Stocks * | $ 16,078,617 | $ - | $ - | $ 16,078,617 |
| Money Market Fund | 96,294 | - | - | 96,294 |
| | $ 16,174,911 | $ - | $ - | $ 16,174,911 |
| Bond Fund | Financial Instruments – Assets |
| | | | | |
| Categories | Level 1 | Level 2 | Level 3 | Fair Value |
| US Treasury Notes | $ - | $ 1,674,757 | $ - | $ 1,674,757 |
| Money Market Fund | 84,119 | - | - | 84,119 |
| | $ 84,119 | $ 1,674,757 | $ - | $ 1,758,876 |
* Industry classifications of these categories are detailed on each Fund's Schedule of Investments.
The Funds did not hold any Level 3 assets during the six months ended June 30, 2024. The Funds did not hold any derivative instruments at any time during the six months ended June 30, 2024. There were no significant transfers into or out of Level 1 or Level 2 during the period. It is the Funds’ policy to recognize transfers into and out of Level 1 and Level 2 at the end of the reporting period.
3. INVESTMENT ADVISORY AGREEMENT AND OTHER TRANSACTIONS WITH AFFILIATES
Investment Advisory Agreement
Under an agreement effective December 31, 2021 Smithbridge Asset Management, Inc. (“Smithbridge” or “Advisor”) acquired the assets of Morris Capital Advisors, LLC. The Board of Trustees voted to approve an investment advisory agreement with Smithbridge, effective December 31, 2021. Smithbridge assumed all duties and responsibilities previously performed by Morris Capital Advisors, LLC. At a Board of Trustees meeting on March 16, 2022 the Board voted to approve an interim investment advisory agreement and an investment advisory agreement with Smithbridge to act as investment adviser to Manor Investment Funds, pending shareholder approval. At a special meeting of shareholders held February 15, 2023 the shareholders of the Manor Fund, the Growth Fund, and the Bond Fund, voting separately, approved the new advisory agreement between the Trust and Smithbridge. Under the investment advisory agreement, the fee structure consists of a management fee not to exceed 0.75% of average net assets for the Manor Fund and the Growth Fund and a management fee not to exceed 0.50% of average net assets for the Bond Fund. The agreement also includes an administrative fee not to exceed 0.50%, 0.24% and 0.45% of average net assets for the Manor Fund, Growth Fund, and Bond Fund, respectively. Management and administrative fees are paid on a monthly basis. Expenses that may be excluded from the unified fees include such expenses as acquired fund fees or expenses.
Advisory Fees for the six months ended June 30, 2024
| | Manor Fund | Growth Fund | Bond Fund |
| Advisory Fees Earned | $ 32,880 | $ 56,988 | $ 4,406 |
| Advisory Fees owed to Advisor | $ 5,662 | $ 9,758 | $ 723 |
Administrative Fees for the six months ended June 30, 2024
| | Manor Fund | Growth Fund | Bond Fund |
| Administrative Fees Earned | $ 21,920 | $ 18,236 | $ 3,966 |
| Administrative Fees owed to Advisor | $ 3,775 | $ 3,123 | $ 651 |
Administrative Shareholder Servicing Fees
The Trust entered into an Administrative Services Agreement with Smithbridge effective January 1, 2022, under which Smithbridge, as Advisor to the Funds, provides certain services to the Trust including, but not limited to: accounting, recordkeeping, and portfolio administration of the funds; preparation, distribution, and filing of required reports; managing operational requirements and service providers; organizing and managing the Board of Trustees; and providing marketing and distribution services. Under the Administrative Services Agreement the Advisor earns a fee of 0.05% of net average assets of the Trust. This administrative shareholder services fee is included in the ordinary expenses of the Trust on an annual basis, billed monthly. The fee may be waived for assets in any fund series during periods that the Advisor serves as investment advisor to that series. For the six months ended June 30, 2024, no fees were billed or accrued for the Advisor under this agreement.
As Administrator to the Trust, the Advisor also oversees the third-party service providers. The Advisor pays all expenses related to management and administrative support for the Funds, including those third-party services currently under contract, as approved by the Board. The Advisor also pays certain financial institutions (which may include banks, brokers, securities dealers and other industry professionals) that charge a fee for providing distribution related services and/or certain administrative functions for the Fund shareholders.
Daniel A. Morris serves Co-Chief Investment Officer of the Advisor. He also served as the Trust’s President and Trustee until March 28, 2023, at which time the shareholders of the Trust elected Gregory B. Getts to serve as the Trust’s President and Trustee. Mr. Getts is also the owner/President of Mutual Shareholder Services, LLC (“MSS”) the Funds transfer agent and fund accountant. The Trust, on behalf of the Funds, entered into a Compliance Agreement with Empirical Administration, LLC ("Empirical") which provides for compliance services to the Funds. Brandon M. Pokersnik is the owner/president of Empirical and also an employee of MSS. He serves as the Chief Compliance Officer and an officer of the Trust.
4. INVESTMENT TRANSACTIONS
Investment transactions, excluding short-term investments, for the six months ended June 30, 2024, were as follows:
| | Manor Fund | Growth Fund | Bond Fund |
| Purchases | $ 501,382 | $ 873,967 | $ - |
| Sales | $ 553,402 | $ 586,506 | $ - |
5. TAX MATTERS NOTE
As of December 31, 2023, the tax basis unrealized appreciation (depreciation) and cost of investment securities, including short-term investments, were as follows:
| | Manor Fund | Growth Fund | Bond Fund |
Federal tax cost of investments, including short-term investments + | $ 3,676,251 | $ 5,513,185 | $ 1,885,075 |
| Gross tax appreciation of investments | $ 4,636,523 | $ 9,082,189 | $ 24,635 |
| Gross tax depreciation of investments | (26,659) | (2,856) | (103,262) |
| Net tax appreciation (depreciation) | $ 4,609,864 | $ 9,079,333 | $ (78,627) |
Each Fund’s distributable earnings on a tax basis are determined only at the end of each fiscal year. As of December 31, 2023, the Fund’s most recent fiscal year-end, the components of distributable earnings on a tax basis were as follows:
Fund | Unrealized Appreciation (Depreciation) | Undistributed Ordinary Income | Undistributed Capital Gain
(Loss) | Capital Loss Carryforward | Total Distributable Earnings (Deficit) |
| Manor Fund | $ 4,609,864 | $ - | $ - | $ - | $ 4,609,864 |
| Growth Fund + | $ 9,079,333 | $ - | $ - | $ - | $ 9,079,333 |
| Bond Fund | $ (78,627) | $ - | $ - | $ (15,991) | $ (94,618) |
+ The difference between the book cost and tax cost of investments represents disallowed wash sales for tax purposes on the Growth Fund.
As of December 31, 2023, the Bond Fund has capital loss carryforwards available for federal income tax purposes, which can be used to offset future capital gains, as follows:
| Long-term non-expiring | | $ (12,753) |
| Short-term non-expiring | | $ (3,238) |
| Total | | $ (15,991) |
Ordinary income and long-term capital gain distributions are determined in accordance with Federal income tax regulations, which may differ from the character of net investment income or net realized gains presented in the financial statements in accordance with U.S. GAAP.
There were no distributions paid during the six months ended June 30, 2024.
The tax character of distributions paid during the fiscal year ended December 31, 2023 was as follows:
| | Manor Fund | Growth Fund | Bond Fund |
| Ordinary Income | $ 69,851 | $ 32,133 | $ 22,353 |
| Long-term Gain | $ 12,270 | $ 390,002 | $ — |
6. INDEMNIFICATIONS
In the normal course of business, the Funds enter into contracts that contain general indemnifications to other parties. The Funds’ maximum exposure under these contracts is unknown as this would involve future claims that may be made against the Funds that have not yet occurred. The Funds expect the risk of loss to be remote.
7. MARKET RISK
The increasing interconnectivity between global economies and financial markets increases the likelihood that events or conditions in one region or financial market may adversely impact issuers in a different country, region or financial market. Securities in the Funds may underperform due to inflation (or expectations for inflation), interest rates, global demand for particular products or resources, natural disasters, climate change and climate-related events, pandemics, epidemics, terrorism, international conflicts, regulatory events and governmental or quasi-governmental actions. The occurrence of global events similar to those in recent years, such as terrorist attacks around the world, natural disasters, social and political discord or debt crises and downgrades, among others, may result in market volatility and may have long term effects on both the U.S. and global financial markets. It is difficult to predict when similar events affecting the U.S. or global financial markets may occur, the effects that such events may have and the duration of those effects. Any such event(s) could have a significant adverse impact on the value and risk profile of the Funds. Changes in market conditions and interest rates can have the same impact on all types of securities and instruments. In times of severe market disruptions, you could lose your entire investment.
8. SECTOR RISK
The Manor Fund and Growth Fund may, at times invest a substantial portion of the portfolio in companies in the technology sector. Companies in this sector are subject to the risk of rapidly changing technological developments and highly competitive industry participants. As a result, many companies can have variable earnings and may not pay dividends, leading to higher volatility as investor expectations shift.
9. NEW ACCOUNTING PRONOUNCEMENTS
In September 2023, the SEC adopted a final rule relating to “Names Rule” under the 1940 Act. The amendments expanded the rule to require more funds to adopt an 80 percent investment policy, including funds with names suggesting a focus in investments with particular characteristics (e.g., growth or value) or with terms that reference a thematic investment focus (e.g., environmental, social, or governance factors). The amendments will require that a fund review its name for compliance with the rule. If needed, a fund may need to adopt an 80 percent investment policy and review its portfolio assets' treatment under such policy at least quarterly. The rule also requires additional prospectus disclosure and reporting and record keeping requirements. The amendments will become effective on April 9, 2024. The compliance date is February 9, 2026 for Funds with more than $1 billion in assets and August 9, 2026 for Funds with less than $1 billion in assets. The Funds are in compliance with this new rule.
10. CHANGE OF SERVICE PROVIDERS
As of April 26, 2024, the Funds changed their custodian from U.S. Bank N.A. to Huntington National Bank to perform all custodian services for the Funds.
11. SUBSEQUENT EVENTS
Management has evaluated the impact of all other subsequent events through the date the financial statements were issued and has determined that there were no subsequent events requiring recognition or disclosure in these financial statements.
Manor Investment Funds
ADDITIONAL INFORMATION
JUNE 30, 2024 (UNAUDITED)
Proxy Voting Procedures
The Trust's Board of Trustees has approved proxy voting procedures for the voting of proxies relating to securities held by the Funds. Records of the Funds proxy voting records are maintained and are available for inspection. The Board is responsible for overseeing the implementation of the procedures. Information regarding how the Funds voted proxies relating to portfolio securities during the most recent 12-month period ended June 30 is available without charge, upon request, by calling 800-787-3334; or on the Funds website at www.manorfunds.com under Fund Information, Proxy Voting, or on the SEC website at http://www.sec.gov.
Quarterly Portfolio Schedule
The Trust now files a complete schedule of investments with the SEC for the first and third quarters of each fiscal year on Form N-PORT. These forms are available on the SEC’S website at http://www.sec.gov. They may be reviewed and copied at the SEC’s Public Reference Room in Washington, D.C. Information on the operation of the Public Reference Room may be obtained by calling 1-800-723-0330.
Manor Investment Funds
Fund Office:
15 Chester County Commons
Malvern, PA 19355
610-722-0900 800-787-3334
www.manorfunds.com
Funds distributed by:
Foreside Funds Services, LLC
Three Canal Plaza
Suite 100
Portland, ME 04101
This report is submitted for the general information of the shareholders of the Funds. It is not authorized for distribution to prospective investors unless preceded or accompanied by an effective prospectus, which includes information regarding each of the Fund’s risks, objectives, fees and expenses, experience of its management and other information.
ITEM 8. CHANGES IN AND DISAGREEMENTS WITH ACCOUNTANTS FOR OPEN-END MANAGEMENT INVESTMENT COMPANIES.
Not applicable.
ITEM 9. PROXY DISCLOSURE FOR OPEN-END MANAGEMENT INVESTMENT COMPANIES.
Not applicable.
ITEM 10. REMUNERATION PAID TO DIRESTORS, OFFICERS AND OTHERS OF OPEN-END MANAGEMENT INVESTMENT COMPANIES.
The information is included as part of the material filed under Item 7 of this Form.
ITEM 11. STATEMENT REGARDING BASIS FOR APPROVAL OF INVESTMENT ADVISORY CONTRACT.
The information is included as part of the material filed under Item 7 of this Form.
ITEM 12. DISCLOSURE OF PROXY VOTING POLICIES AND PROCEDURES FOR CLOSED-END MANAGEMENT INVESTMENT COMPANIES.
Not applicable.
ITEM 13. PORTFOLIO MANAGERS OF CLOSED-END MANAGEMENT INVESTMENT COMPANIES.
Not applicable to open-end investment companies.
ITEM 14. PURCHASES OF EQUITY SECURITIES BY CLOSED-END MANAGEMENT INVESTMENT COMPANIES.
Not applicable to open-end investment companies.
ITEM 15. SUBMISSION OF MATTERS TO A VOTE OF SECURITY HOLDERS.
Not applicable.
ITEM 16. CONTROLS AND PROCEDURES.
(a) The registrant’s president and chief financial officer has concluded that the registrant’s disclosure controls and procedures (as defined in Rule 30a-3(c) under the Investment Company Act of 1940, as amended (the “1940 Act”)) are effective, as of a date within 90 days of the filing date of the report that includes the disclosure required by this paragraph, based on their evaluation of these controls and procedures required by Rule 30a-3(b) under the 1940 Act and Rules 13-a-15(b) under the Securities Exchange Act of 1934.
(b) There were no changes in the registrant’s internal control over financial reporting (as defined in Rule 30a-3(d) under the 1940 Act) that occurred during the registrant’s second fiscal half-year that has materially affected, or is reasonably likely to materially affect, the registrant’s internal control over financial reporting.
ITEM 17. DISCLOSURE OF SECURITIES LENDING ACTIVITIES FOR CLOSED-END MANAGEMENT INVESTMENT COMPANIES.
Not applicable.
ITEM 18. RECOVERY OF ERRONEOUSLY AWARDED COMPENSATION.
(a) Not applicable.
(b) Not applicable.
ITEM 19. EXHIBITS
(a)(1) Code of Ethics — For annual reports.
(a)(2) Certifications pursuant to Section 302 of the Sarbanes-Oxley Act of 2002 are attached hereto.
(b) Certification pursuant to Section 906 of the Sarbanes-Oxley Act of 2002 are attached hereto.
SIGNATURES
Pursuant to the requirements of the Securities Exchange Act of 1934 and the Investment Company Act of 1940, the registrant has duly caused this report to be signed on its behalf by the undersigned, thereunto duly authorized.
Manor Investment Funds
By /s/ Daniel A. Morris
Daniel A. Morris, President
Mr. Morris serves as both Principal Executive Officer and Principal Financial Officer of Manor Investment Funds.
Date: 09/03/2024
Pursuant to the requirements of the Securities Exchange Act of 1934 and the Investment Company Act of 1940, this report has been signed below by the following persons on behalf of the registrant and in the capacities and on the dates indicated.
Manor Investment Funds
By /s/ Daniel A. Morris
Daniel A. Morris, President
Mr. Morris serves as both Principal Executive Officer and Principal Financial Officer of Manor Investment Funds.
Date: 09/03/2024