Exhibit 99.1
| Atlanta Gas Light | Atlanta Gas Light Company | |
| AGL Capital | AGL Capital Corporation | |
| AGL Networks | AGL Networks, LLC | |
| AGSC | AGL Services Company, a service company established in accordance with SEC regulations | |
| AIP | Annual Incentive Plan | |
| Bcf | Billion cubic feet | |
| Chattanooga Gas | Chattanooga Gas Company | |
| Compass Energy | Compass Energy Services, Inc. | |
| Credit Facilities | $1.0 billion and $140 million credit agreements of AGL Capital | |
| Deregulation Act | 1997 Natural Gas Competition and Deregulation Act | |
| Dominion Ohio | Dominion East of Ohio, a Cleveland, Ohio based natural gas company; a subsidiary of Dominion Resources, Inc. | |
| EBIT | Earnings before interest and taxes, a non-GAAP measure that includes operating income, other income and gain on sales of assets and excludes interest and income tax expense; as an indicator of our operating performance, EBIT should not be considered an alternative to, or more meaningful than, operating income or net income attributable to AGL Resources Inc. as determined in accordance with GAAP | |
| EITF | Emerging Issues Task Force | |
| Energy Act | Energy Policy Act of 2005 | |
| ERC | Environmental remediation costs associated with our distribution operations segment which are recoverable through rates mechanisms | |
| FASB | Financial Accounting Standards Board | |
| FERC | Federal Energy Regulatory Commission | |
| Fitch | Fitch Ratings | |
| Florida Commission | Florida Public Service Commission | |
| FSP | FASB Staff Position | |
| GAAP | Accounting principles generally accepted in the United States of America | |
| Georgia Commission | Georgia Public Service Commission | |
| Golden Triangle Storage | Golden Triangle Storage, Inc. | |
| Heating Degree Days | A measure of the effects of weather on our businesses, calculated when the average daily actual temperatures are less than a baseline temperature of 65 degrees Fahrenheit. | |
| Heating Season | The period from November to March when natural gas usage and operating revenues are generally higher because more customers are connected to our distribution systems when weather is colder | |
| Jefferson Island | Jefferson Island Storage & Hub, LLC | |
| LIBOR | London interbank offered rate | |
| LNG | Liquefied natural gas | |
| LOCOM | Lower of weighted average cost or current market price | |
| Louisiana DNR | Louisiana Department of Natural Resources | |
| Magnolia | Magnolia Enterprise Holdings, Inc. | |
| Maryland Commission | Maryland Public Service Commission | |
| Marketers | Marketers selling retail natural gas in Georgia and certificated by the Georgia Commission | |
| Medium-term notes | Notes issued by Atlanta Gas Light with scheduled maturities between 2012 and 2027 bearing interest rates ranging from 6.6% to 9.1% | |
| MGP | Manufactured gas plant | |
| MMBtu | NYMEX equivalent contract units of 10,000 million British thermal units | |
| Moody’s | Moody’s Investors Service | |
| New Jersey Commission | New Jersey Board of Public Utilities | |
| NUI | NUI Corporation - an acquisition which was completed in November 2004 | |
| NYMEX | New York Mercantile Exchange, Inc. | |
| OCI | Other comprehensive income | |
| Operating margin | A measure of income, calculated as revenues minus cost of gas, that excludes operation and maintenance expense, depreciation and amortization, taxes other than income taxes, and the gain or loss on the sale of our assets; these items are included in our calculation of operating income as reflected in our statements of consolidated income. |
| OTC | Over-the-counter |
| Piedmont | Piedmont Natural Gas |
| Pivotal Propane | Pivotal Propane of Virginia, Inc. |
| Pivotal Utility | Pivotal Utility Holdings, Inc., doing business as Elizabethtown Gas, Elkton Gas and Florida City Gas |
| PP&E | Property, plant and equipment |
| PRP | Pipeline replacement program for Atlanta Gas Light |
| S&P | Standard & Poor’s Ratings Services |
| Saltville | Saltville Gas Storage Company |
| SEC | Securities and Exchange Commission |
| Sequent | Sequent Energy Management, L.P. |
| SFAS | Statement of Financial Accounting Standards |
| SNG | Southern Natural Gas Company, a subsidiary of El Paso Corporation |
| SouthStar | SouthStar Energy Services LLC |
| Tennessee Commission | Tennessee Regulatory Authority |
| VaR | Value at risk is defined as the maximum potential loss in portfolio value over a specified time period that is not expected to be exceeded within a given degree of probability |
| Virginia Natural Gas | Virginia Natural Gas, Inc. |
| Virginia Commission | Virginia State Corporation Commission |
| WACOG | Weighted average cost of goods |
| WNA | Weather normalization adjustment |
| APB 25 | APB Opinion No. 25, “Accounting for Stock Issued to Employees” |
| EITF 98-10 | EITF Issue No. 98-10, “Accounting for Contracts Involved in Energy Trading and Risk Management Activities” |
| EITF 99-02 | EITF Issue No. 99-02, “Accounting for Weather Derivatives” |
| EITF 00-11 | EITF Issue No. 00-11, “Lessor’s Evaluation of Whether Leases of Certain Integral Equipment Meet the Ownership Transfer Requirements of FASB Statement No. 13, Accounting for Leases, for Leases of Real Estate” |
| EITF 02-03 | EITF Issue No. 02-03, “Issues Involved in Accounting for Contracts under EITF Issue No. 98-10, ‘Accounting for Contracts Involved in Energy Trading and Risk Management Activities’” |
| FIN 39 | FASB Interpretation No. (FIN) 39 “Offsetting of Amounts Related to Certain Contracts” |
| FSP FIN 39-1 | FASB Staff Position 39-1 “Amendment of FIN 39” |
| FIN 46 & FIN 46R | FIN 46, “Consolidation of Variable Interest Entities” |
| FIN 48 | FIN 48, “Accounting for Uncertainty in Income Taxes, an interpretation of SFAS Statement No. 109” |
| FSP EITF 03-6-1 | FSP EITF 03-6-1, “Determining Whether Instruments Granted in Share-Based Payment Transactions Are Participating Securities” | |
| FSP EITF 06-3 | FSP EITF 06-3, “How Taxes Collected from Customers and Remitted to Governmental Authorities Should be Presented in the Income Statement (That Is, Gross versus Net Presentation)” | |
| FSP FAS 133-1 | FSP No. FAS 133-1, “Disclosures about Credit Derivatives and Certain Guarantees: An Amendment of FASB Statement No. 133” | |
| FSP FAS 140-R and FIN 46R-8 | FSP No. FAS 140-R and FIN 46R-8, “Disclosures by Public Entities (Enterprises) about Transfers of Financial Assets and Interests in Variable Interest Entities” | |
| FSP FAS 157-3 | FSP No. FAS 157-3, “Determining the Fair Value of a Financial Asset When the Market for That Asset Is Not Active” | |
| SFAS 5 | SFAS No. 5, “Accounting for Contingencies” | |
| SFAS 13 | SFAS No. 13, “Accounting for Leases” | |
| SFAS 66 | SFAS No. 66, “Accounting for Sales of Real Estate” | |
| SFAS 71 | SFAS No. 71, “Accounting for the Effects of Certain Types of Regulation” | |
| SFAS 87 | SFAS No. 87, “Employers’ Accounting for Pensions” | |
| SFAS 106 | SFAS No. 106, “Employers’ Accounting for Postretirement Benefits Other Than Pensions” | |
| SFAS 109 | SFAS No. 109, “Accounting for Income Taxes” | |
| SFAS 123 & SFAS 123R | SFAS No. 123, “Accounting for Stock-Based Compensation” | |
| SFAS 133 | SFAS No. 133, “Accounting for Derivative Instruments and Hedging Activities” | |
| SFAS 140 | SFAS No. 140, “Accounting for Transfers and Servicing Financial Assets and Extinguishments of Liabilities” | |
| SFAS 141 | SFAS No. 141, “Business Combinations” |
| SFAS 142 | SFAS No. 142, “Goodwill and Other Intangible Assets” |
| SFAS 148 | SFAS No. 148, “Accounting for Stock-Based Compensation – Transition and Disclosure” |
| SFAS 149 | SFAS No. 149, “Amendment of SFAS 133 on Derivative Instruments and Hedging Activities” |
| SFAS 157 | SFAS No. 157, “Fair Value Measurements” |
| SFAS 158 | SFAS No. 158, “Employers’ Accounting for Defined Benefit Pension and Other Postretirement Plans” |
| SFAS 160 | SFAS No. 160, “Noncontrolling Interests in Consolidated Financial Statements” |
| SFAS 161 | SFAS No. 161, “Disclosure about Derivative Instruments and Hedging Activities, an amendment of SFAS 133” |
BUSINESS
Unless the context requires otherwise, references to “we,” “us,” “our,” the “company” and “AGL Resources” are intended to mean consolidated AGL Resources Inc. and its subsidiaries.
We are an energy services holding company whose principal business is the distribution of natural gas in six states - Florida, Georgia, Maryland, New Jersey, Tennessee and Virginia. Our six utilities serve more than 2.2 million end-use customers, making us the largest distributor of natural gas in the southeastern and mid-Atlantic regions of the United States based on customer count. We are also involved in several related and complementary businesses, including retail natural gas marketing to end-use customers primarily in Georgia; natural gas asset management and related logistics activities for each of our utilities as well as for nonaffiliated companies; natural gas storage arbitrage and related activities; and the development and operation of high-deliverability natural gas storage assets. We also own and operate a small telecommunications business that constructs and operates conduit and fiber infrastructure within select metropolitan areas.
We manage these businesses through four operating segments and a nonoperating corporate segment. Operating revenues, operating margin, operating expenses and EBIT for each of our business segments are presented in the following table for the last three years.
| In millions | | Operating revenues | | | Operating margin (1) | | | | Operating expenses | | | | EBIT (1) | | |
| 2008 | | | | | | | | | | |
| Distribution operations | | $ | 1,768 | | | $ | 818 | | | $ | 493 | | | $ | 329 | |
| Retail energy operations | | | 987 | | | | 149 | | | | 73 | | | | 77 | |
| Wholesale services | | | 170 | | | | 122 | | | | 62 | | | | 60 | |
| Energy investments | | | 55 | | | | 50 | | | | 31 | | | | 19 | |
| Corporate (2) | | | (180 | ) | | | 7 | | | | 9 | | | | (1 | ) |
| Consolidated | | $ | 2,800 | | | $ | 1,146 | | | $ | 668 | | | $ | 484 | |
2007 | | | | | | | | | | | | | | | | | |
| Distribution operations | | $ | 1,665 | | | $ | 820 | | | $ | 485 | | | $ | 338 | |
| Retail energy operations | | | 892 | | | | 188 | | | | 75 | | | | 113 | |
| Wholesale services | | | 83 | | | | 77 | | | | 43 | | | | 34 | |
| Energy investments | | | 42 | | | | 40 | | | | 25 | | | | 15 | |
| Corporate (2) | | | (188 | ) | | | - | | | | 8 | | | | (7 | ) |
| Consolidated | | $ | 2,494 | | | $ | 1,125 | | | $ | 636 | | | $ | 493 | |
| 2006 | | | | | | | | | | | | | | | | | |
| Distribution operations | | $ | 1,624 | | | $ | 807 | | | $ | 499 | | | $ | 310 | |
| Retail energy operations | | | 930 | | | | 156 | | | | 68 | | | | 86 | |
| Wholesale services | | | 182 | | | | 139 | | | | 49 | | | | 90 | |
| Energy investments | | | 41 | | | | 36 | | | | 26 | | | | 10 | |
| Corporate (2) | | | (156 | ) | | | 1 | | | | 9 | | | | (9 | ) |
| Consolidated | | $ | 2,621 | | | $ | 1,139 | | | $ | 651 | | | $ | 487 | |
| (1) | These are non-GAAP measurements. A reconciliation of operating margin and EBIT to our operating income, earnings before income taxes and net income attributable to AGL Resources Inc. is contained in “Results of Operations” in Exhibit 99.3, “Management’s Discussion and Analysis of Financial Condition and Results of Operations.” |
(2) Includes intercompany eliminations.
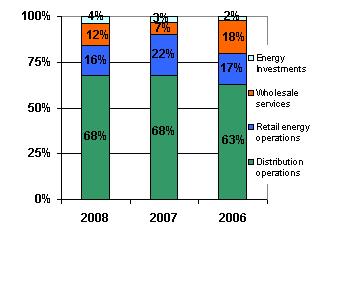
Over the last three years, on average, we have derived 85% of our operating segments’ EBIT from our regulated natural gas distribution business and the sale of natural gas to retail customers primarily in Georgia through our affiliate SouthStar. This statistic is significant because it represents the portion of our earnings that directly results from the underlying business of supplying natural gas to retail customers. SouthStar, which is subject to a different regulatory framework from our utilities, is an integral part of the retail framework for providing natural gas service to end-use customers in Georgia.
We derived our remaining operating EBIT for the last three years principally from businesses that are complementary to our natural gas distribution business. We engage in natural gas asset management and the operation of high-deliverability natural gas underground storage as ancillary activities to our utility franchises. These businesses allow us to be opportunistic in capturing incremental value at the wholesale level and provide us with deepened business insight about natural gas market dynamics.
The following chart provides each operating segment’s percentage contribution to the total operating EBIT for the last three years.
 Distribution Operations
Our distribution operations segment is the largest component of our business and includes six natural gas local distribution utilities. These utilities construct, manage and maintain intrastate natural gas pipelines and distribution facilities and include:
| · | Atlanta Gas Light in Georgia |
| · | Chattanooga Gas in Tennessee |
| · | Elizabethtown Gas in New Jersey |
| · | Florida City Gas in Florida |
| · | Virginia Natural Gas in Virginia |
Regulatory Environment
Each utility operates subject to regulations of the state regulatory agencies in its service territories with respect to rates charged to our customers, maintenance of accounting records and various service and safety matters. Rates charged to our customers vary according to customer class (residential, commercial or industrial) and rate jurisdiction. Rates are set at levels that generally should allow recovery of all prudently incurred costs, including a return on rate base sufficient to pay interest on debt and provide a reasonable return for our shareholders. Rate base generally consists of the original cost of utility plant in service, working capital and certain other assets; less accumulated depreciation on utility plant in service and net deferred income tax liabilities, and may include certain other additions or deductions.
In 2009 and 2010, we expect to file base rate cases in four of our six jurisdictions. Over the past several years our utilities have been fulfilling their long-term commitments to rate freezes, which begin expiring in 2009. As these rate cases are filed, we will be seeking rate reforms that encourage conservation and “decoupling.” In traditional rate designs, our utilities’ recovery of a significant portion of their fixed customer service costs is tied to assumed natural gas volumes used by our customers. We believe separating, or decoupling, the recovery of these fixed costs from the natural gas deliveries will align the interests of our customers and utilities by encouraging energy conservation and ensuring stable returns for our shareholders.
For our largest utility, Atlanta Gas Light, the natural gas market was deregulated in 1997 with the Deregulation Act. Prior to this act, Atlanta Gas Light was the supplier and seller of natural gas to its customers. Today, Marketers sell natural gas to end-use customers in Georgia and handle customer billing functions. The Marketers file their rates monthly with the Georgia Commission. Atlanta Gas Light's role includes:
| · | distributing natural gas for Marketers |
| · | constructing, operating and maintaining the gas system infrastructure, including responding to customer service calls and leaks |
| · | reading meters and maintaining underlying customer premise information for Marketers |
| · | planning and contracting for capacity on interstate transportation and storage systems |
Atlanta Gas Light recognizes revenue under a straight-fixed-variable rate design whereby it charges rates to its customers based primarily on monthly fixed charges that are periodically adjusted. The Marketers bill these charges directly to their customers. This mechanism minimizes the seasonality of Atlanta Gas Light’s revenues since the monthly fixed charge is not volumetric or directly weather dependent. However, weather indirectly influences the number of customers that have active accounts during the heating season, and this has a seasonal impact on Atlanta Gas Light’s revenues since generally more customers are connected in periods of colder weather than in periods of warmer weather.
All of our utilities, excluding Atlanta Gas Light, are authorized to use a natural gas cost recovery mechanism that allows them to adjust their rates to reflect changes in the wholesale cost of natural gas and to ensure they recover 100% of the costs incurred in purchasing gas for their customers. Since Atlanta Gas Light does not sell natural gas directly to its end-use customers, it does not need or utilize a natural gas cost recovery mechanism.
Regulatory Agreements In 2007, we filed a joint FERC application with SNG, which was approved in 2008, which obtained an undivided interest in pipelines connecting our Georgia service territory to the Elba Island LNG facility. Under the project, we would purchase the undivided interest and, in turn, lease the interest to SNG. Atlanta Gas Light would then subscribe to the associated supply capacity from SNG. The project is expected to be completed in 2009. We along with SNG have undertaken this pipeline project in an effort to diversify our sources of natural gas by gaining more access to natural gas supplies from SNG’s Elba Island LNG facility located on Georgia’s Atlantic coast near Savannah. We currently receive the majority of our natural gas supply from a production region in and around the Gulf of Mexico and generally, demand for this natural gas is growing faster than supply.
In July 2008, Virginia Natural Gas filed a Conservation and Ratemaking Efficiency Plan with the Virginia Commission. The plan was filed pursuant to the Natural Gas Conservation and Ratemaking Efficiency Act passed by the State of Virginia in March 2008. The act allows natural gas utilities to implement conservation programs and alternative rate designs that would allow the utilities to recover the cost of providing safe and reliable service based on normal customer usage. In October 2008, Virginia Natural Gas filed with the Virginia Commission a motion for approval of the proposed plan; which was approved by the Virginia Commission in December 2008. As part of this plan, Virginia Natural Gas intends to invest approximately $7 million over three years in new conservation programs and to implement an accompanying decoupled rate design mechanism that will help to mitigate the impact of declining usage due to conservation and provide the utility with an opportunity to recover its fixed costs.
In December 2007, the Florida Commission approved our request to include the amortization of certain components of the purchase price we paid for Florida City Gas in our calculation of return on equity. The costs will not be amortized for financial reporting purposes in accordance with GAAP, but will be amortized over a period of 5 to 30 years for our regulatory reporting to the Florida Commission in connection with the Florida Commission’s review of Florida City Gas’ return on equity. Additionally and under the same order, the Florida Commission approved a five-year base rate stay-out beginning October 2007, whereby base rates will not be increased, except for certain unforeseen acts beyond our control. The five-year stay-out provision does not preclude the Florida Commission from initiating over- earning or other proceedings that may result in rate reductions.
A November 2004 agreement between Elizabethtown Gas and the New Jersey Commission approved our acquisition of NUI. This agreement included, among other things, a base rate freeze for Elizabethtown Gas for a five-year period with new rates, if approved, to go into effect no later than January 2010. Beginning with the December 2007 annual measurement period, 75% of Elizabethtown Gas’ earnings in excess of an 11% return on equity are shared with rate payers in the fourth and fifth years of the base rate stay-out period.
The following table provides certain regulatory information for our largest utilities.
| | | Atlanta Gas Light | | Elizabethtown Gas | | Virginia Natural Gas | | Florida City Gas | | Chattanooga Gas |
| Current rates effective until | | | Q2 2010 | | | | Q4 2009 - Q1 2010 | | | | Q3 2011 | | | | N/A | | | | Q1 2011 | |
Authorized return on rate base (1) | | | 8.53 | % | | | 7.95 | % | | | 9.24 | % | | | 7.36 | % | | | 7.89 | % |
Estimated 2008 return on rate base (2) (3) | | | 8.38 | % | | | 6.86 | % | | | 8.24 | % | | | 5.63 | % | | | 6.52 | % |
Authorized return on equity (1) | | | 10.90 | % | | | 10.00 | % | | | 10.90 | % | | | 11.25 | % | | | 10.20 | % |
Estimated 2008 return on equity (2) (3) | | | 10.59 | % | | | 7.67 | % | | | 9.61 | % | | | 7.09 | % | | | 7.14 | % |
Authorized rate base % of equity (1) | | | 47.9 | % | | | 53.0 | % | | | 52.4 | % | | | 36.8 | % | | | 44.8 | % |
Rate base included in 2008 return on equity (in millions) (3) (4) | | $ | 1,312 | | | $ | 471 | | | $ | 378 | | | $ | 152 | | | $ | 108 | |
Performance based rates (5) | | | | | | ü | | | ü | | | | | | | | | |
Weather normalization (6) | | | | | | ü | | | ü | | | | | | | | ü |
Decoupled or straight-fixed variable rate design (7) | | ü | | | | | | | ü | | | | | | | | | |
| State regulator | | Georgia Commission | | New Jersey Commission | | Virginia Commission | | Florida Commission | | Tennessee Commission |
| (1) | The authorized return on rate base, return on equity, and percentage of equity reflected above were those authorized as of December 31, 2008. |
| (2) | Estimates based on principles consistent with utility ratemaking in each jurisdiction, and are not necessarily consistent with GAAP returns. |
| (3) | Florida City Gas includes the impacts of the acquisition adjustment, as approved by the Florida Commission in December 2007, in its rate base, return on rate base and return on equity calculations. |
| (4) | Estimated based on 13-month average. |
| (5) | Involves frozen rates for a determined period, and or allows for sharing of earnings with customers when returns on equity or rate base exceeds agreed upon amounts. |
| (6) | Involves regulatory mechanisms that allow us to recover our costs in the event of unseasonal weather, but are not direct offsets to the potential impacts of weather and customer consumption on earnings. These mechanisms are designed to help stabilize operating results by increasing base rate amounts charged to customers when weather is warmer than normal and decreasing amounts charged when weather is colder than normal. |
| (7) | Decoupled and straight-fixed variable rate designs allow for the recovery of fixed customer service costs separately from assumed natural gas volumes used by our customers. |
Customer Demand
All of our utilities face competition from other energy products. Our principal competition is from electric utilities and oil and propane providers serving the residential and commercial markets throughout our service areas and the potential displacement or replacement of natural gas appliances with electric appliances. The primary competitive factors are the prices for competing sources of energy as compared to natural gas and the desirability of natural gas heating versus alternative heating sources.
Competition for space heating and general household and small commercial energy needs generally occurs at the initial installation phase when the customer or builder makes decisions as to which types of equipment to install. Customers generally continue to use the chosen energy source for the life of the equipment. Customer demand for natural gas could be affected by numerous factors, including:
| · | changes in the availability or price of natural gas and other forms of energy |
| · | general economic conditions |
| · | legislation and regulations |
| · | the capability to convert from natural gas to alternative fuels |
Due to the general economic downturn and the decline in the housing markets in the areas we serve, we experienced lower than expected customer growth throughout 2008, a trend we expect to continue through 2009. The reduction in customer growth is primarily a result of much slower growth in the residential housing markets throughout our service territories. This trend has been offset slightly by growth in the commercial customer segment in certain areas, primarily as a result of conversions to natural gas from other fuel sources. In addition, we continue to experience some customer loss because of higher natural gas prices and competition from alternative fuel sources, including incentives offered by the local electric utilities to switch to electric alternatives.
We continue to use a variety of targeted marketing programs to attract new customers and to retain existing customers. These efforts include working to add residential customers, multifamily complexes and commercial customers who use natural gas for purposes other than space heating. In addition, we partner with numerous entities to market the benefits of gas appliances and to identify potential retention options early in the process for those customers who might consider converting to alternative fuels.
Collective Bargaining Agreements
The following table provides information about the collective bargaining agreements to which our natural gas utilities are parties. This represents approximately 12% of our total employees.
| | | Approximate # of Employees | | Contract Expiration Date |
Elizabethtown Gas Utility Workers Union of America (Local No. 424) | | | 160 | | Nov. 2009 |
Virginia Natural Gas International Brotherhood of Electrical Workers (Local No. 50) | | | 126 | | May 2010 |
| Total | | | 286 | | |
Retail Energy Operations
Our retail energy operations segment consists of SouthStar, a joint venture owned 70% by our subsidiary, Georgia Natural Gas Company, and 30% by Piedmont. SouthStar markets natural gas and related services under the trade name Georgia Natural Gas to retail customers on an unregulated basis, primarily in Georgia as well as to commercial and industrial customers, principally in Florida, Ohio, Tennessee, North Carolina, South Carolina and Alabama. Based on its market share, SouthStar is the largest Marketer of natural gas in Georgia, with average customers in excess of 525,000 over the last three years.
SouthStar is governed by an executive committee, which is comprised of six members, three representatives from AGL Resources and three from Piedmont. Under a joint venture agreement, all significant management decisions require the unanimous approval of the SouthStar executive committee; accordingly, our 70% financial interest is considered to be noncontrolling. Although our ownership interest in the SouthStar partnership is 70%, under an amended and restated joint venture agreement executed in March 2004, SouthStar's earnings are allocated 75% to us and 25% to Piedmont except for earnings related to customers in Ohio and Florida, which are allocated 70% to us and 30% to Piedmont. We record the earnings allocated to Piedmont as net income attributable to the noncontrolling interest in our consolidated statements of income, and we record Piedmont’s portion of SouthStar’s capital as noncontrolling interest in our consolidated statements of financial positions.
The restated agreement includes a series of options granting us the evergreen opportunity to purchase all or a portion of Piedmont’s ownership interest in SouthStar. We have the right to exercise an option to purchase on or before November of each year, with the purchase being effective as of January 1, of the following year. The option, effective November 1, 2009, allows us to purchase 100% of Piedmont’s ownership interest. If we were to exercise any option to purchase less than 100% of Piedmont’s ownership interest in SouthStar, Piedmont, at its discretion, could require us to purchase their entire ownership interest. The purchase price, in any exercise of our option, would be based on the then current fair market value of SouthStar.
SouthStar’s operations are sensitive to customer consumption patterns similar to those affecting our utility operations. SouthStar uses a variety of hedging strategies, such as futures, options, swaps, weather derivative instruments and other risk management tools, to mitigate the potential effect of these issues and commodity price risk on its operations. For more information on SouthStar’s derivative instrument activities, see “Energy Marketing and Risk Management Activities” in Item 7a, “Quantitative and Qualitative Disclosures About Market Risk - Commodity Price Risk” of our Annual Report on Form 10-K for the year ended December 31, 2008.
Competition SouthStar competes with other energy marketers to provide natural gas and related services to customers in Georgia and the Southeast. SouthStar’s operation in Georgia is currently in direct competition with other Marketers to provide natural gas to customers in Georgia. In addition, similar to our distribution operations, SouthStar faces competition based on customer preferences for natural gas compared to other energy products and the comparative prices of those products. Also, price volatility in the wholesale natural gas commodity market and related significant increases in the cost of natural gas billed to SouthStar’s customers have contributed to an increase in competition for residential and commercial customers.
Operating margin SouthStar generates operating margin primarily in three ways. The first is through the sale of natural gas to residential, commercial and industrial customers, primarily in Georgia where SouthStar captures a spread between wholesale and retail natural gas prices. The second is through the collection of monthly service fees and customer late payment fees.
SouthStar evaluates the combination of these two retail price components to ensure such pricing is structured to cover related retail customer costs, such as bad debt expense, customer service and billing, and lost and unaccounted-for gas, and to provide a reasonable profit, as well as being competitive to attract new customers and maintain market share. SouthStar’s operating margin is affected by seasonal weather, natural gas prices, customer growth and their related market share in Georgia, which has historically been in excess of approximately 34%, based on customer count. SouthStar employs strategies to attract and retain a higher credit-quality customer base. These strategies result not only in higher operating margin, as these customers tend to utilize higher volumes of natural gas, but also help to mitigate bad debt expense due to the higher credit-quality of these customers.
The third way SouthStar generates operating margin is through its commercial operations of optimizing storage and transportation assets and effectively managing commodity risk, which enables SouthStar to maintain competitive retail prices and operating margin. SouthStar is allocated storage and pipeline capacity that is used to supply natural gas to its customers in Georgia. Through hedging transactions, SouthStar manages exposures arising from changing commodity prices using natural gas storage transactions to capture operating margin from natural gas pricing differences that occur over time. SouthStar’s risk management policies allow the use of derivative instruments for hedging and risk management purposes but prohibit the use of derivative instruments for speculative purposes.
SouthStar accounts for its natural gas inventories at the LOCOM price. SouthStar evaluates the weighted average cost of its natural gas inventories against market prices and determines whether any declines in market prices below the weighted average cost are other than temporary. For declines considered to be other than temporary, SouthStar records adjustments to the cost of gas (LOCOM adjustments) in our consolidated statement of income to reduce the weighted average cost of the natural gas inventory to the current market price. SouthStar recorded the following LOCOM adjustments.
| | | For the years ended Dec. 31, | |
| In millions | | 2008 | | | 2007 | | | 2006 | |
| LOCOM adjustments | | $ | 24 | | | $ | - | | | $ | 6 | |
SouthStar also enters into weather derivative instruments to stabilize operating margin profits in the event of warmer-than-normal and colder-than-normal weather in the winter months. These contracts are accounted for using the intrinsic value method under EITF 99-02. The weather derivative contracts contain settlement provisions based on cumulative heating degree days for the covered periods. SouthStar entered into weather derivatives (swaps and options) for the last three heating seasons. The net gains or losses on these weather derivatives were largely offset by corresponding decreases or increases in operating margin due to the warmer or colder weather the hedges were designed to protect against.
Wholesale Services
Our wholesale services segment consists primarily of Sequent, our subsidiary involved in asset management and optimization, storage, transportation, producer and peaking services and wholesale marketing. Sequent seeks asset optimization opportunities, which focus on capturing the value from idle or underutilized assets, typically by participating in transactions to take advantage of pricing differences between varying markets and time horizons within the natural gas supply, storage and transportation markets to generate earnings. These activities are generally referred to as arbitrage opportunities.
Sequent’s profitability is driven by volatility in the natural gas marketplace. Volatility arises from a number of factors such as weather fluctuations or the change in supply of, or demand for, natural gas in different regions of the country. Sequent seeks to capture value from the price disparity across geographic locations and various time horizons (location and seasonal spreads). In doing so, Sequent also seeks to mitigate the risks associated with this volatility and protect its margin through a variety of risk management and economic hedging activities.
Sequent provides its customers with natural gas from the major producing regions and market hubs in the U.S. and Canada. Sequent acquires transportation and storage capacity to meet its delivery requirements and customer obligations in the marketplace. Sequent’s customers benefit from its logistics expertise and ability to deliver natural gas at prices that are advantageous relative to other alternatives available to its customers.
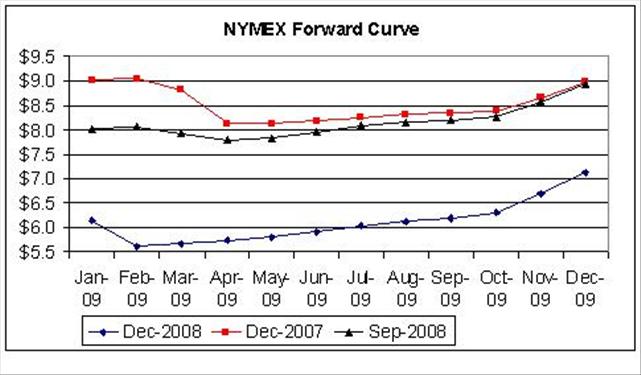
Storage inventory outlook The following graph presents the NYMEX forward natural gas prices as of December 31, 2008, December 31, 2007 and September 30, 2008, for the period of January 2009 through December 2009, and reflects the prices at which Sequent could buy natural gas at the Henry Hub for delivery in the same time period. The Henry Hub is the largest centralized point for natural gas spot and futures trading in the United States. The NYMEX uses the Henry Hub as the point of delivery for its natural gas futures contracts. Many natural gas marketers also use the Henry Hub as their physical contract delivery point or their price benchmark for spot trades of natural gas.
Sequent’s expected natural gas withdrawals from physical salt dome and reservoir storage are presented in the following table along with the operating revenues expected at the time of withdrawal. Sequent’s expected operating revenues are net of the estimated impact of regulatory sharing and reflect the amounts that are realizable in future periods based on the inventory withdrawal schedule and forward natural gas prices at December 31, 2008. Sequent’s storage inventory is economically hedged with futures contracts, which results in an overall locked-in margin, timing notwithstanding.
| | | Withdrawal schedule (in Bcf) | | |
| | | Salt dome (WACOG $5.67) | | | Reservoir (WACOG $5.68) | | | Expected operating revenues (in millions) | |
| 2009 | | | | | | | | | |
| First quarter | | | - | | | | 8 | | | $ | (0.4 | ) |
| Second quarter | | | - | | | | - | | | | - | |
| Third quarter | | | 1 | | | | 1 | | | | 0.4 | |
| Total | | | 1 | | | | 9 | | | $ | - | |
Due to the storage hedge gains and LOCOM adjustments reported in 2008, Sequent expects no additional operating revenue in 2009 from storage withdrawals of existing inventory. Expected operating revenues will change in the future as Sequent injects natural gas into inventory, adjusts its injection and withdrawal plans in response to changes in market conditions in future months and as forward NYMEX prices fluctuate. For more information on Sequent’s derivative instrument activities, see “Energy Marketing and Risk Management Activities” in Item 7a, “Quantitative and Qualitative Disclosures About Market Risk - Commodity Price Risk” of our Annual Report on Form 10-K for the year ended December 31, 2008.
Competition Sequent competes for asset management contracts with other energy wholesalers, often through a competitive bidding process.
Asset Management Transactions Sequent’s asset management customers include affiliated utilities, nonaffiliated utilities, municipal utilities, power generators and large industrial customers. These customers, due to seasonal demand or levels of activity, may have contracts for transportation and storage capacity, which may exceed their actual requirements. Sequent enters into structured agreements with these customers, whereby Sequent, on behalf of the customer, optimizes the transportation and storage capacity during periods when customers do not use it for their own needs. Sequent may capture incremental operating margin through optimization, and either share margins with the customers or pay them a fixed amount.
The FERC recently issued Order 712, which clarifies capacity release rules for asset management relationships. As Order 712 has removed uncertainties associated with certain aspects of some asset management services, we expect there may be an increase in customers seeking these services during 2009. This could provide us with additional opportunities in this portion of Sequent’s business. Until the market further develops under the requirements of Order 712, we are unable to predict what impact this may have on our wholesale business.
Sequent is actively negotiating the renewal of its remaining affiliate asset management agreement with Virginia Natural Gas scheduled to expire in 2009. The following table provides information on Sequent’s asset management agreements with affiliated utilities.
| | | | | | | Profit sharing / fees payments | |
| In millions | Expiration date | | % Shared | | | 2008 | | | 2007 | | | 2006 | |
| Virginia Natural Gas | Mar 2009 | | (A) | | | $ | 2 | | | $ | 7 | | | $ | 2 | |
| Chattanooga Gas | Mar 2011 | | | 50% (B) | | | | 4 | | | | 2 | | | | 4 | |
| Elizabethtown Gas | Mar 2011 | | (A) (B) | | | | 5 | | | | 6 | | | | 4 | |
| Atlanta Gas Light | Mar 2012 | | up to 60% (B) | | | | 9 | | | | 9 | | | | 6 | |
| Florida City Gas | Mar 2013 | | | 50% | | | | 1 | | | | 1 | | | | - | |
| Total | | | | | | | $ | 21 | | | $ | 25 | | | $ | 16 | |
| (A) | Shared on a tiered structure. |
| (B) | Includes aggregate annual minimum payments of $12 million. |
Transportation Transactions Sequent contracts for natural gas transportation capacity and participates in transactions that manage the natural gas commodity and transportation costs in an attempt to achieve the lowest cost to serve its various markets. Sequent seeks to optimize this process on a daily basis as market conditions change by evaluating all the natural gas supplies, transportation alternatives and markets to which it has access and identifying the lowest-cost alternatives to serve the various markets. This enables Sequent to capture geographic pricing differences across these various markets as delivered natural gas prices change.
As Sequent executes transactions to secure transportation capacity, it often enters into forward financial contracts to hedge its positions and lock-in a margin on future transportation activities. The hedging instruments are derivatives, and Sequent reflects changes in the derivatives’ fair value in its reported operating results in the period of change, which can be in periods prior to actual utilization of the transportation capacity. The following table lists Sequent’s reported unrealized gains associated with transportation capacity hedges. In prior years, these amounts have been realized as these positions settle in subsequent periods, and this is expected to be the case for unrealized gains in 2008.
| | | For the year ended December 31, | |
| In millions | | 2008 | | | 2007 | | | 2006 | |
| Unrealized gains | | $ | 7 | | | $ | 5 | | | $ | 12 | |
During 2008, Sequent negotiated an agreement for 40,000 dekatherms per day of transportation capacity for a period of 25 years beginning in August 2009. Upon execution of this agreement, we will include approximately $89 million of future demand payments associated with this capacity within our unrecorded contractual obligations and commitment disclosures. As with its other transportation capacity agreements, Sequent has and will identify opportunities to lock-in economic value associated with this capacity through the use of financial hedges. Since the duration of this agreement will be significantly longer than the average duration of Sequent’s portfolio, the hedging of the capacity has increased our exposure to hedge gains and losses as well as potentially increasing VaR once the contract is executed. During the third quarter of 2008, we began executing hedging transactions related to this transportation capacity, and recorded associated hedge gains of $9 million during 2008 associated with this capacity; however there was no significant impact to VaR due to the effect of other positions in the portfolio.
Producer Services Sequent’s producer services business primarily focuses on aggregating natural gas supply from various small and medium-sized producers located throughout the natural gas production areas of the United States. Sequent provides producers with certain logistical and risk management services that offer them attractive options to move their supply into the pipeline grid.
Park and Loan Transactions Sequent routinely enters into park and loan transactions with various pipelines, which allow Sequent to park gas on, or borrow gas from, the pipeline in one period and reclaim gas from, or repay gas to, the pipeline in a subsequent period. The economics of these transactions are evaluated and price risks are managed in much the same way traditional reservoir and salt dome storage transactions are evaluated and managed.
Sequent enters into forward NYMEX contracts to hedge its park and loan transactions. While the hedging instruments mitigate the price risk associated with the delivery and receipt of natural gas, they can also result in volatility in Sequent’s reported results during the period before the initial delivery or receipt of natural gas. During this period, if the forward NYMEX prices in the months of delivery and receipt do not change in equal amounts, Sequent will report a net unrealized gain or loss on the hedges.
Sequent’s results were affected by unrealized hedge gains on park and loan activities of $9 million during 2008, but Sequent had no significant gains or losses on park and loan hedges during 2007 or 2006.
Mark-to-Market Versus Lower of Average Cost or Market Sequent purchases natural gas for storage when the current market price it pays plus the cost for transportation and storage is less than the market price it anticipates it could receive in the future. Sequent attempts to mitigate substantially all of the commodity price risk associated with its storage portfolio and uses derivative instruments to reduce the risk associated with future changes in the price of natural gas. Sequent sells NYMEX futures contracts or OTC derivatives in forward months to substantially lock in the operating revenue it will ultimately realize when the stored gas is actually sold.
We view Sequent’s trading margins from two perspectives. First, we base our commercial decisions on economic value, which is defined as the locked-in operating revenue to be realized at the time the physical gas is withdrawn from storage and sold and the derivative instrument used to economically hedge natural gas price risk on that physical storage is settled. Second is the GAAP reported value both in periods prior to and in the period of physical withdrawal and sale of inventory. The GAAP amount is affected by the process of accounting for the financial hedging instruments in interim periods at fair value between the period when the natural gas is injected into storage and when it is ultimately withdrawn and the financial instruments are settled. The change in the fair value of the hedging instruments is recognized in earnings in the period of change and is recorded as unrealized gains or losses. The actual value, less any interim recognition of gains or losses on hedges and adjustments for LOCOM, is realized when the natural gas is delivered to its ultimate customer.
Sequent accounts for natural gas stored in inventory differently than the derivatives Sequent uses to mitigate the commodity price risk associated with its storage portfolio. The natural gas that Sequent purchases and injects into storage is accounted for at the lower of average cost or current market value. The derivatives that Sequent uses to mitigate commodity price risk are accounted for at fair value and marked to market each period. This difference in accounting treatment can result in volatility in Sequent’s reported results, even though the expected operating revenue is essentially unchanged from the date the transactions were initiated. These accounting differences also affect the comparability of Sequent’s period-over-period results, since changes in forward NYMEX prices do not increase and decrease on a consistent basis from year to year.
During the first half of 2008, the reported results were negatively affected by sharp increases in forward NYMEX prices, but in the second half of 2008 forward NYMEX prices dropped to below 2007 levels. The overall result was more significant unrealized gains during 2008, which contributed to the favorable variance between 2008 and 2007. During most of 2007 and 2006, Sequent’s reported results were positively affected by decreases in forward NYMEX prices, which resulted in the recognition of unrealized gains; however, the effect was more significant for 2006. As a result the more significant unrealized gains during 2006 increased the unfavorable variance between 2007 and 2006.
Energy Investments
Our energy investments segment includes a number of businesses that are related and complementary to our primary business. The most significant of these businesses is our natural gas storage business, which develops, acquires and operates high-deliverability salt-dome and other storage assets in the Gulf Coast region of the United States. While this business also can generate additional revenue during times of peak market demand for natural gas storage services, the majority of our storage services are covered under a portfolio of short, medium and long-term contracts at a fixed market rate.
Jefferson Island This wholly owned subsidiary operates a salt dome storage and hub facility in Louisiana, approximately eight miles from the Henry Hub. The storage facility is regulated by the Louisiana DNR and by the FERC, which has limited regulatory authority over storage and transportation services. Jefferson Island provides storage and hub services through its direct connection to the Henry Hub via the Sabine Pipeline and its interconnection with eight other pipelines in the area. Jefferson Island’s entire portfolio is under firm subscription for the current heating season.
In August 2006, the Office of Mineral Resources of the Louisiana DNR informed Jefferson Island that its mineral lease – which authorizes salt extraction to create two new storage caverns – at Lake Peigneur had been terminated. The Louisiana DNR identified two bases for the termination: (1) failure to make certain mining leasehold payments in a timely manner, and (2) the absence of salt mining operations for six months.
In September 2006, Jefferson Island filed suit against the State of Louisiana, in the 19th Judicial District Court in Baton Rouge, to maintain its lease to complete an ongoing natural gas storage expansion project in Louisiana. The project would add two salt dome storage caverns under Lake Peigneur to the two caverns currently owned and operated by Jefferson Island. In its suit, Jefferson Island alleges that the Louisiana DNR accepted all leasehold payments without reservation and never provided Jefferson Island with notice and opportunity to cure the alleged late payments, as required by state law. In its answer to the suit, the State denied that anyone with proper authority approved late payments. As to the second basis for termination, the suit contends that Jefferson Island’s lease with the State of Louisiana was amended in 2004 so that mining operations are no longer required to maintain the lease. The State’s answer denies that the 2004 amendment was properly authorized. In March 2008, Jefferson Island served discovery requests on the State of Louisiana and sought a trial date in this lawsuit. Jefferson Island also asserted additional claims against the State seeking to obtain a declaratory ruling that Jefferson Island’s surface lease, under which it operates its existing two storage caverns, authorizes the creation of the two new expansion caverns separate and apart from the mineral lease challenged by the State.
In addition, in June 2008, the State of Louisiana passed legislation restricting water usage from the Chicot aquifer, which is a main source of fresh water required for the expansion of our Jefferson Island capacity. We contend that this legislation is unconstitutional and have sought to amend the pending litigation to seek a declaration that the legislation is invalid and cannot be enforced. Even if we are not successful on those grounds, we believe the legislation does not materially impact the feasibility of the expansion project. During 2008 and early 2009 we aggressively pursued our litigation. However, we are not able to predict the outcome of the litigation. As of January 2009, our current estimate of costs incurred that would be considered unusable if the Louisiana DNR was successful in terminating our lease and causing us to cease the expansion project is approximately $6 million.
Golden Triangle Storage In December 2006, we announced that our wholly-owned subsidiary, Golden Triangle Storage, plans to build a natural gas storage facility in the Beaumont, Texas area in the Spindletop salt dome. The project will initially consist of two underground salt dome storage caverns approximately a half-mile to a mile below ground that will hold about 12 Bcf of working natural gas storage capacity initially, or a total cavern capacity of approximately 17 Bcf. The facility potentially can be expanded to a total of five caverns with 38 Bcf of working natural gas storage capacity in the future based on customer interest. Golden Triangle Storage also intends to build an approximately nine-mile dual 24” natural gas pipeline to connect the storage facility with three interstate and three intrastate pipelines. In May 2007, Golden Triangle Storage held a non-binding open season for service offerings at the proposed facility, which resulted in indications of market support for the facility.
In December 2007, Golden Triangle Storage received an order from the FERC granting a Certificate of Public Convenience and Necessity to construct and operate the storage facility and approving market-based rates for services to be provided. We accepted this FERC order in January 2008. The FERC will serve as the lead agency overseeing the participation of a number of other federal, state and local agencies in reviewing and permitting the facility. In May 2008, Golden Triangle Storage started construction on the first cavern. Hurricanes Gustav and Ike caused some damage and minor delays in September 2008, but our timelines associated with commencement of commercial operations remain on schedule.
We previously estimated, based on then current prices for labor, materials and pad gas, that costs to construct the facility would be approximately $265 million. However, prices for labor and materials have risen significantly in the ensuing months, increasing the current estimated construction cost by approximately 10% to 20%. The actual project costs depend upon the facility’s configuration, materials, drilling costs, financing costs and the amount and cost of pad gas, which includes volumes of non-working natural gas used to maintain the operational integrity of the cavern facility. The costs for approximately 64% of these items have not been fixed and are subject to continued variability during construction. Further, since we are not able to predict whether these costs of construction will continue to increase, moderate or decrease from current levels, we believe that there could be continued volatility in the construction cost estimates.
AGL Networks This wholly owned subsidiary provides telecommunications conduit and available for use or “dark” fiber optic cable. AGL Networks leases and sells its fiber to a variety of customers in the Atlanta, Georgia and Phoenix, Arizona metropolitan areas, with a small presence in other cities in the United States. Its customers include local, regional and national telecommunications companies, internet service providers, educational institutions and other commercial entities. AGL Networks typically provides underground conduit and dark fiber to its customers under leasing arrangements with terms that vary from one to twenty years. In addition, AGL Networks offers telecommunications construction services to its customers. AGL Networks’ competitors are any entities that have laid or will lay conduit and fiber on the same route as AGL Networks in the respective metropolitan areas.
Corporate
Our corporate segment includes our nonoperating business units, including AGSC and AGL Capital. AGL Capital, our wholly owned subsidiary, provides for our ongoing financing needs through a commercial paper program, the issuance of various debt and hybrid securities, and other financing arrangements.
We allocate substantially all of AGSC’s operating expenses and interest costs to our operating segments in accordance with state regulations. Our corporate segment also includes intercompany eliminations for transactions between our operating business segments. Our EBIT results include the impact of these allocations to the various operating segments.
Our corporate segment also includes Pivotal Energy Development, which coordinates among our related operating segments the development, construction or acquisition of assets, such as storage facilities, related and complementary to our primary businesses within the southeastern, mid-Atlantic and northeastern regions in order to extend our natural gas capabilities and improve system reliability while enhancing service to our customers in those areas. The focus of Pivotal Energy Development’s commercial activities is to improve the economics of system reliability and natural gas deliverability in these targeted regions.
Employees
As of January 31, 2009, we employed a total of 2,389 employees, and we believe that our relations with them are good.
Additional Information
For additional information on our segments, see Exhibit 99.3, Item 7, “Management’s Discussion and Analysis of Financial Condition and Results of Operations” recast as required under the provisions of SFAS 160 under the caption “Results of Operations” and Exhibit 99.4, Item 8, “Updated Financial Statements and Supplementary Data,” recast as required under the provisions of SFAS 160 under the caption “Note 9, Segment Information”.
Information on our environmental remediation efforts, is contained in Exhibit 99.4, Item 8, “Updated Financial Statements and Supplementary Data,” recast as required under the provisions of SFAS 160 under the caption “Note 7, Commitments and Contingencies.”
Hedges
Changes in commodity prices subject a significant portion of our operations to earnings variability. Our nonutility businesses principally use physical and financial arrangements to reduce the risks associated with both weather-related seasonal fluctuations in market conditions and changing commodity prices. In addition, because these economic hedges may not qualify, or are not designated for hedge accounting treatment, our reported earnings for the wholesale services and retail energy operations segments reflect changes in the fair values of certain derivatives. These values may change significantly from period to period and are reflected as gains or losses within our operating revenues or our OCI for those derivative instruments that qualify and are designated as accounting hedges.
Elizabethtown Gas utilizes certain derivatives in accordance with a directive from the New Jersey Commission to create a hedging program to hedge the impact of market fluctuations in natural gas prices. These derivative products are accounted for at fair value each reporting period. In accordance with regulatory requirements, realized gains and losses related to these derivatives are reflected in purchased gas costs and ultimately included in billings to customers. Unrealized gains and losses are reflected as a regulatory asset or liability, as appropriate, in our condensed consolidated statements of financial position.
Seasonality
The operating revenues and EBIT of our distribution operations, retail energy operations and wholesale services segments are seasonal. During the heating season, natural gas usage and operating revenues are generally higher because more customers are connected to our distribution systems and natural gas usage is higher in periods of colder weather than in periods of warmer weather. Occasionally in the summer, Sequent’s operating revenues are impacted due to peak usage by power generators in response to summer energy demands. Seasonality also affects the comparison of certain statement of financial position items such as receivables, unbilled revenue, inventories and short-term debt across quarters. However, these items are comparable when reviewing our annual results.
Approximately 65% of these segments’ operating revenues and 74% of these segments’ EBIT for the year ended December 31, 2008 were generated during the first and fourth quarters of 2008, and are reflected in our statements of consolidated income for the quarters ended March 31, 2008 and December 31, 2008. Our base operating expenses, excluding cost of gas, interest expense and certain incentive compensation costs, are incurred relatively equally over any given year. Thus, our operating results can vary significantly from quarter to quarter as a result of seasonality.
Available Information
Detailed information about us is contained in our annual reports on Form 10-K, quarterly reports on Form 10-Q, current reports on Form 8-K, proxy statements and other reports, and amendments to those reports, that we file with, or furnish to, the SEC. These reports are available free of charge at our website, www.aglresources.com, as soon as reasonably practicable after we electronically file such reports with or furnish such reports to the SEC. However, our website and any contents thereof should not be considered to be incorporated by reference into this document. We will furnish copies of such reports free of charge upon written request to our Investor Relations department. You can contact our Investor Relations department at:
AGL Resources Inc.
Investor Relations - Dept. 1071
P.O. Box 4569
Atlanta, GA 30309-4569
404-584-3801
In Part III of our Annual Report on Form 10-K for the year ended December 31, 2008, we incorporate by reference from our Proxy Statement for our 2009 annual meeting of shareholders certain information. We expect to file that Proxy Statement with the SEC on or about March 16, 2009, and we will make it available on our website as soon as reasonably practicable. Please refer to the Proxy Statement when it is available.
Additionally, our corporate governance guidelines, code of ethics, code of business conduct and the charters of each of our Board of Directors committees are available on our website. We will furnish copies of such information free of charge upon written request to our Investor Relations department.