![](https://capedge.com/proxy/8-K/0001004155-13-000028/exhibit_99-15.jpg)
AGL Resources 2013 Investor Conference March 27, 2013
![](https://capedge.com/proxy/8-K/0001004155-13-000028/exhibit_99-16.jpg)
8:00 – 8:30 REGISTRATION & BREAKFAST REGISTRATION & BREAKFAST 8:30 – 8:35 Welcome Remarks Sarah Stashak Director, Investor Relations 8:35 – 8:50 CEO Remarks John Somerhalder Chairman, President & CEO 8:50 – 9:20 Financial Overview Drew Evans EVP & CFO 9:20 – 10:15 Distribution Operations Hank Linginfelter EVP, Distribution Operations 10:15 – 10:30 BREAK BREAK 10:30 – 11:00 Retail Operations Mike Braswell – President, Retail Energy Robin Boren – President, Retail Services 11:00 – 11:30 Wholesale Services & Midstream Pete Tumminello EVP, Wholesale Services 11:30 – 11:45 Cargo Shipping Drew Evans EVP & CFO 11:45 – 12:00 Final Q&A Final Q&A 12:00 – 1:00 LUNCH LUNCH Agenda *
![](https://capedge.com/proxy/8-K/0001004155-13-000028/exhibit_99-17.jpg)
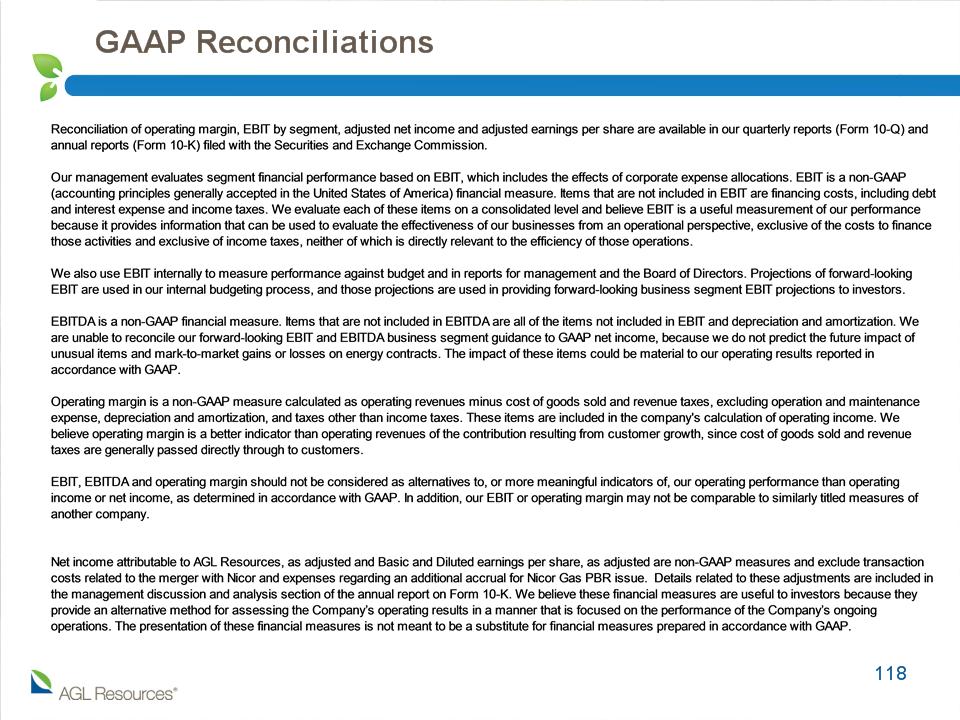
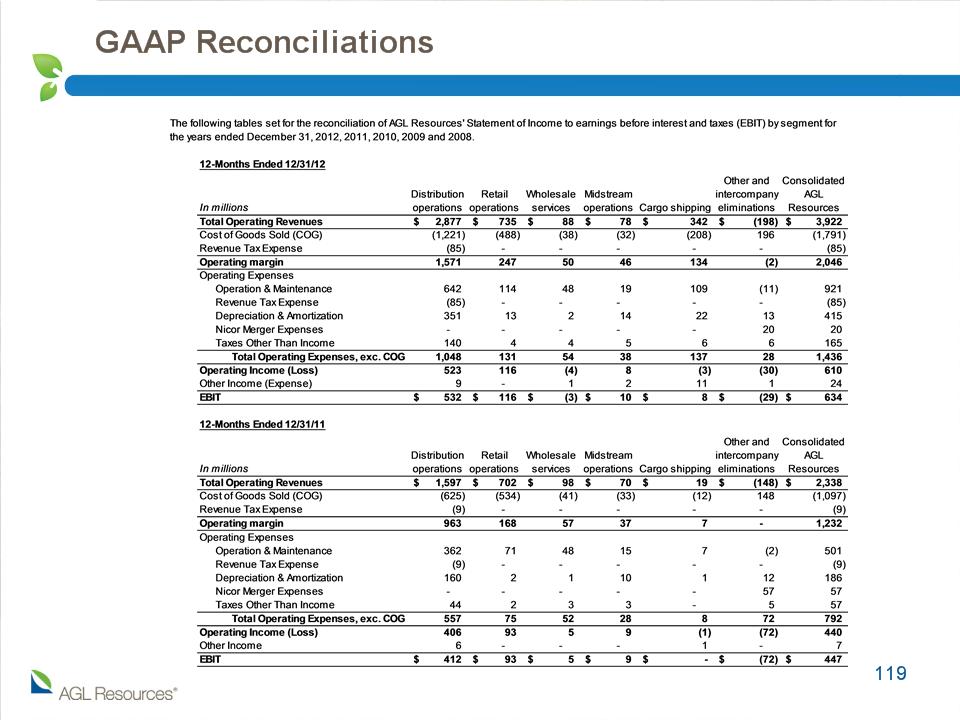
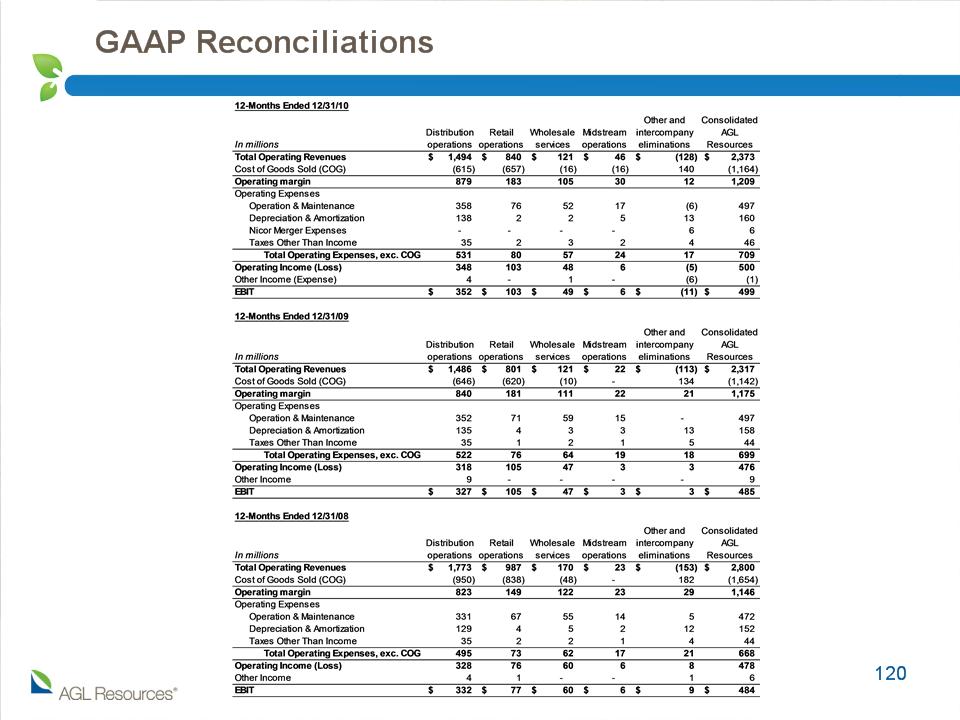
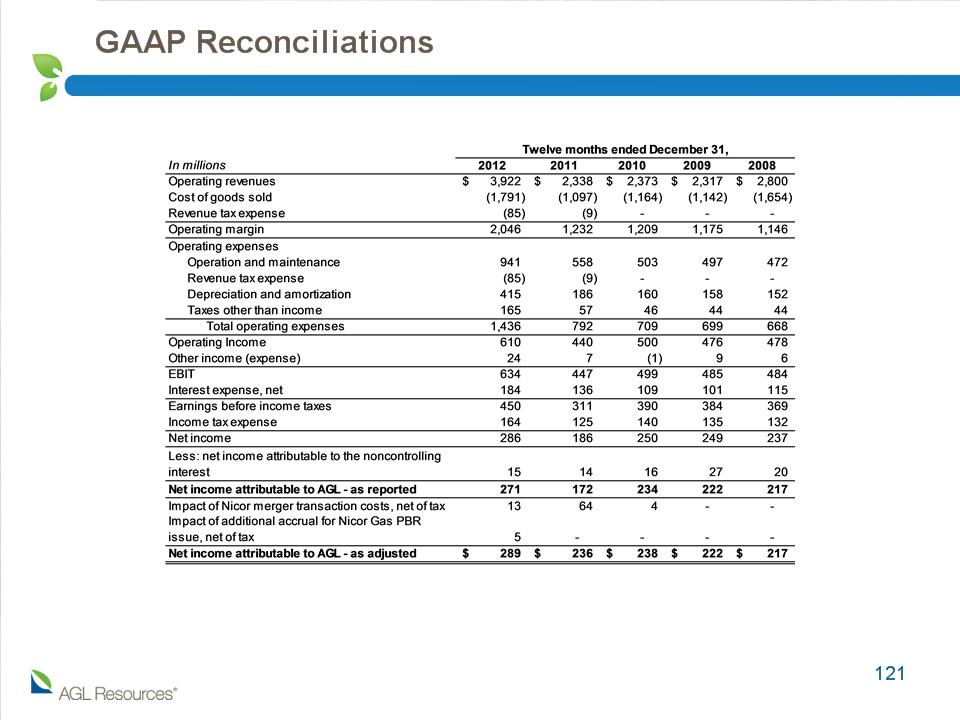
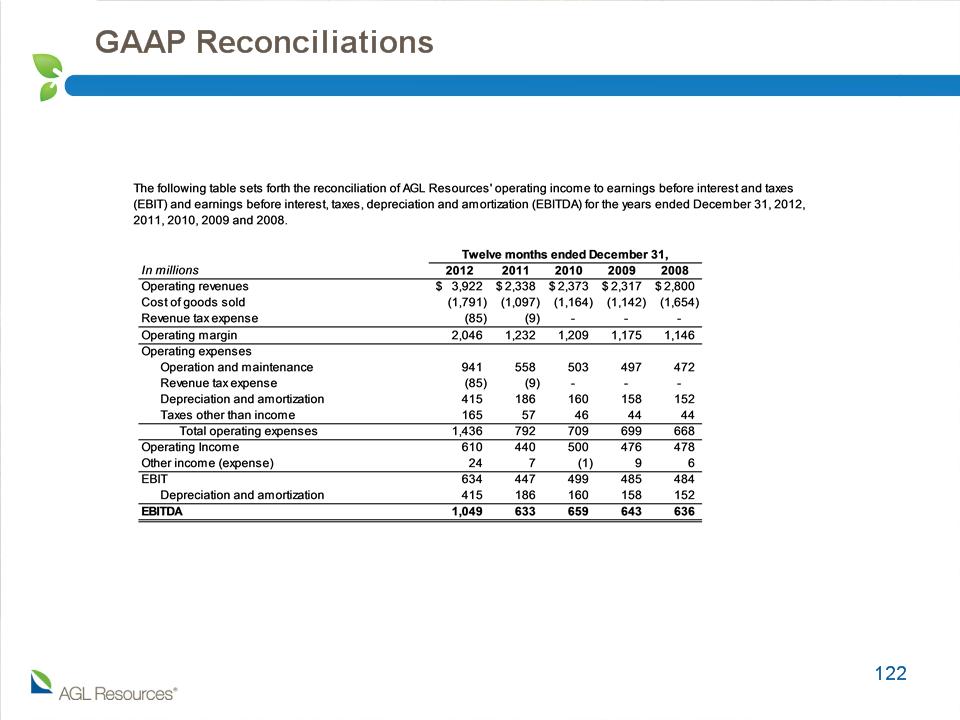
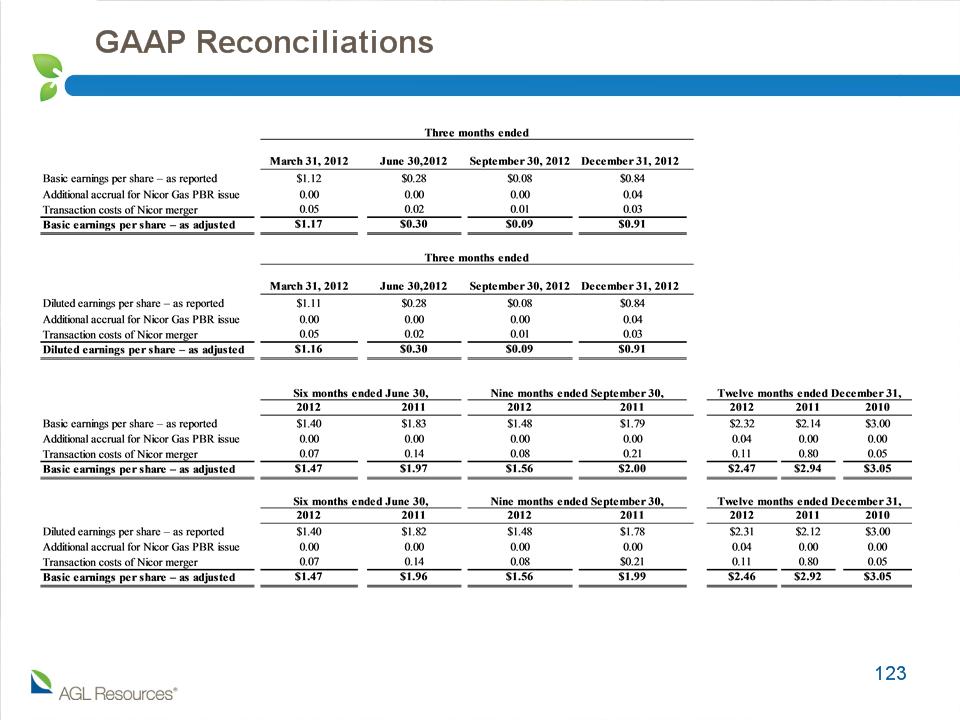
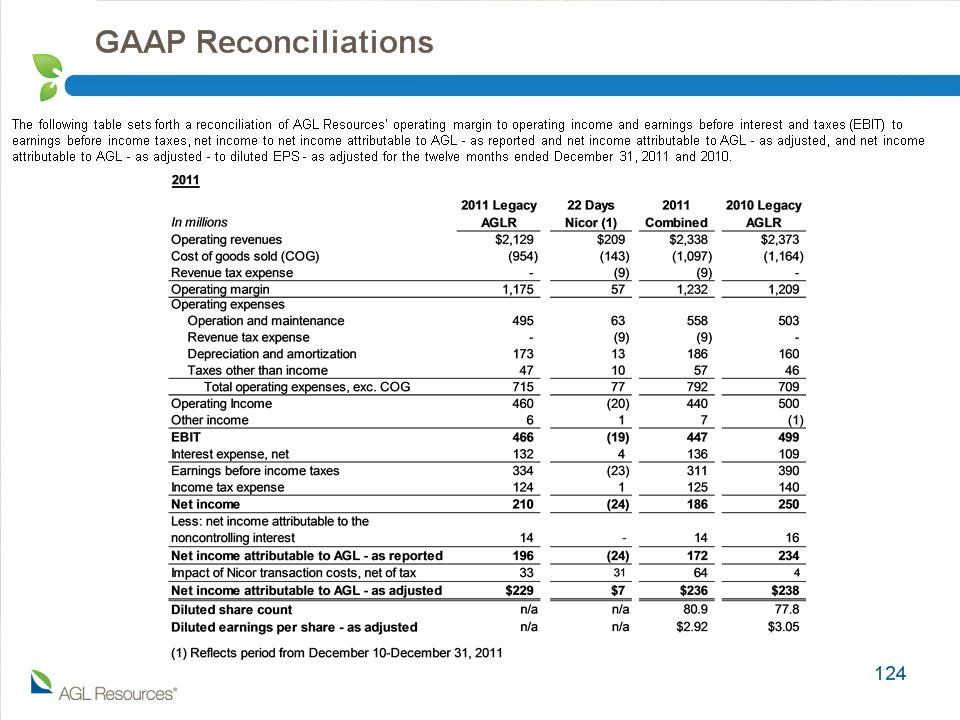
Cautionary Statements and Supplemental Information * Forward-Looking Statements Certain expectations and projections regarding our future performance referenced in this presentation, in other reports or statements we file with the SEC or otherwise release to the public, and on our website, are forward-looking statements. Senior officers and other employees may also make verbal statements to analysts, investors, regulators, the media and others that are forward-looking. Forward-looking statements involve matters that are not historical facts, such as statements regarding our future operations, prospects, strategies, financial condition, economic performance (including growth and earnings), industry conditions and demand for our products and services. Because these statements involve anticipated events or conditions, forward-looking statements often include words such as "anticipate," "assume," "believe," "can," "could," "estimate," "expect," "forecast," "future," "goal," "indicate," "intend," "may," "outlook," "plan," "potential," "predict," "project," "seek," "should," "target," "would," or similar expressions. Forward-looking statements contained in this presentation include, without limitation, statements regarding future earnings per share, segment EBIT and related guidance, capital expenditures, impact of bonus depreciation, pension and OPEB expenses, growth of our retail services business, dividend growth, contracted capacity rates, expected increase in natural gas power generation, expected storage rollout schedule and value and our opportunities and priorities for 2013. Our expectations are not guarantees and are based on currently available competitive, financial and economic data along with our operating plans. While we believe our expectations are reasonable in view of the currently available information, our expectations are subject to future events, risks and uncertainties, and there are several factors - many beyond our control - that could cause results to differ significantly from our expectations. Such events, risks and uncertainties include, but are not limited to, changes in price, supply and demand for natural gas and related products; the impact of changes in state and federal legislation and regulation, including changes related to climate change; actions taken by government agencies on rates and other matters, including regulatory approval of new partnerships; concentration of credit risk; utility and energy industry consolidation; the impact on cost and timeliness of construction projects by government and other approvals; development project delays; adequacy of supply of diversified vendors; unexpected change in project costs, including the cost of funds to finance these projects; the impact of acquisitions and divestitures, including the Nicor merger; limits on natural gas pipeline capacity; direct or indirect effects on our business, financial condition or liquidity resulting from a change in our credit ratings or the credit ratings of our counterparties or competitors; interest rate fluctuations; financial market conditions, including disruptions in the capital markets and lending environment and the current economic uncertainty; general economic conditions; uncertainties about environmental issues and the related impact of such issues; the impact of changes in weather, including climate change, on the temperature-sensitive portions of our business; the impact of natural disasters such as hurricanes on the supply and price of natural gas; the outcome of litigation; acts of war or terrorism; and other factors which are provided in detail in our filings with the Securities and Exchange Commission. Forward-looking statements are only as of the date they are made, and we do not undertake to update these statements to reflect subsequent changes. Supplemental Information Company management evaluates segment financial performance based on earnings before interest and taxes (EBIT), which includes the effects of corporate expense allocations and on operating margin. EBIT is a non-GAAP (accounting principles generally accepted in the United States of America) financial measure that includes operating income, other income and expenses. Items that are not included in EBIT are financing costs, including debt and interest expense and income taxes. The company evaluates each of these items on a consolidated level and believes EBIT is a useful measurement of our performance because it provides information that can be used to evaluate the effectiveness of our businesses from an operational perspective, exclusive of the costs to finance those activities and exclusive of income taxes, neither of which is directly relevant to the efficiency of those operations. In addition to EBIT, the company also uses the non-GAAP financial measure of earnings before interest, taxes, depreciation and amortization (EBITDA) to evaluate segment financial performance. Management believes that EBITDA may provide additional information with respect to the Company's performance or ability to meet its future debt service, capital expenditures and working capital requirements. Operating margin is a non-GAAP measure calculated as operating revenues minus cost of goods sold and revenue taxes, excluding operation and maintenance expense, depreciation and amortization, and taxes other than income taxes. These items are included in the company's calculation of operating income. The company believes operating margin is a better indicator than operating revenues of the contribution resulting from customer growth, since cost of goods sold and revenue taxes are generally passed directly through to customers. In addition, in this presentation, the company has presented a non-GAAP measure of both its net income and its earnings per share each adjusted to exclude expenses incurred with respect to the Nicor Inc. (Nicor) merger and expenses regarding an additional accrual for the Nicor Gas performance-based rate (PBR) issue. As the company does not routinely engage in transactions of the magnitude of the Nicor merger, and consequently does not regularly incur transaction related expenses with correlative size, the company believes presenting net income and EPS excluding Nicor merger expenses provides investors with an additional measure of the company’s core operating performance. Additionally, the company has excluded the additional accrual for the Nicor Gas PBR issue as it was a one-time expense that is not expected to be recurring. EBIT, EBITDA, operating margin, adjusted net income and adjusted EPS should not be considered as alternatives to, or more meaningful indicators of, the company's operating performance than operating income, net income attributable to AGL Resources Inc. or EPS as determined in accordance with GAAP. In addition, the company's EBIT, EBITDA, operating margin, adjusted net income and adjusted EPS may not be comparable to similarly titled measures of another company. Reconciliations of non-GAAP financial measures referenced in this presentation are available on the company’s Web site at www.aglresources.com
![](https://capedge.com/proxy/8-K/0001004155-13-000028/exhibit_99-18.jpg)
Presenter Bios
![](https://capedge.com/proxy/8-K/0001004155-13-000028/exhibit_99-19.jpg)
John W. Somerhalder II Chairman, President and Chief Executive Officer AGL Resources John W. Somerhalder II was named president and chief executive officer of AGL Resources (NYSE:GAS) in March 2006 and elected as chairman of the company’s board of directors in November 2007. Mr. Somerhalder joined AGL Resources from El Paso Corporation where he spent almost 30 years, rising through the ranks from engineer to president of El Paso Pipeline Group and executive vice president of El Paso Corporation. Mr. Somerhalder is a member of the board of directors of the American Gas Association, which he chaired in 2011. He also serves on the boards of the Gas Technology Institute, the Georgia Chamber of Commerce and the Metro Atlanta Chamber of Commerce. He has served as past chairman of the Interstate Natural Gas Association of America. He was elected director of Crestwood Gas Services GP LLC in July 2007. Mr. Somerhalder is chairman of the board of the Atlanta BeltLine, Inc., which is leading the development of the Atlanta BeltLine along 22 miles of historic railroad around the city. A member of the board of the United Way of Metropolitan Atlanta, he successfully chaired the 2009 United Way Campaign for metro Atlanta during difficult economic times and served an unprecedented second term as chair of the 2010 campaign. Mr. Somerhalder holds a bachelor of science degree in chemical engineering from the University of Arizona. He and his wife, Rebecca, live in Atlanta. They have four grown children and five grandchildren. *
![](https://capedge.com/proxy/8-K/0001004155-13-000028/exhibit_99-110.jpg)
Andrew W. (Drew) Evans Executive Vice President and Chief Financial Officer AGL Resources Andrew Evans was named senior vice president and chief financial officer of AGL Resources (NYSE:GAS) in September 2005 and promoted to executive vice president, chief financial officer in May 2006. In this capacity, Mr. Evans directs finance, accounting and information technology for all AGL Resources businesses, as well as investor relations and the company’s strategic planning functions. He also has responsibility for various unregulated subsidiaries. Mr. Evans joined AGL Resources in May 2002 as vice president of finance and treasurer, where he was responsible for the company’s treasury and finance operations including corporate finance, cash management, rating agency relationships, pension management and corporate planning and analysis. He also played a key role in supporting the company’s corporate development and growth initiatives, and assisted in deal evaluation, structuring and financing. Mr. Evans came to AGL Resources from Mirant Corporation (formerly Southern Energy Inc.) where he served in various finance and business development roles over a nine-year period. Prior to Mirant, Mr. Evans was employed by National Economic Research Associates and the Federal Reserve Bank of Boston. Mr. Evans serves as chairman of the board of Zoo Atlanta and on the finance committees of Grady Memorial Hospital, Refugee Family Services and the Georgia Council for Economic Education, where he is also a board member. Mr. Evans is a graduate of Emory University and lives in Atlanta with his wife, Faye. *
![](https://capedge.com/proxy/8-K/0001004155-13-000028/exhibit_99-111.jpg)
Henry P. (Hank) Linginfelter Executive Vice President, Distribution Operations AGL Resources Henry P. “Hank” Linginfelter was named executive vice president, distribution operations, for AGL Resources (NYSE:GAS) in December 2011. As chairman and CEO of the company's seven utilities, Mr. Linginfelter is responsible for all operating functions of the utilities including field operations, customer experience, gas operations, construction, energy efficiency programs and utility marketing and sales. In addition he has corporatewide responsibility for regulatory and governmental affairs, economic development, supply chain, engineering and environmental health and safety. In his years of service with AGL Resources, Mr. Linginfelter has assumed increasing levels of responsibility and has played a key role in the company’s operations, marketing and regulatory activities. He has more than 28 years of experience in utility operations with AGL Resources. Prior to his current role, Mr. Linginfelter had oversight responsibilities for the company’s mid-Atlantic operations. This included the integration and management of Virginia Natural Gas (Virginia) in 2000 and Elizabethtown Gas (New Jersey) in 2004. He resided in Virginia and served as president of each of those utilities along with Elkton Gas (Maryland) until 2007 when he returned to Atlanta to oversee utility operations companywide. Mr. Linginfelter currently serves on the boards of Central Atlanta Progress, Metro Atlanta Chamber of Commerce, The Nature Conservancy of Georgia, Georgia Allies, Boy Scouts Atlanta Area Council, Southern Gas Association and Jekyll Island Foundation, where he is chairman. He also serves on the Leadership Council of the American Gas Association and is a graduate of the Leadership Atlanta Class of 2009. Mr. Linginfelter has a bachelor’s degree in industrial management from Georgia Tech and a master’s degree in business administration from Georgia State University. He and his wife, Sandy, and their two children reside in Atlanta and attend Buckhead Church. *
![](https://capedge.com/proxy/8-K/0001004155-13-000028/exhibit_99-112.jpg)
Michael (Mike) Braswell President of Retail Energy, AGL Resources President and CEO, SouthStar Energy Services AGL Resources Michael Braswell was named president of retail energy for AGL Resources (NYSE:GAS) in December 2011. He is responsible for ensuring the expansion and continued success of AGL Resources' retail energy operations in multiple states. To that end, he continues to serve as CEO of SouthStar Energy Services, LLC, a joint venture between AGL Resources and Piedmont Natural Gas Company. SouthStar serves more than half a million customers. Mr. Braswell has more than 20 years of experience in the natural gas industry, working in both regulated and deregulated environments. Prior to being named CEO of SouthStar, he served as executive vice president and chief operating officer for SouthStar. He also has held positions as vice president, retail markets, and as vice president, customer service and strategic planning. Before joining SouthStar, Mr. Braswell held various key positions over a 10-year period with AGL Resources, working in marketing, sales management, rates and strategic planning. Mr. Braswell 's commitment to giving back to the communities that SouthStar serves has resulted in his team of employee volunteers receiving national and local awards for outstanding community service. A graduate of Georgia Tech, Mr. Braswell earned a bachelor's degree in industrial engineering. He later earned a master of business administration degree (concentration in finance) from Georgia State University. He resides in Atlanta with his wife and four children. *
![](https://capedge.com/proxy/8-K/0001004155-13-000028/exhibit_99-113.jpg)
Robin B. Boren President, Retail Services AGL Resources Robin B. Boren was named president, Retail Services for AGL Resources (NYSE:GAS) in June 2012. She is responsible for overseeing and expanding the company's home services and solutions provided through Nicor National. The company offers proven, turnkey solutions through a wide range of warranty repair and service plans that provide value and peace of mind for utility customers. Previously, Ms. Boren served as assistant treasurer and was responsible for corporate finance functions, including bank and rating agency relationships, capital market and M&A activities. In this capacity, Ms. Boren played a key role in the company's acquisition of Nicor Inc in 2011. She was responsible for securing committed financing for the cash consideration of the acquisition, the successful execution of which helped create the country's largest natural gas only distribution company based on customer count. During the course of 2011, Ms. Boren led the financing or refinancing of short- and long-term debt totaling over $2 billion for the company. Since joining AGL Resources in May 2009, Ms. Boren has served in a variety of roles, applying her business and finance expertise to deliver exceptional financial results. Prior to joining AGL Resources, she was employed by SunTrust Robinson Humphrey, Inc. for 12 years, predominantly as a senior capital markets originator. Ms. Boren received her bachelor's degree in accounting and business administration from Presbyterian College and earned her master of business administration from the Wharton School at the University of Pennsylvania. She also completed a study abroad program at La Sorbonne in Paris, France. A native of Georgia, Ms. Boren is based in Naperville, Illinois, where she lives with her husband and daughter. *
![](https://capedge.com/proxy/8-K/0001004155-13-000028/exhibit_99-114.jpg)
Peter (Pete) Tumminello Executive Vice President, Wholesale Services President, Sequent Energy Management AGL Resources Peter Tumminello was named executive vice president, wholesale services, for AGL Resources (NYSE:GAS) in December 2011. In this role, he has executive oversight for AGL Resources’ marketing and trading business, storage business and fuels business. He continues to serve as president of Sequent Energy Management, leading all aspects of Sequent's operations including natural gas asset management, origination, trading, producer services, support functions and long-term growth strategy. Mr. Tumminello brings more than 20 years experience in natural gas marketing and trading and more than 27 years in the energy industry to his position. He previously served as executive vice president of business development and support for Sequent and as vice president of corporate development for AGL Resources. In this capacity, Mr. Tumminello and his team helped expand Sequent’s business into new regions and products while supporting AGL Resources’ affiliate utilities through successful asset management programs. Mr. Tumminello joined the executive management team of Sequent in August 2003 as vice president of asset management and origination. He has served on the AGL Resources Policy Committee since April 2010. Prior to joining AGL Resources and Sequent, Mr. Tumminello was vice president of energy supply for Green Mountain Energy Company, and he worked for TPC Corp and ARCO Oil and Gas Company in various capacities in energy marketing, storage and transportation asset management, petroleum engineering, finance and planning, and project evaluation. Mr. Tumminello earned his master of business administration from the University of Southwestern Louisiana and his bachelor of science in petroleum engineering from Louisiana Tech University. He serves on the advisory board for Tulane University's Energy Institute and the advisory board for the Arc of Katy. A native of New Orleans, Mr. Tumminello lives with his wife and two daughters in Katy, Texas. *
![](https://capedge.com/proxy/8-K/0001004155-13-000028/exhibit_99-115.jpg)
CEO Perspective John Somerhalder Chairman, President & CEO
![](https://capedge.com/proxy/8-K/0001004155-13-000028/exhibit_99-116.jpg)
AGL Resources - Footprint *
![](https://capedge.com/proxy/8-K/0001004155-13-000028/exhibit_99-117.jpg)
AGL Resources - Business Overview Distribution Operations Retail Operations Wholesale Services Midstream Operations Cargo Shipping Serves 4.5 million customers across 7 states Performance driven by customer growth and/or usage, balanced regulatory outcomes and prudent infrastructure investment Serves 1.5 million customers across 15 states Sustained performance driven by market leading position in Georgia and growth opportunities in retail services Provides asset management services to AGLR’s utilities (except Nicor Gas), third party utilities and other wholesale customers Business remains challenged due to low natural gas price volatility Consists primarily of high deliverability natural gas storage facilities Business remains challenged due to weak seasonal spreads and continued oversupply of natural gas Provides shipping services to Caribbean and Bahamian islands Includes Seven Seas Insurance & investment in Triton containers Business improving due to higher volumes and increased rates *
![](https://capedge.com/proxy/8-K/0001004155-13-000028/exhibit_99-118.jpg)
AGL Resources - 2012 Shareholder Return Source: Thomson Reuters Peer Average: 3.8% LDC Average: -3.3% Note: ATO – Atmos; CNP – CenterPoint; NI – NiSource; NJR – New Jersey Resources; OKE – ONEOK; PNY – Piedmont Natural Gas; SRE – Sempra; SWX – Southwest Gas Corp.; TEG – Integrys Energy Group; UGI – UGI Corp.; VVC – Vectren; WGL – WGL Holdings LDC Peers: ATO, NJR, PNY, SWX, WGL *
![](https://capedge.com/proxy/8-K/0001004155-13-000028/exhibit_99-119.jpg)
AGL Resources - 3-Year Total Shareholder Return Source: Thomson Reuters Peer Average: 50.4% LDC Average: 35.8% *
![](https://capedge.com/proxy/8-K/0001004155-13-000028/exhibit_99-120.jpg)
AGL Resources – Dividend Track Record Management and Board of Directors have demonstrated a commitment to dividend growth and have established a strong track record of regular dividend increases (1) 2011 payout ratio based on adjusted EPS of $2.92; 2012 payout ratio based on adjusted EPS of $2.46 *
![](https://capedge.com/proxy/8-K/0001004155-13-000028/exhibit_99-121.jpg)
AGL Resources - 2013 Opportunities and Challenges Distribution improvement expected to be offset by: Incentive compensation, assuming performance targets achieved (essentially none awarded in 2012) Bonus depreciation Slow economic recovery makes new customer additions more challenging Continued adoption of fixed-price plans in Georgia retail market creates headwinds Low volatility and tight seasonal storage spreads challenge both Wholesale Services and Midstream Operations Opportunities Challenges Normal or near-normal weather likely to create uplift vs. 2012 for Distribution Operations Attractive natural gas pricing relative to other fuel sources creates opportunity Continued regulated infrastructure investment expected to generate solid returns Retail operations expected to remain stable, with modest growth in retail services Strong storage rollout schedule at Sequent Improving profitability at Cargo Shipping *
![](https://capedge.com/proxy/8-K/0001004155-13-000028/exhibit_99-122.jpg)
AGL Resources - 2013 Priorities Invest necessary capital to maintain and enhance system reliability Remain a low-cost leader within the industry Opportunistically expand system and capitalize on potential customer conversions Maintain margins in Georgia and Illinois while continuing to expand into other profitable retail markets Integrate new retail services business and expand reach Maximize strong storage and transportation rollout value created in 2012 Effectively perform on existing asset management agreements and expand customers Bring cost structure in line with market fundamentals Optimize storage portfolio, including expiring contracts Complete GTS Cavern 1 re-water and place back into service Pursue land-based LNG transportation opportunities Effectively control expenses and focus on capital discipline in each of our business segments Increase vessel utilization and improve margin per TEU Prudently deploy capital investment and diligently manage operating costs Distribution Expenses Wholesale Midstream Shipping Retail *
![](https://capedge.com/proxy/8-K/0001004155-13-000028/exhibit_99-123.jpg)
Financial Overview Drew Evans EVP & Chief Financial Officer
![](https://capedge.com/proxy/8-K/0001004155-13-000028/exhibit_99-124.jpg)
Optimize service functions that are scalable Accelerate returns on regulated infrastructure investments Improve utility returns by operating complementary non-regulated businesses Maintain financial integrity in utility and non-regulated businesses Grow earnings and dividends Maximize return on invested capital Focus on total shareholder return Ensure management and employee incentives are properly aligned with shareholder interests Strategic Priorities * Business Financial Investors
![](https://capedge.com/proxy/8-K/0001004155-13-000028/exhibit_99-125.jpg)
2012 Financial Results * 2012 GAAP EPS of $2.31 per diluted share Adjusted diluted EPS of $2.46, excluding $18 million in after-tax costs related to Nicor merger and additional PBR accrual Warmer-than-normal (10-year average) weather at distribution and retail segments reduced EPS by approximately $0.18 YTD Distribution segment EBIT up 29% through 2012 vs. 2011, primarily due to a full year of contribution from Nicor Gas Retail segment EBIT up 25%, primarily due to addition of Nicor retail businesses Wholesale Services storage rollout schedule at $27 million as of 12/31/12 vs. $3 million at 12/31/11 Midstream and cargo shipping segments remain challenged due to market fundamentals Interest expense higher by $48 million due to merger-financing Note: Please review the AGL Resources 10-K as filed with the SEC on 2/6/2013 for detailed information. Operating Margin, EBIT, Adjusted Net Income and Adjusted EPS are non-GAAP measures. Please see the appendix to this presentation or visit the investor relations section of www.aglresources.com for a reconciliation to GAAP. (1) Results for 22 days of legacy Nicor businesses are included in 2011 GAAP results. (2) Adjusted for Cost of Goods Sold and revenue tax expenses for Nicor Gas which are passed directly through to customers. (3) Adjusted net income and adjusted EPS exclude Nicor-related merger costs and additional PBR accrual of approximately $18 million, net of tax, for 2012 and merger-related costs of $64 million, net of tax, for 2011.
![](https://capedge.com/proxy/8-K/0001004155-13-000028/exhibit_99-126.jpg)
Balance Sheet Highlights * Solid balance sheet with significant opportunity to fund capital requirements Good access to capital markets Company credit metrics support solid, investment-grade ratings $4.9 billion debt outstanding Long-term debt $3.4 billion Current portion of long-term debt $0.2 billion Short-term debt of $1.4 billion Debt to Cap Ratio: 58%
![](https://capedge.com/proxy/8-K/0001004155-13-000028/exhibit_99-127.jpg)
2013 Business Unit Earnings Drivers * Distribution Operations Investment in regulatory infrastructure programs, dampened by bonus depreciation Incentive compensation estimated at targeted amount in 2013 vs. essentially none in 2012 due to 2012 targets not being achieved Retail Operations Highly competitive Georgia retail energy market, offset by growth in retail services Wholesale Services Strong storage rollout schedule entering 2013, but low volatility and seasonal price spreads continue to challenge business Midstream Operations Expiration of higher-rate contracts replaced with lower rates in current market, resulting in headwinds for segment Cargo Shipping Focus on increased profitability per TEU (twenty-foot-equivalent unit) expected to drive improved performance
![](https://capedge.com/proxy/8-K/0001004155-13-000028/exhibit_99-128.jpg)
Impact of Bonus Depreciation on Rate Base Growth * Bonus depreciation dampens impact of rate base growth 50% bonus depreciation in effect for 2013 Rate Base Growth Including Infrastructure Rider Investment
![](https://capedge.com/proxy/8-K/0001004155-13-000028/exhibit_99-129.jpg)
2013 Pension and OPEB Funding and Costs * AGL Resources has consistently funded at least the minimum required to maintain 80% funding level Nicor acquisition created opportunity to merge AGL and Nicor Gas plans Merger of pension plans completed 12/31/2012 No contributions required in 2013 and future contributions significantly reduced Key 2013 pension assumptions: Discount rate: 4.15% Expected return on plan assets: 7.75% Pension & OPEB Expense ($ millions) 2012A 2013E AGL Resources (consolidated) – net of capitalizations $53 $56 - $63 Pension Contributions ($ millions) 2012A 2013E AGL Resources (consolidated) $40 $ -- Pension Sensitivities EPS Change 1% change in assumed return on pension plan assets + / - $0.04 1% change in pension discount rate + / - $0.07
![](https://capedge.com/proxy/8-K/0001004155-13-000028/exhibit_99-130.jpg)
Effective Expense Management * O&M per Customer O&M used to calculate O&M per customer excludes: rider-based O&M expenses that are recoverable, the Nicor Gas PBR matter, partial year of NUI expenses in 2004 and partial year of Nicor Gas expenses in 2011. “Other O&M” includes primarily contractors, system maintenance and materials.
![](https://capedge.com/proxy/8-K/0001004155-13-000028/exhibit_99-131.jpg)
Wholesale Services Quarterly EBIT Volatility * millions Quarterly Wholesale Services EBIT contributions are volatile due primarily to mark-to-market accounting and not necessarily reflective of economic value generated by Wholesale Services EBIT is a non-GAAP measure. A reconciliation to GAAP is available in the appendix of this presentation as well as at www.aglresources.com.
![](https://capedge.com/proxy/8-K/0001004155-13-000028/exhibit_99-132.jpg)
2012 Adjusted EBIT to 2013 Estimated EBIT * On an adjusted basis consolidated EBIT is expected to be up approximately $43 million vs. 2012
![](https://capedge.com/proxy/8-K/0001004155-13-000028/exhibit_99-133.jpg)
2012 Adjusted to exclude PBR accrual. Retail Energy Operations segment includes EBIT related to SouthStar at the 100% level, before minority interest distribution to 15% partner Piedmont. 2010, 2011 and 2012 EPS are adjusted for expenses related to the merger with Nicor. Additionally, 2011 interest expenses exclude $25 million ($16 million net of taxes) for debt issuance costs on pre-funding the cash portion of the purchase consideration. EPS excludes the results of Wholesale Services to remove the volatility to consolidated EPS created by mark-to-market accounting. 2013 Earnings Guidance *
![](https://capedge.com/proxy/8-K/0001004155-13-000028/exhibit_99-134.jpg)
2013 Guidance Assumptions * AGL Resources expects consolidated diluted EPS to be in the range of $2.50 - $2.70 for 2013 Excluding Wholesale Services, EPS range expected to be $2.40 - $2.50 Key assumptions include: Normal weather Exclusion of mark-to-market impacts (applies to consolidated range) Pension and OPEB expense of $56 million to $63 million, net of capitalizations 2013 cap ex estimated at $690 million Approximately $650 million of utility cap ex expected in 2013 vs. $704 million in 2012 Approximately $40 million of non-utility cap ex expected in 2013 vs. $80 million in 2012 Average diluted shares outstanding of 118.5 million Effective tax rate of 37.9% Continued low volatility in natural gas prices Successful implementation of regulatory infrastructure and rate programs Approximate quarterly earnings contribution percentages: Distribution: 1Q – 40%; 2Q – 15%; 3Q – 15%; 4Q – 30% Retail: 1Q – 50%; 2Q – 10%; 3Q – 5%; 4Q – 35% Cargo Shipping: Expected primarily in 4Q
![](https://capedge.com/proxy/8-K/0001004155-13-000028/exhibit_99-135.jpg)
Net Investment * 2012 EBIT Contribution Net investment based upon 6/30/12, which more accurately reflects an average net investment for Wholesale Services vs. 12/31/12. (1) Wholesale Services did not contribute EBIT in 2012. Net Investment (MM) $195 $301 $556 $356 $6,167 % Total Net Investment 3% 4% 7% 5% 81% 80% 1% 17% 2%
![](https://capedge.com/proxy/8-K/0001004155-13-000028/exhibit_99-136.jpg)
Capital Expenditures * Note: “Other” includes facilities, fleet, IT, Retail, Wholesale, AGL Networks, biosolids, landfill gas, Cargo Shipping and Trussville LNG $785 $700 $705 $750 millions Regulatory infrastructure capex spending expected to drop temporarily in 2014 due to timing of expiring programs and initiation of new programs, primarily in Georgia Additional capital could be deployed in Illinois pending outcome of proposed depreciation legislation Increase in “Other” capex due to expectation for increased investment in LNG initiatives
![](https://capedge.com/proxy/8-K/0001004155-13-000028/exhibit_99-137.jpg)
EBITDA and Available Cash Increasing * millions EBITDA is a non-GAAP measure. A reconciliation to GAAP can be found in the appendix of this presentation and at www.aglresources.com.
![](https://capedge.com/proxy/8-K/0001004155-13-000028/exhibit_99-138.jpg)
Comparative Credit Metrics * Credit Metrics 2012 2013E Debt to Cap Debt to EBITDA Dividend Payout Ratio1 FFO/Total Debt FFO Interest Coverage 58.9% 4.7x 75% 17.5% 5.6x 58.5% 4.4x 72% 15.8% 5.0x (1) Dividend payout ratio for 2012 assumes adjusted non-GAAP EPS of $2.46 and normalized dividend of $1.84
![](https://capedge.com/proxy/8-K/0001004155-13-000028/exhibit_99-139.jpg)
Debt Maturity Schedule * AGLR average interest rate: 5.0% / Peer group average interest rate: 5.3% AGLR average duration: 13.1 years / Peer group average duration: 12.9 years 2013 refinancing expected to further improve average rate and duration
![](https://capedge.com/proxy/8-K/0001004155-13-000028/exhibit_99-140.jpg)
2013 Priorities * Align capital allocation with strategic plan to grow regulated business Invest regulated capital in programs that minimize regulatory lag and the recovery cycle Optimize current wholesale and midstream businesses in a sustained low volatility market Continue aggressive cost-control reduction throughout the business Maintain strong balance sheet and liquidity profile, and solid investment-grade ratings Maintain commitment to sustainable annual dividend growth Deliver on commitments to shareholders
![](https://capedge.com/proxy/8-K/0001004155-13-000028/exhibit_99-141.jpg)
Financial Outlook * Target five-year net income CAGR of 4%-6% Expect rate base growth of approximately 4% Upside potential strong in non-utility businesses, though timing is less predictable New opportunities such as pipeline investment could provide for additional regulated earnings Target annual dividend growth of 2.0% - 2.5% Increase dividend on a consistent basis, based upon sustainable cash flows primarily from distribution and retail businesses Balance return to shareholders with longer-term investment in the business
![](https://capedge.com/proxy/8-K/0001004155-13-000028/exhibit_99-142.jpg)
Value Proposition * 2013 P/E Multiples TTM EV/EBITDA Multiples Source: Goldman Sachs
![](https://capedge.com/proxy/8-K/0001004155-13-000028/exhibit_99-143.jpg)
Distribution Operations Hank Linginfelter EVP, Distribution Operations *
![](https://capedge.com/proxy/8-K/0001004155-13-000028/exhibit_99-144.jpg)
Overview Largest LDC by customer count in U.S. 4.5 million customers Approximately 1 out of every 16 meters in U.S. served by an AGLR utility 80,100 miles of pipeline Aggregate rate base of $4.7 billion Annual capex ~$650 million Approximately 30% of capex under specific recovery programs ~4,400 employees Near or better than upper quartile safety ratings for on-the-job injuries and days away from work Key Statistics *
![](https://capedge.com/proxy/8-K/0001004155-13-000028/exhibit_99-145.jpg)
Distribution – EBIT Track Record Estimated 2012-2017 5-year CAGR: EBIT 3%-4%; Rate Base ~4% 2011 includes 22 days of operation from Nicor Gas; (2) 2012 excludes $8 million expense related to Nicor Gas PBR matter. *
![](https://capedge.com/proxy/8-K/0001004155-13-000028/exhibit_99-146.jpg)
Distribution – 2013 EBIT Guidance vs. 2012 * $540 $540 $24 $32 $4 $31 $19 $4 $3 $1 $2
![](https://capedge.com/proxy/8-K/0001004155-13-000028/exhibit_99-147.jpg)
Return on Equity * 7.90% (1) 7.90% represents the ROE assuming normal weather at Nicor Gas
![](https://capedge.com/proxy/8-K/0001004155-13-000028/exhibit_99-148.jpg)
Strategic Focus Focus on Safety Proven track record with year-over-year safety performance near or better than the AGA Mega LDC upper quartile, when compared to peer companies with On the Job Injury (OJI) rates, Lost and Restricted Work (DART) rates and Motor Vehicle Accident (MVA) rates Cost Containment Continue to control costs by focusing on productivity improvements, leveraging common systems and shared services model, standardization and scale Minimize Regulatory Lag Expansion of existing infrastructure programs and rate recovery mechanisms that allow for recovery outside of a rate case Successful Integration Successful integration of acquired companies into AGL Resources - continue to identify and adopt best practice(s); Continue to honor Illinois merger commitments Position for Growth Capitalize on improving market conditions; Continue to be responsive to emerging market opportunities and regional demand to drive growth *
![](https://capedge.com/proxy/8-K/0001004155-13-000028/exhibit_99-149.jpg)
Key Regulatory Outcomes 2008 2009 2010 2011 2012 2013 December, 2009— Elizabethtown Gas Rate Case $2.9M rate increase New depreciation rates decreased expense $5M May, 2010— Chattanooga Gas Rate Case $60K rate increase Revenue decoupling New depreciation rates decreased expense $2M — October, 2010 Atlanta Gas Light Rate Case $26.7M rate increase December, 2011— Virginia Natural Gas Rate Case $15.4M rate increase October 2009 AGLC STRIDE Program Approved April 2009 ETG UIE Program Approved December 2008 VNG CARE / RNA Approved (Expired December, 2011) November, 2011 AGLC CNG Station Construction June, 2012 VNG SAVE Program Approved * December, 2011 Nicor Merger Approved December, 2012 VNG CARE Program Filed
![](https://capedge.com/proxy/8-K/0001004155-13-000028/exhibit_99-150.jpg)
U.S. Winter Heating Degree Days (population-weighted) * *2012 *2012 *2012 *2012 *2012 *2012 Source: EIA Short-Term Energy Outlook, March 2013 *HDD shown by heating season, not calendar year - 2012 calendar year is labeled
![](https://capedge.com/proxy/8-K/0001004155-13-000028/exhibit_99-151.jpg)
Regulatory Recovery Mechanisms Utility Rate Decoupling Weather Normalization Bad Debt Recovery Conservation Program Recovery Infrastructure Programs Nicor Gas (~70% Fixed) P P Atlanta Gas Light P (Straight –Fixed -Variable) P Virginia Natural Gas P* (Revenue Normalization) P P P* P Elizabethtown Gas P P P Florida City Gas P Chattanooga Gas P** (Revenue Normalization) P P P** * *Revenue Normalization Adjustment (RNA) and Conservation (e.g. VNG CARE Plan) approval pending **Chattanooga Revenue Normalization Adjustment (RNA) mechanism is up for review in 2013; if it is not made permanent or extended the RNA will end May 31, 2013 (inclusive of conservation program recovery)
![](https://capedge.com/proxy/8-K/0001004155-13-000028/exhibit_99-152.jpg)
Margin Covered by Regulatory Mechanisms * % Fixed % Base Volumetric % Weather Normalization % Revenue Normalization %Volumetric at Risk
![](https://capedge.com/proxy/8-K/0001004155-13-000028/exhibit_99-153.jpg)
Volumetric Margin Sensitivity Atlanta Gas Light No weather sensitivity due to decoupled rates (weather sensitivity resides with Georgia Natural Gas retail business) Chattanooga Gas No weather sensitivity with the weather and revenue normalization rate mechanisms in place Virginia Natural Gas & Elizabethtown Gas Weather Normalization Adjustment (WNA) is not 100% effective in extreme weather Elizabethtown WNA is subject to an earnings test before recovery is allowed Nicor Gas Significant portion of margin (~70%) for residential and commercial customers is recovered through fixed charges; Remaining volumetric margin contains base and weather sensitive component Weather sensitive component is small in percentage terms (~2%) but large in magnitude due to large volumes Florida City Gas Weather sensitivity is limited * NOTE: Volumetric sensitivity considers the sensitivity of residential and commercial volumetric margin only. The impact of customers leaving the system, energy efficiency and changing economic conditions was not considered. These factors could put margin further at risk.
![](https://capedge.com/proxy/8-K/0001004155-13-000028/exhibit_99-154.jpg)
Customer Growth - Cost Advantage * (Nominal $ per MMBTU) Source: EIA February 2013 Short Term Energy Outlook & EIA 2013 Annual Energy Outlook (Reference Case) Residential End Use Prices unless otherwise noted
![](https://capedge.com/proxy/8-K/0001004155-13-000028/exhibit_99-155.jpg)
Customer Growth - Economic Housing Recovery * Source: Moody’s February 2013 Baseline Forecast of Housing Starts Midwest, Mid-Atlantic and Southeast housing starts reflect county level data from service territory and near surrounding areas
![](https://capedge.com/proxy/8-K/0001004155-13-000028/exhibit_99-156.jpg)
Distribution Operations Usage Growth Drivers Conversion opportunity as customers switch from less cost effective energy sources to natural gas Elizabethtown Gas: Conversion opportunity from cost advantage over fuel oil Virginia Natural Gas: Conversion opportunity from cost advantage over fuel oil Industrial opportunity as economy recovers and natural gas maintains its price advantage over other fuel sources Atlanta Gas Light: Poultry farms and other agricultural commercial/industrial opportunities Florida City Gas: Industrial (and conversion) opportunity through flexible tariff provisions including the Area Main Extension Program Nicor Gas: Industrial agricultural opportunities (e.g. grain dryers, fertilizer) and industrial/large commercial conversion potential from waste oil (e.g. asphalt plants) Natural gas vehicle opportunity as natural gas maintains its cost advantage to other vehicle fuel alternatives Atlanta Gas Light: In 2012 AGL issued an RFP for parties interested in developing CNG stations; Over the next five years investment in CNG infrastructure could total $11.57 million with funding provided partially through Georgia’s Universal Service Fund (USF) Chattanooga Gas: Recently filed a revised NGV tariff to better accommodate emerging NGV market *
![](https://capedge.com/proxy/8-K/0001004155-13-000028/exhibit_99-157.jpg)
Investment Growth Drivers- Georgia Strategic Infrastructure Development and Enhancement (STRIDE): Background: STRIDE began with the Pipeline Replacement Program (PRP) in 1998; Since its inception, AGLC has spent $697M and replaced 2,625 miles of pipe through PRP Other STRIDE programs include: i-SRP: System reliability - Expenditures to date: $224M i-CGP: Customer growth and economic development - Expenditures to date $29M Rider provides for the recovery of a return on investment at AGLC’s authorized rate of return, depreciation and taxes PRP program concludes in 2013 Future Objectives: On November 21, 2012 AGLC filed a petition with the Georgia Commission proposing a vintage plastic pipe replacement program (i-VPR) that would fall under STRIDE Under the i-VPR program, AGLC is seeking to replace 756 miles of vintage plastic pipe over the next four years; AGLC has identified approximately 3,300 miles of vintage plastic mains in its system that potentially should be considered for expedited replacement over the next 15 - 20 years The STRIDE program requires AGLC to file an updated construction plan every three years for review; This plan (STRIDE II) is expected to be filed by August 2013 *
![](https://capedge.com/proxy/8-K/0001004155-13-000028/exhibit_99-158.jpg)
Investment Growth Drivers- Virginia Steps to Advance Virginia’s Energy Plan (SAVE): Background: Approved in June 2012, SAVE is a five year infrastructure enhancement program that focuses on improving system reliability by accelerating the replacement of pipeline infrastructure The SAVE Rider recovers all approved SAVE-related infrastructure replacement costs including a return on investment at the Company’s authorized rate of return, depreciation and taxes Future Objectives: VNG will spend $25M annually, not to exceed $105M over the 5-year period *
![](https://capedge.com/proxy/8-K/0001004155-13-000028/exhibit_99-159.jpg)
Investment Growth Drivers– New Jersey Utility Infrastructure Enhancement (UIE) & Accelerated Infrastructure Recovery (AIR) Background: Created in response to the Governor’s request for investment to spur economic recovery Since UIE’s inception, Elizabethtown has spent $108M and replaced 109 miles of pipe Costs recovered through periodic adjustments to rates UIE provides for return on investment at the Company’s authorized rate of return, depreciation and taxes Future Objectives: In July 2012, ETG filed for an Accelerated Infrastructure Replacement (AIR) Rider to replace UIE Under its proposal, ETG would invest in and recover $135M in infrastructure to be spent from November 2012-August 2017 Ruling expected in the first half of 2013 *
![](https://capedge.com/proxy/8-K/0001004155-13-000028/exhibit_99-160.jpg)
Conservation Program Recovery Nicor Gas State of Illinois legislature mandate (2009) Programs filed with regulators for three-year periods Ratepayer funded Current program (June 2011 – May 2014) – $150M program budget (based on revenue) – 51M therm reduction goal – 14 programs offered to homeowners and businesses ~ 80,000 participants annually Cumulative loss in therms led to $543,900 revenue loss in 2012 with expected loss of $1.5M in 2013 Virginia Natural Gas Program Pending Approval Filed with the Virginia Commission in December 2012 Expect to implement in mid-2013 Chattanooga Gas Program offers free programmable thermostats (ends May ‘13) Online application/Toll-free phone option Elizabethtown Gas Ratepayer funded – offers residential/commercial rebates Incentivizes the installation of high-efficiency equipment $1.3M annual budget / ~ 2,250 participants Florida City Gas Ratepayer funded – offers residential/commercial rebates Encourages gas usage reduce stress on electric grid $4.3M annual budget / ~ 5,000 participants *
![](https://capedge.com/proxy/8-K/0001004155-13-000028/exhibit_99-161.jpg)
2013 Priorities & Objectives (Recap) Focus on Safety Continue track record of near or better than upper quartile safety ratings for on-the-job injuries and days away from work Cost Containment Control costs by focusing on productivity improvements, leveraging common systems and shared services model, standardization and scale Regulatory Outcomes Gain regulatory approval of AIR in New Jersey, i-VPR in Georgia and CARE in Virginia Maintain current regulatory recovery mechanisms and gain approval of pending and future proposals Nicor Merger Requirements Continue to honor Illinois merger commitments Position for Growth Take advantage of improving market conditions and emerging regional opportunities *
![](https://capedge.com/proxy/8-K/0001004155-13-000028/exhibit_99-162.jpg)
Distribution – Appendix *
![](https://capedge.com/proxy/8-K/0001004155-13-000028/exhibit_99-163.jpg)
Distribution – Rate Case History Utility Last Rate Case Key Outcomes Agreements on Rate Case Stay Outs Nicor Gas Mar. 2009 $80M rate increase Bad debt rider approved in February 2010 providing recovery from (or credit to) customers the difference of actual expense and $63 million benchmark Rate case reset heating degree days from 5,830 to 5,600 Stay out concludes Dec. 2014 Atlanta Gas Light Oct. 2010 $26.7M rate increase approved Included ~$10M in new customer service and safety programs Adopted new acquisition synergy sharing policy None Virginia Natural Gas Dec. 2011 $11.3M base rate increase, plus $1M non-jurisdictional Recovery of $3.1M costs previously recovered through base rates now recovered through PGA Approval to recover gas portion of bad debts through the PGA None Elizabethtown Gas Dec. 2009 $3M rate increase New depreciation rates decreased expense $5M Two-year rate freeze concluded in 2011 None Florida City Gas Feb. 2004 $7M rate increase Approval in late 2007 to include acquisition adjustment amortization expense in operating income and acquisition adjustment asset balance in rate base for regulatory surveillance reporting purposes 2007 approval included a 5-year stay-out provision None Chattanooga Gas May 2010 Instituted new rate design that encourages customer conservation First decoupled rate design for TN utility New depreciation rates decreased expense of $2M annually None *
![](https://capedge.com/proxy/8-K/0001004155-13-000028/exhibit_99-164.jpg)
Distribution – Key Statistics Utility # Customers (Average in thousands; year-ended 12/31/12) Capital Expenditures 2012 / 2013E (millions) Rate Base (millions) Est. Return on Rate Base 2012 Est. Return on Equity 2012 Nicor Gas 2,188 $203 / $204 $1,418 6.24% 6.50% Atlanta Gas Light 1,541 $308 / 255 $2,045 8.71% 11.94% Virginia Natural Gas 281 $64 / 67 $577 7.74% 10.79% Elizabethtown Gas 277 $40 / 53 $478 8.51% 12.11% Florida City Gas 104 $23 / 25 $166 6.07% 10.42% Chattanooga Gas 62 $9 / 17 $90 7.99% 11.29% * Note: Corporate cap ex allocated to utilities was $53 million in 2012 and is expected to be approximately $27 million in 2013. These amounts are not included in the information above.
![](https://capedge.com/proxy/8-K/0001004155-13-000028/exhibit_99-165.jpg)
AGL Resources Acronyms * AIR Accelerated Infrastructure Replacement CARE Conservation and Ratemaking Efficiency Plan PBR Performance Based Ratemaking PRP Pipeline Replacement Program RNA Revenue Normalization Adjustment SAVE Steps to Advance Virginia’s Energy Plan STRIDE Strategic Infrastructure Development and Enhancement UIE Utility Infrastructure Enhancement WNA Weather Normalization Adjustment
![](https://capedge.com/proxy/8-K/0001004155-13-000028/exhibit_99-166.jpg)
Retail Operations Mike Braswell - President, Retail Energy Robin Boren - President, Retail Services
![](https://capedge.com/proxy/8-K/0001004155-13-000028/exhibit_99-167.jpg)
Acquired as part of Nicor Inc. merger in December 2011; expanded in February 2013 via acquisition of NiSource’s retail business Provides warranty and home service solutions to customers across 8 states, and creates opportunity to influence fuel-use choices made by consumers Expect to introduce products and services across additional AGLR utilities beginning in 2013 EBIT estimated to grow by 60% in 2013 and 5%-10% annually from 2014 to 2016 Retail Operations – Introduction * Retail Energy Retail Services Originally developed in response to deregulation of Georgia natural gas market in 1998 Serves residential, commercial and industrial customers in 9 states Primary business is marketing of natural gas commodity Provides stable, predictable earnings stream to AGLR Competitive Georgia market resulting in earnings pressure AGLR’s retail businesses market natural gas and home-related services, such as appliance repair and gas and electric line protection plans
![](https://capedge.com/proxy/8-K/0001004155-13-000028/exhibit_99-168.jpg)
Profitable market expansion (market environment of lower commercial opportunities and increased retail competition) Note: Earnings before interest and tax. Results include 100% of SouthStar earnings, which effective January 1, 2010 are split 85% to AGL Resources and 15% to Piedmont Natural Gas. Retail Operations – EBIT Track Record Continued market expansion & addition of Nicor retail businesses $125-$135 *
![](https://capedge.com/proxy/8-K/0001004155-13-000028/exhibit_99-169.jpg)
Retail Energy - Overview * Georgia Tennessee Kentucky Virginia West Virginia Ohio Pennsylvania New York Maine Connecticut Rhode Island Massachusetts Vermont New Hampshire North Carolina South Carolina Florida New Jersey Maryland Delaware District of Columbia Michigan Current Retail Markets Emerging Retail Markets Indiana Illinois Large C&I Markets (includes GA) Alabama One of the largest retail natural gas marketers in the United States Serving over 600,000 customers in 9 states Largest marketer in Georgia, serving approximately 500,000 residential, commercial and industrial customers Approximately 300 large C&I customers in the Southeast Retail energy businesses include SouthStar, Nicor Advanced Energy and Nicor Solutions Consistent earnings stream for the last five years 2012 EBIT contribution: $106 million Addition of Nicor’s retail energy businesses in December 2011 further strengthens retail energy platform Active in the emerging CNG market, currently serving multiple fleets with approximately 300 vehicles and annual sales of 0.5 Bcf Key Statistics
![](https://capedge.com/proxy/8-K/0001004155-13-000028/exhibit_99-170.jpg)
Grow retail business margin contribution Utilize new products, promotional and partnership offers and improve sales performance Retail Energy - Strategic Objectives * Georgia Market Illinois Market Expanded Markets Maintain GA margins by leveraging strategic marketing investments Enhance brand equity Promote new product, service, and/or partnership offerings to bolster market share and price plan mix Develop incremental earnings streams from profitable new markets and products Continue to enter and expand targeted choice markets Leverage product set for natural gas choice markets Continue to pursue inorganic growth opportunities across all markets Retail Energy will sustain its GA and IL businesses and develop incremental earnings streams from new markets, products and channels while operating in an environment of increased retail competition and lower wholesale volatility and commercial opportunities.
![](https://capedge.com/proxy/8-K/0001004155-13-000028/exhibit_99-171.jpg)
Retail Energy - Georgia Customer & Market Overview Ten active competitors in marketplace, with top four representing approximately 85% of market Serving customers under the Georgia Natural Gas (GNG) brand (via our SouthStar (SSE) partnership with Piedmont Natural Gas (85% AGLR / 15% PNY) GNG is the long-standing market leader and has maintained stable market share Competitive pressures in Georgia continue with promotion of lower margin products and increased consumer shopping Launched new products and marketing partnerships to sustain market leadership and margins. Examples: Price Protection Guarantee, Guaranteed Bill and Pre-pay plans, Delta SkyMiles partnership * GNG Customer Count & Market Share *
![](https://capedge.com/proxy/8-K/0001004155-13-000028/exhibit_99-172.jpg)
*Nicor Solutions does not supply the physical commodity as part of the Financial Fixed Bill program. The throughput equivalent is based on the gas supplied by Nicor Gas to enrolled customers. Retail Energy - Illinois Customer & Market Overview Illinois local distribution companies (LDCs) began offering choice to retail customers in the late 1990s, with approximately 10% of customers choosing a competitive supplier Customer and Throughput Information Customer and Throughput Information Customer and Throughput Information Customers Normalized Annual Throughput (Bcf) Nicor Gas Financial Fixed Bill Physical Fixed Bill Variable / Fixed Price 35,000 20,000 15,000 4 2 2 North Shore Gas Physical Fixed Bill Variable / Fixed 1,000 1,000 <1 <1 Peoples Gas Physical Fixed Bill Variable / Fixed Price 1,000 1,000 <1 <1 Total 73,000 8 Nicor Solutions and Nicor Advanced Energy are active behind Nicor Gas, Peoples Gas and North Shore Gas Product offerings include: annual fixed bill products (physical and financial), price per therm products (fixed and variable) *
![](https://capedge.com/proxy/8-K/0001004155-13-000028/exhibit_99-173.jpg)
Retail Energy - Expanded and C&I Markets Market Designation State(s) / Brand Retail Energy Position Key Market Objectives Retail Markets – Currently Active OH (Ohio Natural Gas) Active behind Dominion East Ohio, Vectren Delivery of Ohio, Columbia of Ohio & Duke Choice market growth Retail Markets – Currently Active FL (Florida Natural Gas) Active behind Central Florida Gas, Tampa Electric, Florida Public Utilities & Florida City Gas Steady, moderate growth Retail Markets – Currently Active NY (New York Natural Gas) Active behind Orange & Rockland and National Grid – Long Island Choice market growth Retail Markets – Currently Active MD (Maryland Energy) Active behind Baltimore Gas & Electric and Washington Gas Choice market growth Large C&I GA, TN, SC, NC Principally operating behind Atlanta Gas Light, Piedmont Natural Gas, Chattanooga Gas Company and Nashville Gas Balanced customer portfolio Emerging Retail Markets PA, NJ, IN, MI, VA Evaluating timing for pursuing market entry Evaluating key metrics for potential market entry *
![](https://capedge.com/proxy/8-K/0001004155-13-000028/exhibit_99-174.jpg)
Retail Energy - Weather Hedging * AGLR’s retail energy businesses can be impacted by weather variations across our markets Weather hedging programs help to mitigate the impacts of warmer-than-normal weather and can be structured to allow the business to largely capture upside of colder-than-normal weather in key markets such as Georgia, Illinois and Ohio In 2012, weather was significantly warmer than normal in Georgia and Ohio, with a corresponding $9 million negative impact to EBIT; the weather hedging program protected further downside by approximately $20 million Weather exposure: Georgia: Net long HDDs Illinois: Net short HDDs (short fixed-bill; long per-therm) Ohio: Net long HDDs Florida, New York and Maryland: Net long HDDs
![](https://capedge.com/proxy/8-K/0001004155-13-000028/exhibit_99-175.jpg)
Retail Energy - 2013 Priorities and Objectives Maintain Georgia market share and mitigate degradation of portfolio mix in a mature market and difficult economy Grow Nicor retail energy businesses through new products, promotions, partnership marketing and improved sales channel performance Continue to grow customers and margins in expanded markets of Ohio, Florida, New York and Maryland and continue to monitor and evaluate new markets for potential entry Position commercial business to create incremental value from asset management and manage risks inherent in retail business Develop new products, services and partnerships to acquire and retain profitable customers Introduced fixed bill product behind Georgia Natural Gas Launched Delta SkyMiles partnership in Georgia and Ohio Launched new fixed price plan in Illinois Leverage partnership with Dominion Retail (Nicor Electric) in Illinois *
![](https://capedge.com/proxy/8-K/0001004155-13-000028/exhibit_99-176.jpg)
Retail Services - Overview Key Statistics * Retail Services Today Primary states served: 8 Key expansion states: 6 Service contracts: 1.2 million Employees: ~390 2012 Operational Metrics* 683,000 Calls handled 79,000 HVAC company in-home visits 104,000 Claims processed 94% Customer satisfaction score 6th consecutive JD Power certification * Results do not include assets acquired from NiSource Inc. on January 31, 2013
![](https://capedge.com/proxy/8-K/0001004155-13-000028/exhibit_99-177.jpg)
Retail Services - Overview * Offer a suite of warranty protection and home solutions that include line repair (gas and electric), equipment repair, insurance and maintenance Partner with utilities to leverage inbound calls to sell products and services Expand customer touch-points with outbound marketing through direct mail and digital channels Leverage the brand of each partner utility Bill our products and services on utility bill Process fulfillment through network of in-house and third-party service providers
![](https://capedge.com/proxy/8-K/0001004155-13-000028/exhibit_99-178.jpg)
Increasing Contract Value Increasing Customer Satisfaction Retail Services – Product Offerings * Line Repair Gas Lines Outside Water/Sewer Comprehensive Home Manager Essential Home Manager Complete Electric Repair Electric Lines Surge Protection Equipment Repair Appliances Home Systems Electronics Maintenance Heating & Cooling Appliance Safety Energy Efficiency
![](https://capedge.com/proxy/8-K/0001004155-13-000028/exhibit_99-179.jpg)
Customers are on monthly service contracts Warranty products are billed a fixed monthly amount, which differs per product, per market and ranges from $3.95 to $63.95 Services that are entitlement based (a specific service is rendered as part of the contract) are charged to the customer on a monthly basis; revenue is recognized at the lesser of when the service is rendered or the end of an annual period Retail Services – Business Structure Claims Warranty claims – costs incurred when warranty issues arise Entitlement claims – costs incurred when customer requests service Customer marketing and customer service Call center primary cost driver Additional marketing expenses via direct mail and digital Multiple structures for revenue sharing/cost reduction for our partners Scalable SG&A cost structure, leveraging a shared services model * Expenses
![](https://capedge.com/proxy/8-K/0001004155-13-000028/exhibit_99-180.jpg)
Total purchase price of $120 million plus working capital at closing of January 31, 2013 Purchase includes existing book of contracts, 10-year licensing agreements and 10-year billing agreements with all seven utilities, representing 3.1 million utility customers EPS accretive in year 1 Current customers in Indiana, Ohio, Massachusetts, Pennsylvania, Kentucky and New Hampshire Actual customer contracts as of 12/31/12 of 508,000 (476,000 Service Plans and 32,000 Leases) Retail Services – NiSource Retail Services Acquisition * Acquisition Recap Near Term Transition to AGL Resources infrastructure, equipment and resources Integrate work streams – Call Center, Quality Assurance, IT, Marketing, Back Office, HR, Accounting and Finance Longer Term Vendor consolidation and common operating platform Best practices implementation across work streams
![](https://capedge.com/proxy/8-K/0001004155-13-000028/exhibit_99-181.jpg)
Retail Services - Macroeconomic/Market Landscape * Mobility rate decline and changing mix of homeowners and renters Fewer people coming through traditional “move” channels are homeowners Renter group has lower affinity for the traditional warranty products New products for renters Current regulatory environment Regulatory bodies that oversee utilities are scrutinizing billing relationships Increasing restrictions and compliance requirements with FCC Able to react quickly to regulatory changes Highly fragmented industry with low barriers to entry Large competitors have entered the American market from Canada and Great Britain Direct competition for the utility affinity relationship and bill Leverage relationship with AGL Resources utilities and NiSource Changing demographics As population ages, size of traditional warranty consumer group is increasing Time constrained and Do-It-Yourself challenged younger people are emerging market for our products Completed behavioral segmentation study and customer journey mapping in 2012 Low level of general customer satisfaction in warranty market Competitive landscape generally not focused on customer service Look to trusted brands for reliable information and service Leverage our customer experience model to increase retention and improve number of products per customer Key Variables Business Impact Competitive Advantage *
![](https://capedge.com/proxy/8-K/0001004155-13-000028/exhibit_99-182.jpg)
Retail Services – 2013 Priorities and Objectives * 2013 Financial Goals for Base Business Grow net contracts by 5% New Partnerships Partnership opportunities with AGL Resources utilities and others Acquisition Integrate and continue to grow NiSource Retail Services business Marketing Strategy Continue building digital experience and web-related features Technology Invest in technology that will increase efficiencies or improve digital functionality Implementation of web self-service capabilities Branding Transition branding from multiple brands to single corporate identity Align partner branding with new corporate brand, to the extent different Critical Success Factor Business Plan
![](https://capedge.com/proxy/8-K/0001004155-13-000028/exhibit_99-183.jpg)
Wholesale Services Peter Tumminello EVP, Wholesale Services and President Sequent Energy Management
![](https://capedge.com/proxy/8-K/0001004155-13-000028/exhibit_99-184.jpg)
* Wholesale Services - Introduction Effective management of all affiliate utility assets, with exception of Nicor, as well as service provider for non-affiliate asset management agreements Leading industry expertise in physical gas delivery Diverse portfolio of transportation and storage assets, enabling higher returns in a high volatility environment but positioned to endure a low volatility market Top 10 physical provider nationally and one of the strongest SE / Eastern seaboard gas providers Top “intra-day” gas provider in spot power generation fuel market Lower risk philosophy in a tightly controlled environment Selective C&I market growth Favorable opportunities to continue cost reductions
![](https://capedge.com/proxy/8-K/0001004155-13-000028/exhibit_99-185.jpg)
2012 EBIT declined by $8 million due to: Lower storage hedge gains ($14 million in 2012 vs. $37 million in 2011) Transportation hedge losses (loss of $3 million in 2012 vs. gain of $8 million in 2011) Improved commercial activity ($43 million in 2012 vs. $38 million in 2011) Reduced inventory lower-of-cost-or-market (LOCOM) adjustments ($4 million in 2012 vs. $26 million in 2011) Rollout: Stronger seasonal storage spreads in 2012 resulted in $27 million storage rollout schedule at Sequent at the end of 4Q12 vs. $3 million at the end of 4Q11 Rollout expected to be recognized primarily in 2013 Wholesale Services - Key 2012 Results * millions Wholesale Operating Margin Components 2012 Financial Performance Summary
![](https://capedge.com/proxy/8-K/0001004155-13-000028/exhibit_99-186.jpg)
Wholesale Services - Key 2012 Results Cont. Ongoing re-contracting of storage leases at significantly lower market rates Record warm temperatures created challenges; major eastern U.S. markets 14% warmer and Chicago 19% warmer than 10-year normal New deal flow met expectations with addition of material fee based producer services deals, power generation fuel supply and key transportation transactions serving constrained supply and market areas Continued growth in gas-fired power generation and producer services volumes Effective expense management: Achieved $9.4 million in merger synergies, a 20% reduction relative to 2011 Nicor Enerchange and Wholesale Services combined costs Q1 2013 initiative expected to achieve $3.5 million in annual reduced costs ($2.5 million impact to 2013) Competitors experiencing earnings challenges, resulting in selective industry consolidation Actively managed open exposures, resulting in a relatively low average VaR of $2.0 million, consistent with historical periods *
![](https://capedge.com/proxy/8-K/0001004155-13-000028/exhibit_99-187.jpg)
Wholesale Services - Overview Sequent’s business model includes a portfolio of assets and services that enable it to capture value in a variety of market conditions. In any given year: The proportion of segments changes with market conditions Sequent has the ability to capture value in a dynamic environment Affiliate asset management agreements “core” to Sequent’s business - $207 million of life-to-date sharing payments under the asset agreements $74 million under the Atlanta Gas Light AMA ($5 million paid in 2012) $51 million under the Virginia Natural Gas AMA ($3 million paid in 2012) $49 million under the Elizabethtown Gas AMA ($5 million paid in 2012) $26 million under the Chattanooga Gas AMA ($1 million paid in 2012) $7 million under the Florida City Gas AMA ($1 million paid in 2012) * Affiliate AMA Major storage positions Major pipeline positions
![](https://capedge.com/proxy/8-K/0001004155-13-000028/exhibit_99-188.jpg)
Wholesale Services - History * Forecast * $30 million, mid-point of EPS guidance *
![](https://capedge.com/proxy/8-K/0001004155-13-000028/exhibit_99-189.jpg)
Wholesale Services - Credit Management and Review Aggressive credit management results in track record of performance System resource capabilities leveraged to closely monitor exposure levels and activity Active management of reviews for creditworthiness Active participation in transaction structuring and negotiation of terms Full utilization of market intelligence sources Real-time communication regarding counterparty status and exposures Immediate elevation of issues through communication with Treasury, Risk Management and Sequent Credit Committees * Credit Exposure by Industry Credit Exposure by Rating Tiers
![](https://capedge.com/proxy/8-K/0001004155-13-000028/exhibit_99-190.jpg)
Wholesale Services - Growth in Fees & Services Business *
![](https://capedge.com/proxy/8-K/0001004155-13-000028/exhibit_99-191.jpg)
Wholesale Services - Gas For Power Generation * Key growth driver for Sequent with 156% increase in volumes since 2008
![](https://capedge.com/proxy/8-K/0001004155-13-000028/exhibit_99-192.jpg)
Wholesale Services - Strategic Producer Transactions * Shale plays provide opportunities for growth
![](https://capedge.com/proxy/8-K/0001004155-13-000028/exhibit_99-193.jpg)
2009 $1.385 2010 $1.402 2011 $1.035 2012 $0.770 2013 $0.538 Max Spreads Historical Intrinsic Value - Flattening of NYMEX Curve * Source: Nymex
![](https://capedge.com/proxy/8-K/0001004155-13-000028/exhibit_99-194.jpg)
Northeast (New England) Lack of LNG coupled with increasing demand and supply constraints has pushed forward prices higher Mid-Atlantic (New Jersey/Maryland) Price pressure due to production from Gulf of Mexico and Marcellus competing for the market Canada to Midwest West Canada prices compete with increasing Bakken production and redirected Midcontinent and Gulf of Mexico supply to serve a growing Midwest market Florida / Southeast Forward prices are stronger due to increased power generation demand along with constrained access to Florida; load growth expected to be significant and leading to new greenfield pipeline built into Florida Canada to Midwest New England New Jersey/Maryland Florida Wholesale Services - Transportation Portfolio * Source: Platts and ICE
![](https://capedge.com/proxy/8-K/0001004155-13-000028/exhibit_99-195.jpg)
Full Year 2012 compared to 30-Year Normal Temperature Anomaly * Source: NOAA
![](https://capedge.com/proxy/8-K/0001004155-13-000028/exhibit_99-196.jpg)
Marcellus Production Outpacing Northeast Demand TGP 200L Potential Pipeline Constraints Millennium Transco MD TETCO Projects have evolved from capturing Northeast demand to now finding alternative markets. Displacement of Gulf Coast and Canada supplies Exports to Canada Backhaul to Southeast and Midwest Markets Source: Wood Mackenzie Fall 2012, Bentek Exports to Canada Utica competes for Midwest markets in near future, as production there is expected to be ~1.2 Bcf/d by end of 2014. TGP 300L Northeast Production and Demand Outlook * Northeast Production and Demand Outlook Source: Wood Mackenzie Fall 2012, Bentek
![](https://capedge.com/proxy/8-K/0001004155-13-000028/exhibit_99-197.jpg)
In 2012, lower natural gas prices incentivized coal to gas switching If normal weather materializes, North America’s supply and demand balance should be close to balance, stabilizing gas prices at a level that would lessen coal switching By 2016, expect increasing natural gas power generation due to further coal retirements and overall power demand growth boosted by a stronger economy Wholesale Services - Gas for Power Generation Growth * forecast Source: Wood Mackenzie released December 2012 Bcf/d *
![](https://capedge.com/proxy/8-K/0001004155-13-000028/exhibit_99-198.jpg)
Wholesale Services – EBIT Forecast * *Storage rollout range based on historical 5-year and 10-year averages of storage rollout values as of year-ended December 31.
![](https://capedge.com/proxy/8-K/0001004155-13-000028/exhibit_99-199.jpg)
Wholesale Services - Storage Rollout Historical actual storage roll-out value ($ in millions) Forecasted storage roll-out value ($ in millions) 2012 year-end rollout value of $27 million; 2013 year-end estimate of $12 million - $15 million* * *Storage rollout range based on historical 5-year and 10-year averages of storage rollout values as of year-ended December 31.
![](https://capedge.com/proxy/8-K/0001004155-13-000028/exhibit_99-1100.jpg)
Majority of assets contracted for 1-3 year terms Rolling over most agreements at lower fixed payments Contracted for storage in the West to add to the portfolio Wholesale Services - Fixed Payment Obligations Commitment Summary as of Dec. 31, 2012 (millions) $136.3 $65.9 $50.3 $22.9 *Storage payments inclusive of obligations to Jefferson Island and Golden Triangle *
![](https://capedge.com/proxy/8-K/0001004155-13-000028/exhibit_99-1101.jpg)
Wholesale Services - 2013 Market Outlook A new pipeline into Florida is being proposed to serve growing power generation load Expect less coal to gas switching in power generation sector Continued new pipeline infrastructure out of Marcellus/Utica needed to move growing supply to market, further pressuring down New Jersey/Pennsylvania/Mid Atlantic price differentials Anticipate growing volumes from Marcellus/Utica moving to Southeast, Midcontinent & Eastern Canada over time Supply slowly in decline in the West providing basis support in region Storage values continue to be depressed Shale production and power generation have provided the market with balancing capability Market is still absorbing new projects built over last several years Extreme price spikes seen in early 2013 in New York and New England markets, benefiting the portfolio *
![](https://capedge.com/proxy/8-K/0001004155-13-000028/exhibit_99-1102.jpg)
Wholesale Services - 2013 Priorities & Objectives Expect to deliver $25 million to $35 million of EBIT Continue to drive down SG&A cost structure Cost of asset portfolio healthier and continue to re-contract at lower market rates Strong storage spreads of 2012 not likely to repeat in 2013 Grow an already solid Northeast transport position that serves constrained shale supply and city gate market areas Competitors exiting the business, providing opportunity to selectively acquire asset contracts at distressed values Industrial load continues to grow, but expect no material impact on the market for several years LNG exports gaining momentum, but expect no material impact on the market for several years Gulf Coast prices expected to remain range bound around $3/MMBtu - $5/MMBtu with significant spikes expected in constrained markets under severe weather conditions *
![](https://capedge.com/proxy/8-K/0001004155-13-000028/exhibit_99-1103.jpg)
Midstream Operations Peter Tumminello EVP, Wholesale Services and President Sequent Energy Management
![](https://capedge.com/proxy/8-K/0001004155-13-000028/exhibit_99-1104.jpg)
Focused on high deliverability salt dome storage as well as depleted reservoir storage and related business development opportunities Storage facilities provide customers with firm, interruptible, wheeling, and park and loan services Customers include utilities, gas marketers and E&P companies Current operating facilities include: Jefferson Island Storage & Hub (7.3 Bcf): Henry Hub equivalent trading appealing to market makers; high deliverability and both inter and intrastate connections favor LDCs and end-users Golden Triangle Storage (13.5 Bcf): Future Golden Pass LNG export activities Central Valley Gas Storage* (11 Bcf): PG&E operational constraints and increased maintenance requirements drives value Operating segment also includes Magnolia pipeline, equity interest in Horizon pipeline and renewable gas operations Midstream Operations - Overview * Central Valley Golden Triangle Storage and Hub Jefferson Island Storage and Hub
![](https://capedge.com/proxy/8-K/0001004155-13-000028/exhibit_99-1105.jpg)
Midstream Operations - Historical Financial Performance * millions
![](https://capedge.com/proxy/8-K/0001004155-13-000028/exhibit_99-1106.jpg)
Midstream Operations - Market Fundamentals Persistent low natural gas prices and volatility in recent years have negatively impacted profitability of AGLR’s storage facilities AGLR’s storage investments began in 2004 with the purchase of Jefferson Island AGLR’s decisions to investment in and expand storage facilities based on storage lease rates in the range of $0.15 to $0.20 per MMBtu per month Current market storage lease rates are between $0.04 - $0.08 per MMBtu per month, depending on the location of the facility and quality of the service profile Future lease rates aligned with higher commodity prices At current levels of volatility we forecast improved market rates over 3 years Storage model runs below for forward terms (utilizing JISH) * Term – 3 Year Commodity Price Modeled Valuation* 2014 Start $3.65 - $4.40 $.110 2015 Start $4.25 - $4.60 $.117 2016 Start $4.40 - $4.80 $.130 Term – 1 Year Commodity Price Modeled Valuation *– % of Extrinsic Value Bid Modeled Valuation *– % of Extrinsic Value Bid Modeled Valuation *– % of Extrinsic Value Bid Term – 1 Year Commodity Price 0% 10% 25% 2014 – 2015 $3.65 $.062 $.084 $.099 2015 – 2016 $4.25 $.067 $.087 $.103 2016 - 2017 $4.40 $.07 $.095 $.108 * Modeled valuation stated in Dth/month
![](https://capedge.com/proxy/8-K/0001004155-13-000028/exhibit_99-1107.jpg)
Midstream Operations - Current and Forecasted Contracted Capacity Rates *
![](https://capedge.com/proxy/8-K/0001004155-13-000028/exhibit_99-1108.jpg)
Midstream Operations - AGLR’s LNG Experience Operating LNG facilities since the 1970s Largest operator of liquefaction in U.S. with capacity of ~540,000 gpd Established Pivotal LNG to build, own, operate and market LNG Trussville LNG facility with ~ 60,000 gpd capacity in commercial service – 24 X 7 operations expected Q1’13 Own and operate 6 LNG tankers to facilitate deliveries Executed 10-year agreement with a large trucking company starting Oct 2013 – supply 500,000 average gallons/month for fueling stations Trussville LNG * AGLR LNG Business Perspectives Grow natural gas demand by pricing LNG on a cost plus basis Use existing idle LNG capacity to seed nodes of demand High horsepower/large users will be the early adopters: Driven by lower natural gas prices relative to crude Class 8 trucking will emerge as incremental LNG supply becomes available Developing marine market Position Pivotal LNG to build LNG facilities to meet growing demand
![](https://capedge.com/proxy/8-K/0001004155-13-000028/exhibit_99-1109.jpg)
Midstream Operations - LNG Value Proposition (without Fed and State highway taxes) *
![](https://capedge.com/proxy/8-K/0001004155-13-000028/exhibit_99-1110.jpg)
Midstream Operations - 2013 Priorities and Objectives Expect to deliver ($3) million to $3 million of EBIT (inclusive of $17 million of depreciation expense) Strong O&M and capital cost management – significantly lower development expenses Jefferson Island Storage & Hub Re-contract 3.4 Bcf of capacity expiring in March 2013 Golden Triangle Storage Complete re-watering project and put Cavern 1 back in service second-half of 2013 Achieve higher contracted rates on expiring 2 Bcf of capacity through re-contracting or provision of other services Central Valley Storage Continue to evaluate reservoir performance and implement optimal contracting strategy to achieve full working gas capacity Re-contract 1.5 Bcf of expiring capacity and contract additional 3 Bcf of capacity Pivotal LNG Complete upgrade of Trussville LNG facility to 24 by 7 operations by end Q1 2013 Position for growth and elevate national profile in the growing LNG and CNG substitute fuel industry *
![](https://capedge.com/proxy/8-K/0001004155-13-000028/exhibit_99-1111.jpg)
Cargo Shipping Drew Evans EVP & Chief Financial Officer
![](https://capedge.com/proxy/8-K/0001004155-13-000028/exhibit_99-1112.jpg)
* * Cargo Shipping - Overview Tropical Shipping Container shipping company started in 1963 Directly serves 25 ports in the Bahamas and Caribbean, with cargo primarily sailing southbound out of the Port of Palm Beach, FL and Saint John, Canada Fleet of 12 owned and 2 chartered vessels Fleet of 12,600 containers and flat racks 2,900 temperature controlled (refrigerated) containers 8,600 non-temperature controlled (dry) containers and 1,100 flat racks Triton Container Investments, LLC Cargo container leasing company, in which we have an equity investment Seven Seas Insurance Company Affiliated company of Tropical Shipping that is licensed to underwrite cargo insurance
![](https://capedge.com/proxy/8-K/0001004155-13-000028/exhibit_99-1113.jpg)
Tropical Shipping – Service Territory * Tropical Shipping – Service Territory See Inset Palm Beach Freeport Nassau Providenciales Puerto Plata Guyana Trinidad Grenada St. Lucia Barbados Dominica San Juan Tortola St. Thomas Anguilla St. Maarten St. Barths Antigua Nevis St. Kitts Abaco St. Vincent Grand Turk St. Croix Ports with direct service by Tropical throughout the Bahamas and the Caribbean Caucedo Cayman Islands
![](https://capedge.com/proxy/8-K/0001004155-13-000028/exhibit_99-1114.jpg)
Tropical Shipping – TEU Track Record * Twenty Foot Equivalent Units (TEUs) Increase in TEUs vs. 2011 due primarily to strategic initiatives to expand market share and increase vessel and equipment utilization However, volume increases in 2012 were offset by a decline in shipping rates year-over-year
![](https://capedge.com/proxy/8-K/0001004155-13-000028/exhibit_99-1115.jpg)
Cargo Shipping – Historical Operating Performance * Decline vs. 2006 peak due primarily to global economic downturn and impact on tourism in Caribbean and Bahamian regions where Cargo Shipping operates NOTE: Cargo Shipping was acquired as part of the Nicor Inc. merger in December 2011; Operating Income pre-2012 is based upon operations prior to ownership by AGLR. (1) Includes purchase price accounting D&A. (in 000s)
![](https://capedge.com/proxy/8-K/0001004155-13-000028/exhibit_99-1116.jpg)
Tropical Shipping – 2012 Volume *
![](https://capedge.com/proxy/8-K/0001004155-13-000028/exhibit_99-1117.jpg)
Tropical Shipping – 2012 Volumes by Service Type *
![](https://capedge.com/proxy/8-K/0001004155-13-000028/exhibit_99-1118.jpg)
Tropical Shipping – 2012 Revenue * Revenue by Island Destination Revenue by Product Mix Diverse geographic reach and varied service offerings provide array of customer options as well as revenue streams
![](https://capedge.com/proxy/8-K/0001004155-13-000028/exhibit_99-1119.jpg)
Cargo Shipping – 2013 Risks and Opportunities * Continued fuel cost escalation Potential change in global trade patterns and/or shift of business away from U.S.-origin cargo could increase competition in our markets Continued downward pressure on shipping rates from regional and global carriers due to ongoing overcapacity and competitors’ preservation of market share U.S. regulations and budgetary constraints (i.e. Sequestration) present potential challenges Increase market share through initiatives of new management team Continue reductions in fixed cost structure Deploy new capacity to replace poorly capitalized competitors who ultimately exit certain markets or cease operations completely Longer-term: evaluating transportation of LNG as additional service offering and utilization of LNG as a fuel source for Tropical’s truck and vessel fleets Risks Opportunities Expect EBIT of $10 million to $20 million, which includes $5 million in depreciation and amortization related to purchase accounting recorded in December 2011 Increase vs. 2012 EBIT of $8 million related primarily to expectation of increased profitability per TEU
![](https://capedge.com/proxy/8-K/0001004155-13-000028/exhibit_99-1120.jpg)
Q&A *
![](https://capedge.com/proxy/8-K/0001004155-13-000028/exhibit_99-1121.jpg)
GAAP Reconciliations
![](https://capedge.com/proxy/8-K/0001004155-13-000028/exhibit_99-1122.jpg)
GAAP Reconciliations *
![](https://capedge.com/proxy/8-K/0001004155-13-000028/exhibit_99-1123.jpg)
GAAP Reconciliations *
![](https://capedge.com/proxy/8-K/0001004155-13-000028/exhibit_99-1124.jpg)
GAAP Reconciliations *
![](https://capedge.com/proxy/8-K/0001004155-13-000028/exhibit_99-1125.jpg)
GAAP Reconciliations *
![](https://capedge.com/proxy/8-K/0001004155-13-000028/exhibit_99-1126.jpg)
GAAP Reconciliations *
![](https://capedge.com/proxy/8-K/0001004155-13-000028/exhibit_99-1127.jpg)
GAAP Reconciliations *
![](https://capedge.com/proxy/8-K/0001004155-13-000028/exhibit_99-1128.jpg)
GAAP Reconciliations The following table sets forth a reconciliation of AGL Resources’ operating margin to operating income and earnings before interest and taxes (EBIT) to earnings before income taxes, net income to net income attributable to AGL – as reported and net income attributable to AGL – as adjusted, and net income attributable to AGL – as adjusted – to diluted EPS – as adjusted for the twelve months ended December 31, 2011 and 2010. *
![](https://capedge.com/proxy/8-K/0001004155-13-000028/exhibit_99-1129.jpg)
GAAP Reconciliations *