Table of Contents
SECURITIES AND EXCHANGE COMMISSION
WASHINGTON, D.C. 20549
FORM6-K
Report of Foreign Private Issuer
Pursuant to Rule13a-16 or15d-16
of the Securities Exchange Act of 1934
For the month of December, 2017
Commission File Number33-99720
ARAUCO AND CONSTITUTION PULP INC.
(Translation of registrant’s name into English)
El Golf 150
Fourteenth Floor
Santiago, Chile
(Address of principal executive offices)
Indicate by check mark whether the registrant files or will file annual reports under cover Form20-F or Form40-F.
Form20-F ☒ Form40-F ☐
Indicate by check mark if the registrant is submitting the Form6-K in paper as permitted by RegulationS-T Rule 101(b)(1): ☐
Indicate by check mark if the registrant is submitting the Form6-K in paper as permitted by RegulationS-T Rule 101(b)(7): ☐
Indicate by check mark whether the registrant by furnishing the information contained in this Form is also thereby furnishing the information to the Commission pursuant to Rule12g3-2(b) under the Securities Exchange Act of 1934.
Yes ☐ No ☒
If “Yes” is marked, indicate below the file number assigned to the registrant in connection with Rule12g3-2(b):82-
Table of Contents
ARAUCO AND CONSTITUTION PULP INC
| Item | Page | |||||
1. | 1 | |||||
2. | 7 | |||||
3. | 9 | |||||
4. | 10 | |||||
5. | 11 | |||||
6. | 12 | |||||
7. | 13 | |||||
Table of Contents
CELULOSA ARAUCO Y CONSTITUCION S.A.
AND SUBSIDIARIES
Ratio Analysis of the Consolidated Financial Statements
December 31, 2017
Amounts in thousands of U.S. dollars, except as indicated
1. ANALYSIS OF FINANCIAL POSITION
| a) | Statement of Financial Position |
The principal components of assets and liabilities at each period, as follows:
Assets | 12-31-2017 ThU.S.$ | 12-31-2016 ThU.S.$ | ||||||
Current assets | 2,770,363 | 2,722,360 | ||||||
Non-current assets | 11,224,237 | 11,283,821 | ||||||
|
|
|
| |||||
Total assets | 13,994,600 | 14,006,181 | ||||||
|
|
|
| |||||
Liabilities | 12-31-2017 ThU.S.$ | 12-31-2016 ThU.S.$ | ||||||
Current liabilities | 1,399,394 | 1,346,064 | ||||||
Non-current liabilities | 5,478,313 | 5,660,834 | ||||||
Non–parent participation | 41,920 | 44,032 | ||||||
Net equity attributable to parent company | 7,074,973 | 6,955,251 | ||||||
|
|
|
| |||||
Total net equity and liabilities | 13,994,600 | 14,006,181 | ||||||
|
|
|
| |||||
As of December 31, 2017, total assets decreased MU.S.$12 compared to December 31, 2016, equivalent to a 0.08% variation. This decrease was driven mainly by decreases in the balance of biological assets and inventory, which were partially offset by increases in Trade and other current receivables and property assets, plants and equipment.
In turn, total liabilities decreased by MU.S.$129 mainly due to a decrease in financial liabilities and deferred taxes liabilities, partially offset by increases in trade and other current payables.
The main financial and operational indicators as of the dates and periods indicated below are as follows:
Liquidity ratios | 12-31-2017 | 12-31-2016 | ||||||
Current Liquidity (current assets / current liabilities) | 1.98 | 2.02 | ||||||
Acid ratio ((current assets-inventories, biological assets) / current liabilities) | 1.14 | 1.16 | ||||||
Debt indicators | 12-31-2017 | 12-31-2016 | ||||||
Debt to equity ratio (total liabilities / equity) | 0.97 | 1.00 | ||||||
Short-term debt to total debt (current liabilities / total liabilities) | 0.20 | 0.19 | ||||||
Long-term debt to total debt(non-current liabilities / total liabilities) | 0.80 | 0.81 | ||||||
| 12-31-2017 | 12-31-2016 | |||||||
Financial expenses coverage ratio (earnings before taxes + interest expense / interest expense) | 1.83 | 2.02 | ||||||
Activity ratio | 12-31-2017 | 12-31-2016 | ||||||
Inventory turnover-time (cost of sales / inventories + current biological assets) | 3.06 | 2.99 | ||||||
Inventory turnover-time (excluding biological assets) (Cost of sales /inventory) | 4.15 | 3.97 | ||||||
Inventory permanence-days ((inventories + biological assets) /cost of sales) | 117.58 | 120.42 | ||||||
Inventory permanence-days (excluding biological assets) (inventory / cost of sales) | 86.67 | 90.68 | ||||||
As of December 31, 2017, the short-term debt represented 20% of total liabilities (19% as of December 31, 2016).
1
Table of Contents
CELULOSA ARAUCO Y CONSTITUCION S.A.
AND SUBSIDIARIES
Ratio Analysis of the Consolidated Financial Statements
December 31, 2017
Amounts in thousands of U.S. dollars, except as indicated
Our financial expenses coverage ratio decreased from 2.02 to 1.83, mainly due to lower earnings before taxes and higher financial costs for the period ended December 31, 2017, compared to the same period of 2016.
| b) | Statement of profit or loss |
Income before income tax
Income before income tax registered a profit of approximately MU.S.$239 compared to a profit of approximately MU.S.$263 in the same period of 2016. The negative variation of MU.S.$24 is explained by the factors described in the following table:
Item | MU.S.$ | |||
Gross margin | 401 | |||
Distribution and Administrative Expenses | (74 | ) | ||
Other income and expenses (*) | (309 | ) | ||
Financial income and expenses | (39 | ) | ||
Others | (3 | ) | ||
|
| |||
Net change in income before income tax | (24 | ) | ||
|
| |||
| (*) | Includes MU.S.$173 of Loss of forest due to fires net of MU.S.$35 from insurance compensation. |
The main indicators related to result accounts and the details of revenues and operation costs are as follows:
Revenues | 12-31-2017 ThU.S.$ | 12-31-2016 ThU.S.$ | ||||||
Pulp | 2,451,363 | 2,146,079 | ||||||
Timber | 2,625,198 | 2,494,750 | ||||||
Forestry | 114,122 | 96,488 | ||||||
Other | 47,568 | 24,068 | ||||||
|
|
|
| |||||
Total revenues | 5,238,341 | 4,761,385 | ||||||
|
|
|
| |||||
Sales costs | 12-31-2017 ThU.S.$ | 12-31-2016 ThU.S.$ | ||||||
Wood | 725,114 | 736,399 | ||||||
Forestry work | 631,276 | 600,320 | ||||||
Depreciation and amortization | 389,847 | 377,983 | ||||||
Other costs | 1,828,295 | 1,784,203 | ||||||
|
|
|
| |||||
Total sales costs | 3,574,532 | 3,498,905 | ||||||
|
|
|
| |||||
Profitability index | 12-31-2017 | 12-31-2016 | ||||||
Profitability on equity | 3.83 | 3.19 | ||||||
Profitability on assets | 1.93 | 1.57 | ||||||
Return on operating assets | 4.67 | 2.21 | ||||||
Profitability ratios | 12-31-2017 | 12-31-2016 | ||||||
Income per share (U.S.$) (1) | 2.38 | 1.89 | ||||||
Income after tax (ThU.S.$) (2) | 270,352 | 217,577 | ||||||
Gross margin (ThU.S.$) | 1,663,809 | 1,262,480 | ||||||
Financial costs (ThU.S.$) | (287,958 | ) | (258,467 | ) | ||||
| (1) | Earnings per share refer to the profit to net equity to parent company. |
| (2) | Includesnon-controlling interest. |
2
Table of Contents
CELULOSA ARAUCO Y CONSTITUCION S.A.
AND SUBSIDIARIES
Ratio Analysis of the Consolidated Financial Statements
December 31, 2017
Amounts in thousands of U.S. dollars, except as indicated
EBITDA | 12-31-2017 MU.S.$ | 12-31-2016 MU.S.$ | ||||||
Gain (loss) | 270.4 | 217.6 | ||||||
Finance costs | 288.0 | 258.5 | ||||||
Financial income | (19.6 | ) | (29.7 | ) | ||||
Expenses for income tax | (31.0 | ) | 45.6 | |||||
EBIT | 507.7 | 492.0 | ||||||
Depreciation and amortization | 421.6 | 409.4 | ||||||
EBITDA | 929.2 | 901.4 | ||||||
Cost at fair value of the harvest | 334.1 | 340.2 | ||||||
Gain from changes in fair value of biological assets | (83.0 | ) | (208.6 | ) | ||||
Exchange difference | (0.1 | ) | 3.9 | |||||
Others* | 186.2 | 15.2 | ||||||
Adjusted EBITDA | 1,366.4 | 1,052.1 | ||||||
| * | 2017: Loss of forest due to fires of MU.S.$138.1, net of MU.S.$34.8 from Impairment provision for property, plant and equipment and others, and MU.S.$13 from forestry roads adjustment. |
| * | 2016: Loss of forest due to fires of MU.S.$15.2 |
2. MAIN SOURCES OF FINANCING
Arauco’s financing needs are mainly covered through the capital markets, with bond issuances and credits obtained from banks and financial institutions serving as the main sources of financing. For short-term borrowing, Arauco follows a liquidity policy which indicates the amounts and institutions from which it can borrow according to several conditions defined in the policy. In the case of long-term debt, corporate bond issuances in the local market and also in international markets are used as sources of new resources. Another source of long-term financing corresponds to borrowings from banks and financial institutions around the world.
3. DIFFERENCE BETWEEN ECONOMIC VALUES AND BOOK ASSETS
Assets and liabilities are presented in the Financial Statements according to International Financial Reporting Standards and instructions issued by the Chilean Superintendency of Securities and Insurance (current Chilean Commission for the Financial Market). We believe that there are no material differences between the economic value of our assets and the value reflected in these Financial Statements.
4. MARKET SITUATION
Pulp Division
Prices during the fourth quarter experienced an increase of 11.2% compared to the last quarter. In general, all markets were very active in demand because of healthy economies that could absorb the increase in supply of pulp of new production that started at the end of 2016 and during 2017. This new production was also compensated due to operational problems of existing plants that lost a significant part of their annual capacity. The OKI Mill that was expected to reach the 2.8 million tons of annual production, instead is expected to produce 1.7 million tons for the next couple of years.
The Asian markets continue with high demand, especially China that has been affected by the import restrictions of unsorted waste paper. Although prices in the local market in China began to stabilize, there was an important difference between these prices and those of imports, especially in long fiber, that was declining during the fourth quarter. During the fourth quarter, there was more supply of short fiber pulp, so increases in prices were done with caution. Most Asian paper producers managed to pass the increases in pulp prices to
3
Table of Contents
CELULOSA ARAUCO Y CONSTITUCION S.A.
AND SUBSIDIARIES
Ratio Analysis of the Consolidated Financial Statements
December 31, 2017
Amounts in thousands of U.S. dollars, except as indicated
their products due to the strong demand, these were materialized specially during the fourth quarter. In Korea, customers were more reluctant to the increases in prices, because there was over supply in the paper market and pulp customers were not able to transfer the increase to their products. The increases in Korea were bigger than China due to higher discounts and adjustments to list prices.
In Europe, the market that was quite depressed for several years, showed clear signs of recovery and demand grew significantly, the market was still particularly active during this fourth quarter and prices continued rising. With the only exception of the tissue industry, the additional costs that paper producers had to absorb were transferred to the final product, and in general, the productions were at full capacity. In the tissue market contracts are annually negotiated so companies have more buying power.
Middle East, specially Turkey also started to have problems to transfer the price of the raw materials and were oversupply in tissue put producers in a very delicate situation in terms of margin. In North and Latin America, the price increases less aggressive. In the fluff market at the beginning of the fourth quarter the increase of prices was slow, but during the quarter prices started going up in a better rhythm.
Production during the fourth quarter decreased by 15.2% compared to last quarter and 11.3% compared to the same quarter of last year. The lower production is explained by more programmed maintenance stoppages this quarter, certain production losses at the plant in Argentina and the blockade of the Constitución Mill by an association of truck owners. The blockade lasted 38 days and the effect on the production was of 35,000 tons approximately.
Composite Panel
Sales slightly decreased, with overall sales volume decreasing 3.6% and average prices remain steady. MDF and PBO, both had less sales compared to third quarter, mainly because of competition in the North American markets. OSB sales volume in Chile were lower, however it was compensated with an increase in average prices, thanks to production from Sonae Arauco which we could sell within this market through market trading.
Sales in North American market continued to show stable price levels in comparison to the last quarter, meanwhile sales volume decreased due to more competitors. Brazil was also affected by lower sales volume in MDF, but there is still optimism in the market due to more consumption during the last months.
The rest of Latin America reached stable sales thanks to our diversified product mix. These markets have not been as dynamic as other parts of the world, as less projects that require construction and furniture products come into execution. In the Melamine market, we are still growing specially in Chile and Perú, where we are developing new supplying choices to cover the demand.
Timber Division
Sawn timber markets showed a negative trend from last quarter with sales volume decreasing 7.6%, but with stable average prices. Asia and the Middle East are the principal customers for these products, and sales to this markets during the fourth quarter were lower than the third quarter. Remanufactured sales volume was affected by the new supply coming from Brazil, that was compensated slightly by higher prices. Production was lower than the third quarter due to the stoppages in the Viñales facility.
4
Table of Contents
CELULOSA ARAUCO Y CONSTITUCION S.A.
AND SUBSIDIARIES
Ratio Analysis of the Consolidated Financial Statements
December 31, 2017
Amounts in thousands of U.S. dollars, except as indicated
Panels
Plywood production and sales volume decrease compared to the third quarter by 7.2% and 9.5% respectively. However, average prices increased 3.6% during the fourth quarter. Sales in North America improved as demand grew, especially with the retailer’s, due to the hurricanes that affected the southern east of the country. In Latin America, specifically in Chile and Mexico, the demand expanded and we were able to increase prices.
5. ANALYSIS OF CASH FLOW
The main components of net cash flow in each period are as follows:
| 12-31-2017 ThU.S.$ | 12-31-2016 ThU.S.$ | |||||||
Positive (negative) Cash flow | ||||||||
Cash flow from operating activities | 1,072,425 | 773,584 | ||||||
Cash flow from (used in) financing activities: | ||||||||
Loan and bond obtention and payments | (315,230 | ) | 92,442 | |||||
Dividend payments | (121,586 | ) | (130,624 | ) | ||||
Others | (2,285 | ) | (302 | ) | ||||
Cash flow from (used in) investment activities: | ||||||||
Incorporation and sale of property, plant and equipment | (442,006 | ) | (338,468 | ) | ||||
Incorporation and sale of biological assets | (176,575 | ) | (139,063 | ) | ||||
Incorporation and sale of intangible assets | (10,468 | ) | (14,858 | ) | ||||
Additions (Disposals), Investments in joint ventures and associates. | (15,917 | ) | (146,354 | ) | ||||
Dividends received | 7,287 | 4,772 | ||||||
Others | 4,331 | (6,241 | ) | |||||
|
|
|
| |||||
Positive (negative) Net cash flow | (24 | ) | 94,888 | |||||
|
|
|
| |||||
The financing cash flow shows a higher negative balance of MU.S.$439 for the current period, presenting variations in respect of the previous period (negative balance of MU.S.$38), resulting mainly from higher payments by indebtedness during the 2017 period.
Regarding the investment cash flow, as of the closing of the current period, it shows a lower negative balance of MU.S.$633 (MU.S.$640 for the 2016 period), mainly due to higher disbursements arising from the payment of the investment in joint venture SONAE ARAUCO during the 2016 period, offset by higher purchases in property, plant and equipments and biological assets in 2017.
5
Table of Contents
CELULOSA ARAUCO Y CONSTITUCION S.A.
AND SUBSIDIARIES
Ratio Analysis of the Consolidated Financial Statements
December 31, 2017
Amounts in thousands of U.S. dollars, except as indicated
7. MARKET RISK ANALYSIS
In respect of the economic risks resulting from interest rate variations, the Company maintains, as of December 31, 2017, a ratio of fixed rate debt to total consolidated debt of approximately 86%, which it believes is consistent with industry standards. Regarding variations in prices of pulp and forestry products, the Company does not participate in futures trading as to maintain one of the lowest cost structures in the industry, the risks for price fluctuations are bounded.
The Company and most of its subsidiaries maintain their accounting records and prepare their financial statements in U.S. dollars. Both the accounts receivable and most financial liabilities are denominated in U.S. dollars or are covered by an exchange rate swap, as well as most of their revenues. As a result, exposure to changes in the exchange rate has decreased significantly.
In the report to the Consolidated Financial Statements as of December 31, 2017, a detailed analysis of the risks associated with the business of Arauco is available (See Note 23).
6
Table of Contents
CELULOSA ARAUCO Y CONSTITUCION S.A.
AND SUBSIDIARIES
Unaudited Consolidated Financial Statements
December 31, 2017
Amounts in thousands of U.S. dollars, except as indicated
CONSOLIDATED STATEMENTS OF FINANCIAL POSITION
| Note | 12-31-2017 ThU.S.$ | 12-31-2016 ThU.S.$ | ||||||||
Assets | ||||||||||
Current Assets | ||||||||||
Cash and cash equivalents | 5 | 589,886 | 592.253 | |||||||
Other current financial assets | 23 | 3,504 | 5.201 | |||||||
Other currentnon-financial assets | 25 | 129,837 | 144.915 | |||||||
Trade and other current receivables | 23 | 814,412 | 701.610 | |||||||
Accounts receivable due from related companies | 13 | 3,488 | 12.505 | |||||||
Current inventories | 4 | 868,462 | 852.612 | |||||||
Current biological assets | 20 | 307,796 | 306.117 | |||||||
Current tax assets | 49,471 | 104.088 | ||||||||
Total Current Assets other than assets or disposal groups classified as held for sale | 2,766,856 | 2.719.301 | ||||||||
Non-Current Assets or disposal groups classified as held for sale | 22 | 3,507 | 3.059 | |||||||
Non-Current Assets or disposal groups classified as held for sale or as held for distribution to owners | 3,507 | 3.059 | ||||||||
Total Current Assets | 2,770,363 | 2.722.360 | ||||||||
Non-Current Assets | ||||||||||
Othernon-current financial assets | 23 | 56,600 | 8.868 | |||||||
Othernon-currentnon-financial assets | 25 | 121,521 | 130.319 | |||||||
Trade and othernon-current receivables | 16,040 | 14.273 | ||||||||
Accounts receivable due from related companies,non-current | 13 | 1,056 | 957 | |||||||
Investments accounted for using equity method | 15-16 | 368,772 | 446.548 | |||||||
Intangible assets other than goodwill | 19 | 88,615 | 89.497 | |||||||
Goodwill | 17 | 69,922 | 74.893 | |||||||
Property, plant and equipment | 7 | 7,034,299 | 6.919.495 | |||||||
Non-current biological assets | 20 | 3,459,146 | 3.592.874 | |||||||
Deferred tax assets | 8,266 | 6.097 | ||||||||
TotalNon-Current Assets | 11,224,237 | 11.283.821 | ||||||||
Total Assets | 13,994,600 | 14.006.181 | ||||||||
|
|
|
| |||||||
The accompanying notes are an integral part of these consolidated financial statements.
7
Table of Contents
CELULOSA ARAUCO Y CONSTITUCION S.A.
AND SUBSIDIARIES
Unaudited Consolidated Financial Statements
December 31, 2017
Amounts in thousands of U.S. dollars, except as indicated
CONSOLIDATED STATEMENTS OF FINANCIAL POSITION (continued)
| Note | 12-31-2017 ThU.S.$ | 12-31-2016 ThU.S.$ | ||||||||
Equity and Liabilities | ||||||||||
Liabilities | ||||||||||
Current Liabilities | ||||||||||
Other current financial liabilities | 23 | 500,344 | 697.452 | |||||||
Trade and other current payables | 23 | 717,346 | 537.891 | |||||||
Accounts payable to related companies | 13 | 11,208 | 3.831 | |||||||
Other current provisions | 18 | 2,728 | 842 | |||||||
Current tax liabilities | 8,088 | 1.641 | ||||||||
Current provisions for employee benefits | 10 | 5,730 | 5.244 | |||||||
Other currentnon-financial liabilities | 25 | 153,950 | 99.163 | |||||||
Total Current Liabilities other than assets included in disposal groups classified as held for sale | 1,399,394 | 1.346.064 | ||||||||
Total Current Liabilities | 1,399,394 | 1.346.064 | ||||||||
Non-Current Liabilities | ||||||||||
Othernon-current financial liabilities | 23 | 3,778,567 | 3.870.914 | |||||||
Othernon-current provisions | 18 | 36,008 | 38.138 | |||||||
Deferred tax liabilities | 6 | 1,485,365 | 1.631.065 | |||||||
Non-current provisions for employee benefits | 10 | 66,033 | 60.084 | |||||||
Othernon-currentnon-financial liabilities | 25 | 112,340 | 60.633 | |||||||
TotalNon-Current Liabilities | 5,478,313 | 5.660.834 | ||||||||
Total Liabilities | 6,877,707 | 7.006.898 | ||||||||
Equity | ||||||||||
Issued capital | 353,618 | 353.618 | ||||||||
Retained earnings | 7,425,133 | 7.329.675 | ||||||||
Other reserves | (703,778 | ) | (728.042 | ) | ||||||
Equity attributable to parent company | 7,074,973 | 6.955.251 | ||||||||
Non-controlling interests | 41,920 | 44.032 | ||||||||
Total Equity | 7,116,893 | 6.999.283 | ||||||||
Total Equity and Liabilities | 13,994,600 | 14.006.181 | ||||||||
|
|
|
| |||||||
The accompanying notes are an integral part of these consolidated financial statements.
8
Table of Contents
CELULOSA ARAUCO Y CONSTITUCION S.A.
AND SUBSIDIARIES
Unaudited Consolidated Financial Statements
December 31, 2017
Amounts in thousands of U.S. dollars, except as indicated
CONSOLIDATED STATEMENTS OF PROFIT OR LOSS
| For the years ended December 31, | ||||||||||
| 2017 | 2016 | |||||||||
| Note | ThU.S.$ | ThU.S.$ | ||||||||
Statements of profit or loss | ||||||||||
Revenue | 9 | 5,238,341 | 4,761,385 | |||||||
Cost of sales | 3 | (3,574,532 | ) | (3,498,905 | ) | |||||
Gross profit | 1,663,809 | 1,262,480 | ||||||||
Other income | 3 | 111,513 | 257,863 | |||||||
Distribution costs | 3 | (523,300 | ) | (496,473 | ) | |||||
Administrative expenses | 3 | (521,294 | ) | (474,469 | ) | |||||
Other expense | 3 | (240,165 | ) | (77,415 | ) | |||||
Profit from operating activities | 490,563 | 471,986 | ||||||||
Finance income | 3 | 19,640 | 29,701 | |||||||
Finance costs | 3 | (287,958 | ) | (258,467 | ) | |||||
Share of profit of associates and joint ventures accounted for using equity method | 15 | 17,017 | 23,939 | |||||||
Exchange rate differences | 98 | (3,935 | ) | |||||||
Profit before income tax | 239,360 | 263,224 | ||||||||
Income Tax | 6 | 30,992 | (45,647 | ) | ||||||
Net Profit | 270,352 | 217,577 | ||||||||
|
|
|
| |||||||
Net profit attributable to | ||||||||||
Net profit attributable to parent company | 269,724 | 213,801 | ||||||||
Net profit attributable tonon-controlling interests | 628 | 3,776 | ||||||||
Net Profit | 270,352 | 217,577 | ||||||||
|
|
|
| |||||||
Basic earnings per share (in U.S.$ per share) | ||||||||||
Basic earnings per share from continuing operations | 2.3836 | 1.8894 | ||||||||
|
|
|
| |||||||
Basic earnings per share | 2.3836 | 1.8894 | ||||||||
|
|
|
| |||||||
Earnings per diluted shares (in U.S.$ per share) | ||||||||||
Earnings per diluted share from continuing operations | — | — | ||||||||
|
|
|
| |||||||
Earnings per diluted share | — | — | ||||||||
|
|
|
| |||||||
The accompanying notes are an integral part of these consolidated financial statements.
9
Table of Contents
CELULOSA ARAUCO Y CONSTITUCION S.A.
AND SUBSIDIARIES
Unaudited Consolidated Financial Statements
December 31, 2017
Amounts in thousands of U.S. dollars, except as indicated
CONSOLIDATED STATEMENTS OF COMPREHENSIVE INCOME
| For the years ended December 31, | ||||||||||
| Note | 2017 ThU.S.$ | 2016 ThU.S.$ | ||||||||
Net profit | 270,352 | 217,577 | ||||||||
Components of other comprehensive income that will not be reclassified to profit or loss before tax: | ||||||||||
Other comprehensive income before tax actuarial gain (losses) on defined benefit plans | 2,499 | (5,593 | ) | |||||||
Share of other comprehensive income of associates and joint ventures accounted for using equity method | 8,754 | 132 | ||||||||
Other Comprehensive Income that will not be reclassified to profit or loss before tax | 11,253 | (5,461 | ) | |||||||
Components of other comprehensive income that will be reclassified to profit or loss before tax: | ||||||||||
Exchange differences on translation | ||||||||||
Gains (losses) on exchange differences on translation, before tax | 11 | 11,873 | 173,754 | |||||||
Other Comprehensive Income before tax exchange differences on translation | 11,873 | 173,754 | ||||||||
Cash flow hedges | ||||||||||
Gains (losses) on cash flow hedges, before tax | 23 | 22,212 | 84,045 | |||||||
Recycle of cash flow hedges to profit or loss before tax | 23 | (16,965 | ) | (10,198 | ) | |||||
Other Comprehensive Income before tax Cash flow hedges | 5,247 | 73,847 | ||||||||
Other Comprehensive income that will be reclassified to profit or loss before tax | 17,120 | 247,601 | ||||||||
Income tax relating to components of other comprehensive Income that will not be reclassified to profit or loss before tax | ||||||||||
Income tax relating to actuarial losses on defined benefit plans | (673 | ) | �� | 1,509 | ||||||
Income tax relating to share of other comprehensive income of associates and joint ventures accounted for using equity method | (2,086 | ) | (106 | ) | ||||||
Income tax relating to components of other comprehensive Income that will be reclassified to profit or loss before tax | ||||||||||
Income tax relating to cash flow hedges | 23 | (5,917 | ) | (20,055 | ) | |||||
Income tax relating to recycle of cash flow hedges | 23 | 4,326 | 2,700 | |||||||
Income tax relating to components of other comprehensive income that will be reclassified to profit or loss | (1,591 | ) | (17,355 | ) | ||||||
Other comprehensive (loss) income | 24,023 | 226,188 | ||||||||
Comprehensive (loss) income | 294,375 | 443,765 | ||||||||
|
|
|
| |||||||
Comprehensive Income attributable to | ||||||||||
Comprehensive (loss) income, attributable to owners of parent company | 293,988 | 435,119 | ||||||||
Comprehensive (loss) income, attributable tonon-controlling interests | 387 | 8,646 | ||||||||
Total comprehensive (loss) income | 294,375 | 443,765 | ||||||||
|
|
|
| |||||||
The accompanying notes are an integral part of these consolidated financial statements.
10
Table of Contents
CELULOSA ARAUCO Y CONSTITUCION S.A.
AND SUBSIDIARIES
Unaudited Consolidated Financial Statements
December 31, 2017
Amounts in thousands of U.S. dollars, except as indicated
CONSOLIDATED STATEMENTS OF CHANGES IN EQUITY
12-31-2017 | Issued Capital ThU.S.$ | Reserve of exchange differences on translation ThU.S.$ | Reserve of cash flow hedges ThU.S.$ | Reserve of actuarial losses on defined benefit plans ThU.S.$ | Other Reserves ThU.S.$ | Total other Reserves ThU.S.$ | Retained Earnings ThU.S.$ | Equity attributable to owners of parent ThU.S.$ | Non - controlling interests ThU.S.$ | Total Equity ThU.S.$ | ||||||||||||||||||||||||||||||
Opening balanceat 01-01-2017 | 353,618 | (703,886 | ) | 1,096 | (20,752 | ) | (4,500 | ) | (728,042 | ) | 7,329,675 | 6,955,251 | 44,032 | 6,999,283 | ||||||||||||||||||||||||||
Changes in Equity: | ||||||||||||||||||||||||||||||||||||||||
Comprehensive income | ||||||||||||||||||||||||||||||||||||||||
Net profit | 269,724 | 269,724 | 628 | 270.352 | ||||||||||||||||||||||||||||||||||||
Other comprehensive income, net of tax | 12,114 | 3,656 | 1,826 | 6,668 | 24,264 | 24,264 | (241 | ) | 24.023 | |||||||||||||||||||||||||||||||
Comprehensive income | — | 12,114 | 3,656 | 1,826 | 6,668 | 24,264 | 269,724 | 293,988 | 387 | 294.375 | ||||||||||||||||||||||||||||||
Dividends | (174,266 | ) | (174,266 | ) | (2,483 | ) | (176.749 | ) | ||||||||||||||||||||||||||||||||
Increase (decrease) from transfers and other changes | — | — | (16 | ) | (16 | ) | ||||||||||||||||||||||||||||||||||
Changes in equity | — | 12,114 | 3,656 | 1,826 | 6,668 | 24,264 | 95,458 | 119,722 | (2,112 | ) | 117.610 | |||||||||||||||||||||||||||||
Closing balance at12-31-2017 | 353,618 | (691,772 | ) | 4,752 | (18,926 | ) | 2,168 | (703,778 | ) | 7,425,133 | 7,074,973 | 41,920 | 7,116,893 | |||||||||||||||||||||||||||
|
|
|
|
|
|
|
|
|
|
|
|
|
|
|
|
|
|
|
| |||||||||||||||||||||
12-31-2016 | Issued Capital ThU.S.$ | Reserve of exchange differences on translation ThU.S.$ | Reserve of cash flow hedges ThU.S.$ | Reserve of actuarial losses on defined benefit plans ThU.S.$ | Other Reserves ThU.S.$ | Total other Reserves ThU.S.$ | Retained Earnings ThU.S.$ | Equity attributable to owners of parent ThU.S.$ | Non - controlling interests ThU.S.$ | Total Equity ThU.S.$ | ||||||||||||||||||||||||||||||
Opening balanceat 01-01-2016 | 353,618 | (872,770 | ) | (55,396 | ) | (16,668 | ) | (4,526 | ) | (949,360 | ) | 7,204,452 | 6,608,710 | 37,735 | 6,646,445 | |||||||||||||||||||||||||
Changes in Equity: | ||||||||||||||||||||||||||||||||||||||||
Comprehensive income | ||||||||||||||||||||||||||||||||||||||||
Net profit | 213,801 | 213,801 | 3.776 | 217.577 | ||||||||||||||||||||||||||||||||||||
Other comprehensive income, net of tax | 168,884 | 56,492 | (4,084 | ) | 26 | 221,318 | 221,318 | 4.870 | 226.188 | |||||||||||||||||||||||||||||||
Comprehensive income | — | 168,884 | 56,492 | (4,084 | ) | 26 | 221,318 | 213,801 | 435,119 | 8.646 | 443.765 | |||||||||||||||||||||||||||||
Dividends | (88,578 | ) | (88,578 | ) | (2,250 | ) | (90.828 | ) | ||||||||||||||||||||||||||||||||
Increase (decrease) from transfers and other changes | — | — | (99 | ) | (99 | ) | ||||||||||||||||||||||||||||||||||
Changes in equity | — | 168,884 | 56,492 | (4,084 | ) | 26 | 221,318 | 125,223 | 346,541 | 6,297 | 352.838 | |||||||||||||||||||||||||||||
Closing balance at12-31-2016 | 353,618 | (703,886 | ) | 1,096 | (20,752 | ) | (4,500 | ) | (728,042 | ) | 7,329,675 | 6,955,251 | 44,032 | 6,999,283 | ||||||||||||||||||||||||||
|
|
|
|
|
|
|
|
|
|
|
|
|
|
|
|
|
|
|
| |||||||||||||||||||||
The accompanying notes are an integral part of these consolidated financial statements.
11
Table of Contents
CELULOSA ARAUCO Y CONSTITUCION S.A.
AND SUBSIDIARIES
Unaudited Consolidated Financial Statements
December 31, 2017
Amounts in thousands of U.S. dollars, except as indicated
CONSOLIDATED STATEMENTS OF CASH FLOWS
| For the years ended December 31, | ||||||||
| 2017 ThU.S.$ | 2016 ThU.S.$ | |||||||
STATEMENTS OF CASH FLOWS | ||||||||
Cash Flows from (used in) Operating Activities | ||||||||
Classes of cash receipts from operating activities | ||||||||
Receipts from sales of goods and rendering of services | 5,508,705 | 5,020,551 | ||||||
Other cash receipts from operating activities | 365,238 | 470,765 | ||||||
Classes of cash payments | ||||||||
Payments to suppliers for goods and services | (3,850,367 | ) | (3,914,976 | ) | ||||
Payments to and on behalf of employees | (532,223 | ) | (320,738 | ) | ||||
Other cash payments from operating activities | (128,314 | ) | (232,271 | ) | ||||
Interest paid | (261,186 | ) | (191,573 | ) | ||||
Interest received | 18,966 | 29,380 | ||||||
Income taxes paid | (37,942 | ) | (83,903 | ) | ||||
Other inflows (outflows) of cash, net | (10,452 | ) | (3,651 | ) | ||||
Net Cash flows from Operating Activities | 1,072,425 | 773,584 | ||||||
|
|
|
| |||||
Cash flows (used in) investing activities | ||||||||
Cash flow used in obtaining control of subsidiaries or other businesses | (15,918 | ) | — | |||||
Cash used for contributions and purchase of associates and joint ventures | — | (153,135 | ) | |||||
Other cash receipts from sales of equity or debt instruments in other entities | 1 | 6,781 | ||||||
Loans to related parties | — | — | ||||||
Proceeds from sale of property, plant and equipment | 6,308 | 17,685 | ||||||
Purchase of property, plant and equipment | (448,314 | ) | (356,153 | ) | ||||
Proceeds from sales of intangible assets | — | — | ||||||
Purchase of intangible assets | (10,468 | ) | (14,858 | ) | ||||
Proceeds from sales of other long-term assets | 2,609 | 1,644 | ||||||
Purchase of othernon-current assets | (179,184 | ) | (140,707 | ) | ||||
Dividends received | 7,287 | 4,772 | ||||||
Other inflows (outflows) of cash, net | 4,331 | (6,241 | ) | |||||
Cash flows used in Investing Activities | (633,348 | ) | (640,212 | ) | ||||
|
|
|
| |||||
Cash flows from (used in) Financing Activities | ||||||||
Total borrowings obtained | 1,312,481 | 737,653 | ||||||
Debt obtained in long-term | 1,025,096 | 187,845 | ||||||
Debt obtained in short-term | 287,385 | 549,808 | ||||||
Repayments of borrowings | (1,627,711 | ) | (645,211 | ) | ||||
Dividends paid | (121,586 | ) | (130,624 | ) | ||||
Other outflows of cash, net | (2,285 | ) | (302 | ) | ||||
Cash flows used in Financing Activities | (439,101 | ) | (38,484 | ) | ||||
|
|
|
| |||||
Net increase (decrease) in Cash and Cash Equivalents before effect of exchange rate changes | (24 | ) | 94,888 | |||||
Effect of exchange rate changes on cash and cash equivalents | (2,343 | ) | (2,660 | ) | ||||
|
|
|
| |||||
Net increase (decrease) of Cash and Cash equivalents | (2,367 | ) | 92,228 | |||||
Cash and cash equivalents, at the beginning of the period | 592,253 | 500,025 | ||||||
Cash and cash equivalents, at the end of the period | 589,886 | 592,253 | ||||||
|
|
|
| |||||
The accompanying notes are an integral part of these consolidated financial statements.
12
Table of Contents
CELULOSA ARAUCO Y CONSTITUCION S.A.
AND SUBSIDIARIES
Unaudited Consolidated Financial Statements
December 31, 2017
Amounts in thousands of U.S. dollars, except as indicated
NOTES TO CONSOLIDATED FINANCIAL STATEMENTS AS OF DECEMBER 31, 2017 AND 2016
NOTE 1. PRESENTATION OF CONSOLIDATED FINANCIAL STATEMENTS
Entity Information
Celulosa Arauco y Constitución S.A. and subsidiaries, (hereafter “Arauco” or the “Company”), tax identification number93,458,000-1, is a closely held corporation, that was registered in the Securities Registry (the “Registry”) of the Superintendency of Securities and Insurance (current Chilean Commission for the Financial Market (“CMF”)) as No. 042 on June 14, 1982. Additionally, the Company is registered as anon-accelerated filer in the Securities and Exchange Commission (SEC) of the United States of America.
Forestal Cholguán S.A., a subsidiary of Celulosa Arauco y Constitución S.A., is also registered in the Securities Registry as No. 030.
The Company’s head office address is El Golf Avenue 150, 14thfloor, Las Condes, Santiago, Chile.
Arauco is principally engaged in the production and sale of products related to the forestry and timber industries. Its main operations are focused on business areas of pulp, timber and forestry.
Arauco is controlled by Empresas Copec S.A., which owns 99.9780% of Arauco, and is registered in the Securities Registry as No. 0028. Each of the above mentioned companies is subject to the oversight of the CMF.
The ultimate shareholders of Arauco are Mrs. Maria Noseda Zambra de Angelini, Mr. Roberto Angelini Rossi and Mrs. Patricia Angelini Rossi, who have control fundamentally as follows:
| (i) | Through Inversiones Angelini y Cía. Ltda., entity wich has 63.4015% of the shares of AntarChile S.A. and |
| (ii) | Mr. Roberto Angelini Rossi through the statutory control of Inversiones Golfo Blanco Ltda., direct owner of 5.77307% of the shares of AntarChile S.A.; and Mrs. Patricia Angelini Rossi, through the statutory control of Inversiones Senda Blanca Ltda., direct owner of 4.32981% of the shares of AntarChile S.A. |
Arauco’s Consolidated Financial Statements were prepared on a going concern basis.
13
Table of Contents
CELULOSA ARAUCO Y CONSTITUCION S.A.
AND SUBSIDIARIES
Unaudited Consolidated Financial Statements
December 31, 2017
Amounts in thousands of U.S. dollars, except as indicated
Presentation of Consolidated Financial Statements
The Financial Statements presented by Arauco are comprised by the following:
| • | Consolidated Statements of Financial Positionas of December 31, 2017 and 2016. |
| • | Consolidated Statements of Profit or Loss for the years ended December 31, 2017 and 2016. |
| • | Consolidated Statements of Comprehensive Income for the years ended December 31, 2017 and 2016. |
| • | Consolidated Statements of Changes in Equity for the years ended December 31, 2017 and 2016. |
| • | Consolidated Statements of Cash Flows for the years ended December 31, 2017 and 2016. |
| • | Explanatory disclosures (notes) |
Period Covered by the Consolidated Financial Statements
Periods ended December 31, 2017 and 2016.
Date of Approval of Consolidated Financial Statements
These consolidated financial statements were approved by the Board of Directors of the Company (the “Board”) at the Extraordinary Meeting No. 584 on April 19, 2018.
Abbreviations used in this report:
IFRS - International Financial Reporting Standards
IASB - International Accounting Standards Board
IAS - International Accounting Standards
IFRIC - International Financial Reporting Standards Interpretations Committee
MU.S.$ - Millions of U.S. dollars
ThU.S.$ - Thousands of U.S. dollars
U.F. – Inflation index-linked units of account
UTA – Annual Tax Unit
ICMS – Tax movement of inventories and services (Brazil)
Functional and Presentation Currency
Arauco and most of its subsidiaries determined the United States (“U.S.”) Dollar as its functional currency since the majority of its revenues from sales of its products are derived from exports denominated in U.S. Dollars, while their costs of sales are to a large extent related or indexed to the U.S. Dollar.
For the pulp reportable segment, most of the sales are exports denominated in U.S. Dollars and costs are mainly related to plantation costs which are settled in U.S. Dollars.
For the sawn timber, panel and forestry reportable segments, although total sales include a mix of domestic and exports sales, prices of the products are established in U.S. Dollars, which is also the case for the cost structure of the related raw materials.
In relation to the cost of sales, although labor and services costs are generally billed and paid in local currency, these costs are not as significant as the costs of raw materials, which are driven mainly by global markets and therefore, influenced mostly by the U.S. Dollar.
14
Table of Contents
CELULOSA ARAUCO Y CONSTITUCION S.A.
AND SUBSIDIARIES
Unaudited Consolidated Financial Statements
December 31, 2017
Amounts in thousands of U.S. dollars, except as indicated
The presentation currency of the consolidated financial statements is the U.S. Dollar. Figures on these consolidated financial statements are presented in thousands of U.S. Dollar (ThU.S.$).
Summary of significant accounting policies
| a) | Basis for preparation of consolidated financial statements |
These consolidated financial statements have been prepared in accordance with International Financial Reporting Standards (IFRS) as issued by the International Accounting Standards Board (IASB) and they represent the explicit and unreserved adoption of IFRS.
The consolidated financial statements have been prepared on the historical cost basis, except for biological assets and certain derivative financial instruments which are measured at revalued amounts or fair value at the end of each period as explained in the following significant accounting policies.
| b) | Critical accounting estimates and judgments |
The preparation of these financial statements, in accordance with IFRS, requires management to make estimates and assumptions that affect the carrying amounts reported. These estimates are based on historical experience and various other assumptions that are considered to be reasonable. Actual results may differ from these estimates. Management believes that the accounting policies below are the critical judgments that have the most significant effect on the amounts recognized in the consolidated financial statements.
-Biological Assets
The recovery of forest plantations is based on discounted cash flow models which means that the fair value of biological assets is calculated using cash flows from continuing operations on a discounted basis, based on our sustainable forest management plans and the estimated growth of forests.
These discounted cash flows require estimates in growth, harvest, sales prices and costs; therefore, it is important that management make appropriate estimates of future levels and trends for sales and costs, as well as conduct regular surveys of the forests to establish the volumes of wood available for harvesting and their current growth rates. The main considerations used to measure forest plantations are presented in Note 20, including a sensitivity analysis.
15
Table of Contents
CELULOSA ARAUCO Y CONSTITUCION S.A.
AND SUBSIDIARIES
Unaudited Consolidated Financial Statements
December 31, 2017
Amounts in thousands of U.S. dollars, except as indicated
-Goodwill
Goodwill represents the excess of the acquisition cost over the fair value of the Group’s holding in the identifiable net assets of the acquired subsidiary at the date of acquisition. The aforementioned fair value is determined whether based on assessments and/or the discounted future flow method using hypotheses in their determination, such as sales prices and industry indexes, among others. See Note 17.
-Litigation and Contingencies
Arauco and its subsidiaries are subject to certain litigation proceedings. Future impact on Arauco’s financial condition derived from such litigations is estimated by management, in collaboration with its legal advisors. Arauco applies judgment when interpreting the reports of its legal advisors who provide updated estimates of the legal contingencies at each reporting period and/or at each time a modification is determined to be necessary. For a description of current litigations see Note 18.
| c) | Consolidation |
The consolidated financial statements include all entities over which Arauco has the power to direct the relevant financial and operating activities. Subsidiaries are consolidated from the date on which control is obtained and up to the date that control ceases.
Specifically, a company controls an investee or subsidiary if, and only if, they have all of the following:
(a) power over the investee, i.e. the investor has existing rights which give it the ability to direct the relevant activities (the activities that significantly affect the investee’s returns)
(b) exposure or rights to variable returns from involvement with the investee; and
(c) the ability to use power over the investee to affect the amount of the investor’s returns.
When Arauco holds less than the majority of voting rights in a company in which it participates, it nonetheless has the power over said company - when these voting rights are enough - to grant it in practice the ability to unilaterally direct said company’s relevant activities. Arauco takes into account all facts and circumstances in order to assess if the voting rights in a company in which it participates are enough for granting it the power, including:
a) the size of the investor’s holding of voting rights relative to the size and dispersion of holdings of the other vote holders;
b) potential voting rights held by the investor, other vote holders or other parties;
c) rights arising from other contractual arrangements; and
d) any additional facts and circumstances that indicate the investor has, or does not have, the current ability to direct the relevant activities at the time that decisions need to be made, including voting patterns at previous shareholders’ meetings.
The Company will reevaluate whether or not it holds control of a company in which participates if the facts and circumstances indicate that changes have occurred in one or more of the three elements of control mentioned above.
16
Table of Contents
CELULOSA ARAUCO Y CONSTITUCION S.A.
AND SUBSIDIARIES
Unaudited Consolidated Financial Statements
December 31, 2017
Amounts in thousands of U.S. dollars, except as indicated
Consolidation of an investee shall begin from the date the investor obtains control of the investee and cease when the investor loses control of the investee. An entity includes the income and expenses of an acquired or sold subsidiary in the consolidated financial statements from the date it gains control until the date when the entity ceases to control the subsidiary.
The profit or loss of each component of other comprehensive income is attributed to owners of the parent company and thenon-controlling interest, as appropriate. Total comprehensive income is attributed to the owners of the parent company andnon-controlling interests even if the results of thenon-controlling interest have a deficit balance.
If a subsidiary uses accounting policies other than those adopted in the consolidated financial statements for transactions and other events in similar circumstances, appropriate adjustments are made to the consolidated financial statements of subsidiaries in order to ensure compliance with Arauco’s accounting policies.
All intercompany transactions and unrealized gains and losses from subsidiaries have been fully eliminated from consolidated financial statements andnon-controlling interest is presented in the consolidated statement of financial position within equity, separately from the equity of the owners of the parent company.
The consolidated financial statements at the end of this period include the assets, liabilities, income and expenses of the subsidiaries shown in Note 13.
Certain consolidated subsidiaries have Brazilian Real and Chilean Pesos as their functional currencies. For consolidation purposes, the financial statements of those subsidiaries have been prepared in accordance with IFRS and translated into the presentation currency as indicated in Note 1 (e) (ii).
A parent company will presentnon-controlling interests in the consolidated statement of financial position within equity, separately from the equity of the owners of the parent company.
| d) | Segments |
Arauco has defined its reportable segments according to its business areas, based on the products and services sold to its customers. This definition is consistent with the management, resource allocation and performance assessment made by key personnel responsible for making relevant decisions related to the Company’s operation. The Chief Operating Decision Maker (CODM) is the Chief Executive Officer who is responsible for making these decisions and it is supported by the Corporate Managing Directors of each segment.
Based on the aforementioned process, the Company has established reportable segments according to the following business units:
| • | Pulp |
| • | Timber |
| • | Forestry |
Refer to Note 24 for detailed financial information by reportable segment.
17
Table of Contents
CELULOSA ARAUCO Y CONSTITUCION S.A.
AND SUBSIDIARIES
Unaudited Consolidated Financial Statements
December 31, 2017
Amounts in thousands of U.S. dollars, except as indicated
| e) | Functional currency |
| (i) | Functional currency |
All items in the financial statements of Arauco and each of its subsidiaries, associates and jointly controlled entities are measured using the currency of the primary economic environment in which each entity operates (the functional currency). The consolidated financial statements are presented in U.S. dollars, which is Arauco’s functional and presentation currency.
| (ii) | Translation to the presentation currency of Arauco |
For the purposes of presenting consolidated financial statements, assets and liabilities of Arauco’s operations in a functional currency different from Arauco’s are translated into U.S. dollars using exchange rates prevailing at the end of each reporting period. Income and expense items are translated at the average exchange rates for the period, unless exchange rates fluctuate significantly during that period, in which case the exchange rates at the dates of the transactions are used. Exchange rate differences are recognized in other comprehensive income and accumulated in “Other reserves” within–equity.
| (iii) | Foreign Currency Transactions |
Transactions in currencies other than the functional currency are recognized at the exchange rates prevailing at the dates of the transactions. Profit or loss on transactions in currencies other than the functional currency resulting from the settlement of such transactions and from the translation atyear-end exchange rates of monetary assets and liabilities denominated in foreign currencies, are recognized in the statements of profit or loss, except those which are recorded in other comprehensive income and accumulated in equity such as cash flows hedging derivatives.
| f) | Cash and cash equivalents |
Cash and cash equivalents includecash-in-hand, deposits held on demand at banks and other short term highly liquid investments with an original maturity of three months or less and which are subject to an insignificant risk of changes in value.
| g) | Financial Instruments |
Financial assets
Financial assets are classified into the following specified categories: ‘loans and receivables’ and “derivative financial instruments”. The classification depends on the nature and purpose of the financial assets and is determined at the time of initial recognition. All purchases and sales of financial assets are recognized and derecognized on the trade date, which require delivery of assets within the same time frame established by regulation or convention in the marketplace.
Loans and receivables arenon-derivative financial assets with fixed or determinable payments that are not quoted in an active market. Loans and receivables are classified as current assets, except for those with maturities more than 12 months after the reporting period, which are classified asnon-current assets. Loans and receivables include trade and other receivables.
18
Table of Contents
CELULOSA ARAUCO Y CONSTITUCION S.A.
AND SUBSIDIARIES
Unaudited Consolidated Financial Statements
December 31, 2017
Amounts in thousands of U.S. dollars, except as indicated
Loans and receivables are initially recognized at fair value plus transaction costs that are directly attributable to the acquisition and are subsequently measured at amortized cost using the effective interest rate method, less any impairment.
Derivative financial instruments are explained in Note 1 h)
Financial liabilities
Financial liabilities (including borrowings and trade and other payables) are subsequently measured at amortized cost using the effective interest method.
The effective interest method is a method of calculating the amortized cost of a financial liability and of allocating interest expense over the relevant period. The effective interest rate is the rate that discounts estimated future cash payments (including all fees and amounts paid or received that form an integral part of the effective interest rate, transaction costs and other premiums or discounts) through the expected life of the financial liability, or (where appropriate) a shorter period, to the net carrying amount on initial recognition.
Financial obligations are classified as current liabilities, unless Arauco holds an unconditional right to defer their settlement during at least 12 months after the balance sheet’s date.
The estimate of the fair value of obligations with banks is determined using valuation techniques that include discounted cash flow analyses applying rates of similar loans. Bonds are appraised at market value.
| h) | Derivative financial instruments |
(i) Derivative Financial Instruments - The Company enters into a variety of derivative financial instruments to manage its exposure to interest rate and foreign exchange rate risks, including foreign exchange forward contracts, interest rate swaps, currency swaps and zero cost collar contracts. The Company’s policy is to enter into derivatives contracts only for economic hedging purposes and there no instruments with speculation objectives.
Derivatives are initially recognized at fair value at the date the derivative contracts are entered into and are subsequentlyre-measured at fair value at the end of each reporting period. The resulting gain or loss is recognized in profit or loss unless the derivative is designated as a hedging instrument and complies with hedge accounting requirements of IAS 39, in which event the timing of the recognition in profit or loss depends on the nature of the hedge relationship.
(ii) Embedded derivatives - The Company assesses the existence of embedded derivatives in financial instrument contracts. Derivatives embedded innon-derivative host contracts are treated as separate derivatives when they meet the definition of a derivative, their risks and characteristics are not closely related to those of the host contracts and the contracts are not measured at FVTPL as a whole. Arauco has determined that no embedded derivatives currently exist.
19
Table of Contents
CELULOSA ARAUCO Y CONSTITUCION S.A.
AND SUBSIDIARIES
Unaudited Consolidated Financial Statements
December 31, 2017
Amounts in thousands of U.S. dollars, except as indicated
(iii) Hedge accounting - The Company designates certain hedging instruments as either fair value hedges or cash flow hedges.
At the inception of the hedge relationship, the entity documents the relationship between the hedging instrument and the hedged item, along with its risk management objectives and its strategy for undertaking various hedge transactions. Furthermore, at the inception of the hedge and on an ongoing basis, Arauco documents whether the hedging instrument is highly effective in offsetting changes in fair values or cash flows of the hedged item attributable to the hedged risk.
-Fair Value Hedges under IAS39-Changes in the fair value of derivatives that are designated and qualify as fair value hedges are recognized in profit or loss immediately, together with any changes in the fair value of the hedged asset or liability that are attributable to the hedged risk. The change in the fair value of the hedging instrument and the change in the hedged item attributable to the hedged risk are recognized in profit or loss in the line item relating to the hedged item.
-Cash flow hedges under IAS 39 -The effective portion of changes in the fair value of derivatives that are designated and qualify as cash flow hedges is recognized in other comprehensive income and accumulated under the heading of cash flow hedging reserve. The gain or loss relating to the ineffective portion is recognized immediately in profit or loss, and is included in the Finance costs line item in the consolidated statement of profit or loss. Amounts previously recognized in other comprehensive income are reclassified to profit or loss in the periods when the hedged item affects profit or loss, in the same line as the recognized hedged item.
Hedge accounting is discontinued when the Group revokes the hedging relationship, when the hedging instrument expires or is sold, terminated, or exercised, or when it no longer qualifies for hedge accounting. Any gain or loss recognized in other comprehensive income and accumulated in equity at that time remains in equity and is recognized when the forecasted transaction is ultimately recognized in profit or loss. When a forecasted transaction is no longer expected to occur, the gain or loss accumulated in equity is recognized immediately in profit or loss.
| i) | Inventories |
Inventories are stated at the lower of cost and net realizable value. Cost is determined using the weighted average cost method.
The cost of finished and in process products includes the cost of raw materials, direct labor, other direct costs and manufacturing overhead expenses.
Initial costs of harvested wood are determined at fair value less cost of sale at the point of harvest.
Biological assets are transferred to inventories when forests are harvested.
Net realizable value is the estimated selling price in the ordinary course of business less the estimated costs of completion and the estimated costs necessary to make the sale.
20
Table of Contents
CELULOSA ARAUCO Y CONSTITUCION S.A.
AND SUBSIDIARIES
Unaudited Consolidated Financial Statements
December 31, 2017
Amounts in thousands of U.S. dollars, except as indicated
When market conditions result in the production costs of a product exceeding its net realizable value, the inventories are written-down to their net realizable value. This write-down also includes obsolescence amounts resulting from slow moving inventories and technical obsolescence.
Spare parts that will be consumed in a period of less than twelve months are presented in inventories and recognized as an expense when they are consumed.
| j) | Non-current assets held for sale |
The Group classifies certain property, plant and equipment, intangible assets, investments in associates and disposal groups (groups of assets to be sold together with their directly associated liabilities) asnon-current assets held for sale which as of the date of the statements of financial position are the subject of active sale efforts which are estimated to be highly probable.Non-current assets held for sale are presented separately from the other assets in the balance sheet.
These assets or disposal groups are measured at the lower of the carrying amount or the fair value less the costs to sell, and are no longer depreciated or amortized from the time they are classified asnon-current assets held for sale.
| k) | Business Combinations |
Arauco applies the acquisition method to account for a business combination. This method requires the identification of the acquirer, determination of the acquisition date, recognition and measurement of the identifiable assets acquired, the liabilities assumed and anynon-controlling interest in the acquiree; and recognition and measurement of goodwill or a gain from a bargain purchase. Identifiable assets acquired and liabilities assumed and any contingent liabilities in a business combination are initially measured at fair value at the acquisition date, except:
-deferred tax assets or liabilities, and assets or liabilities related to employee benefit arrangements are recognized and measured in accordance with IAS 12 Income Taxes and IAS 19 respectively;
-liabilities or equity instruments related to share-based payment arrangements of the acquiree or share-based payment arrangements of the Group entered into to replace share-based payment arrangements of the acquiree are measured in accordance with IFRS 3 at the acquisition date; and
-assets (or disposal groups) that are classified as held for sale in accordance with IFRS 5Non-current Assets Held for Sale and Discontinued Operations are measured in accordance with such standard.
Acquisition-related costs are accounted for as expenses when they are incurred, except for costs to issue debt or equity securities which are recognized in accordance with IAS 32 and IAS 39.
A parent will presentnon-controlling interests in the consolidated statement of financial position within equity, separately from the equity of the owners of the parent company.
21
Table of Contents
CELULOSA ARAUCO Y CONSTITUCION S.A.
AND SUBSIDIARIES
Unaudited Consolidated Financial Statements
December 31, 2017
Amounts in thousands of U.S. dollars, except as indicated
Changes in the ownership interest of a parent in its subsidiary that do not result in a loss of control are treated as equity transactions. Any difference between the amount by whichnon-controlling interests are adjusted and the fair value of the consideration paid or received is recognized directly in equity and attributed to owners of the parent company. No adjustment is made to the carrying amount of goodwill, neither gains nor losses are recognized in the statement of profit or loss.
Non-controlling interests that are present ownership interests and entitle their holders to a proportionate share of the entity’s net assets in the event of liquidation may initially be measured either at fair value or at the present ownership instruments’ proportionate share ofnon-controlling interests, in the recognized amounts of the acquirer’s identifiable net assets. The choice is made on atransaction-by-transaction basis.
Arauco measures the fair value of the acquired company in the business combination achieved in stage (“step acquisition”), recognizing the effects of remeasurement of previously held equity in the acquiree in the statements of profit or loss.
If the initial accounting for a business combination is not completed by the end of the reporting period in which the combination occurs, Arauco reports preliminary amounts for the items for which the accounting is incomplete. During the measurement period (no more than one year), these preliminary amounts are retrospectively adjusted, or additional assets or liabilities are recognized to reflect new information about facts and circumstances that existed at the acquisition date, if known, would have affected the amounts recognized at that date.
Business combinations that are under common control transactions are accounted using as a reference the pooling of interest. Under this method, assets and liabilities related to the transaction carry over the previous carrying values. Any difference between assets and liabilities included in the consolidation and the consideration transferred, is accounted in equity.
| l) | Investments in associates and joint arrangements |
Associates are entities over which Arauco exercises significant influence, but not control. Significant influence is the power to participate in the financial and operating policy decisions of the investee but is not control or joint control over those policies.
Joint arrangement is defined as an entity over which there is joint control, which exists only when the decisions about strategic of activities, both financial and operational, require the unanimous consent of the parties sharing control.
Investments in joint arrangements are classified as a joint venture or as a joint operation. A joint operation is a joint arrangement in which the parties that have joint control of the arrangement (i.e. joint operators) have rights to the assets and obligations for the liabilities, relating to the arrangement. A joint venture is a joint arrangement in which the parties that have joint control of the arrangement (i.e., participants in a joint venture) have rights to the net assets of the arrangement.
Investments in associates and joint ventures are accounted for using the equity method and are initially recognized at cost. Their carrying amount is increased or decreased to recognize the portion corresponding to the statement of profit or loss or to the statement of comprehensive income. Dividends received are recognized by deducting the amount received from the carrying amount of the investment. Arauco’s investment in associates includes goodwill (both net of any accumulated impairment loss).
22
Table of Contents
CELULOSA ARAUCO Y CONSTITUCION S.A.
AND SUBSIDIARIES
Unaudited Consolidated Financial Statements
December 31, 2017
Amounts in thousands of U.S. dollars, except as indicated
The investments in joint operations are recognized through consolidation of assets, liabilities and results of operations in relation to Arauco’s ownership percentage.
Investments in associates and joint ventures are presented in the consolidated statement of financial position in the line item “Investments accounted for using equity method”.
If Arauco’s share of losses of an associate or joint venture equals or exceeds its interest in the associate or joint venture, Arauco discontinues recognizing its share of further losses. After Arauco’s carrying value in the investee is reduced to zero, additional losses are provided for, and a liability is recognized, only to the extent that Arauco has incurred legal or constructive obligations or made payments on behalf of the associate or joint venture. If the associate or joint venture subsequently reports profits, Arauco resumes recognizing its share of those profits only after its share of the profits equals the share of losses not recognized.
| m) | Intangible assets other than goodwill |
After initial recognition, intangible assets with finite useful lives are carried at cost less any accumulated amortization and impairment losses.
Amortization of an intangible asset with a finite useful life is allocated over the asset’s useful life. Amortization begins when the asset is available for use, i.e., when it is in the location and condition necessary for it to be capable of operating in the manner intended by management.
| (i) | Computer Software |
Computer software licenses are capitalized in terms of the costs incurred to acquire and make them compatible with existing software. These costs are amortized over the estimated useful lives of the software.
| (ii) | Water Rights, Easements and Other Rights |
This item includes water rights, easements and other acquired rights recognized at historical cost which have indefinite useful lives as there is no foreseeable limit to the period over which these assets are expected to generate future cash flows. These rights are not amortized, but are tested for impairment at least annually, or when there is any indication that the assets might be impaired.
| (iii) | Customers and trade relations with customers |
Correspond to the valuation over the time of the established relationship with customers, from the sale of products and services through its sales team. These relations will materialize in sales orders, which generate revenue and cost of sales. The useful life has been determined to be 15 years.
23
Table of Contents
CELULOSA ARAUCO Y CONSTITUCION S.A.
AND SUBSIDIARIES
Unaudited Consolidated Financial Statements
December 31, 2017
Amounts in thousands of U.S. dollars, except as indicated
| n) | Goodwill |
Goodwill is measured as the excess of the sum of the consideration transferred, the amount of anynon-controlling interest in the acquired company, and the fair value of the acquirer’s previously held equity interest in the acquired company (if any) over the net of the acquisition-date amounts of the identifiable assets acquired and theliabilities assumed. If the total of consideration transferred,non-controlling interest recognized and previously held interest measured is less than the fair value of the net assets of the subsidiary acquired in the case of a bargain purchase, the difference is recognized directly in the statements of profit or loss.
Goodwill is not amortized but tested for impairment on annual basis.
After initial recognition, goodwill is measured at cost less any accumulated impairment losses. For purposes of impairment testing, goodwill in a business combination is allocated as of the acquisition date to the cash generating unit or a group of cash generating units expected to benefit from the synergies of the combination irrespective of whether other assets or liabilities of the acquired company are allocated to those units or group of units.
The goodwill generated on acquisitions of foreign companies, is expressed in the functional currency of such foreign company.
Goodwill recognized for the acquisition of the subsidiary Arauco do Brasil S.A. whose functional currency is the Brazilian Real, is translated into U.S. Dollars at the closing exchange rate.
24
Table of Contents
CELULOSA ARAUCO Y CONSTITUCION S.A.
AND SUBSIDIARIES
Unaudited Consolidated Financial Statements
December 31, 2017
Amounts in thousands of U.S. dollars, except as indicated
| o) | Property, Plant and Equipment |
Property, plant and equipment are measured at cost less accumulated depreciation and accumulated impairment. The cost includes expenditures that are directly attributable to the acquisition of the assets.
Subsequent costs, such as improvements and replacement of components, are included in the asset’s carrying amount or recognized as a separate asset, as appropriate, only when it is probable that future economic benefits associated with the item will flow to Arauco and the cost of the item can be measured reliably. The carrying amount of the replaced part is derecognized from property, plant and equipment. All other repairs and maintenance costs are expensed in the period in which they are incurred.
Arauco capitalizes borrowing costs that are directly attributable to the acquisition, construction or production of qualifying assets as part of the cost of those assets, until the assets are ready for their intended use (See Note 12).
Depreciation is calculated by components using the straight-line method.
The useful lives of the items of property, plant and equipment is estimated according to the expected use of the assets. The residual values and useful lives of assets are reviewed and adjusted, if appropriate, annually.
| p) | Leases |
Arauco applies IFRIC 4 to assess whether an arrangement is, or contains, a lease. Leases of assets in which Arauco substantially holds all the risks and rewards of ownership are classified as finance leases. All other leases are classified as operating leases.
Finance leases are initially recognized at the lower of the fair value at the inception of the lease of the leased property and the present value of the minimum lease payments.
When assets are leased under a finance lease, the present value of lease payments are recognized as financial accounts receivable. Finance income, which is the difference between the gross receivable and the present value of such amount, is recognized as the interest rate of return.
Leases in which substantially all risks and rewards are not transferred to the lessee are classified as operating leases. Payments under operating leases (net of any incentives received from the lessor) are recognized as an expense on a straight-line basis over the lease term.
Arauco evaluates the economic nature of the contracts that grant the right to use certain assets, for the purposes of determining the existence of implied leases. In these cases, the Company separates - at the beginning of the contract, and based on relative reasonable values - payments and considerations associated with the lease, from the rest of the elements incorporated to the contract.
25
Table of Contents
CELULOSA ARAUCO Y CONSTITUCION S.A.
AND SUBSIDIARIES
Unaudited Consolidated Financial Statements
December 31, 2017
Amounts in thousands of U.S. dollars, except as indicated
| q) | Biological Assets |
IAS 41 requires that biological assets, such as standing trees, are measured at fair value less cost to sell in the statement of financial position. Forestry plantations are accounted for at fair value less costs to sell, based on the presumption that fair values of these assets can be measured reliably.
The measurement of forestry plantations is based on discounted cash flow models whereby the fair value of the biological assets is determined using estimated future cash flows from continuing operations calculated using our sustainable forest management plans and including the estimated growth of the forests. This valuation is performed on the basis of each identifiable farm block and for each type of tree.
The measurement of new forestry plantations made during the current year is made at cost, which corresponds to the fair value at that date. After twelve months, the valuation methodology used is that explained in the preceding paragraph.
Biological assets shown as current assets correspond to those forestry plantations that will be harvested in the short term.
Biological growth and changes in fair value of forestry plantations are recognized in the line item “Other income” in the consolidated statement of profit or loss.
| r) | Income taxes and deferred taxes. |
The tax liabilities are recognized in the consolidated financial statements based on the determination of taxable income for the year and calculated using the tax rates in force in the countries where Arauco operates.
Deferred income tax is recognized using liability method, on the temporary differences arising between the tax bases of assets and liabilities and their carrying amounts in the consolidated annual accounts. Deferred income tax is determined using tax rates contained in laws adopted as of the date of the financial statements and that are expected to be applicable when the related deferred tax asset is realized or the deferred income tax liability is settled.
The goodwill arising on business combinations does not give rise to deferred tax.
The deferred tax assets and tax credits are generally recognized for all deductible temporary differences to the extent that it is probable that future taxable profit will be available against which those deductible temporary differences can be utilized.
26
Table of Contents
CELULOSA ARAUCO Y CONSTITUCION S.A.
AND SUBSIDIARIES
Unaudited Consolidated Financial Statements
December 31, 2017
Amounts in thousands of U.S. dollars, except as indicated
| s) | Provisions |
Provisions are recognized when the Company has a present obligation, legal or constructive, as a result of past events; it is probable that an outflow of resources will be required to settle the obligation; and a reliable estimate can be made of the amount of the obligation. The amount recognized as a provision is the best estimate of the consideration required to settle the present obligation at the end of the reporting period.
| t) | Revenue recognition |
Revenues are recognized when Arauco has transferred the risks and rewards of ownership to the buyer and Arauco has no right to dispose of the assets, nor effective control of such good.
| (i) | Revenue recognition from the Sale of Goods |
Revenue from the sale of goods is recognized when Arauco has transferred to the buyer the significant risks and rewards of ownership of the goods, when the amount of revenue can be reliably measured, when Arauco does not retain any managerial involvement over the goods sold and when it is probable that the economic benefits associated with the transaction will flow to Arauco and the costs incurred in respect of the transaction can be measured reliably.
Sales are recognized in terms of the price agreed to in the sales contract, less any volume discounts and estimated product returns at the date of the sale. Volume discounts are evaluated in terms of estimated annual purchases. There is no significant financing component given that receivables from sales are collected within a short period, which is in line with market practices.
The structure for recognizing revenue from export sales is based on the 2010 Incoterms, which are the official rules for the interpretation of commercial terms issued by the International Chamber of Commerce.
The main Incoterms used by Arauco are the following:
“CFR (Cost and freight)”, where the company bears all costs including main transportation, until the products arrives at its port of destination. The risk is transferred to the purchaser once the products have been loaded onto the vessel, in the country of origin.
“CIF (Cost Insurance & Freight)”, where the Company organizes and pays for external freight services and some other expenses. Arauco is no longer responsible for the products once they have been delivered to the ocean carrier company. The point of sale is the delivery of the products to the carrier chartered by the seller.
| (ii) | Revenue recognition from Rendering of Services |
When the outcome of a transaction involving the rendering of services can be reliably estimated, revenue is recognized by reference to the stage of completion of the transaction at the date of the reporting period, and when it is probable that the economic benefits associated with the transaction will flow to the Arauco.
27
Table of Contents
CELULOSA ARAUCO Y CONSTITUCION S.A.
AND SUBSIDIARIES
Unaudited Consolidated Financial Statements
December 31, 2017
Amounts in thousands of U.S. dollars, except as indicated
Arauco mainly provides power supply services which are transacted principally in the spot market of the Sistema Interconectado Central (“Central Interconnected System”). According to current regulations, the prices on that market called “Marginal Costs” are calculated by the Centro de Despacho Económico de Carga del Sistema Interconectado Central (CDEC–SIC) (“Economic Load Dispatch Center of the Central Interconnected System”) and are generally recognized in the period in which the services are rendered.
Electrical power is generated as aby-product of the pulp and wood process and is a complementary business to it, which is initially supplied to the group’s subsidiaries and any surplus is sold to theCDEC-SIC.
Arauco provides othernon-core services such as port services and pest control whose revenues are derived from fixed price service contracts, generally recognized during the period of the service contract on a straight-line basis over the term of the contract.
Revenues from reportable segments mentioned in Note 24 are measured in accordance with the policies indicated in the preceding paragraphs.
Revenues from inter-segment sales (which are made at market prices) are eliminated in the consolidated financial statements.
| u) | Minimum dividend |
Article No. 79 of the Chilean Corporations Law states that, unless otherwise unanimously agreed by the shareholders, corporations must distribute annually at least 30% of net income for the current year as cash dividend to shareholders determined in proportion to their shares or in the proportion established in theby-laws for preferred shares, if any, except where necessary to absorb accumulated losses from prior years.
The General Shareholders’ Meeting of Arauco agreed to distribute annual dividends at 40% of net distributable income, including an interim dividend to be distributed at year end. Dividends payable are recognized as a liability in the financial statements in the period when they are declared and approved by the Arauco’s shareholders or when arises the corresponding present obligation based on existing legislation or distribution policies established by the Shareholders’ Meeting.
The dividends payable provision is registered for 40% of the liquid distributable profit and against a lower equity, based on the yearly resolution of the Shareholders’ Meeting.
Dividends payable are presented in the line item “Other currentnon-financial liabilities” in the consolidated statement of financial position.
| v) | Earning per share |
Basic earnings per share are calculated by dividing the net profit for the period attributable to the parent company by the weighted average number of ordinary shares outstanding during the period, excluding the average number of shares in the Company held by a subsidiary, if such circumstance exists. Arauco has not performed any type of transaction with a potential dilutive effect that would cause diluted earnings per share to be different from basic earnings per share.
28
Table of Contents
CELULOSA ARAUCO Y CONSTITUCION S.A.
AND SUBSIDIARIES
Unaudited Consolidated Financial Statements
December 31, 2017
Amounts in thousands of U.S. dollars, except as indicated
| w) | Impairment |
Non-financial Assets
The recoverable amount of property, plant and equipment and other long-term assets with finite useful lives are measured whenever there are any circumstances indicating that the assets have to recognize an impairment loss. Among the circumstances to consider as evidence of impairment are significant declines in the assets’ market value, significant adverse changes in the technological environment, obsolescence or physical damages of assets and changes in the manner in which the asset is used or expected to be used). Arauco evaluates at the end of each reporting period whether there is any evidence of the indications above mentioned.
A previously recognized impairment loss is reversed if there has been a change in the estimates used to determine the recoverable amount however a reversal of an impairment loss shall not exceed the carrying amount that would have been determined (net of amortization or depreciation) had no impairment loss been recognized for the asset in prior years.
For the purposes of assessing impairment losses, assets are grouped at the lowest level for which there is identifiable cash flows separately for each cash-generating unit.Non-financial assets, other than goodwill, which had recognized an impairment loss, are reviewed at the end of each reporting period whether there are any circumstances indicating that an impairment loss previously recognized may no longer exists or has decreased.
“Cash-generating units” are the smallest identifiable groups of those cash inflows that are largely independent of the cash inflow from other assets or groups of assets.
Goodwill
Goodwill and intangible assets with indefinite useful life are tested annually for impairment or whenever circumstances indicate it. The recoverable amount of an intangible asset is the higher of its fair value less costs to sell and its value in use. An impairment loss is recognized whenever the carrying amount exceeds the recoverable amount.
A cash-generating unit, for which goodwill has been allocated, is tested for impairment annually or more frequently when there are circumstances indicating that the unit may be impaired. If the recoverable amount of the cash-generating unit is less than its carrying amount, the impairment loss is allocated first to reduce the carrying amount of any goodwill allocated to the unit and then to other assets pro rata based on the carrying amount of each asset in the unit. Any impairment loss of goodwill is recognized directly in profit or loss. An impairment loss recognized for goodwill is not reversed in subsequent periods.
Goodwill is allocated to cash-generating units for impairment testing purposes. The allocation is made between cash-generating units or groups of cash generating units expected to benefit from the synergies of the combination.
Financial Assets
At the end of each reporting period, an assessment is performed in order to identify whether there is any objective evidence that a financial asset or a group of financial assets may have been impaired. Financial assets are impaired only when there is objective evidence that, as a result of one or more loss events that occurred after the initial recognition of a financial asset, the estimated future cash flows of the financial asset have been affected. Impairment losses are recognized in the consolidated statement of profit or loss.
29
Table of Contents
CELULOSA ARAUCO Y CONSTITUCION S.A.
AND SUBSIDIARIES
Unaudited Consolidated Financial Statements
December 31, 2017
Amounts in thousands of U.S. dollars, except as indicated
An allowance for doubtful accounts is established based on an analysis of the maturity of the portfolio and considering the insurance coverage on accounts receivable. Other conditions are assessed, for example, when there is objective evidence of default or delinquency in payments under the original sale terms and when the customer enters into bankruptcy or financial reorganization, and iswritten-off when Arauco has exhausted all levels of recovery of the receivable in a reasonable time.
The allowance for doubtful accounts is measured as the difference between the carrying amount of receivables and the present value of estimated future cash flows. The carrying amount of the receivable is reduced through the use of the allowance. If the impairment loss decreases in later periods, it is reversedeither directly or by adjusting the provision for doubtful accounts, with effect in profit or loss.
x) Employee Benefits
Arauco constitutes labor obligations for severance payable in all circumstances for certain of its employees with at least 5 years of work in the Company, based on the terms of the staff’s collective and individual bargaining agreements.
The related provision is an estimate of the years of service to be recognized as a future labor obligation liability, in accordance with contracts between Arauco and its employees and pursuant to actuarial valuation criteria for this type of liability. This post-employment benefit is considered a defined benefit plan.
The main factors considered for calculating the actuarial value of severance obligation for years of service are employee turnover, salary increases and life expectancy of the workers included in this benefit.
Actuarial gains and losses are recognized in other comprehensive income in the year they are incurred.
These obligations are related to post-employee benefits in accordance with current standards.
y) Employee Vacations
Arauco recognizes the expense for employee vacation according to labor legislation in each country on an accrual basis.
This obligation is presented in the line item “Trade and Other current payables” and “Trade and Othernon-current payables” depending on their respective maturities in the consolidated statements of financial position.
30
Table of Contents
CELULOSA ARAUCO Y CONSTITUCION S.A.
AND SUBSIDIARIES
Unaudited Consolidated Financial Statements
December 31, 2017
Amounts in thousands of U.S. dollars, except as indicated
z) Recent accounting pronouncements
| a) | Standards, interpretations and amendments that are mandatory for the first time for annual periods beginning on January 1, 2017: |
Amendments and improvements | Content | Mandatory application for annual periods beginning on or after | ||
| IAS 7 | Statements of Cash Flows Introduces additional disclosure that enable users of financial statements to evaluate changes in liabilities arising from financial activities. | January 1, 2017 | ||
| IAS 12 | Income taxes Clarifies the accounting for deferred tax assets relating to debt instruments measured at fair value. | January 1, 2017 | ||
| IFRS 12 | Disclosure of Interests in Other Entities. Clarifies the scope of this rule. | January 1, 2017 | ||
The adoption of the standards, amendments and interpretations described above did not have a significant impact on the Arauco’s Consolidated Financial Statements.
| b) | Standards, interpretations and amendments, the application of which is not yet mandatory, which have not been adopted in advance: |
Standards and interpretations | Content | Mandatory application for annual periods beginning on or after | ||
| IFRS 9 | Financial Instruments Supersedes IAS 39. This final version includes requirements for the classification and measurement of financial assets and liabilities and introduces an ‘expected credit loss’ model for the measurement of the impairment. Hedge accounting part was included in IFRS 9 published at November 2013. | January 1, 2018 | ||
| IFRS 15 | Revenue from Contracts with Customers Provides a single, principles based five-step model to be applied to all contracts with customers. The principles include information related to nature, amount, opportunity and uncerntainty of the revenue and cash flows from contracts with customers. | January 1, 2018 | ||
| IFRS 16 | Leases The standard provides a single lessee accounting model, requiring lessees to recognize assets and liabilities for all leases unless the lease term is 12 months or less or the underlying asset has a low value. | January 1, 2019 | ||
| IFRIC 22 | Transactions in Foreign Currency and Anticipated Considerations Applies to a transaction in foreign currency (or partially in foreign currency) when an entity recognizes anon-financial asset or anon-financial liability arising from the payment or collection of an anticipated consideration, before recognizing the related asset, expense, or income. | January 1, 2018 | ||
| IFRIC 23 | Uncertain tax positions It clarifies the method of applying the acknowledgment and measurement requirements of IAS 12 when there is uncertainty regarding the fiscal treatments. | January 1, 2019 | ||
| IFRS 17 | Inssurance Contracts Supersedes IFRS 4. It changes mainly the accounting for insurance contracts and inverstments contracts. | January 1, 2021 | ||
31
Table of Contents
CELULOSA ARAUCO Y CONSTITUCION S.A.
AND SUBSIDIARIES
Unaudited Consolidated Financial Statements
December 31, 2017
Amounts in thousands of U.S. dollars, except as indicated
Amendments and improvements | Content | Mandatory application for annual periods beginning on or after | ||
| IFRS 1 | First-time Adoption of International Financial Reporting Standards Deletes the short-term exemptions for first time adopters regarding to IFRS 7, IAS 9 and IFRS 10. | January 1, 2018 | ||
| IFRS 2 | Share-based payment Clarifies the measurement of cash settled share-based payment transactions and the accounting for amendments that change such payments to equity instruments. | January 1, 2018 | ||
| IFRS 15 | Revenue from contracts with customers. Introduces clarifications to the guidelines and examples related to the transition towards the new rule. | January 1, 2018 | ||
| IFRS 4 | Insurance contracts Introduces two approaches: overlap and temporary exemption of IFRS 9. | January 1, 2018 | ||
| IAS 40 | Investment properties Clarifies the requirements needed to transfer to, or from, investment properties. | January 1, 2018 | ||
| IFRS 10 y IAS 28- Amendments | Sale or Contribution of assets among an Investor and its Associates or Joint Ventures. | Indeterminate | ||
| IAS 28 | Investments in associates and joint ventures Measurement of the investments in associates and joint ventures at fair value. | January 1, 2018 | ||
| IAS 28 | Investments in associates and joint ventures It clarifies that an entity applies IFRS 9 Financial Instruments to long-term interests in an associate or joint venture that form part of the net investment in the associate or joint venture but to which the equity method is not applied. | January 1, 2019 | ||
| IFRS 9 | Financial instruments Allows assets to be measured at amortised cost. | January 1, 2019 | ||
| IFRS 3 | Business Combinations Clarifies that when an entity obtains control of a business that is a joint operation, it is a business combination achieve by steps. | January 1, 2019 | ||
| IFRS 11 | Joint Arrangements Clarifies that when an entity obtains joint control of a business that is a joint operation, the entity does not remeasure previously held interests in that business. | January 1, 2019 | ||
| IAS 12 | Income taxes Clarifies the income tax consequences of dividends from financial instruments at amortized cost should be recognized according to the past transactions or events that generated distributable profits. | January 1, 2019 | ||
| IAS 23 | Borrowing Costs Clarifies that if any specific borrowing remains outstanding after the related asset is ready for its intended use or sale, that borrowing becomes part of the general borrowings. | January 1, 2019 | ||
32
Table of Contents
CELULOSA ARAUCO Y CONSTITUCION S.A.
AND SUBSIDIARIES
Unaudited Consolidated Financial Statements
December 31, 2017
Amounts in thousands of U.S. dollars, except as indicated
IFRS 9 - Financial Instruments.
IFRS 9 addresses the classification, measurement and derecognition of financial assets and financial liabilities. The standard includes new rules applicable to hedge accounting and a new impairment model for financial assets. The financial assets held by the Group mainly include: Mutual Fund Holdings, (hedge) Derivatives, and highly-liquid financial instruments.
Consequently, Arauco does not expect the new standard to have a significant impact in the classification and measurement of its financial assets.
IFRS 15 – Revenue from Contracts with Customers.
The new standard specifies how and when income will be recognized and increases the disclosures. The standard provides a single five-step model based on principles applicable to all contracts with clients. The standard will be in full force and effect as of January 1, 2018.
Arauco is a pulp and wood supplier in the global markets. Arauco’s contracts with clients can be clearly identified on the basis of purchase orders placed by such clients. Performance obligations are regularly explicitly defined as the products are delivered in accordance with the client’s contracts.
The main contracts with clients do not include additional separate performance obligations that would substantially change the timing of income recognition in accordance to IFRS 15, compared to current income recognition practices.
IFRS 16 - Leases
IFRS 16 was issued in January 2016. The new standard will result in recognizing practically all leases in the balance sheet, because the distinction between operational and financial leases was eliminated. Under the new standard an asset (the right to use the leased property) as well as a financial liability is recognized for lease payments. Short-term andlow-value leases are an exception to this standard. This standard will be in full force and effect as of January 1, 2019.
The group’s main assets are held under financial leases by Arauco and its affiliates, and therefore we do not expect that the new standard will have a significant impact on the financial statements. However, the group has yet to evaluate which other adjustments, if any, would be necessary due to changes in the definition of the term of the lease and the various treatments of variable rent payments and extension and termination options. Therefore, it is not yet possible to estimate the value of the right to use the assets and liabilities under leases that will be recognized upon the implementation of the new standard, or how this could affect the group’s earnings or losses and the classification of future cash flows.
33
Table of Contents
CELULOSA ARAUCO Y CONSTITUCION S.A.
AND SUBSIDIARIES
Unaudited Consolidated Financial Statements
December 31, 2017
Amounts in thousands of U.S. dollars, except as indicated
According to the performed evaluations, the adoption of the other standards, amendments and interpretations described above will not have a significant impact on Arauco’s Consolidated Financial Statements during its initial application period.
NOTE 2. ACCOUTING POLICIES, CHANGES IN ACCOUNTING ESTIMATES
There have been no changes in the treatment of estimates, amendments and accounting policies with respect to same period of last year.
NOTE 3. DISCLOSURE OF OTHER INFORMATION
| a) | Disclosure of information on Issued Capital |
At the date of these consolidated financial statements the share capital of Arauco is ThU.S.$353,618.
100% of Capital corresponds to ordinary shares
| 12-31-2017 | 12-31-2016 | |||
Description of Ordinary Capital Share Types | 100% of Capital corresponds to ordinary shares | |||
Number of Authorized Shares by Type of Capital in Ordinary Shares | 113,159,655 | |||
Nominal Value of Shares by Type of Capital in Ordinary Shares | ThU.S.$0.0031210 per share | |||
Amount of Capital in Shares by Type of Ordinary Shares that Constitute Capital | ThU.S.$353,618 | |||
| 12-31-2017 | 12-31-2016 | |||
Number of Shares Issued and Fully Paid by Type of Capital in Ordinary Shares | 113,159,655 | |||
| b) | Dividends paid |
The interim dividend paid in December 2017 was equivalent to 20% of the distributable net profit calculated as of the end of September 2017 and was considered a decrease in the statements of changes in equity.
The final dividend paid each year corresponds to the difference between the 40% of the prior year distributable net profit and the amount of the interim dividend paid.
The ThU.S.$174,266 (ThU.S.$ 88,578 as of December 31, 2016) presented in the statements of changes in equity correspond to the minimum dividend provision recorded for the period 2017.
In the Statements of Cash Flow in the line item “Dividends Paid” an amount of ThU.S.$121,586 is presented for the year ended December 31, 2017 (ThU.S.$130,624 for the year ended December 31, 2016), of which ThU.S.$119,499 (ThU.S.$ 128,793 for the year ended December 31, 2016) correspond to the payment of dividends of the parent company.
34
Table of Contents
CELULOSA ARAUCO Y CONSTITUCION S.A.
AND SUBSIDIARIES
Unaudited Consolidated Financial Statements
December 31, 2017
Amounts in thousands of U.S. dollars, except as indicated
The following are the dividends paid and per share amounts during the periods 2017 and 2016:
Detail of Dividend Paid, Ordinary Shares | ||
Dividend Paid | Interim Dividend | |
Type of Shares for which there is a Dividend Paid | Ordinary Shares | |
Date of Dividend Paid | 12-20-2017 | |
Amount of Dividend | ThU.S.$60,494 | |
Number of Shares for which Dividends are Paid | 113,159,655 | |
Dividend per Share | U.S.$0.53459 |
Detail of Dividend Paid, Ordinary Shares | ||
Dividend Paid | Final Dividend | |
Type of Shares for which there is a Dividend Paid | Ordinary Shares | |
Date of Dividend Paid | 05-10-2017 | |
Amount of Dividend | ThU.S.$59,005 | |
Number of Shares for which Dividends are Paid | 113,159,655 | |
Dividend per Share | U.S.$0.52143 | |
Detail of Dividend Paid, Ordinary Shares | ||||
Dividend Paid | Interim Dividend | |||
Type of Shares for which there is a Dividend Paid | Ordinary Shares | |||
Date of Dividend Paid | 12-14-2016 | |||
Amount of Dividend | ThU.S.$29,572 | |||
Number of Shares for which Dividends are Paid | 113,159,655 | |||
Dividend per Share | U.S.$0.26133 | |||
Detail of Dividend Paid, Ordinary Shares | ||||
Dividend Paid | Final Dividend | |
Type of Shares for which there is a Dividend Paid | Ordinary Shares | |
Date of Dividend Paid | 05-11-2016 | |
Amount of Dividend | ThU.S.$99,221 | |
Number of Shares for which Dividends are Paid | 113,159,655 | |
Dividend per Share | U.S.$0.87683 | |
35
Table of Contents
CELULOSA ARAUCO Y CONSTITUCION S.A.
AND SUBSIDIARIES
Unaudited Consolidated Financial Statements
December 31, 2017
Amounts in thousands of U.S. dollars, except as indicated
| c) | Disclosure of Information on Reserves |
Other reserves comprise reserves of exchange differences on translation, reserves of cash flow hedges and other reserves. Arauco does not have any restrictions associated with these reserves.
Reserves of exchange differences on translation
Reserves of exchange differences on translation correspond to exchange differences relating to the translation of the results and net assets of Arauco’s subsidiaries whose functional currency is other than Arauco’s presentation currency.
Reserves of cash flow hedges
Reserves of cash flow hedges correspond to the portion of net gain or loss of derivative financial instruments that complies with the requirements of hedge accounting at the end of each period.
Reserve of Actuarial Losses in Defined Benefit Plans
This corresponds to changes in the present value of the obligation for defined benefits resulting from experience adjustments (the effect of the differences between the previous actuarial assumptions and the events that occurred within the context of the plan) and the effects of the changes in the actuarial assumptions.
Other reserves
This mainly corresponds to the share of other comprehensive income of investments in associates and joint ventures.
36
Table of Contents
CELULOSA ARAUCO Y CONSTITUCION S.A.
AND SUBSIDIARIES
Unaudited Consolidated Financial Statements
December 31, 2017
Amounts in thousands of U.S. dollars, except as indicated
| Other | items in the Statements of Profit or Loss |
The table below sets forth other income, other expenses, finance income, finance costs and share of profit (loss) of associates and joint ventures for the years ended December 31, 2017 and 2016 are as follows:
| January - December | ||||||||
| 2017 ThU.S.$ | 2016 ThU.S.$ | |||||||
Classes of Other Income | ||||||||
Other Income, Total | 111,513 | 257,863 | ||||||
Gain from changes in fair value of biological assets (See note 20) | 83,031 | 208,562 | ||||||
Net income from insurance compensation | 1,305 | 3,222 | ||||||
Revenue from export promotion | 3,542 | 2,350 | ||||||
Lease income | 3,061 | 4,687 | ||||||
Gain on sales of assets | 13,444 | 17,485 | ||||||
Gain on business combination achieved in stages | — | — | ||||||
Access easement | 565 | 3,756 | ||||||
Recovery of tax credits | — | 2,033 | ||||||
Other operating results (*) | 6,565 | 15,768 | ||||||
Classes of Other Expenses by activity | ||||||||
Total of Other Expenses by activity | (240,165 | ) | (77,415 | ) | ||||
Depreciation | (1,880 | ) | (562 | ) | ||||
Legal expenses | (3,882 | ) | (5,087 | ) | ||||
Impairment provision for property, plant and equipment and others | (33,240 | ) | (14,979 | ) | ||||
Operating expenses related to plants stoppage | (5,861 | ) | (3,926 | ) | ||||
Expenses related to projects | (2,139 | ) | (1,620 | ) | ||||
Loss of asset sales | (4,691 | ) | (2,283 | ) | ||||
Loss and repair of assets | (3,739 | ) | (1,307 | ) | ||||
Loss of forest due to fires (**) | (138,139 | ) | (15,193 | ) | ||||
Other Taxes | (17,463 | ) | (8,261 | ) | ||||
Research and development expenses | (2,594 | ) | (2,684 | ) | ||||
Fines, readjustments and interests | (3,675 | ) | (1,004 | ) | ||||
Loss on disposal of associates | — | (10,369 | ) | |||||
Others rentals no operational | (1,877 | ) | — | |||||
Other expenses | (20,985 | ) | (10,140 | ) | ||||
Classes of financing income | ||||||||
Financing income, total | 19,640 | 29,701 | ||||||
Financial income from mutual funds - term deposits | 11,023 | 11,439 | ||||||
Financial income resulting from swap - forward instruments | 3,602 | 7,226 | ||||||
Financial income resulting from loans with related companies | — | — | ||||||
Other financial income | 5,015 | 11,036 | ||||||
Classes of financing costs | ||||||||
Financing costs, Total | (287,958 | ) | (258,467 | ) | ||||
Interest expense, Banks loans | (31,014 | ) | (33,224 | ) | ||||
Interest expense, Bonds | (223,602 | ) | (183,203 | ) | ||||
Interest expense, other financial instruments | (15,706 | ) | (17,221 | ) | ||||
Other financial costs | (17,636 | ) | (24,819 | ) | ||||
Share of profit (loss) of associates and joint ventures accounted for using equity method | ||||||||
Total | 17,017 | 23,939 | ||||||
Investments in associates | 4,855 | 16,348 | ||||||
Joint ventures | 12,162 | 7,591 | ||||||
| (*) | ”Other operating results” includes income from interests, extraction of sand and gravel from wharfage and indemnities, among others. |
| (**) | Loss of forest due to fires are presented net of ThU.S.$35,000 from insurance compensation as of December 2017. |
37
Table of Contents
CELULOSA ARAUCO Y CONSTITUCION S.A.
AND SUBSIDIARIES
Unaudited Consolidated Financial Statements
December 31, 2017
Amounts in thousands of U.S. dollars, except as indicated
The analysis of expenses by nature contained in these consolidated financial statements is presented below:
| January - December | ||||||||
Cost of sales | 2017 ThU.S.$ | 2016 ThU.S.$ | ||||||
Timber | 725,114 | 736,399 | ||||||
Forestry labor costs | 631,276 | 600,320 | ||||||
Depreciation and amortization | 389,847 | 377,983 | ||||||
Maintenance costs | 262,764 | 313,500 | ||||||
Chemical costs | 517,478 | 479,335 | ||||||
Sawmill Services | 109,776 | 117,340 | ||||||
Other Raw Materials | 188,874 | 221,950 | ||||||
Other Indirect costs | 178,447 | 143,074 | ||||||
Energy and fuel | 186,041 | 139,527 | ||||||
Cost of electricity | 42,008 | 39,960 | ||||||
Wage and salaries | 342,907 | 329,517 | ||||||
Total | 3,574,532 | 3,498,905 | ||||||
|
|
|
| |||||
| January - December | ||||||||
Distribution cost | 2017 ThU.S.$ | 2016 ThU.S.$ | ||||||
Selling costs | 39,175 | 33,557 | ||||||
Commissions | 14,880 | 13,880 | ||||||
Insurance | 3,620 | 3,216 | ||||||
Provision for doubtful accounts | (245 | ) | 910 | |||||
Other selling costs | 20,920 | 15,551 | ||||||
Shipping and freight costs | 484,125 | 462,916 | ||||||
Port services | 30,996 | 28,028 | ||||||
Freights | 384,523 | 357,442 | ||||||
Other shipping and freight costs | 68,606 | 77,446 | ||||||
Total | 523,300 | 496,473 | ||||||
|
|
|
| |||||
| January - December | ||||||||
Administrative expenses | 2017 ThU.S.$ | 2016 ThU.S.$ | ||||||
Wages and salaries | 218,720 | 198,042 | ||||||
Marketing, advertising, promotion and publications expenses | 10,046 | 9,937 | ||||||
Insurances | 17,122 | 21,526 | ||||||
Depreciation and amortization | 28,210 | 29,285 | ||||||
Computer services | 27,193 | 27,735 | ||||||
Lease rentals (offices, other property and vehicles) | 14,195 | 13,391 | ||||||
Donations, contributions, scholarships | 12,772 | 10,396 | ||||||
Fees (legal and technical advisors) | 43,107 | 43,809 | ||||||
Property taxes, city permits and rights | 17,281 | 15,962 | ||||||
Cleaning services, security services and transportation | 25,153 | 26,975 | ||||||
Third-party variable services (maneuvers, logistics) | 46,097 | 40,277 | ||||||
Basic services | 8,423 | 8,653 | ||||||
Maintenance and repair | 5,579 | 7,617 | ||||||
Seminars, courses, training materials | 2,526 | 3,560 | ||||||
Other administration expenses | 44,870 | 17,304 | ||||||
Total | 521,294 | 474,469 | ||||||
|
|
|
| |||||
38
Table of Contents
CELULOSA ARAUCO Y CONSTITUCION S.A.
AND SUBSIDIARIES
Unaudited Consolidated Financial Statements
December 31, 2017
Amounts in thousands of U.S. dollars, except as indicated
NOTE 4. INVENTORIES
Components of Inventory | 12-31-2017 ThU.S.$ | 12-31-2016 ThU.S.$ | ||||||
Raw materials | 103,049 | 61,252 | ||||||
Production supplies | 98,548 | 102,760 | ||||||
Work in progress | 56,194 | 59,332 | ||||||
Finished goods | 441,726 | 468,544 | ||||||
Spare Parts | 168,945 | 160,724 | ||||||
Total Inventories | 868,462 | 852,612 | ||||||
|
|
|
| |||||
Inventories recognized as cost of sales at December 31, 2017 were ThU.S.$3,511,871 (ThU.S.$3,423,439 at December 31, 2016).
In order to have the inventories recorded at net realizable value at December 31, 2017, a net decrease of inventories was recognized associated with a higher provision of obsolescence of ThU.S.$1,264 (ThU.S.$8,397 at December 31, 2016). As of December 31, 2017, the amount of obsolescence provision is ThU.S.$28,684 (ThU.S.$27,420 at December 31, 2016).
At December 31, 2017, there were inventory write-offs of ThU.S.$1,427 (ThU.S.$1,332 at December 31, 2016)
The inventory obsolescence provision is calculated based on the sales conditions of products and age of inventory (inventory turnover).
As of the date of these consolidated financial statements, there are no inventories pledged as security to report.
Agricultural Products
Agricultural Products are mainly forestry products that are intended for sale in the normal course of our operations and are measured at fair value less costs to sell at the point of harvest at the end of each reporting period Agricultural products are classified as raw materials within the line item inventories.
39
Table of Contents
CELULOSA ARAUCO Y CONSTITUCION S.A.
AND SUBSIDIARIES
Unaudited Consolidated Financial Statements
December 31, 2017
Amounts in thousands of U.S. dollars, except as indicated
NOTE 5. CASH AND CASH EQUIVALENTS
Cash and cash equivalents include cash on hand, bank checking account balances, time deposits and mutual funds. These are short-term highly liquid investments that are readily convertible to known amounts of cash, and are subject to an insignificant risk of changes in value.
Theinvestment objective of time deposits is to maximize the amounts of cash surpluses in the short-term. These instruments are permitted under Arauco’s Investment Policy which allows investing in fixed income securities. These instruments have a maturity of less than three months from the date of acquisition.
Arauco invests in local and international mutual funds in order to maximize the returns of cash surpluses denominated in Chilean Pesos or in foreign currencies such as U.S. Dollars or Euros. These instruments are permitted under Arauco’s Investment Policy.
As of the date of these consolidated financial statements, there are no amounts of cash and cash equivalents with restrictions on use.
Components of Cash and Cash Equivalents | 12-31-2017 ThU.S.$ | 12-31-2016 ThU.S.$ | ||||||
Cash on hand | 148 | 3,156 | ||||||
Bank checking account balances | 209,037 | 146,290 | ||||||
Time deposits | 292,105 | 247,391 | ||||||
Mutual funds | 73,170 | 195,416 | ||||||
Other cash and cash equivalents (*) | 15,426 | — | ||||||
Total | 589,886 | 592,253 | ||||||
|
|
|
| |||||
| (*) | Applies to purchase contracts resale commitments. |
The risk classification of the mutual funds in effect as of December 31, 2017 and December 31, 2016 is shown below.
| December 2017 ThU.S.$ | December 2016 ThU.S.$ | |||||||
AAAfm | 70,808 | 192,895 | ||||||
AAfm | 2,362 | 2,521 | ||||||
Total Mutual Funds | 73,170 | 195,416 | ||||||
|
|
|
| |||||
Changes in Financial Liabilities
| Cash Flow | ||||||||||||||||||||||||||||||||
| Opening balance 12-31-2016 | Borrowings obtained | Borrowings Paid | Interest paid | Accrued interest | Inflation adjustment | Non-cash movements | Closing balance 12-31-2017 | |||||||||||||||||||||||||
Borrowings from banks | 914,358 | 421,309 | (481,205 | ) | (28,141 | ) | 27,894 | (439 | ) | 4,681 | 858,457 | |||||||||||||||||||||
Hedging liabilities | 87,364 | — | — | — | — | — | (81,971 | ) | 5,393 | |||||||||||||||||||||||
Bonds and promissory notes | 3,452,658 | 891,172 | (1,146,506 | ) | (233,045 | ) | 218,326 | 122,324 | (2,244 | ) | 3,302,685 | |||||||||||||||||||||
Total | 4,454,380 | 1,312,481 | (1,627,711 | ) | (261,186 | ) | 246,220 | 121,885 | (79,534 | ) | 4,166,535 | |||||||||||||||||||||
|
|
|
|
|
|
|
|
|
|
|
|
|
|
|
| |||||||||||||||||
| Cash Flow | ||||||||||||||||||||||||||||||||
| Opening balance 12-31-2015 | Borrowings obtained | Borrowings Paid | Interest paid | Accrued interest | Inflation adjustment | Non-cash movements | Closing balance 12-31-2016 | |||||||||||||||||||||||||
Borrowings from banks | 997,542 | 550,226 | (645,211 | ) | (27,692 | ) | 27,471 | 9 | 12,013 | 914,358 | ||||||||||||||||||||||
Hedging liabilities | 227,568 | — | — | — | — | — | (140,204 | ) | 87,364 | |||||||||||||||||||||||
Bonds and promissory notes | 3,180,334 | 187,427 | — | (163,881 | ) | 165,017 | 79,923 | 3,838 | 3,452,658 | |||||||||||||||||||||||
Total | 4,405,444 | 737,653 | (645,211 | ) | (191,573 | ) | 192,488 | 79,932 | (124,353 | ) | 4,454,380 | |||||||||||||||||||||
|
|
|
|
|
|
|
|
|
|
|
|
|
|
|
| |||||||||||||||||
40
Table of Contents
CELULOSA ARAUCO Y CONSTITUCION S.A.
AND SUBSIDIARIES
Unaudited Consolidated Financial Statements
December 31, 2017
Amounts in thousands of U.S. dollars, except as indicated
NOTE 6. INCOME TAXES AND DEFERRED TAXES
The tax rates applicable in the countries in which Arauco operates are 25.5% in Chile, 35% in Argentina, 34% in Brazil, 25% in Uruguay and 35% in the United States (federal tax).
On September 29, 2014, the Official Gazette enacted Law No. 20,780, which introduced various amendments to the current income tax system, as well as to other taxes in Chile. The main amendment was the establishment of an option between two tax regimes: attributed income system and the partially integrated system. One of the effects of the regime selection is that it attaches a progressive increase in the First Category Tax for the fiscal years of 2014, 2015, 2016 and 2017 onwards, increasing to 21%, 22,5%, 24% y 25%, respectively, if the Company chooses the application of an attributed income system, or an increase to 21%, 22.5%, 24%, 25.5% y 27% for the fiscal years 2014, 2015, 2016, 2017, 2018 and thereafter, if the Company chooses the application of the partially integrated system.
Subsequently, on February 28, 2016, the Official Gazette enacted Law No. 20,899, which introduced amendments to Law No. 20,780. Among the main amendments is the incorporation of certain limitations for applying to the attributed income system, and therefore Arauco’s Chilean companies must apply the general rule, that is, the partially integrated system.
On December 22, 2017, a new law was enacted in the United States that amended several articles of the Income Tax Act. The most relevant amendments of this law include the reduction of the income tax rate, from 35% as to 21% by 2018 fiscal year. This amendment generated a benefit of ThU.S.$ 17,600 for Arauco’s subsidiaries in that country as of December 31, 2017, as a result of the reduction of the net deferred liabilities generated by the reduction of the federal income tax rate.
On December 29, 2017, Law No. 27,430 was enacted in the Official Gazette of Argentina, which amended several articles of the Income Tax Act. The most relevant amendments include the reduction of the federal income tax rate from 35%to 30% by 2018 and 2019 fiscal years, and 25% by 2020. This amendment generated a benefit of ThU.S$ 62,677 for Arauco’s subsidiaries in that country as of December 31, 2017, as a result of the reduction of the net deferred liabilities generated by the reduction of the federal income tax rate.
41
Table of Contents
CELULOSA ARAUCO Y CONSTITUCION S.A.
AND SUBSIDIARIES
Unaudited Consolidated Financial Statements
December 31, 2017
Amounts in thousands of U.S. dollars, except as indicated
Deferred Tax Assets
The following table sets forth the deferred tax assets as of the dates indicated:
Deferred Tax Assets | 12-31-2017 ThU.S.$ | 12-31-2016 ThU.S.$ | ||||||
Deferred tax Assets relating to Provisions | 7,433 | 5,771 | ||||||
Deferred tax Assets relating to Accrued Liabilities | 11,267 | 11,716 | ||||||
Deferred tax Assets relating to Post-Employment benefits | 19,276 | 17,618 | ||||||
Deferred tax Assets relating to Property, Plant and equipment | 11,657 | 9,806 | ||||||
Deferred tax Assets relating to Financial Instruments | 4,348 | 12,699 | ||||||
Deferred tax Assets relating to Tax Loss Carryforward | 62,706 | 50,917 | ||||||
Deferred tax Assets relating to Inventories | 5,941 | 7,158 | ||||||
Deferred tax Assets relating to Provisions for Income | 21,354 | 7,069 | ||||||
Deferred tax Assets relating to Allowance for Doubtful Accounts | 5,149 | 4,886 | ||||||
Intangible revaluation differences | 10,389 | 10 | ||||||
Deferred tax Assets relating to Other Deductible Temporary Differences | 27,364 | 22,985 | ||||||
Total Deferred Tax Assets | 186,884 | 157,866 | ||||||
|
|
|
| |||||
Offsetting presentation | (178,618 | ) | (151,769 | ) | ||||
|
|
|
| |||||
Net Effect | 8,266 | 6,097 | ||||||
|
|
|
| |||||
Certain subsidiaries of Arauco mainly in Chile, Brazil and Uruguay, as of the date of these consolidated financial statements, present tax losses for which we estimate that, given the projection of future profits, will allow the recovery of these assets. The total amount of these tax losses is ThU.S.$216,397 (ThU.S.$178,064 at December 31, 2016), which are mainly originated by operational and financial losses.
In addition, as of the closing of these consolidated financial statements there are ThU.S.$167,862 (ThU.S.$176,280 at December 31, 2016) ofnon-recoverable tax losses from companies in Uruguay as joint operations based on the participation of Arauco and subsidiaries in USA, for which deferred tax assets have not been recognized. The estimated recovery period exceeds the expiry date of such tax losses.
Deferred Tax Liabilities
The following table sets forth the deferred tax liabilities as of the dates indicated:
| 12-31-2017 | 12-31-2016 | |||||||
Deferred Tax Liabilities | ThU.S.$ | ThU.S.$ | ||||||
Deferred tax Liabilities relating to Property, Plant and Equipment | 860,498 | 934,892 | ||||||
Deferred tax Liabilities relating to Financial Instruments | 12,684 | 7,186 | ||||||
Deferred tax Liabilities relating to Biological Assets | 676,876 | 719,577 | ||||||
Deferred tax Liabilities relating to Inventory | 32,580 | 31,072 | ||||||
Deferred tax Liabilities relating to Prepaid Expenses | 41,600 | 42,881 | ||||||
Deferred tax Liabilities relating to Intangible | 22,014 | 27,222 | ||||||
Deferred tax Liabilities relating to Other Taxable Temporary Differences | 17,731 | 20,004 | ||||||
Total Deferred Tax Liabilities | 1,663,983 | 1,782,834 | ||||||
|
|
|
| |||||
Offsetting presentation | (178,618 | ) | (151,769 | ) | ||||
|
|
|
| |||||
Net Effect | 1,485,365 | 1,631,065 | ||||||
|
|
|
| |||||
The effect of changes in current and deferred tax liabilities related to financial hedging instruments corresponds to a credit of ThU.S.$1,591 for the year ended December 31, 2017 (compared to a credit of ThU.S.$17,355 for the year ended December 31, 2016), which is presented in net in Reserves for Cash Flow Hedges in the Consolidated Statement of changes in Equity.
42
Table of Contents
CELULOSA ARAUCO Y CONSTITUCION S.A.
AND SUBSIDIARIES
Unaudited Consolidated Financial Statements
December 31, 2017
Amounts in thousands of U.S. dollars, except as indicated
Reconciliation of deferred tax assets and liabilities
| Opening Balance 01-01-2017 | Deferred tax Expenses (Income) | Deferred tax of items charged to other comprehensive income | Increase (decrease) through Business Combination | Increase (decrease) Net exchange differences | Closing balance 12-31-2017 | |||||||||||||||||||
Deferred Tax Assets | ThU.S.$ | ThU.S.$ | ThU.S.$ | ThU.S.$ | ThU.S.$ | ThU.S$ | ||||||||||||||||||
Deferred tax Assets relating to Provisions | 5,771 | 931 | — | 726 | 5 | 7,433 | ||||||||||||||||||
Deferred tax Assets relating to Accrued Liabilities | 11,716 | (405 | ) | — | — | (44 | ) | 11,267 | ||||||||||||||||
Deferred tax Assets relating to Post-Employment benefits | 17,618 | 2,286 | (673 | ) | — | 45 | 19,276 | |||||||||||||||||
Deferred tax Assets relating to Property, Plant and equipment | 9,806 | 1,850 | — | — | 1 | 11,657 | ||||||||||||||||||
Deferred tax Assets relating to Financial Instruments | 12,699 | 1,414 | (9,764 | ) | — | (1 | ) | 4,348 | ||||||||||||||||
Deferred tax Assets relating to Tax Loss Carryforward | 50,917 | 7,271 | — | 6,093 | (1,575 | ) | 62,706 | |||||||||||||||||
Deferred tax Assets relating to Inventories | 7,158 | (1,435 | ) | — | 221 | (3 | ) | 5,941 | ||||||||||||||||
Deferred tax Assets relating to Provisions for Income | 7,069 | (3,697 | ) | — | — | — | 3,372 | |||||||||||||||||
Deferred tax Assets relating to Allowance for Doubtful Accounts | 4,886 | (854 | ) | — | 1,133 | (16 | ) | 5,149 | ||||||||||||||||
Intangible revaluation differences | 10 | (954 | ) | — | 11,333 | — | 10,389 | |||||||||||||||||
Deferred tax Assets relating to Other Deductible Temporary Differences | 30,216 | 6,943 | — | 9,134 | (948 | ) | 45,345 | |||||||||||||||||
Total Deferred Tax Assets | 157,866 | 13,350 | (10,437 | ) | 28,640 | (2,536 | ) | 186,883 | ||||||||||||||||
|
|
|
|
|
|
|
|
|
|
|
| |||||||||||||
| Opening Balance 01-01-2017 | Deferred tax Expenses (Income) | Deferred tax of items charged to other comprehensive income | Increase (decrease) through Business Combination | Increase (decrease) Net exchange differences | Closing balance 12-31-2017 | |||||||||||||||||||
Deferred Tax Liabilities | ThU.S.$ | ThU.S.$ | ThU.S.$ | ThU.S.$ | ThU.S.$ | ThU.S.$ | ||||||||||||||||||
Deferred tax Liabilities relating to Property, Plant and Equipment | 934,892 | (82,445 | ) | — | 9,735 | (1,684 | ) | 860,498 | ||||||||||||||||
Deferred tax Liabilities relating to Financial Instruments | 7,186 | 5,497 | — | — | 1 | 12,684 | ||||||||||||||||||
Deferred tax Liabilities relating to Biological Assets | 719,577 | (79,947 | ) | — | 37,246 | (751 | ) | 676,876 | ||||||||||||||||
Deferred tax Liabilities relating to Inventory | 31,072 | 1,508 | — | — | — | 32,580 | ||||||||||||||||||
Deferred tax Liabilities relating to Prepaid Expenses | 42,881 | (1,281 | ) | — | — | — | 41,600 | |||||||||||||||||
Deferred tax Liabilities relating to Intangible | 27,222 | (4,880 | ) | — | — | (328 | ) | 22,014 | ||||||||||||||||
Deferred tax Liabilities relating to Other Taxable Temporary Differences | 20,004 | (6,730 | ) | — | 4,467 | (10 | ) | 17,731 | ||||||||||||||||
Total Deferred Tax Liabilities | 1,782,834 | (168,278 | ) | — | 52,199 | (2,772 | ) | 1,663,983 | ||||||||||||||||
|
|
|
|
|
|
|
|
|
|
|
| |||||||||||||
| Opening Balance 01-01-2016 | Deferred tax Expenses (Income) | Deferred tax of items charged to other comprehensive income | Increase (decrease) Net exchange differences | Closing balance 12-31-2016 | ||||||||||||||||
Deferred Tax Assets | ThU.S.$ | ThU.S.$ | ThU.S.$ | ThU.S.$ | ThU.S.$ | |||||||||||||||
Deferred tax Assets relating to Provisions | 13,498 | (8,019 | ) | — | 292 | 5,771 | ||||||||||||||
Deferred tax Assets relating to Accrued Liabilities | 8,535 | 3,181 | — | — | 11,716 | |||||||||||||||
Deferred tax Assets relating to Post-Employment benefits | 15,480 | 579 | 1,509 | 50 | 17,618 | |||||||||||||||
Deferred tax Assets relating to Property, Plant and equipment | 7,730 | 2,076 | — | — | 9,806 | |||||||||||||||
Deferred tax Assets relating to Financial Instruments | 21,805 | 1,500 | (10,606 | ) | — | 12,699 | ||||||||||||||
Deferred tax Assets relating to Tax Loss Carryforward | 35,751 | 11,498 | — | 3,668 | 50,917 | |||||||||||||||
Deferred tax Assets relating to Inventories | 4,240 | 2,918 | — | — | 7,158 | |||||||||||||||
Deferred tax Assets relating to Provisions for Income | 3,997 | 3,050 | — | 22 | 7,069 | |||||||||||||||
Deferred tax Assets relating to Allowance for Doubtful Accounts | 4,572 | 261 | — | 53 | 4,886 | |||||||||||||||
Intangible revaluation differences | 56 | (46 | ) | — | — | 10 | ||||||||||||||
Deferred tax Assets relating to Other Deductible Temporary Differences | 24,587 | 3,593 | — | 2,036 | 30,216 | |||||||||||||||
Total Deferred Tax Assets | 140,251 | 20,591 | (9,097 | ) | 6,121 | 157,866 | ||||||||||||||
|
|
|
|
|
|
|
|
|
| |||||||||||
| Opening Balance 01-01-2016 | Deferred tax Expenses (Income) | Deferred tax of items charged to other comprehensive income | Increase (decrease) Net exchange differences | Closing balance 12-31-2016 | ||||||||||||||||
Deferred Tax Liabilities | ThU.S.$ | ThU.S.$ | ThU.S.$ | ThU.S.$ | ThU.S.$ | |||||||||||||||
Deferred tax Liabilities relating to Property, Plant and Equipment | 930,608 | (1,065 | ) | — | 5,349 | 934,892 | ||||||||||||||
Deferred tax Liabilities relating to Financial Instruments | 6,376 | 810 | — | — | 7,186 | |||||||||||||||
Deferred tax Liabilities relating to Biological Assets | 693,103 | 12,642 | — | 13,832 | 719,577 | |||||||||||||||
Deferred tax Liabilities relating to Inventory | 31,912 | (840 | ) | — | — | 31,072 | ||||||||||||||
Deferred tax Liabilities relating to Prepaid Expenses | 40,907 | 2,078 | — | (104 | ) | 42,881 | ||||||||||||||
Deferred tax Liabilities relating to Intangible | 26,419 | (528 | ) | — | 1,331 | 27,222 | ||||||||||||||
Deferred tax Liabilities relating to Other Taxable Temporary Differences | 26,203 | (9,229 | ) | — | 3,030 | 20,004 | ||||||||||||||
Total Deferred Tax Liabilities | 1,755,528 | 3,868 | — | 23,438 | 1,782,834 | |||||||||||||||
|
|
|
|
|
|
|
|
|
| |||||||||||
43
Table of Contents
CELULOSA ARAUCO Y CONSTITUCION S.A.
AND SUBSIDIARIES
Unaudited Consolidated Financial Statements
December 31, 2017
Amounts in thousands of U.S. dollars, except as indicated
Temporary Differences
The following tables summarize the deductible and taxable temporary differences:
| 12-31-2017 | 12-31-2016 | |||||||||||||||
Detail of classes of Deferred Tax Temporary Differences | Deductible Difference ThU.S.$ | Taxable Difference ThU.S.$ | Deductible Difference ThU.S.$ | Taxable Difference ThU.S.$ | ||||||||||||
Deferred Tax Assets | 124,178 | 106,949 | ||||||||||||||
Deferred Tax Assets - Tax loss carryforward | 62,706 | 50,917 | ||||||||||||||
Deferred Tax Liabilities | 1,663,983 | 1,782,834 | ||||||||||||||
Total | 186,884 | 1,663,983 | 157,866 | 1,782,834 | ||||||||||||
|
|
|
|
|
|
|
| |||||||||
| January - December | ||||||||
Detail of Temporary Difference Income and Loss Amounts | 2017 ThU.S.$ | 2016 ThU.S.$ | ||||||
Deferred Tax Assets | 6,079 | 9,093 | ||||||
Deferred Tax Assets - Tax loss carryforward | 7,270 | 11,498 | ||||||
Deferred Tax Liabilities | 168,279 | (3,868 | ) | |||||
Total | 181,628 | 16,723 | ||||||
|
|
|
| |||||
Income Tax Expense
Income tax expense consists of the following:
| January - December | ||||||||
Income Tax composition | 2017 ThU.S.$ | 2016 ThU.S.$ | ||||||
Current income tax expense | (155,292 | ) | (58,831 | ) | ||||
Tax benefit arising from unrecognized tax assets previously used to reduce current tax expense | 3,018 | — | ||||||
Prior period current income tax adjustments | (227 | ) | (6,899 | ) | ||||
Other current benefit tax (expenses) | 1,865 | 3,360 | ||||||
Current Tax Expense, Net | (150,636 | ) | (62,370 | ) | ||||
Deferred tax expense relating to origination and reversal of temporary differences | 174,358 | 5,225 | ||||||
Tax benefit arising from previously unrecognized tax loss carryforward | 7,270 | 11,498 | ||||||
Total deferred Tax Expense, Net | 181,628 | 16,723 | ||||||
Income Tax Expense, Total | 30,992 | (45,647 | ) | |||||
|
|
|
| |||||
44
Table of Contents
CELULOSA ARAUCO Y CONSTITUCION S.A.
AND SUBSIDIARIES
Unaudited Consolidated Financial Statements
December 31, 2017
Amounts in thousands of U.S. dollars, except as indicated
The following table presents the current income tax expense detailed by foreign and domestic (Chile) companies at December 31, 2017 and 2016:
| January - December | ||||||||
| 2017 ThU.S.$ | 2016 ThU.S.$ | |||||||
Foreign current income tax expense | (28,071 | ) | (27,931 | ) | ||||
Domestic current income tax expense | (122,565 | ) | (34,439 | ) | ||||
Total current income tax expense | (150,636 | ) | (62,370 | ) | ||||
Foreign deferred tax expense | 94,228 | 7,794 | ||||||
Domestic deferred tax expense | 87,400 | 8,929 | ||||||
Total deferred tax expense | 181,628 | 16,723 | ||||||
Total tax expense | 30,992 | (45,647 | ) | |||||
|
|
|
| |||||
Reconciliation of income tax expense from statutory tax rate to the effective tax rate.
The reconciliation of income tax expense is as follows:
| January - December | ||||||||
Reconciliation of Income tax from Statutory Rate to Effective Tax Rate | 2017 ThU.S.$ | 2016 ThU.S.$ | ||||||
Statutory domestic (Chile) income tax rate | 25.5 | % | 24.0 | % | ||||
Tax Expense at statutory tax rate | (61,037 | ) | (63,174 | ) | ||||
Tax effect of foreign tax rates | (7,118 | ) | (13,368 | ) | ||||
Tax effect of revenues exempt from taxation | 40,133 | 33,834 | ||||||
Tax effect of not deductible expenses | (37,713 | ) | (10,987 | ) | ||||
Tax rate effect of tax loss carry forwards | (44 | ) | — | |||||
Tax effect of Previously Unrecognized Tax Benefit in the Statements of Profit or Loss | 195 | — | ||||||
Tax effect of a new evaluation of assets for deferred not recognized taxes | 5,311 | 17,157 | ||||||
Tax rate effect from change in tax rate (opening balances) | 78,946 | (3,681 | ) | |||||
Tax rate effect of adjustments for current tax of prior periods | (227 | ) | (6,899 | ) | ||||
Other tax rate effects | 12,546 | 1,471 | ||||||
Total adjustments to tax expense at applicable tax rate | 92,029 | 17,527 | ||||||
Tax expense at effective tax rate | 30,992 | (45,647 | ) | |||||
|
|
|
| |||||
45
Table of Contents
CELULOSA ARAUCO Y CONSTITUCION S.A.
AND SUBSIDIARIES
Unaudited Consolidated Financial Statements
December 31, 2017
Amounts in thousands of U.S. dollars, except as indicated
NOTE 7. PROPERTY, PLANT AND EQUIPMENT
| 12-31-2017 | 12-31-2016 | |||||||
Property, Plant and Equipment, Net | ThU.S.$ | ThU.S.$ | ||||||
Construction work in progress | 597,351 | 321,031 | ||||||
Land | 1,008,310 | 991,450 | ||||||
Buildings | 2,135,201 | 2,169,731 | ||||||
Plant and equipment | 3,112,755 | 3,256,348 | ||||||
Information technology equipment | 22,665 | 24,154 | ||||||
Fixtures and fittings | 12,297 | 9,880 | ||||||
Motor vehicles | 15,959 | 16,858 | ||||||
Other property, plant and equipment | 129,761 | 130,043 | ||||||
Total Net | 7,034,299 | 6,919,495 | ||||||
|
|
|
| |||||
Property, Plant and Equipment, Gross | ||||||||
Construction work in progress | 597,351 | 321,031 | ||||||
Land | 1,008,310 | 991,450 | ||||||
Buildings | 3,926,157 | 3,825,259 | ||||||
Plant and equipment | 6,410,561 | 6,128,494 | ||||||
Information technology equipment | 82,765 | 76,421 | ||||||
Fixtures and fittings | 40,388 | 33,613 | ||||||
Motor vehicles | 49,756 | 48,534 | ||||||
Other property, plant and equipment | 159,720 | 153,838 | ||||||
Total Gross | 12,275,008 | 11,578,640 | ||||||
|
|
|
| |||||
Accumulated depreciation and impairment | ||||||||
Buildings | (1,790,956 | ) | (1,655,528 | ) | ||||
Plant and equipment | (3,297,806 | ) | (2,872,146 | ) | ||||
Information technology equipment | (60,100 | ) | (52,267 | ) | ||||
Fixtures and fittings | (28,091 | ) | (23,733 | ) | ||||
Motor vehicles | (33,797 | ) | (31,676 | ) | ||||
Other property, plant and equipment | (29,959 | ) | (23,795 | ) | ||||
Total | (5,240,709 | ) | (4,659,145 | ) | ||||
|
|
|
| |||||
Description of Property, Plant and Equipment Pledged as Security for Liabilities
As of December 31, 2017, there are no significant assets pledged as collateral to be disclosed in these consolidated financial statements.
46
Table of Contents
CELULOSA ARAUCO Y CONSTITUCION S.A.
AND SUBSIDIARIES
Unaudited Consolidated Financial Statements
December 31, 2017
Amounts in thousands of U.S. dollars, except as indicated
Disbursements commitments for the acquisition of property, plant and equipment and disbursements for property, plant and equipment under construction.
| 12-31-2017 | 12-31-2016 | |||||||
| ThU.S.$ | ThU.S.$ | |||||||
Amount committed for the acquisition of property, plant and equipment | 112,924 | 122,757 | ||||||
47
Table of Contents
CELULOSA ARAUCO Y CONSTITUCION S.A.
AND SUBSIDIARIES
Unaudited Consolidated Financial Statements
December 31, 2017
Amounts in thousands of U.S. dollars, except as indicated
Reconciliation of Property, Plant and Equipment
The following tables set forth the reconciliation of the carrying amount of property, plant and equipment as of December 31, 2017 and December 31, 2016:
Movement of Property, Plant and Equipment | Construction work in progress ThU.S.$ | Land ThU.S.$ | Buildings ThU.S.$ | Plant and equipment ThU.S.$ | IT Equipment ThU.S.$ | Fixtures and fittings ThU.S.$ | Motor vehicles ThU.S.$ | Other Property, Plant and Equipment ThU.S.$ | TOTAL ThU.S.$ | |||||||||||||||||||||||||||
Opening Balance01-01-2017 | 321,031 | 991,450 | 2,169,731 | 3,256,348 | 24,154 | 9,880 | 16,858 | 130,043 | 6,919,495 | |||||||||||||||||||||||||||
Changes | ||||||||||||||||||||||||||||||||||||
Additions | 440,394 | 277 | 12,932 | 65,938 | 787 | 556 | 2,161 | 10,788 | 533,833 | |||||||||||||||||||||||||||
Acquisitions through business combinations | 3,460 | 4,009 | 17,214 | 46,415 | 164 | 986 | 241 | 2,022 | 74,511 | |||||||||||||||||||||||||||
Disposals | — | (1,878 | ) | (48 | ) | (5,492 | ) | (26 | ) | (26 | ) | (292 | ) | (262 | ) | (8,024 | ) | |||||||||||||||||||
Retirements | (1,585 | ) | (75 | ) | (3,809 | ) | (3,900 | ) | (4 | ) | (29 | ) | (127 | ) | (7,211 | ) | (16,740 | ) | ||||||||||||||||||
Depreciation | — | — | (125,692 | ) | (311,819 | ) | (6,080 | ) | (2,268 | ) | (3,546 | ) | (5,421 | ) | (454,826 | ) | ||||||||||||||||||||
Impairment loss recognized in profit or loss | (208 | ) | — | (769 | ) | (8,271 | ) | (5 | ) | (310 | ) | — | (338 | ) | (9,901 | ) | ||||||||||||||||||||
Increase (decrease) through net exchange differences | 290 | (2,728 | ) | 961 | (2,394 | ) | 51 | (31 | ) | 67 | 69 | (3,715 | ) | |||||||||||||||||||||||
Reclassification of assets held for sale | (418 | ) | — | — | 84 | — | — | — | — | (334 | ) | |||||||||||||||||||||||||
Increase (decrease) through transfers from construction in progress | (165,613 | ) | 17,255 | 64,681 | 75,846 | 3,624 | 3,539 | 597 | 71 | — | ||||||||||||||||||||||||||
Total changes | 276,320 | 16,860 | (34,530 | ) | (143,593 | ) | (1,489 | ) | 2,417 | (899 | ) | (282 | ) | 114,804 | ||||||||||||||||||||||
Closing balance12-31-2017 | 597,351 | 1,008,310 | 2,135,201 | 3,112,755 | 22,665 | 12,297 | 15,959 | 129,761 | 7,034,299 | |||||||||||||||||||||||||||
|
|
|
|
|
|
|
|
|
|
|
|
|
|
|
|
|
| |||||||||||||||||||
Movement of Property, Plant and Equipment | Construction work in progress ThU.S.$ | Land ThU.S.$ | Buildings ThU.S.$ | Plant and equipment ThU.S.$ | IT Equipment ThU.S.$ | Fixtures and fittings ThU.S.$ | Motor vehicles ThU.S.$ | Other Property, Plant and Equipment ThU.S.$ | TOTAL ThU.S.$ | |||||||||||||||||||||||||||
Opening Balance01-01-2016 | 251,519 | 951,638 | 2,182,643 | 3,346,675 | 26,210 | 11,860 | 16,721 | 109,130 | 6,896,396 | |||||||||||||||||||||||||||
Changes | ||||||||||||||||||||||||||||||||||||
Additions | 317,159 | 6,350 | 7,966 | 59,997 | 554 | 269 | 1,281 | 25,618 | 419,194 | |||||||||||||||||||||||||||
Disposals | (44 | ) | (1,107 | ) | (443 | ) | (2,382 | ) | (105 | ) | — | (199 | ) | (1,607 | ) | (5,887 | ) | |||||||||||||||||||
Retirements | (1,754 | ) | (295 | ) | (926 | ) | (2,209 | ) | (24 | ) | (8 | ) | (30 | ) | (2,811 | ) | (8,057 | ) | ||||||||||||||||||
Depreciation | — | — | (122,257 | ) | (330,876 | ) | (5,352 | ) | (1,970 | ) | (3,969 | ) | (4,729 | ) | (469,153 | ) | ||||||||||||||||||||
Impairment loss recognized in profit or loss | — | — | 9 | (1,254 | ) | (7 | ) | (1 | ) | — | (1,553 | ) | (2,806 | ) | ||||||||||||||||||||||
Increase (decrease) through net exchange differences | 6,610 | 30,514 | (2,388 | ) | 51,224 | 134 | 116 | 112 | 3,145 | 89,467 | ||||||||||||||||||||||||||
Reclassification of assets held for sale | — | — | — | 341 | — | — | — | — | 341 | |||||||||||||||||||||||||||
Increase (decrease) through transfers from construction in progress | (252,459 | ) | 4,350 | 105,127 | 134,832 | 2,744 | (386 | ) | 2,942 | 2,850 | — | |||||||||||||||||||||||||
Total changes | 69,512 | 39,812 | (12,912 | ) | (90,327 | ) | (2,056 | ) | (1,980 | ) | 137 | 20,913 | 23,099 | |||||||||||||||||||||||
Closing balance12-31-2016 | 321,031 | 991,450 | 2,169,731 | 3,256,348 | 24,154 | 9,880 | 16,858 | 130,043 | 6,919,495 | |||||||||||||||||||||||||||
|
|
|
|
|
|
|
|
|
|
|
|
|
|
|
|
|
| |||||||||||||||||||
48
Table of Contents
CELULOSA ARAUCO Y CONSTITUCION S.A.
AND SUBSIDIARIES
Unaudited Consolidated Financial Statements
December 31, 2017
Amounts in thousands of U.S. dollars, except as indicated
The depreciation expense for the period ending December 31, 2017 and 2016 is as follows:
| January-December | ||||||||
Depreciation for the year | 2017 ThU.S.$ | 2016 ThU.S.$ | ||||||
Cost of sales | 381,725 | 371,170 | ||||||
Administrative expenses | 23,005 | 21,546 | ||||||
Other expenses | 3,494 | 2,119 | ||||||
Total | 408,224 | 394,835 | ||||||
|
|
|
| |||||
The useful lives of property, plant and equipment are estimated based on the expected use of the assets. The average useful lives by asset class are as follow:
| Years of Useful Life (Average) | ||||
Buildings | 58 | |||
Plant and equipment | 30 | |||
Information technology equipment | 8 | |||
Fixtures and fittings | 28 | |||
Motor vehicles | 7 | |||
Other property, plant and equipment | 14 | |||
See Note 12 for details of capitalized borrowing costs.
49
Table of Contents
CELULOSA ARAUCO Y CONSTITUCION S.A.
AND SUBSIDIARIES
Unaudited Consolidated Financial Statements
December 31, 2017
Amounts in thousands of U.S. dollars, except as indicated
NOTE 8. LEASES
Arauco acting as lessee
| 12-31-2017 | 12-31-2016 | |||||||
| ThU.S.$ | ThU.S.$ | |||||||
Property, Plant and Equipment under finance leases | 116,534 | 117,206 | ||||||
Plant and equipment | 116,534 | 117,206 | ||||||
|
|
|
| |||||
Reconciliation of Financial Lease Minimum Payments:
| 12-31-2017 | ||||
Periods | Present Value ThU.S.$ | |||
Less than one year | 44,341 | |||
Between one and five years | 68,035 | |||
More than five years | — | |||
Total | 112,376 | |||
|
| |||
|
| |||
| 12-31-2016 | ||||
Periods | Present Value ThU.S.$ | |||
Less than one year | 40,400 | |||
Between one and five years | 73,586 | |||
More than five years | — | |||
Total | 113,986 | |||
|
| |||
Lease obligations are presented in the consolidated statements of financial position in line items “Other current financial liabilities” and “Othernon-current financial liabilities” depending on their respective maturities as stated above.
50
Table of Contents
CELULOSA ARAUCO Y CONSTITUCION S.A.
AND SUBSIDIARIES
Unaudited Consolidated Financial Statements
December 31, 2017
Amounts in thousands of U.S. dollars, except as indicated
Arauco acting as lessor
Reconciliation of Financial Lease Minimum Payments:
| 12-31-2017 | ||||||||||||
Periods | Gross ThU.S.$ | Interest ThU.S.$ | Present Value ThU.S.$ | |||||||||
Less than one year | 12,001 | 69 | 11,932 | |||||||||
Between one and five years | 1,174 | — | 1,174 | |||||||||
More than five years | — | — | — | |||||||||
Total | 13,175 | 69 | 13,106 | |||||||||
|
|
|
|
|
| |||||||
| 12-31-2016 | ||||||||||||
Periods | Gross ThU.S.$ | Interest ThU.S.$ | Present Value ThU.S.$ | |||||||||
Less than one year | 512 | — | 512 | |||||||||
Between one and five years | 353 | — | 353 | |||||||||
More than five years | — | — | — | |||||||||
Total | 865 | — | 865 | |||||||||
|
|
|
|
|
| |||||||
Finance lease receivables are presented in the consolidated statements of financial position in line items “Trade and other current receivable” and “Trade and othernon-current receivable” depending on their maturities stated above.
Arauco accounts for its lease contracts as finance leases. These lease contracts are for a term of less than five-years at market interest rates and leased assets are forestry machinery and equipment. They also include an early termination option, under general and special conditions stipulated in each contract.
Arauco holds leases as lessee and lessor, described in the previous tables, for which there are no impairment contingent payments or restrictions to report.
NOTE 9. REVENUE
| January - December | ||||||||
Classes of revenue | 2017 ThU.S.$ | 2016 ThU.S.$ | ||||||
Revenue from sales of goods | 5,133,339 | 4,649,581 | ||||||
Revenue from rendering of services | 105,002 | 111,804 | ||||||
Total | 5,238,341 | 4,761,385 | ||||||
|
|
|
| |||||
51
Table of Contents
CELULOSA ARAUCO Y CONSTITUCION S.A.
AND SUBSIDIARIES
Unaudited Consolidated Financial Statements
December 31, 2017
Amounts in thousands of U.S. dollars, except as indicated
NOTE 10. EMPLOYEE BENEFITS
Classes of Benefits and Expenses by Employee
| 2017 | 2016 | |||||||
| ThU.S.$ | ThU.S.$ | |||||||
Employee expenses | 563,117 | 532,957 | ||||||
Wages and salaries | 542,981 | 506,993 | ||||||
Severance indemnities | 20,136 | 25,964 | ||||||
|
|
|
| |||||
| 2017 | 2016 | |||||||
Discount rate | 5.11 | % | 4.52 | % | ||||
Inflation | 2.77 | % | 2.79 | % | ||||
Annual rate of wage growth | 5.22 | % | 5.22 | % | ||||
Mortality rate (1) | RV-2014 | RV-2009 | ||||||
| (1) | For the purposes of determining the technical reserves, Chilean annuity providers are required by law to utilize the mortality tables specified by the SVS (currently Chilean Commission for the Financial Market). The most recent table is theRV-2014, which is based on Chilean pensioner experience from 2006-2013 (SP & SVS, 2013). The mortality tables distinguish between males and females. |
Sensitivities to assumptions | 2017 ThU.S.$ | |||
Discount rate | ||||
Increase in 100 bps | (5,170 | ) | ||
Decrease in 100 bps | 6,018 | |||
Wage growth rates | ||||
Increase in 100 bps | 5,590 | |||
Decrease in 100 bps | (5,212 | ) | ||
The following tables set forth the balances and the reconciliation of the present value of severance indemnities obligations as of December 31, 2017 and December 31, 2016:
| 12-31-2017 | 12-31-2016 | |||||||
| ThU.S.$ | ThU.S.$ | |||||||
Current | 5,730 | 5,244 | ||||||
Non-current | 66,033 | 60,084 | ||||||
Total | 71,763 | 65,328 | ||||||
|
|
|
| |||||
Reconciliation of the present value of severance indemnities obligations | 12-31-2017 ThU.S.$ | 12-31-2016 ThU.S.$ | ||||||
Opening balance | 65,328 | 56,433 | ||||||
Current service cost | 5,583 | 5,334 | ||||||
Interest cost | 3,208 | 2,957 | ||||||
(Gains) losses from changes in actuarial assumptions | (3,711 | ) | 2,083 | |||||
Actuarial gains and losses arising from experience | 1,212 | 3,503 | ||||||
Benefits paid | (5,654 | ) | (7,871 | ) | ||||
Increase (decrease) for foreign currency exchange rates changes | 5,792 | 2,889 | ||||||
Closing balance | 71,763 | 65,328 | ||||||
|
|
|
| |||||
52
Table of Contents
CELULOSA ARAUCO Y CONSTITUCION S.A.
AND SUBSIDIARIES
Unaudited Consolidated Financial Statements
December 31, 2017
Amounts in thousands of U.S. dollars, except as indicated
NOTE 11. BALANCES IN FOREIGN CURRENCY AND FOREIGN CURRENCY EXCHANGE RATE IMPACT IN PROFIT OR LOSS.
| 12-31-2017 | 12-31-2016 | |||||||
| ThU.S.$ | ThU.S.$ | |||||||
Total Current Assets | 2,770,363 | 2,722,360 | ||||||
Cash and Cash Equivalents | 589,886 | 592,253 | ||||||
U.S Dollar | 501,352 | 524,426 | ||||||
Euros | 4,306 | 2,357 | ||||||
Brazilian Real | 47,314 | 47,696 | ||||||
Argentine Pesos | 10,038 | 4,046 | ||||||
Other currencies | 3,685 | 3,327 | ||||||
Chilean Pesos | 23,191 | 10,401 | ||||||
Other current financial assets | 3,504 | 5,201 | ||||||
U.S Dollar | 3,497 | 4,879 | ||||||
Argentine Pesos | — | 315 | ||||||
Other currencies | 7 | 7 | ||||||
Other currentnon-financial assets | 129,837 | 144,915 | ||||||
U.S Dollar | 48,632 | 62,246 | ||||||
Euros | 104 | 71 | ||||||
Brazilian Real | 17,158 | 22,537 | ||||||
Argentine Pesos | 5,832 | 12,261 | ||||||
Other currencies | 5,306 | 3,500 | ||||||
Chilean Pesos | 52,805 | 44,300 | ||||||
Trade and other current receivables | 814,412 | 701,610 | ||||||
U.S Dollar | 550,674 | 489,056 | ||||||
Euros | 20,498 | 26,544 | ||||||
Brazilian Real | 89,673 | 46,150 | ||||||
Argentine Pesos | 26,863 | 15,137 | ||||||
Other currencies | 17,702 | 16,620 | ||||||
Chilean Pesos | 106,442 | 106,681 | ||||||
U.F. | 2,560 | 1,422 | ||||||
Accounts receivable due from related companies | 3,488 | 12,505 | ||||||
U.S Dollar | 726 | 274 | ||||||
Brazilian Real | 171 | 726 | ||||||
Chilean Pesos | 2,192 | 10,548 | ||||||
U.F. | 399 | 957 | ||||||
Current Inventories | 868,462 | 852,612 | ||||||
U.S Dollar | 809,689 | 812,748 | ||||||
Brazilian Real | 58,773 | 39,864 | ||||||
Current biological assets | 307,796 | 306,117 | ||||||
U.S Dollar | 270,761 | 271,551 | ||||||
Brazilian Real | 37,035 | 34,566 | ||||||
Current tax assets | 49,471 | 104,088 | ||||||
U.S Dollar | 7,769 | 6,199 | ||||||
Brazilian Real | 6,721 | 5,798 | ||||||
Argentine Pesos | — | 39 | ||||||
Other currencies | 3,188 | 2,696 | ||||||
Chilean Pesos | 31,793 | 89,356 | ||||||
Non-current assets or disposal groups classified as held for sale | 3,507 | 3,059 | ||||||
U.S Dollar | 2,835 | 3,059 | ||||||
Brazilian Real | 672 | — | ||||||
53
Table of Contents
CELULOSA ARAUCO Y CONSTITUCION S.A.
AND SUBSIDIARIES
Unaudited Consolidated Financial Statements
December 31, 2017
Amounts in thousands of U.S. dollars, except as indicated
| 12-31-2017 | 12-31-2016 | |||||||
| ThU.S.$ | ThU.S.$ | |||||||
TotalNon-Current Assets | 11,224,237 | 11,283,821 | ||||||
Othernon-current financial assets | 56,600 | 8,868 | ||||||
U.S Dollar | 56,600 | 8,868 | ||||||
Othernon-currentnon-financial assets | 121,521 | 130,319 | ||||||
U.S Dollar | 104,711 | 95,658 | ||||||
Brazilian Real | 4,629 | 4,042 | ||||||
Argentine Pesos | 11,303 | 9,900 | ||||||
Other currencies | 693 | 636 | ||||||
Chilean Pesos | 185 | 20,083 | ||||||
Trade and othernon-current receivables | 16,040 | 14,273 | ||||||
U.S Dollar | 4,247 | 6,895 | ||||||
Brazilian Real | 3,345 | — | ||||||
Other currencies | — | 527 | ||||||
Chilean Pesos | 6,692 | 5,753 | ||||||
U.F. | 1,756 | 1,098 | ||||||
Accounts receivable due from related companies,non-current | 1,056 | 957 | ||||||
U.F. | 1,056 | 957 | ||||||
Investments accounted for using equity method | 368,772 | 446,548 | ||||||
U.S Dollar | 130,276 | 124,324 | ||||||
Euros | 185,410 | 156,990 | ||||||
Brazilian Real | 53,080 | 165,203 | ||||||
Chilean Pesos | 6 | 31 | ||||||
Intangible assets other than goodwill | 88,615 | 89,497 | ||||||
U.S Dollar | 87,007 | 88,394 | ||||||
Brazilian Real | 1,516 | 1,026 | ||||||
Chilean Pesos | 92 | 77 | ||||||
Goodwill | 69,922 | 74,893 | ||||||
U.S Dollar | 42,656 | 42,508 | ||||||
Brazilian Real | 27,266 | 32,385 | ||||||
Property, plant and equipment | 7,034,299 | 6,919,495 | ||||||
U.S Dollar | 6,443,081 | 6,394,105 | ||||||
Brazilian Real | 585,202 | 520,448 | ||||||
Chilean Pesos | 6,016 | 4,942 | ||||||
Non-current biological assets | 3,459,146 | 3,592,874 | ||||||
U.S Dollar | 2,934,819 | 3,185,872 | ||||||
Brazilian Real | 524,327 | 407,002 | ||||||
Deferred tax assets | 8,266 | 6,097 | ||||||
U.S Dollar | 4,319 | 4,134 | ||||||
Brazilian Real | 3,622 | 1,697 | ||||||
Other currencies | 32 | 52 | ||||||
Chilean Pesos | 293 | 214 | ||||||
54
Table of Contents
CELULOSA ARAUCO Y CONSTITUCION S.A.
AND SUBSIDIARIES
Unaudited Consolidated Financial Statements
December 31, 2017
Amounts in thousands of U.S. dollars, except as indicated
| 12-31-2017 | 12-31-2016 | |||||||||||||||||||||||
| Up to 90 days ThU.S.$ | From 91 days to 1 year ThU.S.$ | Total ThU.S.$ | Up to 90 days ThU.S.$ | From 91 days to 1 year ThU.S.$ | Total ThU.S.$ | |||||||||||||||||||
Total Liabilities, current | 1,045,364 | 354,030 | 1,399,394 | 806,280 | 539,784 | 1,346,064 | ||||||||||||||||||
Other current financial liabilities | 148,778 | 351,566 | 500,344 | 196,001 | 501,451 | 697,452 | ||||||||||||||||||
U.S Dollar | 134,125 | 284,293 | 418,418 | 178,442 | 455,908 | 634,350 | ||||||||||||||||||
Brazilian Real | 2,383 | 4,660 | 7,043 | 3,558 | 1,282 | 4,840 | ||||||||||||||||||
Argentine Pesos | — | — | — | 11 | 29 | 40 | ||||||||||||||||||
Chilean Pesos | 1,508 | 4,116 | 5,624 | 1,132 | 3,387 | 4,519 | ||||||||||||||||||
U.F. | 10,762 | 58,497 | 69,259 | 12,858 | 40,845 | 53,703 | ||||||||||||||||||
Bank Loans | 110,700 | 282,172 | 392,872 | 134,140 | 61,483 | 195,623 | ||||||||||||||||||
U.S Dollar | 108,317 | 277,512 | 385,829 | 130,571 | 60,172 | 190,743 | ||||||||||||||||||
Brazilian Real | 2,383 | 4,660 | 7,043 | 3,558 | 1,282 | 4,840 | ||||||||||||||||||
Argentine Pesos | — | — | — | 11 | 29 | 40 | ||||||||||||||||||
Financial Leases | 9,928 | 34,413 | 44,341 | 9,534 | 30,866 | 40,400 | ||||||||||||||||||
Chilean Pesos | 1,508 | 4,116 | 5,624 | 1,132 | 3,387 | 4,519 | ||||||||||||||||||
U.F. | 8,420 | 30,297 | 38,717 | 8,402 | 27,479 | 35,881 | ||||||||||||||||||
Other Loans | 28,150 | 34,981 | 63,131 | 52,327 | 409,102 | 461,429 | ||||||||||||||||||
U.S Dollar | 25,808 | 6,781 | 32,589 | 47,871 | 395,736 | 443,607 | ||||||||||||||||||
U.F. | 2,342 | 28,200 | 30,542 | 4,456 | 13,366 | 17,822 | ||||||||||||||||||
Trade and other current payables | 717,342 | 4 | 717,346 | 511,371 | 26,520 | 537,891 | ||||||||||||||||||
U.S Dollar | 193,562 | — | 193,562 | 146,652 | 3,510 | 150,162 | ||||||||||||||||||
Euros | 9,099 | — | 9,099 | 12,006 | 1,028 | 13,034 | ||||||||||||||||||
Brazilian Real | 124,917 | — | 124,917 | 4,849 | 21,982 | 26,831 | ||||||||||||||||||
Argentine Pesos | 29,243 | — | 29,243 | 31,661 | — | 31,661 | ||||||||||||||||||
Other currencies | 4,936 | — | 4,936 | 12,244 | — | 12,244 | ||||||||||||||||||
Chilean Pesos | 333,525 | 4 | 333,529 | 285,359 | — | 285,359 | ||||||||||||||||||
U.F. | 22,060 | — | 22,060 | 18,600 | — | 18,600 | ||||||||||||||||||
Accounts payable to related companies | 11,208 | — | 11,208 | 3,831 | — | 3,831 | ||||||||||||||||||
U.S Dollar | 1,354 | — | 1,354 | 1,969 | — | 1,969 | ||||||||||||||||||
Chilean Pesos | 9,854 | — | 9,854 | 1,862 | — | 1,862 | ||||||||||||||||||
Other current provisions | 2,728 | — | 2,728 | 842 | — | 842 | ||||||||||||||||||
U.S Dollar | 622 | — | 622 | 842 | — | 842 | ||||||||||||||||||
Brazilian Real | 2,106 | — | 2,106 | — | — | — | ||||||||||||||||||
Current tax liabilities | 6,361 | 1,727 | 8,088 | 1,641 | — | 1,641 | ||||||||||||||||||
U.S Dollar | 283 | — | 283 | 448 | — | 448 | ||||||||||||||||||
Euros | 158 | — | 158 | 7 | — | 7 | ||||||||||||||||||
Argentine Pesos | 46 | — | 46 | 133 | — | 133 | ||||||||||||||||||
Other currencies | 479 | — | 479 | 574 | — | 574 | ||||||||||||||||||
Chilean Pesos | 5,395 | 1,727 | 7,122 | 479 | — | 479 | ||||||||||||||||||
Current provisions for employee benefits | 5,595 | 135 | 5,730 | 5,214 | 30 | 5,244 | ||||||||||||||||||
Chilean Pesos | 5,595 | 135 | 5,730 | 5,214 | 30 | 5,244 | ||||||||||||||||||
Other currentnon-financial liabilities | 153,352 | 598 | 153,950 | 87,380 | 11,783 | 99,163 | ||||||||||||||||||
U.S Dollar | 119,309 | 582 | 119,891 | 62,974 | 163 | 63,137 | ||||||||||||||||||
Euros | 77 | — | 77 | 53 | — | 53 | ||||||||||||||||||
Brazilian Real | 18,016 | — | 18,016 | 9,426 | 11,616 | 21,042 | ||||||||||||||||||
Argentine Pesos | 3,215 | — | 3,215 | 3,474 | — | 3,474 | ||||||||||||||||||
Other currencies | 3,906 | — | 3,906 | 3,202 | — | 3,202 | ||||||||||||||||||
Chilean Pesos | 8,809 | 16 | 8,825 | 8,183 | 4 | 8,187 | ||||||||||||||||||
U.F. | 20 | — | 20 | 68 | — | 68 | ||||||||||||||||||
55
Table of Contents
CELULOSA ARAUCO Y CONSTITUCION S.A.
AND SUBSIDIARIES
Unaudited Consolidated Financial Statements
December 31, 2017
Amounts in thousands of U.S. dollars, except as indicated
| 12-31-2017 | 12-31-2016 | |||||||||||||||||||||||
| From 13 months to 5 years ThU.S.$ | More than 5 years ThU.S.$ | Total ThU.S.$ | From 13 months to 5 years ThU.S.$ | More than 5 years ThU.S.$ | Total ThU.S.$ | |||||||||||||||||||
Totalnon-current liabilities | 3,025,553 | 2,452,760 | 5,478,313 | 3,599,291 | 2,061,543 | 5,660,834 | ||||||||||||||||||
Othernon-current financial liabilities | 1,455,641 | 2,322,926 | 3,778,567 | 2,020,484 | 1,850,430 | 3,870,914 | ||||||||||||||||||
U.S Dollar | 970,631 | 1,508,999 | 2,479,630 | 1,591,127 | 1,075,204 | 2,666,331 | ||||||||||||||||||
Brazilian Real | 16,506 | — | 16,506 | 17,098 | 1,042 | 18,140 | ||||||||||||||||||
Chilean Pesos | 9,839 | — | 9,839 | 11,151 | — | 11,151 | ||||||||||||||||||
U.F. | 458,665 | 813,927 | 1,272,592 | 401,108 | 774,184 | 1,175,292 | ||||||||||||||||||
Bank Loans | 327,424 | 138,161 | 465,585 | 626,384 | 92,351 | 718,735 | ||||||||||||||||||
U.S Dollar | 310,918 | 138,161 | 449,079 | 609,286 | 91,309 | 700,595 | ||||||||||||||||||
Brazilian Real | 16,506 | — | 16,506 | 17,098 | 1,042 | 18,140 | ||||||||||||||||||
Financial Leases | 68,035 | — | 68,035 | 73,586 | — | 73,586 | ||||||||||||||||||
Chilean Pesos | 9,839 | — | 9,839 | 11,151 | — | 11,151 | ||||||||||||||||||
U.F. | 58,196 | — | 58,196 | 62,435 | — | 62,435 | ||||||||||||||||||
Other Loans | 1,060,182 | 2,184,765 | 3,244,947 | 1,320,514 | 1,758,079 | 3,078,593 | ||||||||||||||||||
U.S Dollar | 659,713 | 1,370,838 | 2,030,551 | 981,841 | 983,895 | 1,965,736 | ||||||||||||||||||
U.F. | 400,469 | 813,927 | 1,214,396 | 338,673 | 774,184 | 1,112,857 | ||||||||||||||||||
Othernon-current provisions | 36,008 | — | 36,008 | 38,138 | — | 38,138 | ||||||||||||||||||
U.S Dollar | 7 | — | 7 | 1 | — | 1 | ||||||||||||||||||
Brazilian Real | 4,682 | — | 4,682 | 5,425 | — | 5,425 | ||||||||||||||||||
Argentine Pesos | 31,316 | — | 31,316 | 32,712 | — | 32,712 | ||||||||||||||||||
Chilean Pesos | 3 | — | 3 | — | — | — | ||||||||||||||||||
Deferred tax liabilities | 1,355,531 | 129,834 | 1,485,365 | 1,479,596 | 151,469 | 1,631,065 | ||||||||||||||||||
U.S Dollar | 1,247,096 | 129,834 | 1,376,930 | 1,412,506 | 131,406 | 1,543,912 | ||||||||||||||||||
Brazilian Real | 108,435 | — | 108,435 | 67,090 | 20,063 | 87,153 | ||||||||||||||||||
Non-current provisions for employee benefits | 66,033 | — | 66,033 | 60,084 | — | 60,084 | ||||||||||||||||||
Other currencies | 129 | — | 129 | 144 | — | 144 | ||||||||||||||||||
Chilean Pesos | 65,904 | — | 65,904 | 59,940 | — | 59,940 | ||||||||||||||||||
Othernon-currentnon-financial liabilities | 112,340 | — | 112,340 | 989 | 59,644 | 60,633 | ||||||||||||||||||
U.S Dollar | 13 | — | 13 | 430 | — | 430 | ||||||||||||||||||
Brazilian Real | 111,634 | — | 111,634 | — | 59,644 | 59,644 | ||||||||||||||||||
Argentine Pesos | 480 | — | 480 | 349 | — | 349 | ||||||||||||||||||
Chilean Pesos | 213 | — | 213 | 206 | — | 206 | ||||||||||||||||||
U.F. | — | — | — | 4 | — | 4 | ||||||||||||||||||
The table below sets forth the subsidiaries that have determined a functional currency other than the U.S. Dollar as follows:
Subsidiary | Country | Functional Currency | ||
Arauco do Brasil S.A. | Brazil | Brazilian Real | ||
Arauco Forest Brasil S.A. | Brazil | Brazilian Real | ||
Arauco Florestal Arapoti S.A. | Brazil | Brazilian Real | ||
Arauco Industria de Paineis Ltda. | Brazil | Brazilian Real | ||
Empreendimentos Florestais Santa Cruz Ltda. | Brazil | Brazilian Real | ||
Mahal Empreendimentos e Participacoes S.A. | Brazil | Brazilian Real | ||
Investigaciones Forestales Bioforest S.A. | Chile | Chilean Pesos | ||
Consorcio Protección Fitosanitaria Forestal S.A. | Chile | Chilean Pesos | ||
Forestal Nuestra Señora del Carmen S.A. | Argentina | Argentine Pesos | ||
Forestal Talavera S.A. | Argentina | Argentine Pesos | ||
Greeneagro S.A. | Argentina | Argentine Pesos | ||
Leasing Forestal S.A. | Argentina | Argentine Pesos | ||
Savitar S.A. | Argentina | Argentine Pesos | ||
Flakeboard Company Limited | Canada | Canadian Dollar | ||
56
Table of Contents
CELULOSA ARAUCO Y CONSTITUCION S.A.
AND SUBSIDIARIES
Unaudited Consolidated Financial Statements
December 31, 2017
Amounts in thousands of U.S. dollars, except as indicated
The table below shows a detail per company of the effect in the period of the Reserve of Exchange Differences on translation:
| January - December | ||||||||
| 2017 | 2016 | |||||||
| ThU.S.$ | ThU.S.$ | |||||||
Arauco do Brasil S.A. | (6,537 | ) | 73,087 | |||||
Arauco Forest Brasil S.A. | (6,929 | ) | 68,314 | |||||
Arauco Florestal Arapoti S.A. | (1,051 | ) | 19,523 | |||||
Sonae Arauco S.A. | 20,547 | — | ||||||
Arauco Argentina S.A. | (752 | ) | 4,989 | |||||
Flakeboard Company Limited | 6,529 | 2,984 | ||||||
Others | 307 | (13 | ) | |||||
|
|
|
| |||||
Total reserve of exchange differences on translation | 12,114 | 168,884 | ||||||
|
|
|
| |||||
Effect of foreign exchange rates changes
| January-December | ||||||||
| 2017 | 2016 | |||||||
| ThU.S.$ | ThU.S.$ | |||||||
Exchange differences recognized in profit or loss, except for those arising on financial instruments measured at fair value through profit or loss | 98 | (3,935 | ) | |||||
Reserve of exchange differences on translation (withNon-controlling interests) | 11,873 | 173,754 | ||||||
|
|
|
| |||||
57
Table of Contents
CELULOSA ARAUCO Y CONSTITUCION S.A.
AND SUBSIDIARIES
Unaudited Consolidated Financial Statements
December 31, 2017
Amounts in thousands of U.S. dollars, except as indicated
NOTE 12. BORROWING COSTS
Arauco estimates the average rate of borrowings to finance its current investments projects. The average rate loans to finance these investments projects were claculated to record the capitalization.
| January - December | ||||||||
| 2017 | 2016 | |||||||
| ThU.S.$ | ThU.S.$ | |||||||
Property, plant and equipment capitalized cost | ||||||||
Property, plant and equipment capitalized interest cost rate | 4.91 | % | 5.11 | % | ||||
Amount of the capitalized interest cost, property, plant and equipment | 5,603 | 2,177 | ||||||
NOTE 13. RELATED PARTIES
Related Party Disclosures
Related parties are those entities defined in IAS 24 and under the rules of the Superintendency of Securities and Insurance (current Chilean Commission for the Financial Market) and the Chilean Corporations Law.
The receivable and payable amounts among related parties at the end of each period correspond to commercial and financing transactions denominated in Chilean Pesos, U.S. dollars and Brazilian Real, where collection or payment deadlines are shown in the following tables and in general do not bear interest, except for financing transactions.
As of the date of these consolidated financial statements, the main transactions with related parties are related to fuel purchases with Compañía de Petróleos de Chile S.A. and sodium chlorate purchases at EKA Chile S.A.
As of the date of these consolidated financial statements, there are neither provisions for doubtful accounts nor any guarantees granted or received related to the balances with related parties.
Name of Group’s Main Shareholders
The ultimate shareholders of Arauco, direct and indirectly, are Mrs. Maria Noseda Zambra de Angelini, Mr. Roberto Angelini Rossi and Mrs. Patricia Angelini Rossi.
Name of the Intermediate Controlling Entity that Produces Consolidated Financial Statements for Public Use
Empresas Copec S.A.
58
Table of Contents
CELULOSA ARAUCO Y CONSTITUCION S.A.
AND SUBSIDIARIES
Unaudited Consolidated Financial Statements
December 31, 2017
Amounts in thousands of U.S. dollars, except as indicated
Compensation to Key Management Personnel
Compensation to key management personnel, including directors, managers and deputy managers, consist of a fixed monthly salary, and managers and deputy managers, also receive an annual bonus subject to the results of the Company and the fulfillment of goals of the business as well as individual performance.
Pricing Strategy Terms and Conditions Corresponding to Transactions with Related Parties
Related party transactions are equitable in relation to other transactions regularly performed at market conditions, with mutual independence of the parties.
The table below sets forth information about the Relationship between the Parent Company and its Subsidiaries
| Functional | % Ownership interest 12-31-2017 | % Ownership interest 12-31-2016 | ||||||||||||||||||||||||||||
| ID N° | Company Name | Country | Currency | Direct | Indirect | Total | Direct | Indirect | Total | |||||||||||||||||||||
| - | Agenciamiento y Servicios Profesionales S.A. | Mexico | U.S. Dollar | 0.0020 | 99.9970 | 99.9990 | 0.0020 | 99.9970 | 99.9990 | |||||||||||||||||||||
| - | Arauco Argentina S.A. | Argentina | U.S. Dollar | 9.9753 | 90.0048 | 99.9801 | 9.9753 | 90.0048 | 99.9801 | |||||||||||||||||||||
| - | Arauco Australia Pty Ltd. | Australia | U.S. Dollar | — | 99.9990 | 99.9990 | — | 99.9990 | 99.9990 | |||||||||||||||||||||
| 96547510-9 | Arauco Bioenergía S.A. | Chile | U.S. Dollar | 98.0000 | 1.9999 | 99.9999 | 98.0000 | 1.9999 | 99.9999 | |||||||||||||||||||||
| - | Arauco Colombia S.A. | Colombia | U.S. Dollar | 1.4778 | 98.5204 | 99.9982 | 1.4778 | 98.5204 | 99.9982 | |||||||||||||||||||||
| - | Arauco do Brasil S.A. | Brazil | Brazilian Real | 1.1624 | 98.8366 | 99.9990 | 1.1624 | 98.8366 | 99.9990 | |||||||||||||||||||||
| - | Arauco Europe Cooperatief U.A. | Netherlands | U.S. Dollar | 0.5689 | 99.4301 | 99.9990 | 0.4614 | 99.5376 | 99.9990 | |||||||||||||||||||||
| - | Arauco Florestal Arapoti S.A. | Brazil | Brazilian Real | — | 79.9992 | 79.9992 | — | 79.9992 | 79.9992 | |||||||||||||||||||||
| - | Arauco Forest Brasil S.A. | Brazil | Brazilian Real | 9.9971 | 90.0021 | 99.9992 | 10.1297 | 89.8694 | 99.9991 | |||||||||||||||||||||
| - | Arauco Industria de Paineis Ltda. | Brazil | Brazilian Real | — | 99.9990 | 99.9990 | — | — | — | |||||||||||||||||||||
| - | Arauco Middle East DMCC | Dubai | U.S. Dollar | — | 99.9990 | 99.9990 | — | 99.9990 | 99.9990 | |||||||||||||||||||||
| 76620842-8 | Arauco Nutrientes Naturales SPA | Chile | U.S. Dollar | — | 99.9484 | 99.9484 | — | 99.9484 | 99.9484 | |||||||||||||||||||||
| - | Arauco Panels USA, LLC | USA | U.S. Dollar | — | 99.9990 | 99.9990 | — | 99.9990 | 99.9990 | |||||||||||||||||||||
| - | Arauco Perú S.A. | Peru | U.S. Dollar | 0.0013 | 99.9977 | 99.9990 | 0.0013 | 99.9977 | 99.9990 | |||||||||||||||||||||
| - | Arauco Wood Products, Inc. | USA | U.S. Dollar | 0.0004 | 99.9986 | 99.9990 | 0.0004 | 99.9986 | 99.9990 | |||||||||||||||||||||
| - | Araucomex S.A. de C.V. | Mexico | U.S. Dollar | 0.0005 | 99.9985 | 99.9990 | 0.0005 | 99.9985 | 99.9990 | |||||||||||||||||||||
| 96657900-5 | Consorcio Protección Fitosanitaria Forestal S.A. | Chile | Chilean Pesos | — | 57.5223 | 57.5223 | — | 57.5404 | 57.5404 | |||||||||||||||||||||
| - | Empreendimentos Florestais Santa Cruz Ltda. | Brazil | Brazilian Real | — | 99.9795 | 99.9795 | — | 99.9789 | 99.9789 | |||||||||||||||||||||
| - | Flakeboard America Limited | USA | U.S. Dollar | — | 99.9990 | 99.9990 | — | 99.9990 | 99.9990 | |||||||||||||||||||||
| - | Flakeboard Company Ltd. | Canada | Canadian Dollar | — | 99.9990 | 99.9990 | — | 99.9990 | 99.9990 | |||||||||||||||||||||
| 85805200-9 | Forestal Arauco S.A. | Chile | U.S. Dollar | 99.9484 | — | 99.9484 | 99.9484 | — | 99.9484 | |||||||||||||||||||||
| 93838000-7 | Forestal Cholguán S.A. | Chile | U.S. Dollar | — | 98.4826 | 98.4826 | — | 98.4744 | 98.4744 | |||||||||||||||||||||
| - | Forestal Concepción S.A. | Panama | U.S. Dollar | — | — | — | 0.0050 | 99.9940 | 99.9990 | |||||||||||||||||||||
| 78049140-K | Forestal Los Lagos S.A. | Chile | U.S. Dollar | — | 79.9587 | 79.9587 | — | 79.9587 | 79.9587 | |||||||||||||||||||||
| - | Forestal Nuestra Señora del Carmen S.A. | Argentina | Argentine pesos | — | 99.9805 | 99.9805 | — | 99.9805 | 99.9805 | |||||||||||||||||||||
| - | Forestal Talavera S.A. | Argentina | Argentine pesos | — | 99.9942 | 99.9942 | — | 99.9942 | 99.9942 | |||||||||||||||||||||
| - | Greenagro S.A. | Argentina | Argentine pesos | — | 97.9805 | 97.9805 | — | 97.9805 | 97.9805 | |||||||||||||||||||||
| 96563550-5 | Inversiones Arauco Internacional Ltda. | Chile | U.S. Dollar | 98.0186 | 1.9804 | 99.9990 | 98.0186 | 1.9804 | 99.9990 | |||||||||||||||||||||
| 79990550-7 | Investigaciones Forestales Bioforest S.A. | Chile | Chilean Pesos | 1.0000 | 98.9489 | 99.9489 | 1.0000 | 98.9489 | 99.9489 | |||||||||||||||||||||
| - | Leasing Forestal S.A. | Argentina | Argentine pesos | — | 99.9801 | 99.9801 | — | 99.9801 | 99.9801 | |||||||||||||||||||||
| 96510970-6 | Maderas Arauco S.A. (ex Paneles Arauco S.A.) | Chile | U.S. Dollar | 99.0000 | 0.9995 | 99.9995 | 99.0000 | 0.9995 | 99.9995 | |||||||||||||||||||||
| - | Mahal Empreendimentos e Participacoes S.A. | Brazil | Brazilian Real | — | 99.9961 | 99.9961 | — | 99.9934 | 99.9934 | |||||||||||||||||||||
| - | Novo Oeste Gestao de Ativos Florestais S.A. | Brazil | Brazilian Real | — | 99.9991 | 99.9991 | — | 99.9990 | 99.9990 | |||||||||||||||||||||
| - | Savitar S.A. | Argentina | Argentine pesos | — | 99.9841 | 99.9841 | — | 99.9841 | 99.9841 | |||||||||||||||||||||
| 76375371-9 | Servicios Aéreos Forestales Ltda. | Chile | U.S. Dollar | 0.0100 | 99.9890 | 99.9990 | 0.0100 | 99.9890 | 99.9990 | |||||||||||||||||||||
| 96637330-K | Servicios Logísticos Arauco S.A. | Chile | U.S. Dollar | 45.0000 | 54.9997 | 99.9997 | 45.0000 | 54.9997 | 99.9997 | |||||||||||||||||||||
59
Table of Contents
CELULOSA ARAUCO Y CONSTITUCION S.A.
AND SUBSIDIARIES
Unaudited Consolidated Financial Statements
December 31, 2017
Amounts in thousands of U.S. dollars, except as indicated
The companies in the table below are classified as joint operations in accordance with IFRS 11. The assets, liabilities, income and expenses are recorded in relation to the Company’s ownership percentage in accordance with accounting standards applicable in each case.
Company Name | Country | Functional Currency | ||
Eufores S.A. | Uruguay | U.S. Dollar | ||
Celulosa y Energía Punta Pereira S.A. | Uruguay | U.S. Dollar | ||
Zona Franca Punta Pereira S.A. | Uruguay | U.S. Dollar | ||
Forestal Cono Sur S.A. | Uruguay | U.S. Dollar | ||
Stora Enso Uruguay S.A. | Uruguay | U.S. Dollar | ||
El Esparragal Asociación Agraria de R.L. | Uruguay | U.S. Dollar | ||
Ongar S.A. | Uruguay | U.S. Dollar | ||
Terminal Logística e Industrial M’Bopicua S.A. | Uruguay | U.S. Dollar |
There are no significant restrictions on the ability of subsidiaries to transfer funds to Arauco, in the form of cash dividends or repayment of loans and/or advances.
Employee Benefits for Key Management Personnel
| January - December | ||||||||
| 2017 ThU.S.$ | 2016 ThU.S.$ | |||||||
Salaries and bonuses | 59,501 | 73,398 | ||||||
Per diem compensation to members of the Board of Directors | 2,566 | 1,783 | ||||||
Termination benefits | 4,936 | 6,174 | ||||||
Total | 67,003 | 81,355 | ||||||
|
|
|
| |||||
Related Party Receivables, Current
Name of Related Party | Tax ID No. | Nature of Relationship | Country | Currency | Maturity | 12-31-2017 ThU.S.$ | 12-31-2016 ThU.S.$ | |||||||||||
Forestal Mininco S.A. | 91.440.000-7 | Common Stockholder | Chile | Chilean pesos | 30 days | 25 | 39 | |||||||||||
Eka Chile S.A. | 99.500.140-3 | Joint Venture | Chile | Chilean pesos | 30 days | 2,027 | 1,701 | |||||||||||
Forestal del Sur S.A. | 79.825.060-4 | Common director | Chile | Chilean pesos | 30 days | 4 | 7,618 | |||||||||||
Unilin Arauco Pisos Ltda. | — | Joint Venture | Brazil | Brazilian Real | 30 days | 171 | 726 | |||||||||||
Colbún S.A. | 96.505.760-9 | Common director | Chile | Chilean pesos | 30 days | 136 | — | |||||||||||
CMPC Celulosa S.A. | 96.532.330-9 | Common Stockholder | Chile | Chilean pesos | — | — | 2 | |||||||||||
Fundación Educacional Arauco | 71.625.000-8 | Common director | Chile | Chilean pesos | — | — | 1,188 | |||||||||||
Fundación Acerca Redes | 65.097.218-K | Parent company is founder and contributor | Chile | U.S. Dollar | 30 days | 726 | 274 | |||||||||||
Compañía Puerto de Coronel S.A. | 79.895.330-3 | Subsidiary of an Associate | Chile | U.F. | 30 days | 399 | 957 | |||||||||||
TOTAL | 3,488 | 12,505 | ||||||||||||||||
Related Party Receivables,Non-Current
Name of Related Party | Tax ID No. | Nature of Relationship | Country | Currency | Maturity | 12-31-2017 ThU.S.$ | 12-31-2016 ThU.S.$ | |||||||||||
Compañía Puerto de Coronel S.A. | 79.895.330-3 | Subsidiary of an Associate | Chile | U.F. | Sep-18 | 528 | 478 | |||||||||||
Compañía Puerto de Coronel S.A. | 79.895.330-3 | Subsidiary of an Associate | Chile | U.F. | Sep-19 | 528 | 478 | |||||||||||
TOTAL | 1,056 | 957 | ||||||||||||||||
|
|
|
| |||||||||||||||
60
Table of Contents
CELULOSA ARAUCO Y CONSTITUCION S.A.
AND SUBSIDIARIES
Unaudited Consolidated Financial Statements
December 31, 2017
Amounts in thousands of U.S. dollars, except as indicated
Related Party Payables, Current
Name of Related party | Tax ID No. | Nature of Relationship | Country | Currency | Maturity | 12-31-2017 ThU.S.$ | 12-31-2016 ThU.S.$ | |||||||||||||||
Compañía de Petróleos de Chile S.A. | 99.520.000-7 | | Common controlling parent | | Chile | Chilean pesos | 30 days | 8,837 | 1,758 | |||||||||||||
Abastible S.A. | 91.806.000-6 | | Controlling Parent’s Subsidiary | | Chile | Chilean pesos | 30 days | 545 | 97 | |||||||||||||
Fundación Educacional Arauco | 71.625.000-8 | Common director | Chile | Chilean pesos | 30 days | 54 | — | |||||||||||||||
Red to Green S.A.(Ex-Sigma Servicios Informáticos S.A.) | 86.370.800-1 | Common director | Chile | Chilean pesos | 30 days | 1 | — | |||||||||||||||
Portaluppi, Guzman y Bezanilla Abogados | 78.096.080-9 | Common director | Chile | Chilean pesos | 30 days | 146 | — | |||||||||||||||
Empresa Nacional de Telecomunicaciones S.A. | 92.580.000-7 | Common Stockholder | Chile | Chilean pesos | 30 days | 137 | — | |||||||||||||||
Servicios Corporativos Sercor S.A. | 96.925.430-1 | | Subsidiary of the Associate | | Chile | Chilean pesos | 30 days | 29 | — | |||||||||||||
Puerto Lirquén S.A. | 96.959.030-1 | | Subsidiary of the Associate | | Chile | U.S. Dollar | 30 days | 1,354 | 1,246 | |||||||||||||
Compañía Puerto de Coronel S.A. | 79.895.330-3 | | Subsidiary of the Associate | | Chile | U.S. Dollar | — | — | 723 | |||||||||||||
Adm.Estaciones de Servicio Serco Ltda. | 79.689.550-0 | | Common controlling parent | | Chile | Chilean pesos | 30 days | 1 | — | |||||||||||||
Adm. de Ventas al Detalle Arco Prime Ltda. | 77.215.640-5 | | Common controlling parent | | Chile | Chilean pesos | 30 days | 14 | 5 | |||||||||||||
Empresa Distrib. Papeles y Cartones S.A. | 88.566.900-k | Common Stockholder | Chile | Chilean pesos | — | — | 2 | |||||||||||||||
Elemental S.A. | 76.659.730-0 | | Indirect associate of controlling parent | | Chile | Chilean pesos | 30 days | 4 | — | |||||||||||||
Woodtech S.A. | 76.724.000-7 | | Indirect associate of controlling parent | | Chile | Chilean pesos | 30 days | 86 | — | |||||||||||||
TOTAL | 11,208 | 3,831 | ||||||||||||||||||||
61
Table of Contents
CELULOSA ARAUCO Y CONSTITUCION S.A.
AND SUBSIDIARIES
Unaudited Consolidated Financial Statements
December 31, 2017
Amounts in thousands of U.S. dollars, except as indicated
Related Party Transactions
Purchases
Name of Related Party | Tax ID No. | Nature of Relationship | Country | Currency | Transaction Descriptions | 12-31-2017 ThU.S.$ | 12-31-2016 ThU.S.$ | |||||||||||
Abastible S.A. | 91.806.000-6 | Common controlling parent | Chile | Chilean pesos | Fuel | 3,115 | 2,199 | |||||||||||
Empresas Copec S.A. | 90.690.000-9 | Controlling Parent | Chile | Chilean pesos | Management service | 106 | 356 | |||||||||||
Compañía de Petróleos de Chile S.A. | 99.520.000-7 | Common controlling parent | Chile | Chilean pesos | Fuel and other | 66,789 | 39,732 | |||||||||||
Compañía Puerto de Coronel S.A. | 79.895.330-3 | Subsidiary of the Associate | Chile | U.S. Dollar | Transport and stowage | 9,986 | 8,633 | |||||||||||
Puerto Lirquén S.A. | 96.959.030-1 | Subsidiary of the Associate | Chile | U.S. Dollar | Port services | 6,956 | 7,311 | |||||||||||
EKA Chile S.A. | 99.500.140-3 | Joint Venture | Chile | Chilean pesos | Sodium chlorate | 44,055 | 47,236 | |||||||||||
Forestal del Sur S.A. | 79.825.060-4 | Common director | Chile | Chilean pesos | Wood and ships | 1,310 | 2,093 | |||||||||||
Portaluppi, Guzman y Bezanilla Abogados | 78.096.080-9 | Common director | Chile | Chilean pesos | Legal services | 1,496 | 1,295 | |||||||||||
Empresa Nacional de Telecomunicaciones S.A. | 92.580.000-7 | Common Stockholder | Chile | Chilean pesos | Telephone services | 460 | 512 | |||||||||||
CMPC Maderas S.A. | 95.304.000-K | Common Stockholder | Chile | Chilean pesos | Wood and logs | 330 | 511 | |||||||||||
Red to Green S.A.(Ex-Sigma Servicios Informáticos S.A.) | 86.370.800-1 | Common director | Chile | Chilean pesos | Computer Services | 130 | 249 | |||||||||||
Colbún Transmisión S.A. | 76.218.856-2 | Common director | Chile | Chilean pesos | Electrical Power | 389 | 383 | |||||||||||
Woodtech S.A. | 76.724.000-7 | Indirect associate of controlling parent | Chile | Chilean pesos | Wood volumen measurement services | 2,239 | 982 | |||||||||||
Inversiones Siemel S.A. | 94.082.000-6 | Common Stockholder | �� | Chile | Chilean pesos | Rentals | 596 | 777 | ||||||||||
CMPC Celulosa S.A. | 96.532.330-9 | Common Stockholder | Chile | Chilean pesos | Others purchases | 965 | 3 | |||||||||||
Sales
Name of Related Party | Tax ID No. | Nature of Relationship | Country | Currency | Transaction Descriptions | 12-31-2017 ThU.S.$ | 12-31-2016 ThU.S.$ | |||||||||||
Compañía de Petróleos de Chile S.A. | 99.520.000-7 | Common controlling parent | Chile | Chilean pesos | Charter Services | 202 | — | |||||||||||
Colbún S.A. | 96.505.760-9 | Common director | Chile | Chilean pesos | Electrical Power | 1,128 | 5,999 | |||||||||||
EKA Chile S.A. | 99.500.140-3 | Joint venture | Chile | Chilean pesos | Electrical Power | 19,182 | 16,326 | |||||||||||
Stora Enso Arapoti Industria de Papel S.A. | — | Subsidiary of the Associate | Brazil | Brazilian Real | Wood | — | 1,149 | |||||||||||
Forestal del Sur S.A. | 79.825.060-4 | Common director | Chile | Chilean pesos | Harvesting services, Wood and chips | 25,322 | 21,657 | |||||||||||
Compañía Puerto de Coronel S.A. | 79.895.330-3 | Subsidiary of the Associate | Chile | U.F. | Sale Land | — | 1,914 | |||||||||||
Unilin Arauco Pisos Ltda. | — | Joint venture | Brazil | Brazilian Real | Wood | 2,966 | 5,263 | |||||||||||
62
Table of Contents
CELULOSA ARAUCO Y CONSTITUCION S.A.
AND SUBSIDIARIES
Unaudited Consolidated Financial Statements
December 31, 2017
Amounts in thousands of U.S. dollars, except as indicated
NOTE 14. CONSOLIDATED FINANCIAL STATEMENTS
On December 6, 2017, the subsidiary Arauco do Brasil S.A. acquired all the equity rights of Masisa do Brasil Ltda. (currently Arauco Industria de Paineis Ltda.) for a value of ThU.S.$ 32,698. During December 2017, Arauco paid ThU.S.$ 15,918. Later, in February 2018, the remaining balance of ThU.S$ 16,780 was paid. The main assets acquired consist of 2 industrial complexes that would give Arauco an installed capacity of approximately 10 million m3.
Arauco recognized the acquisition of Arauco Industria de Paineis Ltda. over the basis of the information available at the date of the transaction, performing a preliminary calculation of the allocation of fair values in the acquisition of this Company. The recorded assets and liabilities are considered provisional amounts and may be adjusted during the measurement period of this acquisition, in order to reflect new information obtained regarding facts and circumstances existing as of the date of acquisition which, had they been known, would have affected the measurements of the amounts recorded by that date. The measurement period will not exceed the term of one year, from the acquisition date.
The table below shows the fair values of assets and liabilities at the date of transaction:
ARAUCO INDUSTRIA DE PAINEIS LTDA. | 12-06-2017 ThU.S.$ | |||
Cash and cash equivalent | 4,345 | |||
Trade and other current receivables | 49,715 | |||
Inventories | 23,331 | |||
Property, plant and equipment | 68,321 | |||
Other assets | 27,012 | |||
Total assets | 172,724 | |||
Other financial liabilities, current andnon-current | 43,218 | |||
Trade and other payables | 26,437 | |||
Other liabilities | 70,371 | |||
Total liabilities | 140,026 | |||
|
| |||
The following table shows revenue and net profit recognized at the acquisition day:
ARAUCO INDUSTRIA DE PAINEIS LTDA. | 12-01-2017 al 12-31-2017 ThU.S.$ | |||
Revenue | 11,830 | |||
Net profit | (1,376 | ) | ||
|
| |||
The following table shows revenue and net profit as if the date of acquisition were at the beginning of the annual period of the investement:
ARAUCO INDUSTRIA DE PAINEIS LTDA. | January-December 2017 ThU.S.$ | |||
Revenue | 157,518 | |||
Net profit | (124,609 | ) | ||
|
| |||
On August 2, 2016, our subsidiary Forestal Arauco S.A. incorporated the company Arauco Nutrientes Naturales SPA, with a capital contribution of ThU.S.$5,000 of which, as of December 31, 2017 ThU.S.$3,000 had been paid. The corporate purpose of the company is the manufacture and sale of products made from extracts, fruits, and others.
The details of the subsidiaries included in the consolidation of Arauco are disclosed in Note 13.
63
Table of Contents
CELULOSA ARAUCO Y CONSTITUCION S.A.
AND SUBSIDIARIES
Unaudited Consolidated Financial Statements
December 31, 2017
Amounts in thousands of U.S. dollars, except as indicated
NOTE 15. INVESTMENTS IN ASSOCIATES
At December 31, 2017 and December 31, 2016 there were no new investments in associates to report.
On March 31, 2016, our subsidiary Arauco do Brasil S.A. sold its stake at Stora Enso Arapoti Industria de Papel S.A. for ThU.S.$4,141. This transaction generated a loss of ThU.S.$10,369, as reflected in the Consolidated Statements of Profit or Loss, in the line item “Other Expenses”.
The following tables set forth information about Investments in associates.
| Name | Puertos y Logística S.A. | |||
| Country | Chile | |||
| Functional Currency | U.S. Dollar | |||
| Corporate purpose | Docking and warehousing operations for proprietary and third party use, cargo of all classes of goods, as well, as warehousing and transport operations. | |||
| Ownership interest (%) | 20.2767% | |||
| 12-31-2017 | 12-31-2016 | |||
| Carrying amount | ThU.S.$62,225 | ThU.S.$61,505 | ||
| Name | Inversiones Puerto Coronel S.A. | |||
| Country | Chile | |||
| Functional Currency | U.S. Dollar | |||
| Corporate purpose | Investments in movables and real estate, acquisition of companies, securities and investment instruments, investment management and development and/or participation in all kind of businesses and companies related to industrial, shipping, forestry and commercial activities. | |||
| Ownership interest (%) | 50.0000% | |||
| 12-31-2017 | 12-31-2016 | |||
| Carrying amount | ThU.S.$47,619 | ThU.S.$43,559 | ||
| Name | Servicios Corporativos Sercor S.A. | |||
| Country | Chile | |||
| Functional Currency | Chilean Pesos | |||
| Corporate purpose | Consulting services related to business management to Boards of Directors and Senior Management of all Arauco’s entities. | |||
| Ownership interest (%) | 20.0000% | |||
| 12-31-2017 | 12-31-2016 | |||
| Carrying amount | ThU.S.$191 | ThU.S.$190 | ||
| Name | Genómica Forestal S.A. | |||
| Country | Chile | |||
| Functional Currency | Chilean Pesos | |||
| Corporate purpose | Developing forestry genomics, through the use of biotechnological, molecular and bioinformatics tools with the purpose of strengthening genetic programs so as to improve the competitive position of the Chilean forestry industry for priority tree species. | |||
| Ownership interest (%) | 25.0000% | |||
| 12-31-2017 | 12-31-2016 | |||
| Carrying amount | ThU.S.$(4) | ThU.S.$(1) | ||
64
Table of Contents
CELULOSA ARAUCO Y CONSTITUCION S.A.
AND SUBSIDIARIES
Unaudited Consolidated Financial Statements
December 31, 2017
Amounts in thousands of U.S. dollars, except as indicated
| Name | Consorcio Tecnológico Bioenercel S.A. | |||
| Country | Chile | |||
| Functional Currency | Chilean Pesos | |||
| Corporate purpose | Developing of technologies which will promote the development of a biofuels industry in Chile, obtained from lingo-cellulosic materials. The future execution of this sustainable project is financed by the Innova Chile Committee. | |||
| Ownership interest (%) | 20.0000% | |||
| 12-31-2017 | 12-31-2016 | |||
| Carrying amount | ThU.S.$6 | ThU.S.$31 | ||
| Name | Vale do Corisco S.A. | |||
| Country | Brazil | |||
| Functional Currency | Brazilian Real | |||
| Corporate purpose | Management of forestry activities. | |||
| Ownership interest (%) | 49.0000% | |||
| 12-31-2017 | 12-31-2016 | |||
| Carrying amount | ThU.S.$48,921 | ThU.S.$160,490 | ||
65
Table of Contents
CELULOSA ARAUCO Y CONSTITUCION S.A.
AND SUBSIDIARIES
Unaudited Consolidated Financial Statements
December 31, 2017
Amounts in thousands of U.S. dollars, except as indicated
Summarized Financial Information of Associates
| Assets | ||||||||||||||||||||||||||||||||
12-31-2017 | Puertos y Logística S.A. ThU.S.$ | Inversiones Puerto Coronel S.A. ThU.S.$ | Serv.Corporativos Sercor S.A. ThU.S.$ | Stora Enso Arapoti Ind.de Papel S.A. ThU.S.$ | Vale do Corisco S.A. ThU.S.$ | Consorcio Tecnológico Bioenercel S.A. ThU.S.$ | Genómica Forestal S.A. ThU.S.$ | Total ThU.S.$ | ||||||||||||||||||||||||
Current | 92,816 | 29 | 4,296 | — | 6,384 | 5 | 25 | 103,555 | ||||||||||||||||||||||||
Non-current | 590,309 | 97,072 | 769 | — | 126,215 | 45 | 24 | 814,434 | ||||||||||||||||||||||||
Total | 683,125 | 97,101 | 5,065 | — | 132,599 | 50 | 49 | 917,989 | ||||||||||||||||||||||||
|
|
|
|
|
|
|
|
|
|
|
|
|
|
|
| |||||||||||||||||
| Liabilities | ||||||||||||||||||||||||||||||||
| Puertos y Logística S.A. ThU.S.$ | Inversiones Puerto Coronel S.A. ThU.S.$ | Serv.Corporativos Sercor S.A. ThU.S.$ | Stora Enso Arapoti Ind.de Papel S.A. ThU.S.$ | Vale do Corisco S.A. ThU.S.$ | Consorcio Tecnológico Bioenercel S.A. ThU.S.$ | Genómica Forestal S.A. ThU.S.$ | Total ThU.S.$ | |||||||||||||||||||||||||
Current | 44,564 | 82 | 3,219 | — | 123 | — | 14 | 48,002 | ||||||||||||||||||||||||
Non-current | 331,681 | — | 871 | — | 32,636 | 5 | 50 | 365,243 | ||||||||||||||||||||||||
Equity | 306,880 | 97,019 | 975 | — | 99,840 | 45 | (15 | ) | 504,744 | |||||||||||||||||||||||
Total | 683,125 | 97,101 | 5,065 | — | 132,599 | 50 | 49 | 917,989 | ||||||||||||||||||||||||
|
|
|
|
|
|
|
|
|
|
|
|
|
|
|
| |||||||||||||||||
| 12-31-2017 | ||||||||||||||||||||||||||||||||
Revenues | 130,720 | 4,741 | 5,211 | — | 34,449 | 2 | 30 | 175,153 | ||||||||||||||||||||||||
Expenses | (132,538 | ) | — | (5,246 | ) | — | (29,648 | ) | (10 | ) | (36 | ) | (167,478 | ) | ||||||||||||||||||
Profit or loss (continuing operations) | (1,818 | ) | 4,741 | (35 | ) | — | 4,801 | (8 | ) | (6 | ) | 7,675 | ||||||||||||||||||||
|
|
|
|
|
|
|
|
|
|
|
|
|
|
|
| |||||||||||||||||
Other comprehensive income | 5,850 | — | — | 95,039 | — | — | 100,889 | |||||||||||||||||||||||||
Total comprehensive income | 4,032 | 4,741 | (35 | ) | — | 99,840 | (8 | ) | (6 | ) | 108,564 | |||||||||||||||||||||
Dividends | — | — | — | — | — | — | — | — | ||||||||||||||||||||||||
| Assets | ||||||||||||||||||||||||||||||||
12-31-2016 | Puertos y Logística S.A. ThU.S.$ | Inversiones Puerto Coronel S.A. ThU.S.$ | Serv.Corporativos Sercor S.A. ThU.S.$ | Stora Enso Arapoti Ind.de Papel S.A. ThU.S.$ | Vale do Corisco S.A. ThU.S.$ | Consorcio Tecnológico Bioenercel S.A. ThU.S.$ | Genómica Forestal S.A. ThU.S.$ | Total ThU.S.$ | ||||||||||||||||||||||||
Current | 76,021 | 29 | 4,608 | — | 24,972 | 6 | 26 | 105,662 | ||||||||||||||||||||||||
Non-current | 572,831 | 88,936 | 668 | — | 415,083 | 153 | 63 | 1,077,734 | ||||||||||||||||||||||||
Total | 648,852 | 88,965 | 5,276 | — | 440,055 | 159 | 89 | 1,183,396 | ||||||||||||||||||||||||
|
|
|
|
|
|
|
|
|
|
|
|
|
|
|
| |||||||||||||||||
| Liabilities | ||||||||||||||||||||||||||||||||
| Puertos y Logística S.A. ThU.S.$ | Inversiones Puerto Coronel S.A. ThU.S.$ | Serv.Corporativos Sercor S.A. ThU.S.$ | Stora Enso Arapoti Ind.de Papel S.A. ThU.S.$ | Vale do Corisco S.A. ThU.S.$ | Consorcio Tecnológico Bioenercel S.A. ThU.S.$ | Genómica Forestal S.A. ThU.S.$ | Total ThU.S.$ | |||||||||||||||||||||||||
Current | 44,457 | 82 | 3,412 | — | 3,446 | — | 9 | 51,406 | ||||||||||||||||||||||||
Non-current | 301,065 | — | 912 | — | 109,079 | 6 | 85 | 411,147 | ||||||||||||||||||||||||
Equity | 303,330 | 88,883 | 952 | — | 327,530 | 153 | (5 | ) | 720,843 | |||||||||||||||||||||||
Total | 648,852 | 88,965 | 5,276 | — | 440,055 | 159 | 89 | 1,183,396 | ||||||||||||||||||||||||
|
|
|
|
|
|
|
|
|
|
|
|
|
|
|
| |||||||||||||||||
| 12-31-2016 | ||||||||||||||||||||||||||||||||
Revenues | 107,722 | 3,072 | 4,591 | 492 | 44,822 | 33 | 94 | 160,826 | ||||||||||||||||||||||||
Expenses | (98,642 | ) | — | (4,587 | ) | (6,320 | ) | (15,238 | ) | (147 | ) | (100 | ) | (125,034 | ) | |||||||||||||||||
Profit or loss (continuing operations) | 9,080 | 3,072 | 4 | (5,828 | ) | 29,584 | (114 | ) | (6 | ) | 35,792 | |||||||||||||||||||||
|
|
|
|
|
|
|
|
|
|
|
|
|
|
|
| |||||||||||||||||
Other comprehensive income | 7,385 | (29 | ) | — | — | — | — | — | 7,356 | |||||||||||||||||||||||
Total Comprehensive income | 16,465 | 3,072 | 4 | (5,828 | ) | 29,584 | (114 | ) | (6 | ) | 43,177 | |||||||||||||||||||||
Dividends | — | 3,043 | — | — | 1,420 | — | — | 1,420 | ||||||||||||||||||||||||
Reconciliation of Investment in Associates and Joint Ventures
| 12-31-2017 ThU.S.$ | 12-31-2016 ThU.S.$ | |||||||
Opening balance as of January 1 | 446,548 | 264,812 | ||||||
Changes | ||||||||
Investment in joint ventures, Additions | — | 153,135 | ||||||
Disposals, Investments in associates and joint ventures | — | (14,510 | ) | |||||
Share of profit (loss) in investment in associates | 4,855 | 16,349 | ||||||
Share of profit (loss) in investment in joint ventures | 12,162 | 7,590 | ||||||
Dividends Received, Investments in Associates | (8,586 | ) | (5,320 | ) | ||||
Increase (Decrease) in foreign exchange currency on translation of Associates and Joint Ventures | 22,726 | 20,634 | ||||||
Other increase (decrease) in investment and associates and joint Ventures (*) | (108,933 | ) | 3,858 | |||||
Total changes | (77,776 | ) | 181,736 | |||||
Ending balance | 368,772 | 446,548 | ||||||
|
|
|
| |||||
| (*) | In May 2017, Arauco’s associate Florestal Vale do Corisco S.A. performed a return of capital to its shareholders. This transaction did not generate effects in the Consolidated Statements of Profit or Loss nor modified Arauco’s shareholding in Florestal Vale do Corisco S.A. |
66
Table of Contents
CELULOSA ARAUCO Y CONSTITUCION S.A.
AND SUBSIDIARIES
Unaudited Consolidated Financial Statements
December 31, 2017
Amounts in thousands of U.S. dollars, except as indicated
| 12-31-2017 ThU.S.$ | 12-31-2016 ThU.S.$ | |||||||
Carrying amount of associates accounted for using equity method | 158,772 | 265,775 | ||||||
Carrying amount of joint ventures accounted for using equity method | 209,805 | 180,773 | ||||||
Total investment accounted for using equity method | 368,577 | 446,548 | ||||||
|
|
|
| |||||
NOTE 16. INTERESTS IN JOINT ARRANGEMENTS
Investments and contributions made
On May 31, 2016, Inversiones Arauco Internacional Limitada, Arauco’s subsidiary, acquired 50% of the shares of Tableros de Fibras S.A, a Spanish subsidiary of SONAE INDUSTRIA, SGPS, S.A. (“Sonae”), which as of such date changed its name to “Sonae Arauco S.A.”. The price paid by Arauco for the acquisition of 50% of the shares of Sonae Arauco was the amount of €137,500,000 (equivalent to ThU.S.$153,135 at the acquisition date). This transaction generated a goodwill of ThU.S.$36,190, as shown in the Consolidated Statements of Financial Position as part of the investment.
Sonae Arauco produces and sales wood panels, of the type of MDF, PB and OSB, and sawn timber, through the operation of 2 panel plants and one sawmill in Spain; 2 panel plants and one resin plant in Portugal; 4 panel plants in Germany and 2 panel plants in South Africa.
In the aggregate, the production capacity of Sonae Arauco is of approximately 1.4 million m3 of MDF, 2.1 million m3 of particleboard, 486,000 m3 of OSB and 50,000 m3 of sawn timber.
As of December 31, 2017 and 2016, Arauco has not carried out any contributions to Uruguayan companies Celulosa y Energía Punta Pereira S.A. and Zona Franca Punta Pereira S.A.
The investments in Uruguay qualify as a joint operation. In relation to “other rights and contractual conditions”, the joint operation has the primary objective of providing the parties an output. As established in the “Pulp Supply Agreement”, both Arauco and its partner have the obligation to acquire 100% of the yearly pulp produced by the joint operation. Arauco has recognized the assets, liabilities, income and expenses associated with its interest ownership, as of January 1, 2013, pursuant to IFRS 11.
Furthermore, Arauco holds a 50% ownership interest in Unilin Arauco Pisos Laminados Ltda., a Brazilian company, and in Eka Chile S.A. (“Eka”), a company that sells sodium chlorate to cellulose plants in Chile. There is a contractual agreement with these companies whereby Arauco has engaged in an economic activity subject to common control, which is classified as a joint venture.
67
Table of Contents
CELULOSA ARAUCO Y CONSTITUCION S.A.
AND SUBSIDIARIES
Unaudited Consolidated Financial Statements
December 31, 2017
Amounts in thousands of U.S. dollars, except as indicated
The following tables set forth summarized financial information of the more significant interests in joint arrangements, which qualify as joint operations:
| 12-31-2017 | 12-31-2016 | |||||||||||||||
Celulosa y Energía Punta Pereira S.A. (Uruguay) | Assets ThU.S.$ | Liabilities ThU.S.$ | Assets ThU.S.$ | Liabilities ThU.S.$ | ||||||||||||
Current | 202,669 | 186,626 | 173,258 | 182,834 | ||||||||||||
Non-current | 2,076,255 | 586,034 | 2,131,266 | 735,679 | ||||||||||||
Equity | 1,506,264 | 1,386,011 | ||||||||||||||
Total Joint Arrangement | 2,278,924 | 2,278,924 | 2,304,524 | 2,304,524 | ||||||||||||
|
|
|
|
|
|
|
| |||||||||
Investment | 753,132 | 693,006 | ||||||||||||||
|
|
|
| |||||||||||||
| 12-31-2017 ThU.S.$ | 12-31-2016 ThU.S.$ | |||||||
Income | 768,508 | 680,819 | ||||||
Expenses | (650,174 | ) | (618,387 | ) | ||||
Joint Arrangement Net Income (Loss) | 118,334 | 62,432 | ||||||
|
|
|
| |||||
| 12-31-2017 | 12-31-2016 | |||||||||||||||
Forestal Cono Sur S.A. (consolidated) | Assets ThU.S.$ | Liabilities ThU.S.$ | Assets ThU.S.$ | Liabilities ThU.S.$ | ||||||||||||
Current | 33,012 | 22,582 | 23,745 | 21,039 | ||||||||||||
Non-current | 174,943 | 2,314 | 178,236 | 1,381 | ||||||||||||
Equity | 183,059 | 179,561 | ||||||||||||||
Total Joint Arrangement | 207,955 | 207,955 | 201,981 | 201,981 | ||||||||||||
|
|
|
|
|
|
|
| |||||||||
Investment | 91,530 | 89,781 | ||||||||||||||
|
|
|
| |||||||||||||
| 12-31-2017 ThU.S.$ | 12-31-2016 ThU.S.$ | |||||||
Income | 15,113 | 8,443 | ||||||
Expenses | (9,926 | ) | (2,876 | ) | ||||
Joint Arrangement Net Income (Loss) | 5,187 | 5,567 | ||||||
|
|
|
| |||||
| 12-31-2017 | 12-31-2016 | |||||||||||||||
Eufores S.A.(consolidated) | Assets ThU.S.$ | Liabilities ThU.S.$ | Assets ThU.S.$ | Liabilities ThU.S.$ | ||||||||||||
Current | 183,175 | 180,298 | 178,644 | 200,525 | ||||||||||||
Non-current | 612,187 | 7,948 | 604,736 | 23,052 | ||||||||||||
Equity | 607,116 | 559,803 | ||||||||||||||
Total Joint Arrangement | 795,362 | 795,362 | 783,380 | 783,380 | ||||||||||||
|
|
|
|
|
|
|
| |||||||||
Investment | 303,558 | 279,902 | ||||||||||||||
|
|
|
| |||||||||||||
| 12-31-2017 ThU.S.$ | 12-31-2016 ThU.S.$ | |||||||
Income | 336,705 | 296,927 | ||||||
Expenses | (286,616 | ) | (280,054 | ) | ||||
Joint Arrangement Net Income (Loss) | 50,089 | 16,873 | ||||||
|
|
|
| |||||
| 12-31-2017 | 12-31-2016 | |||||||||||||||
Zona Franca Punta Pereira S.A. (Uruguay) | Assets ThU.S.$ | Liabilities ThU.S.$ | Assets ThU.S.$ | Liabilities ThU.S.$ | ||||||||||||
Current | 6,105 | 97,233 | 4,397 | 82,331 | ||||||||||||
Non-current | 483,884 | 43,180 | 492,815 | 63,021 | ||||||||||||
Equity | 349,576 | 351,860 | ||||||||||||||
Total Joint Arrangement | 489,989 | 489,989 | 497,212 | 497,212 | ||||||||||||
|
|
|
|
|
|
|
| |||||||||
Investment | 174,788 | 175,930 | ||||||||||||||
|
|
|
| |||||||||||||
| 12-31-2017 ThU.S.$ | 12-31-2016 ThU.S.$ | |||||||
Income | 22,129 | 31,042 | ||||||
Expenses | (24,413 | ) | (25,966 | ) | ||||
Joint Arrangement Net Income (Loss) | (2,284 | ) | 5,076 | |||||
|
|
|
| |||||
68
Table of Contents
CELULOSA ARAUCO Y CONSTITUCION S.A.
AND SUBSIDIARIES
Unaudited Consolidated Financial Statements
December 31, 2017
Amounts in thousands of U.S. dollars, except as indicated
The following tables set forth summarized financial information of the more significant interests in joint ventures:
| 12-31-2017 | 12-31-2016 | |||||||||||||||
Unilin Arauco Pisos Ltda. | Assets ThU.S.$ | Liabilities ThU.S.$ | Assets ThU.S.$ | Liabilities ThU.S.$ | ||||||||||||
Current | 7,270 | 4,461 | 7,900 | 3,549 | ||||||||||||
Non-current | 5,535 | 28 | 5,094 | 18 | ||||||||||||
Equity | 8,316 | 9,427 | ||||||||||||||
Total Joint Arrangement | 12,805 | 12,805 | 12,994 | 12,994 | ||||||||||||
|
|
|
|
|
|
|
| |||||||||
Investment | 4,158 | 4,714 | ||||||||||||||
|
|
|
| |||||||||||||
| 12-31-2017 ThU.S.$ | 12-31-2016 ThU.S.$ | |||||||
Income | 17,910 | 1,305 | ||||||
Expenses | (18,736 | ) | (1,974 | ) | ||||
Joint Arrangement Net Income (Loss) | (826 | ) | (669 | ) | ||||
|
|
|
| |||||
Other comprehensive income | — | — | ||||||
Comprehensive income | (826 | ) | (669 | ) | ||||
Dividends | — | — | ||||||
|
|
|
| |||||
| 12-31-2017 | 12-31-2016 | |||||||||||||||
Eka Chile S.A. | Assets ThU.S.$ | Liabilities ThU.S.$ | Assets ThU.S.$ | Liabilities ThU.S.$ | ||||||||||||
Current | 18,876 | 5,388 | 15,817 | 4,348 | ||||||||||||
Non-current | 32,040 | 5,054 | 31,690 | 5,021 | ||||||||||||
Equity | 40,474 | 38,138 | ||||||||||||||
Total Joint Arrangement | 50,916 | 50,916 | 47,507 | 47,507 | ||||||||||||
|
|
|
|
|
|
|
| |||||||||
Investment | 20,237 | 19,069 | ||||||||||||||
|
|
|
| |||||||||||||
| 12-31-2017 ThU.S.$ | 12-31-2016 ThU.S.$ | |||||||
Income | 43,678 | 48,276 | ||||||
Expenses | (40,111 | ) | (44,045 | ) | ||||
Joint Arrangement Net Income (Loss) | 3,567 | 4,231 | ||||||
|
|
|
| |||||
Other comprehensive income | — | — | ||||||
Comprehensive income | 3,567 | 4,231 | ||||||
Dividends | — | — | ||||||
|
|
|
| |||||
| 12-31-2017 | 12-31-2016 | |||||||||||||||
Sonae Arauco S.A. | Assets ThU.S.$ | Liabilities ThU.S.$ | Assets ThU.S.$ | Liabilities ThU.S.$ | ||||||||||||
Current | 265,578 | 235,676 | 223,145 | 213,228 | ||||||||||||
Non-current | 664,689 | 323,770 | 616,467 | 312,404 | ||||||||||||
Equity | 370,821 | 313,980 | ||||||||||||||
Total Joint Arrangement | 930,267 | 930,267 | 839,612 | 839,612 | ||||||||||||
|
|
|
|
|
|
|
| |||||||||
Net assets | 151,920 | 120,800 | ||||||||||||||
Net asset adjustment (Goodwill) | 33,491 | 36,190 | ||||||||||||||
Investment | 185,411 | 156,990 | ||||||||||||||
|
|
|
| |||||||||||||
| 12-31-2017 ThU.S.$ | 12-31-2016 ThU.S.$ | |||||||
Income | 976,936 | 507,179 | ||||||
Expenses | (954,979 | ) | (495,560 | ) | ||||
Joint Arrangement Net Income (Loss) | 21,957 | 11,619 | ||||||
|
|
|
| |||||
Other comprehensive income | — | — | ||||||
Comprehensive income | 21,957 | — | ||||||
Dividends | — | — | ||||||
|
|
|
| |||||
69
Table of Contents
CELULOSA ARAUCO Y CONSTITUCION S.A.
AND SUBSIDIARIES
Unaudited Consolidated Financial Statements
December 31, 2017
Amounts in thousands of U.S. dollars, except as indicated
NOTE 17. IMPAIRMENT OF ASSETS
Provisions for impairment of property, plant and equipment due to technical obsolescence have been recorded as of December 31, 2017 and December 31, 2016, respectively, as shown below:
Disclosure of Asset Impairment | ||||
Principal classes of Assets affected by Impairment and Reversal of Losses | Machinery and Equipment | |||
Principal Facts and Circumstances that lead to Recognizing Impairment and Reversal of losses | Technical Obsolescence and Claim | |||
| 12-31-2017 | 12-31-2016 | |||
Information relevant to the sum of all impairment | ThU.S.$17,396 | ThU.S.$7,993 | ||
Goodwill
Goodwill is allocated to the groups of cash-generating units that are expected to benefit from the synergies of the combination.
At the date of these consolidated financial statements, the balance of goodwill is ThU.S.$69,922 (ThU.S.$74,893 at December 31, 2016), as shown below:
Goodwill | 12-31-2017 ThU.S.$ | 12-31-2016 ThU.S.$ | ||||||
Opening balance at January 1 | 74,893 | 69,475 | ||||||
Impairment | (4,640 | ) | — | |||||
Increase (decrease) in foreign currency exchange | (331 | ) | 5,418 | |||||
Closing balance at December 31, 2017 | 69,922 | 74,893 | ||||||
|
|
|
| |||||
Of the total of goodwill, ThU.S.$39,841 (ThU.S.$39,694 as of December 31, 2016) are generated by the acquisition of “Flakeboard”, a company that, directly and/or through its subsidiaries, possesses and operates 7 panel plants, for which Arauco acquired and paid, on September 24, 2012, the price of ThU.S.$242,502 for the 100% interest ownership.
The recoverable amount for Flakeboard’s cash generating unit was determined based on the calculations of its value in use, and this calculation was made using cash flow projections covering a5-year term, applying a real discount rate of 6.7% which reflects current market assessments for the timber segment in North America.
The investment in the panel plant in Pien, Brazil generated a goodwill of ThU.S.$27,266 (ThU.S.$32,385 as of December 31, 2016).
The recoverable amount for the Pien plant’s cash generating unit was determined based on the calculations of its value in use, and this calculation was made using cash flow projections based on the operational plan approved by the Administration, covering a5-year term, applying a 7% real discount rate that reflects current evaluations for the panel segment in Brazil.
As a result of the annual impairment test, the carrying value of the goodwill of the plants exceeded their recoverable value, and therefore there impairment losses of ThU.S.$4,640 were recognized.
70
Table of Contents
CELULOSA ARAUCO Y CONSTITUCION S.A.
AND SUBSIDIARIES
Unaudited Consolidated Financial Statements
December 31, 2017
Amounts in thousands of U.S. dollars, except as indicated
NOTE 18. PROVISIONS, CONTINGENT ASSETS AND CONTINGENT LIABILITIES
The contingent liabilities for outstanding litigations are as follows:
Celulosa Arauco y Constitución S.A.
1.On August 25, 2005, the Chilean Servicio de Impuestos Internos (the “Chilean IRS”) issued tax resolutions No. 184 and No. 185 of 2005, and objected certain income tax returns made by Arauco on April 16, 2001 and October 31, 2001, and furthermore, requested the reimbursement of the amounts returned in connection to tax losses, along with the amendment of the FUT (Tax Profits Fund) Registry balance. In consideration to the foregoing, the above mentioned tax resolutions ordered the restitution of the historical amount of $4,571,664,617 (equal to ThU.S.$7,436 as of December 31, 2017). On November 7, 2005, the Company requested a Review of the Supervision Action (Revisión de la Actuación Fiscalizadora, or “RAF”), which is an administrative review of the tax action brought by the Chilean IRS, and filed a claim disputing the above mentioned tax resolutions No. 184 and 185 of 2005. The RAF was resolved on January 9, 2009 by the Chilean IRS, partially sustaining the Company’s request, granting a discount to the total amount of $1,209,399,164 (equal to ThU.S.$1,967, as of December 31, 2017), resulting in a total disputed amount of $3,362,265,453 (equal to ThU.S.$5,469 as of December 31, 2017); consequently, on this date the claim corresponding to the sums not granted during the enforcement stage was filed. On February 19, 2010, the Court acknowledged receipt of the Company’s request. Subsequently, the tax authority issued a report and the Company commented on such report.
On September 26, 2014, Arauco requested the submission of this claim to the competent jurisdiction of the new Tax and Customs Courts. On October 10, 2014, Arauco’s request was granted. Currently the action is being considered by these new Courts under the Docket No. RUC14-9-0002087-3. On March 20, 2015, the SII responded to the allegations submitted by Arauco against Liquidations No. 184 and 185 of 2005. On June 19, 2017, the Court issued the evidence production ruling, which resolution was notified via certified letter on July 23 of 2017. Arauco lodged a motion for reconsideration and a supplementary appeal, requesting the terms of the evidence production ruling be modified. On July 7, 2017, the Court upheld the motion for reconsideration. On September 20, 2017, the Court issued its first instance decision confirming the liquidations. On October 12, 2017, Arauco challenged the decision through an appeal, requesting the Court of Appeals of Santiago to revoke the first instance decision and uphold Arauco’s claim instead. The case is pending.
Considering that the Company’s position is based on solid legal grounds, there is a reasonable margin for obtaining a favorable result for the Company and therefore as of December 31, 2017, Arauco has not made any provision whatsoever in connection to this contingency.
2. In connection with Licancel Plant, on June 22, 2011, the Company was notified of a civil claim for compensation of prejudice for an alleged tort liability, filed by twelve fishermen of the Mataquito River before the Court of First Instance, Guarantee and Family of Licantén under Docket number73-2011. The case arose out of dead fish allegedly found in the Mataquito River on June 5, 2007 caused by the Licancel Plant. The plaintiffs seek to be compensated for alleged damages that they had from the aforementioned event, including loss of profits, pain and suffering and an alleged contractual liability, for a total of $2,695,560,000 (equal to ThU.S.$4,824 as of December 31, 2017).
71
Table of Contents
CELULOSA ARAUCO Y CONSTITUCION S.A.
AND SUBSIDIARIES
Unaudited Consolidated Financial Statements
December 31, 2017
Amounts in thousands of U.S. dollars, except as indicated
On October 21, 2015, the Court issued a definitive first instance decision partially admitting the claim, sentencing Celulosa Arauco y Constitución S.A. to pay each claimant – asnon-monetary damages – the sum of $5,000,000 (equal to ThU.S.$8, as of December 31, 2017) plus adjustments, in accordance with the variation of the Consumer Price Index, calculated as of the month of May 2007, up to the month when the payment is made. On November 16, 2015, the defendant challenged the definitive decision through the submission of a cassation appeal based on formal aspects and an ordinary appeal. In turn, the plaintiff adhered to the appeal, seeking to have the amount of thenon-monetary damages recognized by the first instance decision increased. On June 27, 2017, the Court of Appeals of Talca confirmed the ruling, additionally declaring that it increased the amount awarded asnon-monetary damages to $10,000,000 (equal to ThU.S.$16 as of December 31, 2017) for each claimant, plus Consumer Price Index-based adjustments, calculated from the date of the first instance ruling (October 21, 2015) up to the date of effective payment. On July 12, 2017, Arauco filed a cassation appeal based on both procedural and substantial flaws. On October 5, 2017, Arauco became a party to the Appeal.
On December 20, 2017 the parties reached a complete agreement, thus putting an end to the trial through a settlement, with Celulosa Arauco y Constitución S.A., paying - without recognizing any liability in connection with the events - an amount lower than ninety million pesos, with the plaintiffs, in turn, abandoning the cassation appeals that they had lodged. On December 28, 2017, the Supreme Corte issued a ruling declaring the waiver of both remedies. Proceedings Terminated.
3. Through Res. Ex. N° 1 issued by the Superintendence of the Environment (“SMA”) on January 8, 2016, notified on January 14, 2016, the SMA formulated 11 charges against the Company, due to alleged breaches of certain Environmental Qualification Resolutions for the Valdivia Plant and of DS No. 90/2000. The 11 charges were classified as follows by the SMA: 1 critical, 5 severe, 5 minor.
On February 12, 2016, the Company submitted its defenses.
On December 15, 2017, the Superintendence of the Environment issued Exempted Resolution No. 1,487, closing the punitive administrative proceeding, absolving the company with regards to one of the charges and convicting for other 10 charges, applying a fine of 7,777 UTA (equal to ThU.S.$ 7,131 as of December 31, 2017). On December 22, 2017, the Company submitted a motion for reconsideration regarding Exempted Resolution No. 1,487, before the SMA, requesting that we be absolved of all infringements, with the exception of the charge specified under number 7 (late submission of the water quality report regarding the Cruces river). Proceedings Pending.
Considering that the Company’s position is based on solid legal grounds, there is a reasonable margin for obtaining a favorable result for the Company, and therefore as of December 31, 2017, Arauco has not made any provision whatsoever in connection to this contingency.
4. Through Res. Ex. N° 1 of the SMA, dated February 17, 2016 notified on February 23, 2016, the SMA formulated 8 charges against the company due to alleged breaches of certain Environmental Qualification Resolutions for the Nueva Aldea Plant. The 8 charges were qualified by the SMA as follows: 7 severe and 1 minor.
On March 15, 2016, the company submitted - within the established term - a compliance program which contains 30 actions and goals, related to each one of the 8 alleged infringements. On July 15, 2016, the Exempted Resolution No. 11 of the SMA was notified, which approved the compliance program and suspended the punitive proceedings. If the program is satisfactorily implemented, it would be possible to conclude the proceedings without applying any sanctions.
72
Table of Contents
CELULOSA ARAUCO Y CONSTITUCION S.A.
AND SUBSIDIARIES
Unaudited Consolidated Financial Statements
December 31, 2017
Amounts in thousands of U.S. dollars, except as indicated
On August 3, 2016, third-party complainants in the administrative proceeding filed a complaint appeal against Exempted Resolution No. 11 issued by the SMA, which approved the compliance program. On December 24, 2016, the Third Environmental Court rejected such complaint filed against Ex. Res. No. 11 SMA, which approved the compliance program. The petitioners did not file a cassation remedy.
On October 31, 2017, a final report was submitted regarding the Compliance Program, which evidenced the complete and comprehensive performance of all actions and measures envisaged in said program. The SMA must issue its opinion regarding the satisfactory performance of the Compliance Program.
5. Through Exempted Resolution No. 1/FileF-020-2016, dated May 6, 2016, the SMA formulated four charges against the company due to certain alleged breaches of the Environmental Qualification Resolutions of the Licancel Plant. The SMA classified the four charges as follows: 1 severe and 3 minor.
Regarding the 4 charges pressed by the Superintendence of the Environment through Exempted Resolution No. 1/Case FileF-020-2016, dated May 6, 2016, against the Company for alleged infringements to the Environmental Qualification Resolutions of the Licancel Plant, we can inform the following:
On February 1, 2017, the Environment Superintendent issued Exempted Resolution No. 71, imposing a fine against the Company for the amount of 239 Annual Tax Units (UTA) (equivalent to ThU.S.$ 219, as of December 31, 2017).
On February 13, 2017, the Company filed a motion for reconsideration, requesting the annulment of the fine or substantially decreasing it.
On August 7, 2017, a ruling was issued to resolve the reconsideration appeal, partially upholding the Company’s request regarding Charge No. 2, thus reducing the portion of the fine that corresponds to this charge, from 234 UTA to 177 UTA (equivalent to ThU.S.$215, as of December 31, 2017).
Additionally, regarding the total amount of the fine imposed for Charges Nos. 1, 2 and 3 (No. 4 had been rendered ineffective previously), the 25% reduction benefit was granted as a result of paying within the first 5 business days, and the total sum amounted to 136.5 UTA (equivalent to ThU.S.$125 as of December 31, 2017). Case closed.
6. Through Exempted Resolution No. 1/FileF-031-2016, dated September 15, 2016, the SMA formulated three charges against the company due to certain alleged breaches of certain Environmental Qualification Resolutions of the Constitución Plant, and an alleged contravention of Law No. 19,300 resulting from a purported circumvention of the Environmental Assessment System. The SMA classified the three charges as follows: 1 severe and 2 minor.
On October 17, 2016, the company filed a Compliance Program containing 7 actions and objectives. On January 3, 2017, the SMA served its resolution approving the compliance program submitted by the Company. If the compliance program is executed satisfactorily, the proceedings would conclude without the application of any sanctions.
73
Table of Contents
CELULOSA ARAUCO Y CONSTITUCION S.A.
AND SUBSIDIARIES
Unaudited Consolidated Financial Statements
December 31, 2017
Amounts in thousands of U.S. dollars, except as indicated
The final report regarding the Compliance Program was submitted on October 2, 2017, and further supplemented on December 11, 2017, evidencing the complete and comprehensive performance of all the actions and measures envisaged in said program. The SMA must issue its opinion regarding the satisfactory performance of the Compliance Program.
Since the Company’s position is grounded in solid legal arguments, there is a reasonable margin for obtaining a favorable result for the Company and therefore, as of December 31, 2017, Arauco has not made any provision whatsoever in connection to this contingency.
Arauco Argentina S.A.
1.On December 14, 2007 the Federal Administration of Internal Revenue (Administración Federal de Ingresos Públicos) (“AFIP”) requested a determination, challenging the deductibility, as against Income Tax, of certain expenses, interests and exchange differences generated by Private Negotiable Obligations issued by the Company in 2001 and cancelled in 2007, for an amount of US$ 250,000,000.
This determination reached $417,908,207 Argentine Pesos (equivalent to ThU.S.$22,409 as of December 31, 2017) for principal, compensatory interest and fines.
On February 11, 2008, the Company appealed before the National Tax Court (Tribunal Fiscal de la Nación) (“TFN”), which upheld the State’s determination on February 2010. The Company appealed this decision before the National Chamber of Appeals for Federal Administrative Disputes.
Likewise, the Company requested an interim measure of relief before the Chamber of Appeals, so that the Chamber may order the suspension of the determination’s enforceability while the final judgment is pending. On May 13, 2010, Chamber I of the National Chamber of Appeals for Federal Administrative Disputes approved the request, subject to the pledge of collateral, which collateral was furnished by the Company by means of Insurance Policy No. 86058, issued by Zurich Argentina Cia. de Seguros S.A. for $633,616,741 Argentine Pesos (equivalent to ThU.S.$ 33,976 as of December 31, 2017).
The judgment of the Chamber of Appeals, issued in December 2012, was contrary to the company’s interests. The Company filed an Ordinary Appeal before the Supreme Court of Justice, which was authorized by the Chamber of Appeals, and an Extraordinary Appeal, which was duly noted by the Chamber for the relevant procedural phase.
During this entire process, the Company, in consultation with its external legal advisors maintained their opinion that the Company had behaved within the limits of the law in its deduction of the interests, expenses and exchange differences that was challenged by the State, and that there were good chances that this determination issued by the AFIP would be rendered without effect.
On July 22, 2016, Congress passed law No. 27,260, whose Title II, Book II establishes an Exceptional Regularization Regime for Tax, Social Security and Customs Obligations, for obligations that have been the subject matter of judicial proceedings (henceforth, the “Regularization Regime”).
The introduction of the Regularization Regime entails an exemption from the applicable fines as well as a portion of the interests. In order to enjoy these benefits, the taxpayer must unconditionally accept its counterparty’s claim in relation to the regularized obligations, as well as desist from and withdraw any action and right, including restitution actions, bearing the expense of litigation costs and expenses.
74
Table of Contents
CELULOSA ARAUCO Y CONSTITUCION S.A.
AND SUBSIDIARIES
Unaudited Consolidated Financial Statements
December 31, 2017
Amounts in thousands of U.S. dollars, except as indicated
The legal counselors that have been intervening in the different stages of litigation have highlighted the very important economic advantages offered by the Regularization Regime in light of the contingency inherent to any judicial case.
On September 7, 2016, the Company materialized its application to the Regularization Regime before the AFIP, in connection to the obligations claimed in consideration to the adjustment conducted by the State regarding the Income Tax Statements filed between the years 2001 and 2004 and reported this situation to the Nation’s Supreme Court, consequently abandoning the Ordinary Appeal that had been promptly filed.
As of this date, the updated amount for the contingency amounted to approximately $891,758,132 Argentine Pesos (equal to ThU.S.$47,818 as of December 31, 2017), corresponding to principal, interest and fines. The Company decided to pay in cash, and the balance that was finally paid amounted to $248,503,504 Argentine Pesos (equal to ThU.S.$ 13,626 as of December 31, 2017). Additionally, the Company shall assume the payment of all litigation costs and trial expenses, the sum of which was undetermined as of the date of these financial statements. On November 1, 2016, the Nation’s Supreme Court of Justice declared the above mentioned remedy’s abandonment and returned the file to the court of origin. On November 30, 2016, the First Chamber of the National Appeals Court declared that the case file as returned. On April 18, 2017, Chamber I of the National Chamber declared that the Company had abandoned its actions and rights, including its repetition rights, thus condoning the fine and the corresponding interests. Additionally, it ordered the deferral of the fees regulation until payment of the state attorneys has been decided before the lower court, ordering the reimbursement of the Surety Insurance. The contingency insurance policy has been redeemed and returned to the insurance company.
2. Pursuant to law No. 25,080, the former Secretary of Agriculture, Livestock, Fishing and Foodstuffs, the enforcement agency referred to in the law approved, by Res. No. 952/2000, the forestry and industrial-forestry projects submitted by Arauco Argentina S.A. In the context of these projects, the Company afforested: 1) 4,777 hectares during 2000, in observance of its committed yearly plan; and 2) 23,012 hectares between 2000 and 2006 as a part of the multi-year afforestation plan. Likewise, a sawmill was built with installed capacity to produce 250,000 m3 of sawn timber per year.
On January 11, 2001, Arauco Argentina S.A. submitted an expansion for the approved industrial-forestry project. The expansion was approved via Res. No. 84/03 issued by the former Secretary of Agriculture, Livestock, Fishing and Foodstuffs. In accordance with the assumed obligations, the Company built a MDF board (panels) plant and afforested 8,089 hectares between 2001 and 2006.
Additionally, the Company filed yearly forestry plans between years 2007 and 2015 for its local operations in the Provinces of Misiones and Buenos Aires.
In March, 2005, Note No. 145/05 of the Undersecretary of Agriculture, Livestock and Afforestation suspended the benefit that exempted Arauco Argentina S.A. from paying export duties under Law No. 25,080. This measure is currently under discussion by the Company. On November 8, 2006, the V Chamber of the National Appeals Court for Adversarial Administrative and Federal Matters issued a ruling ordering Arauco Argentina S.A. to continue to enjoy an exemption from paying the exportation duties, in the same manner and scope it had prior to the suspension ordered by Note No. 145/05, if the
75
Table of Contents
CELULOSA ARAUCO Y CONSTITUCION S.A.
AND SUBSIDIARIES
Unaudited Consolidated Financial Statements
December 31, 2017
Amounts in thousands of U.S. dollars, except as indicated
clearance of merchandise is performed pursuant to the guarantee regime established in article 453, subsection a) of the Customs Code, for the exempted tax obligation. The judicial measure became effective beginning on March of 2007 by collateralization through the granting of bond (caución) policies for each shipment permits exempted from payment of export duty. The company maintains an assignment of funds equivalent to $437,149,340 Argentine Pesos (ThU.S.$ 23,440 as of December 31, 2017) for guaranteed export duties, which appears under not current provisions. Additionally, the Company filed a restitution claim for a total amount of US$6,555,207, plus interests accrued from the service of the claim, corresponding to export duties between March 2005 and March 2007, as a result of the application of Note 145/05 issued by the Undersecretary of Agriculture, Livestock and Afforestation. Both the underlying issue and the restitution claim have yet to be resolved.
On the other hand, in April 2016, the Secretary of Agriculture, Livestock and Fishing issued Resolution No.154 – E/2016, that requires that the holders of enterprises that have received the fiscal benefits envisaged by Law No. 25,080, establish collateral to cover a third of the duration of the project, with a minimum term of five years. During May of 2017, the Company modified the duly established collateral in accordance to the terms of said Resolution, for which reason the security was ultimately established at an amount of $276,508,024 (ThU.S.$14,827 as of December 31, 2017).
Arauco Argentina S.A. believes that it has complied with all of the obligations imposed upon it by the system set forth under Law No. 25,080.
Arauco do Brasil S.A.
On November 8, 2012, the Brazilian tax authorities issued an Infringement Notice against one of our Brazilian subsidiaries, Arauco do Brasil S.A., for allegedly unpaid taxed owed by said company during the period from 2006 to 2010. Specifically, the tax authorities (i) objected to the deductibility of certain payments made, and expenses incurred (including the amortization of premiums, interest and litigation costs) by Arauco do Brasil between 2005 and 2010, and, (ii) argued that Arauco do Brasil made certain insufficient payments regarding the Brazilian Corporate Tax (“IRPJ”) and the Corporate Contribution over Net Profits (“CSLL”) during 2010.
On July 20, 2015, Arauco do Brasil was notified of the first-level administrative ruling which partially upheld the Infringement, at the estimated amount of R$164,159,000 (ThU.S.$49,572 as of December 31, 2017). Against this ruling, a Voluntary Appeal was filed seeking to revoke the Infringement Notice before the Brazilian Administrative Tax Council (Conselho Administrativo de Recursos Fiscais de Brasil or “CARF”), which is the second administrative level. The CARF’s decision was issued on May 16, 2017, and took into consideration certain arguments presented by the Company regarding the agios, but preserving other charges. Administratively, it is possible that the parties can file a Special Remedy. If the current scenario remains in place, it is estimated that the claim will amount to R$57,278,771 (ThU.S.$17,297 as of December 31, 2017), plus correction increments.
The company believes that its challenge against the Infringement Notice is based on sound legal grounds and that a reasonable possibility exists that this matter will be resolved in favor of the company. Otherwise, as the next step, the Company will discuss the Infringement Notice before the Brazilian Justice Courts.
76
Table of Contents
CELULOSA ARAUCO Y CONSTITUCION S.A.
AND SUBSIDIARIES
Unaudited Consolidated Financial Statements
December 31, 2017
Amounts in thousands of U.S. dollars, except as indicated
Forestal Arauco S.A.
1. Maquinarias y Equipos Klenner Limitada filed a civil damages claim before the First Civil Court of Valdivia, Case File numberC-375-2015, against Forestal Arauco S.A. The claim seeks compensation for alleged damages brought as a result of the termination of a service provision contract that took place on February 9, 2010. The plaintiff valued the damages in the amount of $4,203,216,164 (equivalent to ThU.S.$ 6,837, as of December 31, 2017).
On November 14, 2016, the lower court issued a ruling partially upholding the claim, convicting Forestal Arauco S.A. to pay the sum of $115,026,673 (equivalent to ThU.S.$ 187 as of December 31, 2017) as general damage, and the sum of $607,849,413 (equivalent to ThU.S.$ 989 as of December 31, 2017) for loss profit, rejecting the claim for alleged moral damage, all without ordering the payment of litigation expenses.
Forestal Arauco S.A. challenged the ruling filing a cassation remedy based on procedural violations as well as an appeal. The plaintiff also challenged the ruling through an appeal. On August 14, 2017, the Court of Appeals decided to only uphold the appeal filed by Forestal Arauco S.A., dismissing the claim in its entirety.
On September 1, 2017, the plaintiff challenged the decision rendered by the Court of Appeals, filing a formal cassation appeal and a cassation appeal on the merits before the Supreme Court. Proceedings pending.
Considering that the Company’s position is based on solid legal grounds, there is a reasonable margin for obtaining a favorable result for the Company and therefore, as of December 31, 2017, Arauco has not made any provision whatsoever in connection to this contingency.
2. On April 28, 2015, the company was notified of and answered the action for recovery submitted in ordinary proceedings by Mr. Rodrigo Huanquimilla Arcos and Mr. Mario Andrades Rojas, attorneys at law, on behalf of 24 members of the Arcos succession, who claiming to be owners of the estate that they identify as Hacienda Quivolgo, of 5,202 hectares, request that Forestal Celco S.A., currently Forestal Arauco S.A., be sentenced to return the above mentioned real property plus civil and natural fruits or revenues as well as any estates adhered to it, along with any damages that the real property may have suffered, with litigation costs. The company proceeded to answer the claim requesting that it be completely rejected, arguing that Forestal Celco S.A., currently Forestal Arauco S.A., is the sole and legitimate owner of the real property.
The Court ordered that this trial be joined with those entertained under Case FileC-54-2015, suspending the proceeding and ordering the parties to appoint a joint representative to act on behalf of both parties. The attorneys for both claimant parties conferred reciprocal powers to each other, and thus the Court deemed they had fulfilled the legal requirement.
On December 9, 2016, the Court summoned the parties for the issuance of the ruling. On February 24, 2017, the first instance final ruling was notified, which ruling dismissed the claim in its entirety, and imposed the payment of court costs. On March 8, 2017, the claimant appealed against the first instance decision. Currently, the case is pending before the Court of Appeals, with the decree declaring that the case is ready to be heard by the Court being issued on April 12. Pending (Court of Appeals of Talca Case FileNo. 949-2017).
Considering that the Company’s position is based on solid legal grounds, there is a reasonable margin for obtaining a favorable result for the Company and therefore, as of December 31, 2017, Arauco has not made any provision whatsoever in connection to this contingency.
77
Table of Contents
CELULOSA ARAUCO Y CONSTITUCION S.A.
AND SUBSIDIARIES
Unaudited Consolidated Financial Statements
December 31, 2017
Amounts in thousands of U.S. dollars, except as indicated
3. On April 6, 2015, the company was notified through a rogatory letter regarding the claim submitted by Mr. Gustavo Andrés Ochagavía Urrutia, attorney at law, acting on behalf of 23 members of the Arcos succession, who claim to be the owners of the estate that they identify as Hacienda Quivolgo, of 5,202 hectares, requesting that Forestal Celco S.A., currently Forestal Arauco S.A., be ordered to return the above mentioned real property plus civil and natural fruits or revenues as well as any estates adhered to it, along with any damages that the real property may have suffered, with litigation costs. They base their claim in that Forestal Celco S.A., currently Forestal Arauco S.A., is allegedly in possession but does not own the real property in question. On April 28, 2014, the company proceeded to answer the claim requesting that it be completely rejected, arguing that Forestal Celco S.A., currently Forestal Arauco S.A., is the sole and legitimate owner of the real property.
On January 8, 2016, the defendant requested a consolidation of the proceedings with Case file334-2014, as well as the suspension of the proceedings until this request is decided upon. The Court ordered this case file to be joined with the proceedings of case file No.C-334-2014 of the Civil Court of Constitución.
On February 24, 2017, the final ruling of the lower court was notified, completely dismissing the claim, with litigation costs.
On March 8, 2017, the plaintiff filed an appeal against the lower court final ruling. Currently, the case is pending before the Court of Appeals, with the decree declaring that the case is ready to be heard by the Court being issued on April 12. Pending (Court of Appeals of Talca Case FileNo. 949-2017).
Considering that the Company’s position is based on solid legal grounds, there is a reasonable margin for obtaining a favorable result for the Company and therefore, as of December 31, 2017, Arauco has not made any provision whatsoever in connection to this contingency.
4. On August 24, 2017, the company was notified of a civil claim for recovery in ordinary proceedings, filed by Mrs. Carmen Muñoz Domínguez on behalf of Forestal Ezrece S.A. The plaintiff argues that its client would be the rightful owner – as a result of an assignment and sale – of 87.5% of the hereditary rights in the rural real estate property called “Pino Huacho,” located in the boroughs of Los Alamos and of Cañete, province of Lebu, Eighth Region, for a surface area amounting to 5,144.22 hectares, which actions would be under the possession of Forestal Arauco S.A. The claimant has requested the court to order Forestal Arauco S.A. to be sentenced to restitute these actions and rights. Forestal Arauco S.A. answered the claim, requesting its total dismissal, with litigation costs, and further filing a counterclaim based on the ordinary prescription and, in lieu thereof, based on extraordinary prescription.
Currently, and with the discussion period in both the main claim and the counterclaim having expired, the processing of the trial has been suspended as a consequence of a decree issued by the Court of Appeals of Concepción, which is currently entertaining an application for leave to appeal filed by Forestal Arauco S.A., stemming from the dismissal of the appeal lodged against the resolution that upheld only partially the motion for reconsideration filed in respect of the evidence production ruling. Proceedings pending (Case FileC-109-2017. Civil and Criminal Court of Lebu).
78
Table of Contents
CELULOSA ARAUCO Y CONSTITUCION S.A.
AND SUBSIDIARIES
Unaudited Consolidated Financial Statements
December 31, 2017
Amounts in thousands of U.S. dollars, except as indicated
Considering that the Company’s position is based on solid legal grounds, there is a reasonable margin for obtaining a favorable result for the Company and therefore, as of December 31, 2017, Arauco has not made any provision whatsoever in connection to this contingency.
At the end of each reporting period there are no other contingencies that might significantly affect the Company’s financial, position or results of operations.
Provisions recorded as of December 31, 2017 and December 31, 2016 are as follows:
| 12-31-2017 | 12-31-2016 | |||||||
Classes of Provisions | ThU.S.$ | ThU.S.$ | ||||||
Provisions, Current | 2,728 | 842 | ||||||
Provisions for litigations | 616 | 427 | ||||||
Other provisions | 2,112 | 415 | ||||||
Provisions,non-Current | 36,008 | 38,138 | ||||||
Provisions for litigations | 12,556 | 14,696 | ||||||
Other provisions | 23,452 | 23,442 | ||||||
|
|
|
| |||||
Total Provisions | 38,736 | 38,980 | ||||||
|
|
|
| |||||
79
Table of Contents
CELULOSA ARAUCO Y CONSTITUCION S.A.
AND SUBSIDIARIES
Unaudited Consolidated Financial Statements
December 31, 2017
Amounts in thousands of U.S. dollars, except as indicated
| 12-31-2017 | ||||||||||||
Movements in Provisions | Litigations (*) ThU.S.$ | Other Provisions (**) ThU.S.$ | Total ThU.S.$ | |||||||||
Opening balance | 15,123 | 23,857 | 38,980 | |||||||||
Changes in provisions | ||||||||||||
Increase in existing provisions | 1,314 | 16 | 1,330 | |||||||||
Increase through business combinations | — | 2,106 | 2,106 | |||||||||
Used provisions | (1,578 | ) | — | (1,578 | ) | |||||||
Increase (decrease) in foreign currency exchange | (1,493 | ) | — | (1,493 | ) | |||||||
Other Increases (Decreases) | (193 | ) | (416 | ) | (609 | ) | ||||||
Total Changes | (1,950 | ) | 1,706 | (244 | ) | |||||||
Closing balance | 13,173 | 25,563 | 38,736 | |||||||||
|
|
|
|
|
| |||||||
| (*) | The increase in legal claims is composed mainly of ThU.S.$908 and ThU.S.$375 Brazilian and Argentine subsidiaries respectively) in connection with civil and labor lawsuits. |
| (**) | The change in Other Increases (Decreases) in Other provisions is due to a reverse of the provision in Zona Franca Punta Pereira (Uruguay). The increase through business combination corresponds to the acquisition of Arauco Industrias de Paineis |
| 12-31-2016 | ||||||||||||
Movements in Provisions | Litigations (*) ThU.S.$ | Other Provisions (**) ThU.S.$ | Total ThU.S.$ | |||||||||
Opening balance | 11,400 | 23,999 | 35,399 | |||||||||
Changes in provisions | ||||||||||||
Increase in existing provisions | 5,363 | 1 | 5,364 | |||||||||
Used provisions | (998 | ) | (39 | ) | (1,037 | ) | ||||||
Increase (decrease) in foreign currency exchange | (609 | ) | — | (609 | ) | |||||||
Other Increases (Decreases) | (33 | ) | (104 | ) | (137 | ) | ||||||
Total Changes | 3,723 | (142 | ) | 3,581 | ||||||||
Closing balance | 15,123 | 23,857 | 38,980 | |||||||||
|
|
|
|
|
| |||||||
| (*) | The increase in legal claims is composed mainly of ThU.S.$ 863 and ThU.S.$ 2,255 (Brazilian and Argentine subsidiaries respectively) in connection with civil and labor lawsuits, and ThU.S.$1,490 from Arauco Argentina in connection of fees in lawsuits. |
| (**) | The change in Other Increases (Decreases) in Other provisions is due to a reverse of the ThU.S.$ 100 corresponding to Arauco Argentina. |
Provisions for litigations are related to labor and tax claims whose payment period is uncertain. Other provisions mainly include the recognition of a liability related to investments in associates and joint ventures accounted under the equity method with net asset deficiency at the end of the reporting period.
80
Table of Contents
CELULOSA ARAUCO Y CONSTITUCION S.A.
AND SUBSIDIARIES
Unaudited Consolidated Financial Statements
December 31, 2017
Amounts in thousands of U.S. dollars, except as indicated
NOTE 19. INTANGIBLE ASSETS
Classes of Intangible Assets, Net | 12-31-2017 ThU.S.$ | 12-31-2016 ThU.S.$ | ||||||
Intangible assets, net | 88,615 | 89,497 | ||||||
Computer software | 26,747 | 26,370 | ||||||
Water rights | 5,697 | 5,689 | ||||||
Customer | 47,144 | 50,982 | ||||||
Other identifiable intangible assets | 9,027 | 6,456 | ||||||
|
|
|
| |||||
Classes of intangible Assets, Gross | 173,426 | 159,025 | ||||||
Computer software | 81,907 | 72,008 | ||||||
Water rights | 5,697 | 5,689 | ||||||
Customer | 72,685 | 71,275 | ||||||
Other identifiable intangible assets | 13,137 | 10,053 | ||||||
|
|
|
| |||||
Classes of accumulated amortization and impairment | ||||||||
Total accumulated amortization and impairment | (84,811 | ) | (69,528 | ) | ||||
Accumulated amortization and impairment, intangible assets | (84,811 | ) | (69,528 | ) | ||||
Computer software | (55,160 | ) | (45,638 | ) | ||||
Customer | (25,541 | ) | (20,293 | ) | ||||
Other identifiable intangible assets | (4,110 | ) | (3,597 | ) | ||||
|
|
|
| |||||
Reconciliation of the carrying amount of intangible assets at the beginning and end of each reporting period balances
| 12-31-2017 | ||||||||||||||||||||
Reconciliation of intangible assets | Computer Software ThU.S.$ | Water Rights ThU.S.$ | Customer ThU.S.$ | Others ThU.S.$ | TOTAL ThU.S.$ | |||||||||||||||
Opening Balance | 26,370 | 5,689 | 50,982 | 6,456 | 89,497 | |||||||||||||||
Changes | ||||||||||||||||||||
Additions | 7,487 | 8 | — | 2,973 | 10,468 | |||||||||||||||
Additions through business combination | 320 | — | — | — | 320 | |||||||||||||||
Disposals | (181 | ) | — | — | — | (181 | ) | |||||||||||||
Amortization | (8,122 | ) | — | (4,797 | ) | (408 | ) | (13,327 | ) | |||||||||||
Increase (Decrease) related to foreign currency translation | 873 | — | 959 | (96 | ) | 1,736 | ||||||||||||||
Other Increases (Decreases) | — | — | — | 102 | 102 | |||||||||||||||
Changes Total | 377 | 8 | (3,838 | ) | 2,571 | (882 | ) | |||||||||||||
Closing Balance | 26,747 | 5,697 | 47,144 | 9,027 | 88,615 | |||||||||||||||
|
|
|
|
|
|
|
|
|
| |||||||||||
| 12-31-2016 | ||||||||||||||||||||
Reconciliation of intangible assets | Computer Software ThU.S.$ | Water Rights ThU.S.$ | Customer ThU.S.$ | Others ThU.S.$ | TOTAL ThU.S.$ | |||||||||||||||
Opening Balance | 21,251 | 5,485 | 55,265 | 6,111 | 88,112 | |||||||||||||||
Changes | ||||||||||||||||||||
Additions | 12,935 | 204 | — | 1,718 | 14,857 | |||||||||||||||
Disposals | (1 | ) | — | — | — | (1 | ) | |||||||||||||
Amortization | (8,368 | ) | — | (4,770 | ) | (1,414 | ) | (14,552 | ) | |||||||||||
Increase (Decrease) related to foreign currency translation | 178 | — | 487 | 41 | 706 | |||||||||||||||
Other Increases (Decreases) | 375 | — | — | — | 375 | |||||||||||||||
Changes Total | 5,119 | 204 | (4,283 | ) | 345 | 1,385 | ||||||||||||||
Closing Balance | 26,370 | 5,689 | 50,982 | 6,456 | 89,497 | |||||||||||||||
|
|
|
|
|
|
|
|
|
| |||||||||||
| Years of Useful life (Average) | ||||
Computer Software | 5 | |||
Customer | 15 | |||
Brands | 7 | |||
The amortization of customer and computer software is presented in the Consolidated Statements of Profit or Loss under the “Administrative Expenses” line item.
81
Table of Contents
CELULOSA ARAUCO Y CONSTITUCION S.A.
AND SUBSIDIARIES
Unaudited Consolidated Financial Statements
December 31, 2017
Amounts in thousands of U.S. dollars, except as indicated
NOTE 20. BIOLOGICAL ASSETS
Biological assets comprise forestry plantations, mainly radiata and taeda pine, and to a lesser extent eucalyptus. The plantations are located in Chile, Argentina, Brazil and Uruguay, with a total surface of 1.7 million hectares as of December 31, 2017 out of which 1 million hectares are used for forestry planting, 431 thousand hectares are native forest, 195 thousand hectares are used for other purposes and 99 thousand hectares not yet planted.
As of December 31, 2017, the production volume of logs totaled 20.7 million m3 (18.7 million m3 as of December 31, 2016).
Measurements of fair value of Arauco’s biological assets are classified as Level 3, due to the fact that inputs are not observable. However, this information reflects the assumptions that market participants would use in pricing the asset, including assumptions about risk.
These unobservable inputs were developed using the best information available and includes internal data from Arauco. These unobservable inputs can be adjusted if the available information indicates that other market participants would use different information or there is something specific in Arauco that is not available to other market participants.
The main considerations in determining the fair value of biological assets include the following:
| • | Arauco uses discounted expected future cash flows of its forest plantations, which are based on a harvest projection date for all existing plantations. |
| • | Current forestry plantations are projected based on a net volume that will not decrease, with a minimum growth equivalent to the current supply demand. |
| • | Future plantations are not considered. |
| • | The harvest of forestry plantations supplies raw materials for all other products that Arauco produces and trades. By directly controlling the development of forests that will be processed, Arauco ensures high quality timber for each of its products. |
| • | Expected cash flows are determined in terms of harvest and expected sale of forestry products, associated with the demand from the Company’s own industrial centers and sales to third parties at market prices. Sales margin of the different products that are harvested in the forest is also considered in the valuation. The changes in the value of the plantations pursuant to the criteria defined above are accounted for in the results for the fiscal year, as established in IAS 41. These changes are presented in the Consolidated Statements of Profit or Loss under the line item Other income per function, which as of December 31, 2017 amounted to ThU.S.$83,031 (ThU.S.$ 208,562 as of December 31, 2016). The appraisal of biological assets resulted in a greater cost of the lumber sold in comparison to the real incurred cost, which is presented included in the cost of sales which as of December 31, 2017 amounted to ThU.S.$213,234 (ThU.S.$204,971 as of December 31, 2016). |
| • | Forestry plantations are harvested according to the needs of Arauco’s production plants. |
82
Table of Contents
CELULOSA ARAUCO Y CONSTITUCION S.A.
AND SUBSIDIARIES
Unaudited Consolidated Financial Statements
December 31, 2017
Amounts in thousands of U.S. dollars, except as indicated
| • | The discount rates used are 7.5% in Chile (8% at 2016), 8% Brazil and Uruguay, and 12% in Argentina. |
| • | It is expected that prices of harvested timber are constant in real terms based on market prices. |
| • | Cost expectations with respect to the lifetime of the forests are constant based on estimated costs included in the projections made by Arauco. |
| • | The average crop age by species and country is: |
| Chile | Argentina | Brazil | Uruguay | |||||||||||||
Pine | 24 | 15 | 15 | — | ||||||||||||
Eucalyptus | 12 | 10 | 7 | 10 | ||||||||||||
The following table sets forth changes in fair value of biological assets considering variations in significant assumptions considered in calculating the fair value of the assets:
| ThU.S.$ | ||||||||
Discount rate | 0,5 | (98,304 | ) | |||||
| -0,5 | 103,444 | |||||||
Margins (%) | 10 | 370,058 | ||||||
| -10 | (370,058 | ) | ||||||
The adjustment to fair value of biological assets is recorded in the Consolidated Statements of Profit or Loss, under the line item Other Income or Other Expenses, depending on whether it corresponds to profits or losses.
Forestry plantations classified as current Biological assets are those to be harvested and sold within twelve months after the reporting period.
The Company has contracted fire insurance policies for its forestry plantatios, which in conjunction with the Company’s resources, allow risks to be minimized.
Detail of Biological Assets Pledged as Security
As of December 31, 2017, there are no forestry plantations pledged as security.
Detail of Biological Assets with Restricted Ownership
As of the date of these consolidated financial statements, there are no biological assets with restricted ownership.
No significant government grants have been received.
83
Table of Contents
CELULOSA ARAUCO Y CONSTITUCION S.A.
AND SUBSIDIARIES
Unaudited Consolidated Financial Statements
December 31, 2017
Amounts in thousands of U.S. dollars, except as indicated
Current andNon-Current Biological Assets
As of the date of these consolidated financial statements, the Current andNon-current biological assets are as follows:
| 12-31-2017 ThU.S.$ | 12-31-2016 ThU.S.$ | |||||||
Current | 307,796 | 306,117 | ||||||
Non-current | 3,459,146 | 3,592,874 | ||||||
Total | 3,766,942 | 3,898,991 | ||||||
|
|
|
| |||||
84
Table of Contents
CELULOSA ARAUCO Y CONSTITUCION S.A.
AND SUBSIDIARIES
Unaudited Consolidated Financial Statements
December 31, 2017
Amounts in thousands of U.S. dollars, except as indicated
Reconciliation of carrying amount of biological assets
Movement | 12-31-2017 ThU.S.$ | |||
Opening Balance | 3,898,991 | |||
Changes in Biological Assets | ||||
Additions through acquisition and costs of new plantations | 310,249 | |||
Sales | (5,289 | ) | ||
Harvest | (341,108 | ) | ||
Gain (losses) arising from changes in fair value less costs to sale | 83,031 | |||
Increases (decreases) in Foreign Currency Translation | (5,792 | ) | ||
Loss of forest due to fires | (173,139 | ) | ||
Other Increases (decreases) | (1 | ) | ||
Total Changes | (132,049 | ) | ||
Closing Balance | 3,766,942 | |||
|
| |||
Movement | 12-31-2016 ThU.S.$ | |||
Opening Balance | 3,826,597 | |||
Changes in Biological Assets | ||||
Additions through acquisition and costs of new plantations | 137,439 | |||
Sales | (1,351 | ) | ||
Harvest | (326,494 | ) | ||
Gain (losses) arising from changes in fair value less costs to sale | 208,562 | |||
Increases (decreases) in Foreign Currency Translation | 69,068 | |||
Loss of forest due to fires | (15,193 | ) | ||
Other Increases (decreases) | 363 | |||
Total Changes | 72,394 | |||
Closing Balance | 3,898,991 | |||
|
| |||
In January 2017, Arauco was affected by fires that consumed 72,564 hectares of forest plantations, recorded in the balance sheet in MU.S.$ 210, representing 5.6% of the value of Arauco’s forestry plantations.
The affected plantations have been managed by the company in order to minimize the damage caused by the fires. This management has allowed for the recovery of 17.6% of the afore mentioned amount of MU.S.$210. Additionally, the forest plantations affected by the fires were insured, with their corresponding deductibles and limitations. As a consequence of the above, the sum recovered from the insurance company amounted to MU.S$ 35.
As of the date of these consolidated financial statements, there are no disbursements related to the acquisition of biological assets.
85
Table of Contents
CELULOSA ARAUCO Y CONSTITUCION S.A.
AND SUBSIDIARIES
Unaudited Consolidated Financial Statements
December 31, 2017
Amounts in thousands of U.S. dollars, except as indicated
NOTE 21. ENVIRONMENTAL MATTERS
Environment Management
For Arauco, sustainability means management strategy. This strategy incorporates values, commitments and standards, that together with the adoption of best practices as well as the use of the latest available technologies, seek to continuously improve the Company’s environmental management. It is the environmental department and each of its specialists that ensure these guidelines are met and are put in to practice in everyday company operations.
All of Arauco’s production units have certified environmental management systems, which reinforce the Company’s commitment to environmental performance and ensure the traceability of all raw materials used.
Arauco uses several supplies in its productive processes such as wood, chemical products, and water, etc., which in turn produce liquid and gas emissions. As a way to make the Company’s environmental management more efficient, significant progress has been made to reduce consumption and emissions.
Environmental investments have been made related to the control of atmospheric emissions, process improvements, water and waste management, as well as effluent treatment, in order to improve the environmental performance of all of Arauco’s business units.
These investments are reflected in the Consolidated Financial Statements as Properties, Plants and Equipment when they refer to disbursements in major works executed and are reflected in Expenses when they refer to improvements or management not directly associated with investment projects.
Detail information of disbursements related to the environment
As of December 31, 2017 and December 31, 2016 Arauco has made and / or has committed the following disbursements by major environmental projects:
86
Table of Contents
CELULOSA ARAUCO Y CONSTITUCION S.A.
AND SUBSIDIARIES
Unaudited Consolidated Financial Statements
December 31, 2017
Amounts in thousands of U.S. dollars, except as indicated
12-31-2017 | Disbursements undertaken 2017 | Committed Disbursements | ||||||||||||||||||
Company | Name of project | State of | Amount ThU.S.$ | Asset | Asset/expense | Amount ThU.S.$ | Estimated date | |||||||||||||
Arauco Do Brasil S.A. | Environmental improvement studies | In process | 1,008 | Assets | Property, plant and equipment | 48 | 2018 | |||||||||||||
Arauco Do Brasil S.A. | Environmental improvement studies | In process | 1,058 | Expense | Administration expenses | 296 | 2018 | |||||||||||||
Celulosa Arauco Y Constitucion S.A. | Investment projects for the control and management of gas emissions from industrial process | In process | 5,811 | Assets | Property, plant and equipment | 4,068 | 2018 | |||||||||||||
Celulosa Arauco Y Constitucion S.A. | Environmental improvement studies | In process | 17,435 | Assets | Property, plant and equipment | 20,694 | 2018 | |||||||||||||
Celulosa Arauco Y Constitucion S.A. | Environmental improvement studies | Finished | 10,326 | Assets | Property, plant and equipment | — | — | |||||||||||||
Celulosa Arauco Y Constitucion S.A. | Investment projects for the control and management of hazardous liquids and water energy optimization of industrial plants | In process | 47,512 | Assets | Property, plant and equipment | 17,837 | 2018 | |||||||||||||
Celulosa Arauco Y Constitucion S.A. | Environmental improvement studies | In process | 26,578 | Expense | Operating cost | 6,214 | 2018 | |||||||||||||
Arauco Argentina S.A. | Construction emisario | In process | 2,312 | Assets | Property, plant and equipment | 797 | 2018 | |||||||||||||
Arauco Argentina S.A. | Expansion of solid industrial waste dumpsite for management of these in the future | In process | 139 | Assets | Property, plant and equipment | 28 | 2018 | |||||||||||||
Arauco Argentina S.A. | Investment projects for the control and management of hazardous liquids and water energy optimization of industrial plants | In process | 19 | Assets | Property, plant and equipment | 5,921 | 2018 | |||||||||||||
Maderas Arauco S.A. | Investment projects for the control and management of hazardous liquids and water energy optimization of industrial plants | In process | 432 | Expense | Administration expenses | — | 2018 | |||||||||||||
Maderas Arauco S.A. | Expansion of solid industrial waste dumpsite for management of these in the future | In process | 1,346 | Expense | Operating cost | — | 0 | |||||||||||||
Maderas Arauco S.A. | Environmental improvement studies | In process | 89 | Assets | Property, plant and equipment | 332 | 0 | |||||||||||||
Forestal Arauco S.A. | Environmental improvement studies | In process | 983 | Expense | Administration expenses | 1,165 | 2018 | |||||||||||||
Forestal los Lagos S.A. | Environmental improvement studies | In process | 229 | Expense | Operating cost | 290 | 2018 | |||||||||||||
|
|
|
| |||||||||||||||||
| TOTAL | 115,277 | 57,690 | ||||||||||||||||||
|
|
|
| |||||||||||||||||
12-31-2016 | Disbursements undertaken 2016 | Committed Disbursements | ||||||||||||||||||
Company | Name of project | State of | Amount ThU.S.$ | Asset | Asset/expense | Amount ThU.S.$ | Estimated date | |||||||||||||
Arauco Do Brasil S.A. | Environmental improvement studies | In process | 285 | Assets | Property, plant and equipment | 417 | 2017 | |||||||||||||
Arauco Do Brasil S.A. | Environmental improvement studies | In process | 385 | Expense | Administration expenses | 1,231 | 2017 | |||||||||||||
Celulosa Arauco Y Constitucion S.A. | Investment projects for the control and management of gas emissions from industrial process | In process | 1,585 | Assets | Property, plant and equipment | 1,396 | 2017 | |||||||||||||
Celulosa Arauco Y Constitucion S.A. | Investment projects for the control and management of gas emissions from industrial process | In process | 476 | Assets | Property, plant and equipment | 8,085 | 2018 | |||||||||||||
Celulosa Arauco Y Constitucion S.A. | Environmental improvement studies | In process | 611 | Assets | Property, plant and equipment | 20,658 | 2017 | |||||||||||||
Celulosa Arauco Y Constitucion S.A. | Environmental improvement studies | Finished | 1,271 | Assets | Property, plant and equipment | — | — | |||||||||||||
Celulosa Arauco Y Constitucion S.A. | Environmental improvement studies | In process | 1,218 | Assets | Property, plant and equipment | 14,736 | 2018 | |||||||||||||
Celulosa Arauco Y Constitucion S.A. | Investment projects for the control and management of hazardous liquids and water energy optimization of industrial plants | In process | 51,703 | Assets | Property, plant and equipment | 64,450 | 2017 | |||||||||||||
Celulosa Arauco Y Constitucion S.A. | Environmental improvement studies | In process | 26,990 | Expense | Operating cost | 4,180 | 2018 | |||||||||||||
Celulosa Arauco Y Constitucion S.A. | Expansion of solid industrial waste dumpsite for management of these in the future | Finished | 144 | Assets | Property, plant and equipment | — | — | |||||||||||||
Arauco Argentina S.A | Construction emisario | In process | 8 | Assets | Property, plant and equipment | 824 | 2017 | |||||||||||||
Arauco Argentina S.A | Expansion of solid industrial waste dumpsite for management of these in the future | In process | 187 | Assets | Property, plant and equipment | 124 | 2017 | |||||||||||||
Arauco Argentina S.A | Investment projects for the control and management of hazardous liquids and water energy optimization of industrial plants | In process | 183 | Assets | Property, plant and equipment | 6,112 | 2017 | |||||||||||||
Paneles Arauco S.A. | Investment projects for the control and management of hazardous liquids and water energy optimization of industrial plants | Finished | 1,332 | Expense | Operating cost | — | — | |||||||||||||
Paneles Arauco S.A. | Expansion of solid industrial waste dumpsite for management of these in the future | Finished | 465 | Expense | Administration expenses | — | — | |||||||||||||
Paneles Arauco S.A. | Environmental improvement studies | In process | 1,217 | Assets | Property, plant and equipment | 304 | 2017 | |||||||||||||
Forestal Arauco S.A.(Ex-Forestal Celco S.A.) | Environmental improvement studies | In process | 643 | Expense | Administration expenses | 946 | 2017 | |||||||||||||
Forestal Los Lagos S.A | Environmental improvement studies | In process | 225 | Expense | Operating cost | 18 | 2017 | |||||||||||||
|
|
|
| |||||||||||||||||
| TOTAL | 88,928 | 123,481 | ||||||||||||||||||
|
|
|
| |||||||||||||||||
87
Table of Contents
CELULOSA ARAUCO Y CONSTITUCION S.A.
AND SUBSIDIARIES
Unaudited Consolidated Financial Statements
December 31, 2017
Amounts in thousands of U.S. dollars, except as indicated
NOTE 22.NON-CURRENT ASSETS HELD FOR SALE
Arauco decided to sell assets in previous years corresponding mainly to sawmills in Chile and remains committed to its sales plan.
The following table sets forth information on the main types ofnon-current assets held for sale:
| 12-31-2017 ThU.S.$ | 12-31-2016 ThU.S.$ | |||||||
Land | 160 | 160 | ||||||
Buildings | 1,122 | 1,122 | ||||||
Property, plant and equipment | 2,225 | 1,777 | ||||||
Total | 3,507 | 3,059 | ||||||
|
|
|
| |||||
As of December 31, 2017 and 2016, there were no significant effects on results related to the sale of assets held for sale.
88
Table of Contents
CELULOSA ARAUCO Y CONSTITUCION S.A.
AND SUBSIDIARIES
Unaudited Consolidated Financial Statements
December 31, 2017
Amounts in thousands of U.S. dollars, except as indicated
NOTE 23. FINANCIAL INSTRUMENTS
23.1 Classification
Arauco’s financial instruments as of December 31, 2017 and December 31, 2016, are displayed in the table below. Regarding those instruments valued at an amortized cost, as estimation of their fair value is displayed for informational purposes.
Financial Instruments Thousands of dollars | December 2017 | December 2016 | ||||||||||||||
| Carrying amount | Fair Value | Carrying amount | Fair Value | |||||||||||||
Fair value through profit or loss (held for trading) (1) | 74,849 | 74,849 | 198,582 | 198,582 | ||||||||||||
Derivatives | 1,679 | 1,679 | 3,166 | 3,166 | ||||||||||||
Mutual funds (2) | 73,170 | 73,170 | 195,416 | 195,416 | ||||||||||||
Loans and Accounts Receivables | 1,351,712 | 1,351,712 | 1,126,182 | 1,126,182 | ||||||||||||
Cash and cash equivalents (amortized cost) | 516,716 | 516,716 | 396,837 | 396,837 | ||||||||||||
Cash | 209,185 | 209,185 | 149,446 | 149,446 | ||||||||||||
Time deposits | 292,105 | 292,105 | 247,391 | 247,391 | ||||||||||||
Agreements | 15,426 | 15,426 | — | — | ||||||||||||
Accounts Receivable (net) | 830,452 | 830,452 | 715,883 | 715,883 | ||||||||||||
Trade and other receivables | 709,983 | 709,983 | 600,589 | 600,589 | ||||||||||||
Lease receivable | 13,106 | 13,106 | 764 | 764 | ||||||||||||
Other receivables | 107,363 | 107,363 | 114,530 | 114,530 | ||||||||||||
Accounts receivable due from related parties | 4,544 | 4,544 | 13,462 | 13,462 | ||||||||||||
Other Financial Assets (5) | 58,425 | 58,425 | 10,903 | 10,903 | ||||||||||||
|
|
|
|
|
|
|
| |||||||||
Financial liabilities at amortized cost (3) | 5,002,072 | 5,198,654 | 5,022,725 | 5,158,789 | ||||||||||||
Bonds issued denominated in U.S. Dollars | 2,057,746 | 2,135,893 | 2,321,980 | 2,480,063 | ||||||||||||
Bonds issued denominated in U.F. (4) | 1,244,939 | 1,333,087 | 1,130,679 | 1,078,934 | ||||||||||||
Bank Loans in U.S. Dollars | 835,099 | 870,399 | 891,338 | 926,070 | ||||||||||||
Bank borrowing denominated in U.S. Dollars | 23,358 | 23,358 | 23,020 | 23,020 | ||||||||||||
Financial leasing | 112,376 | 107,363 | 113,986 | 108,980 | ||||||||||||
Trade and other payables | 717,346 | 717,346 | 537,891 | 537,891 | ||||||||||||
Accounts payable to related parties | 11,208 | 11,208 | 3,831 | 3,831 | ||||||||||||
Financial liabilities at fair value through profit or loss | 137 | 137 | 336 | 336 | ||||||||||||
Forward | 137 | 137 | 336 | 336 | ||||||||||||
Hedging Liabilities | 5,256 | 5,256 | 87,027 | 87,027 | ||||||||||||
|
|
|
|
|
|
|
| |||||||||
| (1) | Assets measured at fair value through profit or loss other than mutual funds classified as cash equivalents, are presented in the line item “other financial assets” in the consolidated statements of financial position. |
| (2) | Although mutual funds are measured at fair value through profit or loss for purposes of the consolidated statements of financial position mutual funds are classified as “Cash and cash equivalents” due to the are highly liquid short-term investment. |
| (3) | Financial liabilities measured at amortized cost, other than “Trade and other payables” and derivatives are presented in the consolidated statements of financial position in the line item “Other financial liabilities” as current andnon-current based on their maturity. |
| (4) | The Unidad de Fomento (“U.F.”) is a unit of account that is linked to, and is adjusted daily to reflect changes in the Chilean consumer price index. |
| (5) | Includes guarantee fund for derivatives which correspond to the collateral under swap agreements. |
89
Table of Contents
CELULOSA ARAUCO Y CONSTITUCION S.A.
AND SUBSIDIARIES
Unaudited Consolidated Financial Statements
December 31, 2017
Amounts in thousands of U.S. dollars, except as indicated
23.2 Fair Value Hierarchy of Financial Assets and Liabilities
The assets and liabilities measured at fair value in the consolidated statements of financial position as of December 31, 2017, have been measured based on the valuation methodologies provided in IAS 39. The methodologies applied for each financial instrument are classified according to their hierarchy as follows:
| • | Level 1: Securities or quoted prices in active markets for identical assets and liabilities |
| • | Level 2: Inputs other than quoted prices included within Level 1 that are observable for the assets or liabilities, either directly (i.e. as prices) or indirectly (i.e. derived from prices); and |
| • | Level 3: Inputs for the assets or liabilities that are not based on observable market data (unobservable inputs). |
Financial Instruments | Fair Value December 2017 ThU.S.$ | Level 1 ThU.S.$ | Fair value Level 2 ThU.S.$ | Level 3 ThU.S.$ | ||||||||||||
Fair value through profit or loss (held for trading) | ||||||||||||||||
Derivatives | 1,679 | 1,679 | ||||||||||||||
Mutual Funds | 73,170 | 73,170 | �� | |||||||||||||
Other financial assets | 58,425 | 2,654 | 55,771 | |||||||||||||
Financial liabilities measured at amortized cost | ||||||||||||||||
Bonds issued denominated in U.S. Dollars | 2,135,893 | 2,135,893 | ||||||||||||||
Bonds issued denominated in U.F. (4) | 1,333,087 | 1,333,087 | ||||||||||||||
Bank loans in U.S. Dollars | 870,399 | 870,399 | ||||||||||||||
Bank borrowing denominated in U.S. Dollars | 23,358 | 23,358 | ||||||||||||||
Financial leasing | 107,363 | 107,363 | ||||||||||||||
Financial liabilities at fair value through profit or loss | 137 | 137 | ||||||||||||||
Hedging liabilities | 5,256 | 5,256 | ||||||||||||||
23.3 Explanation of the valuation of Financial Instruments.
Cash and cash equivalent and accounts receivable
The carrying amount of accounts receivable, cash and cash equivalents (including mutual funds), and other financial assets and liabilities approximate their fair value due to the short-term nature of such instruments.
Derivative financial instruments
Interest rate and currency swaps are valued under the cash flow discount method at the rate applicable according to the transaction’s risk, using an internal methodology based on the information obtained from Bloomberg. In this particular case, given that cross currency swaps correspond to future flows in UF and future flows in Dollars, Arauco calculates the current value of such flows by using 2 discount curves: the UF zero coupon curve and the Dollar zero coupon.
The fair value of the interest rate swap contracts is calculated by reference to the rate differential between the agreed upon rate and the market rate as of the end date of these financial statements.
The fair value of the currency forward contracts is calculated by reference to the current forward exchange rates of contracts with similar maturity profiles.
90
Table of Contents
CELULOSA ARAUCO Y CONSTITUCION S.A.
AND SUBSIDIARIES
Unaudited Consolidated Financial Statements
December 31, 2017
Amounts in thousands of U.S. dollars, except as indicated
Financial Liabilities
The fair value of bonds issued was determined with reference to quoted market prices as they have standard terms and conditions.
The fair value of bank borrowings were determined based on discounted cash flow analysis, applying the corresponding discount yield curves to the remaining term to maturity.
Disclosures of the fair value of financial liabilities at amortized cost are determined via the use of discounted cash flows, calculated over variables of the observable markets as of the date of informing the consolidated financial statements, and correspond to Level 2 of the fair value hierarchy.
The following table shows the compliance with the financial covenants (level of indebtedness, detailed in section 23.9.3), for the bonds issued prior to the year 2015, as required by domestic indentures (Chile):
| December 2017 ThU.S.$ | December 2016 ThU.S.$ | |||||||
Interest bearing loans, current (a) | 500,207 | 697,000 | ||||||
Other financial liabilities, current | 500,344 | 697,452 | ||||||
Hedging liabilities current + Financial liabilities at fair value through profit or loss current | 137 | 452 | ||||||
Interest bearing loans,non-current (b) | 3,773,311 | 3,784,003 | ||||||
Other financial liabilities,non-current | 3,778,567 | 3,870,914 | ||||||
Hedging liabilitiesnon-current + Financial liabilities at fair value through profit or lossnon-current | 5,256 | 86,911 | ||||||
Financial debt total (c) | 4,273,518 | 4,481,003 | ||||||
Cash and cash equivalents | 589,886 | 592,253 | ||||||
Other financial assets current | 3,504 | 5,201 | ||||||
Total, Cash (d) | 593,390 | 597,454 | ||||||
Net Financial Debt (e) | 3,680,128 | 3,883,549 | ||||||
Non-controlling interests | 7,074,973 | 6,955,251 | ||||||
Equity attributable to owners of parent | 41,920 | 44,032 | ||||||
Total, Equity (f) | 7,116,893 | 6,999,283 | ||||||
Debt to equity ratio (g) | 0.52 | 0.55 | ||||||
| (a) | Other Current Financial Liabilities – (Current Hedge Liabilities + Financial Liabilities with changes in current results) |
| (b) | OtherNon-Current Financial Liabilities –(Non-current Hedge Liabilities + Financial Liabilities with changes innon-current results) |
| (c) | Interest bearing loans, current + Interest bearing loans,non-current |
| (d) | Cash and Cash Equivalents + Other Current Financial Assets |
| (e) | Total Financial Debt – Total Cash |
| (f) | Equity attributable to owners of controlling parent +Non-controlling interests |
| (g) | Net Financial Debt / Total Equity |
Note: As of December 31, 2017 the amount for the financial Liabilities with changes innon-current profits and losses is zero, current hedging liabilities and financial liabilities at fair value through profit or loss are ThU.S.$ 137.
91
Table of Contents
CELULOSA ARAUCO Y CONSTITUCION S.A.
AND SUBSIDIARIES
Unaudited Consolidated Financial Statements
December 31, 2017
Amounts in thousands of U.S. dollars, except as indicated
The following table shows the compliance with the financial covenants (level of indebtedness, detailed in section 23.9.3), for the bonds issued after year 2015, as required by domestic indentures (Chile):
| December 2017 ThU.S.$ | December 2016 ThU.S.$ | |||||||
Other financial liabilities (a) | 4,278,911 | 4,568,366 | ||||||
Other financial liabilities, current | 500,344 | 697,452 | ||||||
Other financial liabilities,non-current | 3,778,567 | 3,870,914 | ||||||
Financial liabilities at fair value through profit or loss | 137 | 336 | ||||||
Hedging liabilities (b) | 5,256 | 87,027 | ||||||
Swaps | 5,248 | 86,895 | ||||||
Forward | 8 | 132 | ||||||
Financial debt total (c) | 4,273,518 | 4,481,003 | ||||||
Cash and cash equivalents | 589,886 | 592,253 | ||||||
Total, Cash (d) | 589,886 | 592,253 | ||||||
Net Financial Debt (e) | 3,683,632 | 3,888,750 | ||||||
Non-controlling interests | 7,074,973 | 6,955,251 | ||||||
Equity attributable to owners of parent | 41,920 | 44,032 | ||||||
Total, Equity (f) | 7,116,893 | 6,999,283 | ||||||
Debt to equity ratio (g) | 0.52 | 0.56 | ||||||
| (a) | Other Financial Liabilities current + Other Financial Liabilitiesnon-current |
| (b) | Swaps + Forwards + Options |
| (c) | Other financial liabilities +Financial liabilities at fair value through profit or loss + Hedging liabilities |
| (d) | Cash and Cash Equivalents + Other Current Financial Assets |
| (e) | Total Financial Debt – Total Cash |
| (f) | Equity attributable to owners of controlling parent +Non-controlling interests |
| (g) | Net Financial Debt / Total Equity |
92
Table of Contents
CELULOSA ARAUCO Y CONSTITUCION S.A.
AND SUBSIDIARIES
Unaudited Consolidated Financial Statements
December 31, 2017
Amounts in thousands of U.S. dollars, except as indicated
The following table sets forth a reconciliation between the financial liabilities and the consolidated statements of financial position as of December 31, 2017 and 2016:
Thousands of dollars | December 2017 | |||||||||||||||||||||||||||
| Up to 90 days | From 91 days to 1 year | Other current financial liabilities, Total | From 13 months to 5 years | More than 5 years | Other non-current financial liabilities, Total | Total | ||||||||||||||||||||||
Bonds obligations | 28,013 | 34,981 | 62,994 | 1,054,926 | 2,184,765 | 3,239,691 | 3,302,685 | |||||||||||||||||||||
Bank borrowing | 110,700 | 282,172 | 392,872 | 327,424 | 138,161 | 465,585 | 858,457 | |||||||||||||||||||||
Financial Leasing | 9,928 | 34,413 | 44,341 | 68,035 | — | 68,035 | 112,376 | |||||||||||||||||||||
Swap and Forward | 137 | — | 137 | 5,256 | — | 5,256 | 5,393 | |||||||||||||||||||||
|
|
|
|
|
|
|
|
|
|
|
|
|
| |||||||||||||||
Other Financial Liabilities, Total (a) | 148,778 | 351,566 | 500,344 | 1,455,641 | 2,322,926 | 3,778,567 | 4,278,911 | |||||||||||||||||||||
|
|
|
|
|
|
|
|
|
|
|
|
|
| |||||||||||||||
Thousands of dollars | December 2017 | |||||||||||||||||||||||||||
| Up to 90 days | From 91 days to 1 year | Total Current | From 13 months to 5 years | More than 5 years | Total non-current | Total | ||||||||||||||||||||||
Trades and other payables | 717,342 | 4 | 717,346 | — | — | — | 717,346 | |||||||||||||||||||||
Accounts payable to related companies | 11,208 | — | 11,208 | — | — | — | 11,208 | |||||||||||||||||||||
|
|
|
|
|
|
|
|
|
|
|
|
|
| |||||||||||||||
Accounts Payable, Total (b) | 728,550 | 4 | 728,554 | — | — | — | 728,554 | |||||||||||||||||||||
|
|
|
|
|
|
|
|
|
|
|
|
|
| |||||||||||||||
Total Pasivos financieros (a) + (b) | 877,328 | 351,570 | 1,228,898 | 1,455,641 | 2,322,926 | 3,778,567 | 5,007,465 | |||||||||||||||||||||
|
|
|
|
|
|
|
|
|
|
|
|
|
| |||||||||||||||
Thousands of dollars | December 2016 | |||||||||||||||||||||||||||
| Up to 90 days | From 91 days to 1 year | Other current financial liabilities, Total | From 13 months to 5 years | More than 5 years | Other non-current financial liabilities, Total | Total | ||||||||||||||||||||||
Bonds obligations | 51,874 | 409,102 | 460,976 | 1,233,603 | 1,758,079 | 2,991,682 | 3,452,658 | |||||||||||||||||||||
Bank borrowings | 134,140 | 61,483 | 195,623 | 626,384 | 92,351 | 718,735 | 914,358 | |||||||||||||||||||||
Financial leasing | 9,534 | 30,866 | 40,400 | 73,586 | — | 73,586 | 113,986 | |||||||||||||||||||||
Swap and Forward | 453 | — | 453 | 86,911 | — | 86,911 | 87,364 | |||||||||||||||||||||
|
|
|
|
|
|
|
|
|
|
|
|
|
| |||||||||||||||
Other Financial Liabilities, Total (a) | 196,001 | 501,451 | 697,452 | 2,020,484 | 1,850,430 | 3,870,914 | 4,568,366 | |||||||||||||||||||||
|
|
|
|
|
|
|
|
|
|
|
|
|
| |||||||||||||||
Thousands of dollars | December 2016 | |||||||||||||||||||||||||||
| Up to 90 days | From 91 days to 1 year | Total Current | From 13 months to 5 years | More than 5 years | Total non-current | Total | ||||||||||||||||||||||
Trades and other payables | 511,371 | 26,520 | 537,891 | — | — | — | 537,891 | |||||||||||||||||||||
Accounts payable to related companies | 3,831 | — | 3,831 | — | — | — | 3,831 | |||||||||||||||||||||
|
|
|
|
|
|
|
|
|
|
|
|
|
| |||||||||||||||
Accounts Payable, Total (b) | 515,202 | 26,520 | 541,722 | — | — | — | 541,722 | |||||||||||||||||||||
|
|
|
|
|
|
|
|
|
|
|
|
|
| |||||||||||||||
Financial Liabilities, Total (a) + (b) | 711,203 | 527,971 | 1,239,174 | 2,020,484 | 1,850,430 | 3,870,914 | 5,110,088 | |||||||||||||||||||||
|
|
|
|
|
|
|
|
|
|
|
|
|
| |||||||||||||||
93
Table of Contents
CELULOSA ARAUCO Y CONSTITUCION S.A.
AND SUBSIDIARIES
Unaudited Consolidated Financial Statements
December 31, 2017
Amounts in thousands of U.S. dollars, except as indicated
23.4 Derivative Instruments
Hedging instruments recorded as of December 31, 2017 and 2016 are cash flow hedges. Arauco uses derivatives for hedging purposes, such as cross currency swaps, currency and commodity forwards, interest rate swaps, and options. Depending on the fair value of each instrument, the position could be either an asset or a liability, and they are listed in the Statements of Financial Position under OtherNon-Current Financial Assets or OtherNon-current Financial Liabilities, respectively. The effects for the period are presented under Equity as Other Comprehensive Income or the Statements of Comprehensive Income as Finance Income or Finance Costs, net of differences in exchange rate of the hedged items and the deferred tax.
A summary of the derivative financial instruments included in the Statements of Financial Position as of the end of this period, is presented below:
Financial Instruments | 2017 Fair Value ThU.S.$ | 2016 Fair Value ThU.S.$ | ||||||
Assets at fair value through profit or loss (held for trading) | 1,679 | 3,166 | ||||||
Derivative-Uruguay (1) | 1,672 | 3,159 | ||||||
Forward-Colombia | 7 | 7 | ||||||
Hedging Assets | 55,771 | 8,658 | ||||||
Derivative-Uruguay (1) | 3,037 | 2,029 | ||||||
Cross Currency Swaps | 52,734 | 6,629 | ||||||
Financial liabilities at fair value through profit or loss | (137 | ) | (336 | ) | ||||
Forward-Colombia | (137 | ) | (267 | ) | ||||
Derivative-Uruguay (1) | — | (69 | ) | |||||
Hedging Liabilities | (5,256 | ) | (87,027 | ) | ||||
Cross Currency Swaps | (5,248 | ) | (86,895 | ) | ||||
Derivative-Uruguay (1) | (8 | ) | (132 | ) | ||||
| (1) | Includes Swap and Forward from Uruguay tables. |
23.4.1. Chile
Cross currency swaps
Arauco is exposed to the risk of variability in cash flows from changes in foreign exchange rates and inflation, mainly due to balances of assets denominated in U.S. Dollars and other currencies differente from the functional currency, which causes mismatches that could affect operating results.
94
Table of Contents
CELULOSA ARAUCO Y CONSTITUCION S.A.
AND SUBSIDIARIES
Unaudited Consolidated Financial Statements
December 31, 2017
Amounts in thousands of U.S. dollars, except as indicated
Below are the cross currency swaps that Arauco has as of December 31, 2017 and 2016 to cover the exposure to the exchange rate risk generated from bonds denominated in U.F.:
Bond | Institution | Amount U.S.$ | Amount U.F. | Starting date | Ending date | Market Value ThU.S.$ 2017 | Market Value ThU.S. 2016 | |||||||||||||||||||
F | Deutsche - U.K. | 43,618,307 | 1,000,000 | 10-30-2011 | 10-30-2021 | 213 | (4,703 | ) | ||||||||||||||||||
F | JP Morgan - N.A. | 43,618,307 | 1,000,000 | 10-30-2011 | 10-30-2021 | 306 | (4,584 | ) | ||||||||||||||||||
F | Deutsche - U.K. | 37,977,065 | 1,000,000 | 04-30-2014 | 04-30-2019 | 6,599 | 1,782 | |||||||||||||||||||
F | BBVA - Chile | 38,426,435 | 1,000,000 | 10-30-2014 | 04-30-2023 | 5,252 | 558 | |||||||||||||||||||
F | BBVA - Chile | 38,378,440 | 1,000,000 | 10-30-2014 | 04-30-2023 | 5,550 | 908 | |||||||||||||||||||
F | Santander - Chile | 37,977,065 | 1,000,000 | 10-30-2014 | 04-30-2023 | 6,051 | 1,427 | |||||||||||||||||||
F | BCI - Chile | 37,621,562 | 1,000,000 | 10-30-2014 | 04-30-2023 | 6,549 | 1,954 | |||||||||||||||||||
J | Corpbanca - Chile | 42,864,859 | 1,000,000 | 09-01-2010 | 09-01-2020 | (292 | ) | (5,505 | ) | |||||||||||||||||
J | BBVA - Chile | 42,864,859 | 1,000,000 | 09-01-2010 | 09-01-2020 | (292 | ) | (5,505 | ) | |||||||||||||||||
J | Deutsche - U.K. | 42,864,859 | 1,000,000 | 09-01-2010 | 09-01-2020 | (356 | ) | (5,590 | ) | |||||||||||||||||
J | Santander - Spain | 42,873,112 | 1,000,000 | 09-01-2010 | 09-01-2020 | (263 | ) | (5,463 | ) | |||||||||||||||||
J | BBVA - Chile | 42,864,257 | 1,000,000 | 09-01-2010 | 09-01-2020 | (152 | ) | (5,318 | ) | |||||||||||||||||
P | Corpbanca - Chile | 46,474,122 | 1,000,000 | 05-15-2012 | 11-15-2021 | (1,775 | ) | (6,355 | ) | |||||||||||||||||
P | JP Morgan - N.A. | 47,163,640 | 1,000,000 | 11-15-2012 | 11-15-2021 | (1,753 | ) | (6,157 | ) | |||||||||||||||||
P | BBVA - Chile | 42,412,852 | 1,000,000 | 11-15-2013 | 11-15-2023 | 1,854 | (2,548 | ) | ||||||||||||||||||
P | Santander - Chile | 41,752,718 | 1,000,000 | 11-15-2013 | 11-15-2023 | 2,777 | (1,591 | ) | ||||||||||||||||||
P | Deutsche - U.K. | 41,752,718 | 1,000,000 | 11-15-2013 | 11-15-2023 | 2,800 | (1,564 | ) | ||||||||||||||||||
R | Santander - Chile | 128,611,183 | 3,000,000 | 10-01-2014 | 04-01-2024 | (365 | ) | (13,815 | ) | |||||||||||||||||
R | JP Morgan - U.K. | 43,185,224 | 1,000,000 | 10-01-2014 | 04-01-2024 | 329 | (4,039 | ) | ||||||||||||||||||
R | Corpbanca - Chile | 43,277,070 | 1,000,000 | 10-01-2014 | 04-01-2024 | 327 | (4,026 | ) | ||||||||||||||||||
Q | BCI - Chile | 43,185,224 | 1,000,000 | 10-01-2014 | 04-01-2021 | 1,022 | (3,524 | ) | ||||||||||||||||||
Q | BCI - Chile | 43,196,695 | 1,000,000 | 10-01-2014 | 04-01-2021 | 1,070 | (3,443 | ) | ||||||||||||||||||
S | Santander - Chile | 201,340,031 | 5,000,000 | 11-15-2016 | 11-15-2026 | 12,035 | (3,165 | ) | ||||||||||||||||||
|
|
|
| |||||||||||||||||||||||
| 47,486 | (80,266 | ) | ||||||||||||||||||||||||
|
|
|
| |||||||||||||||||||||||
Arauco needs to minimize the risk of the exchange rate, as it holds debt in pesos, adjustable to reflect inflation. The objective of this position in the swap is to eliminate the uncertainty of the exchange rate, exchanging the flows derived from obligations expressed in adjustable pesos of the bonds described above, with flows in U.S. dollars (Arauco’s functional currency), at a fixed and determined exchange rate as of the agreement’s execution date.
Through an effectiveness test, and pursuant to IAS 39, we were able to validate that the aforementioned hedging instruments are highly effective within an acceptable range for Arauco, for the purposes of eliminating the uncertainty of the exchange rate in the commitments derived from the hedged object.
23.4.2. Colombia
Forward contracts that are in force and effect, executed by Arauco Colombia as of December 31, 2017 and 2016, are detailed in the following table:
Exchange rate | Institution | Amount ThU.S.$ | Starting date | Ending date | December 2017 Market Value ThU.S.$ | |||||||||||||||
USDCOP | BBVA Colombia | 6,000 | 10-11-2017 | 01-10-2018 | (1 | ) | ||||||||||||||
USDCOP | Corpbanca Colombia | 8,000 | 11-14-2017 | 02-13-2018 | (136 | ) | ||||||||||||||
USDCOP | Corpbanca Colombia | 2,100 | 12-21-2017 | 03-12-2018 | 7 | |||||||||||||||
|
| |||||||||||||||||||
| (130 | ) | |||||||||||||||||||
|
| |||||||||||||||||||
Exchange rate | Institution | Amount ThU.S.$ | Starting date | Ending date | December 2016 Market Value ThU.S.$ | |||||||||||||||
USDCOP | BBVA Colombia | 5,000 | 10-28-2016 | 01-11-2017 | 7 | |||||||||||||||
USDCOP | BBVA Colombia | 4,000 | 11-18-2016 | 02-09-2017 | (255 | ) | ||||||||||||||
USDCOP | BBVA Colombia | 7,000 | 12-13-2016 | 03-10-2017 | (12 | ) | ||||||||||||||
|
| |||||||||||||||||||
| (260 | ) | |||||||||||||||||||
|
| |||||||||||||||||||
95
Table of Contents
CELULOSA ARAUCO Y CONSTITUCION S.A.
AND SUBSIDIARIES
Unaudited Consolidated Financial Statements
December 31, 2017
Amounts in thousands of U.S. dollars, except as indicated
23.4.3. Uruguay
Forward
As of December 31, 2017 and 2016, Arauco Uruguay maintains the following forward contracts in force and effect for the purposes of ensuring an exchange rate for sale of dollars:
Exchange rate | Institution | Notional ThU.S.$ | December 2017 Market Value ThU.S.$ | |||||||||
UYUUSD | Banco Santander Uy | 24,000 | 1,213 | |||||||||
UYUUSD | HSBC Uruguay | 9,000 | 543 | |||||||||
|
| |||||||||||
| 1,756 | ||||||||||||
|
| |||||||||||
Exchange rate | Institution | Notional ThU.S.$ | December 2016 Market Value ThU.S.$ | |||||||||
UYUUSD | Banco Santander Uy | 16,600 | 1,633 | |||||||||
UYUUSD | Citibank U.K. | 3,200 | 150 | |||||||||
UYUUSD | HSBC Uruguay | 10,750 | 1,256 | |||||||||
|
| |||||||||||
| 3,039 | ||||||||||||
|
| |||||||||||
Arauco Uruguay’s profits and losses also face exposure to the price variation of certain fuels, as occurs with Fuel Oil N°6, which is used during the cellulose manufacturing process. In order to minimize this risk, the volatility of future flows associated to the purchase of Fuel Oil No. 6 for years 2017, 2018 and part of 2019 has been limited, through forwards of this commodity. The agreements that are in force and effect as of December 31, 2017 and 2016, are detailed below:
Commodity | Institution | Notional ThU.S.$ | December 2017 Market Value ThU.S.$ | |||||||||
Fuel Oil N°6 | JPMorgan Chase Bank, N.A. | 4,760 | 1,372 | |||||||||
Fuel Oil N°6 | DNB Bank ASA | 4,002 | 732 | |||||||||
Fuel Oil N°6 | Citibank U.K. | 761 | 112 | |||||||||
|
| |||||||||||
| 2,216 | ||||||||||||
|
| |||||||||||
Commodity | Institution | Notional ThU.S.$ | December 2016 Market Value ThU.S.$ | |||||||||
Fuel Oil N°6 | JPMorgan Chase Bank, N.A. | 5,508 | 1,059 | |||||||||
Fuel Oil N°6 | DNB Bank ASA | 2,661 | 156 | |||||||||
Fuel Oil N°6 | Citibank U.K. | 378 | 83 | |||||||||
|
| |||||||||||
| 1,298 | ||||||||||||
|
| |||||||||||
96
Table of Contents
CELULOSA ARAUCO Y CONSTITUCION S.A.
AND SUBSIDIARIES
Unaudited Consolidated Financial Statements
December 31, 2017
Amounts in thousands of U.S. dollars, except as indicated
Interest Rate Swap
In addition, Arauco Uruguay’s maintains an Interest Rate Swap in force and effect, a derivative instrument which purpose is to set the interest rate of a variable rate debt in the same currency (USD). The valuation off this instrument as of December 31, 2017, is shown below:
Exchange rate | Institution | Notional ThU.S.$ | December 2017 Market Value ThU.S.$ | |||||||
USD | DNB Bank ASA | 50,638 | 729 | |||||||
Exchange rate | Institution | Notional ThU.S.$ | December 2016 Market Value ThU.S.$ | |||||||
USD | DNB Bank ASA | 59,077 | 650 | |||||||
23.5 Loans and Receivables
Loans and receivables arenon-derivative financial assets with fixed or determinable payments that are not quoted in an active market. In the consolidated statements of financial position, they are included in line items “Cash and cash equivalents” (certain components of cash and cash equivalents), “Trade and OtherCurrent/Non-Current Receivables” and “Accounts receivable due from related parties”.
Loans and receivables are measured at amortized cost using the effective interest method and are tested for impairment. Financial assets that are classified as loans and receivables are: cash and cash-equivalents, time deposits, repurchase agreements, trade and othercurrent/non-current receivables, and accounts receivable due from related parties.
As of December 31, 2017 and 2016, there are provisions for impairment for ThU.S.$ 14,501 and ThU.S.$ 16,644, respectively.
| December 2017 ThU.S.$ | December 2016 ThU.S.$ | |||||||
Loans and Accounts Receivables | 1,351,712 | 1,126,182 | ||||||
Cash and cash equivalents | 516,716 | 396,837 | ||||||
Cash | 209,185 | 149,446 | ||||||
Time Deposits | 292,105 | 247,391 | ||||||
Agreements | 15,426 | — | ||||||
Trade and other receivables (net) | 834,996 | 729,345 | ||||||
Trade and other receivables | 709,983 | 600,589 | ||||||
Lease receivable | 13,106 | 764 | ||||||
Other receivables | 107,363 | 114,530 | ||||||
Accounts receivable due from related parties | 4,544 | 13,462 | ||||||
23.5.1. Cash and Cash Equivalents
Includes cash on hand, bank checking account balances and time deposits and other short term highly liquid investments with an original maturity of three months or less. They are short-term, highly liquid investments that are readily convertible to known amounts of cash, and which are subject to an insignificant risk of changes in value.
97
Table of Contents
CELULOSA ARAUCO Y CONSTITUCION S.A.
AND SUBSIDIARIES
Unaudited Consolidated Financial Statements
December 31, 2017
Amounts in thousands of U.S. dollars, except as indicated
The composition of cash and cash equivalents (including the balance of mutual funds displayed in this note as valuation, instruments at fair value with profit or loss) at December 31, 2017 and December 31, 2016, classified by origin coins is as follow:
| 12-31-2017 ThU.S.$ | 12-31-2016 ThU.S.$ | |||||||
Cash and Cash Equivalents | 589,886 | 592,253 | ||||||
U.S. Dollars | 501,352 | 524,426 | ||||||
Euro | 4,306 | 2,357 | ||||||
Other currencies | 61,037 | 55,069 | ||||||
Chilean pesos | 23,191 | 10,401 | ||||||
23.5.2 Time Deposits and Repurchase Agreements:The investment objective of time deposits and repurchase agreements is to maximize in the short-term the amounts of cash surpluses. These instruments are authorized by Arauco’s Investment Policy, which allows investing in fixed income securities. These instruments have a maturity of less than three months from the date of acquisition.
23.5.3 Trade and Other Receivables:Theserepresent enforceable rights for Arauco resulting from the normal course of the business.
23.5.4 Other Receivables: These correspond to receivables from sales, services or loans that are not considered within the normal course of the business.
The provision for doubtful accounts is presented as a deduction of trade and other receivables. The provision for doubtful accounts is established based on an analysis of the age of the portfolio and considering the insurance coverage on accounts receivable. Other conditions are assessed for example when there is objective evidence that Arauco will not receive payments under the original sale terms and when the customer is a party to a bankruptcy court agreement or cessation of payments, and iswritten-off when Arauco has exhausted all levels of recovery of the receivable in a reasonable time.
23.5.5 Accounts receivable due from related parties: Represent enforceable rights for Arauco resulting from the normal course of business, calling normal to the line of business, activity or purpose of exploitation and financing, and which Arauco owns anon-controlling ownership of the counterparty.
The following table sets forth trade and othercurrent/non-current receivables classified by currencies as of December 31, 2017 and December 31, 2016:
| 12-31-2017 ThU.S.$ | 12-31-2016 ThU.S.$ | |||||||
Trades and other current receivables | 814,412 | 701,610 | ||||||
U.S. Dollars | 550,674 | 489,056 | ||||||
Euros | 20,498 | 26,544 | ||||||
Other currencies | 134,238 | 77,907 | ||||||
Chilean pesos | 106,442 | 106,681 | ||||||
U.F. | 2,560 | 1,422 | ||||||
Accounts receivable from related parties, current | 3,488 | 12,505 | ||||||
U.S. Dollars | 726 | 274 | ||||||
Other currencies | 171 | 726 | ||||||
Chilean pesos | 2,192 | 10,548 | ||||||
U.F. | 399 | 957 | ||||||
Trade and othernon-current receivables | 16,040 | 14,273 | ||||||
U.S. Dollars | 4,247 | 6,895 | ||||||
Other currencies | 3,345 | 527 | ||||||
Chilean pesos | 6,692 | 5,753 | ||||||
U.F. | 1,756 | 1,098 | ||||||
Accounts receivable from related parties,non-current | 1,056 | 957 | ||||||
U.F. | 1,056 | 957 | ||||||
98
Table of Contents
CELULOSA ARAUCO Y CONSTITUCION S.A.
AND SUBSIDIARIES
Unaudited Consolidated Financial Statements
December 31, 2017
Amounts in thousands of U.S. dollars, except as indicated
23.6 Total Financial Liabilities
Arauco’s financial liabilities to the date of these consolidated financial statements are as follows:
Financial Liabilities | December 2017 ThU.S.$ | December 2016 ThU.S.$ | ||||||
Total Financial Liabilities | 5,007,465 | 5,110,088 | ||||||
Financial liabilities at fair value through profit or loss (held for trading) | 137 | 336 | ||||||
Hedging Liabilities | 5,256 | 87,027 | ||||||
Financial Liabilities Measured at Amortized Cost | 5,002,072 | 5,022,725 | ||||||
The following table sets forth the current portion of thenon-current bank borrowings and debt issued as of December 31, 2017 and 2016.
| December 2017 ThU.S.$ | December 2016 ThU.S.$ | |||||||
Bank borrowings - current portion | 92,693 | 88,028 | ||||||
Bonds issued - current portion | 107,268 | 62,506 | ||||||
Total | 199,961 | 150,534 | ||||||
|
|
|
| |||||
23.7 Financial Liabilities Measured at Amortized Cost
Financial liabilities correspond tonon-derivative financial instruments with contractual cash-flow payments that can be either fixed or variable.
Also, this category includes thosenon-derivative financial liabilities for services or goods delivered to Arauco at the end of each reporting period that have not yet been paid. These amounts are not insured and are generally paid within thirty days after being recognized.
At the end of each reporting period, Arauco includes in this category bank borrowings, bonds issued denominated in U.S. Dollars and in U.F., trade and other payables.
| Currency | 12-31-2017 | 12-31-2016 | 12-31-2017 | 12-31-2016 | ||||||||||||||||
| ThU.S.$ | ThU.S.$ | ThU.S.$ | ThU.S.$ | |||||||||||||||||
| Amortized Cost | Fair Value | |||||||||||||||||||
Total Financial Liabilities | 5,002,072 | 5,022,725 | 5,198,654 | 5,158,789 | ||||||||||||||||
Bonds Issued | U.S. Dollar | 2,057,747 | 2,321,980 | 2,135,893 | 2,480,063 | |||||||||||||||
Bonds Issued | U.F. | 1,244,938 | 1,130,679 | 1,333,087 | 1,078,934 | |||||||||||||||
Bank borrowings | U.S. Dollar | 834,908 | 891,338 | 870,399 | 926,070 | |||||||||||||||
Bank borrowings | Other currencies | 23,549 | 23,020 | 23,358 | 23,020 | |||||||||||||||
Financial Leasing | Other currencies | 96,913 | 98,316 | 92,542 | 94,052 | |||||||||||||||
Financial Leasing | Chilean pesos | 15,463 | 15,670 | 14,821 | 14,928 | |||||||||||||||
Trades and Other Payables | U.S. Dollar | 194,342 | 150,162 | 194,342 | 150,162 | |||||||||||||||
Trades and Other Payables | Euro | 8,848 | 13,034 | 8,848 | 13,034 | |||||||||||||||
Trades and Other Payables | Other currencies | 158,567 | 70,736 | 158,567 | 70,736 | |||||||||||||||
Trades and Other Payables | Chilean pesos | 333,529 | 285,359 | 333,529 | 285,359 | |||||||||||||||
Trades and Other Payables | U.F. | 22,060 | 18,600 | 22,060 | 18,600 | |||||||||||||||
Related party payables | U.S. Dollar | 1,354 | 1,969 | 1,354 | 1,968 | |||||||||||||||
Related party payables | Chilean pesos | 9,854 | 1,862 | 9,854 | 1,863 | |||||||||||||||
99
Table of Contents
CELULOSA ARAUCO Y CONSTITUCION S.A.
AND SUBSIDIARIES
Unaudited Consolidated Financial Statements
December 31, 2017
Amounts in thousands of U.S. dollars, except as indicated
The financial liabilities at amortized cost presented in the consolidated statements of financial positions as of December 31, 2017 and 2016 are as follows:
| December 2017 | ||||||||||||
| Current ThU.S.$ | Non-Current ThU.S.$ | Total ThU.S.$ | ||||||||||
Other financial liabilities | 500,207 | 3,773,311 | 4,273,518 | |||||||||
Trade and other payables | 717,346 | — | 717,346 | |||||||||
Related Party Payables | 11,208 | — | 11,208 | |||||||||
Total Financial Liabilities Measured at Amortized Cost | 1,228,761 | 3,773,311 | 5,002,072 | |||||||||
|
|
|
|
|
| |||||||
| December 2016 | ||||||||||||
| Current ThU.S.$ | Non-Current ThU.S.$ | Total ThU.S.$ | ||||||||||
Other financial liabilities | 697,000 | 3,784,003 | 4,481,003 | |||||||||
Trade and other payables | 537,891 | — | 537,891 | |||||||||
Related Party Payables | 3,831 | — | 3,831 | |||||||||
Total Financial Liabilities Measured at Amortized Cost | 1,238,722 | 3,784,003 | 5,022,725 | |||||||||
|
|
|
|
|
| |||||||
100
Table of Contents
CELULOSA ARAUCO Y CONSTITUCION S.A.
AND SUBSIDIARIES
Unaudited Consolidated Financial Statements
December 31, 2017
Amounts in thousands of U.S. dollars, except as indicated
23.8 Cash Flow Hedges Reserve Reconciliation
The following table sets forth the reconciliation balances of cash flow hedges presented in Other Comprehensive Income:
| January-December | ||||||||
| 2017 | 2016 | |||||||
| ThU.S.$ | ThU.S.$ | |||||||
Opening balance | 1,096 | (55,396 | ) | |||||
Gains (losses) on cash flow hedges | 22,212 | 84,045 | ||||||
Recycle of cash flow hedges to profit or loss | (16,965 | ) | (10,198 | ) | ||||
Income tax | (5,917 | ) | (20,055 | ) | ||||
Recycle of income tax | 4,326 | 2,700 | ||||||
Closing balance | 4,752 | 1,096 | ||||||
|
|
|
| |||||
23.9 Capital Disclosures
23.9.1 Information on Objectives, Policies and Processes applied by the Company regarding Capital Management
Arauco’s policies on capital management have the objective of:
| a) | Ensuring business continuity and normal operations in the long term; |
| b) | Ensuring funding for new investments to achieve sustainable growth over time; |
| c) | Keeping adequate capital structure considering all economic cycles that impact the business and the nature of the industry; and |
| d) | Maximizing the Company’s value and providing an adequate return to shareholders. |
23.9.2 Qualitative Information on Objectives, Policies and Processes applied by the Company regarding Capital Management
Arauco determines and manages its capital structure based on its carrying amount of equity plus its financial debt (bank borrowings and bonds issued).
23.9.3 Quantitative Information on Capital Management
The following table sets forth the financial covenants that the Company has to comply with as part of the terms of certain of its obligations:
Instrument | December 2017 ThU.S.$ | December 2016 ThU.S.$ | Interest coverage >= 2,0x | Debt level (1) <= 1,2x | ||||||||
Domestic bonds (Chile) | 1,244,939 | 1,130,679 | N/R | ✓ | ||||||||
Syndicate Loan Scotia | 199,597 | 298,967 | ✓ | ✓ | ||||||||
Syndicate Loan Banco Estado - Grayling | 130,953 | — | ✓ | ✓ | ||||||||
N/R: Not required for the financial obligation
| (1) | Debt to equity ratio (financial debt divided by equity plusnon-controlling interests) |
As of December 31, 2017 and December 31, 2016, Arauco has complied with all of its financial covenants.
101
Table of Contents
CELULOSA ARAUCO Y CONSTITUCION S.A.
AND SUBSIDIARIES
Unaudited Consolidated Financial Statements
December 31, 2017
Amounts in thousands of U.S. dollars, except as indicated
The following table sets forth the credit ratings of our debt instruments as of December 31, 2017, are as follows:
Instrument | Standard & Poor’s | Fitch Ratings | Moody’s | Feller Rate | ||||
Local bonds | - | AA- | - | AA- | ||||
Foreign bonds | BBB- | BBB | Baa3 | — |
Capitalization requirements are established based on the Company’s financial needs and on maintaining an adequate liquidity level and complying with financial covenants established in current debt arrangements. The Company manages its capital structure and makes adjustments based on the prevailing economic conditions in order to mitigate the risks associated with adverse market conditions, and based on opportunities that may arise to improve the Company’s level of liquidity.
The capitalization of Arauco as of December 31, 2017 and December 31, 2016 is as follows:
| December 2017 | December 2016 | |||||||
| ThU.S.$ | ThU.S.$ | |||||||
Equity | 7,116,893 | 6,999,283 | ||||||
Bank borrowings | 858,457 | 914,358 | ||||||
Financial leasing | 112,376 | 113,986 | ||||||
Bonds issued | 3,302,685 | 3,452,659 | ||||||
|
|
|
| |||||
Capitalization | 11,390,411 | 11,480,286 | ||||||
|
|
|
| |||||
23.10 Risk Management
Arauco’s financial instruments are exposed to various financial risks: credit risk, liquidity risk and market risk (including exchange rate risks, interest rate risks and price risks).
Arauco’s overall risk management program focuses on uncertainty in financial markets and aims to minimize potential adverse effects on Arauco’s financial profitability.
Arauco’s financial risk management is overseen by the Corporate Finance Department. This department identifies, assesses and hedges financial risks in close collaboration with Arauco’s operational units.
23.10.1 Type of Risk: Credit Risk
Description
Credit risk refers to financial uncertainty at different periods of time relating to the fulfillment of obligations with counterparties, at the time of exercising the contract rights to receive cash or other financial assets on behalf of Arauco.
102
Table of Contents
CELULOSA ARAUCO Y CONSTITUCION S.A.
AND SUBSIDIARIES
Unaudited Consolidated Financial Statements
December 31, 2017
Amounts in thousands of U.S. dollars, except as indicated
Explanation of Credit Risk Exposure and How This Risk Arises
Arauco’s exposure to credit risk is directly related to each of its customer’s individual abilities to fulfill their contractual commitments, reflected in trade receivables.
Accounts exposed to credit risk are: trade receivable, financial lease debtors and other debtors.
Arauco does not have a securitized portfolio.
| December 2017 | December 2016 | |||||||
| ThU.S.$ | ThU.S.$ | |||||||
Current Receivables | ||||||||
Trade receivables | 706,485 | 598,597 | ||||||
Financial lease receivables | 11,932 | 411 | ||||||
Other debtors | 95,995 | 102,602 | ||||||
Net subtotal | 814,412 | 701,610 | ||||||
Trade receivables | 715,217 | 609,102 | ||||||
Financial lease receivables | 12,033 | 512 | ||||||
Other debtors | 101,663 | 108,640 | ||||||
Gross subtotal | 828,913 | 718,254 | ||||||
Provision for doubtful trade receivables | 8,732 | 10,505 | ||||||
Provision for doubtful lease receivables | 101 | 101 | ||||||
Provision for doubtful other debtors | 5,668 | 6,038 | ||||||
Subtotal Bad Debt | 14,501 | 16,644 | ||||||
Non-Current Receivables | ||||||||
Trade receivables | 3,498 | 1,992 | ||||||
Financial lease receivables | 1,174 | 353 | ||||||
Other debtors | 11,368 | 11,928 | ||||||
Net Subtotal | 16,040 | 14,273 | ||||||
Trade receivables | 3,498 | 1,992 | ||||||
Financial lease receivables | 1,174 | 353 | ||||||
Other debtors | 11,368 | 11,928 | ||||||
Gross subtotal | 16,040 | 14,273 | ||||||
Provision for doubtful trade receivables | — | — | ||||||
Provision for doubtful lease receivables | — | — | ||||||
Provision for doubtful other debtors | — | — | ||||||
Subtotal Bad Debt | — | — | ||||||
Explanation of Risk Management Objectives, Policies and Processes, and Measurement Methods
The Credit and CollectionsSub-Division, dependent from the Treasury Division, is the area entrusted with minimizing the credit risk of the accounts receivable, supervising the delinquency of the accounts. The regulations and procedures applicable for the control and administration of the Arauco Group can be found in the Corporate Credit Policy.
As of December 31, 2017, Arauco’s balance for commercial Debtors was ThU.S.$ 718,714 of which, according to the agreed sales conditions, 59.18% corresponded to sales on credit (open account), 37.83% to sales with letters of credit and 2.99% to other types of sales, distributed in 2,245 debtors. The client with the largest Open Account debt represented 3.49% of the total accounts receivable as of that date.
Below we provide detail regarding accounts receivable, classified in tranches.
103
Table of Contents
CELULOSA ARAUCO Y CONSTITUCION S.A.
AND SUBSIDIARIES
Unaudited Consolidated Financial Statements
December 31, 2017
Amounts in thousands of U.S. dollars, except as indicated
December 31, 2017
| Age of trade receivables | ||||||||||||||||||||||||||||||||||||||||||||
Days | Non-past due | 1 to 30 | 31 to 60 | 61 to 90 | 91 to 120 | 121 to 150 | 151 to 180 | 181 to 210 | 211 to 250 | More than 250 | Total | |||||||||||||||||||||||||||||||||
ThU.S.$ | 662,963 | 39,459 | 551 | 955 | 50 | 34 | 2,238 | 56 | 97 | 12,312 | 718,715 | |||||||||||||||||||||||||||||||||
% | 92.20 | % | 5.50 | % | 0.10 | % | 0.10 | % | 0.00 | % | 0.00 | % | 0.30 | % | 0.00 | % | 0.00 | % | 1.70 | % | 100 | % | ||||||||||||||||||||||
December 31, 2016
| Age of trade receivables | ||||||||||||||||||||||||||||||||||||||||||||
Days | Non-past due | 1 to 30 | 31 to 60 | 61 to 90 | 91 to 120 | 121 to 150 | 151 to 180 | 181 to 210 | 211 to 250 | More than 250 | Total | |||||||||||||||||||||||||||||||||
ThU.S.$ | 564,378 | 31,106 | 257 | 881 | 39 | 18 | 21 | 11 | 64 | 14,319 | 611,094 | |||||||||||||||||||||||||||||||||
% | 92.40 | % | 5.10 | % | 0.00 | % | 0.10 | % | 0.00 | % | 0.00 | % | 0.00 | % | 0.00 | % | 0.00 | % | 2.30 | % | 100 | % | ||||||||||||||||||||||
Arauco does not conduct rescheduling or renegotiations with its clients that imply an amendment to the maturity of the invoices and, should it be necessary, any debt renegotiation with a client shall be analyzed on acase-by-case basis and subjected to the approval of the Corporate Finance Division.
Regarding the provisions fromnon-enforceable accounts, below we provide detail for the movements as of December 31, 2017 and 2016:
| 12-31-2017 | 12-31-2016 | |||||||
| ThU.S.$ | ThU.S.$ | |||||||
Opening balance | (16,644 | ) | (19,860 | ) | ||||
Impairment losses recognized on receivables | (139 | ) | (3,950 | ) | ||||
Reversal of impairment losses | 2,282 | 7,166 | ||||||
Closing balance | (14,501 | ) | (16,644 | ) | ||||
|
|
|
| |||||
Currently there is a policy for provisions for doubtful accounts receivable under IFRS for all the Arauco group companies.
Explanation regarding the Sales Risk with Letters of Credit
The sales with letters of credit mainly occur in markets in Asia and the Middle East. Periodically, a credit assessment is conducted regarding the banks that issue the letters of credit with the purpose of obtaining their score over the basis of risk-qualification ratings, country-specific risk and financial statements. The decision of approving the issuing bank or asking for confirmation of the letter of credit is made in consideration to this assessment.
104
Table of Contents
CELULOSA ARAUCO Y CONSTITUCION S.A.
AND SUBSIDIARIES
Unaudited Consolidated Financial Statements
December 31, 2017
Amounts in thousands of U.S. dollars, except as indicated
Explanation of the Sales Risk with Credit Line
Sales on credit are subject to the credit limit for each customer. The approval or rejection of a credit limit for all term sales is conducted by the Corporate CreditSub-Division, as well as by the Credit and Collections area for North America, Brazil and Argentina, which report to the Corporate Finance Division. The regulations and procedures applicable for the correct control and risk management over the sales on credit are ruled by the Credit Policy.
A procedure that must be applied by all the companies of the Arauco group has been established for the approval and/or modification of client credit lines. Credit line requests are entered to the SAP that analyzes all available information. Afterwards, the same are either approved or rejected in each one of the internal committees of each company belonging to the Arauco group, depending on the maximum amount authorized by the Credit Policy. Lines of credit are renewed during this internal process on a yearly basis.
All sales are automatically controlled by a credit verification system, which has been configured to block any orders from clients who are delinquent in a given percentage of a debt and/or from clients whose line of credit, as of the time of the product’s shipping, has been exceeded or is overdue.
In order to minimize the credit risk for term or Open Account sales, it is Arauco’s policy to take out insurance to cover the export sales of companies Celulosa Arauco y Constitución S.A., Maderas Arauco S.A., Forestal Arauco S.A., and Arauco do Brasil S.A., as well as the domestic sales of Arauco México S.A. de C.V., Arauco Wood Inc, Arauco Colombia S.A., Arauco Perú S.A., Arauco Panels USA LLC, Flakeboard Company Ltd., Flakeboard America Ltd., Celulosa Arauco y Constitución S.A., Maderas Arauco S.A., Arauco Florestal Arapoti, Arauco Forest Brasil S.A. and Arauco do Brasil S.A. Arauco works with credit insurance company Continental(AA- rating, as per risk rating companies Humphreys and Fitch Ratings). In order to cover the export sales and domestic sales of Arauco Argentina S.A., the preferred credit insurance company is Insur (a subsidiary of Continental in Argentina). Both companies grant a 90% coverage over the amount of each invoice, without deductibles, for registered clients and of 85% fornon-registered clients.(Non-registered clients are those whose lines range between ThU.S.$ 5 and ThU.S.$ 70 (equivalent currency of their invoicing) of the local sales of companies Arauco Perú S.A., Arauco Colombia S.A., Arauco México S.A. de C.V., Arauco Do Brasil S.A., Arauco Argentina S.A. and Maderas Arauco S.A. Lines in excess of the aforesaid amounts correspond to registered clients.
105
Table of Contents
CELULOSA ARAUCO Y CONSTITUCION S.A.
AND SUBSIDIARIES
Unaudited Consolidated Financial Statements
December 31, 2017
Amounts in thousands of U.S. dollars, except as indicated
As another way of minimizing risk and supporting a line of credit approved by the Credit Committee, Arauco holds guarantees such as mortgages, pledges, Standby letters of credit, bank performance bonds, checks, promissory notes, loans or any other that could be required under the laws of each country. The total amount held in guarantees amounts to ThU.S.$98.7 million, effective as of December 2017, as summarized in the following chart. The procedure for guarantees is regulated by Arauco’s Policy on Guarantees, whose purpose is to control their accounting, due date and custody.
| Guarantees Arauco Group (ThU.S.$) | ||||||||
Guarantees Debtors (received from clients) | ||||||||
Certificate of deposits | 7,106 | 7.3 | % | |||||
Standby | 6,942 | 7.0 | % | |||||
Promissory notes | 71,961 | 72.9 | % | |||||
Finance | 3,094 | 3.1 | % | |||||
Mortgage | 6,849 | 6.9 | % | |||||
Pledge | 2,580 | 2.6 | % | |||||
Promissory notes | 200 | 0.2 | % | |||||
Total Guarantees | 98,732 | 100.0 | % | |||||
|
|
|
| |||||
The maximum exposure to credit risk is limited to the value at amortized cost of the Debtors’ account for sales registered as of the date of this report, minus the percentage of sales insured by the aforementioned credit insurance companies and the guarantees granted in favor of Arauco.
In summary, the open account debt covered by the various insurance policies and guarantees amounts to 97.4% and, therefore, Arauco’s portfolio exposure amounts to 2.6%.
| Secured Open Accounts Receivable | ThU.S.$ | % | ||||||
Total open accounts receivable | 391,992 | 100.0 | % | |||||
Secured receivables (*) | 381,800 | 97.4 | % | |||||
Unsecured receivables | 10,192 | 2.6 | % | |||||
| (*) | Insured Debt is deemed to be the portion of accounts receivable that is covered by a credit company or by guarantees such as standby letters of credit, mortgages, performance bonds, among others |
Investment Policy:
Arauco has an Investment Policy which identifies and limits the financial instruments and the entities into which the Arauco companies, in particular Celulosa Arauco y Constitucion S.A., are authorized to invest. The Company’s Treasury Department is centralized with operations in Chile. The Head Office is responsible for carrying out investments, cash flow surplus investments, and short and long term debt subscriptions. Exceptions to this rule are specific investments made through other companies where authorization is required from the Chief Financial Officer.
For financial instruments, the only permitted investments are fixed income investments with adequate liquidity. Each instrument has defined classifications and limits, depending on duration and type of issuer.
Regarding intermediaries (such as banks, securities brokers and dealers of mutual funds that are bank affiliates), a scoring methodology is used to determine the relative degree of risk of each intermediary based on their financial position and assign score points that result in a credit risk rating to each intermediary. Arauco uses this scoring system to determine its investment limits for each intermediary.
106
Table of Contents
CELULOSA ARAUCO Y CONSTITUCION S.A.
AND SUBSIDIARIES
Unaudited Consolidated Financial Statements
December 31, 2017
Amounts in thousands of U.S. dollars, except as indicated
The required information to evaluate the various criteria are obtained from published financial statements from the banks under evaluation and from the credit risk ratings of short and long term debt securities obtained from rating agencies authorized by the Superintendence of Banks and Financial Institutions (Fitch Ratings Chile, Humphreys and Feller Rate).
The criteria evaluated are: Capital and Reserves, Current Ratio, Return on equity, Net Income to Operating income Ratio, Debt to Equity Ratio and the Credit Risk rating of each entity.
Any necessary exceptions regarding investment limits in each particular instrument or entity must have the authorization from Arauco’s Chief Financial Officer.
23.10.2 Type of Risk: Liquidity Risk
Description
This risk corresponds to Arauco’s ability to fulfill its financial obligations upon maturity.
Explanation of Liquidity Risk Exposure and How This Risk Arises
Arauco’s exposure to liquidity risk is mainly from its obligations to bondholders, banks and financial institutions, creditors and other payables. Liquidity risk may arise if Arauco is unable to meet the net cash flow requirements, which sustain its operations under both normal and exceptional circumstances.
Explanation of Objectives, Policies and Processes for Risk Management, and Measurement Methods
The Financial Management Department monitors on an ongoing basis the Company’s cash flow forecasts based on short and long term forecasts and available financing alternatives. In order to manage the risk level of financial assets, Arauco follows its investment policy.
107
Table of Contents
CELULOSA ARAUCO Y CONSTITUCION S.A.
AND SUBSIDIARIES
Unaudited Consolidated Financial Statements
December 31, 2017
Amounts in thousands of U.S. dollars, except as indicated
The following tables detail Arauco’s liquidity analysis for its financial liabilities as of December 31, 2017 and December 31, 2016. The tables have been drawn up based on the contractual undiscounted cash outflows and their remaining contractual maturities:
December 31, 2017 | Maturity | Total | ||||||||||||||||||||||||||||||||||||||||||||||||||||
Tax ID | Name | Currency | Name - Country Loans with banks | Up to 3 months ThU.S.$ | 3 to 12 months ThU.S.$ | 1 to 2 years ThU.S.$ | 2 to 3 years ThU.S.$ | 3 to 4 years ThU.S.$ | 4 to 5 years ThU.S.$ | More than 5 years ThU.S.$ | Current ThU.S.$ | Non Current ThU.S.$ | Effective rate | Nominal rate | ||||||||||||||||||||||||||||||||||||||||
93.458.000-1 | | Celulosa Arauco y Constitución S.A. | | U.S. Dollar | Scotiabank- Chile | 25 | 199,572 | — | — | — | — | — | 199,597 | — | 1.70% | Libor + 0.70% | ||||||||||||||||||||||||||||||||||||||
— | | Zona Franca Punta Pereira | | U.S. Dollar | Interamerican Development Bank | 1,167 | 1,032 | 2,434 | 2,361 | 2,282 | 2,201 | 2,120 | 2,199 | 11,398 | 3.51% | Libor + 2.05% | ||||||||||||||||||||||||||||||||||||||
— | | Zona Franca Punta Pereira | | U.S. Dollar | Interamerican Development Bank | 2,953 | 2,787 | 5,870 | 5,676 | — | — | — | 5,740 | 11,546 | 3.26% | Libor + 1.80% | ||||||||||||||||||||||||||||||||||||||
— | | Zona Franca Punta Pereira | | U.S. Dollar | BBVA | 14,007 | — | — | — | — | — | — | 14,007 | — | 3.13% | Libor + 1.75% | ||||||||||||||||||||||||||||||||||||||
— | | Zona Franca Punta Pereira | | U.S. Dollar | Citibank | — | 4,503 | — | — | — | — | — | 4,503 | — | 3.10% | Libor + 1.75% | ||||||||||||||||||||||||||||||||||||||
— | | Zona Franca Punta Pereira | | U.S. Dollar | Scotiabank | 3 | 2,506 | — | — | — | — | — | 2,509 | — | 3.17% | 3.17% | ||||||||||||||||||||||||||||||||||||||
— | | Celulosa y Energia Punta Pereira | | U.S. Dollar | Banco Interamericano de Desarrollo | 4,723 | 4,161 | 9,828 | 9,526 | 9,201 | 8,885 | 8,570 | 8,884 | 46,010 | 3.51% | Libor + 2.05% | ||||||||||||||||||||||||||||||||||||||
— | | Celulosa y Energia Punta Pereira | | U.S. Dollar | Banco Interamericano de Desarrollo | 11,946 | 11,255 | 23,735 | 22,938 | — | — | — | 23,201 | 46,673 | 3.26% | Libor + 1.80% | ||||||||||||||||||||||||||||||||||||||
— | | Celulosa y Energia Punta Pereira | | U.S. Dollar | Finnish Export Credit | 25,176 | 21,214 | 50,198 | 49,484 | 47,929 | 47,207 | 23,564 | 46,390 | 218,382 | 3.20% | 3.20% | ||||||||||||||||||||||||||||||||||||||
— | | Celulosa y Energia Punta Pereira | | U.S. Dollar | Dnb Nor Bank | — | 45 | — | — | — | — | — | 45 | — | 0.00% | Libor + 2% | ||||||||||||||||||||||||||||||||||||||
— | Eufores S.A. | U.S. Dollar | Banco Republica Oriental de Uruguay | 24,746 | 12,564 | — | — | — | — | — | 37,310 | — | 3.08% | Libor + 1.75% | ||||||||||||||||||||||||||||||||||||||||
— | Eufores S.A. | U.S. Dollar | Citibank | 6 | — | — | — | — | — | — | 6 | — | 3.43% | Libor + 2% | ||||||||||||||||||||||||||||||||||||||||
— | Eufores S.A. | U.S. Dollar | Banco HSBC- Uruguay | 1,200 | — | — | — | — | — | — | 1,200 | — | 2.91% | Libor + 1.75% | ||||||||||||||||||||||||||||||||||||||||
— | Eufores S.A. | U.S. Dollar | Banco Itau - Uruguay | 4 | 12,513 | — | — | — | — | — | 12,517 | — | 3.08% | Libor + 1.75% | ||||||||||||||||||||||||||||||||||||||||
— | Eufores S.A. | U.S. Dollar | Heritage | 1,352 | — | — | — | — | — | — | 1,352 | — | 3.03% | Libor + 1.75% | ||||||||||||||||||||||||||||||||||||||||
— | Eufores S.A. | U.S. Dollar | Banco Santander | 20,230 | 5,013 | — | — | — | — | — | 25,243 | — | 3.06% | Libor + 1.75% | ||||||||||||||||||||||||||||||||||||||||
— | | Arauco Do Brasil S.A. | | | Brazilian Real | | Banco Santander | 23 | 67 | 89 | 46 | — | — | — | 90 | 135 | 9.50% | 9.50% | ||||||||||||||||||||||||||||||||||||
— | | Arauco Do Brasil S.A. | | | Brazilian Real | | Banco Alfa | 18 | 56 | 74 | 74 | 74 | 7 | — | 74 | 229 | 10.75% | Tljp+2%+ spread 1.75% | ||||||||||||||||||||||||||||||||||||
— | | Arauco Do Brasil S.A. | | | Brazilian Real | | Banco Santander | 3 | 7 | 10 | 10 | 7 | — | — | 10 | 27 | 11.00% | Tljp+2%+ spread 2% | ||||||||||||||||||||||||||||||||||||
— | | Arauco Florestal Arapoti S.A. | | | Brazilian Real | | Banco Itau | 1 | — | — | — | — | — | — | 1 | — | 2.50% | 2.50% | ||||||||||||||||||||||||||||||||||||
— | | Arauco Florestal Arapoti S.A. | | | Brazilian Real | | Banco Itau | 13 | 37 | 4 | — | — | — | — | 50 | 4 | 3.50% | 3.50% | ||||||||||||||||||||||||||||||||||||
— | | Arauco Florestal Arapoti S.A. | | | Brazilian Real | | Banco Bradesco | 11 | 33 | 36 | — | — | — | — | 44 | 36 | 6.00% | 6.00% | ||||||||||||||||||||||||||||||||||||
— | | Arauco Florestal Arapoti S.A. | | | Brazilian Real | | Banco Votorantim | 16 | — | — | — | 364 | 364 | — | 16 | 728 | 5.00% | 5.00% | ||||||||||||||||||||||||||||||||||||
— | | Arauco Florestal Arapoti S.A. | | | Brazilian Real | | Banco Safra | 22 | 65 | 22 | — | — | — | — | 87 | 22 | 6.00% | 6.00% | ||||||||||||||||||||||||||||||||||||
— | | Arauco Florestal Arapoti S.A. | | | Brazilian Real | | Banco Safra | 7 | 20 | 27 | 27 | 11 | — | — | 27 | 65 | 10.00% | 10.00% | ||||||||||||||||||||||||||||||||||||
— | | Arauco Florestal Arapoti S.A. | | | Brazilian Real | | Banco Santander | 981 | 907 | — | — | — | — | — | 1,888 | — | 9.50% | 9.50% | ||||||||||||||||||||||||||||||||||||
— | | Arauco Florestal Arapoti S.A. | | | Brazilian Real | | Banco Santander | — | 16 | 16 | 8 | — | — | — | 16 | 24 | 9.00% | 9.00% | ||||||||||||||||||||||||||||||||||||
— | | Arauco Florestal Arapoti S.A. | | | Brazilian Real | | Banco Santander | 12 | 52 | 85 | 74 | 64 | 54 | — | 64 | 277 | 10.49% | 10.49% | ||||||||||||||||||||||||||||||||||||
— | | Arauco Forest Brasil S.A. | | | Brazilian Real | | Banco Bradesco | 20 | 69 | 53 | 28 | 28 | 16 | — | 89 | 125 | 9.00% | 9.00% | ||||||||||||||||||||||||||||||||||||
— | | Arauco Forest Brasil S.A. | | U.S. Dollar | Banco Alfa | 2 | 7 | 9 | 9 | 5 | — | — | 9 | 23 | 8.20% | Cesta+2%+spread 1.8% | ||||||||||||||||||||||||||||||||||||||
— | | Arauco Forest Brasil S.A. | | | Brazilian Real | | Banco Alfa | 6 | 17 | 23 | 22 | 11 | — | — | 23 | 56 | 10.80% | Tljp+2%+Spread 1.8% | ||||||||||||||||||||||||||||||||||||
— | | Arauco Forest Brasil S.A. | | | Brazilian Real | | Banco Itau -Brazil | 1 | — | — | — | — | — | — | 1 | — | 2.50% | 2.50% | ||||||||||||||||||||||||||||||||||||
— | | Arauco Forest Brasil S.A. | | | Brazilian Real | | Banco Votorantim - Brazil | 192 | 619 | 403 | — | 322 | 322 | — | 811 | 1,047 | 8.10% | Tljp+1.8%+Spread 2% | ||||||||||||||||||||||||||||||||||||
— | | Arauco Forest Brasil S.A. | | U.S. Dollar | Banco Votorantim - Brazil | 34 | — | 78 | — | — | — | — | 34 | 78 | 7.70% | Cesta+1.3%+spread 2% | ||||||||||||||||||||||||||||||||||||||
— | | Arauco Forest Brasil S.A. | | | Brazilian Real | | Banco Bndes Subcrédito A-B-D | 4 | — | — | 115 | 458 | 344 | — | 4 | 917 | 9.82% | Tljp + 2.91% | ||||||||||||||||||||||||||||||||||||
— | | Arauco Forest Brasil S.A. | | U.S. Dollar | Banco Bndes Subcrédito C | 5 | — | — | 24 | 145 | 120 | — | 5 | 289 | 7.30% | Cesta + 2.91% | ||||||||||||||||||||||||||||||||||||||
— | | Arauco Forest Brasil S.A. | | | Brazilian Real | | Banco Santander | 995 | 984 | 107 | 212 | 202 | 161 | — | 1,979 | 682 | 8.90% | 8.90% | ||||||||||||||||||||||||||||||||||||
— | | Mahal Emprendimientos Pat. S.A. | | | Brazilian Real | | Bndes SubcréditoE-I | 23 | 754 | 3,017 | 2,262 | — | — | — | 777 | 5,279 | 9.91% | Tljp + 2.91% | ||||||||||||||||||||||||||||||||||||
— | | Mahal Emprendimientos Pat. S.A. | | | Brazilian Real | | Bndes SubcréditoF-J | 16 | 452 | 1,810 | 1,358 | — | — | — | 468 | 3,168 | 10.91% | Tljp + 3.91% | ||||||||||||||||||||||||||||||||||||
— | | Mahal Emprendimientos Pat. S.A. | | U.S. Dollar | Bndes Subcrédito G-K | 63 | 339 | 2,037 | 1,697 | — | — | — | 402 | 3,734 | 7.31% | Cesta + 2.91% | ||||||||||||||||||||||||||||||||||||||
— | | Mahal Emprendimientos Pat. S.A. | | | Brazilian Real | | Bndes Subcrédito H-L | 19 | 504 | 2,011 | 1,509 | — | — | — | 523 | 3,520 | 12.11% | Tljp + 5.11% | ||||||||||||||||||||||||||||||||||||
— | | Mahal Emprendimientos Pat. S.A. | | | Brazilian Real | | Banco Santander | — | — | 27 | 27 | 27 | — | — | — | 81 | 11.00% | Tljp+2%+Spread 2% | ||||||||||||||||||||||||||||||||||||
— | | Mahal Emprendimientos Pat. S.A. | | U.S. Dollar | Banco Santander | — | — | 13 | 13 | 12 | — | — | — | 38 | 8.40% | Cesta+2%+Spread 2% | ||||||||||||||||||||||||||||||||||||||
— | | Novo Oeste Gestao de Ativos Florestais S.A. | | | Brazilian Real | | Banco Santander | — | 1 | 26 | 28 | 28 | 2 | — | 1 | 84 | 11.00% | Tljp+2%+Spread 2% | ||||||||||||||||||||||||||||||||||||
— | | Novo Oeste Gestao de Ativos Florestais S.A. | | U.S. Dollar | Banco Santander | — | 1 | 12 | 13 | 13 | 1 | — | 1 | 39 | 8.40% | Tljp+2%+Spread 2% | ||||||||||||||||||||||||||||||||||||||
— | | Flakeboard America Ltd | | U.S. Dollar | Banco del Estado de Chile | 675 | — | 5,060 | 4,839 | 17,925 | 17,925 | 111,309 | 675 | 157,058 | 3.00% | Libor + 1.65% | ||||||||||||||||||||||||||||||||||||||
|
|
|
|
|
|
|
|
|
|
|
|
|
|
|
|
|
| |||||||||||||||||||||||||||||||||||||
| Total | 110,700 | 282,172 | 107,114 | 102,380 | 79,108 | 77,609 | 145,563 | 392,872 | 511,774 | |||||||||||||||||||||||||||||||||||||||||||||
|
|
|
|
|
|
|
|
|
|
|
|
|
|
|
|
|
| |||||||||||||||||||||||||||||||||||||
December 31, 2017 | Maturity | Total | ||||||||||||||||||||||||||||||||||||||||||||||||
Tax ID | Name | Currency | Name - Country Bonds | Up to 3 months ThU.S.$ | 3 to 12 months ThU.S.$ | 1 to 2 years ThU.S.$ | 2 to 3 years ThU.S.$ | 3 to 4 years ThU.S.$ | 4 to 5 years ThU.S.$ | More than 5 years ThU.S.$ | Current ThU.S.$ | Non Current ThU.S.$ | Effective rate | Nominal rate | ||||||||||||||||||||||||||||||||||||
93.458.000-1 | Celulosa Arauco y Constitución S.A. | U.F. | Barau-F | — | 1,528 | 28,132 | 27,301 | 26,469 | 25,638 | 156,181 | 1,528 | 263,721 | 4.24 | % | 4.21 | % | ||||||||||||||||||||||||||||||||||
93.458.000-1 | Celulosa Arauco y Constitución S.A. | U.F. | Barau-F | — | 611 | 11,340 | 11,005 | 10,670 | 10,335 | 62,958 | 611 | 106,308 | 4.25 | % | 4.21 | % | ||||||||||||||||||||||||||||||||||
93.458.000-1 | Celulosa Arauco y Constitución S.A. | U.F. | Barau-J | 2,342 | — | 7,027 | 224,916 | — | — | — | 2,342 | 231,943 | 3.23 | % | 3.22 | % | ||||||||||||||||||||||||||||||||||
93.458.000-1 | Celulosa Arauco y Constitución S.A. | U.F. | Barau-P | — | 1,103 | 8,633 | 8,633 | 8,633 | 28,334 | 240,175 | 1,103 | 294,408 | 3.96 | % | 3.96 | % | ||||||||||||||||||||||||||||||||||
93.458.000-1 | Celulosa Arauco y Constitución S.A. | U.F. | Barau-Q | — | 22,364 | 23,445 | 22,796 | 11,154 | — | — | 22,364 | 57,395 | 2.96 | % | 2.98 | % | ||||||||||||||||||||||||||||||||||
93.458.000-1 | Celulosa Arauco y Constitución S.A. | U.F. | Barau-R | — | 1,944 | 7,777 | 7,777 | 7,777 | 7,777 | 314,228 | 1,944 | 345,336 | 3.57 | % | 3.57 | % | ||||||||||||||||||||||||||||||||||
93.458.000-1 | Celulosa Arauco y Constitución S.A. | U.F. | Barau-S | — | 650 | 5,200 | 5,200 | 5,200 | 5,200 | 230,228 | 650 | 251,028 | 2.44 | % | 2.89 | % | ||||||||||||||||||||||||||||||||||
93.458.000-1 | Celulosa Arauco y Constitución S.A. | U.S. Dollar | Yankee 2019 | 6,168 | — | 217,034 | — | — | — | — | 6,168 | 217,034 | 7.26 | % | 7.25 | % | ||||||||||||||||||||||||||||||||||
93.458.000-1 | Celulosa Arauco y Constitución S.A. | U.S. Dollar | Yankee 2021 | 4,422 | — | 10,013 | 10,013 | 204,138 | — | — | 4,422 | 224,164 | 5.02 | % | 5.00 | % | ||||||||||||||||||||||||||||||||||
93.458.000-1 | Celulosa Arauco y Constitución S.A. | U.S. Dollar | Yankee 2022 | 5,705 | — | 12,153 | 12,153 | 12,153 | 259,072 | — | 5,705 | 295,531 | 4.77 | % | 4.75 | % | ||||||||||||||||||||||||||||||||||
93.458.000-1 | Celulosa Arauco y Constitución S.A. | U.S. Dollar | Yankee 2024 | 9,375 | — | 22,500 | 22,500 | 22,500 | 22,500 | 548,324 | 9,375 | 638,324 | 4.52 | % | 4.50 | % | ||||||||||||||||||||||||||||||||||
93.458.000-1 | Celulosa Arauco y Constitución S.A. | U.S. Dollar | Yankee 2027 | — | 3,175 | 19,375 | 19,375 | 19,375 | 19,375 | 582,479 | 3,175 | 659,979 | 3.90 | % | 3.88 | % | ||||||||||||||||||||||||||||||||||
93.458.000-1 | Celulosa Arauco y Constitución S.A. | U.S. Dollar | Yankee 2047 | — | 3,607 | 22,000 | 22,000 | 22,000 | 22,000 | 943,160 | 3,607 | 1,031,160 | 5.50 | % | 5.50 | % | ||||||||||||||||||||||||||||||||||
|
|
|
|
|
|
|
|
|
|
|
|
|
|
|
|
|
| |||||||||||||||||||||||||||||||||
| Total | 28,012 | 34,982 | 394,629 | 393,669 | 350,069 | 400,231 | 3,077,733 | 62,994 | 4,616,331 | |||||||||||||||||||||||||||||||||||||||||
|
|
|
|
|
|
|
|
|
|
|
|
|
|
|
|
|
| |||||||||||||||||||||||||||||||||
December 31, 2017 | Maturity | Total | ||||||||||||||||||||||||||||||||||||||||||||
Tax ID | Name | Currency | Name - Country Lease | Up to 3 months ThU.S.$ | 3 to 12 months ThU.S.$ | 1 to 2 years ThU.S.$ | 2 to 3 years ThU.S.$ | 3 to 4 years ThU.S.$ | 4 to 5 years ThU.S.$ | More than 5 years ThU.S.$ | Current ThU.S.$ | Non Current ThU.S.$ | Effective rate | Nominal rate | ||||||||||||||||||||||||||||||||
| 85.805.200-9 | Forestal Arauco S.A. | U.F. | Banco Santander | 168 | 1,026 | 983 | 983 | — | — | — | 1,194 | 1,966 | — | — | ||||||||||||||||||||||||||||||||
| 85.805.200-9 | Forestal Arauco S.A. | U.F. | Banco Scotiabank | 1,563 | 3,772 | 4,139 | 4,139 | 638 | 638 | — | 5,335 | 9,554 | — | — | ||||||||||||||||||||||||||||||||
| 85.805.200-9 | Forestal Arauco S.A. | U.F. | Banco Estado | 749 | 2,182 | 2,318 | 2,318 | 230 | 230 | — | 2,931 | 5,096 | — | — | ||||||||||||||||||||||||||||||||
| 85.805.200-9 | Forestal Arauco S.A. | U.F. | Banco de Chile | 3,346 | 13,995 | 7,886 | 7,886 | 2,247 | 2,247 | — | 17,341 | 20,266 | — | — | ||||||||||||||||||||||||||||||||
| 85.805.200-9 | Forestal Arauco S.A. | U.F. | Banco BBVA | 1,151 | 3,421 | 447 | 447 | — | — | — | 4,572 | 894 | — | — | ||||||||||||||||||||||||||||||||
| 85.805.200-9 | Forestal Arauco S.A. | U.F. | Banco Credito e Inversiones | 1,443 | 5,901 | 4,856 | 4,856 | 5,354 | 5,354 | — | 7,344 | 20,420 | — | — | ||||||||||||||||||||||||||||||||
| 85.805.200-9 | Forestal Arauco S.A. | Chilean Pesos | Banco Santander | 50 | 17 | — | — | — | — | — | 67 | — | — | — | ||||||||||||||||||||||||||||||||
| 85.805.200-9 | Forestal Arauco S.A. | Chilean Pesos | Banco Chile | 607 | 1,547 | 1,015 | 1,015 | 123 | 123 | — | 2,154 | 2,276 | — | — | ||||||||||||||||||||||||||||||||
| 85.805.200-9 | Forestal Arauco S.A. | Chilean Pesos | Banco Credito e Inversiones | 767 | 2,301 | 3,032 | 3,032 | 179 | 179 | — | 3,068 | 6,422 | — | — | ||||||||||||||||||||||||||||||||
| 85.805.200-9 | Forestal Arauco S.A. | Chilean Pesos | Banco Scotiabank | 84 | 251 | 334 | 334 | 237 | 236 | — | 335 | 1,141 | — | — | ||||||||||||||||||||||||||||||||
|
|
|
|
|
|
|
|
|
|
|
|
|
|
|
|
|
| |||||||||||||||||||||||||||||
| Total | 9,928 | 34,413 | 25,010 | 25,010 | 9,008 | 9,007 | — | 44,341 | 68,035 | |||||||||||||||||||||||||||||||||||||
|
|
|
|
|
|
|
|
|
|
|
|
|
|
|
|
|
| |||||||||||||||||||||||||||||
As part of the policy of Arauco, it considers compliance with all Accounts Payable, whether with related (see Note 13) or third parties, within a period not exceeding 30 days.
108
Table of Contents
CELULOSA ARAUCO Y CONSTITUCION S.A.
AND SUBSIDIARIES
Unaudited Consolidated Financial Statements
December 31, 2017
Amounts in thousands of U.S. dollars, except as indicated
December 31, 2016 | Maturity | Total | ||||||||||||||||||||||||||||||||||||||||||||||||
Tax ID | Name | Currency | Name - Country Loans with | Up to 3 months ThU.S.$ | 3 to 12 months ThU.S.$ | 1 to 2 years ThU.S.$ | 2 to 3 years ThU.S.$ | 3 to 4 years ThU.S.$ | 4 to 5 years ThU.S.$ | More than 5 years ThU.S.$ | Current ThU.S.$ | Non Current ThU.S.$ | Effective rate | Nominal rate | ||||||||||||||||||||||||||||||||||||
93.458.000-1 | Celulosa Arauco y Constitución S.A. | U.S. Dollar | Scotiabank- Chile | — | 36 | 302,242 | — | — | — | — | 36 | 302,242 | 1.63% | 1.63% | ||||||||||||||||||||||||||||||||||||
| — | Arauco Argentina S.A. | U.S. Dollar | Banco Galicia- Argentina | 5,031 | — | — | — | — | — | — | 5,031 | — | 2.00% | 2.00% | ||||||||||||||||||||||||||||||||||||
| — | Arauco Argentina S.A. | Argentine Pesos | Banco Macro- Argentina | 11 | 29 | — | — | — | — | — | 40 | — | 15.25% | 15.25% | ||||||||||||||||||||||||||||||||||||
| — | Zona Franca Punta Pereira | U.S. Dollar | Interamerican Development Bank | 1,178 | 1,027 | 2,450 | 2,387 | 2,324 | 2,256 | 4,302 | 2,205 | 13,719 | Libor + 2.05% | Libor + 2.05% | ||||||||||||||||||||||||||||||||||||
| — | Zona Franca Punta Pereira | U.S. Dollar | Interamerican Development Bank | 2,990 | 2,782 | 5,997 | 5,830 | 5,664 | — | — | 5,772 | 17,491 | Libor + 1.80% | Libor + 1.80% | ||||||||||||||||||||||||||||||||||||
— | Zona Franca Punta Pereira | U.S. Dollar | BBVA | 16,176 | — | — | — | — | — | — | 16,176 | — | 3.23% | Libor + 2% | ||||||||||||||||||||||||||||||||||||
— | Zona Franca Punta Pereira | U.S. Dollar | Citibank | — | 2,501 | — | — | — | — | — | 2,501 | — | 2.95% | Libor + 1.75% | ||||||||||||||||||||||||||||||||||||
| — | Zona Franca Punta Pereira | U.S. Dollar | Scotiabank | 2,501 | — | — | — | — | — | — | 2,501 | — | 1.60% | 1.60% | ||||||||||||||||||||||||||||||||||||
| — | Celulosa y Energia Punta Pereira | U.S. Dollar | Banco Interamericano de Desarrollo | 4,768 | 4,143 | 9,895 | 9,637 | 9,379 | 9,096 | 17,371 | 8,911 | 55,378 | 3.30% | Libor + 2.05% | ||||||||||||||||||||||||||||||||||||
— | Celulosa y Energia Punta Pereira | U.S. Dollar | Banco Interamericano de Desarrollo | 12,104 | 11,237 | 24,249 | 23,568 | 22,888 | — | — | 23,341 | 70,705 | 3.05% | Libor + 1.80% | ||||||||||||||||||||||||||||||||||||
— | Celulosa y Energia Punta Pereira | U.S. Dollar | Finnish Export Credit | 25,474 | 20,774 | 43,915 | 44,538 | 45,209 | 45,882 | 70,166 | 46,248 | 249,710 | 3.20% | 3.20% | ||||||||||||||||||||||||||||||||||||
| — | Celulosa y Energia Punta Pereira | U.S. Dollar | Dnb Nor Bank | 89 | — | — | — | — | — | — | 89 | — | | Libor + 2.00% | | Libor + 2.00% | ||||||||||||||||||||||||||||||||||
— | Eufores S.A. | U.S. Dollar | Banco Republica Oriental de Uruguay | 24,733 | 12,563 | — | — | — | — | — | 37,296 | — | Libor + 1.75% | Libor + 1.75% | ||||||||||||||||||||||||||||||||||||
— | Eufores S.A. | U.S. Dollar | Citibank | 5 | — | — | — | — | — | — | 5 | — | Libor + 2.00% | Libor + 2.00% | ||||||||||||||||||||||||||||||||||||
— | Eufores S.A. | U.S. Dollar | Banco HSBC- Uruguay | 1,202 | — | — | — | — | — | — | 1,202 | — | Libor + 2.00% | Libor + 2.00% | ||||||||||||||||||||||||||||||||||||
— | Eufores S.A. | U.S. Dollar | Banco Itau -Uruguay | 10,135 | 5,003 | — | — | — | — | — | 15,138 | — | Libor + 2.00% | Libor + 2.00% | ||||||||||||||||||||||||||||||||||||
— | Eufores S.A. | U.S. Dollar | Heritage | 1,351 | — | — | — | — | — | — | 1,351 | — | Libor + 2.00% | Libor + 2.00% | ||||||||||||||||||||||||||||||||||||
— | Eufores S.A. | U.S. Dollar | Banco Santander | 22,735 | — | — | — | — | — | — | 22,735 | — | Libor + 2.00% | Libor + 2.00% | ||||||||||||||||||||||||||||||||||||
— | Arauco Do Brasil S.A. | Brazilian Real | Banco ABC - Brazil | 7 | 18 | — | — | — | — | — | 25 | — | 2.50% | 2.50% | ||||||||||||||||||||||||||||||||||||
— | Arauco Do Brasil S.A. | Brazilian Real | Banco Itau | 2,713 | 321 | — | — | — | — | — | 3,034 | — | 9.50% | 9.50% | ||||||||||||||||||||||||||||||||||||
— | Arauco Do Brasil S.A. | Brazilian Real | Banco Votorantim | 13 | 25 | — | — | — | — | — | 38 | — | 5.50% | 5.50% | ||||||||||||||||||||||||||||||||||||
— | Arauco Do Brasil S.A. | Brazilian Real | Banco Santander | 2 | 46 | 100 | 100 | 57 | 7 | — | 48 | 264 | 9.34% | 9.34% | ||||||||||||||||||||||||||||||||||||
— | Arauco Florestal Arapoti S.A. | Brazilian Real | Banco Itau | 2 | 6 | 1 | — | — | — | — | 8 | 1 | 2.50% | 2.50% | ||||||||||||||||||||||||||||||||||||
— | Arauco Florestal Arapoti S.A. | Brazilian Real | Banco Itau | 13 | 38 | 51 | 4 | — | — | — | 51 | 55 | 3.50% | 3.50% | ||||||||||||||||||||||||||||||||||||
— | Arauco Florestal Arapoti S.A. | Brazilian Real | Banco Bradesco | 11 | 33 | 44 | 37 | — | — | — | 44 | 81 | 6.00% | 6.00% | ||||||||||||||||||||||||||||||||||||
— | Arauco Florestal Arapoti S.A. | Brazilian Real | Banco Bradesco | 400 | — | — | — | — | — | — | 400 | — | 8.75% | 8.75% | ||||||||||||||||||||||||||||||||||||
— | Arauco Florestal Arapoti S.A. | Brazilian Real | Banco Votorantim | 17 | — | — | — | — | 369 | 369 | 17 | 738 | 5.00% | 5.00% | ||||||||||||||||||||||||||||||||||||
— | Arauco Florestal Arapoti S.A. | Brazilian Real | Banco Safra | 22 | 66 | 88 | 22 | — | — | — | 88 | 110 | 6.00% | 6.00% | ||||||||||||||||||||||||||||||||||||
— | Arauco Florestal Arapoti S.A. | Brazilian Real | Banco Safra | 8 | 21 | 27 | 27 | 27 | 11 | — | 29 | 92 | 10.00% | 10.00% | ||||||||||||||||||||||||||||||||||||
— | Arauco Florestal Arapoti S.A. | Brazilian Real | Banco Santander | 1 | 16 | 16 | 16 | 8 | — | — | 17 | 40 | 9.00% | 9.00% | ||||||||||||||||||||||||||||||||||||
— | Arauco Florestal Arapoti S.A. | Brazilian Real | Banco Santander | 5 | 18 | 30 | 30 | 19 | 8 | — | 23 | 87 | 9.22% | 9.22% | ||||||||||||||||||||||||||||||||||||
— | Arauco Forest Brasil S.A. | Brazilian Real | Banco Bradesco | 20 | 57 | 77 | 23 | — | — | — | 77 | 100 | 5.91% | 5.91% | ||||||||||||||||||||||||||||||||||||
— | Arauco Forest Brasil S.A. | U.S. Dollar | Banco Alfa | — | 5 | 9 | 9 | 9 | 5 | — | 5 | 32 | 7.94% | 7.94% | ||||||||||||||||||||||||||||||||||||
— | Arauco Forest Brasil S.A. | Brazilian Real | Banco Alfa | — | 12 | 23 | 23 | 23 | 11 | — | 12 | 80 | 11.30% | 11.30% | ||||||||||||||||||||||||||||||||||||
— | Arauco Forest Brasil S.A. | Brazilian Real | Banco Itau- Brazil | 4 | 12 | 1 | 2 | — | — | — | 16 | 3 | 2.50% | 2.50% | ||||||||||||||||||||||||||||||||||||
— | Arauco Forest Brasil S.A. | Brazilian Real | Banco Votorantim -Brazil | 195 | 520 | 694 | 405 | — | 327 | 327 | 715 | 1,753 | 8.59% | 8.59% | ||||||||||||||||||||||||||||||||||||
— | Arauco Forest Brasil S.A. | U.S. Dollar | Banco Votorantim - Brazil | 35 | 101 | 134 | 78 | — | — | — | 136 | 212 | 7.44% | 7.44% | ||||||||||||||||||||||||||||||||||||
— | Arauco Forest Brasil S.A. | Brazilian Real | Banco Bndes SubcréditoA-B-D | 4 | — | — | — | 114 | 460 | 346 | 4 | 920 | 9.82% | 9.82% | ||||||||||||||||||||||||||||||||||||
— | Arauco Forest Brasil S.A. | U.S. Dollar | Banco Bndes Subcrédito C | 4 | — | — | — | 24 | 144 | 120 | 4 | 288 | 7.05% | 7.05% | ||||||||||||||||||||||||||||||||||||
— | Arauco Forest Brasil S.A. | Brazilian Real | Banco Santander | 1 | 32 | — | — | — | — | — | 33 | — | 9.32% | 9.32% | ||||||||||||||||||||||||||||||||||||
— | Arauco Forest Brasil S.A. | Brazilian Real | Banco John Deere | 62 | 41 | 41 | 32 | 10 | — | — | 103 | 83 | 6.00% | 6.00% | ||||||||||||||||||||||||||||||||||||
— | Mahal Emprendimientos Pat. S.A. | Brazilian Real | Bndes SubcréditoE-I | 23 | — | 758 | 3,030 | 2,272 | — | — | 23 | 6,060 | 8.91% | 8.91% | ||||||||||||||||||||||||||||||||||||
— | Mahal Emprendimientos Pat. S.A. | Brazilian Real | Bndes SubcréditoF-J | 16 | — | 454 | 1,818 | 1,363 | — | — | 16 | 3,635 | 9.91% | 9.91% | ||||||||||||||||||||||||||||||||||||
— | Mahal Emprendimientos Pat. S.A. | U.S. Dollar | Bndes SubcréditoG-K | 60 | — | 339 | 2,037 | 1,697 | — | — | 60 | 4,073 | 7.05% | 7.05% | ||||||||||||||||||||||||||||||||||||
— | Mahal Emprendimientos Pat. S.A. | Brazilian Real | Bndes SubcréditoH-L | 19 | — | 504 | 2,020 | 1,514 | — | — | 19 | 4,038 | 11.11% | 11.11% | ||||||||||||||||||||||||||||||||||||
|
|
|
|
|
|
|
|
|
|
|
|
|
|
|
|
|
| |||||||||||||||||||||||||||||||||
| Total | 134,140 | 61,483 | 392,139 | 95,673 | 92,601 | 58,576 | 93,001 | 195,623 | 731,990 | |||||||||||||||||||||||||||||||||||||||||
|
|
|
|
|
|
|
|
|
|
|
|
|
|
|
|
|
| |||||||||||||||||||||||||||||||||
December 31, 2016 | Maturity | Total | ||||||||||||||||||||||||||||||||||||||||||||||||
Tax ID | Name | Currency | Name - Country Bonds | Up to 3 months ThU.S.$ | 3 to 12 months ThU.S.$ | 1 to 2 years ThU.S.$ | 2 to 3 years ThU.S.$ | 3 to 4 years ThU.S.$ | 4 to 5 years ThU.S.$ | More than 5 years ThU.S.$ | Current ThU.S.$ | Non Current ThU.S.$ | Effective rate | Nominal rate | ||||||||||||||||||||||||||||||||||||
93.458.000-1 | Celulosa Arauco y Constitución S.A. | U.F. | Barau-F | — | 1,931 | 11,587 | 29,091 | 27,486 | 33,383 | 180,490 | 1,931 | 282,037 | 4.24 | % | 4.21 | % | ||||||||||||||||||||||||||||||||||
93.458.000-1 | Celulosa Arauco y Constitución S.A. | U.F. | Barau-J | 2,115 | — | 6,344 | 6,344 | 203,030 | — | — | 2,115 | 215,718 | 3.23 | % | 3.22 | % | ||||||||||||||||||||||||||||||||||
93.458.000-1 | Celulosa Arauco y Constitución S.A. | U.F. | Barau-P | — | 996 | 7,794 | 7,794 | 7,794 | 7,794 | 242,571 | 996 | 273,747 | 3.96 | % | 3.96 | % | ||||||||||||||||||||||||||||||||||
93.458.000-1 | Celulosa Arauco y Constitución S.A. | U.F. | Barau-Q | 586 | 9,839 | 21,758 | 21,172 | 20,586 | 10,073 | — | 10,425 | 73,589 | 2.96 | % | 2.98 | % | ||||||||||||||||||||||||||||||||||
93.458.000-1 | Celulosa Arauco y Constitución S.A. | U.F. | Barau-R | 1,755 | — | 7,022 | 7,022 | 7,022 | 7,022 | 290,572 | 1,755 | 318,660 | 3.57 | % | 3.57 | % | ||||||||||||||||||||||||||||||||||
93.458.000-1 | Celulosa Arauco y Constitución S.A. | U.F. | Barau-S | — | 600 | 4,695 | 4,695 | 4,695 | 4,695 | 210,785 | 600 | 229,565 | 2.44 | % | 2.89 | % | ||||||||||||||||||||||||||||||||||
— | Arauco Argentina S.A. | U.S. Dollar | Bono 144 A – Argentina | — | 270,787 | — | — | — | — | — | 270,787 | — | 6.39 | % | 6.38 | % | ||||||||||||||||||||||||||||||||||
93.458.000-1 | Celulosa Arauco y Constitución S.A. | U.S. Dollar | Yankee Bonds 2019 | 15,205 | — | 36,250 | 534,254 | — | — | — | 15,205 | 570,504 | 7.26 | % | 7.25 | % | ||||||||||||||||||||||||||||||||||
93.458.000-1 | Celulosa Arauco y Constitución S.A. | U.S. Dollar | Yankee Bonds 2nd Emission | 2,734 | 124,949 | — | — | — | — | — | 127,683 | — | 7.50 | % | 7.50 | % | ||||||||||||||||||||||||||||||||||
93.458.000-1 | Celulosa Arauco y Constitución S.A. | U.S. Dollar | Yankee 2021 | 8,889 | — | 20,000 | 20,000 | 20,000 | 406,926 | — | 8,889 | 466,926 | 5.02 | % | 5.00 | % | ||||||||||||||||||||||||||||||||||
93.458.000-1 | Celulosa Arauco y Constitución S.A. | U.S. Dollar | Yankee 2022 | 11,215 | — | 23,750 | 23,750 | 23,750 | 23,750 | 504,895 | 11,215 | 599,895 | 4.77 | % | 4.75 | % | ||||||||||||||||||||||||||||||||||
93.458.000-1 | Celulosa Arauco y Constitución S.A. | U.S. Dollar | Yankee 2024 | 9,376 | — | 22,500 | 22,500 | 22,500 | 22,500 | 569,625 | 9,376 | 659,625 | 4.52 | % | 4.50 | % | ||||||||||||||||||||||||||||||||||
|
|
|
|
|
|
|
|
|
|
|
|
|
|
|
|
|
| |||||||||||||||||||||||||||||||||
| Total | 51,875 | 409,102 | 161,700 | 676,622 | 336,863 | 516,143 | 1,998,938 | 460,977 | 3,690,266 | |||||||||||||||||||||||||||||||||||||||||
|
|
|
|
|
|
|
|
|
|
|
|
|
|
|
|
|
| |||||||||||||||||||||||||||||||||
December 31, 2016 | Maturity | Total | ||||||||||||||||||||||||||||||||||||||||||||||||
Tax ID | Name | Currency | Name - Country Lease | Up to 3 months ThU.S.$ | 3 to 12 months ThU.S.$ | 1 to 2 years ThU.S.$ | 2 to 3 years ThU.S.$ | 3 to 4 years ThU.S.$ | 4 to 5 years ThU.S.$ | More than 5 years ThU.S.$ | Current ThU.S.$ | Non Current ThU.S.$ | Effective rate | Nominal rate | ||||||||||||||||||||||||||||||||||||
85.805.200-9 | Forestal Arauco S.A. | U.F. | Banco Santander | 237 | 1,616 | — | 1,179 | — | 1,201 | — | 1,853 | 2,380 | — | — | ||||||||||||||||||||||||||||||||||||
85.805.200-9 | Forestal Arauco S.A. | U.F. | Banco Scotiabank | 1,571 | 4,970 | — | 7,731 | — | 4,259 | — | 6,541 | 11,990 | — | — | ||||||||||||||||||||||||||||||||||||
85.805.200-9 | Forestal Arauco S.A. | U.F. | Banco Estado | 645 | 2,008 | — | 5,092 | — | 2,035 | — | 2,653 | 7,127 | — | — | ||||||||||||||||||||||||||||||||||||
85.805.200-9 | Forestal Arauco S.A. | U.F. | Banco de Chile | 3,294 | 10,861 | — | 16,861 | — | 8,906 | — | 14,155 | 25,767 | — | — | ||||||||||||||||||||||||||||||||||||
85.805.200-9 | Forestal Arauco S.A. | U.F. | Banco BBVA | 1,673 | 5,030 | — | 4,663 | — | 183 | — | 6,703 | 4,846 | — | — | ||||||||||||||||||||||||||||||||||||
85.805.200-9 | Forestal Arauco S.A. | U.F. | Banco Credito e Inversiones | 982 | 2,994 | — | 7,501 | — | 2,824 | — | 3,976 | 10,325 | — | — | ||||||||||||||||||||||||||||||||||||
85.805.200-9 | Forestal Arauco S.A. | Chilean Pesos | Banco Santander | 46 | 138 | — | 61 | — | — | — | 184 | 61 | — | — | ||||||||||||||||||||||||||||||||||||
85.805.200-9 | Forestal Arauco S.A. | Chilean Pesos | Banco Chile | 439 | 1,317 | — | 2,418 | — | 929 | — | 1,756 | 3,347 | — | — | ||||||||||||||||||||||||||||||||||||
85.805.200-9 | Forestal Arauco S.A. | Chilean Pesos | Banco Credito e Inversiones | 647 | 1,932 | — | 5,053 | — | 2,690 | — | 2,579 | 7,743 | — | — | ||||||||||||||||||||||||||||||||||||
|
|
|
|
|
|
|
|
|
|
|
|
|
|
|
|
|
| |||||||||||||||||||||||||||||||||
| Total | 9,534 | 30,866 | — | 50,559 | — | 23,027 | — | 40,400 | 73,586 | |||||||||||||||||||||||||||||||||||||||||
|
|
|
|
|
|
|
|
|
|
|
|
|
|
|
|
|
| |||||||||||||||||||||||||||||||||
As part of the policy of Arauco, it considers compliance with all Accounts Payable, whether with related (see Note 13) or third parties, within a period not exceeding 30 days.
109
Table of Contents
CELULOSA ARAUCO Y CONSTITUCION S.A.
AND SUBSIDIARIES
Unaudited Consolidated Financial Statements
December 31, 2017
Amounts in thousands of U.S. dollars, except as indicated
Guarantees
As of the date of these consolidated financial statements, Arauco has financial assets of approximately MU.S.$55 that have been pledged to third parties (beneficiaries), as direct guarantee. If Arauco does not fulfill its obligations, the guarantors could execute the guarantees.
As of December 31, 2017, the total assets pledged as an indirect guarantee were MU.S.$602. In contrast to direct guarantees, indirect guarantees are given to secure obligations assumed by a third party.
On September 29, 2011, Arauco entered into a Security Agreement under which it granted anon-joint guarantee limited to 50% of the obligations of the Uruguayan companies (joint ventures) Celulosa y Energía Punta Pereira S.A. and Zona Franca Punta Pereira S.A., under the IDB Facility Agreement in the amount of up to MU.S.$454 and the Finnevera Guaranteed Facility Agreement in the amount of up to MU.S.$900. Both loan agreements were signed with the International Development Bank. Such guarantee is included in the table below, under indirect guarantees.
Direct and indirect guarantees granted by Arauco:
DIRECT
Subsidiary | Guarantee | Assets | Currency | ThU.S.$ | Guarantor | |||||
Celulosa Arauco y Constitución S.A. | Guarantee letter | — | Chilean Pesos | 488 | Directorate General of Maritime Territory and Merchant Marine | |||||
Celulosa Arauco y Constitución S.A. | Guarantee letter | — | Chilean Pesos | 313 | Directorate General of Maritime Territory and Merchant Marine | |||||
Celulosa Arauco y Constitución S.A. | Guarantee letter | — | Chilean Pesos | 230 | Directorate General of Maritime Territory and Merchant Marine | |||||
Celulosa Arauco y Constitución S.A. | Guarantee letter | — | Chilean Pesos | 209 | Directorate General of Maritime Territory and Merchant Marine | |||||
Celulosa Arauco y Constitución S.A. | Guarantee letter | — | Chilean Pesos | 100 | National Customs Service | |||||
Arauco Forest Brasil S.A. | Mortgage Industrial Plant of Jaguariaíva of Arauco do Brasil | — | U.S. Dollar | 46.346 | BNDES | |||||
Arauco Forest Brasil S.A. | Endorsement of ADB + Guarantee Letter AISA | — | U.S. Dollar | 3.539 | Bank Votorantim S.A. | |||||
Arauco Forest Brasil S.A. | Endorsement of Arauco do Brasil | — | U.S. Dollar | 645 | Bank Votorantim S.A. | |||||
Arauco Forest Brasil S.A. | Equipment | Property plant and equipment | U.S. Dollar | 224 | Bank Santander S.A. | |||||
Arauco Forest Brasil S.A. | Equipment | Property plant and equipment | U.S. Dollar | 134 | Bank Bradesco S.A. | |||||
Arauco Forest Brasil S.A. | Equipment | Property plant and equipment | U.S. Dollar | 113 | Bank Bradesco S.A. | |||||
Arauco Forest Brasil S.A. | Equipment | Property plant and equipment | U.S. Dollar | 97 | Bank Bradesco S.A. | |||||
Arauco do Brasil S.A. | Equipment | Property plant and equipment | U.S. Dollar | 209 | Bank Santander S.A. | |||||
Arauco do Brasil S.A. | Equipment | Property plant and equipment | U.S. Dollar | 206 | Bank Alpha S.A. | |||||
Arauco Florestal Arapoti S.A. | Endorsement of Arauco do Brasil | — | U.S. Dollar | 727 | Bank Votorantim S.A. | |||||
Arauco Florestal Arapoti S.A. | Equipment | Property plant and equipment | U.S. Dollar | 389 | Bank Safra S.A. | |||||
Arauco Florestal Arapoti S.A. | Equipment | Property plant and equipment | U.S. Dollar | 232 | Bank Santander S.A. | |||||
Arauco Florestal Arapoti S.A. | Equipment | Property plant and equipment | U.S. Dollar | 201 | Bank Itaú BBA S.A. | |||||
Arauco Florestal Arapoti S.A. | Equipment | Property plant and equipment | U.S. Dollar | 96 | Bank Bradesco S.A. | |||||
Arauco Bioenergía S.A. | Guarantee letter | — | Chilean Pesos | 185 | Minera Escondida Ltda. | |||||
Arauco Bioenergía S.A. | Guarantee letter | — | Chilean Pesos | 121 | CODELCO S.A. | |||||
| Total | 54.804 | |||||||||
| ||||||||||
INDIRECT
| ||||||||||
Subsidiary | Guarantee | Assets | Currency | ThU.S.$ | Guarantor | |||||
Celulosa Arauco y Constitución S.A. | Suretyship not supportive and cumulative | — | U.S. Dollar | 408.351 | Joint Ventures (Uruguay) | |||||
Celulosa Arauco y Constitución S.A. | Full Guarantee | — | U.S. Dollar | 131.000 | Arauco Forest Brasil y Mahal (Brazil) | |||||
Celulosa Arauco y Constitución S.A. | Guarantee letter | — | U.S. Dollar | 4.362 | Arauco Forest Brasil y Mahal (Brazil) | |||||
Celulosa Arauco y Constitución S.A. | Guarantee letter | — | Brazilian Real | 14.593 | Arauco Forest Brasil y Mahal (Brazil) | |||||
Celulosa Arauco y Constitución S.A. | Guarantee letter | — | U.S. Dollar | 43.896 | Masisa S.A. | |||||
| Total | 602.202 | |||||||||
| ||||||||||
23.10.3 Type of Risk: Market Risk – Exchange Rate
Description
Market risk arises from the probability of being affected by losses from fluctuations in currencies exchange rates in which assets and liabilities are denominated, in a functional currency other than the functional currency of Arauco.
110
Table of Contents
CELULOSA ARAUCO Y CONSTITUCION S.A.
AND SUBSIDIARIES
Unaudited Consolidated Financial Statements
December 31, 2017
Amounts in thousands of U.S. dollars, except as indicated
Explanation of Currency Risk Exposure and How This Risk Arises
Arauco is exposed to the foreign currency risk from currency fluctuations arising from sales, purchases and obligations undertaken in foreign currencies, such as the Chilean Peso, Euro, Brazilian Real or other foreign currencies. In the case of significant exchange rate variations, the Chilean Peso is the currency that represents the main currency risk. See Note 11 for details assets and liabilities classified by currency.
Explanation of Risk Management Objectives, Policies and Processes, and Measurement Methods
Arauco performs sensitivity analyses to measure the effect of this variable on equity and net result.
Sensitivity analysis considers a variation of +/- 10% of the exchange rate over the Chilean Peso. This fluctuation range is considered possible given current market conditions as of the date of these financial statements. With all other variables at a constant rate, a U.S. Dollar exchange rate variation of +/- 10% in relation to the Chilean Peso would mean a change in the net income year after tax +/- 9.98% (equivalent to ThU.S.$ +/- 26,968), and +/- 0.23% of equity (equivalent to ThU.S.$ +/- 16,181).
Additionally, a sensitivity analysis is carried out assuming a variation of +/- 10% in the closing exchange rate on the Brazilian Real, which is considered a possible range of fluctuation given the market conditions as of the date of these financial statements. With all the other variables constant, a variation of +/- 10% in the exchange rate of the dollar on the Brazilian Real would mean a variation on the net income after tax +/- 1,67% (equivalent to ThU.S.$4,500) and a change on the equity of +/- 0.04% (equivalent to ThU.S.$2,700).
23.10.4 Type of Risk: Market Risk – Interest rate risk
Description
Interest rate risk refers to the sensitivity of the value of financial assets and liabilities in terms of interest rate fluctuations.
Explanation of Interest Rate Risk Exposure and How This Risk Arises
Arauco is exposed to risks due to interest rate fluctuations for bonds issued, bank borrowings and financial instruments that bear interest at a variable rate.
Explanation of Risk Management Objectives, Policies and Processes, and Measurement Methods
Arauco completes its risk analysis by reviewing its exposure to changes in interest rates. As of December 31, 2017, 14% our financial debt accrues interest at variable rates. A change of +/- 10% in the interest rate is considered a possible range of fluctuation. Such market conditions would affect the income after tax at rate of +/- 0.41% (equivalent to ThU.S.$-/+ 1,097) and +/- 0.01% (equivalent to ThU.S.$-/+ 658) on equity.
111
Table of Contents
CELULOSA ARAUCO Y CONSTITUCION S.A.
AND SUBSIDIARIES
Unaudited Consolidated Financial Statements
December 31, 2017
Amounts in thousands of U.S. dollars, except as indicated
Thousands of dollars | December 2017 ThU.S.$ | Total | ||||||
Fixed rate | 3,676,210 | 86.0 | % | |||||
Bonds issued | 3,302,685 | |||||||
Bank borrowings (*) | 261,149 | |||||||
Financial leasing | 112,376 | |||||||
Variable rate | 597,308 | 14.0 | % | |||||
Bonds issued | — | |||||||
Loans with Banks | 597,308 | |||||||
Total | 4,273,518 | 100.0 | % | |||||
|
|
|
| |||||
Thousands of dollars | December 2016 ThU.S.$ | Total | ||||||
Fixed rate | 3,903,942 | 87.1 | % | |||||
Bonds issued | 3,452,659 | |||||||
Bank borrowings (*) | 337,297 | |||||||
Financial leasing | 113,986 | |||||||
Variable rate | 577,061 | 12.9 | % | |||||
Bonds issued | — | |||||||
Loans with Banks | 577,061 | |||||||
Total | 4,481,003 | 100.0 | % | |||||
|
|
|
| |||||
| (*) | Includes variable rate bank borrowings changed by fixed rate swaps. |
23.10.5 Type of Risk: Market Risk – Price of Pulp Risks
Description
Pulp prices are determined by world and regional market conditions. Prices fluctuate based on demand, production capacity, commercial strategies adopted by large-scale forestry companies, pulp and paper producers and by the availability of substitutes.
Explanation of Price Risk Exposure and How This Risk Arises
Pulp prices are reflected in revenue from sales and directly affect the net income for the period.
As of December 31, 2017, revenue due to pulp sales accounted for 46.8% of total sales. Pulp prices are fixed on a monthly basis in accordance with the market. Forward contracts or other financial instruments are not used for pulp sales.
Explanation of Risk Management Objectives, Policies and Processes, and Measurement Methods
This risk is approached in different ways. Arauco has a team of specialists who perform periodic market and competition analyses, providing tools to analyze and evaluate trends and adjust forecasts. Similarly, Arauco performs price financial sensitivity analysis in order to take the necessary safeguards to confront different scenarios in the best possible manner.
Sensitivity analysis considers a variation of +/- 10% in the average pulp price, a possible fluctuation range given current market conditions at the date of the closing balance. With all other variables constant, a variation of +/- 10% in the average pulp price would mean a variation of +/- 72.94% (equivalent to ThU.S.$ 197,022) on the income for the year after tax and +/- 1.66% (equivalent to ThU.S.$118,213) on equity.
112
Table of Contents
CELULOSA ARAUCO Y CONSTITUCION S.A.
AND SUBSIDIARIES
Unaudited Consolidated Financial Statements
December 31, 2017
Amounts in thousands of U.S. dollars, except as indicated
NOTE 24. REPORTABLE SEGMENTS
The main products that generate revenue for each reportable segment are described as follows:
| • | Pulp: The main products sold by this reportable segment are long fiber bleached pulp (BSKP), short fiber bleached pulp (BHKP), long fiber raw pulp (UKP), and pulp fluff. |
| • | Timber: The range of products sold by this reportable segment are plywood panels, MDF panels (medium density fiberboard), Hardboard Panels, PB Panels (agglomerated) different sizes of sawn wood and remanufactured products such as moldings, precut pieces and finger joints. |
| • | Forestry: This reportable segment produces and sells sawn logs, pulpable logs, posts and chips made from owned forests of Radiata and Taeda pine, eucalyptus globulus and nitens forests. Additionally, purchases logs and woodchip from third parties, which it sells to its other reportable segment. |
Pulp
The Pulp reportable segment uses wood exclusively from pine and eucalyptus plantations for the production of different classes of wood cellulose or pulp. Bleached pulp is mainly used as raw material for producing printing and writing paper, as well as toilet paper and high quality wrapping paper. Unbleached pulp is used to produce packing paper, filters, fiber cement products, dielectric paper and others. On the other hand, fluff pulp is mainly used in the production of diapers and female hygiene products.
Arauco has seven plants, five in Chile, one in Argentina and one in Uruguay and they have a total production capacity of approximately 3.9 million tons per year. Pulp is sold in more than 45 countries, mainly in Asia and Europe.
113
Table of Contents
CELULOSA ARAUCO Y CONSTITUCION S.A.
AND SUBSIDIARIES
Unaudited Consolidated Financial Statements
December 31, 2017
Amounts in thousands of U.S. dollars, except as indicated
Timber
The Panels area produces a wide range of panel products and several kinds of moldings aimed at the furniture, decoration and construction industries. It consists of 19 industrial plants: 5 in Chile, 2 in Argentina, 4 in Brazil, and 8 plants around USA and Canada. The Company has a total annual production capacity of 6.8 million cubic meters of PBO, MDF, Hardboards, plywood and moldings.
Through the joint venture Sonae Arauco (see note 16), Arauco produces and sells wood panels, of the type of MDF, PB and OSB, and sawn timber, through the operation of 2 panel plants and one sawmill in Spain; 2 panel plants and one resin plant in Portugal; 4 panel plants in Germany and 2 panel plants in South Africa.
In total, Sonae Arauco’s production capacity is approximately 1.4 million m3 of MDF, 2.1 million m3 of PB, 486,000 m3 of OSB and 50,000 m3 of sawn lumber.
The Sawn Timber area produces a wide range of wood and remanufactured products with different kinds of uses and appearances, which include a wide variety of uses in the furniture, packing, construction and refurbishing industries.
With 8 saw mills in operation (7 in Chile and 1 in Argentina), the Company has a production capacity of 3 million m3 of sawn wood.
Furthermore, the Company has 5 remanufacturing plants, 4 in Chile and 1 in Argentina. These plants reprocess sawn wood and produce high quality remanufactured products, such as finger joint and solid moldings as well as precut pieces.
Forestry
The Forestry reportable segment is Arauco’s core business. It provides raw materials for all products manufactured and sold by the Company. By directly controlling the growth of the forests to be processed, Arauco guarantees itself quality wood for each of its products.
Arauco holds forestry assets distributed throughout Chile, Argentina, Brazil and Uruguay, reaching 1.7 million hectares as of December 31, 2017, of which 1 million hectares are used for plantations, 431 thousand hectares for native forests, 195 thousand hectares for other uses and 99 thousand hectares are to be planted.
Arauco’s principal plantations consist of radiata and taeda pine and eucalyptus to a lesser degree. These are species that have fast growth rates and short harvest cycles compared with other long fiber commercial woods.
Arauco has no customers representing 10% or more of its revenues.
Below, please find summarized information concerning the assets, liabilities and profits and losses at the end of each period, by segments. The profit (loss) of each segment informed takes into consideration that taxes and income and financial costs have not been allocated to the various segments, and are shown as part of the Corporate’s segment:
114
Table of Contents
CELULOSA ARAUCO Y CONSTITUCION S.A.
AND SUBSIDIARIES
Unaudited Consolidated Financial Statements
December 31, 2017
Amounts in thousands of U.S. dollars, except as indicated
Year ended December 31, 2017 | Pulp ThU.S.$ | Forestry ThU.S.$ | Timber ThU.S.$ | Others ThU.S.$ | Corporate ThU.S.$ | Sub Total ThU.S.$ | Elimination ThU.S.$ | Total ThU.S.$ | ||||||||||||||||||||||||
Revenues from external customers | 2,451,363 | 114,122 | 2,625,198 | 47,658 | — | 5,238,341 | — | 5,238,341 | ||||||||||||||||||||||||
Revenues from transactions with other operating segments | 43,829 | 970,384 | 6,297 | 35,659 | — | 1,056,169 | (1,056,169 | ) | — | |||||||||||||||||||||||
|
|
|
|
|
|
|
|
|
|
|
|
|
|
|
| |||||||||||||||||
Finance income | — | — | — | — | 19,640 | 19,640 | — | 19,640 | ||||||||||||||||||||||||
Finance costs | — | — | — | — | (287,958 | ) | (287,958 | ) | — | (287,958 | ) | |||||||||||||||||||||
Net finance costs | — | — | — | — | (268,318 | ) | (268,318 | ) | — | (268,318 | ) | |||||||||||||||||||||
|
|
|
|
|
|
|
|
|
|
|
|
|
|
|
| |||||||||||||||||
Depreciation and amortizations | 246,382 | 22,011 | 142,504 | 3,568 | 7,086 | 421,551 | — | 421,551 | ||||||||||||||||||||||||
Sum of significant income accounts | 581 | 91,089 | 1,304 | — | — | 92,974 | — | 92,974 | ||||||||||||||||||||||||
Sum of significant expense accounts | — | 138,139 | 3,333 | — | — | 141,472 | — | 141,472 | ||||||||||||||||||||||||
|
|
|
|
|
|
|
|
|
|
|
|
|
|
|
| |||||||||||||||||
Profit (loss) of each reportable segment | 589,934 | (210,566 | ) | 221,368 | 10,617 | (341,001 | ) | 270,352 | — | 270,352 | ||||||||||||||||||||||
|
|
|
|
|
|
|
|
|
|
|
|
|
|
|
| |||||||||||||||||
Share of profit (loss) of associates and joint ventures accounted for using equity method | ||||||||||||||||||||||||||||||||
Associates | — | — | — | — | 4,855 | 4,855 | — | 4,855 | ||||||||||||||||||||||||
Joint ventures | — | — | 10,378 | — | 1,784 | 12,162 | — | 12,162 | ||||||||||||||||||||||||
|
|
|
|
|
|
|
|
|
|
|
|
|
|
|
| |||||||||||||||||
Income tax expense | — | — | — | — | 30,992 | 30,992 | — | 30,992 | ||||||||||||||||||||||||
|
|
|
|
|
|
|
|
|
|
|
|
|
|
|
| |||||||||||||||||
Geographical information on revenues | ||||||||||||||||||||||||||||||||
Revenue – Chilean entities | 1,781,769 | 55,946 | 1,265,161 | 692 | — | 3,103,568 | — | 3,103,568 | ||||||||||||||||||||||||
Revenue – Foreign entities | 669,594 | 58,176 | 1,360,037 | 46,966 | — | 2,134,773 | — | 2,134,773 | ||||||||||||||||||||||||
Total Ordinary Income | 2,451,363 | 114,122 | 2,625,198 | 47,658 | — | 5,238,341 | — | 5,238,341 | ||||||||||||||||||||||||
|
|
|
|
|
|
|
|
|
|
|
|
|
|
|
| |||||||||||||||||
Year ended December 31, 2017 | Pulp ThU.S.$ | Forestry ThU.S.$ | Timber ThU.S.$ | Others ThU.S.$ | Corporate ThU.S.$ | Sub Total ThU.S.$ | Elimination ThU.S.$ | Total ThU.S.$ | ||||||||||||||||||||||||
Amounts of additions tonon-current assets | ||||||||||||||||||||||||||||||||
Acquisition of property, plant and equipment and biological assets | 191,771 | 211,245 | 230,395 | 428 | 4,127 | 637,966 | — | 637,966 | ||||||||||||||||||||||||
Acquisition and contribution of investments in associates and joint venture | — | — | — | — | 15,918 | 15,918 | — | 15,918 | ||||||||||||||||||||||||
|
|
|
|
|
|
|
|
|
|
|
|
|
|
|
| |||||||||||||||||
Year ended December 31, 2017 | Pulp ThU.S.$ | Forestry ThU.S.$ | Panels ThU.S.$ | Others ThU.S.$ | Corporate ThU.S.$ | Sub Total ThU.S.$ | Elimination ThU.S.$ | Total ThU.S.$ | ||||||||||||||||||||||||
Segment assets | 5,035,105 | 5,040,500 | 3,024,120 | 52,640 | 881,000 | 14,033,365 | (38,765 | ) | 13,994,600 | |||||||||||||||||||||||
Segments assets (excluding deferred tax assets) | 5,035,105 | 5,040,500 | 3,024,120 | 52,640 | 872,734 | 14,025,099 | (38,765 | ) | 13,986,334 | |||||||||||||||||||||||
Deferred tax assets | — | — | — | — | 8,266 | 8,266 | — | 8,266 | ||||||||||||||||||||||||
Investments accounted through equity method | ||||||||||||||||||||||||||||||||
Associates | — | 48,921 | — | — | 110,046 | 158,967 | — | 158,967 | ||||||||||||||||||||||||
Joint Ventures | — | — | 189,568 | — | 20,237 | 209,805 | — | 209,805 | ||||||||||||||||||||||||
Segment liabilities | 325,598 | 184,721 | 489,022 | 16,100 | 5,862,266 | 6,877,707 | — | 6,877,707 | ||||||||||||||||||||||||
Segment liabilities (excluding deferred tax liabilities) | 325,598 | 184,721 | 489,022 | 16,100 | 4,376,902 | 5,392,343 | — | 5,392,343 | ||||||||||||||||||||||||
Deferred tax liabilities | — | — | — | — | 1,485,364 | 1,485,364 | — | 1,485,364 | ||||||||||||||||||||||||
|
|
|
|
|
|
|
|
|
|
|
|
|
|
|
| |||||||||||||||||
Geographical information onnon-current assets | ||||||||||||||||||||||||||||||||
Chile | 2,537,947 | 3,221,911 | 666,234 | 22,220 | 187,639 | 6,635,951 | (4,635 | ) | 6,631,316 | |||||||||||||||||||||||
Foreign countries | 1,700,240 | 1,648,557 | 1,191,895 | 21,571 | 30,658 | 4,592,921 | — | 4,592,921 | ||||||||||||||||||||||||
Non-current assets, Total | 4,238,187 | 4,870,468 | 1,858,129 | 43,791 | 218,297 | 11,228,872 | (4,635 | ) | 11,224,237 | |||||||||||||||||||||||
|
|
|
|
|
|
|
|
|
|
|
|
|
|
|
| |||||||||||||||||
115
Table of Contents
CELULOSA ARAUCO Y CONSTITUCION S.A.
AND SUBSIDIARIES
Unaudited Consolidated Financial Statements
December 31, 2017
Amounts in thousands of U.S. dollars, except as indicated
Year ended December 31, 2016 | Pulp ThU.S.$ | Forestry ThU.S.$ | Timber ThU.S.$ | Others ThU.S.$ | Corporate ThU.S.$ | Sub Total ThU.S.$ | Elimination ThU.S.$ | Total ThU.S.$ | ||||||||||||||||||||||||
Revenues from external customers | 2,146,079 | 96,488 | 2,494,750 | 24,068 | — | 4,761,385 | — | 4,761,385 | ||||||||||||||||||||||||
Revenues from transactions with other reportable segments | 41,586 | 1,105,220 | 6,938 | 34,085 | — | 1,187,829 | (1,187,829 | ) | — | |||||||||||||||||||||||
|
|
|
|
|
|
|
|
|
|
|
|
|
|
|
| |||||||||||||||||
Finance income | — | — | — | — | 29,701 | 29,701 | — | 29,701 | ||||||||||||||||||||||||
Finance costs | — | — | — | — | (258,467 | ) | (258,467 | ) | — | (258,467 | ) | |||||||||||||||||||||
Net finance costs | — | — | — | — | (228,766 | ) | (228,766 | ) | — | (228,766 | ) | |||||||||||||||||||||
|
|
|
|
|
|
|
|
|
|
|
|
|
|
|
| |||||||||||||||||
Depreciation and amortizations | 240,699 | 19,996 | 139,844 | 2,529 | 6,319 | 409,387 | — | 409,387 | ||||||||||||||||||||||||
Sum of significant income accounts | 212 | 227,776 | 269 | — | — | 228,257 | — | 228,257 | ||||||||||||||||||||||||
Sum of significant expense accounts | — | 15,193 | 12,565 | — | — | 27,758 | — | 27,758 | ||||||||||||||||||||||||
|
|
|
|
|
|
|
|
|
|
|
|
|
|
|
| |||||||||||||||||
Profit (loss) of each reportable segment | 308,536 | 98,955 | 165,887 | (2,559 | ) | (353,242 | ) | 217,577 | — | 217,577 | ||||||||||||||||||||||
|
|
|
|
|
|
|
|
|
|
|
|
|
|
|
| |||||||||||||||||
Share of profit (loss) of associates and joint ventures accounted for using equity method | ||||||||||||||||||||||||||||||||
Associates | — | — | — | — | 16,348 | 16,348 | — | 16,348 | ||||||||||||||||||||||||
Joint ventures | — | — | 5,475 | — | 2,116 | 7,591 | — | 7,591 | ||||||||||||||||||||||||
|
|
|
|
|
|
|
|
|
|
|
|
|
|
|
| |||||||||||||||||
Income tax expense | — | — | — | — | (45,647 | ) | (45,647 | ) | — | (45,647 | ) | |||||||||||||||||||||
|
|
|
|
|
|
|
|
|
|
|
|
|
|
|
| |||||||||||||||||
Geographical information on revenues | ||||||||||||||||||||||||||||||||
Revenue – Chilean entities | 1,756,659 | 52,161 | 1,275,937 | 885 | — | 3,085,642 | — | 3,085,642 | ||||||||||||||||||||||||
Revenue – Foreign entities | 389,420 | 44,327 | 1,218,813 | 23,183 | — | 1,675,743 | — | 1,675,743 | ||||||||||||||||||||||||
Total Ordinary Income | 2,146,079 | 96,488 | 2,494,750 | 24,068 | — | 4,761,385 | — | 4,761,385 | ||||||||||||||||||||||||
|
|
|
|
|
|
|
|
|
|
|
|
|
|
|
| |||||||||||||||||
Year ended December 31, 2016 | Pulp ThU.S.$ | Forestry ThU.S.$ | Timber ThU.S.$ | Others ThU.S.$ | Corporate ThU.S.$ | Sub Total ThU.S.$ | Elimination ThU.S.$ | Total ThU.S.$ | ||||||||||||||||||||||||
Amounts of additions tonon-current assets | ||||||||||||||||||||||||||||||||
Acquisition of property, plant and equipment and biological assets | 205,205 | 182,743 | 118,408 | 1,479 | 3,883 | 511,718 | — | 511,718 | ||||||||||||||||||||||||
Acquisition and contribution of investments in associates and joint venture | — | — | 153,135 | — | — | 153,135 | — | 153,135 | ||||||||||||||||||||||||
|
|
|
|
|
|
|
|
|
|
|
|
|
|
|
| |||||||||||||||||
Year ended December 31, 2016 | Pulp ThU.S.$ | Forestry ThU.S.$ | Timber ThU.S.$ | Others ThU.S.$ | Corporate ThU.S.$ | Sub Total ThU.S.$ | Elimination ThU.S.$ | Total ThU.S.$ | ||||||||||||||||||||||||
Segment assets | 5,077,300 | 5,492,364 | 2,515,092 | 30,970 | 932,059 | 14,047,785 | (41,604 | ) | 14,006,181 | |||||||||||||||||||||||
Segments assets (excluding deferred tax assets) | 5,077,300 | 5,492,364 | 2,515,092 | 30,970 | 925,962 | 14,041,688 | (41,604 | ) | 14,000,084 | |||||||||||||||||||||||
Deferred tax assets | — | — | — | — | 6,097 | 6,097 | — | 6,097 | ||||||||||||||||||||||||
Investments accounted through equity method | ||||||||||||||||||||||||||||||||
Associates | — | 160,490 | — | — | 105,285 | 265,775 | — | 265,775 | ||||||||||||||||||||||||
Joint Ventures | — | — | 161,703 | — | 19,070 | 180,773 | — | 180,773 | ||||||||||||||||||||||||
Segment liabilities | 277,474 | 161,091 | 311,667 | 11,836 | 6,244,830 | 7,006,898 | — | 7,006,898 | ||||||||||||||||||||||||
Segment liabilities (excluding deferred tax liabilities) | 277,474 | 161,091 | 311,667 | 11,836 | 4,613,765 | 5,375,833 | — | 5,375,833 | ||||||||||||||||||||||||
Deferred tax liabilities | — | — | — | — | 1,631,065 | 1,631,065 | — | 1,631,065 | ||||||||||||||||||||||||
|
|
|
|
|
|
|
|
|
|
|
|
|
|
|
| |||||||||||||||||
Geographical information onnon-current assets | ||||||||||||||||||||||||||||||||
Chile | 2,572,702 | 3,509,727 | 721,418 | 27 | 135,808 | 6,939,682 | (3,575 | ) | 6,936,107 | |||||||||||||||||||||||
Foreign countries | 1,740,559 | 1,525,190 | 1,016,633 | 23,040 | 42,292 | 4,347,714 | — | 4,347,714 | ||||||||||||||||||||||||
Non-current assets, Total | 4,313,261 | 5,034,917 | 1,738,051 | 23,067 | 178,100 | 11,287,396 | (3,575 | ) | 11,283,821 | |||||||||||||||||||||||
|
|
|
|
|
|
|
|
|
|
|
|
|
|
|
| |||||||||||||||||
116
Table of Contents
CELULOSA ARAUCO Y CONSTITUCION S.A.
AND SUBSIDIARIES
Unaudited Consolidated Financial Statements
December 31, 2017
Amounts in thousands of U.S. dollars, except as indicated
The following table shows information related to cash flows by segments which is presented as a complementary information as required by our regulatory entities:
Year ended December 31, 2017 | Pulp ThU.S.$ | Forestry ThU.S.$ | Panels ThU.S.$ | Others ThU.S.$ | Corporate ThU.S.$ | Sub Total ThU.S.$ | Elimination ThU.S.$ | Total ThU.S.$ | ||||||||||||||||||||||||
Segment Cash Flows | ||||||||||||||||||||||||||||||||
Cash Flows from (used in) Operating Activities | 709,344 | 258,488 | 418,721 | 7,389 | (321,517 | ) | 1,072,425 | — | 1,072,425 | |||||||||||||||||||||||
Cash flows (used in) investing activities | (190,450 | ) | (189,455 | ) | (244,243 | ) | (1,792 | ) | (7,408 | ) | (633,348 | ) | — | (633,348 | ) | |||||||||||||||||
Cash flows from (used in) Financing Activities | (77,163 | ) | — | (3,060 | ) | — | (358,878 | ) | (439,101 | ) | — | (439,101 | ) | |||||||||||||||||||
Net increase (decrease) in Cash and Cash Equivalents | 441,731 | 69,033 | 171,418 | 5,597 | (687,803 | ) | (24 | ) | — | (24 | ) | |||||||||||||||||||||
|
|
|
|
|
|
|
|
|
|
|
|
|
|
|
| |||||||||||||||||
Period ended December 31, 2016 | Pulp ThU.S.$ | Forestry ThU.S.$ | Panels ThU.S.$ | Others ThU.S.$ | Corporate ThU.S.$ | Sub Total ThU.S.$ | Elimination ThU.S.$ | Total ThU.S.$ | ||||||||||||||||||||||||
Segment Cash Flows | ||||||||||||||||||||||||||||||||
Cash Flows from (used in) Operating Activities | 501,565 | 243,162 | 382,075 | 2,610 | (355,828 | ) | 773,584 | — | 773,584 | |||||||||||||||||||||||
Cash flows (used in) investing activities | (206,424 | ) | (153,898 | ) | (275,100 | ) | (1,479 | ) | (3,311 | ) | (640,212 | ) | — | (640,212 | ) | |||||||||||||||||
Cash flows from (used in) Financing Activities | (92,006 | ) | 5,290 | (38,668 | ) | — | 86,900 | (38,484 | ) | — | (38,484 | ) | ||||||||||||||||||||
Net increase (decrease) in Cash and Cash Equivalents | 203,135 | 94,554 | 68,307 | 1,131 | (272,239 | ) | 94,888 | — | 94,888 | |||||||||||||||||||||||
|
|
|
|
|
|
|
|
|
|
|
|
|
|
|
| |||||||||||||||||
117
Table of Contents
CELULOSA ARAUCO Y CONSTITUCION S.A.
AND SUBSIDIARIES
Unaudited Consolidated Financial Statements
December 31, 2017
Amounts in thousands of U.S. dollars, except as indicated
Information required by geographic area:
| Geographical area | ||||||||||||||||||||||||
| 2017 | Local country | Foreign country | ||||||||||||||||||||||
| Chile | Argentina | Brazil | USA/Canada | Uruguay | Total | |||||||||||||||||||
Disclosure of geographical areas | ThU.S.$ | ThU.S.$ | ThU.S.$ | ThU.S.$ | ThU.S.$ | ThU.S.$ | ||||||||||||||||||
Revenues at12-31-2017 | 3,103,568 | 494,479 | 395,416 | 801,092 | 443,786 | 5,238,341 | ||||||||||||||||||
Non-current Assets at12-31-2017 other than deferred tax | 6,624,381 | 956,511 | 1,274,536 | 575,231 | 1,785,312 | 11,215,971 | ||||||||||||||||||
| Geographical area | ||||||||||||||||||||||||
| 2016 | Local country | Foreign country | ||||||||||||||||||||||
| Chile | Argentina | Brazil | USA/Canada | Uruguay | Total | |||||||||||||||||||
Disclosure of geographical areas | ThU.S.$ | ThU.S.$ | ThU.S.$ | ThU.S.$ | ThU.S.$ | ThU.S.$ | ||||||||||||||||||
Revenues at12-31-2016 | 3,085,642 | 360,224 | 354,170 | 779,356 | 181,993 | 4,761,385 | ||||||||||||||||||
Non-current Assets at12-31-2016 other than deferred tax | 6,931,755 | 960,596 | 1,186,538 | 397,924 | 1,800,911 | 11,277,724 | ||||||||||||||||||
118
Table of Contents
CELULOSA ARAUCO Y CONSTITUCION S.A.
AND SUBSIDIARIES
Unaudited Consolidated Financial Statements
December 31, 2017
Amounts in thousands of U.S. dollars, except as indicated
NOTE 25. OTHERNON-FINANCIAL ASSETS ANDNON-FINANCIAL LIABILITIES
Currentnon-financial assets | 12-31-2017 ThU.S.$ | 12-31-2016 ThU.S.$ | ||||||
Roads to amortize current | 43,301 | 41,812 | ||||||
Prepayment to amortize (insurance + others) | 21,257 | 23,086 | ||||||
Recoverable taxes (Relating to purchases) | 60,823 | 71,357 | ||||||
Other currentnon-financial assets | 4,456 | 8,660 | ||||||
Total | 129,837 | 144,915 | ||||||
|
|
|
| |||||
Non-currentnon-financial assets | 12-31-2017 ThU.S.$ | 12-31-2016 ThU.S.$ | ||||||
Roads to amortize,non-current | 112,937 | 121,894 | ||||||
Guarantee values | 2,893 | 3,302 | ||||||
Recoverable taxes | 1,835 | 1,493 | ||||||
Othernon-currentnon-financial assets | 3,856 | 3,630 | ||||||
Total | 121,521 | 130,319 | ||||||
|
|
|
| |||||
Currentnon-financial liabilities | 12-31-2017 ThU.S.$ | 12-31-2016 ThU.S.$ | ||||||
Provision of minimum dividend (1) | 116,123 | 60,312 | ||||||
ICMS tax payable | 12,593 | 14,856 | ||||||
Other tax payable | 23,040 | 16,202 | ||||||
Other Currentnon-financial liablities | 2,194 | 7,793 | ||||||
Total | 153,950 | 99,163 | ||||||
|
|
|
| |||||
| (1) | Provision includes a minimum dividend of subsidiary minority. |
Non-currentnon-financial liabilities | 12-31-2017 ThU.S.$ | 12-31-2016 ThU.S.$ | ||||||
ICMS tax payable | 110,532 | 58,606 | ||||||
Othernon-currentnon-financial liablities | 1,808 | 2,027 | ||||||
Total | 112,340 | 60,633 | ||||||
|
|
|
| |||||
119
Table of Contents
CELULOSA ARAUCO Y CONSTITUCION S.A.
AND SUBSIDIARIES
Unaudited Consolidated Financial Statements
December 31, 2017
Amounts in thousands of U.S. dollars, except as indicated
NOTE 26. DISTRIBUTABLE NET PROFIT AND EARNINGS PER SHARE
Distributable net profit
As a general policy, the Board of Directors of Arauco agreed that the net profit to be distributed as dividend is determined based on realized net gains/(losses) of any relevant variations in the value of unrealized assets and liabilities, which are excluded from the calculation of net profit during the period such changes are made.
As a result of the foregoing, for purposes of determining the distributable net profit of the Company, which is the same considered for calculating the minimum dividend required and additional dividend, the following unrealized gains/losses are excluded from the net profit for the year:
| 1) | Unrealized gains/losses relating to the fair value recorded for forestry assets under IAS 41, adding them back to distributable net profit when they are realized through sale or disposed of by other means. |
| 2) | Those generated through the acquisition of entities. These results will be added back to net profit when they are realized through sale. |
The deferred taxes associated with the amounts described in 1) and 2) above are also excluded.
The following table details the adjustments made for the determination of distributable net profit as December 31, 2017 and 2016 in order to determine the provision of 40% of the distributable net profit for each year:
| Distributable Net Profit ThU.S.$ | ||||
Net profit attributable to owners of parent at12-31-2017 | 269,724 | |||
Adjustments: | ||||
Biological Assets | ||||
Unrealized gains/losses | (82,782 | ) | ||
Realized gains/losses | 303,668 | |||
Deferred income taxes | (54,944 | ) | ||
|
| |||
Total adjustments | 165,942 | |||
|
| |||
Distributable Net Profit at12-31-2017 | 435,666 | |||
|
| |||
| Distributable Net Profit ThU.S.$ | ||||
Net profit attributable to owners of parent at12-31-2016 | 213,801 | |||
Adjustments: | ||||
Biological Assets | ||||
Unrealized gains/losses | (204,671 | ) | ||
Realized gains/losses | 210,223 | |||
Deferred income taxes | 2,089 | |||
|
| |||
Total adjustments | 7,641 | |||
|
| |||
Distributable Net Profit at12-31-2016 | 221,442 | |||
|
| |||
The Company expects to maintain its policy of distributing 40% of its net distributable profit as dividends for all future fiscal years, but will also consider the alternative of distributing a provisional dividend at year end.
120
Table of Contents
CELULOSA ARAUCO Y CONSTITUCION S.A.
AND SUBSIDIARIES
Unaudited Consolidated Financial Statements
December 31, 2017
Amounts in thousands of U.S. dollars, except as indicated
As of December 31, 2017, in the Statements of Financial Position, under the line item Other currentnon-financial liabilities ThU.S.$113,773 correspond to a provision for the minimum dividend for the 2017 period, corresponding to the Parent Company, after discounting the provisional dividend distribution of ThU.S.$60,494, paid to the shareholders in December 2017.
Basic and diluted earnings per share
Basic and diluted earnings per share are calculated by dividing the profit or loss attributable to ordinary equity holders of parent by the weighted average number of ordinary shares outstanding. Arauco does not have any shares with potential dilutive effect.
| January-December | ||||||||
2017 ThU.S.$ | 2016 ThU.S.$ | |||||||
Profit or loss attributable to ordinary equity holder of parent | 269,724 | 213,801 | ||||||
Weighted average of number of shares | 113,159,655 | 113,159,655 | ||||||
Basic and diluted earnings per share (in U.S.$ per share) | 2,3836 | 1,8894 | ||||||
121
Table of Contents
CELULOSA ARAUCO Y CONSTITUCION S.A.
AND SUBSIDIARIES
Unaudited Consolidated Financial Statements
December 31, 2017
Amounts in thousands of U.S. dollars, except as indicated
NOTE 27. SUBSEQUENT EVENTS
The authorization for the issuance and publication of these consolidated financial statements for the period ended December 31, 2017 was approved by the Board of Directors of Arauco at the Extraordinary Session No.584 held on March 19, 2018.
Subsequent to December 31, 2017 and until the date of issuance of these consolidated financial statements, there have been no events, other than those discussed above, that could materially affect the presentation of these financial statements.
122
Table of Contents
1 CELULOSA ARAUCO Y CONSTITUCIÓN S.A. Fourth Quarter 2017 Results March 19, 2018
Table of Contents
2 HIGHLIGHTS Readers are referred to the documents filed by Arauco with the United States Securities and Exchange Commission, specifically the most recent filing on Form 20-F that identifies important risk factors that could cause actual results to differ from those contained in the forward-looking statements. All forward-looking statements are based on information available to Arauco on the date hereof and Arauco does not assume any obligation to update such statements. References herein to “U.S.$” are to United States dollars. Discrepancies in any table between totals and sums of the amounts listed are due to rounding. This report is unaudited. NET INCOME U.S.$ 83.2 MILLION Net income reached U.S.$ 83.2 million, a decrease of 44.0% or U.S.$ 65.2million compared to the U.S.$ 148.4 million obtained in thethird quarter of 2017. And an increase of 9.8% or U.S.$ 7.4 million compared to the same quarter of 2016 LTM ADJUSTED EBITDA U.S.$ 1,366.4MILLION LTM Adjusted EBITDA reached U.S.$1,366.4 million, an increase of 29.9% or U.S.$ 314.3 millioncompared to the U.S.$1,052.1 million obtained during the full year 2016. Adjusted EBITDA reached U.S.$ 344.5 million during the fourth quarter, a decrease of 12.4% or U.S.$ 47.1million compared to the U.S.$ 391.6million obtained during the third quarterof 2017. NET FINANCIAL DEBT/ LTM ADJUSTED EBITDA2.7x (THE LOWEST SINCE2011) Net Financial Debt / LTM Adjusted EBITDA ratio reached 2.7x in this quarter, a decrease compared to the 2.9x obtained in the third quarter of 2017. CAPEX CAPEX reached U.S.$ 232.8 million, an increase of 37.8% or U.S.$ 63.8 million compared to the U.S.$ 169 million spent during the third quarter of 2017. REVENUES U.S.$ 1,331.3MILLION Arauco’s revenues reached U.S.$ 1,331.3 million during the fourth quarter of 2017,a4.5% decreasecompared to the U.S.$ 1,393.4million obtained in thethird quarter of 2017. And an increase of 9.1%comparedto the U.S.$ 1,220.6 obtained in the same quarter of 2016 Conference Call Tuesday, March 20th, 2018 10:30 Santiago Time 09:30 Eastern Time (New York) Please Dial: +1 (844) 839 2184 from USA +1 (412) 317 2505 from other countries Password: Arauco For more details on Arauco´s financial statements please refer to www.cmfchile.cl or www.arauco.cl For f
Table of Contents
3 OVERVIEW LTM Adjusted Ebitda reached U.S.$ 1,366.4 for December 2017, the highest since 2010. Consequently, our Net Debt/LTM Ebitda ratio reached 2.7x, the lowest since 2011. Arauco´s fourth quarter net income amounted U.S.$ 83.2 million, affected by a decrease in revenues due to lower sales volume, by higher financial costs due to the repurchase of bonds done in November 2017 and by positive income tax due to the reduction of the tax rate in Argentina and United States. Our Adjusted EBITDA Margin was 25.9%, a decreased of 7.9% compared to last quarter. Pulp sales were impacted by a lower production volume affected by the blockade of the Constitution Mill and production losses at our mill in Argentina. However, this was partially offset by pulp prices that increased by 11.2% compared to the third quarter. Our wood products segment was affected by lower sales volume in the panel and sawn timber markets, due to a general port strike in Chile of 10 days in November, and blockade of the Viñales Sawmill and remanufacturing facility during the end of November and the end of December, and an increase in the supply in the North American market. This was partially offset by prices remaining steady with a smaller increase in the panels market. Capex for the fourth quarter increase 37.8% compared to third quarter due to the Grayling project that is on construction phase. In U.S. Million Q4 2017 Q3 2017 Q4 2016 QoQ YoY YTD 2017 YTD 2016 YoY Acum Revenue 1,331.3 1,393.4 1,220.6 -4.5% 9.1% 5,238.3 4,761.4 10.0% Net income 83.2 148.4 75.8 -44.0% 9.8% 270.4 217.6 24.3% Adjusted EBITDA 344.5 391.6 259.8 -12.0% 32.6% 1,366.4 1,052.1 29.9% Adjusted EBITDA Margin 25.9% 28.1% 21.3% -7.9% 21.6% 26.1% 22.1% 18.0% LTM Adj. EBITDA 1,366.4 1,281.8 1,052.1 6.6% 29.9% 1,366.4 1,052.1 29.9% CAPEX 232.8 169.0 163.5 37.8% 42.4% 653.9 664.9 -1.6% Net Financial Debt 3,683.6 3,679.2 3,888.8 0.1% -5.3% 3,683.6 3,888.8 -5.3% Net Financial Debt / LTM Adj. EBITDA 2.7x 2.9x 3.7x -6.1% -27.1% 2.7x 3.7x -27.1%
Table of Contents
4 INCOME STATEMENT Net income for the fourth quarter of 2017 was U.S.$ 83.2 million, a decrease of 44.0% or U.S.$ 65.2 million compared to the U.S.$ 148.4 million obtained in the third quarter of this year. The decrease is mainly explained by one time financial expenses due to the repurchase of three of our outstanding bonds in November 2017, a decrease of other income and an increase in other expenses, compensated by a positive income tax. In U.S.$ Million Q4 2017 Q3 2017 QoQ Revenues 1,331.3 1,393.4 -4.5% Cost of sales (884.9) (940.3) -5.9% Distribution costs (132.9) (138.3) -3.9% Administrative expenses (150.1) (123.7) 21.4% Other income (11.7) 42.2 -127.6% Other expenses (47.1) 8.2 -678.5% Financial income 4.0 3.3 19.6% Financial costs (116.2) (54.1) 114.6% Participation in (loss) profit in associates and joint ventures accounted through equity method (1.6) 7.0 -122.3% Exchange rate differences (2.6) 2.9 -190.6% Income before income tax (11.8) 200.6 -105.9% Income tax 95.0 (52.2) -282.0% Net income 83.2 148.4 -44.0%
Table of Contents
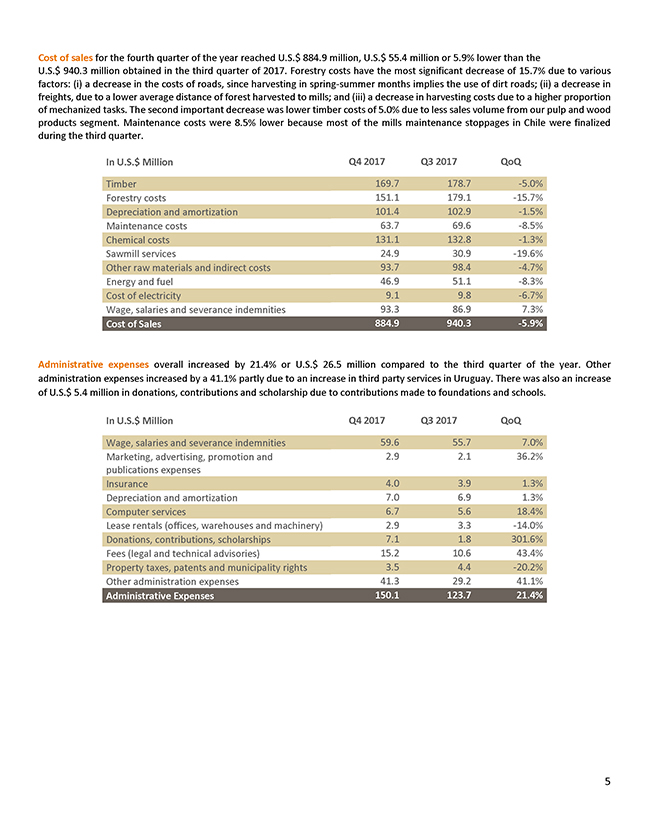
5 Cost of sales for the fourth quarter of the year reached U.S.$ 884.9 million, U.S.$ 55.4 million or 5.9% lower than the U.S.$ 940.3 million obtained in the third quarter of 2017. Forestry costs have the most significant decrease of 15.7% due to various factors: (i) a decrease in the costs of roads, since harvesting in spring-summer months implies the use of dirt roads; (ii) a decrease in freights, due to a lower average distance of forest harvested to mills; and (iii) a decrease in harvesting costs due to a higher proportion of mechanized tasks. The second important decrease was lower timber costs of 5.0% due to less sales volume from our pulp and wood products segment. Maintenance costs were 8.5% lower because most of the mills maintenance stoppages in Chile were finalized during the third quarter. In U.S.$ Million Q4 2017 Q3 2017 QoQ Timber 169.7 178.7 -5.0% Forestry costs 151.1 179.1 -15.7% Depreciation and amortization 101.4 102.9 -1.5% Maintenance costs 63.7 69.6 -8.5% Chemical costs 131.1 132.8 -1.3% Sawmill services 24.9 30.9 -19.6% Other raw materials and indirect costs 93.7 98.4 -4.7% Energy and fuel 46.9 51.1 -8.3% Cost of electricity 9.1 9.8 -6.7% Wage, salaries and severance indemnities 93.3 86.9 7.3% Cost of Sales 884.9 940.3 -5.9%
Table of Contents
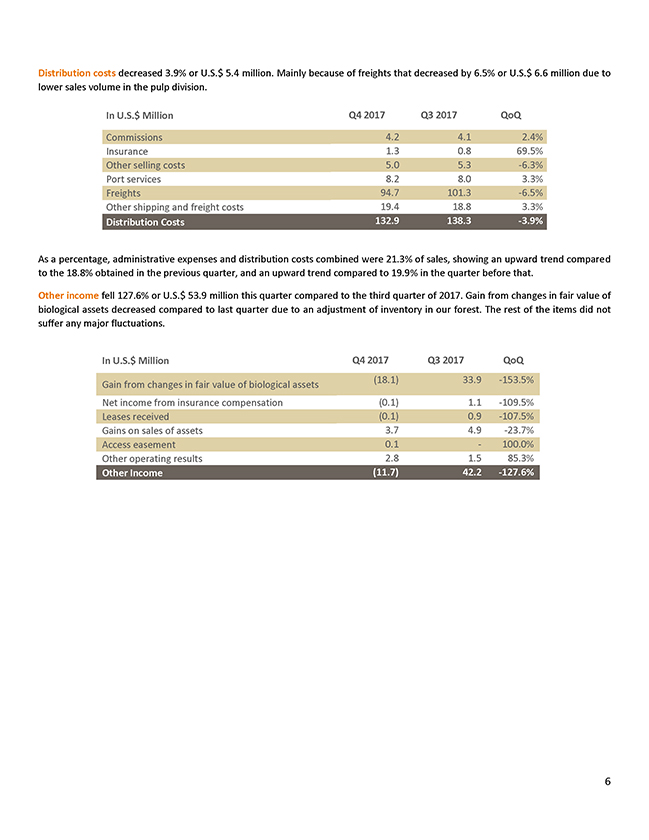
6 Distribution costs decreased 3.9% or U.S.$ 5.4 million. Mainly because of freights that decreased by 6.5% or U.S.$ 6.6 million due to lower sales volume in the pulp division. In U.S.$ Million Q4 2017 Q3 2017 QoQ Commissions 4.2 4.1 2.4% Insurance 1.3 0.8 69.5% Other selling costs 5.0 5.3 -6.3% Port services 8.2 8.0 3.3% Freights 94.7 101.3 -6.5% Other shipping and freight costs 19.4 18.8 3.3% Distribution Costs 132.9 138.3 -3.9%
Table of Contents
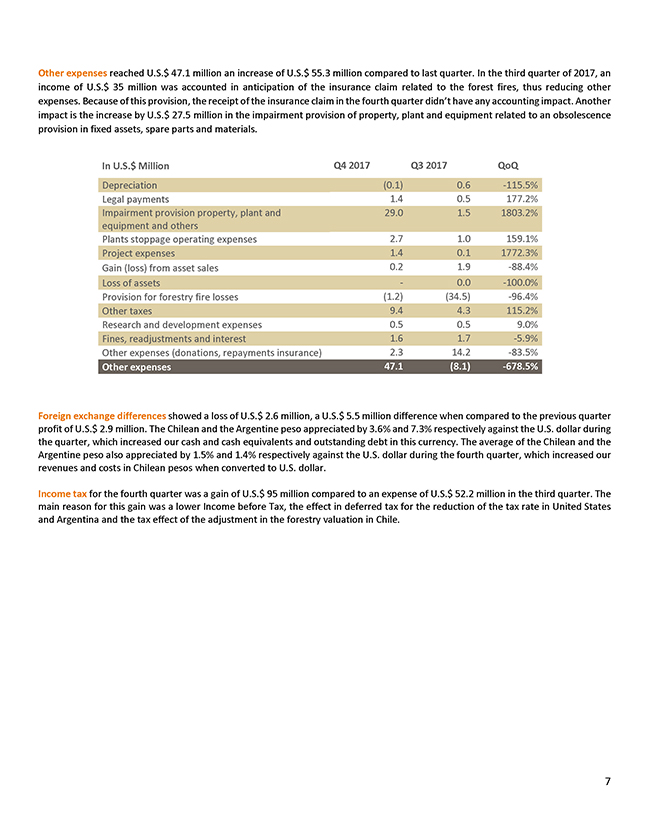
Other expenses reached U.S.$ 47.1 million an increase of U.S.$ 55.3 million compared to last quarter. In the third quarter of 2017, an income of U.S.$ 35 million was accounted in anticipation of the insurance claim related to the forest fires, thus reducing other expenses. Because of this provision, the receipt of the insurance claim in the fourth quarter didn’t have any accounting impact. Another impact is the increase by U.S.$ 27.5 million in the impairment provision of property, plant and equipment related to an obsolescence provision in fixed assets, spare parts and materials. In U.S.$ Million Q4 2017 Q3 2017 QoQ Depreciation (0.1) 0.6 -115.5% Legal payments 1.4 0.5 177.2% Impairment provision property, plant and 29.0 1.5 1803.2% equipment and others Plants stoppage operating expenses 2.7 1.0 159.1% Project expenses 1.4 0.1 1772.3% Gain (loss) from asset sales 0.2 1.9 -88.4% Loss of assets — 0.0 -100.0% Provision for forestry fire losses (1.2) (34.5) -96.4% Other taxes 9.4 4.3 115.2% Research and development expenses 0.5 0.5 9.0% Fines, readjustments and interest 1.6 1.7 -5.9% Other expenses (donations, repayments insurance) 2.3 14.2 -83.5% Other expenses 47.1 (8.1) -678.5% Foreign exchange differences showed a loss of U.S.$ 2.6 million, a U.S.$ 5.5 million difference when compared to the previous quarter profit of U.S.$ 2.9 million. The Chilean and the Argentine peso appreciated by 3.6% and 7.3% respectively against the U.S. dollar during the quarter, which increased our cash and cash equivalents and outstanding debt in this currency. The average of the Chilean and the Argentine peso also appreciated by 1.5% and 1.4% respectively against the U.S. dollar during the fourth quarter, which increased our revenues and costs in Chilean pesos when converted to U.S. dollar. Income tax for the fourth quarter was a gain of U.S.$ 95 million compared to an expense of U.S.$ 52.2 million in the third quarter. The main reason for this gain was a lower Income before Tax, the effect in deferred tax for the reduction of the tax rate in United States and Argentina and the tax effect of the adjustment in the forestry valuation in Chile.
Table of Contents
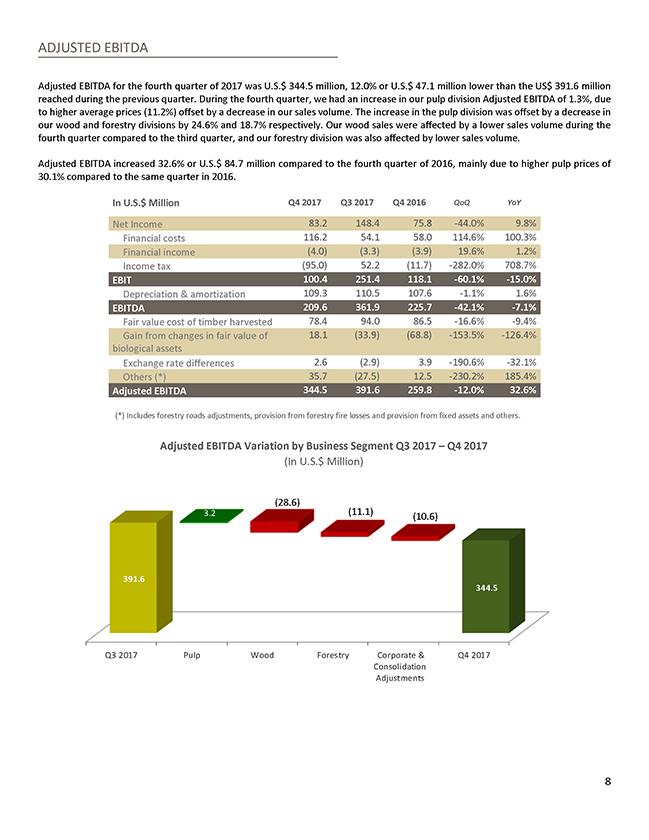
ADJUSTED EBITDA Adjusted EBITDA for the fourth quarter of 2017 was U.S.$ 344.5 million, 12.0% or U.S.$ 47.1 million lower than the US$ 391.6 million reached during the previous quarter. During the fourth quarter, we had an increase in our pulp division Adjusted EBITDA of 1.3%, due to higher average prices (11.2%) offset by a decrease in our sales volume. The increase in the pulp division was offset by a decrease in our wood and forestry divisions by 24.6% and 18.7% respectively. Our wood sales were affected by a lower sales volume during the fourth quarter compared to the third quarter, and our forestry division was also affected by lower sales volume. Adjusted EBITDA increased 32.6% or U.S.$ 84.7 million compared to the fourth quarter of 2016, mainly due to higher pulp prices of 30.1% compared to the same quarter in 2016. In U.S.$ Million Q4 2017 Q3 2017 Q4 2016 QoQ YoY Net Income 83.2 148.4 75.8 -44.0% 9.8% Financial costs 116.2 54.1 58.0 114.6% 100.3% Financial income (4.0) (3.3) (3.9) 19.6% 1.2% Income tax (95.0) 52.2 (11.7) -282.0% 708.7% EBIT 100.4 251.4 118.1 -60.1% -15.0% Depreciation & amortization 109.3 110.5 107.6 -1.1% 1.6% EBITDA 209.6 361.9 225.7 -42.1% -7.1% Fair value cost of timber harvested 78.4 94.0 86.5 -16.6% -9.4% Gain from changes in fair value of 18.1 (33.9) (68.8) -153.5% -126.4% biological assets Exchange rate differences 2.6 (2.9) 3.9 -190.6% -32.1% Others (*) 35.7 (27.5) 12.5 -230.2% 185.4% Adjusted EBITDA 344.5 391.6 259.8 -12.0% 32.6% (*) Includes forestry roads adjustments, provision from forestry fire losses and provision from fixed assets and others. Adjusted EBITDA Variation by Business Segment Q3 2017 – Q4 2017 (In U.S.$ Million) 2 (28. .6 6) 10.7 3.2 (11.1) (10.6) 391.6 344.5 Q3 2017 Pulp Wood Forestry Corporate & Q4 2017 Consolidation Adjustments
Table of Contents
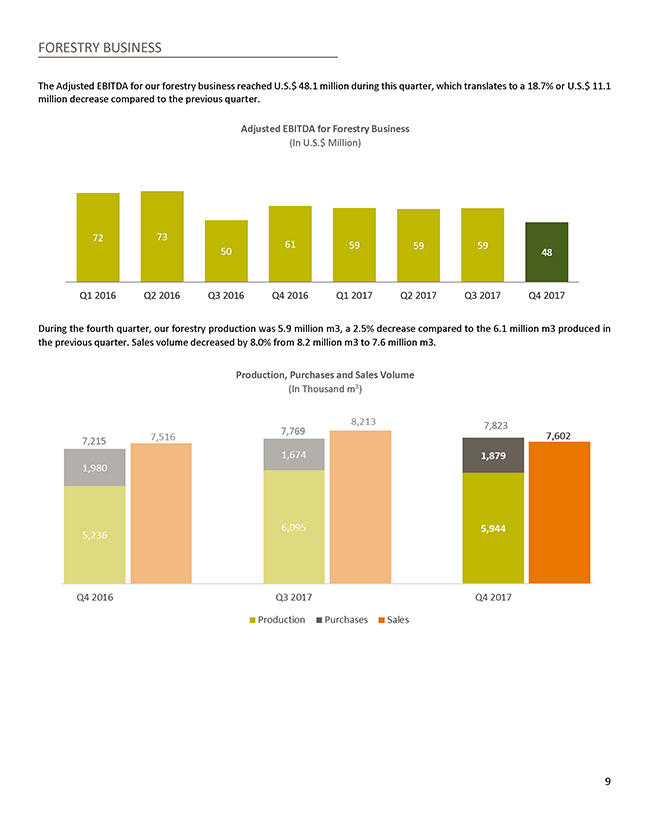
FORESTRY BUSINESS The Adjusted EBITDA for our forestry business reached U.S.$ 48.1 million during this quarter, which translates to a 18.7% or U.S.$ 11.1 million decrease compared to the previous quarter. Adjusted EBITDA for Forestry Business (In U.S.$ Million) 72 73 61 59 59 59 50 48 Q1 2016 Q2 2016 Q3 2016 Q4 2016 Q1 2017 Q2 2017 Q3 2017 Q4 2017 During the fourth quarter, our forestry production was 5.9 million m3, a 2.5% decrease compared to the 6.1 million m3 produced in the previous quarter. Sales volume decreased by 8.0% from 8.2 million m3 to 7.6 million m3. Production, Purchases and Sales Volume (In Thousand m3) 7,823 7,769 7,215
Table of Contents
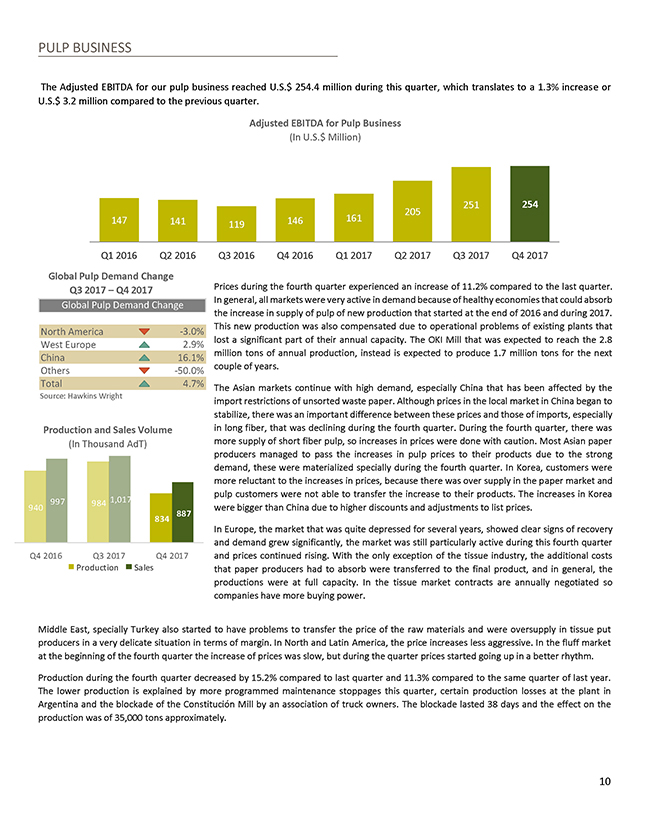
PULP BUSINESS The Adjusted EBITDA for our pulp business reached U.S.$ 254.4 million during this quarter, which translates to a 1.3% increase or U.S.$ 3.2 million compared to the previous quarter. Adjusted EBITDA for Pulp Business (In U.S.$ Million) 205 251 254 147 141 146 161 119 Q1 2016 Q2 2016 Q3 2016 Q4 2016 Q1 2017 Q2 2017 Q3 2017 Q4 2017 Global Pulp Demand Change Q3 2017 – Q4 2017 Prices during the fourth quarter experienced an increase of 11.2% compared to the last quarter. In general, all markets were very active in demand because of healthy economies that could absorb Global Pulp Demand Change the increase in supply of pulp of new production that started at the end of 2016 and during 2017. This new production was also compensated due to operational problems of existing plants that North America -3.0% lost a significant part of their annual capacity. The OKI Mill that was expected to reach the 2.8 West Europe 2.9% million tons of annual production, instead is expected to produce 1.7 million tons for the next China 16.1% couple of years. Others -50.0% Total 4.7% The Asian markets continue with high demand, especially China that has been affected by the Source: Hawkins Wright import restrictions of unsorted waste paper. Although prices in the local market in China began to stabilize, there was an important difference between these prices and those of imports, especially Production and Sales Volume in long fiber, that was declining during the fourth quarter. During the fourth quarter, there was (In Thousand AdT) more supply of short fiber pulp, so increases in prices were done with caution. Most Asian paper producers managed to pass the increases in pulp prices to their products due to the strong demand, these were materialized specially during the fourth quarter. In Korea, customers were more reluctant to the increases in prices, because there was over supply in the paper market and pulp customers were not able to transfer the increase to their products. The increases in Korea 997 984 1,017 940 were bigger than China due to higher discounts and adjustments to list prices. 887 834 In Europe, the market that was quite depressed for several years, showed clear signs of recovery and demand grew significantly, the market was still particularly active during this fourth quarter Q4 2016 Q3 2017 Q4 2017 and prices continued rising. With the only exception of the tissue industry, the additional costs Production Sales that paper producers had to absorb were transferred to the final product, and in general, the productions were at full capacity. In the tissue market contracts are annually negotiated so companies have more buying power. Middle East, specially Turkey also started to have problems to transfer the price of the raw materials and were oversupply in tissue put producers in a very delicate situation in terms of margin. In North and Latin America, the price increases less aggressive. In the fluff market at the beginning of the fourth quarter the increase of prices was slow, but during the quarter prices started going up in a better rhythm. Production during the fourth quarter decreased by 15.2% compared to last quarter and 11.3% compared to the same quarter of last year. The lower production is explained by more programmed maintenance stoppages this quarter, certain production losses at the plant in Argentina and the blockade of the Constitución Mill by an association of truck owners. The blockade lasted 38 days and the effect on the production was of 35,000 tons approximately. 10
Table of Contents
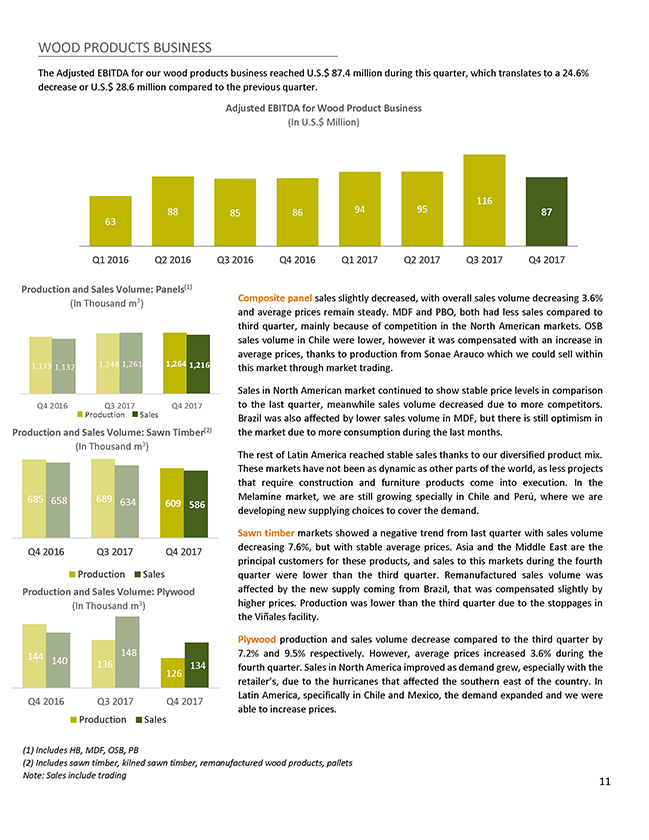
WOOD PRODUCTS BUSINESS The Adjusted EBITDA for our wood products business reached U.S.$ 87.4 million during this quarter, which translates to a 24.6% decrease or U.S.$ 28.6 million compared to the previous quarter. Adjusted EBITDA for Wood Product Business (In U.S.$ Million) 95 116 88 85 86 94 87 63 Q1 2016 Q2 2016 Q3 2016 Q4 2016 Q1 2017 Q2 2017 Q3 2017 Q4 2017 Production and Sales Volume: Panels(1) 3 Composite panel sales slightly decreased, with overall sales volume decreasing 3.6% (In Thousand m ) and average prices remain steady. MDF and PBO, both had less sales compared to third quarter, mainly because of competition in the North American markets. OSB sales volume in Chile were lower, however it was compensated with an increase in average prices, thanks to production from Sonae Arauco which we could sell within 1,173 1,132 1,248 1,261 1,264 1,216 this market through market trading. Sales in North American market continued to show stable price levels in comparison Q4 2016 Q3 2017 Q4 2017 to the last quarter, meanwhile sales volume decreased due to more competitors. Production Sales Brazil was also affected by lower sales volume in MDF, but there is still optimism in Production and Sales Volume: Sawn Timber(2) the market due to more consumption during the last months. (In Thousand m3) The rest of Latin America reached stable sales thanks to our diversified product mix. These markets have not been as dynamic as other parts of the world, as less projects that require construction and furniture products come into execution. In the 685 689 Melamine market, we are still growing specially in Chile and Perú, where we are 658 634 609 586 developing new supplying choices to cover the demand. Sawn timber markets showed a negative trend from last quarter with sales volume decreasing 7.6%, but with stable average prices. Asia and the Middle East are the Q4 2016 Q3 2017 Q4 2017 principal customers for these products, and sales to this markets during the fourth Production Sales quarter were lower than the third quarter. Remanufactured sales volume was Production and Sales Volume: Plywood affected by the new supply coming from Brazil, that was compensated slightly by (In Thousand m3) higher prices. Production was lower than the third quarter due to the stoppages in the Viñales facility. Plywood production and sales volume decrease compared to the third quarter by 144 140 148 7.2% and 9.5% respectively. However, average prices increased 3.6% during the 136 134 fourth quarter. Sales in North America improved as demand grew, especially with the 126 retailer’s, due to the hurricanes that affected the southern east of the country. In Latin America, specifically in Chile and Mexico, the demand expanded and we were Q4 2016 Q3 2017 Q4 2017 able to increase prices. Production Sales (1) Includes HB, MDF, OSB, PB (2) Includes sawn timber, kilned sawn timber, remanufactured wood products, pallets Note: Sales include trading 11
Table of Contents
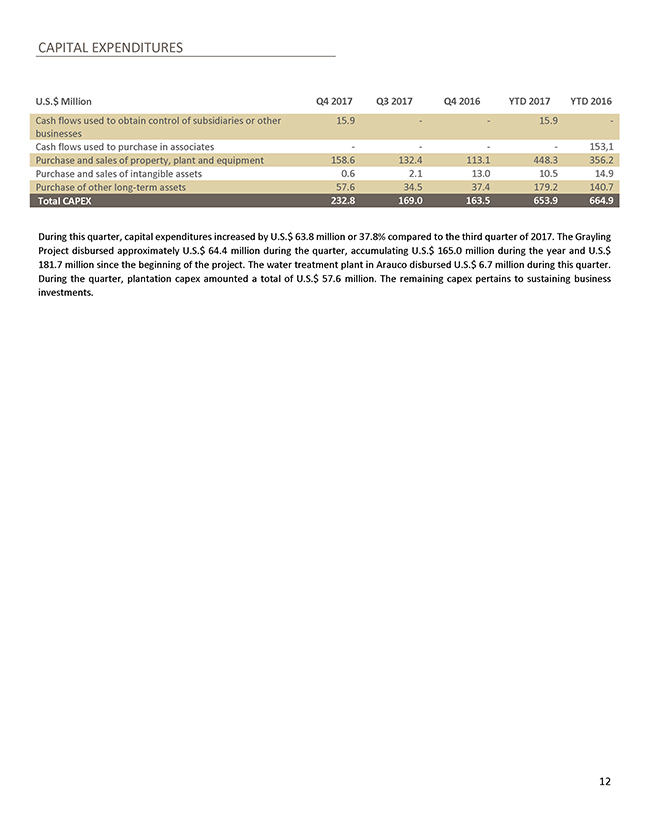
CAPITAL EXPENDITURES U.S.$ Million Q4 2017 Q3 2017 Q4 2016 YTD 2017 YTD 2016 Cash flows used to obtain control of subsidiaries or other 15.9 — — 15.9 — businesses Cash flows used to purchase in associates — — — — 153,1 Purchase and sales of property, plant and equipment 158.6 132.4 113.1 448.3 356.2 Purchase and sales of intangible assets 0.6 2.1 13.0 10.5 14.9 Purchase of other long-term assets 57.6 34.5 37.4 179.2 140.7 Total CAPEX 232.8 169.0 163.5 653.9 664.9 During this quarter, capital expenditures increased by U.S.$ 63.8 million or 37.8% compared to the third quarter of 2017. The Grayling Project disbursed approximately U.S.$ 64.4 million during the quarter, accumulating U.S.$ 165.0 million during the year and U.S.$ 181.7 million since the beginning of the project. The water treatment plant in Arauco disbursed U.S.$ 6.7 million during this quarter. During the quarter, plantation capex amounted a total of U.S.$ 57.6 million. The remaining capex pertains to sustaining business investments.
Table of Contents
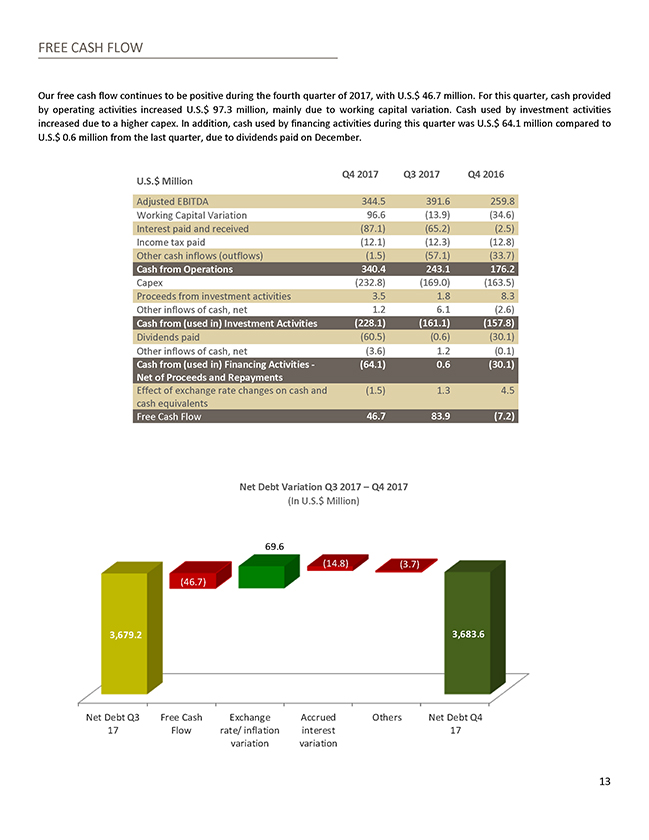
FREE CASH FLOW Our free cash flow continues to be positive during the fourth quarter of 2017, with U.S.$ 46.7 million. For this quarter, cash provided by operating activities increased U.S.$ 97.3 million, mainly due to working capital variation. Cash used by investment activities increased due to a higher capex. In addition, cash used by financing activities during this quarter was U.S.$ 64.1 million compared to U.S.$ 0.6 million from the last quarter, due to dividends paid on December. Q4 2017 Q3 2017 Q4 2016 U.S.$ Million Adjusted EBITDA 344.5 391.6 259.8 Working Capital Variation 96.6 (13.9) (34.6) Interest paid and received (87.1) (65.2) (2.5) Income tax paid (12.1) (12.3) (12.8) Other cash inflows (outflows) (1.5) (57.1) (33.7) Cash from Operations 340.4 243.1 176.2 Capex (232.8) (169.0) (163.5) Proceeds from investment activities 3.5 1.8 8.3 Other inflows of cash, net 1.2 6.1 (2.6) Cash from (used in) Investment Activities (228.1) (161.1) (157.8) Dividends paid (60.5) (0.6) (30.1) Other inflows of cash, net (3.6) 1.2 (0.1) Cash from (used in) Financing Activities— (64.1) 0.6 (30.1) Net of Proceeds and Repayments Effect of exchange rate changes on cash and (1.5) 1.3 4.5 cash equivalents Free Cash Flow 46.7 83.9 (7.2) Net Debt Variation Q3 2017 – Q4 2017 (In U.S.$ Million) 69.6 (14.8) (3.7) (46.7) 3,679.2 3,683.6 Net Debt Q3 Free Cash Exchange Accrued Others Net Debt Q4 17 Flow rate/ inflation interest 17 variation variation 13
Table of Contents
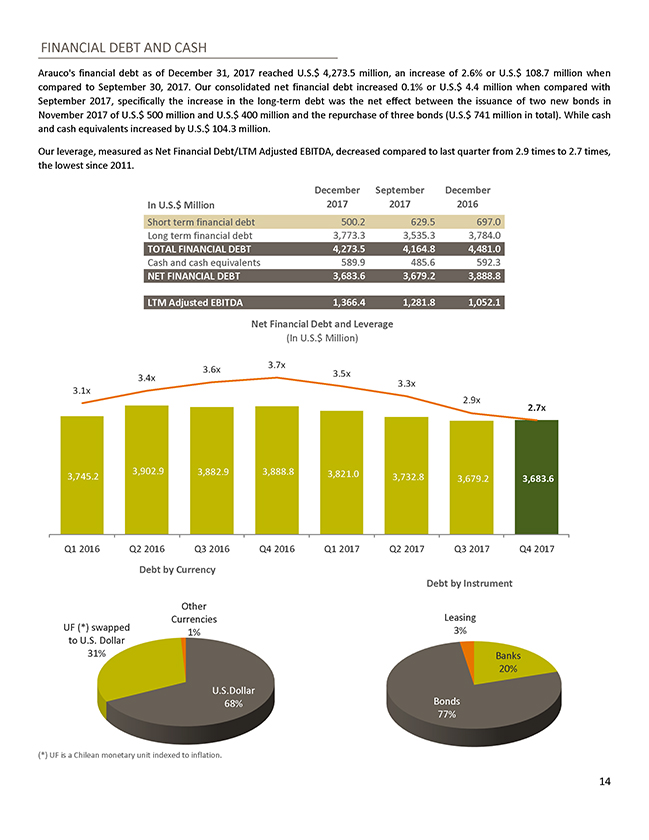
FINANCIAL DEBT AND CASH Arauco’s financial debt as of December 31, 2017 reached U.S.$ 4,273.5 million, an increase of 2.6% or U.S.$ 108.7 million when compared to September 30, 2017. Our consolidated net financial debt increased 0.1% or U.S.$ 4.4 million when compared with September 2017, specifically the increase in the long-term debt was the net effect between the issuance of two new bonds in November 2017 of U.S.$ 500 million and U.S.$ 400 million and the repurchase of three bonds (U.S.$ 741 million in total). While cash and cash equivalents increased by U.S.$ 104.3 million. Our leverage, measured as Net Financial Debt/LTM Adjusted EBITDA, decreased compared to last quarter from 2.9 times to 2.7 times, the lowest since 2011. December September December In U.S.$ Million 2017 2017 2016 Short term financial debt 500.2 629.5 697.0 Long term financial debt 3,773.3 3,535.3 3,784.0 TOTAL FINANCIAL DEBT 4,273.5 4,164.8 4,481.0 Cash and cash equivalents 589.9 485.6 592.3 NET FINANCIAL DEBT 3,683.6 3,679.2 3,888.8 LTM Adjusted EBITDA 1,366.4 1,281.8 1,052.1 Net Financial Debt and Leverage (In U.S.$ Million) 3.7x 3.6x 3.5x 3.4x 3.3x 3.1x 2.9x 2.7x 3,902.9 3,882.9 3,888.8 3,821.0 3,745.2 3,732.8 3,679.2 3,683.6 Q1 2016 Q2 2016 Q3 2016 Q4 2016 Q1 2017 Q2 2017 Q3 2017 Q4 2017 Debt by Currency Debt by Instrument Other Currencies Leasing UF (*) swapped 3% to U.S. Dollar 1% 31% Banks 20% U.S.Dollar 68% Bonds 77% (*) UF is a Chilean monetary unit indexed to inflation. 14
Table of Contents
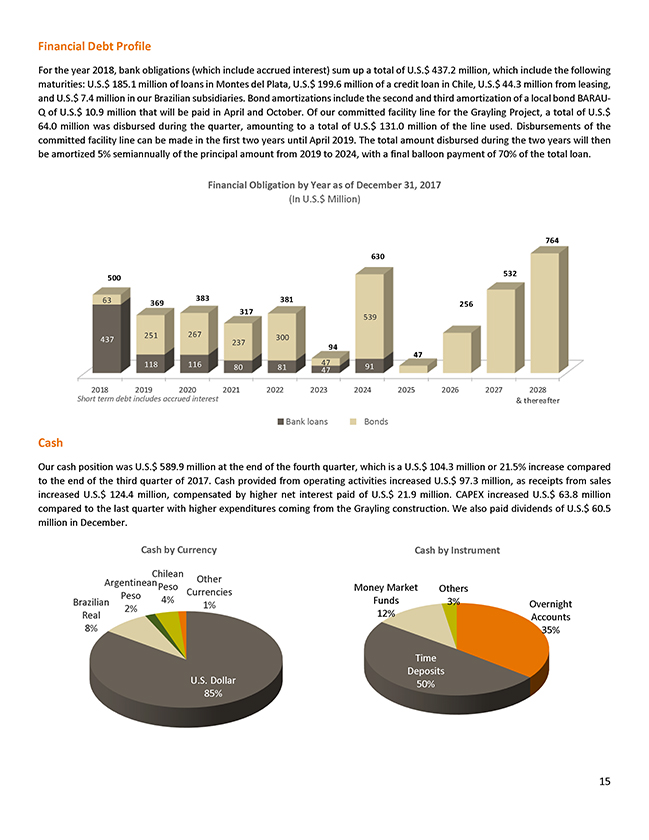
Financial Debt Profile For the year 2018, bank obligations (which include accrued interest) sum up a total of U.S.$ 437.2 million, which include the following maturities: U.S.$ 185.1 million of loans in Montes del Plata, U.S.$ 199.6 million of a credit loan in Chile, U.S.$ 44.3 million from leasing, and U.S.$ 7.4 million in our Brazilian subsidiaries. Bond amortizations include the second and third amortization of a local bond BARAU-Q of U.S.$ 10.9 million that will be paid in April and October. Of our committed facility line for the Grayling Project, a total of U.S.$ 64.0 million was disbursed during the quarter, amounting to a total of U.S.$ 131.0 million of the line used. Disbursements of the committed facility line can be made in the first two years until April 2019. The total amount disbursed during the two years will then be amortized 5% semiannually of the principal amount from 2019 to 2024, with a final balloon payment of 70% of the total loan. Financial Obligation by Year as of December 31, 2017 (In U.S.$ Million) 764 630 532 500 63 383 381 369 256 317 539 251 267 300 437 237 94 47 118 116 47 80 81 91 47 2018 2019 2020 2021 2022 2023 2024 2025 2026 2027 2028 Short term debt includes accrued interest & thereafter Bank loans Bonds Cash Our cash position was U.S.$ 589.9 million at the end of the fourth quarter, which is a U.S.$ 104.3 million or 21.5% increase compared to the end of the third quarter of 2017. Cash provided from operating activities increased U.S.$ 97.3 million, as receipts from sales increased U.S.$ 124.4 million, compensated by higher net interest paid of U.S.$ 21.9 million. CAPEX increased U.S.$ 63.8 million compared to the last quarter with higher expenditures coming from the Grayling construction. We also paid dividends of U.S.$ 60.5 million in December. Cash by Currency Cash by Instrument Chilean Argentinean Peso Other Money Market Currencies Others Peso Brazilian 4% Funds 3% 1% Overnight 2% Real 12% Accounts 8% 35% Time Deposits U.S. Dollar 50% 85%
Table of Contents
FOURTH QUARTER AND SUBSEQUENT EVENTS AND NEWS Arauco acquired Masisa’s subsidiary in Brazil In September 2017, Arauco do Brasil S.A. agreed with Masisa S.A. the total buyout of the social rights of the subsidiary named Masisa do Brasil Ltda. The transaction price was approximately U.S.$ 102.8 million, with a final payment of U.S.$ 52.8 million. The main assets of Masisa do Brasil S.A. consists of two industrial complexes located in Ponta Grossa (Paraná) and Montenegro (Rio Grande do Sul) in Brazil, with a total annual installed capacity of 300,000 m3 of MDF, 500,000 m3 of MDP and 660,000 m3 of melamine capacity. The transaction was finally closed at the end of the year, which means that at December 31st, 2017 Arauco do Brasil S.A has consolidated the assets acquired. Arauco to acquire Masisa’s subsidiary in Mexico In December 2017, Inversiones Arauco Internacional Limitada and AraucoMex, S.A. de C.V. agreed with Masisa S.A. the total buyout of the social rights of its subsidiaries in Mexico. The transaction price is for approximately U.S.$ 245 million. Main assets consist of three industrial complexes located in Chihuahua, Durango and Zitácuaro in Mexico, with a total annual installed capacity of 220,000 m3 of MDF; 519,000 m3 of PB; 426,000 m3 of melamine; 66,000 tons of resins; 60,600 tons of formaldehyde and 22.8 million m2 of impregnation lines. The transaction is subject to a series of conditions precedent, customary in this type of operations, with the most relevant one being the approval by the Mexican antitrust authority. The transaction is estimated to be materialized during 2018. Grayling Project on Schedule The Grayling Project continues its course on schedule. As of December 31st, 2017, the progress was a 40% completion and today is 70%. The particleboard mill located in Grayling, Michigan, U.S.A., will cost approximately U.S.$ 400.0 million and will have a capacity of 800,000 m3 per year. Rollout of the first panel is estimated to occur during the latter part of 2018. Dissolving Pulp The Dissolving Pulp Project continues its course, as of December 31st, 2017 the progress was 5% and today is 11%. The estimate investment for the project is approximately U.S.$ 185 million. This project should take about two years of construction, with the ramp-up scheduled to occur during the end of 2019. Significant decreased in forestry fires From early January until mid-March 2018 the hectares of plantations affected by forestry fires had been 450 hectares, a decrease of 99.4% compared to the 72,500 hectares burned during the wildfires of 2017.
Table of Contents
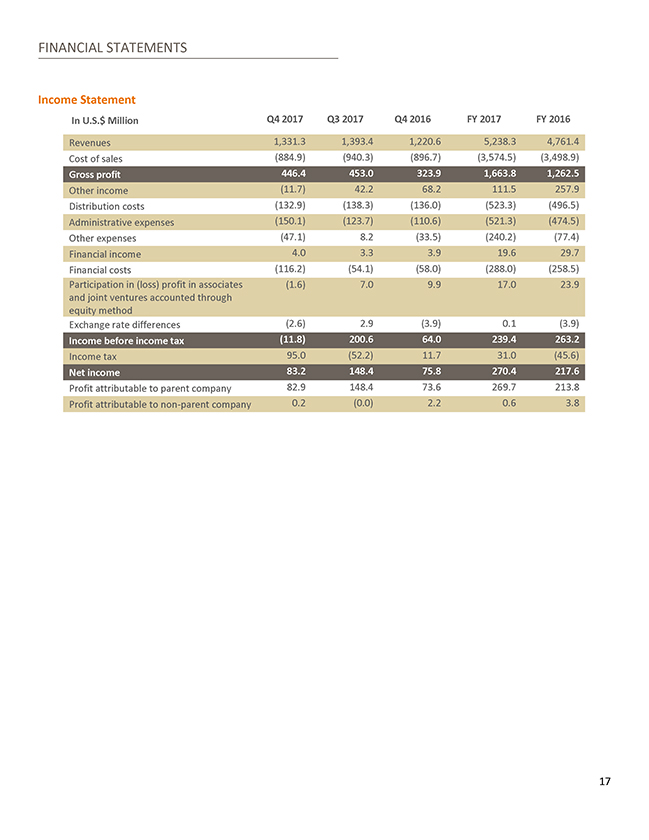
FINANCIAL STATEMENTS Income Statement In U.S.$ Million Q4 2017 Q3 2017 Q4 2016 FY 2017 FY 2016 Revenues 1,331.3 1,393.4 1,220.6 5,238.3 4,761.4 Cost of sales (884.9) (940.3) (896.7) (3,574.5) (3,498.9) Gross profit 446.4 453.0 323.9 1,663.8 1,262.5 Other income (11.7) 42.2 68.2 111.5 257.9 Distribution costs (132.9) (138.3) (136.0) (523.3) (496.5) Administrative expenses (150.1) (123.7) (110.6) (521.3) (474.5) Other expenses (47.1) 8.2 (33.5) (240.2) (77.4) Financial income 4.0 3.3 3.9 19.6 29.7 Financial costs (116.2) (54.1) (58.0) (288.0) (258.5) Participation in (loss) profit in associates (1.6) 7.0 9.9 17.0 23.9 and joint ventures accounted through equity method Exchange rate differences (2.6) 2.9 (3.9) 0.1 (3.9) Income before income tax (11.8) 200.6 64.0 239.4 263.2 Income tax 95.0 (52.2) 11.7 31.0 (45.6) Net income 83.2 148.4 75.8 270.4 217.6 Profit attributable to parent company 82.9 148.4 73.6 269.7 213.8 Profit attributable to non-parent company 0.2 (0.0) 2.2 0.6 3.8
Table of Contents
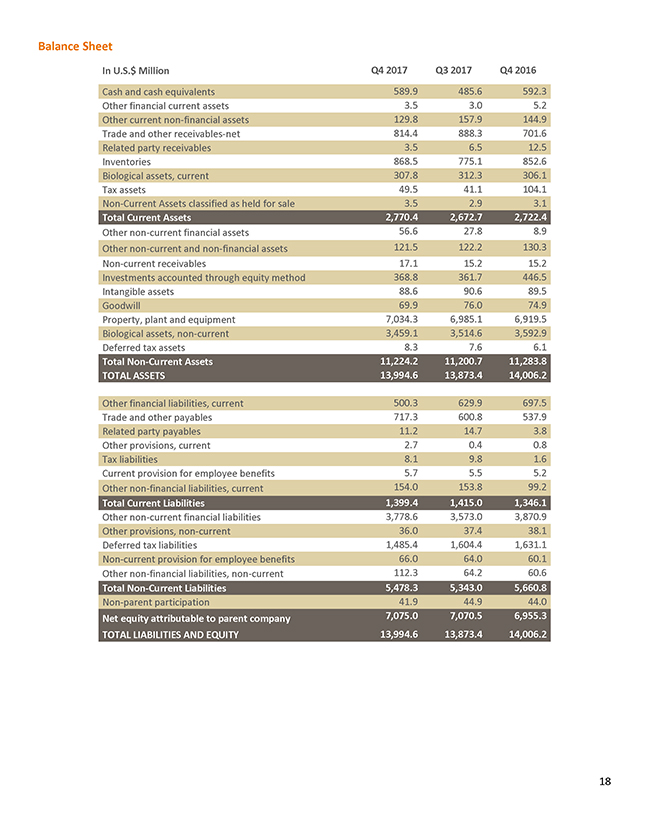
Balance Sheet In U.S.$ Million Q4 2017 Q3 2017 Q4 2016 Cash and cash equivalents 589.9 485.6 592.3 Other financial current assets 3.5 3.0 5.2 Other current non-financial assets 129.8 157.9 144.9 Trade and other receivables-net 814.4 888.3 701.6 Related party receivables 3.5 6.5 12.5 Inventories 868.5 775.1 852.6 Biological assets, current 307.8 312.3 306.1 Tax assets 49.5 41.1 104.1 Non-Current Assets classified as held for sale 3.5 2.9 3.1 Total Current Assets 2,770.4 2,672.7 2,722.4 Other non-current financial assets 56.6 27.8 8.9 Other non-current and non-financial assets 121.5 122.2 130.3 Non-current receivables 17.1 15.2 15.2 Investments accounted through equity method 368.8 361.7 446.5 Intangible assets 88.6 90.6 89.5 Goodwill 69.9 76.0 74.9 Property, plant and equipment 7,034.3 6,985.1 6,919.5 Biological assets, non-current 3,459.1 3,514.6 3,592.9 Deferred tax assets 8.3 7.6 6.1 Total Non-Current Assets 11,224.2 11,200.7 11,283.8 TOTAL ASSETS 13,994.6 13,873.4 14,006.2 Other financial liabilities, current 500.3 629.9 697.5 Trade and other payables 717.3 600.8 537.9 Related party payables 11.2 14.7 3.8 Other provisions, current 2.7 0.4 0.8 Tax liabilities 8.1 9.8 1.6 Current provision for employee benefits 5.7 5.5 5.2 Other non-financial liabilities, current 154.0 153.8 99.2 Total Current Liabilities 1,399.4 1,415.0 1,346.1 Other non-current financial liabilities 3,778.6 3,573.0 3,870.9 Other provisions, non-current 36.0 37.4 38.1 Deferred tax liabilities 1,485.4 1,604.4 1,631.1 Non-current provision for employee benefits 66.0 64.0 60.1 Other non-financial liabilities, non-current 112.3 64.2 60.6 Total Non-Current Liabilities 5,478.3 5,343.0 5,660.8 Non-parent participation 41.9 44.9 44.0 Net equity attributable to parent company 7,075.0 7,070.5 6,955.3 TOTAL LIABILITIES AND EQUITY 13,994.6 13,873.4 14,006.2
Table of Contents
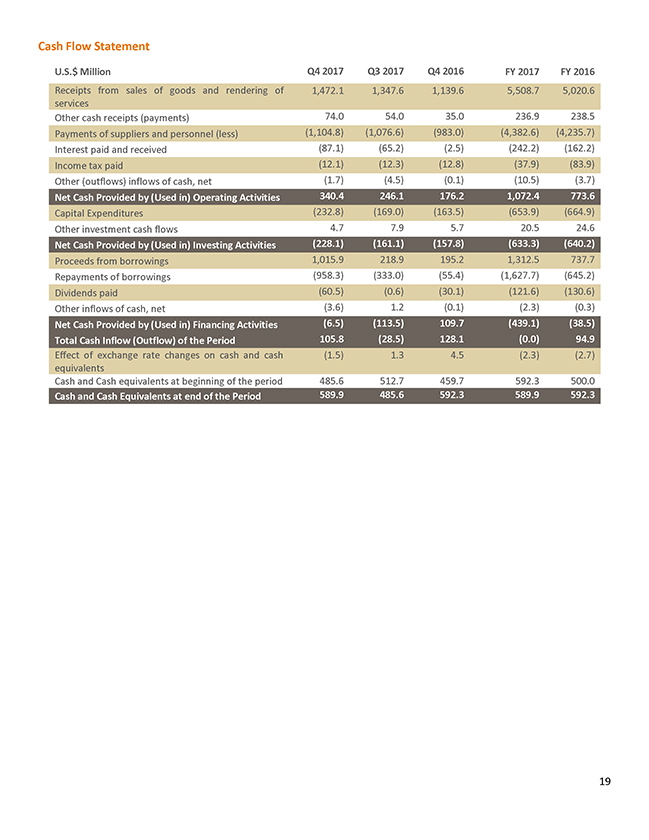
Cash Flow Statement U.S.$ Million Q4 2017 Q3 2017 Q4 2016 FY 2017 FY 2016 Receipts from sales of goods and rendering of 1,472.1 1,347.6 1,139.6 5,508.7 5,020.6 services Other cash receipts (payments) 74.0 54.0 35.0 236.9 238.5 Payments of suppliers and personnel (less) (1,104.8) (1,076.6) (983.0) (4,382.6) (4,235.7) Interest paid and received (87.1) (65.2) (2.5) (242.2) (162.2) Income tax paid (12.1) (12.3) (12.8) (37.9) (83.9) Other (outflows) inflows of cash, net (1.7) (4.5) (0.1) (10.5) (3.7) Net Cash Provided by (Used in) Operating Activities 340.4 246.1 176.2 1,072.4 773.6 Capital Expenditures (232.8) (169.0) (163.5) (653.9) (664.9) Other investment cash flows 4.7 7.9 5.7 20.5 24.6 Net Cash Provided by (Used in) Investing Activities (228.1) (161.1) (157.8) (633.3) (640.2) Proceeds from borrowings 1,015.9 218.9 195.2 1,312.5 737.7 Repayments of borrowings (958.3) (333.0) (55.4) (1,627.7) (645.2) Dividends paid (60.5) (0.6) (30.1) (121.6) (130.6) Other inflows of cash, net (3.6) 1.2 (0.1) (2.3) (0.3) Net Cash Provided by (Used in) Financing Activities (6.5) (113.5) 109.7 (439.1) (38.5) Total Cash Inflow (Outflow) of the Period 105.8 (28.5) 128.1 (0.0) 94.9 Effect of exchange rate changes on cash and cash (1.5) 1.3 4.5 (2.3) (2.7) equivalents Cash and Cash equivalents at beginning of the period 485.6 512.7 459.7 592.3 500.0 Cash and Cash Equivalents at end of the Period 589.9 485.6 592.3 589.9 592.3
Table of Contents
Signature
Pursuant to the requirements of the Securities Exchange Act of 1934, the registrant has duly caused this report to be signed on its behalf by the undersigned, thereunto duly authorized.
| Celulosa Arauco y Constitución, S.A. | ||||||
| (Registrant) | ||||||
| Date: April 3, 2018 | By: | /s/ Matías Domeyko Cassel | ||||
| Name: | Matías Domeyko Cassel | |||||
| Title: | Chief Executive Officer | |||||