FORM 6-K
SECURITIES AND EXCHANGE COMMISSION
WASHINGTON, D.C. 20549
Report of Foreign Private Issuer
Pursuant to Rule 13a-16 or 15d-16
of the Securities Exchange Act of 1934
For the month of August 2021
Commission File Number 33-99720
ARAUCO AND CONSTITUTION PULP INC.
(Translation of registrant’s name into English)
El Golf 150
Fourteenth Floor
Santiago, Chile
(Address of principal executive offices)
Indicate by check mark whether the registrant files or will file annual reports under cover Form 20-F or Form 40-F.
Form 20-F ☑ Form 40-F ☐
Indicate by check mark if the registrant is submitting the Form 6-K in paper as permitted by Regulation S-T Rule 101(b)(1): ☐
Indicate by check mark if the registrant is submitting the Form 6-K in paper as permitted by Regulation S-T Rule 101(b)(7): ☐
Indicate by check mark whether the registrant by furnishing the information contained in this Form is also thereby furnishing the information to the Commission pursuant to Rule 12g3-2(b) under the Securities Exchange Act of 1934.
Yes ☐ No ☑
If “Yes” is marked, indicate below the file number assigned to the registrant in connection with Rule 12g3-2(b): 82-
ARAUCO AND CONSTITUTION PULP INC
TABLE OF CONTENTS
CELULOSA ARAUCO Y CONSTITUCION S.A. AND SUBSIDIARIES
Ratio Analysis of the Interim Consolidated Financial Statements
June 30, 2021
Amounts in thousands of U.S. dollars, except as indicated
1. ANALYSIS OF FINANCIAL POSITION
| | a) | Interim Statement of Financial Position |
The principal components of assets and liabilities at the end of each period are as follows:
| | | | | | | | | | | | |
Assets | | 06-30-2021
ThU.S.$ | | | 12-31-2020
ThU.S.$ | | | Variation
ThU.S.$ | |
Current assets | | | 3,790,907 | | | | 3,544,325 | | | | 246,582 | |
Non-current assets | | | 12,633,449 | | | | 12,483,994 | | | | 149,455 | |
| | | | | | | | | | | | |
Total assets | | | 16,424,356 | | | | 16,028,319 | | | | 2.47 | % |
| | | | | | | | | | | | |
| | | | | | | | | | | | |
Liabilities | | 06-30-2021
ThU.S.$ | | | 12-31-2020
ThU.S.$ | | | Variation
ThU.S.$ | |
Current liabilities | | | 1,304,458 | | | | 1,097,593 | | | | 206,865 | |
Non-current liabilities | | | 7,216,056 | | | | 7,515,091 | | | | (299,035 | ) |
Non–parent participation | | | 26,926 | | | | 30,913 | | | | (3,987 | ) |
Net equity attributable to parent company | | | 7,876,916 | | | | 7,384,722 | | | | 492,194 | |
| | | | | | | | | | | | |
Total net equity and liabilities | | | 16,424,356 | | | | 16,028,319 | | | | 2.47 | % |
| | | | | | | | | | | | |
As of June 30, 2021, total assets increased MU.S.$ 396 compared to December 31, 2020, equivalent to a 2.47% variation. This variation was driven mainly by an increase in property, plants & equipment resulting from the investment in the MAPA project, accounts receivable from sales to national and foreign customers, cash in banks, term deposit and assets held for sale (which are mainly biological assets from the forestry lands sale contract), which was partially offset by decreases in current tax assets and biological assets.
In turn, total liabilities decreased by MU.S.$ 92 principally due to a decrease in long term debt to banks.
The main financial and operational indicators related to the Statement of Financial position as of the dates and for the periods indicated below are as follows:
| | | | | | | | |
Liquidity ratios | | 06-30-2021 | | | 12-31-2020 | |
Current Liquidity (current assets / current liabilities) | | | 2.91 | | | | 3.23 | |
Acid ratio ((current assets-inventories, biological assets) / current liabilities) | | | 1.90 | | | | 2.10 | |
| | | | | | | | |
Debt indicators | | 06-30-2021 | | | 12-31-2020 | |
Debt to equity ratio (total liabilities / equity) | | | 1.08 | | | | 1.16 | |
Short-term debt to total debt (current liabilities / total liabilities) | | | 0.15 | | | | 0.13 | |
Long-term debt to total debt (non-current liabilities / total liabilities) | | | 0.85 | | | | 0.87 | |
| | |
| | | 06-30-2021 | | | 06-30-2020 | |
Financial expenses coverage ratio (earnings before taxes + interest expense / interest expense) | | | 4.98 | | | | 0.17 | |
| | | | | | | | |
Activity ratio | | 06-30-2021 | | | 12-31-2020 | |
Inventory turnover-time (cost of sales / inventories + current biological assets) | | | 2.79 | | | | 2.68 | |
Inventory turnover-time (excluding biological assets) (Cost of sales /inventory) | | | 3.65 | | | | 3.46 | |
Inventory permanence-days ((inventories + biological assets) /cost of sales) | | | 129.01 | | | | 134.30 | |
Inventory permanence-days (excluding biological assets) (inventory / cost of sales) | | | 98.73 | | | | 104.08 | |
As of June 30, 2021, the short-term debt to total debt ratio represented 15% of total liabilities (13% as of December 31, 2020).
Our financial expenses coverage ratio increased from 0.17 to 4.98, mainly due to the profits before taxes generated for the period ended June 30, 2021, compared to a loss before taxes generated in the same period of 2020.
1
CELULOSA ARAUCO Y CONSTITUCION S.A. AND SUBSIDIARIES
Ratio Analysis of the Interim Consolidated Financial Statements
June 30, 2021
Amounts in thousands of U.S. dollars, except as indicated
| | b) | Interim Statement of Profit or Loss |
Profit before income tax
We recorded a profit before income tax of approximately MU.S.$ 470 compared to a loss of approximately MU.S.$ 115 in the same period of 2020. The variation of MU.S.$ 585 is explained by the factors described in the following table:
| | | | |
Item | | MU.S.$ | |
Gross margin | | | 584 | |
Distribution and Administrative Expenses | | | (77 | ) |
Other income and expenses | | | 35 | |
Others | | | 43 | |
| | | | |
Net change in profit (loss) before income tax | | | 585 | |
| | | | |
The main indicators related to the accounts in our statements of profit or loss and the details of revenues and operation costs are as follows:
| | | | | | | | |
Revenues | | 06-30-2021
ThU.S.$ | | | 06-30-2020
ThU.S.$ | |
Pulp | | | 1,287,128 | | | | 1,010,235 | |
Wood | | | 1,614,979 | | | | 1,166,723 | |
Other | | | 174 | | | | 82 | |
| | | | | | | | |
Total revenues | | | 2,902,281 | | | | 2,177,040 | |
| | | | | | | | |
On January 1, 2021 we discontinued the reporting of our forestry operations as a business segment, and included those operations as part of the pulp segment. This is in line with Arauco’s current reality and with the way in which the management views the progress of business. The new segments reported are Pulp and wood products, consistent with Arauco’s focus on its end customers. For more information, see Notes 2 and 24 to the Interim Consolidated Financial Statements Report as of June 30, 2021.
| | | | | | | | |
Sales costs | | 06-30-2021
ThU.S.$ | | | 06-30-2020
ThU.S.$ | |
Wood | | | 410,047 | | | | 390,392 | |
Forestry work and other services | | | 256,172 | | | | 215,475 | |
Depreciation and amortization | | | 226,164 | | | | 229,250 | |
Other operating costs | | | 892,574 | | | | 808,497 | |
| | | | | | | | |
Total sales costs | | | 1,784,957 | | | | 1,643,614 | |
| | | | | | | | |
| | | | | | | | |
Profitability index | | 06-30-2021 | | | 12-31-2020 | |
Profitability on equity | | | 7.93 | | | | 0.34 | |
Profitability on assets | | | 3.74 | | | | 0.16 | |
Return on operating assets | | | 7.52 | | | | (3.90 | ) |
| | | | | | | | |
Profitability ratios | | 06-30-2021 | | | 06-30-2020 | |
Income per share (U.S.$) (1) | | | 2.5597 | | | | (0.7554 | ) |
Profit after tax (ThU.S.$) (2) | | | 303,787 | | | | (85,643 | ) |
Gross margin (ThU.S.$) | | | 1,117,324 | | | | 533,426 | |
Finance costs (ThU.S.$) | | | (118,180 | ) | | | (137,704 | ) |
| (1) | Average earnings per share refer to the profit to net equity to parent company. |
| (2) | Includes non-controlling interest. |
2
CELULOSA ARAUCO Y CONSTITUCION S.A. AND SUBSIDIARIES
Ratio Analysis of the Interim Consolidated Financial Statements
June 30, 2021
Amounts in thousands of U.S. dollars, except as indicated
| | | | | | | | |
EBITDA | | 06-30-2021
ThU.S.$ | | | 06-30-2020
ThU.S.$ | |
Profit (loss) | | | 303,787 | | | | (85,643 | ) |
Finance costs | | | 118,180 | | | | 137,704 | |
Finance income | | | (14,434 | ) | | | (19,519 | ) |
Income tax expense | | | 166,006 | | | | (29,111 | ) |
EBIT | | | 573,539 | | | | 3,431 | |
Depreciation and amortization | | | 249,102 | | | | 250,842 | |
EBITDA | | | 822,641 | | | | 254,273 | |
Cost at fair value of the harvest | | | 148,021 | | | | 142,284 | |
Gain from changes in fair value of biological assets | | | (83,080 | ) | | | (88,143 | ) |
Exchange difference | | | 13,696 | | | | 30,084 | |
Others* | | | 28,813 | | | | 61,854 | |
Adjusted EBITDA | | | 930,091 | | | | 400,352 | |
| * | Considers loss of forest due to fires and theft and impairment provision for industrial property, plant and equipment. |
2. MAIN SOURCES OF FINANCING
Arauco’s financing needs are mainly covered through the capital markets, with bond issuances and credits obtained from banks and financial institutions serving as the main sources of financing. For short-term borrowing, Arauco follows a liquidity policy which indicates the amounts and institutions from which it can borrow according to several conditions defined in the policy. In the case of long-term debt, corporate bond issuances in the local market and also in the international markets are used as sources of new resources. Another source of long-term financing corresponds to borrowings from banks and financial institutions around the world.
3. MARKET SITUATION
In the second quarter of 2021 the billing was higher in 3.7% than then same period of 2020. It was for the sale average price increase in 54.7% offseted in a portion for the sale volume in 11.1%. The accumulated billing in the first semester of 2021 increase in 30.3%, as a result of a better average price, offseted for a decrease of sale volume of 5.2%.
During the second quarter, pulp demand remained stable, with some markets more solid and requesting additional volumes. Prices increased in some markets and were stable in others. On the other hand, sales started to be affected by the logistic issues that are affecting all industries worldwide. World inventories for both fibers increased between March and May 2021, long fiber increased by 1 day and short fiber by two days.
In China, pulp demand remained relatively stable, even though during the second quarter the low demand season begins in the northern hemisphere. The tissue industry has lowered its operating rate due to high prices of raw materials and the difficulties to pass such high prices onto their final products. The P&W industry remained more stable, with some producers decreasing supply and inventories, and trying to maintain prices of final products. During the second quarter, the Chinese government implemented measures to try to stop the rise in commodity prices, these measures impacted negatively upon the pulp futures market. Short fiber price reached its highest level at the beginning of the quarter and then remained stable, however, long fiber prices after increasing and reaching its highest level slightly decreased towards the end of the quarter. The spread between the long and short fiber decreased reaching US$130 at the end of the quarter, a decrease of US$40 compared to end of the first quarter.
In Europe there was good pulp demand during the quarter. The P&W and specialty industries experienced good demand for their final products, and they have been able to confirm price increases transferring the higher costs of raw material to their final products. The tissue industry came under increased pressure because of (i) pulp prices, (ii) prices for final
3
CELULOSA ARAUCO Y CONSTITUCION S.A. AND SUBSIDIARIES
Ratio Analysis of the Interim Consolidated Financial Statements
June 30, 2021
Amounts in thousands of U.S. dollars, except as indicated
products did not increase, and (iii) demand for their products remained stable. Pulp prices, as in the first quarter, continued to rise throughout the second quarter.
The dissolving pulp market remained stable and prices kept at high levels. The viscose market started to decline so some local dissolving pulp producers in China switched to producing paper grade pulp, anticipating the pressure in the dissolving pulp market.
Production during the second quarter was lower by 3.5% compared to the same period of 2020. During the second quarter of this year, we had the programmed maintenance stoppage of the Esperanza mill, in Argentina, and the Line 2 of the Arauco mill.
Wood Products Business
Panels
Revenues increased when compared to the first quarter, mainly as a result of a 9.7% increase in average prices. Sales volumes increased 1.6%.
During the second quarter, the market demand continued to rise. The foregoing is explained by an increase in demand for products of home improvement and remodeling, the reactivation of construction projects and by government measures that have favored consumption.
Sawn timber
During the second quarter sales volume decreased by 2.0% while average prices increased by 7.2%.
During the second quarter prices for sawn timber and remanufactured wood products continued to rise compared to the first quarter mainly due to an increase in demand. However, logistics problems have also continued throughout the quarter leading to low availability and rising costs.
Plywood
Sales volume decreased by 21.2% during the second quarter, partially offset by an increase in average prices of 14.7%. There has been an increase in demand in markets such as Chile, Europe, Oceania and the US, despite some effects arising from logistical issues leading to some invoice delays.
4. ANALYSIS OF INTERIM CASH FLOW
The main components of cash flow in each period are as follows:
| | | | | | | | |
| | | 06-30-2021
ThU.S.$ | | | 06-30-2020
ThU.S.$ | |
Positive (negative) Cash flow | | | | | | | | |
Net cash flows from operating activities | | | 854,838 | | | | 249,238 | |
Cash flows from (used in) financing activities: | | | | | | | | |
Issuance of shares | | | 200,000 | | | | — | |
Obtaining and paying loans and bonds | | | (267,643 | ) | | | 312,991 | |
Payment of lease liabilities | | | (36,238 | ) | | | (37,582 | ) |
Dividends paid | | | (167 | ) | | | (110 | ) |
Others | | | 457 | | | | (8,591 | |
Cash flows from (used in) investment activities: | | | | | | | | |
Purchase and sale of property, plant and equipment | | | (595,793 | ) | | | (680,196 | ) |
Purchase and sale of biological assets | | | (127,534 | ) | | | (114,471 | ) |
Purchase and sale of intangible assets | | | (2,471 | ) | | | (11,565 | ) |
Additions (disposals), investments in subsidiaries, joint ventures and associates | | | 43,183 | | | | (15,212 | ) |
Dividends received | | | 1,454 | | | | 4,042 | |
Others | | | (429 | ) | | | 667 | |
| | | | | | | | |
Positive (negative) net cash flow | | | 69,657 | | | | (300,789 | ) |
| | | | | | | | |
4
CELULOSA ARAUCO Y CONSTITUCION S.A. AND SUBSIDIARIES
Ratio Analysis of the Interim Consolidated Financial Statements
June 30, 2021
Amounts in thousands of U.S. dollars, except as indicated
Our cash flow from operating activities increased to MU.S.$ 855 for the current period (compared to the positive balance of MU.S.$ 249 for the same period in 2020), resulting mainly from higher revenue from customer collections and tax refund in the current period.
The cash flow from financing activities shows a negative balance of MU.S.$ 104 for the current period (compared to the positive balance of MU.S.$ 267 for the same period in 2020). The decrease is attributable to prepayment of bank loans in the current period of MU.S.$ 200 and due to the effect of the increase in financial debts in the previous period offset by the capital increase of the parent company for MU.S.$ 200 made by the shareholders in the current period.
Regarding the cash flow from investment activities, the balance decreased to MU.S.$ 682 (compared to MU.S.$ 817 for the same period of 2020), mainly due to lower disbursements made for the purchase of property, plant and equipment and the sale of the participation in the subsidiary Forestal Los Lagos SpA of MU.S.$ 48 in the current period.
5. MARKET RISK ANALYSIS
In respect of the economic risks resulting from interest rate variations, the Company maintains, as of June 30, 2021, a ratio of fixed rate debt to total consolidated debt of approximately 94.2%, which we believe is consistent with industry standards.
Regarding variations in prices of pulp and forestry products, since the risks of price fluctuation are limited/can be managed without hedging, the Company does not participate in futures trading, which allows it to maintain one of the lowest cost structures in the industry, thes risks are bounded.
The Company and most of its subsidiaries maintain their accounting records and prepare their financial statements in U.S. dollars. Most of their revenues (and accordingly accounts receivable) are denominated in U.S. dollars, and most financial liabilities are either denominated in U.S. dollars or are covered by exchange rate swaps. As a result, exposure to exchange rate fluctuations has decreased significantly.
In the Interim Consolidated Financial Statements as of June 30, 2021, a detailed analysis of the risks associated with the business of Arauco (see Note 23).
5
CELULOSA ARAUCO Y CONSTITUCION S.A. AND SUBSIDIARIES
Unaudited Interim Consolidated Financial Statements
June 30, 2021
Amounts in thousands of U.S. dollars, except as indicated
INTERIM CONSOLIDATED STATEMENTS OF FINANCIAL POSITION
| | | | | | | | | | | | |
| | | | | | 06-30-2021 | | | 12-31-2020 | |
| | | Note | | | ThU.S.$ | | | ThU.S.$ | |
Assets | | | | | | | | | | | | |
Current Assets | | | | | | | | | | | | |
Cash and cash equivalents | | | 5-23 | | | | 1,133,729 | | | | 1,064,714 | |
Other current financial assets | | | 23 | | | | 3,309 | | | | 1,763 | |
Other current non-financial assets | | | 25 | | | | 208,044 | | | | 168,597 | |
Trade and other current receivables | | | 23 | | | | 878,628 | | | | 737,381 | |
Accounts receivable from related companies | | | 13 | | | | 5,812 | | | | 6,274 | |
Current inventories | | | 4 | | | | 1,019,753 | | | | 938,279 | |
Current biological assets | | | 20 | | | | 297,890 | | | | 302,710 | |
Current tax assets | | | 6 | | | | 111,782 | | | | 320,730 | |
Total Current Assets other than assets or disposal groups classified as held for sale | | | | | | | 3,658,947 | | | | 3,540,448 | |
Non-Current Assets or disposal groups classified as held for sale | | | 22 | | | | 131,960 | | | | 3,877 | |
Non-Current Assets or disposal groups classified as held for sale or as held for distribution to owners | | | | | | | 131,960 | | | | 3,877 | |
Total Current Assets | | | | | | | 3,790,907 | | | | 3,544,325 | |
Non-Current Assets | | | | | | | | | | | | |
Other non-current financial assets | | | 23 | | | | 16,670 | | | | 28,982 | |
Other non-current non-financial assets | | | 25 | | | | 117,911 | | | | 113,214 | |
Trade and other non-current receivables | | | 23 | | | | 15,673 | | | | 16,606 | |
Investments accounted for using equity method | | | 15-16 | | | | 324,391 | | | | 316,939 | |
Intangible assets other than goodwill | | | 19 | | | | 97,140 | | | | 102,090 | |
Goodwill | | | 17 | | | | 59,617 | | | | 59,567 | |
Property, plant and equipment | | | 7 | | | | 8,605,407 | | | | 8,325,304 | |
Right of use assets | | | 8 | | | | 201,244 | | | | 219,134 | |
Non-current biological assets | | | 20 | | | | 3,189,681 | | | | 3,296,117 | |
Deferred tax assets | | | 6 | | | | 5,715 | | | | 6,041 | |
Total Non-Current Assets | | | | | | | 12,633,449 | | | | 12,483,994 | |
Total Assets | | | | | | | 16,424,356 | | | | 16,028,319 | |
| | | | | | | | | | | | |
The accompanying notes are an integral part of these interim consolidated financial statements.
6
CELULOSA ARAUCO Y CONSTITUCION S.A. AND SUBSIDIARIES
Unaudited Interim Consolidated Financial Statements
June 30, 2021
Amounts in thousands of U.S. dollars, except as indicated
INTERIM CONSOLIDATED STATEMENTS OF FINANCIAL POSITION (continued)
| | | | | | | | | | | | |
| | | | | | 06-30-2021 | | | 12-31-2020 | |
| | | Note | | | ThU.S.$ | | | ThU.S.$ | |
Equity and Liabilities | | | | | | | | | | | | |
Liabilities | | | | | | | | | | | | |
Current Liabilities | | | | | | | | | | | | |
Other current financial liabilities | | | 23 | | | | 429,426 | | | | 307,136 | |
Current lease liabilities | | | 8-23 | | | | 58,225 | | | | 63,640 | |
Trade and other current payables | | | 23 | | | | 700,226 | | | | 626,504 | |
Accounts payable to related companies | | | 13 | | | | 3,862 | | | | 3,739 | |
Other current provisions | | | 18 | | | | 385 | | | | 386 | |
Current tax liabilities | | | 6 | | | | 56,011 | | | | 44,672 | |
Current provisions for employee benefits | | | 10 | | | | 6,365 | | | | 6,786 | |
Other current non-financial liabilities | | | 25 | | | | 49,958 | | | | 44,730 | |
| | | |
Total Current Liabilities other than assets included in disposal groups classified as held for sale | | | | | | | 1,304,458 | | | | 1,097,593 | |
Total Current Liabilities | | | | | | | 1,304,458 | | | | 1,097,593 | |
Non-Current Liabilities | | | | | | | | | | | | |
Other non-current financial liabilities | | | 23 | | | | 5,380,494 | | | | 5,714,728 | |
Non-current lease liabilities | | | 8-23 | | | | 137,037 | | | | 148,115 | |
Other non-current provisions | | | 18 | | | | 29,277 | | | | 30,450 | |
Deferred tax liabilities | | | 6 | | | | 1,509,315 | | | | 1,463,886 | |
Non-current provisions for employee benefits | | | 10 | | | | 73,925 | | | | 74,609 | |
Other non-current non-financial liabilities | | | 25 | | | | 86,008 | | | | 83,303 | |
Total Non-Current Liabilities | | | | | | | 7,216,056 | | | | 7,515,091 | |
Total Liabilities | | | | | | | 8,520,514 | | | | 8,612,684 | |
Equity | | | | | | | | | | | | |
Issued capital | | | 3 | | | | 803,618 | | | | 603,618 | |
Retained earnings | | | | | | | 8,192,300 | | | | 7,889,901 | |
Other reserves | | | | | | | (1,119,002 | ) | | | (1,108,797 | ) |
Equity attributable to parent company | | | | | | | 7,876,916 | | | | 7,384,722 | |
Non-controlling interests | | | | | | | 26,926 | | | | 30,913 | |
Total Equity | | | | | | | 7,903,842 | | | | 7,415,635 | |
Total Equity and Liabilities | | | | | | | 16,424,356 | | | | 16,028,319 | |
| | | | | | | | | | | | |
The accompanying notes are an integral part of these interim consolidated financial statements.
7
CELULOSA ARAUCO Y CONSTITUCION S.A. AND SUBSIDIARIES
Unaudited Interim Consolidated Financial Statements
June 30, 2021
Amounts in thousands of U.S. dollars, except as indicated
INTERIM CONSOLIDATED STATEMENTS OF PROFIT OR LOSS
| | | | | | | | | | | | | | | | | | | | |
| | | | | | January-June | | | April-June | |
| | | | | | 2021 | | | 2020 | | | 2021 | | | 2020 | |
| | | Note | | | ThU.S.$ | | | ThU.S.$ | | | ThU.S.$ | | | ThU.S.$ | |
Statements of profit or loss | | | | | | | | | | | | | | | | | | | | |
Revenue | | | 9 | | | | 2,902,281 | | | | 2,177,040 | | | | 1,555,578 | | | | 1,049,874 | |
Cost of sales | | | 3 | | | | (1,784,957 | ) | | | (1,643,614 | ) | | | (887,183 | ) | | | (800,054 | ) |
Gross profit | | | | | | | 1,117,324 | | | | 533,426 | | | | 668,395 | | | | 249,820 | |
Other income | | | 3 | | | | 120,376 | | | | 122,844 | | | | 45,379 | | | | 67,598 | |
Distribution costs | | | 3 | | | | (304,070 | ) | | | (260,245 | ) | | | (159,276 | ) | | | (122,816 | ) |
Administrative expenses | | | 3 | | | | (287,155 | ) | | | (253,728 | ) | | | (150,653 | ) | | | (130,225 | ) |
Other expense | | | 3 | | | | (70,456 | ) | | | (108,294 | ) | | | (32,978 | ) | | | (57,356 | ) |
Profit from operating activities | | | | | | | 576,019 | | | | 34,003 | | | | 370,867 | | | | 7,021 | |
Finance income | | | 3 | | | | 14,434 | | | | 19,519 | | | | 7,600 | | | | 12,312 | |
Finance costs | | | 3 | | | | (118,180 | ) | | | (137,704 | ) | | | (57,187 | ) | | | (65,922 | ) |
Share of profit of associates and joint ventures accounted for using equity method | | | 3-15 | | | | 11,216 | | | | (488 | ) | | | 8,718 | | | | (2,041 | ) |
Gains (losses) on exchange differences on translation | | | | | | | (13,696 | ) | | | (30,084 | ) | | | (5,217 | ) | | | (26,657 | ) |
Profit before income tax | | | | | | | 469,793 | | | | (114,754 | ) | | | 324,781 | | | | (75,287 | ) |
Income Tax | | | 6 | | | | (166,006 | ) | | | 29,111 | | | | (123,362 | ) | | | 19,350 | |
Net Profit | | | | | | | 303,787 | | | | (85,643 | ) | | | 201,419 | | | | (55,937 | ) |
| | | | | | | | | | | | | | | | | | | | |
Net profit attributable to | | | | | | | | | | | | | | | | | | | | |
Net profit attributable to parent company | | | | | | | 302,912 | | | | (85,477 | ) | | | 201,004 | | | | (56,017 | ) |
Net profit attributable to non-controlling interests | | | | | | | 875 | | | | (166 | ) | | | 415 | | | | 80 | |
Net Profit | | | | | | | 303,787 | | | | (85,643 | ) | | | 201,419 | | | | (55,937 | ) |
| | | | | | | | | | | | | | | | | | | | |
Basic and diluted earnings per share (in U.S.$ per share) | | | | | | | | | | | | | | | | | | | | |
Basic and diluted earnings per share from continuing operations | | | | | | | 2.5597414 | | | | (0.7554 | ) | | | 1.6724083 | | | | (0.4950 | ) |
Basic and diluted earnings per share | | | | | | | 2.5597414 | | | | (0.7554 | ) | | | 1.6724083 | | | | (0.4950 | ) |
| | | | | | | | | | | | | | | | | | | | |
The accompanying notes are an integral part of these interim consolidated financial statements.
8
CELULOSA ARAUCO Y CONSTITUCION S.A. AND SUBSIDIARIES
Unaudited Interim Consolidated Financial Statements
June 30, 2021
Amounts in thousands of U.S. dollars, except as indicated
INTERIM CONSOLIDATED STATEMENTS OF COMPREHENSIVE INCOME
| | | | | | | | | | | | | | | | | | | | |
| | | | | | January-June | | | April-June | |
| | | | | | 2021 | | | 2020 | | | 2021 | | | 2020 | |
| | | Note | | | ThU.S.$ | | | ThU.S.$ | | | ThU.S.$ | | | ThU.S.$ | |
Net profit | | | | | | | 303,787 | | | | (85,643 | ) | | | 201,419 | | | | (55,937 | ) |
Components of other comprehensive income that will not be reclassified to profit or loss before tax: | | | | | | | | | | | | | | | | | | | | |
Other comprehensive income before tax gains losses on remeasurements of defined benefit plans | | | 10 | | | | 1,229 | | | | (454 | ) | | | (1,172 | ) | | | (563 | ) |
Other Comprehensive Income that will not be reclassified to profit or loss before tax | | | | | | | 1,229 | | | | (454 | ) | | | (1,172 | ) | | | (563 | ) |
Components of other comprehensive income that will be reclassified to profit or loss before tax: | | | | | | | | | | | | | | | | | | | | |
Exchange differences on translation | | | | | | | | | | | | | | | | | | | | |
Gains (losses) on exchange differences on translation, before tax | | | 11 | | | | 24,736 | | | | (281,392 | ) | | | 106,553 | | | | (17,003 | ) |
Other Comprehensive Income before tax exchange differences on translation | | | | | | | 24,736 | | | | (281,392 | ) | | | 106,553 | | | | (17,003 | ) |
Cash flow hedges | | | | | | | | | | | | | | | | | | | | |
Gains (losses) on cash flow hedges, before tax | | | 23 | | | | (49,740 | ) | | | (66,873 | ) | | | (82,658 | ) | | | 36,593 | |
Recycle of cash flow hedges to profit or loss before tax | | | 23 | | | | (10,137 | ) | | | (20,854 | ) | | | (9,862 | ) | | | (18,057 | ) |
Other Comprehensive Income before tax Cash flow hedges | | | | | | | (59,877 | ) | | | (87,727 | ) | | | (92,520 | ) | | | 18,536 | |
Share of other comprehensive income of associates and joint ventures accounted for using equity method that will be reclassified to profit or loss before tax | | | | | | | 2,187 | | | | (5,922 | ) | | | 752 | | | | 107 | |
Share of other comprehensive income of associates and joint ventures accounted for using equity method that will be reclassified to profit or loss before tax | | | | | | | 2,187 | | | | (5,922 | ) | | | 752 | | | | 107 | |
Share of other comprehensive income of associates and joint ventures accounted for using equity method that will be reclassified to profit or loss before tax | | | | | | | (32,954 | ) | | | (375,041 | ) | | | 14,785 | | | | 1,640 | |
Income tax relating to components of other comprehensive income that will not be reclassified to profit or loss before tax | | | | | | | | | | | | | | | | | | | | |
Income tax relating to remeasurements of defined benefit plans of other comprehensive income | | | | | | | (293 | ) | | | 119 | | | | 316 | | | | 183 | |
Income tax relating to components of other comprehensive income that will not be reclassified to profit or loss before tax | | | | | | | (293 | ) | | | 119 | | | | 316 | | | | 183 | |
Income tax relating to components of other comprehensive income that will be reclassified to profit or loss before tax | | | | | | | | | | | | | | | | | | | | |
Income tax relating to cash flow hedges of other comprehensive income | | | 6 | | | | 17,132 | | | | 21,427 | | | | 24,184 | | | | (6,359 | ) |
Income tax relating to share of other comprehensive income of associates and joint ventures accounted for using equity method that will be reclassified to profit or loss | | | | | | | (470 | ) | | | 1,237 | | | | (162 | ) | | | (27 | ) |
Income tax relating to components of other comprehensive income that will be reclassified to profit or loss | | | | | | | 16,662 | | | | 22,664 | | | | 24,022 | | | | (6,386 | ) |
Other comprehensive income (loss) | | | | | | | (15,356 | ) | | | (352,712 | ) | | | 37,951 | | | | (5,126 | ) |
Comprehensive income (loss) | | | | | | | 288,431 | | | | (438,355 | ) | | | 239,370 | | | | (61,063 | ) |
| | | | | | | | | | | | | | | | | | | | |
Comprehensive Income (loss) attributable to | | | | | | | | | | | | | | | | | | | | |
Comprehensive income (loss), attributable to Owners of parent company | | | | | | | 292,338 | | | | (432,797 | ) | | | 236,633 | | | | (60,352 | ) |
Comprehensive income (loss), attributable to Non-controlling interests | | | | | | | (3,907 | ) | | | (5,558 | ) | | | 2,737 | | | | (711 | ) |
Total comprehensive income (loss) | | | | | | | 288,431 | | | | (438,355 | ) | | | 239,370 | | | | (61,063 | ) |
| | | | | | | | | | | | | | | | | | | | |
The accompanying notes are an integral part of these interim consolidated financial statements.
9
CELULOSA ARAUCO Y CONSTITUCION S.A. AND SUBSIDIARIES
Unaudited Interim Consolidated Financial Statements
June 30, 2021
Amounts in thousands of U.S. dollars, except as indicated
INTERIM CONSOLIDATED STATEMENTS OF CHANGES IN EQUITY
| | | | | | | | | | | | | | | | | | | | | | | | | | | | | | | | | | | | | | | | |
06-30-2021 | | Issued
Capital
ThU.S.$ | | | Reserve of
exchange
differences
on
translation
ThU.S.$ | | | Reserve of
cash flow
hedges
ThU.S.$ | | | Reserve
of
actuarial
losses on
defined
benefit
plans
ThU.S.$ | | | Other
Reserves
ThU.S.$ | | | Total other
Reserves
ThU.S.$ | | | Retained
Earnings
ThU.S.$ | | | Equity
attributable
to owners of
parent
ThU.S.$ | | | Non -
controlling
interests
ThU.S.$ | | | Total
Equity
ThU.S.$ | |
Opening balance at 01-01-2021 | | | 603,618 | | | | (1,081,320 | ) | | | (37,007 | ) | | | (19,725 | ) | | | 29,255 | | | | (1,108,797 | ) | | | 7,889,901 | | | | 7,384,722 | | | | 30,913 | | | | 7,415,635 | |
Changes in Equity: | | | | | | | | | | | | | | | | | | | | | | | | | | | | | | | | | | | | | | | | |
Comprehensive income | | | | | | | | | | | | | | | | | | | | | | | | | | | | | | | | | | | | | | | | |
Net profit | | | — | | | | — | | | | — | | | | — | | | | — | | | | — | | | | 302,912 | | | | 302,912 | | | | 875 | | | | 303,787 | |
Other comprehensive income, net of tax | | | — | | | | 29,518 | | | | (42,745 | ) | | | 936 | | | | 1,717 | | | | (10,574 | ) | | | — | | | | (10,574 | ) | | | (4,782 | ) | | | (15,356 | ) |
Comprehensive income | | | — | | | | 29,518 | | | | (42,745 | ) | | | 936 | | | | 1,717 | | | | (10,574 | ) | | | 302,912 | | | | 292,338 | | | | (3,907 | ) | | | 288,431 | |
Issue of equity | | | 200,000 | | | | — | | | | — | | | | — | | | | — | | | | — | | | | — | | | | 200,000 | | | | — | | | | 200,000 | |
Dividends | | | — | | | | — | | | | — | | | | — | | | | — | | | | — | | | | — | | | | — | | | | (80 | ) | | | (80 | ) |
Increase (decrease) from transfers and other changes | | | — | | | | — | | | | — | | | | — | | | | 369 | | | | 369 | | | | (513 | ) | | | (144 | ) | | | — | | | | (144 | ) |
Changes in equity | | | 200,000 | | | | 29,518 | | | | (42,745 | ) | | | 936 | | | | 2,086 | | | | (10,205 | ) | | | 302,399 | | | | 492,194 | | | | (3,987 | ) | | | 488,207 | |
Closing balance at 06-30-2021 | | | 803,618 | | | | (1,051,802 | ) | | | (79,752 | ) | | | (18,789 | ) | | | 31,341 | | | | (1,119,002 | ) | | | 8,192,300 | | | | 7,876,916 | | | | 26,926 | | | | 7,903,842 | |
| | | | | | | | | | | | | | | | | | | | | | | | | | | | | | | | | | | | | | | | |
| | | | | | | | | | |
06-30-2020 | | Issued
Capital
ThU.S.$ | | | Reserve of
exchange
differences
on
translation
ThU.S.$ | | | Reserve of
cash flow
hedges
ThU.S.$ | | | Reserve of
actuarial
losses on
defined
benefit
plans
ThU.S.$ | | | Other
Reserves
ThU.S.$ | | | Total other
Reserves
ThU.S.$ | | | Retained
Earnings
ThU.S.$ | | | Equity
attributable
to owners of
parent
ThU.S.$ | | | Non -
controlling
interests
ThU.S.$ | | | Total
Equity
ThU.S.$ | |
Opening balance at 01-01-2020 | | | 353,618 | | | | (902,387 | ) | | | 9,010 | | | | (19,511 | ) | | | 20,024 | | | | (892,864 | ) | | | 7,873,650 | | | | 7,334,404 | | | | 35,011 | | | | 7,369,415 | |
Changes in Equity: | | | — | | | | — | | | | — | | | | — | | | | — | | | | — | | | | — | | | | — | | | | — | | | | — | |
Comprehensive income | | | — | | | | — | | | | — | | | | — | | | | — | | | | — | | | | — | | | | — | | | | — | | | | — | |
Net profit | | | — | | | | — | | | | — | | | | — | | | | — | | | | — | | | | (85,477 | ) | | | (85,477 | ) | | | (166 | ) | | | (85,643 | ) |
Other comprehensive income, net of tax | | | — | | | | (276,008 | ) | | | (66,300 | ) | | | (327 | ) | | | (4,685 | ) | | | (347,320 | ) | | | — | | | | (347,320 | ) | | | (5,392 | ) | | | (352,712 | ) |
Comprehensive income | | | — | | | | (276,008 | ) | | | (66,300 | ) | | | (327 | ) | | | (4,685 | ) | | | (347,320 | ) | | | (85,477 | ) | | | (432,797 | ) | | | (5,558 | ) | | | (438,355 | ) |
Dividends | | | — | | | | — | | | | — | | | | — | | | | — | | | | — | | | | — | | | | — | | | | (62 | ) | | | (62 | ) |
Increase (decrease) from transfers and other changes | | | — | | | | — | | | | — | | | | — | | | | — | | | | — | | | | — | | | | — | | | | — | | | | — | |
Changes in equity | | | — | | | | (276,008 | ) | | | (66,300 | ) | | | (327 | ) | | | (4,685 | ) | | | (347,320 | ) | | | (85,477 | ) | | | (432,797 | ) | | | (5,620 | ) | | | (438,417 | ) |
Closing balance at 06-30-2020 | | | 353,618 | | | | (1,178,395 | ) | | | (57,290 | ) | | | (19,838 | ) | | | 15,339 | | | | (1,240,184 | ) | | | 7,788,173 | | | | 6,901,607 | | | | 29,391 | | | | 6,930,998 | |
| | | | | | | | | | | | | | | | | | | | | | | | | | | | | | | | | | | | | | | | |
The accompanying notes are an integral part of these interim consolidated financial statements.
10
CELULOSA ARAUCO Y CONSTITUCION S.A. AND SUBSIDIARIES
Unaudited Interim Consolidated Financial Statements
June 30, 2021
Amounts in thousands of U.S. dollars, except as indicated
INTERIM CONSOLIDATED STATEMENTS OF CASH FLOWS
| | | | | | | | |
| | | January-June | |
| | | 2021 | | | 2020 | |
| | | ThU.S.$ | | | ThU.S.$ | |
| | |
STATEMENTS OF CASH FLOWS | | | | | | | | |
| | |
Cash Flows from (used in) Operating Activities | | | | | | | | |
| | |
Classes of cash receipts from operating activities | | | | | | | | |
| | |
Receipts from sales of goods and rendering of services | | | 2,832,390 | | | | 2,298,271 | |
Other cash receipts from operating activities | | | 260,189 | | | | 392,745 | |
Classes of cash payments | | | | | | | | |
Payments to suppliers for goods and services | | | (1,878,961 | ) | | | (1,843,706 | ) |
Payments to and on behalf of employees | | | (313,747 | ) | | | (292,009 | ) |
Other cash payments from operating activities | | | (60,675 | ) | | | (209,130 | ) |
Interest paid | | | (125,848 | ) | | | (131,775 | ) |
Interest received | | | 13,784 | | | | 9,420 | |
Income taxes paid | | | 130,029 | | | | 27,539 | |
Other inflows (outflows) of cash, net | | | (2,323 | ) | | | (2,117 | ) |
Net Cash flow from Operating Activities | | | 854,838 | | | | 249,238 | |
| | | | | | | | |
| | |
Cash flows from (used in) Investing Activities | | | | | | | | |
Cash flow used in obtaining control of subsidiaries and other businesses | | | 47,988 | | | | — | |
Cash flow used in the purchase of non-controlling interests | | | (5 | ) | | | (15,212 | ) |
Other cash payments to acquire interests in joint ventures | | | (4,800 | ) | | | — | |
Loans to related entities | | | (427 | ) | | | — | |
Proceeds from sale of property, plant and equipment | | | 7,330 | | | | 2,634 | |
Purchase of property, plant and equipment | | | (603,123 | ) | | | (682,830 | ) |
Purchase of intangible assets | | | (2,471 | ) | | | (8,511 | ) |
Proceeds from sales of other long-term assets | | | 3,805 | | | | 5,600 | |
Purchase of other non-current assets | | | (131,339 | ) | | | (123,125 | ) |
Dividends received | | | 1,454 | | | | 4,042 | |
Other inflows (outflows) of cash, net | | | (2 | ) | | | 667 | |
Cash flows used Investing Activities | | | (681,590 | ) | | | (816,735 | ) |
| | | | | | | | |
| | |
Cash flows from (used in) Financing Activities | | | | | | | | |
Total issuance of shares | | | 200,000 | | | | — | |
Total loanss obtained | | | 5,000 | | | | 378,836 | |
Debt obtained in long-term | | | — | | | | 228,836 | |
Debt obtained in short-term | | | 5,000 | | | | 150,000 | |
Repayments of loans | | | (272,643 | ) | | | (65,845 | ) |
Payments of lease liabilities | | | (36,238 | ) | | | (37,582 | ) |
Dividends paid | | | (167 | ) | | | (110 | ) |
Other outflows of cash, net | | | 457 | | | | (8,591 | ) |
Cash flows from (used in) Financing Activities | | | (103,591 | ) | | | 266,708 | |
| | | | | | | | |
Net increase (decrease) in Cash and Cash Equivalents before effect of exchange rate changes | | | 69,657 | | | | (300,789 | ) |
Effect of exchange rate changes on cash and cash equivalents | | | (642 | ) | | | (29,232 | ) |
| | | | | | | | |
Net increase (decrease) of Cash and Cash Equivalents | | | 69,015 | | | | (330,021 | ) |
Cash and cash equivalents, at the beginning of the period | | | 1,064,714 | | | | 1,560,012 | |
Cash and cash equivalents, at the end of the period | | | 1,133,729 | | | | 1,229,991 | |
| | | | | | | | |
The accompanying notes are an integral part of these interim consolidated financial statements.
11
CELULOSA ARAUCO Y CONSTITUCION S.A. AND SUBSIDIARIES
Unaudited Interim Consolidated Financial Statements
June 30, 2021
Amounts in thousands of U.S. dollars, except as indicated
NOTES TO THE INTERIM CONSOLIDATED FINANCIAL STATEMENTS AS OF JUNE 30, 2021 AND 2020 AND AS OF DECEMBER 31,2020
NOTE 1. PRESENTATION OF INTERIM CONSOLIDATED FINANCIAL STATEMENTS
Entity Information
Celulosa Arauco y Constitución S.A. and subsidiaries, (hereafter “Arauco” or the “Company”), tax identification number 93,458,000-1, is a closely held corporation, that was registered in the Securities Registry (the “Registry”) of the Chilean Commission for the Financial Market (“CMF”) as No. 042 on June 14, 1982. Additionally, the Company is registered as a non-accelerated filer in the Securities and Exchange Commission (SEC) of the United States of America.
The Company’s head office address is El Golf Avenue 150, 14th floor, Las Condes, Santiago, Chile.
Arauco is principally engaged in the production and sale of products related to the forestry and timber industries. Its main operations are focused on business areas of pulp and wood productos.
As of June 30, 2021, Arauco is controlled by Empresas Copec S.A., tax identification number 90,690,000-9, which owns 99,978048% of Arauco, and is registered in the Securities Registry as No. 0028. Each of the above mentioned companies is subject to the oversight of the CMF.
Moreover, Empresas Copec S.A. is controlled by the public corporation AntarChile S.A., tax identification number 96,556,310-5, which owns 60,8208% of Empresas Copec S.A. Furthermore, the ultimate shareholders of AntarChile S.A. and, consequently, of Empresas Copec S.A., are Mr. Roberto Angelini Rossi, tax identification number 5,625,652-0, and Mrs. Patricia Angelini Rossi, tax identification number 5,765,170-9.
Arauco’s Interim Consolidated Financial Statements were prepared on a going concern basis.
Presentation of Interim Consolidated Financial Statements
The Consolidated Financial Statements presented by Arauco are comprised by the following:
| | • | | Interim Consolidated Statements of Financial Position as of June 30, 2021 and as of December 31,2020. |
| | • | | Interim Consolidated Statements of Profit or Loss for the periods ended June 30, 2021 and 2020. |
| | • | | Interim Consolidated Statements of Comprehensive Income for the periods ended June 30, 2021 and 2020. |
| | • | | Interim Consolidated Statements of Changes in Equity for the periods ended June 30, 2021 and 2020. |
| | • | | Interim Consolidated Statements of Cash Flows for the periods ended June 30, 2021 and 2020. |
| | • | | Explanatory disclosures (notes) |
12
CELULOSA ARAUCO Y CONSTITUCION S.A. AND SUBSIDIARIES
Unaudited Interim Consolidated Financial Statements
June 30, 2021
Amounts in thousands of U.S. dollars, except as indicated
Period Covered by the Interim Consolidated Financial Statements
Periods ended June 30, 2021 and 2020.
Date of Approval of the Interim Consolidated Financial Statements
These interim consolidated financial statements were approved by the Board of Directors of the Company (the “Board”) at the Extraordinary Meeting No. 654 on August 16, 2021.
Abbreviations used in this report:
IFRS - International Financial Reporting Standards
IASB - International Accounting Standards Board
IAS - International Accounting Standards
IFRIC - International Financial Reporting Standards Interpretations Committee
MU.S.$ - Millions of U.S. dollars
ThU.S.$ - Thousands of U.S. dollars
U.F. - Inflation index-linked units of account
UTA - Annual Tax Unit
ICMS - Tax movement of inventories and services (Brazil)
ThCLP$ - Thousands of Chilean Pesos
Functional and Presentation Currency
Arauco and most of its subsidiaries determined the United States (“U.S.”) Dollar as its functional currency since the majority of its revenues from sales of its products are derived from exports denominated in U.S. Dollars, while their costs of sales are to a large extent related or indexed to the U.S. Dollar.
For the pulp reportable segment, most of the sales are exports denominated in U.S. Dollars and costs are mainly related to plantation costs which are settled in U.S. Dollars.
For the wood operating segment, although total sales include a mix of domestic and exports sales, prices of the products are established in U.S. Dollars, which is also the case for the cost structure of the related raw materials.
In relation to the cost of sales, although labor and services costs are generally billed and paid in local currency, these costs are not as significant as the costs of raw materials, which are driven mainly by global markets and therefore, influenced mostly by the U.S. Dollar.
The currency used to finance operations is mainly the U.S. Dollar.
The presentation currency of the consolidated financial statements is the U.S. Dollar. Figures on these interim consolidated financial statements are presented in thousands of U.S. Dollar (ThU.S.$).
13
CELULOSA ARAUCO Y CONSTITUCION S.A. AND SUBSIDIARIES
Unaudited Interim Consolidated Financial Statements
June 30, 2021
Amounts in thousands of U.S. dollars, except as indicated
Summary of significant accounting policies
a) Basis for preparation of the interim consolidated financial statements
These interim consolidated financial statements have been prepared in accordance with International Financial Reporting Standards (IFRS) as issued by the International Accounting Standards Board (IASB) and they represent the explicit and unreserved adoption of IFRS.
The interim consolidated financial statements have been prepared on a historical cost basis, except for biological assets and certain derivative financial instruments which are measured at revalued amounts or fair value at the end of each period as explained in the following significant accounting policies.
b) Critical accounting estimates and judgments
The preparation of these interim consolidated financial statements, in accordance with IFRS, requires management to make estimates and assumptions that affect the carrying amounts reported. These estimates are based on historical experience and various other assumptions that are considered to be reasonable. Actual results may differ from these estimates. Management believes that the accounting policies below are the critical judgments that have the most significant effect on the amounts recognized in the consolidated financial statements.
- Biological Assets
The recovery of forest plantations is based on discounted cash flow models which means that the fair value of biological assets is calculated using cash flows from continuing operations on a discounted basis, based on our sustainable forest management plans and the estimated growth of forests.
The measurement of the fair value of the biological assets is determined using a discounted cash flow model. Our cash flow projections include significant judgments and assumptions relating to discount rates, estimated growth of the forests and sales margins. This valuation is performed on the basis of each identifiable farm block and for each type of tree. The main considerations used to calculate the valuation of forest plantations and a sensitivity analysis are presented in Note 20.
14
CELULOSA ARAUCO Y CONSTITUCION S.A. AND SUBSIDIARIES
Unaudited Interim Consolidated Financial Statements
June 30, 2021
Amounts in thousands of U.S. dollars, except as indicated
- Litigation and Contingencies
Arauco and its subsidiaries are subject to certain litigation proceedings. Future impact on Arauco’s financial condition derived from such litigations is estimated by management, in collaboration with its legal advisors. Arauco applies judgment when interpreting the reports of its legal advisors who provide updated estimates of the legal contingencies at each reporting period and/or at each time a modification is determined to be necessary. For a description of current litigations see Note 18.
c) Consolidation
The interim consolidated financial statements include all entities over which Arauco has the power to direct the relevant financial and operating activities. Subsidiaries are consolidated from the date on which control is obtained and up to the date that control ceases.
Specifically, a company controls an investee or subsidiary if, and only if, they have all of the following:
(a) power over the investee, i.e. the investor has existing rights which give it the ability to direct the relevant activities (the activities that significantly affect the investee’s returns);
| (b) | exposure or rights to variable returns from involvement with the investee; and |
| (c) | the ability to use power over the investee to affect the amount of the investor’s returns. |
When Arauco holds less than the majority of the voting rights in a company in which it participates, it nonetheless has the power over said company - when these voting rights are enough - to grant it in practice the ability to unilaterally direct said company’s relevant activities. Arauco takes into account all facts and circumstances in order to assess if the voting rights in a company in which it participates are enough for granting it the power, including:
a) the size of the investor’s holding of voting rights relative to the size and dispersion of holdings of the other vote holders;
b) potential voting rights held by the investor, other vote holders or other parties;
c) rights arising from other contractual arrangements; and
d) any additional facts and circumstances that indicate the investor has, or does not have, the current ability to direct the relevant activities at the time that decisions need to be made, including voting patterns at previous shareholders’ meetings.
The Company will reevaluate whether or not it holds control of a company in which participates if the facts and circumstances indicate that changes have occurred in one or more of the three elements of control mentioned above.
Consolidation of an investee shall begin from the date the investor obtains control of the investee and cease when the investor loses control of the investee. An entity includes the income and expenses of an acquired or sold subsidiary in the interim consolidated financial statements from the date it gains control until the date when the entity ceases to control the subsidiary.
15
CELULOSA ARAUCO Y CONSTITUCION S.A. AND SUBSIDIARIES
Unaudited Interim Consolidated Financial Statements
June 30, 2021
Amounts in thousands of U.S. dollars, except as indicated
The profit or loss of each component of other comprehensive income is attributed to owners of the parent company and the non-controlling interest, as appropriate. Total comprehensive income is attributed to the owners of the parent company and non-controlling interests even if the results of the non-controlling interest have a deficit balance.
If a subsidiary uses accounting policies other than those adopted in the interim consolidated financial statements for transactions and other events in similar circumstances, appropriate adjustments are made to the interim consolidated financial statements of subsidiaries in order to ensure compliance with Arauco’s accounting policies.
All intercompany transactions and unrealized gains and losses from subsidiaries have been fully eliminated from these interim consolidated financial statements and non-controlling interest is presented in the interim consolidated statement of financial position within equity.
The interim consolidated financial statements at the end of this period include the assets, liabilities, income and expenses of the subsidiaries shown in Note 13.
Certain consolidated subsidiaries have Brazilian Real, Mexican Pesos, Canadian Dollars, Chilean Pesos and Argentine Pesos as their functional currencies. For consolidation purposes, the financial statements of those subsidiaries have been prepared in accordance with IFRS and translated as indicated in Note 1 (e) (ii).
A parent company will present non-controlling interests in the interim consolidated statement of financial position within equity, separately from the equity of the owners of the parent company.
d) Segments
Arauco has defined its reportable segments according to its business areas, based on the products and services sold to its customers. This definition is consistent with the management, resource allocation and performance assessment made by key personnel responsible for making relevant decisions related to the Company’s operation. The personnel responsible for making such decisions are the Executive Vice-president and the Chief Executive Officer who are the highest authorities for making decisions and are supported by the Vice-presidents of each segment.
Based on the aforementioned process, the Company has established reportable segments according to the following business units:
Refer to Note 24 for detailed financial information by reportable segment.
16
CELULOSA ARAUCO Y CONSTITUCION S.A. AND SUBSIDIARIES
Unaudited Interim Consolidated Financial Statements
June 30, 2021
Amounts in thousands of U.S. dollars, except as indicated
All items in the financial statements of Arauco and each of its subsidiaries, associates and jointly controlled entities are measured using the currency of the primary economic environment in which each entity operates (the functional currency). The interim consolidated financial statements are presented in U.S. dollars, which is Arauco’s functional and presentation currency.
| (ii) | Translation to the presentation currency of Arauco |
For the purposes of presenting interim consolidated financial statements, assets and liabilities of Arauco’s operations in a functional currency different from Arauco’s are translated into U.S. dollars using exchange rates prevailing at the end of each reporting period. Income and expense items are translated at the average exchange rates for the period, unless exchange rates fluctuate significantly during that period, in which case the exchange rates at the dates of the transactions are used. Exchange rate differences are recognized in other comprehensive income and accumulated in “Other reserves” within–equity.
| (iii) | Foreign Currency Transactions |
Transactions in currencies other than the functional currency are recognized at the exchange rates prevailing at the dates of the transactions. Profit or loss on transactions in currencies other than the functional currency resulting from the settlement of such transactions and from the translation at year-end exchange rates of monetary assets and liabilities denominated in foreign currencies, are recognized in the interim consolidated statements of profit or loss, except those which are recorded in other comprehensive income and accumulated in equity such as cash flows hedging derivatives.
| f) | Cash and cash equivalents |
Cash and cash equivalents include cash-on-hand, deposits held on demand at financial entities and other short term highly liquid investments with an original maturity of three months or less and which are subject to an insignificant risk of changes in value.
Financial assets
Initial classification
Arauco classifies its financial assets into the following categories: fair value through profit or loss and amortized cost.
Arauco does not have financial assets at fair value through other comprehensive income.
The classification is based on the business model used to manage the assets and the characteristics of their contractual cash flows.
17
CELULOSA ARAUCO Y CONSTITUCION S.A. AND SUBSIDIARIES
Unaudited Interim Consolidated Financial Statements
June 30, 2021
Amounts in thousands of U.S. dollars, except as indicated
Management determines the classification of its financial assets at the time of their initial recognition.
(a) Financial assets at fair value through profit or loss: these instruments are initially measured at fair value. Net income and losses, including any income from interest or dividends, are registered in the profit or loss of the period. Financial assets are classified in the category of financial assets at fair value through profit or loss when they are maintained for negotiation or designated in their initial registration as assets at fair value through profit or loss. A financial asset can be classified in this category if it is acquired mainly for the purposes of being sold in the short-term. Gain or losses of assets held for negotiations are registered in the consolidated statements of Profit or Loss, and the related interest is registered independently as financial income. Derivatives are classified as acquired for negotiation also unless they are designated as hedging instruments.
(b) Assets measured at amortized cost: they are initially registered at the fair value of the transaction, adding or subtracting the transaction costs that are directly attributable to the issuance of the financial asset or financial liability. The financial asset is maintained within a business model, the objective of which is to maintain financial assets to obtain contractual cash flows and the contractual conditions of the asset give rise, on specified dates, to cash flows that are solely payments of principal and interests (“SPPI”) over the amount of the outstanding principal.
Subsequent measurement
Financial instruments are subsequently measured at fair value through profit or loss or amortized cost.
The classification is based on two criteria: i) the Company’s business model for the management of financial instruments, and ii) whether the contractual cash flows related to the financial instruments represent “Solely Payments of Principal and Interests”.
a) Financial assets at fair value through profit or loss: these instruments are subsequently measured at fair value. Net earnings and losses, including income from interests and dividends, are registered as profits or losses for the period. These instruments are held for negotiation and they are mainly acquired to be sold in the short term. Derivatives are also classified as held for negotiation, unless they are registered as hedging instruments. Financial instruments of this type are classified as Other Current and Non-Current Financial Assets. They are subsequently valuated by determining their fair value, registering changes in value in the interim interim consolidated statements of Profit or Loss, in the items of Financial Income or Financial Costs.
b) Financial assets measured at amortized cost: These instruments are subsequently measured at amortized cost minus accumulated amortizations, using the effective interest method and adjusted by loss allowance and volume discounts, in the case of financial assets. Financial income and expenses, foreign exchange income and losses, and impairment are registered in results. Any earnings or losses due to initial or subsequent reductions of the value of the asset are registered in the statement of profit or loss of the period. Loans and receivables are non-derivative financial instruments with fixed or determinable payments not traded in any active market. They are registered at amortized cost, registering accrued conditions directly in profit or loss.
18
CELULOSA ARAUCO Y CONSTITUCION S.A. AND SUBSIDIARIES
Unaudited Interim Consolidated Financial Statements
June 30, 2021
Amounts in thousands of U.S. dollars, except as indicated
Arauco measures accumulated losses in a quantity equivalent to expected credit losses during the lifelong commitment. Expected credit losses are based on contractual cash flow differences based on the allowance of each contract and the cash flows that Arauco expects. The difference is then discounted based on an approximation of the asset’s original effective interest rate. The asset’s carrying value is reduced as the allowance is used, and the loss is recognized in sales expenses in the interim consolidated statements of profit or loss. When an account receivable cannot be collected, it is regularized against the allowance account for receivables. Subsequent recoveries of previously impaired amounts are recognized as a debit in distribution costs.
Derivative financial instruments are explained in Note 1 h).
Financial liabilities
Arauco classifies its financial liabilities as follows: fair value through profit or loss, derivatives designated as effective hedging instruments and amortized costs.
Management determines the classification of its financial liabilities upon initial recognition. Financial liabilities are derecognized when the obligation is cancelled, settled or expired. When an existing financial liability is replaced with another of the same provider under substantially different terms, or where the terms of an existing liability are substantially amended, such exchange or modification is treated as a write-off of the original liability, with a new liability being recognized, and the difference between the respective carrying amounts is recognized in the interim consolidated statement of profit or loss.
Financial liabilities are initially recognized at fair value, and in the case of loans, they include the costs directly attributable to the transaction. The subsequent measurement of the financial liabilities depends on their classification:
Financial Liabilities at fair value through profit or loss
Financial liabilities are included in the category of financial liabilities at fair value through profit or loss when they are held for trading or originally designated at fair value through profit or loss. Income and losses from liabilities held for trading are recognized in profit or loss. This category includes non-designated derivatives for hedging accounting.
Financial Liabilities at amortized cost
Other financial liabilities are subsequently valued at their amortized cost based on the effective interest rate method. The amortized cost is calculated taking into account any premium or acquisition discount and includes the costs of transactions that are an integral part of the effective interest rate. This category includes Commercial Accounts Payable and Other Accounts Payable, lease liabilities, as well as the loans included in Other Current and Non-Current Financial Liabilities.
19
CELULOSA ARAUCO Y CONSTITUCION S.A. AND SUBSIDIARIES
Unaudited Interim Consolidated Financial Statements
June 30, 2021
Amounts in thousands of U.S. dollars, except as indicated
h) Derivative financial instruments
(i) Derivative Financial Instruments—The Company enters into a variety of derivative financial instruments to manage its exposure to interest rate and foreign exchange rate risks, including foreign exchange forward contracts, interest rate swaps, currency swaps and zero cost collar contracts. The Company’s policy is to enter into derivatives contracts only for economic hedging purposes and there are no instruments with speculation objectives.
Derivatives are initially recognized at fair value at the date the derivative contracts are entered into and are subsequently re-measured at fair value at the end of each reporting period. The resulting gain or loss is recognized in profit or loss unless the derivative is designated as a hedging instrument and complies with hedge accounting requirements, in which event the timing of the recognition in profit or loss depends on the nature of the hedge relationship.
(ii) Embedded derivatives
The Company assesses the existence of embedded derivatives in financial instrument contracts. Derivatives embedded in non-derivative host contracts are treated as separate derivatives when they meet the definition of a derivative, their risks and characteristics are not closely related to those of the host contracts and the contracts are not measured at FVTPL as a whole. Arauco has determined that no embedded derivatives currently exist.
(iii) Hedge accounting
The Company designates certain hedging instruments as either fair value hedges or cash flow hedges.
At the inception of the hedge relationship, the entity documents the relationship between the hedging instrument and the hedged item, along with its risk management objectives and its strategy for undertaking various hedge transactions. Furthermore, at the inception of the hedge and on an ongoing basis, Arauco documents whether the hedging instrument is highly effective in offsetting changes in fair values or cash flows of the hedged item attributable to the hedged risk.
-Fair Value Hedges
Changes in the fair value of derivatives that are designated and qualify as fair value hedges are recognized in profit or loss immediately, together with any changes in the fair value of the hedged asset or liability that are attributable to the hedged risk.
-Cash flow hedges
The effective portion of changes in the fair value of derivatives that are designated and qualify as cash flow hedges is recognized in other comprehensive income and accumulated under the heading of cash flow hedging reserve. The gain or loss relating to the ineffective portion is recognized immediately in profit or loss, and is included in the Finance costs line item in the interim consolidated statement of profit or loss. Amounts previously recognized in other comprehensive income are reclassified to profit or loss in the periods when the hedged item affects profit or loss, in the same line as the recognized hedged item.
Hedge accounting is discontinued when the Group revokes the hedging relationship, when the hedging instrument expires or is sold, terminated, or exercised, or when it no longer qualifies for hedge accounting. Any gain or loss recognized in other comprehensive
20
CELULOSA ARAUCO Y CONSTITUCION S.A. AND SUBSIDIARIES
Unaudited Interim Consolidated Financial Statements
June 30, 2021
Amounts in thousands of U.S. dollars, except as indicated
income and accumulated in equity at that time remains in equity and is recognized when the forecasted transaction is ultimately recognized in profit or loss. When a forecasted transaction is no longer expected to occur, the gain or loss accumulated in equity is recognized immediately in profit or loss.
Inventories are measured at the lower of cost or net realizable value. Cost is determined using the weighted average cost method.
The cost of finished and in process products includes the cost of raw materials, direct labor, other direct costs and manufacturing overhead expenses.
Initial costs of harvested wood are determined at fair value less cost of sale at the point of harvest.
Biological assets are transferred to inventories when forests are harvested.
Net realizable value is the estimated selling price in the ordinary course of business less the estimated costs of completion and the estimated costs necessary to make the sale.
When market conditions result in the production costs of a product exceeding its net realizable value, the inventories are written-down to their net realizable value. This write-down also includes obsolescence amounts resulting from slow moving inventories and technical obsolescence.
Spare parts that will be consumed in a period of less than twelve months are presented in inventories and recognized as an expense when they are consumed.
| j) | Non-current assets held for sale |
Arauco classifies certain property, plant and equipment, intangible assets, investments in associates and disposal groups (groups of assets to be sold together with their directly associated liabilities) as non-current assets held for sale which as of the date of the interim consolidated statements of financial position are the subject of active sale efforts which are estimated to be highly probable.
These assets or disposal groups are measured at the lower of the carrying amount or the fair value less the costs to sell, and are no longer depreciated or amortized from the time they are classified as non-current assets held for sale.
21
CELULOSA ARAUCO Y CONSTITUCION S.A. AND SUBSIDIARIES
Unaudited Interim Consolidated Financial Statements
June 30, 2021
Amounts in thousands of U.S. dollars, except as indicated
Arauco applies the acquisition method to account for a business combination. This method requires the identification of the acquirer, determination of the acquisition date, recognition and measurement of the identifiable assets acquired, the liabilities assumed and any non-controlling interest in the acquiree; and recognition and measurement of goodwill or a gain from a bargain purchase. Identifiable assets acquired and liabilities assumed and any contingent liabilities in a business combination are initially measured at fair value at the acquisition date, except:
-Deferred tax assets or liabilities, and assets or liabilities related to employee benefit arrangements are recognized and measured in accordance with IAS 12 Income Taxes and IAS 19 respectively;
-liabilities or equity instruments related to share-based payment arrangements of the acquiree or share-based payment arrangements of the Group entered into to replace share-based payment arrangements of the acquiree are measured in accordance with IFRS 3 at the acquisition date; and
-assets (or disposal groups) that are classified as held for sale in accordance with IFRS 5 Non-current Assets Held for Sale and Discontinued Operations are measured in accordance with such standard.
Acquisition-related costs are accounted for as expenses when they are incurred, except for costs to issue debt or equity securities which are recognized in accordance with IAS 32 and IFRS 9.
A parent will present non-controlling interests in the interim consolidated statement of financial position within equity, separately from the equity of the owners of the parent company.
Changes in the ownership interest of a parent in its subsidiary that do not result in a loss of control are treated as equity transactions. Any difference between the amount by which non-controlling interests are adjusted and the fair value of the consideration paid or received is recognized directly in equity and attributed to owners of the parent company. No adjustment is made to the carrying amount of goodwill, neither gains nor losses are recognized in the statement of profit or loss.
Non-controlling interests that are present ownership interests and entitle their holders to a proportionate share of the entity’s net assets in the event of liquidation may initially be measured either at fair value or at the present ownership instruments’ proportionate share of non-controlling interests, in the recognized amounts of the acquirer’s identifiable net assets. The choice is made on a transaction-by-transaction basis.
Arauco measures the fair value of the acquired company in the business combination achieved in each stage (“step acquisition”), recognizing the effects of remeasurement of previously held equity in the acquiree in the interim consolidated statements of profit or loss.
If the initial accounting for a business combination is not completed by the end of the reporting period in which the combination occurs, Arauco reports preliminary amounts for the items for which the accounting is incomplete. During the measurement period (no more than one year), these preliminary amounts are retrospectively adjusted, or
22
CELULOSA ARAUCO Y CONSTITUCION S.A. AND SUBSIDIARIES
Unaudited Interim Consolidated Financial Statements
June 30, 2021
Amounts in thousands of U.S. dollars, except as indicated
additional assets or liabilities are recognized to reflect new information about facts and circumstances that existed at the acquisition date, if known, would have affected the amounts recognized at that date.
Business combinations that are under common control transactions are accounted using as a reference the pooling of interest. Under this method, assets and liabilities related to the transaction carry over the previous carrying values. Any difference between assets and liabilities included in the consolidation and the consideration transferred, is accounted in equity.
| l) | Investments in associates and joint arrangements |
Associates are entities over which Arauco exercises significant influence, but not control. Significant influence is the power to participate in the financial and operating policy decisions of the investee but is not control or joint control over those policies.
Joint arrangement is defined as an entity over which there is joint control, which exists only when the decisions about strategic of activities, both financial and operational, require the unanimous consent of the parties sharing control.
Investments in joint arrangements are classified as a joint venture or as a joint operation. A joint operation is a joint arrangement in which the parties that have joint control of the arrangement (i.e. joint operators) have rights to the assets and obligations for the liabilities, relating to the arrangement. A joint venture is a joint arrangement in which the parties that have joint control of the arrangement (i.e., participants in a joint venture) have rights to the net assets of the arrangement.
Investments in associates and joint ventures are accounted for using the equity method and are initially recognized at cost. Their carrying amount is increased or decreased to recognize the portion corresponding to the statement of profit or loss or to the statement of comprehensive income. Dividends received are recognized by deducting the amount received from the carrying amount of the investment. Arauco’s investment in associates includes goodwill (both net of any accumulated impairment loss).
The investments in joint operations are recognized through consolidation of assets, liabilities and results of operations in relation to Arauco’s ownership percentage.
If the acquisition cost is lower than the fair value of the net assets of the associate acquired, the difference is recognized directly in statement of profit or loss in line Other gains (losses).
Investments in associates and joint ventures are presented in the interim consolidated statement of financial position in the line item “Investments accounted for using equity method”.
If Arauco’s share of losses of an associate or joint venture equals or exceeds its interest in the associate or joint venture, Arauco discontinues recognizing its share of further losses. After Arauco’s carrying value in the investee is reduced to zero, additional losses are provided for, and a liability is recognized, only to the extent that Arauco has incurred legal or constructive obligations or made payments on behalf of the associate or joint venture. If the associate or joint venture subsequently reports profits, Arauco resumes recognizing its share of those profits only after its share of the profits equals the share of losses not recognized.
23
CELULOSA ARAUCO Y CONSTITUCION S.A. AND SUBSIDIARIES
Unaudited Interim Consolidated Financial Statements
June 30, 2021
Amounts in thousands of U.S. dollars, except as indicated
| m) | Intangible assets other than goodwill |
After initial recognition, intangible assets with finite useful lives are carried at cost less any accumulated amortization and impairment losses.
Amortization of an intangible asset with a finite useful life is allocated over the asset’s useful life. Amortization begins when the asset is available for use, i.e., when it is in the location and condition necessary for it to be capable of operating in the manner intended by management.
Computer software licenses are capitalized in terms of the costs incurred to acquire and make them compatible with existing software. These costs are amortized over the estimated useful lives of the software.
| (ii) | Water Rights, Easements and Other Rights |
This item includes water rights, easements and other acquired rights recognized at historical cost which have indefinite useful lives as there is no foreseeable limit to the period over which these assets are expected to generate future cash flows. These rights are not amortized, but are tested for impairment at least annually, or when there is any indication that the assets might be impaired.
| (iii) | Customers and trade relations with customers |
Correspond to the valuation over the time of the established relationship with customers, from the sale of products and services through its sales team. These relations will materialize in sales orders, which generate revenue and cost of sales. The useful life has been determined to be 15 years.
Goodwill is measured as the excess of the sum of the consideration transferred, the amount of any non-controlling interest in the acquired company, and the fair value of the acquirer’s previously held equity interest in the acquired company (if any) over the net of the acquisition-date amounts of the identifiable assets acquired and the liabilities assumed. If the total of consideration transferred, non-controlling interest recognized and previously held interest measured is less than the fair value of the net assets of the subsidiary acquired in the case of a bargain purchase, the difference is recognized directly in the statements of profit or loss.
Goodwill is not amortized but tested for impairment on annual basis.
After initial recognition, goodwill is measured at cost less any accumulated impairment losses. For purposes of impairment testing, goodwill in a business combination is allocated as of the acquisition date to the cash generating unit or a group of cash generating units expected to benefit from the synergies of the combination irrespective of whether other assets or liabilities of the acquired company are allocated to those units or group of units.
The goodwill generated on acquisitions of foreign companies, is expressed in the functional currency of such foreign company.
24
CELULOSA ARAUCO Y CONSTITUCION S.A. AND SUBSIDIARIES
Unaudited Interim Consolidated Financial Statements
June 30, 2021
Amounts in thousands of U.S. dollars, except as indicated
Goodwill recognized in subsidiaries Arauco Canada Ltd. and Arauco do Brasil S.A., generated on subsidiaries acquisitions whose functional currency is different from the functional currency of the parent company and presentation of these financial statements, are translated into U.S. Dollars at the closing exchange rate.
| o) | Property, Plant and Equipment |
Property, plant and equipment are measured at cost less accumulated depreciation and accumulated impairment. The cost includes expenditures that are directly attributable to the acquisition of the assets.
Subsequent costs, such as improvements and replacement of components, are included in the asset’s carrying amount or recognized as a separate asset, as appropriate, only when it is probable that future economic benefits associated with the item will flow to Arauco and the cost of the item can be measured reliably. The carrying amount of the replaced part is derecognized from property, plant and equipment. All other repairs and maintenance costs are expensed in the period in which they are incurred.
Arauco capitalizes borrowing costs that are directly attributable to the acquisition, construction or production of qualifying assets as part of the cost of those assets, until the assets are ready for their intended use (See Note 12).
Depreciation is calculated by components using the straight-line method.
The useful lives of the items of property, plant and equipment is estimated according to the expected use of the assets. The residual values and useful lives of assets are reviewed and adjusted, if appropriate, annually.
Arauco applies IFRS 16 for recognizing leases in a manner consistent with contracts with similar features and akin circumstances.
At the beginning of a contract, Arauco assesses whether the contract is, or if it contains, a lease. A contract is, or contains, a lease if it transfers the right to control the use of a given asset for a certain period of time, in exchange for consideration.
As of the initial date for recording a lease, Arauco, as lessee, recognizes an asset by the right of use at cost.
The cost of the asset for right of use comprises:
| | - | The amount of the initial measurement of the lease liability. This measurement is at present value of the payments for leases that have not been disbursed as of that date. Payments for leases are discounted using the incremental interest rate for financial loans; |
| | - | Payments for leases performed prior to or as of the initiation date, minus the lease incentives that have been received; |
| | - | The initial direct costs incurred by the lessee; and |
| | - | An estimation of the costs to be incurred by the lessee when dismantling and eliminating the underlying asset, restoring the location where the same is located, or restoring the underlying asset to the condition required under the terms and conditions of the lease, unless such costs are incurred in order to produce inventories. The lessee assumes obligations stemming from such costs either at |
25
CELULOSA ARAUCO Y CONSTITUCION S.A. AND SUBSIDIARIES
Unaudited Interim Consolidated Financial Statements
June 30, 2021
Amounts in thousands of U.S. dollars, except as indicated
| | the commencement date, or as a result of having used the underlying asset during a specific period. |
After the initial recognition date, Arauco, as lessee, recognizes its asset for right of use by applying the cost model, minus the accumulated depreciation and impairment losses, and adjusted for remeasurement of the liability for lease.
At the beginning, Arauco in the capacity of lessee, recognizes the lease liability at present value of the lease payments that have not been disbursed as of that date. Lease payments are discounted using the incremental interest rate for financial loans.
After the initial recognition date, Arauco, as lessee, recognizes a liability for leases by increasing the book value, so as to reflect the interest over the liability for lease, reducing the amount in order to reflect the payments for leases that have been performed and once again recognizing the book value, so as to reflect the remeasurement and also to reflect the essential fixed payments for leases that have been revised.
Arauco presents the assets by right of use in the Interim Consolidated Statement of Financial Position and are further disclosed in Note 8. Likewise, lease liabilities are presented in the Interim Consolidated Statement of Financial Position and further disclosed in Note 23.
IFRS 16 maintains substantially the accounting requirements of the lessor from IAS 17. Therefore, Arauco has continued to classify its leases as operational or financial, as the case may be.
Income from operating leases in which Arauco is the lessor are recognized on a straight-line basis during the term of the lease. Initial direct costs are added to the book value of the underlying asset and are recognized as expenses during the term of the lease on the same basis as the lease income. Leased assets are included within the statement of financial position, in property, plant and equipment. Arauco did not make adjustments with respect to assets that maintains as a lessor, as a result of IFRS 16 adoption.
When assets are leased under a financial lease, the present value of lease payments are recognized as financial accounts receivable. The difference between the gross receivable and the present value of such amount, is recognized as financial return on capital.
Arauco evaluates the economic nature of the contracts that grant the right to use certain assets, for the purposes of determining the existence of implied leases. In these cases, the Company separates, at the beginning of the contract and based on its relative reasonable values, payments and considerations associated with the lease, from the rest of the elements incorporated into the contract.
26
CELULOSA ARAUCO Y CONSTITUCION S.A. AND SUBSIDIARIES
Unaudited Interim Consolidated Financial Statements
June 30, 2021
Amounts in thousands of U.S. dollars, except as indicated
IAS 41 requires that biological assets, such as standing trees, are measured at fair value less cost to sell in the interim statement of financial position. Forestry plantations are accounted for at fair value less costs to sell, based on the presumption that fair values of these assets can be measured reliably.
The measurement of the fair value of the biological assets is determined using a discounted cash flow model. Our cash flow projections include significant judgments and assumptions relating to discount rates, estimated growth of the forests and sales margins. This valuation is performed on the basis of each identifiable farm block and for each type of tree.
The measurement of new forestry plantations made during the current year is made at cost, which corresponds to the fair value at that date. After twelve months, the valuation methodology used is that explained in the preceding paragraph.
Biological assets shown as current assets correspond to those forestry plantations that will be harvested in the short term.
Biological growth and changes in fair value of forestry plantations are recognized in the line item “Other income” in the interim consolidated statements of profit or loss.
The tax liabilities are recognized in the interim consolidated financial statements based on the determination of taxable income for the year and calculated using the tax rates in force in the countries where Arauco operates.
Deferred income tax is recognized using liability method, on the temporary differences arising between the tax bases of assets and liabilities and their carrying amounts in the consolidated annual accounts. Deferred income tax is determined using tax rates contained in laws adopted as of the date of the financial statements and that are expected to be applicable when the related deferred tax asset is realized, or the deferred income tax liability is settled.
Deferred taxes are recognized in accordance with the standards established in IAS 12 - Income Tax.
The goodwill arising on business combinations does not give rise to deferred tax.
The deferred tax assets and tax credits are generally recognized for all deductible temporary differences to the extent that it is probable that future taxable profit will be available against which those deductible temporary differences can be utilized.
Provisions are recognized when the Company has a present obligation, legal or constructive, as a result of past events, under which, it is probable that an outflow of resources will be required to settle the obligation; and when a reliable estimate can be made of the amount of the obligation. The amount recognized as a provision is the best estimate of the consideration required to settle the present obligation at the end of the reporting period.
27
CELULOSA ARAUCO Y CONSTITUCION S.A. AND SUBSIDIARIES
Unaudited Interim Consolidated Financial Statements
June 30, 2021
Amounts in thousands of U.S. dollars, except as indicated
Revenues are valued at fair value of the consideration received or to be received, derived from them. Arauco analyses and takes under consideration all relevant facts and circumstances to apply the five-step model established under IFRS 15 to customer contracts: (i) identify the contract, (ii) identify the performance obligations, (iii) determine the transaction price, (iv) allocate the transaction price, and (v) recognise revenue. Additionally, Arauco evaluates the incremental costs of obtaining a contract and the costs incurred to comply with a contract. Arauco recognizes revenues when the steps established in IFRS have been satisfactorily complied with.
Accounts receivable are recognized when control over goods or services has been transferred to the customer, because at this point of the time collection is unconditional and the passage of time is only needed to receive payment.
(i) Revenue recognition from the Sale of Goods
Revenue from the sale of goods is recognized when Arauco has transferred to the buyer the significant risks and rewards of ownership of the committed goods, when the amount of revenue can be reliably measured, when Arauco does not retain any managerial involvement over the goods sold and when it is probable that the economic benefits associated with the transaction will flow to Arauco and the costs incurred in respect of the transaction can be measured reliably. Revenue from the sale of goods are recognized when there is no obligation unsatisfied that could affect the customer’s acceptance of the product. The delivery is effective when the products are sent to the specific location, the risks of obsolescence and loss have been transferred to the customer and when Arauco has objective evidence that all acceptance criteria have been satisfied.
Sales are recognized in terms of the price agreed to in the sales contract, less any volume discounts and estimated product returns at the date of the sale. There is no significant financing component given that receivables from sales are collected within a short period, which is in line with market practices.
The structure for recognizing revenue from export sales is based on the 2010 Incoterms, which are the official rules for the interpretation of commercial terms issued by the International Chamber of Commerce.
The main Incoterms used by Arauco are the following:
“CFR (Cost and freight)”, where the company bears all costs including main transportation, until the products arrives at its port of destination. The risk is transferred to the purchaser once the products have been loaded onto the vessel, in the country of origin.
“CIF (Cost Insurance & Freight)”, where the Company organizes and pays for external freight services and some other expenses. Arauco is no longer responsible for the products once they have been delivered to the ocean carrier company.
28
CELULOSA ARAUCO Y CONSTITUCION S.A. AND SUBSIDIARIES
Unaudited Interim Consolidated Financial Statements
June 30, 2021
Amounts in thousands of U.S. dollars, except as indicated
| (ii) | Revenue recognition from Rendering of Services |
Revenue from the rendering of services is recognized as long as the performance obligation have been satisfied.
Revenue is recognized considering the stage of completion of the transaction at the date of the reporting period, when Arauco has the enforceable right of payment from the rendering of the services.
There is no significant financing component, given that sales are made with a reduced average collection period, which is in line with market practice.
Arauco mainly provides power supply services which are transacted principally in the spot market of the Sistema Eléctrico Nacional (SEN) (“National Electrical System”). According to current regulations, the prices on that market called “Marginal Costs” are calculated by the Coordinador Eléctrico Nacional (CEN) (“National Electrical Coordinator”) and are generally recognized in the period in which the services are rendered.
Electrical power is generated as a by-product of the pulp and wood process and is a complementary business to it, which is initially supplied to the group’s subsidiaries and any surplus is sold to the SEN.
Arauco provides other non-core services such as port services and pest control whose revenues are derived from fixed price service contracts are recognized considering the stage of completion of the services rendered at the date of reporting, generally during the period of the service contract on a straight-line basis over the term of the contract.
Revenues from reportable segments mentioned in Note 24 are measured in accordance with the policies indicated in the preceding paragraphs.
Revenues from inter-segment sales (which are made at market prices) are eliminated in the interim consolidated financial statements.
Article No. 79 of the Chilean Corporations Law states that, unless otherwise unanimously agreed by the shareholders, corporations must distribute annually at least 30% of net income for the current year as cash dividend to shareholders determined in proportion to their shares or in the proportion established in the by-laws for preferred shares, if any, except where necessary to absorb accumulated losses from prior years.
On October 28, 2019, Arauco approved to amend the Company’s by-laws in order to establish that the Ordinary Shareholders’ Meeting will be determining, on an annually basis, the dividends to be distributed, without being subject to the 30% distributable minimum indicated by Chilean Corporations Law.
For the purposes of the annual distribution of the net profits on each period, it will be responsibility of the Ordinary Shareholders’ Meeting to determine the portion of such profits that will be distributed as dividend to the shareholders. Such determination will be made by the Shareholders’ meeting without being subject to the 30% minimum established in article 79 of Law No. 18,046 (regarding Corporations), who may agree on the distribution of a smaller percentage. In any case, the Board of Directors may, under
29
CELULOSA ARAUCO Y CONSTITUCION S.A. AND SUBSIDIARIES
Unaudited Interim Consolidated Financial Statements
June 30, 2021
Amounts in thousands of U.S. dollars, except as indicated
the personal responsibility of the directors participating in the respective agreement, distribute dividends out of the profits of the corresponding year, provided there are no accumulated losses.
Basic earnings per share are calculated by dividing the net profit for the period attributable to the parent company by the weighted average number of ordinary shares outstanding during the period, excluding the average number of shares in the Company held by a subsidiary, if such circumstance exists. Arauco has not performed any type of transaction with a potential dilutive effect that would cause diluted earnings per share to be different from basic earnings per share.
Non-financial Assets
The recoverable amount of property, plant and equipment and other long-term assets with finite useful lives are measured whenever there are any circumstances indicating that the assets have to recognize an impairment loss. Among the circumstances to consider as evidence of impairment are significant declines in the assets’ market value, significant adverse changes in the technological environment, obsolescence or physical damages of assets and changes in the manner in which the asset is used or expected to be used). Arauco evaluates at the end of each reporting period whether there is any evidence of the indications above mentioned.
A previously recognized impairment loss is reversed if there has been a change in the estimates used to determine the recoverable amount however a reversal of an impairment loss shall not exceed the carrying amount that would have been determined (net of amortization or depreciation) had no impairment loss been recognized for the asset in prior years.
For the purposes of assessing impairment losses, assets are grouped at the lowest level for which there is identifiable cash flows separately for each cash-generating unit. Non-financial assets, other than goodwill, which had recognized an impairment loss, are reviewed at the end of each reporting period whether there are any circumstances indicating that an impairment loss previously recognized may no longer exists or has decreased.
“Cash-generating units” are the smallest identifiable groups of those cash inflows that are largely independent of the cash inflow from other assets or groups of assets.
Goodwill
Goodwill and intangible assets with indefinite useful life are tested annually for impairment or whenever circumstances indicate it. The recoverable amount of an intangible asset is the higher of its fair value less costs to sell and its value in use. An impairment loss is recognized whenever the carrying amount exceeds the recoverable amount.
A cash-generating unit, for which goodwill has been allocated, is tested for impairment annually or more frequently when there are circumstances indicating that the unit may be impaired. If the recoverable amount of the cash-generating unit is less than its carrying amount, the impairment loss is allocated first to reduce the carrying amount of any goodwill allocated to the unit and then to other assets pro rata based on the carrying
30
CELULOSA ARAUCO Y CONSTITUCION S.A. AND SUBSIDIARIES
Unaudited Interim Consolidated Financial Statements
June 30, 2021
Amounts in thousands of U.S. dollars, except as indicated
amount of each asset in the unit. Any impairment loss of goodwill is recognized directly in the interim consolidated statement of profit or loss. An impairment loss recognized for goodwill is not reversed in subsequent periods.
Goodwill is allocated to cash-generating units for impairment testing purposes. The allocation is made between cash-generating units or groups of cash generating units expected to benefit from the synergies of the combination.
Financial Assets
At the end of each reporting period, an assessment is performed in order to identify whether there is any objective evidence that a financial asset or a group of financial assets may have been impaired.
An allowance for doubtful accounts is established based on a measurement of expected losses using a simplified approach.
The allowance for doubtful accounts is measured as the difference between the carrying amount of receivables and the present value of estimated future cash flows. The carrying amount of the receivable is reduced through the use of the allowance. If the impairment loss decreases in later periods, it is reversed either directly or by adjusting the provision for doubtful accounts, with effect in profit or loss.
Arauco constitutes labor obligations for severance payable in all circumstances for certain of its employees with at least 5 years of work in the Company, based on the terms of the staff’s collective and individual bargaining agreements.
The related provision is an estimate of the years of service to be recognized as a future labor obligation liability, in accordance with contracts between Arauco and its employees and pursuant to actuarial valuation criteria for this type of liability. This post-employment benefit is considered a defined benefit plan.
The main factors considered for calculating the actuarial value of severance obligation for years of service are employee turnover, salary increases and life expectancy of the workers included in this benefit.
Actuarial gains and losses are recognized in other comprehensive income in the year they are incurred.
These obligations are related to post-employee benefits in accordance with current standards.
Arauco recognizes the expense for employee vacation according to labor legislation in each country on an accrual basis.
This obligation is presented in line item “Trade and other current payables” in the interim consolidated statements of financial position.
31
CELULOSA ARAUCO Y CONSTITUCION S.A. AND SUBSIDIARIES
Unaudited Interim Consolidated Financial Statements
June 30, 2021
Amounts in thousands of U.S. dollars, except as indicated
| z) | Recent accounting pronouncements |
a) Standards, interpretations and amendments that are mandatory for the first time for annual periods beginning on January 1, 2021:
| | | | |
Amendments and improvements | | Content | | Mandatory application
for annual periods
beginning on or after |
| IFRS 9, IAS 39, IFRS 7, IFRS 4 y IFRS 16 | | Reference interest rate reform (IBOR). These amendments provide specific simplifications regarding reference rate reform.The Phase 2 amendments address issues that arise from the implementation of the reforms, including the replacement of one benchmark with an alternative one. | | January 1, 2021 |
| | |
| IFRS 16 | | Lease concessions As a result of the coronavirus (COVID-19) pandemic, rent concessions have been granted to lessees. In May 2020, the IASB published an amendment to IFRS 16 that provided an optional practical expedient for lessees from assessing whether a rent concession related to COVID-19 is a lease modification. On 31 March 2021, the IASB published an additional amendment to extend the date of the practical expedient from 30 June 2021 to 30 June 2022. Lessees can elect to account for such rent concessions in the same way as they would if they were not lease modifications. In many cases, this will result in accounting for the concession as variable lease payments in the period(s) in which the event or condition that triggers the reduced payment occurs. | | January 1, 2021 |
The amendments above do not have an impact on Arauco Interim Consolidated Financial Statements during its initial application period.
b) Standards, interpretations and amendments, the application of which is not yet mandatory, which have not been adopted in advance:
32
CELULOSA ARAUCO Y CONSTITUCION S.A. AND SUBSIDIARIES
Unaudited Interim Consolidated Financial Statements
June 30, 2021
Amounts in thousands of U.S. dollars, except as indicated
| | | | |
Amendments and improvements | | Content | | Mandatory application
for annual periods
beginning on or after |
IFRS 10 y IAS 28- Amendments | | Asset sale or contribution between an investor and an associate or joint venture. | | Indeterminate |
| IAS 1 | | Presentation of Financial Statements Clarifies that liabilities will be classified as current or non-current depending on the rights at the end of the reporting period. The amendment also clarifies what IAS 1 means when it refers to the ‘settlement’ of a liability. | | January 1, 2023 |
Reference to the Conceptual Framework - Amendments to IFRS 3 | | Business combinations. Minor amendments were made to IFRS 3 to update references to the conceptual framework for financial reporting and to add an exception for the recognition of liabilities and contingent liabilities. | | January 1, 2022 |
| IAS 16 Amendment | | Properties, plant and equipments Prohibit a company from deducting from the cost of property, plant and equipment amounts received from selling items produced while the company is preparing the asset for its intended use. Instead, a company will recognise such sales proceeds and related cost in profit or loss. | | January 1, 2022 |
| IAS 37 Amendment | | Provisions, contingent liabilities and contingent Specify which costs a company includes when assessing whether a contract will be loss-making. | | January 1, 2022 |
Annual Improvements to IFRS Standards 2018–2020 | | IFRS 9 Financial Instruments Addresses which fees should be included in the 10% test for derecognition of financial liabilities. | | January 1, 2022 |
| | IFRS 16 Leases Amendment to example 13 to remove the illustration of the lessor’s payments for lease improvements. | | |
| | NIIF 1: First-time Adoption of International Financial Reporting Standards Allows entities that have valued their assets and liabilities at their book values in their parent company’s accounts to also value cumulative translation differences using the amounts reported by the parent company. | | |
| | IAS 41 Agriculture Elimination of the requirement for entities to exclude tax cash flows when measuring fair value under IAS 41. | | |
| IAS 1 and IAS 8 | | Presentation of financial statements’, on classification of liabilities clarify that liabilities are classified as either current or non-current, depending on the rights that exist at the end of the reporting period. Classification is unaffected by the expectations of the entity or events after the reporting date (for example, the receipt of a waiver or a breach of covenant). The amendment also clarifies what IAS 1 means when it refers to the ‘settlement’ of a liability. To IAS 1, Practice statement 2 and IAS 8, aim to improve accounting policy disclosures and to help users of the financial statements to distinguish between changes in accounting estimates and changes in accounting policies. | | January 1, 2023 |
| IAS 12 | | Deferred tax related to assets and liabilities arising from a single transaction require companies to recognise deferred tax on transactions that, on initial recognition give rise to equal amounts of taxable and deduct able temporary differences. | | January 1, 2023 |
33
CELULOSA ARAUCO Y CONSTITUCION S.A. AND SUBSIDIARIES
Unaudited Interim Consolidated Financial Statements
June 30, 2021
Amounts in thousands of U.S. dollars, except as indicated
Arauco estimates that the adoption of the standards, amendments and interpretations described above will not have a significant impact on Arauco’s Consolidated Financial Statements during its initial application period.
NOTE 2. ACCOUNTING POLICIES, CHANGES IN ACCOUNTING ESTIMATES
Changes to accounting policies
On January 1, 2021, we discontinued the reporting of our forestry operations as a business segment, and included those operations as part of the pulp segment. This is in line with Arauco’s current reality and with the way in which the management views the progress of the business. Thus, the new segments are: Pulp and and wood products, which demonstrates Arauco’s focus on its end custumers.
The comparative information in the tables in Note 24 Reportable Segments has been restated as of December 31, 2020 and June 30, 2020 due to the merger of the pulp and forestry businesses. This reformulation of the Company’s segments did not produce changes in Arauco’s Consolidated Financial Statements (Statement of Financial Position, Statement of Income, Statement of Comprehensive Income, Statement of Changes in Equity, Statement of Cash Flows and Notes to the statements financial statements, except for the Note 24).
Changes to accounting estimates
As of June 30, 2021, there have been no changes in the methodologies for calculating the accounting estimates with respect to the 2020 financial year.
NOTE 3. DISCLOSURE OF OTHER INFORMATION
| a) | Disclosure of information on Issued Capital |
Between April and May of 2021, a capital increase of ThU.S$ 200,000 which amounts to 3,250,975 shares was wholly subscribed and paid-in by the shareholders.
As of September 24, 2020, a capital increase of ThU.S.$ 250,000 which amounts to 4,063,720 shares was wholly subscribed and paid-in by the shareholders.
As of June 30, 2021, the shareholders composition according to the amount of shares owned is as follows:
| | | | |
Shareholders | | % | |
Empresas Copec S.A. | | | 99.97804761 | % |
Chilur S.A. | | | 0.02054047 | % |
Administradora Sintra Ltda. | | | 0.00132808 | % |
AntarChile S.A. | | | 0.00008384 | % |
| | | 100.00000000 | % |
At the date of these interim consolidated financial statements the share capital of Arauco is ThU.S.$ 803,618.
100% of Capital corresponds to ordinary shares.
34
CELULOSA ARAUCO Y CONSTITUCION S.A. AND SUBSIDIARIES
Unaudited Interim Consolidated Financial Statements
June 30, 2021
Amounts in thousands of U.S. dollars, except as indicated
| | | | |
| | | 06-30-2021 | | 12-31-2020 |
Description of Ordinary Capital Share Types | | 100% of Capital corresponds to
ordinary shares |
Number of Authorized Shares by Type of Capital in Ordinary Shares | | 120,474,350 | | 117,223,375 |
Nominal Value of Shares by Type of Capital in Ordinary Shares | | ThU.S.$ 6.6704
per share | | ThU.S.$ 0.0051493
per share |
Amount of Capital in Shares by Type of Ordinary Shares that Constitute Capital | | ThU.S.$ 803,618 | | ThU.S.$ 603,618 |
| | |
| | | 06-30-2021 | | 12-31-2020 |
Number of Shares Issued and Fully Paid by Type of Capital in Ordinary Shares | | 120,474,350 | | 117,223,375 |
As of June 30, 2021 and as of December 31, 2020, no dividends were paid.
As of June 30, 2021 according to the current dividends policy, it is not required to recognize a minimum dividend provision.
| c) | Disclosure of Information on Reserves |
Other reserves comprise reserves of exchange differences on translation, reserves of cash flow hedges and other reserves. Arauco does not have any restrictions associated with these reserves.
| Reserves | of exchange differences on translation |
Reserves of exchange differences on translation correspond to exchange differences relating to the translation of the results and net assets of Arauco’s subsidiaries whose functional currency is other than Arauco’s presentation currency.
| Reserves | of cash flow hedges |
The hedging reserve includes the cash flow hedge reserve and the costs of hedging reserve. The cash flow hedge reserve is used to recognise the effective portion of gains or losses on derivatives that are designated and qualify as cash flow hedges.
| Reserve | of Actuarial Losses in Defined Benefit Plans |
This corresponds to changes in the present value of the obligation for defined benefits resulting from experience adjustments (the effect of the differences between the previous actuarial assumptions and the events that occurred within the context of the plan) and the effects of the changes in the actuarial assumptions.
This mainly corresponds to the share of other comprehensive income of investments in associates and joint ventures.
35
CELULOSA ARAUCO Y CONSTITUCION S.A. AND SUBSIDIARIES
Unaudited Interim Consolidated Financial Statements
June 30, 2021
Amounts in thousands of U.S. dollars, except as indicated
| d) | Other items in the Consolidated Statements of Profit or Loss |
The table below sets forth other income, other expenses, finance income, finance costs and share of profit (loss) of associates and joint ventures for the periods ended June 30, 2021 and 2020 are as follows:
| | | | | | | | | | | | | | | | |
| | | January - June | | | April - June | |
| | | 2021
ThU.S.$ | | | 2020
ThU.S.$ | | | 2021
ThU.S.$ | | | 2020
ThU.S.$ | |
Classes of Other Income | | | | | | | | | | | | | | | | |
Other Income, Total | | | 120,376 | | | | 122,844 | | | | 45,379 | | | | 67,598 | |
Gain from changes in fair value of biological assets (note 20) | | | 83,080 | | | | 88,143 | | | | 41,771 | | | | 36,126 | |
Net income from insurance compensation | | | 606 | | | | 2,106 | | | | 598 | | | | 2,086 | |
Revenue from export promotion | | | 742 | | | | 508 | | | | 367 | | | | 232 | |
Lease income | | | 725 | | | | 784 | | | | 191 | | | | 438 | |
Gain on sales of assets | | | 3,648 | | | | 2,216 | | | | 1,675 | | | | 728 | |
Access easement | | | 161 | | | | 35 | | | | 158 | | | | 35 | |
Recovery of tax credits | | | 6 | | | | 21,133 | | | | 6 | | | | 21,133 | |
Compensations received | | | 7,018 | | | | 950 | | | | 3 | | | | 949 | |
Gain on sales of associates | | | 20,381 | | | | — | | | | — | | | | — | |
Other operating results | | | 4,009 | | | | 6,969 | | | | 610 | | | | 5,871 | |
| | | | |
Classes of Other Expenses by activity | | | | | | | | | | | | | | | | |
Total of Other Expenses by activity | | | (70,456 | ) | | | (108,294 | ) | | | (32,978 | ) | | | (57,356 | ) |
Provision Legal expenses | | | (6,172 | ) | | | (2,819 | ) | | | (4,708 | ) | | | (1,429 | ) |
Impairment provision for property, plant and equipment and others | | | (11,832 | ) | | | (52,523 | ) | | | (7,876 | ) | | | (34,464 | ) |
Operating expenses related to staff restructuring or from plants stoppage or closed | | | (3,613 | ) | | | (21,070 | ) | | | (2,091 | ) | | | (7,959 | ) |
Expenses related to projects | | | (11,397 | ) | | | (6,775 | ) | | | (6,139 | ) | | | (3,225 | ) |
Loss of asset sales | | | (3,202 | ) | | | (3,210 | ) | | | (1,153 | ) | | | (2,262 | ) |
Loss and repair of assets | | | (494 | ) | | | (4,155 | ) | | | (171 | ) | | | (1,643 | ) |
Loss of forest due to fires | | | (17,503 | ) | | | (5,197 | ) | | | (605 | ) | | | (141 | ) |
Other Taxes | | | (10,011 | ) | | | (8,520 | ) | | | (6,757 | ) | | | (4,604 | ) |
Research and development expenses | | | (2,037 | ) | | | (1,278 | ) | | | (1,708 | ) | | | (777 | ) |
Fines, readjustments and interests | | | (93 | ) | | | (677 | ) | | | (75 | ) | | | (106 | ) |
Loss on sale of permanent investments | | | (431 | ) | | | — | | | | — | | | | — | |
Loss of tax credits | | | (255 | ) | | | — | | | | (154 | ) | | | — | |
Other expenses | | | (3,416 | ) | | | (2,070 | ) | | | (1,541 | ) | | | (746 | ) |
| | | | |
Classes of financing income | | | | | | | | | | | | | | | | |
Financing income, total | | | 14,434 | | | | 19,519 | | | | 7,600 | | | | 12,312 | |
Financial income from mutual funds - term deposits | | | 13,205 | | | | 8,067 | | | | 6,963 | | | | 2,736 | |
Financial income resulting from swap - forward instruments | | | 39 | | | | 667 | | | | — | | | | 324 | |
Other financial income | | | 1,190 | | | | 10,785 | | | | 637 | | | | 9,252 | |
| | | | |
Classes of financing costs | | | | | | | | | | | | | | | | |
Financing costs, Total | | | (118,180 | ) | | | (137,704 | ) | | | (57,187 | ) | | | (65,922 | ) |
Interest expense, Banks loans | | | (10,672 | ) | | | (15,775 | ) | | | (4,805 | ) | | | (7,569 | ) |
Interest expense, Bonds | | | (73,978 | ) | | | (87,692 | ) | | | (36,154 | ) | | | (44,034 | ) |
Interest expense, other financial instruments | | | (10,963 | ) | | | (17,371 | ) | | | (4,831 | ) | | | (7,886 | ) |
Interest expence for right-of-use | | | (4,412 | ) | | | (4,830 | ) | | | (1,753 | ) | | | (2,298 | ) |
Other financial costs | | | (18,155 | ) | | | (12,036 | ) | | | (9,644 | ) | | | (4,135 | ) |
| | | | |
Share of profit (loss) of associates and joint ventures accounted for using equity method | | | | | | | | | | | | | | | | |
Total | | | 11,216 | | | | (488 | ) | | | 8,718 | | | | (2,041 | ) |
Investments in associates | | | 139 | | | | 3,630 | | | | 233 | | | | 1,512 | |
Joint ventures | | | 11,077 | | | | (4,118 | ) | | | 8,485 | | | | (3,553 | ) |
36
CELULOSA ARAUCO Y CONSTITUCION S.A. AND SUBSIDIARIES
Unaudited Interim Consolidated Financial Statements
June 30, 2021
Amounts in thousands of U.S. dollars, except as indicated
The analysis of expenses by nature contained in these interim consolidated financial statements is presented below:
| | | | | | | | | | | | | | | | |
| | | January – June | | | April – June | |
| | | 2021 | | | 2020 | | | 2021 | | | 2020 | |
Cost of sales (*) | | ThU.S.$ | | | ThU.S.$ | | | ThU.S.$ | | | ThU.S.$ | |
Timber | | | 410,047 | | | | 390,392 | | | | 181,029 | | | | 199,992 | |
Forestry labor costs and other services | | | 256,1172 | | | | 215,475 | | | | 136,547 | | | | 109,119 | |
Depreciation and amortization | | | 204,257 | | | | 199,164 | | | | 100,306 | | | | 100,896 | |
Depreciation for right of use | | | 21,907 | | | | 30,086 | | | | 10,221 | | | | 15,140 | |
Maintenance costs | | | 127,669 | | | | 112,781 | | | | 63,190 | | | | 53,497 | |
Chemical costs | | | 245,488 | | | | 217,843 | | | | 130,520 | | | | 100,525 | |
Sawmill Services | | | 53,657 | | | | 49,448 | | | | 28,114 | | | | 21,555 | |
Other Raw Materials | | | 109,581 | | | | 99,599 | | | | 55,215 | | | | 46,325 | |
Other Indirect costs | | | 58,546 | | | | 55,439 | | | | 31,419 | | | | 25,890 | |
Energy and fuel | | | 85,692 | | | | 83,728 | | | | 42,830 | | | | 38,904 | |
Cost of electricity | | | 22,082 | | | | 17,141 | | | | 12,462 | | | | 8,330 | |
Staff expenses | | | 189,859 | | | | 172,518 | | | | 95,330 | | | | 79,881 | |
Total | | | 1,784,957 | | | | 1,643,614 | | | | 887,183 | | | | 800,054 | |
| | | | | | | | | | | | | | | | |
| (*) | Total amount is comprised of the cost of inventory sales for ThU.S.$ 1,733,145 (ThU.S.$ 1,594,281 as of June 30, 2020) and the cost of rendering services for ThU.S.$ 51,812 (ThU.S.$ 49,333 as of June 30, 2020). |
| | | | | | | | | | | | | | | | |
| | | January – June | | | April – June | |
| | | 2021 | | | 2020 | | | 2021 | | | 2020 | |
Distribution cost | | ThU.S.$ | | | ThU.S.$ | | | ThU.S.$ | | | ThU.S.$ | |
Selling costs | | | 17,655 | | | | 18,439 | | | | 8,929 | | | | 9,743 | |
Commissions | | | 7,197 | | | | 6,396 | | | | 3,603 | | | | 3,286 | |
Insurance | | | 1,974 | | | | 2,200 | | | | 850 | | | | 1,363 | |
Provision for doubtful accounts | | | 300 | | | | 637 | | | | 339 | | | | 681 | |
Other selling costs | | | 8,184 | | | | 9,206 | | | | 4,137 | | | | 4,413 | |
Shipping and freight costs | | | 286,415 | | | | 241,806 | | | | 150,347 | | | | 113,073 | |
Port services | | | 23,547 | | | | 18,532 | | | | 11,839 | | | | 9,913 | |
Freights | | | 241,332 | | | | 201,489 | | | | 128,235 | | | | 91,146 | |
Depreciation for right of use | | | 1,211 | | | | 825 | | | | 639 | | | | 412 | |
Other shipping and freight costs (internment, warehousing, stowage, customs and other costs) | | | 20,325 | | | | 20,960 | | | | 9,634 | | | | 11,602 | |
Total | | | 304,070 | | | | 260,245 | | | | 159,276 | | | | 122,816 | |
| | | | | | | | | | | | | | | | |
| | | | | | | | | | | | | | | | |
| | | January – June | | | April – June | |
| | | 2021 | | | 2020 | | | 2021 | | | 2020 | |
Administrative expenses | | ThU.S.$ | | | ThU.S.$ | | | ThU.S.$ | | | ThU.S.$ | |
Wages and salaries | | | 122,862 | | | | 104,269 | | | | 62,694 | | | | 50,808 | |
Marketing, advertising, promotion and publications expenses | | | 5,972 | | | | 4,964 | | | | 3,339 | | | | 1,579 | |
Insurances | | | 11,804 | | | | 10,803 | | | | 5,990 | | | | 5,084 | |
Depreciation and amortization | | | 18,037 | | | | 16,231 | | | | 9,428 | | | | 8,617 | |
Depreciation for right of use | | | 3,471 | | | | 4,167 | | | | 1,658 | | | | 1,392 | |
Computer services | | | 18,300 | | | | 16,912 | | | | 9,648 | | | | 11,610 | |
Lease rentals (offices, other property and vehicles) | | | 3,226 | | | | 3,061 | | | | 1,591 | | | | 1,553 | |
Donations, contributions, scholarships | | | 3,063 | | | | 8,751 | | | | 1,174 | | | | 6,152 | |
Fees (legal and technical advisors) | | | 18,216 | | | | 18,208 | | | | 9,327 | | | | 8,883 | |
Property taxes, city permits and rights | | | 12,713 | | | | 9,487 | | | | 8,236 | | | | 5,616 | |
Cleaning services, security services and transportation | | | 16,977 | | | | 11,295 | | | | 8,931 | | | | 6,102 | |
Third-party variable services (maneuvers, logistics) | | | 21,927 | | | | 18,277 | | | | 11,586 | | | | 10,082 | |
Basic services (electricity, telephone) | | | 11,559 | | | | 3,598 | | | | 6,468 | | | | 1,841 | |
Maintenance and repair | | | 3,714 | | | | 2,859 | | | | 2,097 | | | | 1,504 | |
Seminars, courses, training materials | | | 1,084 | | | | 865 | | | | 575 | | | | 337 | |
Travels, clothing and safety equipment, environmental expenses, audits and others | | | 14,230 | | | | 19,981 | | | | 7,911 | | | | 9,065 | |
Total | | | 287,155 | | | | 253,728 | | | | 150,653 | | | | 130,225 | |
| | | | | | | | | | | | | | | | |
37
CELULOSA ARAUCO Y CONSTITUCION S.A. AND SUBSIDIARIES
Unaudited Interim Consolidated Financial Statements
June 30, 2021
Amounts in thousands of U.S. dollars, except as indicated
| e) | Auditor Fees and Number of Employees |
| | | | | | | | |
Auditors fees | | 06-30-2021
ThU.S.$ | | | 06-30-2020
ThU.S.$ | |
Audit services | | | 1,039 | | | | 1,318 | |
Other services | | | | | | | | |
Tax services | | | 456 | | | | 631 | |
Others | | | 58 | | | | 84 | |
TOTAL | | | 1,553 | | | | 2,033 | |
| | | | | | | | |
| |
Number of employees | | N° | |
| | | 17,551 | | | | 18,119 | |
NOTE 4. INVENTORIES
| | | | | | | | |
Components of Inventory | | 06-30-2021
ThU.S.$ | | | 12-31-2020
ThU.S.$ | |
Raw materials | | | 100,185 | | | | 83,267 | |
Production supplies | | | 134,140 | | | | 129,065 | |
Work in progress | | | 52,136 | | | | 64,449 | |
Finished goods | | | 525,814 | | | | 460,419 | |
Spare Parts | | | 207,478 | | | | 201,079 | |
Total Inventories | | | 1,019,753 | | | | 938,279 | |
| | | | | | | | |
Inventories recognized as cost of sales as of June 30, 2021 were ThU.S.$ 1,733,145 (ThU.S.$ 1,594,281 as of June 30, 2020).
In order to have inventories recorded at net realizable value as of June 30, 2021, a net decrease of inventories was recognized associated with an higher provision of obsolescence of ThU.S.$ 395 (decrease of ThU.S.$ 12,663 as of June 30, 2020). As of June 30, 2021, the amount of obsolescence provision is ThU.S.$ 31,995 (ThU.S.$ 31,600 as of December 31, 2020).
As of June 30, 2021, there were inventory write-offs of ThU.S.$ 355 (ThU.S.$ 1,321 as of June 30, 2020) which are presented in the interim consolidated statements of profit or loss whithin Cost of sales.
The inventory obsolescence provision is calculated based on the sales conditions of products and age of inventory (inventory turnover).
As of the date of these interim consolidated financial statements, no inventories were pledged as security.
38
CELULOSA ARAUCO Y CONSTITUCION S.A. AND SUBSIDIARIES
Unaudited Interim Consolidated Financial Statements
June 30, 2021
Amounts in thousands of U.S. dollars, except as indicated
NOTE 5. CASH AND CASH EQUIVALENTS
Cash and cash equivalents include cash on hand, bank checking account balances, time deposits and mutual funds. These are short-term highly liquid investments that are readily convertible to known amounts of cash and are subject to an insignificant risk of changes in value.
The investment objective of time deposits is to maximize the amounts of cash surpluses in the short-term. These instruments are permitted under Arauco’s Investment Policy which allows investing in fixed income securities. These instruments have a maturity of less than three months from the date of acquisition.
Arauco invests in local and international mutual funds in order to maximize the returns of cash surpluses denominated in Chilean Pesos or in foreign currencies such as U.S. Dollars or Euros. These instruments are permitted under Arauco’s Investment Policy.
As of the date of these interim consolidated financial statements, there are no amounts of cash and cash equivalents with restrictions on use.
| | | | | | | | |
Components of Cash and Cash Equivalents | | 06-30-2021
ThU.S.$ | | | 12-31-2020
ThU.S.$ | |
Cash on hand | | | 126 | | | | 99 | |
Bank checking account balances | | | 453,245 | | | | 357,354 | |
Time deposits | | | 614,357 | | | | 507,519 | |
Mutual funds | | | 66,001 | | | | 199,742 | |
Total | | | 1,133,729 | | | | 1,064,714 | |
| | | | | | | | |
The risk classification of the Company’s mutual funds as of June 30, 2021 and as of December 31, 2020 is shown below.
| | | | | | | | |
| | | 06-30-2021
ThU.S.$ | | | 12-31-2020
ThU.S.$ | |
AAAfm | | | 22,508 | | | | 137,534 | |
No classification | | | 43,493 | | | | 62,208 | |
Total Mutual Funds | | | 66,001 | | | | 199,742 | |
| | | | | | | | |
39
CELULOSA ARAUCO Y CONSTITUCION S.A. AND SUBSIDIARIES
Unaudited Interim Consolidated Financial Statements
June 30, 2021
Amounts in thousands of U.S. dollars, except as indicated
Changes in Financial Liabilities
| | | | | | | | | | | | | | | | | | |
| | | 06-30-2021 | |
| | | Borrowings
from banks | | | Hedging
liabilities | | | Bonds and
promissory
notes | | | Other
financial
liabilities,
Total | |
| | | ThU.S.$ | | | ThU.S.$ | | | ThU.S.$ | | | ThU.S.$ | |
Opening balance January 1 | | | 1,274,260 | | | | 39,660 | | | | 4,707,944 | | | | 6,021,864 | |
| Cash flows | | (+) Borrowings obtained | | | 5,000 | | | | — | | | | — | | | | 5,000 | |
| | (-) Borrowings paid | | | (249,162 | ) | | | 128 | | | | (23,609 | ) | | | (272,643 | ) |
| | (-) Interest paid | | | (7,096 | ) | | | (11,434 | ) | | | (102,470 | ) | | | (121,000 | ) |
(+) Accrued interest | | | 6,162 | | | | 10,193 | | | | 102,092 | | | | 118,447 | |
(+/-) Inflation adjustment | | | (19,606 | ) | | | — | | | | (1,574 | ) | | | (21,180 | ) |
(+/-) Changes in fair value | | | — | | | | 72,591 | | | | — | | | | 72,591 | |
(+/-) Other non-cash movements | | | 2,817 | | | | — | | | | 4,024 | | | | 6,841 | |
Closing balance | | | 1,012,375 | | | | 111,138 | | | | 4,686,407 | | | | 5,809,920 | |
| | | | | | | | | | | | | | | | | | |
| | | | | | | | | | | | | | | | | | |
| | | 12-31-2020 | |
| | | Borrowings from
banks | | | Hedging
liabilities | | | Bonds and
promissory notes | | | Other financial
liabilities, Total | |
| | | ThU.S.$ | | | ThU.S.$ | | | ThU.S.$ | | | ThU.S.$ | |
Opening balance January 1 | | | 947,022 | | | | 134,275 | | | | 4,831,743 | | | | 5,913,040 | |
| Cash flows | | (+) Borrowings obtained | | | 412,077 | | | | — | | | | — | | | | 412,077 | |
| | (-) Borrowings paid | | | (257,551 | ) | | | (37,127 | ) | | | (225,796 | ) | | | (520,474 | ) |
| | (-) Commissions paid | | | (9,113 | ) | | | — | | | | — | | | | (9,113 | ) |
| | (-) Interest paid | | | (29,515 | ) | | | (32,189 | ) | | | (194,512 | ) | | | (256,216 | ) |
(+) Accrued interest | | | 26,174 | | | | 33,613 | | | | 204,678 | | | | 264,465 | |
(+/-) Inflation adjustment | | | 51,510 | | | | — | | | | 83,809 | | | | 135,319 | |
(+/-) Changes in fair value | | | — | | | | (58,898 | ) | | | — | | | | (58,898 | ) |
(+/-) Other non-cash movements | | | 133,656 | | | | (14 | ) | | | 8,022 | | | | 141,664 | |
Closing balance | | | 1,274,260 | | | | 39,660 | | | | 4,707,944 | | | | 6,021,864 | |
| | | | | | | | | | | | | | | | | | |
| | | | | | | | | | |
| | | Lease liabilities | |
| | | 06-30-2021 | | | 12-31-2020 | |
| | | ThU.S.$ | | | ThU.S.$ | |
Opening balance January 1 | | | 211,755 | | | | 271,025 | |
| Cash flows | | (-) Borrowings paid | | | (36,238 | ) | | | (75,233 | ) |
| | (-) Interest paid | | | (4,848 | ) | | | (9,428 | ) |
(+) Accrued interest | | | 4,876 | | | | 10,021 | |
(+/-) Inflation adjustment | | | (3,583 | ) | | | 4,394 | |
(+) Increase due to new leases liabilities | | | 20,003 | | | | 16,760 | |
(+/-) Other movements | | | 3,297 | | | | (5,784 | ) |
Closing balance | | | 195,262 | | | | 211,755 | |
| | | | | | | | | | |
40
CELULOSA ARAUCO Y CONSTITUCION S.A. AND SUBSIDIARIES
Unaudited Interim Consolidated Financial Statements
June 30, 2021
Amounts in thousands of U.S. dollars, except as indicated
NOTE 6. INCOME TAXES
The tax rates applicable in the countries in which Arauco operates are 27% in Chile, 35% in Argentina and Mexico, 34% in Brazil, 25% in Uruguay and 21% in the United States (federal tax).
In 2021, Argentinian Republic published in the Official Gazette of Argentina the law No. 27,630, which replaced the fixed rate paid by Argentine companies on their corporate income tax periods starting in 2021. It provides a progressive scale of rates, where a 25% rate will be applied to companies with a nex taxable income of up to 5,000,000Argentine pesos (AR$) (approximately US$ 52,235 as of June 30, 2021), a 30% rate will be applied to companies with a nex taxable income ranging between AR$ 5,000,000 and AR$ 50,000,000 (approximately US$ 522,350 as of June 30,2021), and a 35% rate will be applied to companies with a nex taxable incomes surpassing AR$ 50,000,000. This new regulationgenerated a loss of ThU.S.$ 49,000 in Arauco Argentina S.A. in income tax. The rate applied to Arauco Argentina S.A. in 2020 was 30%.
41
CELULOSA ARAUCO Y CONSTITUCION S.A. AND SUBSIDIARIES
Unaudited Interim Consolidated Financial Statements
June 30, 2021
Amounts in thousands of U.S. dollars, except as indicated
Deferred Tax Assets
The following table sets forth the deferred tax assets as of the dates indicated:
| | | | | | | | |
| | | 06-30-2021 | | | 12-31-2020 | |
Deferred Tax Assets | | ThU.S.$ | | | ThU.S.$ | |
Deferred tax Assets relating to Provisions | | | 4,881 | | | | 5,042 | |
Deferred tax Assets relating to Accrued Liabilities | | | 8,111 | | | | 8,107 | |
Deferred tax Assets relating to Post-Employment benefits | | | 21,837 | | | | 22,026 | |
Deferred tax Assets relating to Property, Plant and equipment | | | 26,196 | | | | 24,397 | |
Deferred tax Assets relating to Impairment provision | | | 10,766 | | | | 14,193 | |
Deferred tax Assets relating to Financial Instruments | | | 96,476 | | | | 79,765 | |
Deferred tax Assets relating to Tax Loss Carryforward | | | 224,800 | | | | 126,405 | |
Deferred tax Assets relating to Inventories | | | 9,035 | | | | 7,964 | |
Deferred tax Assets relating to Provisions for Income | | | 11,099 | | | | 7,905 | |
Deferred tax Assets relating to Allowance for Doubtful Accounts | | | 2,182 | | | | 2,427 | |
Deferred tax Assets relating to Intangible revaluation | | | 3,317 | | | | 3,713 | |
Deferred tax Assets relating to tax credits | | | 14,974 | | | | 20,898 | |
Deferred tax Assets relating to Other Deductible Temporary Differences | | | 29,521 | | | | 20,018 | |
Total Deferred Tax Assets | | | 463,195 | | | | 342,860 | |
| | | | | | | | |
Offsetting presentation | | | (457,480 | ) | | | (336,819 | ) |
| | | | | | | | |
Net Effect | | | 5,715 | | | | 6,041 | |
| | | | | | | | |
Certain subsidiaries of Arauco mainly in Chile, Brazil, Argentina and USA, as of the date of these interim consolidated financial statements, present tax losses for which we record as deferred tax assets, given our the projection of future profits, will allow the recovery of these assets. The total amount of these tax losses is ThU.S.$ 1,045,185 (ThU.S.$ 622,621 at December 31, 2020).
In addition, as of the closing date of these interim consolidated financial statements there are ThU.S.$ 145,723 (ThU.S.$ 152,898 at December 31, 2020) of non-recoverable tax losses from subsidiaries in USA and from joint operations, for which deferred tax assets have not been recognized. The estimated recovery period exceeds the expiry date of such tax losses.
Deferred Tax Liabilities
The following table sets forth the deferred tax liabilities as of the dates indicated:
| | | | | | | | |
| | | 06-30-2021 | | | 12-31-2020 | |
Deferred Tax Liabilities | | ThU.S.$ | | | ThU.S.$ | |
Deferred tax Liabilities relating to Property, Plant and Equipment | | | 1,161,598 | | | | 1,020,282 | |
Deferred tax Liabilities relating to Financial Instruments | | | 25,213 | | | | 26,755 | |
Deferred tax Liabilities relating to Biological Assets | | | 658,019 | | | | 644,348 | |
Deferred tax Liabilities relating to Inventory | | | 42,896 | | | | 32,567 | |
Deferred tax Liabilities relating to Prepaid Expenses | | | 43,366 | | | | 42,319 | |
Deferred tax Liabilities relating to Intangible | | | 14,556 | | | | 14,826 | |
Deferred tax Liabilities relating to Other Taxable Temporary Differences | | | 21,147 | | | | 19,608 | |
Total Deferred Tax Liabilities | | | 1,966,795 | | | | 1,800,705 | |
| | | | | | | | |
Offsetting presentation | | | (457,480 | ) | | | (336,819 | ) |
| | | | | | | | |
Net Effect | | | 1,509,315 | | | | 1,463,886 | |
| | | | | | | | |
The effect of this period in current and deferred tax liabilities related to financial hedging instruments corresponds to a credit of ThU.S.$ 17,132 as of June 30, 2021 (credit of ThU.S.$ 21,427 as of June 30, 2020), which is presented net in Reserves for Cash Flow Hedges in the interim Consolidated Statement of Changes in Equity.
42
CELULOSA ARAUCO Y CONSTITUCION S.A. AND SUBSIDIARIES
Unaudited Interim Consolidated Financial Statements
June 30, 2021
Amounts in thousands of U.S. dollars, except as indicated
Reconciliation of deferred tax assets and liabilities
| | | | | | | | | | | | | | | | | | | | | | | | |
| | | Opening
Balance
01-01-2021 | | | Deferred tax
Income
(Expenses) | | | Deferred tax of
items charged
to other
comprehensive
income | | | Decrease
through
loss of control
in subsidiary | | | Increase
(decrease)
Net exchange
differences | | | Closing
balance
06-30-2021 | |
Deferred Tax Assets | | ThU.S.$ | | | ThU.S.$ | | | ThU.S.$ | | | ThU.S.$ | | | ThU.S.$ | | | ThU.S$ | |
Deferred tax Assets relating to Provisions | | | 5,042 | | | | (208 | ) | | | — | | | | — | | | | 47 | | | | 4,881 | |
Deferred tax Assets relating to Accrued Liabilities | | | 8,107 | | | | 27 | | | | — | | | | (24 | ) | | | 1 | | | | 8,111 | |
Deferred tax Assets relating to Post-Employment benefits | | | 22,026 | | | | 160 | | | | (293 | ) | | | (56 | ) | | | — | | | | 21,837 | |
Deferred tax Assets relating to Property, Plant and equipment | | | 24,397 | | | | 1,7994 | ) | | | — | | | | — | | | | — | | | | 26,196 | |
Deferred tax Assets relating to Impairment provision | | | 14,193 | | | | (3,624 | )) | | | — | | | | — | | | | 197 | | | | 10,766 | |
Deferred tax Assets relating to Financial Instruments | | | 79,765 | | | | (604 | ) | | | 17,086 | | | | — | | | | 229 | | | | 96,476 | |
Deferred tax Assets relating to Tax Loss Carryforward | | | 126,405 | | | | 97,941 | | | | — | | | | (207 | ) | | | 661 | | | | 224,800 | |
Deferred tax Assets relating to Inventories | | | 7,964 | | | | 1,060 | | | | — | | | | — | | | | 11 | | | | 9,035 | |
Deferred tax Assets relating to Provisions for Income | | | 7,905 | | | | 3,191 | | | | — | | | | — | | | | 3 | | | | 11,099 | |
Deferred tax Assets relating to Allowance for Doubtful Accounts | | | 2,427 | | | | (246 | ) | | | — | | | | — | | | | 1 | | | | 2,182 | |
Deferred tax Assets relating to Intangible revaluation | | | 3,713 | | | | (495 | ) | | | — | | | | — | | | | 99 | | | | 3,317 | |
Deferred tax Assets relating to tax credits | | | 20,898 | | | | (5,924 | ) | | | — | | | | — | | | | — | | | | 14,974 | |
Deferred tax Assets relating to Other Deductible Temporary Differences | | | 20,018 | | | | 8,628 | | | | — | | | | — | | | | 871 | | | | 29,521 | |
Total Deferred Tax Assets | | | 342,860 | | | | 101,705 | | | | 16,793 | | | | (283 | ) | | | 2,120 | | | | 463,195 | |
| | | | | | | | | | | | | | | | | | | | | | | | |
| | | | | | |
| | | Opening
Balance
01-01-2021 | | | Deferred tax
(Income)
Expenses | | | Deferred tax of
items charged
to other
comprehensive
income | | | Decrease
through loss
of control in
subsidiary | | | Increase (decrease)
Net exchange
differences | | | Closing
balance
06-30-2021 | |
Deferred Tax Liabilities | | ThU.S.$ | | | ThU.S.$ | | | ThU.S.$ | | | ThU.S.$ | | | ThU.S.$ | | | ThU.S$ | |
Deferred tax Liabilities relating to Property, Plant and Equipment | | | 1,020,282 | | | | 139,748 | | | | — | | | | (121 | ) | | | 1,689 | | | | 1,161,598 | |
Deferred tax Liabilities relating to Financial Instruments | | | 26,755 | | | | (1,490 | ) | | | (53 | ) | | | — | | | | 1 | | | | 25,213 | |
Deferred tax Liabilities relating to Biological Assets | | | 644,348 | | | | 13,788 | | | | — | | | | (2,946 | ) | | | 2,829 | | | | 658,019 | |
Deferred tax Liabilities relating to Inventory | | | 32,567 | | | | 11,690 | | | | — | | | | (1,395 | ) | | | 34 | | | | 42,896 | |
Deferred tax Liabilities relating to Prepaid Expenses | | | 42,319 | | | | 1,048 | | | | — | | | | — | | | | (1 | ) | | | 43,366 | |
Deferred tax Liabilities relating to Intangible | | | 14,826 | | | | (607 | ) | | | — | | | | — | | | | 337 | | | | 14,556 | |
Deferred tax Liabilities relating to Other Taxable Temporary Differences | | | 19,608 | | | | 1,063 | | | | — | | | | (179 | ) | | | 655 | | | | 21,147 | |
Total Deferred Tax Liabilities | | | 1,800,705 | | | | 165,240 | | | | (53 | ) | | | (4,641 | ) | | | 5,544 | | | | 1,966,795 | |
| | | | | | | | | | | | | | | | | | | | | | | | |
| | | | | | | | | | | | | | | | | | | | |
| | | Opening
Balance
01-01-2020 | | | Deferred tax
Income
(Expenses) | | | Deferred tax of
items charged
to other
comprehensive
income | | | Increase
(decrease)
Net exchange
differences | | | Closing
balance
12-31-2020 | |
Deferred Tax Assets | | ThU.S.$ | | | ThU.S.$ | | | ThU.S.$ | | | ThU.S.$ | | | ThU.S$ | |
Deferred tax Assets relating to Provisions | | | 5,749 | | | | (267 | ) | | | — | | | | (440 | ) | | | 5,042 | |
Deferred tax Assets relating to Accrued Liabilities | | | 7,182 | | | | 937 | | | | — | | | | (12 | ) | | | 8,107 | |
Deferred tax Assets relating to Post-Employment benefits | | | 20,378 | | | | 1,598 | | | | 68 | | | | (18 | ) | | | 22,026 | |
Deferred tax Assets relating to Property, Plant and equipment | | | 16,609 | | | | 7,788 | | | | — | | | | — | | | | 24,397 | |
Deferred tax Assets relating to Impairment provision | | | 20,169 | | | | (4,598 | ) | | | — | | | | (1,378 | ) | | | 14,193 | |
Deferred tax Assets relating to Financial Instruments | | | 68,390 | | | | (1,641 | ) | | | 13,685 | | | | (669 | ) | | | 79,765 | |
Deferred tax Assets relating to Tax Loss Carryforward | | | 133,221 | | | | 2,605 | | | | — | | | | (9,421 | ) | | | 126,405 | |
Deferred tax Assets relating to Inventories | | | 12,460 | | | | (4,363 | ) | | | — | | | | (133 | ) | | | 7,964 | |
Deferred tax Assets relating to Provisions for Income | | | 6,631 | | | | 1,295 | | | | — | | | | (21 | ) | | | 7,905 | |
Deferred tax Assets relating to Allowance for Doubtful Accounts | | | 4,349 | | | | (1,545 | ) | | | — | | | | (377 | ) | | | 2,427 | |
Deferred tax Assets relating to Intangible revaluation | | | 6,044 | | | | (1,042 | ) | | | — | | | | (1,289 | ) | | | 3,713 | |
Deferred tax Assets relating to tax credits | | | 19,460 | | | | 1,438 | | | | — | | | | — | | | | 20,898 | |
Deferred tax Assets relating to Other Deductible Temporary Differences | | | 16,161 | | | | 5,096 | | | | — | | | | (1,239 | ) | | | 20,018 | |
Total Deferred Tax Assets | | | 336,803 | | | | 7,301 | | | | 13,753 | | | | (14,997 | ) | | | 342,860 | |
| | | | | | | | | | | | | | | | | | | | |
| | | | | |
| | | Opening
Balance
01-01-2020 | | | Deferred tax
(Income)
Expenses | | | Deferred tax of
items charged
to other
comprehensive
income | | | Increase (decrease)
Net exchange
differences | | | Closing
balance
12-31-2020 | |
Deferred Tax Liabilities | | ThU.S.$ | | | ThU.S.$ | | | ThU.S.$ | | | ThU.S.$ | | | ThU.S$ | |
Deferred tax Liabilities relating to Property, Plant and Equipment | | | 900,415 | | | | 128,933 | | | | — | | | | (9,066 | ) | | | 1,020,282 | |
Deferred tax Liabilities relating to Financial Instruments | | | 25,630 | | | | 986 | | | | 139 | | | | — | | | | 26,755 | |
Deferred tax Liabilities relating to Biological Assets | | | 642,221 | | | | 20,239 | | | | — | | | | (18,112 | ) | | | 644,348 | |
Deferred tax Liabilities relating to Inventory | | | 38,251 | | | | (5,711 | ) | | | — | | | | 27 | | | | 32,567 | |
Deferred tax Liabilities relating to Prepaid Expenses | | | 41,338 | | | | 989 | | | | — | | | | (8 | ) | | | 42,319 | |
Deferred tax Liabilities relating to Intangible | | | 17,942 | | | | (1,118 | ) | | | — | | | | (1,998 | ) | | | 14,826 | |
Deferred tax Liabilities relating to Other Taxable Temporary Differences | | | 25,126 | | | | (2,846 | ) | | | — | | | | (2,672 | ) | | | 19,608 | |
Total Deferred Tax Liabilities | | | 1,690,923 | | | | 141,472 | | | | 139 | | | | (31,829 | ) | | | 1,800,705 | |
| | | | | | | | | | | | | | | | | | | | |
43
CELULOSA ARAUCO Y CONSTITUCION S.A. AND SUBSIDIARIES
Unaudited Interim Consolidated Financial Statements
June 30, 2021
Amounts in thousands of U.S. dollars, except as indicated
Temporary Differences
The following tables summarize the deductible and taxable temporary differences:
| | | | | | | | | | | | | | | | |
| | | 06-30-2021 | | | 12-31-2020 | |
| | | Deductible | | | Taxable | | | Deductible | | | Taxable | |
| | | Difference | | | Difference | | | Difference | | | Difference | |
| Detail of classes of Deferred Tax Temporary Differences | | ThU.S.$ | | | ThU.S.$ | | | ThU.S.$ | | | ThU.S.$ | |
Deferred Tax Assets | | | 238,395 | | | | — | | | | 216,455 | | | | — | |
Deferred Tax Assets - Tax loss carryforward | | | 224,800 | | | | — | | | | 126,405 | | | | — | |
Deferred Tax Liabilities | | | — | | | | 1,966,795 | | | | — | | | | 1,800,705 | |
Total | | | 463,195 | | | | 1,966,795 | | | | 342,860 | | | | 1,800,705 | |
| | | | | | | | | | | | | | | | |
| | |
| | | January - June | | | April - June | |
| | | 2021 | | | 2020 | | | 2021 | | | 2020 | |
| Detail of Temporary Difference Income and Loss Amounts | | ThU.S.$ | | | ThU.S.$ | | | ThU.S.$ | | | ThU.S.$ | |
Deferred Tax Assets | | | 3,764 | | | | 14,747 | | | | (10,717 | ) | | | 6,842 | |
Deferred Tax Assets - Tax loss carryforward | | | 97,941 | | | | 31,108 | | | | 44,871 | | | | 21,414 | |
Deferred Tax Liabilities | | | (165,240 | ) | | | (13,697 | ) | | | (96,202 | ) | | | 7,112 | |
Total | | | (63,535 | ) | | | 32,158 | | | | (62,048 | ) | | | 35,368 | |
| | | | | | | | | | | | | | | | |
Income Tax Expense
Income tax expense consists of the following:
| | | | | | | | | | | | | | | | |
| | | January – June | | | April - June | |
Income Tax composition | | 2021 | | | 2020 | | | 2021 | | | 2020 | |
| | | ThU.S.$ | | | ThU.S.$ | | | ThU.S.$ | | | ThU.S.$ | |
Current income tax expense | | | (101,556 | ) | | | (4,737 | ) | | | (61,140 | ) | | | (18,399 | ) |
Tax benefit from tax credits, used to reduce current tax expense | | | 5,026 | | | | 3,552 | | | | 5,026 | | | | 3,552 | |
Prior period current income tax adjustments | | | (2,729 | ) | | | 1,302 | | | | (2,513 | ) | | | 1,306 | |
Other current benefit tax (expenses) | | | (3,212 | ) | | | (3,164 | ) | | | (2,687 | ) | | | (2,477 | ) |
Current Tax Expense, Net | | | (102,471 | ) | | | (3,047 | ) | | | (61,314 | ) | | | (16,018 | ) |
Deferred tax expense relating to origination and reversal of temporary differences | | | (161,476 | ) | | | 1,050 | | | | (106,919 | ) | | | 13,954 | |
Tax benefit arising from tax credits used to reduce deferred tax expense | | | 97,941 | | | | 31,108 | | | | 44,871 | | | | 21,414 | |
Total deferred Tax benefit (expense), Net | | | (63,535 | ) | | | 32,158 | | | | (62,048 | ) | | | 35,368 | |
Income Tax benefit (expense), Total | | | (166,006 | ) | | | 29,111 | | | | (123,362 | ) | | | 19,350 | |
| | | | | | | | | | | | | | | | |
The following table presents the current income tax expense detailed by foreign and domestic (Chile) companies at June 30, 2021 and 2020:
| | | | | | | | | | | | | | | | |
| | | January – June | | | April - June | |
| | | 2021 | | | 2020 | | | 2021 | | | 2020 | |
| | | ThU.S.$ | | | ThU.S.$ | | | ThU.S.$ | | | ThU.S.$ | |
Foreign current income tax expense | | | (53,280 | ) | | | 13,329 | | | | (33,423 | ) | | | (8,686 | ) |
Domestic current income tax expense | | | (49,191 | ) | | | (16,376 | ) | | | (27,891 | ) | | | (7,332 | ) |
Total current income tax expense | | | (102,471 | ) | | | (3,047 | ) | | | (61,314 | ) | | | (16,018 | ) |
Foreign deferred tax benefit (expense) | | | (49,988 | ) | | | (14,582 | ) | | | (44,805 | ) | | | 11,900 | |
Domestic deferred tax benefit (expense) | | | (13,547 | ) | | | 46,740 | | | | (17,243 | ) | | | 23,468 | |
Total deferred tax benefit (expense) | | | (63,535 | ) | | | 32,158 | | | | (61,048 | ) | | | 35,368 | |
Total income tax benefit (expense) | | | (166,006 | ) | | | 29,111 | | | | (123,362 | ) | | | 19,350 | |
44
CELULOSA ARAUCO Y CONSTITUCION S.A. AND SUBSIDIARIES
Unaudited Interim Consolidated Financial Statements
June 30, 2021
Amounts in thousands of U.S. dollars, except as indicated
Reconciliation of income tax expense from statutory tax rate to the effective tax rate.
The reconciliation of income tax expense is as follows:
| | | | | | | | | | | | | | | | |
| | | January - June | | | | | | | |
Reconciliation of Income tax from Statutory Rate to Effective Tax Rate | | 2021 | | | 2020 | | | 2021 | | | 2020 | |
| | ThU.S.$ | | | ThU.S.$ | | | ThU.S.$ | | | ThU.S.$ | |
Statutory domestic (Chile) income tax rate | | | 27.0 | % | | | 27.0 | % | | | 27.0 | % | | | 27.0 | % |
Tax Expense at statutory tax rate | | | (126,844 | ) | | | 30,984 | | | | (87,691 | ) | | | 20,328 | |
Tax effect of foreign tax rates | | | (3,646 | ) | | | (1,641 | ) | | | (843 | ) | | | (1,460 | ) |
Tax effect of revenues exempt from taxation | | | 25,938 | | | | 2,396 | | | | 18,092 | | | | 1,590 | |
Tax effect of not deductible expenses | | | (14,938 | ) | | | (10,517 | ) | | | (5,576 | ) | | | 4,730 | |
Tax rate effect of previously unrecognized tax loss | | | — | | | | 11,066 | | | | — | | | | (3,327 | ) |
Tax effect of a new evaluation of deferred tax assets | | | 4,454 | | | | (778 | ) | | | 3,301 | | | | (404 | ) |
Tax effect of changes in tax rates | | | (45,094 | ) | | | — | | | | (45,094 | ) | | | — | |
Tax Effect of tax provided in excess in prior periods | | | (2,729 | ) | | | 1,302 | | | | (2,513 | ) | | | 1,306 | |
Other tax rate effects | | | (3,147 | ) | | | (3,701 | ) | | | (3,038 | ) | | | (3,413 | ) |
Total adjustments to tax expense at applicable tax rate | | | (39,162 | ) | | | (1,873 | ) | | | (35,671 | ) | | | (978 | ) |
Tax benefit (expense) at effective tax rate | | | (166,006 | ) | | | 29,111 | | | | (123,362 | ) | | | 19,350 | |
| | | | | | | | | | | | | | | | |
Current tax assets and liabilities
The current tax assets and liabilities balances are as follow:
| | | | | | | | |
Current tax Assets | | 06-30-2021
ThU.S.$ | | | 12-31-2020
ThU.S.$ | |
Monthly Provisional Payments (MPP) | | | 5,721 | | | | 17,540 | |
Income tax receivable | | | 103,791 | | | | 298,093 | |
Fixed assets tax credits | | | — | | | | 10 | |
Provision tax income | | | (23,195 | ) | | | (928 | ) |
Other tax receivables | | | 25,465 | | | | 6,015 | |
Total | | | 111,782 | | | | 320,730 | |
| | | | | | | | |
| | |
Current tax Liabilities | | 06-30-2021
ThU.S.$ | | | 12-31-2020
ThU.S.$ | |
Provision tax income (First category) | | | 76,758 | | | | 81,368 | |
Monthly Provisional Payments (MPP) | | | (30,592 | ) | | | (43,232 | ) |
Other tax payables | | | 9,845 | | | | 6,536 | |
Total | | | 56,011 | | | | 44,672 | |
| | | | | | | | |
45
CELULOSA ARAUCO Y CONSTITUCION S.A. AND SUBSIDIARIES
Unaudited Interim Consolidated Financial Statements
June 30, 2021
Amounts in thousands of U.S. dollars, except as indicated
NOTE 7. PROPERTY, PLANT AND EQUIPMENT
| | | | | | | | |
Property, Plant and Equipment, Net | | 06-30-2021
ThU.S.$ | | | 12-31-2020
ThU.S.$ | |
Construction work in progress | | | 2,346,172 | | | | 1,944,578 | |
Land | | | 892,384 | | | | 930,372 | |
Buildings | | | 2,218,155 | | | | 2,248,784 | |
Plant and equipment | | | 2,976,751 | | | | 3,026,136 | |
Information technology equipment | | | 25,107 | | | | 26,166 | |
Fixtures and fittings | | | 14,373 | | | | 16,627 | |
Motor vehicles | | | 14,088 | | | | 15,055 | |
Other property, plant and equipment | | | 118,377 | | | | 117,586 | |
Total Net | | | 8,605,407 | | | | 8,325,304 | |
| | | | | | | | |
Property, Plant and Equipment, Gross | | | | | | | | |
Construction work in progress | | | 2,346,172 | | | | 1,944,578 | |
Land | | | 892,384 | | | | 930,372 | |
Buildings | | | 4,460,994 | | | | 4,420,293 | |
Plant and equipment | | | 7,102,924 | | | | 7,027,942 | |
Information technology equipment | | | 104,220 | | | | 102,632 | |
Fixtures and fittings | | | 49,577 | | | | 50,209 | |
Motor vehicles | | | 59,561 | | | | 59,515 | |
Other property, plant and equipment | | | 135,697 | | | | 135,199 | |
Total Gross | | | 15,151,529 | | | | 14,670,740 | |
| | | | | | | | |
Accumulated depreciation and impairment | | | | | | | | |
Buildings | | | (2,242,839 | ) | | | (2,171,509 | ) |
Plant and equipment | | | (4,126,173 | ) | | | (4,001,806 | ) |
Information technology equipment | | | (79,113 | ) | | | (76,466 | ) |
Fixtures and fittings | | | (35,204 | ) | | | (33,582 | ) |
Motor vehicles | | | (45,473 | ) | | | (44,460 | ) |
Other property, plant and equipment | | | (17,320 | ) | | | (17,613 | ) |
Total | | | (6,546,122 | ) | | | (6,345,436 | ) |
| | | | | | | | |
Description of Property, Plant and Equipment Pledged as Security for Liabilities
As of June 30, 2021, there are no significant assets pledged as collateral to be disclosed in these interim consolidated financial statements.
Disbursements commitments for the acquisition of property, plant and equipment and disbursements for property, plant and equipment under construction.
| | | | | | | | |
| | | 06-30-2021
ThU.S.$ | | | 12-31-2020
ThU.S.$ | |
Amount committed for the acquisition of property, plant and equipment | | | 409,269 | | | | 542,230 | |
46
CELULOSA ARAUCO Y CONSTITUCION S.A. AND SUBSIDIARIES
Unaudited Interim Consolidated Financial Statements
June 30, 2021
Amounts in thousands of U.S. dollars, except as indicated
Reconciliation of Property, Plant and Equipment
The following tables set forth the reconciliation of the carrying amount of property, plant and equipment as of June 30, 2021 and as of December 31, 2020:
| | | | | | | | | | | | | | | | | | | | | | | | | | | | | | | | | | | | |
| | | Construction
work in
progress | | | Land | | | Buildings | | | Plant and
equipment | | | IT
Equipment | | | Fixtures
and
fittings | | | Motor
vehicles | | | Other
Property,
Plant and
Equipment | | | TOTAL | |
Reconciliation of Property, Plant
and Equipment | | ThU.S.$ | | | ThU.S.$ | | | ThU.S.$ | | | ThU.S.$ | | | ThU.S.$ | | | ThU.S.$ | | | ThU.S.$ | | | ThU.S.$ | | | ThU.S.$ | |
Opening Balance 01-01-2021 | | | 1,944,578 | | | | 930,372 | | | | 2,248,784 | | | | 3,026,136 | | | | 26,166 | | | | 16,627 | | | | 15,055 | | | | 117,586 | | | | 8,325,304 | |
Changes | | | | | | | | | | | | | | | | | | | | | | | | | | | | | | | | | | | | |
Additions | | | 523,923 | | | | 45 | | | | 1,137 | | | | 3,846 | | | | 268 | | | | 99 | | | | 100 | | | | 1,828 | | | | 531,246 | |
Disposals | | | — | | | | (123 | ) | | | (456 | ) | | | (11,626 | ) | | | (167 | ) | | | (1 | ) | | | (130 | ) | | | (206 | ) | | | (12,709 | ) |
Withdrawals | | | (919 | ) | | | — | | | | (1,171 | ) | | | (1,911 | ) | | | — | | | | — | | | | (10 | ) | | | (753 | ) | | | (4,764 | ) |
Depreciation | | | — | | | | — | | | | (69,220 | ) | | | (143,570 | ) | | | (3,221 | ) | | | (1,576 | ) | | | (1,683 | ) | | | (591 | ) | | | (219,861 | ) |
Impairment loss recognized in profit or loss | | | — | | | | — | | | | (2,372 | ) | | | 8,766 | | | | (50 | ) | | | — | | | | (12 | ) | | | — | | | | 6,332 | |
Increase (decrease) through net exchange differences | | | 1,390 | | | | 4,126 | | | | 2,198 | | | | 8,014 | | | | 134 | | | | 172 | | | | 134 | | | | 796 | | | | 16,964 | |
Reclassification of assets held for sale | | | — | | | | (26,538 | ) | | | (383 | ) | | | — | | | | — | | | | — | | | | — | | | | — | | | | (26,921 | ) |
Increase (decrease) through transfers from construction in progress | | | (122,800 | ) | | | 822 | | | | 39,685 | | | | 81,058 | | | | 1,977 | | | | (941 | ) | | | 482 | | | | (283 | ) | | | — | |
Reclassification from lease to Property, plant and equipment | | | — | | | | — | | | | — | | | | 7,251 | | | | — | | | | — | | | | 152 | | | | — | | | | 7,403 | |
Decrease due to loss of control in subsidiary | | | — | | | | (16,320 | ) | | | (47 | ) | | | (1,213 | ) | | | — | | | | (7 | ) | | | — | | | | — | | | | (17,587 | ) |
Total changes | | | 401,594 | | | | (37,988 | ) | | | (30,629 | ) | | | (49,385 | ) | | | (1,059 | ) | | | (2,254 | ) | | | (967 | ) | | | 791 | | | | 280,103 | |
Closing balance 06-30-2021 | | | 2,346,172 | | | | 892,384 | | | | 2,218,155 | | | | 2,976,751 | | | | 25,107 | | | | 14,373 | | | | 14,088 | | | | 118,377 | | | | 8,605,407 | |
| | | | | | | | | | | | | | | | | | | | | | | | | | | | | | | | | | | | |
| | | | | | | | | |
Reconciliation of Property, Plant
and Equipment | | Construction
work in
progress | | | Land | | | Buildings | | | Plant and
equipment | | | IT
Equipment | | | Fixtures
and
fittings | | | Motor
vehicles | | | Other
Property,
Plant and
Equipment | | | TOTAL | |
| | | ThU.S.$ | | | ThU.S.$ | | | ThU.S.$ | | | ThU.S.$ | | | ThU.S.$ | | | ThU.S.$ | | | ThU.S.$ | | | ThU.S.$ | | | ThU.S.$ | |
Opening Balance 01-01-2020 | | | 1,128,431 | | | | 971,061 | | | | 2,247,996 | | | | 3,139,761 | | | | 20,906 | | | | 13,421 | | | | 14,922 | | | | 111,685 | | | | 7,648,183 | |
Changes | | | | | | | | | | | | | | | | | | | | | | | | | | | | | | | | | | | | |
Additions | | | 1,258,602 | | | | 3,449 | | | | 5,149 | | | | 38,618 | | | | 906 | | | | 1,602 | | | | 1,553 | | | | 12,839 | | | | 1,322,718 | |
Disposals | | | — | | | | (14,957 | ) | | | (545 | ) | | | (8,323 | ) | | | (5 | ) | | | (1 | ) | | | (197 | ) | | | (1,583 | ) | | | (25,611 | ) |
Withdrawals | | | (418 | ) | | | (782 | ) | | | (1,540 | ) | | | (3,986 | ) | | | (97 | ) | | | (30 | ) | | | (6 | ) | | | (46 | ) | | | (6,905 | ) |
Depreciation | | | — | | | | — | | | | (139,971 | ) | | | (286,740 | ) | | | (6,572 | ) | | | (3,009 | ) | | | (4,325 | ) | | | (1,149 | ) | | | (441,766 | ) |
Impairment loss recognized in profit or loss | | | — | | | | — | | | | (22,176 | ) | | | (36,032 | ) | | | (480 | ) | | | — | | | | (107 | ) | | | — | | | | (58,795 | ) |
Increase (decrease) through net exchange differences | | | (4,102 | ) | | | (28,405 | ) | | | (21,954 | ) | | | (55,349 | ) | | | (288 | ) | | | (190 | ) | | | (309 | ) | | | (4,709 | ) | | | (115,306 | ) |
Increase (decrease) through transfers from construction in progress | | | (437,935 | ) | | | 6 | | | | 181,825 | | | | 235,776 | | | | 11,796 | | | | 4,834 | | | | 3,149 | | | | 549 | | | | — | |
Reclassification from lease to Property, plant and equipment | | | — | | | | — | | | | — | | | | 2,411 | | | | — | | | | — | | | | 375 | | | | — | | | | 2,786 | |
Total changes | | | 816,147 | | | | (40,689 | ) | | | 788 | | | | (113,625 | ) | | | 5,260 | | | | 3,206 | | | | 133 | | | | 5,901 | | | | 677,121 | |
Closing balance 12-31-2020 | | | 1,944,578 | | | | 930,372 | | | | 2,248,784 | | | | 3,026,136 | | | | 26,166 | | | | 16,627 | | | | 15,055 | | | | 117,586 | | | | 8,325,304 | |
| | | | | | | | | | | | | | | | | | | | | | | | | | | | | | | | | | | | |
47
CELULOSA ARAUCO Y CONSTITUCION S.A. AND SUBSIDIARIES
Unaudited Interim Consolidated Financial Statements
June 30, 2021
Amounts in thousands of U.S. dollars, except as indicated
The depreciation expense for the period ending June 30, 2021 and 2020 is as follows:
| | | | | | | | | | | | | | | | |
| | | January - June | | | April - June | |
| | | 2021 | | | 2020 | | | 2021 | | | 2020 | |
Depreciation for the year | | ThU.S.$ | | | ThU.S.$ | | | ThU.S.$ | | | ThU.S.$ | |
Cost of sales | | | 204,257 | | | | 199,164 | | | | 100,306 | | | | 100,896 | |
Administrative expenses | | | 9,205 | | | | 8,889 | | | | 4,621 | | | | 4,803 | |
Other expenses | | | 219 | | | | 1,601 | | | | 120 | | | | 207 | |
Total | | | 213,681 | | | | 209,654 | | | | 105,047 | | | | 105,906 | |
| | | | | | | | | | | | | | | | |
Depreciation charged to profit or loss statement differs from the movement of the period for Property, Plant and Equipment. This is mainly due to the periodic cost processes in which a portion of the depreciation charge remains in Inventories. Furthermore, this deviation is also affected by the conversion differences corresponding to companies that use a functional currency other than U.S. dollars.
The useful lives of property, plant and equipment are estimated based on the expected use of the assets. The average useful lives by asset class are as follow:
| | | | |
| | | Years of Useful Life
(Average) | |
Buildings | | | 58 | |
Plant and equipment | | | 30 | |
Information technology equipment | | | 8 | |
Fixtures and fittings | | | 28 | |
Motor vehicles | | | 7 | |
Other property, plant and equipment | | | 14 | |
See Note 12 for details of capitalized borrowing costs.
48
CELULOSA ARAUCO Y CONSTITUCION S.A. AND SUBSIDIARIES
Unaudited Interim Consolidated Financial Statements
June 30, 2021
Amounts in thousands of U.S. dollars, except as indicated
NOTE 8. LEASES
Arauco acting as lessee
In the application of IFRS 16, Arauco chose not to apply the requirements to recognize a liability and an asset for right of use for leases which term ends within 12 months from January 1, 2019 and for leases in which the underlying asset is of low value ThU.S.$ 5.
Lease liabilities and their maturity are presented in Notes 11 and 23.
Right of use assets
| | | | | | | | |
| | | 06-30-2021 | | | 12-31-2020 | |
| | | ThU.S.$ | | | ThU.S.$ | |
| | | | | | | | |
Property, Plant and Equipment by right of use, Net | | | | | | | | |
Land | | | 75,616 | | | | 60,761 | |
Buildings | | | 15,738 | | | | 19,954 | |
Plant and equipment | | | 20,465 | | | | 24,035 | |
Information technology equipment | | | 241 | | | | 380 | |
Fixtures and fittings | | | 396 | | | | 698 | |
Motor vehicles | | | 73,690 | | | | 92,951 | |
Other property, plant and equipment | | | 15,098 | | | | 20,355 | |
Total Net | | | 201,244 | | | | 219,134 | |
| | | | | | | | |
Property, Plant and Equipment by right of use, Gross | | | | | | | | |
Land | | | 93,649 | | | | 74,047 | |
Buildings | | | 28,781 | | | | 30,443 | |
Plant and equipment | | | 32,813 | | | | 67,662 | |
Information technology equipment | | | 815 | | | | 798 | |
Fixtures and fittings | | | 1,563 | | | | 1,636 | |
Motor vehicles | | | 169,014 | | | | 168,808 | |
Other property, plant and equipment | | | 20,357 | | | | 21,574 | |
Total Gross | | | 346,992 | | | | 364,968 | |
| | | | | | | | |
Accumulated depreciation and impairment by right of use | | | | | | | | |
Land | | | (18,033 | ) | | | (13,286 | ) |
Buildings | | | (13,043 | ) | | | (10,489 | ) |
Plant and equipment | | | (12,348 | ) | | | (43,627 | ) |
Information technology equipment | | | (574 | ) | | | (418 | ) |
Fixtures and fittings | | | (1,167 | ) | | | (938 | ) |
Motor vehicles | | | (95,324 | ) | | | (75,857 | ) |
Other property, plant and equipment | | | (5,259 | ) | | | (1,219 | ) |
Total | | | (145,748 | ) | | | (145,834 | ) |
| | | | | | | | |
49
CELULOSA ARAUCO Y CONSTITUCION S.A. AND SUBSIDIARIES
Unaudited Interim Consolidated Financial Statements
June 30, 2021
Amounts in thousands of U.S. dollars, except as indicated
Reconciliation of Property, Plant and Equipment by Right of Use
The following tables set forth the reconciliation of the carrying amount of property, plant and equipment by right of use as of June 30, 2021 and as of December 31, 2020:
| | | | | | | | | | | | | | | | | | | | | | | | | | | | | | | | |
Reconciliation of Property, Plant and Equipment by
right of use | | Land
ThU.S.$ | | | Buildings
ThU.S.$ | | | Plant and
equipment
ThU.S.$ | | | IT
Equipment
ThU.S.$ | | | Fixtures
and
fittings
ThU.S.$ | | | Motor
vehicles
ThU.S.$ | | | Other
Property,
Plant and
Equipment
ThU.S.$ | | | TOTAL
ThU.S.$ | |
Opening Balance 01-01-2021 | | | 60,761 | | | | 19,954 | | | | 24,035 | | | | 380 | | | | 698 | | | | 92,951 | | | | 20,355 | | | | 219,134 | |
Changes | | | | | | | | | | | | | | | | | | | | | | | | | | | | | | | | |
Additions | | | 17,568 | | | | 581 | | | | 1,577 | | | | — | | | | — | | | | 277 | | | | — | | | | 20,003 | |
Withdrawals | | | — | | | | — | | | | — | | | | — | | | | — | | | | (35 | ) | | | — | | | | (35 | ) |
Depreciation | | | (4,428 | ) | | | (2,719 | ) | | | (4,247 | ) | | | (134 | ) | | | (230 | ) | | | (19,538 | ) | | | (1,095 | ) | | | (32,391 | ) |
Increase (decrease) through net exchange differences | | | 1,715 | | | | 18 | | | | (443 | ) | | | 2 | | | | — | | | | 22 | | | | — | | | | 1,314 | |
Increase (decrease) through others | | | — | | | | — | | | | — | | | | — | | | | — | | | | — | | | | (7,403 | ) | | | (7,403 | ) |
Reclassification from lease to Property, plant and equipment | | | — | | | | (2,096 | ) | | | (457 | ) | | | (7 | ) | | | (72 | ) | | | 13 | | | | 3,241 | | | | 622 | |
Total changes | | | 14,855 | | | | (4,216 | ) | | | (3,570 | ) | | | (139 | ) | | | (302 | ) | | | (19,261 | ) | | | (5,257 | ) | | | (17,890 | ) |
Closing balance 06-30-2021 | | | 75,616 | | | | 15,738 | | | | 20,465 | | | | 241 | | | | 396 | | | | 73,690 | | | | 15,098 | | | | 201,244 | |
| | | | | | | | | | | | | | | | | | | | | | | | | | | | | | | | |
| | | | | | | | | | | | | | | | | | | | | | | | | | | | | | | | |
Reconciliation of Property, Plant and Equipment by
right of use | | Land
ThU.S.$ | | | Buildings
ThU.S.$ | | | Plant and
equipment
ThU.S.$ | | | IT
Equipment
ThU.S.$ | | | Fixtures
and
fittings
ThU.S.$ | | | Motor
vehicles
ThU.S.$ | | | Other
Property,
Plant and
Equipment
ThU.S.$ | | | TOTAL
ThU.S.$ | |
Opening Balance 01-01-2020 | | | 67,804 | | | | 25,940 | | | | 44,753 | | | | 574 | | | | 1,138 | | | | 126,587 | | | | 17,583 | | | | 284,379 | |
Changes | | | | | | | | | | | | | | | | | | | | | | | | | | | | | | | | |
Additions | | | 5,543 | | | | 1,601 | | | | — | | | | 203 | | | | — | | | | 5,663 | | | | 3,750 | | | | 16,760 | |
Withdrawals | | | (474 | ) | | | (33 | ) | | | (5,087 | ) | | | — | | | | — | | | | (862 | ) | | | (435 | ) | | | (6,891 | ) |
Depreciation | | | (7,032 | ) | | | (6,224 | ) | | | (17,455 | ) | | | (270 | ) | | | (481 | ) | | | (38,885 | ) | | | (2,802 | ) | | | (73,149 | ) |
Increase (decrease) through net exchange differences | | | (5,080 | ) | | | 200 | | | | 540 | | | | (63 | ) | | | 41 | | | | (297 | ) | | | — | | | | (4,659 | ) |
Increase (decrease) through others | | | — | | | | (1,530 | ) | | | 1,284 | | | | (64 | ) | | | — | | | | 745 | | | | 5,045 | | | | 5,480 | |
Reclassification from lease to Property, plant and equipment | | | — | | | | — | | | | — | | �� | | — | | | | — | | | | — | | | | (2,786 | ) | | | (2,786 | ) |
Total changes | | | (7,043 | ) | | | (5,986 | ) | | | (20,718 | ) | | | (194 | ) | | | (440 | ) | | | (33,636 | ) | | | 2,772 | | | | (65,245 | ) |
Closing balance 12-31-2020 | | | 60,761 | | | | 19,954 | | | | 24,035 | | | | 380 | | | | 698 | | | | 92,951 | | | | 20,355 | | | | 219,134 | |
| | | | | | | | | | | | | | | | | | | | | | | | | | | | | | | | |
The depreciation expense for the period ending June 30, 2021 and 2020 Property, Plant and Equipment by right of use is as follows:
| | | | | | | | | | | | | | | | |
| | | January - June | | | April - June | |
Depreciation for the period | | 2021
ThU.S.$ | | | 2020
ThU.S.$ | | | 2021
ThU.S.$ | | | 2020
ThU.S.$ | |
Cost of sales | | | 21,907 | | | | 30,086 | | | | 10,221 | | | | 15,140 | |
Distribution costs | | | 1,211 | | | | 825 | | | | 639 | | | | 412 | |
Administrative expenses | | | 3,471 | | | | 4,167 | | | | 1,658 | | | | 1,392 | |
Total | | | 26,589 | | | | 35,078 | | | | 12,518 | | | | 16,944 | |
| | | | | | | | | | | | | | | | |
Depreciation charged to profit or loss statement differs from the movement of the period for Property, Plant and Equipment for right of use. This is mainly due to the periodic cost processes in which a portion of the depreciation charge remains in the Inventories. Furthermore, this deviation is also affected by the conversion differences of the companies with a functional currency other than U.S. dollars.
Additionally, Arauco has recognized directly in the interim consolidated statement of profit or loss, the following leases excluded from Right of use assets:
| | | | | | | | | | | | | | | | |
| | | January – June | | | April - June | |
| | | 2021
ThU.S.$ | | | 2020
ThU.S.$ | | | 2021
ThU.S.$ | | | 2020
ThU.S.$ | |
Expenses from payments of variable leases | | | 73,813 | | | | 65,320 | | | | 37,438 | | | | 33,272 | |
Expenses from low value leases | | | 1,546 | | | | 2,345 | | | | 694 | | | | 974 | |
Expenses from short-term leases | | | 15,382 | | | | 21,932 | | | | 7,079 | | | | 6,076 | |
Total | | | 90,741 | | | | 89,597 | | | | 45,211 | | | | 40,322 | |
| | | | | | | | | | | | | | | | |
50
CELULOSA ARAUCO Y CONSTITUCION S.A. AND SUBSIDIARIES
Unaudited Interim Consolidated Financial Statements
June 30, 2021
Amounts in thousands of U.S. dollars, except as indicated
Arauco acting as lessor
IFRS 16 substantially maintains the accounting requirements of the lessor of IAS 17. Consequently, Arauco has continued to classify its leases as operating or financial.
Reconciliation of Financial Lease Minimum Payments:
| | | | | | | | | | | | |
| | | 06-30-2021 | |
Periods | | Gross
ThU.S.$ | | | Interest
ThU.S.$ | | | Present
Value
ThU.S.$ | |
Less than one year | | | 88 | | | | 6 | | | | 82 | |
Between one and five years | | | — | | | | — | | | | — | |
More than five years | | | — | | | | — | | | | — | |
Total | | | 88 | | | | 6 | | | | 82 | |
| | | | | | | | | | | | |
| | | | | | | | | | | | |
| | | 12-31-2020 | |
Periods | | Gross
ThU.S.$ | | | Interest
ThU.S.$ | | | Present
Value
ThU.S.$ | |
Less than one year | | | 121 | | | | 12 | | | | 109 | |
Between one and five years | | | 26 | | | | — | | | | 26 | |
More than five years | | | — | | | | — | | | | — | |
Total | | | 147 | | | | 12 | | | | 135 | |
| | | | | | | | | | | | |
Financial lease receivables are presented in the interim consolidated statements of financial position in line items “Trade and other current receivable” and “Trade and other non-current receivable” depending on their maturities stated above.
Arauco accounts for its lease contracts as financial leases. These lease contracts are for a term of less than five-years at market interest rates and leased assets are forestry machinery and equipment. They also include an early termination option, under general and special conditions stipulated in each contract.
Arauco holds leases as lessee and lessor, described in the previous tables, for which there are no impairment contingent payments or restrictions to report.
NOTE 9. REVENUE
| | | | | | | | | | | | | | | | |
| | | January - June | | | April - June | |
Classes of revenue | | 2021
ThU.S.$ | | | 2020
ThU.S.$ | | | 2021
ThU.S.$ | | | 2020
ThU.S.$ | |
Revenue from sales of goods | | | 2,855,885 | | | | 2,138,551 | | | | 1,531,919 | | | | 1,031,516 | |
Revenue from rendering of services | | | 46,396 | | | | 38,489 | | | | 23,659 | | | | 18,358 | |
Total | | | 2,902,281 | | | | 2,177,040 | | | | 1,555,578 | | | | 1,049,874 | |
| | | | | | | | | | | | | | | | |
The reportable segments revenues by business area and by geographical area are presented in Note 24.
51
CELULOSA ARAUCO Y CONSTITUCION S.A. AND SUBSIDIARIES
Unaudited Interim Consolidated Financial Statements
June 30, 2021
Amounts in thousands of U.S. dollars, except as indicated
NOTE 10. EMPLOYEE BENEFITS
Classes of Benefits and Expenses by Employee
| | | | | | | | | | | | | | | | |
| | | January - June | | | April - June | |
| | | 2021
ThU.S.$ | | | 2020
ThU.S.$ | | | 2021
ThU.S.$ | | | 2020
ThU.S.$ | |
Employee expenses | | | 331,039 | | | | 290,559 | | | | 166,005 | | | | 137,850 | |
Wages and salaries | | | 320,506 | | | | 283,799 | | | | 160,896 | | | | 134,749 | |
Severance indemnities | | | 10,533 | | | | 6,760 | | | | 5,109 | | | | 3,101 | |
| | | | | | | | | | | | | | | | |
| | | | | | | | |
| | | 06-30-2021 | | | 12-31-2020 | |
Discount rate | | | 1.81 | % | | | 1.81 | % |
Inflation | | | 3.40 | % | | | 3.00 | % |
Annual rate of wage growth | | | 5.22 | % | | | 5.22 | % |
Mortality rate (1) | | | RV-2014 | | | | RV-2014 | |
| (1) | For the purposes of determining the technical reserves, Chilean annuity providers are required by law to utilize the mortality tables specified by the CMF (Chilean Commission for the Financial Market). The most recent table is the RV-2014, which is based on Chilean pensioner experience from 2006-2013 (SP & SVS, 2013). The mortality tables distinguish between males and females. |
| | | | |
Sensitivities to assumptions | | ThU.S.$ | |
Discount rate | | | | |
Increase in 100 bps | | | (6,418 | ) |
Decrease in 100 bps | | | 6,409 | |
Wage growth rates | | | | |
Increase in 100 bps | | | 6,211 | |
Decrease in 100 bps | | | (5,455 | ) |
The following tables set forth the balances and the reconciliation of the present value of severance indemnities obligations as of June 30, 2021 and as of December 31, 2020:
| | | | | | | | |
| | | 06-30-2021
ThU.S.$ | | | 12-31-2020
ThU.S.$ | |
Current | | | 6,365 | | | | 6,786 | |
Non-current | | | 73,925 | | | | 74,609 | |
Total | | | 80,290 | | | | 81,395 | |
| | | | | | | | |
| | |
Reconciliation of the present value of severance indemnities obligations | | 06-30-2021
ThU.S.$ | | | 12-31-2020
ThU.S.$ | |
Opening balance | | | 81,395 | | | | 75,429 | |
Current service cost | | | 3,088 | | | | 6,298 | |
Interest cost | | | 1,899 | | | | 3,802 | |
(Gains) losses from changes in actuarial assumptions | | | (2,228 | ) | | | 159 | |
Actuarial gains and losses arising from experience | | | 1,143 | | | | 124 | |
Benefits paid | | | (2,590 | ) | | | (8,323 | ) |
Decrease due to sale of subsidiary | | | (393 | ) | | | — | |
Increase (decrease) for foreign currency exchange rates changes | | | (2,024 | ) | | | 3,906 | |
Closing balance | | | 80,290 | | | | 81,395 | |
| | | | | | | | |
52
CELULOSA ARAUCO Y CONSTITUCION S.A. AND SUBSIDIARIES
Unaudited Interim Consolidated Financial Statements
June 30, 2021
Amounts in thousands of U.S. dollars, except as indicated
NOTE 11. BALANCES IN FOREIGN CURRENCY AND FOREIGN CURRENCY EXCHANGE RATE IMPACT IN PROFIT OR LOSS.
| | | | | | | | | | | | | | | | | | | | | | | | | | | | | | | | | | | | |
June 30, 2021 | | U.S Dollar
ThU.S.$ | | | Euros
ThU.S.$ | | | Brazilian
Real
ThU.S.$ | | | Argentine
Pesos
ThU.S.$ | | | Mexican
Pesos
ThU.S.$ | | | Other
currencies
ThU.S.$ | | | Chilean
Pesos
ThU.S.$ | | | U.F.
ThU.S.$ | | | Total
ThU.S.$ | |
Assets | | | | | | | | | | | | | | | | | | | | | | | | | | | | | | | | | | | | |
Current Assets | | | | | | | | | | | | | | | | | | | | | | | | | | | | | | | | | | | | |
Cash and Cash Equivalents | | | 733,103 | | | | 2,635 | | | | 157,676 | | | | 53,185 | | | | 47,680 | | | | 7,500 | | | | 131,950 | | | | — | | | | 1,133,729 | |
Other current financial assets | | | 3,309 | | | | — | | | | — | | | | — | | | | — | | | | — | | | | — | | | | — | | | | 3,309 | |
Other current non-financial assets | | | 51,216 | | | | 115 | | | | 18,004 | | | | 10,956 | | | | 4,098 | | | | 6,486 | | | | 117,169 | | | | — | | | | 208,044 | |
Trade and other current receivables | | | 653,449 | | | | 15,648 | | | | 39,223 | | | | 20,459 | | | | 38,116 | | | | 5,762 | | | | 103,149 | | | | 2,822 | | | | 878,628 | |
Accounts receivable due from related companies | | | — | | | | — | | | | — | | | | — | | | | — | | | | — | | | | 5,812 | | | | — | | | | 5,812 | |
Current Inventories | | | 898,001 | | | | — | | | | 84,690 | | | | — | | | | 34,649 | | | | — | | | | 2,413 | | | | — | | | | 1,019,753 | |
Current biological assets | | | 247,802 | | | | — | | | | 50,088 | | | | — | | | | — | | | | — | | | | — | | | | — | | | | 297,890 | |
Current tax assets | | | 108,153 | | | | — | | | | 1,249 | | | | — | | | | 743 | | | | 1,243 | | | | 394 | | | | — | | | | 111,782 | |
Non-current assets or disposal groups classified as held for sale | | | 2,695,033 | | | | 18,398 | | | | 350,930 | | | | 84,600 | | | | 125,286 | | | | 20,991 | | | | 360,887 | | | | 2,822 | | | | 3,658,947 | |
Non-current assets or disposal groups classified as held for sale | | | 131,896 | | | | — | | | | 16 | | | | — | | | | 48 | | | | — | | | | — | | | | — | | | | 131,960 | |
| | | | | | | | | | | | | | | | | | | | | | | | | | | | | | | | | | | | |
Total Current Assets | | | 2,826,929 | | | | 18,398 | | | | 350,946 | | | | 84,600 | | | | 125,334 | | | | 20,991 | | | | 360,887 | | | | 2,822 | | | | 3,790,907 | |
| | | | | | | | | | | | | | | | | | | | | | | | | | | | | | | | | | | | |
Non-Current Assets | | | | | | | | | | | | | | | | | | | | | | | | | | | | | | | | | | | | |
Other non-current financial assets | | | 16,670 | | | | — | | | | — | | | | — | | | | — | | | | — | | | | — | | | | — | | | | 16,670 | |
Other non-current non-financial assets | | | 1,679 | | | | — | | | | 22,391 | | | | 268 | | | | 657 | | | | 18 | | | | 92,898 | | | | — | | | | 117,911 | |
Trade and other non-current receivables | | | 12,926 | | | | — | | | | 4 | | | | — | | | | — | | | | — | | | | 2,743 | | | | — | | | | 15,673 | |
Investments accounted for using equity method | | | 77,625 | | | | 191,767 | | | | 30,587 | | | | — | | | | — | | | | — | | | | 24,412 | | | | — | | | | 324,391 | |
Intangible assets other than goodwill | | | 88,894 | | | | — | | | | 1,591 | | | | — | | | | 545 | | | | — | | | | 6,110 | | | | — | | | | 97,140 | |
Goodwill | | | 41,585 | | | | — | | | | 18,032 | | | | — | | | | — | | | | — | | | | — | | | | — | | | | 59,617 | |
Property, plant and equipment | | | 8,097,826 | | | | — | | | | 375,059 | | | | — | | | | 132,136 | | | | — | | | | 386 | | | | — | | | | 8,605,407 | |
Right of use assets | | | 164,564 | | | | — | | | | 36,680 | | | | — | | | | — | | | | — | | | | — | | | | — | | | | 201,244 | |
Non-current biological assets | | | 2,925,203 | | | | — | | | | 264,478 | | | | — | | | | — | | | | — | | | | — | | | | — | | | | 3,189,681 | |
Deferred tax assets | | | 5,090 | | | | — | | | | 222 | | | | — | | | | 403 | | | | — | | | | — | | | | — | | | | 5,715 | |
| | | | | | | | | | | | | | | | | | | | | | | | | | | | | | | | | | | | |
Total Non-Current Assets | | | 11,432,062 | | | | 191,767 | | | | 749,044 | | | | 268 | | | | 133,741 | | | | 18 | | | | 126,549 | | | | — | | | | 12,633,449 | |
| | | | | | | | | | | | | | | | | | | | | | | | | | | | | | | | | | | | |
Total Assets | | | 14,258,991 | | | | 210,165 | | | | 1,099,990 | | | | 84,868 | | | | 259,075 | | | | 21,009 | | | | 487,436 | | | | 2,822 | | | | 16,424,356 | |
| | | | | | | | | | | | | | | | | | | | | | | | | | | | | | | | | | | | |
| | | | | | | | | |
June 30, 2021 | | U.S Dollar
ThU.S.$ | | | Euros
ThU.S.$ | | | Brazilian
Real
ThU.S.$ | | | Argentine
Pesos
ThU.S.$ | | | Mexican
Pesos
ThU.S.$ | | | Other
currencies
ThU.S.$ | | | Chilean
Pesos
ThU.S.$ | | | U.F.
ThU.S.$ | | | Total
ThU.S.$ | |
Liabilities | | | | | | | | | | | | | | | | | | | | | | | | | | | | | | | | | | | | |
Current Liabilities | | | | | | | | | | | | | | | | | | | | | | | | | | | | | | | | | | | | |
Other current financial liabilities | | | 354,862 | | | | 31,523 | | | | 804 | | | | — | | | | — | | | | — | | | | — | | | | 42,237 | | | | 429,426 | |
Current lease liabilities | | | 10,050 | | | | 95 | | | | 5,279 | | | | — | | | | 601 | | | | 112 | | | | 31,210 | | | | 10,878 | | | | 58,225 | |
Trade and other current payables | | | 210,161 | | | | 9,811 | | | | 91,719 | | | | 14,970 | | | | 35,196 | | | | 6,343 | | | | 294,143 | | | | 37,883 | | | | 700,226 | |
Accounts payable to related companies | | | 193 | | | | — | | | | — | | | | — | | | | — | | | | — | | | | 3,669 | | | | — | | | | 3,862 | |
Other current provisions | | | 385 | | | | — | | | | — | | | | — | | | | — | | | | — | | | | — | | | | — | | | | 385 | |
Current tax liabilities | | | 22,385 | | | | 8,339 | | | | 9,150 | | | | 12,582 | | | | 3,478 | | | | 24 | | | | 53 | | | | — | | | | 56,011 | |
Current provisions for employee benefits | | | — | | | | — | | | | — | | | | — | | | | — | | | | — | | | | 6,365 | | | | — | | | | 6,365 | |
Other current non-financial liabilities | | | 6,494 | | | | 52 | | | | 26,391 | | | | 3,347 | | | | 6,335 | | | | 1,950 | | | | 5,389 | | | | — | | | | 49,958 | |
| | | | | | | | | | | | | | | | | | | | | | | | | | | | | | | | | | | | |
Total Liabilities, current | | | 604,530 | | | | 49,820 | | | | 133,343 | | | | 30,899 | | | | 45,610 | | | | 8,429 | | | | 340,829 | | | | 90,998 | | | | 1,304,458 | |
| | | | | | | | | | | | | | | | | | | | | | | | | | | | | | | | | | | | |
Non-Current Liabilities | | | | | | | | | | | | | | | | | | | | | | | | | | | | | | | | | | | | |
Other non-current financial liabilities | | | 3,776,195 | | | | 481,237 | | | | 530 | | | | — | | | | — | | | | — | | | | — | | | | 1,122,532 | | | | 5,380,494 | |
Non-current lease liabilities | | | 72,506 | | | | 214 | | | | 21,855 | | | | — | | | | 4,303 | | | | 133 | | | | 28,651 | | | | 9,375 | | | | 137,037 | |
Other non-current provisions | | | 69 | | | | — | | | | 3,234 | | | | 25,974 | | | | — | | | | — | | | | — | | | | — | | | | 29,277 | |
Deferred tax liabilities | | | 1,427,320 | | | | — | | | | 75,691 | | | | — | | | | 6,304 | | | | — | | | | — | | | | — | | | | 1,509,315 | |
Non-current provisions for employee benefits | | | — | | | | — | | | | — | | | | — | | | | 912 | | | | — | | | | 73,013 | | | | — | | | | 73,925 | |
Other non-current non-financial liabilities | | | 15 | | | | — | | | | 85,973 | | | | 13 | | | | — | | | | — | | | | 7 | | | | — | | | | 86,008 | |
| | | | | | | | | | | | | | | | | | | | | | | | | | | | | | | | | | | | |
Total non-current liabilities | | | 5,276,105 | | | | 481,451 | | | | 187,283 | | | | 25,987 | | | | 11,519 | | | | 133 | | | | 101,671 | | | | 1,131,907 | | | | 7,216,056 | |
| | | | | | | | | | | | | | | | | | | | | | | | | | | | | | | | | | | | |
Total Liabilities | | | 5,880,635 | | | | 531,271 | | | | 320,626 | | | | 56,886 | | | | 57,129 | | | | 8,562 | | | | 442,500 | | | | 1,222,905 | | | | 8,520,514 | |
| | | | | | | | | | | | | | | | | | | | | | | | | | | | | | | | | | | | |
53
CELULOSA ARAUCO Y CONSTITUCION S.A. AND SUBSIDIARIES
Unaudited Interim Consolidated Financial Statements
June 30, 2021
Amounts in thousands of U.S. dollars, except as indicated
| | | | | | | | | | | | | | | | | | | | | | | | | | | | | | | | | | | | |
December 31, 2020 | | U.S Dollar
ThU.S.$ | | | Euros
ThU.S.$ | | | Brazilian
Real
ThU.S.$ | | | Argentine
Pesos
ThU.S.$ | | | Mexican
Pesos
ThU.S.$ | | | Other
currencies
ThU.S.$ | | | Chilean
Pesos
ThU.S.$ | | | U.F.
ThU.S.$ | | | Total
ThU.S.$ | |
Assets | | | | | | | | | | | | | | | | | | | | | | | | | | | | | | | | | | | | |
Current Assets | | | | | | | | | | | | | | | | | | | | | | | | | | | | | | | | | | | | |
Cash and Cash Equivalents | | | 773,822 | | | | 3,891 | | | | 127,459 | | | | 62,149 | | | | 43,049 | | | | 5,334 | | | | 49,010 | | | | — | | | | 1,064,714 | |
Other current financial assets | | | 1,763 | | | | — | | | | — | | | | — | | | | — | | | | — | | | | — | | | | — | | | | 1,763 | |
Other current non-financial assets | | | 19,802 | | | | 92 | | | | 28,253 | | | | 5,886 | | | | 572 | | | | 6,147 | | | | 107,845 | | | | — | | | | 168,597 | |
Trade and other current receivables | | | 542,296 | | | | 10,448 | | | | 38,362 | | | | 9,757 | | | | 30,856 | | | | 5,999 | | | | 96,847 | | | | 2,816 | | | | 737,381 | |
Accounts receivable due from related companies | | | 369 | | | | — | | | | 829 | | | | — | | | | — | | | | — | | | | 5,076 | | | | — | | | | 6,274 | |
Current Inventories | | | 847,161 | | | | — | | | | 63,935 | | | | — | | | | 27,183 | | | | — | | | | — | | | | — | | | | 938,279 | |
Current biological assets | | | 246,637 | | | | — | | | | 56,073 | | | | — | | | | — | | | | — | | | | — | | | | — | | | | 302,710 | |
Current tax assets | | | 29,069 | | | | 752 | | | | 2,384 | | | | 1,732 | | | | 3,471 | | | | 667 | | | | 282,655 | | | | — | | | | 320,730 | |
Non-current assets or disposal groups classified as held for sale | | | 2,460,919 | | | | 15,183 | | | | 317,295 | | | | 79,524 | | | | 105,131 | | | | 18,147 | | | | 541,433 | | | | 2,816 | | | | 3,540,448 | |
Non-current assets or disposal groups classified as held for sale | | | 3,815 | | | | — | | | | 15 | | | | — | | | | 47 | | | | — | | | | — | | | | — | | | | 3,877 | |
| | | | | | | | | | | | | | | | | | | | | | | | | | | | | | | | | | | | |
Total Current Assets | | | 2,464,734 | | | | 15,183 | | | | 317,310 | | | | 79,524 | | | | 105,178 | | | | 18,147 | | | | 541,433 | | | | 2,816 | | | | 3,544,325 | |
| | | | | | | | | | | | | | | | | | | | | | | | | | | | | | | | | | | | |
Non-Current Assets | | | | | | | | | | | | | | | | | | | | | | | | | | | | | | | | | | | | |
Other non-current financial assets | | | 28,982 | | | | — | | | | — | | | | — | | | | — | | | | — | | | | — | | | | — | | | | 28,982 | |
Other non-current non-financial assets | | | 1,739 | | | | — | | | | 17,346 | | | | 431 | | | | 692 | | | | 102 | | | | 92,904 | | | | — | | | | 113,214 | |
Trade and other non-current receivables | | | 13,637 | | | | — | | | | 40 | | | | — | | | | — | | | | — | | | | 2,859 | | | | 70 | | | | 16,606 | |
Investments accounted for using equity method | | | 78,108 | | | | 184,191 | | | | 32,402 | | | | — | | | | — | | | | — | | | | 22,238 | | | | — | | | | 316,939 | |
Intangible assets other than goodwill | | | 95,231 | | | | — | | | | 1,675 | | | | — | | | | 22 | | | | — | | | | 5,162 | | | | — | | | | 102,090 | |
Goodwill | | | 42,210 | | | | — | | | | 17,357 | | | | — | | | | — | | | | — | | | | — | | | | — | | | | 59,567 | |
Property, plant and equipment | | | 7,838,893 | | | | — | | | | 349,877 | | | | — | | | | 136,188 | | | | — | | | | 346 | | | | — | | | | 8,325,304 | |
Right of use assets | | | 190,252 | | | | — | | | | 28,882 | | | | — | | | | — | | | | — | | | | — | | | | — | | | | 219,134 | |
Non-current biological assets | | | 3,038,157 | | | | — | | | | 257,960 | | | | — | | | | — | | | | — | | | | — | | | | — | | | | 3,296,117 | |
Deferred tax assets | | | 4,449 | | | | — | | | | 1,168 | | | | — | | | | 424 | | | | — | | | | — | | | | — | | | | 6,041 | |
| | | | | | | | | | | | | | | | | | | | | | | | | | | | | | | | | | | | |
Total Non-Current Assets | | | 11,331,658 | | | | 184,191 | | | | 706,707 | | | | 431 | | | | 137,326 | | | | 102 | | | | 123,509 | | | | 70 | | | | 12,483,994 | |
| | | | | | | | | | | | | | | | | | | | | | | | | | | | | | | | | | | | |
Total Assets | | | 13,796,392 | | | | 199,374 | | | | 1,024,017 | | | | 79,955 | | | | 242,504 | | | | 18,249 | | | | 664,942 | | | | 2,886 | | | | 16,028,319 | |
| | | | | | | | | | | | | | | | | | | | | | | | | | | | | | | | | | | | |
| | | | | | | | | |
December 31, 2020 | | U.S Dollar
ThU.S.$ | | | Euros
ThU.S.$ | | | Brazilian
Real
ThU.S.$ | | | Argentine
Pesos
ThU.S.$ | | | Mexican
Pesos
ThU.S.$ | | | Other
currencies
ThU.S.$ | | | Chilean
Pesos
ThU.S.$ | | | U.F.
ThU.S.$ | | | Total
ThU.S.$ | |
Liabilities | | | | | | | | | | | | | | | | | | | | | | | | | | | | | | | | | | | | |
Current Liabilities | | | | | | | | | | | | | | | | | | | | | | | | | | | | | | | | | | | | |
Other current financial liabilities | | | 230,230 | | | | 32,697 | | | | 753 | | | | — | | | | — | | | | — | | | | — | | | | 43,456 | | | | 307,136 | |
Current lease liabilities | | | 13,687 | | | | 84 | | | | 3,292 | | | | — | | | | 426 | | | | 148 | | | | 32,554 | | | | 13,449 | | | | 63,640 | |
Trade and other current payables | | | 153,860 | | | | 11,924 | | | | 80,607 | | | | 11,336 | | | | 26,400 | | | | 7,485 | | | | 298,908 | | | | 35,984 | | | | 626,504 | |
Accounts payable to related companies | | | 236 | | | | — | | | | — | | | | — | | | | — | | | | — | | | | 3,503 | | | | — | | | | 3,739 | |
Other current provisions | | | 386 | | | | — | | | | — | | | | — | | | | — | | | | — | | | | — | | | | — | | | | 386 | |
Current tax liabilities | | | 152 | | | | — | | | | 5,298 | | | | — | | | | 190 | | | | 24 | | | | 39,008 | | | | — | | | | 44,672 | |
Current provisions for employee benefits | | | — | | | | — | | | | — | | | | — | | | | — | | | | — | | | | 6,786 | | | | — | | | | 6,786 | |
Other current non-financial liabilities | | | 6,616 | | | | 58 | | | | 25,726 | | | | 4,118 | | | | 2,382 | | | | 1,319 | | | | 4,511 | | | | — | | | | 44,730 | |
Total Liabilities, current | | | 405,167 | | | | 44,763 | | | | 115,676 | | | | 15,454 | | | | 29,398 | | | | 8,976 | | | | 385,270 | | | | 92,889 | | | | 1,097,593 | |
Non-Current Liabilities | | | | | | | | | | | | | | | | | | | | | | | | | | | | | | | | | | | | |
Other non-current financial liabilities | | | 4,070,126 | | | | 498,484 | | | | 657 | | | | — | | | | — | | | | — | | | | — | | | | 1,145,461 | | | | 5,714,728 | |
Non-current lease liabilities | | | 74,135 | | | | 230 | | | | 14,833 | | | | — | | | | 218 | | | | 171 | | | | 44,604 | | | | 13,924 | | | | 148,115 | |
Other non-current provisions | | | — | | | | — | | | | 4,238 | | | | 26,212 | | | | — | | | | — | | | | — | | | | — | | | | 30,450 | |
Deferred tax liabilities | | | 1,388,713 | | | | — | | | | 68,788 | | | | — | | | | 6,385 | | | | — | | | | — | | | | — | | | | 1,463,886 | |
Non-current provisions for employee benefits | | | — | | | | — | | | | — | | | | — | | | | 1,069 | | | | — | | | | 73,540 | | | | — | | | | 74,609 | |
Other non-current non-financial liabilities | | | 29 | | | | — | | | | 83,249 | | | | 14 | | | | — | | | | — | | | | 11 | | | | — | | | | 83,303 | |
| | | | | | | | | | | | | | | | | | | | | | | | | | | | | | | | | | | | |
Total non-current liabilities | | | 5,533,003 | | | | 498,714 | | | | 171,765 | | | | 26,226 | | | | 7,672 | | | | 171 | | | | 118,155 | | | | 1,159,385 | | | | 7,515,091 | |
| | | | | | | | | | | | | | | | | | | | | | | | | | | | | | | | | | | | |
Total Liabilities | | | 5,938,170 | | | | 543,477 | | | | 287,441 | | | | 41,680 | | | | 37,070 | | | | 9,147 | | | | 503,425 | | | | 1,252,274 | | | | 8,612,684 | |
| | | | | | | | | | | | | | | | | | | | | | | | | | | | | | | | | | | | |
54
CELULOSA ARAUCO Y CONSTITUCION S.A. AND SUBSIDIARIES
Unaudited Interim Consolidated Financial Statements
June 30, 2021
Amounts in thousands of U.S. dollars, except as indicated
| | | | | | | | | | | | | | | | | | | | | | | | |
| | | 06-30-2021 | | | 12-31-2020 | |
| | | Up to 90
days
ThU.S.$ | | | From 91
days
to 1 year
ThU.S.$ | | | Total
ThU.S.$ | | | Up to 90
days
ThU.S.$ | | | From 91
days
to 1 year
ThU.S.$ | | | Total
ThU.S.$ | |
Total Liabilities, current | | | 873,576 | | | | 430,882 | | | | 1,304,458 | | | | 765,176 | | | | 332,417 | | | | 1,097,593 | |
| | | | | | |
Other current financial liabilities | | | 62,408 | | | | 367,018 | | | | 429,426 | | | | 63,605 | | | | 243,531 | | | | 307,136 | |
U.S Dollar | | | 61,833 | | | | 293,029 | | | | 354,862 | | | | 63,509 | | | | 166,721 | | | | 230,230 | |
Euros | | | — | | | | 31,523 | | | | 31,523 | | | | — | | | | 32,697 | | | | 32,697 | |
Brazilian Real | | | 575 | | | | 229 | | | | 804 | | | | 96 | | | | 657 | | | | 753 | |
U.F. | | | — | | | | 42,237 | | | | 42,237 | | | | — | | | | 43,456 | | | | 43,456 | |
| | | | | | |
Bank Loans | | | 30,356 | | | | 183,281 | | | | 213,637 | | | | 30,774 | | | | 184,660 | | | | 215,434 | |
U.S Dollar | | | 29,781 | | | | 151,529 | | | | 181,310 | | | | 30,678 | | | | 151,306 | | | | 181,984 | |
Euros | | | — | | | | 31,523 | | | | 31,523 | | | | — | | | | 32,697 | | | | 32,697 | |
Brazilian Real | | | 575 | | | | 229 | | | | 804 | | | | 96 | | | | 657 | | | | 753 | |
| | | | | | |
Other Loans | | | 32,052 | | | | 183,737 | | | | 215,789 | | | | 32,831 | | | | 58,871 | | | | 91,702 | |
U.S Dollar | | | 32,052 | | | | 141,500 | | | | 173,552 | | | | 32,831 | | | | 15,415 | | | | 48,246 | |
U.F. | | | — | | | | 42,237 | | | | 42,237 | | | | — | | | | 43,456 | | | | 43,456 | |
| | | | | | |
Current lease liabilities | | | 15,774 | | | | 42,451 | | | | 58,225 | | | | 18,631 | | | | 45,009 | | | | 63,640 | |
U.S Dollar | | | 3,044 | | | | 7,006 | | | | 10,050 | | | | 4,675 | | | | 9,012 | | | | 13,687 | |
Euros | | | 24 | | | | 71 | | | | 95 | | | | 23 | | | | 61 | | | | 84 | |
Brazilian Real | | | 1,501 | | | | 3,778 | | | | 5,279 | | | | 823 | | | | 2,469 | | | | 3,292 | |
Mexican Pesos | | | 333 | | | | 268 | | | | 601 | | | | 293 | | | | 133 | | | | 426 | |
Other currencies | | | 38 | | | | 74 | | | | 112 | | | | 37 | | | | 111 | | | | 148 | |
Chilean Pesos | | | 7,671 | | | | 23,539 | | | | 31,210 | | | | 8,578 | | | | 23,976 | | | | 32,554 | |
U.F. | | | 3,163 | | | | 7,715 | | | | 10,878 | | | | 4,202 | | | | 9,247 | | | | 13,449 | |
| | | | | | |
Trade and other current payables | | | 681,418 | | | | 18,808 | | | | 700,226 | | | | 585,428 | | | | 41,076 | | | | 626,504 | |
U.S Dollar | | | 210,161 | | | | — | | | | 210,161 | | | | 153,856 | | | | 4 | | | | 153,860 | |
Euros | | | 9,811 | | | | — | | | | 9,811 | | | | 11,924 | | | | — | | | | 11,924 | |
Brazilian Real | | | 72,995 | | | | 18,724 | | | | 91,719 | | | | 39,596 | | | | 41,011 | | | | 80,607 | |
Argentine Pesos | | | 14,970 | | | | — | | | | 14,970 | | | | 11,336 | | | | — | | | | 11,336 | |
Mexican Pesos | | | 35,112 | | | | 84 | | | | 35,196 | | | | 26,339 | | | | 61 | | | | 26,400 | |
Other currencies | | | 6,343 | | | | — | | | | 6,343 | | | | 7,485 | | | | — | | | | 7,485 | |
Chilean Pesos | | | 294,143 | | | | — | | | | 294,143 | | | | 298,908 | | | | — | | | | 298,908 | |
U.F. | | | 37,883 | | | | — | | | | 37,883 | | | | 35,984 | | | | — | | | | 35,984 | |
| | | | | | |
Accounts payable to related companies | | | 3,862 | | | | — | | | | 3,862 | | | | 3,739 | | | | — | | | | 3,739 | |
U.S Dollar | | | 193 | | | | — | | | | 193 | | | | 236 | | | | — | | | | 236 | |
Chilean Pesos | | | 3,669 | | | | — | | | | 3,669 | | | | 3,503 | | | | — | | | | 3,503 | |
| | | | | | |
Other current provisions | | | 385 | | | | — | | | | 385 | | | | 384 | | | | 2 | | | | 386 | |
U.S Dollar | | | 385 | | | | — | | | | 385 | | | | 384 | | | | 2 | | | | 386 | |
Current tax liabilities | | | 54,037 | | | | 1,974 | | | | 56,011 | | | | 42,580 | | | | 2,092 | | | | 44,672 | |
| | | | | | |
U.S Dollar | | | 22,383 | | | | 2 | | | | 22,385 | | | | 152 | | | | — | | | | 152 | |
Euro | | | 8,339 | | | | — | | | | 8,339 | | | | | | | | | | | | | |
Brazilian Real | | | 7,178 | | | | 1,972 | | | | 9,150 | | | | 5,298 | | | | — | | | | 5,298 | |
Argentine Pesos | | | 12,582 | | | | — | | | | 12,582 | | | | | | | | | | | | | |
Mexican Pesos | | | 3,478 | | | | — | | | | 3,478 | | | | 190 | | | | — | | | | 190 | |
Other currencies | | | 24 | | | | — | | | | 24 | | | | 24 | | | | — | | | | 24 | |
Chilean Pesos | | | 53 | | | | — | | | | 53 | | | | 36,916 | | | | 2,092 | | | | 39,008 | |
Current provisions for employee benefits | | | 5,734 | | | | 631 | | | | 6,365 | | | | 6,079 | | | | 707 | | | | 6,786 | |
| | | | | | |
Chilean Pesos | | | 5,734 | | | | 631 | | | | 6,365 | | | | 6,079 | | | | 707 | | | | 6,786 | |
Other current non-financial liabilities | | | 49,958 | | | | — | | | | 49,958 | | | | 44,730 | | | | — | | | | 44,730 | |
| | | | | | |
U.S Dollar | | | 6,494 | | | | — | | | | 6,494 | | | | 6,616 | | | | — | | | | 6,616 | |
Euros | | | 52 | | | | — | | | | 52 | | | | 58 | | | | — | | | | 58 | |
Brazilian Real | | | 26,391 | | | | — | | | | 26,391 | | | | 25,726 | | | | — | | | | 25,726 | |
Argentine Pesos | | | 3,347 | | | | — | | | | 3,347 | | | | 4,118 | | | | — | | | | 4,118 | |
Mexican Pesos | | | 6,335 | | | | — | | | | 6,335 | | | | 2,382 | | | | — | | | | 2,382 | |
Other currencies | | | 1,950 | | | | — | | | | 1,950 | | | | 1,319 | | | | — | | | | 1,319 | |
Chilean Pesos | | | 5,389 | | | | — | | | | 5,389 | | | | 4,511 | | | | — | | | | 4,511 | |
55
CELULOSA ARAUCO Y CONSTITUCION S.A. AND SUBSIDIARIES
Unaudited Interim Consolidated Financial Statements
June 30, 2021
Amounts in thousands of U.S. dollars, except as indicated
| | | | | | | | | | | | | | | | | | | | | | | | | | | | | | | | |
| | | 06-30-2021 | | | 12-31-2020 | |
| | | From 13
months to 3
years
ThU.S.$ | | | From 3
years to
5 years
ThU.S.$ | | | More than
5 years
ThU.S.$ | | | Total
ThU.S.$ | | | From 13
months to 3
years
ThU.S.$ | | | From 3
years to
5 years
ThU.S.$ | | | More than
5 years
ThU.S.$ | | | Total
ThU.S.$ | |
Total non-current liabilities | | | 2,031,467 | | | | 464,293 | | | | 4,720,296 | | | | 7,216,056 | | | | 1,789,288 | | | | 971,281 | | | | 4,754,522 | | | | 7,515,091 | |
| | | | | | | | |
Other non-current financial liabilities | | | 937,478 | | | | 404,174 | | | | 4,038,842 | | | | 5,380,494 | | | | 726,206 | | | | 919,591 | | | | 4,068,931 | | | | 5,714,728 | |
U.S Dollar | | | 730,355 | | | | 195,867 | | | | 2,849,973 | | | | 3,776,195 | | | | 515,399 | | | | 706,525 | | | | 2,848,202 | | | | 4,070,126 | |
Euros | | | 119,480 | | | | 120,635 | | | | 241,122 | | | | 481,237 | | | | 122,891 | | | | 125,247 | | | | 250,346 | | | | 498,484 | |
Brazilian Real | | | 530 | | | | — | | | | — | | | | 530 | | | | 657 | | | | — | | | | — | | | | 657 | |
U.F. | | | 87,113 | | | | 87,672 | | | | 947,747 | | | | 1,122,532 | | | | 87,259 | | | | 87,819 | | | | 970,383 | | | | 1,145,461 | |
| | | | | | | | |
Bank Loans | | | 241,981 | | | | 315,635 | | | | 241,122 | | | | 798,738 | | | | 473,233 | | | | 335,247 | | | | 250,346 | | | | 1,058,826 | |
U.S Dollar | | | 121,971 | | | | 195,000 | | | | — | | | | 316,971 | | | | 349,685 | | | | 210,000 | | | | — | | | | 559,685 | |
Euros | | | 119,480 | | | | 120,635 | | | | 241,122 | | | | 481,237 | | | | 122,891 | | | | 125,247 | | | | 250,346 | | | | 498,484 | |
Brazilian Real | | | 530 | | | | — | | | | — | | | | 530 | | | | 657 | | | | — | | | | — | | | | 657 | |
| | | | | | | | |
Other Loans | | | 695,497 | | | | 88,539 | | | | 3,797,720 | | | | 4,581,756 | | | | 252,973 | | | | 584,344 | | | | 3,818,585 | | | | 4,655,902 | |
U.S Dollar | | | 608,384 | | | | 867 | | | | 2,849,973 | | | | 3,459,224 | | | | 165,714 | | | | 496,525 | | | | 2,848,202 | | | | 3,510,441 | |
U.F. | | | 87,113 | | | | 87,672 | | | | 947,747 | | | | 1,122,532 | | | | 87,259 | | | | 87,819 | | | | 970,383 | | | | 1,145,461 | |
Non-current lease liabilities | | | 67,997 | | | | 26,798 | | | | 42,242 | | | | 137,037 | | | | 85,964 | | | | 21,906 | | | | 40,245 | | | | 148,115 | |
U.S Dollar | | | 20,758 | | | | 14,852 | | | | 36,896 | | | | 72,506 | | | | 22,935 | | | | 15,787 | | | | 35,413 | | | | 74,135 | |
Euros | | | 181 | | | | 33 | | | | — | | | | 214 | | | | 168 | | | | 62 | | | | — | | | | 230 | |
Brazilian Real | | | 8,217 | | | | 8,386 | | | | 5,252 | | | | 21,855 | | | | 5,452 | | | | 4,842 | | | �� | 4,539 | | | | 14,833 | |
Mexican Pesos | | | 3,278 | | | | 1,025 | | | | — | | | | 4,303 | | | | 218 | | | | — | | | | — | | | | 218 | |
Other currencies | | | 121 | | | | 12 | | | | — | | | | 133 | | | | 141 | | | | 30 | | | | — | | | | 171 | |
Chilean Pesos | | | 28,062 | | | | 589 | | | | — | | | | 28,651 | | | | 44,604 | | | | — | | | | — | | | | 44,604 | |
U.F. | | | 7,380 | | | | 1,901 | | | | 94 | | | | 9,375 | | | | 12,446 | | | | 1,185 | | | | 293 | | | | 13,924 | |
| | | | | | | | |
Other non-current provisions | | | 29,277 | | | | — | | | | — | | | | 29,277 | | | | 30,450 | | | | — | | | | — | | | | 30,450 | |
U.S Dollar | | | 69 | | | | — | | | | | | | | 69 | | | | | | | | | | | | | | | | | |
Brazilian Real | | | 3,234 | | | | — | | | | — | | | | 3,234 | | | | 4,238 | | | | — | | | | — | | | | 4,238 | |
Argentine Pesos | | | 25,974 | | | | — | | | | — | | | | 25,974 | | | | 26,212 | | | | — | | | | — | | | | 26,212 | |
| | | | | | | | |
Deferred tax liabilities | | | 880,640 | | | | 5,364 | | | | 623,311 | | | | 1,509,315 | | | | 840,171 | | | | — | | | | 623,715 | | | | 1,463,886 | |
U.S Dollar | | | 804,009 | | | | — | | | | 623,311 | | | | 1,427,320 | | | | 764,998 | | | | — | | | | 623,715 | | | | 1,388,713 | |
Brazilian Real | | | 70,327 | | | | 5,364 | | | | — | | | | 75,691 | | | | 68,788 | | | | — | | | | — | | | | 68,788 | |
Mexican Pesos | | | 6,304 | | | | — | | | | — | | | | 6,304 | | | | 6,385 | | | | — | | | | — | | | | 6,385 | |
| | | | | | | | |
Non-current provisions for employee benefits | | | 73,883 | | | | 42 | | | | — | | | | 73,925 | | | | 74,336 | | | | 273 | | | | — | | | | 74,609 | |
Mexican Pesos | | | 870 | | | | 42 | | | | — | | | | 912 | | | | 796 | | | | 273 | | | | — | | | | 1,069 | |
Chilean Pesos | | | 73,013 | | | | — | | | | — | | | | 73,013 | | | | 73,540 | | | | — | | | | — | | | | 73,540 | |
| | | | | | | | |
Other non-current non-financial liabilities | | | 42,192 | | | | 27,915 | | | | 15,901 | | | | 86,008 | | | | 32,161 | | | | 29,511 | | | | 21,631 | | | | 83,303 | |
U.S Dollar | | | 15 | | | | — | | | | — | | | | 15 | | | | 29 | | | | — | | | | — | | | | 29 | |
Brazilian Real | | | 42,157 | | | | 27,915 | | | | 15,901 | | | | 85,973 | | | | 32,107 | | | | 29,511 | | | | 21,631 | | | | 83,249 | |
Argentine Pesos | | | 13 | | | | — | | | | — | | | | 13 | | | | 14 | | | | — | | | | — | | | | 14 | |
Chilean Pesos | | | 7 | | | | — | | | | — | | | | 7 | | | | 11 | | | | — | | | | — | | | | 11 | |
| | | | | | | | | | | | | | | | | | | | | | | | | | | | | | | | |
56
CELULOSA ARAUCO Y CONSTITUCION S.A. AND SUBSIDIARIES
Unaudited Interim Consolidated Financial Statements
June 30, 2021
Amounts in thousands of U.S. dollars, except as indicated
The table below sets forth the subsidiaries that have determined a functional currency other than the U.S. Dollar as follows:
| | | | |
Subsidiary | | Country | | Functional Currency |
| Arauco Canada Ltd. | | Canada | | Canadian Dollar |
| Arauco do Brasil S.A. | | Brazil | | Brazilian Real |
| Arauco Florestal Arapoti S.A. | | Brazil | | Brazilian Real |
| Arauco Forest Brasil S.A. | | Brazil | | Brazilian Real |
| Arauco Industria de Mexico, S.A. de C.V. | | Mexico | | Mexican pesos |
| Arauco Industria de Paineis S.A. | | Brazil | | Brazilian Real |
| Arauco Quimica S.A. de C.V. | | Mexico | | Mexican pesos |
| Arauco Serviquimex, S.A. de C.V. | | Mexico | | Mexican pesos |
| Araucomex Servicios, S.A. de C.V. | | Mexico | | Mexican pesos |
| Consorcio Protección Fitosanitaria Forestal S.A. | | Chile | | Chilean Pesos |
| Empreendimentos Florestais Santa Cruz Ltda. | | Brazil | | Brazilian Real |
| Leasing Forestal S.A. | | Argentina | | Argentine pesos |
| Mahal Empreendimentos e Participacoes S.A. | | Brazil | | Brazilian Real |
| Novo Oeste Gestao de Ativos Florestais S.A. | | Brazil | | Brazilian Real |
| ODD Industries SpA | | Chile | | Chilean pesos |
| Tablered Araucomex, S.A. de C.V. | | Mexico | | Mexican pesos |
The table below shows a detail per company of the effect in the period of the Reserve of Exchange Differences on translation:
| | | | | | | | | | | | | | | | |
| | | January - June | | | April - June | |
| | | 2021 | | | 2020 | | | 2021 | | | 2020 | |
| | | ThU.S.$ | | | ThU.S.$ | | | ThU.S.$ | | | ThU.S.$ | |
Arauco do Brasil S.A. | | | 14,720 | | | | (107,725 | ) | | | 45,050 | | | | (16,848 | ) |
Arauco Forest Brasil S.A. | | | 12,340 | | | | (99,354 | ) | | | 39,613 | | | | (14,733 | ) |
Sonae Arauco S.A. | | | (6,649 | ) | | | 225 | | | | 1,486 | | | | 3,765 | |
Arauco Florestal Arapoti S.A. | | | 2,813 | | | | (25,057 | ) | | | 8,809 | | | | (3,617 | ) |
Arauco Industria México S.A. de C.V. | | | 1,694 | | | | (36,176 | ) | | | 6,733 | | | | 7,218 | |
Arauco Canada Ltd. | | | 4,543 | | | | (7,002 | ) | | | 1,896 | | | | 7,675 | |
Others | | | 57 | | | | (919 | ) | | | 644 | | | | 321 | |
| | | | | | | | | | | | | | | | |
Total reserve of exchange differences on translation | | | 29,518 | | | | (276,008 | ) | | | 104,231 | | | | (16,219 | ) |
| | | | | | | | | | | | | | | | |
Effect of foreign exchange rates changes
| | | | | | | | | | | | | | | | |
| | | January - June | | | April - June | |
| | | 2021 | | | 2020 | | | 2021 | | | 2020 | |
| | | ThU.S.$ | | | ThU.S.$ | | | ThU.S.$ | | | ThU.S.$ | |
Exchange differences recognized in profit or loss, except for those arising on financial instruments measured at fair value through profit or loss | | | (5,288 | ) | | | (27,552 | ) | | | (2,709 | ) | | | (25,234 | ) |
| | | | | | | | �� | | | | | | | | |
Reserve of exchange differences on translation (with Non-controlling interests) | | | 24,736 | | | | (281,392 | ) | | | 106,553 | | | | (17,003 | ) |
| | | | | | | | | | | | | | | | |
NOTE 12. BORROWING COSTS
Arauco capitalizes interest at effective rate on current investment projects.
At the date of issuance of these interim consolidated financial statements, Arauco has capitalized financial interest related to the modernization and extension of Planta Arauco (MAPA).
| | | | | | | | | | | | | | | | |
| | | January – June | | | April - June | |
| | | 2021 | | | 2020 | | | 2021 | | | 2020 | |
| | | ThU.S.$ | | | ThU.S.$ | | | ThU.S.$ | | | ThU.S.$ | |
| Property, plant and equipment capitalized cost | | | | | | | | | | | | |
Property, plant and equipment capitalized interest cost rate | | | 4.65 | % | | | 4.65 | % | | | 4.64 | % | | | 4.67 | % |
Amount of the capitalized interest cost, property, plant and equipment | | | 32,267 | | | | 17,982 | | | | 17,300 | | | | 9,487 | |
| | | | | | | | | | | | | | | | |
57
CELULOSA ARAUCO Y CONSTITUCION S.A. AND SUBSIDIARIES
Unaudited Interim Consolidated Financial Statements
June 30, 2021
Amounts in thousands of U.S. dollars, except as indicated
NOTE 13. RELATED PARTIES
Related Party Disclosures
Related parties are those entities defined in IAS 24 and under the rules of the Chilean Commission for the Financial Market and the Chilean Corporations Law.
The receivable and payable amounts among related parties at the end of each period correspond to commercial and financing transactions denominated in Chilean Pesos, U.S. dollars and Brazilian Real, where collection or payment deadlines are shown in the following tables and in general do not bear interest, except for financing transactions.
As of the date of these interim consolidated financial statements, the main transactions with related parties are related to fuel purchases with Compañía de Petróleos de Chile S.A. and sodium chlorate purchases at EKA Chile S.A.
As of the date of these interim consolidated financial statements, there are neither provisions for accounts of doubtful collection nor any guarantees granted or received related to the balances with related parties.
Name of Group’s Main Shareholders
The ultimate shareholders of Arauco, direct and indirectly, are Mr. Roberto Angelini Rossi and Mrs. Patricia Angelini Rossi.
Name of the Intermediate Controlling Entity that Produces Consolidated Financial Statements for Public Use
Empresas Copec S.A.
Compensation to Key Management Personnel
Compensation to key management personnel, including directors, managers and deputy managers, consist of a fixed monthly salary, and managers and deputy managers also receive an annual bonus subject to the results of the Company and the fulfillment of goals of the business as well as individual performance.
Pricing Strategy Terms and Conditions Corresponding to Transactions with Related Parties
Transactions carried out with related parties are intended to contribute to the corporate interest, are adjusted in price, terms and conditions to those prevailing in the market at the time of approval, and meet the requirements and procedures set forth in the law.
58
CELULOSA ARAUCO Y CONSTITUCION S.A. AND SUBSIDIARIES
Unaudited Interim Consolidated Financial Statements
June 30, 2021
Amounts in thousands of U.S. dollars, except as indicated
The table below sets forth information about the Relationship between the Parent Company and its Subsidiaries
| | | | | | | | | | | | | | | | | | | | | | | | | | | | | | |
| | | | | | | Functional | | % Ownership interest
06-30-2021 | | | % Ownership interest
12-31-2020 | |
| ID N° | | Company Name | | Country | | Currency | | Direct | | | Indirect | | | Total | | | Direct | | | Indirect | | | Total | |
| - | | Agenciamiento y Servicios Profesionales S.A. | | Mexico | | U.S. Dollar | | | 0.0020 | | | | 99.9970 | | | | 99.9990 | | | | 0.0020 | | | | 99.9970 | | | | 99.9990 | |
| - | | Arauco Argentina S.A. | | Argentina | | U.S. Dollar | | | 9.9707 | | | | 90.0093 | | | | 99.9800 | | | | 9.9707 | | | | 90.0093 | | | | 99.9800 | |
| - | | Arauco Australia Pty Ltd. | | Australia | | U.S. Dollar | | | — | | | | 99.9990 | | | | 99.9990 | | | | — | | | | 99.9990 | | | | 99.9990 | |
| 96547510-9 | | Arauco Bioenergía S.A. | | Chile | | U.S. Dollar | | | 98.0000 | | | | 1.9990 | | | | 99.9990 | | | | 98.0000 | | | | 1.9990 | | | | 99.9990 | |
| - | | Arauco Canada Ltd. | | Canada | | Canadian
Dollar | | | — | | | | 99.9990 | | | | 99.9990 | | | | — | | | | 99.9990 | | | | 99.9990 | |
| - | | Arauco Colombia S.A. | | Colombia | | U.S. Dollar | | | 1.4778 | | | | 98.5204 | | | | 99.9982 | | | | 1.4778 | | | | 98.5204 | | | | 99.9982 | |
| - | | Arauco do Brasil S.A. | | Brazil | | Brazilian
Real | | | 1.0681 | | | | 98.9309 | | | | 99.9990 | | | | 1.0681 | | | | 98.9309 | | | | 99.9990 | |
| - | | Arauco Europe Cooperatief U.A. | | Netherlands | | U.S. Dollar | | | 0.5215 | | | | 99.4775 | | | | 99.9990 | | | | 0.5215 | | | | 99.4775 | | | | 99.9990 | |
| - | | Arauco Florestal Arapoti S.A. | | Brazil | | Brazilian
Real | | | — | | | | 79.9992 | | | | 79.9992 | | | | — | | | | 79.9992 | | | | 79.9992 | |
| - | | Arauco Forest Brasil S.A. | | Brazil | | Brazilian
Real | | | 10.0809 | | | | 89.9182 | | | | 99.9991 | | | | 10.0809 | | | | 89.9182 | | | | 99.9991 | |
| - | | Arauco Industria de México, S.A.de C.V. | | Mexico | | Mexican
pesos | | | — | | | | 99.9990 | | | | 99.9990 | | | | — | | | | 99.9990 | | | | 99.9990 | |
| - | | Arauco Industria de Paineis Ltda. | | Brazil | | Brazilian
Real | | | — | | | | 99.9990 | | | | 99.9990 | | | | — | | | | 99.9990 | | | | 99.9990 | |
| - | | Arauco Middle East DMCC | | Dubai | | U.S. Dollar | | | — | | | | 99.9990 | | | | 99.9990 | | | | — | | | | 99.9990 | | | | 99.9990 | |
| - | | Arauco North America, Inc. | | United
States | | U.S. Dollar | | | 0.0001 | | | | 99.9989 | | | | 99.9990 | | | | 0.0001 | | | | 99.9989 | | | | 99.9990 | |
| 76620842-8 | | Arauco Nutrientes Naturales SPA | | Chile | | U.S. Dollar | | | — | | | | — | | | | — | | | | — | | | | 99.9484 | | | | 99.9484 | |
| - | | Arauco Perú S.A. | | Perú | | U.S. Dollar | | | 0.0013 | | | | 99.9977 | | | | 99.9990 | | | | 0.0013 | | | | 99.9977 | | | | 99.9990 | |
| - | | Arauco Química S.A. de C.V. | | Mexico | | Mexican
pesos | | | — | | | | 99.9990 | | | | 99.9990 | | | | — | | | | 99.9990 | | | | 99.9990 | |
| - | | Arauco Serviquimex, S.A. de C.V. | | Mexico | | Mexican
pesos | | | — | | | | 99.9990 | | | | 99.9990 | | | | — | | | | 99.9990 | | | | 99.9990 | |
| - | | Arauco Wood (China) Company Limited | | China | | U.S. Dollar | | | — | | | | 99.9990 | | | | 99.9990 | | | | — | | | | 99.9990 | | | | 99.9990 | |
| - | | Araucomex S.A. de C.V. | | Mexico | | U.S. Dollar | | | 0.0005 | | | | 99.9985 | | | | 99.9990 | | | | 0.0005 | | | | 99.9985 | | | | 99.9990 | |
| - | | Araucomex Servicios, S.A. de C.V. | | Mexico | | Mexican
pesos | | | — | | | | 99.9990 | | | | 99.9990 | | | | — | | | | 99.9990 | | | | 99.9990 | |
| 96657900-5 | | Consorcio Protección Fitosanitaria Forestal S.A. | | Chile | | Chilean
Pesos | | | — | | | | 56.4474 | | | | 56.4474 | | | | — | | | | 57.0831 | | | | 57.0831 | |
| - | | Empreendimentos Florestais Santa Cruz Ltda. | | Brazil | | Brazilian
Real | | | — | | | | 99.9984 | | | | 99.9984 | | | | — | | | | 99.9984 | | | | 99.9984 | |
| 85805200-9 | | Forestal Arauco S.A. | | Chile | | U.S. Dollar | | | 99.9484 | | | | — | | | | 99.9484 | | | | 99.9484 | | | | — | | | | 99.9484 | |
| 93838000-7 | | Forestal Cholguán S.A. | | Chile | | U.S. Dollar | | | — | | | | 98.5701 | | | | 98.5701 | | | | — | | | | 98.5683 | | | | 98.5683 | |
| 78049140-K | | Forestal Los Lagos S.A. | | Chile | | U.S. Dollar | | | — | | | | — | | | | — | | | | — | | | | 79.9587 | | | | 79.9587 | |
| 96563550-5 | | Inversiones Arauco Internacional Ltda. | | Chile | | U.S. Dollar | | | 98.0186 | | | | 1.9804 | | | | 99.9990 | | | | 98.0186 | | | | 1.9804 | | | | 99.9990 | |
| 79990550-7 | | Investigaciones Forestales Bioforest S.A. | | Chile | | U.S. Dollar | | | 1.0000 | | | | 98.9489 | | | | 99.9489 | | | | 1.0000 | | | | 98.9489 | | | | 99.9489 | |
| - | | Leasing Forestal S.A. | | Argentina | | Argentine
pesos | | | — | | | | 99.9800 | | | | 99.9800 | | | | — | | | | 99.9800 | | | | 99.9800 | |
| - | | Maderas Arauco Costa Rica S.A. | | Costa Rica | | U.S. Dollar | | | — | | | | 99.9990 | | | | 99.9990 | | | | — | | | | 99.9990 | | | | 99.9990 | |
| 96510970-6 | | Maderas Arauco S.A. | | Chile | | U.S. Dollar | | | 99.0000 | | | | 0.9995 | | | | 99.9995 | | | | 99.0000 | | | | 0.9995 | | | | 99.9995 | |
| - | | Mahal Empreendimentos e Participacoes S.A. | | Brazil | | Brazilian
Real | | | — | | | | 99.9990 | | | | 99.9990 | | | | — | | | | 99.9990 | | | | 99.9990 | |
| - | | Novo Oeste Gestao de Ativos Florestais S.A. | | Brazil | | Brazilian
Real | | | — | | | | 99.9990 | | | | 99.9990 | | | | — | | | | 99.9990 | | | | 99.9990 | |
| 76860724-9 | | ODD Industries SpA | | Chile | | Chilean
Pesos | | | — | | | | 86.6151 | | | | 86.6151 | | | | — | | | | 86.6151 | | | | 86.6151 | |
| - | | Prime-Line, Inc. | | United
States | | U.S. Dollar | | | — | | | | 99.9990 | | | | 99.9990 | | | | — | | | | 99.9990 | | | | 99.9990 | |
| 76375371-9 | | Servicios Aéreos Forestales Ltda. | | Chile | | U.S. Dollar | | | 0.0100 | | | | 99.9890 | | | | 99.9990 | | | | 0.0100 | | | | 99.9890 | | | | 99.9990 | |
| 96637330-K | | Servicios Logísticos Arauco S.A. | | Chile | | U.S. Dollar | | | 45.0000 | | | | 54.9997 | | | | 99.9997 | | | | 45.0000 | | | | 54.9997 | | | | 99.9997 | |
| - | | Tablered Araucomex, S.A. de C.V. | | Mexico | | Mexican
pesos | | | — | | | | 99.9990 | | | | 99.9990 | | | | — | | | | 99.9990 | | | | 99.9990 | |
| | | | | | | | | | | | | | | | | | | | | | | | | | | | | | |
The companies in the table below are classified as joint operations in accordance with IFRS 11. The assets, liabilities, income and expenses are recorded in relation to the Company’s ownership percentage in accordance with accounting standards applicable in each case.
| | | | |
Company Name | | Country | | Functional
Currency |
| Eufores S.A. | | Uruguay | | U.S. Dollar |
| Celulosa y Energía Punta Pereira S.A. | | Uruguay | | U.S. Dollar |
| Zona Franca Punta Pereira S.A. | | Uruguay | | U.S. Dollar |
| Forestal Cono Sur S.A. | | Uruguay | | U.S. Dollar |
| Stora Enso Uruguay S.A. | | Uruguay | | U.S. Dollar |
| El Esparragal Asociación Agraria de R.L. | | Uruguay | | U.S. Dollar |
| Ongar S.A. | | Uruguay | | U.S. Dollar |
| Terminal Logística e Industrial M’Bopicua S.A. | | Uruguay | | U.S. Dollar |
According to significant restrictions on the ability of subsidiaries to transfer funds to Arauco, in the form of cash dividends or repayment of loans and/or advances, we state the following:
59
CELULOSA ARAUCO Y CONSTITUCION S.A. AND SUBSIDIARIES
Unaudited Interim Consolidated Financial Statements
June 30, 2021
Amounts in thousands of U.S. dollars, except as indicated
Long-term debt with related entities - Mutual Agreement with Arauco Argentina S.A.
On June 5, 2017, Arauco signed a mutual agreement with its subsidiary Arauco Argentina S.A, pursuant to which this Company received an amount of U.S.$ 250,000,000, which accrues accrues a interest at the LIBOR interest rate for 180 days plus a fixed spread of 5.20%, with payments every six months on June 1 and December 1 of each year.
During 2020, the Central Bank of the Argentine Republic established certain foreign exchange controls, preventing Arauco Argentina S.A. from making two principal payments for ThU.S.$ 12,500 each, both due during 2020. Under those circumstances, Arauco agreed to reschedule the maturity of the principal repayments that became due in 2020 to May 30, 2021. The principal amount rescheduled will accrue interest at LIBOR rate until the moment of its total or partial payment. As of June 30, 2021, the total principal outstanding under the mutual agreement was ThU.S.$ 160,000.
Employee Benefits for Key Management Personnel
| | | | | | | | | | | | | | | | |
| | | January - June | | | April – June | |
| | | 2021 | | | 2020 | | | 2021 | | | 2020 | |
| | | ThU.S.$ | | | ThU.S.$ | | | ThU.S.$ | | | ThU.S.$ | |
Salaries and bonuses | | | 39,700 | | | | 27,770 | | | | 22,603 | | | | 12,786 | |
Per diem compensation to members of the Board of Directors | | | 1,242 | | | | 1,087 | | | | 625 | | | | 374 | |
Termination benefits | | | 1,995 | | | | 2,218 | | | | 1,420 | | | | 1,743 | |
Total | | | 42,937 | | | | 31,075 | | | | 24,648 | | | | 14,903 | |
| | | | | | | | | | | | | | | | |
Related Party Receivables, Current
| | | | | | | | | | | | | | | | | | | | | | | | | | | | |
Name of Related Party | | Tax ID No. | | | Nature of Relationship | | | Country | | | Currency | | | Maturity | | | 06-30-2021
ThU.S.$ | | | 12-31-2020
ThU.S.$ | |
Forestal Mininco S.A. | | | 91.440.000-7 | | | | Common Stockholder | | | | Chile | | | | Chilean pesos | | | | 30 days | | | | 4 | | | | 8 | |
Eka Chile S.A. | | | 99.500.140-3 | | | | Joint Venture | | | | Chile | | | | Chilean pesos | | | | 30 days | | | | 1,843 | | | | 1,251 | |
Forestal del Sur S.A. | | | 79.825.060-4 | | |
| Associate of a subsidiary’s
minority shareholder |
| | | Chile | | | | Chilean pesos | | | | — | | | | — | | | | 575 | |
Unilin Arauco Pisos Ltda. | | | — | | | | Joint Venture | | | | Brazil | | |
| Brazilian
Real |
| | | 30 days | | | | — | | | | 829 | |
CMPC Maderas S.A. | | | 95.304.000-K | | | | Common Stockholder | | | | Chile | | | | Chilean pesos | | | | 30 days | | | | 2 | | | | 21 | |
CMPC Pulp S.A. | | | 96.532.330-9 | | | | Common Stockholder | | | | Chile | | | | Chilean pesos | | | | 30 days | | | | 900 | | | | 866 | |
Fundación Educacional Arauco | | | 71.625.000-8 | | |
| Parent company is founder
and contributor |
| | | Chile | | | | Chilean pesos | | | | 30 days | | | | 426 | | | | — | |
Fundación Acerca Redes | | | 65.097.218-K | | |
| Parent company is founder
and contributor |
| | | Chile | | | | Chilean pesos | | | | 30 days | | | | 1,006 | | | | 968 | |
Parque Eólico Ovejera Sur SpA. | | | 76.839.949-2 | | | | Associate | | | | Chile | | | | Chilean pesos | | | | 30 days | | | | 99 | | | | — | |
Sonae Arauco Portugal S.A. | | | — | | |
| Subsidiary of a Joint
Venture |
| | | Portugal | | | | U.S. Dollar | | | | — | | | | — | | | | 369 | |
E2E S.A. | | | 76.879.577-0 | | | | Joint Venture | | | | Chile | | | | Chilean pesos | | | | 10-may-21 | | | | 472 | | | | 460 | |
E2E S.A. | | | 76.879.577-0 | | | | Joint Venture | | | | Chile | | | | Chilean pesos | | | | 27-Apr-21 | | | | 430 | | | | — | |
E2E S.A. | | | 76.879.577-0 | | | | Joint Venture | | | | Chile | | | | Chilean pesos | | | | 28-Oct-21 | | | | 295 | | | | 288 | |
E2E S.A. | | | 76.218.856-2 | | | | Joint Venture | | | | Chile | | | | Chilean pesos | | | | 30 days | | | | 335 | | | | 639 | |
| | | | | | | | | | | | | | | | | | | | | | | | | | | | |
TOTAL | | | | | | | | | | | | | | | | | | | | | | | 5,812 | | | | 6,274 | |
| | | | | | | | | | | | | | | | | | | | | | | | | | | | |
Related Party Payables, Current
| | | | | | | | | | | | | | | | | | | | | | | | | | | | |
Name of Related Party | | Tax ID No. | | | Nature of Relationship | | | Country | | | Currency | | | Maturity | | | 06-30-2021
ThU.S.$ | | | 12-31-2020
ThU.S.$ | |
Compañía de Petróleos de Chile S.A. | | | 99.520.000-7 | | |
| Common controlling
parent |
| | | Chile | | | | Chilean pesos | | | | 30 days | | | | 3,583 | | | | 2,657 | |
Abastible S.A. | | | 91.806.000-6 | | |
| Common controlling
parent |
| | | Chile | | | | Chilean pesos | | | | 30 days | | | | 49 | | | | 139 | |
Fundación Educacional Arauco | | | 71.625.000-8 | | |
| Parent company is
founder and
contributor |
| | | Chile | | | | Chilean pesos | | | | — | | | | — | | | | 694 | |
Red to Green S.A. | | | 86.370.800-1 | | |
| Common
Stockholder |
| | | Chile | | | | Chilean pesos | | | | 30 days | | | | 6 | | | | — | |
Empresa Nacional de Telecomunicaciones S.A. | | | 92.580.000-7 | | |
| Common
Stockholder |
| | | Chile | | | | Chilean pesos | | | | 30 days | | | | 6 | | | | 7 | |
Servicios Corporativos Sercor S.A. | | | 96.925.430-1 | | | | Associate | | | | Chile | | | | Chilean pesos | | | | 30 days | | | | 7 | | | | — | |
Compañía Puerto de Coronel S.A. | | | 79.895.330-3 | | |
| Subsidiary of an
associate |
| | | Chile | | | | U.S. Dollar | | | | 30 days | | | | 193 | | | | 236 | |
Colbpun Transmisión S.A. | | | 76.218.856-2 | | |
| Common
Stockholder |
| | | Chile | | | | Chilean pesos | | | | 30 days | | | | 3 | | | | — | |
Adm. de Ventas al Detalle Arco Prime Ltda. | | | 77.215.640-5 | | |
| Common controlling
parent |
| | | Chile | | | | Chilean pesos | | | | 30 days | | | | 2 | | | | 1 | |
Woodtech S.A. | | | 76.724.000-7 | | |
| Associate of
controlling parent |
| | | Chile | | | | Chilean pesos | | | | 30 days | | | | 8 | | | | — | |
Air BP Copec S.A. | | | 96.942.120-8 | | |
| Joint venture of
controlling parent |
| | | Chile | | | | Chilean pesos | | | | 30 days | | | | 5 | | | | 5 | |
| | | | | | | | | | | | | | | | | | | | | | | | | | | | |
TOTAL | | | | | | | | | | | | | | | | | | | | | | | 3,862 | | | | 3,739 | |
| | | | | | | | | | | | | | | | | | | | | | | | | | | | |
60
CELULOSA ARAUCO Y CONSTITUCION S.A. AND SUBSIDIARIES
Unaudited Interim Consolidated Financial Statements
June 30, 2021
Amounts in thousands of U.S. dollars, except as indicated
Related Party Transactions
Purchases
| | | | | | | | | | | | | | | | | | |
Name of Related Party | | Tax ID No. | | Nature of Relationship | | Country | | Currency | | Transaction
Descriptions | | 06-30-2021
ThU.S.$ | | | 12-31-2020
ThU.S.$ | |
Abastible S.A. | | 91.806.000-6 | | Common controlling parent | | Chile | | Chilean
pesos | | Fuel | | | 1,163 | | | | 2,113 | |
Compañía de Petróleos de Chile S.A. | | 99.520.000-7 | | Common controlling parent | | Chile | | Chilean
pesos | | Fuel and
other | | | 38,650 | | | | 48,983 | |
Compañía Puerto de Coronel S.A. | | 79.895.330-3 | | Subsidiary of the Associate | | Chile | | U.S. Dollar | | Transport,
stowage and
port services | | | 4,351 | | | | 17,506 | |
EKA Chile S.A. | | 99.500.140-3 | | Joint Venture | | Chile | | Chilean
pesos | | Sodium
chlorate | | | 19,910 | | | | 38,633 | |
Forestal del Sur S.A. | | 79.825.060-4 | | Associate of a subsidiary’s
minority shareholder | | Chile | | Chilean
pesos | | Wood and
chips | | | 433 | | | | 4,495 | |
Portaluppi, Guzman y Bezanilla Abogados Ltda. | | 78.096.080-9 | | Common director | | Chile | | Chilean
pesos | | Legal
services | | | 393 | | | | 703 | |
Empresa Nacional de Telecomunicaciones S.A. | | 92.580.000-7 | | Common Stockholder | | Chile | | Chilean
pesos | | Telephone
services | | | 164 | | | | 229 | |
Colbún Transmisión S.A. | | 76.218.856-2 | | Common Stockholder | | Chile | | Chilean
pesos | | Electrical
Power | | | 274 | | | | 399 | |
Woodtech S.A. | | 76.724.000-7 | | Indirect associate of
controlling parent | | Chile | | Chilean
pesos | | Wood
volumen
measurement
services | | | 698 | | | | 1,362 | |
Inversiones Siemel S.A. | | 94.082.000-6 | | Common Stockholder | | Chile | | Chilean
pesos | | Rentals | | | 51 | | | | 279 | |
Elemental S.A. | | 76.659.730-0 | | Associate of controlling
parent | | Chile | | Chilean
pesos | | Services and
other
purchases | | | 39 | | | | 364 | |
Servicios Corporativos Sercor S.A. | | 96.925.430-1 | | Associate | | Chile | | Chilean
pesos | | Other
purchases | | | 107 | | | | 242 | |
| | | | | | | | | | | | | | | | | | |
Sales and other transactions
| | | | | | | | | | | | | | | | | | |
Name of Related Party | | Tax ID No. | | Nature of Relationship | | Country | | Currency | | Transaction
Descriptions | | 06-30-2021
ThU.S.$ | | | 12-31-2020
ThU.S.$ | |
EKA Chile S.A. | | 99.500.140-3 | | Joint venture | | Chile | | Chilean
pesos | | Electrical
Power | | | 9,988 | | | | 16,559 | |
Forestal del Sur S.A. | | 79.825.060-4 | | Associate of a subsidiary’s
minority shareholder | | Chile | | Chilean
pesos | | Harvesting
services,
wood and
chips | | | 7,329 | | | | 21,146 | |
CMPC Pulp S.A. | | 96.532.330-9 | | Common Stockholder | | Chile | | Chilean
pesos | | Wood and
chips | | | 4,474 | | | | 7,849 | |
CMPC Tissue S.A. | | 96.529.310-8 | | Common Stockholder | | Chile | | Chilean
pesos | | Pulp | | | — | | | | 3,681 | |
Unilin Arauco Pisos Ltda. | | — | | Joint venture | | Brazil | | Brazilian
Real | | Wood | | | — | | | | 4,623 | |
E2E S.A. | | 76.879.577-0 | | Joint venture | | Chile | | Chilean
pesos | | Wood,
plywood
and boards | | | 211 | | | | 471 | |
| | | | | | | | | | | | | | | | | | |
61
CELULOSA ARAUCO Y CONSTITUCION S.A. AND SUBSIDIARIES
Unaudited Interim Consolidated Financial Statements
June 30, 2021
Amounts in thousands of U.S. dollars, except as indicated
NOTE 14. INVESTMENTS IN SUBSIDIARIES
On March 26, 2021, Arauco Nutrientes Naturales SpA was merged into the subsidiary Forestal Arauco S.A. This operation had no effect on Arauco´s results or on any of the companies that participated on this merger.
On March 10, 2021, Arauco through the subsidiary Forestal Arauco S.A. sold its total stake in the company Forestal Los Lagos SpA (ex S.A.) for ThU.S.$ 48,000. This operation generated a profit of ThU.S.$ 20,381 that is presented in Other income.
On December 2020, through its subsidiary Maderas Arauco S.A., Arauco acquired the 86.6155% of ODD Industries SpA, a pioneer company in the field of industrial artificial intelligence with ethical purposes. Arauco’s objective is to move forward with the implementation of artificial intelligence seeking to develop tools to mitigate climate change, among others. The price paid as of December 31, 2020 for the shares acquired and subscribed in this operation was ThU.S.$ 5,064 out of a total of ThU.S.$ 9,157.
Arauco carried out the initial recognition of the acquisition based on the information available as of that date, performing a preliminary determination about the allocation of the fair values during the acquisition of the same. The amounts of acquired assets and liabilities are deemed to be provisional amounts and could be adjusted during the measurement period of this acquisition, in order to reflect new information obtained based on facts and circumstances that existed as of the acquisition date and which, if known, would have affected the measurement of the amounts recognized as of that date.
NOTE 15. INVESTMENTS IN ASSOCIATES
As of June 30, 2021 and as of December 31, 2020, there were no new investments in associates to report.
The following tables set forth information about Investments in associates.
| | | | |
| Name | | Inversiones Puerto Coronel S.A. |
| Country | | Chile |
| Functional Currency | | U.S. Dollar |
Corporate purpose | | Investments in movables and real estate, acquisition of companies, securities and investment instruments, investment management and development and/or participation in all kind of businesses and companies related to industrial, shipping, forestry and commercial activities. |
Ownership interest (%) | | 50.0000% |
| | 06-30-2021 | | 12-31-2020 |
Carrying amount accounted for using equity method | | ThU.S.$ 55,562 | | ThU.S.$ 56,314 |
| |
| Name | | Servicios Corporativos Sercor S.A. |
| Country | | Chile |
| Functional Currency | | Chilean Pesos |
Corporate purpose | | Consulting services related to business management to Boards of Directors and Senior Management of all Arauco’s entities. |
Ownership interest (%) | | 20.0000% |
| | 06-30-2021 | | 12-31-2020 |
Carrying amount accounted for using equity method | | ThU.S.$ 235 | | ThU.S.$ 187 |
62
CELULOSA ARAUCO Y CONSTITUCION S.A. AND SUBSIDIARIES
Unaudited Interim Consolidated Financial Statements
June 30, 2021
Amounts in thousands of U.S. dollars, except as indicated
| | | | |
| Name | | Genómica Forestal S.A. |
| Country | | Chile |
| Functional Currency | | Chilean Pesos |
Corporate purpose | | Developing forestry genomics, through the use of biotechnological, molecular and bioinformatics tools with the purpose of strengthening genetic programs so as to improve the competitive position of the Chilean forestry industry for priority tree species. |
| Ownership interest (%) | | 25.0000% |
| | 06-30-2021 | | 12-31-2020 |
| Carrying amount accounted for using equity method | | ThU.S.$ 6 | | ThU.S.$ 7 |
| |
| Name | | Consorcio Tecnológico Bioenercel S.A. |
| Country | | Chile |
| Functional Currency | | Chilean Pesos |
| Corporate purpose | | Developing of technologies which will promote the development of a biofuels industry in Chile, obtained from lingo-cellulosic materials. The future execution of this sustainable project is financed by the Innova Chile Committee. |
| Ownership interest (%) | | 20.0000% |
| | 06-30-2021 | | 12-31-2020 |
| Carrying amount accounted for using equity method | | ThU.S.$ 1 | | ThU.S.$ 1 |
| |
| Name | | Vale do Corisco S.A. |
| Country | | Brazil |
| Functional Currency | | Brazilian Real |
| Corporate purpose | | Management of forestry activities. |
| Ownership interest (%) | | 49.0000% |
| | 06-30-2021 | | 12-31-2020 |
| Carrying amount accounted for using equity method | | ThU.S.$ 30,587 | | ThU.S.$
29,205 |
63
CELULOSA ARAUCO Y CONSTITUCION S.A. AND SUBSIDIARIES
Unaudited Interim Consolidated Financial Statements
June 30, 2021
Amounts in thousands of U.S. dollars, except as indicated
Summarized Financial Information of Associates
| | | | | | | | | | | | | | | | | | | | | | | | |
| | | Assets | |
06-30-2021 | | Inversiones
Puerto
Coronel S.A.
ThU.S.$ | | | Serv.Corporativos
Sercor S.A.
ThU.S.$ | | | Vale do
Corisco S.A.
ThU.S.$ | | | Consorcio
Tecnológico
Bioenercel S.A.
ThU.S.$ | | | Genómica
Forestal S.A.
ThU.S.$ | | | Total
ThU.S.$ | |
Current | | | 1 | | | | 3,351 | | | | 4,830 | | | | 1 | | | | 15 | | | | 8,198 | |
Non-current | | | 112,944 | | | | 3,145 | | | | 78,502 | | | | 7 | | | | 56 | | | | 194,654 | |
Total | | | 112,945 | | | | 6,496 | | | | 83,332 | | | | 8 | | | | 71 | | | | 202,852 | |
| | | | | | | | | | | | | | | | | | | | | | | | |
| |
| | | Liabilities and Equity | |
| | | Inversiones
Puerto
Coronel S.A.
ThU.S.$ | | | Serv.Corporativos
Sercor S.A.
ThU.S.$ | | | Vale do
Corisco S.A.
ThU.S.$ | | | Consorcio
Tecnológico
Bioenercel S.A.
ThU.S.$ | | | Genómica
Forestal S.A.
ThU.S.$ | | | Total
ThU.S.$ | |
Current | | | 54 | | | | 2,691 | | | | 596 | | | | — | | | | 7 | | | | 3,348 | |
Non-current | | | — | | | | 2,628 | | | | 20,314 | | | | 5 | | | | 38 | | | | 22,985 | |
Equity | | | 112,890 | | | | 1,176 | | | | 62,422 | | | | 3 | | | | 25 | | | | 176,516 | |
Total | | | 112,944 | | | | 6,495 | | | | 83,332 | | | | 8 | | | | 70 | | | | 202,849 | |
| | | | | | | | | | | | | | | | | | | | | | | | |
| | | | | | |
| 06-30-2021 | | | | | | | | | | | | | | | | | | |
Income | | | — | | | | 2,607 | | | | 3,532 | | | | — | | | | — | | | | 6,139 | |
Other income / expenses | | | (1,520 | ) | | | (2,345 | ) | | | (4,503 | ) | | | — | | | | (2 | ) | | | (8,370 | ) |
Profit or loss (continuing operations) | | | (1,520 | ) | | | 262 | | | | (971 | ) | | | — | | | | (2 | ) | | | (2,231 | ) |
| | | | | | | | | | | | | | | | | | | | | | | | |
Other comprehensive income | | | — | | | | — | | | | — | | | | — | | | | — | | | | — | |
Comprehensive income | | | (1,520 | ) | | | 262 | | | | (971 | ) | | | — | | | | (2 | ) | | | (2,231 | ) |
Dividends received | | | — | | | | — | | | | 573 | | | | — | | | | — | | | | 573 | |
| | | | | | | | | | | | | | | | | | | | | | | | |
| |
| | | Assets | |
12-31-2020 | | Inversiones
Puerto
Coronel S.A.
ThU.S.$ | | | Serv.Corporativos
Sercor S.A.
ThU.S.$ | | | Vale do
Corisco S.A.
ThU.S.$ | | | Consorcio
Tecnológico
Bioenercel S.A.
ThU.S.$ | | | Genómica
Forestal S.A.
ThU.S.$ | | | Total
ThU.S.$ | |
Current | | | 114,463 | | | | 4,155 | | | | 3,725 | | | | 1 | | | | 18 | | | | 122,362 | |
Non-current | | | 1 | | | | 3,444 | | | | 76,129 | | | | 11 | | | | 57 | | | | 79,642 | |
Total | | | 114,464 | | | | 7,599 | | | | 79,854 | | | | 12 | | | | 75 | | | | 202,004 | |
| | | | | | | | | | | | | | | | | | | | | | | | |
| |
| | | Liabilities and Equity | |
| | | Inversiones
Puerto
Coronel S.A.
ThU.S.$ | | | Serv.Corporativos
Sercor S.A.
ThU.S.$ | | | Vale do
Corisco S.A.
ThU.S.$ | | | Consorcio
Tecnológico
Bioenercel S.A.
ThU.S.$ | | | Genómica
Forestal S.A.
ThU.S.$ | | | Total
ThU.S.$ | |
Current | | | 54 | | | | 4,029 | | | | 699 | | | | — | | | | 8 | | | | 4,790 | |
Non-current | | | — | | | | 2,634 | | | | 19,554 | | | | 5 | | | | 39 | | | | 22,232 | |
Equity | | | 114,410 | | | | 936 | | | | 59,601 | | | | 7 | | | | 28 | | | | 174,982 | |
Total | | | 114,464 | | | | 7,599 | | | | 79,854 | | | | 12 | | | | 75 | | | | 202,004 | |
| | | | | | | | | | | | | | | | | | | | | | | | |
| | | | | | |
| 06-30-2020 | | | | | | | | | | | | | | | | | | |
Income | | | — | | | | 2,194 | | | | 2,843 | | | | — | | | | — | | | | 5,037 | |
Other income / expenses | | | 6,019 | | | | (1,978 | ) | | | (1,625 | ) | | | — | | | | (2 | ) | | | 2,414 | |
| | | | | | | | | | | | | | | | | | | | | | | | |
Profit or loss (continuing operations) | | | 6,019 | | | | 216 | | | | 1,218 | | | | — | | | | (2 | ) | | | 7,451 | |
| | | | | | | | | | | | | | | | | | | | | | | | |
Other comprehensive income | | | — | | | | — | | | | — | | | | — | | | | — | | | | — | |
Comprehensive income | | | 6,019 | | | | 216 | | | | 1,218 | | | | — | | | | (2 | ) | | | 7,451 | |
Dividends received | | | — | | | | — | | | | 783 | | | | — | | | | — | | | | 783 | |
| | | | | | | | | | | | | | | | | | | | | | | | |
Reconciliation of Investment in Associates and Joint Ventures
| | | | | | | | |
| | | 06-30-2021 | | | 12-31-2020 | |
| | | ThU.S.$ | | | ThU.S.$ | |
Opening balance as of January 1 Changes | | | 316,939 | | | | 293,118 | |
Investment in joint ventures, additions (*) | | | 4,800 | | | | 20,129 | |
Disposals, investment in associates and joint ventures (**) | | | (3,197 | ) | | | (943 | ) |
Share of profit (loss) in investment in associates | | | 139 | | | | 4,821 | |
Share of profit (loss) in investment in joint ventures | | | 11,077 | | | | (2,504 | ) |
Dividends Received, Investments in Associates | | | (1,166 | ) | | | (4,357 | ) |
Increase (Decrease) in foreign exchange currency on translation of Associates and Joint Ventures | | | (5,546 | ) | | | 8,351 | |
Other increase (decrease) in investment and associates and joint ventures | | | 1,345 | | | | (1,676 | ) |
Total changes | | | 7,452 | | | | 23,821 | |
Closing balance | | | 324,391 | | | | 316,939 | |
| | | | | | | | |
| (*) | During the first semester of 2021 Maderas Arauco S.A. made two capital contribution to E2E S.A., the first one was on January 8, 2021 for ThCLP$ 1,600,000 for160 shares, and the second was made on June 22, 2021 in the amount of ThCLP$ 1,900,000 for 190 shares. |
64
CELULOSA ARAUCO Y CONSTITUCION S.A. AND SUBSIDIARIES
Unaudited Interim Consolidated Financial Statements
June 30, 2021
Amounts in thousands of U.S. dollars, except as indicated
| (**) | ThU.S.$ 3,197 account for the carrying amount of investment in Unilin Arauco Pisos Ltda., which was sold on January 12, 2021. |
| | | | | | | | |
| | | 06-30-2021 | | | 12-31-2020 | |
| | | ThU.S.$ | | | ThU.S.$ | |
Carrying amount of associates accounted for using equity method | | | 86,391 | | | | 85,714 | |
Carrying amount of joint ventures accounted for using equity method | | | 238,000 | | | | 231,225 | |
Total investment accounted for using equity method | | | 324,391 | | | | 316,939 | |
| | | | | | | | |
NOTE 16. INTERESTS IN JOINT ARRANGEMENTS
Investments and contributions made
On January 12, 2021 Arauco through its subsidiary Arauco do Brasil S.A. sold its total 50% stake in Unilin Arauco Pisos Ltda. This transaction generated a loss before taxes of ThU.S.$ 431.
On July 29, 2020 Arauco through its subsidiary Forestal Arauco S.A. entered into a shareholders agreement with respect to Agrícola El Paque SpA, which was established for the plantating, construction and integral management of agricultural projects. The capital contributed by Forestal Arauco S.A. was ThCLP$ 3,651,895 equivalent to ThU.S.$ 4,753.
Between January and February 2020, Arauco through its subsidiary Maderas Arauco S.A. has contributed ThCLP$ 12,000,000 (equivalent to ThU.S.$ 15,022) to E2E S.A., representing 50% of the interest in this company. Between January and July 2021 Arauco contributed ThCLP$ 3,500,000 equivalent to ThU.S.$ 4,800.
Between February and December 2020, Arauco through its subsidiary Arauco Bioenergía S.A. has contributed ThU.S.$ 354 to Parque Eólico Ovejera Sur SpA., representing 50% of the interest in this company.
As of June 30, 2021 and as of December 31, 2020, Arauco has not made contributions to Uruguayan companies Celulosa y Energía Punta Pereira S.A. and Zona Franca Punta Pereira S.A.
The investments in Uruguay qualify as a joint operation. In relation to “other rights and contractual conditions”, the joint operation has the primary objective of providing the parties an output. As established in the “Pulp Supply Agreement”, both Arauco and its partner have the obligation to acquire 100% of the yearly pulp produced by the joint operation. Arauco has recognized the assets, liabilities, income and expenses associated with its interest ownership, as of January 1, 2013, pursuant to IFRS 11.
Arauco holds a 50% interest in Sonae Arauco, which subsidiary produces and commercializes wood panels, of the type of MDF, PB and OSB, and sawn timber, through the operation of 2 panel plants and one sawmill in Spain; 2 panel plants and one resin plant in Portugal; 4 panel plants in Germany and 2 panel plants in South Africa.
Furthermore, Arauco holds a 50% ownership in Eka Chile S.A. (“Eka”), a company that sells sodium chlorate to pulp plants in Chile. There is a contractual agreement with this company whereby Arauco has engaged in an economic activity subject to common control, which is classified as a joint venture.
65
CELULOSA ARAUCO Y CONSTITUCION S.A. AND SUBSIDIARIES
Unaudited Interim Consolidated Financial Statements
June 30, 2021
Amounts in thousands of U.S. dollars, except as indicated
The following tables set forth summarized financial information of the more significant interests in joint arrangements, which qualify as joint operations:
| | | | | | | | | | | | | | | | |
| | | 06-30-2021 | | | 12-31-2020 | |
Celulosa y Energía Punta Pereira S.A. (Uruguay) | | Assets
ThU.S.$ | | | Liabilities
ThU.S.$ | | | Assets
ThU.S.$ | | | Liabilities
ThU.S.$ | |
Current | | | 368,755 | | | | 172,712 | | | | 262,446 | | | | 163,887 | |
Non-current | | | 2,069,384 | | | | 270,245 | | | | 2,103,903 | | | | 325,894 | |
Equity | | | — | | | | 1,995,182 | | | | — | | | | 1,876,568 | |
Total Joint Arrangement | | | 2,438,139 | | | | 2,438,139 | | | | 2,366,349 | | | | 2,366,349 | |
| | | | | | | | | | | | | | | | |
Investment | | | 997,591 | | | | | | | | 938,284 | | | | | |
| | | | | | | | | | | | | | | | |
| | | | | | | | |
| | | 06-30-2021
ThU.S.$ | | | 06-30-2020
ThU.S.$ | |
Income | | | 401,669 | | | | 311,311 | |
Expenses | | | (288,512) | | | | (296,789) | |
Joint Arrangement Net Income (Loss) | | | 113,157 | | | | 14,522 | |
| | | | | | | | |
| | | | | | | | | | | | | | | | |
| | | 06-30-2021 | | | 12-31-2020 | |
Forestal Cono Sur S.A. (consolidated) | | Assets
ThU.S.$ | | | Liabilities
ThU.S.$ | | | Assets
ThU.S.$ | | | Liabilities
ThU.S.$ | |
Current | | | 63,833 | | | | 2,515 | | | | 44,684 | | | | 2,121 | |
Non-current | | | 151,658 | | | | 9,416 | | | | 170,028 | | | | 10,637 | |
Equity | | | — | | | | 203,560 | | | | — | | | | 201,954 | |
Total Joint Arrangement | | | 215,491 | | | | 215,491 | | | | 214,712 | | | | 214,712 | |
| | | | | | | | | | | | | | | | |
Investment | | | 101,780 | | | | | | | | 100,977 | | | | | |
| | | | | | | | | | | | | | | | |
| | | | | | | | |
| | | 06-30-2021
ThU.S.$ | | | 06-30-2020
ThU.S.$ | |
Income | | | 10,112 | | | | 16,658 | |
Expenses | | | (8,505 | ) | | | (17,953 | ) |
Joint Arrangement Net Income (Loss) | | | 1,607 | | | | (1,295 | ) |
| | | | | | | | |
| | | | | | | | | | | | | | | | |
| | | 06-30-2021 | | | 12-31-2020 | |
Eufores S.A. (consolidated) | | Assets
ThU.S.$ | | | Liabilities
ThU.S.$ | | | Assets
ThU.S.$ | | | Liabilities
ThU.S.$ | |
Current | | | 133,150 | | | | 206,707 | | | | 115,971 | | | | 192,443 | |
Non-current | | | 891,545 | | | | 143,388 | | | | 870,093 | | | | 131,893 | |
Equity | | | — | | | | 674,600 | | | | — | | | | 661,728 | |
Total Joint Arrangement | | | 1,024,695 | | | | 1,024,695 | | | | 986,064 | | | | 986,064 | |
| | | | | | | | | | | | | | | | |
Investment | | | 337,300 | | | | | | | | 330,864 | | | | | |
| | | | | | | | | | | | | | | | |
| | | | | | | | |
| | | 06-30-2021
ThU.S.$ | | | 06-30-2020
ThU.S.$ | |
Income | | | 114,241 | | | | 123,568 | |
Expenses | | | (101,145 | ) | | | (118,958 | ) |
Joint Arrangement Net Income (Loss) | | | 13,096 | | | | 4,610 | |
| | | | | | | | |
| | | | | | | | | | | | | | | | |
| | | 06-30-2021 | | | 12-31-2020 | |
Zona Franca Punta Pereira S.A. (Uruguay) | | Assets
ThU.S.$ | | | Liabilities
ThU.S.$ | | | Assets
ThU.S.$ | | | Liabilities
ThU.S.$ | |
Current | | | 6,250 | | | | 103,961 | | | | 6,233 | | | | 107,131 | |
Non-current | | | 448,095 | | | | 16,378 | | | | 453,572 | | | | 19,179 | |
Equity | | | — | | | | 334,006 | | | | — | | | | 333,495 | |
Total Joint Arrangement | | | 454,345 | | | | 454,345 | | | | 459,805 | | | | 459,805 | |
| | | | | | | | | | | | | | | | |
Investment | | | 167,003 | | | | | | | | 166,748 | | | | | |
| | | | | | | | | | | | | | | | |
| | | | | | | | |
| | | 06-30-2021
ThU.S.$ | | | 06-30-2020
ThU.S.$ | |
Income | | | 9,093 | | | | 9,117 | |
Expenses | | | (8,582 | ) | | | (15,298 | ) |
Joint Arrangement Net Income (Loss) | | | 511 | | | | (6,181 | ) |
| | | | | | | | |
66
CELULOSA ARAUCO Y CONSTITUCION S.A. AND SUBSIDIARIES
Unaudited Interim Consolidated Financial Statements
June 30, 2021
Amounts in thousands of U.S. dollars, except as indicated
The following tables set forth summarized financial information of the more significant interests in joint ventures accounted in for equity method:
| | | | | | | | | | | | | | | | |
| | | 06-30-2021 | | | 12-31-2020 | |
Unilin Arauco Pisos Ltda. | | Assets
ThU.S.$ | | | Liabilities
ThU.S.$ | | | Assets
ThU.S.$ | | | Liabilities
ThU.S.$ | |
Current | | | — | | | | — | | | | 8,050 | | | | 4,995 | |
Non-current | | | — | | | | — | | | | 3,747 | | | | 408 | |
Equity | | | — | | | | — | | | | — | | | | 6,394 | |
Total Joint Arrangement | | | — | | | | — | | | | 11,797 | | | | 11,797 | |
| | | | | | | | | | | | | | | | |
Investment | | | — | | | | | | | | 3,197 | | | | | |
| | | | | | | | | | | | | | | | |
| | | | | | | | |
| | | 06-30-2021
ThU.S.$ | | | 06-30-2020
ThU.S.$ | |
Income | | | — | | | | 5,844 | |
Expenses | | | — | | | | (5,631 | ) |
Joint Arrangement Net Income (Loss) | | | — | | | | 213 | |
| | | | | | | | |
Other comprehensive income | | | — | | | | — | |
Comprehensive income | | | — | | | | 213 | |
Dividends | | | — | | | | — | |
| | | | | | | | |
| | | | | | | | | | | | | | | | |
| | | 06-30-2021 | | | 12-31-2020 | |
Eka Chile S.A. | | Assets
ThU.S.$ | | | Liabilities
ThU.S.$ | | | Assets
ThU.S.$ | | | Liabilities
ThU.S.$ | |
Current | | | 15,338 | | | | 2,798 | | | | 16,551 | | | | 4,154 | |
Non-current | | | 35,588 | | | | 4,472 | | | | 35,599 | | | | 4,782 | |
Equity | | | — | | | | 43,656 | | | | — | | | | 43,214 | |
Total Joint Arrangement | | | 50,926 | | | | 50,926 | | | | 52,150 | | | | 52,150 | |
| | | | | | | | | | | | | | | | |
Investment | | | 21,828 | | | | | | | | 21,607 | | | | | |
| | | | | | | | | | | | | | | | |
| | | | | | | | |
| | | 06-30-2021
ThU.S.$ | | | 06-30-2020
ThU.S.$ | |
Income | | | 20,376 | | | | 20,035 | |
Expenses | | | (18,747 | ) | | | (18,221 | ) |
Joint Arrangement Net Income (Loss) | | | 1,629 | | | | 1,814 | |
| | | | | | | | |
Other comprehensive income | | | — | | | | — | |
Comprehensive income | | | 1,629 | | | | 1,814 | |
Dividends | | | 594 | | | | 2,894 | |
| | | | | | | | |
| | | | | | | | | | | | | | | | |
| | | 06-30-2021 | | | 12-31-2020 | |
Sonae Arauco S.A. | | Assets
ThU.S.$ | | | Liabilities
ThU.S.$ | | | Assets
ThU.S.$ | | | Liabilities
ThU.S.$ | |
Current | | | 264,103 | | | | 286,404 | | | | 258,058 | | | | 276,127 | |
Non-current | | | 726,448 | | | | 320,614 | | | | 765,712 | | | | 379,260 | |
Equity | | | — | | | | 383,533 | | | | — | | | | 368,383 | |
Total Joint Arrangement | | | 990,551 | | | | 990,551 | | | | 1,023,770 | | | | 1,023,770 | |
| | | | | | | | | | | | | | | | |
Net assets | | | 166,229 | | | | | | | | 157,552 | | | | | |
Net asset adjustment (Goodwill) | | | 25,538 | | | | | | | | 26,640 | | | | | |
Investment | | | 191,767 | | | | | | | | 184,192 | | | | | |
| | | | | | | | | | | | | | | | |
| | | | | | | | |
| | | 06-30-2021
ThU.S.$ | | | 06-30-2020
ThU.S.$ | |
Income | | | 538,966 | | | | 363,122 | |
Expenses | | | (513,749 | ) | | | (371,177 | ) |
Joint Arrangement Net Income (Loss) | | | 25,217 | | | | (8,055 | ) |
| | | | | | | | |
Other comprehensive income | | | — | | | | — | |
Comprehensive income | | | 25,217 | | | | (8,055 | ) |
Dividends | | | — | | | | — | |
| | | | | | | | |
| | | | | | | | | | | | | | | | |
| | | 06-30-2021 | | | 12-31-2020 | |
Agrícola El Paque SpA. | | Assets
ThU.S.$ | | | Liabilities
ThU.S.$ | | | Assets
ThU.S.$ | | | Liabilities
ThU.S.$ | |
Current | | | 1,590 | | | | 10 | | | | 4,562 | | | | 69 | |
Non-current | | | 10,945 | | | | 2,355 | | | | 5,782 | | | | — | |
Equity | | | — | | | | 10,170 | | | | — | | | | 10,275 | |
Total Joint Arrangement | | | 12,535 | | | | 12,535 | | | | 10,344 | | | | 10,344 | |
| | | | | | | | | | | | | | | | |
Investment | | | 5,085 | | | | | | | | 5,138 | | | | | |
| | | | | | | | | | | | | | | | |
| | | | | | | | |
| | | 06-30-2021
ThU.S.$ | | | 06-30-2020
ThU.S.$ | |
Income | | | — | | | | — | |
Expenses | | | 120 | | | | — | |
Joint Arrangement Net Income (Loss) | | | 120 | | | | — | |
| | | | | | | | |
Other comprehensive income | | | — | | | | — | |
Comprehensive income | | | 120 | | | | — | |
Dividends | | | — | | | | — | |
| | | | | | | | |
67
CELULOSA ARAUCO Y CONSTITUCION S.A. AND SUBSIDIARIES
Unaudited Interim Consolidated Financial Statements
June 30, 2021
Amounts in thousands of U.S. dollars, except as indicated
| | | | | | | | | | | | | | | | |
| | | 06-30-2021 | | | 12-31-2020 | |
Parque Eólico Ovejera del Sur SpA. | | Assets
ThU.S.$ | | | Liabilities
ThU.S.$ | | | Assets
ThU.S.$ | | | Liabilities
ThU.S.$ | |
Current | | | 206 | | | | 105 | | | | 367 | | | | 27 | |
Non-current | | | 2,155 | | | | — | | | | 2,057 | | | | — | |
Equity | | | — | | | | 2,256 | | | | — | | | | 2,398 | |
Total Joint Arrangement | | | 2,361 | | | | 2,361 | | | | 2,424 | | | | 2,425 | |
| | | | | | | | | | | | | | | | |
Investment | | | 1,128 | | | | | | | | 1,199 | | | | | |
| | | | | | | | | | | | | | | | |
| | | | | | | | |
| | | 06-30-2021
ThU.S.$ | | | 06-30-2020
ThU.S.$ | |
Income | | | 64 | | | | — | |
Expenses | | | (152 | ) | | | (69 | ) |
Joint Arrangement Net Income (Loss) | | | (88 | ) | | | (60 | ) |
| | | | | | | | |
Other comprehensive income | | | — | | | | — | |
Comprehensive income | | | (88 | ) | | | (69 | ) |
Dividends | | | — | | | | — | |
| | | | | | | | |
| | | | | | | | | | | | | | | | |
| | | 06-30-2021 | | | 12-31-2020 | |
E2E S.A. | | Assets
ThU.S.$ | | | Liabilities
ThU.S.$ | | | Assets
ThU.S.$ | | | Liabilities
ThU.S.$ | |
Current | | | 6,677 | | | | 1,994 | | | | 9,196 | | | | 4,233 | |
Non-current | | | 32,742 | | | | 2,199 | | | | 27,045 | | | | 1,407 | |
Equity | | | — | | | | 35,226 | | | | — | | | | 30,601 | |
Total Joint Arrangement | | | 39,419 | | | | 39,419 | | | | 36,241 | | | | 36,241 | |
| | | | | | | | | | | | | | | | |
Investment | | | 17,613 | | | | | | | | 15,301 | | | | | |
| | | | | | | | | | | | | | | | |
| | | | | | | | |
| | | 06-30-2021
ThU.S.$ | | | 06-30-2020
ThU.S.$ | |
Income | | | 386 | | | | 800 | |
Expenses | | | (4,774 | ) | | | (1,556 | ) |
Joint Arrangement Net Income (Loss) | | | (4,388 | ) | | | (756 | ) |
| | | | | | | | |
Other comprehensive income | | | — | | | | — | |
Comprehensive income | | | (4,388) | | | | (756) | |
Dividends | | | — | | | | — | |
| | | | | | | | |
| | | | | | | | | | | | | | | | |
| | | 06-30-2021 | | | 12-31-2020 | |
Agrícola San Gerardo SpA. | | Assets
ThU.S.$ | | | Liabilities
ThU.S.$ | | | Assets
ThU.S.$ | | | Liabilities
ThU.S.$ | |
Current | | | 230 | | | | 373 | | | | 603 | | | | 387 | |
Non-current | | | 5,302 | | | | 1,108 | | | | 3,859 | | | | — | |
Equity | | | — | | | | 4,051 | | | | — | | | | 4,075 | |
Total Joint Arrangement | | | 5,532 | | | | 5,532 | | | | 4,462 | | | | 4,462 | |
| | | | | | | | | | | | | | | | |
Investment | | | 2,026 | | | | | | | | 2,038 | | | | | |
| | | | | | | | | | | | | | | | |
| | | | | | | | |
| | | 06-30-2021 | | | 06-30-2020 | |
| | | ThU.S.$ | | | ThU.S.$ | |
Income | | | — | | | | — | |
Expenses | | | (79 | ) | | | (56 | ) |
Joint Arrangement Net Income (Loss) | | | (79 | ) | | | (56 | ) |
| | | | | | | | |
Other comprehensive income | | | — | | | | — | |
Comprehensive income | | | (79) | | | | (56) | |
Dividends | | | — | | | | — | |
| | | | | | | | |
68
CELULOSA ARAUCO Y CONSTITUCION S.A. AND SUBSIDIARIES
Unaudited Interim Consolidated Financial Statements
June 30, 2021
Amounts in thousands of U.S. dollars, except as indicated
NOTE 17. IMPAIRMENT OF ASSETS
As a result of current market conditions in the United States generated by the decrease in prices, the impairment tests carried out at the CGU yielded an impairment provision of ThU.S.$ 14,918 relating to Property, Plant and Equipment and spare parts from Inventories corresponding to facilities of wood products in United States. For these calculations we used a discount rate of 8.7%. In the 2021 period, provisions associated with assets sold and recovered were reversed for a total of ThU.S.$ 10,716.
In addition, due to the modernization and expansion project of the Arauco Mill (Proyecto de Modernización y Ampliación de la Planta Arauco, or MAPA Project), as of June 30, 2021, we recorded an impairment provision due to a reduction in the useful lives for the CGU Line 1 of Arauco Mill (Pulp business) in an amount of ThU.S.$ 4,914 (ThU.S.$ 46,577 as of December 31, 2020). For this calculation, we used a discount rate of 6.1%. The Line 1 of the Arauco mill will be permanently shut down upon completion of the MAPA project.
Both impairment provision charges are presented in the consolidated statement of profit or loss under Other expenses and they constitue the main changes in the total CGU impairment provision as shown below:
| | | | | | | | |
Changes in CGU impairment provision | | 06-30-2021 | | | 12-31-2020 | |
| | ThU.S.$ | | | ThU.S.$ | |
Opening balance | | | 218,764 | | | | 180,209 | |
Impairment loss recognized in profit or loss | | | 5,328 | | | | 62,701 | |
Reversal of impairment loss in profit or loss | | | (13,348 | ) | | | (6,171 | ) |
Increase (Decrease) in foreign exchange currency on translation | | | 2,045 | | | | (17,975 | ) |
| | | | | | | | |
Closing balance | | | 212,789 | | | | 218,764 | |
| | | | | | | | |
Changes in provisions for impairment of property, plant and equipment due to technical obsolescence are shown below:
| | | | | | | | |
Changes in impairment provision from impaired assets | | 06-30-2021 | | | 12-31-2020 | |
| | ThU.S.$ | | | ThU.S.$ | |
Opening balance | | | 8,088 | | | | 8,135 | |
Impairment loss recognized in profit or loss | | | 2,077 | | | | 1,262 | |
Reverse of ompairment loss in profit or loss | | | (63 | ) | | | (1,204 | ) |
Increase (Decrease) in foreign exchange currency on translation | | | 260 | | | | (105 | ) |
| | | | | | | | |
Closing balance | | | 10,362 | | | | 8,088 | |
| | | | | | | | |
Goodwill
Goodwill is allocated to the groups of cash-generating units that are expected to benefit from the synergies of the combination.
At the date of these interim consolidated financial statements, the balance of goodwill is ThU.S.$ 59,617 (ThU.S.$ 59,567 at December 31, 2020), as shown below:
| | | | | | | | |
Goodwill | | 06-30-2021 | | | 12-31-2020 | |
| | ThU.S.$ | | | ThU.S.$ | |
Arauco Canada Ltd. (Flakeboard Company Ltd) | | | 40,853 | | | | 40,793 | |
Arauco do Brasil S.A. (Pien mill) | | | 18,032 | | | | 17,357 | |
Arauco North America, Inc. (Prime-Line, Inc.) | | | 732 | | | | 732 | |
Forestal Arauco S.A. (Forestal Los Lagos S.A.) | | | — | | | | 685 | |
| | | | | | | | |
Closing balance | | | 59,617 | | | | 59,567 | |
| | | | | | | | |
69
CELULOSA ARAUCO Y CONSTITUCION S.A. AND SUBSIDIARIES
Unaudited Interim Consolidated Financial Statements
June 30, 2021
Amounts in thousands of U.S. dollars, except as indicated
| | | | | | | | |
| | | 06-30-2021 | | | 12-31-2020 | |
Goodwill | | ThU.S.$ | | | ThU.S.$ | |
Opening balance at January 1 | | | 59,567 | | | | 65,751 | |
Increase (decrease) due to business combination | | | (685 | ) | | | — | |
Increase (decrease) in foreign currency exchange | | | 735 | | | | (6,184 | ) |
| | | | | | | | |
Closing balance | | | 59,617 | | | | 59,567 | |
| | | | | | | | |
Of the total of goodwill, ThU.S.$ 40,853 (ThU.S.$ 40,793 as of December 31, 2020) were generated by the acquisition of “Flakeboard” (currently Arauco Canada Ltd.), a company that, directly and/or through its subsidiaries, possesses and operates 7 panel plants, for which Arauco acquired and paid, on September 24, 2012, the price of ThU.S.$ 242,502 for the 100% interest ownership. The remaining balance of ThU.S.$ 732 corresponds to the acquisition of Prime-Line Inc, on September 1, 2019, for which Arauco North America Inc, a subsidiary of Arauco Canada Ltd. paid ThU.S.$ 18,880 for all the shares of said company.
The recoverable amount for Flakeboard’s cash generating unit was determined based on the calculations of its value in use, and this calculation was made using cash flow projections covering a 7-year term, a period time, which is considered to represent the cyclicality of the business performance, applying a nominal discount rate of 7% which reflects current market assessments for the wood products segment in North America.
The investment in the panel plant in Pien, Brazil generated a goodwill of ThU.S.$ 18,032 (ThU.S.$ 17,357 as of December 31, 2020).
The recoverable amount for the Pien plant’s cash generating unit was determined based on the calculations of its value in use, and this calculation was made using cash flow projections covering a 5-year term based on the operational plan approved by the Administration, applying a 7.4% nominal discount rate that reflects current evaluations for the panel segment in Brazil.
As of June 30, 2021 and as of December 31, 2020, the carrying value of the goodwill of the plants did not exceed their recoverable value, and therefore there was no need to recognize impairment losses.
Sensitivity analysis on discount rate was made and no impairment provision was determined.
70
CELULOSA ARAUCO Y CONSTITUCION S.A. AND SUBSIDIARIES
Unaudited Interim Consolidated Financial Statements
June 30, 2021
Amounts in thousands of U.S. dollars, except as indicated
NOTE 18. PROVISIONS, CONTINGENT ASSETS AND CONTINGENT LIABILITIES
The contingent liabilities for outstanding litigations are as follows:
Celulosa Arauco y Constitución S.A.
1. On August 25, 2005, the Chilean Servicio de Impuestos Internos (the “Chilean IRS”) issued tax resolutions No. 184 and No. 185 of 2005, and objected certain income tax returns made by Arauco on April 16, 2001 and October 31, 2001, and furthermore, requested the reimbursement of the amounts returned in connection with tax losses, along with the amendment of the FUT (Tax Profits Fund) Registry balance. In consideration to the foregoing, the above mentioned tax resolutions ordered the restitution of the historical amount as of October 31, 2002 of $4,571,664,617 Chilean Pesos (equal to ThU.S.$ 6,282 as of June 30, 2021). On November 7, 2005, the Company requested a Review of the Supervision Action (Revisión de la Actuación Fiscalizadora, or “RAF”), which is an administrative review of the tax action brought by the Chilean IRS, and filed a claim disputing the above mentioned tax resolutions No. 184 and 185 of 2005. The RAF was resolved on January 9, 2009 by the Chilean IRS, partially sustaining the Company’s request, granting a discount to the total amount of $1,209,399,164 Chilean Pesos (equal to ThU.S.$ 1,662 as of June 30, 2021), resulting in a total disputed amount as of October of 2002 of $3,362,265,453 Chilean Pesos (equal to ThU.S.$ 4,620 as of as of June 30, 2021) plus fines and interests. On February 19, 2010, the Court acknowledged receipt of the Company’s request.
On September 26, 2014, Arauco requested the submission of this claim to the competent jurisdiction of the new Tax and Customs Courts. On October 10, 2014, Arauco’s request was granted. Currently the action is being considered by these new Courts under the Docket No. RUC 14-9-0002087-3. On September 20, 2017, the Court issued its first instance decision confirming the liquidations.
On October 12, 2017, Arauco challenged the decision through an appeal, requesting the Court of Appeals of Santiago to revoke the first instance decision and uphold Arauco’s claim instead. On June 29, 2018, the Court of Appeals of Santiago issued a ruling on appeal, confirming the first instance decision. On July 19, 2018, Arauco lodged a cassation appeal based on formal and substantial flaws before the Supreme Court. (case file 24,758-2018).
On June 21, 2019, Celulosa Arauco y Constitución S.A. filed a claim before the Constitutional Court to declare the legal provision contemplated under section 53, paragraph 3 of the Tax Code unconstitutional and, as a consequence, inapplicable.
On October 29, 2019 the Constitutional Court accepted the claim filed by Celulosa Arauco y Constitución S.A., finding unconstitutional and declaring the inapplicability of section 53, paragraph 3 of the Tax Code in the context of the proceeding “Celulosa Arauco y Constitución S.A. with SII Large taxpayers”, which is in the Supreme Court docket as a result of a cassation appeal (based on form and content) under case file 24,758-2018.
Currently, the case is related in the Supreme Court.
Considering that the Company’s position is based on solid legal grounds, there is a reasonable margin for obtaining a favorable result for the Company and therefore as of as of June 30, 2021, Arauco has not made any provision whatsoever in connection with this contingency.
71
CELULOSA ARAUCO Y CONSTITUCION S.A. AND SUBSIDIARIES
Unaudited Interim Consolidated Financial Statements
June 30, 2021
Amounts in thousands of U.S. dollars, except as indicated
2. Through Res. Ex. N° 1 issued by the Superintendence of the Environment (“SMA”) on January 8, 2016, notified on January 14, 2016, the SMA formulated 11 charges against the Company, due to alleged breaches of certain Environmental Qualification Resolutions for the Valdivia Plant and of DS No. 90/2000. The 11 charges were classified as follows by the SMA: 1 critical, 5 severe, 5 minor.
On February 12, 2016, the Company submitted its defenses.
On December 15, 2017, the Superintendence of the Environment issued Exempted Resolution No. 1,487, closing the punitive administrative proceeding, absolving the company with regards to one of the charges and convicting for other 10 charges, applying a fine of 7,777 UTA (equal to ThU.S.$ 6,669 as of June 30, 2021). On December 22, 2017, the Company submitted a motion for reconsideration regarding Exempted Resolution No. 1,487, before the SMA, requesting that we be absolved of all infringements, with the exception of the charge specified under number 7 (late submission of the water quality report regarding the Cruces river). On March 23, 2018, the reconsideration appeal lodged by the company was rejected. On April 5, 2018, a judicial claim was submitted before the Third Environmental Court. On November 12, 2018, the case was in agreement, and the Minister Ms. Sibel Villalobos Volpi was appointed to draft the ruling.
On February 11, 2020 the judgment of the Third Environmental Court was notified, which partially accepted the legal claim of the Company, only as to the inadequate severity qualification of one of the charges. On February 28, 2020, both the Company and the SMA submitted cassation appeals based on form and content, to be heard and resolved by the Supreme Court.
Considering that the Company’s position is based on solid legal grounds, there is a reasonable margin for obtaining a favorable result for the Company, and therefore as of June 30, 2021, Arauco has not made any provision whatsoever in connection with this contingency.
Celulosa Arauco y Constitución S.A., Forestal Arauco S.A., Maderas Arauco S.A. and Servicios Logísticos Arauco S.A.
1. On August 13, 2018, Asociación Gremial de Dueños de Camiones de Constitución (ASODUCAM) filed a complaint seeking the performance of a contract and claiming compensation for damages against Celulosa Arauco y Constitución S.A., Forestal Arauco S.A., Maderas Arauco S.A. and Servicios Logísticos Arauco S.A., The complaint is based on alleged breaches of some agreements for the allocation, distribution and supply of cargo volumes for the years 2001 and 2005, initially executed by associates of ASODUCAM with Forestal Arauco S.A., and then, allegedly, with Servicios Logísticos Arauco S.A., in favor of the other two defendants, Celulosa Arauco and Constitución S.A. and Maderas Arauco S.A. The complaint seeks to enforce the contract, plus $575,000,000 Chilean Pesos (equal to ThU.S.$ 790 as of June 30, 2021) in compensation for damages. In the alternative, it claims (a) $11,189,270,050 Chilean Pesos (equivalent to ThU.S.$ 15,375 as of June 30, 2021), for actual damages; (b) $ 11,189,270,050 monthly during the entire course of the trial, until the termination of the contract is declared in the final ruling, for loss of profits, and (c) $5,000,000,000 Chilean Pesos (equivalent to ThU.S.$ 6,870 as of June 30, 2021) for moral damages.
On August 28, 2018 the claim was served upon Celulosa Arauco y Constitución S.A., Forestal Arauco S.A. and Maderas Arauco S.A., but notification for Servicios Logísticos Arauco S.A. is pending.
72
CELULOSA ARAUCO Y CONSTITUCION S.A. AND SUBSIDIARIES
Unaudited Interim Consolidated Financial Statements
June 30, 2021
Amounts in thousands of U.S. dollars, except as indicated
Considering that the Company’s position is based on solid legal grounds, there is a reasonable margin for obtaining a favorable result for the Company and, therefore, as of June 30, 2021, Arauco has not made any provision whatsoever in connection with this contingency.
Forestal Arauco S.A.
1. On July 7, 2015 Inversiones Forestales Los Alpes Limitada and Forestal Neltume-Carrasco S.A. filed a claim against Forestal Arauco S.A. before the Civil Court of Angol (C-502-2015), in which they request that Forestal Arauco S.A. restitute the material possession of 1,855.9 hectares, which would be part of their property “Resto del Fundo Los Alpes”, which would have an area of approximately 2,700 hectares. Likewise, they requested that it be declared that the property is the exclusive domain of the actors, the restitution of the civil and natural fruits, in addition to the deteriorations that the property would have experienced, with litigation costs.
On May 29, 2019, the lawsuit was answered, and the counterclaim of the acquisitive prescription was filed.
On September 1, 2020, the court received the trial case, and its notification remains pending.
Considering that the Company’s position is based on solid legal grounds, there is a reasonable margin for obtaining a favorable result for the Company and therefore, as of June 30, 2021, Arauco has not made any provision whatsoever in connection with this contingency.
2. On August 2, 2019, the company was notified of a lawsuit for termination of contract and compensation for damages filed by “Sociedad Recuperadora de Fibra S.A.” before the First Court of Valdivia (Case C-2215-2019). In the lawsuit, the plaintiff questions the anticipated termination of a contract by Forestal Arauco. It also claims that the company would have breached various contractual obligations regarding to 2 groups of contracts:
A. (i) Aggregates Transport Contract and (ii) Production, Cargo, Storage and Construction Management Contract for Platforms and flooring.
B. (i) Contract for the Production of Aggregates, (ii) Contract for Long Freight Services for Aggregates and (iii) Contract for Construction Services for Granular floor and Short Freight for Aggregates.
Based on the foregoing, it requests payment of compensation for an amount of $3,486,187,431 Chilean Pesos (equivalent to ThU.S.$ 4,790 as of June 30, 2021).
On September 17, 2019, Forestal Arauco S.A. answered the claim and filed a counterclaim for compensation of damages which is in the process of a conciliation hearing, requesting that the main claimant be ordered to pay $421,723,281 Chilean Pesos (equivalent to ThU.S$ 579 as of June 30, 2021).
Through the resolution dated as of January 9, 2020, the court received the case to commence the production of evidence and the notification of such resolution was delivered to both parties.
73
CELULOSA ARAUCO Y CONSTITUCION S.A. AND SUBSIDIARIES
Unaudited Interim Consolidated Financial Statements
June 30, 2021
Amounts in thousands of U.S. dollars, except as indicated
Currently, the discovery period is suspended due to the health contingency.
Considering that the Company’s position is based on solid legal grounds, there is a reasonable margin for obtaining a favorable result for the Company and therefore, as of June 30, 2021, Arauco has not made any provision whatsoever in connection with this contingency.
3. On April 15, 2020, Forestal Arauco S.A. was notified of a civil claim for recovery (demanda reivindicatoria de cuota) filed by the company “Agrícola, Forestal, Transportes e Inversiones El Quillay SpA” before the Court of Constitución (Case C-298-2020). The plaintiff sues Forestal Arauco S.A. for the restitution of 3,424.59 hectares that it would be occupying, with respect to the following properties: (i) “Predio que formaba parte de la Hijuela Sur Poniente, de la Hijuela Sur del Fundo Quivolgo”, (ii) “Lomas de Quivolgo” and, (iii) “Hijuela Astillero”. It is the opinion of the plaintiff that the aforementioned piece of land would be part of the property called “Bodega de subdelegation de Quivolgo”, in respect of which the plaintiff would have rights and shares corresponding to 4.17% of said property. Likewise, the plaintiff requests to cancel the registration of the above-mentioned properties of Forestal Arauco S.A., deeming it as a bad-faith holder.
Currently, the discussion period is suspended due to the health contingency.
Considering that the Company’s position is based on solid legal grounds, there is a reasonable margin for obtaining a favorable result for the Company and therefore, as of June 30, 2021, Arauco has not made any provision whatsoever in connection with this contingency.
4. Forestal Arauco S.A. filed before the Court of Constitución (Case C-353-2019) a claim seeking compensation on the basis of non-contractual civil liability against Ricardo Guzmán Reyes, for damages caused as a result of illegal logging inside the land of Forestal Arauco called “Parte Sur-Poniente de la Hijuela Sur de la Hacienda Quivolgo” and “Lomas de Quivolgo”. Said damages are valued in $ 100,000,000 Chilean Pesos (equivalent to ThU.S$ 137 as of June 30, 2021).
On May 2, 2020, Mr. Ricardo Guzmán answered the lawsuit and filed a counterclaim for recovery in which he requests to Forestal Arauco S.A. the restitution of 3,424.59 hectares that it would be occupying, corresponding to the following properties owned by the latter: (i) “Predio que formaba parte de la Hijuela Sur Poniente, de la Hijuela Sur del Fundo Quivolgo”, (ii) “Lomas de Quivolgo” and, (iii) “Hijuela Astillero”. It is the opinion of the plaintiff that the aforementioned piece of land would be part of the property called “Bodega de subdelegation de Quivolgo”, from which would have rights and shares corresponding to 2.38% of said property. Likelywise, the plaintiff requests to cancel the registration of the properties before mentioned of Forestal Arauco S.A., deeming it as a bad-faith holder.
Through a resolution dated November 11, 2020, the court received the trial case, and both parties were notified.
Currently, the discovery period is suspended due to the health contingency.
Considering that the Company’s position is based on solid legal grounds, there is a reasonable margin for obtaining a favorable result for the Company and therefore, as of June 30, 2021, Arauco has not made any provision whatsoever in connection with this contingency.
74
CELULOSA ARAUCO Y CONSTITUCION S.A. AND SUBSIDIARIES
Unaudited Interim Consolidated Financial Statements
June 30, 2021
Amounts in thousands of U.S. dollars, except as indicated
5. On May 11, 2020, Forestal Arauco S.A. was notified of a lawsuit of declaration of mere certainty filed against it by the company “Agrícola, Forestal, Transportes y Inversiones El Quillay SpA”, before the Court of Constitución (Case C-323-2020), in which the plaintiff claims that the property called “Predio que formaba parte de la Hijuela Sur Poniente, de la Hijuela Sur del Fundo Quivolgo” owned by Forestal Arauco S.A. would actually have an area of 498 hectares, and, consequently, that the defendant lacks the right of ownership over a portion of land corresponding to 1,768.20 hectares of said property. Based on the foregoing, the plaintiff requests the court to declare mere legal certainty regarding the foregoing and also to declare that said area is part of the property called “La Bodega de la Subdelegación de Quivolgo”, owned by the succession of Mr. José Arcos González in which it would have rights.
On July 29, 2021, the conciliation hearing, was held and an agreement was not reached by the parties. Currently, a decision on the case remains pending.
Considering that the Company’s position is based on solid legal grounds, there is a reasonable margin for obtaining a favorable result for the Company and therefore, as of June 30, 2021, Arauco has not made any provision whatsoever in connection with this contingency.
Arauco Argentina S.A.
Pursuant to law No. 25,080, the former Secretary of Agriculture, Livestock, Fishing and Foodstuffs, the enforcement agency referred to in the law approved, by Res. No. 952/2000, the forestry and industrial-forestry projects submitted by Arauco Argentina S.A. In the context of these projects, the Company afforested: 1) 4,777 hectares during 2000, in observance of its committed yearly plan; and 2) 23,012 hectares between 2000 and 2006 as a part of the multi-year afforestation plan. Likewise, a sawmill was built with installed capacity to produce 250,000 m3 of sawn timber per year.
On January 11, 2001, Arauco Argentina S.A. submitted an expansion for the approved industrial-forestry project. The expansion was approved via Res. No. 84/03 issued by the former Secretary of Agriculture, Livestock, Fishing and Foodstuffs. In accordance with the assumed obligations, the Company built a MDF board (panels) plant and afforested 8,089 hectares between 2001 and 2006.
Additionally, the Company has filed yearly forestry plans between years 2007 and 2019 for its local operations in the provinces of Misiones and Buenos Aires.
On March 25, 2019, the Secretary of Agriculture, Livestock and Fishing approved the resolution No. 2019-55-APN-SECAGYP#MPYT, approving the annual forestry plan for 2007. In addition, said organism through the resolution No. 2019-114-APN-SECAGYP#MPYT approved the annual forestry plan for 2009 on June 12, 2019, and through the resolution No. 2019-228-APN-SECAGYP#MPYT approved the annual forestry plan for 2008 on November 29, 2019. For this reason, Arauco Argentina S.A. may compute the exemption in the income tax related to the forest appraisal on the plantations to be harvested from the lands included in those plans as from the 2019 period.
In March 2005, Note No. 145/05 of the Subsecretary of Agriculture, Livestock and Afforestation suspended the benefit that exempted Arauco Argentina S.A. from paying export duties under Law No. 25,080. This measure is currently under discussion by the
75
CELULOSA ARAUCO Y CONSTITUCION S.A. AND SUBSIDIARIES
Unaudited Interim Consolidated Financial Statements
June 30, 2021
Amounts in thousands of U.S. dollars, except as indicated
Company. On November 8, 2006, the V Chamber of the National Appeals Court for Adversarial Administrative and Federal Matters issued a ruling ordering Arauco Argentina S.A. to continue to enjoy an exemption from paying the exportation duties, in the same manner and scope it had prior to the suspension ordered by Note No. 145/05, if the clearance of merchandise is performed pursuant to the guarantee regime established in article 453, subsection a) of the Customs Code, for the exempted tax obligation. The judicial measure became effective beginning on March of 2007 by collateralization through the granting of bond (caution) policies for each shipment permits exempted from payment of export duty. The company maintains an assignment of funds equivalent to $ 2,160,896,000 Argentine Pesos (ThU.S.$ 22,575 as of June 30, 2021) for guaranteed export duties between 2007-2015, which appears under not current provisions. Additionally, the Company filed a restitution claim for a total amount of ThU.S.$ 6,555, plus interests accrued from the service of the claim, corresponding to export duties between March 2005 and March 2007, as a result of the application of Note 145/05 issued by the Undersecretary of Agriculture, Livestock and Afforestation. The Company’s claim is being heard under case file No. 21830/2006 before the Federal Contentious Administrative Court No. 4. On October 28, 2019, a judgment of first instance was issued in said case, rejecting the claim and imposing the litigation costs on Arauco. Against that judgment, the Company filed an appeal and expressed the corresponding arguments in December 2019. On November 5, 2020, the Chamber of Appeals considered the arguments made by Arauco and determined that a final ruling will be issued in the case.
On the other hand, Arauco Argentina S.A. currently has a guarantee at an amount of $435,952,315 Argentine Pesos (ThU.S.$ 4,554 as of June 30, 2021) in favor of the Secretary of Agriculture, Livestock and Fishing.
Arauco Argentina S.A. believes that it has complied with all of the obligations imposed upon it by the system set forth under Law No. 25,080.
Arauco do Brasil S.A.
The Federal Reserve of Brazil contested the amortization of goodwill resulting from acquisitions of Placas do Paraná, Tafibrás, Tafisa (now, Arauco do Brasil S.A.) y Dynea.
On July 20, 2015, Arauco do Brasil was notified of the first-level administrative ruling which partially upheld the infringement. Against this ruling, a Voluntary Appeal was filed seeking to revoke the Infringement Notice before the Brazilian Administrative Tax Council (Conselho Administrativo de Recursos Fiscais de Brasil or “CARF”), which is the second administrative level.
The CARF’s decision was issued on May 16, 2017 and took into consideration certain arguments presented by the Company regarding the premium but preserving other charges. On September 27, 2018, Arauco do Brasil was notified of the CARF’s decision, for which Arauco do Brasil S.A. filed an appeal for declaration embargoes, to elicit clarifications from the CARF regarding certain points of the decision. On January 25, 2019, the CARF ruled that there were no clarifications or omissions to be made and, consequently, granted a term for filing the last remedy within the administrative realm (“Special Remedy”). This Special Remedy was submitted before the Upper Chamber of Fiscal Remedies of the CARF (CSRF) on February 11, 2019, reiterating the Company’s defense allegations regarding the matters and charges that remained in such process.
On August 28, 2020, the Company was served with an intermediate decision in Grievance of Instrument, issued by CARF that divided the claim into two parts:
76
CELULOSA ARAUCO Y CONSTITUCION S.A. AND SUBSIDIARIES
Unaudited Interim Consolidated Financial Statements
June 30, 2021
Amounts in thousands of U.S. dollars, except as indicated
| (i) | One part that remains awaiting the administrative decision in Special Remedy to the CSRF (the issue of the isolated fine of 50% and interests) with the estimated amount of R$ 29,250,417 (equivalent to ThU.S.$ 5,862 as of June 30, 2021) and that amount will be added interests and readjustments as of January 31, 2019 until the administrative discussion is finished. |
| (ii) | Second part that closes the administrative discussion (Comment of the contractual expenses deducted in the purchase of Tafisa; Comment of interests and legal expenses on debts paid in the amnesty program; payment of IRPJ and lower CSLL in the second part of 2010). Regarding this second part, the amount of R$ 31,774,176 (equivalent to ThU.S.$ 6,368 as of June 30, 2021) and to this amount interests and readjustments will be added as of August 28, 2020 until the final decision of the discussion court initiated on September 23, 2019, to continue answering that part of the claim. Thus, we enter with a Tax Debt Cancellation Action and we are introducing a guarantee for the suspension of any collection an to obtain the Certificates of Tax Compliance until the final decision of the trial. Currently we are starting to produce expert evidence in the case. |
Considering that the Company’s position is based on solid legal grounds, there is a reasonable margin for obtaining a favorable result for the Company and therefore, as of June 30, 2021, Arauco has not made any provision whatsoever in connection with this contingency.
At the closing date, there are no other contingencies in which the Companies act as obligor, that may significantly affect their financial, economic or operational conditions.
Provisions recorded as of June 30, 2021 as of December 31, 2020 are as follows:
| | | | | | | | |
| | | 06-30-2021 | | | 12-31-2020 | |
Classes of Provisions | | ThU.S.$ | | | ThU.S.$ | |
Provisions, Current | | | 385 | | | | 386 | |
Provisions for litigations | | | 385 | | | | 386 | |
Provisions, non-Current | | | 29,277 | | | | 30,450 | |
Provisions for litigations | | | 5,795 | | | | 6,968 | |
Other provisions | | | 23,482 | | | | 23,482 | |
| | | | | | | | |
Total Provisions | | | 29,662 | | | | 30,836 | |
| | | | | | | | |
77
CELULOSA ARAUCO Y CONSTITUCION S.A. AND SUBSIDIARIES
Unaudited Interim Consolidated Financial Statements
June 30, 2021
Amounts in thousands of U.S. dollars, except as indicated
| | | | | | | | | | | | |
| | | 06-30-2021 | |
| | | Litigations (*) | | | Other Provisions | | | Total | |
Movements in Provisions | | ThU.S.$ | | | ThU.S.$ | | | ThU.S.$ | |
Opening balance | | | 7,354 | | | | 23,482 | | | | 30,836 | |
Changes in provisions | | | | | | | | | | | | |
Increase in existing provisions | | | 1,253 | | | | — | | | | 1,253 | |
Used provisions | | | (2,324 | ) | | | — | | | | (2,324 | ) |
Increase (decrease) in foreign currency exchange | | | (183 | ) | | | — | | | | (183 | ) |
Other Increases (Decreases) | | | 80 | | | | — | | | | 80 | |
Total Changes | | | (1,174 | ) | | | — | | | | (1,174 | ) |
Closing balance | | | 6,180 | | | | 23,482 | | | | 29,662 | |
| | | | | | | | | | | | |
| (*) | The increase in legal claims is comprised mainly by ThU.S.$ 1,239 (Brazilian subsidiaries) and THU.S.$ 14 (Argentina) in connection with civil and labor lawsuits |
| | | | | | | | | | | | |
| | | 12-31-2020 | |
| | | Litigations (*) | | | Other Provisions | | | Total | |
Movements in Provisions | | ThU.S.$ | | | ThU.S.$ | | | ThU.S.$ | |
Opening balance | | | 9,524 | | | | 23,500 | | | | 33,024 | |
Changes in provisions | | | | | | | | | | | | |
Increase in existing provisions | | | 3,257 | | | | — | | | | 3,257 | |
Used provisions | | | (2,832 | ) | | | — | | | | (2,832 | ) |
Increase (decrease) in foreign currency exchange | | | (2,240 | ) | | | — | | | | (2,240 | ) |
Other Increases (Decreases) | | | (355 | ) | | | (18 | ) | | | (373 | ) |
Total Changes | | | (2,170 | ) | | | (18 | ) | | | (2,188 | ) |
Closing balance | | | 7,354 | | | | 23,482 | | | | 30,836 | |
| | | | | | | | | | | | |
| (*) | The increase in legal claims is comprised mainly by ThU.S.$ 3,045 and ThU.S.$ 212 (Brazilian and Argentine subsidiaries respectively) in connection with civil and labor lawsuits. |
Provisions for litigations are related to labor and tax claims whose payment period is uncertain. Other provisions mainly include constitution of provision for the lawsuit of export duties (see Arauco Argentina’s contingent liability set forth in this note).
78
CELULOSA ARAUCO Y CONSTITUCION S.A. AND SUBSIDIARIES
Unaudited Interim Consolidated Financial Statements
June 30, 2021
Amounts in thousands of U.S. dollars, except as indicated
NOTE 19. INTANGIBLE ASSETS
| | | | | | | | |
| | | 06-30-2021 | | | 12-31-2020 | |
Classes of Intangible Assets, Net | | ThU.S.$ | | | ThU.S.$ | |
Intangible assets, net | | | 97,140 | | | | 102,090 | |
Computer software | | | 31,751 | | | | 31,877 | |
Water rights | | | 5,684 | | | | 5,684 | |
Customer | | | 32,683 | | | | 35,092 | |
Other identifiable intangible assets | | | 27,022 | | | | 29,437 | |
| | | | | | | | |
Classes of intangible Assets, Gross | | | 236,318 | | | | 232,391 | |
Computer software | | | 121,907 | | | | 116,315 | |
Water rights | | | 5,684 | | | | 5,684 | |
Customer | | | 76,201 | | | | 75,626 | |
Other identifiable intangible assets | | | 32,526 | | | | 34,766 | |
| | | | | | | | |
Classes of accumulated amortization and impairment | | | | | | | | |
Total accumulated amortization and impairment | | | (139,178 | ) | | | (130,301 | ) |
Accumulated amortization and impairment, intangible assets | | | (139,178 | ) | | | (130,301 | ) |
Computer software | | | (90,156 | ) | | | (84,438 | ) |
Customer | | | (43,518 | ) | | | (40,534 | ) |
Other identifiable intangible assets | | | (5,504 | ) | | | (5,329 | ) |
| | | | | | | | |
Reconciliation of the carrying amount of intangible assets at the beginning and end of each reporting period balances
| | | | | | | | | | | | | | | | | | | | |
| | | 06-30-2021 | |
| | | Computer
Software | | | Water
Rights | | | Customer | | | Others | | | TOTAL | |
Reconciliation of intangible assets | | ThU.S.$ | | | ThU.S.$ | | | ThU.S.$ | | | ThU.S.$ | | | ThU.S.$ | |
Opening Balance | | | 31,877 | | | | 5,684 | | | | 35,092 | | | | 29,437 | | | | 102,090 | |
Changes | | | | | | | | | | | | | | | | | | | | |
Additions | | | 1,461 | | | | — | | | | — | | | | 1,390 | | | | 2,581 | |
Disposals | | | — | | | | — | | | | — | | | | (479 | ) | | | (479 | ) |
Amortization | | | (6,058 | ) | | | — | | | | (2,663 | ) | | | (111 | ) | | | (8,832 | ) |
Increase (Decrease) related to foreign currency translation | | | 288 | | | | — | | | | 254 | | | | 5 | | | | 547 | |
Other Increases (Decreases) | | | 4,183 | | | | — | | | | — | | | | (3,220 | ) | | | 963 | |
Changes Total | | | (126 | ) | | | — | | | | (2,409 | ) | | | (2,415 | ) | | | (4,950 | ) |
Closing Balance | | | 31,751 | | | | 5,684 | | | | 32,683 | | | | 27,022 | | | | 97,140 | |
| | | | | | | | | | | | | | | | | | | | |
| | | | | | | | | | | | | | | | | | | | |
| | | 12-31-2020 | |
| | | Computer
Software | | | Water
Rights | | | Customer | | | Others | | | TOTAL | |
Reconciliation of intangible assets | | ThU.S.$ | | | ThU.S.$ | | | ThU.S.$ | | | ThU.S.$ | | | ThU.S.$ | |
Opening Balance | | | 39,065 | | | | 5,966 | | | | 39,981 | | | | 21,240 | | | | 106,252 | |
Changes | | | | | | | | | | | | | | | | | | | | |
Additions | | | 6,084 | | | | — | | | | — | | | | 4,461 | | | | 10,545 | |
Additions through business combination | | | — | | | | — | | | | — | | | | 5,162 | | | | 5,162 | |
Disposals | | | (10 | ) | | | — | | | | — | | | | — | | | | (10 | ) |
Amortization | | | (10,112 | ) | | | — | | | | (5,120 | ) | | | (329 | ) | | | (15,561 | ) |
Increase (Decrease) related to foreign currency translation | | | (277 | ) | | | — | | | | 231 | | | | (116 | ) | | | (162 | ) |
Other Increases (Decreases) | | | (2,873 | ) | | | (282 | ) | | | — | | | | (981 | ) | | | (4,136 | ) |
Changes Total | | | (7,188 | ) | | | (282 | ) | | | (4,889 | ) | | | 8,197 | | | | (4,162 | ) |
Closing Balance | | | 31,877 | | | | 5,684 | | | | 35,092 | | | | 29,437 | | | | 102,090 | |
| | | | | | | | | | | | | | | | | | | | |
| | | | |
| | | Years of Useful life (Average) | |
Computer Software | | | 5 | |
Customer | | | 15 | |
Brands | | | 7 | |
The amortization of customer and computer software is presented in the Interim Consolidated Statements of Profit or Loss under the Administrative Expenses line item.
79
CELULOSA ARAUCO Y CONSTITUCION S.A. AND SUBSIDIARIES
Unaudited Interim Consolidated Financial Statements
June 30, 2021
Amounts in thousands of U.S. dollars, except as indicated
NOTE 20. BIOLOGICAL ASSETS
Biological assets comprise forestry plantations, mainly radiata and taeda pine, and to a lesser extent eucalyptus. The plantations are located in Chile, Argentina, Brazil and Uruguay.
As of June 30, 2021 Arauco has a total surface of 1.7 million hectares of which 998 thousand hectares are used for forestry planting, 493 thousand hectares are native forest, 111 thousand hectares are used for other purposes and 88 thousand hectares not yet planted.
For the period ended June 30, 2021, the production volume of logs totaled 9.9 million m3 (9.1 million m3 as of June 30, 2020).
Measurements of fair value of Arauco’s biological assets are classified as Level 3, due to the fact that inputs are not observable. However, this information reflects the assumptions that market participants would use in pricing the asset, including assumptions about risk.
These unobservable inputs were developed using the best information available and includes internal data from Arauco. These unobservable inputs can be adjusted if the available information indicates that other market participants would use different information or there is something specific in Arauco that is not available to other market participants.
The main considerations in determining the fair value of biological assets include the following:
| • | | Arauco uses discounted expected future cash flows of its forest plantations, which are based on a harvest projection date for all existing plantations. |
| • | | Current forestry plantations are projected based on a net volume that will not decrease, with a minimum growth equivalent to the current supply demand. |
| • | | Future plantations are not considered. |
| • | | The harvest of forestry plantations supplies raw materials for all other products that Arauco produces and trades. By directly controlling the development of forests that will be processed, Arauco ensures high quality timber for each of its products. |
| • | | Expected cash flows are determined in terms of harvest and expected sale of forestry products, associated with the demand from the Company’s own industrial centers and sales to third parties at market prices. Sales margin of the different products that are harvested in the forest is also considered in the valuation. The changes in the value of the plantations pursuant to the criteria defined above are accounted for in the results for the fiscal year, as established in IAS 41. These changes are presented in the Interim Consolidated Statements of Profit or Loss under the line item Other income per function, which as of June 30, 2021 amounted to ThU.S.$ 83,080 (ThU.S.$ 88,143 as of June 30, 2020). The appraisal of biological assets resulted in a greater cost of the lumber sold in comparison to the real incurred cost, which is presented included in the cost of sales which as of June 30, 2021 amounted to ThU.S.$ 96,584 (ThU.S.$ 85,298 as of June 30, 2020). |
| • | | Forestry plantations are harvested according to the needs of Arauco’s production plants. |
80
CELULOSA ARAUCO Y CONSTITUCION S.A. AND SUBSIDIARIES
Unaudited Interim Consolidated Financial Statements
June 30, 2021
Amounts in thousands of U.S. dollars, except as indicated
| • | | The discount rates used are 5.5% in Chile, 6.7% Brazil, 16.2% in Argentina and 6.5% in Uruguay. |
| • | | It is expected that prices of harvested timber are constant in real terms based on market prices. |
| • | | Cost expectations with respect to the lifetime of the forests are constant based on estimated costs included in the projections made by Arauco. |
| • | | The average crop age by species and country is: |
| | | | | | | | | | | | | | | | |
| | | Chile | | | Argentina | | | Brazil | | | Uruguay | |
Pine | | | 24 | | | | 15 | | | | 15 | | | | — | |
Eucalyptus | | | 12 | | | | 10 | | | | 7 | | | | 10 | |
The following table sets forth changes in fair value of biological assets considering variations in significant assumptions considered in calculating the fair value of the assets:
| | | | | | | | |
| | | | | | ThU.S.$ | |
Discount rate | | | 0.5 | | | | (149,083 | ) |
| | | -0.5 | | | | 159,429 | |
Margins (%) | | | 10 | | | | 442,060 | |
| | | -10 | | | | (442,060 | ) |
The significant unobservable input data used in the measurement of the fair value of biological assets are discount rates and sales margins of the different products that are harvested from the forest. Increases (decreases) in any of these input data considered in isolation would result in a smaller or greater fair value measurement.
The adjustment to fair value of biological assets minus sale costs is recorded in the Interim Consolidated Statements of Profit or Loss, under the line item Other Income or Other Expenses, depending on whether it corresponds to profits or losses.
Forestry plantations classified as current Biological assets are those to be harvested and sold within twelve months after the reporting period.
The Company has contracted fire insurance policies for its forestry plantations, which in conjunction with the Company’s resources, allow risks to be minimized.
As of the date of these Interim Consolidated Financial Statements, there are no committed disbursements for the acquisition of biological assets.
Detail of Biological Assets Pledged as Security
As of June 30, 2021, there are no forestry plantations pledged as security.
81
CELULOSA ARAUCO Y CONSTITUCION S.A. AND SUBSIDIARIES
Unaudited Interim Consolidated Financial Statements
June 30, 2021
Amounts in thousands of U.S. dollars, except as indicated
Detail of Biological Assets with Restricted Ownership
As of the date of these Interim Consolidated Financial statements, there are no biological assets with restricted ownership.
No significant government grants have been received.
Current and Non-Current Biological Assets
As of the date of these Interim Consolidated Financial Statements, the Current and Non-current biological assets are as follows:
| | | | | | | | |
| | | 06-30-2021 | | | 12-31-2020 | |
| | | ThU.S.$ | | | ThU.S.$ | |
Current | | | 297,890 | | | | 302,710 | |
Non-current | | | 3,189,681 | | | | 3,296,117 | |
Total | | | 3,487,571 | | | | 3,598,827 | |
| | | | | | | | |
Reconciliation of carrying amount of biological assets
| | | | | | | | | | | | |
| | | 06-30-2021 | |
| | | Current | | | Non-current | | | Total | |
Movement | | ThU.S.$ | | | ThU.S.$ | | | ThU.S.$ | |
Opening Balance | | | 302,710 | | | | 3,296,117 | | | | 3,598,827 | |
Changes in real incurred cost | | | 26,816 | | | | (74,049 | ) | | | (47,233 | ) |
Additions through acquisition and costs of new plantations | | | 78 | | | | 104,816 | | | | 104,894 | |
Sales | | | — | | | | (1,065 | ) | | | (1,065 | ) |
Harvest | | | (53,065 | ) | | | — | | | | (53,065 | ) |
Increases (decreases) in Foreign Currency Translation | | | 1,760 | | | | 9,091 | | | | 10,851 | |
Loss of forest due to fires | | | — | | | | (6,155 | ) | | | (6,155 | ) |
Transfers to non-current assets held for sale | | | — | | | | (76,286 | ) | | | (76,286 | ) |
Transfers from non-current to current | | | 81,140 | | | | (81,140 | ) | | | — | |
Decrease due to loss of control in subsidiary | | | (3,097 | ) | | | (19,977 | ) | | | (23,074 | ) |
Other increases (decreases) | | | — | | | | (3,333 | ) | | | (3,333 | ) |
Changes in fair value | | | (31,636 | ) | | | (32,387 | ) | | | (64,023 | ) |
Gain (losses) arising from changes in fair value minus sale costs | | | — | | | | 83,080 | | | | 83,080 | |
Sales | | | — | | | | (1,937 | ) | | | (1,937 | ) |
Harvest | | | (103,231 | ) | | | — | | | | (103,231 | ) |
Loss of forest due to fires | | | — | | | | (11,398 | ) | | | (11,398 | ) |
Transfers to non-current assets held for sale | | | — | | | | (22,168 | ) | | | (22,168 | ) |
Transfers from non-current to current | | | 73,359 | | | | (73,359 | ) | | | — | |
Decrease due to loss of control in subsidiary | | | (1,764 | ) | | | (6,605 | ) | | | (8,369 | ) |
Total Changes | | | (4,820 | ) | | | (106,436 | ) | | | (111,256 | ) |
Closing balance | | | 297,890 | | | | 3,189,681 | | | | 3,487,571 | |
| | | | | | | | | | | | |
| | | | | | | | | | | | |
| | | 12-31-2020 | |
| | | Current | | | Non-current | | | Total | |
Movement | | ThU.S.$ | | | ThU.S.$ | | | ThU.S.$ | |
Opening Balance | | | 275,792 | | | | 3,393,634 | | | | 3,669,426 | |
Changes in real incurred cost | | | (1,140 | ) | | | (68,081 | ) | | | (69,221 | ) |
Additions through acquisition and costs of new plantations | | | 2,590 | | | | 182,746 | | | | 185,336 | |
Sales | | | — | | | | (47,110 | ) | | | (47,110 | ) |
Harvest | | | (99,300 | ) | | | — | | | | (99,300 | ) |
Increases (decreases) in Foreign Currency Translation | | | (12,889 | ) | | | (85,393 | ) | | | (98,282 | ) |
Loss of forest due to fires | | | (326 | ) | | | (9,535 | ) | | | (9,861 | ) |
Transfers from non-current to current | | | 108,786 | | | | (108,786 | ) | | | — | |
Other increases (decreases) | | | (1 | ) | | | (3 | ) | | | (4 | ) |
Changes in fair value | | | 28,058 | | | | (29,436 | ) | | | (1,378 | ) |
Gain (losses) arising from changes in fair value minus sale costs | | | — | | | | 182,950 | | | | 182,950 | |
Sales | | | — | | | | 15,184 | | | | 15,184 | |
Harvest | | | (182,753 | ) | | | — | | | | (182,753 | ) |
Loss of forest due to fires | | | — | | | | (16,759 | ) | | | (16,759 | ) |
Transfers from non-current to current | | | 210,811 | | | | (210,811 | ) | | | — | |
Total Changes | | | 26,918 | | | | (97,517 | ) | | | (70,599 | ) |
Closing balance | | | 302,710 | | | | 3,296,117 | | | | 3,598,827 | |
| | | | | | | | | | | | |
82
CELULOSA ARAUCO Y CONSTITUCION S.A. AND SUBSIDIARIES
Unaudited Interim Consolidated Financial Statements
June 30, 2021
Amounts in thousands of U.S. dollars, except as indicated
NOTE 21. ENVIRONMENTAL MATTERS
Environment Management
For Arauco, sustainability means management strategy. This strategy incorporates values, commitments and standards, that together with the adoption of best practices as well as the use of the latest available technologies, seek to continuously improve the Company’s environmental management. It is the environmental department and each of its specialists that ensure these guidelines are met and are put into practice in everyday company operations.
All Arauco’s production units have certified environmental management systems, which reinforce the Company’s commitment to environmental performance and ensure the traceability of all raw materials used.
Arauco uses several supplies in its productive processes such as wood, chemical products, and water, etc., which in turn produce liquid and gas emissions. As a way to make the Company’s environmental management more efficient, significant progress has been made to reduce consumption and emissions.
Environmental investments have been made related to the control of atmospheric emissions, process improvements, water and waste management, as well as effluent treatment, in order to improve the environmental performance of all Arauco’s business units.
These investments are reflected in the Interim Consolidated Financial Statements as Properties, Plants and Equipment when they refer to disbursements in major works executed and are reflected in Expenses when they refer to improvements or management not directly associated with investment projects.
Detail information of disbursements related to the environment
As of June 30, 2021 and as of December 31, 2020 Arauco has made and / or has committed the following disbursements in major environmental projects:
83
CELULOSA ARAUCO Y CONSTITUCION S.A. AND SUBSIDIARIES
Unaudited Interim Consolidated Financial Statements
June 30, 2021
Amounts in thousands of U.S. dollars, except as indicated
| | | | | | | | | | | | | | | | | | | | | | | | | | |
06-30-2021 | | Disbursements undertaken 2021 | | | Committed
Disbursements | |
| | | | | State | | | Amount | | | Asset | | | Asset/expense | | | Amount | | | Estimated | |
Company | | Name of project | | of project | | | ThU.S.$ | | | Expense | | | destination item | | | ThU.S.$ | | | date | |
Celulosa Arauco y Constitucion S.A. | | Investment projects for the control and management of gas emissions from industrial process | | | In process | | | | 128 | | | | Assets | | |
| Properties, plants
and equipments |
| | | 931 | | | | 2021 | |
Celulosa Arauco y Constitucion S.A. | | Environmental improvement studies | | | In process | | | | 9,428 | | | | Assets | | |
| Properties, plants
and equipments |
| | | 17,913 | | | | 2021 | |
Celulosa Arauco y Constitucion S.A. | | Investment projects for the control and management of hazardous liquids and water energy optimization of industrial plants | | | In process | | | | 537 | | | | Assets | | |
| Properties, plants
and equipments |
| | | 9,647 | | | | 2021 | |
Celulosa Arauco y Constitucion S.A. | | Environmental improvement studies | | | In process | | | | 4,843 | | | | Expenses | | | | Operating costs | | | | 7,844 | | | | 2021 | |
Celulosa Arauco y Constitucion S.A. | | Investment projects for the control and management of gas emissions from industrial process | | | Finished | | | | — | | | | Expenses | | | | Operating costs | | | | 597 | | | | — | |
Celulosa Arauco y Constitucion S.A. | | Expansion of solid industrial waste dumpsite for management of these in the future | | | In process | | | | 4,665 | | | | Expenses | | | | Operating costs | | | | 6,118 | | | | 2021 | |
Celulosa Arauco y Constitucion S.A. | | Environmental improvement studies | | | Finished | | | | — | | | | Expenses | | | | Operating costs | | | | 1,200 | | | | — | |
Arauco Argentina S.A. | | Construction emissary | | | In process | | | | — | | | | Assets | | |
| Properties, plants
and equipments |
| | | 697 | | | | 2021 | |
Arauco Argentina S.A. | | Expansion of solid industrial waste dumpsite for management of these in the future | | | In process | | | | 727 | | | | Assets | | |
| Properties, plants
and equipments |
| | | 9,466 | | | | 2021 | |
Arauco Argentina S.A. | | Investment projects for the control and management of hazardous liquids and water energy optimization of industrial plants | | | In process | | | | 409 | | | | Assets | | |
| Properties, plants
and equipments |
| | | 994 | | | | 2021 | |
Arauco Argentina S.A. | | Investment projects for the control and management of gas emissions from industrial process | | | In process | | | | 35 | | | | Assets | | |
| Properties, plants
and equipments |
| | | 2,112 | | | | 2021 | |
Maderas Arauco S.A. | | Investment projects for the control and management of hazardous liquids and water energy optimization of industrial plants | | | In process | | | | 301 | | | | Expenses | | | | Operating costs | | | | 301 | | | | 2021 | |
Maderas Arauco S.A. | | Investment projects for the control and management of hazardous liquids and water energy optimization of industrial plants | | | In process | | | | 753 | | | | Assets | | |
| Properties, plants
and equipments |
| | | 363 | | | | 2021 | |
Forestal Arauco S.A. | | Environmental improvement studies | | | In process | | | | 616 | | | | Expenses | | |
| Administration
expenses |
| | | 878 | | | | 2021 | |
Celulosa y Energía Punta Pereira S.A. | | Investment projects for the control and management of gas emissions from industrial process | | | Finished | | | | 221 | | | | Assets | | |
| Properties, plants
and equipments |
| | | — | | | | — | |
Celulosa y Energía Punta Pereira S.A. | | Expansion of solid industrial waste dumpsite for management of these in the future | | | Finished | | | | 547 | | | | Assets | | |
| Properties, plants
and equipments |
| | | — | | | | — | |
Celulosa y Energía Punta Pereira S.A. | | Investment projects for the control and management of hazardous liquids and water energy optimization of industrial plants | | | Finished | | | | 1,865 | | | | Assets | | |
| Properties, plants
and equipments |
| | | — | | | | — | |
Arauco North America, Inc | | Environmental improvement studies | | | In process | | | | 292 | | | | Assets | | |
| Properties, plants
and equipments |
| | | — | | | | — | |
Arauco North America, Inc | | Environmental improvement studies | | | Finished | | | | 1,412 | | | | Assets | | |
| Properties, plants
and equipments |
| | | — | | | | — | |
| | | | | | | | | | | | | | | | | | | | | | | | | | |
| | | | | TOTAL | | | | 26,779 | | | | | | | | | | | | 59,061 | | | | | |
| | | | | | | | | | | | | | | | | | | | | | | | | | |
| | | | | | | | | | | | | | | | | | | | | | | | | | |
12-31-2020 | | Disbursements undertaken 2020 | | | Committed
Disbursements | |
| | | | | State | | | Amount | | | Asset | | | Asset/expense | | | Amount | | | Estimated | |
Company | | Name of project | | of project | | | ThU.S.$ | | | Expense | | | destination item | | | ThU.S.$ | | | date | |
Celulosa Arauco y Constitucion S.A. | | Investment projects for the control and management of gas emissions from industrial process | | | In process | | | | 633 | | | | Assets | | |
| Properties, plants
and equipments |
| | | 979 | | | | 2021 | |
Celulosa Arauco y Constitucion S.A. | | Environmental improvement studies | | | In process | | | | 25,947 | | | | Assets | | |
| Properties, plants
and equipments |
| | | 27,215 | | | | 2021 | |
Celulosa Arauco y Constitucion S.A. | | Investment projects for the control and management of gas emissions from industrial process | | | Finished | | | | 1,750 | | | | Expenses | | | | Operating costs | | | | — | | | | | |
Celulosa Arauco y Constitucion S.A. | | Investment projects for the control and management of hazardous liquids and water energy optimization of industrial plants | | | In process | | | | 2,443 | | | | Assets | | |
| Properties, plants
and equipments |
| | | 9,660 | | | | 2021 | |
Celulosa Arauco y Constitucion S.A. | | Environmental improvement studies | | | Finished | | | | 10,693 | | | | Expenses | | | | Operating costs | | | | — | | | | — | |
Celulosa Arauco y Constitucion S.A. | | Expansion of solid industrial waste dumpsite for management of these in the future | | | Finished | | | | 11,786 | | | | Expenses | | | | Operating costs | | | | — | | | | — | |
Arauco Argentina S.A. | | Construction emissary | | | In process | | | | — | | | | Assets | | |
| Properties, plants
and equipments |
| | | 697 | | | | 2021 | |
Arauco Argentina S.A. | | Expansion of solid industrial waste dumpsite for management of these in the future | | | In process | | | | 702 | | | | Assets | | |
| Properties, plants
and equipments |
| | | 10,368 | | | | 2021 | |
Arauco Argentina S.A. | | Investment projects for the control and management of hazardous liquids and water energy optimization of industrial plants | | | In process | | | | 125 | | | | Assets | | |
| Properties, plants
and equipments |
| | | 560 | | | | 2021 | |
Arauco Argentina S.A. | | Investment projects for the control and management of gas emissions from industrial process | | | In process | | | | 1,453 | | | | Assets | | |
| Properties, plants
and equipments |
| | | 2,147 | | | | 2021 | |
Maderas Arauco S.A. | | Expansion of solid industrial waste dumpsite for management of these in the future | | | In process | | | | 178 | | | | Expenses | | | | Operating costs | | | | — | | | | — | |
Maderas Arauco S.A. | | Investment projects for the control and management of hazardous liquids and water energy optimization of industrial plants | | | In process | | | | 464 | | | | Expenses | | | | Operating costs | | | | — | | | | — | |
Maderas Arauco S.A. | | Investment projects for the control and management of hazardous liquids and water energy optimization of industrial plants | | | In process | | | | 230 | | | | Assets | | |
| Properties, plants
and equipments |
| | | 435 | | | | 2021 | |
Forestal Arauco S.A. | | Environmental improvement studies | | | In process | | | | 324 | | | | Expenses | | |
| Administration
expenses |
| | | 105 | | | | 2021 | |
Celulosa y Energía Punta Pereira S.A. | | Investment projects for the control and management of hazardous liquids and water energy optimization of industrial plants | | | In process | | | | 1,983 | | | | Assets | | |
| Properties, plants
and equipments |
| | | 836 | | | | 2021 | |
Celulosa y Energía Punta Pereira S.A. | | Environmental improvement studies | | | Finished | | | | 221 | | | | Assets | | |
| Properties, plants
and equipments |
| | | — | | | | — | |
Celulosa y Energía Punta Pereira S.A. | | Expansion of solid industrial waste dumpsite for management of these in the future | | | Finished | | | | 547 | | | | Assets | | |
| Properties, plants
and equipments |
| | | — | | | | — | |
Celulosa y Energía Punta Pereira S.A. | | Investment projects for the control and management of hazardous liquids and water energy optimization of industrial plants | | | Finished | | | | 667 | | | | Assets | | |
| Properties, plants
and equipments |
| | | — | | | | — | |
Forestal Los Lagos S.A. | | Environmental improvement studies | | | In process | | | | 179 | | | | Expenses | | | | Operating costs | | | | 69 | | | | 2021 | |
Arauco North America, Inc | | Environmental improvement studies | | | In process | | | | 784 | | | | Assets | | |
| Properties, plants
and equipments |
| | | — | | | | — | |
Arauco North America, Inc | | Environmental improvement studies | | | Finished | | | | 628 | | | | Assets | | |
| Properties, plants
and equipments |
| | | — | | | | — | |
Arauco Industria de México, S.A.de C.V. | | Investment projects for the control and management solid industrial waste dumpsite for management of these in the future | | | Finished | | | | 223 | | | | Expenses | | | | Operating costs | | | | — | | | | — | |
| | | | | | | | | | | | | | | | | | | | | | | | | | |
| | | | | TOTAL | | | | 61,960 | | | | | | | | | | | | 53,071 | | | | | |
| | | | | | | | | | | | | | | | | | | | | | | | | | |
84
CELULOSA ARAUCO Y CONSTITUCION S.A. AND SUBSIDIARIES
Unaudited Interim Consolidated Financial Statements
June 30, 2021
Amounts in thousands of U.S. dollars, except as indicated
NOTE 22. NON-CURRENT ASSETS HELD FOR SALE
Arauco carried out a bidding process for the sale of forestry land (80,489 hectares), in which various domestic and foreign companies participated. In December 2020, bids were received from interested parties, and Arauco selected the proposal submitted by BTG Pactual Timberland Investment Group LLC, and also comprising British Columbia Investment Management Corporation and APG Asset Management N.V. (the “Consorcio”), as this offer contained the highest price and also proposed a working procedure to reach a final agreement within a reasonable period of time. This ongoing process involved the reclassification to assets held for the sale of land, biological assets and farm roads.
The following table sets forth information on the main types of non-current assets held for sale:
| | | | | | | | |
| | | 06-30-2021 | | | 12-31-2020 | |
| | | ThU.S.$ | | | ThU.S.$ | |
Land | | | 28,954 | | | | 2,415 | |
Buildings | | | 1,639 | | | | 1,256 | |
Property, plant and equipment | | | 206 | | | | 206 | |
Forest | | | 98,454 | | | | — | |
Farm roads | | | 2,707 | | | | — | |
Total | | | 131,960 | | | | 3,877 | |
| | | | | | | | |
As of June 30, 2021 and as of December 31, 2020, there were no significant effects on results related to the sale of assets held for sale.
85
CELULOSA ARAUCO Y CONSTITUCION S.A. AND SUBSIDIARIES
Unaudited Interim Consolidated Financial Statements
June 30, 2021
Amounts in thousands of U.S. dollars, except as indicated
NOTE 23. FINANCIAL INSTRUMENTS
23.1 Classification
Arauco’s financial instruments as of June 30, 2021 and as of December 31, 2020, are displayed in the table below. Regarding those instruments valued at an amortized cost, an estimation of their fair value is displayed for informational purposes.
| | | | | | | | | | | | | | | | |
| | | June 2021 | | | December 2020 | |
Financial Instruments Thousands of dollars | | Carrying
amount | | | Fair Value | | | Carrying
amount | | | Fair Value | |
Financial assets at fair value through profit or loss (held for trading) | | | 66,001 | | | | 66,001 | | | | 199,771 | | | | 199,771 | |
Derivatives (1) | | | — | | | | — | | | | 29 | | | | 29 | |
Mutual funds (2) | | | 66,001 | | | | 66,001 | | | | 199,742 | | | | 199,742 | |
Financial assets at amortized cost | | | 1,967,841 | | | | 1,967,841 | | | | 1,625,235 | | | | 1,625,235 | |
Cash and cash equivalents (amortized cost) | | | 1,067,728 | | | | 1,067,728 | | | | 864,972 | | | | 864,972 | |
Cash | | | 453,371 | | | | 453,371 | | | | 357,453 | | | | 357,453 | |
Time deposits | | | 614,357 | | | | 614,357 | | | | 507,519 | | | | 507,519 | |
Accounts Receivable (net) | | | 894,301 | | | | 894,301 | | | | 753,987 | | | | 753,987 | |
Trade and other receivables | | | 788,793 | | | | 788,793 | | | | 647,924 | | | | 647,924 | |
Lease receivable | | | 82 | | | | 82 | | | | 135 | | | | 135 | |
Other receivables | | | 105,426 | | | | 105,426 | | | | 105,928 | | | | 105,928 | |
Accounts receivable due from related parties | | | 5,812 | | | | 5,812 | | | | 6,274 | | | | 6,274 | |
Other financial assets (3) | | | — | | | | — | | | | 2 | | | | 2 | |
Hedging assets | | | 19,979 | | | | 19,979 | | | | 30,714 | | | | 30,714 | |
| | | | | | | | | | | | | | | | |
Financial liabilities at amortized cost (4) | | | 6,598,132 | | | | 7,073,968 | | | | 6,824,202 | | | | 7,641,425 | |
Bonds issued denominated in U.S. Dollars | | | 3,521,638 | | | | 3,884,419 | | | | 3,519,027 | | | | 3,970,081 | |
Bonds issued denominated in U.F. (5) | | | 1,164,769 | | | | 1,244,935 | | | | 1,188,917 | | | | 1,458,106 | |
Bank Loans in U.S. Dollars | | | 498,281 | | | | 509,719 | | | | 741,669 | | | | 770,551 | |
Bank borrowing denominated in U.S. Dollars | | | 514,094 | | | | 535,545 | | | | 532,591 | | | | 600,689 | |
Lease liabilities | | | 195,262 | | | | 195,262 | | | | 211,755 | | | | 211,755 | |
Trade and other payables | | | 700,226 | | | | 700,226 | | | | 626,504 | | | | 626,504 | |
Accounts payable to related parties | | | 3,862 | | | | 3,862 | | | | 3,739 | | | | 3,739 | |
Financial liabilities at fair value through profit or loss | | | — | | | | — | | | | 74 | | | | 74 | |
Hedging Liabilities | | | 111,138 | | | | 111,138 | | | | 39,586 | | | | 39,586 | |
| | | | | | | | | | | | | | | | |
| (1) | The derivatives are presented in the line item “other financial assets” in the consolidated statements of financial position. |
| (2) | Although mutual funds are measured at fair value through profit or loss for purposes of the consolidated statements of financial position mutual funds are classified as “Cash and cash equivalents” due to the are highly liquid short-term investment. |
| (3) | Corresponds to the balance of assets from margin call for current derivatives (collateral). |
| (4) | Financial liabilities measured at amortized cost, other than “Trade and other payables”, “Accounts payable to related parties” and derivatives are presented in the consolidated statements of financial position in the line item “Other financial liabilities” as current and non-current based on their maturity. |
| (5) | The Unidad de Fomento (“U.F.”) is a unit of account that is linked to, and is adjusted daily to reflect changes in the Chilean consumer price index. |
86
CELULOSA ARAUCO Y CONSTITUCION S.A. AND SUBSIDIARIES
Unaudited Interim Consolidated Financial Statements
June 30, 2021
Amounts in thousands of U.S. dollars, except as indicated
23.2 Fair Value Hierarchy of Financial Assets and Liabilities
The assets and liabilities measured at fair value in the interim consolidated statements of financial position as of June 30, 2021, have been measured based on the valuation methodologies provided in IFRS 13. The methodologies applied for each financial instrument are classified according to their hierarchy as follows:
| • | | Level 1: Securities or quoted prices in active markets for identical assets and liabilities |
| • | | Level 2: Inputs other than quoted prices included within Level 1 that are observable for the assets or liabilities, either directly (i.e. as prices) or indirectly (i.e. derived from prices); and |
| • | | Level 3: Inputs for the assets or liabilities that are not based on observable market data (unobservable inputs). |
| | | | | | | | | | | | | | | | |
Fair Value | | June 2021
ThU.S.$ | | | Level 1
ThU.S.$ | | | Level 2
ThU.S.$ | | | Level 3
ThU.S.$ | |
Financial assets at fair value | | | | | | | | | | | | | | | | |
Mutual Funds | | | 66,001 | | | | 66,001 | | | | — | | | | — | |
| | | | |
Hedging assets | | | 19,979 | | | | — | | | | 19,979 | | | | — | |
| | | | |
Hedging liabilities | | | 111,138 | | | | — | | | | 111,138 | | | | — | |
At the closing date of these interim consolidated financial statements, there have been no transfers between the different hierarchy levels.
23.3 Explanation of the valuation of Financial Instruments.
Cash and cash equivalent and accounts receivable
The carrying amount of accounts receivable, cash and cash equivalents (including mutual funds), and other financial assets and liabilities approximate their fair value due to the short-term nature of such instruments.
Derivative financial instruments
Arauco’s current derivatives are valued under the cash flow discount method. These flows are discounted at the rate applicable according to the transaction’s and counterparties’ risk, using an internal methodology based on the information obtained from Bloomberg.
Given thath our cross-currency swaps correspond to future flows in UF, U.S. dollars and Euros, Arauco calculates the current value of such flows by using the UF zero coupon curve, Dollar zero coupon and the Euro zero coupon.
The fair value of the interest rate swap contracts is calculated by reference to the rate differential between the agreed upon rate and the market rate as of the end date of these financial statements.
The fair value of the currency forward contracts is calculated by reference to the current forward exchange rates of contracts with similar maturity profiles.
87
CELULOSA ARAUCO Y CONSTITUCION S.A. AND SUBSIDIARIES
Unaudited Interim Consolidated Financial Statements
June 30, 2021
Amounts in thousands of U.S. dollars, except as indicated
The fair value of zero cost collar contracts is calculated by reference to the price differential between the agreed price range and the market price of the hedge’s object.
The counterparty risk uses the Z-Spread obtained from the curve of the bonds issued by counterparties, and they are deducted from each flow as appropriate.
Financial Liabilities
The fair value of bonds issued was determined with reference to quoted market prices as they have standard terms and conditions.
The fair value of bank borrowings was determined based on discounted cash flow analysis applying the corresponding discount yield curves to the remaining term to maturity.
Disclosures of the fair value of financial liabilities at amortized cost are determined via the use of discounted cash flows, calculated over variables of the observable markets as of the date of informing the interim consolidated financial statements, and correspond to Level 2 of the fair value hierarchy.
The following table shows the compliance with the financial covenants (level of indebtedness, detailed in section 23.9.3), for the bonds issued prior to the year 2015, as required by domestic indentures (Chile):
| | | | | | | | |
| | | June 2021 | | | December 2020 | |
| | | ThU.S.$ | | | ThU.S.$ | |
Interest bearing loans, current (a) | | | 487,651 | | | | 369,998 | |
Other financial liabilities, current | | | 429,426 | | | | 307,136 | |
Current Lease liabilities | | | 58,225 | | | | 63,640 | |
Hedging liabilities current + Financial liabilities at fair value through profit or loss current | | | — | | | | 778 | |
Interest bearing loans, non-current (b) | | | 5,406,393 | | | | 5,823,961 | |
Other financial liabilities, non-current | | | 5,380,494 | | | | 5,714,728 | |
Non-current lease liabilities | | | 137,037 | | | | 148,115 | |
Hedging liabilities non-current + Financial liabilities at fair value through profit or loss non-current | | | 111,138 | | | | 38,882 | |
Financial debt total (c) | | | 5,894,044 | | | | 6,193,959 | |
Cash and cash equivalents | | | 1,133,729 | | | | 1,064,714 | |
Other financial assets current | | | 3,309 | | | | 1,763 | |
Total Cash (d) | | | 1,137,038 | | | | 1,066,477 | |
Net Financial Debt (e) | | | 4,757,006 | | | | 5,127,482 | |
Non-controlling interests | | | 7,876,916 | | | | 7,384,722 | |
Equity attributable to owners of parent | | | 26,926 | | | | 30,913 | |
Total Equity (f) | | | 7,903,842 | | | | 7,415,635 | |
Debt to equity ratio (g) | | | 0.60 | | | | 0.69 | |
| (a) | Other Current Financial Liabilities + Current lease liabilities – (Current Hedge Liabilities + Financial Liabilities with changes in current results) |
| (b) | Other Non-Current Financial Liabilities + Non-current Lease liabilities – (Non-current Hedge Liabilities + Financial Liabilities with changes in non-current results) |
| (c) | Interest bearing loans, current + Interest bearing loans, non-current |
| (d) | Cash and Cash Equivalents + Other Current Financial Assets |
| (e) | Total Financial Debt – Total Cash |
| (f) | Equity attributable to owners of controlling parent + Non-controlling interests |
| (g) | Net Financial Debt / Total Equity |
88
CELULOSA ARAUCO Y CONSTITUCION S.A. AND SUBSIDIARIES
Unaudited Interim Consolidated Financial Statements
June 30, 2021
Amounts in thousands of U.S. dollars, except as indicated
The following table shows the compliance with the financial covenants (level of indebtedness, detailed in section 23.9.3), for the bonds issued after year 2015, as required by domestic indentures (Chile):
| | | | | | | | |
| | | June 2021 | | | December 2020 | |
| | | ThU.S.$ | | | ThU.S.$ | |
Other financial liabilities (a) | | | 5,809,920 | | | | 6,021,864 | |
Other financial liabilities, current | | | 429,426 | | | | 307,136 | |
Other financial liabilities, non-current | | | 5,380,494 | | | | 5,714,728 | |
Lease liabilities (b) | | | 195,262 | | | | 211,755 | |
Current lease liabilities | | | 58,225 | | | | 63,640 | |
Non-current lease liabilities | | | 137,037 | | | | 148,115 | |
Financial liabilities at fair value through profit or loss | | | — | | | | 74 | |
Hedging liabilities (c) | | | 111,138 | | | | 39,586 | |
Swaps | | | 110,580 | | | | 38,251 | |
Forward | | | 558 | | | | 1,335 | |
Financial debt total (d) | | | 5,894,044 | | | | 6,193,959 | |
Cash and cash equivalents | | | 1,133,729 | | | | 1,064,714 | |
Total Cash (e) | | | 1,133,729 | | | | 1,064,714 | |
Net Financial Debt (f) | | | 4,760,315 | | | | 5,129,245 | |
Non-controlling interests | | | 7,876,916 | | | | 7,384,722 | |
Equity attributable to owners of parent | | | 26,926 | | | | 30,913 | |
Total Equity (g) | | | 7,903,842 | | | | 7,415,635 | |
Debt to equity ratio (h) | | | 0.60 | | | | 0.69 | |
| (a) | Other Financial Liabilities current + Other Financial Liabilities non-current |
| (b) | Current lease liabilities + Non-current lease liabilities |
| (c) | Swaps + Forwards + Options |
| (d) | Other financial liabilities + Lease liabilities + Financial liabilities at fair value through profit or loss + Hedging liabilities |
| (e) | Cash and Cash Equivalents + Other Current Financial Assets |
| (f) | Total Financial Debt – Total Cash |
| (g) | Equity attributable to owners of controlling parent + Non-controlling interests |
| (h) | Net Financial Debt / Total Equity |
89
CELULOSA ARAUCO Y CONSTITUCION S.A. AND SUBSIDIARIES
Unaudited Interim Consolidated Financial Statements
June 30, 2021
Amounts in thousands of U.S. dollars, except as indicated
The following table sets forth a reconciliation between the financial liabilities and the consolidated statements of financial position as of June 30, 2021 and as of December 31, 2020:
| | | | | | | | | | | | | | | | | | | | | | | | | | | | | | | | |
| |
| | | June 2021 | |
Thousands of dollars | | Up to 90
days | | | From 91
days to 1
year | | | Other
current
financial
liabilities,
Total | | | From 1
year to 3
years | | | From 3
years to
5 years | | | More than
5 years | | | Other
non-current
financial
liabilities,
Total | | | Total | |
Bonds obligations | | | 32,052 | | | | 183,737 | | | | 215,789 | | | | 584,359 | | | | 88,539 | | | | 3,797,720 | | | | 4,470,618 | | | | 4,686,407 | |
Bank borrowing | | | 30,356 | | | | 183,281 | | | | 213,637 | | | | 241,981 | | | | 315,635 | | | | 241,122 | | | | 798,738 | | | | 1,012,375 | |
Swap and Forward | | | — | | | | — | | | | — | | | | 111,138 | | | | — | | | | — | | | | 111,138 | | | | 111,138 | |
| | | | | | | | | | | | | | | | | | | | | | | | | | | | | | | | |
Other Financial Liabilities, Total (a) | | | 62,408 | | | | 367,018 | | | | 429,426 | | | | 937,478 | | | | 404,174 | | | | 4,038,842 | | | | 5,380,494 | | | | 5,809,920 | |
| | | | | | | | | | | | | | | | | | | | | | | | | | | | | | | | |
| |
| | | June 2021 | |
| | | | | | | | |
Thousands of dollars | | Up to 90
days | | | From 91
days to 1
year | | | Total
Current | | | From 1
year to 3
years | | | From 3
years to
5 years | | | More than
5 years | | | Total
non-current | | | Total | |
Lease liabilities | | | 15,774 | | | | 42,451 | | | | 58,225 | | | | 67,997 | | | | 26,798 | | | | 42,242 | | | | 137,037 | | | | 195,262 | |
| | | | | | | | | | | | | | | | | | | | | | | | | | | | | | | | |
Lease liabilities, Total (b) | | | 15,774 | | | | 42,451 | | | | 58,225 | | | | 67,997 | | | | 26,798 | | | | 42,242 | | | | 137,03 | | | | 195,262 | |
| | | | | | | | | | | | | | | | | | | | | | | | | | | | | | | | |
| |
| | | June 2021 | |
Thousands of dollars | | Up to 90
days | | | From 91
days to 1
year | | | Total
Current | | | From 1
year to 3
years | | | From 3
years to
5 years | | | More than
5 years | | | Total
non-current | | | Total | |
Trades and other payables | | | 681,418 | | | | 18,808 | | | | 700,226 | | | | — | | | | — | | | | — | | | | — | | | | 700,226 | |
Accounts payable to related companies | | | 3,862 | | | | — | | | | 3,862 | | | | — | | | | — | | | | — | | | | — | | | | 3,862 | |
| | | | | | | | | | | | | | | | | | | | | | | | | | | | | | | | |
Accounts Payable, Total (c) | | | 685,280 | | | | 18,808 | | | | 704,088 | | | | — | | | | — | | | | — | | | | — | | | | 704,088 | |
| | | | | | | | | | | | | | | | | | | | | | | | | | | | | | | | |
Financial Liabilities, Total (a) + (b) + (c) | | | 763,462 | | | | 428,277 | | | | 1,191,739 | | | | 1,005,475 | | | | 430,972 | | | | 4,081,084 | | | | 5,517,531 | | | | 6,709,270 | |
| | | | | | | | | | | | | | | | | | | | | | | | | | | | | | | | |
| |
| | | December 2020 | |
Thousands of dollars | | Up to 90
days | | | From 91
days to 1
year | | | Other
current
financial
liabilities,
Total | | | From 1
year to 3
years | | | From 3
years to
5 years | | | More than
5 years | | | Other
non-current
financial
liabilities,
Total | | | Total | |
Bonds obligations | | | 32,053 | | | | 58,871 | | | | 90,924 | | | | 214,092 | | | | 584,344 | | | | 3,818,584 | | | | 4,617,020 | | | | 4,707,944 | |
Bank borrowing | | | 30,774 | | | | 184,660 | | | | 215,434 | | | | 473,233 | | | | 335,247 | | | | 250,346 | | | | 1,058,826 | | | | 1,274,260 | |
Swap and Forward | | | 778 | | | | — | | | | 778 | | | | 38,882 | | | | — | | | | — | | | | 38,882 | | | | 39,660 | |
| | | | | | | | | | | | | | | | | | | | | | | | | | | | | | | | |
Other Financial Liabilities, Total (a) | | | 63,605 | | | | 243,531 | | | | 307,136 | | | | 726,207 | | | | 919,591 | | | | 4,068,930 | | | | 5,714,728 | | | | 6,021,864 | |
| | | | | | | | | | | | | | | | | | | | | | | | | | | | | | | | |
| |
| | | December 2020 | |
Thousands of dollars | | Up to 90
days | | | From 91
days to 1
year | | | Total
Current | | | From 1
year to 3
years | | | From 3
years to
5 years | | | More than
5 years | | | Total
non-current | | | Total | |
Lease liabilities | | | 18,631 | | | | 45,009 | | | | 63,640 | | | | 85,964 | | | | 21,906 | | | | 40,245 | | | | 148,115 | | | | 211,755 | |
| | | | | | | | | | | | | | | | | | | | | | | | | | | | | | | | |
Lease liabilities, Total (b) | | | 18,631 | | | | 45,009 | | | | 63,640 | | | | 85,964 | | | | 21,906 | | | | 40,245 | | | | 148,115 | | | | 211,755 | |
| | | | | | | | | | | | | | | | | | | | | | | | | | | | | | | | |
| |
| | | December 2020 | |
Thousands of dollars | | Up to 90
days | | | From 91
days to 1
year | | | Total
Current | | | From 1
year to 3
years | | | From 3
years to
5 years | | | More than
5 years | | | Total
non-current | | | Total | |
Trades and other payables | | | 585,428 | | | | 41,076 | | | | 626,504 | | | | — | | | | — | | | | — | | | | — | | | | 626,504 | |
Accounts payable to related companies | | | 3,739 | | | | — | | | | 3,739 | | | | — | | | | — | | | | — | | | | — | | | | 3,739 | |
| | | | | | | | | | | | | | | | | | | | | | | | | | | | | | | | |
Accounts Payable, Total (c) | | | 589,167 | | | | 41,076 | | | | 630,243 | | | | — | | | | — | | | | — | | | | — | | | | 630,243 | |
| | | | | | | | | | | | | | | | | | | | | | | | | | | | | | | | |
Financial Liabilities, Total (a) + (b) + (c) | | | 671,403 | | | | 329,616 | | | | 1,001,019 | | | | 812,171 | | | | 941,497 | | | | 4,109,175 | | | | 5,862,843 | | | | 6,863,862 | |
| | | | | | | | | | | | | | | | | | | | | | | | | | | | | | | | |
90
CELULOSA ARAUCO Y CONSTITUCION S.A. AND SUBSIDIARIES
Unaudited Interim Consolidated Financial Statements
June 30, 2021
Amounts in thousands of U.S. dollars, except as indicated
23.4 Derivative Instruments
Hedging instruments recorded as of June 30, 2021 are cash flow hedges. Arauco uses derivatives for hedging purposes, such as cross currency swaps, currency and commodity forwards, interest rate swaps, and options. Depending on the fair value of each instrument, the position could be either an asset or a liability, and they are listed in the Interim Consolidated Statements of Financial Position under Other Non-Current Financial Assets or Other Non-Current Financial Liabilities, respectively. The effects for the period are presented in Interim Consolidated statement of changes in equity as Other Interim Comprehensive Income or the Statements of Comprehensive Income as Finance Income or Finance Costs, net of differences in exchange rate of the hedged items and the deferred tax.
A summary of the derivative financial instruments included in the interim consolidated statements of financial position as of June 30, 2021, is presented below:
| | | | | | | | |
Financial Instruments | | June 2021
Fair Value ThU.S.$ | | | December 2020
Fair Value ThU.S.$ | |
Assets at fair value through profit or loss (held for trading) | | | — | | | | 29 | |
Derivatives (1) | | | — | | | | 29 | |
| | |
Hedging Assets | | | 19,979 | | | | 30,714 | |
Derivatives (1) | | | 11,201 | | | | 4,343 | |
Cross Currency Swaps | | | 8,778 | | | | 26,371 | |
| | |
Financial liabilities at fair value through profit or loss | | | — | | | | (74 | ) |
Derivatives (1) | | | — | | | | (74 | ) |
| | |
Hedging Liabilities | | | (111,138 | ) | | | (39,586 | ) |
Derivatives (1) | | | (739 | ) | | | (4,245 | ) |
Cross Currency Swaps | | | (110,399 | ) | | | (35,341 | ) |
| (1) | Includes Swap, Zero Cost Collar, Forward and IRS from Chile, USA and Uruguay tables. |
| (2) | Includes Forwards from Colombia and Chile. |
23.4.1. Chile
In order to cover the exposure to variation in cash flows associated with fluctuations in exchange rates, interest rates or commodity prices, Arauco Chile has the following derivatives as of June 30, 2021 and as of December 31, 2020:
Cross Currency Swaps
Cross currency swaps to cover the exposure to the exchange rate risk generated from bonds denominated in U.F.
91
CELULOSA ARAUCO Y CONSTITUCION S.A. AND SUBSIDIARIES
Unaudited Interim Consolidated Financial Statements
June 30, 2021
Amounts in thousands of U.S. dollars, except as indicated
| | | | | | | | | | | | | | | | | | | | | | | | | | |
Bond | | Institution | | Amount U.S.$ | | | Amount
U.F. | | | Starting date | | | Ending date | | | June 2021
Fair Value
ThU.S.$ | | | December 2020
Fair Value
ThU.S.$ | |
F | | Deutsche Bank – U.E. | | | 33,705,054 | | | | 772,727 | | | | 10-30-2011 | | | | 10-30-2021 | | | | (2,427 | ) | | | (1,775 | ) |
F | | JP Morgan - N.A. | | | 33,705,054 | | | | 772,727 | | | | 10-30-2011 | | | | 10-30-2021 | | | | (2,404 | ) | | | (1,755 | ) |
F | | Scotiabank – Chile | | | 29,693,153 | | | | 772,727 | | | | 10-30-2014 | | | | 04-30-2023 | | | | 1,639 | | | | 2,825 | |
F | | Scotiabank – Chile | | | 29,656,067 | | | | 772,727 | | | | 10-30-2014 | | | | 04-30-2023 | | | | 1,755 | | | | 2,965 | |
F | | Santander – Chile | | | 29,345,913 | | | | 772,727 | | | | 10-30-2014 | | | | 04-30-2023 | | | | 2,168 | | | | 3,341 | |
F | | BCI – Chile | | | 29,071,206 | | | | 772,727 | | | | 10-30-2014 | | | | 04-30-2023 | | | | 2,422 | | | | 3,697 | |
F | | Banco de Chile - Chile | | | 29,345,914 | | | | 772,727 | | | | 04-30-2019 | | | | 10-30-2029 | | | | 794 | | | | 2,493 | |
P | | Itau – Chile | | | 46,474,122 | | | | 1,000,000 | | | | 05-15-2012 | | | | 11-15-2021 | | | | (5,819 | ) | | | (4,727 | ) |
P | | JP Morgan - N.A. | | | 47,163,640 | | | | 1,000,000 | | | | 11-15-2012 | | | | 11-15-2021 | | | | (6,416 | ) | | | (5,241 | ) |
P | | Scotiabank – Chile | | | 42,412,852 | | | | 1,000,000 | | | | 11-15-2013 | | | | 11-15-2023 | | | | (1,792 | ) | | | (94 | ) |
P | | Santander – Chile | | | 41,752,718 | | | | 1,000,000 | | | | 11-15-2013 | | | | 11-15-2023 | | | | (907 | ) | | | 718 | |
P | | Deutsche - U.K. | | | 41,752,718 | | | | 1,000,000 | | | | 11-15-2013 | | | | 11-15-2023 | | | | (989 | ) | | | 720 | |
Q | | BCI – Chile | | | — | | | | — | | | | — | | | | — | | | | | | | | (267 | ) |
Q | | BCI – Chile | | | — | | | | — | | | | — | | | | — | | | | | | | | (266 | ) |
R | | Santander - Chile | | | 128,611,183 | | | | 3,000,000 | | | | 10-01-2014 | | | | 04-01-2024 | | | | (8,896 | ) | | | (3,812 | ) |
R | | JP Morgan - U.K. | | | 43,185,224 | | | | 1,000,000 | | | | 10-01-2014 | | | | 04-01-2024 | | | | (2,995 | ) | | | (1,154 | ) |
R | | Itau - Chile | | | 43,277,070 | | | | 1,000,000 | | | | 10-01-2014 | | | | 04-01-2024 | | | | (3,052 | ) | | | (1,208 | ) |
S | | Santander - Chile | | | 201,340,031 | | | | 5,000,000 | | | | 11-15-2016 | | | | 11-15-2026 | | | | (1,712 | ) | | | 9,612 | |
W | | Goldman Sachs - N.A. | | | 40,521,750 | | | | 1,000,000 | | | | 10-10-2018 | | | | 10-10-2028 | | | | (4,476 | ) | | | (2,029 | ) |
W | | Scotiabank - Chile | | | 40,537,926 | | | | 1,000,000 | | | | 10-10-2018 | | | | 10-10-2028 | | | | (4,359 | ) | | | (1,939 | ) |
W | | Goldman Sachs - N.A. | | | 40,066,555 | | | | 1,000,000 | | | | 10-10-2018 | | | | 10-10-2028 | | | | (3,829 | ) | | | (1,390 | ) |
X | | Santander - Chile | | | 118,400,504 | | | | 3,000,000 | | | | 10-10-2018 | | | | 10-10-2038 | | | | (19,693 | ) | | | (2,675 | ) |
X | | Santander - Chile | | | 97,971,786 | | | | 2,500,000 | | | | 10-10-2018 | | | | 10-10-2038 | | | | (16,138 | ) | | | (1,955 | ) |
| | | | | | | | | | | | | | | | | | | | | | | | | | |
| | | | | | | | | | | | | | | | | | | | | (77,126 | ) | | | (3,916 | ) |
| | | | | | | | | | | | | | | | | | | | | | | | | | |
Series Q of bonds matured and had their final amortization on April 1,2021, resulting in the termination of the associated cross currency swaps which had the same expiration date.
Cross currency swaps contracts to cover the exposure to the risk of the exchange rate for bank contracts in Euro.
| | | | | | | | | | | | | | | | | | | | | | | | |
Institution | | Amount U.S.$ | | | Amount EUR | | | Starting date | | | Ending date | | | June 2021
Fair Value ThU.S.$ | | | December 2020
Fair Value ThU.S.$ | |
Santander - Chile | | | 118,670,000 | | | | 100,000,000 | | | | 06-15-2021 | | | | 12-15-2029 | | | | (4,788 | ) | | | (1,027 | ) |
Banco de Chile - Chile | | | 59,335,000 | | | | 50,000,000 | | | | 06-15-2021 | | | | 12-15-2029 | | | | (2,457 | ) | | | (488 | ) |
MUFG - N.A. | | | 118,670,000 | | | | 100,000,000 | | | | 06-15-2021 | | | | 12-15-2029 | | | | (4,898 | ) | | | (896 | ) |
JP Morgan - N.A. | | | 237,340,000 | | | | 200,000,000 | | | | 06-15-2021 | | | | 12-15-2029 | | | | (9,898 | ) | | | (2,048 | ) |
HSBC - N.A. | | | 59,335,000 | | | | 50,000,000 | | | | 06-15-2021 | | | | 12-15-2029 | | | | (2,454 | ) | | | (595 | ) |
| | | | | | | | | | | | | | | | | | | | | | | | |
| | | | | | | | | | | | | | | | | | | (24,495 | ) | | | (5,054 | ) |
| | | | | | | | | | | | | | | | | | | | | | | | |
Zero Cost Collars
Zero cost collar to cover the exposure to the Fuel Oil No. 6 and Brent, instruments for oil used by our plants.
| | | | | | | | | | | | | | | | | | | | | | | | | | |
Commodity | | Institution | | Volume | | | Unit | | | Starting date | | | Ending date | | | June 2021
Fair Value ThU.S.$ | | | December 2020
Fair Value ThU.S.$ | |
Fuel Oil N°6 | | JP Morgan - N.A. | | | — | | | | bbl | | | | 01-11-2020 | | | | 04-30-2021 | | | | — | | | | 1,029 | |
Fuel Oil N°6 | | Goldman Sachs - N.A. | | | — | | | | bbl | | | | 01-22-2020 | | | | 04-30-2021 | | | | — | | | | 516 | |
Brent | | BNP Paribas – E.U. | | | 220,000 | | | | bbl | | | | 08-01-2021 | | | | 07-31-2021 | | | | 3,546 | | | | 280 | |
Brent | | Goldman Sachs - N.A. | | | 220,000 | | | | bbl | | | | 08-01-2021 | | | | 07-31-2021 | | | | 3,579 | | | | 404 | |
| | | | | | | | | | | | | | | | | | | | | | | | | | |
| | | | | | | | | | | | | | | | | | | | | 7,125 | | | | 2,229 | |
| | | | | | | | | | | | | | | | | | | | | | | | | | |
92
CELULOSA ARAUCO Y CONSTITUCION S.A. AND SUBSIDIARIES
Unaudited Interim Consolidated Financial Statements
June 30, 2021
Amounts in thousands of U.S. dollars, except as indicated
Interest Rate Swap
Interest rate swap to fix the rate associated to loans with a variable rate.
| | | | | | | | | | | | | | | | | | | | |
Institution | | Amount US$ | | | Starting date | | | Ending date | | | June 2021
Fair Value ThU.S.$ | | | December 2020
Fair Value ThU.S.$ | |
Goldman Sachs - N.A. | | | 100,000,000 | | | | 03-27-2020 | | | | 03-29-2021 | | | | — | | | | (750 | ) |
MUFG - N.A. | | | 100,000,000 | | | | 03-27-2020 | | | | 03-29-2021 | | | | — | | | | (737 | ) |
| | | | | | | | | | | | | | | | | | | | |
| | | | | | | | | | | | | | | — | | | | (1,487 | ) |
| | | | | | | | | | | | | | | | | | | | |
Both Interest Rate Swaps covered portions of a credit for ThU.S.$ 200,000 that we prepay in March 2021. These derivatives were finished in that time.
Through an effectiveness test, and pursuant to IFRS 9, we were able to validate that the aforementioned hedging instruments are highly effective within an acceptable range for Arauco, for the purposes of eliminating the uncertainty of the exchange rate in the commitments derived from the hedged object.
23.4.2. Uruguay
Forward
As of June 30, 2021 and as of December 31, 2020, Arauco through its subsidiaries as a joint operation (50%) in Uruguay maintains the following forward contracts in force and effect for the purposes of ensuring an exchange rate for sale of dollars:
| | | | | | | | | | | | | | | | | | | | |
Exchange rate | | Institution | | | Notional
June 2021
ThU.S.$ | | | June 2021
Fair Value
ThU.S.$ | | | Notional
December 2020
ThU.S.$ | | | December 2020
Fair Value
ThU.S.$ | |
UYUUSD | | | Santander-Uruguay | | | | 7,685 | | | | 354 | | | | 12,160 | | | | 947 | |
UYUUSD | | | Santander-Uruguay | | | | — | | | | — | | | | 4,395 | | | | (179 | ) |
UYUUSD | | | HSBC-Uruguay | | | | 10,340 | | | | 296 | | | | 8,055 | | | | 366 | |
UYUUSD | | | Itaú-Uruguay | | | | 6,420 | | | | 240 | | | | — | | | | — | |
EURUSD | | | HSBC-Uruguay | | | | — | | | | — | | | | 595 | | | | 41 | |
| | | | | | | | | | | | | | | | | | | | |
| | | | | | | | | | | 890 | | | | | | | | 1,175 | |
| | | | | | | | | | | | | | | | | | | | |
Arauco Uruguay’s profits and through its subsidiaries as a joint operation (50%), also face exposure to the price variation of certain fuels, as occurs with Fuel Oil N°6, which is used during the pulp manufacturing process. In order to minimize this risk, the volatility of future flows associated to the purchase of Fuel Oil No. 6 through forwards of this commodity. The agreements that are in force and effect as of June 30, 2021 and as of December 31, 2020, are detailed below:
| | | | | | | | | | | | | | | | | | | | |
Commodity | | Institution | | | Notional
June 2021
ThU.S.$ | | | June 2021
Fair Value
ThU.S.$ | | | Notional
December 2020
ThU.S.$ | | | December 2020
Fair Value
ThU.S.$ | |
Fuel Oil N°6 | | | JP Morgan -N.A. | | | | 5,737 | | | | 1,961 | | | | 3,274 | | | | 541 | |
Fuel Oil N°6 | | | DNB Bank ASA | | | | 3,844 | | | | 1,226 | | | | 2,281 | | | | 248 | |
Fuel Oil N°6 | | | JP Morgan -N.A. | | | | 1,215 | | | | (166 | ) | | | 3,786 | | | | (351 | ) |
Fuel Oil N°6 | | | DNB Bank ASA | | | | 208 | | | | (21 | ) | | | 2,642 | | | | (320 | ) |
| | | | | | | | | | | | | | | | | | | | |
| | | | | | | | | | | 3,000 | | | | | | | | 118 | |
| | | | | | | | | | | | | | | | | | | | |
93
CELULOSA ARAUCO Y CONSTITUCION S.A. AND SUBSIDIARIES
Unaudited Interim Consolidated Financial Statements
June 30, 2021
Amounts in thousands of U.S. dollars, except as indicated
Interest Rate Swap
In addition, Arauco through its subsidiaries as a joint operation (50%) in Uruguay maintains an Interest Rate Swap in force and effect, a derivative instrument which purpose is to set the interest rate of a variable rate debt in the same currency (USD). The valuation off this instrument as of June 30, 2021 and as of December 31, 2020 is shown below:
| | | | | | | | | | | | | | | | |
Exchange rate | | Institution | | | Notional
ThU.S.$ | | | June 2021
Fair Value
ThU.S.$ | | | December 2020
Fair Value
ThU.S.$ | |
USD | | | DNB Bank ASA | | | | 21,099 | | | | (372 | ) | | | (559 | ) |
| | | | | | | | | | | | | | | | |
| | | | | | | | | | | (372 | ) | | | (559 | ) |
| | | | | | | | | | | | | | | | |
23.4.3. United States
Interest Rate Swap
Arauco through its subsidiary in United States maintains an Interest Rate Swap with the purpose of setting the interest rate of a variable rate debt in the same currency (USD). The instrument was settled on September 2020 and the valuation off this instrument as of June 30, 2021 and as of December 31, 2020 is shown below:
| | | | | | | | | | | | | | | | | | | | |
Institution | | Amount
ThU.S.$ | | | Starting date | | | Ending date | | | June 2021
Fair Value | | | December 2020
Fair Value | |
| | ThU.S.$ | | | ThU.S.$ | |
JP Morgan - N.A. | | | 100,000,000 | | | | 04-28-2020 | | | | 10-28-2023 | | | | (87 | ) | | | (474 | ) |
Goldman Sachs N.A. | | | 100,000,000 | | | | 04-28-2020 | | | | 10-28-2023 | | | | (17 | ) | | | (486 | ) |
JP Morgan - N.A. | | | 100,000,000 | | | | 04-28-2020 | | | | 10-28-2023 | | | | (78 | ) | | | (463 | ) |
| | | | | | | | | | | | | | | | | | | | |
| | | | | | | | | | | | | | | (182 | ) | | | (1,423 | ) |
| | | | | | | | | | | | | | | | | | | | |
94
CELULOSA ARAUCO Y CONSTITUCION S.A. AND SUBSIDIARIES
Unaudited Interim Consolidated Financial Statements
June 30, 2021
Amounts in thousands of U.S. dollars, except as indicated
23.5 Cash equivalent, Loans and Receivables
The financial assets measured at amortized cost using the effective interest method and tested for impairment are: cash and cash equivalent, time deposits, repurchase agreements, trade and other current/non-current receivables (with third parties and from related parties)
Loans and receivables are non-derivative financial assets with fixed or determinable payments that are not quoted in an active market. In the consolidated statements of financial position, they are included in line items “Cash and cash equivalents” (certain components of cash and cash equivalents), “Trade and Other Current/Non-Current Receivables” and “Accounts receivable from related parties”.
As of June 30, 2021 and as of December 31, 2020, there are provisions for impairment for ThU.S.$ 8,251 and ThU.S.$ 8,000, respectively.
| | | | | | | | |
| | | June 2021
ThU.S.$ | | | December 2020
ThU.S.$ | |
Financial assets at amortized cost | | | 1,967,841 | | | | 1,625,235 | |
Cash and cash equivalents (Mutual Funds not included) | | | 1,067,728 | | | | 864,972 | |
Cash | | | 453,371 | | | | 357,453 | |
Time Deposits | | | 614,357 | | | | 507,519 | |
Trade and other receivables (net) | | | 900,113 | | | | 760,261 | |
Trade and other receivables | | | 788,793 | | | | 647,924 | |
Lease receivable | | | 82 | | | | 135 | |
Other receivables | | | 105,426 | | | | 105,928 | |
Accounts receivable from related parties | | | 5,812 | | | | 6,274 | |
Other financial assets | | | — | | | | 2 | |
23.5.1. Cash and Cash Equivalents
Includes cash on hand, bank checking account balances and time deposits and other short term highly liquid investments with an original maturity of three months or less. They are short-term, highly liquid investments that are readily convertible to known amounts of cash, and which are subject to an insignificant risk of changes in value.
The composition of cash and cash equivalents (including the balance of mutual funds displayed in this note as valuation, instruments at fair value with profit or loss) at June 30, 2021 and as of December 31, 2020, classified by currency is as follows:
| | | | | | | | |
| | | 06-30-2021
ThU.S.$ | | | 12-31-2020
ThU.S.$ | |
Cash and Cash Equivalents | | | 1,133,729 | | | | 1,064,714 | |
U.S. Dollars | | | 733,103 | | | | 773,822 | |
Euro | | | 2,635 | | | | 3,891 | |
Mexican pesos | | | 47,680 | | | | 43,049 | |
Other currencies | | | 218,361 | | | | 194,942 | |
Chilean pesos | | | 131,950 | | | | 49,010 | |
23.5.2 Time Deposits and Repurchase Agreements: The investment objective of time deposits and repurchase agreements is to maximize in the short-term the amounts of cash surpluses. These instruments are authorized by Arauco’s Investment Policy, which allows investing in fixed income securities. These instruments have a maturity of less than three months from the date of acquisition.
23.5.3 Trade and Other Receivables: These represent enforceable rights for Arauco resulting from the normal course of the business.
95
CELULOSA ARAUCO Y CONSTITUCION S.A. AND SUBSIDIARIES
Unaudited Interim Consolidated Financial Statements
June 30, 2021
Amounts in thousands of U.S. dollars, except as indicated
23.5.4 Other Receivables: These correspond to receivables from sales, services or loans that are not considered within the normal course of the business.
The allowance for doubtful accounts is presented as a deduction of trade and other receivables. The provision for doubtful accounts is established based on an analysis of the age of the portfolio and considering the insurance coverage on accounts receivable. Other conditions are assessed for example when there is objective evidence that Arauco will not receive payments under the original sale terms and when the customer is a party to a bankruptcy court agreement or cessation of payments, and is written-off when Arauco has exhausted all levels of recovery of the receivable in a reasonable time.
23.5.5 Accounts receivable from related parties: Represent enforceable rights for Arauco resulting from the normal course of business, calling normal to the line of business, activity or purpose of exploitation and financing, and which Arauco owns a non-controlling ownership of the counterparty.
The following table sets forth trade and other current/non-current receivables classified by currencies as of June 30, 2021 and as of December 31, 2020:
| | | | | | | | |
| | | 06-30-2021
ThU.S.$ | | | 12-31-2020
ThU.S.$ | |
Trades and other current receivables | | | 878,628 | | | | 737,381 | |
| | |
U.S. Dollars | | | 653,449 | | | | 542,296 | |
Euros | | | 15,648 | | | | 10,448 | |
Mexican pesos | | | 38,116 | | | | 30,856 | |
Other currencies | | | 65,444 | | | | 54,118 | |
Chilean pesos | | | 103,149 | | | | 96,847 | |
U.F. | | | 2,822 | | | | 2,816 | |
| | |
Accounts receivable from related parties, current | | | 5,812 | | | | 6,274 | |
U.S. Dollars | | | — | | | | 369 | |
Other currencies | | | — | | | | 829 | |
Chilean pesos | | | 5,812 | | | | 5,076 | |
| | |
Trade and other non-current receivables | | | 15,673 | | | | 16,606 | |
U.S. Dollars | | | 12,926 | | | | 13,637 | |
Other currencies | | | 4 | | | | 40 | |
Chilean pesos | | | 2,743 | | | | 2,859 | |
U.F. | | | — | | | | 70 | |
23.6 Financial Liabilities
Arauco’s financial liabilities to the date of these consolidated financial statements are as follows:
| | | | | | | | |
Financial Liabilities | | June 2021
ThU.S.$ | | | December 2020
ThU.S.$ | |
Total Financial Liabilities | | | 6,709,270 | | | | 6,863,862 | |
Financial liabilities at fair value through profit or loss (held for trading) | | | — | | | | 74 | |
Hedging Liabilities | | | 111,138 | | | | 39,586 | |
Financial Liabilities Measured at Amortized Cost | | | 6,598,132 | | | | 6,824,202 | |
| | | | | | | | |
The following table sets forth the current portion of the non-current bank borrowings and debt issued as of June 30, 2021 and as of December 31, 2020.
| | | | | | | | |
| | | June 2021
ThU.S.$ | | | December 2020
ThU.S.$ | |
Bank borrowings - current portion | | | 121,307 | | | | 123,087 | |
Bonds issued - current portion | | | 86,985 | | | | 80,074 | |
Total | | | 208,292 | | | | 203,161 | |
| | | | | | | | |
96
CELULOSA ARAUCO Y CONSTITUCION S.A. AND SUBSIDIARIES
Unaudited Interim Consolidated Financial Statements
June 30, 2021
Amounts in thousands of U.S. dollars, except as indicated
23.7 Financial Liabilities Measured at Amortized Cost
Financial liabilities correspond to non-derivative financial instruments with contractual cash-flow payments that can be either fixed or variable.
Also, this category includes those non-derivative financial liabilities for services or goods delivered to Arauco at the end of each reporting period that have not yet been paid. These amounts are not insured and are generally paid within thirty days after being recognized.
At the end of these financial statements, Arauco includes in this category bank borrowings, bonds issued denominated in U.S. Dollars and in U.F., lease liabilities, and trade and other payables.
| | | | | | | | | | | | | | | | | | |
| | | | | 06-30-2021 | | | 12-31-2020 | | | 06-30-2021 | | | 12-31-2020 | |
| | | Currency | | ThU.S.$ | | | ThU.S.$ | | | ThU.S.$ | | | ThU.S.$ | |
| | | Amortized Cost | | | Fair Value | |
Total Financial Liabilities | | | | | 6,598,132 | | | | 6,824,202 | | | | 7,073,967 | | | | 7,641,425 | |
Bonds Issued | | U.S. Dollar | | | 3,521,638 | | | | 3,519,027 | | | | 3,884,418 | | | | 3,970,081 | |
Bonds Issued | | U.F. | | | 1,164,769 | | | | 1,188,917 | | | | 1,244,935 | | | | 1,458,106 | |
Bank borrowings | | U.S. Dollar | | | 498,281 | | | | 741,669 | | | | 509,719 | | | | 770,551 | |
Bank borrowings | | Euro | | | 512,760 | | | | 531,181 | | | | 535,545 | | | | 600,689 | |
Bank borrowings | | Other currencies | | | 1,334 | | | | 1,410 | | | | — | | | | — | |
Lease liabilities | | U.F. | | | 20,253 | | | | 27,373 | | | | 20,253 | | | | 27,373 | |
Lease liabilities | | Chilean pesos | | | 59,861 | | | | 77,158 | | | | 59,861 | | | | 77,158 | |
Lease liabilities | | Mexican pesos | | | 4,904 | | | | 644 | | | | 4,904 | | | | 644 | |
Lease liabilities | | U.S. Dollar | | | 82,556 | | | | 87,822 | | | | 82,556 | | | | 87,822 | |
Lease liabilities | | Euro | | | 309 | | | | 314 | | | | 309 | | | | 314 | |
Lease liabilities | | Other currencies | | | 27,379 | | | | 18,444 | | | | 27,379 | | | | 18,444 | |
Trades and Other Payables | | U.S. Dollar | | | 210,161 | | | | 153,860 | | | | 210,161 | | | | 153,860 | |
Trades and Other Payables | | Euro | | | 9,811 | | | | 11,924 | | | | 9,811 | | | | 11,924 | |
Trades and Other Payables | | Mexican pesos | | | 35,196 | | | | 26,400 | | | | 35,196 | | | | 26,400 | |
Trades and Other Payables | | Other currencies | | | 113,032 | | | | 99,428 | | | | 113,032 | | | | 99,428 | |
Trades and Other Payables | | Chilean pesos | | | 294,143 | | | | 298,908 | | | | 294,143 | | | | 298,908 | |
Trades and Other Payables | | U.F. | | | 37,883 | | | | 35,984 | | | | 37,883 | | | | 35,984 | |
Accounts payable to related parties | | U.S. Dollar | | | 193 | | | | 236 | | | | 193 | | | | 236 | |
Accounts payable to related parties | | Chilean pesos | | | 3,669 | | | | 3,503 | | | | 3,669 | | | | 3,503 | |
The financial liabilities at amortized cost presented in the interim consolidated statements of financial positions as of June 30, 2021 and as of December 31, 2020 are as follows:
| | | | | | | | | | | | |
| | | June 2021
ThU.S.$ | |
| | | Current | | | Non-Current | | | Total | |
Other financial liabilities | | | 429,426 | | | | 5,269,356 | | | | 5,698,782 | |
Lease liabilities | | | 58,225 | | | | 137,037 | | | | 195,262 | |
Trade and other payables | | | 700,226 | | | | — | | | | 700,226 | |
Accounts payable to related parties | | | 3,862 | | | | — | | | | 3,862 | |
| | | | | | | | | | | | |
Total Financial Liabilities Measured at Amortized Cost | | | 1,191,739 | | | | 5,406,393 | | | | 6,598,132 | |
| | | | | | | | | | | | |
| |
| | | December 2020
ThU.S.$ | |
| | | Current | | | Non-Current | | | Total | |
Other financial liabilities | | | 306,358 | | | | 5,675,846 | | | | 5,982,204 | |
Lease liabilities | | | 63,640 | | | | 148,115 | | | | 211,755 | |
Trade and other payables | | | 626,504 | | | | — | | | | 626,504 | |
Accounts payable to related parties | | | 3,739 | | | | — | | | | 3,739 | |
| | | | | | | | | | | | |
Total Financial Liabilities Measured at Amortized Cost | | | 1,000,241 | | | | 5,823,961 | | | | 6,824,202 | |
| | | | | | | | | | | | |
97
CELULOSA ARAUCO Y CONSTITUCION S.A. AND SUBSIDIARIES
Unaudited Interim Consolidated Financial Statements
June 30, 2021
Amounts in thousands of U.S. dollars, except as indicated
23.8 Cash Flow Hedges Reserve Reconciliation
The following table sets forth the reconciliation balances of cash flow hedges presented in the interim consolidated statements of comprehensive income:
| | | | | | | | | | | | | | | | |
| | | January – June | | | April - June | | | | |
| | | 2021 | | | 2020 | | | 2021 | | | 2020 | |
| | ThU.S.$ | | | ThU.S.$ | | | ThU.S.$ | | | ThU.S.$ | |
Opening balance | | | (37,007 | ) | | | 9,010 | | | | (11,416 | ) | | | (69,467 | ) |
Gains (losses) on cash flow hedges, before tax | | | (49,740 | ) | | | (66,873 | ) | | | (82,658 | ) | | | 36,593 | |
Reclassification adjustments on cash flow hedges, before tax | | | (10,137 | ) | | | (20,854 | ) | | | (9,862 | ) | | | (18,057 | ) |
Income tax relating to cash flow hedges of other comprehensive income | | | 17,132 | | | | 21,427 | | | | 24,184 | | | | (6,359 | ) |
Closing balance | | | (79,752 | ) | | | (57,290 | ) | | | (79,752 | ) | | | (57,290 | ) |
| | | | | | | | | | | | | | | | |
23.9 Capital Disclosures
23.9.1 Information on Objectives, Policies and Processes applied by the Company regarding Capital Management
Arauco’s policies on capital management have the objective of:
| a) | Ensuring business continuity and normal operations in the long term; |
| b) | Ensuring funding for new investments to achieve sustainable growth over time; |
| c) | Keeping adequate capital structure considering all economic cycles that impact the business and the nature of the industry; and |
| d) | Maximizing the Company’s value and providing an adequate return to shareholders. |
23.9.2 Qualitative Information on Objectives, Policies and Processes applied by the Company regarding Capital Management
Arauco determines and manages its capital structure based on its carrying amount of equity plus its financial debt (bank borrowings and bonds issued).
23.9.3 Quantitative Information on Capital Management
The following table sets forth the financial covenants that the Company has to comply with as part of the terms of certain of its obligations:
| | | | | | | | | | | | |
Instrument | | June 2021
ThU.S.$ | | | December 2020
ThU.S.$ | | | Interest
coverage
>= 2,0x | | Debt level
(1)
<= 1,2x |
Domestic bonds (Chile) | | | 1,164,769 | | | | 1,188,917 | | | N/R | | ✓ |
Syndicate Loan | | | — | | | | 200,022 | | | ✓ | | ✓ |
Syndicate Loan - Grayling | | | 285,199 | | | | 300,121 | | | ✓ | | ✓ |
Syndicate ECA - MAPA | | | 512,760 | | | | 531,181 | | | ✓ | | ✓ |
N/R: Not required for the financial obligation
(1) Debt to equity ratio (financial debt divided by equity plus non-controlling interests)
As of June 30, 2021 and as of December 31, 2020, Arauco has complied with all of its financial covenants.
The following table sets forth the credit ratings of our debt instruments as of June 30, 2021, are as follows:
| | | | | | | | | | | | | | | | |
Instrument | | Standard &
Poor’s | | | Fitch
Ratings | | | Moody’s | | | Feller
Rate | |
Local bonds | | | — | | | | AA- | (*) | | | — | | | | AA | |
Foreign bonds | | | BBB- | | | | BBB | | | | Baa3 | | | | — | |
| (*) | As of July 28, 202,1 Fitch Ratings upgraded the risk rating of local instrument to AA. |
98
CELULOSA ARAUCO Y CONSTITUCION S.A. AND SUBSIDIARIES
Unaudited Interim Consolidated Financial Statements
June 30, 2021
Amounts in thousands of U.S. dollars, except as indicated
Capitalization requirements are established based on the Company’s financial needs and on maintaining an adequate liquidity level and complying with financial covenants established in current debt arrangements. The Company manages its capital structure and makes adjustments based on the prevailing economic conditions in order to mitigate the risks associated with adverse market conditions and based on opportunities that may arise to improve the Company’s level of liquidity.
The capitalization of Arauco as of June 30, 2021 and as of December 31, 2020 is as follows:
| | | | | | | | |
| | | June 2021 | | | December 2020 | |
| | | ThU.S.$ | | | ThU.S.$ | |
Equity | | | 7,903,842 | | | | 7,415,635 | |
Bank borrowings | | | 1,012,375 | | | | 1,274,260 | |
Lease liabilities | | | 195,262 | | | | 211,755 | |
Bonds issued | | | 4,686,407 | | | | 4,707,944 | |
| | | | | | | | |
Capitalization | | | 13,797,886 | | | | 13,609,594 | |
| | | | | | | | |
23.10 Risk Management
Arauco’s financial instruments are exposed to various financial risks: credit risk, liquidity risk and market risk (including exchange rate risks, interest rate risks and price risks). Arauco’s overall risk management program focuses on uncertainty in financial markets and aims to minimize potential adverse effects on Arauco’s financial profitability.
Arauco’s financial risk management is overseen by the Corporate Finance Department. This department identifies, assesses and hedges financial risks in close collaboration with Arauco’s operational units. The company is not actively involved in trading its financial assets for speculative purposes.
23.10.1 Type of Risk: Credit Risk
Description
Credit risk refers to financial uncertainty at different periods of time relating to the fulfillment of obligations with counterparties, at the time of exercising the contract rights to receive cash or other financial assets on behalf of Arauco.
99
CELULOSA ARAUCO Y CONSTITUCION S.A. AND SUBSIDIARIES
Unaudited Interim Consolidated Financial Statements
June 30, 2021
Amounts in thousands of U.S. dollars, except as indicated
Explanation of Credit Risk Exposure and How This Risk Arises
Arauco’s exposure to credit risk is directly related to each of its customer’s individual abilities to fulfill their contractual commitments, reflected in trade receivables.
Accounts exposed to credit risk are trade receivables, financial lease debtors and other debtors.
Arauco does not have a securitized portfolio.
| | | | | | | | |
| | | June 2021 | | | December 2020 | |
| | | ThU.S.$ | | | ThU.S.$ | |
Current Receivables | | | | | | | | |
Trade receivables | | | 787,483 | | | | 646,607 | |
Financial lease receivables | | | 82 | | | | 109 | |
Other debtors | | | 91,063 | | | | 90,665 | |
Net subtotal | | | 878,628 | | | | 737,381 | |
| | |
Trade receivables | | | 790,813 | | | | 649,680 | |
Financial lease receivables | | | 82 | | | | 109 | |
Other debtors | | | 93,566 | | | | 93,168 | |
Gross subtotal | | | 884,461 | | | | 742,957 | |
| | |
Provision for doubtful trade receivables | | | 3,330 | | | | 3,073 | |
Provision for doubtful lease receivables | | | — | �� | | | — | |
Provision for doubtful other debtors | | | 2,503 | | | | 2,503 | |
Subtotal Bad Debt | | | 5,833 | | | | 5,576 | |
| | |
Non-Current Receivables | | | | | | | | |
| | |
Trade receivables | | | 1,310 | | | | 1,317 | |
Financial lease receivables | | | — | | | | 26 | |
Other debtors | | | 14,363 | | | | 15,263 | |
Net Subtotal | | | 15,673 | | | | 16,606 | |
| | |
Trade receivables | | | 3,728 | | | | 3,741 | |
Financial lease receivables | | | — | | | | 26 | |
Other debtors | | | 14,363 | | | | 15,263 | |
Gross subtotal | | | 18,091 | | | | 19,030 | |
| | |
Provision for doubtful trade receivables | | | 2,418 | | | | 2,424 | |
Provision for doubtful lease receivables | | | — | | | | — | |
Provision for doubtful other debtors | | | — | | | | — | |
Subtotal Bad Debt | | | 2,418 | | | | 2,424 | |
Explanation of Risk Management Objectives, Policies and Processes, and Measurement Methods
The Credit and Collections Sub-Division, dependent from the Treasury Division, is the area entrusted with minimizing the credit risk of the accounts receivable, supervising the delinquency of the accounts. The regulations and procedures applicable for the control and administration of the Arauco Group can be found in the Corporate Credit Policy.
As of June 30, 2021, Arauco’s balance for commercial debtors was ThU.S.$ 794,541 of which, according to the agreed sales conditions, 54.57% corresponded to sales on credit (open account), 43.88% to sales with letters of credit and 1.55% to other types of sales. The client with the largest Open Account debt represented 1.972% of the total accounts receivable as of that date.
100
CELULOSA ARAUCO Y CONSTITUCION S.A. AND SUBSIDIARIES
Unaudited Interim Consolidated Financial Statements
June 30, 2021
Amounts in thousands of U.S. dollars, except as indicated
Below we provide detail regarding accounts receivable, classified in tranches:
| | | | | | | | | | | | | | | | | | | | | | | | | | | | | | | | | | | | | | | | | | | | |
| June 30, 2021 | |
|
| Age of trade receivables | |
Days | | Non-past due | | | 1 to 30 | | | 31 to 60 | | | 61 to 90 | | | 91 to 120 | | | 121 to 150 | | | 151 to 180 | | | 181 to 210 | | | 211 to 250 | | | More
than
250 | | | Total | |
N° Debtor | | | 1,813 | | | | 694 | | | | 74 | | | | 59 | | | | 56 | | | | 83 | | | | 4 | | | | 3 | | | | 3 | | | | 100 | | | | 2,889 | |
ThU.S.$ | | | 742,750 | | | | 39,980 | | | | 5,533 | | | | 409 | | | | 257 | | | | 4 | | | | 3 | | | | 8 | | | | 3 | | | | 5,594 | | | | 794,541 | |
% | | | 93.48 | % | | | 5.03 | % | | | 0.70 | % | | | 0.05 | % | | | 0.03 | % | | | 0.00 | % | | | 0.00 | % | | | 0.00 | % | | | 0.00 | % | | | 0.71 | % | | | 100 | % |
| | | | | | | | | | |
December 31, 2020 | | | | | | | | | | | | | | | | | | | | | | | | | | | | | | | | | | | | | | | | | |
|
| Age of trade receivables | |
Days | | Non-past due | | | 1 to 30 | | | 31 to 60 | | | 61 to 90 | | | 91 to 120 | | | 121 to 150 | | | 151 to 180 | | | 181 to 210 | | | 211 to 250 | | | More
than
250 | | | Total | |
N° Debtor | | | 1,597 | | | | 547 | | | | 51 | | | | 52 | | | | 12 | | | | 7 | | | | 2 | | | | 3 | | | | 7 | | | | 81 | | | | 2,359 | |
ThU.S.$ | | | 625,225 | | | | 21,502 | | | | 474 | | | | 96 | | | | 636 | | | | 11 | | | | 70 | | | | 72 | | | | 299 | | | | 5,036 | | | | 653,421 | |
% | | | 95.68 | % | | | 3.29 | % | | | 0.07 | % | | | 0.01 | % | | | 0.10 | % | | | 0.00 | % | | | 0.01 | % | | | 0.01 | % | | | 0.05 | % | | | 0.78 | % | | | 100 | % |
Arauco applies the simplified approach regarding the expected losses from commercial debtors, which allows for the use of an estimate of expected credit losses over the instrument’s lifespan for all commercial accounts receivable. In order to establish this estimate, the commercial debtors have been grouped in relation to the corresponding risks for sales conditions as well as for tranches, including clients that are up-to-date or in default.
| | | | | | | | | | | | | | | | | | | | | | | | | | | | | | | | | | | | | | | | | | | | |
Days | | Non-past due | | | 1 to 30 | | | 31 to 60 | | | 61 to 90 | | | 91 to 120 | | | 121 to 150 | | | 151 to 180 | | | 181 to 210 | | | 211 to 250 | | | More
than
250 | | | Total | |
Letters of credit | | | 341,402 | | | | 7,200 | | | | 28 | | | | — | | | | — | | | | — | | | | 38 | | | | — | | | | — | | | | 38 | | | | 348,668 | |
Loss allowance provision | | | — | | | | — | | | | — | | | | — | | | | — | | | | — | | | | — | | | | — | | | | — | | | | — | | | | — | |
Expected loss rate | | | 0.00 | % | | | 0.00 | % | | | 0.00 | % | | | 0.00 | % | | | 0.00 | % | | | 0.00 | % | | | 0.00 | % | | | 0.00 | % | | | 0.00 | % | | | 0.00 | % | | | | |
| | | | | | | | | | | | | | | | | | | | | | | | | | | | | | | | | | | | | | | | | | | | |
Credit line | | | 396,681 | | | | 27,996 | | | | 2,954 | | | | 112 | | | | 256 | | | | 3 | | | | 3 | | | | 8 | | | | 3 | | | | 5,556 | | | | 433,572 | |
Loss allowance provision | | | — | | | | — | | | | 88 | | | | 11 | | | | 26 | | | | — | | | | — | | | | 8 | | | | 3 | | | | 5,556 | | | | 5,692 | |
Expected loss rate | | | 0.00 | % | | | 0.00 | % | | | 2.98 | % | | | 9.82 | % | | | 10,16 | % | | | 0.00 | % | | | 0.00 | % | | | 100.00 | % | | | 100.00 | % | | | 100.00 | % | | | | |
| | | | | | | | | | | | | | | | | | | | | | | | | | | | | | | | | | | | | | | | | | | | |
Others | | | 4,667 | | | | 4,784 | | | | 2,551 | | | | 297 | | | | 1 | | | | 1 | | | | — | | | | — | | | | — | | | | — | | | | 12,301 | |
Loss allowance provision | | | — | | | | — | | | | 24 | | | | 30 | | | | 1 | | | | 1 | | | | — | | | | — | | | | — | | | | — | | | | 56 | |
Expected loss rate | | | 0.00 | % | | | 0.00 | % | | | 0.94 | % | | | 10.10 | % | | | 100.00 | % | | | 100.00 | % | | | 0.00 | % | | | 0.00 | % | | | 0.00 | % | | | 0.00 | % | | | | |
| | | | | | | | | | | | | | | | | | | | | | | | | | | | | | | | | | | | | | | | | | | | |
Trade receivables, total (ThU.S.$) | | | 742,750 | | | | 39,980 | | | | 5,533 | | | | 409 | | | | 257 | | | | 4 | | | | 3 | | | | 8 | | | | 3 | | | | 5,594 | | | | 794,541 | |
Allowance for doubtful accounts, total (ThU.S.$) | | | — | | | | — | | | | 112 | | | | 41 | | | | 27 | | | | 1 | | | | — | | | | 8 | | | | 3 | | | | 5,556 | | | | 5,748 | |
| | | | | | | | | | | | | | | | | | | | | | | | | | | | | | | | | | | | | | | | | | | | |
Arauco does not conduct rescheduling or renegotiations with its clients that imply an amendment to the maturity of the invoices and, should it be necessary, any debt renegotiation with a client shall be analyzed on a case-by-case basis and subjected to the approval of the Corporate Finance Division.
Regarding the loss allowance for trade receivables and others, below we provide detail for the movements as of June 30, 2021 and as of December 31, 2020:
| | | | | | | | |
| | | June 2021 | | | December 2020 | |
| | | ThU.S.$ | | | ThU.S.$ | |
Opening loss allowance as at January 1 | | | 8,000 | | | | 16,368 | |
Increase in loan loss allowance recognised in profit or loss during the year | | | 463 | | | | 1,369 | |
Receivables written off during the year as uncollectible | | | — | | | | (6,970 | ) |
Unused amount reversed | | | (212 | ) | | | (2,767 | ) |
Closing balance | | | 8,251 | | | | 8,000 | |
| | | | | | | | |
Currently there is a policy for provisions for doubtful accounts receivable under IFRS for all the Arauco group companies.
101
CELULOSA ARAUCO Y CONSTITUCION S.A. AND SUBSIDIARIES
Unaudited Interim Consolidated Financial Statements
June 30, 2021
Amounts in thousands of U.S. dollars, except as indicated
Explanation regarding the Sales Risk with Letters of Credit
The sales with letters of credit mainly occur in markets in Asia and the Middle East. Periodically, a credit assessment is conducted regarding the banks that issue the letters of credit with the purpose of obtaining their score over the basis of risk-qualification ratings, country-specific risk and financial statements. The decision of approving the issuing bank or asking for confirmation of the letter of credit is made in consideration to this assessment.
Explanation of the Sales Risk with Credit Line
Sales on credit are subject to the credit limit for each customer. The approval or rejection of a credit limit for all term sales is conducted by the Corporate Credit Sub-Division, as well as by the Credit and Collections area for North America, Brazil and Argentina, which report to the Corporate Finance Division. The regulations and procedures applicable for the correct control and risk management over the sales on credit are ruled by the Credit Policy.
A procedure that must be applied by all the companies of the Arauco group has been established for the approval and/or modification of client credit lines. Credit line requests are entered to the SAP that analyzes all available information. Afterwards, the same are either approved or rejected in each one of the internal committees of each company belonging to the Arauco group, depending on the maximum amount authorized by the Credit Policy. Lines of credit are renewed during this internal process on a yearly basis.
All sales are automatically controlled by a credit verification system, which has been configured to block any orders from clients who are delinquent in a given percentage of a debt and/or from clients whose line of credit, as of the time of the product’s shipping, has been exceeded or is overdue.
In order to minimize the credit risk for term or Open Account sales, it is Arauco’s policy to take out insurance to cover the export sales of companies Celulosa Arauco y Constitución S.A., Maderas Arauco S.A., Forestal Arauco S.A., Arauco Argentina S.A., and Arauco do Brasil S.A., as well as the domestic sales of Arauco Europe Coöperatief U.A., Arauco Argentina S.A., Araucomex S.A. de C.V., Arauco Industria de México, S.A. de C.V., Arauco Colombia S.A., Arauco Perú S.A., Arauco North America, Inc., Arauco Canada Ltd., Celulosa Arauco y Constitución S.A., Maderas Arauco S.A., Arauco Florestal Arapoti, Arauco Forest Brasil S.A., Arauco do Brasil S.A. and Arauco Industria de Paineis Ltda. Arauco works with credit insurance company Euler Hermes World Agency (Aa3 rating, as per risk rating companies Moody’s and AA by S&P). The company grant a 90% coverage over the amount of each invoice, without deductibles, for registered clients and of 90% for non-registered clients (*).
(*) Non-registered clients are those whose lines are under ThU.S.$ 100 (equivalent currency of their invoicing) of the credit sales for all companies in the Arauco group that have a valid insurance policy. The top lines are from nominated clients.
As another way of minimizing risk and supporting a line of credit approved by the Credit Committee, Arauco holds guarantees such as mortgages, pledges, Standby letters of credit, bank performance bonds, checks, promissory notes, loans or any other that could be required under the laws of each country. The total amount held in guarantees amounts to ThU.S.$ 98,269, effective as of June 30, 2021, as summarized in the following chart. The procedure for guarantees is regulated by Arauco’s Policy on Guarantees, whose purpose is to control their accounting, due date and custody.
102
CELULOSA ARAUCO Y CONSTITUCION S.A. AND SUBSIDIARIES
Unaudited Interim Consolidated Financial Statements
June 30, 2021
Amounts in thousands of U.S. dollars, except as indicated
| | | | | | | | |
| Guarantees Arauco Group (ThU.S.$) | |
Guarantees Debtors (received from clients) | | | | | | | | |
Certificate of deposits | | | 6,665 | | | | 6.78 | % |
Standby | | | 6,692 | | | | 6.81 | % |
Promissory notes | | | 78,812 | | | | 80.20 | % |
Finance | | | 2,228 | | | | 2.27 | % |
Mortgage | | | 2,277 | | | | 2.32 | % |
Pledge | | | 195 | | | | 0.20 | % |
Promissory notes | | | 1,400 | | | | 1.42 | % |
| | | | | | | | |
Total Guarantees | | | 98,269 | | | | 100 | % |
| | | | | | | | |
The maximum exposure to credit risk is limited to the value at amortized cost of the Debtors’ account for sales registered as of the date of this report, minus the percentage of sales insured by the aforementioned credit insurance companies and the guarantees granted in favor of Arauco.
In summary, the open account debt covered by the various insurance policies and guarantees amounts to 96.4% and, therefore, Arauco’s portfolio exposure amounts to 3.6%.
| | | | | | | | |
| Secured Open Accounts Receivable | | ThU.S.$ | | | % | |
Total open accounts receivable | | | 451,963 | | | | 100.0 | % |
Secured receivables (*) | | | 435,692 | | | | 96.4 | % |
Unsecured receivables | | | 16,271 | | | | 3.6 | % |
(*) Insured Debt is deemed to be the portion of accounts receivable that is covered by a credit company or by guarantees such as standby letters of credit, mortgages, performance bonds, among others
Investment Policy:
Arauco has an Investment Policy which identifies and limits the financial instruments and the entities into which the Arauco companies, in particular Celulosa Arauco y Constitucion S.A., are authorized to invest. The Company’s Treasury Department is centralized with operations in Chile. The Head Office is responsible for carrying out investments, cash flow surplus investments, and short and long-term debt subscriptions. Exceptions to this rule apply to short and long-term debt, and will be for specific investments made through other companies where authorization is required from the Chief Financial Officer.
For financial instruments, the only permitted investments are fixed income investments with adequate liquidity. Each instrument has defined classifications and limits, depending on duration and type of issuer.
Regarding intermediaries (such as banks, securities brokers and dealers of mutual funds that are bank affiliates), a scoring methodology is used to determine the relative degree of risk of each intermediary based on their financial position and assign score points that result in a credit risk rating to each intermediary. Arauco uses this scoring system to determine its investment limits for each intermediary.
The required information to evaluate the various criteria are obtained from published financial statements from the banks under evaluation and from the credit risk ratings of short and long-term debt securities obtained from rating agencies authorized by the Superintendence of Banks and Financial Institutions (Fitch Ratings Chile, Humphreys and Feller Rate).
Any necessary exceptions regarding investment limits in each particular instrument or entity must have the authorization from Arauco’s Chief Financial Officer.
103
CELULOSA ARAUCO Y CONSTITUCION S.A. AND SUBSIDIARIES
Unaudited Interim Consolidated Financial Statements
June 30, 2021
Amounts in thousands of U.S. dollars, except as indicated
23.10.2 Type of Risk: Liquidity Risk
Description
This risk corresponds to Arauco’s ability to fulfill its financial obligations upon maturity.
Explanation of Liquidity Risk Exposure and How This Risk Arises
Arauco’s exposure to liquidity risk is mainly from its obligations to bondholders, banks and financial institutions, creditors and other payables. Liquidity risk may arise if Arauco is unable to meet the net cash flow requirements, which sustain its operations under both normal and exceptional circumstances.
Explanation of Objectives, Policies and Processes for Risk Management, and Measurement Methods
The Corporate Financial Management Division monitors on an ongoing basis the Company’s cash flow forecasts based on short and long-term forecasts and available financing alternatives. In order to manage the risk level of financial assets, Arauco follows its investment policy.
The following tables detail Arauco’s liquidity analysis for its financial liabilities as of June 30, 2021 and as of December 31, 2020. The tables have been drawn up based on the contractual undiscounted cash outflows and their remaining contractual maturities.
104
CELULOSA ARAUCO Y CONSTITUCION S.A. AND SUBSIDIARIES
Unaudited Interim Consolidated Financial Statements
June 30, 2021
Amounts in thousands of U.S. dollars, except as indicated
| | | | | | | | | | | | | | | | | | | | | | | | | | | | | | | | | | | | | | | | | | | | | | | | | | |
June 30, 2021 | | Maturity | | | Total | | | | | | |
Tax ID | | Name | | Currency | | | Loans
with
banks | | Up to 3
months
ThU.S.$ | | | 3 to 12
months
ThU.S.$ | | | 1 to 2
Years
ThU.S.$ | | | 2 to 3
years
ThU.S.$ | | | 3 to 4
years
ThU.S.$ | | | 4 to 5
years
ThU.S.$ | | | More
than 5
years
ThU.S.$ | | | Current
ThU.S.$ | | | Non
Current
ThU.S.$ | | | Effective
rate | | | Nominal rate |
93.458.000-1 | | Celulosa Arauco y Constitución S.A. | | | Euros | | | BNP
Paribas /
ECA | | | — | | | | 68,266 | | | | 67,688 | | | | 67,049 | | | | 66,334 | | | | 65,664 | | | | 224,567 | | | | 68,266 | | | | 491,301 | | | | 1.10% | | | 1.06% |
— | | Zona Franca Punta Pereira S.A. | | | U.S. Dollars | | | Banco
Interamericano
de
Desarrollo
A | | | 1,102 | | | | 1,090 | | | | 2,145 | | | | 1,055 | | | | — | | | | — | | | | — | | | | 2,192 | | | | 3,200 | | | | 2.24% | | | Libor
6M
+2.05% |
— | | Zona Franca Punta Pereira S.A. | | | U.S. Dollars | | | Banco
BBVA | | | — | | | | 18,340 | | | | — | | | | — | | | | — | | | | — | | | | — | | | | 18,340 | | | | — | | | | 1.00% | | | Fixed
1.00% |
— | | Celulosa y Energia Punta Pereira S.A. | | | U.S. Dollars | | | Banco
Interamericano
de
Desarrollo
A | | | 4,456 | | | | 4,410 | | | | 8,677 | | | | 4,267 | | | | — | | | | — | | | | — | | | | 8,867 | | | | 12,944 | | | | 2.24% | | | Libor
6M
+2.05% |
— | | Celulosa y Energia Punta Pereira S.A. | | | U.S. Dollars | | | Finnish
Export
Credit | | | 25,200 | | | | 24,827 | | | | 48,507 | | | | — | | | | — | | | | — | | | | — | | | | 50,027 | | | | 48,507 | | | | 3.20% | | | 0.00% |
— | | Celulosa y Energia Punta Pereira S.A. | | | U.S. Dollars | | | DnB Nor | | | 165 | | | | 132 | | | | 165 | | | | 33 | | | | — | | | | — | | | | — | | | | 297 | | | | 197 | | | | 1.47% | | | 0.00% |
— | | Eufores S.A. | | | U.S. Dollars | | | Banco
República
Oriental
del
Uruguay | | | — | | | | 26,546 | | | | — | | | | — | | | | — | | | | — | | | | — | | | | 26,546 | | | | — | | | | 1.49% | | | Libor
6M
+1.3% |
— | | Eufores S.A. | | | U.S. Dollars | | | Citibank | | | — | | | | 2,513 | | | | — | | | | — | | | | — | | | | — | | | | — | | | | 2,513 | | | | — | | | | 1.05% | | | Libor
6M
+0.9% |
— | | Eufores S.A. | | | U.S. Dollars | | | ITAU | | | — | | | | 12,564 | | | | — | | | | — | | | | — | | | | — | | | | — | | | | 12,564 | | | | — | | | | 1.05% | | | Fixed
1.05% |
— | | Eufores S.A. | | | U.S. Dollars | | | Scotiabank | | | — | | | | 5,024 | | | | — | | | | — | | | | — | | | | — | | | | — | | | | 5,024 | | | | — | | | | 1.00% | | | Fixed
1.00% |
— | | Eufores S.A. | | | U.S. Dollars | | | Santander | | | — | | | | 27,134 | | | | — | | | | — | | | | — | | | | — | | | | — | | | | 27,134 | | | | — | | | | 1.00% | | | Fixed
1.00% |
— | | Stora Enso Uruguay S.A. | | | U.S. Dollars | | | Banco
República
Oriental
del
Uruguay | | | — | | | | 554 | | | | — | | | | — | | | | — | | | | — | | | | — | | | | 554 | | | | — | | | | 1.49% | | | Libor
6M
+1.3% |
— | | Arauco Florestal Arapoti S.A. | |
| Brazilian
Real |
| | Banco
Votorantim | | | 264 | | | | — | | | | 252 | | | | — | | | | — | | | | — | | | | — | | | | 264 | | | | 252 | | | | 5.00% | | | 5.00% |
— | | Arauco Forest Brasil S.A. | |
| Brazilian
Real |
| | Banco
Votorantim | | | 234 | | | | — | | | | 224 | | | | — | | | | — | | | | — | | | | — | | | | 234 | | | | 224 | | | | 5.00% | | | 5.00% |
— | | Arauco Forest Brasil S.A. | |
| Brazilian
Real |
| | Banco
Bndes
Subcrédito
A | | | 37 | | | | 106 | | | | 34 | | | | — | | | | — | | | | — | | | | — | | | | 143 | | | | 34 | | | | 7.52% | | | TJLP
+2.91% |
— | | Arauco Forest Brasil S.A. | |
| Brazilian
Real |
| | Banco
Bndes
Subcrédito
B | | | 22 | | | | 64 | | | | 21 | | | | — | | | | — | | | | — | | | | — | | | | 86 | | | | 21 | | | | 8.52% | | | TJLP
+3.91% |
— | | Arauco Forest Brasil S.A. | | | U.S. Dollars | | | Banco
Bndes
Subcrédito
C | | | 39 | | | | 113 | | | | 49 | | | | — | | | | — | | | | — | | | | — | | | | 152 | | | | 49 | | | | 5.65% | | | Cesta
+2.91% |
— | | Arauco Forest Brasil S.A. | |
| Brazilian
Real |
| | Banco
Bndes
Subcrédito
D | | | 25 | | | | 72 | | | | 23 | | | | — | | | | — | | | | — | | | | — | | | | 97 | | | | 23 | | | | 9.72% | | | TJLP
+5.11% |
| | Arauco North America, Inc. | | | U.S. Dollars | | | Banco Itau
Corpbanca | | | — | | | | 35,091 | | | | 34,541 | | | | 229,001 | | | | — | | | | — | | | | — | | | | 35,091 | | | | 263,542 | | | | 1.81% | | | Libor
6M
+1.65% |
| | | | | | | | | | | | | | | | | | | | | | | | | | | | | | | | | | | | | | | | | | | | | | | | | | |
| | | | | | | | Total | | | 31,544 | | | | 226,846 | | | | 162,326 | | | | 301,405 | | | | 66,334 | | | | 65,664 | | | | 224,567 | | | | 258,391 | | | | 820,294 | | | | | | | |
| | | | | | | | | | | | | | | | | | | | | | | | | | | | | | | | | | | | | | | | | | | | | | | | | | |
| | | | | | | | | | | | | | | | | | | | | | | | | | | | | | | | | | | | | | | | | | | | | | | | |
June 30, 2021 | | Maturity | | | Total | | | | | | |
Tax ID | | Name | | Currency | | Bonds | | Up to 3 months
ThU.S.$ | | | 3 to 12 months
ThU.S.$ | | | 1 to 2 years
ThU.S.$ | | | 2 to 3 years
ThU.S.$ | | | 3 to 4 years
ThU.S.$ | | | 4 to 5 years
ThU.S.$ | | | More
than 5 years
ThU.S.$ | | | Current
ThU.S.$ | | | Non Current
ThU.S.$ | | | Effective
rate | | | Nominal rate |
93.458.000-1 | | Celulosa Arauco y Constitución S.A. | | U.F. | | Barau-F | | | — | | | | 24,995 | | | | 24,214 | | | | 23,434 | | | | 22,654 | | | | 21,873 | | | | 70,410 | | | | 24,995 | | | | 162,585 | | | | 4.25% | | | 4.25% |
93.458.000-1 | | Celulosa Arauco y Constitución S.A. | | U.F. | | Barau-F | | | — | | | | 9,998 | | | | 9,686 | | | | 9,374 | | | | 9,061 | | | | 8,749 | | | | 28,164 | | | | 9,998 | | | | 65,034 | | | | 4.25% | | | 4.25% |
93.458.000-1 | | Celulosa Arauco y Constitución S.A. | | U.F. | | Barau-P | | | — | | | | 17,363 | | | | 26,090 | | | | 25,355 | | | | 24,620 | | | | 23,885 | | | | 137,336 | | | | 17,363 | | | | 237,286 | | | | 4.00% | | | 4.00% |
93.458.000-1 | | Celulosa Arauco y Constitución S.A. | | U.F. | | Barau-R | | | — | | | | 7,283 | | | | 7,283 | | | | 7,283 | | | | 7,283 | | | | 7,283 | | | | 269,668 | | | | 7,283 | | | | 298,800 | | | | 3.60% | | | 3.60% |
93.458.000-1 | | Celulosa Arauco y Constitución S.A. | | U.F. | | Barau-S | | | — | | | | 4,870 | | | | 4,870 | | | | 4,870 | | | | 4,870 | | | | 4,870 | | | | 206,553 | | | | 4,870 | | | | 226,033 | | | | 2.40% | | | 2.40% |
93.458.000-1 | | Celulosa Arauco y Constitución S.A. | | U.F. | | Barau-W | | | — | | | | 2,558 | | | | 2,558 | | | | 2,558 | | | | 2,558 | | | | 2,558 | | | | 128,867 | | | | 2,558 | | | | 139,099 | | | | 2.10% | | | 2.10% |
93.458.000-1 | | Celulosa Arauco y Constitución S.A. | | U.F. | | Barau-X | | | — | | | | 6,022 | | | | 6,022 | | | | 6,022 | | | | 6,022 | | | | 6,022 | | | | 329,913 | | | | 6,022 | | | | 354,001 | | | | 2.70% | | | 2.70% |
93.458.000-1 | | Celulosa Arauco y Constitución S.A. | | U.S. Dollars | | Yankee
2022 | | | 2,996 | | | | 129,164 | | | | — | | | | — | | | | — | | | | — | | | | — | | | | 132,160 | | | | — | | | | 4.75% | | | 4.75% |
93.458.000-1 | | Celulosa Arauco y Constitución S.A. | | U.S. Dollars | | Yankee
2024 | | | 11,250 | | | | 11,250 | | | | 22,500 | | | | 22,500 | | | | 511,250 | | | | — | | | | — | | | | 22,500 | | | | 556,250 | | | | 4.50% | | | 4.50% |
93.458.000-1 | | Celulosa Arauco y Constitución S.A. | | U.S. Dollars | | Yankee
2027 | | | — | | | | 19,375 | | | | 19,375 | | | | 19,375 | | | | 19,375 | | | | 19,375 | | | | 529,063 | | | | 19,375 | | | | 606,563 | | | | 3.88% | | | 3.88% |
93.458.000-1 | | Celulosa Arauco y Constitución S.A. | | U.S. Dollars | | Yankee
2047 | | | — | | | | 22,000 | | | | 22,000 | | | | 22,000 | | | | 22,000 | | | | 22,000 | | | | 873,000 | | | | 22,000 | | | | 961,000 | | | | 5.50% | | | 5.50% |
93.458.000-1 | | Celulosa Arauco y Constitución S.A. | | U.S. Dollars | | Yankee
2029 | | | — | | | | 21,250 | | | | 21,250 | | | | 21,250 | | | | 21,250 | | | | 21,250 | | | | 563,750 | | | | 21,250 | | | | 648,750 | | | | 4.25% | | | 4.25% |
93.458.000-1 | | Celulosa Arauco y Constitución S.A. | | U.S. Dollars | | Yankee
2049 | | | — | | | | 27,500 | | | | 27,500 | | | | 27,500 | | | | 27,500 | | | | 27,500 | | | | 1,132,500 | | | | 27,500 | | | | 1,242,500 | | | | 5.50% | | | 5.50% |
93.458.000-1 | | Celulosa Arauco y Constitución S.A. | | U.S. Dollars | | Yankee
2030 | | | 10,500 | | | | 10,500 | | | | 21,000 | | | | 21,000 | | | | 21,000 | | | | 21,000 | | | | 584,000 | | | | 21,000 | | | | 668,000 | | | | 4.20% | | | 4.20% |
93.458.000-1 | | Celulosa Arauco y Constitución S.A. | | U.S. Dollars | | Yankee
2050 | | | 12,875 | | | | 12,875 | | | | 25,750 | | | | 25,750 | | | | 25,750 | | | | 25,750 | | | | 1,118,000 | | | | 25,750 | | | | 1,221,000 | | | | 5.15% | | | 5.15% |
— | | Prime-Line, Inc. | | U.S. Dollars | | Bond
ADFA
2014 | | | 128 | | | | 384 | | | | 512 | | | | 512 | | | | 512 | | | | 512 | | | | 1,237 | | | | 512 | | | | 3,285 | | | | 4.84% | | | 4.84% |
— | | Prime-Line, Inc. | | U.S. Dollars | | Bond
ADFA
2013 | | | 38 | | | | 111 | | | | 149 | | | | 37 | | | | — | | | | — | | | | — | | | | 149 | | | | 186 | | | | 4.00% | | | 4.00% |
| | | | | | | | | | | | | | | | | | | | | | | | | | | | | | | | | | | | | | | | | | | | | | | | |
| | | | | | Total | | | 37,787 | | | | 327,498 | | | | 240,759 | | | | 238,820 | | | | 725,705 | | | | 212,627 | | | | 5,972,461 | | | | 365,285 | | | | 7,390,372 | | | | | | | |
| | | | | | | | | | | | | | | | | | | | | | | | | | | | | | | | | | | | | | | | | | | | | | | | |
105
CELULOSA ARAUCO Y CONSTITUCION S.A. AND SUBSIDIARIES
Unaudited Interim Consolidated Financial Statements
June 30, 2021
Amounts in thousands of U.S. dollars, except as indicated
| | | | | | | | | | | | | | | | | | | | | | | | | | | | | | | | | | | | | | | | | | |
June 30, 2021 | | Maturity | | | Total | |
Tax ID | | Name | | Currency | | Underlying
asset class | | Up to 3
months
ThU.S.$ | | | 3 to 12
months
ThU.S.$ | | | 1 to 2
years
ThU.S.$ | | | 2 to 3
years
ThU.S.$ | | | 3 to 4
years
ThU.S.$ | | | 4 to 5
years
ThU.S.$ | | | More
than 5
years
ThU.S.$ | | | Current
ThU.S.$ | | | Non
Current
ThU.S.$ | |
| 85.805.200-9 | | Forestal
Arauco S.A. | | U.F. | | Motor
vehicles | | | 518 | | | | 1,331 | | | | 1,445 | | | | 701 | | | | 455 | | | | 395 | | | | 90 | | | | 1,849 | | | | 3,086 | |
| 85.805.200-9 | | Forestal
Arauco S.A. | | U.S. Dollars | | Lands | | | 60 | | | | 180 | | | | 240 | | | | 240 | | | | 240 | | | | 240 | | | | 600 | | | | 240 | | | | 1,560 | |
| 85.805.200-9 | | Forestal
Arauco S.A. | | U.F. | | Plants and
equipments | | | 950 | | | | 1,346 | | | | 590 | | | | — | | | | — | | | | — | | | | — | | | | 2,296 | | | | 590 | |
| 85.805.200-9 | | Forestal
Arauco S.A. | | Chilean
pesos | | Plants and
equipments | | | 37 | | | | 112 | | | | 149 | | | | — | | | | — | | | | — | | | | — | | | | 149 | | | | 149 | |
| 85.805.200-9 | | Forestal
Arauco S.A. | | U.F. | | Other
properties,
plant and
equipment | | | 1,135 | | | | 3,258 | | | | 1,684 | | | | 355 | | | | 208 | | | | 740 | | | | — | | | | 4,393 | | | | 2,987 | |
| 85.805.200-9 | | Forestal
Arauco S.A. | | Chilean
pesos | | Other
properties,
plant and
equipment | | | 106 | | | | 294 | | | | 141 | | | | 141 | | | | 141 | | | | 487 | | | | — | | | | 400 | | | | 910 | |
| — | | Arauco
Argentina S.A. | | U.S. Dollars | | Buildings
and
constructions | | | 124 | | | | 177 | | | | 24 | | | | — | | | | — | | | | — | | | | — | | | | 301 | | | | 24 | |
| — | | Arauco
Argentina S.A. | | U.S. Dollars | | IT
equipment | | | 13 | | | | 39 | | | | 9 | | | | — | | | | — | | | | — | | | | — | | | | 52 | | | | 9 | |
| — | | Arauco
Argentina S.A. | | U.S. Dollars | | Plants and
equipments | | | 347 | | | | 1,040 | | | | 1,194 | | | | 1,002 | | | | 167 | | | | — | | | | — | | | | 1,387 | | | | 2,363 | |
| — | | Arauco
Argentina S.A. | | U.S. Dollars | | Motor
vehicles | | | 806 | | | | 1,646 | | | | 1,696 | | | | 1,500 | | | | — | | | | — | | | | — | | | | 2,452 | | | | 3,196 | |
| — | | Arauco
Industria de
Paineis S.A. | | Brazilian
Real | | Other
properties,
plant and
equipment | | | 3 | | | | 10 | | | | 1 | | | | — | | | | — | | | | — | | | | — | | | | 13 | | | | 1 | |
| — | | Arauco
Industria de
Paineis S.A. | | Brazilian
Real | | Fixed
facilities and
accessories | | | 10 | | | | 30 | | | | 40 | | | | 7 | | | | | | | | | | | | | | | | 40 | | | | 47 | |
| — | | Arauco
Industria de
Paineis S.A. | | Brazilian
Real | | IT
equipment | | | 14 | | | | 43 | | | | 12 | | | | — | | | | — | | | | — | | | | — | | | | 57 | | | | 12 | |
| — | | Arauco
Industria de
Paineis S.A. | | Brazilian
Real | | Motor
vehicles | | | 123 | | | | 306 | | | | — | | | | — | | | | — | | | | — | | | | — | | | | 429 | | | | — | |
| — | | Arauco Forest
Brasil S.A. | | Brazilian
Real | | IT
equipment | | | 6 | | | | 17 | | | | 7 | | | | — | | | | — | | | | — | | | | — | | | | 23 | | | | 7 | |
| — | | Arauco Forest
Brasil S.A. | | Brazilian
Real | | Lands | | | 1,468 | | | | 3,640 | | | | 4,629 | | | | 4,629 | | | | 4,629 | | | | 4,629 | | | | 5,401 | | | | 5,108 | | | | 23,917 | |
| — | | Arauco
Florestal
Arapoti S.A. | | Brazilian
Real | | IT
equipment | | | 2 | | | | 5 | | | | 2 | | | | — | | | | — | | | | — | | | | — | | | | 7 | | | | 2 | |
| — | | Arauco do
Brasil S.A. | | Brazilian
Real | | Buildings
and
constructions | | | 46 | | | | 139 | | | | 186 | | | | 139 | | | | — | | | | — | | | | — | | | | 185 | | | | 325 | |
| — | | Arauco do
Brasil S.A. | | Brazilian
Real | | IT
equipment | | | 15 | | | | 45 | | | | 23 | | | | — | | | | — | | | | — | | | | — | | | | 60 | | | | 23 | |
| — | | Arauco do
Brasil S.A. | | Brazilian
Real | | Motor
vehicles | | | 106 | | | | 317 | | | | 141 | | | | — | | | | — | | | | — | | | | — | | | | 423 | | | | 141 | |
| 93.458.000-1 | | Celulosa
Arauco y
Constitucion
S.A. | | U.F. | | Buildings
and
constructions | | | 427 | | | | 1,230 | | | | 1,584 | | | | 377 | | | | — | | | | — | | | | — | | | | 1,657 | | | | 1,961 | |
| 93.458.000-1 | | Celulosa
Arauco y
Constitucion
S.A. | | U.F. | | Motor
vehicles | | | 162 | | | | 486 | | | | 499 | | | | 177 | | | | 110 | | | | 61 | | | | 5 | | | | 648 | | | | 852 | |
| 93.458.000-1 | | Celulosa
Arauco y
Constitucion
S.A. | | Chilean
pesos | | Buildings
and
constructions | | | 18 | | | | 54 | | | | 54 | | | | — | | | | — | | | | — | | | | — | | | | 72 | | | | 54 | |
| 93.458.000-1 | | Celulosa
Arauco y
Constitucion
S.A. | | U.S. Dollars | | Plants and
equipments | | | 484 | | | | 484 | | | | — | | | | — | | | | — | | | | — | | | | — | | | | 968 | | | | — | |
| 93.458.000-1 | | Celulosa
Arauco y
Constitucion
S.A. | | Chilean
pesos | | Motor
vehicles | | | 4,938 | | | | 14,815 | | | | 15,452 | | | | 1,267 | | | | — | | | | — | | | | — | | | | 19,753 | | | | 16,719 | |
| 93.458.000-1 | | Celulosa
Arauco y
Constitucion
S.A. | | U.S. Dollars | | Motor
vehicles | | | 45 | | | | 75 | | | | — | | | | — | | | | — | | | | — | | | | — | | | | 120 | | | | — | |
| — | | Arauco North
America, Inc. | | U.S. Dollars | | Buildings
and
constructions | | | 275 | | | | 838 | | | | 1,165 | | | | 1,294 | | | | 1,435 | | | | 1,589 | | | | 2,339 | | | | 1,113 | | | | 7,822 | |
| — | | Arauco North
America, Inc. | | U.S. Dollars | | Motor
vehicles | | | 39 | | | | 190 | | | | 158 | | | | 136 | | | | 48 | | | | — | | | | — | | | | 229 | | | | 342 | |
| — | | Arauco Canada
Limited | | Canadian
dollars | | Buildings
and
constructions | | | 26 | | | | 36 | | | | — | | | | — | | | | — | | | | — | | | | — | | | | 62 | | | | — | |
| — | | Arauco Canada
Limited | | Canadian
dollars | | Motor
vehicles | | | 13 | | | | 42 | | | | 75 | | | | 60 | | | | 13 | | | | — | | | | — | | | | 55 | | | | 148 | |
| — | | Celulosa y
Energía Punta
Pereira S.A. | | U.S. Dollars | | Plants and
equipments | | | 192 | | | | 488 | | | | 592 | | | | 592 | | | | 592 | | | | 592 | | | | 7,424 | | | | 680 | | | | 9,792 | |
| — | | Eufores S.A. | | U.S. Dollars | | Lands | | | 806 | | | | 3,878 | | | | 6,065 | | | | 5,853 | | | | 5,547 | | | | 5,126 | | | | 36,030 | | | | 4,684 | | | | 58,621 | |
| — | | Eufores S.A. | | U.S. Dollars | | Plants and
equipments | | | 306 | | | | 917 | | | | 1,222 | | | | 1,222 | | | | 1,222 | | | | 1,222 | | | | 1,834 | | | | 1,223 | | | | 6,722 | |
| — | | Eufores S.A. | | U.S. Dollars | | Buildings
and
constructions | | | 111 | | | | 251 | | | | 239 | | | | 107 | | | | — | | | | — | | | | — | | | | 362 | | | | 346 | |
| 96.510.970-6 | | Maderas
Arauco S.A. | | Chilean
pesos | | Motor
vehicles | | | 2,981 | | | | 9,154 | | | | 8,943 | | | | 2,380 | | | | — | | | | — | | | | — | | | | 12,135 | | | | 11,323 | |
| 96.510.970-6 | | Maderas
Arauco S.A. | | U.F. | | Motor
vehicles | | | 92 | | | | 265 | | | | 238 | | | | 36 | | | | 12 | | | | 5 | | | | — | | | | 357 | | | | 291 | |
| | Arauco
Colombia S.A. | | U.S. Dollars | | Buildings
and
constructions | | | 6 | | | | 18 | | | | 42 | | | | — | | | | — | | | | — | | | | — | | | | 24 | | | | 42 | |
| — | | Arauco
Colombia S.A. | | U.S. Dollars | | Fixed
facilities and
accessories | | | 99 | | | | 99 | | | | — | | | | — | | | | — | | | | — | | | | — | | �� | | 198 | | | | — | |
| — | | Arauco Europe
Cooperatief
U.A. | | Euros | | Motor
vehicles | | | 6 | | | | 17 | | | | 23 | | | | 14 | | | | 9 | | | | — | | | | — | | | | 23 | | | | 46 | |
| — | | Arauco Europe
Cooperatief
U.A. | | Euros | | Buildings
and
constructions | | | 19 | | | | 59 | | | | 80 | | | | 82 | | | | 28 | | | | — | | | | — | | | | 78 | | | | 190 | |
| — | | Araucomex
S.A. de C.V. | | Mexican
pesos | | Buildings
and
constructions | | | 344 | | | | 224 | | | | 1,763 | | | | 1,482 | | | | 985 | | | | — | | | | — | | | | 568 | | | | 4,230 | |
| — | | Araucomex
S.A. de C.V. | | U.S. Dollars | | Buildings
and
constructions | | | 27 | | | | 82 | | | | 115 | | | | 40 | | | | — | | | | — | | | | — | | | | 109 | | | | 155 | |
| — | | Arauco
Industria de
México, S.A.
de C.V. | | U.S. Dollars | | Plants and
equipments | | | — | | | | 193 | | | | 131 | | | | — | | | | — | | | | — | | | | — | | | | 193 | | | | 131 | |
| — | | Arauco
Industria de
México, S.A.
de C.V. | | Mexican
pesos | | Lands | | | — | | | | 4 | | | | 9 | | | | 9 | | | | 9 | | | | — | | | | — | | | | 4 | | | | 27 | |
| — | | Araucomex
Servicios S.A.
de C.V. | | Mexican
pesos | | Motor
vehicles | | | — | | | | 50 | | | | 64 | | | | 59 | | | | 60 | | | | 5 | | | | — | | | | 50 | | | | 188 | |
| 96.637.330-K | | Servicios
Logisticos
Arauco S.A. | | U.F. | | Motor
vehicles | | | 19 | | | | 56 | | | | 49 | | | | — | | | | — | | | | — | | | | — | | | | 75 | | | | 49 | |
| 79.990.550-7 | | Investigaciones
Forestales
Bioforest S.A. | | U.F. | | Motor
vehicles | | | 21 | | | | 28 | | | | 40 | | | | 18 | | | | 5 | | | | — | | | | — | | | | 49 | | | | 63 | |
| | | | | | | | | | | | | | | | | | | | | | | | | | | | | | | | | | | | | | | | | | |
| | | | | | Total | | | 17,345 | | | | 48,008 | | | | 50,815 | | | | 23,919 | | | | 15,915 | | | | 15,091 | | | | 53,723 | | | | 65,353 | | | | 159,463 | |
| | | | | | | | | | | | | | | | | | | | | | | | | | | | | | | | | | | | | | | | | | |
As part of the policy of Arauco, it considers compliance with all Accounts Payable, whether with related (see Note 13) or third parties, within a period not exceeding 30 days.
106
CELULOSA ARAUCO Y CONSTITUCION S.A. AND SUBSIDIARIES
Unaudited Interim Consolidated Financial Statements
June 30, 2021
Amounts in thousands of U.S. dollars, except as indicated
| | | | | | | | | | | | | | | | | | | | | | | | | | | | | | | | | | | | | | | | | | | | | | | | | | |
December 31, 2020 | | Maturity | | | Total | | | | | | |
Tax ID | | Name | | Currency | | | Loans with
banks | | Up to 3
months
ThU.S.$ | | | 3 to 12
months
ThU.S.$ | | | 1 to 2
years
ThU.S.$ | | | 2 to 3
years
ThU.S.$ | | | 3 to 4
years
ThU.S.$ | | | 4 to 5
years
ThU.S.$ | | | More
than 5
years
ThU.S.$ | | | Current
ThU.S.$ | | | Non
Current
ThU.S.$ | | | Effective
rate | | | Nominal rate |
93.458.000-1 | | Celulosa Arauco y Constitución S.A. | | | U.S. Dollars | | | Scotiabank | | | 1,379 | | | | 1,378 | | | | 2,733 | | | | 202,733 | | | | — | | | | — | | | | — | | | | 2,757 | | | | 205,466 | | | | 1.35% | | | Libor
6M+1.1% |
93.458.000-1 | | Celulosa Arauco y Constitución S.A. | | | Euros | | | BNP Paribas /
ECA | | | — | | | | 31,224 | | | | 57,365 | | | | 56,798 | | | | 56,251 | | | | 55,658 | | | | 216,997 | | | | 31,224 | | | | 443,069 | | | | 1.06% | | | 1.06% |
— | | Zona Franca Punta Pereira S.A. | | | U.S. Dollars | | | Banco
Interamericano
de Desarrollo
A | | | 1,117 | | | | 1,104 | | | | 2,172 | | | | 2,123 | | | | — | | | | — | | | | — | | | | 2,221 | | | | 4,295 | | | | 2.33% | | | Libor
6M
+2.05% |
— | | Zona Franca Punta Pereira S.A. | | | U.S. Dollars | | | Banco BBVA | | | — | | | | 18,341 | | | | — | | | | — | | | | — | | | | — | | | | — | | | | 18,341 | | | | — | | | | 1.00% | | | 1.00% |
— | | Celulosa y Energia Punta Pereira S.A. | | | U.S. Dollars | | | Banco
Interamericano
de Desarrollo
A | | | 4,517 | | | | 4,466 | | | | 8,785 | | | | 8,588 | | | | — | | | | — | | | | — | | | | 8,983 | | | | 17,373 | | | | 2.33% | | | Libor
6M
+2.05% |
— | | Celulosa y Energia Punta Pereira S.A. | | | U.S. Dollars | | | Finn Vera/
Finnish Export
Credit | | | 25,589 | | | | 25,200 | | | | 49,269 | | | | 24,065 | | | | — | | | | — | | | | — | | | | 50,789 | | | | 73,334 | | | | 3.20% | | | 3.20% |
— | | Celulosa y Energia Punta Pereira S.A. | | | U.S. Dollars | | | DnB Nor | | | 187 | | | | 155 | | | | 218 | | | | 93 | | | | — | | | | — | | | | — | | | | 342 | | | | 311 | | | | — | | | — |
— | | Eufores S.A. | | | U.S. Dollars | | | Banco
República
Oriental del
Uruguay | | | — | | | | 26,551 | | | | — | | | | — | | | | — | | | | — | | | | — | | | | 26,551 | | | | — | | | | 1.54% | | | Libor
6M
+1.3% |
— | | Eufores S.A. | | | U.S. Dollars | | | Citibank | | | — | | | | 2,514 | | | | — | | | | — | | | | — | | | | — | | | | — | | | | 2,514 | | | | — | | | | 1.16% | | | Libor
6M
+0.9% |
— | | Eufores S.A. | | | U.S. Dollars | | | ITAU | | | — | | | | 12,564 | | | | — | | | | — | | | | — | | | | — | | | | — | | | | 12,564 | | | | — | | | | 1.05% | | | 1.05% |
— | | Eufores S.A. | | | U.S. Dollars | | | Scotiabank | | | — | | | | 5,025 | | | | — | | | | — | | | | — | | | | — | | | | — | | | | 5,025 | | | | — | | | | 1.00% | | | 1.00% |
— | | Eufores S.A. | | | U.S. Dollars | | | Santander | | | — | | | | 27,133 | | | | — | | | | — | | | | — | | | | — | | | | — | | | | 27,133 | | | | — | | | | 1.00% | | | 1.00% |
— | | Stora Enso Uruguay S.A. | | | U.S. Dollars | | | Banco
República
Oriental del
Uruguay | | | — | | | | 554 | | | | — | | | | — | | | | — | | | | — | | | | — | | | | 554 | | | | — | | | | 1.54% | | | Libor
6M
+1.3% |
— | | Arauco Florestal Arapoti S.A. | |
| Brazilian
Real |
| | Banco
Votorantim | | | — | | | | 255 | | | | 243 | | | | — | | | | — | | | | — | | | | — | | | | 255 | | | | 243 | | | | 5.00% | | | 5.00% |
— | | Arauco Forest Brasil S.A. | |
| Brazilian
Real |
| | Banco
Votorantim | | | — | | | | 226 | | | | 215 | | | | — | | | | — | | | | — | | | | — | | | | 226 | | | | 215 | | | | 5.00% | | | 5.00% |
— | | Arauco Forest Brasil S.A. | |
| Brazilian
Real |
| | Banco Bndes
Subcrédito A | | | 36 | | | | 106 | | | | 100 | | | | — | | | | — | | | | — | | | | — | | | | 142 | | | | 100 | | | | 7.46% | | | TJLP
+2.91% |
— | | Arauco Forest Brasil S.A. | |
| Brazilian
Real |
| | Banco Bndes
Subcrédito B | | | 22 | | | | 64 | | | | 60 | | | | — | | | | — | | | | — | | | | — | | | | 86 | | | | 60 | | | | 8.46% | | | TJLP
+3.91% |
— | | Arauco Forest Brasil S.A. | | | U.S. Dollars | | | Banco Bndes
Subcrédito C | | | 40 | | | | 116 | | | | 124 | | | | — | | | | — | | | | — | | | | — | | | | 156 | | | | 124 | | | | 5.80% | | | Cesta
+2.91% |
— | | Arauco Forest Brasil S.A. | | | U.S. Dollars | | | Banco Bndes
Subcrédito D | | | 25 | | | | 72 | | | | 67 | | | | — | | | | — | | | | — | | | | — | | | | 97 | | | | 67 | | | | 9.66% | | | TJLP
+5.11% |
— | | Arauco North America, Inc. | | | U.S. Dollars | | | Banco del
Estado de
Chile - NY
Branch | | | — | | | | 35,657 | | | | 35,077 | | | | 34,496 | | | | 212,036 | | | | — | | | | — | | | | 35,657 | | | | 281,609 | | | | 1.91% | | | Libor
6M
+1.65% |
| | | | | | | | | | | | | | | | | | | | | | | | | | | | | | | | | | | | | | | | | | | | | | | | | | |
| | | | | | | | Total | | | 32,912 | | | | 192,705 | | | | 156,428 | | | | 328,896 | | | | 268,287 | | | | 55,658 | | | | 216,997 | | | | 225,617 | | | | 1,026,266 | | | | | | | |
| | | | | | | | | | | | | | | | | | | | | | | | | | | | | | | | | | | | | | | | | | | | | | | | | | |
December 31, 2020 | | Maturity | | | Total | | | | | | |
Tax ID | | Name | | Currency | | | Bonds | | Up to 3 months
ThU.S.$ | | | 3 to 12 months
ThU.S.$ | | | 1 to 2 years
ThU.S.$ | | | 2 to 3 years
ThU.S.$ | | | 3 to 4 years
ThU.S.$ | | | 4 to 5 years
ThU.S.$ | | | More
than 5 years
ThU.S.$ | | | Current
ThU.S.$ | | | Non Current
ThU.S.$ | | | Effective
rate | | | Nominal rate |
93.458.000-1 | | Celulosa Arauco y Constitución S.A. | | | U.F. | | | Barau-F | | | — | | | | 25,426 | | | | 24,644 | | | | 23,863 | | | | 23,081 | | | | 22,299 | | | | 81,380 | | | | 25,426 | | | | 175,267 | | | | 4.25% | | | 4.25% |
93.458.000-1 | | Celulosa Arauco y Constitución S.A. | | | U.F. | | | Barau-F | | | — | | | | 10,170 | | | | 9,858 | | | | 9,545 | | | | 9,232 | | | | 8,920 | | | | 32,552 | | | | 10,170 | | | | 70,107 | | | | 4.25% | | | 4.25% |
93.458.000-1 | | Celulosa Arauco y Constitución S.A. | | | U.F. | | | Barau-P | | | — | | | | 8,098 | | | | 26,500 | | | | 25,764 | | | | 25,027 | | | | 24,291 | | | | 149,427 | | | | 8,098 | | | | 251,009 | | | | 4.00% | | | 4.00% |
93.458.000-1 | | Celulosa Arauco y Constitución S.A. | | | U.F. | | | Barau-Q | | | — | | | | 10,375 | | | | — | | | | — | | | | — | | | | — | | | | — | | | | 10,375 | | | | — | | | | 3.00% | | | 3.00% |
93.458.000-1 | | Celulosa Arauco y Constitución S.A. | | | U.F. | | | Barau-R | | | — | | | | 7,295 | | | | 7,295 | | | | 7,295 | | | | 7,295 | | | | 7,295 | | | | 273,750 | | | | 7,295 | | | | 302,930 | | | | 3.60% | | | 3.60% |
93.458.000-1 | | Celulosa Arauco y Constitución S.A. | | | U.F. | | | Barau-S | | | — | | | | 4,878 | | | | 4,878 | | | | 4,878 | | | | 4,878 | | | | 4,878 | | | | 209,325 | | | | 4,878 | | | | 228,837 | | | | 2.40% | | | 2.40% |
93.458.000-1 | | Celulosa Arauco y Constitución S.A. | | | U.F. | | | Barau-W | | | — | | | | 2,563 | | | | 2,563 | | | | 2,563 | | | | 2,563 | | | | 2,563 | | | | 130,356 | | | | 2,563 | | | | 140,608 | | | | 2.10% | | | 2.10% |
93.458.000-1 | | Celulosa Arauco y Constitución S.A. | | | U.F. | | | Barau-X | | | — | | | | 6,032 | | | | 6,032 | | | | 6,032 | | | | 6,032 | | | | 6,032 | | | | 333,461 | | | | 6,032 | | | | 357,589 | | | | 2.70% | | | 2.70% |
93.458.000-1 | | Celulosa Arauco y Constitución S.A. | | | U.S. Dollars | | | Yankee 2022 | | | 2,996 | | | | 2,996 | | | | 129,164 | | | | — | | | | — | | | | — | | | | — | | | | 5,992 | | | | 129,164 | | | | 4.75% | | | 4.75% |
93.458.000-1 | | Celulosa Arauco y Constitución S.A. | | | U.S. Dollars | | | Yankee 2024 | | | 11,250 | | | | 11,250 | | | | 22,500 | | | | 22,500 | | | | 522,500 | | | | — | | | | — | | | | 22,500 | | | | 567,500 | | | | 4.50% | | | 4.50% |
93.458.000-1 | | Celulosa Arauco y Constitución S.A. | | | U.S. Dollars | | | Yankee 2027 | | | — | | | | 19,375 | | | | 19,375 | | | | 19,375 | | | | 19,375 | | | | 19,375 | | | | 538,750 | | | | 19,375 | | | | 616,250 | | | | 3.88% | | | 3.88% |
93.458.000-1 | | Celulosa Arauco y Constitución S.A. | | | U.S. Dollars | | | Yankee 2047 | | | — | | | | 22,000 | | | | 22,000 | | | | 22,000 | | | | 22,000 | | | | 22,000 | | | | 884,000 | | | | 22,000 | | | | 972,000 | | | | 5.50% | | | 5.50% |
93.458.000-1 | | Celulosa Arauco y Constitución S.A. | | | U.S. Dollars | | | Yankee 2029 | | | — | | | | 21,250 | | | | 21,250 | | | | 21,250 | | | | 21,250 | | | | 21,250 | | | | 574,375 | | | | 21,250 | | | | 659,375 | | | | 4.25% | | | 4.25% |
93.458.000-1 | | Celulosa Arauco y Constitución S.A. | | | U.S. Dollars | | | Yankee 2049 | | | — | | | | 27,500 | | | | 27,500 | | | | 27,500 | | | | 27,500 | | | | 27,500 | | | | 1,146,250 | | | | 27,500 | | | | 1,256,250 | | | | 5.50% | | | 5.50% |
93.458.000-1 | | Celulosa Arauco y Constitución S.A. | | | U.S. Dollars | | | Yankee 2030 | | | 10,500 | | | | 10,500 | | | | 21,000 | | | | 21,000 | | | | 21,000 | | | | 21,000 | | | | 594,500 | | | | 21,000 | | | | 678,500 | | | | 4.20% | | | 4.20% |
93.458.000-1 | | Celulosa Arauco y Constitución S.A. | | | U.S. Dollars | | | Yankee 2050 | | | 12,875 | | | | 12,875 | | | | 25,750 | | | | 25,750 | | | | 25,750 | | | | 25,750 | | | | 1,130,875 | | | | 25,750 | | | | 1,233,875 | | | | 5.15% | | | 5.15% |
— | | Prime-Line, Inc. | | | U.S. Dollars | | | Bond ADFA
2014 | | | 128 | | | | 384 | | | | 512 | | | | 512 | | | | 512 | | | | 512 | | | | 1,493 | | | | 512 | | | | 3,541 | | | | 4.84% | | | 4.84% |
— | | Prime-Line, Inc. | | | U.S. Dollars | | | Bond ADFA
2013 | | | 38 | | | | 113 | | | | 149 | | | | 112 | | | | — | | | | — | | | | — | | | | 151 | | | | 261 | | | | 4.00% | | | 4.00% |
| | | | | | | | | | | | | | | | | | | | | | | | | | | | | | | | | | | | | | | | | | | | | | | | | | |
| | | | | | | | Total | | | 37,787 | | | | 203,080 | | | | 370,970 | | | | 239,939 | | | | 737,995 | | | | 213,665 | | | | 6,080,494 | | | | 240,867 | | | | 7,643,063 | | | | | | | |
| | | | | | | | | | | | | | | | | | | | | | | | | | | | | | | | | | | | | | | | | | | | | | | | | | |
107
CELULOSA ARAUCO Y CONSTITUCION S.A. AND SUBSIDIARIES
Unaudited Interim Consolidated Financial Statements
June 30, 2021
Amounts in thousands of U.S. dollars, except as indicated
| | | | | | | | | | | | | | | | | | | | | | | | | | | | | | | | | | | | | | | | | | |
December 31, 2020 | | Maturity | | | Total | |
Tax ID | | Name | | Currency | | Underlying
asset class | | Up to 3
months
ThU.S.$ | | | 3 to 12
months
ThU.S.$ | | | 1 to 2
years
ThU.S.$ | | | 2 to 3
years
ThU.S.$ | | | 3 to 4
years
ThU.S.$ | | | 4 to 5
years
ThU.S.$ | | | More
than 5
years
ThU.S.$ | | | Current
ThU.S.$ | | | Non
Current
ThU.S.$ | |
| 85.805.200-9 | | Forestal
Arauco S.A. | | U.F. | | Motor
vehicles | | | 527 | | | | 1,563 | | | | 1,578 | | | | 1,057 | | | | 569 | | | | 431 | | | | 271 | | | | 2,090 | | | | 3,906 | |
| 85.805.200-9 | | Forestal
Arauco S.A. | | U.F. | | Plants and
equipments | | | 1,511 | | | | 2,005 | | | | 1,410 | | | | 41 | | | | — | | | | — | | | | — | | | | 3,516 | | | | 1,451 | |
| 85.805.200-9 | | Forestal
Arauco S.A. | | Chilean
pesos | | Plants and
equipments | | | 384 | | | | 259 | | | | 153 | | | | 76 | | | | — | | | | — | | | | — | | | | 643 | | | | 229 | |
| 85.805.200-9 | | Forestal
Arauco S.A. | | U.F. | | Other
properties,
plant and
equipment | | | 1,518 | | | | 3,812 | | | | 4,459 | | | | 46 | | | | — | | | | — | | | | — | | | | 5,330 | | | | 4,505 | |
| 85.805.200-9 | | Forestal
Arauco S.A. | | Chilean
pesos | | Other
properties,
plant and
equipment | | | 72 | | | | 217 | | | | 120 | | | | — | | | | — | | | | — | | | | — | | | | 289 | | | | 120 | |
| — | | Arauco
Argentina S.A. | | U.S. Dollars | | Buildings
and
constructions | | | 116 | | | | 334 | | | | 34 | | | | — | | | | — | | | | — | | | | — | | | | 450 | | | | 34 | |
| — | | Arauco
Argentina S.A. | | U.S. Dollars | | IT
equipment | | | 13 | | | | 39 | | | | 35 | | | | — | | | | — | | | | — | | | | — | | | | 52 | | | | 35 | |
| — | | Arauco
Argentina S.A. | | U.S. Dollars | | Other
properties,
plant and
equipment | | | — | | | | — | | | | — | | | | — | | | | — | | | | — | | | | — | | | | — | | | | — | |
| — | | Arauco
Argentina S.A. | | U.S. Dollars | | Plants and
equipments | | | 347 | | | | 1,040 | | | | 1,386 | | | | 1,002 | | | | 668 | | | | — | | | | — | | | | 1,387 | | | | 3,056 | |
| — | | Arauco
Argentina S.A. | | U.S. Dollars | | Motor
vehicles | | | 744 | | | | 2,316 | | | | 1,804 | | | | 1,589 | | | | 750 | | | | — | | | | — | | | | 3,060 | | | | 4,143 | |
| — | | Novo Oeste
Gestao de
Ativos
Florestais S.A. | | Brazilian
Real | | Lands | | | — | | | | — | | | | — | | | | — | | | | — | | | | — | | | | — | | | | — | | | | — | |
| — | | Arauco
Industria de
Paineis S.A. | | Brazilian
Real | | Other
properties,
plant and
equipment | | | 3 | | | | 10 | | | | 8 | | | | — | | | | — | | | | — | | | | — | | | | 13 | | | | 8 | |
| — | | Arauco
Industria de
Paineis S.A. | | Brazilian
Real | | IT
equipment | | | 14 | | | | 42 | | | | 38 | | | | 1 | | | | — | | | | — | | | | — | | | | 56 | | | | 39 | |
| — | | Arauco
Industria de
Paineis S.A. | | Brazilian
Real | | Motor
vehicles | | | 118 | | | | 355 | | | | 177 | | | | — | | | | — | | | | — | | | | — | | | | 473 | | | | 177 | |
| — | | Arauco Forest
Brasil S.A. | | Brazilian
Real | | IT
equipment | | | 7 | | | | 17 | | | | 16 | | | | 2 | | | | — | | | | — | | | | — | | | | 24 | | | | 18 | |
| — | | Arauco Forest
Brasil S.A. | | Brazilian
Real | | Lands | | | 676 | | | | 2,027 | | | | 2,476 | | | | 2,702 | | | | 2,702 | | | | 2,702 | | | | 4,728 | | | | 2,703 | | | | 15,310 | |
| — | | Arauco
Florestal
Arapoti S.A. | | Brazilian
Real | | IT
equipment | | | 5 | | | | 8 | | | | 5 | | | | — | | | | — | | | | — | | | | — | | | | 13 | | | | 5 | |
| — | | Arauco do
Brasil S.A. | | Brazilian
Real | | Buildings
and
constructions | | | 75 | | | | 226 | | | | 301 | | | | 301 | | | | 75 | | | | — | | | | — | | | | 301 | | | | 677 | |
| — | | Arauco do
Brasil S.A. | | U.S. Dollars | | IT
equipment | | | — | | | | — | | | | — | | | | — | | | | — | | | | — | | | | — | | | | — | | | | — | |
| — | | Arauco do
Brasil S.A. | | Brazilian
Real | | IT
equipment | | | 34 | | | | 64 | | | | 49 | | | | 3 | | | | — | | | | — | | | | — | | | | 98 | | | | 52 | |
| — | | Arauco do
Brasil S.A. | | Brazilian
Real | | Motor
vehicles | | | 84 | | | | 252 | | | | 408 | | | | — | | | | — | | | | — | | | | — | | | | 336 | | | | 408 | |
| 93.458.000-1 | | Celulosa
Arauco y
Constitucion
S.A. | | U.F. | | Buildings
and
constructions | | | 428 | | | | 1,283 | | | | 1,597 | | | | 1,170 | | | | — | | | | — | | | | — | | | | 1,711 | | | | 2,767 | |
| 93.458.000-1 | | Celulosa
Arauco y
Constitucion
S.A. | | U.F. | | Motor
vehicles | | | 197 | | | | 527 | | | | 603 | | | | 312 | | | | 141 | | | | 88 | | | | 27 | | | | 724 | | | | 1,171 | |
| 93.458.000-1 | | Celulosa
Arauco y
Constitucion
S.A. | | Chilean
pesos | | Buildings
and
constructions | | | 18 | | | | 55 | | | | 74 | | | | 18 | | | | — | | | | — | | | | — | | | | 73 | | | | 92 | |
| 93.458.000-1 | | Celulosa
Arauco y
Constitucion
S.A. | | U.S. Dollars | | Plants and
equipments | | | 1,612 | | | | — | | | | — | | | | — | | | | — | | | | — | | | | — | | | | 1,612 | | | | — | |
| 93.458.000-1 | | Celulosa
Arauco y
Constitucion
S.A. | | Chilean
pesos | | Motor
vehicles | | | 5,055 | | | | 15,165 | | | | 20,220 | | | | 7,005 | | | | — | | | | — | | | | — | | | | 20,220 | | | | 27,225 | |
| 93.458.000-1 | | Celulosa
Arauco y
Constitucion
S.A. | | U.S. Dollars | | Motor
vehicles | | | 45 | | | | 136 | | | | 30 | | | | — | | | | — | | | | — | | | | — | | | | 181 | | | | 30 | |
| — | | Arauco North
America, Inc. | | U.S. Dollars | | Lands | | | — | | | | — | | | | — | | | | — | | | | — | | | | — | | | | — | | | | — | | | | — | |
| — | | Arauco North
America, Inc. | | U.S. Dollars | | Buildings
and
constructions | | | 267 | | | | 822 | | | | 1,156 | | | | 1,285 | | | | 1,426 | | | | 1,581 | | | | 3,275 | | | | 1,089 | | | | 8,723 | |
| — | | Arauco North
America, Inc. | | U.S. Dollars | | Motor
vehicles | | | 38 | | | | 118 | | | | 247 | | | | 138 | | | | 123 | | | | — | | | | — | | | | 156 | | | | 508 | |
| — | | Arauco North
America, Inc. | | U.S. Dollars | | Other
properties,
plant and
equipment | | | — | | | | — | | | | — | | | | — | | | | — | | | | — | | | | — | | | | — | | | | — | |
| — | | Arauco Canada
Limited | | Canadian
dollars | | Other
properties,
plant and
equipment | | | — | | | | — | | | | — | | | | — | | | | — | | | | — | | | | — | | | | — | | | | — | |
| — | | Arauco Canada
Limited | | Canadian
dollars | | Buildings
and
constructions | | | 25 | | | | 78 | | | | 9 | | | | — | | | | — | | | | — | | | | — | | | | 103 | | | | 9 | |
| — | | Arauco Canada
Limited | | Canadian
dollars | | Motor
vehicles | | | 13 | | | | 41 | | | | 57 | | | | 91 | | | | 34 | | | | — | | | | — | | | | 54 | | | | 182 | |
| — | | Celulosa y
Energía Punta
Pereira S.A. | | U.S. Dollars | | Plants and
equipments | | | 139 | | | | 418 | | | | 383 | | | | 384 | | | | 384 | | | | 384 | | | | 7,094 | | | | 557 | | | | 8,629 | |
| — | | Celulosa y
Energía Punta
Pereira S.A. | | U.S. Dollars | | Buildings
and
constructions | | | — | | | | — | | | | — | | | | — | | | | — | | | | — | | | | — | | | | — | | | | — | |
| — | | Eufores S.A. | | U.S. Dollars | | Lands | | | 975 | | | | 2,980 | | | | 5,744 | | | | 5,549 | | | | 5,245 | | | | 4,819 | | | | 32,721 | | | | 3,955 | | | | 54,078 | |
| — | | Eufores S.A. | | U.S. Dollars | | Other
properties,
plant and
equipment | | | — | | | | — | | | | — | | | | — | | | | — | | | | — | | | | — | | | | — | | | | — | |
| — | | Eufores S.A. | | U.S. Dollars | | Plants and
equipments | | | 306 | | | | 917 | | | | 1,222 | | | | 1,222 | | | | 1,222 | | | | 1,222 | | | | 2,445 | | | | 1,223 | | | | 7,333 | |
| — | | Eufores S.A. | | U.S. Dollars | | Buildings
and
constructions | | | 70 | | | | 210 | | | | 117 | | | | 117 | | | | 49 | | | | — | | | | — | | | | 280 | | | | 283 | |
| 96.510.970-6 | | Maderas
Arauco S.A. | | Chilean
pesos | | Motor
vehicles | | | 3,906 | | | | 10,298 | | | | 12,736 | | | | 5,840 | | | | — | | | | — | | | | — | | | | 14,204 | | | | 18,576 | |
| 96.510.970-6 | | Maderas
Arauco S.A. | | U.F. | | Motor
vehicles | | | 125 | | | | 322 | | | | 345 | | | | 105 | | | | 28 | | | | 6 | | | | 2 | | | | 447 | | | | 486 | |
| 96.510.970-6 | | Maderas
Arauco S.A. | | U.F. | | Lands | | | — | | | | — | | | | — | | | | — | | | | — | | | | — | | | | — | | | | — | | | | — | |
| — | | Arauco
Colombia S.A. | | U.S. Dollars | | Buildings
and
constructions | | | 10 | | | | — | | | | — | | | | — | | | | — | | | | — | | | | — | | | | 10 | | | | — | |
| — | | Arauco
Colombia S.A. | | U.S. Dollars | | Fixed
facilities and
accesories | | | 137 | | | | 411 | | | | — | | | | — | | | | — | | | | — | | | | — | | | | 548 | | | | — | |
| — | | Arauco Europe
Cooperatief
U.A. | | Euros | | Motor
vehicles | | | 8 | | | | 12 | | | | 11 | | | | 10 | | | | — | | | | — | | | | — | | | | 20 | | | | 21 | |
| — | | Arauco Europe
Cooperatief
U.A. | | Euros | | Buildings
and
constructions | | | 17 | | | | 52 | | | | 77 | | | | 79 | | | | 81 | | | | 7 | | | | — | | | | 69 | | | | 244 | |
| — | | Araucomex
S.A. de C.V. | | Mexican
pesos | | Buildings
and
constructions | | | 26 | | | | 80 | | | | 112 | | | | 98 | | | | — | | | | — | | | | — | | | | 106 | | | | 210 | |
| — | | Araucomex
S.A. de C.V. | | U.S. Dollars | | Buildings
and
constructions | | | 358 | | | | 970 | | | | 2,251 | | | | 1,859 | | | | 1,815 | | | | — | | | | — | | | | 1,328 | | | | 5,925 | |
| — | | Arauco
Industria de
México, S.A.
de C.V. | | Mexican
pesos | | Plants and
equipments | | | 261 | | | | — | | | | — | | | | — | | | | — | | | | — | | | | — | | | | 261 | | | | — | |
| — | | Arauco
Industria de
México, S.A.
de C.V. | | U.S. Dollars | | Plants and
equipments | | | 94 | | | | 288 | | | | 131 | | | | — | | | | — | | | | — | | | | — | | | | 382 | | | | 131 | |
| — | | Arauco
Industria de
México, S.A.
de C.V. | | Mexican
pesos | | Buildings
and
constructions | | | — | | | | — | | | | — | | | | — | | | | — | | | | — | | | | — | | | | — | | | | — | |
| — | | Arauco
Industria de
México, S.A.
de C.V. | | Mexican
pesos | | Lands | | | — | | | | — | | | | — | | | | — | | | | — | | | | — | | | | — | | | | — | | | | — | |
| — | | Arauco
Industria de
México, S.A.
de C.V. | | U.S. Dollars | | Lands | | | — | | | | — | | | | — | | | | — | | | | — | | | | — | | | | — | | | | — | | | | — | |
| — | | Araucomex
Servicios S.A.
de C.V. | | Mexican
pesos | | Motor
vehicles | | | 20 | | | | 59 | | | | 17 | | | | — | | | | — | | | | — | | | | — | | | | 79 | | | | 17 | |
| 96.637.330-K | | Servicios
Logisticos
Arauco S.A. | | U.F. | | Motor
vehicles | | | 24 | | | | 62 | | | | 70 | | | | 16 | | | | — | | | | — | | | | — | | | | 86 | | | | 86 | |
| 79.990.550-7 | | Investigaciones
Forestales
Bioforest S.A. | | U.F. | | Motor
vehicles | | | 21 | | | | 40 | | | | 38 | | | | 21 | | | | 5 | | | | — | | | | — | | | | 61 | | | | 64 | |
| | | | | | | | | | | | | | | | | | | | | | | | | | | | | | | | | | | | | | | | | | |
| | | | | | Total | | | 20,443 | | | | 49,930 | | | | 61,704 | | | | 32,139 | | | | 15,317 | | | | 11,240 | | | | 50,563 | | | | 70,373 | | | | 170,963 | |
| | | | | | | | | | | | | | | | | | | | | | | | | | | | | | | | | | | | | | | | | | |
As part of the policy of Arauco, it considers compliance with all Accounts Payable, whether with related (see Note 13) or third parties, within a period not exceeding 30 days.
108
CELULOSA ARAUCO Y CONSTITUCION S.A. AND SUBSIDIARIES
Unaudited Interim Consolidated Financial Statements
June 30, 2021
Amounts in thousands of U.S. dollars, except as indicated
Regarding the Libor rate and its discontinuity, at the end of June 2021 Arauco maintains 5.87% of its total debt at said rate and it is not estimated that the effect of its elimination will be material. Additionally, Arauco maintains interest rate derivatives for 89.8% of its Libor rate based debt.
Guarantees
As of the date of these interim consolidated financial statements, Arauco has financial assets of approximately MU.S.$ 61 that have been pledged to third parties (beneficiaries), as direct guarantee. If Arauco does not fulfill its obligations, the guarantors could execute the guarantees.
As of June 30, 2021, the total assets pledged as an indirect guarantee were MU.S.$ 421. In contrast to direct guarantees, indirect guarantees are given to secure obligations assumed by a third party.
On September 29, 2011, Arauco entered into a Security Agreement under which it granted a non-joint guarantee limited to 50% of the obligations of the Uruguayan companies (joint ventures) Celulosa y Energía Punta Pereira S.A. and Zona Franca Punta Pereira S.A., under the IDB Facility Agreement in the amount of up to MU.S.$ 454 and the Finnevera Guaranteed Facility Agreement in the amount of up to MU.S.$ 900. Both loan agreements were signed with the International Development Bank. Such guarantee is included in the table below, under indirect guarantees.
Direct and indirect guarantees granted by Arauco:
DIRECT
| | | | | | | | | | | | | | |
Subsidiary | | Guarantee | | | Assets
Pledged | | Currency | | ThU.S.$ | | | Guarantor |
Celulosa Arauco y Constitución S.A. | |
| Guarantee
letter |
| | — | | Chilean
Pesos | | | 488 | | | Directorate General of Maritime Territory and Merchant Marine |
Celulosa Arauco y Constitución S.A. | |
| Guarantee
letter |
| | — | | Chilean
Pesos | | | 209 | | | Directorate General of Maritime Territory and Merchant Marine |
Celulosa Arauco y Constitución S.A. | |
| Guarantee
letter |
| | — | | Chilean
Pesos | | | 384 | | | Railways |
Celulosa Arauco y Constitución S.A. | |
| Guarantee
letter |
| | — | | Chilean
Pesos | | | 2,574 | | | Regional Road Administration (Bío - Bío region) |
Celulosa Arauco y Constitución S.A. | |
| Guarantee
letter |
| | — | | Chilean
Pesos | | | 4,729 | | | Ministry of Public Works (MOP) |
Celulosa Arauco y Constitución S.A. | |
| Guarantee
letter |
| | — | | Chilean
Pesos | | | 15,683 | | | Sociedad Concesionaria Autopista Costa Arauco S.A. |
Forestal Arauco S.A. | |
| Guarantee
letter |
| | — | | Chilean
Pesos | | | 5,378 | | | Transelec S.A. |
Arauco Forest Brasil S.A. | |
| Mortgage
Industrial
Plant of
Jaguariaíva
of Arauco do
Brasil |
| | Property
plant and
equipment | | Brazilian
Real | | | 30,649 | | | BNDES |
Arauco Forest Brasil S.A. | |
| Endorsement
of Arauco do
Brasil |
| | — | | Brazilian
Real | | | 426 | | | Bank Votorantim S.A. |
Arauco Florestal Arapoti S.A. | |
| Endorsement
of Arauco do
Brasil |
| | — | | Brazilian
Real | | | 481 | | | Bank Votorantim S.A. |
| | | | | | Total | | | | | 61,001 | | | |
| | | | | | | | | | | | | | |
| | | | | |
INDIRECT | | | | | | | | | | | | | | |
Subsidiary | | Guarantee | | | Assets
Pledged | | Currency | | ThU.S.$ | | | Guarantor |
Celulosa Arauco y Constitución S.A. | |
| Suretyship
not
supportive
and
cumulative |
| | — | | U.S. Dollar | | | 121,053 | | | Joint Ventures (Uruguay) |
Celulosa Arauco y Constitución S.A. | |
| Full
Guarantee |
| | — | | U.S. Dollar | | | 300,000 | | | Arauco North America, Inc. |
Celulosa Arauco y Constitución S.A. | |
| Guarantee
letter |
| | — | | Brazilian
Real | | | 384 | | | Arauco Forest Brasil |
| | | | | | Total | | | | | 421,437 | | | |
| | | | | | | | | | | | | | |
109
CELULOSA ARAUCO Y CONSTITUCION S.A. AND SUBSIDIARIES
Unaudited Interim Consolidated Financial Statements
June 30, 2021
Amounts in thousands of U.S. dollars, except as indicated
23.10.3 Type of Risk: Market Risk – Exchange Rate
Description
Market risk arises from the probability of being affected by losses from fluctuations in currencies exchange rates in which assets and liabilities are denominated, in a functional currency other than the functional currency of Arauco.
Explanation of Currency Risk Exposure and How This Risk Arises
Arauco is exposed to the foreign currency risk from currency fluctuations arising from sales, purchases and obligations undertaken in foreign currencies, such as the Chilean Peso, Euro, Brazilian Real or other foreign currencies. In the case of significant exchange rate variations, the Chilean Peso is the currency that represents the main currency risk. See Note 11 for details assets and liabilities classified by currency.
Explanation of Risk Management Objectives, Policies and Processes, and Measurement Methods
Arauco performs sensitivity analyses to measure the effect of this variable on equity and net result.
Sensitivity analysis considers a variation of +/- 10% of the exchange rate over the Chilean Peso. This fluctuation range is considered possible given current market conditions as of the date of these financial statements. With all other variables at a constant rate, a U.S. Dollar exchange rate variation of +/- 10% in relation to the Chilean Peso would mean a change in the net income year after tax +/- 2.88% (equivalent to ThU.S.$ -/+ 8,742), and +/- 0.20% of equity (equivalent to ThU.S.$ -/+ 8,742).
Additionally, a sensitivity analysis is carried out assuming a variation of +/- 10% in the closing exchange rate on the Brazilian Real, which is considered a possible range of fluctuation given the market conditions as of the date of these financial statements. With all the other variables constant, a variation of +/- 10% in the exchange rate of the dollar on the Brazilian Real would mean a variation on the net income after tax +/- 1.01% (equivalent to ThU.S.$-/+$ 3,064) and a change on the equity of +/- 1.21% (equivalent to ThU.S. -/+$ 95,661).
110
CELULOSA ARAUCO Y CONSTITUCION S.A. AND SUBSIDIARIES
Unaudited Interim Consolidated Financial Statements
June 30, 2021
Amounts in thousands of U.S. dollars, except as indicated
23.10.4 Type of Risk: Market Risk – Interest rate risk
Description
Interest rate risk refers to the sensitivity of the value of financial assets and liabilities in terms of interest rate fluctuations.
Explanation of Interest Rate Risk Exposure and How This Risk Arises
Arauco is exposed to risks due to interest rate fluctuations for bonds issued, bank borrowings and financial instruments that bear interest at a variable rate.
Explanation of Risk Management Objectives, Policies and Processes, and Measurement Methods
Arauco completes its risk analysis by reviewing its exposure to changes in interest rates. As of June 30, 2021, 6% our financial debt accrues interest at variable rates. A change of +/- 10% in the interest rate is considered a possible range of fluctuation. Such market conditions would affect the income after tax at rate of +/- 0.01% (equivalent to ThU.S.$-/+ 40) and +/- 0.001% (equivalent to ThU.S.$-/+ 40) on equity.
| | | | | | | | |
| | | June 2021
ThU.S.$ | | | Total | |
Fixed rate | | | 5,552,363 | | | | 94.2 | % |
Bonds issued | | | 4,686,407 | | | | | |
Bank borrowings and others (*) | | | 670,694 | | | | | |
Lease liabilities | | | 195,262 | | | | | |
Variable rate | | | 341,681 | | | | 5.8 | % |
Bonds issued | | | — | | | | | |
Bank borrowings | | | 341,681 | | | | | |
Total | | | 5,894,044 | | | | 100.0 | % |
| | | | | | | | |
| | |
| | | December 2020
ThU.S.$ | | | Total | |
Fixed rate | | | 5,631,837 | | | | 90.9 | % |
Bonds issued | | | 4,707,944 | | | | | |
Bank borrowings and others (*) | | | 712,138 | | | | | |
Lease liabilities | | | 211,755 | | | | | |
Variable rate | | | 562,122 | | | | 9.1 | % |
Bonds issued | | | — | | | | | |
Bank borrowings | | | 562,122 | | | | | |
Total | | | 6,193,959 | | | | 100.0 | % |
| | | | | | | | |
| (*) | Includes variable rate bank borrowings changed by fixed rate swaps. |
111
CELULOSA ARAUCO Y CONSTITUCION S.A. AND SUBSIDIARIES
Unaudited Interim Consolidated Financial Statements
June 30, 2021
Amounts in thousands of U.S. dollars, except as indicated
23.10.5 Type of Risk: Market Risk – Price of Pulp Risks
Description
Pulp prices are determined by world and regional market conditions. Prices fluctuate based on demand, production capacity, commercial strategies adopted by large-scale forestry companies, pulp and paper producers and by the availability of substitutes.
Explanation of Price Risk Exposure and How This Risk Arises
Pulp prices are reflected in revenue from sales and directly affect the net income for the period.
As of June 30, 2021, revenue due to pulp sales accounted for 44.3% of total sales. Pulp prices are fixed on a monthly basis in accordance with the market. Forward contracts or other financial instruments are not used for pulp sales.
Explanation of Risk Management Objectives, Policies and Processes, and Measurement Methods
This risk is approached in different ways. Arauco has a team of specialists who perform periodic market and competition analyses, providing tools to analyze and evaluate trends and adjust forecasts. Similarly, Arauco performs price financial sensitivity analysis in order to take the necessary safeguards to confront different scenarios in the best possible manner.
Sensitivity analysis considers a variation of +/- 10% in the average pulp price, a possible fluctuation range given current market conditions at the date of the closing balance. With all other variables constant, a variation of +/- 10% in the average pulp price would mean a variation of +/- 28.5% (equivalent to ThU.S.$-/+ 86,636) on the income for the year after tax and +/- 1.10% (equivalent to ThU.S.$ -/+ 86,636) on equity.
112
CELULOSA ARAUCO Y CONSTITUCION S.A. AND SUBSIDIARIES
Unaudited Interim Consolidated Financial Statements
June 30, 2021
Amounts in thousands of U.S. dollars, except as indicated
NOTE 24. REPORTABLE SEGMENTS
The main products that generate revenue for each reportable segment are described as follows:
Pulp segment
The main products sold by this reportable segment are long fiber bleached pulp (BSKP), short fiber bleached pulp (BHKP), long fiber raw pulp (UKP), pulp fluff and dissolving pulp (DP). Additionally, it manages a forest plantations in order to supply its production plants and, at the same time, to sell to the wood products segment or to third parties what it does not use (pruning, sawing, poles and chips). Finally, depending on the needs, it buys logs and chips from third parties which are consumed or sold to the wood products segment.
The Pulp reportable segment uses wood exclusively from pine and eucalyptus plantations for the production of different classes of wood cellulose or pulp. Bleached pulp is mainly used as raw material for producing printing and writing paper, as well as toilet paper and high-quality wrapping paper. Unbleached pulp is used to produce packing paper, filters, fiber cement products, dielectric paper and others. Fluff pulp is mainly used in the production of diapers and female hygiene products. On the other hand, dissolving pulp is used as raw material for the manufacture of different fabrics.
Arauco has seven plants, five in Chile, one in Argentina and one in Uruguay (50% property of Arauco) and they have a total production capacity of approximately 4 million tons per year. Pulp is sold in more than 41 countries, mainly in Asia and Europe.
113
CELULOSA ARAUCO Y CONSTITUCION S.A. AND SUBSIDIARIES
Unaudited Interim Consolidated Financial Statements
June 30, 2021
Amounts in thousands of U.S. dollars, except as indicated
Wood products segment
The main products sold by this segment correspond to plywood, MDF (Medium Density Fiberboard), PB (chipboard), sawn wood of different dimensions and remanufactured products such as moldings, pre-cut pieces, finger joints, among others.
The Panels area produces a wide range of panel products and several kinds of moldings aimed at the furniture, decoration and construction industries. It consists of 20 industrial plants: 4 in Chile, 2 in Argentina, 4 in Brazil, 2 in Mexico, and 8 plants around USA and Canada. The Company has a total annual production capacity of 7.6 million cubic meters of PBO, MDF, plywood and moldings.
Through the joint venture Sonae Arauco (see note 16), Arauco produces and sells wood panels, of the type of MDF, PB and OSB, and sawn timber, through the operation of 2 panel plants and one sawmill in Spain; 2 panel plants and one resin plant in Portugal; 4 panel plants in Germany and 2 panel plants in South Africa. In total, Sonae Arauco’s production capacity is approximately 1.5 million m3 of MDF, 2.4 million m3 of PB, 460,000 m3 of OSB and 70,000 m3 of sawn timber.
Including Sonae Arauco at 50%, Arauco totalize a capacity of 4.3 million m3 of MDF, 4.5 million m3 of PB and 230,000 m3 of OSB in its plants.
The Sawn Timber area produces a wide range of wood and remanufactured products with different kinds of uses and appearances, which include a wide variety of uses in the furniture, packing, construction and refurbishing industries.
With 8 sawmills in operation (7 in Chile and 1 in Argentina), the Company has a production capacity of 3.0 million m3 of sawn wood.
Furthermore, the Company has 5 remanufacturing plants, 4 in Chile and 1 in Argentina. These plants reprocess sawn wood and produce high quality remanufactured products, such as finger joint and solid moldings as well as precut pieces.
Arauco has no customers representing 10% or more of its revenues.
According to Note 2 Accounting Policies, changes in Accounting Estimates, since January 1, 2021, the pulp and forestry segments were merged. Given this merger and complying with the requirements of IFRS 8, the information for the period to December 31, 2020 and the 6 months period to June 30, 2021 has been restated.
Below, please find summarized information concerning the assets, liabilities and profits and losses at the end of each period, by segments. The profit (loss) of each segment informed takes into consideration that taxes and income and financial costs have not been allocated to the various segments, and are shown as part of the Corporate’s segment:
114
CELULOSA ARAUCO Y CONSTITUCION S.A. AND SUBSIDIARIES
Unaudited Interim Consolidated Financial Statements
June 30, 2021
Amounts in thousands of U.S. dollars, except as indicated
| | | | | | | | | | | | | | | | | | | | | | | | | | | | |
Period ended June 30, 2021 | | Pulp
ThU.S.$ | | | Wood
products
ThU.S.$ | | | Others
ThU.S.$ | | | Corporate
ThU.S.$ | | | Subtotal
ThU.S.$ | | | Elimination
ThU.S.$ | | | Total
ThU.S.$ | |
Revenues from sales of goods | | | 1,240,933 | | | | 1,614,953 | | | | — | | | | — | | | | 2,855,886 | | | | | | | | 2,855,886 | |
Revenues from rendering of services | | | 46,195 | | | | 26 | | | | 174 | | | | — | | | | 46,395 | | | | | | | | 46,395 | |
| | | | | | | |
Revenues from external customers | | | 1,287,128 | | | | 1,614,979 | | | | 174 | | | | — | | | | 2,902,281 | | | | | | | | 2,902,281 | |
Revenues from transactions with other operating segments | | | 239,934 | | | | 14,429 | | | | 17,314 | | | | — | | | | 271,677 | | | | (271,677 | ) | | | — | |
| | | | | | | | | | | | | | | | | | | | | | | | | | | | |
Finance income | | | — | | | | — | | | | — | | | | 14,434 | | | | 14,434 | | | | | | | | 14,434 | |
Finance costs | | | — | | | | — | | | | — | | | | (118,180 | ) | | | (118,180 | ) | | | | | | | (118,180 | ) |
Net finance costs | | | — | | | | — | | | | — | | | | (103,746 | ) | | | (103,746 | ) | | | | | | | (103,746 | ) |
| | | | | | | | | | | | | | | | | | | | | | | | | | | | |
Depreciation and amortizations | | | 151,306 | | | | 91,449 | | | | 802 | | | | 5,545 | | | | 249,102 | | | | | | | | 249,102 | |
Other income | | | 91,476 | | | | 8,176 | | | | — | | | | 20,724 | | | | 120,376 | | | | | | | | 120,376 | |
Other expenses | | | 48,760 | | | | 12,535 | | | | 133 | | | | 9,028 | | | | 70,456 | | | | | | | | 70,456 | |
| | | | | | | | | | | | | | | | | | | | | | | | | | | | |
Share of profit (loss) of associates and joint ventures accounted for using equity method | | | | | | | | | | | | | | | | | | | | | | | | | | | | |
Associates | | | 848 | | | | — | | | | — | | | | (709 | ) | | | 139 | | | | | | | | 139 | |
Joint ventures | | | — | | | | 12,565 | | | | — | | | | (1,488 | ) | | | 11,077 | | | | | | | | 11,077 | |
| | | | | | | | | | | | | | | | | | | | | | | | | | | | |
Income tax expense | | | — | | | | — | | | | — | | | | (166,006 | ) | | | (166,006 | ) | | | | | | | (166,006 | ) |
| | | | | | | | | | | | | | | | | | | | | | | | | | | | |
| | | | | | | |
Profit (loss) of each reportable segment | | | 298,219 | | | | 347,418 | | | | (4,567 | ) | | | (337,283 | ) | | | 303,787 | | | | | | | | 303,787 | |
| | | | | | | | | | | | | | | | | | | | | | | | | | | | |
Geographical information on revenues | | | | | | | | | | | | | | | | | | | | | | | | | | | | |
Revenue – Chilean entities | | | 887,247 | | | | 423,157 | | | | 174 | | | | — | | | | 1,310,578 | | | | | | | | 1,310,578 | |
Revenue – Foreign entities | | | 399,881 | | | | 1,191,822 | | | | — | | | | — | | | | 1,591,703 | | | | | | | | 1,591,703 | |
Total Ordinary Income | | | 1,287,128 | | | | 1,614,979 | | | | 174 | | | | — | | | | 2,902,281 | | | | | | | | 2,902,281 | |
| | | | | | | | | | | | | | | | | | | | | | | | | | | | |
| | | | | | | |
Period ended June 30, 2021 | | Pulp
ThU.S.$ | | | Wood
products
ThU.S.$ | | | Others
ThU.S.$ | | | Corporate
ThU.S.$ | | | Subtotal
ThU.S.$ | | | Elimination
ThU.S.$ | | | Total
ThU.S.$ | |
Amounts of additions to non-current assets | | | | | | | | | | | | | | | | | | | | | | | | | | | | |
| | | | | | | |
Acquisition of property, plant and equipment and biological assets | | | 699,497 | | | | 34,983 | | | | 52 | | | | 2,401 | | | | 736,933 | | | | — | | | | 736,933 | |
Acquisition and contribution of investments in associates and joint venture | | | — | | | | — | | | | — | | | | 4,805 | | | | 4,805 | | | | — | | | | 4,805 | |
| | | | | | | | | | | | | | | | | | | | | | | | | | | | |
| | | | | | | | | | | | | | | | | | | | | | | | | | | | |
Period ended June 30, 2021 | | Pulp
ThU.S.$ | | | Wood
products
ThU.S.$ | | | Others
ThU.S.$ | | | Corporate
ThU.S.$ | | | Subtotal
ThU.S.$ | | | Elimination
ThU.S.$ | | | Total
ThU.S.$ | |
Segment assets | | | 12,043,096 | | | | 2,935,109 | | | | 25,668 | | | | 1,491,455 | | | | 16,495,328 | | | | (70,972 | ) | | | 16,424,356 | |
Segment assets (excluding deferred tax assets) | | | 12,043,096 | | | | 2,935,109 | | | | 25,668 | | | | 1,485,740 | | | | 16,489,613 | | | | (70,972 | ) | | | 16,418,641 | |
Deferred tax assets | | | | | | | | | | | | | | | 5,715 | | | | 5,715 | | | | | | | | 5,715 | |
Investments accounted through equity method | | | | | | | | | | | | | | | | | | | | | | | | | | | | |
Associates | | | 30,587 | | | | — | | | | — | | | | 55,804 | | | | 86,391 | | | | | | | | 86,391 | |
Joint Ventures | | | — | | | | 191,766 | | | | — | | | | 46,234 | | | | 238,000 | | | | | | | | 238,000 | |
Segment liabilities | | | 528,532 | | | | 507,832 | | | | 9,328 | | | | 7,474,822 | | | | 8,520,514 | | | | | | | | 8,520,514 | |
Segment liabilities (excluding deferred tax liabilities) | | | 528,532 | | | | 507,832 | | | | 9,328 | | | | 5,965,507 | | | | 7,011,199 | | | | | | | | 7,011,199 | |
Deferred tax liabilities | | | | | | | | | | | | | | | 1,509,315 | | | | 1,509,315 | | | | | | | | 1,509,315 | |
| | | | | | | | | | | | | | | | | | | | | | | | | | | | |
Geographical information on non-current assets | | | | | | | | | | | | | | | | | | | | | | | | | | | | |
Chile | | | 7,687,699 | | | | 556,850 | | | | 24,785 | | | | 311,534 | | | | 8,580,868 | | | | (6,397 | ) | | | 8,574,471 | |
Foreign countries | | | 2,729,758 | | | | 1,267,766 | | | | — | | | | 61,454 | | | | 4,058,978 | | | | | | | | 4,058,978 | |
Non-current assets, Total | | | 10,417,457 | | | | 1,824,616 | | | | 24,785 | | | | 372,988 | | | | 12,639,846 | | | | (6,397 | ) | | | 12,633,449 | |
| | | | | | | | | | | | | | | | | | | | | | | | | | | | |
115
CELULOSA ARAUCO Y CONSTITUCION S.A. AND SUBSIDIARIES
Unaudited Interim Consolidated Financial Statements
June 30, 2021
Amounts in thousands of U.S. dollars, except as indicated
| | | | | | | | | | | | | | | | | | | | | | | | | | | | |
Period ended June 30, 2020 | | Pulp
ThU.S.$ | | | Wood
products
ThU.S.$ | | | Others
ThU.S.$ | | | Corporate
ThU.S.$ | | | Subtotal
ThU.S.$ | | | Elimination
ThU.S.$ | | | Total
ThU.S.$ | |
Revenues from goods sale | | | 971,829 | | | | 1,166,722 | | | | — | | | | — | | | | 2,138,551 | | | | | | | | 2,138,551 | |
Revenues from rendering of services | | | 38,406 | | | | 1 | | | | 82 | | | | — | | | | 38,489 | | | | | | | | 38,489 | |
| | | | | | | |
Revenues from external customers | | | 1,010,235 | | | | 1,166,723 | | | | 82 | | | | — | | | | 2,177,040 | | | | | | | | 2,177,040 | |
Revenues from transactions with other operating segments | | | 542,091 | | | | 11,643 | | | | 15,401 | | | | — | | | | 569,135 | | | | (569,135 | ) | | | — | |
| | | | | | | | | | | | | | | | | | | | | | | | | | | | |
Finance income | | | — | | | | — | | | | — | | | | 19,519 | | | | 19,519 | | | | | | | | 19,519 | |
Finance costs | | | — | | | | — | | | | — | | | | (137,704 | ) | | | (137,704 | ) | | | | | | | (137,704 | ) |
Net finance costs | | | — | | | | — | | | | — | | | | (118,185 | ) | | | (118,185 | ) | | | | | | | (118,185 | ) |
| | | | | | | | | | | | | | | | | | | | | | | | | | | | |
Depreciation and amortizations | | | 151,119 | | | | 95,843 | | | | 774 | | | | 4,338 | | | | 252,074 | | | | | | | | 252,074 | |
Other income | | | 96,216 | | | | 26,273 | | | | — | | | | 355 | | | | 122,844 | | | | | | | | 122,844 | |
Other expenses | | | 58,792 | | | | 42,128 | | | | 2 | | | | 7,372 | | | | 108,294 | | | | | | | | 108,294 | |
| | | | | | | | | | | | | | | | | | | | | | | | | | | | |
Share of profit (loss) of associates and joint ventures accounted for using equity method | | | | | | | | | | | | | | | | | | | | | | | | | | | | |
Associates | | | 597 | | | | — | | | | — | | | | 3,033 | | | | 3,630 | | | | | | | | 3,630 | |
Joint ventures | | | — | | | | (4,575 | ) | | | — | | | | 457 | | | | (4,118 | ) | | | | | | | (4,118 | ) |
| | | | | | | | | | | | | | | | | | | | | | | | | | | | |
Income tax expense | | | — | | | | — | | | | — | | | | 29,111 | | | | 29,111 | | | | | | | | 29,111 | |
| | | | | | | | | | | | | | | | | | | | | | | | | | | | |
| | | | | | | |
Profit (loss) of each reportable segment | | | 74,006 | | | | 16,480 | | | | (464 | ) | | | (175,665 | ) | | | (85,643 | ) | | | | | | | (85,643 | ) |
| | | | | | | | | | | | | | | | | | | | | | | | | | | | |
Geographical information on revenues | | | | | | | | | | | | | | | | | | | | | | | | | | | | |
Revenue – Chilean entities | | | 701,272 | | | | 478,640 | | | | 82 | | | | — | | | | 1,179,994 | | | | | | | | 1,179,994 | |
Revenue – Foreign entities | | | 308,963 | | | | 688,083 | | | | — | | | | — | | | | 997,046 | | | | | | | | 997,046 | |
Total Ordinary Income | | | 1,010,235 | | | | 1,166,723 | | | | 82 | | | | — | | | | 2,177,040 | | | | | | | | 2,177,040 | |
| | | | | | | | | | | | | | | | | | | | | | | | | | | | |
| | | | | | | |
Period ended June 30, 2020 | | Pulp
ThU.S.$ | | | Wood
products
ThU.S.$ | | | Others
ThU.S.$ | | | Corporate
ThU.S.$ | | | Subtotal
ThU.S.$ | | | Elimination
ThU.S.$ | | | Total
ThU.S.$ | |
Amounts of additions to non-current assets | | | | | | | | | | | | | | | | | | | | | | | | | | | | |
| | | | | | | |
Acquisition of property, plant and equipment and biological assets | | | 748,668 | | | | 61,984 | | | | 325 | | | | 3,489 | | | | 814,466 | | | | — | | | | 814,466 | |
Acquisition and contribution of investments in associates and joint venture | | | — | | | | — | | | | — | | | | 15,212 | | | | 15,212 | | | | — | | | | 15,212 | |
| | | | | | | | | | | | | | | | | | | | | | | | | | | | |
Period ended December 31, 2020 | | Pulp
ThU.S.$ | | | Wood
products
ThU.S.$ | | | Others
ThU.S.$ | | | Corporate
ThU.S.$ | | | Subtotal
ThU.S.$ | | | Elimination
ThU.S.$ | | | Total
ThU.S.$ | |
Segment assets | | | 11,543,571 | | | | 2,886,177 | | | | 24,941 | | | | 1,623,700 | | | | 16,078,389 | | | | (50,070 | ) | | | 16,028,319 | |
Segment assets (excluding deferred tax assets) | | | 11,543,571 | | | | 2,886,177 | | | | 24,941 | | | | 1,617,659 | | | | 16,072,348 | | | | (50,070 | ) | | | 16,022,278 | |
Deferred tax assets | | | — | | | | — | | | | — | | | | 6,041 | | | | 6,041 | | | | | | | | 6,041 | |
Investments accounted through equity method | | | | | | | | | | | | | | | | | | | | | | | | | | | | |
Associates | | | 29,205 | | | | — | | | | — | | | | 56,509 | | | | 85,714 | | | | | | | | 85,714 | |
Joint Ventures | | | — | | | | 187,388 | | | | — | | | | 43,837 | | | | 231,225 | | | | | | | | 231,225 | |
Segment liabilities | | | 494,065 | | | | 471,024 | | | | 8,574 | | | | 7,639,021 | | | | 8,612,684 | | | | | | | | 8,612,684 | |
Segment liabilities (excluding deferred tax liabilities) | | | 494,065 | | | | 471,024 | | | | 8,574 | | | | 6,175,135 | | | | 7,148,798 | | | | | | | | 7,148,798 | |
Deferred tax liabilities | | | — | | | | — | | | | — | | | | 1,463,886 | | | | 1,463,886 | | | | | | | | 1,463,886 | |
| | | | | | | | | | | | | | | | | | | | | | | | | | | | |
Geographical information on non-current assets | | | | | | | | | | | | | | | | | | | | | | | | | | | | |
Chile | | | 7,487,475 | | | | 588,973 | | | | 24,305 | | | | 314,330 | | | | 8,415,083 | | | | (6,380 | ) | | | 8,408,703 | |
Foreign countries | | | 2,731,405 | | | | 1,277,666 | | | | — | | | | 66,220 | | | | 4,075,291 | | | | — | | | | 4,075,291 | |
Non-current assets, Total | | | 10,218,880 | | | | 1,866,639 | | | | 24,305 | | | | 380,550 | | | | 12,490,374 | | | | (6,380 | ) | | | 12,483,994 | |
| | | | | | | | | | | | | | | | | | | | | | | | | | | | |
116
CELULOSA ARAUCO Y CONSTITUCION S.A. AND SUBSIDIARIES
Unaudited Interim Consolidated Financial Statements
June 30, 2021
Amounts in thousands of U.S. dollars, except as indicated
The following table shows information related to cash flows by segments which is presented as a complementary information as required by our regulatory entities:
| | | | | | | | | | | | | | | | | | | | | | | | | | | | |
Period ended June 30, 2021 | | Pulp
ThU.S.$ | | | Wood
products
ThU.S.$ | | | Others
ThU.S.$ | | | Corporate
ThU.S.$ | | | Subtotal
ThU.S.$ | | | Elimination
ThU.S.$ | | | Total
ThU.S.$ | |
Segment Cash Flows | | | | | | | | | | | | | | | | | | | | | | | | | | | | |
Cash Flows from (used in) Operating Activities | | | 467,894 | | | | 382,363 | | | | (419 | ) | | | 5,072 | | | | 854,838 | | | | — | | | | 854,838 | |
Cash flows (used in) investing activities | | | (635,195 | ) | | | (44,141 | ) | | | (271 | ) | | | (1,983 | ) | | | (681,590 | ) | | | — | | | | (681,590 | ) |
Cash flows from (used in) Financing Activities | | | (76,493 | ) | | | (24,716 | ) | | | (885 | ) | | | (1,497 | ) | | | (103,591 | ) | | | — | | | | (103,591 | ) |
Net increase (decrease) in Cash and Cash Equivalents | | | (243,794 | ) | | | 313,506 | | | | (1,647 | ) | | | 1,592 | | | | 69,657 | | | | — | | | | 69,657 | |
| | | | | | | | | | | | | | | | | | | | | | | | | | | | |
| | | | | | | | | | | | | | | | | | | | | | | | | | | | |
Period ended June 30, 2020 | | Pulp
ThU.S.$ | | | Wood
products
ThU.S.$ | | | Others
ThU.S.$ | | | Corporate
ThU.S.$ | | | Subtotal
ThU.S.$ | | | Elimination
ThU.S.$ | | | Total
ThU.S.$ | |
Segment Cash Flows | | | | | | | | | | | | | | | | | | | | | | | | | | | | |
Cash Flows from (used in) Operating Activities | | | 258,772 | | | | 96,832 | | | | (17 | ) | | | (106,349 | ) | | | 249,238 | | | | — | | | | 249,238 | |
Cash flows (used in) investing activities | | | (742,243 | ) | | | (71,291 | ) | | | (325 | ) | | | (2,876 | ) | | | (816,735 | ) | | | — | | | | (816,735 | ) |
Cash flows from (used in) Financing Activities | | | 260,391 | | | | (1,790 | ) | | | (37 | ) | | | 8,144 | | | | 266,708 | | | | — | | | | 266,708 | |
Net increase (decrease) in Cash and Cash Equivalents | | | (223,080 | ) | | | 23,751 | | | | (379 | ) | | | (101,081 | ) | | | (300,789 | ) | | | — | | | | (300,789 | ) |
| | | | | | | | | | | | | | | | | | | | | | | | | | | | |
Information required by geographic area:
| | | | | | | | | | | | | | | | | | | | | | | | | | | | |
| | | Geographical area | |
| 2021 | | Local country | | | Foreign country | |
| | | Chile | | | Argentina | | | Brazil | | | USA/
Canada | | | Uruguay | | | Mexico | | | Total | |
Disclosure of geographical areas | | ThU.S.$ | | | ThU.S.$ | | | ThU.S.$ | | | ThU.S.$ | | | ThU.S.$ | | | ThU.S.$ | | | ThU.S.$ | |
Revenues from goods sale | | | 1,282,065 | | | | 226,713 | | | | 285,220 | | | | 749,323 | | | | 223,478 | | | | 89,087 | | | | 2,855,886 | |
Revenues from rendering of services | | | 28,513 | | | | — | | | | — | | | | — | | | | 17,857 | | | | 25 | | | | 46,395 | |
| | | | | | | | | | | | | | | | | | | | | | | | | | | | |
Revenues as of June 30, 2021 | | | 1,310,578 | | | | 226,713 | | | | 285,220 | | | | 749,323 | | | | 241,335 | | | | 89,112 | | | | 2,902,281 | |
| | | | | | | | | | | | | | | | | | | | | | | | | | | | |
Revenues from goods sale | | | 701,091 | | | | 115,440 | | | | 153,752 | | | | 387,741 | | | | 128,973 | | | | 44,923 | | | | 1,531,920 | |
Revenues from rendering of services | | | 14,759 | | | | — | | | | — | | | | — | | | | 8,886 | | | | 13 | | | | 23,658 | |
| | | | | | | | | | | | | | | | | | | | | | | | | | | | |
Revenues between April – June of 2021 | | | 715,850 | | | | 115,440 | | | | 153,752 | | | | 387,741 | | | | 137,859 | | | | 44,936 | | | | 1,555,578 | |
| | | | | | | | | | | | | | | | | | | | | | | | | | | | |
Non-current Assets at 06-30-2021 other than deferred tax | | | 8,569,880 | | | | 717,261 | | | | 737,861 | | | | 754,626 | | | | 1,714,878 | | | | 133,228 | | | | 12,627,734 | |
| | | | | | | | | | | | | | | | | | | | | | | | | | | | |
| | | | | | | | | | | | | | | | | | | | | | | | | | | | |
| | | Geographical area | |
| 2020 | | Local country | | | Foreign country | |
| | | Chile | | | Argentina | | | Brazil | | | USA/
Canada | | | Uruguay | | | Mexico | | | Total | |
Disclosure of geographical areas | | ThU.S.$ | | | ThU.S.$ | | | ThU.S.$ | | | ThU.S.$ | | | ThU.S.$ | | | ThU.S.$ | | | ThU.S.$ | |
Revenues from goods sale | | | 1,158,146 | | | | 176,172 | | | | 176,011 | | | | 419,400 | | | | 151,723 | | | | 57,099 | | | | 2,138,551 | |
Revenues from rendering of services | | | 21,848 | | | | — | | | | — | | | | — | | | | 16,640 | | | | 1 | | | | 38,489 | |
| | | | | | | | | | | | | | | | | | | | | | | | | | | | |
Revenues as of June 30, 2020 | | | 1,179,994 | | | | 176,172 | | | | 176,011 | | | | 419,400 | | | | 168,363 | | | | 57,100 | | | | 2,177,040 | |
| | | | | | | | | | | | | | | | | | | | | | | | | | | | |
Revenues from goods sale | | | 592,522 | | | | 90,076 | | | | 72,254 | | | | 179,231 | | | | 76,934 | | | | 20,499 | | | | 1,031,516 | |
| | | | | | | | | | | | | | | | | | | | | | | | | | | | |
Revenues from rendering of services | | | 9,644 | | | | — | | | | — | | | | — | | | | 8,713 | | | | 1 | | | | 18,358 | |
| | | | | | | | | | | | | | | | | | | | | | | | | | | | |
Revenues between April – June of 2020 | | | 602,166 | | | | 90,076 | | | | 72,254 | | | | 179,231 | | | | 85,647 | | | | 20,500 | | | | 1,049,874 | |
| | | | | | | | | | | | | | | | | | | | | | | | | | | | |
Non-current Assets at 12-31-2020 other than deferred tax | | | 8,404,695 | | | | 741,337 | | | | 694,079 | | | | 774,969 | | | | 1,725,736 | | | | 137,137 | | | | 12,477,953 | |
| | | | | | | | | | | | | | | | | | | | | | | | | | | | |
117
CELULOSA ARAUCO Y CONSTITUCION S.A. AND SUBSIDIARIES
Unaudited Interim Consolidated Financial Statements
June 30, 2021
Amounts in thousands of U.S. dollars, except as indicated
NOTE 25. OTHER NON-FINANCIAL ASSETS AND NON-FINANCIAL LIABILITIES
| | | | | | | | |
| | | 06-30-2021 | | | 12-31-2020 | |
Current non-financial assets | | ThU.S.$ | | | ThU.S.$ | |
Roads to amortize current | | | 55,805 | | | | 55,000 | |
Prepayment to amortize (insurance and others) | | | 52,505 | | | | 16,671 | |
Recoverable taxes (GST and others) | | | 91,705 | | | | 91,337 | |
Other current non-financial assets | | | 8,029 | | | | 5,589 | |
Total | | | 208,044 | | | | 168,597 | |
| | | | | | | | |
| | |
| | | 06-30-2021 | | | 12-31-2020 | |
Non-current non-financial assets | | ThU.S.$ | | | ThU.S.$ | |
Roads to amortize, non-current | | | 91,027 | | | | 91,441 | |
Guarantee values | | | 2,917 | | | | 3,605 | |
Recoverable taxes | | | 20,085 | | | | 14,437 | |
Other non-current non-financial assets | | | 3,882 | | | | 3,731 | |
Total | | | 117,911 | | | | 113,214 | |
| | | | | | | | |
| | |
| | | 06-30-2021 | | | 12-31-2020 | |
Current non-financial liabilities | | ThU.S.$ | | | ThU.S.$ | |
Provision of minimum dividend (1) | | | 594 | | | | 698 | |
ICMS, PIS-COFINS and other tax payables - Brazil | | | 26,302 | | | | 24,997 | |
Other tax payable | | | 18,912 | | | | 17,851 | |
Other Current non-financial liabilities | | | 4,150 | | | | 1,184 | |
Total | | | 49,958 | | | | 44,730 | |
| | | | | | | | |
| (1) | In late 2019, the Parent’s dividend policy was modified as disclosed in notes 1 and 26. Provision includes a minimum dividend of subsidiary minority. |
| | | | | | | | |
| | |
| | | 06-30-2021 | | | 12-31-2020 | |
Non-current non-financial liabilities | | ThU.S.$ | | | ThU.S.$ | |
ICMS tax payable—Brazil | | | 84,118 | | | | 82,033 | |
Other non-current non-financial liabilities | | | 1,890 | | | | 1,270 | |
Total | | | 86,008 | | | | 83,303 | |
| | | | | | | | |
118
CELULOSA ARAUCO Y CONSTITUCION S.A. AND SUBSIDIARIES
Unaudited Interim Consolidated Financial Statements
June 30, 2021
Amounts in thousands of U.S. dollars, except as indicated
NOTE 26. DISTRIBUTABLE NET PROFIT AND EARNINGS PER SHARE
Distributable net profit
As a general policy, the Board of Directors of Arauco agreed that the net profit to be distributed as dividend is determined based on realized net gains/(losses) of any relevant variations in the value of unrealized assets and liabilities, which are excluded from the calculation of net profit during the period such changes are made.
As a result of the foregoing, for purposes of determining the distributable net profit of the Company, which is the same considered for calculating the minimum dividend required and additional dividend, the following unrealized gains/losses are excluded from the net profit for the year:
| | 1) | Unrealized gains/losses relating to the fair value recorded for forestry assets under IAS 41, adding them back to distributable net profit when they are realized through sale or disposed of by other means. |
| | 2) | Those generated through the acquisition of entities. These results will be added back to net profit when they are realized through sale. |
The deferred taxes associated with the amounts described in 1) and 2) above are also excluded.
Considering the current dividend policy described in Note 1, it is not appropriate to record a minimum dividend provision.
The following table details the adjustments made for the determination of distributable net profit as of June 30, 2021 and 2020:
| | | | | | | | |
| | | Distributable Net Profit | |
| | | 06-30-2021
ThU.S.$ | | | 06-30-2020
ThU.S.$ | |
Net profit attributable to parent company | | | 302,912 | | | | (85,477 | ) |
Adjustments: | | | | | | | | |
Biological assets | | | | | | | | |
Unrealized gains/losses | | | (81,810 | ) | | | (88,638 | ) |
Realized gains/losses | | | 109,077 | | | | 88,700 | |
Deferred income taxes | | | (5,615 | ) | | | 1,636 | |
| | | | | | | | |
Total adjustments | | | 21,652 | | | | 1,698 | |
| | | | | | | | |
Distributable Net Profit | | | 324,564 | | | | (83,779 | ) |
| | | | | | | | |
119
CELULOSA ARAUCO Y CONSTITUCION S.A. AND SUBSIDIARIES
Unaudited Interim Consolidated Financial Statements
June 30, 2021
Amounts in thousands of U.S. dollars, except as indicated
Basic and diluted earnings per share
Basic and diluted earnings per share are calculated by dividing the profit or loss attributable to ordinary equity holders of parent by the weighted average number of ordinary shares outstanding. Arauco does not have any shares with potential dilutive effect.
| | | | | | | | | | | | | | | | |
| | | January - June | | | April - June | |
| | | 2021
ThU.S.$ | | | 2020
ThU.S.$ | | | 2021
ThU.S.$ | | | 2020
ThU.S.$ | |
Profit or loss attributable to ordinary equity holder of parent | | | 302,912 | | | | (85,477 | ) | | | 201,004 | | | | (56,017 | ) |
Weighted average of number of shares | | | 118,336,956 | | | | 113,159,655 | | | | 120,188,355 | | | | 113,159,655 | |
Basic and diluted earnings per share (in U.S.$ per share) | | | 2.5597414 | | | | (0.7553664 | ) | | | 1.6724083 | | | | (0.4950263 | ) |
| | | | | | | | | | | | | | | | |
120
CELULOSA ARAUCO Y CONSTITUCION S.A. AND SUBSIDIARIES
Unaudited Interim Consolidated Financial Statements
June 30, 2021
Amounts in thousands of U.S. dollars, except as indicated
NOTE 27. COVID-19
In late December 2019 a notice of pneumonia originating from Wuhan, Hubei province (COVID-19, caused by a novel coronavirus) was reported to the World Health Organization, with cases soon confirmed in multiple provinces in China, as well as in other countries. As of the date of this report, the virus has affected most nations, including Chile, Argentina, Brazil, Uruguay, Mexico, and the United States.
Several measures have been undertaken by governments around the globe, including the use of quarantine, screening at airports and other transport hubs, travel restrictions, suspension of visas, nation-wide lockdowns, closing of public and private institutions, suspension of sport events, restrictions to museums and tourist attractions and extension of holidays, among many others.
In this complex scenario, it is important to highlight that, in March 2020, our industrial activities were declared as essential business by the authorities in most of the countries where we have operations. This has allowed us, as of the date of this report, to maintain the operational continuity in most of our industrial operations, helping to mitigate negative effects on the demand of some of our clients and products. We have implemented health and safety protocols for our workers both in industrial operations and in commercial offices. The measures adopted -such as social distancing, sanitation of the facilities, preventive testing, personnel transportation, home office, among others- are being continuously monitored so that workers have all the necessary protection for the performance of their functions.
Arauco’s commitment is not only with its workers, but also with the communities where we operate. In this regard, we have developed programs aimed at strengthening the capacities of the health system, through massive sanitation and fumigation programs of common spaces in the suburbs where we are present in Chile and delivery of sanitary supplies and essential reagents for 8 thousand diagnostic tests in the Ñuble region. In addition, support has been provided in temperature taking points and sanitary barriers in coordination with authorities; contributuion of hospital equipment and mechanical fans in Curanilahue, Biobío region; support in the implementation of rest areas for hospital personnel and improvements in spaces within hospitals in Chile; and collaborated in research for the development of mechanical fans.
On the other hand, our employees have participated as volunteers to deliver food boxes, as part of the campaign promoted by the CPC to reach the most vulnerable families in the country. This initiative entailed deliverying 5,226 food boxes in 28 communes of Chile, and putting together a network of Arauco Chile seamstresses for the development of reusable masks. Support was also provided, through the Fundación AcercaRedes, to the economy of small producers in Chile and for thereopening of agricultura fairs, applying various sanitation actions and delivering health kits. A network of volunteers was also assembled to support families living in rural areas.
No significant economic impacts have been generated in the operations reflected in Arauco’s financial statements.
121
CELULOSA ARAUCO Y CONSTITUCION S.A. AND SUBSIDIARIES
Unaudited Interim Consolidated Financial Statements
June 30, 2021
Amounts in thousands of U.S. dollars, except as indicated
NOTE 28. SUBSEQUENT EVENTS
1) As informed to the Commission for the Financial Market through a material fact (hecho esencial) dated May 13, 2021, Forestal Arauco S.A., a subsidiary of the Company, executed, on May 12, 2021, a master agreement (the “Master Agreement”), by means of which it agreed to sell to Vista Hermosa Inversiones Forestales SpA, a company controlled by BTG Inversiones Forestales Fondo de Inversión, 461 forest properties for a total price of US$ 385,500,000 (three hundred and eighty-five million five hundred thousand United States dollars), plus the corresponding Value Added Tax (the “VAT”). As reported at that time, it is estimated that the transaction would generate a gain of approximately US$ 192,500,000 (one hundred ninety-two million five hundred thousand United States dollars) after taxes, as a result of the sale of all the forest properties.
The closing of the transaction was subject to the fulfillment of customary conditions precedent for this type of transactions, including the authorization by the antitrust authorities. We hereby inform the Commission for the Financial Market that the conditions precedent for the closing of the aforementioned transaction have been fulfilled and, as a result, on August 17, 2021, the parties therein have proceeded to execute the purchase and sale agreements of 430 properties as committed in the Master Agreement for a total price of US$ 343,668,296 (three hundred forty-three million six hundred sixty-eight thousand two hundred ninety-six United States dollars), plus the corresponding VAT.
Additionally, on August 17, 2021, the parties executed a timber supply and preferential right purchase agreement (contrato de suministro y opción preferente de compra de volumen pulpable de pino radiata), a firefighting services agreement (contrato de servicios de combate de incendios) and an agreement for transitional services for the management of operational tasks (contrato de servicios transitorios de administración de predios forestales y gestión de faenas operativas), among other documents. Finally, it shall be noted that the parties expect to execute the purchase and sale agreements of the remaining 31 properties provided that, for each of them, certain specific conditions precedent are met within the following months, in accordance with the Master Agreement.
2) The authorization for the issuance and publication of these consolidated financial statements for the period between January 01, 2021 and June 30, 2021 was approved by the Board of Directors of Arauco at the Extraordinary Meeting No. 654 held on August 16, 2021.
Subsequent to June 30, 2021 and as of the date of issuance of these interim consolidated financial statements, there have been no events, other than those discussed above, that could materially affect the presentation of these financial statements.
122
Press Release 2Q 2021
2Q 2021 RESULTS Highlights For more details on ARAUCO´s financial statements please visit www.cmfchile.cl or www.arauco.com Readers are referred to the documents filed by ARAUCO with the United States Securities and Exchange Commission, specifically the most recent filing on Form 20-F that identifies important risk factors that could cause actual results to differ from those contained in the forward-looking statements. All forward-looking statements are based on information available to ARAUCO on the date hereof and ARAUCO does not assume any obligation to update such statements. References herein to “U.S.$” are to United States dollars. Discrepancies in any table between totals and sums of the amounts listed are due to rounding. This report is unaudited. REVENUES US$1,555.6 million ARAUCO’s revenues reached US$1,555.6 million during the second quarter of 2021, a 15.5% increase compared to the US$1,346.7 million obtained during the first quarter of 2021 and a 48.2% increase compared to the second quarter of 2020. NET INCOME US$201.4 million ARAUCO’s net income was US$201.4 million, equivalent to a US$99.1 million increase when compared to the US$102.4 million obtained during the first quarter of 2021, and a US$257.4 million increase compared to the second quarter of 2020. ADJUSTED EBITDA US$545.4 million Adjusted EBITDA reached US$545.4 million, a 41.7% or US$160.6 million increase compared to the US$384.7 million obtained during the first quarter of 2021, and a 165.0% or US$339.6 million increase compared to the second quarter of 2020. NET DEBT TO EBITDA 2.97x Net Financial Debt decreased by US$265.1 million or 5.3% compared to the last quarter. Net Financial Debt / LTM Adjusted EBITDA ratio reached 2.97x in this quarter, a decrease compared to 3.98x in the first quarter of 2021 and the 5.94x reached during the second quarter of 2021. CAPEX US$401.8 million CAPEX reached US$401.8 million during this quarter, a US$109.9 increase when compared to the US$291.9 million from the first quarter of 2021.
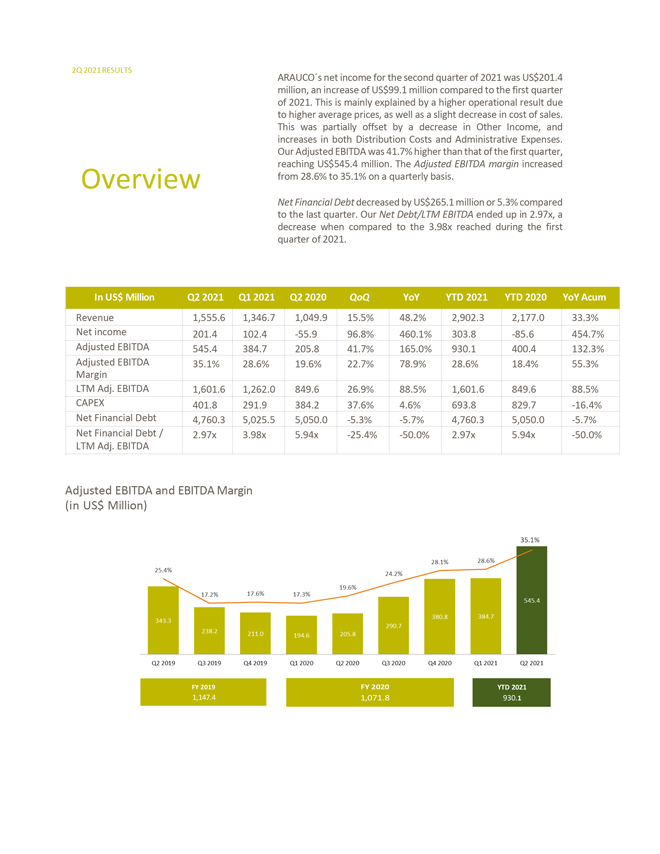
2Q 2021 RESULTS ARAUCO´s net income for the second quarter of 2021 was US$201.4 million, an increase of US$99.1 million compared to the first quarter of 2021. This is mainly explained by a higher operational result due to higher average prices, as well as a slight decrease in cost of sales. This was partially offset by a decrease in Other Income, and increases in both Distribution Costs and Administrative Expenses. Our Adjusted EBITDA was 41.7% higher than that of the first quarter, reaching US$545.4 million. The Adjusted EBITDA margin increased Overview from 28.6% to 35.1% on a quarterly basis. Net Financial Debt decreased by US$265.1 million or 5.3% compared to the last quarter. Our Net Debt/LTM EBITDA ended up in 2.97x, a decrease when compared to the 3.98x reached during the first quarter of 2021. In US$ Million Q2 2021 Q1 2021 Q2 2020 QoQ YoY YTD 2021 YTD 2020 YoY Acum Revenue 1,555.6 1,346.7 1,049.9 15.5% 48.2% 2,902.3 2,177.0 33.3% Net income 201.4 102.4 -55.9 96.8% 460.1% 303.8 -85.6 454.7% Adjusted EBITDA 545.4 384.7 205.8 41.7% 165.0% 930.1 400.4 132.3% Adjusted EBITDA 35.1% 28.6% 19.6% 22.7% 78.9% 28.6% 18.4% 55.3% Margin LTM Adj. EBITDA 1,601.6 1,262.0 849.6 26.9% 88.5% 1,601.6 849.6 88.5% CAPEX 401.8 291.9 384.2 37.6% 4.6% 693.8 829.7 -16.4% Net Financial Debt 4,760.3 5,025.5 5,050.0 -5.3% -5.7% 4,760.3 5,050.0 -5.7% Net Financial Debt / 2.97x 3.98x 5.94x -25.4% -50.0% 2.97x 5.94x -50.0% LTM Adj. EBITDA Adjusted EBITDA and EBITDA Margin (in US$ Million) FY 2019 FY 2020 YTD 2021 1,147.4 1,071.8 930.1
2Q 2021 RESULTS Income Statement In US$ Million Q2 2021 Q1 2021 QoQ Revenues 1,555.6 1,346.7 15.5% Cost of sales (887.2) (897.8) -1.2% Distribution costs (159.3) (144.8) 10.0% Administrative expenses (150.7) (136.5) 10.4% Other income 45.4 75.0 -39.5% Other expenses (33.0) (37.5) -12.0% Financial income 7.6 6.8 11.2% Financial costs (57.2) (61.0) -6.2% Share of profit (loss) of associates and joint 8.7 2.5 249.0% ventures accounted for using equity method Exchange rate differences (5.2) (8.5) -38.5% Income before income tax 324.8 145.0 124.0% Income tax (123.4) (42.6) 189.3% Net income 201.4 102.4 96.8%
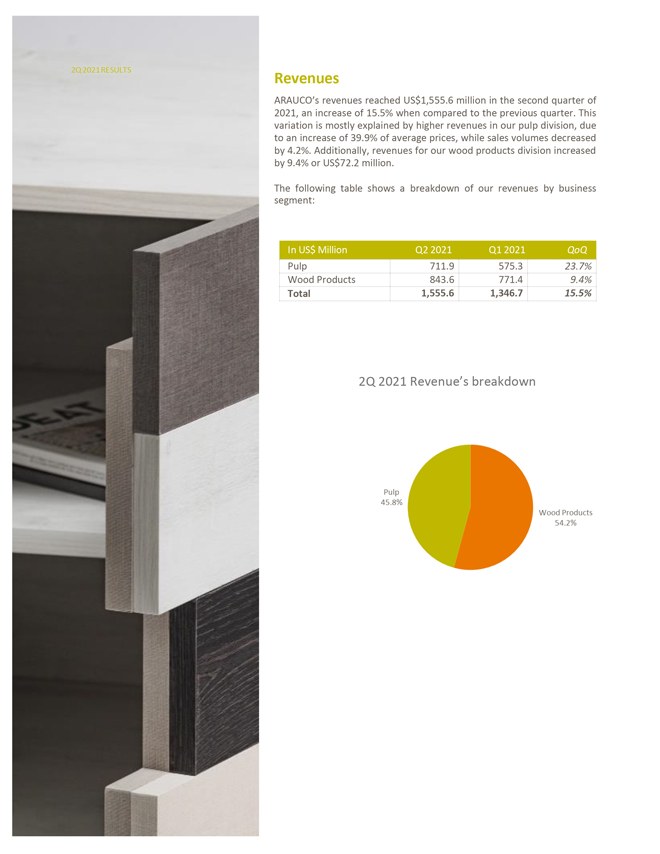
2Q 2021 RESULTS Revenues ARAUCO’s revenues reached US$1,555.6 million in the second quarter of 2021, an increase of 15.5% when compared to the previous quarter. This variation is mostly explained by higher revenues in our pulp division, due to an increase of 39.9% of average prices, while sales volumes decreased by 4.2%. Additionally, revenues for our wood products division increased by 9.4% or US$72.2 million. The following table shows a breakdown of our revenues by business segment: In US$ Million Q2 2021 Q1 2021 QoQ Pulp 711.9 575.3 23.7% Wood Products 843.6 771.4 9.4% Total 1,555.6 1,346.7 15.5% 2Q 2021 Revenue’s breakdown
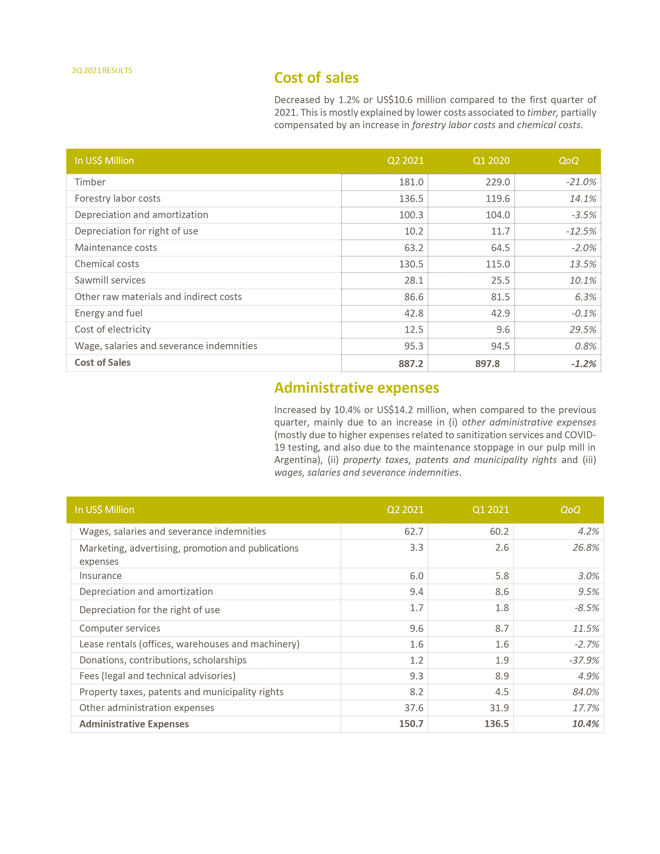
2Q 2021 RESULTS Cost of sales Decreased by 1.2% or US$10.6 million compared to the first quarter of 2021. This is mostly explained by lower costs associated to timber, partially compensated by an increase in forestry labor costs and chemical costs. In US$ Million Q2 2021 Q1 2020 QoQ Timber 181.0 229.0 -21.0% Forestry labor costs 136.5 119.6 14.1% Depreciation and amortization 100.3 104.0 -3.5% Depreciation for right of use 10.2 11.7 -12.5% Maintenance costs 63.2 64.5 -2.0% Chemical costs 130.5 115.0 13.5% Sawmill services 28.1 25.5 10.1% Other raw materials and indirect costs 86.6 81.5 6.3% Energy and fuel 42.8 42.9 -0.1% Cost of electricity 12.5 9.6 29.5% Wage, salaries and severance indemnities 95.3 94.5 0.8% Cost of Sales 887.2 897.8 -1.2% Administrative expenses Increased by 10.4% or US$14.2 million, when compared to the previous quarter, mainly due to an increase in (i) other administrative expenses (mostly due to higher expenses related to sanitization services and COVID-19 testing, and also due to the maintenance stoppage in our pulp mill in Argentina), (ii) property taxes, patents and municipality rights and (iii) wages, salaries and severance indemnities. In US$ Million Q2 2021 Q1 2021 QoQ Wages, salaries and severance indemnities 62.7 60.2 4.2% Marketing, advertising, promotion and publications 3.3 2.6 26.8% expenses Insurance 6.0 5.8 3.0% Depreciation and amortization 9.4 8.6 9.5% Depreciation for the right of use 1.7 1.8 -8.5% Computer services 9.6 8.7 11.5% Lease rentals (offices, warehouses and machinery) 1.6 1.6 -2.7% Donations, contributions, scholarships 1.2 1.9 -37.9% Fees (legal and technical advisories) 9.3 8.9 4.9% Property taxes, patents and municipality rights 8.2 4.5 84.0% Other administration expenses 37.6 31.9 17.7% Administrative Expenses 150.7 136.5 10.4%
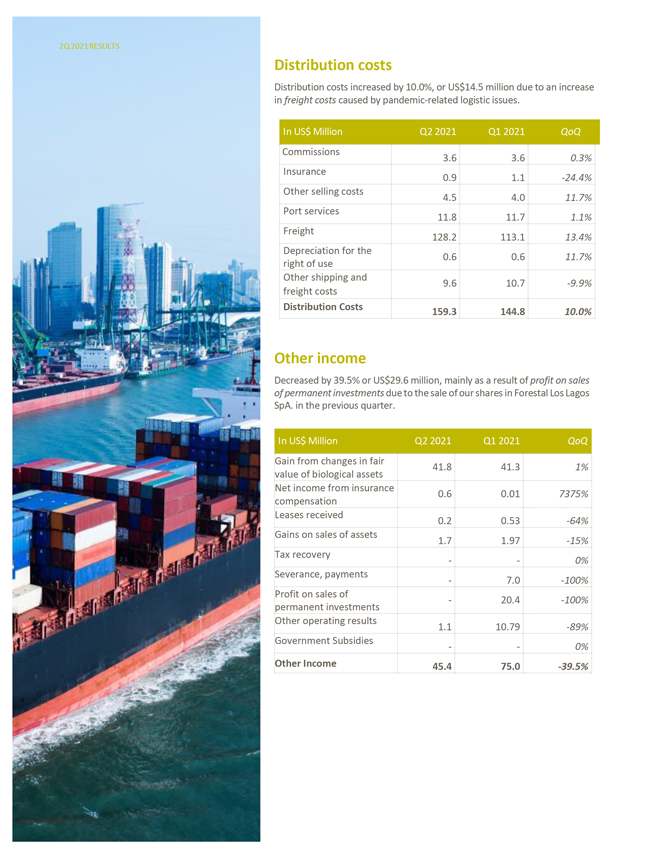
2Q 2021 RESULTS Distribution costs Distribution costs increased by 10.0%, or US$14.5 million due to an increase in freight costs caused by pandemic-related logistic issues. In US$ Million Q2 2021 Q1 2021 QoQ Commissions 3.6 3.6 0.3% Insurance 0.9 1.1 -24.4% Other selling costs 4.5 4.0 11.7% Port services 11.8 11.7 1.1% Freight 128.2 113.1 13.4% Depreciation for the 0.6 0.6 11.7% right of use Other shipping and freight costs 9.6 10.7 -9.9% Distribution Costs 159.3 144.8 10.0% Other income Decreased by 39.5% or US$29.6 million, mainly as a result of profit on sales of permanent investments due to the sale of our shares in Forestal Los Lagos SpA. in the previous quarter. In US$ Million Q2 2021 Q1 2021 QoQ Gain from changes in fair 41.8 41.3 1% value of biological assets Net income from insurance 0.6 0.01 7375% compensation Leases received 0.2 0.53 -64% Gains on sales of assets 1.7 1.97 -15% Tax recovery — 0% Severance, payments—7.0 -100% Profit on sales of—20.4 -100% permanent investments Other operating results 1.1 10.79 -89% Government Subsidies — 0% Other Income 45.4 75.0 -39.5%
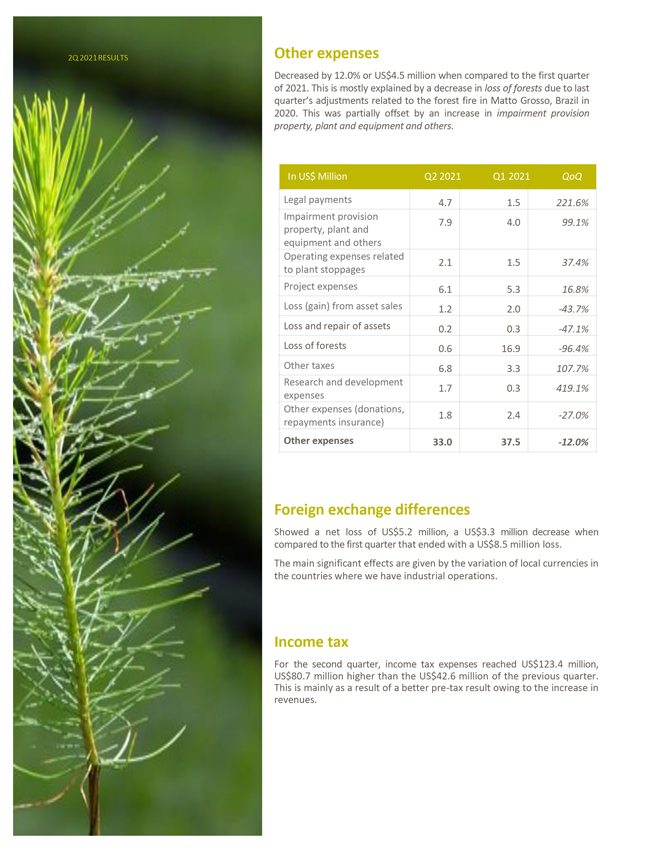
2Q 2021 RESULTS Other expenses Decreased by 12.0% or US$4.5 million when compared to the first quarter of 2021. This is mostly explained by a decrease in loss of forests due to last quarter’s adjustments related to the forest fire in Matto Grosso, Brazil in 2020. This was partially offset by an increase in impairment provision property, plant and equipment and others. In US$ Million Q2 2021 Q1 2021 QoQ Legal payments 4.7 1.5 221.6% Impairment provision 7.9 4.0 99.1% property, plant and equipment and others Operating expenses related 2.1 1.5 37.4% to plant stoppages Project expenses 6.1 5.3 16.8% Loss (gain) from asset sales 1.2 2.0 -43.7% Loss and repair of assets 0.2 0.3 -47.1% Loss of forests 0.6 16.9 -96.4% Other taxes 6.8 3.3 107.7% Research and development 1.7 0.3 419.1% expenses Other expenses (donations, 1.8 2.4 -27.0% repayments insurance) Other expenses 33.0 37.5 -12.0% Foreign exchange differences Showed a net loss of US$5.2 million, a US$3.3 million decrease when compared to the first quarter that ended with a US$8.5 million loss. The main significant effects are given by the variation of local currencies in the countries where we have industrial operations. Income tax For the second quarter, income tax expenses reached US$123.4 million, US$80.7 million higher than the US$42.6 million of the previous quarter. This is mainly as a result of a better pre-tax result owing to the increase in revenues.
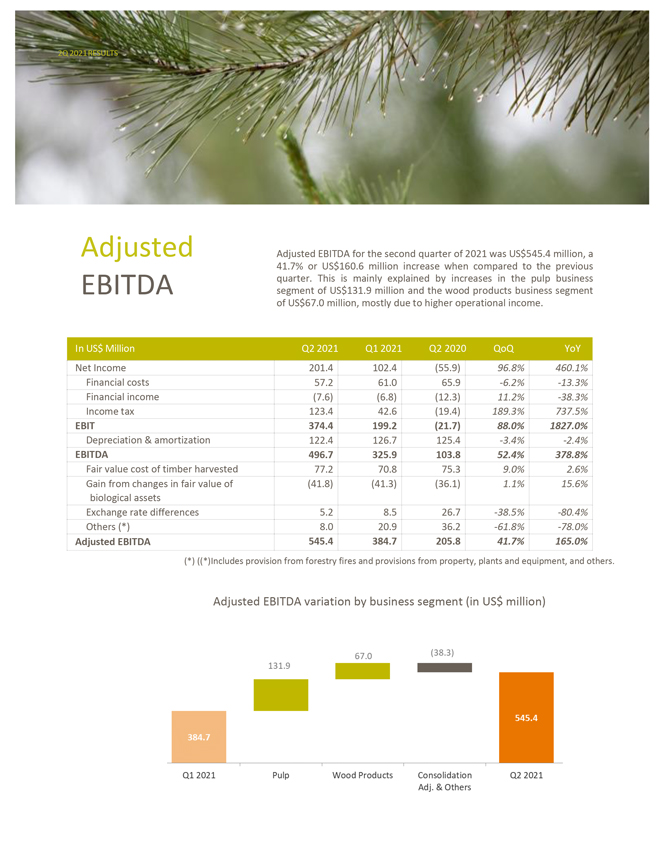
2Q 2021 RESULTS Adjusted Adjusted EBITDA for the second quarter of 2021 was US$545.4 million, a 41.7% or US$160.6 million increase when compared to the previous quarter. This is mainly explained by increases in the pulp business EBITDA segment of US$131.9 million and the wood products business segment of US$67.0 million, mostly due to higher operational income. In US$ Million Q2 2021 Q1 2021 Q2 2020 QoQ YoY Net Income 201.4 102.4 (55.9) 96.8% 460.1% Financial costs 57.2 61.0 65.9 -6.2% -13.3% Financial income (7.6) (6.8) (12.3) 11.2% -38.3% Income tax 123.4 42.6 (19.4) 189.3% 737.5% EBIT 374.4 199.2 (21.7) 88.0% 1827.0% Depreciation & amortization 122.4 126.7 125.4 -3.4% -2.4% EBITDA 496.7 325.9 103.8 52.4% 378.8% Fair value cost of timber harvested 77.2 70.8 75.3 9.0% 2.6% Gain from changes in fair value of (41.8) (41.3) (36.1) 1.1% 15.6% biological assets Exchange rate differences 5.2 8.5 26.7 -38.5% -80.4% Others (*) 8.0 20.9 36.2 -61.8% -78.0% Adjusted EBITDA 545.4 384.7 205.8 41.7% 165.0% (*) ((*)Includes provision from forestry fires and provisions from property, plants and equipment, and others. Adjusted EBITDA variation by business segment (in US$ million)
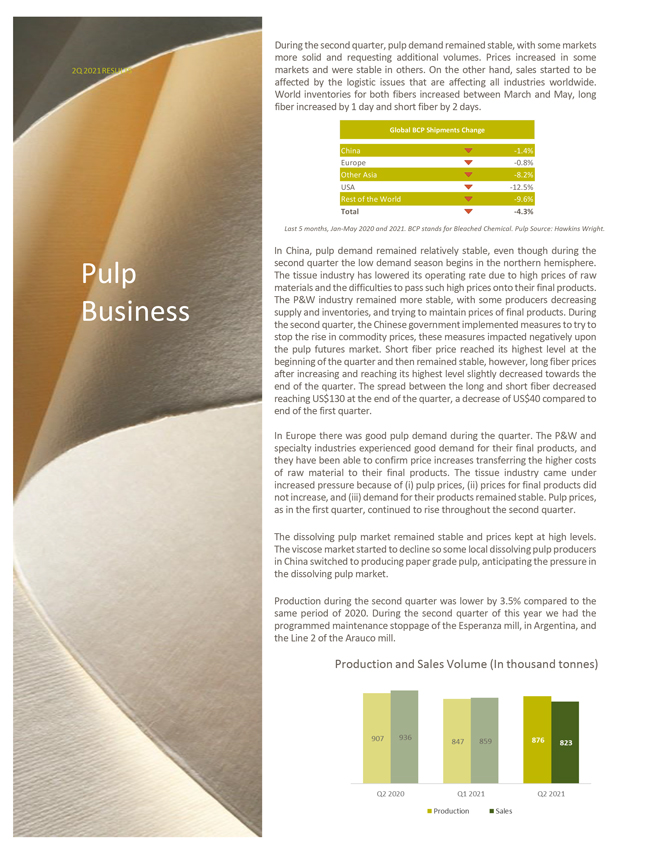
2Q 2021 RESULTS Pulp Business During the second quarter, pulp demand remained stable, with some markets more solid and requesting additional volumes. Prices increased in some markets and were stable in others. On the other hand, sales started to be affected by the logistic issues that are affecting all industries worldwide. World inventories for both fibers increased between March and May, long fiber increased by 1 day and short fiber by 2 days. Global BCP Shipments Change China -1.4% Europe -0.8% Other Asia -8.2% USA -12.5% Rest of the World -9.6% Total -4.3% Last 5 months, Jan-May 2020 and 2021. BCP stands for Bleached Chemical. Pulp Source: Hawkins Wright. In China, pulp demand remained relatively stable, even though during the second quarter the low demand season begins in the northern hemisphere. The tissue industry has lowered its operating rate due to high prices of raw materials and the difficulties to pass such high prices onto their final products. The P&W industry remained more stable, with some producers decreasing supply and inventories, and trying to maintain prices of final products. During the second quarter, the Chinese government implemented measures to try to stop the rise in commodity prices, these measures impacted negatively upon the pulp futures market. Short fiber price reached its highest level at the beginning of the quarter and then remained stable, however, long fiber prices after increasing and reaching its highest level slightly decreased towards the end of the quarter. The spread between the long and short fiber decreased reaching US$130 at the end of the quarter, a decrease of US$40 compared to end of the first quarter. In Europe there was good pulp demand during the quarter. The P&W and specialty industries experienced good demand for their final products, and they have been able to confirm price increases transferring the higher costs of raw material to their final products. The tissue industry came under increased pressure because of (i) pulp prices, (ii) prices for final products did not increase, and (iii) demand for their products remained stable. Pulp prices, as in the first quarter, continued to rise throughout the second quarter. The dissolving pulp market remained stable and prices kept at high levels. The viscose market started to decline so some local dissolving pulp producers in China switched to producing paper grade pulp, anticipating the pressure in the dissolving pulp market. Production during the second quarter was lower by 3.5% compared to the same period of 2020. During the second quarter of this year we had the programmed maintenance stoppage of the Esperanza mill, in Argentina, and the Line 2 of the Arauco mill. Production and Sales Volume (In thousand tonnes)
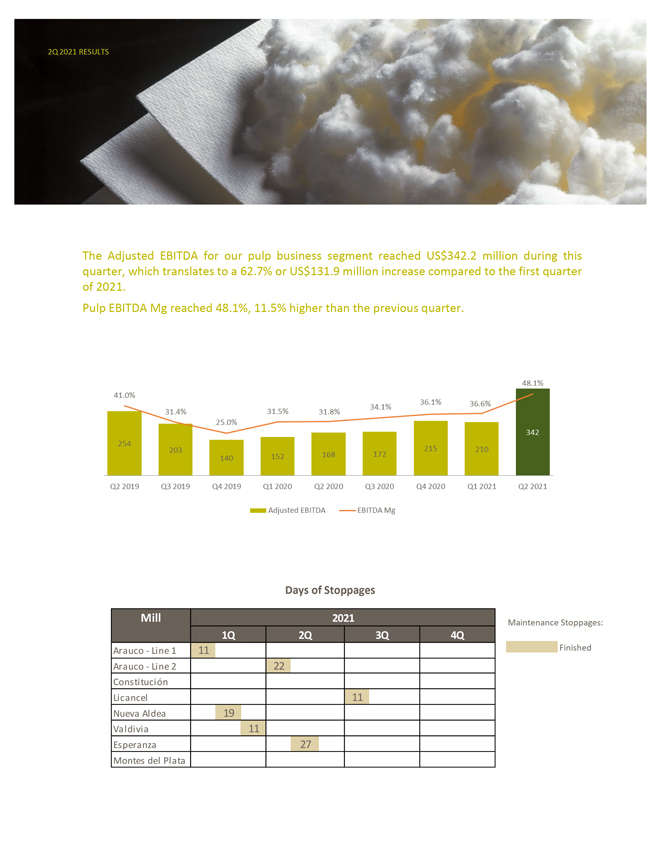
2Q 2021 RESULTS u The Adjusted EBITDA for our pulp business segment reached US$342.2 million during this quarter, which translates to a 62.7% or US$131.9 million increase compared to the first quarter of 2021. Pulp EBITDA Mg reached 48.1%, 11.5% higher than the previous quarter. Days of Stoppages Mill 2021 1Q 2Q 3Q 4Q Arauco—Line 1 11 Arauco—Line 2 22 Constitución Licancel 11 Nueva Aldea 19 11 Valdivia Esperanza 27 Montes del Plata
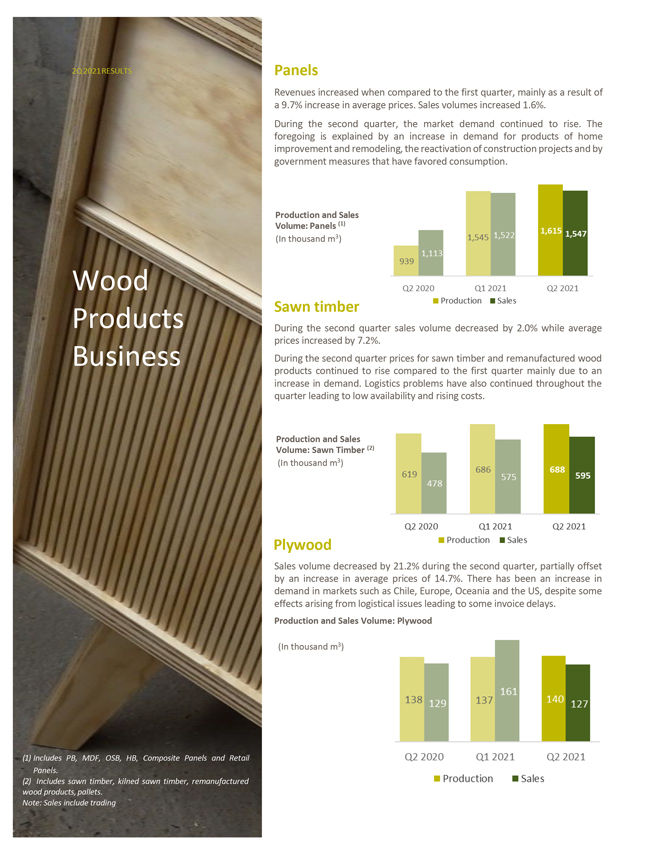
2Q 2021 RESULTS Wood Products Business Includes PB, MDF, OSB, HB, Composite Panels and Retail Panels. Includes sawn timber, kilned sawn timber, remanufactured wood products, pallets. Note: Sales include trading Panels Revenues increased when compared to the first quarter, mainly as a result of a 9.7% increase in average prices. Sales volumes increased 1.6%. During the second quarter, the market demand continued to rise. The foregoing is explained by an increase in demand for products of home improvement and remodeling, the reactivation of construction projects and by government measures that have favored consumption. Production and Sales Volume: Panels (1) (In thousand m3) Sawn timber During the second quarter sales volume decreased by 2.0% while average prices increased by 7.2%. During the second quarter prices for sawn timber and remanufactured wood products continued to rise compared to the first quarter mainly due to an increase in demand. Logistics problems have also continued throughout the quarter leading to low availability and rising costs. Production and Sales Volume: Sawn Timber (2) (In thousand m3) Plywood Sales volume decreased by 21.2% during the second quarter, partially offset by an increase in average prices of 14.7%. There has been an increase in demand in markets such as Chile, Europe, Oceania and the US, despite some effects arising from logistical issues leading to some invoice delays. Production and Sales Volume: Plywood (In thousand m3)
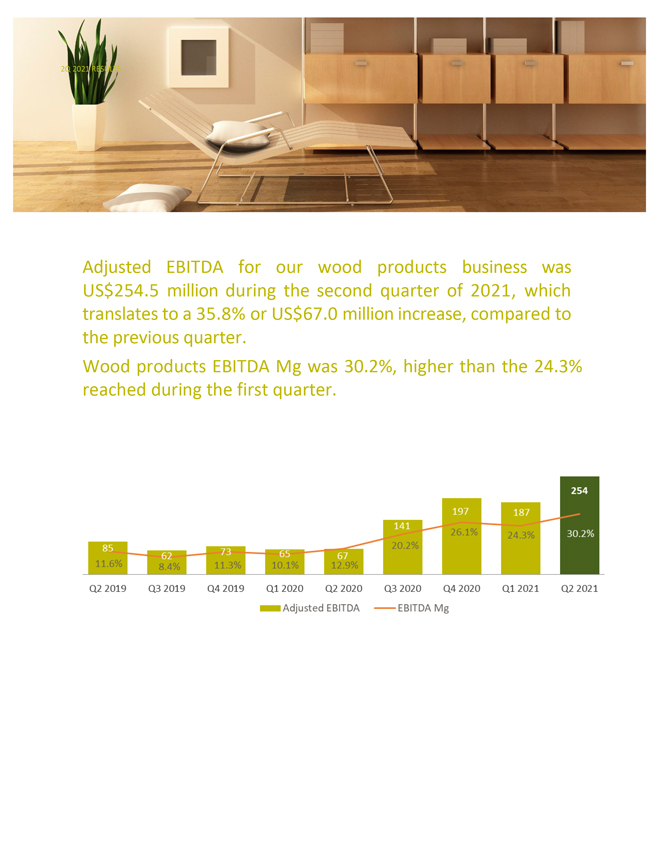
2Q 2021 RESULTS Adjusted EBITDA for our wood products business was US$254.5 million during the second quarter of 2021, which translates to a 35.8% or US$67.0 million increase, compared to the previous quarter. Wood products EBITDA Mg was 30.2%, higher than the 24.3% reached during the first quarter.
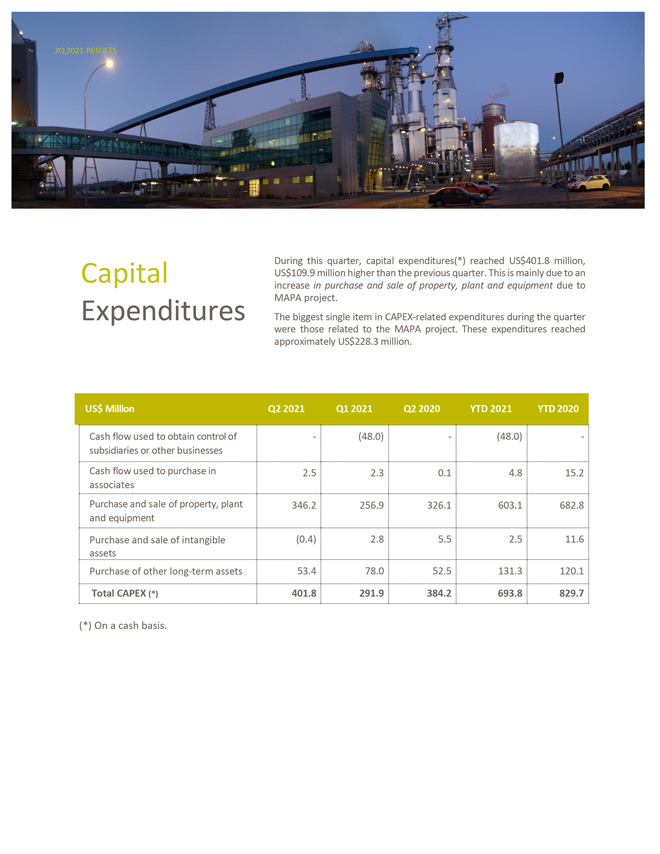
2Q 2021 RESULTS During this quarter, capital expenditures(*) reached US$401.8 million, Capital US$109.9 million higher than the previous quarter. This is mainly due to an increase in purchase and sale of property, plant and equipment due to MAPA project. Expenditures The biggest single item in CAPEX-related expenditures during the quarter were those related to the MAPA project. These expenditures reached approximately US$228.3 million. US$ Million Q2 2021 Q1 2021 Q2 2020 YTD 2021 YTD 2020 Cash flow used to obtain control of—(48.0)—(48.0)—subsidiaries or other businesses Cash flow used to purchase in 2.5 2.3 0.1 4.8 15.2 associates Purchase and sale of property, plant 346.2 256.9 326.1 603.1 682.8 and equipment Purchase and sale of intangible (0.4) 2.8 5.5 2.5 11.6 assets Purchase of other long-term assets 53.4 78.0 52.5 131.3 120.1 Total CAPEX (*) 401.8 291.9 384.2 693.8 829.7 (*) On a cash basis.
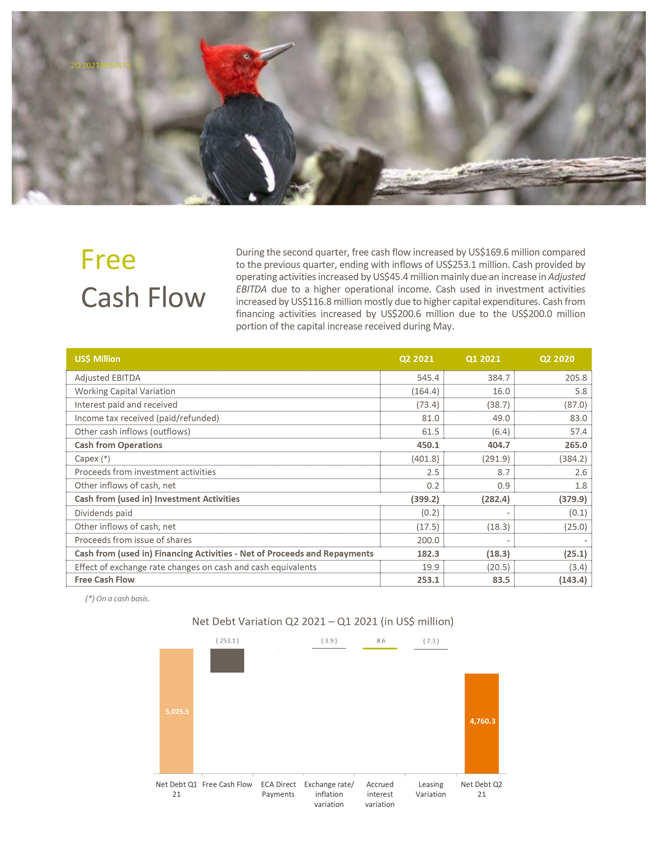
2Q 2021 RESULTS During the second quarter, free cash flow increased by US$169.6 million compared Free to the previous quarter, ending with inflows of US$253.1 million. Cash provided by operating activities increased by US$45.4 million mainly due an increase in Adjusted EBITDA due to a higher operational income. Cash used in investment activities Cash Flow increased by US$116.8 million mostly due to higher capital expenditures. Cash from financing activities increased by US$200.6 million due to the US$200.0 million portion of the capital increase received during May. US$ Million Q2 2021 Q1 2021 Q2 2020 Adjusted EBITDA 545.4 384.7 205.8 Working Capital Variation (164.4) 16.0 5.8 Interest paid and received (73.4) (38.7) (87.0) Income tax received (paid/refunded) 81.0 49.0 83.0 Other cash inflows (outflows) 61.5 (6.4) 57.4 Cash from Operations 450.1 404.7 265.0 Capex (*) (401.8) (291.9) (384.2) Proceeds from investment activities 2.5 8.7 2.6 Other inflows of cash, net 0.2 0.9 1.8 Cash from (used in) Investment Activities (399.2) (282.4) (379.9) Dividends paid (0.2)—(0.1) Other inflows of cash, net (17.5) (18.3) (25.0) Proceeds from issue of shares 200.0 — Cash from (used in) Financing Activities—Net of Proceeds and Repayments 182.3 (18.3) (25.1) Effect of exchange rate changes on cash and cash equivalents 19.9 (20.5) (3.4) Free Cash Flow 253.1 83.5 (143.4) (*) On a cash basis. Net Debt Variation Q2 2021 – Q1 2021 (in US$ million)
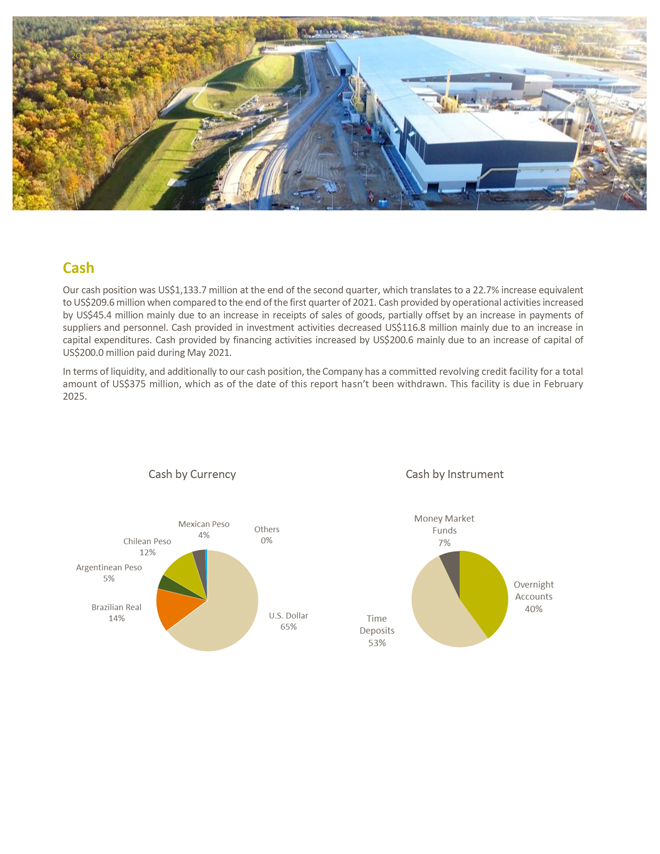
2Q 2021 RESULTS Cash Our cash position was US$1,133.7 million at the end of the second quarter, which translates to a 22.7% increase equivalent to US$209.6 million when compared to the end of the first quarter of 2021. Cash provided by operational activities increased by US$45.4 million mainly due to an increase in receipts of sales of goods, partially offset by an increase in payments of suppliers and personnel. Cash provided in investment activities decreased US$116.8 million mainly due to an increase in capital expenditures. Cash provided by financing activities increased by US$200.6 mainly due to an increase of capital of US$200.0 million paid during May 2021. In terms of liquidity, and additionally to our cash position, the Company has a committed revolving credit facility for a total amount of US$375 million, which as of the date of this report hasn’t been withdrawn. This facility is due in February 2025. Cash by Currency Cash by Instrument
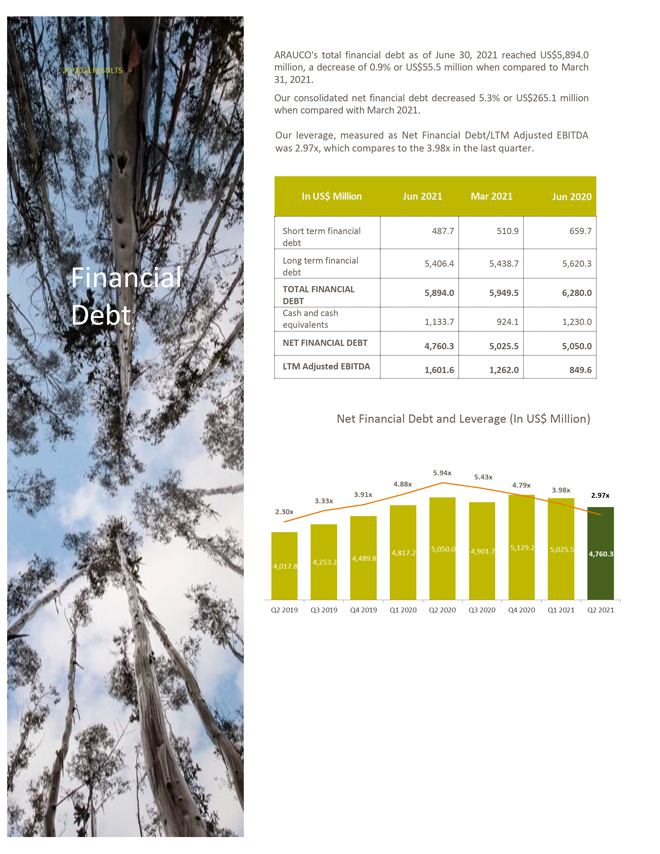
ARAUCO’s total financial debt as of June 30, 2021 reached US$5,894.0 2Q 2021 RESULTS million, a decrease of 0.9% or US$55.5 million when compared to March 31, 2021. Our consolidated net financial debt decreased 5.3% or US$265.1 million when compared with March 2021. Our leverage, measured as Net Financial Debt/LTM Adjusted EBITDA was 2.97x, which compares to the 3.98x in the last quarter. In US$ Million Jun 2021 Mar 2021 Jun 2020 Short term financial 487.7 510.9 659.7 debt Long term financial 5,406.4 5,438.7 5,620.3 Financial debt TOTAL FINANCIAL 5,894.0 5,949.5 6,280.0 DEBT Debt Cash and cash equivalents 1,133.7 924.1 1,230.0 NET FINANCIAL DEBT 4,760.3 5,025.5 5,050.0 LTM Adjusted EBITDA 1,601.6 1,262.0 849.6 Net Financial Debt and Leverage (In US$ Million)
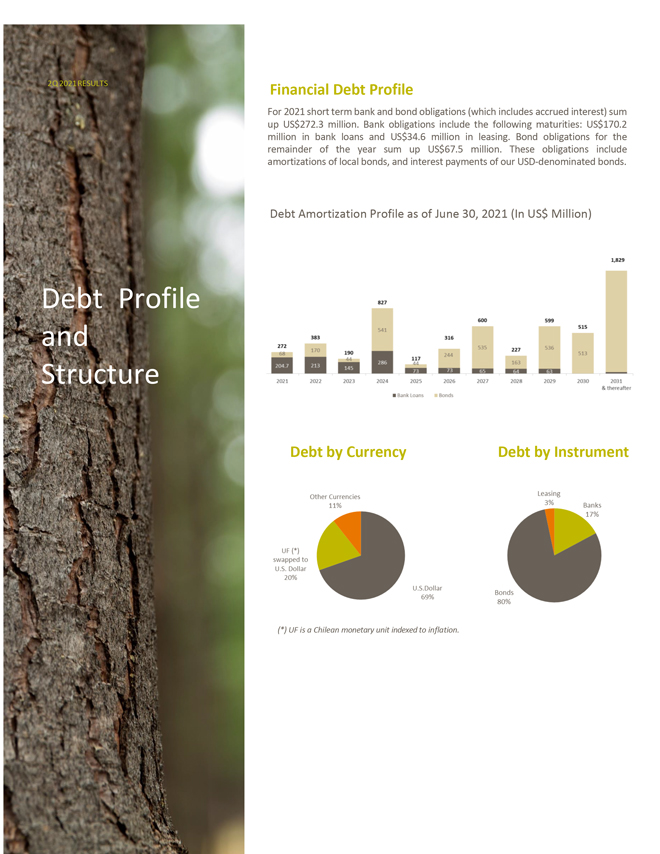
2Q 2021 RESULTS Financial Debt Profile For 2021 short term bank and bond obligations (which includes accrued interest) sum up US$272.3 million. Bank obligations include the following maturities: US$170.2 million in bank loans and US$34.6 million in leasing. Bond obligations for the remainder of the year sum up US$67.5 million. These obligations include amortizations of local bonds, and interest payments of our USD-denominated bonds. Debt Amortization Profile as of June 30, 2021 (In US$ Million) Debt Profile and Structure Debt by Currency Debt by Instrument (*) UF is a Chilean monetary unit indexed to inflation.
2Q 2021 RESULTS Second Quarter Subsequent Events and News Agreement for Selling Forestry Assets update On May 12, 2021, Forestal Arauco S.A., a subsidiary of the Company, executed a master agreement (the “Master Agreement”), by means of which it agreed to sell to a third party, 461 forest properties that include a total of 80,489 hectares, of which 61,742 are productive hectares, for a total price of US$385,500,000, plus the corresponding Value Added Tax. Pursuant to the Master Agreement, at the closing of the transaction, the price corresponding to 430 properties was to be paid, while the price of the remaining 31 properties will be paid subject to satisfaction, for each such property, of certain specific conditions within the months following closing; all of the above according to the procedure established in the Master Agreement. As informed on such occasion, it has been preliminarily estimated that this transaction will generate a gain for 2021 or 2022, depending on the closing date, of approximately US$192,500,000 after taxes, as a result of the sale of all the properties. We hereby inform that the conditions precedent for the closing of the operation described above have been met and, consequently, on August 17, 2021, the parties proceeded to execute the sale of 430 properties committed in the master agreement for a price of US $ 343,668,296, plus the corresponding Value Added Tax. Additionally, on the same date, the parties entered into a supply contract and a preferential call option to purchase pulp volume of radiata pine, a fire fighting service contract and a temporary forest property management and operational task management service contract, among others. Finally, it is noted that the parties expect to carry out the sale of the 31 remaining properties to the extent that, for each of them, certain particular conditions are met within the following months, as established in the Master Agreement.
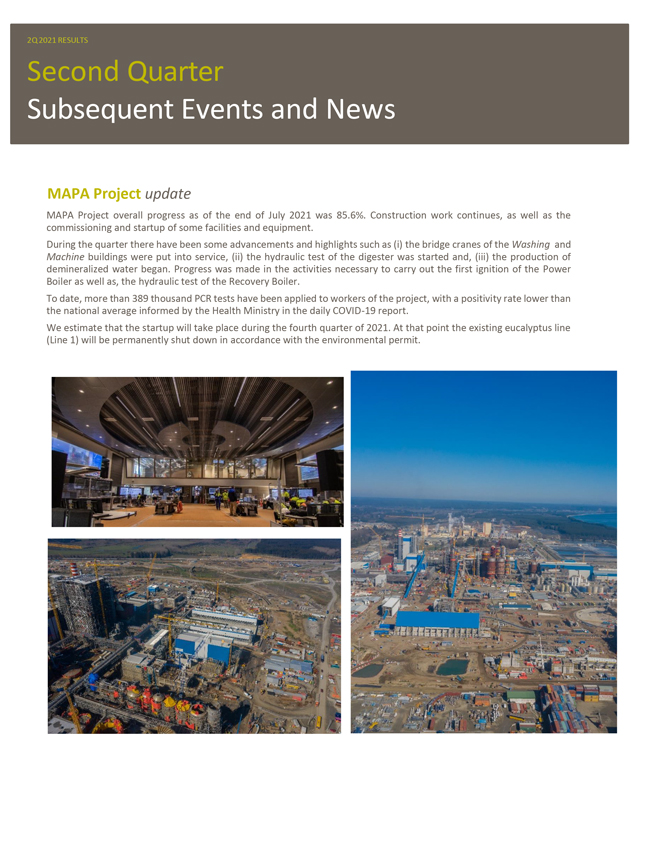
2Q 2021 RESULTS Second Quarter Subsequent Events and News MAPA Project update MAPA Project overall progress as of the end of July 2021 was 85.6%. Construction work continues, as well as the commissioning and startup of some facilities and equipment. During the quarter there have been some advancements and highlights such as (i) the bridge cranes of the Washing and Machine buildings were put into service, (ii) the hydraulic test of the digester was started and, (iii) the production of demineralized water began. Progress was made in the activities necessary to carry out the first ignition of the Power Boiler as well as, the hydraulic test of the Recovery Boiler. To date, more than 389 thousand PCR tests have been applied to workers of the project, with a positivity rate lower than the national average informed by the Health Ministry in the daily COVID-19 report. We estimate that the startup will take place during the fourth quarter of 2021. At that point the existing eucalyptus line (Line 1) will be permanently shut down in accordance with the environmental permit.

2Q 2021 RESULTS UPCOMING EVENTS 2Q 2021 RESULTS CONFERENCE CALL Thursday, August 26, 2021 11:00 Santiago Time 11:00 Eastern Time (New York) Dial in: +1 (844) 450 3845 from the US +56 (44) 208 1274 from Chile +55 (11) 3181 8565 from Brazil +1 (412) 317 6368 from other countries Conference ID: Arauco For further information, please contact: Marcelo Bennett Treasurer marcelo.bennett@arauco.com Phone: +56 2 2461 7309 Marcelo Reyes Intveen Investor Relations marcelo.reyes@arauco.com Phone: +56 2 2461 7434 investor_relations@arauco.cl
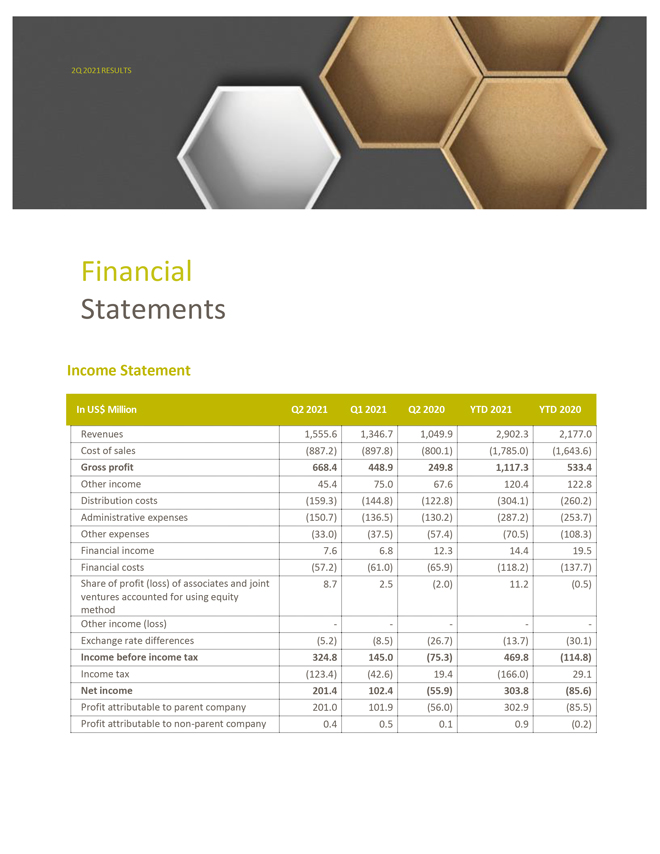
2Q 2021 RESULTS Financial Statements Income Statement In US$ Million Q2 2021 Q1 2021 Q2 2020 YTD 2021 YTD 2020 Revenues 1,555.6 1,346.7 1,049.9 2,902.3 2,177.0 Cost of sales (887.2) (897.8) (800.1) (1,785.0) (1,643.6) Gross profit 668.4 448.9 249.8 1,117.3 533.4 Other income 45.4 75.0 67.6 120.4 122.8 Distribution costs (159.3) (144.8) (122.8) (304.1) (260.2) Administrative expenses (150.7) (136.5) (130.2) (287.2) (253.7) Other expenses (33.0) (37.5) (57.4) (70.5) (108.3) Financial income 7.6 6.8 12.3 14.4 19.5 Financial costs (57.2) (61.0) (65.9) (118.2) (137.7) Share of profit (loss) of associates and joint 8.7 2.5 (2.0) 11.2 (0.5) ventures accounted for using equity method Other income (loss) — ——Exchange rate differences (5.2) (8.5) (26.7) (13.7) (30.1) Income before income tax 324.8 145.0 (75.3) 469.8 (114.8) Income tax (123.4) (42.6) 19.4 (166.0) 29.1 Net income 201.4 102.4 (55.9) 303.8 (85.6) Profit attributable to parent company 201.0 101.9 (56.0) 302.9 (85.5) Profit attributable to non-parent company 0.4 0.5 0.1 0.9 (0.2)
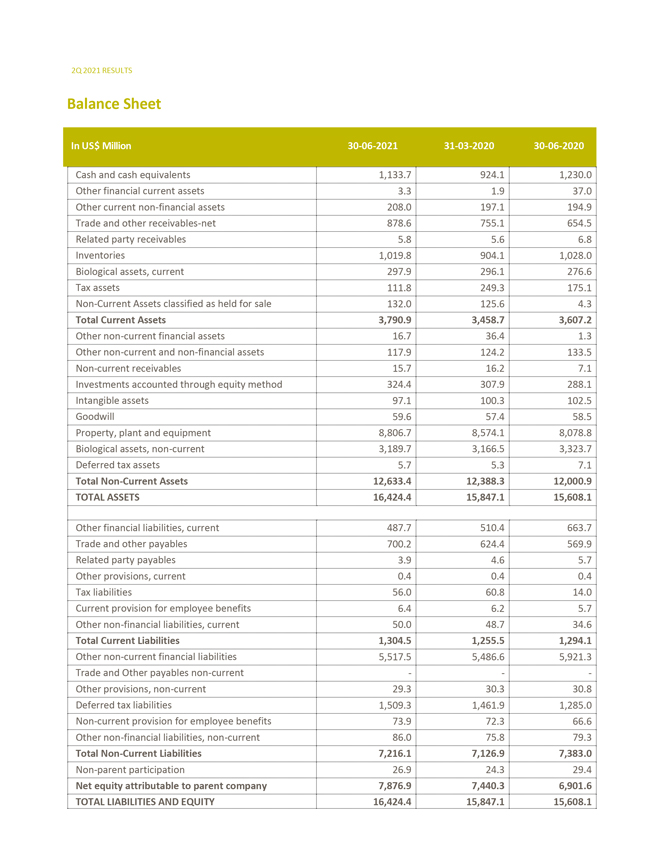
2Q 2021 RESULTS Balance Sheet In US$ Million 30-06-2021 31-03-2020 30-06-2020 Cash and cash equivalents 1,133.7 924.1 1,230.0 Other financial current assets 3.3 1.9 37.0 Other current non-financial assets 208.0 197.1 194.9 Trade and other receivables-net 878.6 755.1 654.5 Related party receivables 5.8 5.6 6.8 Inventories 1,019.8 904.1 1,028.0 Biological assets, current 297.9 296.1 276.6 Tax assets 111.8 249.3 175.1 Non-Current Assets classified as held for sale 132.0 125.6 4.3 Total Current Assets 3,790.9 3,458.7 3,607.2 Other non-current financial assets 16.7 36.4 1.3 Other non-current and non-financial assets 117.9 124.2 133.5 Non-current receivables 15.7 16.2 7.1 Investments accounted through equity method 324.4 307.9 288.1 Intangible assets 97.1 100.3 102.5 Goodwill 59.6 57.4 58.5 Property, plant and equipment 8,806.7 8,574.1 8,078.8 Biological assets, non-current 3,189.7 3,166.5 3,323.7 Deferred tax assets 5.7 5.3 7.1 Total Non-Current Assets 12,633.4 12,388.3 12,000.9 TOTAL ASSETS 16,424.4 15,847.1 15,608.1 Other financial liabilities, current 487.7 510.4 663.7 Trade and other payables 700.2 624.4 569.9 Related party payables 3.9 4.6 5.7 Other provisions, current 0.4 0.4 0.4 Tax liabilities 56.0 60.8 14.0 Current provision for employee benefits 6.4 6.2 5.7 Other non-financial liabilities, current 50.0 48.7 34.6 Total Current Liabilities 1,304.5 1,255.5 1,294.1 Other non-current financial liabilities 5,517.5 5,486.6 5,921.3 Trade and Other payables non-current ——Other provisions, non-current 29.3 30.3 30.8 Deferred tax liabilities 1,509.3 1,461.9 1,285.0 Non-current provision for employee benefits 73.9 72.3 66.6 Other non-financial liabilities, non-current 86.0 75.8 79.3 Total Non-Current Liabilities 7,216.1 7,126.9 7,383.0 Non-parent participation 26.9 24.3 29.4 Net equity attributable to parent company 7,876.9 7,440.3 6,901.6 TOTAL LIABILITIES AND EQUITY 16,424.4 15,847.1 15,608.1
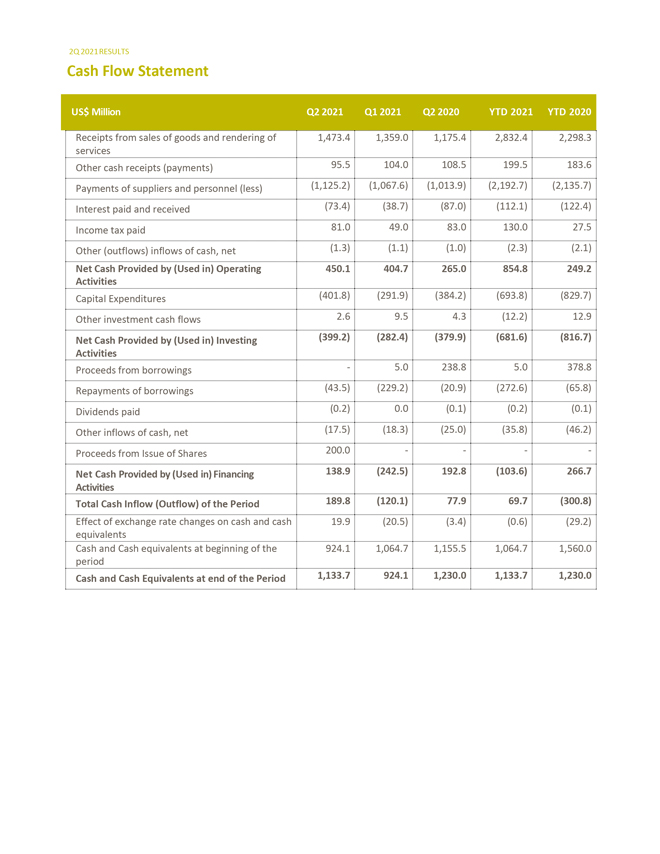
2Q 2021 RESULTS Cash Flow Statement US$ Million Q2 2021 Q1 2021 Q2 2020 YTD 2021 YTD 2020 Receipts from sales of goods and rendering of 1,473.4 1,359.0 1,175.4 2,832.4 2,298.3 services Other cash receipts (payments) 95.5 104.0 108.5 199.5 183.6 Payments of suppliers and personnel (less) (1,125.2) (1,067.6) (1,013.9) (2,192.7) (2,135.7) Interest paid and received (73.4) (38.7) (87.0) (112.1) (122.4) Income tax paid 81.0 49.0 83.0 130.0 27.5 Other (outflows) inflows of cash, net (1.3) (1.1) (1.0) (2.3) (2.1) Net Cash Provided by (Used in) Operating 450.1 404.7 265.0 854.8 249.2 Activities Capital Expenditures (401.8) (291.9) (384.2) (693.8) (829.7) Other investment cash flows 2.6 9.5 4.3 (12.2) 12.9 Net Cash Provided by (Used in) Investing (399.2) (282.4) (379.9) (681.6) (816.7) Activities Proceeds from borrowings—5.0 238.8 5.0 378.8 Repayments of borrowings (43.5) (229.2) (20.9) (272.6) (65.8) Dividends paid (0.2) 0.0 (0.1) (0.2) (0.1) Other inflows of cash, net (17.5) (18.3) (25.0) (35.8) (46.2) Proceeds from Issue of Shares 200.0 — — Net Cash Provided by (Used in) Financing 138.9 (242.5) 192.8 (103.6) 266.7 Activities Total Cash Inflow (Outflow) of the Period 189.8 (120.1) 77.9 69.7 (300.8) Effect of exchange rate changes on cash and cash 19.9 (20.5) (3.4) (0.6) (29.2) equivalents Cash and Cash equivalents at beginning of the 924.1 1,064.7 1,155.5 1,064.7 1,560.0 period Cash and Cash Equivalents at end of the Period 1,133.7 924.1 1,230.0 1,133.7 1,230.0
Signature
Pursuant to the requirements of the Securities Exchange Act of 1934, the registrant has duly caused this report to be signed on its behalf by the undersigned, thereunto duly authorized.
| | | | | | |
| | | | Celulosa Arauco y Constitución, S.A. |
| | | | (Registrant) |
| | | |
| Date: August 27, 2021 | | | | By: | | /s/ Matías Domeyko Cassel |
| | | | Name: | | Matías Domeyko Cassel |
| | | | Title: | | Chief Executive Officer |