Table of Contents
UNITED STATES
SECURITIES AND EXCHANGE COMMISSION
WASHINGTON, D.C. 20549
FORM 6-K
Report of Foreign Private Issuer
Pursuant to Rule 13a-16 or 15d-16
of the Securities Exchange Act of 1934
For the month of August 2023
Commission File Number 33-99720
ARAUCO AND CONSTITUTION PULP INC.
(Translation of registrant’s name into English)
El Golf 150
Fourteenth Floor
Santiago, Chile
(Address of principal executive offices)
Indicate by check mark whether the registrant files or will file annual reports under cover Form 20-F or Form 40-F.
Form 20-F ☒ Form 40-F ☐
Indicate by check mark if the registrant is submitting the Form 6-K in paper as permitted by Regulation S-T Rule 101(b)(1): ☐
Indicate by check mark if the registrant is submitting the Form 6-K in paper as permitted by Regulation S-T Rule 101(b)(7): ☐
Indicate by check mark whether the registrant by furnishing the information contained in this Form is also thereby furnishing the information to the Commission pursuant to Rule 12g3-2(b) under the Securities Exchange Act of 1934. Yes ☐ No ☒
If “Yes” is marked, indicate below the file number assigned to the registrant in connection with Rule 12g3-2(b): 82-
Table of Contents
ARAUCO AND CONSTITUTION PULP INC
| Item | Page | |||
1. Ratio analysis of the interim consolidated financial statements | 1 | |||
| 6 | ||||
| 8 | ||||
| 9 | ||||
| 10 | ||||
| 11 | ||||
| 12 | ||||
Table of Contents
CELULOSA ARAUCO Y CONSTITUCION S.A. AND SUBSIDIARIES
Unaudited consolidated financial statements
June 30, 2023
Amounts in thousands of U.S. dollars, except as indicated
RATIO ANALYSIS OF THE CONSOLIDATED FINANCIAL STATEMENTS
1. ANALYSIS OF FINANCIAL POSITION
a) Statement of financial position
The principal components of assets and liabilities at the end of each period are as follows:
Assets | 06-30-2023 ThU.S.$ | 12-31-2022 ThU.S.$ | Variation ThU.S.$ | |||||||||
Current assets | 4,027,356 | 3,774,921 | 252,435 | |||||||||
Non-current assets | 13,815,097 | 13,405,187 | 409,910 | |||||||||
|
|
|
|
|
| |||||||
Total assets | 17,842,453 | 17,180,108 | 3.86 | % | ||||||||
|
|
|
|
|
| |||||||
Liabilities | 06-30-2023 ThU.S.$ | 12-31-2022 ThU.S.$ | Variation ThU.S.$ | |||||||||
Current liabilities | 1,609,189 | 1,526,284 | 82,905 | |||||||||
Non-current liabilities | 8,090,072 | 7,393,840 | 696,232 | |||||||||
Non–controlling interests | 5,624 | 5,189 | 435 | |||||||||
Equity attributable to parent company | 8,137,568 | 8,254,795 | (117,227 | ) | ||||||||
|
|
|
|
|
| |||||||
Total net equity and liabilities | 17,842,453 | 17,180,108 | 3.86 | % | ||||||||
|
|
|
|
|
| |||||||
As of June 30, 2023, total assets increased MU.S.$ 662 compared to December 31, 2022, equivalent to a 3.86% variation. This variation was driven mainly by an increase in cash and cash equivalents, property, plant and equipment, right of use assets and inventories, which were offset by a lower balance of trade receivables and other receivables.
In turn, total liabilities increased by MU.S.$ 779 principally driven by increases in financial liabilities for bank borrowings and UF bond issuances, which were offset by lower balances of deferred tax liabilities and trade and other current payables.
The main financial and operational indicators related to the statement of financial position as of the dates and for the periods indicated below are as follows:
Liquidity ratios | 06-30-2023 | 12-31-2022 | ||||||
Current liquidity (current assets / current liabilities) | 2.50 | 2.47 | ||||||
Acid ratio ((current assets-inventories, biological assets) / current liabilities) | 1.30 | 1.29 | ||||||
Debt indicators | 06-30-2023 | 12-31-2022 | ||||||
Debt to equity ratio (total liabilities / equity) | 1.19 | 1.08 | ||||||
Short-term debt to total debt (current liabilities / total liabilities) | 0.17 | 0.17 | ||||||
Long-term debt to total debt (non-current liabilities / total liabilities) | 0.83 | 0.83 | ||||||
| 06-30-2023 | 06-30-2022 | |||||||
Financial expenses coverage ratio (earnings before taxes + interest expense / interest expense) | (0.08 | ) | 9.42 | |||||
Activity ratio | 06-30-2023 | 12-31-2022 | ||||||
Inventory turnover-time (cost of sales / inventories + current biological assets) | 2.39 | 2.59 | ||||||
Inventory turnover-time (excluding biological assets) (Cost of sales /inventory) | 2.93 | 3.23 | ||||||
Inventory permanence-days ((inventories + biological assets) /cost of sales) | 150.62 | 139.26 | ||||||
Inventory permanence-days (excluding biological assets) (inventory / cost of sales) | 122.68 | 111.46 | ||||||
As of June 30, 2023, the short-term debt to total debt ratio represented 17% of total liabilities (17% as of December 31, 2022).
1
Table of Contents
CELULOSA ARAUCO Y CONSTITUCION S.A. AND SUBSIDIARIES
Unaudited consolidated financial statements
June 30, 2023
Amounts in thousands of U.S. dollars, except as indicated
Our financial expenses coverage ratio decreased from 9.42 to (0.08), mainly due to the losses before taxes generated for the six-month period ended June 30, 2023, compared to the profits before taxes generated in the same period of 2022.
b) Statement of profit or loss
Profit before income tax
We recorded a loss before income tax of approximately MU.S.$ 185 compared to a profit of approximately MU.S.$ 784 in the same period of 2022. The variation of MU.S.$ 969 is explained by the factors described in the following table:
Item | MU.S.$ | |||
Gross profit (loss) | (911 | ) | ||
Distribution and administrative expenses | 145 | |||
Other income and expenses | (98 | ) | ||
Others | (105 | ) | ||
|
| |||
Net change in profit (loss) before income tax | (969 | ) | ||
|
| |||
The main indicators related to the accounts in our statements of profit or loss and the details of revenues and operation costs are as follows:
Revenues | 06-30-2023 ThU.S.$ | 06-30-2022 ThU.S.$ | ||||||
Pulp | 1,235,160 | 1,501,352 | ||||||
Wood | 1,613,038 | 2,126,968 | ||||||
Other | 191 | 377 | ||||||
|
|
|
| |||||
Total revenues | 2,848,389 | 3,628,697 | ||||||
|
|
|
| |||||
Sales costs | 06-30-2023 ThU.S.$ | 06-30-2022 ThU.S.$ | ||||||
Wood | 457,689 | 369,620 | ||||||
Forestry work and other services | 322,307 | 298,075 | ||||||
Depreciation and amortization | 255,901 | 236,960 | ||||||
Other operating costs | 1,193,762 | 1,194,310 | ||||||
|
|
|
| |||||
Total sales costs | 2,229,659 | 2,098,965 | ||||||
|
|
|
| |||||
Profitability index | 06-30-2023 | 06-30-2022 | ||||||
Profitability on equity | (2.47 | ) | 8.76 | |||||
Profitability on assets | (1.16 | ) | 4.16 | |||||
Return on operating assets | (0.30 | ) | 7.94 | |||||
Profitability ratios | 06-30-2023 | 06-30-2022 | ||||||
Earnings per share (U.S.$) (1) | (0.8410 | ) | 5.2532 | |||||
Profit after tax (ThU.S.$) (2) | (101,417 | ) | 632,910 | |||||
Gross profit (loss) (ThU.S.$) | 618,730 | 1,529,732 | ||||||
Finance costs (ThU.S.$) | (172,569 | ) | (93,210 | ) | ||||
| (1) | Average earnings per share refer to the profit to net equity to parent company. |
| (2) | Includes non-controlling interest. |
2
Table of Contents
CELULOSA ARAUCO Y CONSTITUCION S.A. AND SUBSIDIARIES
Unaudited consolidated financial statements
June 30, 2023
Amounts in thousands of U.S. dollars, except as indicated
EBITDA | 06-30-2023 ThU.S.$ | 06-30-2022 ThU.S.$ | ||||||
Profit (loss) | (101,417 | ) | 632,910 | |||||
Finance costs | 172,569 | 93,210 | ||||||
Finance income | (50,959 | ) | (28,794 | ) | ||||
Income tax expense | (84,119 | ) | 151,542 | |||||
EBIT | (63,926 | ) | 848,868 | |||||
Depreciation and amortization | 320,198 | 261,853 | ||||||
EBITDA | 256,272 | 1,110,721 | ||||||
Cost at fair value of the harvest | 206,446 | 200,815 | ||||||
Gain from changes in fair value of biological assets | (108,687 | ) | (130,564 | ) | ||||
Gains (losses) on exchange difference on translation | 43,600 | 21,409 | ||||||
Others* | 16,906 | 23,793 | ||||||
Adjusted EBITDA | 414,537 | 1,226,174 | ||||||
| * | This net amount corresponds mainly to forest fires and reversal of provisions. |
2. MAIN SOURCES OF FINANCING
Arauco’s financing needs are mainly covered through the capital markets, with bond issuances and credits obtained from banks and financial institutions serving as the main sources of financing.
For short-term borrowing, Arauco follows a liquidity policy which indicates the amounts and institutions from which it can borrow according to several conditions defined in the policy.
In the case of long-term debt, corporate bond issuances in the local market and also in the international markets are used as sources of new resources.
Another source of long-term financing corresponds to borrowings from banks and financial institutions around the world.
3. MARKET SITUATION
Turnover for the second quarter of 2023 decreased by 24.2% when compared to the same period in 2022. This decline was due to lower prices, slightly offset by an increase in sales volume. During the first half of 2023, turnover was 19.5% lower than in the same period of 2022, due to lower volume and lower prices. In terms of grades, most of the prices were lower, with the exception of the grades produced at the Argentina mill.
During the second quarter of 2023 the pulp market weakened. There was an increase in the supply of short fiber to the commissioning of Arauco’s L3 and the new plant in Uruguay, owned by the producer UPM. Additionally, the low season began during this quarter, which, jointly with lower economic activity in several regions, generated lower demand for pulp. Total global inventories followed the trend of the first quarter of 2023 and continued to increase, reaching levels which have not been seen for several years.
In China, the market remains stable, prices of end-products in the paper industry have decreased, and price increases have been attempted in the tissue industry. However, the industry remains cautious due to low seasonality. Pulp prices of all grades began the quarter declining, but towards the end of the quarter the price of long fiber remained constant and that of short fiber increased slightly. Prices’ low level has caused pulp buyers to begin rebuilding their pulp inventories. In addition, pulp supply has increased as a result of new plants and of ship diversions from other destinations to China.
In Europe, demand for paper remains low and customers still hold high inventories of end-products and raw material. However, customers have managed to maintain relatively stable prices for their products. Towards mid-quarter, we also observed that the tissue industry began to weaken. Regarding pulp supply, there was considerable spot supply from other producers during the quarter, which was also reflected in the high pulp inventories at the ports. Both short and long fiber prices decreased during the quarter, with short fiber prices showing a stronger decline as customers pushed to reduce the net price difference with China as much as possible.
The textile pulp market during the second quarter weakens, and therefore, there were some price drops throughout the quarter. Additionally, the low season started during the quarter, resulting in a decrease in demand for textile pulp.
3
Table of Contents
CELULOSA ARAUCO Y CONSTITUCION S.A. AND SUBSIDIARIES
Unaudited consolidated financial statements
June 30, 2023
Amounts in thousands of U.S. dollars, except as indicated
Production in the second quarter of 2023 was affected by the scheduled shutdown of the Nueva Aldea mill and the mill in Uruguay. The Valdivia mill was stopped for almost the entire quarter due to the replacement of the equipment that caught fire in 2022. Additionally, the MAPA project continued with its production curve according to plan.
Wood Products Business
Sawn timber
Sawn timber sales continued to decline in the second quarter of 2023 compared to the same period of the 2022. In general, the markets continue to show the effects of lower economic activity, reflected in lower volumes and prices. China was affected by real estate problems, problems derived from Covid, and continues to show lower than expected economic growth. The rest of Asia and Europe was affected by high inventories, high interest rates, and geopolitical uncertainty. For the upcoming months, limited demand and an uncertain general scenario may continue, which could have repercussions on supply.
In remanufacturing, in the U.S., during this quarter we are beginning to see an improvement in demand, although volumes and prices remain quite lower than in 2022 as a result of the effects of high inflation in the region, rate hikes, high inventories in the logistics chain, and higher supply from Asia, from local sources, and from Latin America. For the next quarter, stable demand and prices are expected in the U.S. and the rest of the markets.
Plywood
During the second quarter of 2023 there was generally a lower demand for plywood compared to the same period of 2022. This decrease is mainly an effect of inflation and higher interest rates in the Americas and Oceania, affecting the construction and renovation sectors. Furthermore, the complicated scenario in Europe due to the war has had an impact on demand and has translated into higher costs. As a result, there is an oversupply in the market, both in Latin America and Europe. In the case of North America, demand and prices have stabilized. Improvements are expected in this market next quarter, while in the rest of the markets they should only occur towards the end of the year and in early 2024.
Panels (MDF, PB, Melamine)
In this second quarter of 2023, volumes and prices continued to be affected by higher exports from Brazil to the rest of the region, especially in MDF. On the demand side, the downward trend persists due to high inflation, higher interest rates, devaluation of currencies against the dollar, high inventories, and political uncertainty in some countries. This competitive scenario is expected to continue in the third quarter.
4
Table of Contents
CELULOSA ARAUCO Y CONSTITUCION S.A. AND SUBSIDIARIES
Unaudited consolidated financial statements
June 30, 2023
Amounts in thousands of U.S. dollars, except as indicated
4. ANALYSIS OF CASH FLOW
The main components of cash flow in each period are as follows:
| 06-30-2023 ThU.S.$ | 06-30-2022 ThU.S.$ | |||||||
Positive (negative) Cash flow | ||||||||
Net cash flows from (used in) operating activities | 149,286 | 945,753 | ||||||
Cash flows from (used in) financing activities: | ||||||||
Obtaining and paying borrowings and bonds | 997,806 | (93,836 | ) | |||||
Payments of lease liabilities | (26,982 | ) | (32,251 | ) | ||||
Dividends paid | (282,690 | ) | (192,334 | ) | ||||
Others | (6,251 | ) | (378 | ) | ||||
Cash flows from (used in) investment activities: | ||||||||
Purchase and sale of property, plant and equipment | (488,569 | ) | (639,464 | ) | ||||
Purchase and sale of biological assets | (212,818 | ) | (104,493 | ) | ||||
Purchase and sale of intangible assets | (2,773 | ) | (1,916 | ) | ||||
Additions (disposals), investments in subsidiaries, joint ventures and associates | — | (118 | ) | |||||
Dividends received | 543 | 24,768 | ||||||
Others | (21,626 | ) | (2,372 | ) | ||||
|
|
|
| |||||
Positive (negative) net cash flow | 105,926 | (96,641 | ) | |||||
|
|
|
| |||||
Our cash flow from operating activities decreased to MU.S.$ 149 for the current period (compared to the positive balance of MU.S.$ 946 for the same period in 2022), resulting mainly from a lower revenue from customer collections in the current period.
The cash flow from financing activities showed a positive balance of MU.S.$ 682 for the current period (compared to the negative balance of MU.S.$ 319 for the same period in 2022). This was mainly due to an increase in short-term borrowings, which was partially offset by financial debts payments
Regarding the cash flow from investment activities, the balance increased to MU.S.$ 725 (compared to a negative balance of MU.S.$ 724 for the same period of 2022), mainly due to a decrease in payments for purchases of property, plant and equipment, which was partially offset by an increase in payments for purchases related to forest plantations and a decrease in dividends received.
5. MARKET RISK ANALYSIS
In respect of the economic risks resulting from interest rate variations, the Company maintained, as of June 30, 2023, a ratio of fixed rate debt to total consolidated debt of approximately 93.7%, which we believe is consistent with industry standards.
Regarding variations in prices of pulp and forestry products, the Company does not participate in futures trading, which allows it to maintain one of the lowest cost structures in the industry and have these risks bounded.
The Company and most of its subsidiaries maintain their accounting records and prepare their financial statements in U.S. dollars. Most of their revenues (and accordingly accounts receivable) are denominated in U.S. dollars, and most financial liabilities are either denominated in U.S. dollars or are covered by exchange rate swaps. As a result, exposure to exchange rate fluctuations has decreased significantly.
The consolidated financial statements as of June 30, 2023 include a detailed analysis of the risks associated with the business of Arauco (see Note 23).
5
Table of Contents
CELULOSA ARAUCO Y CONSTITUCION S.A. AND SUBSIDIARIES
Unaudited consolidated financial statements
June 30, 2023
Amounts in thousands of U.S. dollars, except as indicated
INTERIM CONSOLIDATED STATEMENTS OF FINANCIAL POSITION
| 06-30-2023 | 12-31-2022 | |||||||||
| Note | ThU.S.$ | ThU.S.$ | ||||||||
Assets | ||||||||||
Current assets | ||||||||||
Cash and cash equivalents | 5-23 | 764,621 | 667,207 | |||||||
Other current financial assets | 23 | 27,601 | 15,350 | |||||||
Other current non-financial assets | 25 | 293,805 | 206,059 | |||||||
Trade and other current receivables | 23 | 818,152 | 873,295 | |||||||
Accounts receivable from related companies | 13-23 | 6,714 | 7,563 | |||||||
Current inventories | 4 | 1,569,324 | 1,470,011 | |||||||
Current biological assets | 20 | 361,769 | 330,435 | |||||||
Current tax assets | 6 | 185,191 | 203,722 | |||||||
Total current assets other than assets or disposal groups classified as held for sale | 4,027,177 | 3,773,642 | ||||||||
Non-current assets or disposal groups classified as held for sale | 22 | 179 | 1,279 | |||||||
Non-current assets or disposal groups classified as held for sale or as held for distribution to owners | 179 | 1,279 | ||||||||
Total current assets | 4,027,356 | 3,774,921 | ||||||||
Non-current assets | ||||||||||
Other non-current financial assets | 23 | 115,179 | 63,321 | |||||||
Other non-current non-financial assets | 25 | 120,666 | 92,514 | |||||||
Non-current receivables | 23 | 87,328 | 32,674 | |||||||
Investments accounted for using equity method | 15-16 | 397,003 | 365,671 | |||||||
Intangible assets other than goodwill | 19 | 68,532 | 73,439 | |||||||
Goodwill | 17 | 55,954 | 54,800 | |||||||
Property, plant and equipment | 7 | 9,683,551 | 9,542,335 | |||||||
Right of use assets | 8 | 408,995 | 306,487 | |||||||
Non-current biological assets | 20 | 2,858,504 | 2,864,935 | |||||||
Deferred tax assets | 6 | 19,385 | 9,011 | |||||||
Total non-current assets | 13,815,097 | 13,405,187 | ||||||||
Total assets | 17,842,453 | 17,180,108 | ||||||||
The accompanying notes are an integral part of these interim consolidated financial statements.
6
Table of Contents
CELULOSA ARAUCO Y CONSTITUCION S.A. AND SUBSIDIARIES
Unaudited consolidated financial statements
June 30, 2023
Amounts in thousands of U.S. dollars, except as indicated
INTERIM CONSOLIDATED STATEMENTS OF FINANCIAL POSITION (continued)
| Note | 06-30-2023 ThU.S.$ | 12-31-2022 ThU.S.$ | ||||||||
Equity and liabilities | ||||||||||
Liabilities | ||||||||||
Current liabilities | ||||||||||
Other current financial liabilities | 23 | 778,361 | 375,451 | |||||||
Current lease liabilities | 8-23 | 49,581 | 36,784 | |||||||
Trade and other current payables | 23 | 682,488 | 812,838 | |||||||
Accounts payable to related companies | 13-23 | 17,836 | 14,280 | |||||||
Other short-term provisions | 18 | 7,418 | 9,513 | |||||||
Current tax liabilities | 6 | 8,692 | 26,869 | |||||||
Current provisions for employee benefits | 10 | 8,488 | 7,571 | |||||||
Other current non-financial liabilities | 25 | 56,325 | 242,978 | |||||||
Total current liabilities other than liabilities included in disposal groups classified as held for sale | 1,609,189 | 1,526,284 | ||||||||
Total current liabilities | 1,609,189 | 1,526,284 | ||||||||
Non-current liabilities | ||||||||||
Other non-current financial liabilities | 23 | 5,870,645 | 5,155,371 | |||||||
Non-current lease liabilities | 8-23 | 332,406 | 227,440 | |||||||
Non-current payables | 22,040 | 20,116 | ||||||||
Non-current accounts payable to related companies | 23 | 6,731 | 6,731 | |||||||
Other long-term provisions | 18 | 30,719 | 40,706 | |||||||
Deferred tax liabilities | 6 | 1,657,267 | 1,785,915 | |||||||
Non-current provisions for employee benefits | 10 | 98,633 | 87,689 | |||||||
Other non-current non-financial liabilities | 25 | 71,631 | 69,872 | |||||||
Total non-current liabilities | 8,090,072 | 7,393,840 | ||||||||
Total liabilities | 9,699,261 | 8,920,124 | ||||||||
Equity | ||||||||||
Issued capital | 3 | 803,618 | 803,618 | |||||||
Retained earnings | 8,294,288 | 8,500,901 | ||||||||
Other reserves | (960,338 | ) | (1,049,724 | ) | ||||||
Equity attributable to parent company | 8,137,568 | 8,254,795 | ||||||||
Non-controlling interests | 5,624 | 5,189 | ||||||||
Total equity | 8,143,192 | 8,259,984 | ||||||||
Total equity and liabilities | 17,842,453 | 17,180,108 | ||||||||
The accompanying notes are an integral part of these interim consolidated financial statements.
7
Table of Contents
CELULOSA ARAUCO Y CONSTITUCION S.A. AND SUBSIDIARIES
Unaudited consolidated financial statements
June 30, 2023
Amounts in thousands of U.S. dollars, except as indicated
INTERIM CONSOLIDATED STATEMENTS OF PROFIT OR LOSS
| January – June | April – June | |||||||||||||||||
|
|
|
|
|
|
|
| |||||||||||
| Note | 2023 ThU.S.$ | 2022 ThU.S.$ | 2023 ThU.S.$ | 2022 ThU.S.$ | ||||||||||||||
|
|
|
|
|
|
|
| |||||||||||
Statements of profit or loss | ||||||||||||||||||
Revenue | 9 | 2,848,389 | 3,628,697 | 1,408,918 | 1,867,073 | |||||||||||||
Cost of sales | 3 | (2,229,659 | ) | (2,098,965 | ) | (1,195,648 | ) | (1,095,815 | ) | |||||||||
Gross profit (loss) | 618,730 | 1,529,732 | 213,270 | 771,258 | ||||||||||||||
Other income | 3 | 234,776 | 171,816 | 159,180 | 89,053 | |||||||||||||
Distribution costs | 3 | (333,120 | ) | (489,581 | ) | (172,200 | ) | (255,605 | ) | |||||||||
Administrative expenses | 3 | (311,093 | ) | (299,150 | ) | (161,244 | ) | (158,383 | ) | |||||||||
Other expense by function | 3 | (247,597 | ) | (86,711 | ) | (38,618 | ) | (58,863 | ) | |||||||||
Profit (loss) from operating activities | (38,304 | ) | 826,106 | 388 | 387,460 | |||||||||||||
Finance income | 3 | 50,959 | 28,794 | 28,182 | 15,463 | |||||||||||||
Finance costs | 3 | (172,569 | ) | (93,210 | ) | (92,423 | ) | (46,191 | ) | |||||||||
Share of profit (loss) of associates and joint ventures accounted for using equity method | 3-15 | 17,978 | 44,171 | 10,115 | 24,459 | |||||||||||||
Gains (losses) on exchange differences on translation | (43,600 | ) | (21,409 | ) | (19,904 | ) | (2,429 | ) | ||||||||||
Profit (loss) before income tax | (185,536 | ) | 784,452 | (73,642 | ) | 378,762 | ||||||||||||
Income tax (expense) benefit | 6 | 84,119 | (151,542 | ) | 26,527 | (74,912 | ) | |||||||||||
Net profit (loss) | (101,417 | ) | 632,910 | (47,115 | ) | 303,850 | ||||||||||||
|
|
|
|
|
|
|
| |||||||||||
Net profit attributable to | ||||||||||||||||||
Net profit (loss) attributable to parent company | (101,315 | ) | 632,877 | (47,152 | ) | 303,827 | ||||||||||||
Net profit (loss) attributable to non-controlling interests | (102 | ) | 33 | 37 | 23 | |||||||||||||
Net profit (loss) | (101,417 | ) | 632,910 | (47,115 | ) | 303,850 | ||||||||||||
|
|
|
|
|
|
|
| |||||||||||
Basic and diluted earnings (loss) per share (in U.S.$ per share) | ||||||||||||||||||
Basic and diluted earnings (loss) per share from continuing operations | (0.8409674 | ) | 5.2532095 | (0.3913862 | ) | 2.5219227 | ||||||||||||
|
|
|
|
|
|
|
| |||||||||||
Basic and diluted earnings (loss) per share | (0.8409674 | ) | 5.2532095 | (0.3913862 | ) | 2.5219227 | ||||||||||||
|
|
|
|
|
|
|
| |||||||||||
The accompanying notes are an integral part of these interim consolidated financial statements.
8
Table of Contents
CELULOSA ARAUCO Y CONSTITUCION S.A. AND SUBSIDIARIES
Unaudited consolidated financial statements
June 30, 2023
Amounts in thousands of U.S. dollars, except as indicated
INTERIM CONSOLIDATED STATEMENTS OF COMPREHENSIVE INCOME
| January - June | April - June | |||||||||||||||||||
| Note | 2023 ThU.S.$ | 2022 ThU.S.$ | 2023 ThU.S.$ | 2022 ThU.S.$ | ||||||||||||||||
Net profit (loss) | (101,417 | ) | 632,910 | (47,115 | ) | 303,850 | ||||||||||||||
Components of other comprehensive income that will not be reclassified to profit or loss before tax: | ||||||||||||||||||||
Remeasurements of defined benefit plans | ||||||||||||||||||||
Other comprehensive income before tax gains losses on remeasurements of defined benefit plans | 10 | (4,271 | ) | (4,422 | ) | (4,019 | ) | (3,893 | ) | |||||||||||
Other comprehensive income that will not be reclassified to profit or loss before tax | (4,271 | ) | (4,422 | ) | (4,019 | ) | (3,893 | ) | ||||||||||||
Components of other comprehensive income that will be reclassified to profit or loss before tax: | ||||||||||||||||||||
Exchange differences on translation | ||||||||||||||||||||
Gains (losses) on exchange differences on translation, before tax | 11 | 102,897 | 38,181 | 61,355 | (91,729 | ) | ||||||||||||||
Other comprehensive income before tax exchange differences on translation | 102,897 | 38,181 | 61,355 | (91,729 | ) | |||||||||||||||
Cash flow hedges | ||||||||||||||||||||
Gains (losses) on cash flow hedges, before tax | 23 | (29,698 | ) | 156,807 | 10,700 | 49,486 | ||||||||||||||
Reclassification adjustments on cash flow hedges before tax | 23 | 209 | (5,080 | ) | 209 | (5,080 | ) | |||||||||||||
Other comprehensive income before tax cash flow hedges | (29,489 | ) | 151,727 | 10,909 | 44,406 | |||||||||||||||
Share of other comprehensive income of associates and joint ventures accounted for using equity method that will be reclassified to profit or loss before tax | ||||||||||||||||||||
Share of other comprehensive income of associates and joint ventures accounted for using equity method that will be reclassified to profit or loss before tax | (655 | ) | 2,352 | (1,533 | ) | (1,598 | ) | |||||||||||||
Share of other comprehensive income of associates and joint ventures accounted for using equity method that will be reclassified to profit or loss before tax | (655 | ) | 2,352 | (1,533 | ) | (1,598 | ) | |||||||||||||
Other Comprehensive income that will be reclassified to profit or loss before tax | 72,753 | 192,260 | 70,731 | (48,921 | ) | |||||||||||||||
Income tax relating to components of other comprehensive income that will not be reclassified to profit or loss before tax | ||||||||||||||||||||
Income tax relating to remeasurements of defined benefit plans of other comprehensive income | 1,153 | 1,194 | 1,085 | 1,124 | ||||||||||||||||
Income tax relating to components of other comprehensive income that will not be reclassified to profit or loss before tax | 1,153 | 1,194 | 1,085 | 1,124 | ||||||||||||||||
Income tax relating to components of other comprehensive income that will be reclassified to profit or loss before tax | ||||||||||||||||||||
Income tax relating to cash flow hedges of other comprehensive income | 6 | 7,792 | (41,248 | ) | (4,370 | ) | (17,851 | ) | ||||||||||||
Income tax relating to share of other comprehensive income of associates and joint ventures accounted for using equity method that will be reclassified to profit or loss | (22 | ) | (495 | ) | 323 | 334 | ||||||||||||||
Income tax relating to components of other comprehensive income that will be reclassified to profit or loss | 7,770 | (41,743 | ) | (4,047 | ) | (17,517 | ) | |||||||||||||
Other comprehensive income (loss) | 77,405 | 147,289 | 63,750 | (69,207 | ) | |||||||||||||||
Total comprehensive income (loss) | (24,012 | ) | 780,199 | 16,635 | 234,643 | |||||||||||||||
Comprehensive income (loss) attributable to | ||||||||||||||||||||
Comprehensive income (loss), attributable to owners of parent company | (23,910 | ) | 780,187 | 16,453 | 234,681 | |||||||||||||||
Comprehensive income (loss), attributable to non-controlling interests | (102 | ) | 12 | 182 | (38 | ) | ||||||||||||||
Total comprehensive income (loss) | (24,012 | ) | 780,199 | 16,635 | 234,643 | |||||||||||||||
The accompanying notes are an integral part of these interim consolidated financial statements.
9
Table of Contents
CELULOSA ARAUCO Y CONSTITUCION S.A. AND SUBSIDIARIES
Unaudited consolidated financial statements
June 30, 2023
Amounts in thousands of U.S. dollars, except as indicated
INTERIM CONSOLIDATED STATEMENTS OF CHANGES IN EQUITY
06-30-2023 | Issued capital ThU.S.$ | Reserve of exchange differences on translation ThU.S.$ | Reserve of cash flow hedges ThU.S.$ | Reserve of actuarial losses on defined benefit plans ThU.S.$ | Other reserves ThU.S.$ | Total other reserves ThU.S.$ | Retained earnings ThU.S.$ | Equity attributable to owners of parent ThU.S.$ | Non- controlling interests ThU.S.$ | Total equity ThU.S.$ | ||||||||||||||||||||||||||||||
Opening balance at 01-01-2023 | 803,618 | (1,097,329 | ) | (10,112 | ) | (35,374 | ) | 93,091 | (1,049,724 | ) | 8,500,901 | 8,254,795 | 5,189 | 8,259,984 | ||||||||||||||||||||||||||
Changes in Equity: | ||||||||||||||||||||||||||||||||||||||||
Comprehensive income | ||||||||||||||||||||||||||||||||||||||||
Net profit (loss) | — | — | — | — | — | — | (101,315 | ) | (101,315 | ) | (102 | ) | (101,417 | ) | ||||||||||||||||||||||||||
Other comprehensive income, net of tax | — | 102,897 | (21,697 | ) | (3,118 | ) | (677 | ) | 77,405 | — | 77,405 | — | 77,405 | |||||||||||||||||||||||||||
Comprehensive income (loss) | — | 102,897 | (21,697 | ) | (3,118 | ) | (677 | ) | 77,405 | (101,315 | ) | (23,910 | ) | (102 | ) | (24,012 | ) | |||||||||||||||||||||||
Dividends | — | — | — | — | — | — | (92,719 | ) | (92,719 | ) | (59 | ) | (92,778 | ) | ||||||||||||||||||||||||||
Increase (decrease) through transfers and other changes equity | — | — | — | — | 11,981 | 11,981 | (12,579 | ) | (598 | ) | 596 | (2 | ) | |||||||||||||||||||||||||||
Changes in equity | — | 102,897 | (21,697 | ) | (3,118 | ) | 11,304 | 89,386 | (206,613 | ) | (117,227 | ) | 435 | (116,792 | ) | |||||||||||||||||||||||||
Closing balance at 06-30-2023 | 803,618 | (994,432 | ) | (31,809 | ) | (38,492 | ) | 104,395 | (960,338 | ) | 8,294,288 | 8,137,568 | 5,624 | 8,143,192 | ||||||||||||||||||||||||||
06-30-2022 | Issued capital ThU.S.$ | Reserve of exchange differences on translation ThU.S.$ | Reserve of cash flow hedges ThU.S.$ | Reserve of actuarial losses on defined benefit plans ThU.S.$ | Other reserves ThU.S.$ | Total other reserves ThU.S.$ | Retained earnings ThU.S.$ | Equity attributable to owners of parent ThU.S.$ | Non- controlling interests ThU.S.$ | Total equity ThU.S.$ | ||||||||||||||||||||||||||||||
Opening balance at 01-01-2022 | 803,618 | (1,155,195 | ) | (136,859 | ) | (20,766 | ) | 71,750 | (1,241,070 | ) | 8,248,185 | 7,810,733 | 7,771 | 7,818,504 | ||||||||||||||||||||||||||
Changes in Equity: | ||||||||||||||||||||||||||||||||||||||||
Comprehensive income | ||||||||||||||||||||||||||||||||||||||||
Net profit (loss) | — | — | — | — | — | — | 632,877 | 632,877 | 33 | 632,910 | ||||||||||||||||||||||||||||||
Other comprehensive income, net of tax | — | 38,202 | 110,479 | (3,228 | ) | 1,857 | 147,310 | — | 147,310 | (21 | ) | 147,289 | ||||||||||||||||||||||||||||
Comprehensive income (loss) | — | 38,202 | 110,479 | (3,228 | ) | 1,857 | 147,310 | 632,877 | 780,187 | 12 | 780,199 | |||||||||||||||||||||||||||||
Dividends | — | — | — | — | — | — | (328,734 | ) | (328,734 | ) | (586 | ) | (329,320 | ) | ||||||||||||||||||||||||||
Increase (decrease) through transfers and other changes equity | — | — | — | — | 10,199 | 10,199 | (10,199 | ) | — | — | — | |||||||||||||||||||||||||||||
Changes in equity | — | 38,202 | 110,479 | (3,228 | ) | 12,056 | 157,509 | 293,944 | 451,453 | (574 | ) | 450,879 | ||||||||||||||||||||||||||||
Closing balance at 06-30-2022 | 803,618 | (1,116,993 | ) | (26,380 | ) | (23,994 | ) | 83,806 | (1,083,561 | ) | 8,542,129 | 8,262,186 | 7,197 | 8,269,383 | ||||||||||||||||||||||||||
The accompanying notes are an integral part of these interim consolidated financial statements.
10
Table of Contents
CELULOSA ARAUCO Y CONSTITUCION S.A. AND SUBSIDIARIES
Unaudited consolidated financial statements
June 30, 2023
Amounts in thousands of U.S. dollars, except as indicated
INTERIM CONSOLIDATED STATEMENTS OF CASH FLOWS
| January - June | ||||||||
| 2023 | 2022 | |||||||
| ThU.S.$ | ThU.S.$ | |||||||
STATEMENTS OF CASH FLOWS | ||||||||
Cash flows from (used in) operating activities | ||||||||
Classes of cash receipts from operating activities | ||||||||
Receipts from sales of goods and rendering of services | 3,064,943 | 3,865,770 | ||||||
Receipts from rents and subsequent sales of such assets | 1,933 | 1,917 | ||||||
Other cash receipts from operating activities | 340,703 | 273,147 | ||||||
Classes of cash payments | ||||||||
Payments to suppliers for goods and services | (2,616,551 | ) | (2,577,925 | ) | ||||
Payments to and on behalf of employees | (404,957 | ) | (347,853 | ) | ||||
Payments to manufacture or acquire assets held for rental to others and subsequently held for sale | (4,711 | ) | (12,609 | ) | ||||
Other cash payments from operating activities | (69,312 | ) | (89,086 | ) | ||||
Interest paid | (145,848 | ) | (130,125 | ) | ||||
Interest received | 57,324 | 23,604 | ||||||
Income taxes (paid) refunded | (74,752 | ) | (62,819 | ) | ||||
Other inflows (outflows) of cash, net | 514 | 1,732 | ||||||
Net cash flow from (used in) operating activities | 149,286 | 945,753 | ||||||
|
|
|
| |||||
Cash flows from (used in) investing activities | ||||||||
Other cash payments to acquire interests in joint ventures | — | (118 | ) | |||||
Loans to related entities | — | (2,475 | ) | |||||
Proceeds from sales of property, plant and equipment | 1,225 | 28,139 | ||||||
Purchase of property, plant and equipment | (489,794 | ) | (667,603 | ) | ||||
Proceeds from sales of intangible assets | 122 | 311 | ||||||
Purchase of intangible assets | (2,895 | ) | (2,227 | ) | ||||
Proceeds from other long-term assets | 3,615 | 45,919 | ||||||
Purchase of other long-term assets | (216,433 | ) | (150,412 | ) | ||||
Dividends received | 543 | 24,768 | ||||||
Other inflows (outflows) of cash, net | (21,626 | ) | 103 | |||||
Cash flows from (used in) investing activities | (725,243 | ) | (723,595 | ) | ||||
|
|
|
| |||||
Cash flows from (used in) financing activities | ||||||||
Total proceeds from borrowings | 1,407,023 | 167,460 | ||||||
Proceeds from long-term borrowings | 885,649 | 9,960 | ||||||
Proceeds from short-term borrowings | 521,374 | 157,500 | ||||||
Repayments of borrowings | (409,217 | ) | (261,296 | ) | ||||
Payments of lease liabilities | (26,982 | ) | (32,251 | ) | ||||
Dividends paid | (282,690 | ) | (192,334 | ) | ||||
Other inflows (outflows) of cash, net | (6,251 | ) | (378 | ) | ||||
Cash flows from (used in) financing activities | 681,883 | (318,799 | ) | |||||
|
|
|
| |||||
Net increase (decrease) in cash and cash equivalents before effect of exchange rate changes | 105,926 | (96,641 | ) | |||||
Effect of exchange rate changes on cash and cash equivalents | (8,512 | ) | (12,752 | ) | ||||
|
|
|
| |||||
Net increase (decrease) of cash and cash equivalents | 97,414 | (109,393 | ) | |||||
Cash and cash equivalents, at the beginning of the period | 667,207 | 1,011,100 | ||||||
Cash and cash equivalents, at the end of the period | 764,621 | 901,707 | ||||||
The accompanying notes are an integral part of these interim consolidated financial statements.
11
Table of Contents
CELULOSA ARAUCO Y CONSTITUCION S.A. AND SUBSIDIARIES
Unaudited consolidated financial statements
June 30, 2023
Amounts in thousands of U.S. dollars, except as indicated
NOTES TO THE INTERIM CONSOLIDATED FINANCIAL STATEMENTS AS OF JUNE 30, 2023, AND DECEMBER 31, 2022
NOTE 1. PRESENTATION OF INTERIM CONSOLIDATED FINANCIAL STATEMENTS
Entity Information
Celulosa Arauco y Constitución S.A. and subsidiaries, (hereafter “Arauco” or the “Company”), tax identification number 93.458.000-1, is a closely held corporation, which was registered in the Securities Registry (the “Registry”) of the Chilean Commission for the Financial Market (“CMF”) as No. 042 on June 14, 1982. Additionally, the Company is registered as a non-accelerated filer in the Securities and Exchange Commission (SEC) of the United States of America.
The Company’s head office address is El Golf Avenue 150, 14th floor, Las Condes, Santiago, Chile.
Arauco is principally engaged in the production and sale of products related to the forestry and timber industries. Its main operations are focused on business areas of pulp and wood products.
As of June 30, 2023, Arauco is controlled by Empresas Copec S.A., tax identification number 90.690.000-9, which owns 99.999916% of Arauco, and is registered in the Securities Registry as No. 0028. Each of the above mentioned companies is subject to the oversight of the CMF.
Moreover, Empresas Copec S.A. is controlled by the public corporation AntarChile S.A., tax identification number 96.556.310-5, which owns 60.8208% of Empresas Copec S.A. Furthermore, the ultimate shareholders of AntarChile S.A. and, consequently, of Empresas Copec S.A., are Mr. Roberto Angelini Rossi, tax identification number 5.625.652-0, and Mrs. Patricia Angelini Rossi, tax identification number 5.765.170-9.
Arauco’s interim consolidated financial statements were prepared on a going concern basis.
Presentation of interim consolidated financial statements
The interim consolidated financial statements presented by Arauco are comprised by the following:
| • | Interim consolidated statements of financial position as of June 30, 2023, and December 31, 2022. |
| • | Interim consolidated statements of profit or loss for the periods ended June 30, 2023, and June 30, 2022. |
| • | Interim consolidated statements of comprehensive income for the periods ended June 30, 2023, and June 30, 2022. |
| • | Interim consolidated statements of changes in equity for the periods ended June 30, 2023, and June 30, 2022. |
| • | Interim consolidated statements of cash flows for the periods ended June 30, 2023, and June 30, 2022. |
| • | Explanatory disclosures (notes). |
12
Table of Contents
CELULOSA ARAUCO Y CONSTITUCION S.A. AND SUBSIDIARIES
Unaudited consolidated financial statements
June 30, 2023
Amounts in thousands of U.S. dollars, except as indicated
Period Covered by the interim consolidated financial statements
As of June 30, 2023 and December 31, 2022 and for the three and for the six month periods ended June 30, 2023 and 2022.
Date of Approval of the interim consolidated financial statements
These interim consolidated financial statements were approved by the Board of Directors of the Company (the “Board”) at the Extraordinary Meeting No. 694 on August 9, 2023.
Abbreviations used in this report:
IFRS - International Financial Reporting Standards
IASB - International Accounting Standards Board
IAS - International Accounting Standards
IFRIC - International Financial Reporting Standards Interpretations Committee
MU.S.$ - Millions of U.S. dollars
ThU.S.$ - Thousands of U.S. dollars
U.F. - Inflation index-linked units of account
ICMS - Tax movement of inventories and services (Brazil)
ThCLP$ - Thousands of Chilean pesos
ThR$ - Thousands of Brazilian real
Functional and Presentation Currency
Arauco and most of its subsidiaries determined the United States (“U.S.”) dollar as its functional currency since the majority of its revenues from sales of its products are derived from exports denominated in U.S. dollars, while their costs of sales are to a large extent related or indexed to the U.S. dollar.
For the pulp reportable segment, most of the sales are exports denominated in U.S. dollars and costs are mainly related to plantation costs which are settled in U.S. dollars.
For the wood reportable segment, although total sales include a mix of domestic and exports sales, prices of the products are established in U.S. dollars, which is also the case for the cost structure of the related raw materials.
In relation to the cost of sales, although labor and services costs are generally billed and paid in local currency, these costs are not as significant as the costs of raw materials, which are driven mainly by global markets and therefore, influenced mostly by the U.S. dollar.
The currency used to finance operations is mainly the U.S. dollar.
The presentation currency of the interim consolidated financial statements is the U.S. dollar. Figures on these interim consolidated financial statements are presented in thousands of U.S. dollar (ThU.S.$).
13
Table of Contents
CELULOSA ARAUCO Y CONSTITUCION S.A. AND SUBSIDIARIES
Unaudited consolidated financial statements
June 30, 2023
Amounts in thousands of U.S. dollars, except as indicated
Summary of significant accounting policies
a) Basis for preparation of the interim consolidated financial statements
These interim consolidated financial statements have been prepared in accordance with International Financial Reporting Standards (IFRS) as issued by the International Accounting Standards Board (IASB) and they represent the explicit and unreserved adoption of IFRS.
These interim consolidated financial statements have been prepared on a historical cost basis, except for biological assets and certain derivative financial instruments which are measured at revalued amounts or fair value at the end of each period as explained in the following significant accounting policies.
b) Critical accounting estimates and judgments
The preparation of these interim consolidated financial statements, in accordance with IFRS, requires management to make estimates and assumptions that affect the carrying amounts reported. These estimates are based on historical experience and various other assumptions that are considered to be reasonable. Actual results may differ from these estimates. Management believes that the accounting policies below are the critical judgments that have the most significant effect on the amounts recognized in the interim consolidated financial statements.
| • | Biological Assets |
The recovery of forest plantations is based on discounted cash flow models which means that the fair value of biological assets is calculated using cash flows from continuing operations on a discounted basis, based on our sustainable forest management plans and the estimated growth of forests.
The measurement of the fair value of the biological assets is determined using a discounted cash flow model. Our cash flow projections include significant judgments and assumptions relating to discount rates, estimated growth of the forests and sales margins. This valuation is performed on the basis of each identifiable farm block and for each type of tree. The main considerations used to calculate the valuation of forest plantations and a sensitivity analysis are presented in Note 20.
| • | Litigation and Contingencies |
Arauco and its subsidiaries are subject to certain litigation proceedings. Future impact on Arauco’s financial condition derived from such litigations is estimated by management, in collaboration with its legal advisors. Arauco applies judgment when interpreting the reports of its legal advisors who provide updated estimates of the legal contingencies at each reporting period and/or at each time a modification is determined to be necessary. For a description of current litigations see Note 18.
14
Table of Contents
CELULOSA ARAUCO Y CONSTITUCION S.A. AND SUBSIDIARIES
Unaudited consolidated financial statements
June 30, 2023
Amounts in thousands of U.S. dollars, except as indicated
c) Consolidation
The interim consolidated financial statements include all entities over which Arauco has the power to direct the relevant financial and operating activities. Subsidiaries are consolidated from the date on which control is obtained and up to the date that control ceases.
Specifically, a company controls an investee or subsidiary if, and only if, they have all of the following:
| (a) | power over the investee, i.e. the investor has existing rights which give it the ability to direct the relevant activities (the activities that significantly affect the investee’s returns); |
| (b) | exposure or rights to variable returns from involvement with the investee; and |
| (c) | the ability to use power over the investee to affect the amount of the investor’s returns. |
When Arauco holds less than the majority of the voting rights in a company in which it participates, it nonetheless has the power over said company - when these voting rights are enough - to grant it in practice the ability to unilaterally direct said company’s relevant activities. Arauco takes into account all facts and circumstances in order to assess if the voting rights in a company in which it participates are enough for granting it the power, including:
| a) | the size of the investor’s holding of voting rights relative to the size and dispersion of holdings of the other vote holders; |
| b) | potential voting rights held by the investor, other vote holders or other parties; |
| c) | rights arising from other contractual arrangements; and |
| d) | any additional facts and circumstances that indicate the investor has, or does not have, the current ability to direct the relevant activities at the time that decisions need to be made, including voting patterns at previous shareholders’ meetings. |
The Company will reevaluate whether or not it holds control of a company in which participates if the facts and circumstances indicate that changes have occurred in one or more of the three elements of control mentioned above.
Consolidation of an investee shall begin from the date the investor obtains control of the investee and cease when the investor loses control of the investee. An entity includes the income and expenses of an acquired or sold subsidiary in the interim consolidated financial statements from the date it gains control until the date when the entity ceases to control the subsidiary.
The profit or loss of each component of other comprehensive income is attributed to owners of the parent company and the non-controlling interest, as appropriate. Total comprehensive income is attributed to the owners of the parent company and non-controlling interests even if the results of the non-controlling interest have a deficit balance.
If a subsidiary uses accounting policies other than those adopted in the interim consolidated financial statements for transactions and other events in similar circumstances, appropriate adjustments are made to the interim consolidated financial statements of subsidiaries in order to ensure compliance with Arauco’s accounting policies.
15
Table of Contents
CELULOSA ARAUCO Y CONSTITUCION S.A. AND SUBSIDIARIES
Unaudited consolidated financial statements
June 30, 2023
Amounts in thousands of U.S. dollars, except as indicated
All intercompany transactions and unrealized gains and losses from subsidiaries have been fully eliminated from these interim consolidated financial statements and non-controlling interest is presented in the consolidated statement of financial position within equity.
The interim consolidated financial statements at the end of this period include the assets, liabilities, income and expenses of the subsidiaries shown in Note 13.
Certain consolidated subsidiaries have Brazilian real, Mexican pesos, Canadian dollars, Chilean pesos and Argentine pesos as their functional currencies. For consolidation purposes, the financial statements of those subsidiaries have been prepared in accordance with IFRS and translated as indicated in Note 1 (e) (ii).
A parent company will present non-controlling interests in the consolidated statement of financial position within equity, separately from the equity of the owners of the parent company.
d) Segments
Arauco has defined its reportable segments according to its business areas, based on the products and services sold to its customers. This definition is consistent with the management, resource allocation and performance assessment made by key personnel responsible for making relevant decisions related to the Company’s operation. The personnel responsible for making such decisions are the Executive Vice-president and the Chief Executive Officer who are the highest authorities for making decisions and are supported by the Vice-presidents of each segment.
Based on the aforementioned process, the Company has established reportable segments according to the following business units:
| • | Pulp |
| • | Wood products |
Refer to Note 24 for detailed financial information by reportable segment.
e) Functional currency
(i) Functional currency
All items in the financial statements of Arauco and each of its subsidiaries, associates and jointly controlled entities are measured using the currency of the primary economic environment in which each entity operates (the functional currency). The interim consolidated financial statements are presented in U.S. dollars, which is Arauco’s functional and presentation currency.
16
Table of Contents
CELULOSA ARAUCO Y CONSTITUCION S.A. AND SUBSIDIARIES
Unaudited consolidated financial statements
June 30, 2023
Amounts in thousands of U.S. dollars, except as indicated
(ii) Translation to the presentation currency of Arauco
For the purposes of presenting interim consolidated financial statements, assets and liabilities of Arauco’s operations in a functional currency different from Arauco’s are translated into U.S. dollars using exchange rates prevailing at the end of each reporting period. Income and expense items are translated at the average exchange rates for the period, unless exchange rates fluctuate significantly during that period, in which case the exchange rates at the dates of the transactions are used. Exchange rate differences are recognized in other comprehensive income and accumulated in “Other reserves” within equity.
(iii) Foreign Currency Transactions
Transactions in currencies other than the functional currency are recognized at the exchange rates prevailing at the dates of the transactions. Profit or loss on transactions in currencies other than the functional currency resulting from the settlement of such transactions and from the translation at year-end exchange rates of monetary assets and liabilities denominated in foreign currencies, are recognized in the consolidated statements of profit or loss, except those which are recorded in other comprehensive income and accumulated in equity such as cash flows hedging derivatives.
f) Cash and cash equivalents
Cash and cash equivalents include cash-on-hand, deposits held on demand at financial entities and other short-term highly liquid investments with an original maturity of three months or less and which are subject to an insignificant risk of changes in value.
g) Financial Instruments
Financial assets
Initial classification
Arauco classifies its financial assets into the following categories: fair value through profit or loss and amortized cost.
Arauco does not have financial assets at fair value through other comprehensive income.
The classification is based on the business model used to manage the assets and the characteristics of their contractual cash flows.
Management determines the classification of its financial assets at the time of their initial recognition.
17
Table of Contents
CELULOSA ARAUCO Y CONSTITUCION S.A. AND SUBSIDIARIES
Unaudited consolidated financial statements
June 30, 2023
Amounts in thousands of U.S. dollars, except as indicated
(a) Financial assets at fair value through profit or loss: these instruments are initially measured at fair value. Net income and losses, including any income from interest or dividends, are registered in the profit or loss of the period. Financial assets are classified in the category of financial assets at fair value through profit or loss when they are maintained for negotiation or designated in their initial registration as assets at fair value through profit or loss. A financial asset can be classified in this category if it is acquired mainly for the purposes of being sold in the short-term. Gain or losses of assets held for negotiations are registered in the consolidated statements of profit or loss, and the related interest is registered independently as financial income. Derivatives are classified as acquired for negotiation also unless they are designated as hedging instruments.
(b) Assets measured at amortized cost: they are initially registered at the fair value of the transaction, adding or subtracting the transaction costs that are directly attributable to the issuance of the financial asset or financial liability. The financial asset is maintained within a business model, the objective of which is to maintain financial assets to obtain contractual cash flows and the contractual conditions of the asset give rise, on specified dates, to cash flows that are solely payments of principal and interest (“SPPI”) over the amount of the outstanding principal.
Subsequent measurement
Financial instruments are subsequently measured at fair value through profit or loss or amortized cost.
The classification is based on two criteria: i) the Company’s business model for the management of financial instruments, and ii) whether the contractual cash flows related to the financial instruments represent “Solely Payments of Principal and Interest”.
a) Financial assets at fair value through profit or loss: these instruments are subsequently measured at fair value. Net earnings and losses, including income from interest and dividends, are registered as profits or losses for the period. These instruments are held for negotiation, and they are mainly acquired to be sold in the short-term. Derivatives are also classified as held for negotiation, unless they are registered as hedging instruments. Financial instruments of this type are classified as other current and non-current financial assets. They are subsequently valuated by determining their fair value, registering changes in value in the consolidated statements of profit or loss, in the items of financial income or financial costs.
b) Financial assets measured at amortized cost: These instruments are subsequently measured at amortized cost minus accumulated amortizations, using the effective interest method and adjusted by loss allowance and volume discounts, in the case of financial assets. Financial income and expenses, foreign exchange income and losses, and impairment are registered in results. Any earnings or losses due to initial or subsequent reductions of the value of the asset are registered in the statement of profit or loss of the period. Borrowings and receivables are non-derivative financial instruments with fixed or determinable payments not traded in any active market. They are registered at amortized cost, registering accrued conditions directly in profit or loss.
18
Table of Contents
CELULOSA ARAUCO Y CONSTITUCION S.A. AND SUBSIDIARIES
Unaudited consolidated financial statements
June 30, 2023
Amounts in thousands of U.S. dollars, except as indicated
Arauco measures accumulated losses in a quantity equivalent to expected credit losses during the lifelong commitment. Expected credit losses are based on contractual cash flow differences based on the allowance of each contract and the cash flows that Arauco expects. The difference is then discounted based on an approximation of the asset’s original effective interest rate. The asset’s carrying value is reduced as the allowance is used, and the loss is recognized in sales expenses in the consolidated statements of profit or loss. When an account receivable cannot be collected, it is regularized against the allowance account for receivables. Subsequent recoveries of previously impaired amounts are recognized as a debit in distribution cost.
Derivative financial instruments are explained in Note 1 h).
Financial liabilities
Arauco classifies its financial liabilities as follows: fair value through profit or loss, derivatives designated as effective hedging instruments and amortized costs.
Management determines the classification of its financial liabilities upon initial recognition. Financial liabilities are derecognized when the obligation is cancelled, settled or expired. When an existing financial liability is replaced with another of the same provider under substantially different terms, or where the terms of an existing liability are substantially amended, such exchange or modification is treated as a write-off of the original liability, with a new liability being recognized, and the difference between the respective carrying amounts is recognized in the consolidated statement of profit or loss.
Financial liabilities are initially recognized at fair value, and in the case of borrowings, they include the costs directly attributable to the transaction. The subsequent measurement of the financial liabilities depends on their classification:
Financial liabilities at fair value through profit or loss
Financial liabilities are included in the category of financial liabilities at fair value through profit or loss when they are held for trading or originally designated at fair value through profit or loss. Income and losses from liabilities held for trading are recognized in profit or loss. This category includes non-designated derivatives for hedging accounting.
Financial liabilities at amortized cost
Other financial liabilities are subsequently valued at their amortized cost based on the effective interest rate method. The amortized cost is calculated taking into account any premium or acquisition discount and includes the costs of transactions that are an integral part of the effective interest rate. This category includes commercial accounts payable and other accounts payable, lease liabilities, as well as the borrowings included in other current and non-current financial liabilities.
19
Table of Contents
CELULOSA ARAUCO Y CONSTITUCION S.A. AND SUBSIDIARIES
Unaudited consolidated financial statements
June 30, 2023
Amounts in thousands of U.S. dollars, except as indicated
h) Derivative financial instruments
(i) Derivative financial instruments - The Company enters into a variety of derivative financial instruments to manage its exposure to interest rate and foreign exchange rate risks, including foreign exchange forward contracts, interest rate swaps, currency swaps and zero cost collar contracts. The Company’s policy is to enter into derivatives contracts only for economic hedging purposes and there are no instruments with speculation objectives.
Derivatives are initially recognized at fair value at the date the derivative contracts are entered into and are subsequently re-measured at fair value at the end of each reporting period. The resulting gain or loss is recognized in profit or loss unless the derivative is designated as a hedging instrument and complies with hedge accounting requirements, in which event the timing of the recognition in profit or loss depends on the nature of the hedge relationship.
(ii) Embedded derivatives
The Company assesses the existence of embedded derivatives in financial instrument contracts. Derivatives embedded in non-derivative host contracts are treated as separate derivatives when they meet the definition of a derivative, their risks and characteristics are not closely related to those of the host contracts and the contracts are not measured at FVTPL as a whole. Arauco has determined that no embedded derivatives currently exist.
(iii) Hedge accounting
The Company designates certain hedging instruments as either fair value hedges or cash flow hedges.
At the inception of the hedge relationship, the entity documents the relationship between the hedging instrument and the hedged item, along with its risk management objectives and its strategy for undertaking various hedge transactions. Furthermore, at the inception of the hedge and on an ongoing basis, Arauco documents whether the hedging instrument is highly effective in offsetting changes in fair values or cash flows of the hedged item attributable to the hedged risk.
| • | Fair Value Hedges |
Changes in the fair value of derivatives that are designated and qualify as fair value hedges are recognized in profit or loss immediately, together with any changes in the fair value of the hedged asset or liability that are attributable to the hedged risk.
| • | Cash flow hedges |
The effective portion of changes in the fair value of derivatives that are designated and qualify as cash flow hedges is recognized in other comprehensive income and accumulated under the heading of cash flow hedging reserve. The gain or loss relating to the ineffective portion is recognized immediately in profit or loss, and is included in the Finance costs line item in the consolidated statement of profit or loss. Amounts previously recognized in other comprehensive income are reclassified to profit or loss in the periods when the hedged item affects profit or loss, in the same line as the recognized hedged item.
20
Table of Contents
CELULOSA ARAUCO Y CONSTITUCION S.A. AND SUBSIDIARIES
Unaudited consolidated financial statements
June 30, 2023
Amounts in thousands of U.S. dollars, except as indicated
Hedge accounting is discontinued when the Group revokes the hedging relationship, when the hedging instrument expires or is sold, terminated, or exercised, or when it no longer qualifies for hedge accounting. Any gain or loss recognized in other comprehensive income and accumulated in equity at that time remains in equity and is recognized when the forecasted transaction is ultimately recognized in profit or loss. When a forecasted transaction is no longer expected to occur, the gain or loss accumulated in equity is recognized immediately in profit or loss.
i) Inventories
Inventories are measured at the lower of cost or net realizable value. Cost is determined using the weighted average cost method.
The cost of finished and in process products includes the cost of raw materials, direct labor, other direct costs and manufacturing overhead expenses.
Initial costs of harvested wood are determined at fair value less cost of sale at the point of harvest.
Biological assets are transferred to inventories when forests are harvested.
Net realizable value is the estimated selling price in the ordinary course of business less the estimated costs of completion and the estimated costs necessary to make the sale.
When market conditions result in the production costs of a product exceeding its net realizable value, the inventories are written-down to their net realizable value. This write-down also includes obsolescence amounts resulting from slow moving inventories and technical obsolescence.
Spare parts that will be consumed in a period of less than twelve months are presented in inventories and recognized as an expense when they are consumed.
j) Non-current assets held for sale
Arauco classifies certain property, plant and equipment, intangible assets, investments in associates and disposal groups (groups of assets to be sold together with their directly associated liabilities) as non-current assets held for sale which as of the date of the consolidated statements of financial position are the subject of active sale efforts which are estimated to be highly probable.
These assets or disposal groups are measured at the lower of the carrying amount or the fair value less the costs to sell, and are no longer depreciated or amortized from the time they are classified as non-current assets held for sale.
21
Table of Contents
CELULOSA ARAUCO Y CONSTITUCION S.A. AND SUBSIDIARIES
Unaudited consolidated financial statements
June 30, 2023
Amounts in thousands of U.S. dollars, except as indicated
k) Business Combinations
Arauco applies the acquisition method to account for a business combination. This method requires the identification of the acquirer, determination of the acquisition date, recognition and measurement of the identifiable assets acquired, the liabilities assumed and any non-controlling interest in the acquiree; and recognition and measurement of goodwill or a gain from a bargain purchase. Identifiable assets acquired and liabilities assumed and any contingent liabilities in a business combination are initially measured at fair value at the acquisition date, except:
| • | deferred tax assets or liabilities, and assets or liabilities related to employee benefit arrangements are recognized and measured in accordance with IAS 12 Income taxes and IAS 19 respectively; |
| • | liabilities or equity instruments related to share-based payment arrangements of the acquiree or share-based payment arrangements of the Group entered into to replace share-based payment arrangements of the acquiree are measured in accordance with IFRS 3 at the acquisition date; and |
| • | assets (or disposal groups) that are classified as held for sale in accordance with IFRS 5 Non-current assets held for sale and discontinued operations are measured in accordance with such standard. |
Acquisition-related costs are accounted for as expenses when they are incurred, except for costs to issue debt or equity securities which are recognized in accordance with IAS 32 and IFRS 9.
A parent will present non-controlling interests in the consolidated statement of financial position within equity, separately from the equity of the owners of the parent company.
Changes in the ownership interest of a parent in its subsidiary that do not result in a loss of control are treated as equity transactions. Any difference between the amount by which non-controlling interests are adjusted and the fair value of the consideration paid or received is recognized directly in equity and attributed to owners of the parent company. No adjustment is made to the carrying amount of goodwill, neither gains nor losses are recognized in the statement of profit or loss.
Non-controlling interests that are present ownership interests and entitle their holders to a proportionate share of the entity’s net assets in the event of liquidation may initially be measured either at fair value or at the present ownership instruments’ proportionate share of non-controlling interests, in the recognized amounts of the acquirer’s identifiable net assets. The choice is made on a transaction-by-transaction basis.
Arauco measures the fair value of the acquired company in the business combination achieved in each stage (“step acquisition”), recognizing the effects of remeasurement of previously held equity in the acquiree in the consolidated statements of profit or loss.
22
Table of Contents
CELULOSA ARAUCO Y CONSTITUCION S.A. AND SUBSIDIARIES
Unaudited consolidated financial statements
June 30, 2023
Amounts in thousands of U.S. dollars, except as indicated
If the initial accounting for a business combination is not completed by the end of the reporting period in which the combination occurs, Arauco reports preliminary amounts for the items for which the accounting is incomplete. During the measurement period (no more than one year), these preliminary amounts are retrospectively adjusted, or additional assets or liabilities are recognized to reflect new information about facts and circumstances that existed at the acquisition date, if known, would have affected the amounts recognized at that date.
Business combinations that are under common control transactions are accounted using as a reference the pooling of interest. Under this method, assets and liabilities related to the transaction carry over the previous carrying values. Any difference between assets and liabilities included in the consolidation and the consideration transferred, is accounted in equity.
l) Investments in associates and joint arrangements
Associates are entities over which Arauco exercises significant influence, but not control. Significant influence is the power to participate in the financial and operating policy decisions of the investee but is not control or joint control over those policies.
Joint arrangement is defined as an entity over which there is joint control, which exists only when the decisions about strategic of activities, both financial and operational, require the unanimous consent of the parties sharing control.
Investments in joint arrangements are classified as a joint venture or as a joint operation. A joint operation is a joint arrangement in which the parties that have joint control of the arrangement (i.e. joint operators) have rights to the assets and obligations for the liabilities, relating to the arrangement. A joint venture is a joint arrangement in which the parties that have joint control of the arrangement (i.e., participants in a joint venture) have rights to the net assets of the arrangement.
Investments in associates and joint ventures are accounted for using the equity method and are initially recognized at cost. Their carrying amount is increased or decreased to recognize the portion corresponding to the statement of profit or loss or to the statement of comprehensive income. Dividends received are recognized by deducting the amount received from the carrying amount of the investment. Arauco’s investment in associates includes goodwill (both net of any accumulated impairment loss).
The investments in joint operations are recognized through consolidation of assets, liabilities and results of operations in relation to Arauco’s ownership percentage.
If the acquisition cost is lower than the fair value of the net assets of the associate acquired, the difference is recognized directly in statement of profit or loss in line other gains (losses).
Investments in associates and joint ventures are presented in the consolidated statement of financial position in the line item “Investments accounted for using equity method”.
23
Table of Contents
CELULOSA ARAUCO Y CONSTITUCION S.A. AND SUBSIDIARIES
Unaudited consolidated financial statements
June 30, 2023
Amounts in thousands of U.S. dollars, except as indicated
If Arauco’s share of losses of an associate or joint venture equals or exceeds its interest in the associate or joint venture, Arauco discontinues recognizing its share of further losses. After Arauco’s carrying value in the investee is reduced to zero, additional losses are provided for, and a liability is recognized, only to the extent that Arauco has incurred legal or constructive obligations or made payments on behalf of the associate or joint venture. If the associate or joint venture subsequently reports profits, Arauco resumes recognizing its share of those profits only after its share of the profits equals the share of losses not recognized.
m) Intangible assets other than goodwill
After initial recognition, intangible assets with finite useful lives are carried at cost less any accumulated amortization and impairment losses.
Amortization of an intangible asset with a finite useful life is allocated over the asset’s useful life. Amortization begins when the asset is available for use, i.e., when it is in the location and condition necessary for it to be capable of operating in the manner intended by management.
(i) Computer software
Computer software licenses are capitalized in terms of the costs incurred to acquire and make them compatible with existing software. These costs are amortized over the estimated useful lives of the software.
(ii) Water rights, easements and other rights
This item includes water rights, easements and other acquired rights recognized at historical cost which have indefinite useful lives as there is no foreseeable limit to the period over which these assets are expected to generate future cash flows. These rights are not amortized, but are tested for impairment at least annually, or when there is any indication that the assets might be impaired.
(iii) Customers and trade relations with customers
Correspond to the valuation over the time of the established relationship with customers, from the sale of products and services through its sales team. These relations will materialize in sales orders, which generate revenue and cost of sales. The useful life has been determined to be 15 years.
n) Goodwill
Goodwill is measured as the excess of the sum of the consideration transferred, the amount of any non-controlling interest in the acquired company, and the fair value of the acquirer’s previously held equity interest in the acquired company (if any) over the net of the acquisition-date amounts of the identifiable assets acquired and the liabilities assumed. If the total of consideration transferred, non-controlling interest recognized and previously held interest measured is less than the fair value of the net assets of the subsidiary acquired in the case of a bargain purchase, the difference is recognized directly in the statements of profit or loss.
Goodwill is not amortized but tested for impairment on annual basis.
24
Table of Contents
CELULOSA ARAUCO Y CONSTITUCION S.A. AND SUBSIDIARIES
Unaudited consolidated financial statements
June 30, 2023
Amounts in thousands of U.S. dollars, except as indicated
After initial recognition, goodwill is measured at cost less any accumulated impairment losses. For purposes of impairment testing, goodwill in a business combination is allocated as of the acquisition date to the cash generating unit or a group of cash generating units expected to benefit from the synergies of the combination irrespective of whether other assets or liabilities of the acquired company are allocated to those units or group of units.
The goodwill generated on acquisitions of foreign companies, is expressed in the functional currency of such foreign company.
Goodwill recognized in subsidiaries Arauco Canada Ltd. and Arauco do Brasil S.A., generated on subsidiaries acquisitions whose functional currency is different from the functional currency of the parent company and presentation of these interim consolidated financial statements, are translated into U.S. dollars at the closing exchange rate.
o) Property, Plant and Equipment
Property, plant and equipment are measured at cost less accumulated depreciation and accumulated impairment. The cost includes expenditures that are directly attributable to the acquisition of the assets.
Subsequent costs, such as improvements and replacement of components, are included in the asset’s carrying amount or recognized as a separate asset, as appropriate, only when it is probable that future economic benefits associated with the item will flow to Arauco and the cost of the item can be measured reliably. The carrying amount of the replaced part is derecognized from property, plant and equipment. All other repairs and maintenance costs are expensed in the period in which they are incurred.
Arauco capitalizes borrowing costs that are directly attributable to the acquisition, construction or production of qualifying assets as part of the cost of those assets, until the assets are ready for their intended use (See Note 12).
Depreciation is calculated by components using the straight-line method.
The useful lives of the items of property, plant and equipment is estimated according to the expected use of the assets. The residual values and useful lives of assets are reviewed and adjusted, if appropriate, annually.
p) Leases
Arauco applies IFRS 16 for recognizing leases in a manner consistent with contracts with similar features and akin circumstances.
At the beginning of a contract, Arauco assesses whether the contract is, or if it contains, a lease. A contract is, or contains, a lease if it transfers the right to control the use of a given asset for a certain period of time, in exchange for consideration.
As of the initial date for recording a lease, Arauco, as lessee, recognizes an asset by the right of use at cost.
25
Table of Contents
CELULOSA ARAUCO Y CONSTITUCION S.A. AND SUBSIDIARIES
Unaudited consolidated financial statements
June 30, 2023
Amounts in thousands of U.S. dollars, except as indicated
The cost of the asset for right of use comprises:
| • | The amount of the initial measurement of the lease liability. This measurement is at present value of the payments for leases that have not been disbursed as of that date. Payments for leases are discounted using the incremental interest rate for financial borrowings; |
| • | Payments for leases performed prior to or as of the initiation date, minus the lease incentives that have been received; |
| • | The initial direct costs incurred by the lessee; and |
| • | An estimation of the costs to be incurred by the lessee when dismantling and eliminating the underlying asset, restoring the location where the same is located, or restoring the underlying asset to the condition required under the terms and conditions of the lease, unless such costs are incurred in order to produce inventories. The lessee assumes obligations stemming from such costs either at the commencement date, or as a result of having used the underlying asset during a specific period. |
After the initial recognition date, Arauco, as lessee, recognizes its asset for right of use by applying the cost model, minus the accumulated depreciation and impairment losses, and adjusted for remeasurement of the liability for lease.
At the beginning, Arauco in the capacity of lessee, recognizes the lease liability at present value of the lease payments that have not been disbursed as of that date. Lease payments are discounted using the incremental interest rate for financial borrowings.
After the initial recognition date, Arauco, as lessee, recognizes a liability for leases by increasing the book value, so as to reflect the interest over the liability for lease, reducing the amount in order to reflect the payments for leases that have been performed and once again recognizing the book value, so as to reflect the remeasurement and also to reflect the essential fixed payments for leases that have been revised.
Arauco presents the assets by right of use in the consolidated statement of financial position and are further disclosed in Note 8. Likewise, lease liabilities are presented in the consolidated statement of financial position and further disclosed in Note 23.
IFRS 16 maintains substantially the accounting requirements of the lessor from IAS 17. Therefore, Arauco has continued to classify its leases as operational or financial, as the case may be.
Income from operating leases in which Arauco is the lessor are recognized on a straight-line basis during the term of the lease. Initial direct costs are added to the book value of the underlying asset and are recognized as expenses during the term of the lease on the same basis as the lease income. Leased assets are included within the statement of financial position, in property, plant and equipment. Arauco did not make adjustments with respect to assets that maintains as a lessor, as a result of IFRS 16 adoption.
When assets are leased under a financial lease, the present value of lease payments are recognized as financial accounts receivable. The difference between the gross receivable and the present value of such amount, is recognized as financial return on capital.
26
Table of Contents
CELULOSA ARAUCO Y CONSTITUCION S.A. AND SUBSIDIARIES
Unaudited consolidated financial statements
June 30, 2023
Amounts in thousands of U.S. dollars, except as indicated
Arauco evaluates the economic nature of the contracts that grant the right to use certain assets, for the purposes of determining the existence of implied leases. In these cases, the Company separates, at the beginning of the contract and based on its relative reasonable values, payments and considerations associated with the lease, from the rest of the elements incorporated into the contract.
q) Biological Assets
IAS 41 requires that biological assets, such as standing trees, are measured at fair value less cost to sell in the statement of financial position. Forestry plantations are accounted for at fair value less costs to sell, based on the presumption that fair values of these assets can be measured reliably.
The measurement of the fair value of the biological assets is determined using a discounted cash flow model. Our cash flow projections include significant judgments and assumptions relating to discount rates, estimated growth of the forests and sales margins. This valuation is performed on the basis of each identifiable farm block and for each type of tree.
The measurement of new forestry plantations made during the current year is made at cost, which corresponds to the fair value at that date. After twelve months, the valuation methodology used is that explained in the preceding paragraph.
Biological assets shown as current assets correspond to those forestry plantations that will be harvested in the short-term.
Biological growth and changes in fair value of forestry plantations are recognized in the line item “Other income” in the consolidated statements of profit or loss.
r) Income taxes
The tax liabilities are recognized in the consolidated financial statements based on the determination of taxable income for the year and calculated using the tax rates in force in the countries where Arauco operates.
Deferred income tax is recognized using liability method, on the temporary differences arising between the tax bases of assets and liabilities and their carrying amounts in the consolidated annual accounts. Deferred income tax is determined using tax rates contained in laws adopted as of the date of the financial statements and that are expected to be applicable when the related deferred tax asset is realized, or the deferred income tax liability is settled.
Deferred taxes are recognized in accordance with the standards established in IAS 12 - Income Tax.
The goodwill arising on business combinations does not give rise to deferred tax.
The deferred tax assets and tax credits are generally recognized for all deductible temporary differences to the extent that it is probable that future taxable profit will be available against which those deductible temporary differences can be utilized.
27
Table of Contents
CELULOSA ARAUCO Y CONSTITUCION S.A. AND SUBSIDIARIES
Unaudited consolidated financial statements
June 30, 2023
Amounts in thousands of U.S. dollars, except as indicated
s) Provisions
Provisions are recognized when the Company has a present obligation, legal or constructive, as a result of past events, under which, it is probable that an outflow of resources will be required to settle the obligation; and when a reliable estimate can be made of the amount of the obligation. The amount recognized as a provision is the best estimate of the consideration required to settle the present obligation at the end of the reporting period.
t) Revenue recognition
Revenues are valued at fair value of the consideration received or to be received, derived from them. Arauco analyses and takes under consideration all relevant facts and circumstances to apply the five-step model established under IFRS 15 to customer contracts: (i) identify the contract, (ii) identify the performance obligations, (iii) determine the transaction price, (iv) allocate the transaction price, and (v) recognize revenue. Additionally, Arauco evaluates the incremental costs of obtaining a contract and the costs incurred to comply with a contract. Arauco recognizes revenues when the steps established in IFRS have been satisfactorily complied with.
Accounts receivable are recognized when control over goods or services has been transferred to the customer, because at this point of the time collection is unconditional and the passage of time is only needed to receive payment.
(i) Revenue recognition from the Sale of Goods
Revenue from the sale of goods is recognized when Arauco has transferred to the buyer the significant risks and rewards of ownership of the committed goods, when the amount of revenue can be reliably measured, when Arauco does not retain any managerial involvement over the goods sold and when it is probable that the economic benefits associated with the transaction will flow to Arauco and the costs incurred in respect of the transaction can be measured reliably. Revenue from the sale of goods are recognized when there is no obligation unsatisfied that could affect the customer’s acceptance of the product. The delivery is effective when the products are sent to the specific location, the risks of obsolescence and loss have been transferred to the customer and when Arauco has objective evidence that all acceptance criteria have been satisfied.
Sales are recognized in terms of the price agreed to in the sales contract, less any volume discounts and estimated product returns at the date of the sale. There is no significant financing component given that receivables from sales are collected within a short period, which is in line with market practices.
The structure for recognizing revenue from export sales is based on the 2010 Incoterms, which are the official rules for the interpretation of commercial terms issued by the International Chamber of Commerce.
The main Incoterms used by Arauco are the following:
“CFR (Cost and freight)”, where the company bears all costs including main transportation, until the products arrives at its port of destination. The risk is transferred to the purchaser once the products have been loaded onto the vessel, in the country of origin.
28
Table of Contents
CELULOSA ARAUCO Y CONSTITUCION S.A. AND SUBSIDIARIES
Unaudited consolidated financial statements
June 30, 2023
Amounts in thousands of U.S. dollars, except as indicated
“CIF (Cost Insurance & Freight)”, where the Company organizes and pays for external freight services and some other expenses. Arauco is no longer responsible for the products once they have been delivered to the ocean carrier company.
(ii) Revenue recognition from Rendering of Services
Revenue from the rendering of services is recognized as long as the performance obligation have been satisfied.
Revenue is recognized considering the stage of completion of the transaction at the date of the reporting period, when Arauco has the enforceable right of payment from the rendering of the services.
There is no significant financing component, given that sales are made with a reduced average collection period, which is in line with market practice.
Arauco mainly provides power supply services which are transacted principally in the spot market of the Sistema Eléctrico Nacional (SEN) (“National Electrical System”). According to current regulations, the prices on that market called “Marginal Costs” are calculated by the Coordinador Eléctrico Nacional (CEN) (“National Electrical Coordinator”) and are generally recognized in the period in which the services are rendered.
Electrical power is generated as a by-product of the pulp and wood process and is a complementary business to it, which is initially supplied to the group’s subsidiaries and any surplus is sold to the SEN.
Arauco provides other non-core services such as port services and pest control whose revenues are derived from fixed price service contracts are recognized considering the stage of completion of the services rendered at the date of reporting, generally during the period of the service contract on a straight-line basis over the term of the contract.
Revenues from reportable segments mentioned in Note 24 are measured in accordance with the policies indicated in the preceding paragraphs.
Revenues from inter-segment sales (which are made at market prices) are eliminated in the consolidated financial statements.
u) Minimum dividend
Article No. 79 of the Chilean Corporations Law states that, unless otherwise unanimously agreed by the shareholders, corporations must distribute annually at least 30% of net income for the current year as cash dividend to shareholders determined in proportion to their shares or in the proportion established in the by-laws for preferred shares, if any, except where necessary to absorb accumulated losses from prior years.
29
Table of Contents
CELULOSA ARAUCO Y CONSTITUCION S.A. AND SUBSIDIARIES
Unaudited consolidated financial statements
June 30, 2023
Amounts in thousands of U.S. dollars, except as indicated
The current policy is that an amount equivalent to the 40% of the distributable net income for each fiscal year will be distributed as dividends. Nevertheless, the Board of Directors may decide to distribute and pay dividends to the shareholders, to the extent that it expects the year to finalize with positive results and that the Company’s liquidity allows such distribution and payment.
v) Earning per share
Basic earnings per share are calculated by dividing the net profit for the period attributable to the parent company by the weighted average number of ordinary shares outstanding during the period, excluding the average number of shares in the Company held by a subsidiary, if such circumstance exists. Arauco has not performed any type of transaction with a potential dilutive effect that would cause diluted earnings per share to be different from basic earnings per share.
w) Impairment
Non-financial Assets
The recoverable amount of property, plant and equipment and other long-term assets with finite useful lives are measured whenever there are any circumstances indicating that the assets have to recognize an impairment loss. Among the circumstances to consider as evidence of impairment are significant declines in the assets’ market value, significant adverse changes in the technological environment, obsolescence or physical damages of assets and changes in the manner in which the asset is used or expected to be used). Arauco evaluates at the end of each reporting period whether there is any evidence of the indications above mentioned.
A previously recognized impairment loss is reversed if there has been a change in the estimates used to determine the recoverable amount however a reversal of an impairment loss shall not exceed the carrying amount that would have been determined (net of amortization or depreciation) had no impairment loss been recognized for the asset in prior years.
For the purposes of assessing impairment losses, assets are grouped at the lowest level for which there is identifiable cash flows separately for each cash-generating unit. Non-financial assets, other than goodwill, which had recognized an impairment loss, are reviewed at the end of each reporting period whether there are any circumstances indicating that an impairment loss previously recognized may no longer exists or has decreased.
“Cash-generating units” are the smallest identifiable groups of those cash inflows that are largely independent of the cash inflow from other assets or groups of assets.
Goodwill
Goodwill and intangible assets with indefinite useful life are tested annually for impairment or whenever circumstances indicate it. The recoverable amount of an intangible asset is the higher of its fair value less costs to sell and its value in use. An impairment loss is recognized whenever the carrying amount exceeds the recoverable amount.
30
Table of Contents
CELULOSA ARAUCO Y CONSTITUCION S.A. AND SUBSIDIARIES
Unaudited consolidated financial statements
June 30, 2023
Amounts in thousands of U.S. dollars, except as indicated
A cash-generating unit, for which goodwill has been allocated, is tested for impairment annually or more frequently when there are circumstances indicating that the unit may be impaired. If the recoverable amount of the cash-generating unit is less than its carrying amount, the impairment loss is allocated first to reduce the carrying amount of any goodwill allocated to the unit and then to other assets pro rata based on the carrying amount of each asset in the unit. Any impairment loss of goodwill is recognized directly in the consolidated statement of profit or loss. An impairment loss recognized for goodwill is not reversed in subsequent periods.
Goodwill is allocated to cash-generating units for impairment testing purposes. The allocation is made between cash-generating units or groups of cash generating units expected to benefit from the synergies of the combination.
Financial Assets
At the end of each reporting period, an assessment is performed in order to identify whether there is any objective evidence that a financial asset or a group of financial assets may have been impaired.
An allowance for doubtful accounts is established based on a measurement of expected losses using a simplified approach.
The allowance for doubtful accounts is measured as the difference between the carrying amount of receivables and the present value of estimated future cash flows. The carrying amount of the receivable is reduced through the use of the allowance. If the impairment loss decreases in later periods, it is reversed either directly or by adjusting the provision for doubtful accounts, with effect in profit or loss.
x) Employee Benefits
Arauco constitutes labor obligations for severance payable in all circumstances for certain of its employees with at least 5 years of work in the Company, based on the terms of the staff’s collective and individual bargaining agreements.
The related provision is an estimate of the years of service to be recognized as a future labor obligation liability, in accordance with contracts between Arauco and its employees and pursuant to actuarial valuation criteria for this type of liability. This post-employment benefit is considered a defined benefit plan.
The main factors considered for calculating the actuarial value of severance obligation for years of service are employee turnover, salary increases and life expectancy of the workers included in this benefit.
Actuarial gains and losses are recognized in other comprehensive income in the year they are incurred.
These obligations are related to post-employee benefits in accordance with current standards.
31
Table of Contents
CELULOSA ARAUCO Y CONSTITUCION S.A. AND SUBSIDIARIES
Unaudited consolidated financial statements
June 30, 2023
Amounts in thousands of U.S. dollars, except as indicated
y) Employee Vacations
Arauco recognizes the expense for employee vacation according to labor legislation in each country on an accrual basis.
This obligation is presented in line item “Trade and other current payables” in the consolidated statements of financial position.
z) Recent accounting pronouncements
a) Standards, interpretations and amendments that are mandatory for the first time for annual periods beginning on January 1, 2023:
Amendments and improvements | Content | Mandatory application | ||
IAS 1 and IAS 8 | To IAS 1, Practice statement 2 and IAS 8, aim to improve accounting policy disclosures and to help users of the financial statements to distinguish between changes in accounting estimates and changes in accounting policies. | January 1, 2023 | ||
| IAS 12 | Deferred tax related to assets and liabilities arising from a single transaction
Require companies to recognize deferred tax on transactions that, on initial recognition give rise to equal amounts of taxable and deduct able temporary differences. | January 1, 2023 | ||
| IAS 1 | Presentation of financial statements
clarifies that liabilities are classified as current or non-current depending on the rights that exist at the end of the reporting period. The classification is not affected by the entity’s expectations or events after the reporting date (for example, the receipt of a waiver or a breach of agreement). | January 1, 2023 | ||
| IAS 12 | International tax reform - pillar two model rules
These amendments give companies temporary relief from accounting for deferred taxes arising from the Organization for Economic Co-operation and Development’s (OECD) international tax reform. The amendments also introduce targeted disclosure requirements for affected companies. The deferred tax exemption and disclosure of the fact that the exception has been applied, is effective immediately. The other disclosure requirements are effective annual periods beginning on or after 1 January 2023. | January 1, 2023 | ||
The adoption of the standards, amendments and interpretations described in the table above do not have a significant impact on Arauco’s consolidated financial statements during its initial application period.
32
Table of Contents
CELULOSA ARAUCO Y CONSTITUCION S.A. AND SUBSIDIARIES
Unaudited consolidated financial statements
June 30, 2023
Amounts in thousands of U.S. dollars, except as indicated
b) Standards, interpretations and amendments, the application of which is not yet mandatory, which have not been adopted in advance:
Amendments and improvements | Content | Mandatory application | ||
| IAS 1 | Non-current liabilities with covenants
Clarify how conditions with which an entity must comply within twelve months after the reporting period affect the classification of a liability. | January 1, 2024 | ||
| IFRS 16 | Leases on sale and leaseback
include requirements for sale and leaseback transactions in IFRS 16 to explain how an entity accounts for a sale and leaseback after the date of the transaction. Sale and leaseback transactions where some or all the lease payments are variable lease payments that do not depend on an index or rate are most likely to be impacted. | January 1, 2024 | ||
| IAS 7 and IFRS 7 | Statements of cash flows and financial instruments
Require disclosures to enhance the transparency of supplier finance arrangements and their effects on a company’s liabilities, cash flows and exposure to liquidity risk. | January 1, 2024 | ||
Arauco estimates that the adoption of the standards, amendments and interpretations described in the table above will not have a significant impact on Arauco’s consolidated financial statements during its initial application period.
NOTE 2. ACCOUNTING POLICIES, CHANGES IN ACCOUNTING ESTIMATES
Changes to accounting policies
As of June 30, 2023, there had been no changes in the accounting policies with respect to the 2022 financial year.
Changes to accounting estimates
As of June 30, 2023, there had been no changes in the methodologies for calculating the accounting estimates with respect to the 2022 financial year.
NOTE 3. DISCLOSURE OF OTHER INFORMATION
a) Disclosure of information on Issued Capital
As of June 30, 2023, the shareholders composition according to the amount of shares owned was as follows:
Shareholders | Shares | % | ||||||
Empresas Copec S.A. | 120,474,249 | 99.99991616 | % | |||||
AntarChile S.A. | 101 | 0.00008384 | % | |||||
|
|
|
| |||||
| 120,474,350 | 100.00000000 | % | ||||||
|
|
|
| |||||
At the date of these interim consolidated financial statements the share capital of Arauco was ThU.S.$ 803,618.
100% of Capital corresponds to ordinary shares.
33
Table of Contents
CELULOSA ARAUCO Y CONSTITUCION S.A. AND SUBSIDIARIES
Unaudited consolidated financial statements
June 30, 2023
Amounts in thousands of U.S. dollars, except as indicated
| 06-30-2023 | 12-31-2022 | |||||||
Description of shares by type of capital in ordinary shares | 100% of Capital corresponds to ordinary shares | |||||||
Number of authorized shares by type of capital in ordinary Shares | 120,474,350 | 120,474,350 | ||||||
Nominal value of shares by type of capital in ordinary shares | | U.S.$ 6.6704 per share | | | U.S.$ 6.6704 per share | | ||
Amount of capital in shares by type of ordinary shares that constitute capital | ThU.S.$ 803,618 | ThU.S.$ 803,618 | ||||||
| 06-30-2023 | 12-31-2022 | |||||||
Number of shares issued and fully paid by type of capital in ordinary shares | 120,474,350 | 120,474,350 | ||||||
b) Dividends paid
On May 10, 2023, a dividend of ThU.S.$ 279,622 was paid according to the extraordinary dividend policy distribution of 50% of the distributable net profit after discounting the payment made in December 2022, which is detailed in the following paragraph.
In December 2022 a provisional dividend of ThU.S.$ 183,971 was paid with a charge to the profits of the year 2022, which represented 20% of the distributable net profit as of September 30, 2022.
In May 2022 a dividend of ThU.S.$ 192,132 was paid with a charge to the profits of the year 2021. In November 2021 a provisional dividend of ThU.S.$ 271,000 was paid with a charge to the profits of the same year.
The amount of ThU.S.$ 92,719 presented in the interim consolidated statement of changes in equity for the year ended December 31,2022, contains the minimum dividend provision of an additional and extraordinary 10% to be paid for the profits of the parent company of 2022, approved in April 2023. As of June 30, 2023, there was no minimum dividend provision for the 2023 losses.
See Note 26 for details.
As of June 30, 2023, ThU.S.$ 282,690 are shown in the line of dividends paid of the statements of cash flows (ThU.S.$ 192,334 as of June 30, 2023), of which ThU.S.$ 279,622 (ThU.S.$ 192,132 as of June 30, 2023) correspond to the dividends’ payment from the parent company.
Dividends paid detail, ordinary shares | ||
Dividends paid | Definitive dividend | |
Classes of shares for which there are dividends paid | Ordinary shares without series | |
Date of dividends paid | 05-10-2023 | |
Amount of dividends | ThU.S.$ 279,622 | |
Number of shares on which pay dividends | 120,474,350 | |
Dividend per shares | U.S.$ 2,321007 | |
Dividends paid detail, ordinary shares | ||
Dividends paid | Definitive dividend | |
Classes of shares for which there are dividends paid | Ordinary shares without series | |
Date of dividends paid | 12-14-2022 | |
Amount of dividends | ThU.S.$ 183,971 | |
Number of shares on which pay dividends | 120,474,350 | |
Dividend per shares | U.S.$ 1.527060 | |
34
Table of Contents
CELULOSA ARAUCO Y CONSTITUCION S.A. AND SUBSIDIARIES
Unaudited consolidated financial statements
June 30, 2023
Amounts in thousands of U.S. dollars, except as indicated
Dividends paid detail, ordinary shares | ||
Dividends paid | Definitive dividend | |
Classes of shares for which there are dividends paid | Ordinary shares without series | |
Date of dividends paid | 05-10-2022 | |
Amount of dividends | ThU.S.$ 192,132 | |
Number of shares on which pay dividends | 120,474,350 | |
Dividend per shares | U.S.$ 1.594799 |
c) Disclosure of Information on Reserves
Other reserves comprise reserves of exchange differences on translation, reserves of cash flow hedges and other reserves. Arauco does not have any restrictions associated with these reserves.
Reserves of exchange differences on translation
Reserves of exchange differences on translation correspond to exchange differences relating to the translation of the results and net assets of Arauco’s subsidiaries whose functional currency is other than Arauco’s presentation currency.
Reserves of cash flow hedges
The hedging reserve includes the cash flow hedge reserve and the costs of hedging reserve. The cash flow hedge reserve is used to recognize the effective portion of gains or losses on derivatives that are designated and qualify as cash flow hedges.
Reserve of Actuarial Losses in Defined Benefit Plans
This corresponds to changes in the present value of the obligation for defined benefits resulting from experience adjustments (the effect of the differences between the previous actuarial assumptions and the events that occurred within the context of the plan) and the effects of the changes in the actuarial assumptions.
Other reserves
This mainly corresponds to the share of other comprehensive income of investments in associates and joint ventures.
35
Table of Contents
CELULOSA ARAUCO Y CONSTITUCION S.A. AND SUBSIDIARIES
Unaudited consolidated financial statements
June 30, 2023
Amounts in thousands of U.S. dollars, except as indicated
d) Other items in the consolidated statements of profit or loss
The table below sets forth other income, other expenses, finance income, finance costs and share of profit (loss) of associates and joint ventures for the six-month periods ended June 30, 2023 and 2022 are as follows:
| January - June | April - June | |||||||||||||||
| 2023 | 2022 | 2023 | 2022 | |||||||||||||
| ThU.S.$ | ThU.S.$ | ThU.S.$ | ThU.S.$ | |||||||||||||
Classes of Other Income | ||||||||||||||||
Total Other Income | 234,776 | 171,816 | 159,180 | 89,053 | ||||||||||||
Gain from changes in fair value of biological assets (Note 20) | 108,687 | 130,564 | 56,065 | 76,860 | ||||||||||||
Net income from insurance compensation | 74,247 | 323 | 73,947 | 147 | ||||||||||||
Revenue from export promotion | 449 | 622 | 206 | 293 | ||||||||||||
Lease income | 6,589 | 2,051 | 4,494 | 865 | ||||||||||||
Gain on sales of assets | 5,135 | 29,558 | 2,480 | 3,750 | ||||||||||||
Access easement | 122 | — | 122 | — | ||||||||||||
Recovery of tax credits | 3,692 | — | 3,692 | — | ||||||||||||
Compensations received | 6,417 | — | 5,781 | — | ||||||||||||
Reversal of impairment loss assets | 6,562 | 1,750 | 1,262 | 1,261 | ||||||||||||
Reimbursement provisions (legal and others) | 11,026 | 241 | 1,109 | 241 | ||||||||||||
Other operating income | 11,850 | 6,707 | 10,022 | 5,636 | ||||||||||||
Classes of Other Expenses by function | ||||||||||||||||
Total Other Expenses by function | (247,597 | ) | (86,711 | ) | (38,618 | ) | (58,863 | ) | ||||||||
Depreciation | (694 | ) | — | (694 | ) | — | ||||||||||
Provision legal expenses | (6,703 | ) | (4,028 | ) | (4,393 | ) | (2,409 | ) | ||||||||
Impairmert provision for property, plant and equipment, provision for inventory obsolescence, withdrawals and others | (5,533 | ) | (6,090 | ) | (2,009 | ) | (3,565 | ) | ||||||||
Operating expenses related to staff restructuring or from plants stoppage or closed | (180,912 | ) | (21,445 | ) | (40,766 | ) | (19,515 | ) | ||||||||
Expenses related to projects | (3,578 | ) | (10,133 | ) | (2,635 | ) | (6,419 | ) | ||||||||
Loss of asset sales | (3,920 | ) | (4,816 | ) | (3,026 | ) | (3,116 | ) | ||||||||
Loss and repair of assets | (8,387 | ) | (10,553 | ) | (73 | ) | (10,535 | ) | ||||||||
Loss of forest due to fires | (20,025 | ) | (12,696 | ) | 22,843 | (2,341 | ) | |||||||||
Other Taxes | (11,413 | ) | (8,834 | ) | (4,945 | ) | (5,542 | ) | ||||||||
Research and development expenses | (2,056 | ) | (2,912 | ) | (886 | ) | (1,890 | ) | ||||||||
Fines, readjustments and interest | (683 | ) | (117 | ) | (78 | ) | (79 | ) | ||||||||
Loss of tax credits | (735 | ) | (167 | ) | (688 | ) | 71 | |||||||||
Other expenses | (2,958 | ) | (4,920 | ) | (1,268 | ) | (3,523 | ) | ||||||||
Classes of Finance Income | ||||||||||||||||
Total Finance Income | 50,959 | 28,794 | 28,182 | 15,463 | ||||||||||||
Finance income by mutual funds - term deposits | 44,441 | 26,215 | 24,998 | 13,868 | ||||||||||||
Finance income resulting from derivatives | — | 39 | — | — | ||||||||||||
Other finance income | 6,518 | 2,540 | 3,184 | 1,595 | ||||||||||||
Classes of Finance Costs | ||||||||||||||||
Total Finance Costs | (172,569 | ) | (93,210 | ) | (92,423 | ) | (46,191 | ) | ||||||||
Interest expense, Bank borrowings | (33,373 | ) | (7,899 | ) | (21,273 | ) | (4,300 | ) | ||||||||
Interest expense, Bonds | (105,834 | ) | (52,491 | ) | (53,543 | ) | (24,196 | ) | ||||||||
Interest expense resulting from derivatives | (8,780 | ) | (9,458 | ) | (5,426 | ) | (4,926 | ) | ||||||||
Interest expense for right-of-use | (6,670 | ) | (5,026 | ) | (3,544 | ) | (2,504 | ) | ||||||||
Other finance costs | (17,912 | ) | (18,336 | ) | (8,637 | ) | (10,265 | ) | ||||||||
Share of profit (loss) of associates and joint ventures accounted for using equity method | ||||||||||||||||
Total | 17,978 | 44,171 | 10,115 | 24,459 | ||||||||||||
Investments in associates | 1,947 | 4,777 | 1,765 | 2,345 | ||||||||||||
Investments in joint ventures | 16,031 | 39,394 | 8,350 | 22,114 | ||||||||||||
36
Table of Contents
CELULOSA ARAUCO Y CONSTITUCION S.A. AND SUBSIDIARIES
Unaudited consolidated financial statements
June 30, 2023
Amounts in thousands of U.S. dollars, except as indicated
The analysis of expenses by nature contained in these interim consolidated financial statements is presented below:
| January - June | April - June | |||||||||||||||
| 2023 | 2022 | 2023 | 2022 | |||||||||||||
Cost of sales (*) | ThU.S.$ | ThU.S.$ | ThU.S.$ | ThU.S.$ | ||||||||||||
Timber | 457,689 | 369,620 | 247,525 | 221,819 | ||||||||||||
Forestry labor costs and other services | 322,307 | 298,075 | 171,476 | 157,863 | ||||||||||||
Depreciation and amortization | 243,601 | 216,051 | 142,535 | 105,319 | ||||||||||||
Depreciation for right of use | 12,300 | 20,909 | 5,593 | 10,426 | ||||||||||||
Maintenance costs | 175,040 | 159,926 | 93,676 | 78,209 | ||||||||||||
Chemical costs | 323,616 | 366,555 | 165,131 | 188,548 | ||||||||||||
Sawmill costs | 57,702 | 63,637 | 31,649 | 35,009 | ||||||||||||
Other raw materials | 141,716 | 152,600 | 77,425 | 77,657 | ||||||||||||
Other indirect costs | 115,413 | 92,387 | 59,403 | 38,800 | ||||||||||||
Energy and fuel | 133,399 | 123,491 | 70,476 | 62,857 | ||||||||||||
Cost of electricity | 33,786 | 21,098 | 18,833 | 11,411 | ||||||||||||
Staff expenses | 213,090 | 214,616 | 111,926 | 107,897 | ||||||||||||
Total | 2,229,659 | 2,098,965 | 1,195,648 | 1,095,815 | ||||||||||||
| (*) | Total amount is comprised of the cost of inventory sales for ThU.S.$ 2,177,028 as of June 30, 2023 (ThU.S.$ 2,049,304 as of June 30, 2022) and the cost of rendering services for ThU.S.$ 52,631 as of June 30, 2023 (ThU.S.$ 49,661 as of June 30, 2022). |
| January - June | April - June | |||||||||||||||
| 2023 | 2022 | 2023 | 2022 | |||||||||||||
Distribution costs | ThU.S.$ | ThU.S.$ | ThU.S.$ | ThU.S.$ | ||||||||||||
Selling costs | 19,868 | 20,677 | 9,867 | 10,562 | ||||||||||||
Commissions | 6,478 | 7,002 | 3,364 | 3,281 | ||||||||||||
Insurance | 4,198 | 3,360 | 2,292 | 1,896 | ||||||||||||
Provision for doubtful accounts | 507 | (22 | ) | 31 | 174 | |||||||||||
Other selling costs | 8,685 | 10,337 | 4,180 | 5,211 | ||||||||||||
Shipping and freight costs | 313,252 | 468,904 | 162,333 | 245,043 | ||||||||||||
Port services | 31,030 | 35,906 | 15,982 | 20,657 | ||||||||||||
Freights | 251,513 | 401,358 | 129,780 | 207,018 | ||||||||||||
Depreciation for right of use | 551 | 883 | 276 | 352 | ||||||||||||
Other shipping and freight costs (internment, warehousing, stowage, customs and other costs) | 30,158 | 30,757 | 16,295 | 17,016 | ||||||||||||
Total | 333,120 | 489,581 | 172,200 | 255,605 | ||||||||||||
| January - June | April - June | |||||||||||||||
| 2023 | 2022 | 2023 | 2022 | |||||||||||||
Administrative expenses | ThU.S.$ | ThU.S.$ | ThU.S.$ | ThU.S.$ | ||||||||||||
Wages and salaries | 125,614 | 125,055 | 59,844 | 62,643 | ||||||||||||
Marketing, advertising, promotion and publications expenses | 6,435 | 8,506 | 3,232 | 4,630 | ||||||||||||
Insurances | 22,374 | 12,747 | 12,333 | 6,336 | ||||||||||||
Depreciation and amortization | 20,851 | 16,845 | 12,561 | 8,380 | ||||||||||||
Depreciation for right of use | 3,647 | 3,273 | 1,866 | 1,371 | ||||||||||||
Computer services | 20,605 | 21,765 | 13,651 | 16,233 | ||||||||||||
Lease of offices, other property and vehicles | 3,677 | 2,501 | 1,818 | 980 | ||||||||||||
Donations, contributions, scholarships | 4,805 | 4,083 | 2,812 | 1,985 | ||||||||||||
Fees (legal and technical advisors) | 18,217 | 14,299 | 9,944 | 7,854 | ||||||||||||
Property taxes, city permits and rights | 18,242 | 14,685 | 11,822 | 8,774 | ||||||||||||
Cleaning services, security services and transportation | 14,710 | 14,639 | 7,588 | 7,237 | ||||||||||||
Third-party variable services (maneuvers, logistics) | 20,284 | 25,310 | 9,022 | 12,065 | ||||||||||||
Basic services (electricity, telephone, water) | 4,106 | 3,336 | 1,984 | 1,471 | ||||||||||||
Maintenance and repair | 3,591 | 3,739 | 1,401 | 1,933 | ||||||||||||
Seminars, courses, training materials | 1,541 | 2,307 | 855 | 1,267 | ||||||||||||
Travels, clothing and safety equipment, environmental expenses, audits and others | 22,394 | 26,060 | 10,511 | 15,224 | ||||||||||||
Total | 311,093 | 299,150 | 161,244 | 158,383 | ||||||||||||
37
Table of Contents
CELULOSA ARAUCO Y CONSTITUCION S.A. AND SUBSIDIARIES
Unaudited consolidated financial statements
June 30, 2023
Amounts in thousands of U.S. dollars, except as indicated
NOTE 4. INVENTORIES
| 06-30-2023 | 12-31-2022 | |||||||
Components of inventory | ThU.S.$ | ThU.S.$ | ||||||
Raw materials | 229,152 | 199,174 | ||||||
Production supplies | 204,264 | 209,396 | ||||||
Work in progress | 84,630 | 70,625 | ||||||
Finished goods | 794,945 | 769,558 | ||||||
Spare parts | 256,333 | 221,258 | ||||||
Total inventories | 1,569,324 | 1,470,011 | ||||||
Inventories recognized as cost of sales as of June 30, 2023 were ThU.S.$ 2,177,028 (ThU.S.$ 2,049,304 as of June 30, 2022).
In order to have inventories recorded at net realizable value, inventories are subject of evaluations and obsolescence provision recognition as of June 30, 2023, a net decrease of inventories was recognized associated with a higher provision of ThU.S.$ 103,520 (ThU.S.$ 5,618 as of June 30, 2022). As of June 30, 2023, the amount of provision is ThU.S.$ 180,890 (ThU.S.$ 77,370 as of December 31, 2022).
As of June 30, 2023, there were inventory write-offs of ThU.S.$ 1,876 (ThU.S.$ 737 as of June 30, 2022) which are presented in the interim consolidated statements of profit or loss within Cost of sales.
The inventory obsolescence provision is calculated based on the sales conditions of products and age of inventory (inventory turnover).
As of the date of these interim consolidated financial statements, no inventories were pledged as security.
38
Table of Contents
CELULOSA ARAUCO Y CONSTITUCION S.A. AND SUBSIDIARIES
Unaudited consolidated financial statements
June 30, 2023
Amounts in thousands of U.S. dollars, except as indicated
NOTE 5. CASH AND CASH EQUIVALENTS
Cash and cash equivalents include cash on hand, bank checking account balances, time deposits and mutual funds. These are short-term highly liquid investments that are readily convertible to known amounts of cash and are subject to an insignificant risk of changes in value.
The investment objective of time deposits is to maximize the amounts of cash surpluses in the short-term. These instruments are permitted under Arauco’s Investment Policy which allows investing in fixed income securities. These instruments have a maturity of less than three months from the date of acquisition.
Arauco invests in local and international mutual funds in order to maximize the returns of cash surpluses denominated in Chilean pesos or in foreign currencies such as U.S. dollars or Euros. These instruments are permitted under Arauco’s Investment Policy.
As of the date of these interim consolidated financial statements, there are no amounts of cash and cash equivalents with restrictions on use.
| 06-30-2023 | 12-31-2022 | |||||||
Components of Cash and Cash Equivalents | ThU.S.$ | ThU.S.$ | ||||||
Cash on hand | 98 | 64 | ||||||
Balances with Banks | 266,235 | 298,513 | ||||||
Short-term deposits | 284,518 | 258,566 | ||||||
Mutual funds | 212,058 | 110,064 | ||||||
Repurchase agreements | 1,712 | — | ||||||
Total | 764,621 | 667,207 | ||||||
The risk classification of the Company’s mutual funds as of June 30, 2023 and December 31, 2022 is shown below.
| 06-30-2023 ThU.S.$ | 12-31-2022 ThU.S.$ | |||||||
AAAfm | 121,521 | 24,933 | ||||||
No classification | 90,537 | 85,131 | ||||||
Total Mutual Funds | 212,058 | 110,064 | ||||||
Changes in Financial Liabilities
| 06-30-2023 | ||||||||||||||||||
| Bank borrowings | Hedging liabilities | Bonds and promissory notes | Other financial liabilities, Total | |||||||||||||||
| ThU.S.$ | ThU.S.$ | ThU.S.$ | ThU.S.$ | |||||||||||||||
Opening balance January 1 | 940,677 | 76,686 | 4,513,459 | 5,530,822 | ||||||||||||||
| (+) Borrowings obtained | 875,029 | — | 531,994 | 1,407,023 | ||||||||||||||
(-) Borrowings paid | (384,831 | ) | 209 | (24,595 | ) | (409,217 | ) | |||||||||||
Cash flows | (-) Commissions paid | (473 | ) | — | (5,776 | ) | (6,249 | ) | ||||||||||
| �� | (-) Interest paid | (26,304 | ) | (14,458 | ) | (98,333 | ) | (139,095 | ) | |||||||||
(+) Accrued interest | 32,842 | 14,522 | 101,985 | 149,349 | ||||||||||||||
(+/-) Inflation adjustment | 9,336 | — | 118,093 | 127,429 | ||||||||||||||
(+/-) Changes in fair value | — | (25,075 | ) | — | (25,075 | ) | ||||||||||||
(+/-) Other movements | 14,520 | — | (501 | ) | 14,019 | |||||||||||||
Closing balance | 1,460,796 | 51,884 | 5,136,326 | 6,649,006 | ||||||||||||||
39
Table of Contents
CELULOSA ARAUCO Y CONSTITUCION S.A. AND SUBSIDIARIES
Unaudited consolidated financial statements
June 30, 2023
Amounts in thousands of U.S. dollars, except as indicated
| 12-31-2022 | ||||||||||||||||||
| Bank borrowings | Hedging liabilities | Bonds and promissory notes | Other financial liabilities, Total | |||||||||||||||
| ThU.S.$ | ThU.S.$ | ThU.S.$ | ThU.S.$ | |||||||||||||||
Opening balance January 1 | 991,956 | 296,316 | 4,426,033 | 5,714,305 | ||||||||||||||
| (+) Borrowings obtained | 318,357 | — | — | 318,357 | ||||||||||||||
(-) Borrowings paid | (347,459 | ) | (9,578 | ) | (40,940 | ) | (397,977 | ) | ||||||||||
Cash flows | (-) Commissions paid | (1,656 | ) | — | — | (1,656 | ) | |||||||||||
(-) Interest paid | (18,450 | ) | (37,141 | ) | (193,737 | ) | (249,328 | ) | ||||||||||
(+) Accrued interest | 22,679 | 37,039 | 194,200 | 253,918 | ||||||||||||||
(+/-) Inflation adjustment | (29,757 | ) | — | 120,091 | 90,334 | |||||||||||||
(+/-) Changes in fair value | — | (209,936 | ) | — | (209,936 | ) | ||||||||||||
(+/-) Other movements | 5,007 | (14 | ) | 7,812 | 12,805 | |||||||||||||
Closing balance | 940,677 | 76,686 | 4,513,459 | 5,530,822 | ||||||||||||||
| Lease liabilities | ||||||||||
| 06-30-2023 | 12-31-2022 | |||||||||
| ThU.S.$ | ThU.S.$ | |||||||||
Opening balance January 1 | 264,224 | 163,304 | ||||||||
Cash flows | (-) Borrowings paid | (26,982 | ) | (65,000 | ) | |||||
| (-) Interest paid | (6,753 | ) | (9,724 | ) | ||||||
(+) Accrued interest | 6,894 | 9,753 | ||||||||
(+/-) Inflation adjustment | 2,672 | 839 | ||||||||
(+) Increase due to new leases liabilities | 129,295 | 167,370 | ||||||||
(+/-) Other movements | 12,637 | (2,318 | ) | |||||||
Closing balance | 381,987 | 264,224 | ||||||||
40
Table of Contents
CELULOSA ARAUCO Y CONSTITUCION S.A. AND SUBSIDIARIES
Unaudited consolidated financial statements
June 30, 2023
Amounts in thousands of U.S. dollars, except as indicated
NOTE 6. INCOME TAXES
The tax rates applicable in the countries in which Arauco operates are 27% in Chile, 35% in Argentina, 30% in Mexico, 34% in Brazil, 25% in Uruguay and 21% in the United States (federal tax).
Deferred Tax Assets
The following table sets forth the deferred tax assets as of the dates indicated:
| 06-30-2023 | 12-31-2022 | |||||||
Deferred tax assets | ThU.S.$ | ThU.S.$ | ||||||
Deferred tax assets relating to provisions | 3,700 | 8,910 | ||||||
Deferred tax assets relating to accrued liabilities | 8,693 | 8,986 | ||||||
Deferred tax assets relating to post-employment benefits | 29,149 | 25,904 | ||||||
Deferred tax assets relating to property, plant and equipment | 50,752 | 45,919 | ||||||
Deferred tax assets relating to impairment provision | 14,738 | 13,517 | ||||||
Deferred tax assets relating to financial instruments | 62,574 | 53,347 | ||||||
Deferred tax assets relating to tax loss carryforward | 217,793 | 110,526 | ||||||
Deferred tax assets relating to biological assets | 583 | — | ||||||
Deferred tax assets relating to inventories | 41,108 | 20,942 | ||||||
Deferred tax assets relating to provisions for income | 8,855 | 9,941 | ||||||
Deferred tax assets relating to allowance for doubtful accounts | 2,545 | 2,472 | ||||||
Deferred tax assets relating to intangible revaluation | 1,034 | 1,466 | ||||||
Deferred tax assets relating to other deductible temporary differences | 37,044 | 25,777 | ||||||
Total deferred tax assets | 478,568 | 327,707 | ||||||
|
|
|
| |||||
Offsetting presentation | (459,183 | ) | (318,696 | ) | ||||
|
|
|
| |||||
Net effect | 19,385 | 9,011 | ||||||
|
|
|
| |||||
Certain subsidiaries of Arauco mainly in Chile, Brazil, Argentina and USA, as of the date of these interim consolidated financial statements, present tax losses for which we estimate that, given the projection of future profits, will allow the recovery of the deferred tax assets recorded. The total amount of these tax losses is ThU.S.$ 863,677 (ThU.S.$ 443,250 at December 31, 2022), which are mainly originated by operational and financial losses.
In addition, as of the closing date of these interim consolidated financial statements there are ThU.S.$ 269,582 (ThU.S.$ 125,391 at December 31, 2022) of non-recoverable tax losses and certain assets from subsidiaries in USA and from joint operations in Uruguay, for which deferred tax assets have not been recognized. The estimated recovery period exceeds the expiry date of such tax losses.
Deferred Tax Liabilities
The following table sets forth the deferred tax liabilities as of the dates indicated:
| 06-30-2023 | 12-31-2022 | |||||||
Deferred tax liabilities | ThU.S.$ | ThU.S.$ | ||||||
Deferred tax liabilities relating to property, plant and equipment | 1,367,387 | 1,415,173 | ||||||
Deferred tax liabilities relating to financial instruments | 47,593 | 33,749 | ||||||
Deferred tax liabilities relating to biological assets | 513,237 | 527,988 | ||||||
Deferred tax liabilities relating to inventory | 79,175 | 56,531 | ||||||
Deferred tax liabilities relating to prepaid expenses | 41,696 | 37,760 | ||||||
Deferred tax liabilities relating to intangible | 10,920 | 10,173 | ||||||
Deferred tax liabilities relating to other taxable temporary differences | 56,442 | 23,237 | ||||||
Total deferred tax liabilities | 2,116,450 | 2,104,611 | ||||||
|
|
|
| |||||
Offsetting presentation | (459,183 | ) | (318,696 | ) | ||||
|
|
|
| |||||
Net effect | 1,657,267 | 1,785,915 | ||||||
|
|
|
| |||||
41
Table of Contents
CELULOSA ARAUCO Y CONSTITUCION S.A. AND SUBSIDIARIES
Unaudited consolidated financial statements
June 30, 2023
Amounts in thousands of U.S. dollars, except as indicated
The effect of this period in current and deferred tax liabilities related to financial hedging instruments corresponds to a debit of ThU.S.$ 7,792 as of June 30, 2023 (credit of ThU.S.$ 41,248 as of June 30, 2022), which is presented net in reserves for cash flow hedges in the interim consolidated statement of changes in equity.
Reconciliation of deferred tax assets and liabilities
Deferred tax assets | Opening balance 01-01-2023 ThU.S.$ | Deferred tax income (expenses) ThU.S.$ | Deferred tax of items charged to equity ThU.S.$ | Increase (decrease) net exchange differences ThU.S.$ | Closing balance 06-30-2023 ThU.S.$ | |||||||||||||||
Deferred tax Assets relating to provisions | 8,910 | (5,477 | ) | — | 267 | 3,700 | ||||||||||||||
Deferred tax Assets relating to accrued liabilities | 8,986 | (307 | ) | — | 14 | 8,693 | ||||||||||||||
Deferred tax Assets relating to post-employment benefits | 25,904 | 2,106 | 1,153 | (14 | ) | 29,149 | ||||||||||||||
Deferred tax Assets relating to property, plant and equipment | 45,919 | 4,701 | — | 132 | 50,752 | |||||||||||||||
Deferred tax Assets relating to impairment provision | 13,517 | 468 | — | 753 | 14,738 | |||||||||||||||
Deferred tax Assets relating to financial instruments | 53,347 | 1,837 | 6,765 | 625 | 62,574 | |||||||||||||||
Deferred tax Assets relating to tax loss carryforward | 110,526 | 105,571 | — | 1,696 | 217,793 | |||||||||||||||
Deferred tax assets relating to biological assets | — | 583 | — | — | 583 | |||||||||||||||
Deferred tax Assets relating to inventories | 20,942 | 20,120 | — | 46 | 41,108 | |||||||||||||||
Deferred tax Assets relating to provisions for income | 9,941 | (1,045 | ) | — | (41 | ) | 8,855 | |||||||||||||
Deferred tax Assets relating to allowance for doubtful accounts | 2,472 | 71 | — | 2 | 2,545 | |||||||||||||||
Deferred tax Assets relating to intangible revaluation | 1,466 | (526 | ) | — | 94 | 1,034 | ||||||||||||||
Deferred tax Assets relating to other deductible temporary differences | 25,777 | 10,614 | — | 653 | 37,044 | |||||||||||||||
Total deferred tax assets | 327,707 | 138,716 | 7,918 | 4,227 | 478,568 | |||||||||||||||
Deferred tax liabilities | Opening balance 01-01-2023 ThU.S.$ | Deferred tax (income) expenses ThU.S.$ | Deferred tax of items charged to equity ThU.S.$ | Increase (decrease) net exchange differences ThU.S.$ | Closing balance 06-30-2023 ThU.S.$ | |||||||||||||||
Deferred tax liabilities relating to property, plant and equipment | 1,415,173 | (53,262 | ) | — | 5,476 | 1,367,387 | ||||||||||||||
Deferred tax liabilities relating to financial instruments | 33,749 | 14,871 | (1,027 | ) | — | 47,593 | ||||||||||||||
Deferred tax liabilities relating to biological assets | 527,988 | (20,822 | ) | — | 6,071 | 513,237 | ||||||||||||||
Deferred tax liabilities relating to inventory | 56,531 | 22,616 | — | 28 | 79,175 | |||||||||||||||
Deferred tax liabilities relating to prepaid expenses | 37,760 | 3,920 | — | 16 | 41,696 | |||||||||||||||
Deferred tax liabilities relating to intangible | 10,173 | 157 | — | 590 | 10,920 | |||||||||||||||
Deferred tax liabilities relating to other taxable temporary differences | 23,237 | 32,406 | — | 799 | 56,442 | |||||||||||||||
Total deferred tax liabilities | 2,104,611 | (114 | ) | (1,027 | ) | 12,980 | 2,116,450 | |||||||||||||
Deferred tax assets | Opening balance 01-01-2022 ThU.S.$ | Deferred tax income (expenses) ThU.S.$ | Deferred tax of items charged to equity ThU.S.$ | Increase (decrease) net exchange differences ThU.S.$ | Closing balance 12-31-2022 ThU.S.$ | |||||||||||||||
Deferred tax Assets relating to provisions | 5,730 | 3,051 | — | 129 | 8,910 | |||||||||||||||
Deferred tax Assets relating to accrued liabilities | 8,257 | 716 | — | 13 | 8,986 | |||||||||||||||
Deferred tax Assets relating to post-employment benefits | 19,738 | 745 | 5,403 | 18 | 25,904 | |||||||||||||||
Deferred tax Assets relating to property, plant and equipment | 32,480 | 13,439 | — | — | 45,919 | |||||||||||||||
Deferred tax Assets relating to impairment provision | 8,564 | 4,664 | — | 289 | 13,517 | |||||||||||||||
Deferred tax Assets relating to financial instruments | 108,910 | (8,024 | ) | (47,883 | ) | 344 | 53,347 | |||||||||||||
Deferred tax Assets relating to tax loss carryforward | 24,972 | 83,930 | — | 1,624 | 110,526 | |||||||||||||||
Deferred tax Assets relating to inventories | 18,793 | 2,120 | — | 29 | 20,942 | |||||||||||||||
Deferred tax Assets relating to provisions for income | 19,323 | (9,408 | ) | — | 26 | 9,941 | ||||||||||||||
Deferred tax Assets relating to allowance for doubtful accounts | 4,625 | (2,155 | ) | — | 2 | 2,472 | ||||||||||||||
Deferred tax Assets relating to intangible revaluation | 2,301 | (1,013 | ) | — | 178 | 1,466 | ||||||||||||||
Deferred tax Assets relating to tax credits | 8,996 | (8,996 | ) | — | — | — | ||||||||||||||
Deferred tax Assets relating to other deductible temporary differences | 24,328 | 647 | — | 802 | 25,777 | |||||||||||||||
Total deferred tax assets | 287,017 | 79,716 | (42,480 | ) | 3,454 | 327,707 | ||||||||||||||
42
Table of Contents
CELULOSA ARAUCO Y CONSTITUCION S.A. AND SUBSIDIARIES
Unaudited consolidated financial statements
June 30, 2023
Amounts in thousands of U.S. dollars, except as indicated
Deferred tax liabilities | Opening balance 01-01-2022 ThU.S.$ | Deferred tax (income) expenses ThU.S.$ | Deferred tax of items charged to equity ThU.S.$ | Increase (decrease) net exchange differences ThU.S.$ | Closing balance 12-31-2022 ThU.S.$ | |||||||||||||||
Deferred tax liabilities relating to property, plant and equipment | 1,281,546 | 130,377 | — | 3,250 | 1,415,173 | |||||||||||||||
Deferred tax liabilities relating to financial instruments | 25,334 | 5,712 | 2,704 | (1 | ) | 33,749 | ||||||||||||||
Deferred tax liabilities relating to biological assets | 605,166 | (80,917 | ) | — | 3,739 | 527,988 | ||||||||||||||
Deferred tax liabilities relating to inventory | 46,336 | 10,272 | — | (77 | ) | 56,531 | ||||||||||||||
Deferred tax liabilities relating to prepaid expenses | 38,088 | (337 | ) | — | 9 | 37,760 | ||||||||||||||
Deferred tax liabilities relating to intangible | 12,511 | (2,648 | ) | — | 310 | 10,173 | ||||||||||||||
Deferred tax liabilities relating to other taxable temporary differences | 18,204 | 4,520 | — | 513 | 23,237 | |||||||||||||||
Total deferred tax liabilities | 2,027,185 | 66,979 | 2,704 | 7,743 | 2,104,611 | |||||||||||||||
Temporary Differences
The following tables summarize the deductible and taxable temporary differences:
| 06-30-2023 | 12-31 - 2022 | |||||||||||||||
| Deductible | Taxable | Deductible | Taxable | |||||||||||||
| difference | difference | difference | difference | |||||||||||||
Detail of classes of deferred tax temporary differences | ThU.S.$ | ThU.S.$ | ThU.S.$ | ThU.S.$ | ||||||||||||
Deferred tax assets | 260,775 | — | 217,181 | — | ||||||||||||
Deferred tax assets - tax loss carryforward | 217,793 | — | 110,526 | — | ||||||||||||
Deferred tax liabilities | — | 2,116,450 | — | 2,104,611 | ||||||||||||
Total | 478,568 | 2,116,450 | 327,707 | 2,104,611 | ||||||||||||
| January - June | April - June | |||||||||||||||
| 2023 | 2022 | 2023 | 2022 | |||||||||||||
Detail of temporary difference income and loss amounts | ThU.S.$ | ThU.S.$ | ThU.S.$ | ThU.S.$ | ||||||||||||
Deferred tax assets | 33,145 | 19,462 | 18,930 | (616 | ) | |||||||||||
Deferred tax assets - tax loss carryforward | 105,571 | 27,962 | 22,705 | (15,056 | ) | |||||||||||
Deferred tax liabilities | 114 | (94,641 | ) | 19,126 | (37,470 | ) | ||||||||||
Total | 138,830 | (47,217 | ) | 60,761 | (53,142 | ) | ||||||||||
Income Tax Expense
Income tax expense consists of the following:
| January - June | April - June | |||||||||||||||
| 2023 | 2022 | 2023 | 2022 | |||||||||||||
Income tax composition | ThU.S.$ | ThU.S.$ | ThU.S.$ | ThU.S.$ | ||||||||||||
Current income tax expense | (58,490 | ) | (188,418 | ) | (37,137 | ) | (109,562 | ) | ||||||||
Tax benefit arising from tax credit used to reduce current tax expense | 8,894 | 53,978 | 7,062 | 53,978 | ||||||||||||
Prior period current income tax adjustments | (10,539 | ) | 4,967 | (10,354 | ) | 7,911 | ||||||||||
Other current benefit tax (expenses) | 5,424 | 25,148 | 6,195 | 25,903 | ||||||||||||
Current tax expense, net | (54,711 | ) | (104,325 | ) | (34,234 | ) | (21,770 | ) | ||||||||
Deferred tax expense relating to origination and reversal of temporary differences | 33,259 | (75,179 | ) | 38,056 | (38,086 | ) | ||||||||||
Tax benefit arising from tax credits used to reduce deferred tax expense | 105,571 | 27,962 | 22,705 | (15,056 | ) | |||||||||||
Total deferred tax benefit (expense), net | 138,830 | (47,217 | ) | 60,761 | (53,142 | ) | ||||||||||
Total income tax benefit (expense) | 84,119 | (151,542 | ) | 26,527 | (74,912 | ) | ||||||||||
43
Table of Contents
CELULOSA ARAUCO Y CONSTITUCION S.A. AND SUBSIDIARIES
Unaudited consolidated financial statements
June 30, 2023
Amounts in thousands of U.S. dollars, except as indicated
The following table presents the current income tax expense detailed by foreign and domestic (Chile) companies at June 30, 2023 and 2022:
| January - June | April - June | |||||||||||||||
| 2023 | 2022 | 2023 | 2022 | |||||||||||||
| ThU.S.$ | ThU.S.$ | ThU.S.$ | ThU.S.$ | |||||||||||||
Foreign current income tax expense | (39,284 | ) | (52,429 | ) | (22,971 | ) | (23,668 | ) | ||||||||
Domestic current income tax expense | (15,427 | ) | (51,896 | ) | (11,263 | ) | 1,898 | |||||||||
Total current income tax expense | (54,711 | ) | (104,325 | ) | (34,234 | ) | (21,770 | ) | ||||||||
Foreign deferred tax benefit (expense) | 10,842 | 6,962 | 10,442 | 615 | ||||||||||||
Domestic deferred tax benefit (expense) | 127,988 | (54,179 | ) | 50,319 | (53,757 | ) | ||||||||||
Total deferred tax benefit (expense) | 138,830 | (47,217 | ) | 60,761 | (53,142 | ) | ||||||||||
Total income tax benefit (expense) | 84,119 | (151,542 | ) | 26,527 | (74,912 | ) | ||||||||||
Reconciliation of income tax expense from statutory tax rate to the effective tax rate.
The reconciliation of income tax expense is as follows:
| January – June | April - June | |||||||||||||||
| 2023 | 2022 | 2023 | 2022 | |||||||||||||
Reconciliation of income tax from statutory rate to effective tax rate | ThU.S.$ | ThU.S.$ | ThU.S.$ | ThU.S.$ | ||||||||||||
Statutory domestic (Chile) income tax rate | 27.0 | % | 27.0 | % | 27.0 | % | 27.0 | % | ||||||||
|
|
|
|
|
|
|
| |||||||||
Tax expense at statutory tax rate | 50,095 | (211,802 | ) | 19,884 | (102,266 | ) | ||||||||||
Tax effect of foreign tax rates | (396 | ) | (3,573 | ) | (555 | ) | (152 | ) | ||||||||
Tax effect of income exempt from taxation | 73,256 | 40,840 | 41,015 | 11,854 | ||||||||||||
Tax effect of not deductible expenses | (36,216 | ) | (6,163 | ) | (26,526 | ) | (3,386 | ) | ||||||||
Tax effect of a new evaluation of deferred tax assets | (509 | ) | 7,604 | (825 | ) | 2,983 | ||||||||||
Tax effect of tax provided in excess in prior periods | (10,539 | ) | 4,967 | (10,354 | ) | 7,911 | ||||||||||
Other tax rate effects (*) | 8,428 | 16,585 | 3,888 | 8,144 | ||||||||||||
Total adjustments to tax expense at applicable tax rate | 34,024 | 60,260 | 6,643 | 27,354 | ||||||||||||
Tax benefit (expense) at effective tax rate | 84,119 | (151,542 | ) | 26,527 | (74,912 | ) | ||||||||||
| (*) | This line includes mainly the tax effect generated by exchange differences on translation of tax bases. |
Current tax assets and liabilities
The current tax assets and liabilities balances are as follow:
| 06-30-2023 | 12-31-2022 | |||||||
Current tax assets | ThU.S.$ | ThU.S.$ | ||||||
Monthly Provisional Payments (MPP) | 38,193 | 21,974 | ||||||
Income tax receivable | 143,275 | 181,705 | ||||||
Provision tax income | (24,737 | ) | (25,341 | ) | ||||
Other tax receivables | 28,460 | 25,384 | ||||||
Total | 185,191 | 203,722 | ||||||
| 06-30-2023 | 12-31-2022 | |||||||
Current tax liabilities | ThU.S.$ | ThU.S.$ | ||||||
Provision tax income (First category) | 6,822 | 256,164 | ||||||
Monthly Provisional Payments (MPP) | (2,541 | ) | (231,846 | ) | ||||
Other tax payables | 4,411 | 2,551 | ||||||
Total | 8,692 | 26,869 | ||||||
44
Table of Contents
CELULOSA ARAUCO Y CONSTITUCION S.A. AND SUBSIDIARIES
Unaudited consolidated financial statements
June 30, 2023
Amounts in thousands of U.S. dollars, except as indicated
NOTE 7. PROPERTY, PLANT AND EQUIPMENT
| 06-30-2023 | 12-31-2022 | |||||||
| ThU.S.$ | ThU.S.$ | |||||||
Property, plant and equipment, net | ||||||||
Construction work in progress | 727,749 | 3,592,689 | ||||||
Land | 923,395 | 893,237 | ||||||
Buildings | 3,699,195 | 2,085,868 | ||||||
Plant and equipment | 4,096,161 | 2,760,925 | ||||||
Information technology equipment | 44,218 | 22,642 | ||||||
Fixtures and fittings | 11,499 | 11,017 | ||||||
Motor vehicles | 42,736 | 45,927 | ||||||
Other property, plant and equipment | 138,598 | 130,030 | ||||||
Total net | 9,683,551 | 9,542,335 | ||||||
Property, plant and equipment, gross | ||||||||
Construction work in progress | 727,749 | 3,592,689 | ||||||
Land | 923,395 | 893,237 | ||||||
Buildings | 6,232,340 | 4,510,660 | ||||||
Plant and equipment | 8,763,930 | 7,220,981 | ||||||
Information technology equipment | 133,972 | 108,645 | ||||||
Fixtures and fittings | 52,006 | 49,861 | ||||||
Motor vehicles | 98,958 | 98,126 | ||||||
Other property, plant and equipment | 155,432 | 147,277 | ||||||
Total gross | 17,087,782 | 16,621,476 | ||||||
Accumulated depreciation and impairment | ||||||||
Buildings | (2,533,145 | ) | (2,424,792 | ) | ||||
Plant and equipment | (4,667,769 | ) | (4,460,056 | ) | ||||
Information technology equipment | (89,754 | ) | (86,003 | ) | ||||
Fixtures and fittings | (40,507 | ) | (38,844 | ) | ||||
Motor vehicles | (56,222 | ) | (52,199 | ) | ||||
Other property, plant and equipment | (16,834 | ) | (17,247 | ) | ||||
Total | (7,404,231 | ) | (7,079,141 | ) | ||||
Description of Property, Plant and Equipment Pledged as Security for Liabilities
As of June 30, 2023, there are no significant assets pledged as collateral to be disclosed in these interim consolidated financial statements.
Disbursements commitments for the acquisition of property, plant and equipment and disbursements for property, plant and equipment under construction.
| 06-30-2023 | 12-31-2022 | |||||||
| ThU.S.$ | ThU.S.$ | |||||||
Amount committed for the acquisition of property, plant and equipment | 181,506 | 363,504 | ||||||
45
Table of Contents
CELULOSA ARAUCO Y CONSTITUCION S.A. AND SUBSIDIARIES
Unaudited interim consolidated financial statements
June 30, 2023
Amounts in thousands of U.S. dollars, except as indicated
Reconciliation of Property, Plant and Equipment
The following tables set forth the reconciliation of the carrying amount of property, plant and equipment as of June 30, 2023 and December 31, 2022:
Construction work in progress | Land | Buildings | Plant and equipment | IT equipment | Fixtures and fittings | Motor vehicles | Other property, plant and equipment | Total | ||||||||||||||||||||||||||||
Reconciliation of Property, Plant and Equipment | ThU.S.$ | ThU.S.$ | ThU.S.$ | ThU.S.$ | ThU.S.$ | ThU.S.$ | ThU.S.$ | ThU.S.$ | ThU.S.$ | |||||||||||||||||||||||||||
Opening balance 01-01-2023 | 3,592,689 | 893,237 | 2,085,868 | 2,760,925 | 22,642 | 11,017 | 45,927 | 130,030 | 9,542,335 | |||||||||||||||||||||||||||
Changes | ||||||||||||||||||||||||||||||||||||
Additions | 388,878 | 20,028 | 3,880 | 6,137 | 403 | 105 | 40 | 7,126 | 426,597 | |||||||||||||||||||||||||||
Disposals | (18 | ) | (71 | ) | (697 | ) | (4,689 | ) | (835 | ) | — | (108 | ) | — | (6,418 | ) | ||||||||||||||||||||
Withdrawals | — | (45 | ) | (148 | ) | (1,461 | ) | (9 | ) | — | (4 | ) | — | (1,667 | ) | |||||||||||||||||||||
Depreciation | — | — | (105,512 | ) | (194,030 | ) | (4,444 | ) | (1,599 | ) | (4,046 | ) | (676 | ) | (310,307 | ) | ||||||||||||||||||||
Impairment loss recognized in profit or loss | — | — | 28 | 5,232 | — | — | — | — | 5,260 | |||||||||||||||||||||||||||
Increase (decrease) through net exchange differences | 4,181 | 10,033 | 11,380 | 33,765 | 189 | 24 | 1,078 | 1,303 | 61,953 | |||||||||||||||||||||||||||
Reclassification of assets held for sale | — | 137 | — | — | — | — | — | — | 137 | |||||||||||||||||||||||||||
Increase (decrease) through transfers from construction in progress | (3,257,981 | ) | 76 | 1,704,396 | 1,512,131 | 26,272 | 1,952 | 12,339 | 815 | — | ||||||||||||||||||||||||||
Reclassification from lease to property, plant and equipment | — | — | — | 245 | — | — | — | — | 245 | |||||||||||||||||||||||||||
Increase (decrease) through transfers from leasing assets | — | — | — | (22,094 | ) | — | — | (12,490 | ) | — | (34,584 | ) | ||||||||||||||||||||||||
Total changes | (2,864,940 | ) | 30,158 | 1,613,327 | 1,335,236 | 21,576 | 482 | (3,191 | ) | 8,568 | 141,216 | |||||||||||||||||||||||||
Closing balance 06-30-2023 | 727,749 | 923,395 | 3,699,195 | 4,096,161 | 44,218 | 11,499 | 42,736 | 138,598 | 9,683,551 | |||||||||||||||||||||||||||
| Construction work in progress | Land | Buildings | Plant and equipment | IT Equipment | Fixtures and fittings | Motor vehicles | Other property, plant and equipment | Total | ||||||||||||||||||||||||||||
Reconciliation of Property, Plant and Equipment | ThU.S.$ | ThU.S.$ | ThU.S.$ | ThU.S.$ | ThU.S.$ | ThU.S.$ | ThU.S.$ | ThU.S.$ | ThU.S.$ | |||||||||||||||||||||||||||
Opening balance 01-01-2022 | 2,822,874 | 888,465 | 2,165,318 | 2,915,611 | 23,516 | 13,563 | 13,678 | 112,641 | 8,955,666 | |||||||||||||||||||||||||||
Changes | ||||||||||||||||||||||||||||||||||||
Additions | 1,076,619 | 2,003 | 13,230 | 26,102 | 815 | 808 | 462 | 18,115 | 1,138,154 | |||||||||||||||||||||||||||
Disposals | (18 | ) | (9,747 | ) | (1,571 | ) | (2,788 | ) | (221 | ) | (273 | ) | (62 | ) | (17 | ) | (14,697 | ) | ||||||||||||||||||
Withdrawals | (2,573 | ) | (391 | ) | (569 | ) | (5,319 | ) | (286 | ) | (15 | ) | (80 | ) | (351 | ) | (9,584 | ) | ||||||||||||||||||
Depreciation | — | — | (132,521 | ) | (305,572 | ) | (6,326 | ) | (3,071 | ) | (4,477 | ) | (1,144 | ) | (453,111 | ) | ||||||||||||||||||||
Impairment loss recognized in profit or loss | — | — | (25,611 | ) | (118,026 | ) | 4 | (521 | ) | — | — | (144,154 | ) | |||||||||||||||||||||||
Increase (decrease) through net exchange differences | 53 | 11,769 | 10,308 | 36,234 | 143 | 82 | 503 | 646 | 59,738 | |||||||||||||||||||||||||||
Reclassification of assets held for sale | — | 347 | 68 | (437 | ) | — | — | — | — | (22 | ) | |||||||||||||||||||||||||
Increase (decrease) through transfers from construction in progress | (304,266 | ) | 791 | 57,216 | 210,682 | 4,997 | 444 | 29,996 | 140 | — | ||||||||||||||||||||||||||
Reclassification from lease to property, plant and equipment | — | — | — | 4,438 | — | — | 5,907 | — | 10,345 | |||||||||||||||||||||||||||
Total changes | 769,815 | 4,772 | (79,450 | ) | (154,686 | ) | (874 | ) | (2,546 | ) | 32,249 | 17,389 | 586,669 | |||||||||||||||||||||||
Closing balance 12-31-2022 | 3,592,689 | 893,237 | 2,085,868 | 2,760,925 | 22,642 | 11,017 | 45,927 | 130,030 | 9,542,335 | |||||||||||||||||||||||||||
46
Table of Contents
CELULOSA ARAUCO Y CONSTITUCION S.A. AND SUBSIDIARIES
Unaudited interim consolidated financial statements
June 30, 2023
Amounts in thousands of U.S. dollars, except as indicated
The depreciation expense for the period ending June 30, 2023 and 2022 was as follows:
| January - June | April - June | |||||||||||||||
| 2023 | 2022 | 2023 | 2022 | |||||||||||||
Depreciation for the year | ThU.S.$ | ThU.S.$ | ThU.S.$ | ThU.S.$ | ||||||||||||
Cost of sales | 243,601 | 216,051 | 142,535 | 105,319 | ||||||||||||
Administrative expenses | 13,930 | 9,295 | 9,165 | 4,704 | ||||||||||||
Other expenses | 39,248 | 3,892 | 9,459 | 3,326 | ||||||||||||
Total | 296,779 | 229,238 | 161,159 | 113,349 | ||||||||||||
The useful lives of property, plant and equipment are estimated based on the expected use of the assets. The average useful lives by asset class are as follow:
| Years of Useful Life (Average) | ||||
Buildings | 58 | |||
Plant and equipment | 30 | |||
Information technology equipment | 8 | |||
Fixtures and fittings | 28 | |||
Motor vehicles | 7 | |||
Other property, plant and equipment | 14 | |||
See Note 12 for details of capitalized borrowing costs.
47
Table of Contents
CELULOSA ARAUCO Y CONSTITUCION S.A. AND SUBSIDIARIES
Unaudited interim consolidated financial statements
June 30, 2023
Amounts in thousands of U.S. dollars, except as indicated
NOTE 8. LEASES
Arauco acting as lessee
In the application of IFRS 16, Arauco chose not to apply the requirements to recognize a liability and an asset for right of use for leases which term ends within 12 months and for leases in which the underlying asset is of low value ThU.S.$ 5.
Lease liabilities and their maturity are presented in Notes 11 and 23.
Right of Use Assets
| 06-30-2023 | 12-31-2022 | |||||||
| ThU.S.$ | ThU.S.$ | |||||||
Property, plant and equipment by right of use, net | ||||||||
Land | 309,563 | 195,290 | ||||||
Buildings | 16,547 | 16,731 | ||||||
Plant and equipment | 63,705 | 66,709 | ||||||
Information technology equipment | 129 | 157 | ||||||
Motor vehicles | 14,997 | 24,437 | ||||||
Other property, plant and equipment | 4,054 | 3,163 | ||||||
Total net | 408,995 | 306,487 | ||||||
Property, plant and equipment by right of use, gross | ||||||||
Land | 355,792 | 230,231 | ||||||
Buildings | 33,420 | 32,610 | ||||||
Plant and equipment | 85,253 | 86,870 | ||||||
Information technology equipment | 471 | 630 | ||||||
Motor vehicles | 177,408 | 175,261 | ||||||
Other property, plant and equipment | 4,793 | 3,723 | ||||||
Total gross | 657,137 | 529,325 | ||||||
Accumulated depreciation and impairment by right of use | ||||||||
Land | (46,229 | ) | (34,941 | ) | ||||
Buildings | (16,873 | ) | (15,879 | ) | ||||
Plant and equipment | (21,548 | ) | (20,161 | ) | ||||
Information technology equipment | (342 | ) | (473 | ) | ||||
Motor vehicles | (162,411 | ) | (150,824 | ) | ||||
Other property, plant and equipment | (739 | ) | (560 | ) | ||||
Total | (248,142 | ) | (222,838 | ) | ||||
48
Table of Contents
CELULOSA ARAUCO Y CONSTITUCION S.A. AND SUBSIDIARIES
Unaudited interim consolidated financial statements
June 30, 2023
Amounts in thousands of U.S. dollars, except as indicated
Reconciliation of Property, Plant and Equipment by Right of Use
The following tables set forth the reconciliation of the carrying amount of property, plant and equipment by right of use as of June 30, 2023 and December 31, 2022:
| Land | Buildings | Plant and equipment | IT equipment | Motor vehicles | Other property, plant and equipment | Total | ||||||||||||||||||||||
Reconciliation of property, plant and equipment by right of use | ThU.S.$ | ThU.S.$ | ThU.S.$ | ThU.S.$ | ThU.S.$ | ThU.S.$ | ThU.S.$ | |||||||||||||||||||||
Opening balance 01-01-2023 | 195,290 | 16,731 | 66,709 | 157 | 24,437 | 3,163 | 306,487 | |||||||||||||||||||||
Changes | ||||||||||||||||||||||||||||
Additions | 123,663 | 2,528 | 32 | 25 | 1,767 | 1,282 | 129,297 | |||||||||||||||||||||
Withdrawals | (14,191 | ) | — | (242 | ) | — | — | — | (14,433 | ) | ||||||||||||||||||
Depreciation | (9,969 | ) | (2,743 | ) | (2,815 | ) | (65 | ) | (11,394 | ) | (225 | ) | (27,211 | ) | ||||||||||||||
Increase (decrease) through net exchange differences | 14,770 | 45 | 21 | 10 | 187 | — | 15,033 | |||||||||||||||||||||
Reclassification from lease to Property, plant and equipment | — | — | — | — | — | (245 | ) | (245 | ) | |||||||||||||||||||
Increase (decrease) through others | — | (14 | ) | — | 2 | — | 79 | 67 | ||||||||||||||||||||
Total changes | 114,273 | (184 | ) | (3,004 | ) | (28 | ) | (9,440 | ) | 891 | 102,508 | |||||||||||||||||
Closing balance 06-30-2023 | 309,563 | 16,547 | 63,705 | 129 | 14,997 | 4,054 | 408,995 | |||||||||||||||||||||
| Land | Buildings | Plant and equipment | IT equipment | Fixtures and fittings | Motor vehicles | Other property, plant and equipment | Total | |||||||||||||||||||||||||
Reconciliation of property, plant and equipment by right of use | ThU.S.$ | ThU.S.$ | ThU.S.$ | ThU.S.$ | ThU.S.$ | ThU.S.$ | ThU.S.$ | ThU.S.$ | ||||||||||||||||||||||||
Opening balance 01-01-2022 | 72,384 | 20,682 | 17,198 | 224 | 218 | 55,093 | 14,307 | 180,106 | ||||||||||||||||||||||||
Changes | ||||||||||||||||||||||||||||||||
Additions | 135,407 | 2,531 | 56,720 | 148 | — | 7,827 | 305 | 202,938 | ||||||||||||||||||||||||
Withdrawals | — | (1,101 | ) | (15 | ) | — | (203 | ) | (4 | ) | — | (1,323 | ) | |||||||||||||||||||
Depreciation | (12,660 | ) | (5,400 | ) | (7,174 | ) | (229 | ) | (15 | ) | (38,596 | ) | (1,334 | ) | (65,408 | ) | ||||||||||||||||
Increase (decrease) through net exchange differences | 159 | 22 | 8 | 14 | — | 117 | — | 320 | ||||||||||||||||||||||||
Reclassification from lease to Property, plant and equipment | — | — | — | — | — | — | (10,346 | ) | (10,346 | ) | ||||||||||||||||||||||
Increase (decrease) through others | — | (3 | ) | (28 | ) | — | — | — | 231 | 200 | ||||||||||||||||||||||
Total changes | 122,906 | (3,951 | ) | 49,511 | (67 | ) | (218 | ) | (30,656 | ) | (11,144 | ) | 126,381 | |||||||||||||||||||
Closing balance 12-31-2022 | 195,290 | 16,731 | 66,709 | 157 | — | 24,437 | 3,163 | 306,487 | ||||||||||||||||||||||||
The depreciation expense for the period ending June 30, 2023 and 2022 recognized in property, plant and equipment by right of use is as follows:
| January - June | April - June | |||||||||||||||
| 2023 | 2022 | 2023 | 2022 | |||||||||||||
Depreciation for the period | ThU.S.$ | ThU.S.$ | ThU.S.$ | ThU.S.$ | ||||||||||||
Cost of sales | 12,300 | 20,909 | 5,593 | 10,426 | ||||||||||||
Distribution costs | 551 | 883 | 276 | 352 | ||||||||||||
Administrative expenses | 3,647 | 3,273 | 1,866 | 1,371 | ||||||||||||
Total | 16,498 | 25,065 | 7,735 | 12,149 | ||||||||||||
Additionally, Arauco has recognized directly in the interim consolidated statement of profit or loss, the following leases excluded from right of use assets:
| January - June | April - June | |||||||||||||||
| 2023 | 2022 | 2023 | 2022 | |||||||||||||
| ThU.S.$ | ThU.S.$ | ThU.S.$ | ThU.S.$ | |||||||||||||
Expenses from payments of variable leases | 109,955 | 92,436 | 58,196 | 56,900 | ||||||||||||
Expenses from low value leases | 1,554 | 2,787 | 719 | 2,253 | ||||||||||||
Expenses from short-term leases | 25,260 | 28,445 | 5,428 | 16,485 | ||||||||||||
Total | 136,769 | 123,668 | 64,343 | 75,638 | ||||||||||||
49
Table of Contents
CELULOSA ARAUCO Y CONSTITUCION S.A. AND SUBSIDIARIES
Unaudited interim consolidated financial statements
June 30, 2023
Amounts in thousands of U.S. dollars, except as indicated
Arauco acting as lessor
Reconciliation of financial lease minimum payments:
| 06-30-2023 | ||||||||||||
| Gross | Interest | Present value | ||||||||||
Periods | ThU.S.$ | ThU.S.$ | ThU.S.$ | |||||||||
Less than one year | 13,702 | — | 13,702 | |||||||||
Between one and six years | 63,083 | 4,658 | 58,425 | |||||||||
More than six years | — | — | — | |||||||||
Total | 76,785 | 4,658 | 72,127 | |||||||||
| 12-31-2022 | ||||||||||||
| Gross | Interest | Present value | ||||||||||
Periods | ThU.S.$ | ThU.S.$ | ThU.S.$ | |||||||||
Less than one year | 5,067 | — | 5,067 | |||||||||
Between one and six years | 25,750 | 1,882 | 23,868 | |||||||||
More than six years | — | — | — | |||||||||
Total | 30,817 | 1,882 | 28,935 | |||||||||
Financial lease receivables are presented in the interim consolidated statements of financial position in line items “Trade and other current receivable” and “Trade and other non-current receivable” depending on their maturities stated above.
Arauco accounts for its lease contracts as financial leases. These lease contracts are for a term of less than six years at market interest rates and leased assets are forestry machinery and equipment. They also include an early termination option, under general and special conditions stipulated in each contract.
Arauco holds leases as lessee and lessor, described in the previous tables, for which there are no impairment contingent payments or restrictions to report.
NOTE 9. REVENUE
| January - June | April - June | |||||||||||||||
| 2023 | 2022 | 2023 | 2022 | |||||||||||||
Classes of revenue | ThU.S.$ | ThU.S.$ | ThU.S.$ | ThU.S.$ | ||||||||||||
Revenue from sales of goods | 2,789,360 | 3,572,958 | 1,385,618 | 1,841,879 | ||||||||||||
Revenue from rendering of services | 59,029 | 55,739 | 23,300 | 25,194 | ||||||||||||
Total | 2,848,389 | 3,628,697 | 1,408,918 | 1,867,073 | ||||||||||||
The reportable segments revenues by business area and by geographical area are presented in Note 24.
50
Table of Contents
CELULOSA ARAUCO Y CONSTITUCION S.A. AND SUBSIDIARIES
Unaudited interim consolidated financial statements
June 30, 2023
Amounts in thousands of U.S. dollars, except as indicated
NOTE 10. EMPLOYEE BENEFITS
Classes of Benefits and Expenses by Employee
| January - June | April - June | |||||||||||||||
| 2023 | 2022 | 2023 | 2022 | |||||||||||||
| ThU.S.$ | ThU.S.$ | ThU.S.$ | ThU.S.$ | |||||||||||||
Employee expenses | 384,242 | 349,594 | 196,350 | 174,759 | ||||||||||||
Wages and salaries | 371,399 | 342,047 | 189,455 | 170,724 | ||||||||||||
Severance indemnities | 12,843 | 7,547 | 6,895 | 4,035 | ||||||||||||
| 06-30-2023 | 12-31-2022 | |||||||
Discount rate | 3.02 | % | 3.02 | % | ||||
Inflation | 3.20 | % | 3.20 | % | ||||
Annual rate of wage growth | 5.22 | % | 5.22 | % | ||||
Mortality rate | RV-2014 | RV-2014 | ||||||
Sensitivities to assumptions | ThU.S.$ | |||
Discount rate | ||||
Increase in 100 bps | (7,353 | ) | ||
Decrease in 100 bps | 8,430 | |||
Wage growth rates | ||||
Increase in 100 bps | 7,254 | |||
Decrease in 100 bps | (6,408 | ) | ||
The following tables set forth the balances and the reconciliation of the present value of severance indemnities obligations as of June 30, 2023 and December 31, 2022:
| 06-30-2023 | 12-31-2022 | |||||||
| ThU.S.$ | ThU.S.$ | |||||||
Current | 8,488 | 7,571 | ||||||
Non-current | 98,633 | 87,689 | ||||||
Total | 107,121 | 95,260 | ||||||
Reconciliation of the present value of severance indemnities obligations | 06-30-2023 ThU.S.$ | 12-31-2022 ThU.S.$ | ||||||
Opening balance | 95,260 | 72,560 | ||||||
Current service cost | 3,856 | 6,832 | ||||||
Interest cost | 2,592 | 3,673 | ||||||
(Gains) losses from changes in actuarial assumptions | — | 727 | ||||||
Actuarial gains and losses arising from experience | 4,271 | 19,285 | ||||||
Benefits paid | (5,432 | ) | (7,561 | ) | ||||
Increase (decrease) for foreign currency exchange rates changes | 6,574 | (256 | ) | |||||
Closing balance | 107,121 | 95,260 | ||||||
The average staffing as of June 30, 2023 was 19,043 people.
51
Table of Contents
CELULOSA ARAUCO Y CONSTITUCION S.A. AND SUBSIDIARIES
Unaudited interim consolidated financial statements
June 30, 2023
Amounts in thousands of U.S. dollars, except as indicated
NOTE 11. BALANCES IN FOREIGN CURRENCY AND FOREIGN CURRENCY EXCHANGE RATE IMPACT IN PROFIT OR LOSS.
June 30, 2023 | U.S dollar ThU.S.$ | Euros ThU.S.$ | Brazilian real ThU.S.$ | Argentine pesos ThU.S.$ | Mexican pesos ThU.S.$ | Other currencies ThU.S.$ | Chilean pesos ThU.S.$ | U.F. ThU.S.$ | Total ThU.S.$ | |||||||||||||||||||||||||||
Assets | ||||||||||||||||||||||||||||||||||||
Current assets | ||||||||||||||||||||||||||||||||||||
Cash and cash equivalents | 380,234 | 2,843 | 81,498 | 103,777 | 30,056 | 5,219 | 160,994 | — | 764,621 | |||||||||||||||||||||||||||
Other current financial assets | 27,596 | — | — | 5 | — | — | — | — | 27,601 | |||||||||||||||||||||||||||
Other current non-financial assets | 99,885 | 558 | 18,591 | 8,441 | 5,980 | 8,499 | 151,851 | — | 293,805 | |||||||||||||||||||||||||||
Trade and other current receivables | 460,258 | 27,807 | 71,183 | 25,538 | 38,485 | 2,062 | 178,806 | 14,013 | 818,152 | |||||||||||||||||||||||||||
Accounts receivable due from related companies | 424 | — | — | 2,179 | — | — | 4,111 | — | 6,714 | |||||||||||||||||||||||||||
Current Inventories | 1,372,542 | — | 145,581 | — | 49,863 | — | 1,338 | — | 1,569,324 | |||||||||||||||||||||||||||
Current biological assets | 278,741 | — | 83,028 | — | — | — | — | — | 361,769 | |||||||||||||||||||||||||||
Current tax assets | 167,049 | — | 6,781 | — | 10,567 | 419 | 375 | — | 185,191 | |||||||||||||||||||||||||||
Non-current assets or disposal groups classified as held for sale | 2,786,729 | 31,208 | 406,662 | 139,940 | 134,951 | 16,199 | 497,475 | 14,013 | 4,027,177 | |||||||||||||||||||||||||||
Non-current assets or disposal groups classified as held for sale | 107 | — | 17 | — | 55 | — | — | — | 179 | |||||||||||||||||||||||||||
|
|
|
|
|
|
|
|
|
|
|
|
|
|
|
|
|
| |||||||||||||||||||
Total current assets | 2,786,836 | 31,208 | 406,679 | 139,940 | 135,006 | 16,199 | 497,475 | 14,013 | 4,027,356 | |||||||||||||||||||||||||||
|
|
|
|
|
|
|
|
|
|
|
|
|
|
|
|
|
| |||||||||||||||||||
Non-current assets | ||||||||||||||||||||||||||||||||||||
Other non-current financial assets | 115,179 | — | — | — | — | — | — | — | 115,179 | |||||||||||||||||||||||||||
Other non-current non-financial assets | 88,034 | — | 31,314 | 23 | 757 | 8 | 530 | — | 120,666 | |||||||||||||||||||||||||||
Trade and other non-current receivables | 25,456 | — | — | 503 | — | — | 3,349 | 58,020 | 87,328 | |||||||||||||||||||||||||||
Investments accounted for using equity method | 89,078 | 224,120 | 43,190 | — | — | — | 40,615 | — | 397,003 | |||||||||||||||||||||||||||
Intangible assets other than goodwill | 66,398 | — | 1,846 | — | 288 | — | — | — | 68,532 | |||||||||||||||||||||||||||
Goodwill | 41,455 | — | 14,499 | — | — | — | — | — | 55,954 | |||||||||||||||||||||||||||
Property, plant and equipment | 9,060,764 | — | 461,160 | — | 160,187 | — | 1,440 | — | 9,683,551 | |||||||||||||||||||||||||||
Right of use assets | 149,673 | — | 258,052 | — | 1,270 | — | — | — | 408,995 | |||||||||||||||||||||||||||
Non-current biological assets | 2,492,453 | — | 366,051 | — | — | — | — | — | 2,858,504 | |||||||||||||||||||||||||||
Deferred tax assets | 7,487 | — | 11,384 | — | 514 | — | — | — | 19,385 | |||||||||||||||||||||||||||
|
|
|
|
|
|
|
|
|
|
|
|
|
|
|
|
|
| |||||||||||||||||||
Total non-current assets | 12,135,977 | 224,120 | 1,187,496 | 526 | 163,016 | 8 | 45,934 | 58,020 | 13,815,097 | |||||||||||||||||||||||||||
|
|
|
|
|
|
|
|
|
|
|
|
|
|
|
|
|
| |||||||||||||||||||
Total assets | 14,922,813 | 255,328 | 1,594,175 | 140,466 | 298,022 | 16,207 | 543,409 | 72,033 | 17,842,453 | |||||||||||||||||||||||||||
|
|
|
|
|
|
|
|
|
|
|
|
|
|
|
|
|
| |||||||||||||||||||
June 30, 2023 | U.S dollar ThU.S.$ | Euros ThU.S.$ | Brazilian real ThU.S.$ | Argentine pesos ThU.S.$ | Mexican pesos ThU.S.$ | Other currencies ThU.S.$ | Chilean pesos ThU.S.$ | U.F. ThU.S.$ | Total ThU.S.$ | |||||||||||||||||||||||||||
Liabilities | ||||||||||||||||||||||||||||||||||||
Current liabilities | ||||||||||||||||||||||||||||||||||||
Other current financial liabilities | 634,523 | 71,454 | 12,914 | 81 | — | — | — | 59,389 | 778,361 | |||||||||||||||||||||||||||
Current lease liabilities | 10,583 | 90 | 29,858 | — | 2,117 | 43 | 3,643 | 3,247 | 49,581 | |||||||||||||||||||||||||||
Trade and other current payables | 150,206 | 26,932 | 100,467 | 46,922 | 19,778 | 13,990 | 279,922 | 44,271 | 682,488 | |||||||||||||||||||||||||||
Accounts payable to related companies | — | — | 2,339 | — | — | — | 15,497 | — | 17,836 | |||||||||||||||||||||||||||
Other short-term provisions | 5,653 | — | 264 | — | — | — | 56 | 1,445 | 7,418 | |||||||||||||||||||||||||||
Current tax liabilities | 1,768 | 3,869 | 2,928 | — | — | — | 127 | — | 8,692 | |||||||||||||||||||||||||||
Current provisions for employee benefits | — | — | — | — | — | — | 8,488 | — | 8,488 | |||||||||||||||||||||||||||
Other current non-financial liabilities | 4,746 | 59 | 29,652 | 4,911 | 9,804 | 6 | 7,147 | — | 56,325 | |||||||||||||||||||||||||||
|
|
|
|
|
|
|
|
|
|
|
|
|
|
|
|
|
| |||||||||||||||||||
Total liabilities, current | 807,479 | 102,404 | 178,422 | 51,914 | 31,699 | 14,039 | 314,880 | 108,352 | 1,609,189 | |||||||||||||||||||||||||||
|
|
|
|
|
|
|
|
|
|
|
|
|
|
|
|
|
| |||||||||||||||||||
Non-current liabilities | ||||||||||||||||||||||||||||||||||||
Other non-current financial liabilities | 3,630,034 | 371,278 | 192,457 | — | — | — | — | 1,676,876 | 5,870,645 | |||||||||||||||||||||||||||
Non-current lease liabilities | 116,759 | 69 | 196,797 | — | 2,471 | 151 | 1,352 | 14,807 | 332,406 | |||||||||||||||||||||||||||
Other non-current payables | — | — | 2,667 | — | — | — | 19,373 | — | 22,040 | |||||||||||||||||||||||||||
Non-current accounts payable to related companies | — | — | — | — | — | — | 6,731 | — | 6,731 | |||||||||||||||||||||||||||
Other long-term provisions | — | — | 4,268 | 26,451 | — | — | — | — | 30,719 | |||||||||||||||||||||||||||
Deferred tax liabilities | 1,537,254 | — | 112,752 | — | 7,261 | — | — | — | 1,657,267 | |||||||||||||||||||||||||||
Non-current provisions for employee benefits | — | — | — | — | 1,167 | — | 97,466 | — | 98,633 | |||||||||||||||||||||||||||
Other non-current non-financial liabilities | — | — | 71,616 | 8 | — | — | 7 | — | 71,631 | |||||||||||||||||||||||||||
|
|
|
|
|
|
|
|
|
|
|
|
|
|
|
|
|
| |||||||||||||||||||
Total non-current liabilities | 5,284,047 | 371,347 | 580,557 | 26,459 | 10,899 | 151 | 124,929 | 1,691,683 | 8,090,072 | |||||||||||||||||||||||||||
|
|
|
|
|
|
|
|
|
|
|
|
|
|
|
|
|
| |||||||||||||||||||
Total liabilities | 6,091,526 | 473,751 | 758,979 | 78,373 | 42,598 | 14,190 | 439,809 | 1,800,035 | 9,699,261 | |||||||||||||||||||||||||||
|
|
|
|
|
|
|
|
|
|
|
|
|
|
|
|
|
| |||||||||||||||||||
52
Table of Contents
CELULOSA ARAUCO Y CONSTITUCION S.A. AND SUBSIDIARIES
Unaudited interim consolidated financial statements
June 30, 2023
Amounts in thousands of U.S. dollars, except as indicated
| U.S. dollar | Euros | Brazilian real | Argentine pesos | Mexican pesos | Other currencies | Chilean pesos | U.F. | Total | ||||||||||||||||||||||||||||
December 31, 2022 | ThU.S.$ | ThU.S.$ | ThU.S.$ | ThU.S.$ | ThU.S.$ | ThU.S.$ | ThU.S.$ | ThU.S.$ | ThU.S.$ | |||||||||||||||||||||||||||
Assets | ||||||||||||||||||||||||||||||||||||
Current assets | ||||||||||||||||||||||||||||||||||||
Cash and cash equivalents | 395,254 | 4,884 | 103,829 | 97,859 | 28,564 | 26,793 | 10,024 | — | 667,207 | |||||||||||||||||||||||||||
Other current financial assets | 15,350 | — | — | — | — | — | — | — | 15,350 | |||||||||||||||||||||||||||
Other current non-financial assets | 18,727 | 115 | 17,745 | 5,333 | 2,979 | 7,406 | 153,754 | — | 206,059 | |||||||||||||||||||||||||||
Trade and other current receivables | 614,204 | 36,425 | 50,646 | 33,287 | 33,089 | 1,972 | 97,616 | 6,056 | 873,295 | |||||||||||||||||||||||||||
Accounts receivable due from related companies | — | — | — | 4,713 | — | — | 2,850 | — | 7,563 | |||||||||||||||||||||||||||
Current Inventories | 1,298,649 | — | 130,707 | — | 39,353 | — | 1,302 | — | 1,470,011 | |||||||||||||||||||||||||||
Current biological assets | 264,858 | — | 65,577 | — | — | — | — | — | 330,435 | |||||||||||||||||||||||||||
Current tax assets | 174,287 | — | 8,333 | 10,296 | 9,495 | 1,137 | 174 | — | 203,722 | |||||||||||||||||||||||||||
Non-current assets or disposal groups classified as held for sale | 2,781,329 | 41,424 | 376,837 | 151,488 | 113,480 | 37,308 | 265,720 | 6,056 | 3,773,642 | |||||||||||||||||||||||||||
Non-current assets or disposal groups classified as held for sale | 1,215 | — | 15 | — | 49 | — | — | — | 1,279 | |||||||||||||||||||||||||||
|
|
|
|
|
|
|
|
|
|
|
|
|
|
|
|
|
| |||||||||||||||||||
Total current assets | 2,782,544 | 41,424 | 376,852 | 151,488 | 113,529 | 37,308 | 265,720 | 6,056 | 3,774,921 | |||||||||||||||||||||||||||
|
|
|
|
|
|
|
|
|
|
|
|
|
|
|
|
|
| |||||||||||||||||||
Non-current assets | ||||||||||||||||||||||||||||||||||||
Other non-current financial assets | 63,321 | — | — | — | — | — | — | — | 63,321 | |||||||||||||||||||||||||||
Other non-current non-financial assets | 2,980 | — | 16,022 | 97 | 742 | 8 | 72,665 | — | 92,514 | |||||||||||||||||||||||||||
Trade and other non-current receivables | 5,880 | — | — | — | — | — | 3,434 | 23,360 | 32,674 | |||||||||||||||||||||||||||
Investments accounted for using equity method | 87,826 | 203,443 | 36,489 | — | — | — | 37,913 | — | 365,671 | |||||||||||||||||||||||||||
Intangible assets other than goodwill | 71,141 | — | 1,940 | — | 358 | — | — | — | 73,439 | |||||||||||||||||||||||||||
Goodwill | 41,408 | — | 13,392 | — | — | — | — | — | 54,800 | |||||||||||||||||||||||||||
Property, plant and equipment | 9,024,490 | — | 389,522 | — | 127,120 | — | 1,203 | — | 9,542,335 | |||||||||||||||||||||||||||
Right of use assets | 161,087 | — | 144,626 | — | 774 | — | — | — | 306,487 | |||||||||||||||||||||||||||
Non-current biological assets | 2,549,796 | — | 315,139 | — | — | — | — | — | 2,864,935 | |||||||||||||||||||||||||||
Deferred tax assets | 5,035 | — | 3,500 | — | 476 | — | — | — | 9,011 | |||||||||||||||||||||||||||
|
|
|
|
|
|
|
|
|
|
|
|
|
|
|
|
|
| |||||||||||||||||||
Total non-current assets | 12,012,964 | 203,443 | 920,630 | 97 | 129,470 | 8 | 115,215 | 23,360 | 13,405,187 | |||||||||||||||||||||||||||
|
|
|
|
|
|
|
|
|
|
|
|
|
|
|
|
|
| |||||||||||||||||||
Total assets | 14,795,508 | 244,867 | 1,297,482 | 151,585 | 242,999 | 37,316 | 380,935 | 29,416 | 17,180,108 | |||||||||||||||||||||||||||
|
|
|
|
|
|
|
|
|
|
|
|
|
|
|
|
|
| |||||||||||||||||||
| U.S. dollar | Euros | Brazilian real | Argentine pesos | Mexican pesos | Other currencies | Chilean pesos | U.F. | Total | ||||||||||||||||||||||||||||
December 31, 2022 | ThU.S.$ | ThU.S.$ | ThU.S.$ | ThU.S.$ | ThU.S.$ | ThU.S.$ | ThU.S.$ | ThU.S.$ | ThU.S.$ | |||||||||||||||||||||||||||
Liabilities | ||||||||||||||||||||||||||||||||||||
Current liabilities | ||||||||||||||||||||||||||||||||||||
Other current financial liabilities | 252,091 | 69,139 | 2,810 | 17 | — | — | — | 51,394 | 375,451 | |||||||||||||||||||||||||||
Current lease liabilities | 10,636 | 91 | 10,063 | — | 1,579 | 23 | 10,716 | 3,676 | 36,784 | |||||||||||||||||||||||||||
Trade and other current payables | 234,226 | 23,277 | 82,988 | 54,078 | 16,791 | 10,476 | 351,646 | 39,356 | 812,838 | |||||||||||||||||||||||||||
Accounts payable to related companies | 202 | — | — | — | — | — | 14,078 | — | 14,280 | |||||||||||||||||||||||||||
Other short-term provisions | 7,934 | — | 264 | — | — | — | — | 1,315 | 9,513 | |||||||||||||||||||||||||||
Current tax liabilities | 19,482 | 5,123 | 1,512 | — | 752 | — | — | — | 26,869 | |||||||||||||||||||||||||||
Current provisions for employee benefits | — | — | — | — | — | — | 7,571 | — | 7,571 | |||||||||||||||||||||||||||
Other current non-financial liabilities | 192,359 | 51 | 33,011 | 5,120 | 4,828 | 16 | 7,593 | — | 242,978 | |||||||||||||||||||||||||||
|
|
|
|
|
|
|
|
|
|
|
|
|
|
|
|
|
| |||||||||||||||||||
Total current liabilities | 716,930 | 97,681 | 130,648 | 59,215 | 23,950 | 10,515 | 391,604 | 95,741 | 1,526,284 | |||||||||||||||||||||||||||
|
|
|
|
|
|
|
|
|
|
|
|
|
|
|
|
|
| |||||||||||||||||||
Non-current liabilities | ||||||||||||||||||||||||||||||||||||
Other non-current financial liabilities | 3,637,416 | 386,186 | 67,080 | — | — | — | — | 1,064,689 | 5,155,371 | |||||||||||||||||||||||||||
Non-current lease liabilities | 120,656 | 110 | 91,206 | — | 1,659 | — | 549 | 13,260 | 227,440 | |||||||||||||||||||||||||||
Other non-current payables | — | — | 2,462 | — | — | — | 17,654 | — | 20,116 | |||||||||||||||||||||||||||
Non-current accounts payable to related companies | — | — | — | — | — | — | 6,731 | — | 6,731 | |||||||||||||||||||||||||||
Other long-term provisions | 1,677 | — | 12,512 | 26,517 | — | — | — | — | 40,706 | |||||||||||||||||||||||||||
Deferred tax liabilities | 1,681,957 | — | 97,822 | — | 6,136 | — | — | — | 1,785,915 | |||||||||||||||||||||||||||
Non-current provisions for employee benefits | — | — | — | — | 957 | — | 86,732 | — | 87,689 | |||||||||||||||||||||||||||
Other non-current non-financial liabilities | — | — | 69,849 | 10 | — | — | 13 | — | 69,872 | |||||||||||||||||||||||||||
|
|
|
|
|
|
|
|
|
|
|
|
|
|
|
|
|
| |||||||||||||||||||
Total non-current liabilities | 5,441,706 | 386,296 | 340,931 | 26,527 | 8,752 | — | 111,679 | 1,077,949 | 7,393,840 | |||||||||||||||||||||||||||
|
|
|
|
|
|
|
|
|
|
|
|
|
|
|
|
|
| |||||||||||||||||||
Total liabilities | 6,158,636 | 483,977 | 471,579 | 85,742 | 32,702 | 10,515 | 503,283 | 1,173,690 | 8,920,124 | |||||||||||||||||||||||||||
|
|
|
|
|
|
|
|
|
|
|
|
|
|
|
|
|
| |||||||||||||||||||
53
Table of Contents
CELULOSA ARAUCO Y CONSTITUCION S.A. AND SUBSIDIARIES
Unaudited interim consolidated financial statements
June 30, 2023
Amounts in thousands of U.S. dollars, except as indicated
| 06-30-2023 | 12-31-2022 | |||||||||||||||||||||||
| Up to 90 days | From 91 days to 1 year | Total | Up to 90 days | From 91 days to 1 year | Total | |||||||||||||||||||
| ThU.S.$ | ThU.S.$ | ThU.S.$ | ThU.S.$ | ThU.S.$ | ThU.S.$ | |||||||||||||||||||
Total current liabilities | 1,099,567 | 509,622 | 1,609,189 | 1,241,515 | 284,769 | 1,526,284 | ||||||||||||||||||
Other current financial liabilities | 322,619 | 455,742 | 778,361 | 141,110 | 234,341 | 375,451 | ||||||||||||||||||
U.S. dollar | 314,811 | 319,712 | 634,523 | 138,283 | 113,808 | 252,091 | ||||||||||||||||||
Euros | — | 71,454 | 71,454 | — | 69,139 | 69,139 | ||||||||||||||||||
Brazilian real | 7,727 | 5,187 | 12,914 | 2,810 | — | 2,810 | ||||||||||||||||||
Argentine pesos | 81 | — | 81 | 17 | — | 17 | ||||||||||||||||||
U.F. | — | 59,389 | 59,389 | — | 51,394 | 51,394 | ||||||||||||||||||
Bank borrowings | 292,465 | 381,311 | 673,776 | 109,889 | 167,905 | 277,794 | ||||||||||||||||||
U.S. dollar | 284,738 | 304,670 | 589,408 | 107,079 | 98,766 | 205,845 | ||||||||||||||||||
Euros | — | 71,454 | 71,454 | — | 69,139 | 69,139 | ||||||||||||||||||
Brazilian real | 7,727 | 5,187 | 12,914 | 2,810 | — | 2,810 | ||||||||||||||||||
Other borrowings | 30,154 | 74,431 | 104,585 | 31,221 | 66,436 | 97,657 | ||||||||||||||||||
U.S. dollar | 30,073 | 15,042 | 45,115 | 31,204 | 15,042 | 46,246 | ||||||||||||||||||
Argentine pesos | 81 | — | 81 | 17 | — | 17 | ||||||||||||||||||
U.F. | — | 59,389 | 59,389 | — | 51,394 | 51,394 | ||||||||||||||||||
Current lease liabilities | 24,824 | 24,757 | 49,581 | 11,339 | 25,445 | 36,784 | ||||||||||||||||||
U.S. dollar | 2,817 | 7,766 | 10,583 | 2,799 | 7,837 | 10,636 | ||||||||||||||||||
Euros | 25 | 65 | 90 | 24 | 67 | 91 | ||||||||||||||||||
Brazilian real | 18,655 | 11,203 | 29,858 | 2,240 | 7,823 | 10,063 | ||||||||||||||||||
Mexican pesos | 481 | 1,636 | 2,117 | 457 | 1,122 | 1,579 | ||||||||||||||||||
Other currencies | 11 | 32 | 43 | 2 | 21 | 23 | ||||||||||||||||||
Chilean pesos | 2,093 | 1,550 | 3,643 | 4,264 | 6,452 | 10,716 | ||||||||||||||||||
U.F. | 742 | 2,505 | 3,247 | 1,553 | 2,123 | 3,676 | ||||||||||||||||||
Trade and other current payables | 656,009 | 26,479 | 682,488 | 795,533 | 17,305 | 812,838 | ||||||||||||||||||
U.S. dollar | 150,206 | — | 150,206 | 233,932 | 294 | 234,226 | ||||||||||||||||||
Euros | 26,932 | — | 26,932 | 23,271 | 6 | 23,277 | ||||||||||||||||||
Brazilian real | 73,988 | 26,479 | 100,467 | 66,586 | 16,402 | 82,988 | ||||||||||||||||||
Argentine pesos | 46,922 | — | 46,922 | 54,078 | — | 54,078 | ||||||||||||||||||
Mexican pesos | 19,778 | — | 19,778 | 16,188 | 603 | 16,791 | ||||||||||||||||||
Other currencies | 13,990 | — | 13,990 | 10,476 | — | 10,476 | ||||||||||||||||||
Chilean pesos | 279,922 | — | 279,922 | 351,646 | — | 351,646 | ||||||||||||||||||
U.F. | 44,271 | — | 44,271 | 39,356 | — | 39,356 | ||||||||||||||||||
Accounts payable to related companies | 17,836 | — | 17,836 | 14,280 | — | 14,280 | ||||||||||||||||||
U.S. dollar | — | — | — | 202 | — | 202 | ||||||||||||||||||
Brazilian real | 2,339 | — | 2,339 | — | — | — | ||||||||||||||||||
Chilean pesos | 15,497 | — | 15,497 | 14,078 | — | 14,078 | ||||||||||||||||||
Other short-term provisions | 7,418 | — | 7,418 | 8,198 | 1,315 | 9,513 | ||||||||||||||||||
U.S. dollar | 5,653 | — | 5,653 | 7,934 | — | 7,934 | ||||||||||||||||||
Brazilian real | 264 | — | 264 | 264 | — | 264 | ||||||||||||||||||
Chilean pesos | 56 | — | 56 | — | — | — | ||||||||||||||||||
U.F. | 1,445 | — | 1,445 | — | 1,315 | 1,315 | ||||||||||||||||||
Current tax liabilities | 8,426 | 266 | 8,692 | 24,251 | 2,618 | 26,869 | ||||||||||||||||||
U.S. dollar | 1,768 | — | 1,768 | 16,864 | 2,618 | 19,482 | ||||||||||||||||||
Euros | 3,869 | — | 3,869 | 5,123 | — | 5,123 | ||||||||||||||||||
Brazilian real | 2,726 | 202 | 2,928 | 1,512 | — | 1,512 | ||||||||||||||||||
Mexican pesos | — | — | — | 752 | — | 752 | ||||||||||||||||||
Chilean pesos | 63 | 64 | 127 | — | — | — | ||||||||||||||||||
Current provisions for employee benefits | 8,488 | — | 8,488 | 6,706 | 865 | 7,571 | ||||||||||||||||||
Chilean pesos | 8,488 | — | 8,488 | 6,706 | 865 | 7,571 | ||||||||||||||||||
Other current non-financial liabilities | 4,746 | — | 4,746 | 240,098 | 2,880 | 242,978 | ||||||||||||||||||
U.S. dollar | 59 | — | 59 | 192,359 | — | 192,359 | ||||||||||||||||||
Euros | 29,652 | — | 29,652 | 51 | — | 51 | ||||||||||||||||||
Brazilian real | 4,911 | — | 4,911 | 33,011 | — | 33,011 | ||||||||||||||||||
Argentine pesos | 9,804 | — | 9,804 | 5,120 | — | 5,120 | ||||||||||||||||||
Mexican pesos | 6 | — | 6 | 4,828 | — | 4,828 | ||||||||||||||||||
Other currencies | 4,769 | 2,378 | 7,147 | 16 | — | 16 | ||||||||||||||||||
Chilean pesos | 4,746 | — | 4,746 | 4,713 | 2,880 | 7,593 | ||||||||||||||||||
54
Table of Contents
CELULOSA ARAUCO Y CONSTITUCION S.A. AND SUBSIDIARIES
Unaudited interim consolidated financial statements
June 30, 2023
Amounts in thousands of U.S. dollars, except as indicated
| 06-30-2023 | 12-31-2022 | |||||||||||||||||||||||||||||||
| From 13 months to 3 years | From 3 years to 5 years | More than 5 years | Total | From 13 months to 3 years | From 3 years to 5 years | More than 5 years | Total | |||||||||||||||||||||||||
| ThU.S.$ | ThU.S.$ | ThU.S.$ | ThU.S.$ | ThU.S.$ | ThU.S.$ | ThU.S.$ | ThU.S.$ | |||||||||||||||||||||||||
Total non-current liabilities | 2,434,457 | 1,141,198 | 4,54,417 | 8,090,072 | 2,392,390 | 1,104,841 | 3,896,609 | 7,393,840 | ||||||||||||||||||||||||
Other non-current financial liabilities | 1,151,296 | 991,600 | 3,727,749 | 5,870,645 | 1,028,450 | 947,217 | 3,179,704 | 5,155,371 | ||||||||||||||||||||||||
U.S. dollar | 772,819 | 493,631 | 2,363,584 | 3,630,034 | 782,284 | 492,898 | 2,362,234 | 3,637,416 | ||||||||||||||||||||||||
Euros | 133,108 | 136,130 | 102,040 | 371,278 | 126,793 | 129,736 | 129,657 | 386,186 | ||||||||||||||||||||||||
Brazilian real | 149,228 | 43,229 | — | 192,457 | 31,943 | 35,137 | — | 67,080 | ||||||||||||||||||||||||
U.F. | 96,141 | 318,610 | 1,262,125 | 1,676,876 | 87,430 | 289,446 | 687,813 | 1,064,689 | ||||||||||||||||||||||||
Bank borrowings | 505,621 | 179,359 | 102,040 | 787,020 | 368,353 | 164,873 | 129,657 | 662,883 | ||||||||||||||||||||||||
U.S. dollar | 223,285 | — | — | 223,285 | 209,617 | — | — | 209,617 | ||||||||||||||||||||||||
Euros | 133,108 | 136,130 | 102,040 | 371,278 | 126,793 | 129,736 | 129,657 | 386,186 | ||||||||||||||||||||||||
Brazilian real | 149,228 | 43,229 | — | 192,457 | 31,943 | 35,137 | — | 67,080 | ||||||||||||||||||||||||
Other borrowings | 645,675 | 812,241 | 3,625,709 | 5,083,625 | 660,097 | 782,344 | 3,050,047 | 4,492,488 | ||||||||||||||||||||||||
U.S. dollar | 549,534 | 493,631 | 2,363,584 | 3,406,749 | 572,667 | 492,898 | 2,362,234 | 3,427,799 | ||||||||||||||||||||||||
U.F. | 96,141 | 318,610 | 1,262,125 | 1,676,876 | 87,430 | 289,446 | 687,813 | 1,064,689 | ||||||||||||||||||||||||
Non-current lease liabilities | 61,148 | 48,498 | 222,760 | 332,406 | 45,904 | 38,906 | 142,630 | 227,440 | ||||||||||||||||||||||||
U.S. dollar | 21,120 | 17,336 | 78,303 | 116,759 | 21,562 | 17,653 | 81,441 | 120,656 | ||||||||||||||||||||||||
Euros | 69 | — | — | 69 | 109 | 1 | — | 110 | ||||||||||||||||||||||||
Brazilian real | 30,556 | 26,374 | 139,867 | 196,797 | 17,335 | 16,375 | 57,496 | 91,206 | ||||||||||||||||||||||||
Mexican pesos | 2,182 | 289 | — | 2,471 | 1,646 | 13 | — | 1,659 | ||||||||||||||||||||||||
Other currencies | 111 | 40 | — | 151 | — | — | — | — | ||||||||||||||||||||||||
Chilean pesos | 1,061 | 291 | — | 1,352 | 197 | 352 | — | 549 | ||||||||||||||||||||||||
U.F. | 6,049 | 4,168 | 4,590 | 14,807 | 5,055 | 4,512 | 3,693 | 13,260 | ||||||||||||||||||||||||
Non-current payable | 22,040 | — | — | 22,040 | 2,462 | — | 17,654 | 20,116 | ||||||||||||||||||||||||
Brazilian real | 2,667 | — | — | 2,667 | 2,462 | — | — | 2,462 | ||||||||||||||||||||||||
Chilean pesos | 19,373 | — | — | 19,373 | — | — | 17,654 | 17,654 | ||||||||||||||||||||||||
Non- current accounts payable to related companies | 3,283 | — | 3,448 | 6,731 | 3,283 | — | 3,448 | 6,731 | ||||||||||||||||||||||||
Chilean pesos | 3,283 | — | 3,448 | 6,731 | 3,283 | — | 3,448 | 6,731 | ||||||||||||||||||||||||
Other long-term provisions | 30,719 | — | — | 30,719 | 40,706 | — | — | 40,706 | ||||||||||||||||||||||||
U.S. dollar | — | — | — | — | 1,677 | — | — | 1,677 | ||||||||||||||||||||||||
Brazilian real | 4,268 | — | — | 4,268 | 12,512 | — | — | 12,512 | ||||||||||||||||||||||||
Argentine pesos | 26,451 | — | — | 26,451 | 26,517 | — | — | 26,517 | ||||||||||||||||||||||||
Deferred tax liabilities | 1,012,767 | 84,229 | 560,271 | 1,657,267 | 1,152,877 | 94,256 | 538,782 | 1,785,915 | ||||||||||||||||||||||||
U.S. dollar | 982,100 | 82,634 | 472,520 | 1,537,254 | 1,088,336 | 92,026 | 501,595 | 1,681,957 | ||||||||||||||||||||||||
Brazilian real | 23,406 | 1,595 | 87,751 | 112,752 | 58,405 | 2,230 | 37,187 | 97,822 | ||||||||||||||||||||||||
Mexican pesos | 7,261 | — | — | 7,261 | 6,136 | — | — | 6,136 | ||||||||||||||||||||||||
Non-current provisions for employee benefits | 98,609 | — | 24 | 98,633 | 77,746 | 9,943 | — | 87,689 | ||||||||||||||||||||||||
Mexican pesos | 1,143 | — | 24 | 1,167 | 957 | — | — | 957 | ||||||||||||||||||||||||
Chilean pesos | 97,466 | — | — | 97,466 | 76,789 | 9,943 | — | 86,732 | ||||||||||||||||||||||||
Other non-current non-financial liabilities | 54,595 | 16,871 | 165 | 71,631 | 40,962 | 14,519 | 14,391 | 69,872 | ||||||||||||||||||||||||
Brazilian real | 54,580 | 16,871 | 165 | 71,616 | 40,939 | 14,519 | 14,391 | 69,849 | ||||||||||||||||||||||||
Argentine pesos | 8 | — | — | 8 | 10 | — | — | 10 | ||||||||||||||||||||||||
Chilean pesos | 7 | — | — | 7 | 13 | — | — | 13 | ||||||||||||||||||||||||
55
Table of Contents
CELULOSA ARAUCO Y CONSTITUCION S.A. AND SUBSIDIARIES
Unaudited interim consolidated financial statements
June 30, 2023
Amounts in thousands of U.S. dollars, except as indicated
The table below sets forth the subsidiaries that have determined a functional currency other than the U.S. dollar as follows:
Subsidiary | Country | Functional currency | ||
Arauco Canada Ltd. | Canada | Canadian dollar | ||
Arauco Celulose do Brasil | Brazil | Brazilian real | ||
Arauco do Brasil S.A. | Brazil | Brazilian real | ||
Arauco Florestal Arapoti S.A. | Brazil | Brazilian real | ||
Arauco Forest Brasil S.A. | Brazil | Brazilian real | ||
Arauco Industria de Mexico, S.A. de C.V. | Mexico | Mexican pesos | ||
Arauco Industria de Paineis S.A. | Brazil | Brazilian real | ||
Arauco Participações Florestais Ltda. | Brazil | Brazilian real | ||
Araucomex Servicios, S.A. de C.V. | Mexico | Mexican pesos | ||
Consorcio Protección Fitosanitaria Forestal S.A. | Chile | Chilean pesos | ||
Empreendimentos Florestais Santa Cruz Ltda. | Brazil | Brazilian real | ||
Leasing Forestal S.A. | Argentina | Argentine pesos | ||
Mahal Empreendimentos e Participações S.A. | Brazil | Brazilian real | ||
Novo Oeste Gestao de Ativos Florestais S.A. | Brazil | Brazilian real | ||
Lemu Earth SpA | Chile | Chilean pesos |
The table below shows a detail per company of the effect in the period of the reserve of exchange differences on translation:
| January - June | April - June | |||||||||||||||
| 2023 | 2022 | 2023 | 2022 | |||||||||||||
| ThU.S.$ | ThU.S.$ | ThU.S.$ | ThU.S.$ | |||||||||||||
Arauco Industria México S.A. de C.V. | 23,756 | 2,175 | 10,592 | (3,556 | ) | |||||||||||
Arauco do Brasil S.A. | 28,280 | 35,476 | 16,499 | (28,639 | ) | |||||||||||
Arauco Forest Brasil S.A. | 33,144 | 13,450 | 21,550 | (34,712 | ) | |||||||||||
Sonae Arauco S.A. | 4,217 | (15,736 | ) | 1,181 | (11,547 | ) | ||||||||||
Arauco Florestal Arapoti S.A. | 6,105 | 3,651 | 4,178 | (8,045 | ) | |||||||||||
Arauco Canada Ltd. | 6,730 | (361 | ) | 6,046 | (1,580 | ) | ||||||||||
Others | 665 | (453 | ) | 1,164 | (3,589 | ) | ||||||||||
|
|
|
|
|
|
|
| |||||||||
Total reserve of exchange differences on translation | 102,897 | 38,202 | 61,210 | (91,668 | ) | |||||||||||
Effect of foreign exchange rates changes
| January - June | April - June | |||||||||||||||
| 2023 | 2022 | 2023 | 2022 | |||||||||||||
| ThU.S.$ | ThU.S.$ | ThU.S.$ | ThU.S.$ | |||||||||||||
Exchange differences recognized in profit or loss, except for those arising on financial instruments measured at fair value through profit or loss | (8,238 | ) | 2,156 | (204 | ) | 11,838 | ||||||||||
Reserve of exchange differences on translation (with non-controlling interests) | 102,897 | 38,181 | 61,355 | (91,729 | ) | |||||||||||
NOTE 12. BORROWING COSTS
Arauco capitalizes interest at effective rate on current investment projects.
During 2023, Arauco just has capitalized financial interest related to minor projects.
Until 2022, Arauco capitalized financial interest related to the modernization and expansion of Planta Arauco (MAPA) in Chile.
| January - June | April - June | |||||||||||||||
| 2023 | 2022 | 2023 | 2022 | |||||||||||||
| ThU.S.$ | ThU.S.$ | ThU.S.$ | ThU.S.$ | |||||||||||||
Interest cost capitalized, property, plant and equipment | ||||||||||||||||
Capitalization rate of interest cost capitalized, property, plant and equipment | 4.74 | % | 4.33 | % | 4.74 | % | 4.32 | % | ||||||||
Amount of the interest cost capitalized, property, plant and equipment | 139 | 57,560 | 86 | 29,673 | ||||||||||||
56
Table of Contents
CELULOSA ARAUCO Y CONSTITUCION S.A. AND SUBSIDIARIES
Unaudited interim consolidated financial statements
June 30, 2023
Amounts in thousands of U.S. dollars, except as indicated
NOTE 13. RELATED PARTIES
Related Party Disclosures
Related parties are those entities defined in IAS 24 and under the rules of the Chilean Commission for the Financial Market and the Chilean Corporations Law.
The receivable and payable amounts among related parties at the end of each period correspond to commercial and financing transactions denominated in Chilean pesos, U.S. dollars and Brazilian real, where collection or payment deadlines are shown in the following tables and in general do not bear interest, except for financing transactions.
As of the date of these interim consolidated financial statements, the main transactions with related parties are related to fuel purchases with Copec S.A. and sodium chlorate purchases at EKA Chile S.A.
As of the date of these interim consolidated financial statements, there were neither provisions for accounts of doubtful collection nor any guarantees granted or received related to the balances with related parties.
Name of Group’s Main Shareholders
The ultimate shareholders of Arauco, direct and indirectly, are Mr. Roberto Angelini Rossi and Mrs. Patricia Angelini Rossi.
Name of the Intermediate Controlling Entity that Produces interim consolidated financial statements for Public Use
Empresas Copec S.A.
Key Management Personnel Compensation
Compensation to key management personnel, including directors, managers and deputy managers, consist of a fixed monthly salary, and managers and deputy managers also receive an annual bonus subject to the results of the Company and the fulfillment of goals of the business as well as individual performance.
Pricing Strategy Terms and Conditions Corresponding to Transactions with Related Parties
Transactions carried out with related parties are intended to contribute to the corporate interest, are adjusted in price, terms and conditions to those prevailing in the market at the time of approval, and meet the requirements and procedures set forth in the law.
57
Table of Contents
CELULOSA ARAUCO Y CONSTITUCION S.A. AND SUBSIDIARIES
Unaudited interim consolidated financial statements
June 30, 2023
Amounts in thousands of U.S. dollars, except as indicated
The table below sets forth information about the Relationship between the Parent Company and its Subsidiaries
| % Ownership interest | % Ownership interest | |||||||||||||||||||||||||||||
| Functional | 06-30-2023 | 12-31-2022 | ||||||||||||||||||||||||||||
ID N° | Company Name | Country | Currency | Direct | Indirect | Total | Direct | Indirect | Total | |||||||||||||||||||||
77.630.621-5 | Agrícola Ranquillón SpA | Chile | U.S. dollar | — | 98.64086 | 98.64086 | — | 98.58669 | 98.58669 | |||||||||||||||||||||
77.630.618-5 | Agrícola San Carlos SpA | Chile | U.S. dollar | — | 99.94839 | 99.94839 | — | 99.94839 | 99.94849 | |||||||||||||||||||||
77.630.623-1 | Agrícola Santa Emilia SpA | Chile | U.S. dollar | — | 99.94839 | 99.94839 | — | 99.94839 | 99.94839 | |||||||||||||||||||||
77.630.625-8 | Agrícola Santa Isabel SpA | Chile | U.S. dollar | — | 99.94839 | 99.94839 | — | 99.94839 | 99.94839 | |||||||||||||||||||||
77.630.626-6 | Agrícola Siberia SpA | Chile | U.S. dollar | — | 98.64086 | 98.64086 | — | 98.58669 | 98.58669 | |||||||||||||||||||||
77.630.629-0 | Agrícola Trupán SpA | Chile | U.S. dollar | — | 98.64086 | 98.64086 | — | 98.58669 | 98.58669 | |||||||||||||||||||||
— | Arauco Argentina S.A. | Argentina | U.S. dollar | 9.97070 | 90.00940 | 99.98010 | 9.97070 | 90.00940 | 99.98010 | |||||||||||||||||||||
— | Arauco Australia Pty Ltd. | Australia | U.S. dollar | — | 99.99898 | 99.99898 | — | 99.99898 | 99.99898 | |||||||||||||||||||||
96.547.510-9 | Arauco Bioenergía S.A. | Chile | U.S. dollar | 98.00000 | 1.99897 | 99.99897 | 98.0000 | 1.99897 | 99.99897 | |||||||||||||||||||||
— | Arauco Canada Ltd. | Canada | Canadian dollar | — | 99.99911 | 99.99911 | — | 99.99911 | 99.99911 | |||||||||||||||||||||
— | Arauco Celulose do Brasil S.A. | Brazil | Brazilian real | — | 99.99907 | 99.99907 | — | 99.99907 | 99.99907 | |||||||||||||||||||||
— | Arauco Colombia S.A. | Colombia | U.S. dollar | 1.47783 | 98.52042 | 99.99825 | 1.47783 | 98.52042 | 99.99825 | |||||||||||||||||||||
— | Arauco do Brasil S.A. | Brazil | Brazilian real | 1.06807 | 98.93105 | 99.99912 | 1.06807 | 98.93105 | 99.99912 | |||||||||||||||||||||
— | Arauco Europe Cooperatief U.A. | Holland | U.S. dollar | 0.44979 | 99.54919 | 99.99898 | 0.52148 | 99.47751 | 99.99899 | |||||||||||||||||||||
— | Arauco Florestal Arapoti S.A. | Brazil | Brazilian real | — | 99.99900 | 99.99900 | — | 99.99900 | 99.99900 | |||||||||||||||||||||
— | Arauco Forest Brasil S.A. | Brazil | Brazilian real | 8.68654 | 91.31253 | 99.99907 | 8.68654 | 91.31253 | 99.99907 | |||||||||||||||||||||
— | Arauco Participações Florestais Ltda. | Brazil | Brazilian real | — | 99.99907 | 99.99907 | — | 99.99907 | 99.99907 | |||||||||||||||||||||
— | Arauco Industria de México, S.A.de C.V. | Mexico | Mexican pesos | — | 99.99910 | 99.99910 | — | 99.99910 | 99.99910 | |||||||||||||||||||||
— | Arauco Industria de Paineis S.A. | Brazil | Brazilian real | — | 99.99912 | 99.99912 | — | 99.99912 | 99.99912 | |||||||||||||||||||||
— | Arauco Middle East DMCC | Dubai | U.S. dollar | — | 99.99898 | 99.99898 | — | 99.99898 | 99.99898 | |||||||||||||||||||||
— | Arauco North America, Inc. | United States | U.S. dollar | 0.00010 | 99.99901 | 99.99911 | 0.00010 | 99.99901 | 99.99911 | |||||||||||||||||||||
— | Arauco Perú S.A. | Peru | U.S. dollar | 0.00126 | 99.99772 | 99.99898 | 0.00126 | 99.99772 | 99.99898 | |||||||||||||||||||||
— | Arauco Pulp Limited | United Kingdom | U.S. dollar | — | 99.99898 | 99.99898 | — | 99.99898 | 99.99898 | |||||||||||||||||||||
— | Arauco Ventures Limited | United Kingdom | U.S. dollar | — | 99.99898 | 99.99898 | — | 99.99898 | 99.99898 | |||||||||||||||||||||
— | Arauco Wood (China) Company Limited | China | U.S. dollar | — | 99.99898 | 99.99898 | — | 99.99898 | 99.99898 | |||||||||||||||||||||
— | Arauco Wood Limited. | United Kingdom | U.S. dollar | 12.63126 | 87.36784 | 99.99911 | 12.63126 | 87.36785 | 99.99911 | |||||||||||||||||||||
— | Araucomex S.A. de C.V. | Mexico | U.S. dollar | 0.00050 | 99.99861 | 99.99911 | 0.00050 | 99.99861 | 99.99911 | |||||||||||||||||||||
— | Araucomex Servicios, S.A. de C.V. | Mexico | Mexican pesos | 0.33333 | 99.66578 | 99.99911 | 0.33333 | 99.66578 | 99.99911 | |||||||||||||||||||||
96.657.900-5 | Consorcio Protección Fitosanitaria Forestal S.A. | Chile | Chilean pesos | — | 56.83105 | 56.83105 | — | 56.82817 | 56.82817 | |||||||||||||||||||||
— | Empreendimentos Florestais Santa Cruz Ltda. | Brazil | Brazilian real | — | 99.99873 | 99.99873 | — | 99.99866 | 99.99866 | |||||||||||||||||||||
76.869.577-0 | E2E S.A. (1) | Chile | Chilean pesos | 1.00000 | 98.99861 | 99.99861 | — | — | — | |||||||||||||||||||||
85.805.200-9 | Forestal Arauco S.A. | Chile | U.S. dollar | 99.94839 | — | 99.94839 | 99.94839 | — | 99.94839 | |||||||||||||||||||||
93.838.000-7 | Forestal Cholguán S.A. | Chile | U.S. dollar | — | 98.64086 | 98.64086 | — | 98.58669 | 98.58669 | |||||||||||||||||||||
96.563.550-5 | Inversiones Arauco Internacional Ltda. | Chile | U.S. dollar | 98.01862 | 1.98036 | 99.99898 | 98.01862 | 1.98036 | 99.99898 | |||||||||||||||||||||
79.990.550-7 | Investigaciones Forestales Bioforest S.A. | Chile | U.S. dollar | 1.00000 | 98.94891 | 99.94891 | 1.00000 | 98.94891 | 99.94891 | |||||||||||||||||||||
— | Leasing Forestal S.A. | Argentina | Argentine pesos | — | 99.98010 | 99.98010 | — | 99.98010 | 99.98010 | |||||||||||||||||||||
76.860.724-9 | Lemu Earth SpA | Chile | Chilean pesos | — | 86.73678 | 86.73678 | — | 86.61426 | 86.61426 | |||||||||||||||||||||
— | Lemu Global Limited | United Kingdom | U.S. dollar | — | 93.39087 | 93.39087 | — | 99.99898 | 99.99898 | |||||||||||||||||||||
— | Lemu Inc. (2) | United States | U.S. dollar | — | 93.39087 | 93.39087 | — | — | — | |||||||||||||||||||||
— | Maderas Arauco Costa Rica S.A. | Costa Rica | U.S. dollar | — | 99.99898 | 99.99898 | — | 99.99898 | 99.99898 | |||||||||||||||||||||
96.510.970-6 | Maderas Arauco S.A. | Chile | U.S. dollar | — | 99.99860 | 99.99860 | — | 99.99860 | 99.99860 | |||||||||||||||||||||
— | Mahal Empreendimentos e Participações S.A. | Brazil | Brazilian real | — | 99.99902 | 99.99902 | — | 99.99901 | 99.99901 | |||||||||||||||||||||
— | Novo Oeste Gestao de Ativos Florestais S.A. | Brazil | Brazilian real | — | 99.99907 | 99.99907 | — | 99.99907 | 99.99907 | |||||||||||||||||||||
76.375.371-9 | Servicios Aéreos Forestales Ltda. | Chile | U.S. dollar | 0.01000 | 99.98898 | 99.99898 | 0.01000 | 99.98898 | 99.99898 | |||||||||||||||||||||
96.637.330-K | Servicios Logísticos Arauco S.A. | Chile | U.S. dollar | 45.00000 | 54.99923 | 99.99923 | 45.00000 | 54.99923 | 99.99923 | |||||||||||||||||||||
— | Tecverde Engenharia S.A.(1) | Brazil | Brazilian real | — | 95.61432 | 95.61432 | — | — | — | |||||||||||||||||||||
— | Woodaffix, LLC. | United States | U.S. dollar | — | 99.99911 | 99.99911 | — | 99.99911 | 99.99911 | |||||||||||||||||||||
| (1) | Increased of participation in E2E S.A., changed it from joint venture to subsidiary. Additionally, through this subsidiary, in March 2023 Arauco increased its participation in Tecverde Engenharia S.A., thus being recognized as a subsidiary. |
| (2) | This company was created in February of 2023. |
The companies in the table below are classified as joint operations in accordance with IFRS 11. The assets, liabilities, income and expenses are recorded in relation to the Company’s ownership percentage as specified in the contractual arrangement.
Company Name | Country | Functional currency | ||
Eufores S.A. | Uruguay | U.S. dollar | ||
Celulosa y Energía Punta Pereira S.A. | Uruguay | U.S. dollar | ||
Zona Franca Punta Pereira S.A. | Uruguay | U.S. dollar | ||
Forestal Cono Sur S.A. | Uruguay | U.S. dollar | ||
Stora Enso Uruguay S.A. | Uruguay | U.S. dollar | ||
El Esparragal Asociación Agraria de R.L. | Uruguay | U.S. dollar | ||
Ongar S.A. | Uruguay | U.S. dollar | ||
Terminal Logística e Industrial M’Bopicuá S.A. | Uruguay | U.S. dollar |
58
Table of Contents
CELULOSA ARAUCO Y CONSTITUCION S.A. AND SUBSIDIARIES
Unaudited interim consolidated financial statements
June 30, 2023
Amounts in thousands of U.S. dollars, except as indicated
According to significant restrictions on the ability of subsidiaries to transfer funds to Arauco, in the form of cash dividends or repayment of borrowings and/or advances, we state the following:
Long-term debt with related entities - Mutual Agreement with Arauco Argentina S.A.
On June 5, 2017, Arauco signed a mutual agreement with its subsidiary Arauco Argentina S.A., pursuant to which this subsidiary received an amount of U.S.$ 250,000,000, which accrues an interest at the LIBOR interest rate for 180 days plus a fixed spread of 5.20%, with payments every six months on June 1 and December 1 of each year. As of the date of these interim consolidated financial statements, we are finalizing the change of the base rate to Term SOFR 6M, replacing the current base in LIBOR.
Since 2020, the Central Bank of the Argentine Republic (BCRA) established certain foreign exchange controls, preventing Arauco Argentina S.A. from repaying the amount of ThU.S.$ 160,000 owed under the mutual agreement described above which matured on June 1, 2022.
On July 14, 2022, Arauco Argentina S.A. paid ThU.S.$ 6,000 of the amount owed under the mutual agreement described above, remaining to pay ThU.S.$ 154,000 as of the date of these interim consolidated financial statements.
Key Management Personnel Compensation and Redundancy Benefits
| January - June | April - June | |||||||||||||||
| 2023 | 2022 | 2023 | 2022 | |||||||||||||
| ThU.S.$ | ThU.S.$ | ThU.S.$ | ThU.S.$ | |||||||||||||
Salaries and bonuses | 39,032 | 42,877 | 16,728 | 18,643 | ||||||||||||
Per diem compensation to members of the Board of Directors | 1,357 | 1,189 | 679 | 588 | ||||||||||||
Termination benefits | 1,606 | 993 | 545 | 602 | ||||||||||||
Total | 41,995 | 45,059 | 17,952 | 19,833 | ||||||||||||
Related Party Receivables, Current
| Nature of | 06-30-2023 | 12-31-2022 | ||||||||||||||||||
Name of related party | Tax ID No. | relationship | Country | Currency | Maturity | ThU.S.$ | ThU.S.$ | |||||||||||||
Forestal Mininco S.A. | 91.440.000-7 | Common stockholder | Chile | Chilean pesos | 30 days | 1 | 1 | |||||||||||||
Eka Chile S.A. | 99.500.140-3 | Joint venture | Chile | Chilean pesos | 30 days | 3,070 | 2,626 | |||||||||||||
Colbún S.A. | 96.505.760-9 | Common stockholder | Chile | Chilean pesos | 30 days | — | 21 | |||||||||||||
Fundación Educacional Arauco | 71.625.000-8 | Parent company is founder and contributor | Chile | Chilean pesos | 30 days | 687 | — | |||||||||||||
Fundación Acerca Redes | 65.097.218-K | Parent company is founder and contributor | Chile | Chilean pesos | 30 days | 353 | 41 | |||||||||||||
Parque Eólico Ovejera Sur SpA. | 76.839.949-2 | Joint venture | Chile | Chilean pesos | 30 days | — | 100 | |||||||||||||
Compañía Puerto de Coronel S.A. | 79.895.330-3 | Subsidiary of an associate | Chile | U.S. dollar | 30 days | 424 | — | |||||||||||||
E2E S.A. | 76.218.856-2 | Joint venture | Chile | Chilean pesos | — | — | 60 | |||||||||||||
EMOAC SpA. | 76.208.888-6 | Common controlling parent | Chile | Chilean pesos | 30 days | — | 1 | |||||||||||||
La Papelera del Plata S.A. | — | Common controlling parent | Argentina | Argentine pesos | 30 days | 2,179 | 4,713 | |||||||||||||
|
|
|
| |||||||||||||||||
TOTAL | 6,714 | 7,563 | ||||||||||||||||||
|
|
|
| |||||||||||||||||
Related Party Payables, Current
| 06-30-2023 | 12-31-2022 | |||||||||||||||||||||
Name of related party | Tax ID No. | Nature of relationship | Country | Currency | Maturity | ThU.S.$ | ThU.S.$ | |||||||||||||||
Copec S.A. | 99.520.000-7 | Common controlling parent | Chile | Chilean pesos | 30 days | 6,282 | 4,474 | |||||||||||||||
Abastible S.A. | 91.806.000-6 | Common controlling parent | Chile | Chilean pesos | 30 days | 309 | 189 | |||||||||||||||
Fundación Educacional Arauco | 71.625.000-8 | Parent company is founder and contributor | Chile | Chilean pesos | 30 days | — | 780 | |||||||||||||||
Empresa Nacional de Telecomunicaciones S.A. | 92.580.000-7 | Common stockholder | Chile | Chilean pesos | 30 days | 4 | 4 | |||||||||||||||
Compañía Puerto de Coronel S.A. | 79.895.330-3 | Subsidiary of an associate | Chile | U.S. dollar | 30 days | — | 202 | |||||||||||||||
Colbún S.A. | 96.505.760-9 | Common stockholder | Chile | Chilean pesos | 30 days | 172 | — | |||||||||||||||
Woodtech S.A. | 76.724.000-7 | Associate of controlling parent | Chile | Chilean pesos | 30 days | 92 | — | |||||||||||||||
Copec Aviation S.A. | 96.942.120-8 | Joint venture of controlling parent | Chile | Chilean pesos | — | — | 3 | |||||||||||||||
Falcão MS SPE S.A. | — | Associate | Brasil | Reales | 30 días | 2,339 | — | |||||||||||||||
Agrícola San Gerardo SpA | 77.017.167-9 | Joint venture | Chile | Chilean pesos | 30 days | 156 | 146 | |||||||||||||||
Agrícola Fresno SpA | 77.470.229-6 | Joint venture | Chile | Chilean pesos | Dec-31-23 | 8,482 | 8,482 | |||||||||||||||
|
|
|
| |||||||||||||||||||
TOTAL | 17,836 | 14,280 | ||||||||||||||||||||
|
|
|
| |||||||||||||||||||
59
Table of Contents
CELULOSA ARAUCO Y CONSTITUCION S.A. AND SUBSIDIARIES
Unaudited interim consolidated financial statements
June 30, 2023
Amounts in thousands of U.S. dollars, except as indicated
Related Party Payables, Non-Current
| 06-30-2023 | 12-31-2022 | |||||||||||||||||||||
Name of related party | Tax ID No. | Nature of relationship | Country | Currency | Maturity | ThU.S.$ | ThU.S.$ | |||||||||||||||
Agrícola Fresno SpA | 77.470.229-6 | Joint venture | Chile | Chilean pesos | Dec-31-24 | 3,283 | 3,283 | |||||||||||||||
Agrícola Fresno SpA | 77.470.229-6 | Joint venture | Chile | Chilean pesos | Dec-31-27 | 3,448 | 3,448 | |||||||||||||||
|
|
|
| |||||||||||||||||||
TOTAL | 6,731 | 6,731 | ||||||||||||||||||||
|
|
|
| |||||||||||||||||||
Related Party Transactions
Purchases
Name of related party | Tax ID No. | Nature of relationship | Country | Currency | Transaction descriptions | 06-30-2023 ThU.S.$ | 12-31-2022 ThU.S.$ | |||||||||||||
Abastible S.A. | 91.806.000-6 | Common controlling parent | Chile | Chilean pesos | Fuel | 1,893 | 3,207 | |||||||||||||
Copec S.A. | 99.520.000-7 | Common controlling parent | Chile | Chilean pesos | Fuel and other | 79,042 | 92,643 | |||||||||||||
Compañía Puerto de Coronel S.A. | 79.895.330-3 | Subsidiary of an associate | Chile | U.S. dollar | Transport, stowage and port services | 9,838 | 7,643 | |||||||||||||
EKA Chile S.A. | 99.500.140-3 | Joint venture | Chile | Chilean pesos | Sodium chlorate | 23,646 | 41,540 | |||||||||||||
Portaluppi, Guzman y Bezanilla Abogados Ltda. | 78.096.080-9 | Common director | Chile | Chilean pesos | Legal services | 608 | 851 | |||||||||||||
Empresa Nacional de Telecomunicaciones S.A. | 92.580.000-7 | Common stockholder | Chile | Chilean pesos | Telephone services | 49 | 123 | |||||||||||||
Colbún S.A. | 96.505.760-9 | Common stockholder | Chile | Chilean pesos | Electrical Power | 709 | 834 | |||||||||||||
Woodtech S.A. | 76.724.000-7 | Indirect associate of controlling parent | Chile | Chilean pesos | Wood volumen measurement services | 577 | 1,012 | |||||||||||||
Servicios Corporativos Sercor S.A. | 96.925.430-1 | Associate | Chile | Chilean pesos | Other purchases | 88 | 246 | |||||||||||||
Sales
Name of related party | Tax ID No. | Nature of relationship | Country | Currency | Transaction descriptions | 06-30-2023 ThU.S.$ | 12-31-2022 ThU.S.$ | |||||||||||||
EKA Chile S.A. | 99.500.140-3 | Joint venture | Chile | Chilean pesos | Electrical power | 12,078 | 23,539 | |||||||||||||
Fundación Educacional Arauco | 71.625.000-8 | Parent company is founder and contributor | Chile | Chilean pesos | IT and administrative services | 109 | 299 | |||||||||||||
CMPC Pulp S.A. | 96.532.330-9 | Common stockholder | Chile | Chilean pesos | Wood and chips | 3 | 525 | |||||||||||||
Softys Chile SpA. | 96.529.310-8 | Common stockholder | Chile | Chilean pesos | Pulp | 633 | — | |||||||||||||
Compañía Puerto de Coronel S.A. | 79.895.330-3 | Subsidiary of an associate | Chile | U.S. dollar | Other sales | 254 | 453 | |||||||||||||
E2E S.A. | 76.879.577-0 | Joint venture | Chile | Chilean pesos | Wood, plywood and boards | 117 | 246 | |||||||||||||
EMOAC SPA | 76.208.888-6 | Indirect subsidiary of controlling parent | Chile | Chilean pesos | Electrical Power | 1,975 | 3,272 | |||||||||||||
La Papelera del Plata S.A. | — | Associate | Chile | Chilean pesos | Pulp | 7,144 | 16,686 | |||||||||||||
Other transactions
Name of related party | Tax ID No. | Nature of relationship | Country | Currency | Transaction descriptions | 06-30-2023 ThU.S.$ | 12-31-2022 ThU.S.$ | |||||||||||||
Falcão MS SPE S.A. | — | Associate | Brazil | Reales | Capital contribution | 2,222 | 9,664 | |||||||||||||
Agrícola San Gerardo SpA | 77.017.167-9 | Joint venture | Chile | Chilean pesos | Capital contribution | — | 136 | |||||||||||||
Agrícola Fresno SpA | 77.470.229-6 | Joint venture | Chile | Chilean pesos | Capital contribution | 1,509 | 31,998 | |||||||||||||
Parque Eólico Ovejera Sur SpA. | 76.839.949-2 | Joint venture | Chile | Chilean pesos | Capital contribution | — | 118 | |||||||||||||
E2E S.A. | 76.879.577-0 | Joint venture | Chile | Chilean pesos | Capital contribution | 5,254 | — | |||||||||||||
Tecverde Engenharia S.A. | — | Subsidiary of an joint venture | Brazil | Reales | Borrowing | 2,668 | — | |||||||||||||
E2E S.A. | 76.879.577-0 | Joint venture | Chile | U.S. dollar | Borrowing | 537 | 3,546 | |||||||||||||
60
Table of Contents
CELULOSA ARAUCO Y CONSTITUCION S.A. AND SUBSIDIARIES
Unaudited interim consolidated financial statements
June 30, 2023
Amounts in thousands of U.S. dollars, except as indicated
NOTE 14. INVESTMENTS IN SUBSIDIARIES
The main operations carried out as of June 30, 2023 and December 31, 2022 are reported below:
On March 17, 2023, Arauco took over control of the company E2E S.A., acquiring the remaining 50% interest. The payment for this transaction amounted to ThCLP$ 102 (equivalent to ThU.S.$ 0.12).
On June 22, 2022, a cooperation agreement was signed with the Government of Mato Grosso do Sul, Brazil. Signing this agreement is an important and preparatory step that will enable us to continue assessing the construction of a new pulp mill. If conditions allow – among which conditions are obtaining all necessary permits and board approval – this new plant would have an estimated production capacity of 2.5 million tons of short-fiber pulp and would require an estimated investment of approximately US$ 3 billion. For the same purposes, in August 2022 and through subsidiary Arauco Forest Brasil S.A., the company Arauco Celulose do Brasil S.A. was incorporated. This company participates in forestry-related activities, such as the formation of eucalyptus forests, logging, and electric power generation.
Reorganization
Arauco determined it necessary to reorganize its activity in the wood product segment by centralizing its investments in the wood market in an entity that allows a common direction and control. This is the reason why, on May 23, 2022, the company Arauco Wood Limited was created. Such international parent entity was incorporated in the United Kingdom, a country which is considered and valued as one of the main investment platforms and center global financial system, and known for its institutional stability.
In June and December 2022, Arauco, through its subsidiary Inversiones Arauco International Ltda. and the parent of the group, Celulosa Arauco y Constitución S.A., contributed their subsidiaries from the wood segment to the new company Arauco Wood Limited. These contributions were for a total amount of ThU.S.$ 1,989,972. This operation did not generate an effect within the consolidated statements of profit or loss.
With this reorganization, Arauco intends to achieve a more efficient international structure in a first-class financial center, thus generating an attractive investment focus for potential new investors or other market players. This centralization of the wood product segment will also allow a better and more efficient management, enhancing its investments with a solid structure and greater projections of profitability, growth and sustainability.
NOTE 15. INVESTMENTS IN ASSOCIATES
As of June 30, 2023 and December 31, 2022, these are the main movements of investments in associates to report:
On August 8, 2022, the subsidiary Arauco Participações Florestais Ltda. of Brasil incorporated the company Falcão MS SPE S.A., and during the year 2022, Arauco contributed capital to the new company for ThR$ 49,985 (equivalents to ThU.S.$ 9,664). In 2023, Arauco contributed capital to Falcão MS SPE S.A. for ThR$ 11,270 (equivalents to ThU.S.$ 2,222).
61
Table of Contents
CELULOSA ARAUCO Y CONSTITUCION S.A. AND SUBSIDIARIES
Unaudited interim consolidated financial statements
June 30, 2023
Amounts in thousands of U.S. dollars, except as indicated
The following tables set forth information about investments in associates.
Name | Inversiones Puerto Coronel S.A. | |||
Country | Chile | |||
Functional currency | U.S. dollar | |||
Corporate purpose | Investments in movables and real estate, acquisition of companies, securities and investment instruments, investment management and development and/or participation in all kind of businesses and companies related to industrial, shipping, forestry and commercial activities. | |||
Ownership interest (%) | 50.0000% | |||
06-30-2023 | 12-31-2022 | |||
Carrying amount accounted for using equity method | ThU.S.$ 64,531 | ThU.S.$ 64,000 | ||
Name | Servicios Corporativos Sercor S.A. | |||
Country | Chile | |||
Functional currency | Chilean pesos | |||
Corporate purpose | Consulting services related to business management to Boards of Directors and Senior Management of all Arauco’s entities. | |||
Ownership interest (%) | 20.0000% | |||
06-30-2023 | 12-31-2022 | |||
Carrying amount accounted for using equity method | ThU.S.$ 391 | ThU.S.$ 325 | ||
Name | Genómica Forestal S.A. | |||
Country | Chile | |||
Functional currency | Chilean pesos | |||
Corporate purpose | Developing forestry genomics, through the use of biotechnological, molecular and bioinformatics tools with the purpose of strengthening genetic programs so as to improve the competitive position of the Chilean forestry industry for priority tree species. | |||
Ownership interest (%) | 25.0000% | |||
06-30-2023 | 12-31-2022 | |||
Carrying amount accounted for using equity method | ThU.S.$ 7 | ThU.S.$ 6 | ||
Name | Consorcio Tecnológico Bioenercel S.A. | |||
Country | Chile | |||
Functional currency | Chilean pesos | |||
Corporate purpose | Developing of technologies which will promote the development of a biofuels industry in Chile, obtained from lingo-cellulosic materials. The future execution of this sustainable project is financed by the Innova Chile Committee. | |||
Ownership interest (%) | 20.0000% | |||
06-30-2023 | 12-31-2022 | |||
Carrying amount accounted for using equity method | ThU.S.$ 1 | ThU.S.$ 1 | ||
Name | Florestal Vale do Corisco S.A. | |||
Country | Brazil | |||
Functional currency | Brazilian real | |||
Corporate purpose | Management of forestry activities. | |||
Ownership interest (%) | 49.0000% | |||
06-30-2023 | 12-31-2022 | |||
Carrying amount accounted for using equity method | ThU.S.$ 30,387 | ThU.S.$ 26,910 | ||
Name | Falcão MS SPE S.A. | |||
Country | Brazil | |||
Functional currency | Brazilian real | |||
Corporate purpose | Management of land for leases to related parties. | |||
Ownership interest (%) | 49.0000% | |||
06-30-2023 | 12-31-2022 | |||
Carrying amount accounted for using equity method | ThU.S.$ 12,804 | ThU.S.$ 9,579 | ||
62
Table of Contents
CELULOSA ARAUCO Y CONSTITUCION S.A. AND SUBSIDIARIES
Unaudited interim consolidated financial statements
June 30, 2023
Amounts in thousands of U.S. dollars, except as indicated
Summarized Financial Information of Associates
| Assets | ||||||||||||||||||||||||||||
06-30-2023 | Inversiones Puerto Coronel S.A. ThU.S.$ | Serv.Corporativos Sercor S.A. ThU.S.$ | Florestal Vale do Corisco S.A. ThU.S.$ | Falcão MS SPE S.A. ThU.S.$ | Consorcio Tecnológico Bioenercel S.A. ThU.S.$ | Genómica Forestal S.A. ThU.S.$ | Total ThU.S.$ | |||||||||||||||||||||
Current | 1 | 7,338 | 5,325 | 12,732 | 1 | 9 | 25,406 | |||||||||||||||||||||
Non-current | 130,881 | 2,557 | 78,560 | 125,801 | 4 | 50 | 337,853 | |||||||||||||||||||||
Total of associates | 130,882 | 9,895 | 83,885 | 138,533 | 5 | 59 | 363,259 | |||||||||||||||||||||
| Liabilities and Equity | ||||||||||||||||||||||||||||
| Inversiones Puerto Coronel S.A. ThU.S.$ | Serv.Corporativos Sercor S.A. ThU.S.$ | Florestal Vale do Corisco S.A. ThU.S.$ | Falcão MS SPE S.A. ThU.S.$ | Consorcio Tecnológico Bioenercel S.A. ThU.S.$ | Genómica Forestal S.A. ThU.S.$ | Total ThU.S.$ | ||||||||||||||||||||||
Current | 54 | 6,219 | 787 | 7,320 | — | — | 14,380 | |||||||||||||||||||||
Non-current | — | 1,719 | 21,085 | 105,083 | 4 | 32 | 127,923 | |||||||||||||||||||||
Equity | 130,828 | 1,957 | 62,013 | 26,130 | 1 | 27 | 220,956 | |||||||||||||||||||||
Total of associates | 130,882 | 9,895 | 83,885 | 138,533 | 5 | 59 | 363,259 | |||||||||||||||||||||
06-30-2023 | ||||||||||||||||||||||||||||
Income | — | 2,343 | 4,799 | — | — | — | 7,142 | |||||||||||||||||||||
Other income / expenses | 1,581 | (2,029 | ) | (2,163 | ) | 186 | — | (1 | ) | (2,426 | ) | |||||||||||||||||
Net profit or loss (continuing operations) of associates | 1,581 | 314 | 2,636 | 186 | — | (1 | ) | 4,716 | ||||||||||||||||||||
Other comprehensive income | — | — | — | — | — | — | — | |||||||||||||||||||||
Comprehensive income | 1,581 | 314 | 2,636 | 186 | — | (1 | ) | 4,716 | ||||||||||||||||||||
Dividends received | — | — | 105 | — | — | — | 105 | |||||||||||||||||||||
| Assets | ||||||||||||||||||||||||||||
12-31-2022 | Inversiones Puerto Coronel S.A. ThU.S.$ | Serv.Corporativos Sercor S.A. ThU.S.$ | Florestal Vale do Corisco S.A. ThU.S.$ | Falcão MS SPE S.A. ThU.S.$ | Consorcio Tecnológico Bioenercel S.A. ThU.S.$ | Genómica Forestal S.A. ThU.S.$ | Total ThU.S.$ | |||||||||||||||||||||
Current | 1 | 5,677 | 2,368 | 413 | — | 12 | 8,471 | |||||||||||||||||||||
Non-current | 129,819 | 2,273 | 73,089 | 19,136 | 4 | 52 | 224,373 | |||||||||||||||||||||
Total of associates | 129,820 | 7,950 | 75,457 | 19,549 | 4 | 64 | 232,844 | |||||||||||||||||||||
| Liabilities and Equity | ||||||||||||||||||||||||||||
| Inversiones Puerto Coronel S.A. ThU.S.$ | Serv.Corporativos Sercor S.A. ThU.S.$ | Florestal Vale do Corisco S.A. ThU.S.$ | Falcão MS SPE S.A. ThU.S.$ | Consorcio Tecnológico Bioenercel S.A. ThU.S.$ | Genómica Forestal S.A. ThU.S.$ | Total ThU.S.$ | ||||||||||||||||||||||
Current | 54 | 4,527 | 1,066 | 1 | — | 7 | 5,655 | |||||||||||||||||||||
Non-current | — | 1,798 | 19,475 | — | 3 | 28 | 21,304 | |||||||||||||||||||||
Equity | 129,766 | 1,625 | 54,916 | 19,548 | 1 | 29 | 205,885 | |||||||||||||||||||||
Total of associates | 129,820 | 7,950 | 75,457 | 19,549 | 4 | 64 | 232,844 | |||||||||||||||||||||
06-30-2022 | ||||||||||||||||||||||||||||
Income | — | 2,103 | 7,932 | — | — | — | 10,035 | |||||||||||||||||||||
Other income / expenses | 5,314 | (1,876 | ) | (3,699 | ) | — | (1 | ) | — | (262 | ) | |||||||||||||||||
Net profit or loss (continuing operations) of associates | 5,314 | 227 | 4,233 | — | (1 | ) | — | 9,773 | ||||||||||||||||||||
Other comprehensive income | — | — | — | — | — | — | — | |||||||||||||||||||||
Comprehensive income | 5,314 | 227 | 4,233 | — | (1 | ) | — | 9,773 | ||||||||||||||||||||
Dividends received | — | — | 102 | — | — | — | 102 | |||||||||||||||||||||
63
Table of Contents
CELULOSA ARAUCO Y CONSTITUCION S.A. AND SUBSIDIARIES
Unaudited interim consolidated financial statements
June 30, 2023
Amounts in thousands of U.S. dollars, except as indicated
Reconciliation of Investment in Associates and Joint Ventures
| 06-30-2023 ThU.S.$ | 12-31-2022 ThU.S.$ | |||||||
Opening balance as of January 1 | 365,671 | 336,642 | ||||||
Changes | ||||||||
Investment in joint ventures, additions (*) | 2,222 | 9,664 | ||||||
Investment in joint ventures, additions (**) | 6,763 | 32,252 | ||||||
Disposals, investment in associates and joint ventures (***) | — | (1,878 | ) | |||||
Share of profit (loss) in investment in associates | 1,947 | 7,069 | ||||||
Share of profit (loss) in investment in joint ventures | 16,031 | 26,615 | ||||||
Dividends received, Investments in associates | (105 | ) | (35,187 | ) | ||||
Increase (decrease) in foreign exchange currency on translation of associates and joint ventures | 7,219 | (11,779 | ) | |||||
Other increase (decrease) in investment in associates and joint ventures | (2,745 | ) | 2,273 | |||||
Total changes | 31,332 | 29,029 | ||||||
Closing balance | 397,003 | 365,671 | ||||||
Year 2023
| (*) | Arauco Participações Florestais Ltda. made a capital contribution to Falcão MS SPE S.A., for ThR$ 11,270 that is equivalent to ThU.S.$ 2,222 for 11,270,000 shares. |
| (**) | On January 9, 2023 Maderas Arauco S.A. made a capital contribution to E2E S.A., through the capitalization of loans maintained with this entity for Th$ 4,446,808 that is equivalent to ThU.S.$ 5,254 for 4,446,808 shares. |
| • | Forestal Arauco S.A. and Agrícola San Carlos SpA. In March 2023 made a non-monetary assets contribution to Agrícola Fresno SpA for ThU.S.$ 1,509. For this contribution they subscribed 266,204 and 35,556 shares respectively. In the act, Agrícola San Carlos SpA sold the subscribed shares of Agrícola Fresno SpA to Forestal Arauco S.A., maintaining Forestal Arauco S.A. a 50% of participation in Agrícola Fresno SpA. |
Year 2022
| (*) | During the year 2022, Arauco Participações Florestais Ltda. made a capital contribution to Falcão MS SPE S.A., for ThR$ 49,985 that in total is equivalent to ThU.S.$ 9,664 for 49,984,900 shares. |
| (**) | During the year 2022, the main movement corresponds to: |
| • | Forestal Arauco S.A. made a capital contribution in assets as non-monetary assets to Agrícola Fresno, for ThU.S.$ 31,998 for 6,399,520 shares. |
| (***) | ThU.S.$ 1,878 equivalent to R$ 9,800,000 corresponding to a capital decrease of Arauco Forest do Brasil S.A. en Florestal Vale Do Corisco S.A. on October 11, 2022. |
| 06-30-2023 ThU.S.$ | 12-31-2022 ThU.S.$ | |||||||
Carrying amount of investments in associates accounted for using equity method | 108,120 | 100,821 | ||||||
Carrying amount of investments in joint ventures accounted for using equity method | 288,883 | 264,850 | ||||||
Total investment accounted for using equity method | 397,003 | 365,671 | ||||||
64
Table of Contents
CELULOSA ARAUCO Y CONSTITUCION S.A. AND SUBSIDIARIES
Unaudited interim consolidated financial statements
June 30, 2023
Amounts in thousands of U.S. dollars, except as indicated
NOTE 16. INTERESTS IN JOINT ARRANGEMENTS
Investments and contributions made
The main operations carried out as of June 30, 2023 and December 31, 2022 are reported below:
AS of January 9, 2023, Maderas Arauco S.A. made a capital contribution to E2E S.A., through the capitalization of loans maintained with this entity for ThCLP$ 4,446,808(equivalent to ThU.S.$ 5,254) for 4,446,808 shares.
On October 13, 2021, Arauco, through its subsidiary Forestal Arauco S.A. created Agrícola Fresno SpA with the purpose of developing agricultural projects. It was incorporated with a capital of ThU.S.$ 1,000, Forestal Arauco S.A. contributed the equivalent of 50% of the shares of the new subsidiary. In November of 2021, it was agreed to increase the capital to ThU.S.$ 7,452 and during the period of 2022 ThU.S.$ 31,998, Forestal Arauco S.A. contributed all of the committed capital (50%) through the contribution of assets.
As of June 30, 2023 and December 31, 2022, Arauco has not made contributions to Uruguayan companies Celulosa y Energía Punta Pereira S.A. and Zona Franca Punta Pereira S.A.
The investments in Uruguay qualify as a joint operation, and Arauco holds a 50% interest in these investments. In relation to “other rights and contractual conditions”, the joint operation has the primary objective of providing the parties an output. As established in the “Pulp Supply Agreement”, both Arauco and its partner have the obligation to acquire 100% of the yearly pulp produced by the joint operation. Arauco has recognized the assets, liabilities, income and expenses associated with its interest ownership, pursuant to IFRS 11.
Arauco holds a 50% interest in Sonae Arauco, which subsidiary produces and commercializes wood panels, of the type of MDF, PB and OSB, and sawn timber, through the operation of 2 panel plants and one sawmill in Spain; 2 panel plants and one resin plant in Portugal; 3 panel plants in Germany and 2 panel plants in South Africa.
Furthermore, Arauco holds a 50% ownership in Eka Chile S.A. (“Eka”), a company that sells sodium chlorate to pulp plants in Chile. There is a contractual agreement with this company whereby Arauco has engaged in an economic activity subject to common control, which is classified as a joint venture.
65
Table of Contents
CELULOSA ARAUCO Y CONSTITUCION S.A. AND SUBSIDIARIES
Unaudited interim consolidated financial statements
June 30, 2023
Amounts in thousands of U.S. dollars, except as indicated
The following tables set forth summarized financial information of the more significant interests in joint arrangements, which qualify as joint operations:
| 06-30-2023 | 12-31-2022 | |||||||||||||||
Celulosa y Energía Punta Pereira S.A. (Uruguay) | Assets ThU.S.$ | Liabilities ThU.S.$ | Assets ThU.S.$ | Liabilities ThU.S.$ | ||||||||||||
Current | 494,662 | 88,441 | 478,480 | 114,012 | ||||||||||||
Non-current | 1,956,230 | 137,697 | 1,982,237 | 141,588 | ||||||||||||
Equity | — | 2,224,754 | — | 2,205,117 | ||||||||||||
Total joint arrangement | 2,450,892 | 2,450,892 | 2,460,717 | 2,460,717 | ||||||||||||
|
|
|
| |||||||||||||
Investment | 1,112,377 | 1,102,559 | ||||||||||||||
|
|
|
| |||||||||||||
| 06-30-2023 ThU.S.$ | 06-30-2022 ThU.S.$ | |||||||||||||||
Income | 528,491 | 451,710 | ||||||||||||||
Expenses | (327,352 | ) | (295,384 | ) | ||||||||||||
Joint arrangement net income (loss) | 201,139 | 156,326 | ||||||||||||||
| 06-30-2023 | 12-31-2022 | |||||||||||||||
Forestal Cono Sur S.A. (consolidated) | Assets ThU.S.$ | Liabilities ThU.S.$ | Assets ThU.S.$ | Liabilities ThU.S.$ | ||||||||||||
Current | 42,834 | 6,323 | 30,769 | 5,894 | ||||||||||||
Non-current | 149,017 | 1,718 | 158,787 | 4,119 | ||||||||||||
Equity | — | 183,810 | — | 179,543 | ||||||||||||
Total joint arrangement | 191,851 | 191,851 | 189,556 | 189,556 | ||||||||||||
|
|
|
| |||||||||||||
Investment | 91,905 | 89,772 | ||||||||||||||
|
|
|
| |||||||||||||
| 06-30-2023 ThU.S.$ | 06-30-2022 ThU.S.$ | |||||||||||||||
Income | 7,735 | 2,127 | ||||||||||||||
Expenses | (3,468 | ) | 2,425 | |||||||||||||
Joint arrangement net income (loss) | 4,267 | 4,552 | ||||||||||||||
| 06-30-2023 | 12-31-2022 | |||||||||||||||
Eufores S.A. (consolidated) | Assets ThU.S.$ | Liabilities ThU.S.$ | Assets ThU.S.$ | Liabilities ThU.S.$ | ||||||||||||
Current | 175,093 | 242,506 | 125,027 | 193,423 | ||||||||||||
Non-current | 905,034 | 105,578 | 892,452 | 119,050 | ||||||||||||
Equity | — | 732,043 | — | 705,006 | ||||||||||||
Total joint arrangement | 1,080,127 | 1,080,127 | 1,017,479 | 1,017,479 | ||||||||||||
|
|
|
| |||||||||||||
Investment | 366,022 | 352,503 | ||||||||||||||
|
|
|
| |||||||||||||
| 06-30-2023 ThU.S.$ | 06-30-2022 ThU.S.$ | |||||||||||||||
Income | 136,478 | 115,555 | ||||||||||||||
Expenses | (110,314 | ) | (89,428 | ) | ||||||||||||
Joint arrangement net income (loss) | 26,164 | 26,127 | ||||||||||||||
| 06-30-2023 | 12-31-2022 | |||||||||||||||
Zona Franca Punta Pereira S.A. (Uruguay) | Assets ThU.S.$ | Liabilities ThU.S.$ | Assets ThU.S.$ | Liabilities ThU.S.$ | ||||||||||||
Current | 41,284 | 126,011 | 13,824 | 101,385 | ||||||||||||
Non-current | 428,460 | — | 432,769 | — | ||||||||||||
Equity | — | 343,733 | — | 345,208 | ||||||||||||
Total joint arrangement | 469,744 | 469,744 | 446,593 | 446,593 | ||||||||||||
|
|
|
| |||||||||||||
Investment | 171,867 | 172,604 | ||||||||||||||
|
|
|
| |||||||||||||
| 06-30-2023 ThU.S.$ | 06-30-2022 ThU.S.$ | |||||||||||||||
Income | 10,536 | 10,551 | ||||||||||||||
Expenses | (12,011 | ) | (1,632 | ) | ||||||||||||
Joint arrangement net income (loss) | (1,475 | ) | 8,919 | |||||||||||||
66
Table of Contents
CELULOSA ARAUCO Y CONSTITUCION S.A. AND SUBSIDIARIES
Unaudited interim consolidated financial statements
June 30, 2023
Amounts in thousands of U.S. dollars, except as indicated
The following tables set forth summarized financial information of the more significant interests in joint ventures accounted in for equity method and its movements are presented in Note 15:
| 06-30-2023 | 12-31-2022 | |||||||||||||||
Eka Chile S.A. | Assets ThU.S.$ | Liabilities ThU.S.$ | Assets ThU.S.$ | Liabilities ThU.S.$ | ||||||||||||
Current | 19,959 | 5,629 | 17,673 | 4,821 | ||||||||||||
Non-current | 39,235 | 5,256 | 39,496 | 5,347 | ||||||||||||
Equity | — | 48,309 | — | 47,001 | ||||||||||||
Total joint arrangement | 59,194 | 59,194 | 57,169 | 57,169 | ||||||||||||
|
|
|
| |||||||||||||
Investment | 24,155 | 23,501 | ||||||||||||||
|
|
|
| |||||||||||||
| 06-30-2023 ThU.S.$ | 06-30-2022 ThU.S.$ | |||||||||||||||
Income | 24,048 | 23,281 | ||||||||||||||
Expenses | (22,741 | ) | (20,494 | ) | ||||||||||||
Joint arrangement net income (loss) | 1,307 | 2,787 | ||||||||||||||
|
|
|
| |||||||||||||
Other comprehensive income | — | — | ||||||||||||||
Comprehensive income | 1,307 | 2,787 | ||||||||||||||
Dividends | — | — | ||||||||||||||
| 06-30-2023 | 12-31-2022 | |||||||||||||||
Sonae Arauco S.A. | Assets ThU.S.$ | Liabilities ThU.S.$ | Assets ThU.S.$ | Liabilities ThU.S.$ | ||||||||||||
Current | 334,125 | 254,991 | 320,837 | 229,330 | ||||||||||||
Non-current | 685,978 | 316,871 | 668,138 | 352,759 | ||||||||||||
Equity | — | 448,241 | — | 406,886 | ||||||||||||
Total joint arrangement | 1,020,103 | 1,020,103 | 988,975 | 988,975 | ||||||||||||
|
|
|
| |||||||||||||
Net assets | 202,567 | 180,896 | ||||||||||||||
Net asset adjustment (goodwill) | 21,554 | 22,547 | ||||||||||||||
Investment | 224,121 | 203,443 | ||||||||||||||
| 06-30-2023 ThU.S.$ | 06-30-2022 ThU.S.$ | |||||||||||||||
Income | 578,022 | 717,298 | ||||||||||||||
Expenses | (540,340 | ) | (640,471 | ) | ||||||||||||
Joint arrangement net income (loss) | 37,682 | 76,827 | ||||||||||||||
|
|
|
| |||||||||||||
Other comprehensive income | — | — | ||||||||||||||
Comprehensive income | 37,682 | 76,827 | ||||||||||||||
Dividends | — | 33,176 | ||||||||||||||
| 06-30-2023 | 12-31-2022 | |||||||||||||||
Agrícola El Paque SpA. | Assets ThU.S.$ | Liabilities ThU.S.$ | Assets ThU.S.$ | Liabilities ThU.S.$ | ||||||||||||
Current | 259 | 182 | 966 | 1,360 | ||||||||||||
Non-current | 16,876 | 2,848 | 18,914 | 5,450 | ||||||||||||
Equity | — | 14,105 | — | 13,070 | ||||||||||||
Total joint arrangement | 17,135 | 17,135 | 19,880 | 19,880 | ||||||||||||
|
|
|
| |||||||||||||
Investment | 7,052 | 6,534 | ||||||||||||||
|
|
|
| |||||||||||||
| 06-30-2023 ThU.S.$ | 06-30-2022 ThU.S.$ | |||||||||||||||
Income | — | — | ||||||||||||||
Expenses | (36 | ) | 194 | |||||||||||||
Joint arrangement net income (loss) | (36 | ) | 194 | |||||||||||||
|
|
|
| |||||||||||||
Other comprehensive income | — | — | ||||||||||||||
Comprehensive income | (36 | ) | 194 | |||||||||||||
Dividends | — | — | ||||||||||||||
| 06-30-2023 | 12-31-2022 | |||||||||||||||
Parque Eólico Ovejera del Sur SpA. | Assets ThU.S.$ | Liabilities ThU.S.$ | Assets ThU.S.$ | Liabilities ThU.S.$ | ||||||||||||
Current | 62 | 63 | 100 | 224 | ||||||||||||
Non-current | 3,175 | — | 2,885 | — | ||||||||||||
Equity | — | 3,174 | — | 2,761 | ||||||||||||
Total joint arrangement | 3,237 | 3,237 | 2,985 | 2,985 | ||||||||||||
|
|
|
| |||||||||||||
Investment | 1,587 | 1,381 | ||||||||||||||
|
|
|
| |||||||||||||
| 06-30-2023 ThU.S.$ | 06-30-2022 ThU.S.$ | |||||||||||||||
Income | — | — | ||||||||||||||
Expenses | (23 | ) | (5 | ) | ||||||||||||
Joint arrangement net income (loss) | (23 | ) | (5 | ) | ||||||||||||
|
|
|
| |||||||||||||
Other comprehensive income | — | — | ||||||||||||||
Comprehensive income | (23 | ) | (5 | ) | ||||||||||||
Dividends | — | — | ||||||||||||||
67
Table of Contents
CELULOSA ARAUCO Y CONSTITUCION S.A. AND SUBSIDIARIES
Unaudited interim consolidated financial statements
June 30, 2023
Amounts in thousands of U.S. dollars, except as indicated
| 02-28-2023 | 12-31-2022 | |||||||||||||||
E2E S.A. | Assets ThU.S.$ | Liabilities ThU.S.$ | Assets ThU.S.$ | Liabilities ThU.S.$ | ||||||||||||
Current | 7,693 | 20,282 | 7,361 | 20,327 | ||||||||||||
Non-current | 21,411 | 2,520 | 20,914 | 11,301 | ||||||||||||
Equity | — | 6,302 | — | (3,353 | ) | |||||||||||
Total joint arrangement | 29,104 | 29,104 | 28,275 | 28,275 | ||||||||||||
|
|
|
| |||||||||||||
Investment | 3,151 | — | ||||||||||||||
|
|
|
| |||||||||||||
| 02-28-2023 ThU.S.$ | 06-30-2022 ThU.S.$ | |||||||||||||||
Income | 224 | 1,176 | ||||||||||||||
Expenses | (1,244 | ) | (2,354 | ) | ||||||||||||
Joint arrangement net income (loss) | (1,020 | ) | (1,178 | ) | ||||||||||||
|
|
|
| |||||||||||||
Other comprehensive income | — | — | ||||||||||||||
Comprehensive income | (1,020 | ) | (1,178 | ) | ||||||||||||
Dividends | — | — | ||||||||||||||
| 06-30-2023 | 12-31-2022 | |||||||||||||||
Agrícola San Gerardo SpA. | Assets ThU.S.$ | Liabilities ThU.S.$ | Assets ThU.S.$ | Liabilities ThU.S.$ | ||||||||||||
Current | 569 | 53 | 844 | 62 | ||||||||||||
Non-current | 5,152 | 1,879 | 5,661 | 2,871 | ||||||||||||
Equity | — | 3,789 | — | 3,572 | ||||||||||||
Total joint arrangement | 5,721 | 5,721 | 6,505 | 6,505 | ||||||||||||
|
|
|
| |||||||||||||
Investment | 1,895 | 1,786 | ||||||||||||||
|
|
|
| |||||||||||||
| 06-30-2023 ThU.S.$ | 06-30-2022 ThU.S.$ | |||||||||||||||
Income | — | — | ||||||||||||||
Expenses | (30 | ) | 43 | |||||||||||||
Joint arrangement net income (loss) | (30 | ) | 43 | |||||||||||||
|
|
|
| |||||||||||||
Other comprehensive income | — | — | ||||||||||||||
Comprehensive income | (30 | ) | 43 | |||||||||||||
Dividends | — | — | ||||||||||||||
| 06-30-2023 | 12-31-2022 | |||||||||||||||
Agrícola Fresno SpA | Assets ThU.S.$ | Liabilities ThU.S.$ | Assets ThU.S.$ | Liabilities ThU.S.$ | ||||||||||||
Current | 7,485 | 1,348 | 28,952 | 1,657 | ||||||||||||
Non-current | 77,204 | — | 58,755 | 7,232 | ||||||||||||
Equity | — | 83,341 | — | 78,818 | ||||||||||||
Total joint arrangement | 84,689 | 84,689 | 87,707 | 87,707 | ||||||||||||
|
|
|
| |||||||||||||
Investment | 41,671 | 39,409 | ||||||||||||||
|
|
|
| |||||||||||||
| 06-30-2023 ThU.S.$ | 06-30-2022 ThU.S.$ | |||||||||||||||
Income | — | — | ||||||||||||||
Expenses | (53 | ) | 48 | |||||||||||||
Joint arrangement net income (loss) | (53 | ) | 48 | |||||||||||||
|
|
|
| |||||||||||||
Other comprehensive income | — | — | ||||||||||||||
Comprehensive income | (53 | ) | 48 | |||||||||||||
Dividends | — | — | ||||||||||||||
68
Table of Contents
CELULOSA ARAUCO Y CONSTITUCION S.A. AND SUBSIDIARIES
Unaudited interim consolidated financial statements
June 30, 2023
Amounts in thousands of U.S. dollars, except as indicated
NOTE 17. IMPAIRMENT OF ASSETS
In 2022, as a result of loss of dryer, an impairment provision was made for ThU.S.$ 10,500 in Valdivia mill, which was recognized into impairment provisions of assets.
In 2022, as a result of closing MDP line of Pien mill in Brasil, an impairment provision was made for ThU.S.$ 14,388, which amount include an impairment of goodwill for ThU.S.$ 3,895.
At the end of 2022, considering the current projections of future margins, exchange differences and the sustained increasing risk in the Argentine Republic, and applying the usual procedures for determining impairment in accordance with IFRS, in the subsidiary Arauco Argentina, an impairment was recorded in the cash generating unit for the manufacture of cellulose pulp in the amount of ThU.S.$ 127,605.
The premises included in this projection consider a discount rate of 22.07%, sales volume based on expected production data, sales prices based on the projection of international consultants and future investments of the machinery in its current state.
As of June 30, 2022 the subsidiaries of United States and Canada, impairment provisions associated with sold and recovered from property, plant and equipment were reversed for a total of ThU.S.$ 6,381 (ThU.S.$ 7,014 as of December 31, 2022).
All impairment provision charges are presented in the interim consolidated statement of profit or loss under other expenses by function, whose movements are shown below:
Changes in CGUs impairment provision | 06-30-2023 ThU.S.$ | 12-31-2022 ThU.S.$ | ||||||
Opening balance | 348,350 | 214,042 | ||||||
Impairment loss recognized in profit or loss | — | 141,137 | ||||||
Reversal of impairment loss recognized in profit or loss | (6,760 | ) | (9,164 | ) | ||||
Increase (decrease) in foreign exchange | 5,082 | 2,335 | ||||||
Closing balance | 346,672 | 348,350 | ||||||
Changes in provisions for impairment of property, plant and equipment and spare parts due to technical obsolescence or loss to forest due to fires, are shown below:
Changes in impairment provision from impaired assets | 06-30-2023 ThU.S.$ | 12-31-2022 ThU.S.$ | ||||||
Opening balance | 18,085 | 11,798 | ||||||
Impairment loss recognized in profit or loss | 3,097 | 13,823 | ||||||
Reverse of impairment recognized loss in profit or loss | (188 | ) | (7,691 | ) | ||||
Increase (decrease) in foreign exchange | 126 | 155 | ||||||
Closing balance | 21,120 | 18,085 | ||||||
69
Table of Contents
CELULOSA ARAUCO Y CONSTITUCION S.A. AND SUBSIDIARIES
Unaudited interim consolidated financial statements
June 30, 2023
Amounts in thousands of U.S. dollars, except as indicated
Goodwill
Goodwill is allocated to the groups of cash-generating units that are expected to benefit from the synergies of the combination.
At the date of these interim consolidated financial statements, the balance of goodwill is ThU.S.$ 55,954 (ThU.S.$ 54,800 on December 31, 2022), as shown below:
| 06-30-2023 | 12-31-2022 | |||||||
Goodwill | ThU.S.$ | ThU.S.$ | ||||||
Arauco Canada Ltd. (Flakeboard Company Ltd) | 40,723 | 40,676 | ||||||
Arauco do Brasil S.A. (Pien mill) | 14,499 | 13,392 | ||||||
Arauco North America, Inc. (Prime-Line, Inc.) | 732 | 732 | ||||||
|
|
|
| |||||
Closing balance | 55,954 | 54,800 | ||||||
|
|
|
| |||||
| 06-30-2023 | 12-31-2022 | |||||||
Goodwill movement | ThU.S.$ | ThU.S.$ | ||||||
Opening balance at January 1 | 54,800 | 57,697 | ||||||
Increase (decrease) impairment | — | (3,895 | ) | |||||
Increase (decrease) in foreign exchange | 1,154 | 998 | ||||||
Closing balance | 55,954 | 54,800 | ||||||
Of the total of goodwill, ThU.S.$ 40,723 (ThU.S.$ 40,676 as of December 31, 2022) were generated by the acquisition of “Flakeboard” (currently Arauco Canada Ltd.), a company that, directly and/or through its subsidiaries, possesses and operates 7 panel plants, for which Arauco acquired and paid, on September 24, 2012, the price of ThU.S.$ 242,502 for the 100% interest ownership. The remaining balance of ThU.S.$ 732 corresponds to the acquisition of Prime-Line Inc., on September 1, 2019, for which Arauco North America Inc, a subsidiary of Arauco Canada Ltd. paid ThU.S.$ 18,880 for all the shares of said company.
The recoverable amount for Flakeboard’s cash generating unit was determined based on the calculations of its value in use, and this calculation was made using cash flow projections covering a 7-year term, a period time, which is considered to represent the cyclicality of the business performance, applying a nominal discount rate of 7% which reflects current market assessments for the wood products segment in North America.
Due to the investment in panel plant in Pien, Brazil, there is a goodwill of ThU.S.$ 14,499 (ThU.S.$ 13,392 as of December 31, 2022).
The recoverable amount for the Pien mill’s cash generating unit was determined based on the calculations of its value in use, and this calculation was made using cash flow projections covering a 5-year term based on the operational plan approved by the Administration, applying a 7.4% nominal discount rate that reflects current evaluations for the panel segment in Brazil.
As of June 30, 2023, the carrying value of the goodwill of the plants did not exceed their recoverable value, except at the end of December 2022 in Brazil for the MDF line of the Pien mill, was recognized an impairment of the goodwill, and it was for ThU.S.$ 3,895.
70
Table of Contents
CELULOSA ARAUCO Y CONSTITUCION S.A. AND SUBSIDIARIES
Unaudited interim consolidated financial statements
June 30, 2023
Amounts in thousands of U.S. dollars, except as indicated
NOTE 18. PROVISIONS, CONTINGENT ASSETS AND CONTINGENT LIABILITIES
The contingent liabilities for outstanding litigations are as follows:
Celulosa Arauco y Constitución S.A.
On April 26, 2023, Ingeniería y Construcción Sigdo Koppers S.A. (“ICSK”) filed before the Arbitration and Mediation Center of the Santiago Chamber of Commerce an arbitration claim against the Company, requesting the specific performance of contract No. 906, Civil Electromechanical Assembly Digester, Washing, Bleaching, Machine and Final Line, executed between the parties on June 18th, 2019 (“Contract”), also seeking the compensation of damages. The total sum claimed by ICSK amounts to $ 246,650,876,566 Chilean pesos (ThU.S.$ 307,675 as of June 30, 2023), plus adjustments. It is relevant to highlight that, according to ICSK’s claim, the above amount should be reduced by $ 60,657,576,943 Chilean pesos (ThU.S.$ 75,665 as of June 30, 2023), owed by ICSK to Arauco, once the claimed amount has been readjusted. ICSK also requests that the claimed sum be paid with current interest, computed as of April 2023.
On June 16, 2023, Arauco answered the claim filed by ICSK, requesting the rejection of the claim. Simultaneously, Arauco filed a counterclaim against ICSK, seeking a declaration that ICSK breached the term of the Contract and, consequently, for the arbitration court to order ICSK to pay the fine associated with such breach, which amounted, at the time the claim was answered, to the sum of $ 37,302,818,060 Chilean pesos (ThU.S.$ 46,532 as of June 30, 2023). Arauco also demanded the restitution of the total amount of $ 60,657,576,943 Chilean pesos (ThU.S.$ 75,665 as of June 30, 2023), plus adjustments and interest, paid to ICSK during the performance of the Contract as consideration for various items.
The arbitration is currently in its discussion period, as set out in the defined arbitration process.
Considering that the Company’s position is supported by sound legal arguments, it is reasonably likely that the Company will obtain a favorable outcome and therefore, as of June 30, 2023, Arauco has not made any provision whatsoever in connection with this contingency.
Celulosa Arauco y Constitución S.A., Forestal Arauco S.A., Maderas Arauco S.A. and Servicios Logísticos Arauco S.A.
1. On August 13, 2018, Asociación Gremial de Dueños de Camiones de Constitución (ASODUCAM) filed a complaint seeking the performance of a contract and claiming compensation for damages against Celulosa Arauco y Constitución S.A. before the Civil Court of Constitución (C-757-2018), Forestal Arauco S.A., Maderas Arauco S.A. and Servicios Logísticos Arauco S.A., The complaint is based on alleged breaches of some agreements for the allocation, distribution and supply of cargo volumes for the years 2001 and 2005, initially executed by associates of ASODUCAM with Forestal Arauco S.A., and then, allegedly, with Servicios Logísticos Arauco S.A., in favor of the other two defendants, Celulosa Arauco and Constitución S.A. and Maderas Arauco S.A. The complaint seeks to enforce the contract, plus $575,000,000 Chilean pesos (equal to ThU.S.$ 717 as of June 30, 2023) in compensation for damages. In the alternative, it claims (a) CLP$11,189,270,050 (equivalent to ThU.S.$ 13,958 as of June 30, 2023), for actual damages; (b) CLP$ 11,189,270,050 monthly during the entire course of the trial, until the termination of the contract is declared in the final ruling, for loss of profits, and (c) CLP$5,000,000,000 (equivalent to ThU.S.$ 6,237 as of June 30, 2023) for moral damages.
71
Table of Contents
CELULOSA ARAUCO Y CONSTITUCION S.A. AND SUBSIDIARIES
Unaudited interim consolidated financial statements
June 30, 2023
Amounts in thousands of U.S. dollars, except as indicated
On August 28, 2018 the claim was served upon Celulosa Arauco y Constitución S.A., Forestal Arauco S.A. and Maderas Arauco S.A., but notification for Servicios Logísticos Arauco S.A. is pending.
By resolution dated February 28, 2023, the court ordered the case to be archived.
Forestal Arauco S.A.
On July 7, 2015 Inversiones Forestales Los Alpes Limitada and Forestal Neltume-Carrasco S.A. filed a claim against Forestal Arauco S.A. before the Civil Court of Angol (C-502-2015), in which they request that Forestal Arauco S.A. restitute the material possession of 1,855.9 hectares, which would be part of their property “Resto del Fundo Los Alpes”, which would have an area of approximately 2,700 hectares. Likewise, they requested that it be declared that the property is the exclusive domain of the actors, the restitution of the civil and natural fruits, in addition to the deteriorations that the property would have experienced, with litigation costs.
On May 29, 2019, the lawsuit was answered, and the counterclaim of the acquisitive prescription was filed.
On September 1, 2020, the court received the case. Moreover, the resolution was notified on August 30, 2022, along with the resolution to reactivate the discovery period.
On September 2, 2022, the company filed an abandonment incident of procedures, which is pending.
Considering that the Company’s position is based on solid legal grounds, there is a reasonable margin for obtaining a favorable result for the Company and therefore, as of June 30, 2023, Arauco has not made any provision whatsoever in connection with this contingency.
Arauco Argentina S.A.
Pursuant to law No. 25,080, the former Secretary of Agriculture, Livestock, Fishing and Foodstuffs, the enforcement agency referred to in the law approved, by Res. No. 952/2000, the forestry and industrial-forestry projects submitted by Arauco Argentina S.A. In the context of these projects, the Company afforested: 1) 4,777 hectares during 2000, in observance of its committed yearly plan; and 2) 23,012 hectares between 2000 and 2006 as a part of the multi-year afforestation plan. Likewise, a sawmill was built with installed capacity to produce 250,000 m3 of sawn timber per year.
On January 11, 2001, Arauco Argentina S.A. submitted an expansion for the approved industrial-forestry project. The expansion was approved via Res. No. 84/03 issued by the former Secretary of Agriculture, Livestock, Fishing and Foodstuffs. In accordance with the assumed obligations, the Company built a MDF board (panels) plant and afforested 8,089 hectares between 2001 and 2006.
72
Table of Contents
CELULOSA ARAUCO Y CONSTITUCION S.A. AND SUBSIDIARIES
Unaudited interim consolidated financial statements
June 30, 2023
Amounts in thousands of U.S. dollars, except as indicated
Additionally, the Company has filed yearly forestry plans between years 2007 and 2020 for its local operations in the provinces of Misiones and Buenos Aires.
On March 25, 2019, the Secretary of Agriculture, Livestock and Fishing approved the resolution No. 2019-55-APN-SECAGYP#MPYT, approving the annual forestry plan for 2007. In addition, said organism through the resolution No. 2019-114-APN-SECAGYP#MPYT approved the annual forestry plan for 2009 on June 12, 2019, and through the resolution No. 2019-228-APN-SECAGYP#MPYT approved the annual forestry plan for 2008 on November 29, 2019. For this reason, Arauco Argentina S.A. may compute the exemption in the income tax related to the forest appraisal on the plantations to be harvested from the lands included in those plans as from the 2019 period.
In March 2005, Note No. 145/05 of the Subsecretary of Agriculture, Livestock and Afforestation suspended the benefit that exempted Arauco Argentina S.A. from paying export duties under Law No. 25,080. This measure is currently under discussion by the Company. On November 8, 2006, the V Chamber of the National Appeals Court for Adversarial Administrative and Federal Matters issued a ruling ordering Arauco Argentina S.A. to continue to enjoy an exemption from paying the exportation duties, in the same manner and scope it had prior to the suspension ordered by Note No. 145/05, if the clearance of merchandise is performed pursuant to the guarantee regime established in article 453, subsection a) of the Customs Code, for the exempted tax obligation. The judicial measure became effective beginning in March of 2007 by collateralization through the granting of bond (caution) policies for each shipment permits exempted from payment of export duty. The company maintains an assignment of funds equivalent to $ 23,821 June 30, 2023 for guaranteed export duties between 2007-2015, which appears under long-term provisions. Additionally, the Company filed a restitution claim for a total amount of ThU.S.$ 6,555, plus interest accrued from the service of the claim, corresponding to export duties between March 2005 and March 2007, as a result of the application of Note 145/05 issued by the Undersecretary of Agriculture, Livestock and Afforestation. The Company’s claim is being heard under case file No. 21830/2006 before the Federal Contentious Administrative Court No. 4. On October 28, 2019, a judgment of first instance was issued in said case, rejecting the claim and imposing the litigation costs on Arauco. Against that judgment, the Company filed an appeal and expressed the corresponding arguments in December 2019. On June 15, 2022, the Chamber of Appeals confirmed the judgement of first instance. On July 1, 2022, Arauco Argentina filed the Federal Extraordinary Appeal before the Supreme Court of Justice. The Chamber admitted the appeal lodged by Arauco regarding the federal matter of the litigation; however, the grounds pertaining to arbitrariness were dismissed. Arauco filed a direct complaint before the Supreme Court, seeking for the higher court to broaden its examination of the case and also address such argument. This resolution of this petition is still pending.
On the other hand, Arauco Argentina S.A. currently has a guarantee at an amount of $ 435,952,315 Argentine pesos (ThU.S.$ 1,698 as of June 30, 2023) in favor of the Secretary of Agriculture, Livestock and Fishing.
Arauco Argentina S.A. believes that it has complied with all of the obligations imposed upon it by the system set forth under Law No. 25,080.
Arauco do Brasil S.A.
1) The Federal Reserve of Brazil contested the amortization of goodwill resulting from acquisitions of Placas do Paraná, Tafibrás, Tafisa (now, Arauco do Brasil S.A.) y Dynea.
73
Table of Contents
CELULOSA ARAUCO Y CONSTITUCION S.A. AND SUBSIDIARIES
Unaudited interim consolidated financial statements
June 30, 2023
Amounts in thousands of U.S. dollars, except as indicated
On July 20, 2015, Arauco do Brasil was notified of the first-level administrative ruling which partially upheld the infringement. Against this ruling, a Voluntary Appeal was filed seeking to revoke the Infringement Notice before the Brazilian Administrative Tax Council (Conselho Administrativo de Recursos Fiscais de Brasil or “CARF”), which is the second administrative level.
The CARF’s decision was issued on May 16, 2017 and took into consideration certain arguments presented by the Company regarding the premium but preserving other charges. On September 27, 2018, Arauco do Brasil was notified of the CARF’s decision, for which Arauco do Brasil S.A. filed an appeal for declaration embargoes, to elicit clarifications from the CARF regarding certain points of the decision. On January 25, 2019, the CARF ruled that there were no clarifications or omissions to be made and, consequently, granted a term for filing the last remedy within the administrative realm (“Special Remedy”). This Special Remedy was submitted before the Upper Chamber of Fiscal Remedies of the CARF (CSRF) on February 11, 2019, reiterating the Company’s defense allegations regarding the matters and charges that remained in such process.
On August 28, 2020, the Company was served with an intermediate decision in Grievance of Instrument, issued by CARF that divided the claim into two parts, one at the administrative level and the other one at the judicial level:
I – The administrative level fine(deductibility of interest and isolated fine of 50%) whose estimated amount of R$34.5 million (equivalent to ThU.S.$ 7,204 as of June 30, 2023). Pursuant to these requirements on March 27, 2023, Arauco do Brasil adhered to the government program of reduction of fiscal litigation which permits a reduction of the 65% of the entire amount of the debt through the payment of the 35% of the debt in two ways: (a) payment in cash of the 30%, totaling R$3.7 million (ThU.S.$ 767 as of June 30, 2023) and (b) payment of 70% of fiscal losses, totaling R$8.6 million (ThU.S.$ 1,790 as of June 30, 2023).
Subsequently, Arauco do Brasil performed the payment in cash and also the offset with tax losses. Notwithstanding the foregoing, the Federal Reserve of Brazil (Brazilian tax service) must confirm Arauco do Brasil’s compliance with the program, thus closing the part of the case which was being reviewed before an administrative venue.
II – Part of the case that remained in a judicial venue (contractual expenses deducted in the purchase of Tafisa Brasil; interest and legal expenses on debts in the amnesty program; Imposto de Renda Pessoa Jurídica, or “IRPJ”, and lower Contribuição Social sobre o Lucro Líquido, or “CSLL” whose updated estimated amount is R$ 42,167,507 (ThU.S.$ 8,803 as of June 30, 2023). Arauco do Brasil filed the Tax Debt Annulment Action.
On March 9, 2023, the trial court issued a judgment that was partially favorable to Arauco do Brasil, upholding the aforementioned claims, and thus setting aside the portion of the debt corresponding to R$ 26,554,677 (ThU.S.$ 5,544 as of June 30, 2023). However, the judgment rejected the claim related to interest and legal expenses on debts under the amnesty program, which amount to R$ 15,612,831 (ThU.S.$ 3,259 as of June 30, 2023).
Arauco filed a motion to clarify the ruling, which was partially upheld to correct a material error in the judgment. On May 29, 2023, the Federal Reserve filed an appeal seeking the revocation of the judgment in the section that was favorable to Arauco, while, on June 26, 2023, Arauco also filed an appeal, but seeking the ratification of the judgment regarding interest and legal expenses on debts in the amnesty program. Arauco filed its counter-arguments to the Appeal of the National Treasury and is currently awaiting the filing of counter-arguments by the National Treasury to subsequently send the case to the Court for an appellate judgment.
74
Table of Contents
CELULOSA ARAUCO Y CONSTITUCION S.A. AND SUBSIDIARIES
Unaudited interim consolidated financial statements
June 30, 2023
Amounts in thousands of U.S. dollars, except as indicated
Considering that the Company’s position is supported by solid legal arguments, there is a reasonable margin of obtaining a favorable result for the Company and that is why, as of June 30, 2023, Arauco has not established any provision for this contingency.
2) In 2013, a service provider instituted a civil lawsuit against us seeking compensation for damages allegedly caused by Arauco’s unilateral termination of its contract in connection with the implementation of the MDF 2 line of the Jaguariaiva mill. On November 01, 2021, the Civil Court of Curitiba issued its ruling, ordering Arauco to pay to the service provider an amount of ThR$ 84,000 (ThU.S.$ 17,537 as of June 30, 2023) in consideration of the alleged damages borne by the service provider during the course of the services contracts and as a result of its early termination by Arauco.
After the judgment, we were summoned and on March 8, 2022 we filed an Appeal, and the opposing party was summoned to present arguments on our appeal and filed the petition on April 11, 2022, also appealing the judgment.
In April 2023, a favorable ruling was handed down in our Appeal and we succeeded in annulling the judgment so that the case could return to its origin. This annulment ruling will also affect the expert evidence, which will have to be produced again. As a result, the provision of R$ 42,945,528 (ThU.S.$ 8,966 as of June 30, 2023) was fully reversed.
In May 2023, the contractor company filed a Motion for Clarification presenting alleged omissions, in an attempt to preserve the decision or at least the evidence already produced. Review of these remedies is currently pending.
Arauco Industria de México, S.A. de C.V. (before Maderas y Sintéticos de México, S.A. de C.V.
On December 12, 2022, the Tax Administration Service issued tax credit assessment resolution number 900-04-04-00-00-00-2022-978 corresponding to the 2014 tax year. Under such assessment, objections against the following items were filed: (i) the deduction of interest in the historical amount of $ 85,172,274 Mexican pesos (ThU.S.$ 4,973 as of June 30, 2023), from loans granted by Masisa S.A. (Chile); (ii) the tax loss in the total amount of $ 275,986,671 Mexican pesos (ThU.S.$ 16,116 as of June 30, 2023); (iii) the deduction of payments made to Masisa S.A. for logistics services in the total amount of $ 3,058,221 Mexican pesos (ThU.S.$ 179 as of June 30, 2023); (iv) the alleged generation of non-distributed dividends related to the payments indicated in items (i) and (iii) above; (v) the rejection of contributions to the Single Contribution Account in amounts expressed in Mexican pesos of $ 342,372,000 (ThU.S.$ 19,992 as of June 30, 2023), $ 66,250,020 (ThU.S.$ 3,868 as of June 30, 2023), $ 46,389,980 (ThU.S.$ 2,709 as of June 30, 2023) and $ 11,457,000 Mexican pesos (ThU.S.$ 669 as of June 30, 2023), respectively; and (vi) an alleged incorrect application of the double taxation avoidance treaty between Mexico and Chile. The total amount of omitted tax, updates, surcharges, and fines assessed to the company amounts to $ 423,687,300 Mexican pesos (ThU.S.$ 24,740 as of June 30, 2023).
75
Table of Contents
CELULOSA ARAUCO Y CONSTITUCION S.A. AND SUBSIDIARIES
Unaudited interim consolidated financial statements
June 30, 2023
Amounts in thousands of U.S. dollars, except as indicated
On February 13, 2023, a motion to revoke was filed against the above assessment, before the General Legal Administration of the Tax Administration Service. Currently, additional evidence was submitted, and subsequently, the tax authorities must issue a ruling which, if unfavorable, could be challenged by the Company before the Federal Court of Administrative Justice.
Considering that the Company’s position is supported by solid legal arguments, there is a reasonable margin to obtain a favorable outcome for the Company and therefore, as of June 30, 2023, Arauco has not yet made any provision for this contingency.
At the closing date, there are no other contingencies in which the Companies act as obligor, that may significantly affect their financial, economic or operational conditions.
Provisions recorded as of June 30, 2023 and December 31, 2022 are as follows:
| 06-30-2023 | 12-31-2022 | |||||||
Classes of Provisions | ThU.S.$ | ThU.S.$ | ||||||
Short-term provisions | 7,418 | 9,513 | ||||||
Provisions for litigations | 688 | 639 | ||||||
Other short-term provisions | 6,730 | 8,874 | ||||||
Long-term provisions, non-Current | 30,719 | 40,706 | ||||||
Provisions for litigations | 30,719 | 39,029 | ||||||
Other long-term provisions | — | 1,677 | ||||||
Total provisions | 38,137 | 50,219 | ||||||
| 06-30-2023 | ||||||||||||
Movements in provisions | Litigations (*) ThU.S.$ | Other Provisions (**) ThU.S.$ | Total ThU.S.$ | |||||||||
Opening balance | 39,668 | 10,551 | 50,219 | |||||||||
Changes in provisions | ||||||||||||
Additional provisions | 19,415 | — | 19,415 | |||||||||
Used provisions | (26,810 | ) | (2,273 | ) | (29,083 | ) | ||||||
Increase (decrease) in foreign exchange | (856 | ) | 128 | (728 | ) | |||||||
Other increases (decreases) | (10 | ) | (1,676 | ) | (1,686 | ) | ||||||
Total changes | (8,261 | ) | (3,821 | ) | (12,082 | ) | ||||||
Closing balance | 31,407 | 6,730 | 38,137 | |||||||||
| (*) | The increase in litigations is mainly made up of ThU.S.$ 17,794 (subsidiaries in Brazil) for civil and labor lawsuits. In addition, the decrease legal litigations correspond mainly to the reversal of the provision for a lawsuit with a supplier in the Arauco do Brasil S.A. |
| (**) | The decrease in Other Provisions corresponds mainly to the reversal of the provision for dismantling of Line 1 o Arauco mill and the decrease in the balance of the provision for negative equity of E2E S.A. |
| 12-31-2022 | ||||||||||||
Movements in provisions | Litigations (*) ThU.S.$ | Other Provisions ThU.S.$ | Total ThU.S.$ | |||||||||
Opening balance | 29,886 | — | 29,886 | |||||||||
Changes in provisions | ||||||||||||
Additional provisions | 24,582 | 8,875 | 33,457 | |||||||||
Used provisions | (13,652 | ) | — | (13,652 | ) | |||||||
Increase (decrease) in foreign exchange | (1,144 | ) | — | (1,144 | ) | |||||||
Other increases (decreases) | (4 | ) | 1,676 | 1,672 | ||||||||
Total changes | 9,782 | 10,551 | 20,333 | |||||||||
Closing balance | 39,668 | 10,551 | 50,219 | |||||||||
| (*) | The increase in litigations is mainly made up of ThU.S.$ 24,533 (subsidiaries in Brazil) for civil and labor lawsuits. |
| (**) | The increase in Other Provisions corresponds to the dismantling L1. |
Provisions for litigations are related to labor and tax claims whose payment period is uncertain. Other provisions mainly include constitution of provision for the lawsuit of export duties (see Arauco Argentina’s contingent liability set forth in this note).
76
Table of Contents
CELULOSA ARAUCO Y CONSTITUCION S.A. AND SUBSIDIARIES
Unaudited interim consolidated financial statements
June 30, 2023
Amounts in thousands of U.S. dollars, except as indicated
NOTE 19. INTANGIBLE ASSETS
| 06-30-2023 | 12-31-2022 | |||||||
Classes of intangible assets, net | ThU.S.$ | ThU.S.$ | ||||||
Intangible assets, net | 68,532 | 73,439 | ||||||
Intangible assets under development (IT programs) | 5,718 | 5,076 | ||||||
Computer software | 19,225 | 22,323 | ||||||
Water rights | 5,007 | 5,185 | ||||||
Customer relationship | 21,805 | 24,015 | ||||||
Other identifiable intangible assets | 16,777 | 16,840 | ||||||
Classes of intangible assets, gross | 228,067 | 226,642 | ||||||
Intangible assets under development (IT programs) | 5,718 | 5,076 | ||||||
Computer software | 119,705 | 119,353 | ||||||
Water rights | 5,007 | 5,185 | ||||||
Customer relationship | 75,316 | 74,860 | ||||||
Other identifiable intangible assets | 22,321 | 22,168 | ||||||
Classes of accumulated amortization and impairment | ||||||||
Total accumulated amortization and impairment | (159,535 | ) | (153,203 | ) | ||||
Accumulated amortization and impairment, intangible assets | (159,535 | ) | (153,203 | ) | ||||
Computer software | (100,480 | ) | (97,030 | ) | ||||
Customer relationship | (53,511 | ) | (50,845 | ) | ||||
Other identifiable intangible assets | (5,544 | ) | (5,328 | ) | ||||
Reconciliation of the carrying amount of intangible assets at the beginning and end of each reporting period balances
| 06-30-2023 | ||||||||||||||||||||||||
Reconciliation of intangible assets | Intangible assets under development ThU.S.$ | Computer software ThU.S.$ | Water rights ThU.S.$ | Customer relationship ThU.S.$ | Others ThU.S.$ | Total ThU.S.$ | ||||||||||||||||||
Opening balance | 5,076 | 22,323 | 5,185 | 24,015 | 16,840 | 73,439 | ||||||||||||||||||
Changes | ||||||||||||||||||||||||
Additions | 905 | 840 | — | — | 101 | 1,846 | ||||||||||||||||||
Disposals | (79 | ) | — | (178 | ) | — | — | (257 | ) | |||||||||||||||
Amortization | — | (4,414 | ) | — | (2,341 | ) | (166 | ) | (6,921 | ) | ||||||||||||||
Increase (decrease) in foreign exchange | — | 292 | — | 131 | 2 | 425 | ||||||||||||||||||
Other increases (decreases) | (184 | ) | 184 | — | — | — | — | |||||||||||||||||
Changes total | 642 | (3,098 | ) | (178 | ) | (2,210 | ) | (63 | ) | (4,907 | ) | |||||||||||||
Closing balance | 5,718 | 19,225 | 5,007 | 21,805 | 16,777 | 68,532 | ||||||||||||||||||
| 12-31-2022 | ||||||||||||||||||||||||
Reconciliation of intangible assets | Intangible assets under development ThU.S.$ | Computer software ThU.S.$ | Water rights ThU.S.$ | Customer relationship ThU.S.$ | Others ThU.S.$ | Total ThU.S.$ | ||||||||||||||||||
Opening balance | 4,881 | 27,268 | 5,684 | 29,218 | 17,159 | 84,210 | ||||||||||||||||||
Changes | ||||||||||||||||||||||||
Additions | 1,696 | 3,758 | 2,134 | — | 140 | 7,728 | ||||||||||||||||||
Disposals | (853 | ) | — | (2,633 | ) | — | (108 | ) | (3,594 | ) | ||||||||||||||
Amortization | — | (9,398 | ) | — | (4,969 | ) | (375 | ) | (14,742 | ) | ||||||||||||||
Increase (decrease) in foreign exchange | — | 120 | — | (234 | ) | 24 | (90 | ) | ||||||||||||||||
Other increases (decreases) | (648 | ) | 575 | — | — | — | (73 | ) | ||||||||||||||||
Changes total | 195 | (4,945 | ) | (499 | ) | (5,203 | ) | (319 | ) | (10,771 | ) | |||||||||||||
Closing balance | 5,076 | 22,323 | 5,185 | 24,015 | 16,840 | 73,439 | ||||||||||||||||||
| Years of useful life (average) | ||||||||||||
Computer software | 5 | |||||||||||
Customer relationship | 15 | |||||||||||
Brands | 7 | |||||||||||
77
Table of Contents
CELULOSA ARAUCO Y CONSTITUCION S.A. AND SUBSIDIARIES
Unaudited interim consolidated financial statements
June 30, 2023
Amounts in thousands of U.S. dollars, except as indicated
The amortization of customer relationship and computer software is presented in the interim consolidated statements of profit or loss under the administrative expenses line item.
NOTE 20. BIOLOGICAL ASSETS
Biological assets comprise forestry plantations, mainly radiata and taeda pine, and to a lesser extent eucalyptus. The plantations are located in Chile, Argentina, Brazil and Uruguay.
As of June 30, 2023 Arauco had a total surface of 1.7 million hectares of which 963 thousand hectares are used for forestry planting, 500 thousand hectares are native forest, 105 thousand hectares are used for other purposes and 127 thousand hectares not yet planted. Lands corresponding to native forest, lands used for other purposes and lands not yet planted are presented in property, plant & equipment, Forest plantations are presented in Biological Assets.
For the six-month period ended June 30, 2023, the production volume of logs totaled 9.5 million m3 (10.8 million m3 as of June 30, 2023).
Measurements of fair value of Arauco’s biological assets are classified as Level 3, due to the fact that inputs are not observable. However, this information reflects the assumptions that market participants would use in pricing the asset, including assumptions about risk.
These unobservable inputs were developed using the best information available and includes internal data from Arauco. These unobservable inputs can be adjusted if the available information indicates that other market participants would use different information or there is something specific in Arauco that is not available to other market participants.
The main considerations in determining the fair value of biological assets include the following:
| • | Arauco uses discounted expected future cash flows of its forest plantations, which are based on a harvest projection date for all existing plantations. |
| • | Current forestry plantations are projected based on a net volume that will not decrease, with a minimum growth equivalent to the current supply demand. |
| • | Future plantations are not considered. |
| • | The harvest of forestry plantations supplies raw materials for all other products that Arauco produces and trades. By directly controlling the development of forests that will be processed, Arauco ensures high quality timber for each of its products. |
| • | Expected cash flows are determined in terms of harvest and expected sale of forestry products, associated with the demand from the Company’s own industrial centers and sales to third parties at market prices. Sales margin of the different products that are harvested in the forest is also considered in the valuation. The changes in the value of the plantations pursuant to the criteria defined above are accounted for in the results for the period, as established in IAS 41. These changes are presented in the interim consolidated statements of profit or loss under the line item other income per function, which as of June 30, 2023 amounted to ThU.S.$ 102,398 (ThU.S.$ 130,564 as of June 30, 2022). The appraisal of biological assets resulted in a greater cost of the lumber sold in comparison to the real incurred cost, which is presented included in the cost of sales which as of June 30, 2023 amounted to ThU.S.$ 138,446 (ThU.S.$ 146,534 as of June 30, 2022). |
| • | Forestry plantations are harvested according to the needs of Arauco’s production plants. |
78
Table of Contents
CELULOSA ARAUCO Y CONSTITUCION S.A. AND SUBSIDIARIES
Unaudited interim consolidated financial statements
June 30, 2023
Amounts in thousands of U.S. dollars, except as indicated
| • | The discount rates used are 7.0% in Chile, 8.3% Brazil, 21% in Argentina and 9% in Uruguay. |
| • | It is expected that prices of harvested timber are constant in real terms based on market prices. |
| • | Cost expectations with respect to the lifetime of the forests are constant based on estimated costs included in the projections made by Arauco. |
| • | The average crop age by species and country is: |
| Chile | Argentina | Brazil | Uruguay | |||||||||||||
|
|
|
|
|
|
|
| |||||||||
Pine | 24 | 15 | 15 | — | ||||||||||||
Eucalyptus | 12 | 10 | 7 | 10 | ||||||||||||
The following table sets forth changes in fair value of biological assets considering variations in significant assumptions considered in calculating the fair value of the assets:
| ThU.S.$ | ||||||||
Discount rate | 0.5 | (106,343 | ) | |||||
| -0.5 | 113,496 | |||||||
Margins (%) | 10 | 420,968 | ||||||
| -10 | (420,968 | ) | ||||||
The significant unobservable input data used in the measurement of the fair value of biological assets are discount rates and sales margins of the different products that are harvested from the forest. Increases (decreases) in any of these input data considered in isolation would result in a smaller or greater fair value measurement.
The adjustment to fair value of biological assets minus sale costs is recorded in the interim consolidated statements of profit or loss, under the line item other income or other expenses, depending on whether it corresponds to profits or losses.
Forestry plantations classified as current biological assets are those to be harvested and sold within twelve months after the reporting period.
The Company has contracted fire insurance policies for its forestry plantations, which in conjunction with the Company’s resources, allow risks to be minimized.
As of the date of these interim consolidated financial statements, there are no committed disbursements for the acquisition of biological assets.
Detail of Biological Assets Pledged as Security
As of June 30, 2023, there were no forestry plantations pledged as security.
Detail of Biological Assets with Restricted Ownership
As of the date of these interim consolidated financial statements, there are no biological assets with restricted ownership.
No significant government grants have been received.
79
Table of Contents
CELULOSA ARAUCO Y CONSTITUCION S.A. AND SUBSIDIARIES
Unaudited interim consolidated financial statements
June 30, 2023
Amounts in thousands of U.S. dollars, except as indicated
Current and Non-Current Biological Assets
As of the date of these interim consolidated financial statements, the current and non-current biological assets were as follows:
| 06-30-2023 | 12-31-2022 | |||||||
| ThU.S.$ | ThU.S.$ | |||||||
Current | 361,769 | 330,435 | ||||||
Non-current | 2,858,504 | 2,864,935 | ||||||
Total | 3,220,273 | 3,195,370 | ||||||
Reconciliation of carrying amount of biological assets
| 06-30-2023 | ||||||||||||
Movement | Current ThU.S.$ | Non-current ThU.S.$ | Total ThU.S.$ | |||||||||
Opening balance | 330,435 | 2,864,935 | 3,195,370 | |||||||||
Changes in real incurred cost | 8,048 | 100,609 | 108,657 | |||||||||
Additions through acquisition | — | 215,408 | 215,408 | |||||||||
Sales | (168 | ) | (5,596 | ) | (5,764 | ) | ||||||
Harvest | (73,362 | ) | — | (73,362 | ) | |||||||
Increases (decreases) in foreign exchange | 5,774 | 28,070 | 33,844 | |||||||||
Loss of forest due to fires | — | (62,301 | ) | (62,301 | ) | |||||||
Transfers to non-current assets held for sale | — | 832 | 832 | |||||||||
Transfers from non-current to current | 75,804 | (75,804 | ) | — | ||||||||
Changes in fair value | 23,286 | (107,040 | ) | (83,754 | ) | |||||||
Gain (losses) arising from changes in fair value minus sale costs | — | 108,687 | 108,687 | |||||||||
Sales | (45 | ) | (2,023 | ) | (2,068 | ) | ||||||
Harvest | (147,213 | ) | — | (147,213 | ) | |||||||
Loss of forest due to fires | — | (43,172 | ) | (43,172 | ) | |||||||
Transfers to non-current assets held for sale | — | 12 | 12 | |||||||||
Transfers from non-current to current | 170,544 | (170,544 | ) | — | ||||||||
Total changes | 31,334 | (6,431 | ) | 24,903 | ||||||||
Closing balance | 361,769 | 2,858,504 | 3,220,273 | |||||||||
| 12-31-2022 | ||||||||||||
Movement | Current ThU.S.$ | Non-current ThU.S.$ | Total ThU.S.$ | |||||||||
Opening balance | 329,586 | 3,008,897 | 3,338,483 | |||||||||
Changes in real incurred cost | 18,600 | 156,351 | 174,951 | |||||||||
Additions through acquisition | 35 | 293,231 | 293,266 | |||||||||
Sales | (428 | ) | (9,512 | ) | (9,940 | ) | ||||||
Harvest | (115,373 | ) | — | (115,373 | ) | |||||||
Increases (decreases) in foreign exchange | (2,077 | ) | 14,680 | 12,603 | ||||||||
Loss of forest due to fires | — | (13,346 | ) | (13,346 | ) | |||||||
Transfers to non-current assets held for sale | — | 4,938 | 4,938 | |||||||||
Transfers from non-current to current | 133,640 | (133,640 | ) | — | ||||||||
Decrease due to loss of control in subsidiary | 2,803 | — | 2,803 | |||||||||
Changes in fair value | (17,751 | ) | (300,313 | ) | (318,064 | ) | ||||||
Gain (losses) arising from changes in fair value minus sale costs | 2,345 | 10,587 | 12,932 | |||||||||
Sales | 106 | (13,306 | ) | (13,200 | ) | |||||||
Harvest | (320,810 | ) | — | (320,810 | ) | |||||||
Loss of forest due to fires | — | (3,781 | ) | (3,781 | ) | |||||||
Transfers to non-current assets held for sale | — | 5,220 | 5,220 | |||||||||
Transfers from non-current to current | 299,498 | (299,498 | ) | — | ||||||||
Decrease due to loss of control in subsidiary | 1,110 | 465 | 1,575 | |||||||||
Total changes | 849 | (143,962 | ) | (143,113 | ) | |||||||
Closing balance | 330,435 | 2,864,935 | 3,195,370 | |||||||||
80
Table of Contents
CELULOSA ARAUCO Y CONSTITUCION S.A. AND SUBSIDIARIES
Unaudited interim consolidated financial statements
June 30, 2023
Amounts in thousands of U.S. dollars, except as indicated
Regarding the fires that occurred in 2023 in the regions of Maule, Ñuble, Araucanía, Biobío and Los Ríos. Arauco has 47,000 hectares of productive forest plantations were affected and for which, to date, management has been carried out that has allowed to recover an approximate equivalent to 12 thousand hectares.
As of June 30, 2023, a net loss of insurance compensation of U.S.$ 17 million (U.S.$ 102 million gross) was recognized for the fires in Chile, reducing the gross value of the biological assets, which represents 3.2% of the value of the forest plantations of Arauco.
NOTE 21. ENVIRONMENTAL MATTERS
Environment Management
For Arauco, sustainability means management strategy. This strategy incorporates values, commitments and standards, that together with the adoption of best practices as well as the use of the latest available technologies, seek to continuously improve the Company’s environmental management. It is the environmental department and each of its specialists that ensure these guidelines are met and are put into practice in everyday company operations.
All Arauco’s production units have certified environmental management systems, which reinforce the Company’s commitment to environmental performance and ensure the traceability of all raw materials used.
Arauco uses several supplies in its productive processes such as wood, chemical products, and water, etc., which in turn produce liquid and gas emissions. As a way to make the Company’s environmental management more efficient, significant progress has been made to reduce consumption and emissions.
Environmental investments have been made related to the control of atmospheric emissions, process improvements, water and waste management, as well as effluent treatment, in order to improve the environmental performance of all Arauco’s business units.
These investments are reflected in the interim consolidated financial statements as property, plant and equipment when they refer to disbursements in major works executed and are reflected in Expenses when they refer to improvements or management not directly associated with investment projects.
Detail information of disbursements related to the environment
As of June 30, 2023 and December 31, 2022 Arauco had made and / or had committed the following disbursements in major environmental project.
81
Table of Contents
CELULOSA ARAUCO Y CONSTITUCION S.A. AND SUBSIDIARIES
Unaudited interim consolidated financial statements
June 30, 2023
Amounts in thousands of U.S. dollars, except as indicated
06-30-2023 | Disbursements undertaken 2023 | Committed Disbursements | ||||||||||||
| State | Amount | Asset | Asset/expense | Amount | Estimated | |||||||||
Company | Name of project | of project | ThU.S.$ | Expense | destination item | ThU.S.$ | date | |||||||
| Celulosa Arauco y Constitucion S.A. | Environmental improvement studies | In process | 1,437 | Assets | Properties, plants and equipments | 3,293 | 2023 | |||||||
| Celulosa Arauco y Constitucion S.A. | Investment projects for the control and management of hazardous liquids and water energy optimization of industrial plants | In process | 5,739 | Assets | Properties, plants and equipments | 8,066 | 2023 | |||||||
| Celulosa Arauco y Constitucion S.A. | Investment projects for the control and management of gas emissions from industrial process | In process | 382 | Assets | Properties, plants and equipments | 129 | 2023 | |||||||
| Celulosa Arauco y Constitucion S.A. | Expansion of solid industrial waste dumpsite for management of these in the future | In process | 1,762 | Assets | Properties, plants and equipments | — | 2023 | |||||||
| Celulosa Arauco y Constitucion S.A. | Environmental improvement studies | In process | 7,140 | Expense | Operating costs | 5,360 | 2023 | |||||||
| Celulosa Arauco y Constitucion S.A. | Expansion of solid industrial waste dumpsite for management of these in the future | In process | 8,488 | Expense | Operating costs | 4,942 | 2023 | |||||||
| Celulosa y Energía Punta Pereira S.A. | Expansion of solid industrial waste dumpsite for management of these in the future | Finished | 350 | Assets | Properties, plants and equipments | — | ||||||||
| Arauco do Brasil S.A. | Environmental improvement studies | In process | 733 | Assets | Properties, plants and equipments | 1,610 | 2023 | |||||||
| Arauco Forest Brasil S.A. | Environmental improvement studies | In process | 119 | Assets | Properties, plants and equipments | 188 | 2022 | |||||||
| Arauco Industria de Paineis S.A. | Investment projects for the control and management of hazardous liquids and water energy optimization of industrial plants | In process | 3,938 | Expense | Operating costs | 174 | 2023 | |||||||
| Forestal Arauco S.A. | Environmental improvement studies | In process | 704 | Expense | Operating costs | 1,582 | 2022 | |||||||
| Arauco North America, Inc | Investment projects for the control and management of gas emissions from industrial process | In process | 1,765 | Assets | Properties, plants and equipments | 569 | 2023 | |||||||
| Arauco North America, Inc | Investment projects for the control and management of hazardous liquids and water energy optimization of industrial plants | In process | 1,967 | Assets | Properties, plants and equipments | 125 | 2023 | |||||||
|
| |||||||||||||
| TOTAL | 34,808 | 26,038 | ||||||||||||
|
| |||||||||||||
12-31-2022 | Disbursements undertaken 2022 | Committed Disbursements | ||||||||||||
| State | Amount | Asset | Asset/expense | Amount | Estimated | |||||||||
Company | Name of project | of project | ThU.S.$ | Expense | destination item | ThU.S.$ | date | |||||||
| Celulosa Arauco y Constitucion S.A. | Environmental improvement studies | In process | 6,898 | Assets | Property, plant and equipment | 2,029 | 2023 | |||||||
| Celulosa Arauco y Constitucion S.A. | Investment projects for the control and management of hazardous liquids and water energy optimization of industrial plants | In process | 1,540 | Assets | Property, plant and equipment | 10,677 | 2023 | |||||||
| Celulosa Arauco y Constitucion S.A. | Investment projects for the control and management of gas emissions from industrial process | In process | 167 | Assets | Property, plant and equipment | 687 | 2023 | |||||||
| Celulosa Arauco y Constitucion S.A. | Expansion of solid industrial waste dumpsite for management of these in the future | In process | 68 | Assets | Property, plant and equipment | 632 | 2023 | |||||||
| Celulosa Arauco y Constitucion S.A. | Environmental improvement studies | In process | 12,506 | Expense | Operating cost | — | 2023 | |||||||
| Celulosa Arauco y Constitucion S.A. | Expansion of solid industrial waste dumpsite for management of these in the future | In process | 13,556 | Expense | Operating cost | — | 2023 | |||||||
| Arauco Argentina S.A. | Investment projects for the control and management of hazardous liquids and water energy optimization of industrial plants | In process | 119 | Assets | Property, plant and equipment | 169 | 2023 | |||||||
| Arauco Argentina S.A. | Expansion of solid industrial waste dumpsite for management of these in the future | Finished | 427 | Assets | Property, plant and equipment | — | 2022 | |||||||
| Arauco Florestal Arapoti S.A. | Environmental improvement studies | Finished | 724 | Assets | Property, plant and equipment | — | 2022 | |||||||
| Arauco Industria de Paineis S.A. | Investment projects for the control and management of hazardous liquids and water energy optimization of industrial plants | In process | 4,102 | Assets | Property, plant and equipment | 8 | 2023 | |||||||
| Arauco Industria de Paineis S.A. | Investment projects for the control and management of hazardous liquids and water energy optimization of industrial plants | Finished | 366 | Assets | Property, plant and equipment | — | 2022 | |||||||
| Forestal Arauco S.A. | Environmental improvement studies | In process | 1,648 | Expense | Operating cost | 124 | 2023 | |||||||
| Maderas Arauco S.A. | Investment projects for the control and management of hazardous liquids and water energy optimization of industrial plants | In process | 47 | Assets | Property, plant and equipment | 295 | 2023 | |||||||
| Maderas Arauco S.A. | Investment projects for the control and management of hazardous liquids and water energy optimization of industrial plants | Finished | 687 | Expense | Operating cost | — | 2022 | |||||||
| Arauco North America, Inc | Investment projects for the control and management of gas emissions from industrial process | In process | 684 | Assets | Property, plant and equipment | 1,651 | 2023 | |||||||
| Arauco North America, Inc | Investment projects for the control and management of hazardous liquids and water energy optimization of industrial plants | In process | 1,369 | Assets | Property, plant and equipment | 454 | 2023 | |||||||
|
| |||||||||||||
| TOTAL | 44,908 | 16,726 | ||||||||||||
|
| |||||||||||||
82
Table of Contents
CELULOSA ARAUCO Y CONSTITUCION S.A. AND SUBSIDIARIES
Unaudited interim consolidated financial statements
June 30, 2023
Amounts in thousands of U.S. dollars, except as indicated
NOTE 22. NON-CURRENT ASSETS HELD FOR SALE
The following table sets forth information on the main types of non-current assets held for sale:
| 06-30-2023 ThU.S.$ | 12-31-2022 ThU.S.$ | |||||||
Land | 179 | 307 | ||||||
Forest | — | 844 | ||||||
Roads | — | 128 | ||||||
Total | 179 | 1,279 | ||||||
As of June 30, 2023 and December 31, 2022, there were no significant impacts on results that must be reported.
83
Table of Contents
CELULOSA ARAUCO Y CONSTITUCION S.A. AND SUBSIDIARIES
Unaudited interim consolidated financial statements
June 30, 2023
Amounts in thousands of U.S. dollars, except as indicated
NOTE 23. FINANCIAL INSTRUMENTS
23.1 Classification
Arauco’s financial instruments as of June 30, 2023, and December 31, 2022, are displayed in the table below. Regarding those instruments valued at an amortized cost, an estimation of their fair value is displayed for informational purposes.
| 06-30-2023 | 12-31-2022 | |||||||||||||||
Financial instruments Thousands of dollars | Carrying amount | Fair value | Carrying amount | Fair value | ||||||||||||
Financial assets at fair value through profit or loss (held for trading) | 212,067 | 212,067 | 110,208 | 110,208 | ||||||||||||
Derivative (1) | 9 | 9 | 144 | 144 | ||||||||||||
Mutual funds (1) | 212,058 | 212,058 | 110,064 | 110,064 | ||||||||||||
Financial assets at amortized cost | 1,464,758 | 1,464,758 | 1,476,046 | 1,476,046 | ||||||||||||
Cash and cash equivalents (amortized cost) | 552,563 | 552,563 | 557,143 | 557,143 | ||||||||||||
Cash | 266,333 | 266,333 | 298,577 | 298,577 | ||||||||||||
Time deposits | 284,518 | 284,518 | 258,566 | 258,566 | ||||||||||||
Agreements | 1,712 | 1,712 | — | — | ||||||||||||
Accounts receivable (net) | 905,480 | 905,480 | 905,969 | 905,969 | ||||||||||||
Trade receivables | 599,777 | 599,777 | 726,972 | 726,972 | ||||||||||||
Lease receivable | 72,127 | 72,127 | 28,935 | 28,935 | ||||||||||||
Sundry debtors | 14,922 | 14,922 | 8,911 | 8,911 | ||||||||||||
Other receivables | 159,877 | 159,877 | 56,973 | 56,973 | ||||||||||||
Prepayments | 58,777 | 58,777 | 84,178 | 84,178 | ||||||||||||
Accounts receivable from related parties | 6,714 | 6,714 | 7,563 | 7,563 | ||||||||||||
Other financial assets (2) | 1 | 1 | 5,371 | 5,371 | ||||||||||||
Hedging assets | 142,770 | 142,770 | 73,156 | 73,156 | ||||||||||||
Financial liabilities at amortized cost (3) | 7,708,204 | 6,853,293 | 6,572,325 | 6,331,528 | ||||||||||||
Bonds issued denominated in U.S. dollars | 3,400,061 | 3,015,787 | 3,397,376 | 3,136,318 | ||||||||||||
Bonds issued denominated in U.F. (4) | 1,736,265 | 1,310,644 | 1,116,083 | 1,167,251 | ||||||||||||
Bank borrowings in U.S. dollars | 812,693 | 807,498 | 415,462 | 408,278 | ||||||||||||
Bank borrowings in other currencies | 648,103 | 608,282 | 525,215 | 501,492 | ||||||||||||
Lease liabilities | 381,987 | 381,987 | 264,224 | 264,224 | ||||||||||||
Trade and other payables | 704,528 | 704,528 | 832,954 | 832,954 | ||||||||||||
Accounts payable to related parties | 24,567 | 24,567 | 21,011 | 21,011 | ||||||||||||
Financial liabilities at fair value through profit or loss | 188 | 107 | 17 | 17 | ||||||||||||
Hedging liabilities | 51,696 | 51,777 | 76,669 | 76,669 | ||||||||||||
| (1) | Although mutual funds are measured at fair value through profit or loss for purposes of the consolidated statements of financial position mutual funds are classified as “Cash and cash equivalents” due to the are highly liquid short-term investment. |
| (2) | Corresponds to the balance of assets from margin call for current derivatives (collateral). |
| (3) | Financial liabilities measured at amortized cost, other than “Trade and other payables”, “Accounts payable to related parties” and derivatives are presented in the consolidated statements of financial position in the line item “Other financial liabilities” as current and non-current based on their maturity. |
| (4) | The Unidad de Fomento (“U.F.”) is a unit of account that is linked to, and is adjusted daily to reflect changes in the Chilean consumer price index. |
84
Table of Contents
CELULOSA ARAUCO Y CONSTITUCION S.A. AND SUBSIDIARIES
Unaudited interim consolidated financial statements
June 30, 2023
Amounts in thousands of U.S. dollars, except as indicated
23.2 Fair Value Hierarchy of Financial Assets and Liabilities
The assets and liabilities measured at fair value in the consolidated statements of financial position as of June 30, 2023 and December 31, 2022, have been measured based on the valuation methodologies provided in IFRS 13. The methodologies applied for each financial instrument are classified according to their hierarchy as follows:
| • | Level 1: Securities or quoted prices in active markets for identical assets and liabilities |
| • | Level 2: Inputs other than quoted prices included within Level 1 that are observable for the assets or liabilities, either directly (i.e. as prices) or indirectly (i.e. derived from prices); and |
| • | Level 3: Inputs for the assets or liabilities that are not based on observable market data (unobservable inputs). |
Fair value | 06-30-2023 ThU.S.$ | Level 1 ThU.S.$ | Level 2 ThU.S.$ | Level 3 ThU.S.$ | ||||||||||||
Financial assets at fair value through profit or loss (held for trading) | ||||||||||||||||
Derivatives | 9 | 9 | — | |||||||||||||
Mutual Funds | 212,058 | 212,058 | — | — | ||||||||||||
Hedging assets | 142,770 | — | 142,770 | — | ||||||||||||
Financial liabilities at fair value through profit or loss | 188 | — | 188 | — | ||||||||||||
Hedging liabilities | 51,696 | — | 51,696 | — | ||||||||||||
Fair value | 12-31-2022 ThU.S.$ | Level 1 ThU.S.$ | Level 2 ThU.S.$ | Level 3 ThU.S.$ | ||||||||||||
Financial assets at fair value through profit or loss (held for trading) | ||||||||||||||||
Derivatives | 144 | — | 144 | — | ||||||||||||
Mutual Funds | 110,064 | 110,064 | — | — | ||||||||||||
Hedging assets | 73,156 | — | 73,156 | — | ||||||||||||
Financial liabilities at fair value through profit or loss | 17 | — | 17 | — | ||||||||||||
Hedging liabilities | 76,669 | — | 76,669 | — | ||||||||||||
At the closing date of these interim consolidated financial statements, there have been no transfers between the different hierarchy levels.
23.3 Explanation of the valuation of Financial Instruments.
Cash and cash equivalent and accounts receivable
The carrying amount of accounts receivable, cash and cash equivalents (including mutual funds), and other financial assets and liabilities approximate their fair value due to the short-term nature of such instruments.
Derivative financial instruments
Arauco’s current derivatives are valued under the cash flow discount method. These flows are discounted at the rate applicable according to the transaction’s and counterparties’ risk, using an internal methodology based on the information obtained from Bloomberg.
85
Table of Contents
CELULOSA ARAUCO Y CONSTITUCION S.A. AND SUBSIDIARIES
Unaudited interim consolidated financial statements
June 30, 2023
Amounts in thousands of U.S. dollars, except as indicated
Given that our cross-currency swaps correspond to future flows in UF, U.S. dollars and Euros, Arauco calculates the current value of such flows by using the UF zero coupon curve, dollar zero coupon and the Euro zero coupon.
The fair value of the interest rate swap contracts is calculated by reference to the rate differential between the agreed upon rate and the market rate as of the end date of these interim consolidated financial statements.
The fair value of the currency forward contracts is calculated by reference to the current forward exchange rates of contracts with similar maturity profiles.
The fair value of zero cost collar contracts is calculated by reference to the price differential between the agreed price range and the market price of the hedge’s object.
The counterparty risk uses the Z-Spread obtained from the curve of the bonds issued by counterparties, and they are deducted from each flow as appropriate.
Financial Liabilities
The fair value of bonds issued was determined with reference to quoted market prices as they have standard terms and conditions.
The fair value of bank borrowings was determined based on discounted cash flow analysis applying the corresponding discount yield curves to the remaining term to maturity.
Disclosures of the fair value of financial liabilities at amortized cost are determined via the use of discounted cash flows, calculated over variables of the observable markets as of the date of informing the interim consolidated financial statements, and correspond to Level 2 of the fair value hierarchy.
86
Table of Contents
CELULOSA ARAUCO Y CONSTITUCION S.A. AND SUBSIDIARIES
Unaudited interim consolidated financial statements
June 30, 2023
Amounts in thousands of U.S. dollars, except as indicated
The following table sets forth a reconciliation between the financial liabilities and the consolidated statements of financial position as of June 30, 2023 and December 31, 2022:
Thousands of dollars | 06-30-2023 | |||||||||||||||||||||||||||||||
| Up to 90 days | From 91 days to 1 year | Other current financial liabilities, Total | From 1 year to 3 years | From 3 years to 5 years | More than 5 years | Other non- current financial liabilities, Total | Total | |||||||||||||||||||||||||
Bonds obligations | 29,113 | 74,431 | 103,544 | 594,832 | 812,241 | 3,625,709 | 5,032,782 | 5,136,326 | ||||||||||||||||||||||||
Bank borrowings | 292,465 | 381,311 | 673,776 | 505,621 | 179,359 | 102,040 | 787,020 | 1,460,796 | ||||||||||||||||||||||||
Swap and Forward | 1,041 | — | 1,041 | 50,843 | — | — | 50,843 | 51,884 | ||||||||||||||||||||||||
|
|
|
|
|
|
|
|
|
|
|
| �� |
|
|
| |||||||||||||||||
Total other financial liabilities (a) | 322,619 | 455,742 | 778,361 | 1,151,296 | 991,600 | 3,727,749 | 5,870,645 | 6,649,006 | ||||||||||||||||||||||||
|
|
|
|
|
|
|
|
|
|
|
|
|
|
|
| |||||||||||||||||
Thousands of dollars | 06-30-2023 | |||||||||||||||||||||||||||||||
| Up to 90 days | From 91 days to 1 year | Total Current | From 1 year to 3 years | From 3 years to 5 years | More than 5 years | Total non- current | Total | |||||||||||||||||||||||||
Lease liabilities | 24,824 | 24,757 | 49,581 | 61,148 | 48,498 | 222,760 | 332,406 | 381,987 | ||||||||||||||||||||||||
|
|
|
|
|
|
|
|
|
|
|
|
|
|
|
| |||||||||||||||||
Total lease liabilities (b) | 24,824 | 24,757 | 49,581 | 61,148 | 48,498 | 222,760 | 332,406 | 381,987 | ||||||||||||||||||||||||
|
|
|
|
|
|
|
|
|
|
|
|
|
|
|
| |||||||||||||||||
Thousands of dollars | 06-30-2023 | |||||||||||||||||||||||||||||||
| Up to 90 days | From 91 days to 1 year | Total Current | From 1 year to 3 years | From 3 years to 5 years | More than 5 years | Total non- current | Total | |||||||||||||||||||||||||
Trade and other payables | 656,009 | 26,479 | 682,488 | 22,040 | — | — | 22,040 | 704,528 | ||||||||||||||||||||||||
Accounts payable to related companies | 17,836 | — | 17,836 | 3,283 | — | 3,448 | 6,731 | 24,567 | ||||||||||||||||||||||||
|
|
|
|
|
|
|
|
|
|
|
|
|
|
|
| |||||||||||||||||
Total accounts payable (c) | 673,845 | 26,479 | 700,324 | 25,323 | — | 3,448 | 28,771 | 729,095 | ||||||||||||||||||||||||
|
|
|
|
|
|
|
|
|
|
|
|
|
|
|
| |||||||||||||||||
Total financial liabilities (a) + (b) + (c) | 1,021,288 | 506,978 | 1,528,266 | 1,237,767 | 1,040,098 | 3,953,957 | 6,231,822 | 7,760,088 | ||||||||||||||||||||||||
|
|
|
|
|
|
|
|
|
|
|
|
|
|
|
| |||||||||||||||||
Thousands of dollars | 12-31-2022 | |||||||||||||||||||||||||||||||
| Up to 90 days | From 91 days to 1 year | Other current financial liabilities, Total | From 1 year to 3 years | From 3 years to 5 years | More than 5 years | Other non- current financial liabilities, Total | Total | |||||||||||||||||||||||||
Bonds obligations | 29,114 | 66,436 | 95,550 | 585,518 | 782,344 | 3,050,047 | 4,417,909 | 4,513,459 | ||||||||||||||||||||||||
Bank borrowings | 109,889 | 167,905 | 277,794 | 368,353 | 164,873 | 129,657 | 662,883 | 940,677 | ||||||||||||||||||||||||
Swap and Forward | 2,107 | — | 2,107 | 74,579 | — | — | 74,579 | 76,686 | ||||||||||||||||||||||||
|
|
|
|
|
|
|
|
|
|
|
|
|
|
|
| |||||||||||||||||
Total other financial liabilities (a) | 141,110 | 234,341 | 375,451 | 1,028,450 | 947,217 | 3,179,704 | 5,155,371 | 5,530,822 | ||||||||||||||||||||||||
|
|
|
|
|
|
|
|
|
|
|
|
|
|
|
| |||||||||||||||||
Thousands of dollars | 12-31-2022 | |||||||||||||||||||||||||||||||
| Up to 90 days | From 91 days to 1 year | Total Current | From 1 year to 3 years | From 3 years to 5 years | More than 5 years | Total non- current | Total | |||||||||||||||||||||||||
Lease liabilities | 11,339 | 25,445 | 36,784 | 45,904 | 38,906 | 142,630 | 227,440 | 264,224 | ||||||||||||||||||||||||
|
|
|
|
|
|
|
|
|
|
|
|
|
|
|
| |||||||||||||||||
Total lease liabilities (b) | 11,339 | 25,445 | 36,784 | 45,904 | 38,906 | 142,630 | 227,440 | 264,224 | ||||||||||||||||||||||||
|
|
|
|
|
|
|
|
|
|
|
|
|
|
|
| |||||||||||||||||
Thousands of dollars | 12-31-2022 | |||||||||||||||||||||||||||||||
| Up to 90 days | From 91 days to 1 year | Total Current | From 1 year to 3 years | From 3 years to 5 years | More than 5 years | Total non- current | Total | |||||||||||||||||||||||||
Trade and other payables | 795,533 | 17,305 | 812,838 | 2,462 | — | 17,654 | 20,116 | 832,954 | ||||||||||||||||||||||||
Accounts payable to related companies | 14,280 | — | 14,280 | 3,283 | — | 3,448 | 6,731 | 21,011 | ||||||||||||||||||||||||
|
|
|
|
|
|
|
|
|
|
|
|
|
|
|
| |||||||||||||||||
Total accounts payable (c) | 809,813 | 17,305 | 827,118 | 5,745 | — | 21,102 | 26,847 | 853,965 | ||||||||||||||||||||||||
|
|
|
|
|
|
|
|
|
|
|
|
|
|
|
| |||||||||||||||||
Total financial liabilities (a) + (b) + (c) | 962,262 | 277,091 | 1,239,353 | 1,080,099 | 986,123 | 3,343,436 | 5,409,658 | 6,649,011 | ||||||||||||||||||||||||
|
|
|
|
|
|
|
|
|
|
|
|
|
|
|
| |||||||||||||||||
87
Table of Contents
CELULOSA ARAUCO Y CONSTITUCION S.A. AND SUBSIDIARIES
Unaudited interim consolidated financial statements
June 30, 2023
Amounts in thousands of U.S. dollars, except as indicated
23.4 Derivative Instruments
Hedging instruments recorded as of June 30, 2023 are cash flow hedges. Arauco uses derivatives for hedging purposes, such as cross currency swaps, currency and commodity forwards, interest rate swaps, and options. Depending on the fair value of each instrument, the position could be either an asset or a liability, and they are listed in the interim consolidated statements of financial position under other non-current financial assets or other non-current financial liabilities, respectively. The effects for the period are presented in interim consolidated statement of changes in equity as other comprehensive income or the interim consolidated statements of comprehensive income as finance income or finance costs, net of differences in exchange rate of the hedged items and the deferred tax.
A summary of the derivative financial instruments included in the consolidated statements of financial position as of June 30, 2023 and December 31, 2022, is presented below:
Financial instruments | 06-30-2023 Fair value ThU.S.$ | 12-31-2022 Fair value ThU.S.$ | ||||||
Financial assets at fair value through profit or loss | 9 | 144 | ||||||
Derivatives (1) | 4 | 144 | ||||||
Forward | 5 | — | ||||||
Hedging assets | 142,770 | 73,156 | ||||||
Derivatives (1) | 13,881 | 17,629 | ||||||
Cross Currency Swaps (2) | 128,889 | 55,527 | ||||||
Financial liabilities at fair value through profit or loss | (107 | ) | (17 | ) | ||||
Forward | (107 | ) | (17 | ) | ||||
Hedging liabilities | (51,696 | ) | (76,669 | ) | ||||
Derivatives (1) | (1,393 | ) | (650 | ) | ||||
Cross currency swaps (2) | (50,303 | ) | (76,019 | ) | ||||
| (1) | Includes HFO swap, zero cost collar, forward and IRS from Chile, USA, Argentina and Uruguay tables. |
| (2) | Includes cross currency swaps from Chile. |
88
Table of Contents
CELULOSA ARAUCO Y CONSTITUCION S.A. AND SUBSIDIARIES
Unaudited interim consolidated financial statements
June 30, 2023
Amounts in thousands of U.S. dollars, except as indicated
23.4.1. Chile
In order to cover the exposure to variation in cash flows associated with fluctuations in exchange rates, interest rates or commodity prices, Arauco Chile has the following derivatives as of June 30, 2023 and December 31, 2022:
Cross Currency Swaps
Cross currency swaps to cover the exposure to the exchange rate risk generated from bonds denominated in U.F.
Bond | Institution | Amount U.S.$ | Amount U.F. | Starting date | Ending date | 06-30-2023 fair value ThU.S.$ | 12-31-2022 fair value ThU.S.$ | |||||||||||||||||||
F | Scotiabank | 24,453,184 | 636,364 | 2014-10-30 | 2023-04-30 | — | 1,625 | |||||||||||||||||||
F | Scotiabank | 24,422,642 | 636,364 | 2014-10-30 | 2023-04-30 | — | 1,673 | |||||||||||||||||||
F | Santander | 24,167,222 | 636,364 | 2014-10-30 | 2023-04-30 | — | 1,905 | |||||||||||||||||||
F | BCI | 22,750,014 | 590,909 | 2021-10-30 | 2029-10-30 | 4,821 | 2,692 | |||||||||||||||||||
F | BCI | 23,940,993 | 636,364 | 2014-10-30 | 2023-04-30 | — | 2,154 | |||||||||||||||||||
F | Scotiabank | 22,777,334 | 590,909 | 2021-10-30 | 2029-10-30 | 5,232 | 3,212 | |||||||||||||||||||
F | Banco de Chile | 22,440,993 | 590,909 | 2019-04-30 | 2029-10-30 | 4,280 | 2,104 | |||||||||||||||||||
F | BCI | 22,678,168 | 590,909 | 2023-04-30 | 2029-10-30 | 4,276 | — | |||||||||||||||||||
F | BCI | 22,706,528 | 590,909 | 2023-04-30 | 2029-10-30 | 4,254 | — | |||||||||||||||||||
F | BCI | 22,230,921 | 590,909 | 2023-04-30 | 2029-10-30 | 4,644 | — | |||||||||||||||||||
F | BCI | 22,440,992 | 590,909 | 2023-04-30 | 2029-10-30 | 4,466 | — | |||||||||||||||||||
P | BCI | 33,250,022 | 863,636 | 2021-11-15 | 2032-11-15 | 7,801 | 4,709 | |||||||||||||||||||
P | BCI | 33,247,217 | 863,636 | 2021-11-15 | 2032-11-15 | 8,705 | 5,695 | |||||||||||||||||||
P | Scotiabank | 36,629,274 | 863,636 | 2013-11-15 | 2023-11-15 | 1,871 | (1,025 | ) | ||||||||||||||||||
P | Santander | 36,059,158 | 863,636 | 2013-11-15 | 2023-11-15 | 2,385 | (448 | ) | ||||||||||||||||||
P | Deutsche | 36,059,158 | 863,636 | 2013-11-15 | 2023-11-15 | 2,455 | (401 | ) | ||||||||||||||||||
R | Santander | 128,611,183 | 3,000,000 | 2014-10-01 | 2024-04-01 | 4,348 | (5,117 | ) | ||||||||||||||||||
R | JP Morgan | 43,185,224 | 1,000,000 | 2014-10-01 | 2024-04-01 | 1,386 | (1,725 | ) | ||||||||||||||||||
R | Itau | 43,277,070 | 1,000,000 | 2014-10-01 | 2024-04-01 | 1,269 | (1,835 | ) | ||||||||||||||||||
S | Santander | 201,340,031 | 5,000,000 | 2016-11-15 | 2026-11-15 | 28,557 | 10,004 | |||||||||||||||||||
W | Goldman Sachs | 40,521,750 | 1,000,000 | 2018-10-10 | 2028-10-10 | 3,728 | (167 | ) | ||||||||||||||||||
W | Scotiabank | 40,537,926 | 1,000,000 | 2018-10-10 | 2028-10-10 | 3,721 | (148 | ) | ||||||||||||||||||
W | Goldman Sachs | 40,066,555 | 1,000,000 | 2018-10-10 | 2028-10-10 | 4,263 | 369 | |||||||||||||||||||
X | Santander | 118,400,504 | 3,000,000 | 2018-10-10 | 2038-10-10 | 12,654 | 10,457 | |||||||||||||||||||
X | Santander | 97,971,786 | 2,500,000 | 2018-10-10 | 2038-10-10 | 10,805 | 8,928 | |||||||||||||||||||
Y | JP Morgan | 89,387,460 | 2,000,000 | 2023-04-10 | 2032-04-10 | 1,024 | — | |||||||||||||||||||
Z | Santander | 90,274,363 | 2,000,000 | 2023-04-10 | 2032-04-10 | 109 | — | |||||||||||||||||||
Z | Banco de Chile | 44,572,044 | 1,000,000 | 2023-04-10 | 2032-04-12 | 861 | — | |||||||||||||||||||
Z | JP Morgan | 44,572,044 | 1,000,000 | 2023-04-10 | 2032-04-12 | 974 | — | |||||||||||||||||||
|
|
|
| |||||||||||||||||||||||
| 128,889 | 44,661 | |||||||||||||||||||||||||
|
|
|
| |||||||||||||||||||||||
Cross currency swaps contracts to cover the exposure to the risk of the exchange rate for bank contracts in Euro.
Institution | Amount U.S.$ | Amount EUR | Starting date | Ending date | 06-30-2023 fair value ThU.S.$ | 12-31-2022 fair value ThU.S.$ | ||||||||||||||||||
Santander - Chile | 90,747,647 | 76,470,588 | 2021-06-15 | 2029-12-15 | (10,302 | ) | (13,279 | ) | ||||||||||||||||
Banco de Chile - Chile | 45,373,824 | 38,235,294 | 2021-06-15 | 2029-12-15 | (5,055 | ) | (6,491 | ) | ||||||||||||||||
MUFG - N.A. | 90,747,647 | 76,470,588 | 2021-06-15 | 2029-12-15 | (9,940 | ) | (12,898 | ) | ||||||||||||||||
JP Morgan - N.A. | 181,495,294 | 152,941,176 | 2021-06-15 | 2029-12-15 | (20,034 | ) | (26,033 | ) | ||||||||||||||||
HSBC - N.A. | 45,373,824 | 38,235,294 | 2021-06-15 | 2029-12-15 | (4,972 | ) | (6,452 | ) | ||||||||||||||||
|
|
|
| |||||||||||||||||||||
| (50,303 | ) | (65,153 | ) | |||||||||||||||||||||
|
|
|
| |||||||||||||||||||||
89
Table of Contents
CELULOSA ARAUCO Y CONSTITUCION S.A. AND SUBSIDIARIES
Unaudited interim consolidated financial statements
June 30, 2023
Amounts in thousands of U.S. dollars, except as indicated
23.4.2. Uruguay
Forward
As of June 30, 2023 and December 31, 2022, Arauco through its subsidiaries as a joint operation (50%) in Uruguay maintained the following forward contracts in force and effect for the purposes of ensuring an exchange rate for sale of dollars:
Exchange rate | Institution | 06-30-2023 notional ThU.S.$ | 06-30-2023 fair value ThU.S.$ | 12-31-2022 notional ThU.S.$ | 12-31-2022 fair value ThU.S.$ | |||||||||||||
UYUUSD | HSBC - Uruguay | 7,435 | 900 | 13,735 | 1,138 | |||||||||||||
UYUUSD | Citibank U.K. | 1,150 | 89 | — | — | |||||||||||||
UYUUSD | Itaú - Uruguay | 13,335 | 1,105 | 8,480 | 451 | |||||||||||||
UYUUSD | Banco de la República Oriental de Uruguay | 5,725 | 712 | 3,805 | 166 | |||||||||||||
EURUSD | Itaú - Uruguay | 465 | 19 | 859 | 33 | |||||||||||||
EURUSD | Santander - Uruguay | 1,341 | 8 | 2,416 | 3 | |||||||||||||
EURUSD | Santander - Uruguay | — | — | — | (1 | ) | ||||||||||||
|
|
|
| |||||||||||||||
| 2,833 | 1,790 | |||||||||||||||||
|
|
|
| |||||||||||||||
Commodity Swap
Arauco Uruguay’s profits and through its subsidiaries as a joint operation (50%), also face exposure to the price variation of certain fuels, as occurs with Fuel Oil N°6, which is used during the pulp manufacturing process. In order to minimize this risk, the volatility of future flows associated to the purchase of Fuel Oil No. 6 through forwards of this commodity. The agreements that are in force and effect as of June 30, 2023 and December 31, 2022, are detailed below:
Commodity | Institution | 06-30-2023 notional ThU.S.$ | 06-30-2023 fair value ThU.S.$ | 12-31-2022 notional ThU.S.$ | 12-31-2022 fair value ThU.S.$ | |||||||||||||
Fuel Oil N°6 | JP Morgan - N.A. | 4,542 | 69 | 7,367 | 677 | |||||||||||||
Fuel Oil N°6 | DNB Bank ASA | 9,577 | 4 | 7,366 | 62 | |||||||||||||
Fuel Oil N°6 | JP Morgan - N.A. | — | (436 | ) | — | (252 | ) | |||||||||||
Fuel Oil N°6 | DNB Bank ASA | — | (982 | ) | — | (397 | ) | |||||||||||
Fuel Oil N°6 | BNP Paribas | 1,591 | (82 | ) | — | — | ||||||||||||
|
|
|
| |||||||||||||||
| (1,427 | ) | 90 | ||||||||||||||||
|
|
|
| |||||||||||||||
Interest Rate Swap
In addition, Arauco through its subsidiaries as a joint operation (50%) in Uruguay maintains an Interest Rate Swap in force and effect, a derivative instrument which purpose is to set the interest rate of a variable rate debt in the same currency (USD). The valuation off this instrument as of June 30, 2023 and December 31, 2022 is shown below:
Exchange rate | Institution | Notional ThU.S.$ | 06-30-2023 fair value ThU.S.$ | 12-31-2022 fair value ThU.S.$ | ||||||||||
USD | DNB Bank ASA | 4,220 | 29 | 110 | ||||||||||
|
|
|
| |||||||||||
| 29 | 110 | |||||||||||||
|
|
|
| |||||||||||
Note: The values and amounts indicated in the section 23.4.2 correspond to 50% of the total Uruguayan companies amounts, showing the participation that Arauco has in this companies.
90
Table of Contents
CELULOSA ARAUCO Y CONSTITUCION S.A. AND SUBSIDIARIES
Unaudited interim consolidated financial statements
June 30, 2023
Amounts in thousands of U.S. dollars, except as indicated
23.4.3. United States
Interest Rate Swap
Arauco through its subsidiary in United States maintains an Interest Rate Swap with the purpose of setting the interest rate of a variable rate debt in the same currency (USD). The instrument was settled on September 2020 and the valuation off this instrument as of June 30, 2023 and December 31, 2022 is shown below:
Institution | Amount ThU.S.$ | Starting date | Ending date | 06-30-2023 fair value ThU.S.$ | 12-31-2022 fair value ThU.S.$ | |||||||||||||||
JP Morgan - N.A. | 80,000,000 | 2020-04-28 | 2024-04-28 | 3,677 | 5,062 | |||||||||||||||
Goldman Sachs N.A. | 80,000,000 | 2020-04-28 | 2024-04-28 | 3,593 | 5,004 | |||||||||||||||
JP Morgan - N.A. | 80,000,000 | 2020-04-28 | 2024-04-28 | 3,680 | 5,067 | |||||||||||||||
|
|
|
| |||||||||||||||||
| 10,950 | 15,133 | |||||||||||||||||||
|
|
|
| |||||||||||||||||
23.4.4. Argentina
Forward
As of June 30, 2023 and December 31, 2022, Arauco through its subsidiary in Argentina maintained the following forward contracts in force and effect for the purposes of ensuring an exchange rate of dollars:
Exchange rate | Institution | Amount ThU.S.$ | Starting date | Ending date | 06-30-2023 fair value ThU.S.$ | 12-31-2022 fair value ThU.S.$ | ||||||||||||||||
ARSUSD | BBVA - Argentina | 6,000 | 2023-03-30 | 2023-04-28 | — | (17 | ) | |||||||||||||||
ARSUSD | HSBC | 4,000 | 2023-06-15 | 2023-07-31 | (81 | ) | — | |||||||||||||||
ARSUSD | HSBC | 4,000 | 2023-06-28 | 2023-07-31 | 5 | — | ||||||||||||||||
|
|
|
| |||||||||||||||||||
| (76 | ) | (17 | ) | |||||||||||||||||||
|
|
|
| |||||||||||||||||||
23.5 Cash equivalent, Loans and Receivables
The financial assets measured at amortized cost using the effective interest method and tested for impairment are: cash and cash equivalent, time deposits, repurchase agreements, trade and other current/non-current receivables (with third parties and from related parties).
Loans and receivables are non-derivative financial assets with fixed or determinable payments that are not quoted in an active market. In the consolidated statements of financial position, they are included in line items “Cash and cash equivalents” (certain components of cash and cash equivalents), “Trade and other current/non-current receivables” and “Accounts receivable from related parties”.
91
Table of Contents
CELULOSA ARAUCO Y CONSTITUCION S.A. AND SUBSIDIARIES
Unaudited interim consolidated financial statements
June 30, 2023
Amounts in thousands of U.S. dollars, except as indicated
As of June 30, 2023 and December 31, 2022, there are provisions for impairment for ThU.S.$8,330 and ThU.S.$ 7,960, respectively.
| 06-30-2023 ThU.S.$ | 12-31-2022 ThU.S.$ | |||||||
Financial assets at amortized cost | 1,464,758 | 1,476,046 | ||||||
Cash and cash equivalents (Mutual Funds not included) | 552,563 | 557,143 | ||||||
Cash | 266,333 | 298,577 | ||||||
Time deposits | 284,518 | 258,566 | ||||||
Repurchase agreements | 1,712 | — | ||||||
Accounts receivables (net) | 912,194 | 913,532 | ||||||
Trade receivables | 599,777 | 726,972 | ||||||
Lease receivable | 72,127 | 28,935 | ||||||
Sundry debtors | 14,922 | 8,911 | ||||||
Other receivables | 159,877 | 56,973 | ||||||
Prepayments | 58,777 | 84,178 | ||||||
Accounts receivable from related parties | 6,714 | 7,563 | ||||||
Other financial assets | 1 | 5,371 | ||||||
23.5.1. Cash and Cash Equivalents
Includes cash on hand, bank checking account balances and time deposits and other short-term highly liquid investments with an original maturity of three months or less. They are short-term, highly liquid investments that are readily convertible to known amounts of cash, and which are subject to an insignificant risk of changes in value.
The composition of cash and cash equivalents (including the balance of mutual funds displayed in this note as valuation, instruments at fair value with profit or loss) at June 30, 2023 and December 31, 2022, classified by currency is as follows:
| 06-30-2023 ThU.S.$ | 12-31-2022 ThU.S.$ | |||||||
Cash and cash equivalents | 764,621 | 667,207 | ||||||
U.S. dollars | 380,234 | 395,254 | ||||||
Euro | 2,843 | 4,884 | ||||||
Real | 81,498 | 103,829 | ||||||
Argentine pesos | 103,777 | 97,859 | ||||||
Mexican pesos | 30,056 | 28,564 | ||||||
Other currencies | 5,219 | 26,793 | ||||||
Chilean pesos | 160,994 | 10,024 | ||||||
23.5.2 Time Deposits and Repurchase Agreements: The investment objective of time deposits and repurchase agreements is to maximize in the short-term the amounts of cash surpluses. These instruments are authorized by Arauco’s Investment Policy, which allows investing in fixed income securities. These instruments have a maturity of less than three months from the date of acquisition.
23.5.3 Trade and Other Receivables: These represent enforceable rights for Arauco resulting from the normal course of the business.
23.5.4 Sundry debtors: These correspond to receivables from sales, services or loans that are not considered within the normal course of the business.
The allowance for doubtful accounts is presented as a deduction of trade and other receivables. The provision for doubtful accounts is established based on an analysis of the age of the portfolio and considering the insurance coverage on accounts receivable. Other conditions are assessed for example when there is objective evidence that Arauco will not receive payments under the original sale terms and when the customer is a party to a bankruptcy court agreement or cessation of payments, and is written-off when Arauco has exhausted all levels of recovery of the receivable in a reasonable time.
92
Table of Contents
CELULOSA ARAUCO Y CONSTITUCION S.A. AND SUBSIDIARIES
Unaudited interim consolidated financial statements
June 30, 2023
Amounts in thousands of U.S. dollars, except as indicated
23.5.5 Accounts receivable from related parties: Represent enforceable rights for Arauco resulting from the normal course of business, calling normal to the line of business, activity or purpose of exploitation and financing, and which Arauco owns a non-controlling ownership of the counterparty.
The following table sets forth trade and other current/non-current receivables classified by currencies as of June 30, 2023 and December 31, 2022:
| 06-30-2023 ThU.S.$ | 12-31-2022 ThU.S.$ | |||||||
Trade and other current receivables | 818,152 | 873,295 | ||||||
U.S. dollars | 460,258 | 614,204 | ||||||
Euros | 27,807 | 36,425 | ||||||
Real | 71,183 | 50,646 | ||||||
Argentine pesos | 25,538 | 33,287 | ||||||
Mexican pesos | 38,485 | 33,089 | ||||||
Other currencies | 2,062 | 1,972 | ||||||
Chilean pesos | 178,806 | 97,616 | ||||||
U.F. | 14,013 | 6,056 | ||||||
Accounts receivable from related parties, current | 6,714 | 7,563 | ||||||
U.S. dollars | 424 | — | ||||||
Other currencies | 2,179 | 4,713 | ||||||
Chilean pesos | 4,111 | 2,850 | ||||||
Trade and other non-current receivables | 87,328 | 32,674 | ||||||
U.S. dollars | 25,456 | 5,880 | ||||||
Argentine pesos | 503 | — | ||||||
Chilean pesos | 3,349 | 3,434 | ||||||
U.F. | 58,020 | 23,360 | ||||||
23.6 Financial Liabilities
Arauco’s financial liabilities to the date of these interim consolidated financial statements are as follows:
Financial liabilities | 06-30-2023 ThU.S.$ | 12-31-2022 ThU.S.$ | ||||||
Total financial liabilities | 7,760,088 | 6,649,011 | ||||||
Financial liabilities at fair value through profit or loss | 188 | 17 | ||||||
Hedging liabilities | 51,696 | 76,669 | ||||||
Financial liabilities at amortized cost | 7,708,204 | 6,572,325 | ||||||
The following table sets forth the current portion of the non-current bank borrowings and debt issued as of June 30, 2023 and December 31, 2022.
| 06-30-2023 ThU.S.$ | 12-31-2022 ThU.S.$ | |||||||
Bank borrowings - current portion | 317,270 | 139,252 | ||||||
Bonds issued - current portion | 103,544 | 95,550 | ||||||
Total | 420,814 | 234,802 | ||||||
93
Table of Contents
CELULOSA ARAUCO Y CONSTITUCION S.A. AND SUBSIDIARIES
Unaudited interim consolidated financial statements
June 30, 2023
Amounts in thousands of U.S. dollars, except as indicated
23.7 Financial Liabilities Measured at Amortized Cost
Financial liabilities correspond to non-derivative financial instruments with contractual cash-flow payments that can be either fixed or variable.
Also, this category includes those non-derivative financial liabilities for services or goods delivered to Arauco at the end of each reporting period that have not yet been paid. These amounts are not insured and are generally paid within thirty days after being recognized.
At the end of these interim consolidated financial statements, Arauco includes in this category bank borrowings, bonds issued denominated in U.S. dollars and in U.F., lease liabilities, and trade and other payables.
Currency | 06-30-2023 ThU.S.$ | 12-31-2022 ThU.S.$ | 06-30-2023 ThU.S.$ | 12-31-2022 ThU.S.$ | ||||||||||||||
| Amortized cost | Fair value | |||||||||||||||||
Total financial liabilities | 7,708,204 | 6,572,325 | 6,853,293 | 6,331,528 | ||||||||||||||
Bonds issued | U.S. dollar | 3,400,061 | 3,397,376 | 3,015,787 | 3,136,318 | |||||||||||||
Bonds issued | U.F. | 1,736,265 | 1,116,083 | 1,310,644 | 1,167,251 | |||||||||||||
Bank borrowings | U.S. dollar | 812,693 | 415,462 | 807,498 | 408,278 | |||||||||||||
Bank borrowings | Euro | 442,732 | 455,325 | 608,282 | 501,492 | |||||||||||||
Bank borrowings | Other currencies | 205,371 | 69,890 | — | — | |||||||||||||
Lease liabilities | U.F. | 18,054 | 16,936 | 18,054 | 16,936 | |||||||||||||
Lease liabilities | Chilean pesos | 4,995 | 11,265 | 4,995 | 11,265 | |||||||||||||
Lease liabilities | Real | 226,655 | 101,269 | 226,655 | 101,269 | |||||||||||||
Lease liabilities | Mexican pesos | 4,588 | 3,238 | 4,588 | 3,238 | |||||||||||||
Lease liabilities | U.S. dollar | 127,342 | 131,292 | 127,342 | 131,292 | |||||||||||||
Lease liabilities | Euro | 159 | 201 | 159 | 201 | |||||||||||||
Lease liabilities | Other currencies | 194 | 23 | 194 | 23 | |||||||||||||
Trade and other payables | U.S. dollar | 150,206 | 234,226 | 150,206 | 234,226 | |||||||||||||
Trade and other payables | Euro | 26,932 | 23,277 | 26,932 | 23,277 | |||||||||||||
Trade and other payables | Real | 103,134 | 85,450 | 103,134 | 85,450 | |||||||||||||
Trade and other payables | Argentine pesos | 46,922 | 54,078 | 46,922 | 54,078 | |||||||||||||
Trade and other payables | Mexican pesos | 19,778 | 16,791 | 19,778 | 16,791 | |||||||||||||
Trade and other payables | Other currencies | 13,990 | 10,476 | 13,990 | 10,476 | |||||||||||||
Trade and other payables | Chilean pesos | 299,295 | 369,300 | 299,295 | 369,300 | |||||||||||||
Trade and other payables | U.F. | 44,271 | 39,356 | 44,271 | 39,356 | |||||||||||||
Accounts payable to related parties | U.S. dollar | — | 202 | — | 202 | |||||||||||||
Accounts payable to related parties | Other currencies | — | — | — | — | |||||||||||||
Accounts payable to related parties | Real | 2,339 | — | 2,339 | — | |||||||||||||
Accounts payable to related parties | Chilean pesos | 22,228 | 20,809 | 22,228 | 20,809 | |||||||||||||
The financial liabilities at amortized cost presented in the interim consolidated statements of financial position as of June 30, 2023 and December 31, 2022 are as follows:
| 06-30-2023 ThU.S.$ | ||||||||||||
| Current | Non-current | Total | ||||||||||
Other financial liabilities | 777,320 | 5,819,802 | 6,597,122 | |||||||||
Lease liabilities | 49,581 | 332,406 | 381,987 | |||||||||
Trade and other payables | 682,488 | 22,040 | 704,528 | |||||||||
Accounts payable to related parties | 17,836 | 6,731 | 24,567 | |||||||||
|
|
|
|
|
| |||||||
Total financial liabilities at amortized cost | 1,527,225 | 6,180,979 | 7,708,204 | |||||||||
|
|
|
|
|
| |||||||
| 12-31-2022 ThU.S.$ | ||||||||||||
| Current | Non-current | Total | ||||||||||
Other financial liabilities | 373,344 | 5,080,792 | 5,454,136 | |||||||||
Lease liabilities | 36,784 | 227,440 | 264,224 | |||||||||
Trade and other payables | 812,838 | 20,116 | 832,954 | |||||||||
Accounts payable to related parties | 14,280 | 6,731 | 21,011 | |||||||||
|
|
|
|
|
| |||||||
Total financial liabilities at amortized cost | 1,237,246 | 5,335,079 | 6,572,325 | |||||||||
|
|
|
|
|
| |||||||
94
Table of Contents
CELULOSA ARAUCO Y CONSTITUCION S.A. AND SUBSIDIARIES
Unaudited interim consolidated financial statements
June 30, 2023
Amounts in thousands of U.S. dollars, except as indicated
23.8 Cash Flow Hedges Reserve Reconciliation
The following table sets forth the reconciliation balances of cash flow hedges presented in the interim consolidated statements of comprehensive income:
| January - June | April - June | |||||||||||||||
| 2023 ThU.S.$ | 2022 ThU.S.$ | 2023 ThU.S.$ | 2022 ThU.S.$ | |||||||||||||
Opening balance | (10,112 | ) | (136,859 | ) | (38,348 | ) | (52,935 | ) | ||||||||
Gains (losses) on cash flow hedges, before tax | (29,698 | ) | 156,807 | 10,700 | 49,486 | |||||||||||
Recycle of cash flow hedges to profit or loss | 209 | (5,080 | ) | 209 | (5,080 | ) | ||||||||||
Income tax relating to cash flow hedges of other comprehensive income | 7,792 | (41,248 | ) | (4,370 | ) | (17,851 | ) | |||||||||
Closing balance | (31,809 | ) | (26,380 | ) | (31,809 | ) | (26,380 | ) | ||||||||
23.9 Capital Disclosures
23.9.1 Information on Objectives, Policies and Processes applied by the Company regarding Capital Management
Arauco’s policies on capital management have the objective of:
| a) | Ensuring business continuity and normal operations in the long-term; |
| b) | Ensuring funding for new investments to achieve sustainable growth over time; |
| c) | Keeping adequate capital structure considering all economic cycles that impact the business and the nature of the industry; and |
| d) | Maximizing the Company’s value and providing an adequate return to shareholders. |
23.9.2 Qualitative Information on Objectives, Policies and Processes applied by the Company regarding Capital Management
Arauco determines and manages its capital structure based on its carrying amount of equity plus its financial debt (bank borrowings and bonds issued).
23.9.3 Quantitative Information on Capital Management
The following table sets forth the financial covenants that the Company has to comply with as part of the terms of certain of its obligations:
Instrument | 06-30-2023 ThU.S.$ | 12-31-2022 ThU.S.$ | Interest coverage >= 2,0x | Debt level (1) <= 1,2x | ||||||||
Domestic bonds (Chile) | 1,736,265 | 1,116,083 | N/R | ü | ||||||||
Syndicate borrowing - Grayling | 227,572 | 242,483 | ü | ü | ||||||||
Syndicate ECA - MAPA | 442,732 | 455,325 | ü | ü | ||||||||
N/R: Not required for the financial obligation.
| (1) | Debt to equity ratio (financial debt divided by equity plus non-controlling interests). |
As of June 30, 2023 and December 31, 2022, Arauco has complied with all of its financial covenants.
The following table sets forth the credit ratings of our debt instruments as of June 30, 2023, are as follows:
Instrument | Standard & Poor’s | Fitch Ratings | Moody’s | Feller Rate | ||||
| Local bonds | — | AA | — | AA | ||||
| Foreign bonds | BBB- | BBB | Baa3 | — |
95
Table of Contents
CELULOSA ARAUCO Y CONSTITUCION S.A. AND SUBSIDIARIES
Unaudited interim consolidated financial statements
June 30, 2023
Amounts in thousands of U.S. dollars, except as indicated
Capitalization requirements are established based on the Company’s financial needs and on maintaining an adequate liquidity level and complying with financial covenants established in current debt arrangements. The Company manages its capital structure and makes adjustments based on the prevailing economic conditions in order to mitigate the risks associated with adverse market conditions and based on opportunities that may arise to improve the Company’s level of liquidity.
The capitalization of Arauco as of June 30, 2023 and December 31, 2022 is as follows:
| 06-30-2023 | 12-31-2022 | |||||||
| ThU.S.$ | ThU.S.$ | |||||||
Equity | 8,143,192 | 8,259,984 | ||||||
Bank borrowings | 1,460,796 | 940,677 | ||||||
Lease liabilities | 381,987 | 264,224 | ||||||
Bonds issued | 5,136,326 | 4,513,459 | ||||||
|
|
|
| |||||
Capitalization | 15,122,301 | 13,978,344 | ||||||
|
|
|
| |||||
23.10 Risk Management
Arauco’s financial instruments are exposed to various financial risks: credit risk, liquidity risk and market risk (including exchange rate risks, interest rate risks and price risks). Arauco’s overall risk management program focuses on uncertainty in financial markets and aims to minimize potential adverse effects on Arauco’s financial profitability.
Arauco’s financial risk management is overseen by the Corporate Finance Department. This department identifies, assesses and hedges financial risks in close collaboration with Arauco’s operational units. The company is not actively involved in trading its financial assets for speculative purposes.
23.10.1 Type of Risk: Credit Risk
Description
Credit risk refers to financial uncertainty at different periods of time relating to the fulfillment of obligations with counterparties, at the time of exercising the contract rights to receive cash or other financial assets on behalf of Arauco.
Explanation of Credit Risk Exposure and How This Risk Arises
Arauco’s exposure to credit risk is directly related to each of its customer’s individual abilities to fulfill their contractual commitments, reflected in trade receivables.
Accounts exposed to credit risk are trade receivables, financial lease debtors and other debtors.
96
Table of Contents
CELULOSA ARAUCO Y CONSTITUCION S.A. AND SUBSIDIARIES
Unaudited interim consolidated financial statements
June 30, 2023
Amounts in thousands of U.S. dollars, except as indicated
Arauco does not have a securitized portfolio.
| 06-30-2023 | 12-31-2022 | |||||||
| ThU.S.$ | ThU.S.$ | |||||||
Current receivables | ||||||||
Trade receivables | 599,740 | 726,936 | ||||||
Lease receivable | 13,702 | 5,067 | ||||||
Sundry debtors | 10,701 | 4,451 | ||||||
Other receivables | 136,750 | 54,525 | ||||||
Prepayments | 57,259 | 82,316 | ||||||
Net subtotal | 818,152 | 873,295 | ||||||
Trade receivables | 604,213 | 731,445 | ||||||
Lease receivable | 13,702 | 5,067 | ||||||
Sundry debtors | 11,596 | 4,866 | ||||||
Other receivables | 137,852 | 55,687 | ||||||
Prepayments | 57,259 | 82,316 | ||||||
Gross subtotal | 824,622 | 879,381 | ||||||
Provision for doubtful trade receivables | 4,473 | 4,509 | ||||||
Provision for doubtful lease receivable | — | — | ||||||
Provision for doubtful sundry debtors | 895 | 415 | ||||||
Provision for doubtful other receivables | 1,102 | 1,162 | ||||||
Subtotal bad debt | 6,470 | 6,086 | ||||||
Non-current receivables | ||||||||
Trade receivables | 37 | 36 | ||||||
Lease receivable | 58,425 | 23,868 | ||||||
Sundry debtors | 4,221 | 4,460 | ||||||
Other receivables | 23,127 | 2,448 | ||||||
Prepayments | 1,518 | 1,862 | ||||||
Net subtotal | 87,328 | 32,674 | ||||||
Trade receivables | 1,897 | 1,910 | ||||||
Lease receivable | 58,425 | 23,868 | ||||||
Sundry debtors | 4,221 | 4,460 | ||||||
Other receivables | 23,127 | 2,448 | ||||||
Prepayments | 1,518 | 1,862 | ||||||
Gross subtotal | 89,188 | 34,548 | ||||||
Provision for doubtful trade receivables | 1,860 | 1,874 | ||||||
Provision for doubtful lease receivable | — | — | ||||||
Provision for doubtful sundry debtors | — | — | ||||||
Provision for doubtful other receivables | — | — | ||||||
Subtotal bad debt | 1,860 | 1,874 | ||||||
Explanation of Risk Management Objectives, Policies and Processes, and Measurement Methods
The Credit and Collections Sub-Division, dependent from the Treasury Department, is the area entrusted with minimizing the credit risk of the accounts receivable, supervising the delinquency of the accounts. The regulations and procedures applicable for the control and administration of the Arauco Group can be found in the Corporate Credit Policy.
As of June 30, 2023, Arauco’s balance for commercial debtors was ThU.S.$ 606,110 of which, according to the agreed sales conditions, 63.88% corresponded to sales on credit (open account), 34.02% to sales with letters of credit and 2.10% to other types of sales. The client with the largest Open Account debt represented 2.52% of the total accounts receivable as of that date.
97
Table of Contents
CELULOSA ARAUCO Y CONSTITUCION S.A. AND SUBSIDIARIES
Unaudited interim consolidated financial statements
June 30, 2023
Amounts in thousands of U.S. dollars, except as indicated
Below we provide detail regarding accounts receivable, classified in tranches:
June 30, 2023
Age of trade receivables
Days | Non- past due | 1 to 30 | 31 to 60 | 61 to 90 | 91 to 120 | 121 to 150 | 151 to 180 | 181 to 210 | 211 to 250 | More than 250 | Total | |||||||||||||||||||||||||||||||||
N° debtor | 1,640 | 620 | 49 | 30 | 24 | 19 | 10 | 7 | 10 | 71 | 2,480 | |||||||||||||||||||||||||||||||||
ThU.S.$ | 575,297 | 22,343 | 760 | 362 | 237 | 124 | 1,378 | 69 | 173 | 5,367 | 606,110 | |||||||||||||||||||||||||||||||||
% | 94.90 | % | 3.69 | % | 0.13 | % | 0.06 | % | 0.04 | % | 0.02 | % | 0.23 | % | 0.01 | % | 0.03 | % | 0.89 | % | 100 | % | ||||||||||||||||||||||
December 31, 2022
Age of trade receivables
Days | Non- past due | 1 to 30 | 31 to 60 | 61 to 90 | 91 to 120 | 121 to 150 | 151 to 180 | 181 to 210 | 211 to 250 | More than 250 | Total | |||||||||||||||||||||||||||||||||
N° debtor | 1,500 | 689 | 69 | 43 | 37 | 25 | 18 | 27 | 16 | 62 | 2,486 | |||||||||||||||||||||||||||||||||
ThU.S.$ | 700,691 | 23,995 | 1,941 | 474 | 352 | 133 | 87 | 94 | 67 | 5,521 | 733,355 | |||||||||||||||||||||||||||||||||
% | 95.56 | % | 3.27 | % | 0.26 | % | 0.06 | % | 0.05 | % | 0.02 | % | 0.01 | % | 0.01 | % | 0.01 | % | 0.75 | % | 100 | % | ||||||||||||||||||||||
Arauco applies the simplified approach regarding the expected losses from commercial debtors, which allows for the use of an estimate of expected credit losses over the instrument’s lifespan for all commercial accounts receivable. In order to establish this estimate, the commercial debtors have been grouped in relation to the corresponding risks for sales conditions as well as for tranches, including clients that are up-to-date or in default.
June 30, 2023:
Days | Non- past due | 1 to 30 | 31 to 60 | 61 to 90 | 91 to 120 | 121 to 150 | 151 to 180 | 181 to 210 | 211 to 250 | More than 250 | Total | |||||||||||||||||||||||||||||||||
Letters of credit | 205,415 | 808 | — | — | — | — | — | — | — | — | 206,223 | |||||||||||||||||||||||||||||||||
Loss allowance provision | — | — | — | — | — | — | — | — | — | — | — | |||||||||||||||||||||||||||||||||
Expected loss rate | 0.00 | % | 0.00 | % | 0.00 | % | 0.00 | % | 0.00 | % | 0.00 | % | 0.00 | % | 0.00 | % | 0.00 | % | 0.00 | % | ||||||||||||||||||||||||
Credit line | 359,907 | 21,191 | 563 | 226 | 208 | 113 | 1,376 | 68 | 148 | 3,368 | 387,168 | |||||||||||||||||||||||||||||||||
Loss allowance provision | 1,545 | — | 18 | 29 | 17 | 12 | 138 | 68 | 147 | 2,298 | 4,272 | |||||||||||||||||||||||||||||||||
Expected loss rate | 0.43 | % | 0.00 | % | 3.14 | % | 12.70 | % | 8.17 | % | 10.71 | % | 10.01 | % | 99.85 | % | 99.59 | % | 68.23 | % | ||||||||||||||||||||||||
Others | 9,975 | 344 | 197 | 136 | 29 | 11 | 2 | 1 | 25 | 1,999 | 12,719 | |||||||||||||||||||||||||||||||||
Loss allowance provision | — | — | 2 | 14 | 15 | 6 | 1 | 0 | 25 | 1,999 | 2,061 | |||||||||||||||||||||||||||||||||
Expected loss rate | 0.00 | % | 0.00 | % | 0.86 | % | 10.00 | % | 50.69 | % | 51.82 | % | 50.00 | % | 30.00 | % | 100.00 | % | 100.00 | % | ||||||||||||||||||||||||
Total trade receivables (ThU.S.$) | 575,297 | 22,343 | 760 | 362 | 237 | 124 | 1,378 | 69 | 173 | 5,367 | 606,110 | |||||||||||||||||||||||||||||||||
Total allowance for doubtful accounts (ThU.S.$) | 1,545 | — | 19 | 42 | 32 | 18 | 139 | 68 | 172 | 4,297 | 6,333 | |||||||||||||||||||||||||||||||||
December 31, 2022:
Days | Non- past due | 1 to 30 | 31 to 60 | 61 to 90 | 91 to 120 | 121 to 150 | 151 to 180 | 181 to 210 | 211 to 250 | More than 250 | Total | |||||||||||||||||||||||||||||||||
Letters of credit | 335,897 | 1,080 | 10 | — | — | — | — | — | — | — | 336,987 | |||||||||||||||||||||||||||||||||
Loss allowance provision | — | — | — | — | — | — | — | — | — | — | — | |||||||||||||||||||||||||||||||||
Expected loss rate | 0.00 | % | 0.00 | % | 0.00 | % | 0.00 | % | 0.00 | % | 0.00 | % | 0.00 | % | 0.00 | % | 0.00 | % | 0.00 | % | ||||||||||||||||||||||||
Credit line | 363,423 | 22,175 | 1,791 | 300 | 299 | 100 | 87 | 93 | 67 | 3,505 | 391,840 | |||||||||||||||||||||||||||||||||
Loss allowance provision | 1,545 | — | 59 | 34 | 38 | 10 | 9 | 93 | 41 | 2,487 | 4,316 | |||||||||||||||||||||||||||||||||
Expected loss rate | 0.43 | % | 0.00 | % | 3.27 | % | 11.22 | % | 12.74 | % | 9.52 | % | 9.82 | % | 99.08 | % | 60.88 | % | 70.95 | % | ||||||||||||||||||||||||
Others | 1,371 | 740 | 140 | 174 | 53 | 33 | — | 1 | — | 2,016 | 4,528 | |||||||||||||||||||||||||||||||||
Loss allowance provision | — | — | 1 | 17 | 31 | 19 | — | 1 | — | 2,000 | 2,069 | |||||||||||||||||||||||||||||||||
Expected loss rate | 0.00 | % | 0.00 | % | 0.85 | % | 9.94 | % | 57.52 | % | 55.92 | % | 0.00 | % | 96.35 | % | 0.00 | % | 99.25 | % | ||||||||||||||||||||||||
Total trade receivables (ThU.S.$) | 700,691 | 23,995 | 1,941 | 474 | 352 | 133 | 87 | 94 | 67 | 5,521 | 733,355 | |||||||||||||||||||||||||||||||||
Total allowance for doubtful accounts (ThU.S.$) | 1,545 | — | 60 | 51 | 69 | 29 | 9 | 94 | 41 | 4,487 | 6,385 | |||||||||||||||||||||||||||||||||
Arauco does not conduct rescheduling or renegotiations with its clients that imply an amendment to the maturity of the invoices and, should it be necessary, any debt renegotiation with a client shall be analyzed on a case-by-case basis and subjected to the approval of the Corporate Finance Division.
98
Table of Contents
CELULOSA ARAUCO Y CONSTITUCION S.A. AND SUBSIDIARIES
Unaudited interim consolidated financial statements
June 30, 2023
Amounts in thousands of U.S. dollars, except as indicated
Regarding the loss allowance for trade receivables and others, below we provide detail for the movements as of June 30, 2023 and December 31, 2022:
| 06-30-2023 | 12-30-2022 | |||||||
| ThU.S.$ | ThU.S.$ | |||||||
Opening loss allowance as at January 1 | 7,960 | 8,792 | ||||||
Increase in loan loss allowance recognized in profit or loss during the year | 852 | 1,097 | ||||||
Receivables written off during the year as uncollectible | — | (321 | ) | |||||
Unused amount reversed | (482 | ) | (1,608 | ) | ||||
Closing balance | 8,330 | 7,960 | ||||||
Currently there is a policy for provisions for doubtful accounts receivable under IFRS for all the Arauco group companies.
Explanation regarding the Sales Risk with Letters of Credit
The sales with letters of credit mainly occur in markets in Asia and the Middle East. Periodically, a credit assessment is conducted regarding the banks that issue the letters of credit with the purpose of obtaining their score over the basis of risk-qualification ratings, country-specific risk and financial statements. The decision of approving the issuing bank or asking for confirmation of the letter of credit is made in consideration to this assessment.
Explanation of the Sales Risk with Credit Line
Sales on credit are subject to the credit limit for each customer. The approval or rejection of a credit limit for all term sales is conducted by the Corporate Credit Sub-Division, as well as by the Credit and Collections area for North America, Brazil and Argentina, which report to the Corporate Finance Division. The regulations and procedures applicable for the correct control and risk management over the sales on credit are ruled by the Credit Policy.
A procedure that must be applied by all the companies of the Arauco group has been established for the approval and/or modification of client credit lines. Credit line requests are entered to the SAP that analyzes all available information. Afterwards, the same are either approved or rejected in each one of the internal committees of each company belonging to the Arauco group, depending on the maximum amount authorized by the Credit Policy. Lines of credit are renewed during this internal process on a yearly basis.
All sales are automatically controlled by a credit verification system, which has been configured to block any orders from clients who are delinquent in a given percentage of a debt and/or from clients whose line of credit, as of the time of the product’s shipping, has been exceeded or is overdue.
99
Table of Contents
CELULOSA ARAUCO Y CONSTITUCION S.A. AND SUBSIDIARIES
Unaudited interim consolidated financial statements
June 30, 2023
Amounts in thousands of U.S. dollars, except as indicated
In order to minimize the credit risk for term or Open Account sales, it is Arauco’s policy to take out insurance to cover the export sales of companies Celulosa Arauco y Constitución S.A., Maderas Arauco S.A., Forestal Arauco S.A., Arauco Argentina S.A., and Arauco do Brasil S.A., as well as the domestic sales of Arauco Europe Coöperatief U.A., Arauco Argentina S.A., Araucomex S.A. de C.V., Arauco Industria de México, S.A. de C.V., Arauco Peru S.A., Arauco North America, Inc., Arauco Canada Ltd., Celulosa Arauco y Constitución S.A., Maderas Arauco S.A., Arauco Florestal Arapoti S.A., Arauco Forest Brasil S.A., Arauco do Brasil S.A. and Arauco Industria de Paineis S.A. Arauco works with credit insurance company Allianz Trade For Multinationals (Aa3 rating, as per risk rating companies Moody’s).
As another way of minimizing risk and supporting a line of credit approved by the Credit Committee through guarantees, Arauco holds guarantees such as mortgages, pledges, Standby letters of credit, bank performance bonds, checks, promissory notes, borrowings or any other that could be required under the laws of each country. The total amount held in guarantees amounts to ThU.S.$ 106,327, effective as of June 30, 2023, as summarized in the following chart. The procedure for guarantees is regulated by Arauco’s Policy on Guarantees, whose purpose is to control their accounting, due date and custody.
Guarantees Arauco group (ThU.S.$) | ||||||||
Guarantees debtors (received from clients) |
| |||||||
Certificate of deposits | 3,017 | 2.84 | % | |||||
Standby | 10,849 | 10.20 | % | |||||
Promissory notes | 77,352 | 72.75 | % | |||||
Finance | 1,802 | 1.70 | % | |||||
Mortgage | 1,078 | 1.01 | % | |||||
Pledge | 632 | 0.59 | % | |||||
Loan agreement | 11,597 | 10.91 | % | |||||
|
|
|
| |||||
Total guarantees | 106,327 | 100.0 | % | |||||
|
|
|
| |||||
The maximum exposure to credit risk is limited to the value at amortized cost of the Debtors’ account for sales registered as of the date of this report, minus the percentage of sales insured by the aforementioned credit insurance companies and the guarantees granted in favor of Arauco.
In summary, the open account debt covered by the various insurance policies and guarantees amounts to 99.2% and, therefore, Arauco’s portfolio exposure amounts to 0.8%.
Secured open accounts receivable | ThU.S.$ | % | ||||||
Total open accounts receivable | 437,739 | 100.0 | % | |||||
Secured receivables (*) | 434,167 | 99.2 | % | |||||
Unsecured receivables | 3,572 | 0.8 | % | |||||
| (*) | Insured debt is deemed to be the portion of accounts receivable that is covered by a credit company or by guarantees such as standby letters of credit, mortgages, performance bonds, among others. |
100
Table of Contents
CELULOSA ARAUCO Y CONSTITUCION S.A. AND SUBSIDIARIES
Unaudited interim consolidated financial statements
June 30, 2023
Amounts in thousands of U.S. dollars, except as indicated
Investment Policy:
Arauco has an Investment Policy which identifies and limits the financial instruments and the entities into which the Arauco companies, in particular Celulosa Arauco y Constitucion S.A., are authorized to invest. The Company’s Treasury Department is centralized with operations in Chile, USA, Canada and México. The Head Office is responsible for carrying out investments, cash flow surplus investments, and short and long-term debt subscriptions. Exceptions to this rule apply to short and long-term debt, and will be for specific investments made through other companies where authorization is required from the Chief Financial Officer.
For financial instruments, the only permitted investments are fixed income investments with adequate liquidity. Each instrument has defined classifications and limits, depending on duration and type of issuer.
Regarding intermediaries (such as banks, securities brokers and dealers of mutual funds that are bank affiliates), a scoring methodology is used to determine the relative degree of risk of each intermediary based on their financial position and assign score points that result in a credit risk rating to each intermediary. Arauco uses this scoring system to determine its investment limits for each intermediary.
The required information to evaluate the various criteria are obtained from published financial statements from the banks under evaluation and from the credit risk ratings of short and long-term debt securities obtained from rating agencies authorized by the Commission for the Financial Market (Fitch Ratings Chile, Humphreys and Feller Rate).
Any necessary exceptions regarding investment limits in each particular instrument or entity must have the authorization from Arauco’s Chief Financial Officer.
23.10.2 Type of Risk: Liquidity Risk
Description
This risk corresponds to Arauco’s ability to fulfill its financial obligations upon maturity.
Explanation of Liquidity Risk Exposure and How This Risk Arises
Arauco’s exposure to liquidity risk is mainly from its obligations to bondholders, banks and financial institutions, creditors and other payables. Liquidity risk may arise if Arauco is unable to meet the net cash flow requirements, which sustain its operations under both normal and exceptional circumstances.
Explanation of Objectives, Policies and Processes for Risk Management, and Measurement Methods
The Corporate Financial Management Division monitors on an ongoing basis the Company’s cash flow forecasts based on short and long-term forecasts and available financing alternatives. In order to manage the risk level of financial assets, Arauco follows its investment policy.
101
Table of Contents
CELULOSA ARAUCO Y CONSTITUCION S.A. AND SUBSIDIARIES
Unaudited interim consolidated financial statements
June 30, 2023
Amounts in thousands of U.S. dollars, except as indicated
The following tables detail Arauco’s liquidity analysis for its financial liabilities as of June 30, 2023 and December 31, 2022. The tables have been drawn up based on the contractual undiscounted cash outflows and their remaining contractual maturities.
June 30, 2023 | Maturity | Total | Effective rate | Nominal rate | ||||||||||||||||||||||||||||||||||||||||||||
| Up to 3 | 3 to 12 | 1 to 2 | 2 to 3 | 3 to 4 | 4 to 5 | More than 5 | Non | |||||||||||||||||||||||||||||||||||||||||
| months | months | Years | years | years | Years | years | Current | current | ||||||||||||||||||||||||||||||||||||||||
Tax ID | Name | Currency | Bank borrowings | ThU.S.$ | ThU.S.$ | ThU.S.$ | ThU.S.$ | ThU.S.$ | ThU.S.$ | ThU.S.$ | ThU.S.$ | ThU.S.$ | ||||||||||||||||||||||||||||||||||||
| 93.458.000-1 | Celulosa Arauco y Constitución S.A. | Euros | BNP paribas / ECA | — | 73,643 | 72,858 | 72,122 | 71,393 | 70,659 | 104,601 | 73,643 | 391,633 | 1.10 | % | 1.06% | |||||||||||||||||||||||||||||||||
| 93.458.000-1 | Celulosa Arauco y Constitución S.A. | U.S. dollar | Bank of Nova Scotia | — | — | 223,285 | — | — | — | — | — | 223,285 | 6.12 | % | Fijo 6.08% | |||||||||||||||||||||||||||||||||
| 93.458.000-1 | Celulosa Arauco y Constitución S.A. | U.S. dollar | Banco Estado | 50,481 | — | — | — | — | — | — | 50,481 | — | 6.08 | % | Fijo 6.08% | |||||||||||||||||||||||||||||||||
| 93.458.000-1 | Celulosa Arauco y Constitución S.A. | U.S. dollar | BCI | 70,567 | — | — | — | — | — | — | 70,567 | — | 5.42 | % | Fijo 5.42% | |||||||||||||||||||||||||||||||||
| 93.458.000-1 | Celulosa Arauco y Constitución S.A. | U.S. dollar | ITAU | 50,183 | — | — | — | — | — | — | 50,183 | — | 5.98 | % | Fijo 5.98% | |||||||||||||||||||||||||||||||||
| 93.458.000-1 | Celulosa Arauco y Constitución S.A. | U.S. dollar | Scotiabank | 50,359 | — | — | — | — | — | — | 50,359 | — | 5.95 | % | Fijo 5.95% | |||||||||||||||||||||||||||||||||
| 93.458.000-1 | Celulosa Arauco y Constitución S.A. | U.S. dollar | Banco Santander | 50,268 | — | — | — | — | — | — | 50,268 | — | 5.84 | % | Fijo 5.84% | |||||||||||||||||||||||||||||||||
| — | Zona Franca Punta Pereira S.A. | U.S. dollar | Banco Interamericano de Desarrollo A | 2,161 | — | — | — | — | — | — | 2,161 | — | 7.10 | % | 2.05% + libor 6m | |||||||||||||||||||||||||||||||||
| — | Celulosa y Energía Punta Pereira S.A. | U.S. dollar | Banco Interamericano de Desarrollo A | 8,599 | — | — | — | — | — | — | 8,599 | — | 7.10 | % | 2.05% + libor 6m | |||||||||||||||||||||||||||||||||
| — | Eufores S.A. | U.S. dollar | Banco BBVA | — | 20,523 | — | — | — | — | — | 20,523 | — | 5.30 | % | Fijo 5.3% | |||||||||||||||||||||||||||||||||
| — | Eufores S.A. | U.S. dollar | Banco República Oriental del Uruguay | — | 56,320 | — | — | — | — | — | 56,320 | — | 4.76 | % | Fijo 4.76% | |||||||||||||||||||||||||||||||||
| — | Stora Enso Uruguay S.A. | U.S. dollar | Banco República Oriental del Uruguay | — | 5,120 | — | — | — | — | — | 5,120 | — | 4.76 | % | Fijo 4.76% | |||||||||||||||||||||||||||||||||
| — | Zona Franca Punta Pereira S.A. | U.S. dollar | Banco República Oriental del Uruguay | — | 15,360 | — | — | — | — | — | 15,360 | — | 4.76 | % | Fijo 4.76% | |||||||||||||||||||||||||||||||||
| — | Eufores S.A. | U.S. dollar | Banco Itaú | — | 15,381 | — | — | — | — | — | 15,381 | — | 5.52 | % | Fijo 5.52% | |||||||||||||||||||||||||||||||||
| — | Eufores S.A. | U.S. dollar | Santander | — | 42,854 | — | — | — | — | — | 42,854 | — | 5.55 | % | Fijo 5.55% | |||||||||||||||||||||||||||||||||
| — | Eufores S.A. | U.S. dollar | Scotiabank | — | 5,139 | — | — | — | — | — | 5,139 | — | 5.65 | % | Fijo 5.65% | |||||||||||||||||||||||||||||||||
| — | Arauco Forest Brasil S.A. | Brazilian real | Banco Safra S.A. | 3,064 | 3,011 | 13,062 | 18,433 | 16,370 | 7,422 | — | 6,075 | 55,287 | 15.30 | % | CDI + 1.65% | |||||||||||||||||||||||||||||||||
| — | Mahal Empreendimentos e Participações S.A. | Brazilian real | Banco Safra S.A. | — | 9,691 | 13,816 | 12,282 | 5,577 | — | — | 9,691 | 31,675 | 15.20 | % | CDI + 1.55% | |||||||||||||||||||||||||||||||||
| — | Arauco do Brasil S.A. | Brazilian real | Itaú Unibanco S.A. | 40 | 38 | 78 | 597 | — | — | — | 78 | 675 | 15.40 | % | CDI + 1.75% | |||||||||||||||||||||||||||||||||
| — | Arauco Celulose do Brasil S.A. | Brazilian real | Itaú Unibanco S.A. | 5,483 | 5,311 | 10,860 | 83,486 | — | — | — | 10,794 | 94,346 | 15.27 | % | CDI + 1.62% | |||||||||||||||||||||||||||||||||
| — | Arauco Celulose do Brasil S.A. | Brazilian real | Banco BTG pactual S.A. | 3,825 | 3,730 | 25,069 | 22,456 | 19,832 | — | — | 7,555 | 67,357 | 15.21 | % | CDI + 1.56% | |||||||||||||||||||||||||||||||||
| — | Arauco Argentina S.A. | U.S. dollar | Banco Industria y Comercial de China | 298 | — | — | — | — | — | — | 298 | — | 13.50 | % | 13.50% | |||||||||||||||||||||||||||||||||
| — | Arauco Argentina S.A. | U.S. dollar | Banco Industria y Comercial de China | 1,183 | — | — | — | — | — | — | 1,183 | — | 13.70 | % | 13.50% | |||||||||||||||||||||||||||||||||
| — | Arauco Argentina S.A. | U.S. dollar | Banco Industria y Comercial de China | 805 | — | — | — | — | — | — | 805 | — | 13.70 | % | 13.50% | |||||||||||||||||||||||||||||||||
| — | Arauco Argentina S.A. | U.S. dollar | Banco Industria y Comercial de China | 798 | — | — | — | — | — | — | 798 | — | 14.70 | % | 14.50% | |||||||||||||||||||||||||||||||||
| — | Arauco Argentina S.A. | U.S. dollar | Banco Industria y Comercial de China | 755 | — | — | — | — | — | — | 755 | — | 14.20 | % | 14.00% | |||||||||||||||||||||||||||||||||
| — | Arauco Argentina S.A. | U.S. dollar | Banco Industria y Comercial de China | — | 1,201 | — | — | — | — | — | 1,201 | — | 14.20 | % | 14.00% | |||||||||||||||||||||||||||||||||
| — | Arauco Argentina S.A. | U.S. dollar | Banco Industria y Comercial de China | 786 | — | — | — | — | — | — | 786 | — | 14.50 | % | 14.30% | |||||||||||||||||||||||||||||||||
| — | Arauco North America, Inc. | U.S. dollar | Banco Itau Corpbanca – NY Branch | — | 239,571 | — | — | — | — | — | 239,571 | — | 6.59 | % | 1.65% + libro 6m | |||||||||||||||||||||||||||||||||
|
|
|
|
|
|
|
|
|
|
|
|
|
|
|
|
|
| |||||||||||||||||||||||||||||||
| Total | 299,655 | 496,893 | 359,028 | 209,376 | 113,172 | 78,081 | 104,601 | 796,548 | 864,258 | |||||||||||||||||||||||||||||||||||||||
|
|
|
|
|
|
|
|
|
|
|
|
|
|
|
|
|
| |||||||||||||||||||||||||||||||
June 30, 2023 | Maturity | Total | Effective rate | Nominal rate | ||||||||||||||||||||||||||||||||||||||||||||
| Up to 3 | 3 to 12 | 1 to 2 | 2 to 3 | 3 to 4 | 4 to 5 | More than 5 | Non | |||||||||||||||||||||||||||||||||||||||||
| months | months | years | years | years | years | years | Current | current | ||||||||||||||||||||||||||||||||||||||||
Tax ID | Name | Currency | Bonds | ThU.S.$ | ThU.S.$ | ThU.S.$ | ThU.S.$ | ThU.S.$ | ThU.S.$ | ThU.S.$ | ThU.S.$ | ThU.S.$ | ||||||||||||||||||||||||||||||||||||
| 93.458.000-1 | Celulosa Arauco y Constitución S.A. | U.F. | Barau-F | — | 25,842 | 24,981 | 24,121 | 23,260 | 22,399 | 31,985 | 25,842 | 126,746 | 4.26 | % | 4.25% | |||||||||||||||||||||||||||||||||
| 93.458.000-1 | Celulosa Arauco y Constitución S.A. | U.F. | Barau-F | — | 10,337 | 9,992 | 9,648 | 9,304 | 8,960 | 12,794 | 10,337 | 50,698 | 4.24 | % | 4.25% | |||||||||||||||||||||||||||||||||
| 93.458.000-1 | Celulosa Arauco y Constitución S.A. | U.F. | Barau-P | — | 27,960 | 27,150 | 26,339 | 25,529 | 24,718 | 101,201 | 27,960 | 204,937 | 3.96 | % | 4.00% | |||||||||||||||||||||||||||||||||
| 93.458.000-1 | Celulosa Arauco y Constitución S.A. | U.F. | Barau-R | — | 8,032 | 8,032 | 8,032 | 8,032 | 8,032 | 281,314 | 8,032 | 313,442 | 3.57 | % | 3.60% | |||||||||||||||||||||||||||||||||
| 93.458.000-1 | Celulosa Arauco y Constitución S.A. | U.F. | Barau-S | — | 5,370 | 5,370 | 5,370 | 227,777 | — | — | 5,370 | 238,517 | 2.43 | % | 2.40% | |||||||||||||||||||||||||||||||||
| 93.458.000-1 | Celulosa Arauco y Constitución S.A. | U.F. | Barau-W | — | 2,821 | 2,821 | 2,821 | 2,821 | 2,821 | 136,466 | 2,821 | 147,750 | 2.12 | % | 2.10% | |||||||||||||||||||||||||||||||||
| 93.458.000-1 | Celulosa Arauco y Constitución S.A. | U.F. | Barau-X | — | 6,641 | 6,641 | 6,641 | 6,641 | 6,641 | 350,532 | 6,641 | 377,096 | 2.70 | % | 2.70% | |||||||||||||||||||||||||||||||||
| 93.458.000-1 | Celulosa Arauco y Constitución S.A. | U.F. | Barau-Y | — | 2,770 | 2,770 | 2,770 | 2,770 | 2,770 | 101,116 | 2,770 | 112,196 | 3.10 | % | 3.10% | |||||||||||||||||||||||||||||||||
| 93.458.000-1 | Celulosa Arauco y Constitución S.A. | U.F. | Barau-Z | — | 7,146 | 7,146 | 7,146 | 7,146 | 7,146 | 332,286 | 7,146 | 360,870 | 3.18 | % | 3.20% | |||||||||||||||||||||||||||||||||
| 93.458.000-1 | Celulosa Arauco y Constitución S.A. | U.F. | Barau-AB | — | 7,146 | 7,146 | 7,146 | 7,146 | 7,146 | 353,724 | 7,146 | 382,308 | 3.19 | % | 3.20% | |||||||||||||||||||||||||||||||||
| 93.458.000-1 | Celulosa Arauco y Constitución S.A. | U.S. dollar | Yankee 2024 | 11,250 | 11,250 | 511,250 | — | — | — | — | 22,500 | 511,250 | 4.52 | % | 4.50% | |||||||||||||||||||||||||||||||||
| 93.458.000-1 | Celulosa Arauco y Constitución S.A. | U.S. dollar | Yankee 2027 | — | 19,375 | 19,375 | 19,375 | 19,375 | 509,688 | — | 19,375 | 567,813 | 5.50 | % | 3.88% | |||||||||||||||||||||||||||||||||
| 93.458.000-1 | Celulosa Arauco y Constitución S.A. | U.S. dollar | Yankee 2047 | — | 22,000 | 22,000 | 22,000 | 22,000 | 22,000 | 829,000 | 22,000 | 917,000 | 3.90 | % | 5.50% | |||||||||||||||||||||||||||||||||
| 93.458.000-1 | Celulosa Arauco y Constitución S.A. | U.S. dollar | Yankee 2029 | — | 21,250 | 21,250 | 21,250 | 21,250 | 21,250 | 521,250 | 21,250 | 606,250 | 4.27 | % | 4.25% | |||||||||||||||||||||||||||||||||
| 93.458.000-1 | Celulosa Arauco y Constitución S.A. | U.S. dollar | Yankee 2049 | — | 27,500 | 27,500 | 27,500 | 27,500 | 27,500 | 1,077,500 | 27,500 | 1,187,500 | 5.51 | % | 5.50% | |||||||||||||||||||||||||||||||||
| 93.458.000-1 | Celulosa Arauco y Constitución S.A. | U.S. dollar | Yankee 2030 | 10,500 | 10,500 | 21,000 | 21,000 | 21,000 | 21,000 | 542,000 | 21,000 | 626,000 | 4.21 | % | 4.20% | |||||||||||||||||||||||||||||||||
| 93.458.000-1 | Celulosa Arauco y Constitución S.A. | U.S. dollar | Yankee 2050 | 12,875 | 12,875 | 25,750 | 25,750 | 25,750 | 25,750 | 1,066,500 | 25,750 | 1,169,500 | 5.16 | % | 5.15% | |||||||||||||||||||||||||||||||||
|
|
|
|
|
|
|
|
|
|
|
|
|
|
|
|
|
| |||||||||||||||||||||||||||||||
| Total | 34,625 | 228,815 | 750,174 | 236,909 | 457,301 | 717,821 | 5,737,668 | 263,440 | 7,899,873 | |||||||||||||||||||||||||||||||||||||||
|
|
|
|
|
|
|
|
|
|
|
|
|
|
|
|
|
| |||||||||||||||||||||||||||||||
102
Table of Contents
CELULOSA ARAUCO Y CONSTITUCION S.A. AND SUBSIDIARIES
Unaudited interim consolidated financial statements
June 30, 2023
Amounts in thousands of U.S. dollars, except as indicated
June 30, 2023 | Maturity | Total | ||||||||||||||||||||||||||||||||||||||||||
| Up to 3 | 3 to 12 | 1 to 2 | 2 to 3 | 3 to 4 | 4 to 5 | More than 5 | Non | |||||||||||||||||||||||||||||||||||||
| months | months | years | years | years | years | years | Current | current | ||||||||||||||||||||||||||||||||||||
Tax ID | Name | Currency | Underlying asset class | ThU.S.$ | ThU.S.$ | ThU.S.$ | ThU.S.$ | ThU.S.$ | ThU.S.$ | ThU.S.$ | ThU.S.$ | ThU.S.$ | ||||||||||||||||||||||||||||||||
| 85.805.200-9 | Forestal Arauco S.A. | U.F. | Motor vehicles | 212 | 561 | 502 | 436 | 99 | — | — | 773 | 1,037 | ||||||||||||||||||||||||||||||||
| 85.805.200-9 | Forestal Arauco S.A. | U.F. | Lands | — | 514 | 514 | 449 | 449 | 449 | 7,548 | 514 | 9,409 | ||||||||||||||||||||||||||||||||
| 85.805.200-9 | Forestal Arauco S.A. | U.S. dollar | Lands | 60 | 180 | 240 | 240 | 240 | 240 | 120 | 240 | 1,080 | ||||||||||||||||||||||||||||||||
| 85.805.200-9 | Forestal Arauco S.A. | U.F. | Plants and equipments | 106 | 285 | 230 | 817 | — | — | — | 391 | 1,047 | ||||||||||||||||||||||||||||||||
| 85.805.200-9 | Forestal Arauco S.A. | Chilean pesos | Plants and equipments | 123 | 332 | 442 | 756 | 305 | — | — | 455 | 1,503 | ||||||||||||||||||||||||||||||||
| — | Arauco Argentina S.A. | U.S. dollar | Buildings and constructions | 153 | 459 | 344 | — | — | — | — | 612 | 344 | ||||||||||||||||||||||||||||||||
| — | Arauco Argentina S.A. | U.S. dollar | IT equipment | 4 | — | — | — | — | — | — | 4 | — | ||||||||||||||||||||||||||||||||
| — | Arauco Argentina S.A. | U.S. dollar | Plants and equipments | 259 | 760 | 167 | — �� | — | — | — | 1,019 | 167 | ||||||||||||||||||||||||||||||||
| — | Arauco Argentina S.A. | U.S. dollar | Motor vehicles | 375 | 1,125 | — | — | — | — | — | 1,500 | — | ||||||||||||||||||||||||||||||||
| — | Arauco Florestal Novo Oeste | Brazilian real | Buildings and constructions | 2 | — | — | — | — | — | — | 2 | — | ||||||||||||||||||||||||||||||||
| — | Arauco Industria de Paineis S.A. | Brazilian real | Buildings and constructions | 7 | — | — | — | — | — | — | 7 | — | ||||||||||||||||||||||||||||||||
| — | Arauco Industria de Paineis S.A. | Brazilian real | IT equipment | 4 | 13 | 18 | 3 | — | — | — | 17 | 21 | ||||||||||||||||||||||||||||||||
| — | Arauco Industria de Paineis S.A. | Brazilian real | Motor vehicles | 11 | 21 | — | — | — | — | — | 32 | — | ||||||||||||||||||||||||||||||||
| — | Arauco Forest Brasil S.A. | Brazilian real | IT equipment | 1 | 4 | 6 | 6 | 6 | 2 | — | 5 | 20 | ||||||||||||||||||||||||||||||||
| — | Arauco Forest Brasil S.A. | Brazilian real | Lands | 1,687 | 3,939 | 5,594 | 5,594 | 5,594 | 932 | — | 5,626 | 17,714 | ||||||||||||||||||||||||||||||||
| — | Arauco Forest Brasil S.A. | Brazilian real | Motor vehicles | 150 | 301 | 10 | — | — | — | — | 451 | 10 | ||||||||||||||||||||||||||||||||
| — | Arauco Florestal Arapoti S.A. | Brazilian real | Motor vehicles | 33 | 59 | 24 | 18 | 11 | — | — | 92 | 53 | ||||||||||||||||||||||||||||||||
| — | Arauco do Brasil S.A. | Brazilian real | Buildings and constructions | 56 | 129 | — | — | — | — | — | 185 | — | ||||||||||||||||||||||||||||||||
| — | Arauco do Brasil S.A. | Brazilian real | IT equipment | 19 | 40 | — | — | — | — | — | 59 | — | ||||||||||||||||||||||||||||||||
| — | Arauco do Brasil S.A. | Brazilian real | Motor vehicles | 9 | 22 | 9 | 9 | 2 | — | — | 31 | 20 | ||||||||||||||||||||||||||||||||
| — | Arauco Celulose do Brasil S.A. | Brazilian real | Lands | 17,168 | 8,435 | 14,102 | 14,931 | 14,131 | 14,131 | 176,663 | 25,603 | 233,958 | ||||||||||||||||||||||||||||||||
| — | Arauco Celulose do Brasil S.A. | Brazilian real | Buildings and constructions | 18 | 55 | 73 | 49 | — | — | — | 73 | 122 | ||||||||||||||||||||||||||||||||
| — | Mahal Empreendimentos e Participações S.A. | Brazilian real | Motor vehicles | 195 | 426 | 242 | 59 | — | — | — | 621 | 301 | ||||||||||||||||||||||||||||||||
| — | Mahal Empreendimentos e Participações S.A. | Brazilian real | Lands | — | 2,643 | 2,643 | 2,643 | 2,643 | 2,643 | 25,320 | 2,643 | 35,892 | ||||||||||||||||||||||||||||||||
| — | Mahal Empreendimentos e Participações S.A. | Brazilian real | Buildings and constructions | 19 | 19 | — | — | — | — | — | 38 | — | ||||||||||||||||||||||||||||||||
| 93.458.000-1 | Celulosa Arauco y Constitucion S.A. | Brazilian real | Buildings and constructions | 466 | 1,397 | 1,863 | 1,863 | 1,863 | 1,863 | 931 | 1,863 | 8,383 | ||||||||||||||||||||||||||||||||
| 93.458.000-1 | Celulosa Arauco y Constitucion S.A. | Brazilian real | Motor vehicles | 54 | 141 | 121 | 67 | 6 | — | — | 195 | 194 | ||||||||||||||||||||||||||||||||
| 93.458.000-1 | Celulosa Arauco y Constitucion S.A. | U.S. dollar | Plants and equipments | 999 | 3,005 | 4,018 | 4,033 | 4,048 | 4,063 | 58,491 | 4,004 | 74,653 | ||||||||||||||||||||||||||||||||
| 93.458.000-1 | Celulosa Arauco y Constitucion S.A. | Chilean pesos | Motor vehicles | 863 | 288 | — | — | — | — | — | 1,151 | — | ||||||||||||||||||||||||||||||||
| — | Arauco North America, Inc. | U.S. dollar | Buildings and constructions | 308 | 774 | 1,356 | 1,503 | 833 | 257 | 405 | 1,082 | 4,354 | ||||||||||||||||||||||||||||||||
| — | Arauco North America, Inc. | U.S. dollar | Motor vehicles | 214 | 669 | 916 | 392 | 81 | 8 | — | 883 | 1,397 | ||||||||||||||||||||||||||||||||
| — | Arauco Canada Limited | Canadian dollar | Motor vehicles | 11 | 34 | 59 | 64 | 46 | — | — | 45 | 169 | ||||||||||||||||||||||||||||||||
| — | Celulosa y Energía Punta Pereira S.A. | U.S. dollar | Plants and equipments | 240 | 719 | 480 | 640 | 640 | 640 | 7,174 | 959 | 9,574 | ||||||||||||||||||||||||||||||||
| — | Eufores S.A. | U.S. dollar | Lands | 984 | 2,675 | 7,057 | 6,500 | 6,043 | 5,553 | 39,226 | 3,659 | 64,379 | ||||||||||||||||||||||||||||||||
| — | Eufores S.A. | U.S. dollar | Plants and equipments | 306 | 917 | 917 | 1,222 | 1,222 | 917 | — | 1,223 | 4,278 | ||||||||||||||||||||||||||||||||
| — | Eufores S.A. | U.S. dollar | Buildings and constructions | 80 | 180 | — | — | — | — | — | 260 | — | ||||||||||||||||||||||||||||||||
| 96.510.970-6 | Maderas Arauco S.A. | Chilean pesos | Motor vehicles | 1,495 | 1,021 | — | — | — | — | — | 2,516 | — | ||||||||||||||||||||||||||||||||
| 96.510.970-6 | Maderas Arauco S.A. | U.F. | Motor vehicles | 12 | 30 | 14 | 6 | — | — | — | 42 | 20 | ||||||||||||||||||||||||||||||||
| — | Arauco Europe Cooperatief U.A. | Euros | Motor vehicles | 6 | 14 | 17 | 5 | — | — | — | 20 | 22 | ||||||||||||||||||||||||||||||||
| — | Arauco Europe Cooperatief U.A. | Euros | Buildings and constructions | 21 | 58 | 55 | — | — | — | — | 79 | 55 | ||||||||||||||||||||||||||||||||
| — | Araucomex S.A. de C.V. | Mexican pesos | Buildings and constructions | 520 | 1,629 | 1,389 | 417 | — | — | — | 2,149 | 1,806 | ||||||||||||||||||||||||||||||||
| — | Araucomex S.A. de C.V. | U.S. dollar | Buildings and constructions | 29 | 10 | — | — | — | — | — | 39 | — | ||||||||||||||||||||||||||||||||
| — | Arauco Industria de México, S.A. de C.V. | Mexican pesos | Motor vehicles | — | 49 | 106 | 51 | 37 | — | — | 49 | 194 | ||||||||||||||||||||||||||||||||
| — | Arauco Industria de México, S.A. de C.V. | Mexican pesos | Buildings and constructions | — | 75 | 160 | 175 | 275 | — | — | 75 | 610 | ||||||||||||||||||||||||||||||||
| — | Arauco Industria de México, S.A. de C.V. | Mexican pesos | Lands | — | 3 | 6 | — | — | — | — | 3 | 6 | ||||||||||||||||||||||||||||||||
| — | Arauco Industria de México, S.A. de C.V. | Mexican pesos | IT equipment | — | 4 | 7 | 4 | — | — | — | 4 | 11 | ||||||||||||||||||||||||||||||||
| — | Araucomex Servicios S.A. de C.V. | Mexican pesos | Motor vehicles | — | 13 | 30 | 19 | 3 | — | — | 13 | 52 | ||||||||||||||||||||||||||||||||
| 79.990.550-7 | Investigaciones Forestales Bioforest S.A. | U.F. | Motor vehicles | 4 | 9 | — | — | — | — | — | 13 | — | ||||||||||||||||||||||||||||||||
|
|
|
|
|
|
|
|
|
|
|
|
|
|
|
|
|
| |||||||||||||||||||||||||||
| Total | 27,283 | 34,036 | 43,731 | 42,971 | 38,577 | 31,698 | 315,878 | 61,319 | 472,855 | |||||||||||||||||||||||||||||||||||
|
|
|
|
|
|
|
|
|
|
|
|
|
|
|
|
|
| |||||||||||||||||||||||||||
As part of the policy of Arauco, it considers compliance with all accounts payable, whether with related (see Note 13) or third parties, within a period not exceeding 30 days.
103
Table of Contents
CELULOSA ARAUCO Y CONSTITUCION S.A. AND SUBSIDIARIES
Unaudited interim consolidated financial statements
June 30, 2023
Amounts in thousands of U.S. dollars, except as indicated
December 31, 2022 | Maturity | Total | Effective rate | Nominal rate | ||||||||||||||||||||||||||||||||||||||||||||
| Up to 3 | 3 to 12 | 1 to 2 | 2 to 3 | 3 to 4 | 4 to 5 | More than 5 | Non | |||||||||||||||||||||||||||||||||||||||||
| months | months | Years | years | years | Years | years | Current | current | ||||||||||||||||||||||||||||||||||||||||
Tax ID | Name | Currency | Bank borrowings | ThU.S.$ | ThU.S.$ | ThU.S.$ | ThU.S.$ | ThU.S.$ | ThU.S.$ | ThU.S.$ | ThU.S.$ | ThU.S.$ | ||||||||||||||||||||||||||||||||||||
| 93.458.000-1 | Celulosa Arauco y Constitución S.A. | Euros | BNP paribas / ECA | — | 71,000 | 66,743 | 66,040 | 65,380 | 64,711 | 127,424 | 71,000 | 390,298 | 1.10 | % | 1.06% | |||||||||||||||||||||||||||||||||
| 93.458.000-1 | Celulosa Arauco y Constitución S.A. | U.S. dollar | Banco de Chile | 60,259 | — | — | — | — | — | — | 60,259 | — | 5.17 | % | Fixed 5.17% | |||||||||||||||||||||||||||||||||
| — | Zona Franca Punta Pereira S.A. | U.S. dollar | Banco Interamericano de Desarrollo A | 1,138 | 1,074 | — | — | — | — | — | 2,212 | — | 5.89 | % | 2.05% + libor 6m | |||||||||||||||||||||||||||||||||
| — | Zona Franca Punta Pereira S.A. | U.S. dollar | Banco BBVA | — | 5,122 | — | — | — | — | — | 5,122 | — | 4.95 | % | Fixed 4.95% | |||||||||||||||||||||||||||||||||
| — | Celulosa y Energia Punta Pereira S.A. | U.S. dollar | Banco Interamericano de Desarrollo A | 4,512 | 4,300 | — | — | — | — | — | 8,812 | — | 5.89 | % | 2.05% + libor 6m | |||||||||||||||||||||||||||||||||
| — | Celulosa y Energia Punta Pereira S.A. | U.S. dollar | Finnish Export Credit | 24,459 | — | — | — | — | — | — | 24,459 | — | 3.20 | % | 3.20% | |||||||||||||||||||||||||||||||||
| — | Eufores S.A. | U.S. dollar | Banco República Oriental del Uruguay | — | 27,688 | — | — | — | — | — | 27,688 | — | 1.40 | % | Fixed 1.4% | |||||||||||||||||||||||||||||||||
| — | Stora Enso Uruguay S.A. | U.S. dollar | Banco República Oriental del Uruguay | — | 2,517 | — | — | — | — | — | 2,517 | — | 1.40 | % | Fixed 1.4% | |||||||||||||||||||||||||||||||||
| — | Zona Franca Punta Pereira S.A. | U.S. dollar | Banco República Oriental del Uruguay | — | 7,551 | — | — | — | — | — | 7,551 | — | 1.40 | % | Fixed 1.4% | |||||||||||||||||||||||||||||||||
| — | Eufores S.A. | U.S. dollar | Banco Itaú | — | 15,382 | — | — | — | — | — | 15,382 | — | 5.17 | % | Fixed 5.165% | |||||||||||||||||||||||||||||||||
| — | Eufores S.A. | U.S. dollar | Santander | — | 21,382 | — | — | — | — | — | 21,382 | — | 5.12 | % | Fixed 5.12% | |||||||||||||||||||||||||||||||||
| — | Arauco Forest Brasil S.A. | Brazilian real | Banco Safra S.A. | 2,826 | 2,830 | 5,586 | 17,983 | 16,081 | 14,194 | — | 5,656 | 53,844 | 15.30 | % | CDI + 1.65% | |||||||||||||||||||||||||||||||||
| — | Mahal Empreendimentos e Participações S.A. | Brazilian real | Banco Safra S.A. | — | 4,209 | 13,463 | 12,029 | 10,628 | — | — | 4,209 | 36,120 | 15.20 | % | CDI + 1.55% | |||||||||||||||||||||||||||||||||
| — | Arauco North America, Inc. | U.S. dollar | Banco Itau Corpbanca— NY Branch | — | 45,760 | 217,247 | — | — | — | — | 45,760 | 217,247 | 4.23 | % | 1.65% + libor 6m | |||||||||||||||||||||||||||||||||
|
|
|
|
|
|
|
|
|
|
|
|
|
|
|
|
| ||||||||||||||||||||||||||||||||
| Total | 93,194 | 208,815 | 303,039 | 96,052 | 92,089 | 78,905 | 127,424 | 302,009 | 697,509 | |||||||||||||||||||||||||||||||||||||||
|
|
|
|
|
|
|
|
|
|
|
|
|
|
|
|
| ||||||||||||||||||||||||||||||||
December 31, 2022 | Maturity | Total | Effective rate | Nominal rate | ||||||||||||||||||||||||||||||||||||||||||||
| Up to 3 | 3 to 12 | 1 to 2 | 2 to 3 | 3 to 4 | 4 to 5 | More than 5 | Non | |||||||||||||||||||||||||||||||||||||||||
| months | months | years | years | years | years | years | Current | current | ||||||||||||||||||||||||||||||||||||||||
Tax ID | Name | Currency | Bonds | ThU.S.$ | ThU.S.$ | ThU.S.$ | ThU.S.$ | ThU.S.$ | ThU.S.$ | ThU.S.$ | ThU.S.$ | ThU.S.$ | ||||||||||||||||||||||||||||||||||||
| 93.458.000-1 | Celulosa Arauco y Constitución S.A. | U.F. | Barau-F | — | 23,934 | 23,149 | 22,365 | 21,581 | 20,797 | 39,243 | 23,934 | 127,135 | 4.25 | % | 4.25% | |||||||||||||||||||||||||||||||||
| 93.458.000-1 | Celulosa Arauco y Constitución S.A. | U.F. | Barau-F | — | 9,573 | 9,260 | 8,946 | 8,633 | 8,319 | 15,697 | 9,573 | 50,855 | 4.24 | % | 4.25% | |||||||||||||||||||||||||||||||||
| 93.458.000-1 | Celulosa Arauco y Constitución S.A. | U.F. | Barau-P | — | 25,840 | 25,102 | 24,364 | 23,625 | 22,887 | 103,359 | 25,840 | 199,337 | 3.95 | % | 4.00% | |||||||||||||||||||||||||||||||||
| 93.458.000-1 | Celulosa Arauco y Constitución S.A. | U.F. | Barau-R | — | 7,317 | 7,317 | 7,317 | 7,317 | 7,317 | 259,931 | 7,317 | 289,199 | 3.56 | % | 3.60% | |||||||||||||||||||||||||||||||||
| 93.458.000-1 | Celulosa Arauco y Constitución S.A. | U.F. | Barau-S | — | 4,892 | 4,892 | 4,892 | 209,947 | — | — | 4,892 | 219,731 | 2.43 | % | 2.40% | |||||||||||||||||||||||||||||||||
| 93.458.000-1 | Celulosa Arauco y Constitución S.A. | U.F. | Barau-W | — | 2,570 | 2,570 | 2,570 | 2,570 | 2,570 | 125,603 | 2,570 | 135,883 | 2.11 | % | 2.10% | |||||||||||||||||||||||||||||||||
| 93.458.000-1 | Celulosa Arauco y Constitución S.A. | U.F. | Barau-X | — | 6,050 | 6,050 | 6,050 | 6,050 | 6,050 | 322,353 | 6,050 | 346,553 | 2.68 | % | 2.70% | |||||||||||||||||||||||||||||||||
| 93.458.000-1 | Celulosa Arauco y Constitución S.A. | U.S. dollar | Yankee 2024 | 11,250 | 11,250 | 522,500 | — | — | — | — | 22,500 | 522,500 | 4.51 | % | 4.50% | |||||||||||||||||||||||||||||||||
| 93.458.000-1 | Celulosa Arauco y Constitución S.A. | U.S. dollar | Yankee 2027 | — | 19,375 | 19,375 | 19,375 | 19,375 | 509,688 | — | 19,375 | 567,813 | 3.89 | % | 3.88% | |||||||||||||||||||||||||||||||||
| 93.458.000-1 | Celulosa Arauco y Constitución S.A. | U.S. dollar | Yankee 2047 | — | 22,000 | 22,000 | 22,000 | 22,000 | 22,000 | 840,000 | 22,000 | 928,000 | 5.50 | % | 5.50% | |||||||||||||||||||||||||||||||||
| 93.458.000-1 | Celulosa Arauco y Constitución S.A. | U.S. dollar | Yankee 2029 | — | 21,250 | 21,250 | 21,250 | 21,250 | 21,250 | 531,875 | 21,250 | 616,875 | 4.26 | % | 4.25% | |||||||||||||||||||||||||||||||||
| 93.458.000-1 | Celulosa Arauco y Constitución S.A. | U.S. dollar | Yankee 2049 | — | 27,500 | 27,500 | 27,500 | 27,500 | 27,500 | 1,091,250 | 27,500 | 1,201,250 | 5.50 | % | 5.50% | |||||||||||||||||||||||||||||||||
| 93.458.000-1 | Celulosa Arauco y Constitución S.A. | U.S. dollar | Yankee 2030 | 10,500 | 10,500 | 21,000 | 21,000 | 21,000 | 21,000 | 552,500 | 21,000 | 636,500 | 4.20 | % | 4.20% | |||||||||||||||||||||||||||||||||
| 93.458.000-1 | Celulosa Arauco y Constitución S.A. | U.S. dollar | Yankee 2050 | 12,875 | 12,875 | 25,750 | 25,750 | 25,750 | 25,750 | 1,079,375 | 25,750 | 1,182,375 | 5.16 | % | 5.15% | |||||||||||||||||||||||||||||||||
|
|
|
|
|
|
|
|
|
|
|
|
|
|
|
|
|
| |||||||||||||||||||||||||||||||
| Total | 34,625 | 204,926 | 737,715 | 213,379 | 416,598 | 695,128 | 4,961,186 | 239,551 | 7,024,006 | |||||||||||||||||||||||||||||||||||||||
|
|
|
|
|
|
|
|
|
|
|
|
|
|
|
|
|
| |||||||||||||||||||||||||||||||
104
Table of Contents
CELULOSA ARAUCO Y CONSTITUCION S.A. AND SUBSIDIARIES
Unaudited interim consolidated financial statements
June 30, 2023
Amounts in thousands of U.S. dollars, except as indicated
December 31, 2022 | Maturity | Total | ||||||||||||||||||||||||||||||||||||||||||||||
Tax ID | Name | Currency | Underlying asset class | Up to 3 months ThU.S.$ | 3 to 12 months ThU.S.$ | 1 to 2 years ThU.S.$ | 2 to 3 years ThU.S.$ | 3 to 4 years ThU.S.$ | 4 to 5 years ThU.S.$ | More than 5 years ThU.S.$ | Current ThU.S.$ | Non current ThU.S.$ | ||||||||||||||||||||||||||||||||||||
| 85.805.200-9 | | Forestal Arauco S.A. | | U.F. | Motor vehicles | 421 | 639 | 571 | 433 | 268 | 4 | — | 1,060 | 1,276 | ||||||||||||||||||||||||||||||||||
| 85.805.200-9 | | Forestal Arauco S.A. | | U.F. | Lands | 282 | — | 282 | 282 | 282 | 282 | 4,654 | 282 | 5,782 | ||||||||||||||||||||||||||||||||||
| 85.805.200-9 | | Forestal Arauco S.A. | | | U.S. dollar | | Lands | 60 | 180 | 240 | 240 | 240 | 240 | 240 | 240 | 1,200 | ||||||||||||||||||||||||||||||||
| 85.805.200-9 | | Forestal Arauco S.A. | | U.F. | Plants and equipments | 242 | — | — | — | — | — | — | 242 | — | ||||||||||||||||||||||||||||||||||
| 85.805.200-9 | | Forestal Arauco S.A. | | U.F. | Other property, plant and equipment | 96 | 289 | 268 | 209 | 640 | — | — | 385 | 1,117 | ||||||||||||||||||||||||||||||||||
| 85.805.200-9 | | Forestal Arauco S.A. | | | Chilean pesos | | Other property, plant and equipment | 97 | 169 | 120 | 120 | 354 | — | — | 266 | 594 | ||||||||||||||||||||||||||||||||
| — | | Arauco Argentina S.A. | | | U.S. dollar | | Buildings and constructions | 116 | 345 | 460 | 38 | — | — | — | 461 | 498 | ||||||||||||||||||||||||||||||||
| — | | Arauco Argentina S.A. | | | U.S. dollar | | IT equipment | 6 | 10 | — | — | — | — | — | 16 | — | ||||||||||||||||||||||||||||||||
| — | | Arauco Argentina S.A. | | | U.S. dollar | | Plants and equipments | 251 | 752 | 668 | — | — | — | — | 1,003 | 668 | ||||||||||||||||||||||||||||||||
| — | | Arauco Argentina S.A. | | | U.S. dollar | | Motor vehicles | 429 | 1,161 | 750 | — | — | — | — | 1,590 | 750 | ||||||||||||||||||||||||||||||||
| — | | Arauco Florestal Novo Oeste | | | Brazilian real | | Motor vehicles | 5 | 3 | — | — | — | — | — | 8 | — | ||||||||||||||||||||||||||||||||
| — | | Arauco Florestal Novo Oeste | | | Brazilian real | | Buildings and constructions | 1 | 3 | — | — | — | — | — | 4 | — | ||||||||||||||||||||||||||||||||
| — | | Arauco Industria de Paineis S.A. | | | Brazilian real | | Fixed facilities and accessories | 9 | 16 | — | — | — | — | — | 25 | — | ||||||||||||||||||||||||||||||||
| — | | Arauco Industria de Paineis S.A. | | | Brazilian real | | IT equipment | 5 | 12 | 16 | 11 | — | — | — | 17 | 27 | ||||||||||||||||||||||||||||||||
| — | | Arauco Industria de Paineis S.A. | | | Brazilian real | | Motor vehicles | 10 | 30 | 9 | — | — | — | — | 40 | 9 | ||||||||||||||||||||||||||||||||
| — | | Arauco Forest Brasil S.A. | | | Brazilian real | | IT equipment | 1 | — | — | — | — | — | — | 1 | — | ||||||||||||||||||||||||||||||||
| — | | Arauco Forest Brasil S.A. | | | Brazilian real | | Lands | 1,569 | 3,285 | 4,885 | 4,885 | 4,506 | 3,636 | — | 4,854 | 17,912 | ||||||||||||||||||||||||||||||||
| — | | Arauco Forest Brasil S.A. | | | Brazilian real | | Motor vehicles | 147 | 405 | 131 | — | — | — | — | 552 | 131 | ||||||||||||||||||||||||||||||||
| — | | Arauco Florestal Arapoti S.A. | | | Brazilian real | | Motor vehicles | 92 | 89 | 24 | — | — | — | — | 181 | 24 | ||||||||||||||||||||||||||||||||
| — | | Arauco do Brasil S.A. | | | Brazilian real | | Buildings and constructions | 52 | 157 | 52 | — | — | — | — | 209 | 52 | ||||||||||||||||||||||||||||||||
| — | | Arauco do Brasil S.A. | | | Brazilian real | | IT equipment | 21 | 53 | 14 | — | — | — | — | 74 | 14 | ||||||||||||||||||||||||||||||||
| — | | Arauco do Brasil S.A. | | | Brazilian real | | Motor vehicles | 18 | 20 | 2 | — | — | — | — | 38 | 2 | ||||||||||||||||||||||||||||||||
| — | | Arauco Celulose do Brasil S.A. | | | Brazilian real | | Lands | 381 | 4,030 | 4,058 | 4,058 | 4,058 | 4,058 | 45,148 | 4,411 | 61,380 | ||||||||||||||||||||||||||||||||
| — | | Mahal Empreendimentos e Participações S.A. | | | Brazilian real | | Motor vehicles | 203 | 552 | 328 | 164 | — | — | — | 755 | 492 | ||||||||||||||||||||||||||||||||
| — | | Mahal Empreendimentos e Participações S.A. | | | Brazilian real | | Lands | — | 2,381 | 2,381 | 2,381 | 2,381 | 2,381 | 23,808 | 2,381 | 33,332 | ||||||||||||||||||||||||||||||||
| — | | Mahal Empreendimentos e Participações S.A. | | | Brazilian real | | Buildings and constructions | 18 | 53 | — | — | — | — | — | 71 | — | ||||||||||||||||||||||||||||||||
| 93.458.000-1 | | Celulosa Arauco y Constitucion S.A. | | U.F. | Buildings and constructions | 424 | 1,273 | 1,697 | 1,697 | 1,697 | 1,697 | 1,698 | 1,697 | 8,486 | ||||||||||||||||||||||||||||||||||
| 93.458.000-1 | | Celulosa Arauco y Constitucion S.A. | | U.F. | Motor vehicles | 139 | 174 | 142 | 88 | 27 | — | — | 313 | 257 | ||||||||||||||||||||||||||||||||||
| 93.458.000-1 | | Celulosa Arauco y Constitucion S.A. | | | Chilean pesos | | Buildings and constructions | 15 | — | — | — | — | — | — | 15 | — | ||||||||||||||||||||||||||||||||
| 93.458.000-1 | | Celulosa Arauco y Constitucion S.A. | | | U.S. dollar | | Plants and equipments | 999 | 2,998 | 4,011 | 4,026 | 4,040 | 4,055 | 60,526 | 3,997 | 76,658 | ||||||||||||||||||||||||||||||||
| 93.458.000-1 | | Celulosa Arauco y Constitucion S.A. | | | Chilean pesos | | Motor vehicles | 2,866 | 2,953 | — | — | — | — | — | 5,819 | — | ||||||||||||||||||||||||||||||||
| — | | Arauco North America, Inc. | | | U.S. dollar | | Buildings and constructions | 336 | 852 | 1,020 | 1,131 | 1,162 | 499 | 429 | 1,188 | 4,241 | ||||||||||||||||||||||||||||||||
| — | | Arauco North America, Inc. | | | U.S. dollar | | Motor vehicles | 173 | 540 | 593 | 244 | 52 | 4 | — | 713 | 893 | ||||||||||||||||||||||||||||||||
| — | | Arauco Canada Limited | | | Canadian dollar | | Motor vehicles | 4 | 23 | — | — | — | — | — | 27 | — | ||||||||||||||||||||||||||||||||
| — | | Celulosa y Energía Punta Pereira S.A. | | | U.S. dollar | | Plants and equipments | 239 | 719 | 800 | 641 | 641 | 641 | 7,332 | 958 | 10,055 | ||||||||||||||||||||||||||||||||
| — | Eufores S.A. | | U.S. dollar | | Lands | 975 | 2,926 | 6,808 | 6,306 | 5,861 | 5,373 | 38,052 | 3,901 | 62,400 | ||||||||||||||||||||||||||||||||||
| Eufores S.A. | | U.S. dollar | | Plants and equipments | 306 | 917 | 1,222 | 1,222 | 1,222 | 1,222 | — | 1,223 | 4,888 | |||||||||||||||||||||||||||||||||||
| — | Eufores S.A. | | U.S. dollar | | Buildings and constructions | 70 | 88 | 49 | — | — | — | — | 158 | 49 | ||||||||||||||||||||||||||||||||||
| 96.510.970-6 | | Maderas Arauco S.A. | | | Chilean pesos | | Motor vehicles | 1,400 | 3,451 | — | — | — | — | — | 4,851 | — | ||||||||||||||||||||||||||||||||
| 96.510.970-6 | | Maderas Arauco S.A. | | U.F. | Motor vehicles | 63 | 42 | 28 | 6 | 3 | — | — | 105 | 37 | ||||||||||||||||||||||||||||||||||
| — | | Arauco Europe Cooperatief U.A. | | Euros | Motor vehicles | 7 | 18 | 19 | 12 | 2 | — | — | 25 | 33 | ||||||||||||||||||||||||||||||||||
| — | | Arauco Europe Cooperatief U.A. | | Euros | Buildings and constructions | 18 | 54 | 72 | 18 | — | — | — | 72 | 90 | ||||||||||||||||||||||||||||||||||
| — | | Araucomex S.A. de C.V. | | | Mexican pesos | | Buildings and constructions | 456 | 1,126 | 1,620 | — | — | — | — | 1,582 | 1,620 | ||||||||||||||||||||||||||||||||
| — | | Araucomex S.A. de C.V. | | | U.S. dollar | | Buildings and constructions | 29 | 68 | — | — | — | — | — | 97 | — | ||||||||||||||||||||||||||||||||
| — | | Arauco Industria de México, S.A. de C.V. | | | Mexican pesos | | Motor vehicles | 17 | 53 | 76 | 26 | 11 | — | — | 70 | 113 | ||||||||||||||||||||||||||||||||
| — | | Arauco Industria de México, S.A. de C.V. | | | U.S. dollar | | Plants and equipments | 79 | 26 | — | — | — | — | — | 105 | — | ||||||||||||||||||||||||||||||||
| — | | Arauco Industria de México, S.A. de C.V. | | | Mexican pesos | | Buildings and constructions | 13 | 9 | — | — | — | — | — | 22 | — | ||||||||||||||||||||||||||||||||
| — | | Arauco Industria de México, S.A. de C.V. | | | Mexican pesos | | Lands | 1 | 3 | 5 | — | — | — | — | 4 | 5 | ||||||||||||||||||||||||||||||||
| — | | Arauco Industria de México, S.A. de C.V. | | | Mexican pesos | | IT equipment | 1 | 5 | 7 | 4 | — | — | — | 6 | 11 | ||||||||||||||||||||||||||||||||
| — | | Araucomex Servicios S.A. de C.V. | | | Mexican pesos | | Motor vehicles | 6 | 17 | 26 | 17 | 3 | — | — | 23 | 46 | ||||||||||||||||||||||||||||||||
| 96.637.330-K | | Servicios Logisticos Arauco S.A. | | U.F. | Motor vehicles | 16 | — | — | — | — | — | — | 16 | — | ||||||||||||||||||||||||||||||||||
| 79.990.550-7 | | Investigaciones Forestales Bioforest S.A. | | U.F. | Motor vehicles | 9 | 12 | 5 | — | — | — | — | 21 | 5 | ||||||||||||||||||||||||||||||||||
|
|
|
|
|
|
|
|
|
|
|
|
|
|
|
|
|
| |||||||||||||||||||||||||||||||
| Total | 13,193 | 32,981 | 33,459 | 28,259 | 27,450 | 24,092 | 181,887 | 46,174 | 295,147 | |||||||||||||||||||||||||||||||||||||||
|
|
|
|
|
|
|
|
|
|
|
|
|
|
|
|
|
| |||||||||||||||||||||||||||||||
As part of the policy of Arauco, it considers compliance with all accounts payable, whether with related (see Note 13) or third parties, within a period not exceeding 30 days.
105
Table of Contents
CELULOSA ARAUCO Y CONSTITUCION S.A. AND SUBSIDIARIES
Unaudited interim consolidated financial statements
June 30, 2023
Amounts in thousands of U.S. dollars, except as indicated
Regarding the Libor rate and its discontinuity, at the end of June 2023 Arauco maintains 4.09% of its total debt at said rate and it is not estimated that the effect of its elimination will be material. Additionally, Arauco maintains interest rate derivatives for 99.58% of its Libor rate based debt. The credits set at the Libor rate that Arauco maintains at the closing date of these interim consolidated financial statements generally include provisions that allow the rate to be modified in the event of situations such as that given by the discontinuation of Libor rates. Notwithstanding the automatic conversion mechanisms to alternative rates, Arauco has been finalizing negotiations with its counterparties in recent months to change the base rates from Libor to SOFR or Term SOFR.
As of June 30, 2023, it is estimated that this change will not have a significant impact on Arauco’s results.
Guarantees
As of the date of these interim consolidated financial statements, Arauco has financial assets of approximately MU.S.$ 20 that have been pledged to third parties (beneficiaries), as direct guarantee. If Arauco does not fulfill its obligations, the guarantors could execute the guarantees.
As of June 30, 2023, the total assets pledged as an indirect guarantee were MU.S.$ 450. In contrast to direct guarantees, indirect guarantees are given to secure obligations assumed by a third party.
On September 29, 2011, Arauco entered into a Security Agreement under which it granted a non-joint guarantee limited to 50% of the obligations of the Uruguayan companies (joint ventures) Celulosa y Energía Punta Pereira S.A. and Zona Franca Punta Pereira S.A., under the IDB Facility Agreement in the amount of up to MU.S.$ 454 and the Finnvera Guaranteed Facility Agreement in the amount of up to MU.S.$ 900. Both borrowing agreements were signed with the International Development Bank. Such guarantee is included in the table below, under indirect guarantees. As of June 30, 2023 Finnvera Facility Agreement payment ended, finishing the related indirect guarantee.
Direct and indirect guarantees granted by Arauco:
DIRECT | ||||||||||
Subsidiary | Guarantee | Assets pledged | Currency | ThU.S.$ | Guarantor | |||||
Celulosa Arauco y Constitución S.A. | Guarantee letter | — | Chilean pesos | 817 | Directorate General of Maritime Territory and Merchant Marine | |||||
Celulosa Arauco y Constitución S.A. | Guarantee letter | — | Chilean pesos | 373 | Railways | |||||
Celulosa Arauco y Constitución S.A. | Guarantee letter | — | Chilean pesos | 2,453 | Ministry of Public Works (MOP) | |||||
Celulosa Arauco y Constitución S.A. | Guarantee letter | — | Chilean pesos | 582 | Illustrious municipality of Arauco | |||||
Celulosa Arauco y Constitución S.A. | Guarantee letter | — | Chilean pesos | 15,657 | Sociedad Concesionaria Autopista Costa Arauco S.A. | |||||
Arauco do Brasil S.A. | Guarantee letter | — | Brazilian real | 540 | Itaú Unibanco S.A. | |||||
| ||||||||||
| Total | 20,422 | |||||||||
|
106
Table of Contents
CELULOSA ARAUCO Y CONSTITUCION S.A. AND SUBSIDIARIES
Unaudited interim consolidated financial statements
June 30, 2023
Amounts in thousands of U.S. dollars, except as indicated
INDIRECT | ||||||||||
Subsidiary | Guarantee | Assets pledged | Currency | ThU.S.$ | Guarantor | |||||
Celulosa Arauco y Constitución S.A. | Suretyship not supportive and cumulative of Joint Ventures (Uruguay) | — | U.S. dollar | 5,263 | Interamerican Development Bank | |||||
Celulosa Arauco y Constitución S.A. | Full Guarantee, of Arauco North America, Inc. | — | U.S. dollar | 240,000 | Bank Itaú Corpbanca – NY Branch | |||||
Arauco do Brasil S.A. | Endorsement of Arauco Forest Brasil S.A. | — | Brazilian real | 44,030 | Banco Safra S.A. | |||||
Arauco do Brasil S.A. | Endorsement of Mahal Empreendimentos e Participações S.A. | — | Brazilian real | 31,624 | Banco Safra S.A. | |||||
Arauco do Brasil S.A. | Endorsement of Arauco Celulose do Brasil S.A. | — | Brazilian real | 75,472 | Itaú Unibanco S.A. | |||||
Arauco do Brasil S.A. | Endorsement of Arauco Celulose do Brasil S.A. | — | Brazilian real | 53,709 | Bank BTG Pactual S.A. | |||||
| ||||||||||
| Total | 450,098 | |||||||||
|
23.10.3 Type of Risk: Market Risk – Exchange Rate
Description
Market risk arises from the probability of being affected by losses from fluctuations in currencies exchange rates in which assets and liabilities are denominated, in a functional currency other than the functional currency of Arauco.
Explanation of Currency Risk Exposure and How This Risk Arises
Arauco is exposed to the foreign currency risk from currency fluctuations arising from sales, purchases and obligations undertaken in foreign currencies, such as the Chilean peso, Euro, Brazilian real or other foreign currencies. In the case of significant exchange rate variations, the Chilean peso is the currency that represents the main currency risk. See Note 11 for details assets and liabilities classified by currency.
Explanation of Risk Management Objectives, Policies and Processes, and Measurement Methods
Arauco performs sensitivity analyses to measure the effect of this variable on equity and net result.
Sensitivity analysis considers a variation of +/- 10% of the exchange rate over the Chilean peso. This fluctuation range is considered possible given current market conditions as of the date of these interim consolidated financial statements. With all other variables at a constant rate, a U.S. dollar exchange rate variation of +/- 10% in relation to the Chilean peso would mean a change in the net income year after tax +/- 6.78% (equivalent to ThU.S.$ -/+ 6,875), and +/- 0.05% of equity (equivalent to ThU.S.$ -/+ 4,125).
Additionally, a sensitivity analysis is carried out assuming a variation of +/- 10% in the closing exchange rate on the Brazilian real, which is considered a possible range of fluctuation given the market conditions as of the date of these interim consolidated financial statements. With all the other variables constant, a variation of +/- 10% in the exchange rate of the dollar on the Brazilian real would mean a variation on the net income after tax +/- 7.54% (equivalent to ThU.S.$-/+$ 7,648) and a change on the equity of +/- 1.49% (equivalent to ThU.S. -/+$ 121,553).
107
Table of Contents
CELULOSA ARAUCO Y CONSTITUCION S.A. AND SUBSIDIARIES
Unaudited interim consolidated financial statements
June 30, 2023
Amounts in thousands of U.S. dollars, except as indicated
23.10.4 Type of Risk: Market Risk – Interest rate risk
Description
Interest rate risk refers to the sensitivity of the value of financial assets and liabilities in terms of interest rate fluctuations.
Explanation of Interest Rate Risk Exposure and How This Risk Arises
Arauco is exposed to risks due to interest rate fluctuations for bonds issued, bank borrowings and financial instruments that bear interest at a variable rate.
Explanation of Risk Management Objectives, Policies and Processes, and Measurement Methods
Arauco completes its risk analysis by reviewing its exposure to changes in interest rates. As of June 30, 2023, 6.3% our financial debt accrues interest at variable rates. A change of +/- 10% in the interest rate is considered a possible range of fluctuation. Such market conditions would affect the income after tax at rate of +/- 1.82% (equivalent to ThU.S.$-/+ 1,844) and +/- 0.014% (equivalent to ThU.S.$-/+ 1,106) on equity.
| June 2023 ThU.S.$ | Total | |||||||
Fixed rate | 6,540,836 | 93.7 | % | |||||
Bonds issued | 5,136,326 | |||||||
Bank borrowings and others (*) | 1,022,523 | |||||||
Lease liabilities | 381,987 | |||||||
Variable rate | 438,273 | 6.3 | % | |||||
Bonds issued | — | |||||||
Bank borrowings | 438,273 | |||||||
Total | 6,979,109 | 100.0 | % | |||||
| December 2022 ThU.S.$ | Total | |||||||
Fixed rate | 5,637,820 | 98.6 | % | |||||
Bonds issued | 4,513,459 | |||||||
Bank borrowings and others (*) | 860,137 | |||||||
Lease liabilities | 264,224 | |||||||
Variable rate | 80,540 | 1.4 | % | |||||
Bonds issued | — | |||||||
Bank borrowings | 80,540 | |||||||
Total | 5,718,360 | 100.0 | % | |||||
| (*) | Includes variable rate bank borrowings changed by fixed rate swaps. |
108
Table of Contents
CELULOSA ARAUCO Y CONSTITUCION S.A. AND SUBSIDIARIES
Unaudited interim consolidated financial statements
June 30, 2023
Amounts in thousands of U.S. dollars, except as indicated
23.10.5 Type of Risk: Market Risk – Price of Pulp Risks
Description
Pulp prices are determined by world and regional market conditions. Prices fluctuate based on demand, production capacity, commercial strategies adopted by large-scale forestry companies, pulp and paper producers and by the availability of substitutes.
Explanation of Price Risk Exposure and How This Risk Arises
Pulp prices are reflected in revenue from sales and directly affect the net income for the period.
As of June 30, 2023, revenue due to pulp sales accounted for 43,4% of total sales. Pulp prices are fixed on a monthly basis in accordance with the market. Forward contracts or other financial instruments are not used for pulp sales.
Explanation of Risk Management Objectives, Policies and Processes, and Measurement Methods
This risk is approached in different ways. Arauco has a team of specialists who perform periodic market and competition analyses, providing tools to analyze and evaluate trends and adjust forecasts. Similarly, Arauco performs price financial sensitivity analysis in order to take the necessary safeguards to confront different scenarios in the best possible manner.
Sensitivity analysis considers a variation of +/- 10% in the average pulp price, a possible fluctuation range given current market conditions at the date of the closing balance. With all other variables constant, a variation of +/- 10% in the average pulp price would mean a variation of +/- 80.5% (equivalent to ThU.S.$-/+ 81,639) on the income for the year after tax and +/- 0.6% (equivalent to ThU.S.$ -/+ 48,983) on equity.
109
Table of Contents
CELULOSA ARAUCO Y CONSTITUCION S.A. AND SUBSIDIARIES
Unaudited interim consolidated financial statements
June 30, 2023
Amounts in thousands of U.S. dollars, except as indicated
NOTE 24. REPORTABLE SEGMENTS
The main products that generate revenue for each reportable segment are described as follows:
Pulp segment
The main products sold by this reportable segment are long fiber bleached pulp (BSKP), short fiber bleached pulp (BHKP), long fiber raw pulp (UKP), pulp fluff and dissolving pulp (DP). Additionally, it manages a forest plantations in order to supply its production plants and, at the same time, to sell to the wood products segment or to third parties what it does not use (pruning, sawing, poles and chips). Finally, depending on its needs, it buys logs and chips from third parties which are consumed or sold to the wood products segment.
The Pulp reportable segment uses wood exclusively from pine and eucalyptus plantations for the production of different classes of wood cellulose or pulp. Bleached pulp is mainly used as raw material for producing printing and writing paper, as well as toilet paper and high-quality wrapping paper. Unbleached pulp is used to produce packing paper, filters, fiber cement products, dielectric paper and others. Fluff pulp is mainly used in the production of diapers and female hygiene products. On the other hand, dissolving pulp is used as raw material for the manufacture of different fabrics.
Arauco has seven plants: five in Chile, one in Argentina and one in Uruguay (50% property of Arauco), and they have a total production capacity of approximately 5.2 million tons per year. Pulp is sold in more than 42 countries, mainly in Asia and Europe.
110
Table of Contents
CELULOSA ARAUCO Y CONSTITUCION S.A. AND SUBSIDIARIES
Unaudited interim consolidated financial statements
June 30, 2023
Amounts in thousands of U.S. dollars, except as indicated
Wood products segment
The main products sold by this segment correspond to plywood, MDF (Medium Density Fiberboard), PB (chipboard), sawn wood of different dimensions and remanufactured products such as moldings, pre-cut pieces, finger joints, among others.
The Panels area produces a wide range of panel products and several kinds of moldings aimed at the furniture, decoration and construction industries. It consists of 20 industrial plants: 4 in Chile, 2 in Argentina, 4 in Brazil, 2 in Mexico, and 8 plants in the U.S. and Canada. The Company has a total annual production capacity of 7.3 million cubic meters of PBO, MDF, plywood and moldings.
Through the joint venture Sonae Arauco, Arauco produces and sells wood panels, of the type of MDF, PB and OSB, and sawn timber, through the operation of 2 panel plants and one sawmill in Spain; 2 panel plants and one resin plant in Portugal; 3 panel plants in Germany and 2 panel plants in South Africa. In total, Sonae Arauco’s production capacity is approximately 1.2 million m3 of MDF, 2.4 million m3 of PB, 460,000 m3 of OSB and 70,000 m3 of sawn timber.
Including Sonae Arauco at 50%, Arauco in its mills totalize a capacity of 4.2 million m3 of MDF, 4.2 million m3 of PB and 230,000 m3 of OSB, 710,000 m3 of Plywood and 3,100,000 m3 of sawn timber.
The Sawn Timber area produces a wide range of wood and remanufactured products with different kinds of uses and appearances, which include a wide variety of uses in the furniture, packing, construction and refurbishing industries.
With 8 sawmills in operation (7 in Chile and 1 in Argentina), the Company has a production capacity of 3.0 million m3 of sawn wood.
Furthermore, the Company has 5 remanufacturing plants: 4 in Chile and 1 in Argentina. These plants reprocess sawn wood and produce high quality remanufactured products, such as finger joint and solid moldings as well as precut pieces.
Arauco has no customers representing 10% or more of its revenues.
Below is summarized information concerning the assets, liabilities and profits and losses at the end of each period, by segments. The profit (loss) of each segment informed takes into consideration that taxes and income and financial costs have not been allocated to the various segments, and are shown as part of the Corporate’s segment:
111
Table of Contents
CELULOSA ARAUCO Y CONSTITUCION S.A. AND SUBSIDIARIES
Unaudited interim consolidated financial statements
June 30, 2023
Amounts in thousands of U.S. dollars, except as indicated
Six-month period ended June 30, 2023 | Pulp ThU.S.$ | Wood products ThU.S.$ | Others ThU.S.$ | Corporate ThU.S.$ | Subtotal ThU.S.$ | Elimination ThU.S.$ | Total ThU.S.$ | |||||||||||||||||||||
Revenues from sales of goods | 1,178,312 | 1,611,048 | — | — | 2,789,360 | 2,789,360 | ||||||||||||||||||||||
Revenues from rendering of services | 56,848 | 1,990 | 191 | — | 59,029 | 59,029 | ||||||||||||||||||||||
Revenues from ordinary activities | 1,235,160 | 1,613,038 | 191 | — | 2,848,389 | 2,848,389 | ||||||||||||||||||||||
Revenues from transactions with reportable segments | 228,942 | 16,621 | 25,602 | — | 271,165 | (271,165 | ) | — | ||||||||||||||||||||
Finance income | — | — | — | 50,959 | 50,959 | 50,959 | ||||||||||||||||||||||
Finance costs | — | — | — | (172,569 | ) | (172,569 | ) | (172,569 | ) | |||||||||||||||||||
Net finance costs | — | — | — | (121,610 | ) | (121,610 | ) | (121,610 | ) | |||||||||||||||||||
Depreciation and amortizations | 222,094 | 93,326 | 841 | 3,937 | 320,198 | 320,198 | ||||||||||||||||||||||
Other income | 197,379 | 28,752 | 334 | 8,311 | 234,776 | 234,776 | ||||||||||||||||||||||
Other expenses | 215,309 | 25,435 | 1 | 6,852 | 247,597 | 247,597 | ||||||||||||||||||||||
Share of profit (loss) of associates and joint ventures accounted for using equity method | ||||||||||||||||||||||||||||
Associates | 1,383 | — | — | 564 | 1,947 | 1,947 | ||||||||||||||||||||||
Joint ventures | — | 15,416 | — | 615 | 16,031 | 16,031 | ||||||||||||||||||||||
Income tax expense | — | — | — | 84,119 | 84,119 | 84,119 | ||||||||||||||||||||||
Profit (loss) of each reportable segment | (166,545 | ) | 202,923 | 388 | (138,183 | ) | (101,417 | ) | (101,417 | ) | ||||||||||||||||||
Geographical information on revenues | ||||||||||||||||||||||||||||
Revenue – Chilean entities | 810,808 | 539,890 | 191 | — | 1,350,889 | 1,350,889 | ||||||||||||||||||||||
Revenue – Foreign entities | 424,352 | 1,073,148 | — | — | 1,497,500 | 1,497,500 | ||||||||||||||||||||||
Total revenues from ordinary activities | 1,235,160 | 1,613,038 | 191 | — | 2,848,389 | 2,848,389 | ||||||||||||||||||||||
Six-month period ended June 30, 2023 | Pulp ThU.S.$ | Wood products ThU.S.$ | Others ThU.S.$ | Corporate ThU.S.$ | Subtotal ThU.S.$ | Elimination ThU.S.$ | Total ThU.S.$ | |||||||||||||||||||||
Amounts of additions to non-current assets | ||||||||||||||||||||||||||||
Acquisition of property, plant and equipment and biological assets | 632,223 | 68,981 | 155 | 7,763 | 709,122 | — | 709,122 | |||||||||||||||||||||
Acquisition and contribution of investments in associates and joint venture | — | — | — | — | — | — | — | |||||||||||||||||||||
Six-month period ended June 30, 2023 | Pulp ThU.S.$ | Wood products ThU.S.$ | Others ThU.S.$ | Corporate ThU.S.$ | Subtotal ThU.S.$ | Elimination ThU.S.$ | Total ThU.S.$ | |||||||||||||||||||||
Segment assets | 13,527,699 | 3,005,870 | 19,872 | 1,363,309 | 17,916,750 | (74,297 | ) | 17,842,453 | ||||||||||||||||||||
Segment assets (excluding deferred tax assets) | 13,527,699 | 3,005,870 | 19,872 | 1,343,924 | 17,897,365 | (74,297 | ) | 17,823,068 | ||||||||||||||||||||
Deferred tax assets | 19,385 | 19,385 | 19,385 | |||||||||||||||||||||||||
Investments accounted through equity method | ||||||||||||||||||||||||||||
Associates | 43,190 | — | — | 64,930 | 108,120 | 108,120 | ||||||||||||||||||||||
Joint Ventures | — | 224,120 | — | 64,763 | 288,883 | 288,883 | ||||||||||||||||||||||
Segment liabilities | 906,479 | 415,375 | 10,597 | 8,366,810 | 9,699,261 | 9,699,261 | ||||||||||||||||||||||
Segment liabilities (excluding deferred tax liabilities) | 906,479 | 415,375 | 10,597 | 6,709,543 | 8,041,994 | 8,041,994 | ||||||||||||||||||||||
Deferred tax liabilities | 1,657,267 | 1,657,267 | 1,657,267 | |||||||||||||||||||||||||
Geographical information on non-current assets | ||||||||||||||||||||||||||||
Chile | 8,578,110 | 474,903 | 16,502 | 489,721 | 9,559,236 | (15,280 | ) | 9,543,956 | ||||||||||||||||||||
Foreign countries | 2,967,766 | 1,244,105 | — | 59,270 | 4,271,141 | 4,271,141 | ||||||||||||||||||||||
Total non-current assets | 11,545,876 | 1,719,008 | 16,502 | 548,991 | 13,830,377 | (15,280 | ) | 13,815,097 | ||||||||||||||||||||
112
Table of Contents
CELULOSA ARAUCO Y CONSTITUCION S.A. AND SUBSIDIARIES
Unaudited interim consolidated financial statements
June 30, 2023
Amounts in thousands of U.S. dollars, except as indicated
Six-month period ended June 30, 2022 | Pulp ThU.S.$ | Wood products ThU.S.$ | Others ThU.S.$ | Corporate ThU.S.$ | Subtotal ThU.S.$ | Elimination ThU.S.$ | Total ThU.S.$ | |||||||||||||||||||||
Revenues from sales of goods | 1,445,990 | 2,126,968 | — | — | 3,572,958 | 3,572,958 | ||||||||||||||||||||||
Revenues from rendering of services | 55,362 | — | 377 | — | 55,739 | 55,739 | ||||||||||||||||||||||
Revenues from ordinary activities | 1,501,352 | 2,126,968 | 377 | — | 3,628,697 | 3,628,697 | ||||||||||||||||||||||
Revenues from transactions with reportable segments | 260,422 | 12,237 | 25,887 | — | 298,546 | (298,546 | ) | — | ||||||||||||||||||||
Finance income | — | — | — | 28,794 | 28,794 | 28,794 | ||||||||||||||||||||||
Finance costs | — | — | — | (93,210 | ) | (93,210 | ) | (93,210 | ) | |||||||||||||||||||
Net finance costs | — | — | — | (64,416 | ) | (64,416 | ) | (64,416 | ) | |||||||||||||||||||
Depreciation and amortizations | 153,197 | 102,486 | 839 | 5,331 | 261,853 | 261,853 | ||||||||||||||||||||||
Other income | 156,943 | 13,416 | — | 1,457 | 171,816 | 171,816 | ||||||||||||||||||||||
Other expenses | 67,860 | 11,458 | 7 | 7,386 | 86,711 | 86,711 | ||||||||||||||||||||||
Share of profit (loss) of associates and joint ventures accounted for using equity method Associates | 2,074 | — | — | 2,703 | 4,777 | 4,777 | ||||||||||||||||||||||
Joint ventures | — | 37,824 | — | 1,570 | 39,394 | 39,394 | ||||||||||||||||||||||
Income tax expense | — | — | — | (151,542 | ) | (151,542 | ) | (151,542 | ) | |||||||||||||||||||
Profit (loss) of each reportable segment | 361,787 | 583,533 | (4,274 | ) | (308,136 | ) | 632,910 | 632,910 | ||||||||||||||||||||
Geographical information on revenues | ||||||||||||||||||||||||||||
Revenue – Chilean entities | 1,016,135 | 973,324 | 377 | — | 1,989,836 | 1,989,836 | ||||||||||||||||||||||
Revenue – Foreign entities | 485,217 | 1,153,644 | — | — | 1,638,861 | 1,638,861 | ||||||||||||||||||||||
Total revenues from ordinary activities | 1,501,352 | 2,126,968 | 377 | — | 3,628,697 | 3,628,697 | ||||||||||||||||||||||
Six-month period ended June 30, 2022 | Pulp ThU.S.$ | Wood products ThU.S.$ | Others ThU.S.$ | Corporate ThU.S.$ | Subtotal ThU.S.$ | Elimination ThU.S.$ | Total ThU.S.$ | |||||||||||||||||||||
Amounts of additions to non-current assets | ||||||||||||||||||||||||||||
Acquisition of property, plant and equipment and biological assets | 769,719 | 44,535 | 251 | 5,737 | 820,242 | — | 820,242 | |||||||||||||||||||||
Acquisition and contribution of investments in associates and joint venture | — | — | — | 118 | 118 | — | 118 | |||||||||||||||||||||
Six-month period ended December 31, 2022 | Pulp ThU.S.$ | Wood products ThU.S.$ | Others ThU.S.$ | Corporate ThU.S.$ | Subtotal ThU.S.$ | Elimination ThU.S.$ | Total ThU.S.$ | |||||||||||||||||||||
Segment assets | 13,094,867 | 2,959,042 | 18,291 | 1,256,321 | 17,328,521 | (148,413 | ) | 17,180,108 | ||||||||||||||||||||
Segment assets (excluding deferred tax assets) | 13,094,867 | 2,959,042 | 18,291 | 1,247,310 | 17,319,510 | (148,413 | ) | 17,171,097 | ||||||||||||||||||||
Deferred tax assets | 9,011 | 9,011 | 9,011 | |||||||||||||||||||||||||
Investments accounted through equity method Associates | 36,489 | — | — | 64,332 | 100,821 | 100,821 | ||||||||||||||||||||||
Joint Ventures | — | 203,443 | — | 61,407 | 264,850 | 264,850 | ||||||||||||||||||||||
Segment liabilities | 1,049,313 | 438,864 | 22,237 | 7,409,710 | 8,920,124 | 8,920,124 | ||||||||||||||||||||||
Segment liabilities (excluding deferred tax liabilities) | 1,049,313 | 438,864 | 22,237 | 5,623,795 | 7,134,209 | 7,134,209 | ||||||||||||||||||||||
Deferred tax liabilities | 1,785,915 | 1,785,915 | 1,785,915 | |||||||||||||||||||||||||
Geographical information on non-current assets | ||||||||||||||||||||||||||||
Chile | 8,540,801 | 491,283 | 17,008 | 398,820 | 9,447,912 | (16,294 | ) | 9,431,618 | ||||||||||||||||||||
Foreign countries | 2,742,416 | 1,190,257 | — | 40,896 | 3,973,569 | 3,973,569 | ||||||||||||||||||||||
Total non-current assets | 11,283,217 | 1,681,540 | 17,008 | 439,716 | 13,421,481 | (16,294 | ) | 13,405,187 | ||||||||||||||||||||
113
Table of Contents
CELULOSA ARAUCO Y CONSTITUCION S.A. AND SUBSIDIARIES
Unaudited interim consolidated financial statements
June 30, 2023
Amounts in thousands of U.S. dollars, except as indicated
The following table shows information related to cash flows by segments which is presented as complementary information as required by our regulatory entities:
Six-month period ended June 30, 2023 | Pulp ThU.S.$ | Wood products ThU.S.$ | Others ThU.S.$ | Corporate ThU.S.$ | Subtotal ThU.S.$ | Elimination ThU.S.$ | Total ThU.S.$ | |||||||||||||||||||||
Segment cash flows | ||||||||||||||||||||||||||||
Cash flows from (used in) operating activities | 53,612 | 267,308 | (2,607 | ) | (169,027 | ) | 149,286 | — | 149,286 | |||||||||||||||||||
Cash flows (used in) investing activities | (625,835 | ) | (71,380 | ) | (1,260 | ) | (26,768 | ) | (725,243 | ) | — | (725,243 | ) | |||||||||||||||
Cash flows from (used in) financing activities | 644,214 | 9,034 | 9,615 | 19,020 | 681,883 | — | 681,883 | |||||||||||||||||||||
Net increase (decrease) in cash and cash equivalents | 71,991 | 204,962 | 5,748 | (176,775 | ) | 105,926 | — | 105,926 | ||||||||||||||||||||
Six-month period ended June 30, 2022 | Pulp ThU.S.$ | Wood products ThU.S.$ | Others ThU.S.$ | Corporate ThU.S.$ | Subtotal ThU.S.$ | Elimination ThU.S.$ | Total ThU.S.$ | |||||||||||||||||||||
Segment cash flows | ||||||||||||||||||||||||||||
Cash flows from (used in) operating activities | 676,684 | 374,351 | 4,137 | (109,419 | ) | 945,753 | — | 945,753 | ||||||||||||||||||||
Cash flows (used in) investing activities | (702,528 | ) | (36,572 | ) | (8,100 | ) | 23,605 | (723,595 | ) | — | (723,595 | ) | ||||||||||||||||
Cash flows from (used in) financing activities | (296,677 | ) | (19,563 | ) | (805 | ) | (1,754 | ) | (318,799 | ) | — | (318,799 | ) | |||||||||||||||
Net increase (decrease) in cash and cash equivalents | (322,521 | ) | 318,216 | (4,768 | ) | (87,568 | ) | (96,641 | ) | — | (96,641 | ) | ||||||||||||||||
Information required by geographic area:
| Geographical area | ||||||||||||||||||||||||||||
2023 | Local country | Foreign country | ||||||||||||||||||||||||||
| Chile | Argentina | Brazil | USA/Canada | Uruguay | Mexico | Total | ||||||||||||||||||||||
Disclosure of geographical areas | ThU.S.$ | ThU.S.$ | ThU.S.$ | ThU.S.$ | ThU.S.$ | ThU.S.$ | ThU.S.$ | |||||||||||||||||||||
Revenues from sale of goods | 1,309,935 | 274,033 | 284,292 | 596,932 | 219,215 | 104,953 | 2,789,360 | |||||||||||||||||||||
Revenues from rendering of services | 40,954 | — | 1,987 | — | 16,085 | 3 | 59,029 | |||||||||||||||||||||
Revenues as of June 30, 2023 | 1,350,889 | 274,033 | 286,279 | 596,932 | 235,300 | 104,956 | 2,848,389 | |||||||||||||||||||||
Non-current Assets at 06-30-2023 other than deferred tax | 9,538,503 | 585,578 | 1,164,702 | 692,765 | 1,652,491 | 161,673 | 13,795,712 | |||||||||||||||||||||
| Geographical area | ||||||||||||||||||||||||||||
2022 | Local country | Foreign country | ||||||||||||||||||||||||||
| Chile | Argentina | Brazil | USA/Canada | Uruguay | Mexico | Total | ||||||||||||||||||||||
Disclosure of geographical areas | ThU.S.$ | ThU.S.$ | ThU.S.$ | ThU.S.$ | ThU.S.$ | ThU.S.$ | ThU.S.$ | |||||||||||||||||||||
Revenues from sale of goods | 1,949,083 | 282,437 | 319,059 | 634,462 | 275,493 | 112,424 | 3,572,958 | |||||||||||||||||||||
Revenues from rendering of services | 40,753 | — | — | — | 14,986 | — | 55,739 | |||||||||||||||||||||
Revenues as of June 30, 2022 | 1,989,836 | 282,437 | 319,059 | 634,462 | 290,479 | 112,424 | 3,628,697 | |||||||||||||||||||||
Non-current Assets at 12-31-2022 other than deferred tax | 9,426,583 | 548,528 | 906,174 | 721,824 | 1,664,974 | 128,093 | 13,396,176 | |||||||||||||||||||||
114
Table of Contents
CELULOSA ARAUCO Y CONSTITUCION S.A. AND SUBSIDIARIES
Unaudited interim consolidated financial statements
June 30, 2023
Amounts in thousands of U.S. dollars, except as indicated
NOTE 25. OTHER NON-FINANCIAL ASSETS AND NON-FINANCIAL LIABILITIES
| 06-30-2023 | 12-31-2022 | |||||||
Current non-financial assets | ThU.S.$ | ThU.S.$ | ||||||
Roads to amortize, current | 56,364 | 56,171 | ||||||
Prepayment to amortize (insurance and others) | 42,989 | 17,474 | ||||||
Recoverable taxes (related to purchases) | 185,416 | 126,368 | ||||||
Other current non-financial assets | 9,036 | 6,046 | ||||||
Total | 293,805 | 206,059 | ||||||
| 06-30-2023 | 12-31-2022 | |||||||
Non-current non-financial assets | ThU.S.$ | ThU.S.$ | ||||||
Roads to amortize, non-current | 83,889 | 71,094 | ||||||
Guarantee values | 4,145 | 4,400 | ||||||
Recoverable taxes | 8,533 | 6,363 | ||||||
Other non-current non-financial assets | 24,099 | 10,657 | ||||||
Total | 120,666 | 92,514 | ||||||
| 06-30-2023 | 12-31-2022 | |||||||
Current non-financial liabilities | ThU.S.$ | ThU.S.$ | ||||||
Provision of minimum dividend (1) | 2,378 | 189,375 | ||||||
ICMS, PIS-COFINS and other tax payables - Brazil | 28,497 | 32,145 | ||||||
Other tax payable | 18,740 | 14,186 | ||||||
Other Current non-financial liabilities | 6,710 | 7,272 | ||||||
Total | 56,325 | 242,978 | ||||||
| (1) | Correspond mainly to the minimum dividend provision of the parent company (see Note 26). |
| 06-30-2023 | 12-31-2022 | |||||||
Non-current non-financial liabilities | ThU.S.$ | ThU.S.$ | ||||||
ICMS and other tax payable - Brazil | 66,796 | 66,736 | ||||||
Other non-current non-financial liabilities | 4,835 | 3,136 | ||||||
Total | 71,631 | 69,872 | ||||||
NOTE 26. DISTRIBUTABLE NET PROFIT AND EARNINGS PER SHARE
Distributable net profit
As a general policy, the Board of Directors of Arauco agreed that the net profit to be distributed as dividend is determined based on realized net gains/(losses) of any relevant variations in the value of unrealized assets and liabilities, which are excluded from the calculation of net profit during the period such changes are made.
As a result of the foregoing, for purposes of determining the distributable net profit of the Company, which is the same considered for calculating the minimum dividend required and additional dividend, the following unrealized gains/losses are excluded from the net profit for the year:
| 1) | Unrealized gains/losses relating to the fair value recorded for forestry assets under IAS 41, adding them back to distributable net profit when they are realized through sale or disposed of by other means. |
| 2) | Those generated through the acquisition of entities. These results will be added back to net profit when they are realized through sale. |
The deferred taxes associated with the amounts described in 1) and 2) above are also excluded.
115
Table of Contents
CELULOSA ARAUCO Y CONSTITUCION S.A. AND SUBSIDIARIES
Unaudited interim consolidated financial statements
June 30, 2023
Amounts in thousands of U.S. dollars, except as indicated
As of December 31, 2022 Arauco in the financial statements recognized the balance of minimum dividend provision of the parent company for ThU.S.$ 186,903. In December 2022 Arauco paid a provisional dividend for ThU.S.$ 183,971 decreasing the minimum dividend provision.
In 2023, the amount of ThU.S.$ 92,719 presented in the interim consolidated statement of changes in equity was provisioned, corresponding to an additional and extraordinary dividend of 10% to be paid for the profits of the parent company of 2022.
For the profits of the fiscal year 2022 and for subsequent fiscal years, an amount equivalent to the 40% of the distributable net income for each fiscal year will be distributed as dividends. Nevertheless, the Board of Directors may decide to distribute and pay dividends to the shareholders, to the extent that it expects the year to finalize with positive results and that the Company’s liquidity allows such distribution and payment.
The following table details the adjustments made for the determination of distributable net profit as of June 30, 2023 and 2022:
| Distributable net profit | ||||||||
| 06-30-2023 ThU.S.$ | 06-30-2022 ThU.S.$ | |||||||
Net profit attributable to parent company | (101,153 | ) | 632,877 | |||||
Adjustments: | ||||||||
Biological assets | ||||||||
Unrealized gains (losses) | (108,687 | ) | (130,564 | ) | ||||
Realized gains (losses) | 158,147 | 161,924 | ||||||
Deferred income taxes | (13,186 | ) | (10,205 | ) | ||||
|
|
|
| |||||
Total adjustments | 36,274 | 21,155 | ||||||
|
|
|
| |||||
Distributable net profit | (65,041 | ) | 654,032 | |||||
|
|
|
| |||||
40% | — | 261,613 | ||||||
|
|
|
| |||||
Due to the fact that the distributable net profit as of June 30, 2023 resulted in a loss, no amount related to the 2023 period was provisioned on that date.
Basic and diluted earnings per share
Basic and diluted earnings per share are calculated by dividing the profit or loss attributable to ordinary equity holders of parent by the weighted average number of ordinary shares outstanding. Arauco does not have any shares with potential dilutive effect.
| January - June | April - June | |||||||||||||||
| 2023 | 2022 | 2023 | 2022 | |||||||||||||
| ThU.S.$ | ThU.S.$ | ThU.S.$ | ThU.S.$ | |||||||||||||
Profit or loss attributable to ordinary equity holder of parent | (101,315 | ) | 632,877 | (47,152 | ) | 303,827 | ||||||||||
Weighted average of number of shares | 120,474,350 | 120,474,350 | 120,474,350 | 120,474,350 | ||||||||||||
Basic and diluted earnings per share (in U.S.$ per share) | (0.8409674 | ) | 5.2532095 | (0,3913862 | ) | 2,5219227 | ||||||||||
116
Table of Contents
CELULOSA ARAUCO Y CONSTITUCION S.A. AND SUBSIDIARIES
Unaudited interim consolidated financial statements
June 30, 2023
Amounts in thousands of U.S. dollars, except as indicated
NOTE 27. SUBSEQUENT EVENTS
The authorization for the issuance and publication of these interim consolidated financial statements for the six-month period ended June 30, 2023, was approved by the Board of Directors of Arauco at the Extraordinary Meeting No. 694 held on August 9, 2023.
Subsequent to June 30, 2023, and as of the date of issuance of these interim consolidated financial statements, there have been no additional events, that could materially affect the presentation of these interim consolidated financial statements.
117
Table of Contents
Table of Contents
Press Release 2Q 2023 Sengés, Paraná State, Brazil 2Q 2023 RESULTS Highlights 2Q 2023 For more details on ARAUCO´s financial statements please visit www.cmfchile.cl or www.arauco.com Readers are referred to the documents filed by ARAUCO with the United States Securities and Exchange Commission, specifically the most recent filing on Form 20-F that identifies important risk factors that could cause actual results to differ from those contained in the forward-looking statements. All forward-looking statements are based on information available to ARAUCO on the date hereof and ARAUCO does not assume any obligation to update such statements. References herein to “U.S.$” are to United States dollars. Discrepancies in any table between totals and sums of the amounts listed are due to rounding. This report is unaudited. REVENUES US$1,408.9 million NET INCOME -US$47.1 million ADJUSTED EBITDA US$226.6 million NET DEBT TO LTM Adj. EBITDA 4.59x CAPEX US$374.4 million
Table of Contents
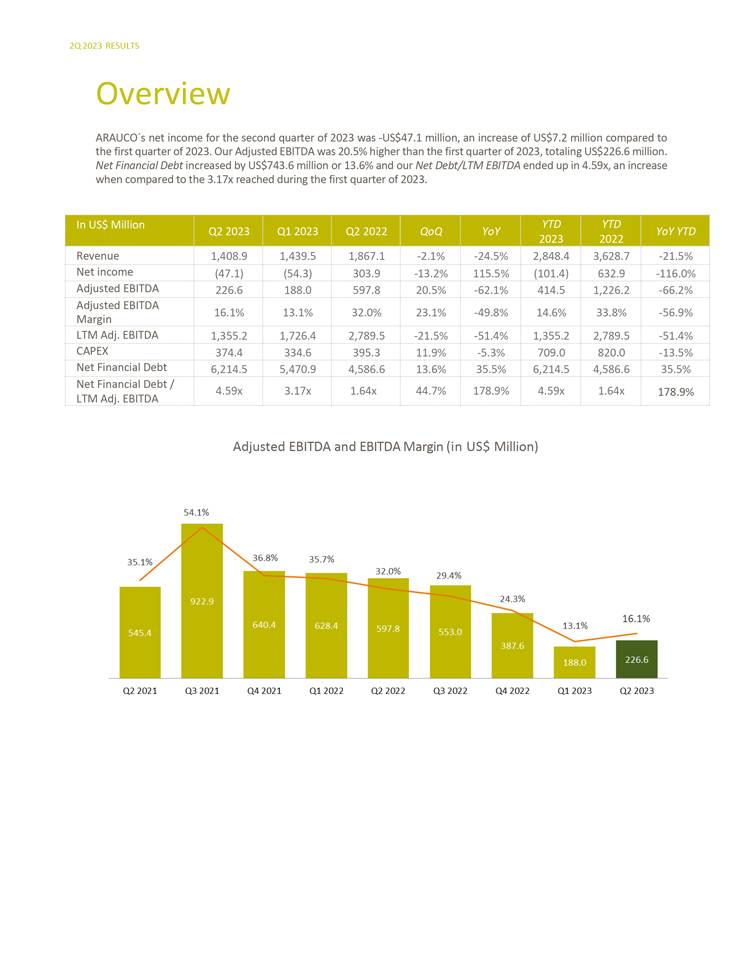
2Q 2023 RESULTS Overview ARAUCO´s net income for the second quarter of 2023 was -US$47.1 million, an increase of US$7.2 million compared to the first quarter of 2023. Our Adjusted EBITDA was 20.5% higher than the first quarter of 2023, totaling US$226.6 million. Net Financial Debt increased by US$743.6 million or 13.6% and our Net Debt/LTM EBITDA ended up in 4.59x, an increase when compared to the 3.17x reached during the first quarter of 2023. In US$ Million YTD YTD Q2 2023 Q1 2023 Q2 2022 QoQ YoY YoY YTD 2023 2022 Revenue 1,408.9 1,439.5 1,867.1 -2.1% -24.5% 2,848.4 3,628.7 -21.5% Net income (47.1) (54.3) 303.9 -13.2% 115.5% (101.4) 632.9 -116.0% Adjusted EBITDA 226.6 188.0 597.8 20.5% -62.1% 414.5 1,226.2 -66.2% Adjusted EBITDA 16.1% 13.1% 32.0% 23.1% -49.8% 14.6% 33.8% -56.9% Margin LTM Adj. EBITDA 1,355.2 1,726.4 2,789.5 -21.5% -51.4% 1,355.2 2,789.5 -51.4% CAPEX 374.4 334.6 395.3 11.9% -5.3% 709.0 820.0 -13.5% Net Financial Debt 6,214.5 5,470.9 4,586.6 13.6% 35.5% 6,214.5 4,586.6 35.5% Net Financial Debt / 4.59x 3.17x 1.64x 44.7% 178.9% 4.59x 1.64x 178.9% LTM Adj. EBITDA Adjusted EBITDA and EBITDA Margin (in US$ Million)
Table of Contents
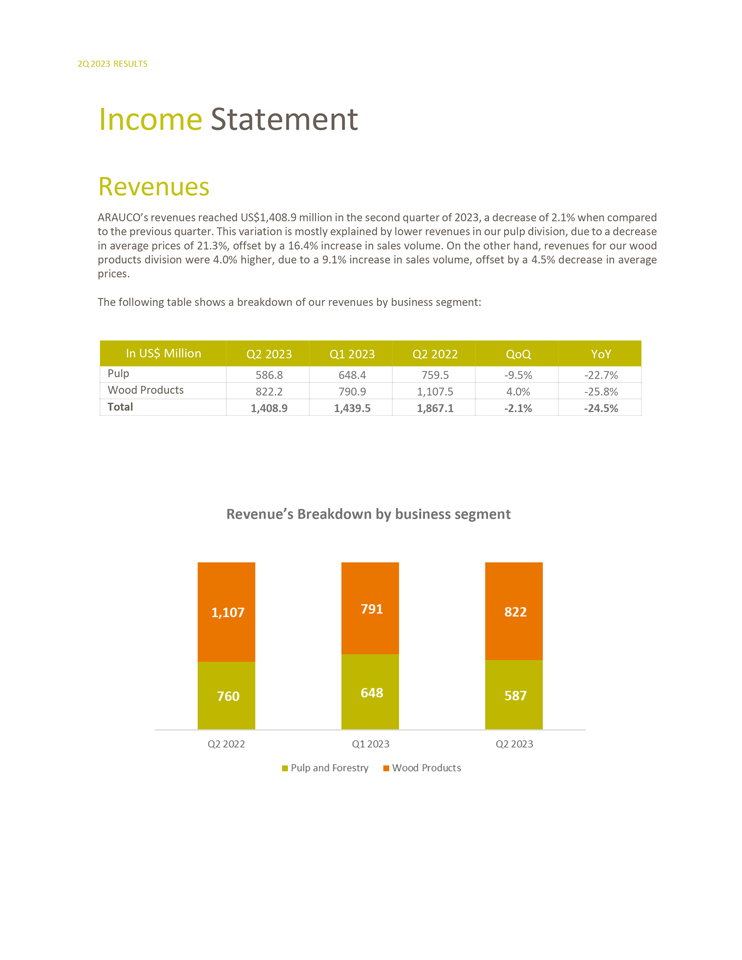
2Q 2023 RESULTS Income Statement Revenues ARAUCO’s revenues reached US$1,408.9 million in the second quarter of 2023, a decrease of 2.1% when compared to the previous quarter. This variation is mostly explained by lower revenues in our pulp division, due to a decrease in average prices of 21.3%, offset by a 16.4% increase in sales volume. On the other hand, revenues for our wood products division were 4.0% higher, due to a 9.1% increase in sales volume, offset by a 4.5% decrease in average prices. The following table shows a breakdown of our revenues by business segment: In US$ Million Q2 2023 Q1 2023 Q2 2022 QoQ YoY Pulp 586.8 648.4 759.5 -9.5% -22.7% Wood Products 822.2 790.9 1,107.5 4.0% -25.8% Total 1,408.9 1,439.5 1,867.1 -2.1% -24.5% Revenue’s Breakdown by business segment
Table of Contents
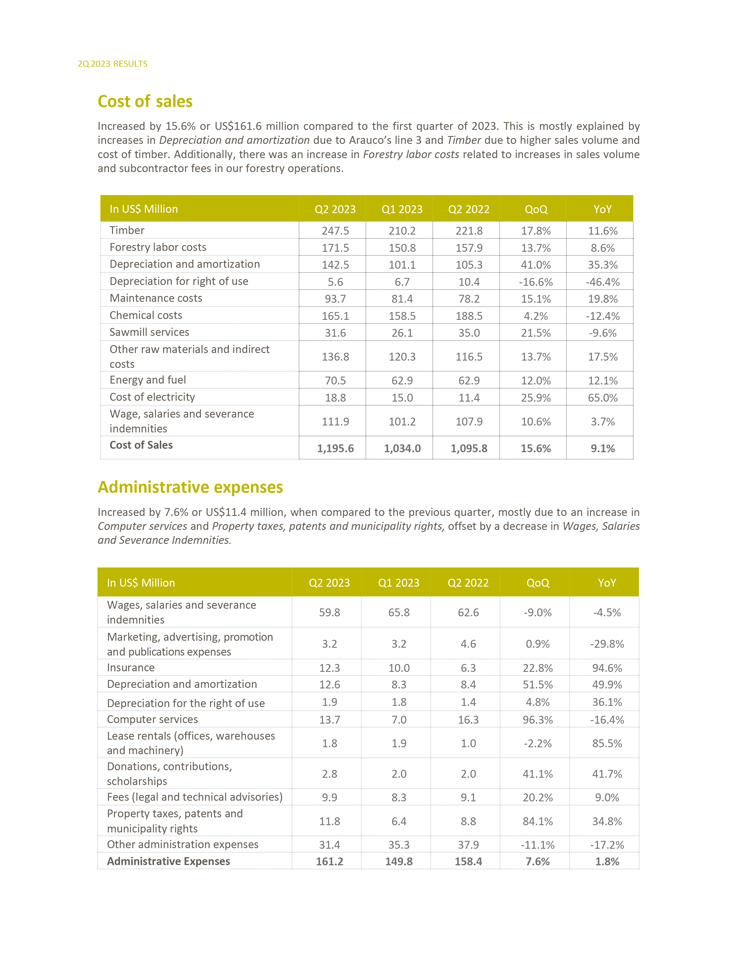
2Q 2023 RESULTS Cost of sales Increased by 15.6% or US$161.6 million compared to the first quarter of 2023. This is mostly explained by increases in Depreciation and amortization due to Arauco’s line 3 and Timber due to higher sales volume and cost of timber. Additionally, there was an increase in Forestry labor costs related to increases in sales volume and subcontractor fees in our forestry operations. In US$ Million Q2 2023 Q1 2023 Q2 2022 QoQ YoY Timber 247.5 210.2 221.8 17.8% 11.6% Forestry labor costs 171.5 150.8 157.9 13.7% 8.6% Depreciation and amortization 142.5 101.1 105.3 41.0% 35.3% Depreciation for right of use 5.6 6.7 10.4 -16.6% -46.4% Maintenance costs 93.7 81.4 78.2 15.1% 19.8% Chemical costs 165.1 158.5 188.5 4.2% -12.4% Sawmill services 31.6 26.1 35.0 21.5% -9.6% Other raw materials and indirect 136.8 120.3 116.5 13.7% 17.5% costs Energy and fuel 70.5 62.9 62.9 12.0% 12.1% Cost of electricity 18.8 15.0 11.4 25.9% 65.0% Wage, salaries and severance 111.9 101.2 107.9 10.6% 3.7% indemnities Cost of Sales 1,195.6 1,034.0 1,095.8 15.6% 9.1% Administrative expenses Increased by 7.6% or US$11.4 million, when compared to the previous quarter, mostly due to an increase in Computer services and Property taxes, patents and municipality rights, offset by a decrease in Wages, Salaries and Severance Indemnities. In US$ Million Q2 2023 Q1 2023 Q2 2022 QoQ YoY Wages, salaries and severance 59.8 65.8 62.6 -9.0% -4.5% indemnities Marketing, advertising, promotion 3.2 3.2 4.6 0.9% -29.8% and publications expenses Insurance 12.3 10.0 6.3 22.8% 94.6% Depreciation and amortization 12.6 8.3 8.4 51.5% 49.9% Depreciation for the right of use 1.9 1.8 1.4 4.8% 36.1% Computer services 13.7 7.0 16.3 96.3% -16.4% Lease rentals (offices, warehouses 1.8 1.9 1.0 -2.2% 85.5% and machinery) Donations, contributions, 2.8 2.0 2.0 41.1% 41.7% scholarships Fees (legal and technical advisories) 9.9 8.3 9.1 20.2% 9.0% Property taxes, patents and 11.8 6.4 8.8 84.1% 34.8% municipality rights Other administration expenses 31.4 35.3 37.9 -11.1% -17.2% Administrative Expenses 161.2 149.8 158.4 7.6% 1.8%
Table of Contents
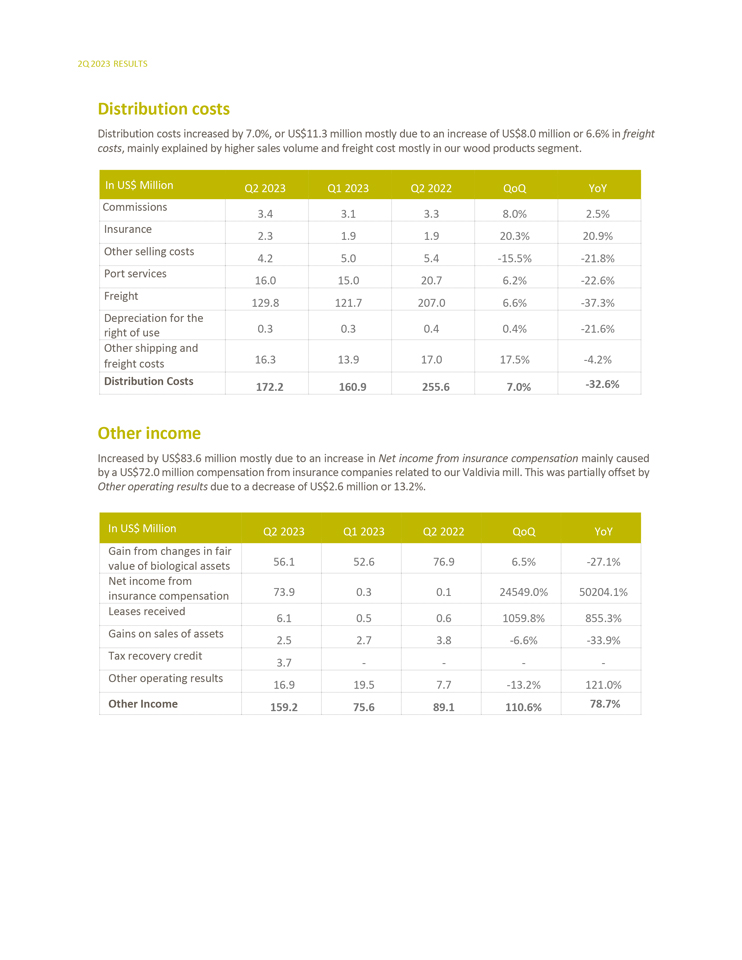
2Q 2023 RESULTS Distribution costs Distribution costs increased by 7.0%, or US$11.3 million mostly due to an increase of US$8.0 million or 6.6% in freight costs, mainly explained by higher sales volume and freight cost mostly in our wood products segment. In US$ Million Q2 2023 Q1 2023 Q2 2022 QoQ YoY Commissions 3.4 3.1 3.3 8.0% 2.5% Insurance 2.3 1.9 1.9 20.3% 20.9% Other selling costs 4.2 5.0 5.4 -15.5% -21.8% Port services 16.0 15.0 20.7 6.2% -22.6% Freight 129.8 121.7 207.0 6.6% -37.3% Depreciation for the right of use 0.3 0.3 0.4 0.4% -21.6% Other shipping and freight costs 16.3 13.9 17.0 17.5% -4.2% Distribution Costs -32.6% 172.2 160.9 255.6 7.0% Other income Increased by US$83.6 million mostly due to an increase in Net income from insurance compensation mainly caused by a US$72.0 million compensation from insurance companies related to our Valdivia mill. This was partially offset by Other operating results due to a decrease of US$2.6 million or 13.2%. In US$ Million Q2 2023 Q1 2023 Q2 2022 QoQ YoY Gain from changes in fair value of biological assets 56.1 52.6 76.9 6.5% -27.1% Net income from insurance compensation 73.9 0.3 0.1 24549.0% 50204.1% Leases received 6.1 0.5 0.6 1059.8% 855.3% Gains on sales of assets 2.5 2.7 3.8 -6.6% -33.9% Tax recovery credit 3.7 — — — Other operating results 16.9 19.5 7.7 -13.2% 121.0% Other Income 159.2 75.6 89.1 110.6% 78.7%
Table of Contents
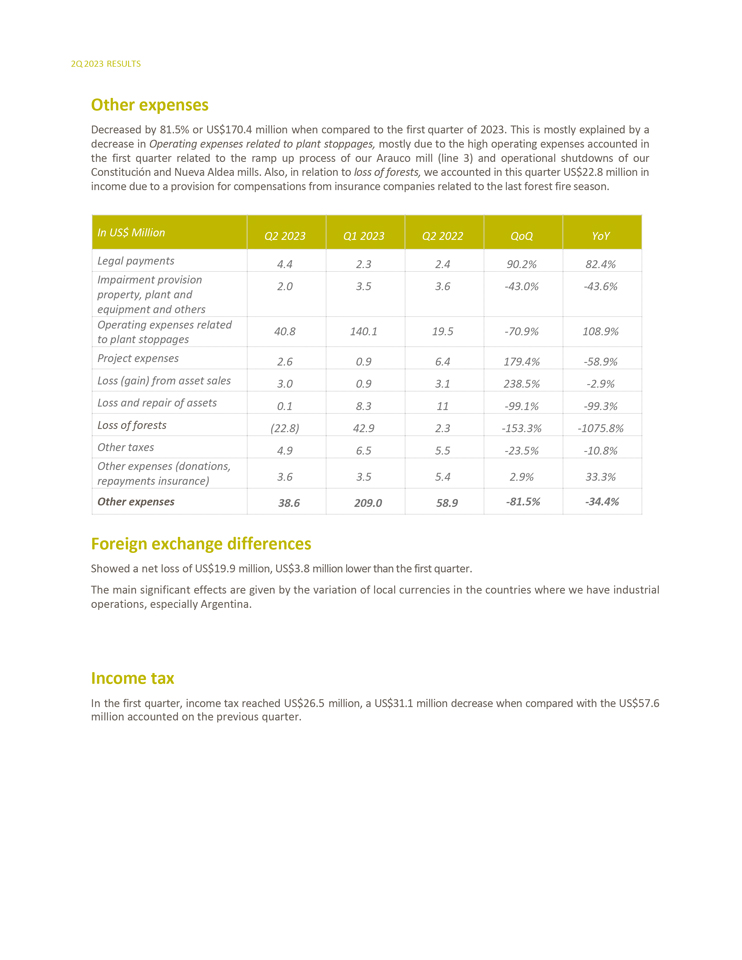
2Q 2023 RESULTS Other expenses Decreased by 81.5% or US$170.4 million when compared to the first quarter of 2023. This is mostly explained by a decrease in Operating expenses related to plant stoppages, mostly due to the high operating expenses accounted in the first quarter related to the ramp up process of our Arauco mill (line 3) and operational shutdowns of our Constitución and Nueva Aldea mills. Also, in relation to loss of forests, we accounted in this quarter US$22.8 million in income due to a provision for compensations from insurance companies related to the last forest fire season. In US$ Million Q2 2023 Q1 2023 Q2 2022 QoQ YoY Legal payments 4.4 2.3 2.4 90.2% 82.4% Impairment provision 2.0 3.5 3.6 -43.0% -43.6% property, plant and equipment and others Operating expenses related 40.8 140.1 19.5 -70.9% 108.9% to plant stoppages Project expenses 2.6 0.9 6.4 179.4% -58.9% Loss (gain) from asset sales 3.0 0.9 3.1 238.5% -2.9% Loss and repair of assets 0.1 8.3 11 -99.1% -99.3% Loss of forests (22.8) 42.9 2.3 -153.3% -1075.8% Other taxes 4.9 6.5 5.5 -23.5% -10.8% Other expenses (donations, repayments insurance) 3.6 3.5 5.4 2.9% 33.3% Other expenses 38.6 209.0 58.9 -81.5% -34.4% Foreign exchange differences Showed a net loss of US$19.9 million, US$3.8 million lower than the first quarter. The main significant effects are given by the variation of local currencies in the countries where we have industrial operations, especially Argentina. Income tax In the first quarter, income tax reached US$26.5 million, a US$31.1 million decrease when compared with the US$57.6 million accounted on the previous quarter.
Table of Contents
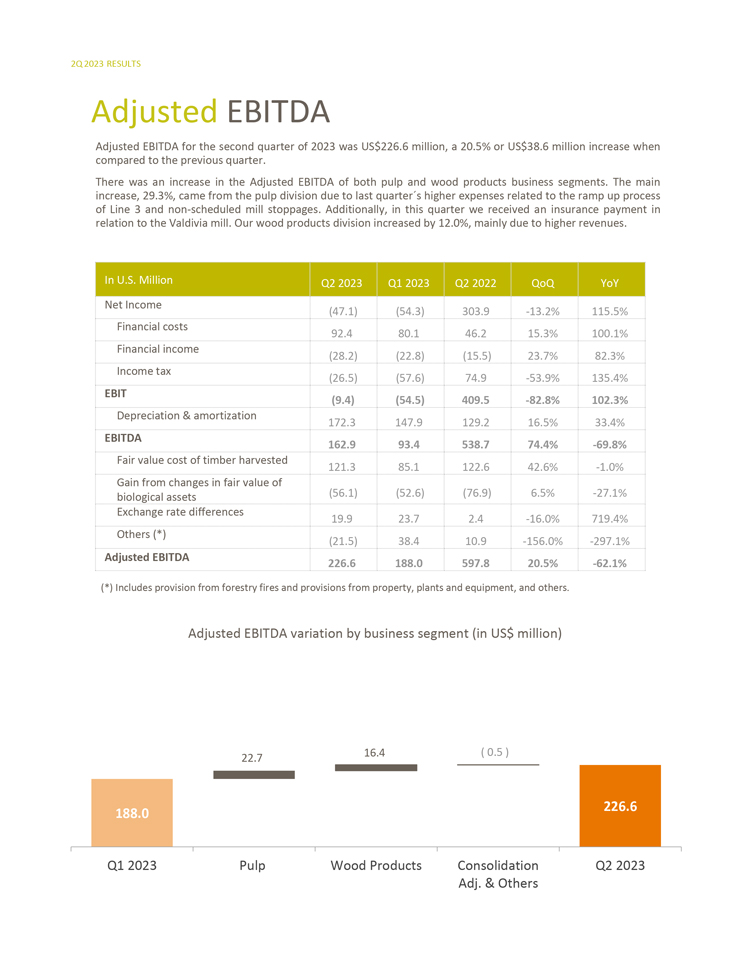
2Q 2023 RESULTS Adjusted EBITDA Adjusted EBITDA for the second quarter of 2023 was US$226.6 million, a 20.5% or US$38.6 million increase when compared to the previous quarter. There was an increase in the Adjusted EBITDA of both pulp and wood products business segments. The main increase, 29.3%, came from the pulp division due to last quarter´s higher expenses related to the ramp up process of Line 3 and non-scheduled mill stoppages. Additionally, in this quarter we received an insurance payment in relation to the Valdivia mill. Our wood products division increased by 12.0%, mainly due to higher revenues. In U.S. Million Q2 2023 Q1 2023 Q2 2022 QoQ YoY Net Income (47.1) (54.3) 303.9 -13.2% 115.5% Financial costs 92.4 80.1 46.2 15.3% 100.1% Financial income (28.2) (22.8) (15.5) 23.7% 82.3% Income tax (26.5) (57.6) 74.9 -53.9% 135.4% EBIT (9.4) (54.5) 409.5 -82.8% 102.3% Depreciation & amortization 172.3 147.9 129.2 16.5% 33.4% EBITDA 162.9 93.4 538.7 74.4% -69.8% Fair value cost of timber harvested 121.3 85.1 122.6 42.6% -1.0% Gain from changes in fair value of biological assets (56.1) (52.6) (76.9) 6.5% -27.1% Exchange rate differences 19.9 23.7 2.4 -16.0% 719.4% Others (*) (21.5) 38.4 10.9 -156.0% -297.1% Adjusted EBITDA 226.6 188.0 597.8 20.5% -62.1% (*) Includes provision from forestry fires and provisions from property, plants and equipment, and others. Adjusted EBITDA variation by business segment (in US$ million) 16.4 ( 0.5 ) 22.7 226.6 188.0 Q1 2023 Pulp Wood Products Consolidation Q2 2023 Adj. & Others
Table of Contents
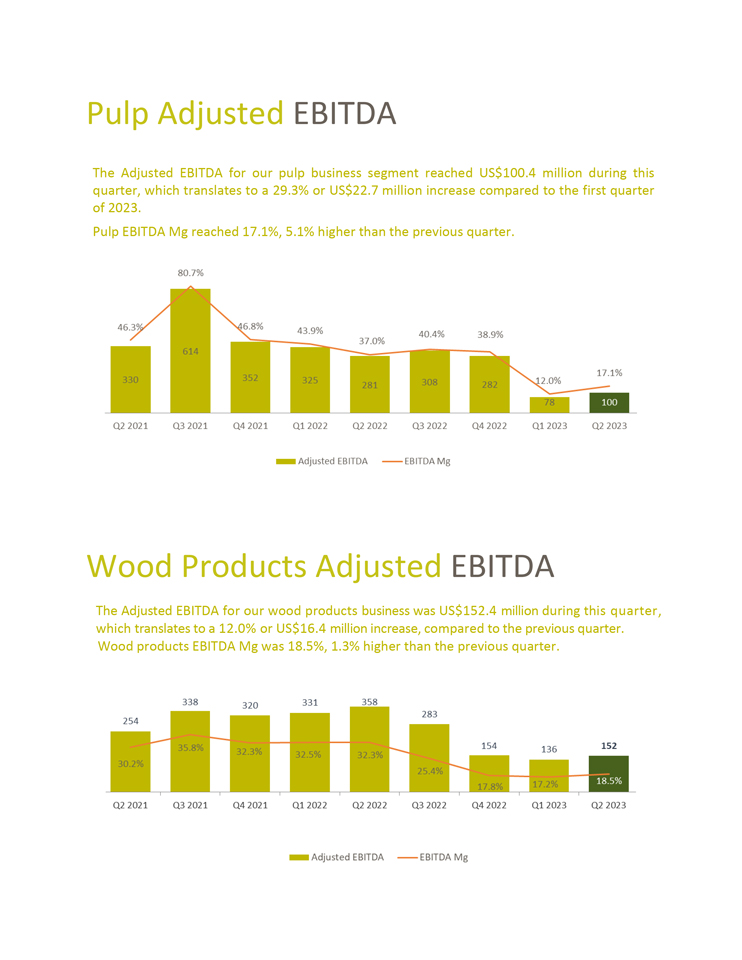
Pulp Adjusted EBITDA The Adjusted EBITDA for our pulp business segment reached US$100.4 million during this quarter, which translates to a 29.3% or US$22.7 million increase compared to the first quarter of 2023. Pulp EBITDA Mg reached 17.1%, 5.1% higher than the previous quarter. Wood Products Adjusted EBITDA The Adjusted EBITDA for our wood products business was US$152.4 million during this quarter, which translates to a 12.0% or US$16.4 million increase, compared to the previous quarter. Wood products EBITDA Mg was 18.5%, 1.3% higher than the previous quarter.
Table of Contents
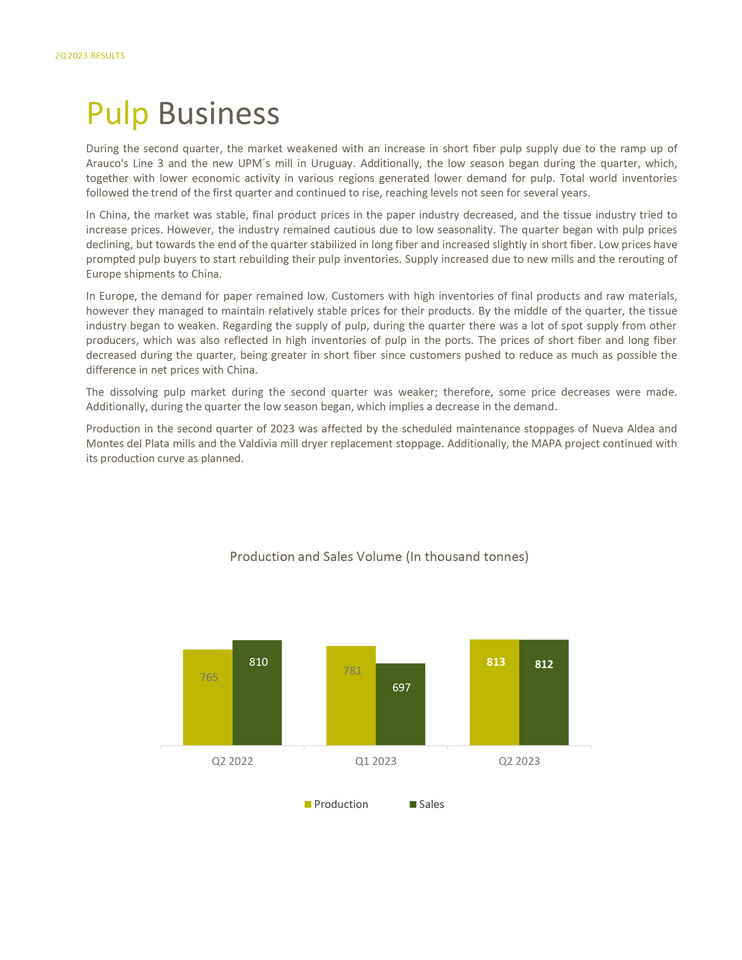
2Q 2023 RESULTS Pulp Business During the second quarter, the market weakened with an increase in short fiber pulp supply due to the ramp up of Arauco’s Line 3 and the new UPM´s mill in Uruguay. Additionally, the low season began during the quarter, which, together with lower economic activity in various regions generated lower demand for pulp. Total world inventories followed the trend of the first quarter and continued to rise, reaching levels not seen for several years. In China, the market was stable, final product prices in the paper industry decreased, and the tissue industry tried to increase prices. However, the industry remained cautious due to low seasonality. The quarter began with pulp prices declining, but towards the end of the quarter stabilized in long fiber and increased slightly in short fiber. Low prices have prompted pulp buyers to start rebuilding their pulp inventories. Supply increased due to new mills and the rerouting of Europe shipments to China. In Europe, the demand for paper remained low. Customers with high inventories of final products and raw materials, however they managed to maintain relatively stable prices for their products. By the middle of the quarter, the tissue industry began to weaken. Regarding the supply of pulp, during the quarter there was a lot of spot supply from other producers, which was also reflected in high inventories of pulp in the ports. The prices of short fiber and long fiber decreased during the quarter, being greater in short fiber since customers pushed to reduce as much as possible the difference in net prices with China. The dissolving pulp market during the second quarter was weaker; therefore, some price decreases were made. Additionally, during the quarter the low season began, which implies a decrease in the demand. Production in the second quarter of 2023 was affected by the scheduled maintenance stoppages of Nueva Aldea and Montes del Plata mills and the Valdivia mill dryer replacement stoppage. Additionally, the MAPA project continued with its production curve as planned. Production and Sales Volume (In thousand tonnes) 810 781 813 812 765 697 Q2 2022 Q1 2023 Q2 2023 Production Sales
Table of Contents
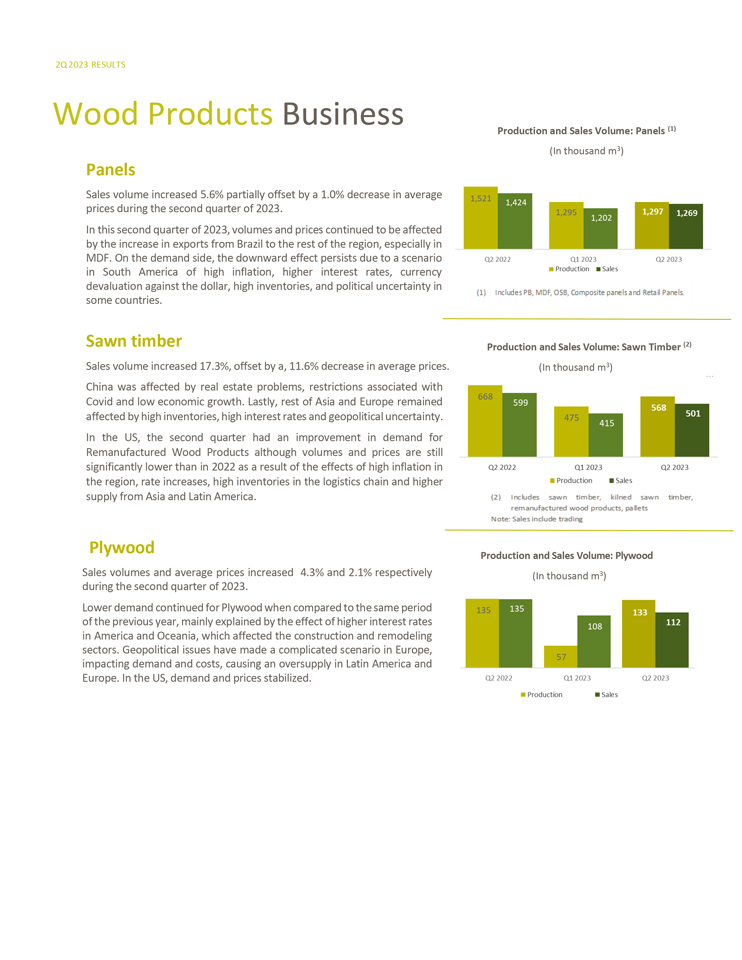
2Q 2023 RESULTS Wood Products Business Production and Sales Volume: Panels (1) (In thousand m3) Panels Sales volume increased 5.6% partially offset by a 1.0% decrease in average prices during the second quarter of 2023. In this second quarter of 2023, volumes and prices continued to be affected by the increase in exports from Brazil to the rest of the region, especially in MDF. On the demand side, the downward effect persists due to a scenario in South America of high inflation, higher interest rates, currency devaluation against the dollar, high inventories, and political uncertainty in some countries. Sawn timber Production and Volume: Sawn Timber (2) Sales Sales volume increased 17.3%, offset by a, 11.6% decrease in average prices. (In thousand m3) China was affected by real estate problems, restrictions associated with Covid and low economic growth. Lastly, rest of Asia and Europe remained affected by high inventories, high interest rates and geopolitical uncertainty. In the US, the second quarter had an improvement in demand for Remanufactured Wood Products although volumes and prices are still significantly lower than in 2022 as a result of the effects of high inflation in the region, rate increases, high inventories in the logistics chain and higher supply from Asia and Latin America. Plywood Production and Sales Volume: Plywood Sales volumes and average prices increased 4.3% and 2.1% respectively during the second quarter of 2023. Lower demand continued for Plywood when compared to the same period of the previous year, mainly explained by the effect of higher interest rates in America and Oceania, which affected the construction and remodeling sectors. Geopolitical issues have made a complicated scenario in Europe, impacting demand and costs, causing an oversupply in Latin America and Europe. In the US, demand and prices stabilized.
Table of Contents
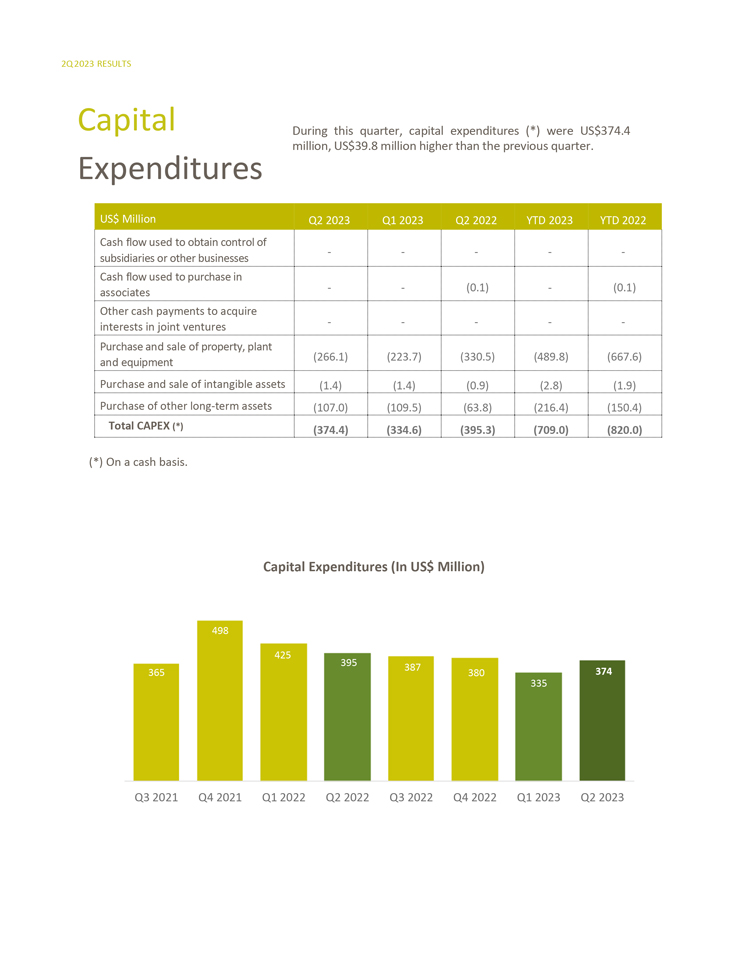
2Q 2023 RESULTS Capital During this quarter, capital expenditures (*) were US$374.4 million, US$39.8 million higher than the previous quarter. Expenditures US$ Million Q2 2023 Q1 2023 Q2 2022 YTD 2023 YTD 2022 Cash flow used to obtain control of————— subsidiaries or other businesses Cash flow used to purchase in—— (0.1)— (0.1) associates Other cash payments to acquire ————— interests in joint ventures Purchase and sale of property, plant (266.1) (223.7) (330.5) (489.8) (667.6) and equipment Purchase and sale of intangible assets (1.4) (1.4) (0.9) (2.8) (1.9) Purchase of other long-term assets (107.0) (109.5) (63.8) (216.4) (150.4) Total CAPEX (*) (374.4) (334.6) (395.3) (709.0) (820.0) (*) On a cash basis. Capital Expenditures (In US$ Million) 498 425 395 387 365 380 374 335 Q3 2021 Q4 2021 Q1 2022 Q2 2022 Q3 2022 Q4 2022 Q1 2023 Q2 2023
Table of Contents
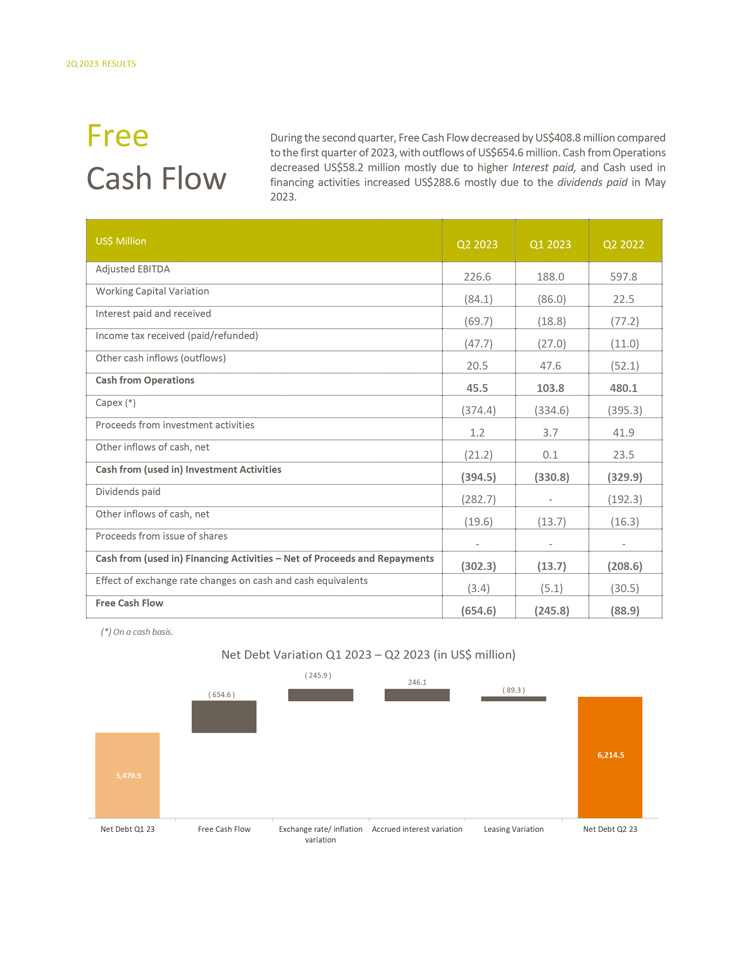
2Q 2023 RESULTS Free During the second quarter, Free Cash Flow decreased by US$408.8 million compared to the first quarter of 2023, with outflows of US$654.6 million. Cash from Operations decreased US$58.2 million mostly due to higher Interest paid, and Cash used in Cash Flow financing activities increased US$288.6 mostly due to the dividends paid in May 2023. US$ Million Q2 2023 Q1 2023 Q2 2022 Adjusted EBITDA 226.6 188.0 597.8 Working Capital Variation (84.1) (86.0) 22.5 Interest paid and received (69.7) (18.8) (77.2) Income tax received (paid/refunded) (47.7) (27.0) (11.0) Other cash inflows (outflows) 20.5 47.6 (52.1) Cash from Operations 45.5 103.8 480.1 Capex (*) (374.4) (334.6) (395.3) Proceeds from investment activities 1.2 3.7 41.9 Other inflows of cash, net (21.2) 0.1 23.5 Cash from (used in) Investment Activities (394.5) (330.8) (329.9) Dividends paid (282.7)— (192.3) Other inflows of cash, net (19.6) (13.7) (16.3) Proceeds from issue of shares —— Cash from (used in) Financing Activities – Net of Proceeds and Repayments (302.3) (13.7) (208.6) Effect of exchange rate changes on cash and cash equivalents (3.4) (5.1) (30.5) Free Cash Flow (654.6) (245.8) (88.9) (*) On a cash basis. Net Debt Variation Q1 2023 – Q2 2023 (in US$ million)
Table of Contents
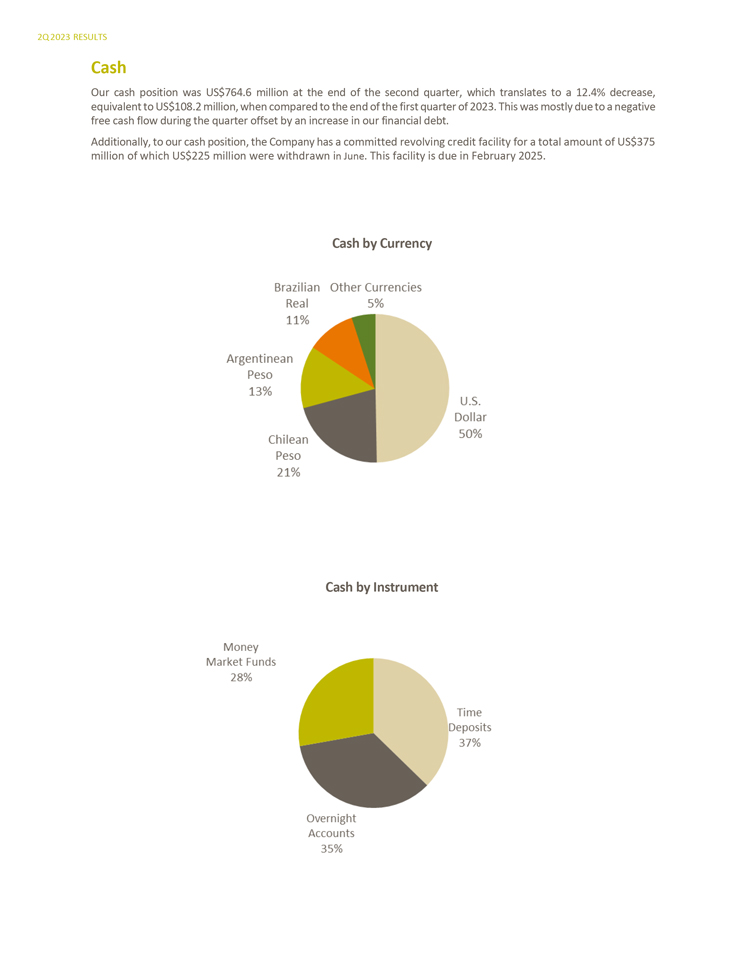
2Q 2023 RESULTS Cash Our cash position was US$764.6 million at the end of the second quarter, which translates to a 12.4% decrease, equivalent to US$108.2 million, when compared to the end of the first quarter of 2023. This was mostly due to a negative free cash flow during the quarter offset by an increase in our financial debt. Additionally, to our cash position, the Company has a committed revolving credit facility for a total amount of US$375 million of which US$225 million were withdrawn in June. This facility is due in February 2025. Cash by Currency Cash by Instrument
Table of Contents
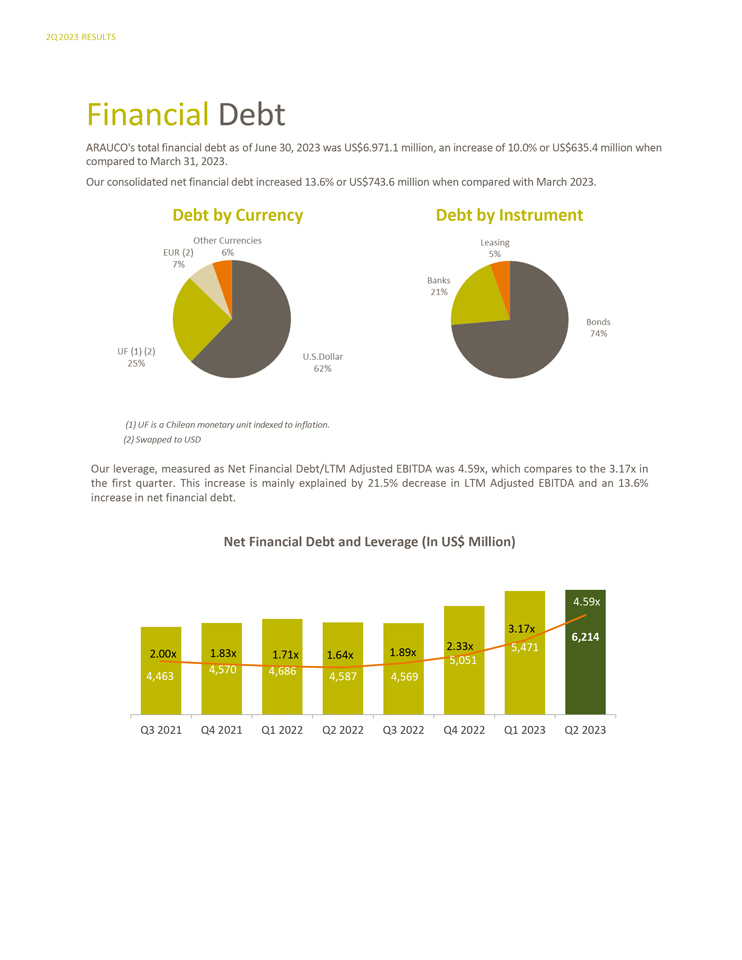
2Q 2023 RESULTS Financial Debt ARAUCO’s total financial debt as of June 30, 2023 was US$6.971.1 million, an increase of 10.0% or US$635.4 million when compared to March 31, 2023. Our consolidated net financial debt increased 13.6% or US$743.6 million when compared with March 2023. Debt by Currency Debt by Instrument (1) UF is a Chilean monetary unit indexed to inflation. (2) Swapped to USD Our leverage, measured as Net Financial Debt/LTM Adjusted EBITDA was 4.59x, which compares to the 3.17x in the first quarter. This increase is mainly explained by 21.5% decrease in LTM Adjusted EBITDA and an 13.6% increase in net financial debt. Net Financial Debt and Leverage (In US$ Million) 5,500.0 6.00x 4.59x 5,000.0 5.00x 4,500.0 3.17x 4.00x 6,214 4,000.0 1.89x 2.33x 5,471 3.00x 2.00x 1.83x 1.71x 1.64x 3,500.0 4,570 5,051 2.00x 4,686 3,000.0 4,463 4,587 4,569 1.00x 2,500.0 0.00x 2,000.0 -1.00x Q3 2021 Q4 2021 Q1 2022 Q2 2022 Q3 2022 Q4 2022 Q1 2023 Q2 2023
Table of Contents
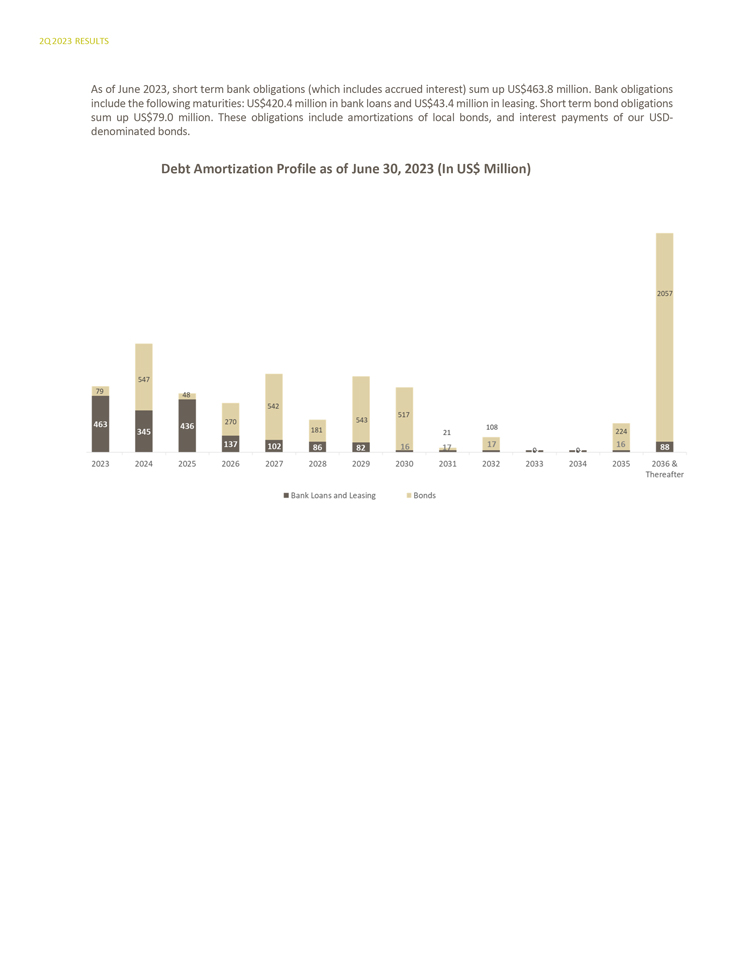
2Q 2023 RESULTS As of June 2023, short term bank obligations (which includes accrued interest) sum up US$463.8 million. Bank obligations include the following maturities: US$420.4 million in bank loans and US$43.4 million in leasing. Short term bond obligations sum up US$79.0 million. These obligations include amortizations of local bonds, and interest payments of our USD-denominated bonds. Debt Amortization Profile as of June 30, 2023 (In US$ Million)
Table of Contents
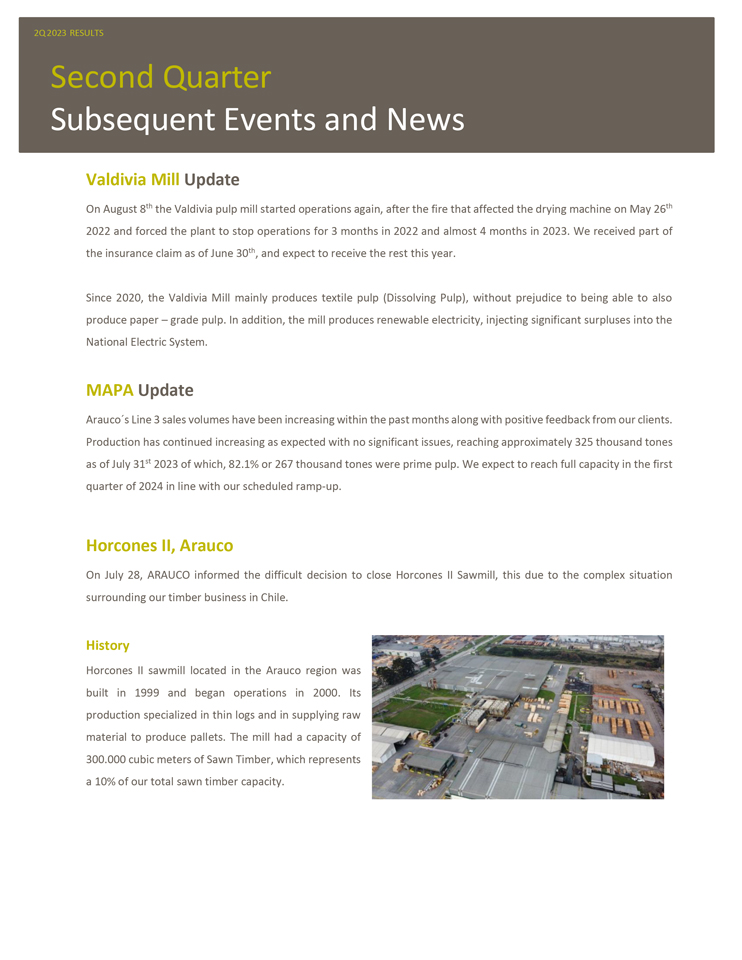
2Q 2023 RESULTS Second Quarter Subsequent Events and News Valdivia Mill Update On August 8th the Valdivia pulp mill started operations again, after the fire that affected the drying machine on May 26th 2022 and forced the plant to stop operations for 3 months in 2022 and almost 4 months in 2023. We received part of the insurance claim as of June 30th, and expect to receive the rest this year. Since 2020, the Valdivia Mill mainly produces textile pulp (Dissolving Pulp), without prejudice to being able to also produce paper – grade pulp. In addition, the mill produces renewable electricity, injecting significant surpluses into the National Electric System. MAPA Update Arauco´s Line 3 sales volumes have been increasing within the past months along with positive feedback from our clients. Production has continued increasing as expected with no significant issues, reaching approximately 325 thousand tones as of July 31st 2023 of which, 82.1% or 267 thousand tones were prime pulp. We expect to reach full capacity in the first quarter of 2024 in line with our scheduled ramp-up. Horcones II, Arauco On July 28, ARAUCO informed the difficult decision to close Horcones II Sawmill, this due to the complex situation surrounding our timber business in Chile. History Horcones II sawmill located in the Arauco region was built in 1999 and began operations in 2000. Its production specialized in thin logs and in supplying raw material to produce pallets. The mill had a capacity of 300.000 cubic meters of Sawn Timber, which represents a 10% of our total sawn timber capacity.
Table of Contents
2Q 2023 RESULTS ESG Sustainable Bonds During the second quarter of 2023, ARAUCO issued three Sustainable Bonds in the local market, which most relevant conditions were: 1. A) On April 25th, “Serie Y” Bond, for a total amount of 2,000,000 Unidades de Fomento (“UF”), maturing on April 10, 2032. Interests will accrue on the unpaid principal, expressed in UF, a coupon interest of 3.10% per annum. B) On April 25th, “Serie Z” Bond, for a total amount of 5,000,000 UF, maturing on April 10, 2044. Interests will accrue on the unpaid principal, expressed in UF, a coupon interest of 3.2% per annum. C) On June 13th “Serie AB” Bond, for a total amount of 5,000,000 in UF, maturing on May 15, 2046. Interests will accrue on the unpaid principal, expressed in UF, a coupon interest of 3.2% per annum 2. These series have a Chilean credit risk rating of AA/Stable, according to Fitch Chile and Feller Rate. 3. The proceeds from the placements will be used 100% for general corporate purposes of the Company and/or its subsidiaries. The abovementioned bonds are classified as “sustainable”, since regardless of the use of proceeds described in the previous paragraph, Arauco will destine an amount equivalent to the proceeds to one or more green and social projects selected for the purposes of the issuance in accordance with the Sustainability Bond Framework adopted by the Company and published on its website. Green and social projects may include: (i) projects with disbursements made within the 36 months preceding the issue date of the bonds and (ii) projects with disbursements to be made after the referred issuance, and up to the maturity date of the same bonds. To this date, the total amount of all three bonds is hedged in USD. Integrated Report On April 14th, as a requirement from the CMF (“Comisión para el Mercado Financiero”), we published Arauco’s first Integrated Report, which consolidates the Sustainability Report and the Annual Report, publications that we used to prepare separately. This publication summarizes the performance of the company in 2022 and establishes our medium and long term challenges in financial, social and environmental matters, among others. You will find our Integrated Report for the year 2022 in our website clicking here for English, here for Spanish or here for Portuguese.
Table of Contents

UPCOMING EVENTS 2Q 2023 RESULTS CONFERENCE CALL Friday, August 18, 2023 10:00 Santiago Time 10:00 Eastern Time (New York) Dial in: +1 (844) 450 3845 from the US +56 (44) 208 1274 from Chile +55 (11) 3181 8565 from Brazil +1 (412) 317 6368 from other countries For further information, please contact: Marcelo Bennett Treasurer marcelo.bennett@arauco.com Phone: +56 2 2461 7309 Constanza Vasquez Investor Relations constanza.vasquez@arauco.com Phone: +56 2 2461 7434 investor_relations@arauco.cl
Table of Contents
2Q 2023 RESULTS Financial Statements Income Statement In US$ Million Q2 2023 Q1 2023 Q2 2022 YTD 2023 YTD 2022 Revenues 1,408.9 1,439.5 1,867.1 2,848.4 3,628.7 Cost of sales (1,195.6) (1,034.0) (1,095.8) (2,229.7) (2,099.0) Gross profit 213.3 405.5 771.3 618.7 1,529.7 Other income 159.2 75.6 89.1 234.8 171.8 Distribution costs (172.2) (160.9) (255.6) (333.1) (489.6) Administrative expenses (161.2) (149.8) (158.4) (311.1) (299.2) Other expenses (38.6) (209.0) (58.9) (247.6) (86.7) Financial income 28.2 22.8 15.5 51.0 28.8 Financial costs (92.4) (80.1) (46.2) (172.6) (93.2) Share of profit (loss) of associates and joint ventures accounted for using equity 10.1 7.9 24.5 18.0 44.2 method Other income (loss) 0.0 0.0 0.0 0.0 0.0 Exchange rate differences (19.9) (23.7) (2.4) (43.6) (21.4) Income before income tax (73.6) (111.9) 378.8 (185.5) 784.5 Income tax 26.5 57.6 (74.9) 84.1 (151.5) Net income (47.1) (54.3) 303.9 (101.4) 632.9 Profit attributable to parent company (47.2) (54.2) 303.8 (101.3) 632.9 Profit attributable to non-parent company 0.0 (0.1) 0.0 (0.1) 0.0
Table of Contents
2Q 2023 RESULTS Balance Sheet In US$ Million 31-06-2023 31-03-2023 31-06-2022 Cash and cash equivalents 764.6 872.8 901.7 Other financial current assets 27.6 27.6 20.5 Other current non-financial assets 293.8 258.6 210.1 Trade and other receivables-net 818.2 853.1 874.6 Related party receivables 6.7 3.4 6.9 Inventories 1,569.3 1,527.2 1,358.3 Biological assets, current 361.8 349.7 364.0 Tax assets 185.2 193.2 125.1 Non-Current Assets classified as held for sale 0.2 0.2 2.3 Total Current Assets 4,027.4 4,085.8 3,863.5 Other non-current financial assets 115.2 108.5 15.8 Other non-current and non-financial assets 120.7 114.5 92.7 Non-current receivables 87.3 38.5 22.7 Investments accounted through equity method 397.0 385.2 337.6 Intangible assets 68.5 70.7 78.5 Goodwill 56.0 55.2 58.8 Property, plant and equipment 10,092.5 9,917.6 9,595.0 Biological assets, non-current 2,858.5 2,834.8 3,008.6 Deferred tax assets 19.4 11.4 7.9 Total Non-Current Assets 13,815.1 13,536.4 13,217.6 TOTAL ASSETS 17,842.5 17,622.2 17,081.1 Other financial liabilities, current 827.9 761.8 383.7 Trade and other payables 682.5 755.1 713.8 Related party payables 17.8 18.9 3.4 Other provisions, current 7.4 10.1 6.3 Tax liabilities 8.7 18.0 44.3 Current provision for employee benefits 8.5 8.2 5.8 Other non-financial liabilities, current 56.3 349.0 311.6 Total Current Liabilities 1,609.2 1,921.1 1,468.9 Other non-current financial liabilities 6,203.1 5,648.9 5,324.9 Trade and Other payables non-current 28.8 28.6 2.4 Other provisions, non-current 30.7 30.5 30.5 Deferred tax liabilities 1,657.3 1,700.9 1,839.6 Non-current provision for employee benefits 98.6 94.9 66.4 Other non-financial liabilities, non-current 71.6 70.6 78.9 Total Non-Current Liabilities 8,090.1 7,574.6 7,342.8 Non-parent participation 5.6 4.9 7.2 Net equity attributable to parent company 8,137.6 8,121.7 8,262.2 TOTAL LIABILITIES AND EQUITY 17,842.5 17,622.2 17,081.1
Table of Contents
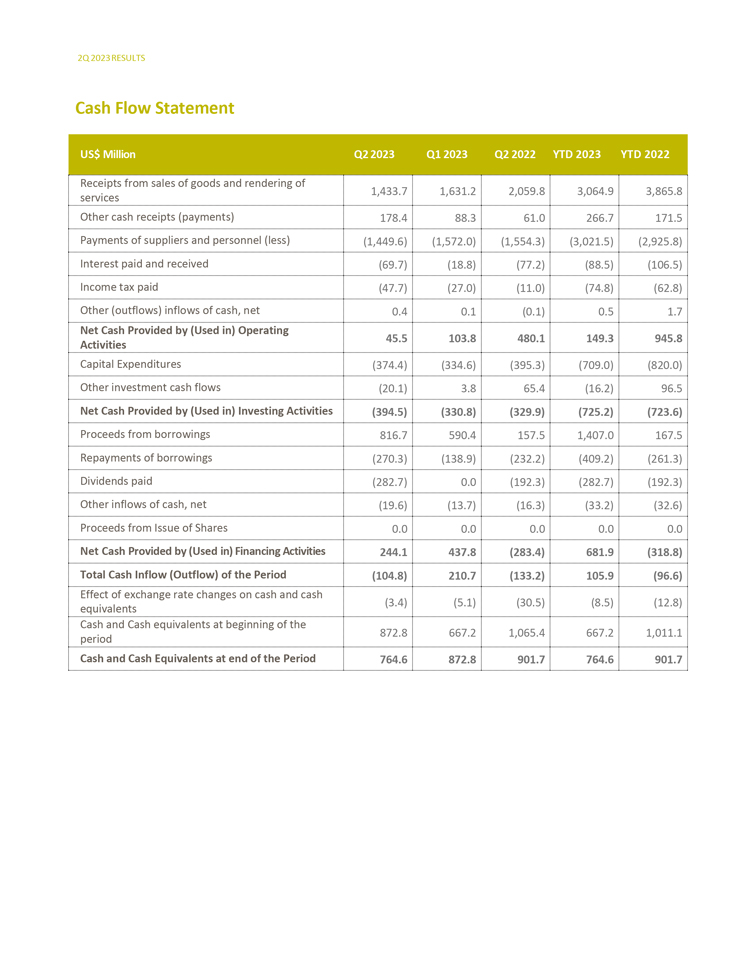
2Q 2023 RESULTS Cash Flow Statement US$ Million Q2 2023 Q1 2023 Q2 2022 YTD 2023 YTD 2022 Receipts from sales of goods and rendering of 1,433.7 1,631.2 2,059.8 3,064.9 3,865.8 services Other cash receipts (payments) 178.4 88.3 61.0 266.7 171.5 Payments of suppliers and personnel (less) (1,449.6) (1,572.0) (1,554.3) (3,021.5) (2,925.8) Interest paid and received (69.7) (18.8) (77.2) (88.5) (106.5) Income tax paid (47.7) (27.0) (11.0) (74.8) (62.8) Other (outflows) inflows of cash, net 0.4 0.1 (0.1) 0.5 1.7 Net Cash Provided by (Used in) Operating 45.5 103.8 480.1 149.3 945.8 Activities Capital Expenditures (374.4) (334.6) (395.3) (709.0) (820.0) Other investment cash flows (20.1) 3.8 65.4 (16.2) 96.5 Net Cash Provided by (Used in) Investing Activities (394.5) (330.8) (329.9) (725.2) (723.6) Proceeds from borrowings 816.7 590.4 157.5 1,407.0 167.5 Repayments of borrowings (270.3) (138.9) (232.2) (409.2) (261.3) Dividends paid (282.7) 0.0 (192.3) (282.7) (192.3) Other inflows of cash, net (19.6) (13.7) (16.3) (33.2) (32.6) Proceeds from Issue of Shares 0.0 0.0 0.0 0.0 0.0 Net Cash Provided by (Used in) Financing Activities 244.1 437.8 (283.4) 681.9 (318.8) Total Cash Inflow (Outflow) of the Period (104.8) 210.7 (133.2) 105.9 (96.6) Effect of exchange rate changes on cash and cash (3.4) (5.1) (30.5) (8.5) (12.8) equivalents Cash and Cash equivalents at beginning of the 872.8 667.2 1,065.4 667.2 1,011.1 period Cash and Cash Equivalents at end of the Period 764.6 872.8 901.7 764.6 901.7
Table of Contents
Signature
Pursuant to the requirements of the Securities Exchange Act of 1934, the registrant has duly caused this report to be signed on its behalf by the undersigned, thereunto duly authorized.
Celulosa Arauco y Constitución S.A. | ||||||
(Registrant) | ||||||
| Date: August 18, 2023 | By: | /s/ Matías Domeyko Cassel | ||||
Name: | Matías Domeyko Cassel | |||||
Title: | Chief Executive Officer | |||||