Exhibit 15.1
This document is an extracted form of the Annual Report and Accounts 2006/07. Certain pages, images and text have been deleted from it. The Annual Report and Accounts is available in full on our website, at www.nationalgrid.com.
NATIONAL GRID PLC
TABLE OF CONTENTS
EXTRACTED FORM OF THE ANNUAL REPORT AND ACCOUNTS 2006/07
| | |
| * | | The Independent Verifier’s Report on Corporate Responsibility on page 76 relates to the corporate responsibility elements of the full Annual Report and Accounts available on our website. |
01Sir John Parker
Chairman
Appointed October 2002, Age 65,
N (ch)
Sir John Parker became Chairman following the merger of National Grid Group plc and Lattice Group plc. He had been Chairman of Lattice Group plc since its demerger from BG Group plc in 2000. He had previously been a Non-executive Director of BG plc from 1997. Sir John’s career has encompassed the engineering, shipbuilding and defence industries. He is Deputy Chairman of Port and Free World Zone (Dubai), a Non-executive Director of Carnival plc and Carnival Corporation, Inc., Senior Non-executive Director of the Court of the Bank of England and Chancellor of the University of Southampton. Once its demerger from Anglo American plc is complete, Sir John will become Joint Non-executive Chairman of the Mondi Group. Sir John is a former Chairman of P&O Group and of RMC Group plc, a former Chairman and Chief Executive of Harland & Wolff plc and Babcock International Group PLC and a former Non-executive Director of Brambles Industries plc, GKN plc and British Coal Corporation. He is a Fellow of the Royal Academy of Engineering.
02Steve Holliday
Chief Executive
Appointed March 2001, Age 50,
E (ch), F
Steve Holliday joined National Grid Group plc as Group Director, UK and Europe in March 2001. Immediately following the merger of National Grid Group plc and Lattice Group plc in October 2002, he was responsible for the electricity and gas transmission businesses. He was appointed as Group Director responsible for UK Gas Distribution and Business Services in April 2003. Steve was appointed Chief Executive on 1 January 2007, having been Deputy Chief Executive from 1 April 2006. He was formerly an Executive Director of British Borneo Oil and Gas. Previously, he spent 19 years with the Exxon Group, where he held senior positions in the international gas business and managed major operational areas such as refining and shipping. Steve’s international experience includes a four year spell in the US. He has also developed business opportunities in countries as diverse as China, Australia, Japan, Brazil and the former Soviet Union. He is a Non-executive Director of Marks and Spencer Group plc.
| | | |
| Committee membership |
A | | Audit |
E | | Executive |
F | | Finance |
N | | Nominations |
R | | Remuneration |
R&R | | Risk & Responsibility |
(ch) | | denotes Committee chairman |
Annual Report and Accounts 2006/0719
03Steve Lucas
Finance Director
Appointed October 2002, Age 53,
E, F
Steve Lucas has been Finance Director since his appointment and is additionally responsible for UK and US Shared Services. He joined the Board following the merger of National Grid Group plc and Lattice Group plc in October 2002. Steve had previously been Executive Director, Finance of Lattice Group plc since its demerger from BG Group plc in 2000. Previously, he was Treasurer of BG Group plc having joined British Gas plc in 1994. Prior to this he was with Shell International Petroleum Company for 11 years, occupying a number of finance management positions and treasury roles, including seven years in Africa and the Far East. Steve is also a Non-executive Director of Compass Group PLC. He is a chartered accountant.
04Nick Winser
Executive Director
Appointed April 2003, Age 46,
E
Nick Winser joined the Board in April 2003 as Executive Director responsible for transmission. He was previously Chief Operating Officer of the US transmission business for National Grid Transco plc. He joined National Grid Company plc in 1993, becoming Director of Engineering in 2001. Prior to this, he had been with Powergen since 1991 as principal negotiator on commercial matters, having joined the Central Electricity Generating Board in 1983 where he served in a variety of technical engineering roles.
05Mark Fairbairn
Executive Director
Appointed January 2007, Age 48,
E
Mark Fairbairn was appointed to the Board in January 2007 as Executive Director with responsibility for Gas Distribution. He joined National Grid in 1989 from BNFL. He was awarded an OBE in 2001 for his services to the electrical industry in respect of his leadership of the fundamental changes implemented for the introduction of the New Electricity Trading Arrangements. Previously Chief Operating Officer of the UK gas distribution business, he has played a key role in helping to restructure the UK gas distribution market through the gas networks sales and the creation of National Grid’s new gas distribution business.
06Edward Astle
Executive Director
Appointed September 2001, Age 53,
E
Edward Astle joined the Board as Group Director, Telecommunications in September 2001 and is now Executive Director responsible for Non-regulated Businesses and leads Business Development. He was Managing Director of BICC Communications from 1997 to 1999, and between 1989 and 1997 he held a variety of positions with Cable & Wireless. He was Regional Director Europe, CEO of its global networks and marine divisions, and in 1995 joined the Cable & Wireless board as Executive Director Global Businesses.
07Ken Harvey
Non-executive Director and
Senior Independent Director
Appointed October 2002, Age 66,
N, R, R&R
Ken Harvey joined the Board following the merger of National Grid Group plc and Lattice Group plc, having been appointed to the Lattice Group plc board in September 2000. He was appointed Senior Independent Director in October 2004. He is Chairman of Pennon Group plc. A chartered engineer, Ken is a former Chairman and Chief Executive of Norweb plc, and a former Chairman of Comax Holdings Ltd, The Intercare Group plc and Beaufort International Group plc.
08Linda Adamany
Non-executive Director
Appointed November 2006, Age 55,
A, R&R
Linda Adamany joined the Board in November 2006. She is Group Vice President, Commercial Directorate and Business Support of BP Refining and Marketing. Linda has over 25 years experience in the energy sector, having held various roles for BP in the UK and US, including Chief Executive of BP Shipping and Senior Vice-President of Commercial Development. She is a certified public accountant.
09John Allan
Non-executive Director
Appointed May 2005, Age 58,
A, R (ch)
John Allan was appointed to the Board in May 2005. He is a member of the Management Board of Deutsche Post, having been appointed following its acquisition of Exel plc in December 2005 where he had been Chief Executive since September 1994. John started his career in marketing at Lever Brothers, moving to Bristol-Myers Company Limited and then Fine Fare Limited. He joined BET plc in 1985 and was appointed to the board in 1987. He is a member of the CBI’s President’s Committee, the International Advisory Council of the Singapore Economic Development Board and the University of Edinburgh Campaign Board. John was previously a Non-executive Director of PHS Group plc, Wolseley plc, Hamleys plc and Connell plc. He is a Non-executive Director of Samsonite Corporation.
10Paul Joskow
Non-executive Director
Appointed March 2000, Age 59,
F (ch), N
Paul Joskow was appointed to the Board in March 2000 following the acquisition of New England Electric System (NEES). He served as a Director of NEES between 1987 and its acquisition. He is a Professor of Economics and Management at the Massachusetts Institute of Technology (MIT), the Director of the MIT Center for Energy and Environmental Policy Research, a Research Associate of the US National Bureau of Economic Research and a Fellow of the Econometric Society and of the American Academy of Arts and Sciences. Paul is also an independent Trustee of the Putnam Mutual Funds and an independent Non-executive Director of TransCanada Corporation.
11Stephen Pettit
Non-executive Director
Appointed October 2002, Age 56,
F, R, R&R (ch)
Stephen Pettit was appointed to the Board following the merger of National Grid Group plc and Lattice Group plc, having been appointed to the Lattice Group plc board in 2001. He is a Non-executive Director of National Air Traffic Services, Halma plc and is Chairman of ROK plc. Stephen is also a member of BT plc’s Equality of Access Board. He is a former Executive Director of Cable & Wireless plc. Before joining Cable & Wireless, he was Chief Executive, Petrochemicals at British Petroleum. Stephen was previously a Non-executive Director of KBC Advanced Technologies plc and Norwood Systems Limited.
12Maria Richter
Non-executive Director
Appointed October 2003, Age 52,
A, F, R&R
Maria Richter was appointed to the Board in October 2003. Maria worked for Morgan Stanley between 1993 and 2002, most recently as Managing Director of its Corporate Finance Retail Group. Prior to this, she was Managing Director of Investment Banking in the Southern Cone of Latin America, and Executive Director and Head of Independent Power and Structured Finance Business. Previous appointments include Vice President of Independent Power Group for Salomon Brothers, and Vice President of Prudential Capital Corporation and Power Funding Associates. Maria is a Director of Pro Mujer International, an international microfinance organisation, The Pantry, Inc. and The Vitec Group plc. She was, until April 2006, a Director of the Western Electricity Co-ordinating Council.
13George Rose
Non-executive Director
Appointed October 2002, Age 55,
A (ch), N, R
George Rose was appointed to the Board following the merger of National Grid Group plc and Lattice Group plc, having been appointed to the Lattice Group plc board in September 2000. He has been Finance Director of BAE Systems plc (formerly British Aerospace plc) since 1998, having joined the company in 1992. He is a Non-executive Director of SAAB AB and a member of the Financial Reporting Review Panel. George is also a former Non-executive Director of Orange plc.
14Helen Mahy
Company Secretary
and General Counsel
Appointed October 2002, Age 46,
E
Helen Mahy was appointed Company Secretary following the merger of National Grid Group plc and Lattice Group plc, having been Company Secretary at Lattice Group plc since March 2002. She was additionally appointed General Counsel from October 2003. Previously, she was Group General Counsel and Company Secretary at Babcock International Group PLC. Helen was appointed a Non-executive Director of Aga Foodservice Group plc in March 2003. She is a barrister, an Associate of the Chartered Insurance Institute, member of the Bar Council and chair of the GC100 group.
20National Grid plc
Operating and Financial Review
This Operating and Financial Review describes the main trends and factors underlying our development, performance and position during the year ended 31 March 2007 as well as those likely to affect our future development, performance and position. It has been prepared in line with the guidance provided in the Reporting Statement on the Operating and Financial Review issued by the UK Accounting Standards Board in January 2006.
About National Grid
Principal operations
Our principal operations are the ownership and operation of regulated electricity and gas infrastructure networks in the UK and the US. We also have interests in related markets, including electricity interconnectors, metering services, liquefied natural gas (LNG) facilities and property in the UK.
History
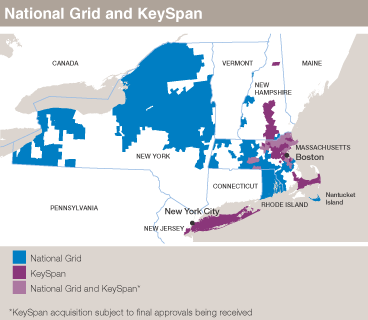
National Grid originated from the restructurings of the UK gas industry in 1986 and the UK electricity industry in 1990. We entered the US electricity delivery market in 2000 in New England and expanded into upstate New York in 2002. We substantially increased our UK wireless infrastructure activities in 2004. In 2005, following the sales of four UK regional gas distribution networks, we adopted National Grid as a single name for all our principal businesses. In 2006, we acquired from Southern Union Company its gas distribution network in Rhode Island and announced the proposed acquisition of KeySpan, expanding our interests in the US. In April 2007 we completed the sale of our UK wireless infrastructure business and agreed to the sale of our US wireless infrastructure operations, with completion expected later in 2007. We also remain committed to the sale of the Basslink electricity interconnector in Australia, in line with our strategy to focus on our core energy infrastructure markets in the UK and the US.
| | | |
| Key milestones |
1986 | | British Gas incorporated as a public limited company. |
| |
1990 | | Electricity transmission network in England and Wales transferred to National Grid on electricity privatisation. |
| |
1995 | | National Grid listed on the London Stock Exchange. |
| |
1997 | | British Gas (BG) demerged Centrica. |
| |
1997 | | National Grid demerged Energis. |
| |
2000 | | Lattice Group demerged from BG and listed separately. |
| |
2000 | | New England Electric System and Eastern Utilities Associates acquired by National Grid. |
| |
2002 | | Niagara Mohawk Power Corporation merged with National Grid’s US operations. |
| |
2002 | | Merger of National Grid and Lattice Group to form National Grid Transco. |
| |
2004 | | Acquisition of UK wireless infrastructure network from Crown Castle International Corp. |
| |
2005 | | Sales of four UK regional gas distribution networks. |
| |
2005 | | Adoption of National Grid as our name. |
| |
2006 | | Agreement to acquire KeySpan. |
| |
2006 | | Acquisition from Southern Union Company of its Rhode Island gas distribution network. |
| |
2006 | | Announcement of new strategy, including our decision to focus on core energy markets in the UK and US. |
| |
2007 | | Sale of UK and US wireless infrastructure operations. |
| |
| | |
| Content of Operating and Financial Review |
| | | |
20 | | About National Grid |
24 | | Current and future developments |
26 | | Objectives and strategy |
30 | | Key performance indicators |
32 | | Performance during the year |
44 | | Transmission |
50 | | Gas Distribution |
56 | | Electricity Distribution |
60 | | Non-regulated Businesses and other |
63 | | Discontinued operations |
64 | | Financial position and financial management |
71 | | Accounting policies |
76 | | Independent verifier’s report on corporate responsibility |
| | | |
| |
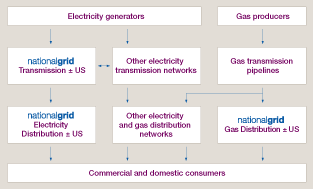
Businesses and segments
The performances of our principal businesses are reported by segment, reflecting the management responsibilities and economic characteristics of each activity. Our principal businesses and segments, together with other activities and discontinued operations, are as follows:
| | | | | |
| Business | | Segment | | Description of principal activities |
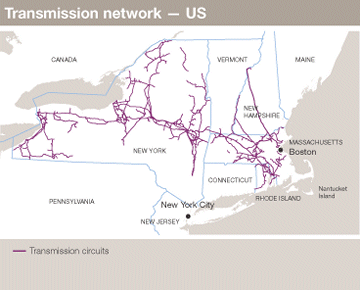
Transmission | | Transmission
– UK | | Owner and operator of the high-voltage electricity transmission network in England and Wales, the gas national transmission system in Great Britain, an electricity interconnector with France and storage facilities for LNG. Operator of the electricity transmission networks in Scotland. |
| | | |
| | | Transmission
– US | | Owner and operator of high-voltage electricity transmission networks in the northeastern US. |
| |
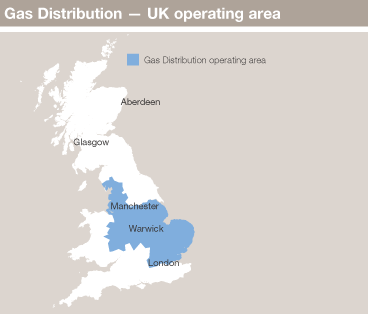
Gas
Distribution | | Gas Distribution
– UK | | The distribution of gas within England as the owner and operator of four of the eight gas distribution networks in Great Britain. |
| | | |
| | | Gas Distribution
– US | | The delivery of gas in upstate New York and Rhode Island. |
| |
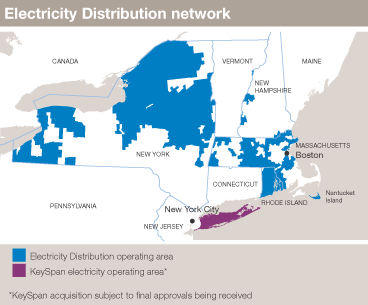
Electricity
Distribution | | Electricity
Distribution
– US | | The delivery of electricity in upstate New York and New England. |
| | | |
| | | US stranded
cost recoveries | | Recovery, through charges to electricity customers in the US, of costs mainly incurred prior to divestiture of electricity generation. |
| |
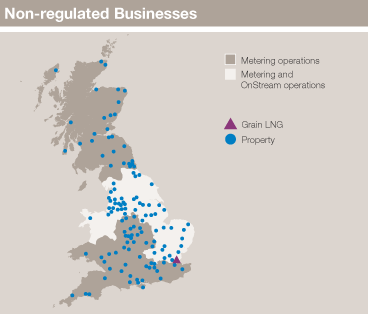
Non-regulated
Businesses | | Other
activities | | Our other activities comprise our non-regulated operations, including metering services, property management and our LNG import terminal in the UK, together with business development and other corporate activities. |
| | | | |
Corporate
activities | | | |
| |
Wireless and Australia | | Discontinued
operations | | Businesses that we committed during the financial year to exit, principally our UK wireless infrastructure operations, sold on 3 April 2007, together with our smaller US wireless infrastructure operations and the Basslink electricity interconnector in Australia. |
| |
Annual Report and Accounts 2006/0721
External market environment
The principal markets in which we operate are the electricity and gas markets in the UK and the northeastern US.
The generation and supply of electricity and gas in the UK and in most states in the northeastern US are competitive in that consumers can contract with different suppliers to obtain the energy they need. Those suppliers are then responsible for sourcing that energy from electricity generators or from gas extractors or importers as appropriate, as well as arranging for that energy to be delivered through physical delivery networks.
These networks, including the ones we operate, are generally monopolies in their local areas as, for the majority of consumers, there are no alternative methods of receiving electricity or gas.
Energy delivery in the UK
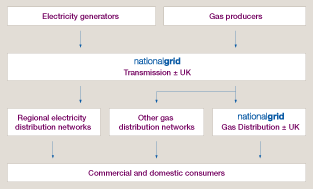
In Great Britain, domestic and commercial consumers contract with energy suppliers who obtain the electricity and gas required from electricity generators and gas shippers respectively. Gas shippers contract with gas producers or importers to deliver gas to network entry points.
In general, energy is transported through electricity or gas transmission networks to regional electricity or gas distribution networks that then deliver energy to consumers on behalf of suppliers. Certain end customers, primarily large industrial users, receive electricity or gas direct from the relevant transmission network.
We are the owner and operator of the electricity transmission network in England and Wales, operator (but not owner) of the two electricity transmission networks in Scotland and owner and operator of the gas national transmission system and of four of the eight regional gas distribution networks in Great Britain.
The other principal infrastructure owners and operators in the UK are EDF, which owns three electricity distribution networks, Scottish & Southern Energy, Scottish Power, Western Power Distribution and CE Electric UK, each of which own two electricity distribution networks and United Utilities which owns one electricity distribution network. Scottish & Southern Energy and Scottish Power also each own an electricity transmission network in Scotland, which we operate in both cases. The gas distribution networks in Scotland and southern England are owned by Scotia Gas Networks, in the north of England by Northern Gas Networks and in Wales and the west of England by Wales & West Utilities. Viridian is responsible for the transmission and distribution of electricity in Northern Ireland.
Energy delivery in the northeastern US
In most states in the northeastern US, consumers are able to purchase their energy through independent energy suppliers, but the majority of consumers still purchase electricity or gas from their local electricity or gas distribution network business. The major alternative fuel source is oil, which is used by many consumers for domestic heating purposes.
Electricity is transported either direct from generators into local electricity distribution networks or via electricity transmission networks, while gas is obtained from import terminals or interstate pipelines and then transported through local gas distribution networks. Certain end customers, primarily large industrial users, receive electricity or gas direct from the electricity transmission networks or inter-state pipelines. Electricity transmission and distribution networks, including the ones we own, are members of the regional transmission operators or independent system operators that have the responsibility for balancing electricity supply with demand and for the reliability of the regional transmission network. Gas distribution networks, including our New York and Rhode Island gas distribution networks, are each responsible for balancing gas supply with demand in their distribution area.
Our US electricity and gas distribution businesses promote competition by encouraging customers to purchase their energy from independent suppliers. Where this occurs, we deliver that energy to consumers on behalf of those suppliers. For the majority of consumers in our operating areas who continue to purchase their energy from us, we source energy from electricity generators or gas suppliers on behalf of our customers in accordance with regulatory approved arrangements. We charge customers for that commodity in addition to delivery or other cost pass-through charges; however, we do not charge a margin on the electricity and gas itself.
There are more than 25 companies and organisations that own or operate energy delivery infrastructure in the northeastern US, including Consolidated Edison, Dominion and Northeast Utilities, in addition to National Grid and KeySpan.
Other markets in which we operate
Our other businesses, with the exception of discontinued operations, primarily operate in energy related markets in the UK or are directly connected to our regulated businesses described above. Although there is now a competitive market for metering services in the UK, in which we participate, we are also the owner of a legacy portfolio of gas meters comprising the majority of the gas meters in operation in the UK.
22National Grid plc
Regulation
As a result of our position in, and importance to, the economies we serve, our electricity and gas transmission and distribution businesses are subject to UK, European Union and US federal and state laws and regulations.
In the UK, energy networks are regulated by the Office of Gas and Electricity Markets (Ofgem). Ofgem operates under the direction and governance of the Gas and Electricity Markets Authority and has established price control mechanisms that restrict the amount of revenue that can be earned by regulated businesses, typically covering five year price control periods.
In the US, public utilities are regulated by the Federal Energy Regulatory Commission (FERC) and by utility commissions in the states in which we operate, comprising the New York Public Service Commission, the Massachusetts Department of Public Utilities, the Rhode Island Public Utilities Commission and the New Hampshire Public Utilities Commission. These US regulators set service standards and determine allowable levels of return. FERC also regulates public utility mergers and acquisitions and public utility holding companies, although prior to 8 August 2005 public utility holding companies were regulated by the US Securities and Exchange Commission.
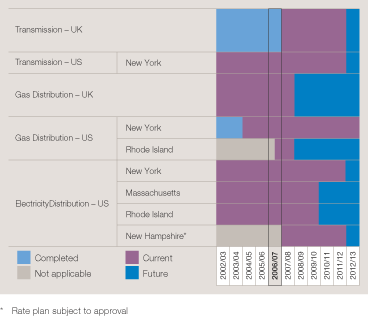
Our principal rate plans and price controls can be summarised as follows:
| | | |
| Country | | Overview |
UK | | We have two price controls for each of our UK electricity and gas transmission operations, one in our role as transmission owner and the other as the system operator. For our UK gas distribution operations, we have four price controls, one for each of our four regional gas distribution networks. |
| | | |
| | | These price controls are based around incentives. We have a financial incentive to invest, receiving a return on efficiently incurred capital expenditure which increases our regulatory asset base, and we can gain or lose through incentive arrangements for our performance in managing system operation, internal costs, pass-through costs and service quality. |
| |
US | | We have electricity rate plans in New York, Massachusetts and Rhode Island covering our electricity distribution networks and, in the case of New York, our electricity transmission network. Our rates in New Hampshire and those for our electricity transmission networks in New England are subject to regulatory approval. |
| | | |
| | | We have two gas rate plans covering our gas distribution networks in New York and Rhode Island respectively. |
| | | |
| | | Our rate plans are based around the efficiency of our cost base, with earned savings mechanisms that allow us to retain a proportion of the savings we achieve with the balance benefiting customers. We receive a return on approved capital expenditure and we can gain or lose through incentive or penalty arrangements based on our performance against reliability and service quality benchmarks. |
| | | |
| | | We are also permitted to recover commodity and other pass-through costs which we incur, together with the recovery of stranded costs. |
| |
The periods of our current and future price controls and rate plans can be summarised as follows:
Our businesses are subject to safety legislation in the UK and the US, which is enforced by the Health and Safety Executive (HSE) in the UK and by federal safety bodies and by state and local authorities in the US. Our UK gas operations work under a permissioning regime, whereby our organisation, processes and procedures are documented in safety cases that are subject to acceptance by the HSE.
Our shares are listed on the London Stock Exchange, and we also have a listing on the New York Stock Exchange. As a consequence, we are regulated by the Financial Services Authority in the UK and by the US Securities and Exchange Commission.
More information about the regulatory environments in which we operate, and on the nature of our rate plans and price controls, is provided in the business discussions on pages 44 to 63.
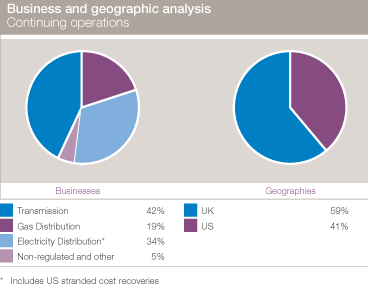
Business and geographic analysis
Our ongoing operations are organised in lines of business and are based in different geographies as follows:
The above charts are based on operating profit from continuing operations for the year ended 31 March 2007.
Annual Report and Accounts 2006/0723
Business drivers
Our principal activities include the operation of highly complex energy infrastructure networks. As a consequence, there are many factors that influence the financial returns we obtain. We consider the following to be our main business drivers:
| | | |
Price controls and rate plans | | The prices we charge for use of our electricity and gas transmission and distribution networks are determined in accordance with regulator approved price controls in the UK and rate plans in the US. |
| | | |
| | | The negotiation of these arrangements has a significant impact on the revenues we obtain from our operations. |
| | | |
| | | In addition, these arrangements include incentives that permit us to earn additional revenues based on our performance or penalise us if we do not meet agreed performance targets. |
| | | |
| | | The period of these arrangements is significant to us in that they provide stability to our operations and allow us to plan ahead and invest in the confidence that we will obtain financial returns. In the UK, our price controls typically cover periods of 5 years, while in the US our electricity and gas rate plans range from periods of 3 to 10 years. |
| |
Multi-year
contractual
arrangements | | Revenues in our other businesses, including metering services, our LNG import terminal and the Basslink interconnector in Australia (and in our wireless infrastructure operations in the UK prior to their disposal) are determined by contractual arrangements, which are usually long-term and with ‘blue chip’ customers. |
| |
Safety and reliability | | Our ability to operate safely and reliably is of paramount importance to us, our employees, our contractors, our customers, the public and our regulators. Our financial performance is affected by our performance in these areas. |
| |
Efficiency | | Our objective, and that of our regulators, is for us to deliver services as efficiently as possible. This allows us to limit price increases or to reduce prices to our customers and improve our own financial performance to the benefit of our shareholders. |
| |
Capital
investment | | Capital investment is a significant driver for organic growth. |
| | | |
| | | In our regulated energy networks, the prices we charge include an allowed return for capital investment determined in accordance with our price controls and rate plans. These provide incentives for us to enhance the quality and reach of our networks through capital improvements. |
| | | |
| | | For other businesses, our capital investment in new assets allows us to develop new revenue streams or to increase revenues from existing assets. |
| |
Acquisitions and disposals | | Investment in new businesses is also a significant driver of growth, provided that we can create value through operational improvements, synergies and financial benefits. |
| | | |
| | | Disposals can crystallise value for shareholders, where we believe that the price on offer is better than the long-term return we can obtain ourselves or where a business does not fit with our long-term strategy. |
| |
Relationships and responsibility | | Our reputation is vitally important to us. Delivering sustainable value depends on the trust and confidence of our stakeholders and this can only be earned by conducting our business in a responsible manner. |
| |
A number of other factors also affect our financial performance but are either less significant than the principal business drivers above, or are mitigated by the way our operations are structured:
| | | |
Weather and volumes | | Changes in the quantities of electricity and gas delivered through our transmission and distribution networks may result in an increase or decrease in our revenues. Volumes are affected by weather, consumer demand and network availability as well as other factors. |
| | | |
| | | The impact of changing volumes may sometimes be offset by changes in costs or may sometimes result in an under- or over-recovery against our allowable revenues, with a corresponding increase or decrease in revenues in future periods. |
| |
Exchange
rates | | The reported results, cash flows and financial position of our US operations are affected by movements in the US dollar to sterling exchange rate. However, the effect of these movements is partially hedged through the use of US dollar denominated debt and derivative financial instruments. |
| |
Commodity and other
pass-through costs | | We are allowed to recover certain costs, including commodity costs in the US and other direct costs in both the UK and the US, through charges to customers. The timing of recovery of these costs can vary between financial periods leading to an under- or over-recovery within any particular financial period. We are affected by movements in commodity prices to the extent that they affect our own energy requirements, the most significant of which relates to gas purchases required for the operation of our gas transmission and gas distribution networks in the UK. |
| | | |
| | | Certain US commodity contracts are recorded in our balance sheet at their fair values and are affected by movements in commodity prices. Although remeasurements of the fair values of these contracts are reflected in our income statement, we expect to recover the net costs incurred under these contracts from customers in current or future periods. |
| |
Inflation | | Without action to improve efficiency, our operating costs increase each year as a result of wage increases and inflation in external costs. In general, our revenues also increase each year, although not necessarily at the same rate, depending on our regulatory or contractual arrangements. As a consequence, our ability to control costs and improve efficiency is important to our ability to increase operating profits. |
| | | |
| | | Our price controls in the UK are linked to retail price inflation, as is a proportion of our UK borrowings, while our electricity regulatory settlements in the US allow us to recover additional distribution revenues from customers if there is a significant change in the rate of inflation. |
| |
Seasonality | | Revenues from our gas distribution networks in the UK and the US and our gas transmission network in the UK are weighted towards the end of the financial year, as gas demand is typically higher during the winter months. Otherwise, seasonality does not have a significant impact on revenues. |
| | | |
| | | With the exception of commodity and other volume related costs passed through to customers, our operating costs are generally not seasonal. |
| |
Interest rates | | The costs of financing our operations are affected by changes in prevailing interest rates, as some of our debt is at floating rates. We hedge some of our exposure to interest rates with fixed-rate debt and derivative financial instruments to maintain a proportion of our debt at fixed interest rates. |
| |
24National Grid plc
Current and future
developments
External market developments
Market structure and ownership
There have been no significant changes in the structure of the UK energy infrastructure market since 2005, when we sold four of our regional gas distribution networks to other operators. The most significant change in ownership is the takeover of Scottish Power (owner of one of the Scottish transmission networks that we operate) by Iberdrola, a Spanish utility, which completed on 23 April 2007.
In the northeastern US, there have been no significant structural changes, while the most significant ownership changes have been our acquisition of the gas distribution network in Rhode Island and our proposed acquisition of KeySpan.
Energy market developments
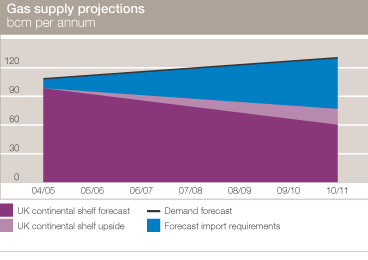
Both the UK and US are in a period of changing energy supply patterns, as more reliance is placed on imported gas and on new sources of electricity generation, including renewables. In the UK, the decline in UK continental shelf gas reserves means we continue to see a trend toward greater use of imported gas for both consumption and use in power generation. In the US, there is an increase in the reliance on imported gas and significant interest in the development of renewable power generation.
These changes are expected to impact on our electricity and gas transmission networks, our gas distribution networks and, to a lesser extent, our electricity distribution networks. In particular, significant investment is planned in our UK electricity and gas transmission networks and gas distribution networks to link new power plants and gas import facilities with domestic, business and industrial consumers. In the US, renewable power developments will require increasing investment in our US electricity transmission and distribution networks.
As a consequence of the decline in gas production from the UK continental shelf, our latest forecast is that the UK will import around 50% of its gas requirements by the end of the decade.
Activity to increase the UK’s import capability has involved the development of new import infrastructure by National Grid and other market participants. During the year, a number of significant infrastructure projects were commissioned, including the Langeled pipeline from Norway connecting at Easington, providing annual capacity of 25 billion cubic metres (bcm) of gas, enhancements to the Belgian interconnector increasing annual import capacity from approximately 17.5 to 25 bcm and the BBL pipeline at 15 bcm capacity linking the UK market at Bacton with the Netherlands. In addition, Excelerate Energy commissioned its 4 bcm peak capability import liquefied natural gas (LNG) facility at Teesside, using onboard ship re-gasification technology, and we are currently building a large pipeline through South Wales to connect new LNG import facilities at Milford Haven. We continue to invest in expanding our own LNG import facility on the Isle of Grain.
Following development of the UK gas daily summary report during winter 2005/06, it became clear how important the delivery of key information was to the operation of the market. For winter 2006/07, we worked with Ofgem and the industry to enhance the quality of information that is available to the market to further promote industry participant response to the gas supply/demand position. Of particular note is the introduction of the quality of information incentives which have been placed on National Grid to improve the timeliness and accuracy of the information being made available to the market, and the introduction of longer term demand forecasts.
In the US, a key industry development of the last 12 months has been a growing opinion among regulators and policymakers at the state and federal level that the industry must be more responsive to greenhouse gas concerns. The District of Columbia and 23 of the 50 states have established renewable portfolio standards for electricity supply procurement, some of which range as high as 30%. As a result there has been greater interest in renewable energy development which has seen an increase in the amount of wind resources connecting to the electricity transmission system. As wind power and other forms of renewable supply are often found in remote areas, greater reliance on such resources will act to increase the distance between generation and major metropolitan load areas, providing further support to an already growing national consensus that additional investment in the US transmission system is needed to meet the energy challenges of tomorrow.
Despite criticism for being too costly, currently established US regional transmission organisations are likely to remain in operation for the foreseeable future due to support of regulators and stakeholders in the regions where they have been established, including the northeastern US. However, it is unlikely that regional transmission organisations will proliferate given strong resistance to them in many places in the western and the southern US. Some vertically integrated utilities in these regions have instead contracted with independent coordinators of transmission to address concerns of regulators seeking greater degrees of transmission independence, while avoiding the changes in jurisdiction from the state to federal level associated with regional transmission membership. In areas without regional transmission organisations, utilities continue to plan their infrastructure needs principally on an individual basis within each state, presenting challenges to inter-state projects in such areas.
Annual Report and Accounts 2006/0725
Regulatory developments
UK and European regulatory developments
During the year ended 31 March 2007, there were no significant changes in the legislative and regulatory framework in the UK.
In January 2007, the European Commission published its final report on its energy sector competition inquiry, concluding that further action is required to improve energy markets in the European Union. It focused on problems from high levels of market concentration as well as vertical integration of supply, generation and infrastructure leading to a lack of equal access to, and sufficient investment in, infrastructure. The report also called for improvements in the regulatory framework to remove gaps in regulation, address concerns with market concentration and increase transparency in market operations.
US regulatory developments
The principal regulatory development in 2006/07 in the US was the implementation of the Energy Policy Act of 2005, which reaffirmed a commitment to competition in wholesale power markets as national policy, strengthened the regulatory powers of the Federal Energy Regulatory Commission (FERC) and provided for development of a stronger energy infrastructure. As part of these changes the Federal Power Act of 1935, the Natural Gas Act of 1938 and the Public Utility Regulatory Policies Act of 1978 were modified, and the Public Utility Holding Company Act of 1935 was repealed and replaced by the Public Utility Holding Company Act of 2005.
Significant new or expanded responsibilities for FERC include: oversight of the reliability of the nation’s electricity transmission grid; the authority to levy larger penalties to prevent market manipulation; the establishment of rules governing transmission rate incentives; the approval of the construction of transmission infrastructure in designated national interest electricity transmission corridors; and the review of certain holding company mergers and acquisitions involving utilities.
FERC has also established, through the certification of the North American Electric Reliability Council as an electric reliability organisation, a process for the establishment, approval and enforcement of mandatory electric reliability standards (including financial penalties), replacing the previous voluntary US national electric reliability standards and supplementing electric reliability standards enforced by state regulators.
The independent system operator for New England has applied to become a regional transmission organisation. As a consequence, we have applied to FERC for an increased rate of return on our investment in transmission assets in our New England operations.
We have also been pursuing a regional planning process with the New York independent system operator to identify regional transmission needs. Progress has been made and the New York independent system operator, which is in the first year of its reliability planning process, has identified reliability needs and is evaluating both regulated and market solutions to meet those needs.
Price controls and rate plans
The previous price control arrangements for our electricity and gas transmission businesses in the UK ceased on 31 March 2007 and have been replaced by new price controls covering the period from 1 April 2007 to 31 March 2012.
We have accepted Ofgem’s final proposals in respect of the price controls covering our role as owner of electricity and gas transmission networks. The key elements of these proposals are a 4.4% post-tax real rate of return on our regulatory asset value, a £4.4 billion baseline five year capital expenditure allowance and a £1.2 billion five year operating expenditure allowance. Since our acceptance in principle of the final proposals, we have been working closely with Ofgem to agree the necessary licence amendments. This process should be completed during the first half of 2007. We have also accepted Ofgem’s final proposals for the system operator schemes to apply for one year from 1 April 2007 for both gas and electricity transmission.
The current price controls for our UK gas distribution networks were extended for one year until 31 March 2008. We are currently in discussions with Ofgem on the next five year price control for the period from 1 April 2008 to 31 March 2013.
In the US, we have reached an agreement for a five year rate plan for our electricity distribution operations in New Hampshire as described on page 57, subject to the approval of the New Hampshire Public Utilities Commission.
Legal and related matters
Metering competition investigation
In June 2005, Ofgem announced that it was going to investigate certain aspects of the domestic gas metering business under the Competition Act 1998 and information requested as part of this investigation has been provided to Ofgem. No findings have been issued with respect to this investigation. However, a supplemental statement of objections was issued by Ofgem in April 2007 to which we will respond shortly.
Environmental remediation
In last year’s Annual Report and Accounts we noted that we, together with the Environment Agency, had sought judicial review to clarify the legal position with regard to the remediation of a site in Bawtry, Yorkshire, a former gas site that was not part of the assets that formed part of the gas privatisation in 1986 and therefore has never been owned by National Grid. On 17 May 2006, the High Court found in favour of the Environment Agency. However, the judgement concluded that the matters raised in the proceedings were of considerable general importance and permission to apply for leave to appeal directly to the House of Lords was granted.
A hearing before the House of Lords has been set for 21 and 22 May 2007 and a judgement is expected in the summer of 2007.
As described in note 35 (g) to the accounts on page 152, we remain convinced of our case that National Grid has no legal liability with respect to the site in Bawtry, nor for other former UK gas sites which did not form part of the assets we acquired at the time of privatisation, and we believe that our position will be upheld by the House of Lords.
26National Grid plc
Strategic review
We have undertaken a thorough and disciplined strategic review of our business, which will set our direction for the next 5 to 10 years. In conducting this review we considered market trends and opportunities that exist in the utility sector, our market position, how we derive value from our businesses and the views of the capital markets. We announced our conclusions in November 2006 and we have updated our objectives accordingly.
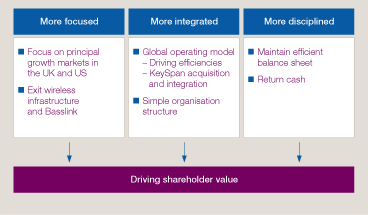
Focus
Our future is about becoming more focused – a clear business model based on the ownership and operation of large scale asset intensive businesses, focusing on our principal growth markets of electricity and gas infrastructure in the UK and US. This includes being flexible in considering ownership of generation assets where they are already part of a business and where they fit our risk profile, with limited exposure to commodity price fluctuations. A consequence of this focus was the decision to exit our wireless infrastructure operations and our Basslink interconnector in Australia.
Integration
We aim to run our businesses in a more integrated way – organising our activities along lines of business, supported by effective and efficient shared services and information systems. This involves deploying proven processes, common systems and best practices within each business, supported by common operating principles and safety and environmental standards. In this way we will maximise the competitive advantages that come from being an international organisation. However, it is critical that we balance this with the need to provide excellent service to customers and to maintain and build local relationships with other key stakeholders.
Discipline
We plan to be more disciplined in the application of best practice. Increasingly we will standardise our approach, applying even greater rigour to financial discipline, ensuring that we have the capital to grow, but maintaining the investor confidence that comes from a disciplined approach to our balance sheet. We maintain our target of increasing dividends per ordinary share expressed in sterling by 7% each financial year through to March 2008. In addition, we have announced plans to return $1.9 billion (£1 billion) to shareholders through a share buy-back programme with respect to US stranded cost recoveries (of which we have returned £169 million in 2006/07), together with £1.8 billion from the disposal of our wireless infrastructure operations.
Objectives
Our primary objective is to grow our businesses in order to create value for our shareholders. We can only create value if we achieve operational excellence and continue to improve our financial performance, we invest for future growth and are financially disciplined and we develop, recruit and retain skilled, talented and motivated people. In each area we aim to increase our focus, benefit from improved integration and be disciplined in our approach. As a consequence, we have identified specific objectives in the following areas:
| | | |
Performance | | We aim for operational excellence by performing to the highest standards of safety, reliability and efficiency. We aim to continue to improve our financial performance. |
| |
Growth | | We will invest in our existing businesses, and in acquiring new businesses in our core markets, to generate future growth. We will be financially disciplined in the way we invest and in the way we manage our balance sheet. |
| |
Talent | | We aim to maximise the contribution made by our employees by motivating our people to strive for continued improvement, developing their skills and talents and by promoting a culture that recognises and respects inclusion and diversity. |
| |
Our strategy is underpinned by our commitments to developing strong and valued relationships with our customers, regulators, suppliers and the communities in which we operate and to acting responsibly, including specific commitments to reducing our environmental impact and to corporate governance and business ethics.
| | | |
Relationships | | We aim to improve our relationships with customers, regulators, suppliers and the communities in which we operate by focusing on the areas that are important to them, such as the quality of service we provide to customers, the quality of information we provide to regulators, by investing in local communities and by the way we address the concerns of, and interact with, all our stakeholders. |
| |
Responsibility | | We believe operating responsibly is essential to the way we conduct our operations, invest, develop our people and manage our relationships and so responsibility underpins everything we do. |
| | | |
| | | We are committed to taking positive action to reduce our contribution to climate change and our other impacts on the environment. We want to operate to the highest standards of corporate governance and we believe in strong business ethics, based around our core values of respect, integrity and ownership. |
| |
Annual Report and Accounts 2006/0727
Risk
Our principal risks relate to the achievement of our objectives and strategy, as we believe that by delivering on these objectives we will achieve our primary objective of delivering growth to drive shareholder value. We set out how we intend to achieve our objectives below and we describe our performance during the year against our objectives on pages 30 to 43.
In considering the opportunities we have to grow and develop our business, we have identified a number of risks and uncertainties in achieving our objectives. The most significant risk factors we have identified relate to:
| n | | changes in laws or regulations; |
| |
| n | | breaches in environmental or health and safety law or regulations; |
| |
| n | | network failure or inability to carry out critical non-network operations; |
| |
| n | | achievement of business performance objectives, including regulatory targets and delivering anticipated cost and efficiency savings; |
| |
| n | | business development activity, including acquisitions and disposals; |
| |
| n | | regulatory treatment of commodity costs passed through to consumers; |
| |
| n | | reputation damage from disruptions to supply, even if outside our control; |
| |
| n | | fluctuations in exchange rates, interest rates and commodity prices and their impact on borrowings, derivatives and commodity contracts; |
| |
| n | | increases in interest rates; |
| |
| n | | restrictions in borrowings and changes in credit ratings or in tax rates; |
| |
| n | | future funding requirements of our pension schemes; and |
| |
| n | | changes in accounting standards. |
These are described in more detail within Corporate Governance on pages 84 and 85.
Shareholder value
By achieving our objectives around performance, growth, talent, relationships and responsibility, we aim to deliver sustainable growth to create value for our shareholders. Our primary measure of how we have created shareholder value is total shareholder return.
The following pages set out some of the specific objectives we have set ourselves in these areas in order to support our overall goals. Our objectives are set in the context of our strategy of increasing our focus, seeking to benefit from improved integration and being disciplined in our approach.
Performance
Our aim is for operational excellence, performing to the highest standards of safety, reliability and efficiency and continuing to improve our financial performance:
| | | |
Safety | | Safety is paramount. |
| | | |
| | | Our most important goals are: to ensure that members of the public are not injured as a direct result of our operations; to deliver a working environment where there are zero work-related injuries or illnesses; to reduce gas leaks on our distribution networks; and to improve the health of our employees so they are fit for work every day. |
| | | |
| | | Measures we use to monitor our performance against our safety objectives include: members of the public injured as a direct result of our operations; employee lost time injury frequency rate; standards of service for responding to gas escapes; kilometres of gas distribution mains replaced in the UK; and employee sickness absence rate. |
| |
Reliability | | Our principal operations are critical to the functioning of the economies we serve. The reliability of our energy networks, and the delivery of energy to our customers, are therefore our next highest priorities after safety. |
| | | |
| | | Our approach to maintaining and improving reliability involves: investing in infrastructure and systems to provide the operational tools and techniques necessary to manage our assets and operations to high standards and investing in the renewal of assets; investing in the skills and capabilities of our people to give them the ability to operate our networks to a high degree of service excellence; and maintaining a constant focus on reliability as one of our principal objectives, ensuring we are proactive about planning to ensure reliability and that we react quickly to factors that could compromise reliability. |
| | | |
| | | We use business-specific reliability performance indicators to measure our reliability performance. |
| |
Efficiency | | By improving efficiency, we can constrain the cost of our operations borne by customers and improve returns to shareholders. We review our operations continually to identify opportunities to improve the operational productivity of our assets and our people, and to identify areas in which we can reduce costs or restrict cost increases. Planning ahead is essential in our approach to maintaining and improving efficiency. |
| | | |
| | | Our primary method of measuring improvements in efficiency is through our financial performance as described below. |
| |
Financial
performance | | If we achieve our objectives we should be able to deliver continued improvements in financial performance, so that we deliver on our commitment to growing our dividend by 7% per annum until 31 March 2008. |
| | | |
| | | The principal measures we use to monitor financial performance are adjusted operating profit* excluding US stranded cost recoveries, adjusted earnings per share* and operating cash flows. |
| |
| | |
| * | | Adjusted operating profit is operating profit before exceptional items and remeasurements, adjusted earnings per share is basic earnings per share excluding exceptional items and remeasurements |
28National Grid plc
Growth
Investment and financial discipline are critical to our plans to grow our businesses.
| | | |
Investment | | We invest in our existing businesses and, where we believe we can create value through operational improvements, synergies and financial benefits, we consider investing in infrastructure businesses in our core UK and US energy markets. |
| | | |
| | | Measures we use to monitor investment include capital expenditure and investments in acquisitions. |
| |
Generate value
from our
investments | | We aim to generate value from our investments by improving the operating performance of our networks, by selecting investments that will provide the best return or, in the case of acquisitions, by selecting businesses where we can obtain synergies for the benefit of our customers and our shareholders. |
| | | |
| | | Measures we use to monitor the value we generate from our investments include our return on equity and synergy savings from acquisitions. |
| |
Financial
discipline | | In order to deliver sustainable growth we must be disciplined in the way we manage our balance sheet. |
| | | |
| | | This means that we will return cash to shareholders to the extent it is not required for our investment objectives. |
| |
Talent
National Grid depends on the talents, skills and motivation of our employees. We aim to maximise the contribution made by our employees by developing their skills and talents, by motivating and driving continued improvement and by promoting a culture that recognises and respects inclusion and diversity and where all our employees share our core values of respect, integrity and ownership. In addition to obtaining the views of employees on an ongoing basis, we periodically carry out employee surveys to identify areas where we can improve the way we develop and interact with them.
| | | |
Motivation and performance | | We plan to improve our operational performance and the service we provide to our customers by motivating our employees to strive for continued improvement. |
| | | |
| | | Our aim is for a world-class performance management system, involving integrated common performance processes, a single set of performance criteria, pay linked to leadership qualities as well as operational and financial performance and greater differentiation between levels of performance. |
| |
Development of talent and skills | | Critical to our success is identifying, recruiting and developing talented people and helping all our managers and employees to operate to the best of their abilities. |
| |
Inclusion and diversity | | In order to develop, recruit and retain talented people we aim to achieve a more inclusive and diverse workforce. A number of priority action areas have been identified to help achieve our vision of developing and operating our business in a way that results in a more inclusive and diverse profile, reflecting the composition of the communities in which we operate, and to be seen as an employer of choice across diverse communities. |
| | | |
| | | Performance measures we use to monitor our objective of promoting inclusion and diversity include the percentage of female employees and the percentage of black and minority ethnic employees. |
| |
Values | | Our aim is for all our people to be proud to work for National Grid and to share our core values of respect, integrity and ownership. |
| |
Relationships
We have a diverse range of external stakeholders including employees, suppliers, customers, regulators, government and local communities. We strive to be open and constructive in our dealings with external audiences.
Our relationships with stakeholders are critical to our future success. Our strategy involves improving these relationships by focusing on the areas that are important to them, such as the quality of service we provide to customers, the quality of information we provide to regulators and the way we address the concerns of, and interact with, all our stakeholders.
| | | |
Customer
service | | Our objective is to impress our customers with the quality of the services we provide, with our responsiveness when things go wrong and with our dedication to continued improvement. |
| | | |
| | | In addition to our plans to improve reliability, in particular of our US electricity distribution networks, we plan to improve the way we interact with our customers by enhancing or replacing the systems we use, through providing our employees with the training, empowerment and support they need to deliver and by improving the quality of our communications with customers and internally. |
| | | |
| | | We use business-specific service quality KPIs to measure our performance in this area. |
| |
Regulatory
relationships | | Our regulators’ primary responsibilities are to electricity and gas consumers. Hence the foundation of our relationship with regulators is based on the safety, reliability and efficiency of our operations and the quality of our customer service. Our strategic focus on operational excellence and on customer relationships plays a critical part in improving relationships with our regulators. |
| | | |
| | | The other critical element in our regulatory relationships is in building trust. This involves being responsive to the need of our regulators for high-quality information, complying with rules and regulations, operating in an ethical way and, most importantly, delivering on our promises. |
| |
Suppliers | | We aim to work in partnership with our suppliers, developing constructive relationships and working together effectively. Our objective is to develop contractual arrangements with our suppliers that align their interests with our own as far as possible and share financial risks appropriately. |
| | | |
| | | We expect our suppliers to be as equally committed as ourselves to safety, reliability and efficiency and to acting responsibly. In turn we aim to respect the capabilities and views of our suppliers and to treat them fairly in all our dealings with them. |
| |
Community
involvement | | National Grid’s role as a good corporate citizen supports our strategic ambitions, and is delivered through a sustained and consistent approach. |
| | | |
| | | In all our community investment we aim to develop our business, support our employees, support communities and enhance our reputation. Our approach is based on two principles: ‘Investment in our Communities, Investment in our People’, and continues to be centred on three key themes: |
| | | energy and environment; education and skills; and community development. |
| | | |
| | | Sharing of best practice across our business and working collaboratively with key partners and stakeholders enables us to maximise how communities benefit from our activities. |
| |
Annual Report and Accounts 2006/0729
Responsibility
We are committed to operating in a responsible way and this underpins our commitments to performance, growth, talent and relationships as discussed above.
As an asset-intensive business our operations have an impact on the environment, the most significant of these are climate change and historic land contamination. We also take actions to minimise other environmental impacts of our operations, we are committed to strong governance and high ethical standards, we take the issues surrounding electric and magnetic fields seriously and we are committed to protecting human rights.
| | | |
Climate
change | | Climate change is possibly one of the greatest challenges facing society in the 21st century. Our public position statement on energy delivery and climate change sets out our approach to delivering energy while playing our role in minimising any impact our operations may have on the climate. |
| | | |
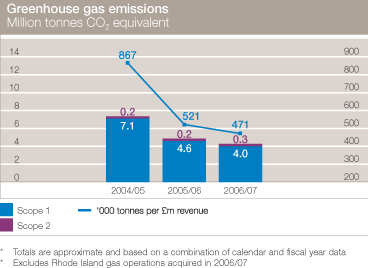
| | | Our target is to reduce National Grid’s greenhouse gas emissions by 60% compared with a verified baseline ahead of the UK Government target of 2050. |
| | | |
| | | Our biggest greenhouse gas emission is methane leakage from our UK gas networks. A major ongoing programme of replacing old cast iron pipes with modern polyethylene pipe is reducing leakage from our distribution system year on year. A programme to install new compressors at key sites will also reduce emissions from our UK gas transmission system. |
| | | |
| | | We plan to reduce emissions relating to our own energy use, saving at least 5% in energy consumption, and use the resultant cost savings to enable us to procure all of the electricity we use from renewable sources by the end of 2010. |
| | | |
| | | With our skills in balancing supply and demand, we believe there are no insurmountable technical problems to accommodating the quantities of intermittent renewable generation that the market will bring forward. We are therefore investing in our networks to connect renewable generators and to reinforce them, ensuring large-scale, renewably generated power can get from where it is generated to where it is used. |
| | | |
| | | The key performance indicator we use to monitor our performance in this area is the percentage reduction in our greenhouse gas emissions against our verified baseline. |
| |
Historically
contaminated
land | | We manage an inherited portfolio of historically contaminated land including former manufactured gas plants, industrial landfills, former gas holders and older substations on our transmission and distribution networks. Sites can sometimes have a complex mix of contamination dating back over 100 years. |
| | | |
| | | In the UK, the main focus of our remediation programme is on managing the environmental risk and returning land to beneficial use, while in the US, our highest priority sites for remediation are those with the highest environmental risk profile and those we are required to remediate by regulatory agencies. Our goal is to return these sites to productive public or private use. |
| |
| | | |
Protecting the
environment | | We are committed to continuous improvement in our environmental performance. |
| | | |
| | | Our objective is to help protect the environment for future generations. In addition to aiming actively to reduce our contribution to climate change we are committed to: |
| | | |
| | | n being efficient in our use of natural resources; |
| | | |
| | | n keeping our waste to a minimum and increasing the economic value of any waste we produce; |
| | | |
| | | n acting to prevent environmental incidents; and |
| | | |
| | | n improving, where we can, the environmental status of the land on which we operate. |
| | | |
| | | We aim to implement environmental management systems certified to the international standard ISO 14001 in all our businesses to help us deliver improvements in these areas. |
| | | |
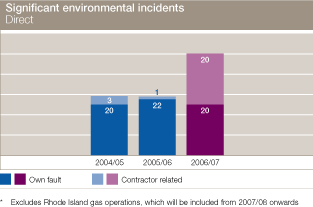
| | | Key performance indicators that we monitor in this area include the number of significant direct environmental incidents and the total value of fines from prosecutions and citations. |
| |
Corporate
governance | | We believe strong corporate governance is essential to operating responsibly and achieving our goals. |
| | | |
| | | We describe our approach to corporate governance on pages 77 to 85. |
| |
Business
ethics | | Not only are we committed to ensuring that all our behaviours are lawful and that we comply with our policies and licences, we also expect all of our employees to live up to our core values of respect, integrity and ownership. |
| |
Electric and magnetic
fields | | We take the issues that surround electric and magnetic fields seriously and in all our operations, as a minimum, we aim to comply with the regulations, guidelines or practices relating to electric and magnetic fields in force in the different jurisdictions in which we operate. |
| |
Human rights | | Our public position statement sets out our commitment to protect human rights within our sphere of influence and ensure our own operations are a force for good wherever we operate in the world. |
| |
30National Grid plc
Key performance indicators
We measure the achievement of our objectives through the use of qualitative assessments and through the monitoring of quantitative indicators, termed key performance indicators (KPIs).
In line with our operating objectives, we use both financial and non-financial KPIs. Where relevant, KPIs are used as our primary measures of whether we are achieving our objectives; however, the scale and size of our operations means we use many other detailed performance measures in addition to KPIs. We also use KPIs to measure performance against our primary objective of growing our businesses to create value for our shareholders. We use qualitative assessments to judge progress against our objectives in areas where numerical measures are less relevant.
The majority of our KPIs are unchanged from last year; however, we have increased the number of KPIs presented in the table below by including business-specific reliability KPIs.
| | | | | | | | | | | |
| Objective | | KPI | | Description | | Target | | Result | | Page |
Shareholder
value | | Total shareholder
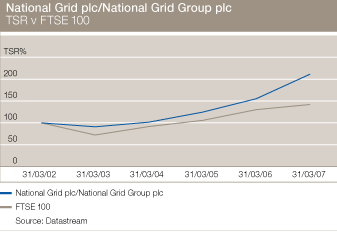
return | | Change in share price, assuming reinvestment of dividends and returns of capital | | To increase | | 2006/07: 44.9%
2005/06: 22.9%
2004/05: 19.0% | | 43 |
| |
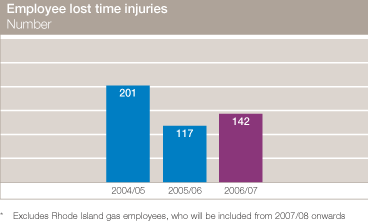
Performance – safety | | Injuries to the public | | Members of the public injured as a direct result of our operations1 | | Zero | | 2006/07: 28
2005/06: 20
2004/05: 52 | | 32 |
| | | |
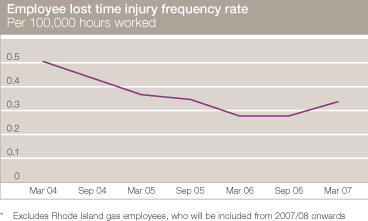
| | | Employee lost time
injury frequency rate | | Injuries resulting in employees
taking time off work
(per 100,000 hours worked) | | Zero | | 2006/07: 0.34
2005/06: 0.28
2004/05: 0.37 | | 32 |
| | | |
| | | Gas safety-related
service standards | | Proportion of uncontrolled gas escapes attended within one hour in the UK | | More than 97% | | 2006/07: 98.51%
2005/06: 97.97%
2004/05: 98.46% | | 52 |
| | | |
| | | Gas Distribution – UK mains replacement | | Kilometres of gas main decommissioned | | 2006/07: 1,824 km
2005/06: 1,724 km
2004/05: 1,492 km | | 2006/07: 1,850 km
2005/06: 1,724 km
2004/05: 1,458 km | | 52 |
| | | |
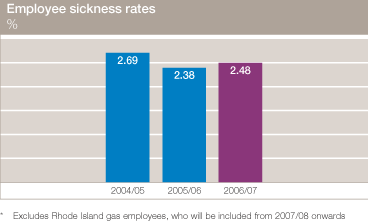
| | | Sickness absence rate | | Proportion of available work days which are lost due to sickness | | Zero work-related sickness2 | | 2006/07: 2.48%
2005/06: 2.38%
2004/05: 2.69% | | 32 |
| |
Performance – reliability | | Transmission – UK electricity system reliability | | Electricity delivered by the electricity transmission system as a proportion of electricity demanded | | 99.9999% | | 2006/07: 99.9999%
2005/06: 99.9999%
2004/05: 99.99998% | | 47 |
| | | |
| | | Transmission – UK gas system reliability | | Gas delivered by the gas transmission system as a proportion of gas demanded | | 100% | | 2006/07: 100%
2005/06: 100%
2004/05: 100% | | 47 |
| | | |
| | | Transmission – US electricity system reliability | | The number of customer interruptions and associated MWh lost | | Less than 75 and less than 408 MWh | | 2006/07: 75 and 264 MWh
2005/06: 97 and 348 MWh
2004/05: 73 and 386 MWh | | 47 |
| | | |
| | | Gas Distribution – UK network reliability | | Proportion of total customer days without unplanned customer interruptions | | 99.999% | | 2006/07: 99.999%
2005/06: 99.999%
2004/05: 99.999% | | 52 |
| | | |
| | | Electricity Distribution – US network reliability | | Average time the average customer is without power over the year | | Less than 115 minutes | | 2006/07: 121 minutes
2005/06: 141 minutes
2004/05: 120 minutes | | 57 |
| | | |
| | | Other business-specific reliability measures are discussed in the business sections on pages 47, 52, 57 and 61. |
| |
Performance – efficiency and financial performance3 | | Adjusted operating profit
excluding stranded4 | | Operating profit from continuing operations excluding US stranded cost recoveries, exceptional items and remeasurements | | To increase sufficiently to support 7% dividend growth through to March 2008 | | 2006/07: £2,031 million
2005/06: £1,968 million
2004/05: £1,936 million | | 33 |
| | | | | | | |
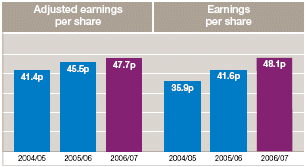
| | | Adjusted earnings
per share5 | | Earnings per share from continuing operations before exceptional items and remeasurements | | | | 2006/07: 47.7p
2005/06: 45.5p
2004/05: 41.4p | | 33 |
| | | | | | | |
| | | Operating cash flows | | Cash flows generated from
continuing operations | | | | 2006/07: £3,090 million
2005/06: £2,973 million
2004/05: £2,820 million | | 33 |
| |
| | | | | | | | | | | |
| |
Annual Report and Accounts 2006/0731
| | | | | | | | | | | |
| Objective | | KPI | | Description | | Target | | Result | | Page |
Growth – investment | | Capital investment | | Additions to plant and equipment and to intangible assets | | There is no numerical target for capital expenditure, or for acquisitions, as each investment is different and is considered on its merits | | 2006/07: £2,375 million
2005/06: £2,108 million
2004/05: £1,905 million | | 33 |
| | | | | | |
| | | Investments in acquisitions | | Consideration in respect of acquired businesses | | | 2006/07: £354 million
2005/06: No acquisitions
2004/05: £1,122 million | | 34 |
| |
Growth –
value from our investments | | Return on equity | | Adjusted earnings excluding stranded and converted on to a regulatory basis over equity on a regulatory basis | | This is a new measure and a target is not yet established | | 2006/07: 12.4%
(3 year average) | | 34 |
| | | |
| | | Synergy savings | | Annualised cost savings achieved from the integration of an acquired business | | Rhode Island: $18 million | | Rhode Island:
Target to be achieved in future periods | | 34 |
| |
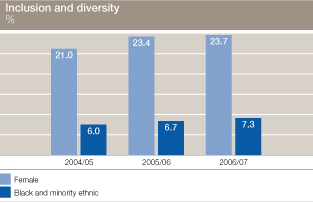
Talent – inclusion and diversity | | Percentage of female employees | | Proportion of employees who are female | | Our ambition is for our employees to reflect the communities we serve while | | 2006/07: 23.7%
2005/06: 23.4%
2004/05: 21.0% | | 35 |
| | | | | | | |
| | | Percentage of black and minority ethnic employees | | Proportion of employees who are black and minority ethnic | | ensuring that we recruit and retain talented people regardless of their gender, race, disability, sexual orientation, age, religion or belief | | 2006/07: 7.3%
2005/06: 6.7%
2004/05: 6.0% | | 35 |
| |
Responsibility
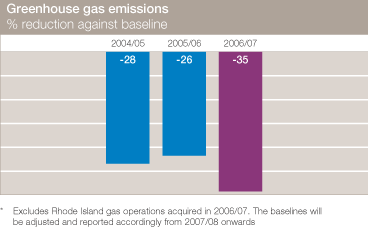
– climate change | | Percentage reduction in
greenhouse gas emissions
against verified baseline6 | | CO2 equivalent emissions estimated to be caused by our operations | | 60% reduction by 2050 | | 2006/07: 35%
2005/06: 26%
2004/05: 28% | | 36 |
| |
Responsibility
– protect the environment | | Significant direct
environmental incidents | | Own fault and contractor-related environmental incidents | | Zero in each case | | 2006/07: 20, 20
2005/06: 22, 1
2004/05: 20, 3 | | 37 |
| | | |
| | | Total value of fines from environmental prosecutions and citations | | Financial quantity of fines imposed | | Zero | | 2006/07: $4,885
2005/06: Zero
2004/05: $3,000 | | 37 |
| |
| | |
| 1 | | Injuries comprise fatalities, injuries that require the person to receive hospital treatment and other injuries reported in the UK under the Reporting of Injuries, Diseases and Dangerous Occurrences Regulations (RIDDOR). |
| |
| 2 | | The sickness absence rate includes absences resulting from both work-related and non work-related illnesses. Our target relates to work-related illnesses, however, we do not have a measure that excludes non work-related illnesses sufficiently accurately. |
| |
| 3 | | The KPI for a 30% reduction in controllable costs by 31 March 2007 in our Gas Distribution business in the UK is no longer included as it was achieved by 31 March 2006. |
| |
| 4 | | This measure has been amended from that presented last year to exclude the impact of US stranded cost recoveries in line with our strategic announcement to return these cash flows to shareholders, and also to reflect the reclassification of wireless infrastructure and Basslink in Australia as discontinued operations. Operating profit from continuing operations including US stranded cost recoveries and exceptional items and remeasurements increased to £2,513 million in 2006/07 from £2,374 million in 2005/06 and from £2,113 million in 2004/05. |
| |
| 5 | | Basic earnings per share from continuing operations including exceptional items and remeasurements increased from 35.9p in 2004/05 to 41.6p in 2005/06 to 48.1p in 2006/07. |
| |
| 6 | | The KPI we use for measuring reduction in greenhouse gas emissions has been changed from last year’s measure of greenhouse gas emissions per £m revenue to a measure that aligns with our target of a 60% reduction in emissions. The verified baseline is based on available historic data for our various emission sources, for example, methane leakage and venting. The period this data covers varies by source, therefore our baseline cannot be attributed to a specific year. The baseline will be adjusted on an annual basis to include businesses we acquire. The derivation of our baseline is included in the responsibility section of our corporate website. |
32National Grid plc
Performance during the year
Our performance against our objectives in the areas of performance, growth, talent, relationships and responsibility is described below and on the following pages. Our financial results are described on pages 38 to 43 and more information on the performance and financial results of each business are included in the business sections on pages 44 to 63.
Performance
Safety
Our safety performance deteriorated in 2006/07 compared with 2005/06, which is disappointing after the significant improvement we recorded last year. Our aim in 2007/08 is to improve our safety performance in line with our goal of zero work-related injuries.
In September 2006, we held our first combined UK and US safety, health and environment conference involving 60 participants from across National Grid and KeySpan. The conference provided the opportunity to review our safety and occupational health policy and our Vision for Safety and develop strategies to meet the challenges facing the business over the next few years. Last year we reported the UK gas and electricity businesses had introduced Golden Rules, setting standards for good safety behaviours and reinforcing a culture whereby safety becomes second nature. This approach is to be extended throughout all our operations during 2007/08.
Public safety
28 members of the public were injured as a result of our operations compared with 20 during 2005/06 and 52 in 2004/05. This includes a member of the public who died after illegally climbing and subsequently falling from an electricity tower in the UK.
Employee safety
During 2006/07, 142 of our employees received injuries that resulted in them taking time off work, compared with 117 in 2005/06 and 201 in 2004/05 (160 when the sold networks are excluded). As a consequence, employee lost time injuries per 100,000 hours worked rose to 0.34 in 2006/07 compared with 0.28 and 0.37 in the two previous years.
In our 2006 employee opinion survey, 89% of respondents considered that National Grid has a clear commitment to operating safely and 89% considered that employees take safety seriously and do their best to prevent injuries and accidents compared with 86% on both these questions in the 2004 survey. 79% of respondents in 2006 felt confident safety concerns or issues raised would be addressed, up from 75% in the 2004 survey.
Contractor safety
It is with sadness we record the death of a contractor while working for our UK electricity transmission business during 2006/07. This was a tragic event and our thoughts and deepest sympathies are with all those affected.
There was an increase in the number of contractor lost time injuries, rising from 119 in 2005/06 to 131 in 2006/07.
Employee health
We continue to focus on our employees’ health and wellbeing. Resulting from an action coming out of the September 2006 safety, health and environment conference, later in 2007/08 we will launch a new ‘Vision for Health and Wellbeing’ setting out how we aim to help and support our employees in the maintenance of good physical and mental health through proper diet, exercise and habits. We also participate in the UK’s Business in the Community Business Action on Health programme at both a leadership team and practitioner level. The objectives of this programme are to raise the profile of health issues in companies and to quantify and track best practice workplace health activities.
Annual Report and Accounts 2006/0733
Around 2.48% of available work days were lost due to sickness absence in 2006/07 compared with 2.38% in 2005/06 and 2.69% in 2004/05. This equates to 6.3 days of sickness per employee per year. The UK Confederation of British Industry’s 2007 sickness absence survey reported that average annual sickness for UK company employees was 7.0 days.
Reliability
Overall, our reliability performance in Transmission in the UK was the best in recent years. In particular, the amount of electricity demanded but not delivered over our UK transmission network this year was the second lowest in the past 5 years, and there were only 5 loss of supply incidents compared to an average of 11 over the preceding 4 years. As we enter a large programme of investment in our UK transmission networks, there is an increased risk of loss of supply incidents and so we are increasing our focus on maintaining reliability over the next few years by assessing the condition of circuits that remain in service during the periods that we replace or overhaul parts of the transmission network.
Our Gas Distribution operations also continued to perform reliably during the year.
In our Electricity Distribution business in the US, we did not meet all of our reliability targets in 2006 and incurred penalties in Massachusetts and New York as a consequence. We achieved all of our targets in Rhode Island. We are seeing improved performance as a result of our comprehensive reliability enhancement programme, as described on page 58.
Further detail on the reliability of our operations is discussed in the business sections on pages 44 to 63.
Efficiency
We continued to institute measures during the year to improve efficiency, with the implementation of a shared services function in the UK to support our principal UK businesses, our business process reviews in Transmission, Electricity Distribution and other business process projects, together with the integration of the acquired Rhode Island gas distribution operations and the work we are carrying out in the US in advance of the planned acquisition of KeySpan to identify efficiencies we can achieve as a combined organisation.
Financial performance
Operating profit from continuing operations excluding US stranded cost recoveries, exceptional items and remeasurements increased from £1,936 million in 2004/05 to £1,968 million in 2005/06 to £2,031 million in 2006/07, while including US stranded cost recoveries operating profit from continuing operations before exceptional items and remeasurements increased from £2,401 million in 2004/05 to £2,457 million in 2005/06 and fell to £2,454 million in 2006/07. Operating profit from continuing operations increased from £2,113 million in 2004/05 to £2,374 million in 2005/06 to £2,513 million in 2006/07.
Earnings per share from continuing operations before exceptional items and remeasurements increased from 41.4p in 2004/05 to 45.5p in 2005/06 to 47.7p in 2006/07. Earnings per share from continuing operations increased from 35.9p in 2004/05 to 41.6p in 2005/06 to 48.1p in 2006/07.
Cash flows generated by continuing operations increased from £2,820 million in 2004/05 to £2,973 million in 2005/06 to £3,090 million in 2006/07.
More information on our financial performance is contained under financial results on pages 38 to 43 and in the business sections on pages 44 to 63.
Growth
Investment
Capital investment
Our capital investment continues to increase as changing energy requirements and the renewal of our networks require increased investment in infrastructure and we invested £2,375 million in the form of capital investment during 2006/07, compared with £2,108 million in 2005/06 and £1,905 million in 2004/05.
In the UK, there is increasing dependency on gas imports and plans for significant expansion of renewable energy sources, as well as the need to increase the rate of asset replacement in electricity transmission as assets built in the 1960s and 1970s approach the end of their useful lives. The UK transmission price controls for the next five years include an allowance of £5.6 billion for investment in our electricity and gas networks. This investment is to respond to changing sources of energy and to replace our aging assets.
Investment is being made in New England to deliver the regional expansion plan and in upstate New York to address asset replacement requirements and to increase the safety and reliability of the network.
Significant elements of our capital investment in 2006/07 included £352 million on the Milford Haven gas transmission pipeline, £290 million on asset replacement in electricity transmission, £333 million on replacement expenditure in Gas Distribution – UK and £41 million on the reliability enhancement programme in Electricity Distribution – US. We also invested £94 million in our Non-regulated Grain LNG import terminal.
Acquisitions and disposals
Significant progress towards proposed acquisition of KeySpan
In 2006, we announced the proposed acquisition of KeySpan for $7.3 billion (£3.7 billion) together with the assumption of approximately $4.5 billion (£2.3 billion) of debt. This would significantly expand our operations in the northeastern US as KeySpan is the fifth largest distributor of natural gas in the US and the largest in the northeast US, serving 2.6 million customers in New York, Massachusetts and New Hampshire. KeySpan also operates an electricity transmission and distribution network serving 1.1 million customers in New York under a long-term contract with the Long Island Power Authority. KeySpan’s other interests include 6.6 GW of generation capacity, together with a small portfolio of non-regulated, energy-related services, and strategic investments in certain gas pipeline, storage and liquefied natural gas assets. The planned combination of our
34National Grid plc
current US operations with those of KeySpan would result in us becoming the third largest energy utility in the US.
We have made significant progress towards completion and have achieved several important milestones. We have obtained clearances from the Federal Trade Commission in respect of the Hart-Scott-Rodino Antitrust Improvements Act, from the Committee on Foreign Investment in the US and by the Federal Energy Regulatory Commission, and we have received approval from both National Grid and KeySpan shareholders. In March 2007, we and KeySpan announced an agreement with the staff of the Long Island Power Authority in principle regarding amended contracts, which is subject to approval by the Board of the Authority and by the Comptroller and Attorney General of New York. In April 2007, the staff of the New Hampshire Public Utilities Commission announced that they would recommend approval. We have also made filings with the New York Public Service Commission and we have held extensive discussions with regulatory staff and other interested parties that have yielded significant progress toward resolution of issues important to the completion of the acquisition. We anticipate achieving a final result that will benefit investors and consumers alike by this autumn.
| | | | | |
| Approval | | Filed | | Cleared |
| Federal Trade Commission | | ü | | ü |
| |
| Committee on Foreign Investment in the US | | ü | | ü |
| |
| Federal Energy Regulatory Commission | | ü | | ü |
| |
| National Grid shareholders | | ü | | ü |
| |
| KeySpan shareholders | | ü | | ü |
| |
| New Hampshire Public Utilities Commission | | ü | | Awaiting
Approval |
| | |
| New York Public Service Commission | | ü | |
| |
Acquisition of Rhode Island gas distribution business
On 24 August 2006, we completed the acquisition from Southern Union Company of its Rhode Island gas distribution network for £269 million, including transaction costs of £3 million, together with the assumption of £48 million of debt. Goodwill arising on the acquisition was £144 million. This acquisition expanded our gas distribution operations by 245,000 customers and added over 3,000 miles of pipelines. The network substantially overlaps our existing electricity distribution service area in Rhode Island. The rates for the Rhode Island gas distribution business are set by the same state regulators that set our electricity distribution rates in Rhode Island. Both businesses have a history of performing under incentive-based rate plans, which provide substantial benefits to customers and shareholders.
Discontinued operations
As part of our strategy of focusing on energy markets in the UK and the US, we committed during 2006/07 to exit our wireless infrastructure operations in the UK and in the US and our electricity interconnector in Australia. Subsequent to the end of the 2006/07 financial year, on 3 April 2007, we completed the sale of our UK wireless infrastructure operations for proceeds of £2.5 billion and, also in April 2007, we agreed to the sale of our much smaller US wireless infrastructure operations with completion expected in the summer of 2007 for proceeds of approximately $290 million (£147 million). We continue to advance the sale of our Australian electricity interconnector. Our wireless infrastructure operations in the UK were created through the combination of National Grid’s then existing wireless infrastructure business with the UK operations of Crown Castle International Corp., which was acquired for cash consideration of £1.1 billion during the year ended 31 March 2005. Our wireless infrastructure operations in the US were expanded during 2006/07 with acquisitions at a cost of £85 million. Its main operations are the construction and ownership of wireless telecommunications towers across a number of US states.
Other acquisitions and disposals
There were no other significant acquisitions completed during the years ended 31 March 2007, 2006 or 2005. On 27 October 2006, we completed the sale of our 38.5% interest in Copperbelt Energy Corporation in Zambia for net proceeds of £14 million. During the year ended 31 March 2006, we completed the sales of four of our regional gas distribution networks, comprising approximately half of the gas distribution network in Great Britain, for net cash proceeds of £5.8 billion and we also sold our interest in a joint venture, Energis Polska, for net proceeds of £8 million, while in the year ended 31 March 2005, we disposed of our investment in a joint venture, Citelec, giving rise to a gain of £13 million.
Generating value from our investments
This year we are reporting for the first time a return on equity measure, the purpose of which is to allow us to monitor how we are performing in generating value from our businesses and from the investments we make. For 2006/07, our return on equity is 14.1% and our average return on equity over the past three years was 12.4%.
Financial discipline
We have progressed on our objective of being financially disciplined by identifying surplus cash flows that can be returned to shareholders through a share buy-back programme. In 2006/07, we returned £169 million, arising from our decision to return $1.9 billion (approximately £1 billion) based on the post-tax net amounts we expect to recover from US stranded costs in the period in which they arise. In addition, we have announced the return of a further £1.8 billion in 2007/08 and 2008/09 following the sale of our wireless infrastructure operations.
Talent
Motivation and performance
In July 2006, we conducted a company-wide employee opinion survey. Over 11,000 employees (58%) took part in the process – a 9% increase on the response rate compared to the 2004 survey. For over 90% of the questions asked, a more favourable response rate was received than in 2004. The survey demonstrated that the workforce better understood our strategy and the need for change. Our employees believe that the business is heading in
Annual Report and Accounts 2006/0735
the right direction and are willing to do their jobs differently to help National Grid improve. Respect and integrity, two of our three core values, are also becoming embedded in the culture of the organisation and safety continues to be recognised as one of National Grid’s strengths.
Areas which the survey results highlighted as needing improvement included general management behaviours around communication with employees and performance management. Action plans have been developed by each of the businesses to address their key priorities for improvement.
Greater use is being made of electronic communication channels with the new Chief Executive outlining the new strategy for all employees via video and issuing a New Year video message to all employees, the latter receiving over 5,000 hits on our intranet site.
Development of talent
Our focus on developing the talent of our current and future business leaders has intensified, with participants in our leadership and management development programmes more than doubled over last year. In our US business review, a need was identified to increase investment in our employees and, in particular, develop front line management. Specific areas of focus included leadership, communication, end user computing, project management and problem solving.
We continue to invest in the recruitment and development of skilled employees for the future, recruiting 160 trainees on to our apprentice, foundation engineer, graduate and student programmes in the UK in the past year. Our UK Foundation Engineering Programme, launched in early 2006, is designed to facilitate the entrance, training and progression of talented people into key engineering roles. In conjunction with Aston University and Energy Utility Skills, our industry sector skills council in the UK, we have also designed an industry specific foundation degree.
Through our ‘e-futures’ strategy, we actively organise and sponsor a number of educational initiatives in the UK. These initiatives are designed to increase the number and diversity of young people interested in engineering careers and, ultimately, to create and sustain a greater pool of skilled talent from which we can recruit. Over the last four years, well over 15,000 young people have participated in these initiatives. Key to this success has been the dedicated involvement of our employees.
In the US we, together with three Massachusetts community colleges, received a $1.9 million (£1 million) grant from the US Department of Labor to support both a college certificate and an associate degree programme in energy utility technology. The three year grant will enable the launch of the programme in September 2007 and hire faculty, fund administrative development, establish laboratories, promote industry careers and an internship programme.
In the UK, National Grid was externally recognised as Graduate Employer of the Year at the Target National Graduate Recruitment awards and was highly commended by the National Council for Work Experience. The quality of our apprentice programmes has also been recognised by the Adult Learning Inspectorate, placing us in the top 10% of training providers in the UK.
Inclusion and diversity
Several employee interest networks have been established focusing on gender, ethnicity and faith, and disability. The networks provide a mutually beneficial relationship for our
employees by providing opportunities for employees to network with each other and senior management, to attain career building skills and to provide a better understanding of National Grid.
Working groups have been established with senior executive sponsors in the UK and the US focusing on recruitment and employee development, employee engagement, communications and measuring the impact of our inclusion and diversity policies. We have also initiated a field force pilot programme in the UK to explore the development of inclusion and diversity best practice that can be replicated across our operational sites.
At 31 March 2007, 23.7% of our employees were female and 7.3% were from black and minority ethnic groups compared with 23.4% and 6.7% respectively at 31 March 2006 and with 21.0% and 6.0% respectively at 31 March 2005.
Our progress has already received external recognition. We achieved The Times Top 50 UK ‘where women want to work’ status and won the 2007 working families award from the UK resource centre for women working in science, engineering and technology. We scored 75% in the US Human Rights Campaign’s Corporate Equality Index – well above the average scored by peer companies.
In our 2006 employee opinion survey, 83% (2004: 81%) of respondents considered they are treated fairly by the Company without regard for race, age, ethnic background, gender, religion, disabilities or sexual orientation, while 66% (2004: not measured) considered that National Grid does a good job of treating them with fairness and respect.
Relationships
Customer service
We continue to aim for improvements in the service we provide to our customers and customer service is high on the agenda for the management teams in each of our businesses. In addition, we are supporting our businesses through the establishment of shared services functions in the UK and the US and by seeking to improve information systems.
Our main area of concern relates to Electricity Distribution in the US, where customer satisfaction has been affected by high commodity prices, which are outside of our control, but also by reliability and service quality issues. As described on pages 33 and 58, our reliability enhancement programme is designed to address many of these issues.
Regulatory relationships
In the UK, we continue to work very closely with Ofgem on the renewal of our electricity and gas transmission and gas
36National Grid plc
distribution networks, and in expanding those networks to meet new and changing demand. In addition, we seek to maintain a professional approach with Ofgem in areas where we disagree, in particular with respect to their investigation into metering services in the UK as discussed on page 25.
In the US, we have differing relationships with FERC and state regulators and there is much we need to do to improve, particularly in respect of New York, where our reliability enhancement programme is targeted on improving customer satisfaction, and hence we hope, our relationships with our regulators. We believe our response to the storms in October 2006 in upstate New York demonstrates how we can deliver.
Suppliers
We continue to make progress in improving the quality of our relationships with suppliers. A particular focus has been in the UK, where we have worked with a number of suppliers to create alliances where we work in combined teams to deliver on construction projects in Transmission – UK and Gas Distribution – UK and where we and suppliers share in the financial risk associated with these projects.
Community investment
Our policy on community investment provides a framework for ensuring that investment delivers benefits for our business and the communities we serve. During the year, we reviewed our social policy to ensure our approach to community investment remains relevant to, and supports, society’s wider social and environmental priorities. This review has included analysis of existing activities and best practice, both across National Grid and externally. We continue to use the model developed by the London Benchmarking Group to provide a framework for measuring and reporting our community investment contributions, by capturing, in accordance with the model, spend against our key themes. On this basis, we invested some £9 million in support of community initiatives and relationships across our operations in 2006/07.
In our 2006 employee opinion survey, 68% (2004: 63%) of respondents considered National Grid makes a positive contribution to the communities in which we operate.
Responsibility
We continue to enjoy external endorsement of our responsible business approach. We are ‘sector leader’ of the multi-utilities sector of the Dow Jones Sustainability World Index and one of only two companies listed. We also continue to feature in the FTSE4Good Index and are one of 29 companies regarded as a ‘Platinum’ company in the Business in the Community 2006 Corporate Responsibility Index, confirming that our approach to responsible business is indeed world class.
Climate change
We have committed to reduce our own greenhouse gas emissions by 60% in advance of the target date of 2050 set by the UK Government. Against our independently verified baseline, to date we have achieved an approximate 35% reduction. The derivation of our baseline is included in the responsibility section of our corporate website.
Last year we reported on our website for the first time our greenhouse gas emissions in line with the World Resources Institute greenhouse gas protocol initiative. This provides a breakdown of our direct emissions (Scope 1), for example methane leaking from our gas distribution networks, indirect emissions resulting from purchased electricity (Scope 2) and other indirect emissions (Scope 3). We believe this provides greater transparency and focuses attention on those emissions over which we have the greatest control.
Almost 100% of our reported Scope 3 emissions are due to losses on our electricity transmission and distribution networks. These losses are dependent on the distance between the location of electricity generators and centres of demand, a factor that is outside of our control. Emissions associated with these losses should be reported as Scope 1 emissions by electricity generators using the protocol.
For our US operations prior to 2006/07, we were unable to separately identify emissions due to methane leakage from our gas distribution network from other apparent losses due to such things as metering and billing error. We therefore reported conservatively and included all as Scope 1 emissions. This resulted in overstatements of our emissions prior to 2006/07. We have now identified a methodology which separately identifies methane leakage and therefore have restated years 2004/05 and 2005/06 accordingly. A detailed explanation, together with a comparison with previously stated Scope 1 and 2 emissions, is included on our website.
During 2006/07, our Scope 1 and Scope 2 greenhouse gas emissions amounted to some 4.3 million tonnes CO2 equivalent, compared with 4.8 million tonnes in 2005/06 and 7.3 million tonnes in 2004/05. Our Scope 3 emissions during 2006/07 amounted to some 5.1 million tonnes CO2 equivalent, compared with 5.0 million tonnes in 2005/06 and 4.5 million tonnes in 2004/05.
Annual Report and Accounts 2006/200737
Total Scope 1 and 2 emissions per £million of revenue amounted to some 471 tonnes CO2 equivalent compared with 521 tonnes in 2005/06 and 867 tonnes in 2004/05.
Our largest direct emission is methane leakage from our gas distribution networks, accounting for some 57% of our Scope 1 emissions. During the year, we replaced approximately 1,850 kilometres of old cast iron pipes in the UK, the largest source of these emissions.
Historically contaminated land
In the UK, National Grid Property manages land contamination issues on 350 currently owned sites previously used for gas production. In the US, we have responsibility for approximately 200 historically contaminated sites, the vast majority of which are formerly owned manufactured gas plants. During 2006/07, 17 sites in the UK were remediated and 18 sites in the US were remediated or closed with no remediation required.
As described on page 25, a case is before the House of Lords regarding a former gas site which was not part of the assets that formed part of the gas privatisation in 1986 and therefore has never been owned by National Grid. We remain convinced of our case that National Grid has no legal liability with respect to this or other former UK gas sites which did not form part of the assets we acquired at the time of privatisation and believe that our position will be upheld by the House of Lords.
Protecting the environment
Over 90% of our employees now work to certified ISO 14001 environmental management systems.
The number of significant environmental incidents in 2006/07 arising directly from our operations was 40, which includes 20 contractor–related incidents. In 2005/06, there were 23 incidents, of which 1 was contractor-related. Incidents outside of our control resulting from third party or weather-related damage to our networks were 13 compared with 25 for 2005/06. There were no prosecutions by enforcing bodies resulting from these incidents. In the US, we received 9 environmental citations in 2006/07 compared with 10 in the previous year. Of these, 2 in the US attracted fines totalling $4,885 (£2,550).
In our 2006 employee opinion survey, 73% (2004: 72%) of respondents considered National Grid acts responsibly in all its business dealings, including environmental management.
Electric and magnetic fields
We recognise there is some scientific evidence suggesting certain adverse health effects may be linked to electric and magnetic fields. There is also evidence linking an increased risk of certain diseases to proximity to power lines, though the cause of this is not clear. As a consequence, there is public concern and we take these issues very seriously. The balance of evidence remains against both power-frequency and radio-frequency electric and magnetic fields causing ill health. The World Health Organization has classified power-frequency magnetic fields as ‘possibly’ carcinogenic. Our public position statement on electric and magnetic fields, which we review annually, helps set the framework within which we continually assess the scientific evidence in this area, determine any implications for the way in which we conduct our business and explain to society what the science is telling us. We actively support high-quality research and open communication and in the UK we initiated and supported the Stakeholder Advisory Group on electric and magnetic fields, which reported its assessment of the issues in April 2007. This group represents a more constructive and less confrontational way of handling issues such as electric and magnetic fields, and its assessment brings greater clarity on the issues involved for society as a whole. This assessment is available at www.emfs.info/sage.
Corporate governance
Our corporate governance performance during the year is described on pages 77 to 85.
Business ethics
In March 2007, we published our Standards of Ethical Business Conduct, replacing our UK Code of Business Conduct and with the intention of replacing our current US Standards of Conduct on completion of the planned KeySpan acquisition, thereby providing a single set of standards throughout National Grid. The new standards provide a common set of practical guidelines to help ensure that our behaviours are lawful, we comply with our policies and licences and we follow the values set out in our Framework for Responsible Business and our core values of respect, integrity and ownership. In 2006/07, there were 7.98 substantiated breaches per 1,000 employees compared with 4.76 in 2005/06 and 8.04 in 2004/05. Offences include such things as internet and email abuse and misuse of company vehicles and other assets. Disciplinary actions can range from a verbal warning to dismissal.
In our 2006 employee opinion survey, 65% (2004: 56%) of respondents considered something would be done if they reported an inappropriate business practice or an ethical issue, while 65% (2004: 61%) believe National Grid is a good company for customers to do business with.
38National Grid plc
Human rights
A review in 2004 of potential human rights risks highlighted the need to better understand our increasingly international supply chain. To improve control in this area, we have worked with other UK utilities to develop the UK’s utilities vendor database supplier pre-qualification programme to include labour-rights related questions – this was introduced in 2006. A complementary approach is being developed for our US operations. To further strengthen controls, we have also carried out an assessment of the full range of materials and services purchased by our worldwide operations and identified those most likely to pose human rights risks to our operations. In 2007/08, we will further develop our purchasing strategies and processes to manage these potential risks. We continue our work with the Business Leaders Initiative on Human Rights, an international business-led initiative aimed at developing practical business tools to incorporate human rights into day-to-day business decision-making.
Financial results
We report our financial results and position in accordance with International Financial Reporting Standards (IFRS) as adopted in the European Union.
Continuing and discontinued operations
The financial results of our business segments (as described on page 20) and of other activities are presented within continuing operations.
The results of our UK and US wireless infrastructure operations, which have been sold or we have agreed to sell since the end of the financial year and the Basslink electricity interconnector in Australia that we plan to sell, are included within discontinued operations. As a consequence, comparative results for these businesses for the years ended 31 March 2006 and 2005 have been reclassified from continuing to discontinued operations. Discontinued operations in previous years also include the four gas distribution networks in the UK that we sold on 1 June 2005.
Measurement of financial performance and use of adjusted profit measures
In considering the financial performance of our businesses and segments, we analyse each of our primary financial measures of operating profit, profit before tax, profit for the year attributable to equity shareholders and earnings per share into two components, comprising firstly ‘business performance’ which excludes exceptional items and remeasurements and secondly ‘exceptional items and remeasurements’. Exceptional items and remeasurements are excluded from the measures of business performance used by management to monitor financial performance as they are considered to distort the comparability of our reported financial performance from year to year.
Measures of business performance are referred to in this Annual Report as adjusted profit measures in order to clearly distinguish them from the comparable total profit measures of which they are a component. Adjusted operating profit, adjusted profit before tax, adjusted earnings and adjusted earnings per share differ from total operating profit, profit before tax, profit for the year attributable to equity shareholders and earnings per share respectively by the exclusion of exceptional items and remeasurements.
Exceptional items and remeasurements are items of income and expenditure that, in the judgement of management, should be disclosed separately on the basis that they are material, either by their nature or their size, and are relevant to an understanding of our financial performance. Items of income or expense that are considered by management for designation as exceptional items include such items as significant restructurings, write-downs or impairments of non-current assets, material changes in environmental or decommissioning provisions, integration of acquired businesses and gains or losses on disposals of businesses or investments. Remeasurements comprise gains or losses recorded in the income statement arising from changes in the fair value of commodity contracts and of derivative financial instruments. These fair values increase or decrease as a consequence of changes in commodity and financial indices and prices over which we have no control.
Adjusted profit measures are limited in their usefulness compared with the comparable total profit measures as they exclude important elements of our underlying financial performance, namely exceptional items and remeasurements. We believe that in separately presenting financial performance in two components it is easier to read and interpret financial performance between periods, as adjusted profit measures are more comparable by excluding the distorting effect of exceptional items and remeasurements, and exceptional items and remeasurements are more clearly understood if separately identified and analysed. The presentation of these two components of financial performance is additional to, and not a substitute for, the comparable total profit measures presented.
Management uses adjusted profit measures as the basis for monitoring financial performance and in communicating financial performance to investors in external presentations and announcements of financial results. Internal financial reports, budgets and forecasts are primarily prepared on the basis of adjusted profit measures, although planned exceptional items, such as significant restructurings, are also reflected in budgets and forecasts. Management compensates for the limitations inherent in the use of adjusted profit measures through the separate monitoring and disclosure of exceptional items and remeasurements as a component of our overall financial performance.
Operating financial performance
| | | | | | | | | | | | | |
| | | Years ended 31 March | |
| | | 2007 | | | 2006 | | | 2005 | |
| Continuing operations | | £m | | | £m | | | £m | |
| |
| Revenue | | | 8,695 | | | | 8,868 | | | | 7,174 | |
| Other operating income | | | 83 | | | | 80 | | | | 67 | |
| Operating costs excluding exceptional items and remeasurements | | | (6,324 | ) | | | (6,491 | ) | | | (4,840 | ) |
| |
| Adjusted operating profit | | | 2,454 | | | | 2,457 | | | | 2,401 | |
| Exceptional items | | | (22 | ) | | | (34 | ) | | | (250 | ) |
| Remeasurements | | | 81 | | | | (49 | ) | | | (38 | ) |
| |
| Total operating profit | | | 2,513 | | | | 2,374 | | | | 2,113 | |
| |
The following tables set out the consolidated revenue, adjusted operating profit and operating profit by business segment. As a consequence of our decision to return to shareholders $1.9 billion (£1 billion) with respect to US stranded cost recoveries, we also present the totals for adjusted operating profit and operating profit excluding US stranded cost recoveries.
Annual Report and Accounts 2006/0739
Revenue by business segment
| | | | | | | | | | | | | |
| |
| | | Years ended 31 March | |
| | | 2007 | | | 2006 | | | 2005 | |
| Continuing operations | | £m | | | £m | | | £m | |
| |
| Transmission – UK | | | 2,816 | | | | 2,710 | | | | 1,995 | |
| Transmission – US | | | 270 | | | | 310 | | | | 284 | |
| Gas Distribution – UK | | | 1,193 | | | | 1,222 | | | | 1,113 | |
| Gas Distribution – US | | | 638 | | | | 571 | | | | 427 | |
| Electricity Distribution – US | | | 3,004 | | | | 3,134 | | | | 2,633 | |
| US stranded cost recoveries | | | 426 | | | | 517 | | | | 436 | |
| Other activities | | | 567 | | | | 701 | | | | 734 | |
| |
| Total segmental revenues | | | 8,914 | | | | 9,165 | | | | 7,622 | |
| Less: sales between business segments | | | (219 | ) | | | (297 | ) | | | (448 | ) |
| |
| Total | | | 8,695 | | | | 8,868 | | | | 7,174 | |
| |
Segmental operating profit before exceptional items and remeasurements
| | | | | | | | | | | | | |
| |
| | | Years ended 31 March | |
| | | 2007 | | | 2006 | | | 2005 | |
| Continuing operations | | £m | | | £m | | | £m | |
| |
| Transmission – UK | | | 946 | | | | 844 | | | | 859 | |
| Transmission – US | | | 108 | | | | 127 | | | | 126 | |
| Gas Distribution – UK | | | 409 | | | | 483 | | | | 424 | |
| Gas Distribution – US | | | 71 | | | | 47 | | | | 33 | |
| Electricity Distribution – US | | | 364 | | | | 317 | | | | 342 | |
| US stranded cost recoveries | | | 423 | | | | 489 | | | | 465 | |
| Other activities | | | 133 | | | | 150 | | | | 152 | |
| |
| Adjusted operating profit | | | 2,454 | | | | 2,457 | | | | 2,401 | |
| |
| Total excluding stranded cost recoveries | | | 2,031 | | | | 1,968 | | | | 1,936 | |
| |
Segmental total operating profit
| | | | | | | | | | | | | |
| |
| | | Years ended 31 March | |
| | | 2007 | | | 2006 | | | 2005 | |
| Continuing operations | | £m | | | £m | | | £m | |
| |
| Transmission – UK | | | 936 | | | | 843 | | | | 857 | |
| Transmission – US | | | 107 | | | | 127 | | | | 119 | |
| Gas Distribution – UK | | | 412 | | | | 432 | | | | 333 | |
| Gas Distribution – US | | | 67 | | | | 47 | | | | 17 | |
| Electricity Distribution – US | | | 355 | | | | 317 | | | | 241 | |
| US stranded cost recoveries | | | 504 | | | | 440 | | | | 427 | |
| Other activities | | | 132 | | | | 168 | | | | 119 | |
| |
| Total operating profit | | | 2,513 | | | | 2,374 | | | | 2,113 | |
| |
| Total excluding stranded cost recoveries | | | 2,009 | | | | 1,934 | | | | 1,686 | |
| |
Details of the financial results of business segments, including information on exceptional items and remeasurements, are included in the business overviews on pages 44 to 63.
Exchange rates
Our financial results reflect decreases in revenue, operating costs and operating profit from 2005/06 to 2006/07, and increases from 2004/05 to 2005/06, arising from exchange on US operations reflecting the movement in the average US dollar to sterling exchange rate from $1.87:£1 in 2004/05 to $1.79:£1 in 2005/06 to $1.91:£1 in 2006/07.
If adjusted operating profit and total operating profit for 2005/06 had been translated using the same exchange rates prevailing in 2006/07 they would have been £62 million and £64 million lower respectively. Similarly, if adjusted operating profit and operating profit for 2004/05 had been translated using the same exchange rates prevailing in 2005/06 they would have been £44 million and £36 million higher respectively.
The effect of movements in the US dollar exchange rate on adjusted operating profit and operating profit are mitigated by changes in the opposite direction to net interest charges and tax. This includes the impact of debt and derivative financial
instruments that are denominated in US dollars. After reflecting these impacts, adjusted profit for the year and profit for the year from continuing operations for 2005/06 would have been £29 million and £27 million lower respectively if they had been translated using the same exchange rates prevailing in 2006/07 (2004/05: £23 million and £19 million higher respectively using 2005/06 average exchange rates).
2006/07 compared to 2005/06
Changes in revenue and other operating income, operating costs and operating profit for 2006/07 compared with 2005/06 can be summarised as follows:
| | | | | | | | | | | | | |
| |
| | | Revenue | | | | | | | |
| | | and other | | | | | | | |
| | | operating | | | Operating | | | Operating | |
| | | income | | | costs | | | profit | |
| | | £m | | | £m | | | £m | |
| |
| 2005/06 results | | | 8,948 | | | | (6,574 | ) | | | 2,374 | |
| Add back 2005/06 exceptional items and remeasurements | | | – | | | | 83 | | | | 83 | |
| |
| 2005/06 adjusted results | | | 8,948 | | | | (6,491 | ) | | | 2,457 | |
| Exchange on US operations | | | (282 | ) | | | 220 | | | | (62 | ) |
| |
| 2005/06 constant currency results | | | 8,666 | | | | (6,271 | ) | | | 2,395 | |
| Transmission – UK | | | 112 | | | | (10 | ) | | | 102 | |
| Transmission – US | | | (21 | ) | | | 10 | | | | (11 | ) |
| Gas Distribution – UK | | | (27 | ) | | | (47 | ) | | | (74 | ) |
| Gas Distribution – US | | | 103 | | | | (76 | ) | | | 27 | |
| Electricity Distribution – US | | | 65 | | | | 2 | | | | 67 | |
| US stranded cost recoveries | | | (59 | ) | | | 24 | | | | (35 | ) |
| Other activities | | | (137 | ) | | | 120 | | | | (17 | ) |
| Sales between businesses | | | 76 | | | | (76 | ) | | | – | |
| |
| 2006/07 adjusted results | | | 8,778 | | | | (6,324 | ) | | | 2,454 | |
| 2006/07 exceptional items and remeasurements | | | – | | | | 59 | | | | 59 | |
| |
| 2006/07 results | | | 8,778 | | | | (6,265 | ) | | | 2,513 | |
| |
Revenue and other operating income was £170 million lower than in 2005/06, reflecting a £282 million decrease as a result of exchange on US operations and a £112 million increase in operating revenues on a constant currency basis. Operating costs excluding exceptional items and remeasurements decreased by £167 million, reflecting a £220 million decrease as a result of exchange on US operations and a £53 million increase in operating costs on a constant currency basis.
Significant movements in operating revenues and costs relate to higher allowed revenues in Transmission in the UK, reduced volumes in Gas Distribution in the UK as a result of warmer weather, revenues and costs from the acquired gas distribution network in Rhode Island, higher commodity costs in Electricity Distribution in the US passed through to customers and lower connections revenues and costs in other activities relating to the regional gas distribution networks sold in 2005/06. There was an increase of £3 million in other operating income, which primarily relates to gains on the sales of property by our property management business in the UK.
As a consequence, adjusted operating profit in 2006/07 was £3 million lower than 2005/06, comprising a £62 million decrease as a result of exchange on US operations and an increase of £59 million from operations on a constant currency basis.
Net operating exceptional charges of £22 million in 2006/07 related to restructuring costs incurred in the UK and US, including the establishment of a UK shared services function, the business process review undertaken in Transmission and the integration of the acquired Rhode Island gas distribution network into our Gas Distribution business.
40National Grid plc
Operating remeasurement gains of £81 million (2005/06: losses of £49 million, 2004/05: losses of £38 million) relate to changes in the value of commodity contracts in the US carried in the balance sheet at fair value, arising from movements in energy prices.
As a consequence of the above, total operating profit rose by £139 million from 2005/06 to 2006/07, resulting from a decrease in adjusted operating profit of £3 million and a movement in operating exceptional charges and remeasurements of £142 million as compared with 2005/06.
2005/06 compared with 2004/05
Changes in revenue and other operating income, operating costs and operating profit for 2005/06 compared with 2004/05 can be summarised as follows:
| | | | | | | | | | | | | |
| | | Revenue | | | | | | | |
| | | and other | | | | | | | |
| | | operating | | | Operating | | | Operating | |
| | | income | | | costs | | | profit | |
| | | £m | | | £m | | | £m | |
| 2004/05 results | | | 7,241 | | | | (5,128 | ) | | | 2,113 | |
| Add back 2004/05 exceptional items and remeasurements | | | – | | | | 288 | | | | 288 | |
| |
| 2004/05 adjusted results | | | 7,241 | | | | (4,840 | ) | | | 2,401 | |
| Exchange on US operations | | | 169 | | | | (125 | ) | | | 44 | |
| |
| 2004/05 constant currency adjusted results | | | 7,410 | | | | (4,965 | ) | | | 2,445 | |
| Transmission – UK | | | 715 | | | | (730 | ) | | | (15 | ) |
| Transmission – US | | | 13 | | | | (18 | ) | | | (5 | ) |
| Gas Distribution – UK | | | 113 | | | | (54 | ) | | | 59 | |
| Gas Distribution – US | | | 125 | | | | (112 | ) | | | 13 | |
| Electricity Distribution – US | | | 386 | | | | (426 | ) | | | (40 | ) |
| US stranded cost recoveries | | | 61 | | | | (59 | ) | | | 2 | |
| Other activities | | | (26 | ) | | | 24 | | | | (2 | ) |
| Sales between businesses | | | 151 | | | | (151 | ) | | | – | |
| |
| 2005/06 adjusted results | | | 8,948 | | | | (6,491 | ) | | | 2,457 | |
| 2005/06 exceptional items and remeasurements | | | – | | | | (83 | ) | | | (83 | ) |
| |
| 2005/06 results | | | 8,948 | | | | (6,574 | ) | | | 2,374 | |
| |
The most significant increases in revenue, other operating income and in operating costs in 2005/06 compared with 2004/05 arose in Transmission – UK, including increased revenues and operating costs in respect of operating the Scottish electricity transmission networks following our appointment as Great Britain System Operator and increased pass-through costs in Transmission – UK, Gas Distribution – US, Electricity Distribution – US and US stranded cost recoveries. Revenue and costs also increased in Gas Distribution – UK, but this was offset by savings in controllable costs. Other operating income, principally gains on property sales, was £13 million higher.
As a consequence of the above, adjusted operating profit in 2005/06 was up £12 million on a constant currency basis compared with 2004/05. This was driven by favourable results from UK capacity auctions in liquefied natural gas (LNG) storage and the French interconnector, a continued focus on efficiencies, particularly in Gas Distribution – UK, and sustained volume growth in the US. These factors more than offset an increase in depreciation charges in Transmission – UK, lower system operator incentive profits also in Transmission – UK and the timing of the recovery of certain pass-through costs in the US.
Net operating exceptional charges of £34 million in 2005/06 were £216 million lower than the £250 million in 2004/05, consisting of £55 million of restructuring costs, primarily cost reduction programmes in Gas Distribution – UK, and £21 million of gains
relating to the disposals of joint venture investments, compared with 2004/05 when there was £108 million in restructuring costs (£82 million in Gas Distribution – UK, £23 million in our US businesses and £3 million in other businesses), £41 million in exceptional pension charges in the US and £101 million of increases in environmental provisions. Operating remeasurements of £49 million in 2005/06 (2004/05: £38 million) related to changes in the value of commodity contracts in the US carried in the balance sheet at fair value arising from movements in energy prices.
In 2005/06, total operating profit was £261 million higher resulting from an increase in adjusted operating profit of £56 million, and a decrease in operating exceptional charges and remeasurements of £205 million as compared with 2004/05.
Earnings from continuing operations
Adjusted earnings
| | | | | | | | | | | | | |
| | | Years ended 31 March | |
| | | 2007 | | | 2006 | | | 2005 | |
| Continuing operations | | £m | | | £m | | | £m | |
| Adjusted operating profit | | | 2,454 | | | | 2,457 | | | | 2,401 | |
| Net finance costs excluding exceptional items and remeasurements | | | (547 | ) | | | (602 | ) | | | (704 | ) |
| Share of post-tax results of joint ventures | | | 2 | | | | 3 | | | | 3 | |
| |
| Adjusted profit before taxation | | | 1,909 | | | | 1,858 | | | | 1,700 | |
| Taxation excluding tax on exceptional items and remeasurements | | | (611 | ) | | | (565 | ) | | | (424 | ) |
| |
| Adjusted profit from continuing operations | | | 1,298 | | | | 1,293 | | | | 1,276 | |
| |
| | | | | | | | | | | | | |
| | | Pence | | Pence | | Pence |
| |
| Adjusted earnings per share from continuing operations | | | 47.7 | | | | 45.5 | | | | 41.4 | |
| |
Earnings
| | | | | | | | | | | | | |
| | | Years ended 31 March | |
| | | 2007 | | | 2006 | | | 2005 | |
| Continuing operations | | £m | | | £m | | | £m | |
| Total operating profit | | | 2,513 | | | | 2,374 | | | | 2,113 | |
| Net finance costs | | | (764 | ) | | | (659 | ) | | | (704 | ) |
| Share of post-tax results of joint ventures | | | 2 | | | | 3 | | | | 3 | |
| |
| Profit before taxation | | | 1,751 | | | | 1,718 | | | | 1,412 | |
| Taxation | | | (441 | ) | | | (535 | ) | | | (306 | ) |
| |
| Profit from continuing operations | | | 1,310 | | | | 1,183 | | | | 1,106 | |
| |
| | | | | | | | | | | | | |
| | | Pence | | Pence | | Pence |
| |
| Earnings per share from continuing operations | | | 48.1 | | | | 41.6 | | | | 35.9 | |
| |
Net finance costs
Net interest excluding exceptional finance costs and remeasurements in 2006/07 decreased by £55 million compared with 2005/06, primarily as a consequence of a reduction in the interest charge related to pensions, the weaker US dollar in 2006/07 and income from short-term investments partially offset by higher average debt.
Net interest excluding exceptional finance costs and remeasurements decreased by £102 million from 2004/05 to 2005/06. This was primarily explained by use of available cash following the sales of four regional gas distribution networks and a reduction in the interest charge related to pensions. This decrease was partially offset by the impact of a stronger US dollar in 2005/06.
Exceptional finance costs and remeasurements
Exceptional finance costs of £45 million related to the early repayment of UK debt, compared with exceptional finance costs of £49 million in 2005/06 and nil in 2004/05. Exceptional
Annual Report and Accounts 2006/0741
finance costs in 2005/06 related to £39 million on the early repayment of debt and £10 million relating to the issue of B shares, as part of the return of capital to shareholders. The issue of the B shares was accounted for as debt, and the associated issue costs recorded as an exceptional finance cost.
Financial remeasurements relate to net losses on derivative financial instruments of £153 million (2005/06: gains of £6 million, 2004/05: nil) and the financial element of commodity contract revaluations, totalling £19 million in 2006/07 (2005/06: £14 million, 2004/05: nil). Net losses on derivative financial instruments in 2006/07 include £126 million of pre-tax losses, which offset at the post-tax level. Net gains on derivative financial instrument remeasurements after tax are £16 million.
Taxation
A net charge of £441 million arose in 2006/07, compared with £535 million in 2005/06 and £306 million in 2004/05. This reflects net tax credits amounting to £170 million, £30 million and £118 million in respect of exceptional items and remeasurements in 2006/07, 2005/06 and 2004/05 respectively. The effective tax rate was 25% for 2006/07, 31% for 2005/06 and 22% for 2004/05.
Excluding the effect of net tax credits on exceptional items and remeasurements, the effective tax rate for 2006/07, 2005/06 and 2004/05 was 32%, 30% and 25% respectively, compared with a standard UK corporation tax rate of 30% for all three years. This reflected credit adjustments in respect of prior periods equivalent to 3%, 1% and 2% respectively.
A reconciliation of the main components giving rise to the difference between the relevant effective tax rate and the UK standard corporation tax rate is shown in note 10 to the accounts.
Profit for the year from continuing operations
Profit for the year from continuing operations increased from £1,183 million in 2005/06 to £1,310 million in 2006/07 (from £1,106 million in 2004/05 to £1,183 million in 2005/06) as a consequence of the above changes.
Adjusted profit measures
The following tables reconcile the adjusted profit measure to the corresponding total profit measure in accordance with IFRS.
a) Reconciliation of adjusted operating profit to total operating profit
| | | | | | | | | | | | | |
| | | Years ended 31 March | |
| | | 2007 | | | 2006 | | | 2005 | |
| Continuing operations | | £m | | | £m | | | £m | |
| Adjusted operating profit | | | 2,454 | | | | 2,457 | | | | 2,401 | |
| Exceptional items | | | (22 | ) | | | (34 | ) | | | (250 | ) |
| Commodity contract remeasurements | | | 81 | | | | (49 | ) | | | (38 | ) |
| |
| Total operating profit | | | 2,513 | | | | 2,374 | | | | 2,113 | |
| |
Adjusted operating profit is presented on the face of the income statement under the heading ‘Operating profit before exceptional items and remeasurements’.
b) Reconciliation of adjusted profit before taxation to profit before taxation
| | | | | | | | | | | | | |
| | | Years ended 31 March | |
| | | 2007 | | | 2006 | | | 2005 | |
| Continuing operations | | £m | | | £m | | | £m | |
| Adjusted profit before taxation | | | 1,909 | | | | 1,858 | | | | 1,700 | |
| Exceptional items | | | (67 | ) | | | (83 | ) | | | (250 | ) |
| Commodity contract remeasurements | | | 62 | | | | (63 | ) | | | (38 | ) |
| Derivative financial remeasurements | | | (153 | ) | | | 6 | | | | – | |
| |
| Total profit before taxation | | | 1,751 | | | | 1,718 | | | | 1,412 | |
| |
Adjusted profit before taxation is presented on the face of the income statements under the heading ‘Profit before taxation before exceptional items and remeasurements’.
c) Reconciliation of adjusted earnings to earnings (profit for the year from continuing operations attributable to equity shareholders of the parent)
| | | | | | | | | | | | | |
| | | Years ended 31 March | |
| | | 2007 | | | 2006 | | | 2005 | |
| Continuing operations | | £m | | | £m | | | £m | |
| Adjusted earnings | | | 1,296 | | | | 1,291 | | | | 1,276 | |
| Exceptional items | | | (41 | ) | | | (61 | ) | | | (147 | ) |
| Commodity contract remeasurements | | | 37 | | | | (38 | ) | | | (23 | ) |
| Derivative financial remeasurements | | | 16 | | | | (11 | ) | | | – | |
| |
| Earnings | | | 1,308 | | | | 1,181 | | | | 1,106 | |
| |
Adjusted earnings is presented in note 13 to the accounts, under the heading ‘Adjusted earnings’.
Earnings per share from continuing operations
The following table sets out the adjusted basic earnings per share and basic earnings per share from continuing operations for 2006/07, 2005/06 and 2004/05 and reconciles the differences between them.
| | | | | | | | | | | | | |
| | | Years ended 31 March | |
| | | 2007 | | | 2006 | | | 2005 | |
| Continuing operations | | pence | | | pence | | | pence | |
| Adjusted basic earnings per share | | | 47.7 | | | | 45.5 | | | | 41.4 | |
| Exceptional items | | | (1.5 | ) | | | (2.2 | ) | | | (4.8 | ) |
| Commodity contract remeasurements | | | 1.3 | | | | (1.3 | ) | | | (0.7 | ) |
| Derivative financial remeasurements | | | 0.6 | | | | (0.4 | ) | | | – | |
| |
| Earnings per share – continuing operations | | | 48.1 | | | | 41.6 | | | | 35.9 | |
| |
Adjusted basic earnings per share for 2006/07 increased by 2.2 pence, an increase of 5% compared with 2005/06 (2005/06: increased by 4.1 pence, an increase of 10% compared with 2004/05).
This reflected the increase in adjusted profit for the year from continuing operations, the effects of the share buy-back programme and the share consolidation in August 2005 following the £2 billion return of value to shareholders (2005/06: the increase in adjusted profit for the year from continuing operations and the share consolidation in August 2005).
42National Grid plc
Earnings per share from continuing operations increased from 41.6 pence per share in 2005/06 to 48.1 pence per share in 2006/07 reflecting the increase in adjusted earnings per share, combined with lower net exceptional items and remeasurements on a per share basis (2005/06: increase from 35.9 pence per share in 2004/05 to 41.6 pence per share reflecting the increase in adjusted earnings per share, combined with lower exceptional items and remeasurements on a per share basis).
Diluted earnings per share from continuing operations were 47.8 pence per share in 2006/07, 0.3 pence lower than basic earnings per share, compared with 41.4 pence per share in 2005/06 (0.2 pence lower) and 35.7 pence per share in 2004/05 (0.2 pence lower). The principal reason for the dilution in 2006/07, 2005/06 and 2004/05 relates to employee share option schemes.
Discontinued operations
| | | | | | | | | | | | | |
| | | Years ended 31 March | |
| | | 2007 | | | 2006 | | | 2005 | |
| Discontinued operations | | £m | | | £m | | | £m | |
| Revenue | | | 383 | | | | 493 | | | | 1,313 | |
| Operating costs before exceptional items | | | (266 | ) | | | (362 | ) | | | (761 | ) |
| |
| Adjusted operating profit | | | 117 | | | | 131 | | | | 552 | |
| Exceptional items | | | (55 | ) | | | (20 | ) | | | (87 | ) |
| |
| Operating profit | | | 62 | | | | 111 | | | | 465 | |
| Finance income – remeasurements | | | 37 | | | | – | | | | – | |
| Finance costs | | | (2 | ) | | | (4 | ) | | | (2 | ) |
| Share of post-tax results of joint venture | | | – | | | | – | | | | (5 | ) |
| |
| Profit from discontinued operations before tax | | | 97 | | | | 107 | | | | 458 | |
| Taxation | | | (11 | ) | | | (45 | ) | | | (153 | ) |
| |
| Profit from discontinued operations | | | 86 | | | | 62 | | | | 305 | |
| Gain on disposal of discontinued operations | | | – | | | | 2,605 | | | | 13 | |
| |
| Profit for the year | | | 86 | | | | 2,667 | | | | 318 | |
| |
Subsequent to our announcement in November 2006 of our strategic decisions to exit our wireless infrastructure operations in the UK and the US and the Basslink electricity interconnector in Australia, they were classified as businesses held for sale prior to 31 March 2007. As a consequence, the results of these operations for 2006/07, 2005/06 and 2004/05 have been included within discontinued operations. Further information on the results of these operations is included on page 63.
The results of discontinued operations for 2005/06 and 2004/05 also include the four regional gas distribution networks that we sold on 1 June 2005. Revenues, operating costs before exceptional items and adjusted operating profit in 2005/06 are substantially lower than for 2004/05 as they relate to a two month period rather than a full year. In addition, revenue for those two months is proportionally lower due to seasonality. The exceptional charge of £20 million in 2005/06 arose from the payment of a £15 million fine relating to one of the sold networks and £5 million of restructuring costs. The exceptional items in 2004/05 related to costs incurred in preparation for the disposal of the networks and to reorganisations, primarily due to cost reduction programmes.
Our share of the post-tax results of joint ventures in 2005/06 and 2004/05 related to Copperbelt Energy Corporation, which was sold during 2006/07, and to Citelec, which was sold in August 2004. The gain on disposal of discontinued operations in 2005/06 relates to the sales of gas distribution networks and in 2004/05 to Citelec.
Earnings per share from discontinued operations in 2006/07 was 3.2 pence per share, compared with 94.0 pence per share in 2005/06 (which included 91.8 pence per share relating to the gain on disposal of four regional gas distribution networks) and with 10.3 pence per share in 2004/05.
Net profit and total earnings per share for the year
Net profit from both continuing and discontinued operations was £1,396 million in 2006/07, compared with £3,850 million in 2005/06 and £1,424 million in 2004/05.
Total earnings per share from both continuing and discontinued operations were 51.3 pence per share in 2006/07, 135.6 pence per share in 2005/06 and 46.2 pence per share in 2004/05.
Cash flows
Cash flows from operating activities
Cash generated from continuing operations was £3,090 million in 2006/07, compared with £2,973 million in 2005/06 and £2,820 million in 2004/05. This includes cash outflows of continuing operations relating to exceptional items of £86 million, £115 million and £113 million respectively.
After reflecting cash flows relating to discontinued operations and tax paid, net cash inflow from operating activities was £2,958 million, compared with £2,971 million in 2005/06 and £3,308 million in 2004/05.
This included net corporate tax payments amounting to £313 million in 2006/07, £140 million in 2005/06 and £150 million in 2004/05.
Cash flows from investing activities
Cash outflows from investing activities were £4,277 million in 2006/07, compared with an inflow of £3,922 million in 2005/06 and an outflow of £2,975 million in 2004/05. This reflected £354 million spent on acquiring businesses in 2006/07 compared with nil in 2005/06 and £1,122 million in 2004/05, a £1,725 million net investment in financial investments (2005/06: net divestment of £25 million, 2004/05: net investment of £59 million) and disposal proceeds from discontinued operations of £27 million in 2006/07 (2005/06: £5,750 million, 2004/05: nil).
Excluding acquisitions, disposals and financial investments, cash outflows increased in 2006/07 compared with 2005/06 as a result of increased purchases of property, plant and equipment within continuing operations amounting to £2,185 million (2005/06: £1,657 million, 2004/05: £1,300 million). Investing activities of discontinued operations in the period resulted in a cash outflow of £47 million in 2006/07 (2005/06: £209 million, 2004/05: £450 million).
Cash flows from financing activities
Net cash raised by financing activities of £1,494 million in 2006/07 compared with £5,712 million used in 2005/06 and £325 million used in 2004/05. This included £26 million in 2006/07 and £1,957 million in 2005/06 in respect of the £2 billion return of value to shareholders, and £169 million in 2006/07 with respect to share buy-backs.
Annual Report and Accounts 2006/0743
Payments to providers of finance, in the form of net interest and dividends, totalled £1,372 million in 2006/07 compared with £1,498 million in 2005/06 and £1,390 million in 2004/05.
Net interest cash outflows reduced from £753 million in 2005/06 to £642 million in 2006/07. The decrease in 2006/07 reflected lower average net debt during the year, the weaker US dollar and the beneficial impact of refinancing debt. The reduction in 2005/06 to £753 million from £762 million in 2004/05 reflected the beneficial impact of refinancing debt, lower short-term interest rates, the weaker US dollar and receipt of £5.8 billion proceeds from the four network sales.
Returns to shareholders
Our total shareholder return over the year ended 31 March 2007 was 44.9% (2005/06: 22.9%, 2004/05: 19.0%) representing the increase in our share price over the year, assuming reinvestment of dividends and taking account of returns of capital.
Dividends in respect of the financial year
| | | | | | | | | | | | | | | | | | | | | |
| | | 2007 | | | 2006 | | | 2005 | | | 2004 | | | 2003 | |
| Dividends | | pence | | | pence | | | pence | | | pence | | | pence | |
| Interim | | | 10.9 | | | | 10.2 | | | | 8.5 | | | | 7.91 | | | | 6.86 | |
| Final | | | 17.8 | | | | 15.9 | | | | 15.2 | | | | 11.87 | | | | 10.34 | |
| |
| Total | | | 28.7 | | | | 26.1 | | | | 23.7 | | | | 19.78 | | | | 17.20 | |
| |
| | | | | | | | | | | | | | | | | | | | | |
| Dividends per ADS | | | $ | | | | $ | | | | $ | | | | $ | | | | $ | |
| |
| Interim | | | 1.03 | | | | 0.88 | | | | 0.79 | | | | 0.67 | | | | 0.54 | |
| Final | | | 1.76 | | | | 1.51 | | | | 1.38 | | | | 1.05 | | | | 0.84 | |
| |
| Total | | | 2.79 | | | | 2.39 | | | | 2.17 | | | | 1.72 | | | | 1.38 | |
| |
The proposed total ordinary dividend for 2006/07 amounts to £778 million or 28.7 pence per ordinary share. This represents an increase of 10% over the previous year’s ordinary dividend per share of 26.1 pence. The above amounts exclude the return of £169 million to shareholders in 2006/07 through a share buy-back programme and the return of £2 billion to shareholders in 2005/06 through the B share scheme.
The total ordinary dividend per share was covered 1.7 times by adjusted earnings from continuing operations per ordinary share (2005/06 covered 1.7 times, 2004/05 covered 1.7 times) and covered 1.7 times by earnings per ordinary share from continuing operations (2005/06 covered 1.6 times, 2004/05 covered 1.5 times).
The table above shows the ordinary dividends paid or payable by National Grid for the past five financial years. These dividends do not include any associated UK tax credit in respect of such dividends.
Dividends expressed in US dollars per ADS in the table above reflect the actual amount paid to ADS holders, expressed to two decimal places, with respect to all amounts with the exception of the final ordinary dividend for 2006/07, which reflects the declared US dollar amount expressed to two decimal places.
In accordance with IFRS, the final dividend proposed in respect of each financial year is reported in the financial statements for the subsequent year. As a consequence the final dividend proposed to shareholders for 2006/07 of 17.8 pence per share, amounting to £481 million, will be reported in the financial statements for the year ending 31 March 2008.
Dividend and share buy-back policies
We maintain our aim of increasing dividends per ordinary share expressed in sterling by 7% in each financial year through to 31 March 2008.
As part of our strategy announcement in November 2006 we are committed to return cash to shareholders through a share buy-back programme based on the after-tax cash flows generated from the recovery of stranded costs in the US. This is expected to amount to approximately $1.9 billion (£1 billion) over the period from 2006 to 2012. We have commenced a share buy-back programme to return this cash to shareholders, in 2006/07 this amounted to £169 million.
In addition, following the successful disposal of our UK wireless infrastructure operations for £2.5 billion on 3 April 2007, we have announced that we intend to return a further £1.8 billion to shareholders through expanding the share buy-back programme over the next two financial years.
This followed the return of £2 billion to shareholders in 2005/06 through a B share scheme, following the successful completions of the sales of four regional gas distribution networks for proceeds of £5.8 billion.
44National Grid plc
About the business
Our Transmission business operates in both the UK and US. As a consequence of the differences in the respective economic and regulatory environments, we report the results of the Transmission business as two segments: Transmission – UK and Transmission – US.
The external and regulatory environments in which our Transmission business operates are described on pages 21 and 22, our business drivers are described on page 23 and our objectives and strategy are set out on pages 26 to 29. Further information relevant to an understanding of our Transmission business is included below.
Transmission – UK
Our transmission operations in the UK encompass both electricity and gas transmission, comprising the following principal activities:
| | | |
Electricity transmission owner | | We own the electricity transmission system in England and Wales. |
| | |
| | Our electricity assets comprise approximately 4,479 miles of overhead line, about 420 miles of underground cable and 337 substations at 244 sites. |
| |
Electricity system operator | | We are the Great Britain System Operator, responsible for managing the operations of both the England and Wales transmission system that we own and also the two high-voltage electricity transmission networks in Scotland. |
| | | |
| | | Day-to-day operation of the Great Britain electricity transmission system involves the continuous real- time matching of demand and generation output, ensuring the stability and security of the power system and the maintenance of satisfactory voltage and frequency. |
| |
Gas transmission owner | | We own the gas national transmission system in Great Britain. |
| | |
| | This comprises approximately 4,326 miles of high pressure pipe and 26 compressor stations, connecting to 8 distribution networks and to third party independent systems for onward transportation of gas to end consumers. |
| |
Gas system operator | | We operate the gas national transmission system.
Day-to-day operation includes balancing supply and demand, maintaining satisfactory system pressures and ensuring gas quality standards are met. |
| |
French interconnector | | We own and operate the UK assets, and a portion of the subsea cables, that comprise the electricity interconnector between England and France as part of a joint arrangement with the French transmission operator. |
| |
LNG storage | | We own and operate four liquefied natural gas (LNG) storage facilities in Great Britain. |
| |
As electricity transmission owner and gas transmission owner, we own and maintain the physical assets, develop the networks to accommodate new connections and disconnections, and manage a programme of asset replacement and investment to ensure the long-term reliability of the respective networks.
As electricity system operator and gas system operator, we undertake a range of activities necessary for the successful, efficient delivery, in real-time, of secure and reliable energy. In the case of electricity, this involves the continuous real-time balancing of supply and demand, and balancing services that include
commercial arrangements with market participants that enable electricity demand or generation output to be varied. In the case of gas, we ensure the system is balanced with supply and demand at the end of each day. We are also required to maintain levels of short-term gas reserves to ensure domestic and other non daily metered gas supplies can be maintained during prolonged cold conditions.
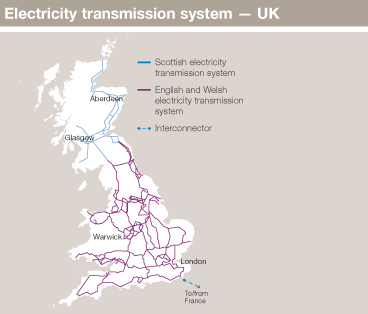
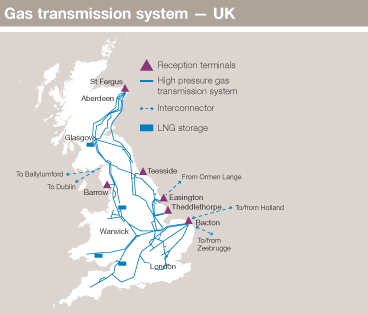
Through our subsidiary, National Grid Electricity Transmission plc, we are the sole holder of an electricity transmission licence for England and Wales. This licence also covers our role as the Great Britain System Operator, in accordance with the British Electricity Trading and Transmission Arrangements (BETTA). We have a duty under the Electricity Act 1989 to develop and maintain an efficient, coordinated and economical system of electricity transmission and to facilitate competition in the supply and generation of electricity. Charges to users of the transmission networks comprise two principal elements: transmission network use of system charges in respect of the electricity transmission owner activity and balancing services use of system charges in respect of the electricity system operator activity. We collect these charges from all Great Britain transmission network users and make payments to the owners of the Scottish transmission networks for the element of the transmission network use of system charges that relate to their networks.
Annual Report and Accounts 2006/0745
Through our subsidiary National Grid Gas plc, we hold a gas transporter licence in respect of the gas national transmission system. Detailed arrangements for the gas industry are provided through the Uniform Network Code approved by Ofgem, which defines the obligations, responsibilities and roles of the industry participants. We have a duty under the Gas Act 1986 to develop and maintain an efficient and economical pipeline system for the conveyance of gas. Under the terms of our licence, we receive income in our role as gas transmission owner through charges to shippers for entry and exit capacity and in our role as gas system operator through commodity charges.
Ofgem sets price controls in respect of the amounts that can be recovered by the owners and operators of electricity and gas infrastructure in the UK. The last price controls for our electricity and gas transmission activities ended on 31 March 2007, having respectively commenced as five year price controls for electricity on 1 April 2001 that were extended by one year, and five year price controls for gas that commenced on 1 April 2002. The new five year price control periods for both electricity and gas transmission activities commenced on 1 April 2007.
Our LNG storage business is managed as a separate business from the gas transmission business; however, it is regulated under our gas operators’ licence. A portion of LNG storage capacity is set aside to support network operating requirements, with the remaining capacity sold to gas shippers.
Under the Energy Act 2004, the holder of a transmission licence is prohibited from operating an interconnector and so the elements of the interconnector assets that we operate were transferred to a new subsidiary on 14 August 2006, the date at which the relevant part of the legislation came into force. The French elements of the interconnector are owned by Réseau de Transport d’Electricité (RTE), the French transmission operator.
Price controls
The charges that we can make for access to our UK electricity and gas transmission systems are determined by a formula linked to the retail price index (RPI). Up until 31 March 2007, these were set at RPI -1.5% for electricity and RPI -2% for gas. These formulae are based upon Ofgem’s estimates of operating expenditure, capital expenditure and asset replacement together with an allowed rate of return. The rate of return up until 31 March 2007 was set at a real pre-tax rate of 6.25% on our regulatory asset value for both our electricity and gas networks.
Our electricity regulatory asset value as of 31 March 2007 is currently £6.0 billion (£5.6 billion March 2006) and for gas it is £3.3 billion (£2.8 billion March 2006).
In the UK, where our capital investment is determined to be efficiently invested by Ofgem, we obtain a rate of return on that investment. The new price control allows a return of 4.4% post-tax real rate of return on our regulatory asset value.
In the UK, we are subject to an incentive scheme based on the reliability of the electricity transmission network in England and Wales. This is based on achieving reliability in excess of 99.9999%. For 2006/07, there was the potential to earn additional revenue up to 1% if loss of supply is less than 248 MWh. For loss of supply in excess of 274 MWh, up to a collar of 653 MWh, we could potentially lose up to 1.5% of revenue. For 2007/08 an identical incentive scheme is in place.
Both our UK gas and electricity system operations have incentive schemes where, if we operate our networks more efficiently than Ofgem’s forecasts, we can increase our revenues. For electricity, we have an external cost scheme that covers the costs incurred in balancing the system. We also have an internal cost incentive scheme that covers the internal costs of the system operator function. Our electricity system operator external incentive, the Balancing Services Incentive Scheme (BSIS), has historically been agreed on an annual basis. For the 2006/07 scheme, we decided not to accept Ofgem’s proposals for the BSIS target as we considered that neither of Ofgem’s external proposals offered an appropriate balance of risk and reward. Normal arrangements for the operation of the system and management of payments continued, but without a financial incentive on National Grid. We are at all times obligated under our electricity transmission licence to operate the system in an economic and efficient manner. For 2007/08, we have accepted a cost target of £430 million to £445 million. We retain 20% of any cost performance under this target deadband, up to a cap of £10 million and we incur 20% of any cost outturn above the deadband, up to a collar of £10 million.
For gas, we have eight incentive schemes covering activities such as cost of investment for additional capacity, managing constraints, market information provision, the cost of purchasing shrinkage gas (gas used in operating the system or lost during transport) and other gas system operation costs.
Transmission – US
In the US, we are involved in electricity transmission and our Transmission – US segment has the following principal activities:
| | | |
Electricity
transmission
owner | | We own and operate an electricity transmission network of approximately 8,600 miles spanning upstate New York, Massachusetts, Rhode Island, New Hampshire and Vermont. Our US electricity transmission facilities operate at voltages ranging from 69 kV to 345 kV, utilising nearly 8,500 miles of overhead lines, 89 miles of underground cable and 501 substations. |
| | | |
| | | We are the largest electricity transmission service provider in the northeastern US by reference to the length of these high-voltage transmission lines. |
| |
Canadian
interconnector | | We own and operate a 139 mile direct current transmission line rated at 450 kV that is a key section of an interconnector between New England and Canada. |
| |
46National Grid plc
In New England and New York, our transmission business operates within two independent system operators, ISO New England and New York ISO. These non-profit entities are the system operators for the New England and New York networks. The independent system operators are responsible for operating organised wholesale markets for energy, operating reserves and capacity, for maintaining the operating reliability of the New England and New York networks, for coordinating the activities of the transmission owners, and for managing transparent transmission expansion planning processes.
We are one of several transmission owners operating within each of these independent system operators. The transmission owners are responsible for certain aspects of the operation of the facilities they each own, such as maintenance, equipment restoration and switching operations. National Grid works closely with the independent system operators in New England and New York to support efficient market and network operations and transmission investment.
Rate plans
Revenue for our transmission business in New England and New York is collected from transmission customers, including our Electricity Distribution business, pursuant to tariffs approved by state utility commissions and by the Federal Energy Regulatory Commission.
In New York, capital expenditure in the rate plan for transmission was set at historic levels, which are significantly lower than required to maintain a safe and reliable network. For the past three years, we have overspent rate plan levels by a factor of at least two.
This coming year, our plans are to spend at a level similar to 2006/07. The rate plan includes provisions for us to petition the New York Public Service Commission for recovery of incremental investment.
In New England, the tariff allows for recovery of, and on, capital expenditures as new investment enters service, bringing immediate revenue benefits.
In the US, we are subject to reliability penalties if the combined performance of our electricity distribution and transmission networks in New York fails to meet targets associated with the number and duration of disturbances that impact customers.
The New York rate plan is oriented around efficient operations. To the extent that we perform necessary activities and spend less than the forecast operating costs set in the rate plan, it equates to increased income for shareholders. Part of the rate plan deals with forecast energy delivery. To the extent that more energy is delivered, we increase revenue. Conversely, if we deliver less than forecast, our revenue goes down.
In New England, efficient operations are also key; however, the rate structure is such that network availability, energy delivery and operational expenditure are all pass-through items.
Current and future developments
In addition to the current and future developments described on pages 24 to 25, the following developments are relevant to the Transmission business.
UK price controls
The previous price control arrangements for our electricity and gas transmission networks in the UK ceased on 31 March 2007 and the next price control period covers the period from 1 April 2007 to 31 March 2012.
We have accepted in principle Ofgem’s final proposals in respect of our role as owner of electricity and gas transmission networks. The key elements of these proposals are a 4.4% post-tax real rate of return on our regulatory asset value, a £4.4 billion baseline five year capital expenditure allowance and a £1.2 billion five year operating expenditure allowance. Following our acceptance in principle of the proposals we have worked closely with Ofgem to agree the necessary licence amendments to enact the final proposals. This process should complete during the first half of 2007.
We have accepted Ofgem’s final proposals for the system operator schemes to apply for one year from 1 April 2007 for both gas transportation and electricity transmission.
Other UK developments
We continue to work with the UK Government and Ofgem to make possible the necessary investments in the electricity transmission network to support the development of renewable energy projects. The final proposals from Ofgem for transmission investment for renewable generation recognised the need to invest in our networks to accommodate renewables and, together with the transmission price control, funding costs for £350 million of investment will be allocated to our electricity transmission owner activity allowable revenue for the upgrade of our Anglo-Scottish interconnector and associated works (conditional on the satisfactory outcome of key planning consents). At this time, access is being sought by approximately 12 GW of renewable generation consisting of 165 projects, each with connection agreements in Scotland. For England and Wales connection offers have been made to an additional 5 GW of renewable generation.
A number of gas pipeline and compressor projects are being progressed to respond to new import pipelines and gas import facilities. Around 90 miles of gas pipeline has been constructed from Ganstead to Asselby in the region of Humberside and from Pannal in North Yorkshire to Nether Kellet in Lancashire to enable increased imports at Easington. Around 200 miles of new pipeline is being built in South Wales and Gloucestershire to cater for the Milford Haven importation facility. Following the decision of the High Court to set aside the planning consent granted by Neath Port Talbot Council for Cilfrew pressure reduction installation on the Milford Haven pipeline, work on the installation was suspended. On 10 April 2007, National Grid issued a force majeure notice, under our contract with the shippers, as this event, which was outside our control, may result in us not being able to provide, or to be delayed in providing, the full amount of capacity that has been allocated to gas shippers using the Milford Haven facility. On 15 May 2007, Neath Port Talbot Council voted again on our planning application, which was then approved. National Grid is now assessing the actual delay (if any) of providing the full amount of capacity that has been allocated to the shippers.
Annual Report and Accounts 2006/0747
US regulatory developments
In the US, consistent with the Federal Energy Regulatory Commission’s (FERC) transmission pricing policy, we applied for an increased rate of return on our investment in transmission assets in New England. FERC approved our application in October 2006, but FERC has yet to determine its response to several parties which have sought to appeal this approval.
We have been pursuing a regional planning process with the New York ISO to identify regional reliability and economic transmission needs. Progress has been made and the New York ISO is in its second year of its reliability planning process implementation. We will be proposing a regulated transmission solution to reliability needs identified by the New York ISO. In addition, as part of FERC’s recent open access transmission tariff reform, the New York ISO is developing a process to address economic planning.
Emissions trading
The second year of Phase 1, from 1 January 2005 to 31 December 2007, of the European Union emissions trading scheme commenced on 1 January 2006. Its purpose is to reduce the level of carbon dioxide emitted by placing a financial incentive on participants to reduce their emissions of this greenhouse gas Allowances are granted to participants in accordance with a national allocation plan and any shortfall or surplus can be traded with other participants.
Our total carbon dioxide emissions between 1 January and 31 December 2006 in the UK, for installations captured by the scheme, were below our allocation and so the scheme did not have a significant financial effect on our results in 2006/07. We similarly do not expect the scheme to have a significant impact on our results in 2007 or 2008. The national allocation plan detailing installation level allowances for Phase 2 of the European Union emissions trading scheme, covering the period from 1 January 2008 to 31 December 2012, has now been published by the UK Department of the Environment, Food and Rural Affairs. Our allocation of allowances for Phase 2 of the scheme is lower than for Phase 1 of the scheme but in line with expectations.
Performance during the year
In the UK, the winter of 2006/07 saw demand from the electricity transmission network in England and Wales hit a peak of 52.1 GW. This compares with 53.7 GW for 2005/06 and 53.3 GW for 2004/05. The total amount of electricity transmitted for 2006/07 was 303,721 GWh compared with 312,339 GWh for 2005/06 and 308,305 GWh for 2004/05. 2006/07 saw a maximum gas demand of 436 mcm on 8 February 2007. This increase on the previous year’s peak of 411 mcm was partly due to a particularly cold snap at the beginning of February.
In the US, the summer of 2006/07 saw demand from the electricity transmission networks in New England and New York hit a combined peak load of 14.0 GW. This compares with 13.2 GW for 2005/06 and 11.8 GW for 2004/05.
Descriptions of our progress against our overall objectives in the areas of performance, growth, talent, relationships (including customer service) and responsibility are set out on pages 30 to 43. We include below further information specific to Transmission with respect to our performance, growth and customer service objectives.
Performance
Our progress against our operating objectives during the year includes the following:
| | | |
| Objective | | Performance |
Safety | | In the UK during 2006/07 there were 13 lost time injuries compared with 14 in 2005/06 and 8 in 2004/05. The lost time injury frequency rate was 0.25 in 2006/07 compared to 0.28 in 2005/06 and 0.17 in 2004/05. |
| | | |
| | | Our US electricity transmission lost time injury frequency rate increased to 0.19 in 2006/07 from zero for 2005/06 as a result of one lost time injury during the year. |
| |
Reliability | | UK electricity transmission network reliability in 2006/07 was 99.9999%, compared with 99.9999% in 2005/06 and 99.99998% in 2004/05. Gas transmission network reliability was 100% in all three years. |
| | | |
| | | Average annual availability of our UK electricity transmission network in 2006/07 was 95.02%, compared with 95.09% in 2005/06 and 95.3% in 2004/05. Reduced availability reflects the increased amount of asset replacement activity to ensure the reliability of the network for years to come.
System availability at winter peak demand was 98.2% in 2006/07, 97.9% in 2005/06 and 97.6% in 2004/05. |
| | | |
| | | UK gas compressor fleet performance during 2006/07 declined slightly with the average time between compressor failures at 6% below our five year average, compared with 10% and 24% above the five year average time between failures in 2005/06 and 2004/05. |
| | | |
| | | In the US, our average annual network availability in 2006/07 was 98.1%. This compared with 98.5% in 2005/06 and 98.3% in 2004/05. |
| | | Overall average network availability was similar in New England and New York, for both summer and winter. |
| |
Efficiency | | We have been undertaking a number of internal business process reviews to seek out further savings without compromising our other objectives.
Efficiency is reflected in our financial performance, which is discussed below. |
| |
Financial
performance | | UK adjusted operating profit of £946 million is 12% higher than 2005/06. US adjusted operating profit of £108 million is 9% lower than 2005/06 on a constant currency basis. These are discussed in further detail in the financial results sections following. |
| |
Growth
Investment – UK
Investment in electricity and gas transmission systems is, by its nature, variable and is largely driven by changing sources of supply and asset replacement requirements. The gas transporter and electricity transmission licences also oblige us to provide connections and capacity upon request.
The bulk of the current UK electricity transmission network was installed during the 1960s and 1970s, with main plant asset lives typically of between 40 and 50 years. We have increased our level of investment as, over the next few years, we replace parts of our UK electricity network as these assets become due for renewal. In addition, parts of the gas transmission network are reaching the end of their lives. These are mainly compressor stations, control systems and valves (ie above ground assets and not the high pressure pipes). This, together with work required
48National Grid plc
to meet changing supply sources, means that the UK electricity and gas transmission business will be embarking on a significant increase in investment and network renewal.
Capital investment in the replacement, reinforcement and extension of the UK electricity and gas transmission systems in 2006/07 was £1,235 million, compared with £849 million in 2005/06 and £529 million in 2004/05.
2006/07 has seen a substantial increase in the level of capital investment in gas pipeline projects, some £244 million higher than 2005/06 (2005/06 £156 million higher than 2004/05).
In addition in 2006/07, 48% or £290 million (2005/06: 50% or £265 million, 2004/05: 41% or £163 million) of electricity transmission capital expenditure was related to asset replacement, reflecting the increasing need to replace transmission network assets, many of which were commissioned in the 1960s.
| | | | | | | | | | | | | |
| |
| | | Years ended 31 March | |
| | | 2007 | | | 2006 | | | 2005 | |
| | | £m | | | £m | | | £m | |
| |
| Property, plant & equipment | | | 1,218 | | | | 840 | | | | 464 | |
| Intangible assets | | | 17 | | | | 9 | | | | 65 | |
| |
| Capital investment | | | 1,235 | | | | 849 | | | | 529 | |
| |
Investment – US
We expect a significant increase in investment in New England to deliver our regional system expansion planning process projects. There will also be an increase in investment in New York in order to address asset replacement requirements and increase safety and reliability of the system.
Capital investment in the replacement, reinforcement and extension of the US electricity transmission networks in 2006/07 was £108 million compared with £91 million in 2005/06 and £74 million in 2004/05. This increase in capital expenditure principally reflects additional planned asset replacement in New England to increase reliability and system security as well as facilitating an increase in transfer capability into Boston.
Customer service
In the US, our principal customer is our own Electricity Distribution business and so customer service activities mainly comprise supporting our Electricity Distribution business in trying to improve our service to commercial and domestic consumers.
Financial results – UK
The results for the Transmission – UK segment for the years ended 31 March 2007, 2006 and 2005 were as follows:
| | | | | | | | | | | | | |
| |
| | | Years ended 31 March | |
| | | 2007 | | | 2006 | | | 2005 | |
| Continuing operations | | £m | | | £m | | | £m | |
| |
| Revenue | | | 2,816 | | | | 2,710 | | | | 1,995 | |
| Other operating income | | | 6 | | | | – | | | | – | |
Operating costs excluding
exceptional items and remeasurements | | | (1,876 | ) | | | (1,866 | ) | | | (1,136 | ) |
| |
| Adjusted operating profit | | | 946 | | | | 844 | | | | 859 | |
| Exceptional items | | | (10 | ) | | | (1 | ) | | | (2 | ) |
| |
| Operating profit | | | 936 | | | | 843 | | | | 857 | |
| |
2006/07 compared with 2005/06
The principal movements between 2005/06 and 2006/07 can be summarised as follows:
| | | | | | | | | | | | | |
| |
| | | Revenue | | | | | | | |
| | | and other | | | | | | | |
| | | operating | | | Operating | | | Operating | |
| | | income | | | costs | | | profit | |
| | | £m | | | £m | | | £m | |
| |
| 2005/06 results | | | 2,710 | | | | (1,867 | ) | | | 843 | |
| Add back 2005/06 exceptional items | | | – | | | | 1 | | | | 1 | |
| |
| 2005/06 adjusted results | | | 2,710 | | | | (1,866 | ) | | | 844 | |
| Allowed revenues | | | 106 | | | | (3 | ) | | | 103 | |
| Timing on recoveries | | | (64 | ) | | | – | | | | (64 | ) |
| Transmission owner depreciation | | | – | | | | 27 | | | | 27 | |
| Other | | | 70 | | | | (34 | ) | | | 36 | |
| |
| 2006/07 adjusted results | | | 2,822 | | | | (1,876 | ) | | | 946 | |
| 2006/07 exceptional items | | | – | | | | (10 | ) | | | (10 | ) |
| |
| 2006/07 results | | | 2,822 | | | | (1,886 | ) | | | 936 | |
| |
Revenue increased by £106 million in 2006/07 compared to 2005/06, driven by an increase of £85 million in electricity transmission owner revenue from the regulatory settlement with Ofgem for the extension of the previous price control for 2006/07, a 6% increase in real terms. The balance of the increase arose from higher incentivised costs associated with balancing the electricity system, which flow through to revenue, higher pass-through costs, partly offset by unfavourable timing impacts on gas revenue and lower interconnector auction income.
Operating costs, excluding exceptional items and remeasurements, increased by £4 million in 2006/07 compared to 2005/06. Transmission owner depreciation and amortisation decreased by £27 million due to the impact of accelerated depreciation charges and early asset write offs in 2005/06 partly offset by an increase in depreciation reflecting the increasing capital programme. Higher other operating costs reflected higher incentivised BSIS costs resulting from higher response and constraint costs partly offset by lower margin costs, higher pass-through costs and higher expenditure relating to tower foundations and steelwork (in future periods this expenditure will be remunerated as part of the regulatory asset base). Gas shrinkage costs decreased mainly due to warmer weather resulting in lower volumes.
The £102 million increase in UK electricity and gas transmission adjusted operating profit comparing 2006/07 with 2005/06 (£15 million decrease comparing 2005/06 with 2004/05) reflects the movements in revenue and operating costs, excluding exceptional items, as described above.
The £10 million exceptional charge in 2006/07 is driven by the establishment of a shared services function and the implementation of a review of our business processes.
2005/06 compared with 2004/05
| | | | | | | | | | | | | |
| |
| | | | | | | Operating | | | Operating | |
| | | Revenue | | | costs | | | profit | |
| | | £m | | | £m | | | £m | |
| |
| 2004/05 results | | | 1,995 | | | | (1,138 | ) | | | 857 | |
| Add back 2004/05 exceptional items | | | – | | | | 2 | | | | 2 | |
| |
| 2004/05 adjusted results | | | 1,995 | | | | (1,136 | ) | | | 859 | |
| LNG storage | | | 34 | | | | (4 | ) | | | 30 | |
| French interconnector | | | 43 | | | | (3 | ) | | | 40 | |
| BSIS | | | 214 | | | | (235 | ) | | | (21 | ) |
| Scottish networks pass-through | | | 259 | | | | (259 | ) | | | – | |
| Depreciation and amortisation | | | – | | | | (83 | ) | | | (83 | ) |
| Other | | | 165 | | | | (146 | ) | | | 19 | |
| |
| 2005/06 adjusted results | | | 2,710 | | | | (1,866 | ) | | | 844 | |
| 2005/06 exceptional items | | | – | | | | (1 | ) | | | (1 | ) |
| |
| 2005/06 results | | | 2,710 | | | | (1,867 | ) | | | 843 | |
| |
Annual Report and Accounts 2006/0749
The £715 million increase in UK electricity and gas transmission revenue comparing 2005/06 with 2004/05 was mainly due to higher incentivised costs associated with balancing the electricity system, which flow through to revenue, and the collection of transmission use of system charges under the new BETTA on behalf of the Scottish network owners. Beneficial outcomes from the capacity auctions in the LNG and electricity interconnector markets resulted in higher revenues compared to 2004/05. Other higher revenues reflected favourable timing and inflationary impacts, and higher pass-through of costs partly reduced by the transfer of the Scottish interconnector into the electricity transmission regulated business under BETTA.
Operating costs, excluding exceptional items and remeasurements, increased by £730 million in 2005/06 compared with 2004/05. This was due to higher incentivised BSIS costs resulting from higher constraint, margin and energy balancing costs, and transmission use of system charges owed to the Scottish network owners under BETTA which became effective from 1 April 2005. Transmission owner depreciation and amortisation increased by £83 million due to higher accelerated depreciation associated with early asset write offs and an increase in core depreciation reflecting the acceleration in the capital programme. Higher other operating costs reflected higher pass-through costs partly offset by the transfer of the Scottish interconnector as referred to above.
The £15 million decrease in adjusted operating profit comparing 2005/06 with 2004/05 reflects the movements in revenue and operating costs, excluding exceptional items, as described above.
The £1 million exceptional charge in 2005/06 related to elements of the Way Ahead programme in Gas Distribution in the UK that affected Transmission.
Financial results – US
The average exchange rates used to translate the results of US operations during 2006/07, 2005/06 and 2004/05 were $1.91:£1, $1.79:£1 and $1.87:£1 respectively.
| | | | | | | | | | | | | |
| | | 2007 | | | 2006 | | | 2005 | |
| | | £m | | | £m | | | £m | |
| Revenue | | | 270 | | | | 310 | | | | 284 | |
| Operating costs excluding exceptional items and remeasurements | | | (162 | ) | | | (183 | ) | | | (158 | ) |
| |
| Adjusted operating profit | | | 108 | | | | 127 | | | | 126 | |
| Exceptional items | | | (1 | ) | | | – | | | | (7 | ) |
| |
| Operating profit | | | 107 | | | | 127 | | | | 119 | |
| |
2006/07 compared with 2005/06
The principal movements between 2005/06 and 2006/07 can be summarised as follows:
| | | | | | | | | | | | | |
| | | | | | | Operating | | | Operating | |
| | | Revenue | | | costs | | | profit | |
| | | £m | | | £m | | | £m | |
| 2005/06 results and adjusted results | | | 310 | | | | (183 | ) | | | 127 | |
| Exchange movements | | | (19 | ) | | | 11 | | | | (8 | ) |
| |
| 2005/06 constant currency results | | | 291 | | | | (172 | ) | | | 119 | |
| Tariff adjustment not repeated | | | (7 | ) | | | 7 | | | | – | |
| GridAmerica | | | (4 | ) | | | 3 | | | | (1 | ) |
| Other changes | | | (10 | ) | | | – | | | | (10 | ) |
| |
| 2006/07 adjusted results | | | 270 | | | | (162 | ) | | | 108 | |
| Exceptional items | | | – | | | | (1 | ) | | | (1 | ) |
| |
| 2006/07 results | | | 270 | | | | (163 | ) | | | 107 | |
| |
The £21 million decrease in revenue comparing 2006/07 with 2005/06 on a constant currency basis was due to the impact of the timing of a revenue adjustment mechanism in New York, lower US interconnector revenues reflecting a declining investment base and the November 2005 closure of GridAmerica (£4 million in 2005/06). In addition, there was no repeat of the one-off tariff adjustment of £7 million in 2005/06 to revenues collected from Electricity Distribution (see below). Partly offsetting these decreases was higher revenue from New England due to a higher investment base.
Operating costs, excluding exceptional items and remeasurements, decreased by £10 million in 2006/07 compared with 2005/06. This is mainly due to the non-recurrence of the one-off £7 million operating cost adjustment reflected in 2005/06 as referred to above and a £3 million reduction in operating costs following the closure of GridAmerica in 2005/06.
The £19 million overall decrease in adjusted operating profit and £20 million decrease in operating profit in 2006/07 compared with 2005/06 reflects the £11 million movement in revenue and operating costs as described above, together with unfavourable exchange movements of £8 million and, in the case of operating profit, £1 million exceptional costs relating to the proposed acquisition of KeySpan.
2005/06 compared with 2004/05
The principal movements between 2004/05 and 2005/06 can be summarised as follows:
| | | | | | | | | | | | | |
| | | | | | | Operating | | | Operating | |
| | | Revenue | | | costs | | | profit | |
| | | £m | | | £m | | | £m | |
| 2004/05 results | | | 284 | | | | (165 | ) | | | 119 | |
| Add back 2004/05 exceptional items | | | – | | | | 7 | | | | 7 | |
| |
| 2004/05 adjusted results | | | 284 | | | | (158 | ) | | | 126 | |
| Exchange movements | | | 13 | | | | (7 | ) | | | 6 | |
| |
| 2004/05 constant currency adjusted results | | | 297 | | | | (165 | ) | | | 132 | |
| Tariff adjustment | | | 7 | | | | (7 | ) | | | – | |
| Other changes | | | 6 | | | | (11 | ) | | | (5 | ) |
| |
| 2005/06 results and adjusted results | | | 310 | | | | (183 | ) | | | 127 | |
| |
The £13 million increase in revenue comparing 2005/06 with 2004/05 arose from a one-off tariff adjustment of £7 million to revenues collected from Electricity Distribution under the regional transmission organisation tariff and generally higher returns in New England, the beneficial timing impact of revenue collection in New York and higher pass-through costs in New England and the US interconnector. Partly offsetting these increases was lower revenue from GridAmerica, following cessation of its operations with effect from 1 November 2005, and a one-off refund associated with a prior period billing error in New England.
Operating costs, excluding exceptional items and remeasurements, increased by £18 million in 2005/06 compared with 2004/05. This was due to the £7 million operating cost adjustment as referred to above, higher payroll and associated benefits costs in New York, a one-off write off of interconnection-related costs and generally higher costs to address reliability issues, partly offset by lower operating costs in GridAmerica following its cessation of operations.
The £1 million increase in adjusted operating profit and operating profit in 2005/06 compared with 2004/05 arose from favourable exchange impacts of £6 million mainly offset by the £5 million movement in revenue and operating costs described above.
50National Grid plc
About the business
Our Gas Distribution business operates in the UK and the US. As a consequence of the differences in the respective economic and regulatory environments, we report the results of Gas Distribution as two segments: Gas Distribution – UK and Gas Distribution – US.
The external and regulatory environments in which our Gas Distribution business operates are described on pages 21 and 22, our business drivers are described on page 23 and our objectives and strategy are set out on pages 26 to 29. Further information relevant to an understanding of our Gas Distribution business is included below.
Gas Distribution – UK
Our Gas Distribution – UK segment comprises almost half of Great Britain’s gas distribution system, comprising four of the eight regional gas distribution networks in Great Britain. Our networks consist of approximately 82,000 miles of distribution pipelines and we transport gas on behalf of approximately 34 active gas shippers from the gas national transmission system to around 11 million consumers.
We also manage the national emergency number (0800 111 999) for all of the gas distribution networks and for other gas transporters in the UK. During 2006/07 we handled approximately 2.3 million calls to the national emergency number.
Detailed arrangements for transporting gas are provided through the Uniform Network Code as approved by Ofgem from time to time, which defines the obligations, responsibilities and roles of the industry participants. We hold a single gas distribution transporter licence, which authorises us to operate the four gas distribution networks we own. However, each of our four networks has its own separate price control, which establishes the prices we can charge for the services provided by each network.
The price controls that applied to our UK gas distribution networks up until 31 March 2007 took into account Ofgem’s estimates of operating expenditure, capital expenditure, replacement expenditure and allowed rate of return (at a real pre-tax rate of 6.25% on our regulatory asset value).
Ofgem has extended each current five year gas distribution price control for a further year through an extension price control to cover the year ending 31 March 2008. The next full price control period will now cover the period from 1 April 2008 to 31 March 2013 as described on page 52. As at 31 March 2007, our regulatory asset value is estimated at approximately £6 billion. Each network’s separate regulatory asset value associated with its distribution assets was originally allocated to it using an estimate of the UK Gas Distribution business’s regulatory asset value as at 1 April 2002. The allocation was aimed at minimising unnecessary regional differentials in transportation charges.
In the UK, the price control formulae specified a maximum allowed revenue assigned to each network. Each formula has a 65% fixed, 35% variable revenue associated with transportation volume changes, a mains replacement incentive mechanism and the pass-through of prescribed rates and gas transporter licence fees. In any year, collected revenue can be more or less than is allowed under the price control formula, although charges are set broadly to recover allowed revenue. Any difference is carried forward and our charges are adjusted accordingly in future periods.
Replacement expenditure maintains the safety and reliability of the network, by replacing older gas pipes with modern pipes. Ofgem treats 50% of projected replacement expenditure as recoverable during the price control period and 50% as recoverable over future years. Each network is subject to its own mains replacement incentive mechanism and retains 33% of any outperformance against Ofgem’s annual cost targets as additional return or, alternatively, bears 50% of any overspend if it underperforms.
Ofgem has established standards of service we are required to meet that apply to our operations. These include: overall standards of service, for example answering 90% of all calls to the national gas emergency number within 30 seconds of the call being connected and attending 97% of reports of a gas escape or other gas emergency within the required timescale; connections standards of service that require us to provide connections to customers to agreed timescales after an unplanned interruption; and guaranteed standards of service for our other transportation services. Compensation is paid to consumers for any failures to meet both these and the connections standard of service.
Annual Report and Accounts 2006/0751
Gas Distribution – US
Our Gas Distribution operations in New York and Rhode Island provide services to 571,000 customers in 216 communities across upstate New York, and 248,000 customers in 33 communities in Rhode Island. Our network of 11,800 miles of gas pipelines in these two states covers approximately 5,460 square miles.
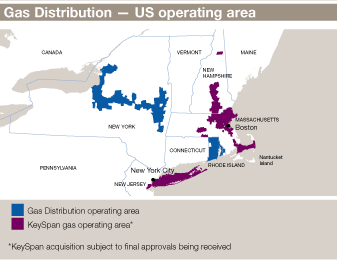
In the US, Gas Distribution provides the same core services of operation and emergency response, as well as billing, customer service, and supply services. Except for residential and small customers in Rhode Island, customers may purchase their supply from independent providers, with the option of billing for those purchases to be provided by National Grid. The gas industry is less deregulated in the US than in the UK, in that the majority of gas supplied is still sold by local regulated utilities to their customers. Regulated utilities, such as our gas distribution operations, purchase gas from gas producers, and gas transporters then transport this gas on the independent interstate pipeline system and into regulated utilities’ gas distribution networks for delivery to customers. In our case, we receive gas from the inter-state pipeline system at 36 gate stations. The interstate pipeline system and local gas distribution networks are also used to deliver gas on behalf of customers who have purchased gas from independent suppliers or direct from gas producers.
In the US, our delivery rates comprise a combination of a per customer charge, a demand charge and a price per additional therm of gas delivered. The allocation between these components varies by size of customer.
New York
In New York, delivery rates are set to recover estimates of operating costs, capital investment and an allowed rate of return inclusive of a return on equity ranging from 10.6% to 12.6% depending on the achievement of certain customer related performance metrics. Gas delivery rates were frozen until the end of the 2004 calendar year, after which a request to change prices can be made at any time. Gas commodity costs are fully recovered from customers. An adjustment to certain customer bills is made during the months of October to May to cap our exposure to sales variations caused by weather. Commodity prices are applied almost entirely on a per therm basis.
We also have a number of service standards for our New York operations, which are subject to penalties for non-achievement, including: the maximum rate of customer complaints to the state regulator; minimum satisfaction rates for residential, commercial and industrial customer billing and service transactions; minimum percentage of meters actually read compared to readings scheduled; minimum percentage of customer calls answered within 30 seconds and minimum enrolment of customers into the low income customer assistance programme; maximum number of outstanding gas leaks requiring repair measured on 31 December of each year; maximum number of reportable incidents resulting from our failure to respond to a request to stakeout our facilities in 48 hours; and cathodically protecting an agreed-upon mileage of pre-1971 installed wrapped steel gas main.
Our New York gas distribution operations are also measured on our performance in responding to gas emergency calls within 30, 45 and 60 minutes without associated financial penalties.
Rhode Island
In Rhode Island, delivery rates are set to recover estimates of operating costs, capital investment and an allowed rate of return of 9.09%. Gas commodity rates are adjusted every November subject to approval by the state regulator and they are also adjusted whenever a significant over- or under-collection of gas costs is expected. Gas commodity costs are fully recovered from customers. There is also a surcharge mechanism that allows for the recovery of environmental response costs, any recovery or returns to customers as a result of a weather normalisation clause, a sharing of non-firm margins (non-firm margin earned from interruptible customers with the ability to switch to alternative fuels) and a portion of earnings in excess of an 11.25% return on equity.
The public utility commission in Rhode Island has established a number of service standards with associated non-achievement penalties, including: a benchmark percentage of abandoned customer calls and a benchmark percentage of calls answered within 60 seconds; a benchmark percentage of meters read during their normal read cycle; testing a predetermined amount of gas meters on an annual basis, as well as a benchmark percentage of meter testing initiated by customer request; meeting a benchmark percentage of customer service appointments; and benchmarks for responding to gas emergency calls within 30 minutes or less during normal working hours and 45 minutes or less after hours.
52National Grid plc
Current and future developments
In addition to the current and future developments described on pages 24 and 25, the following developments are relevant to the Gas Distribution business.
UK regulatory price control reviews
Ofgem has extended the current five year gas distribution price controls for a further year through extension price controls to cover the year ending 31 March 2008. The outcome of the formal review was an increase of 11% in allowed revenues for 2007/08. In addition, the balance between fixed and variable elements has changed, which will reduce the impact that volume changes, including weather, have on our revenue in 2007/08.
The next full price control period will now cover the period from 1 April 2008 to 31 March 2013. Initial proposals will be published at the end of May 2007 and we will be working closely with Ofgem up to the final proposals in December 2007.
Acquisition of gas operations in Rhode Island
As described on page 34 we successfully completed the acquisition from Southern Union Company of its gas distribution network in Rhode Island, substantially increasing the size of our US gas distribution operations.
KeySpan
The planned acquisition of KeySpan would result in the Gas Distribution business expanding to include operations in Long Island in New York, Massachusetts and New Hampshire. KeySpan is the fifth largest gas distribution company in the United States and the largest in the Northeast, with around 2.6 million customers and over 23,000 miles of gas mains and distribution pipelines.
Performance during the year
In the UK, actual gas consumption fell to 303 TWh in 2006/07, compared with 347 TWh in 2005/06 mainly due to very mild weather in 2006/07. Underlying levels of gas demand, excluding the effects of weather, also fell from 347 TWh in 2005/06 to 331 TWh in 2006/07, thought to be mainly due to the high levels of gas supply prices during 2006/07 affecting usage. The reduction was particularly noticeable for larger users.
In the US, gas consumption in upstate New York was 39.9 TWh (136 million dekatherms) for 2006/07 and 10.9 TWh (37 million dekatherms) in Rhode Island. This was slightly above the previous year due to colder temperatures and a lower average price.
Descriptions of our progress against our overall objectives in the areas of performance, growth, talent, relationships (including customer service) and responsibility are set out on pages 30 to 43. We include below further information specific to Gas Distribution with respect to our performance, growth and customer service objectives.
Performance
Progress against our performance objectives during the year included the following:
| | | |
| Objective | | Performance |
Safety | | There were no employee related fatalities during 2006/07 compared with one in 2005/06. |
| | | |
| | | In the UK, lost time injuries for the retained networks fell 12% in 2006/07 to 21, compared with 24 in 2005/06 and 20 in 2004/05. The lost time injury frequency rate fell to 0.16 in 2006/07 from 0.17 in 2005/06 and 0.35 in 2004/05 (2004/05 includes sold networks). |
| | | |
| | | In both the UK and US, we again exceeded our regulatory agreed targets on safety-related standards. In the UK, more than 98% of ‘uncontrolled’ gas escapes (where the gas leak cannot be controlled by turning the gas supply off at the meter) were attended within one hour, and more than 99% of ‘controlled’ gas escapes (where the gas leak can be controlled at the meter) were attended within two hours. In New York, we responded to 80% of gas escapes within 30 minutes (75% target), 93% within 45 minutes (target of 90%), and 97% within 60 minutes (target of 95%). In Rhode Island, we responded to 96% within 30 minutes (target of 91%), and 97% within 45 minutes (target of 93%). |
| | | |
| | | We have decommissioned approximately 1,850 km of gas pipes in 2006/07 exceeding the HSE target this year, compared with 1,724 km in 2005/06 and 1,458 km in 2004/05. |
| |
Reliability | | Over the year we have achieved all our standards of service set by Ofgem that relate to our gas transportation services in the UK and similarly in the US we have continuously improved the integrity of our gas distribution system by actively managing our critical leak backlogs and completing repairs. In the US we were ranked in the top three major gas utilities in all three metrics collected by the New York Department of Public Service as one means in the industry to assess system integrity, gas leaks discovered, main leaks/service leaks repaired. |
| |
Efficiency | | We have continued to drive operational efficiency through the streamlining of processes and best practice sharing between our UK and US operations. |
| |
Financial
performance | | The adjusted operating profit of Gas Distribution in the UK and the US combined was £480 million in 2006/07 compared with £530 million in 2005/06 and £457 million in 2004/05. Further information on the financial results of Gas Distribution – UK and Gas Distribution – US is provided on pages 54 and 55. |
| |
Our performance in the UK during 2006/07 under the current distribution network exit incentive scheme and the mains replacement incentive scheme was broadly neutral.
Annual Report and Accounts 2006/0753
A series of strategic development initiatives have been delivered in support of our aim to be the most efficient gas distribution network in the UK. Centralisation of many key processes has enabled us to place increased emphasis on safety and efficiency while sharing best practice across the organisation and delivering our office rationalisation programme. Centralising our asset management, job scheduling and dispatch processes has exploited our economies of scale while also maintaining alignment of our operational workforce across the network to satisfy consumer requirements.
Having completed our Way Ahead transformation in the UK, we are now concentrating on driving further process alignment across our UK business and bringing the US business in line with the operating model, that is the centralisation of indirect activities into hubs organised by common competencies or functions with direct activities remaining in the field local to the assets and customers. This common operating model will enable us to run our businesses more efficiently, driving continuous improvement and allowing the quick roll out of best practice sharing.
Our US operations have been active in sharing new technology (such as key hole excavation utilising core boring) with counterparts in the UK, as well as evaluating UK techniques (such as sealant for joint repair) for adaptation in the US. The use of new technology and materials is being evaluated to identify opportunities to increase worker productivity and great effort is being made to share these opportunities between the US and the UK. In Gas Distribution in the US, enhanced productivity and efficiency initiatives have been identified that incorporate best practices discovered by members of the National Grid and KeySpan integration teams. These initiatives are being implemented now, where possible, or will be implemented immediately after the approval of the proposed acquisition of KeySpan.
Growth
Investment – UK
Gross investment in the reinforcement, extension and replacement of the UK gas distribution network was £490 million in 2006/07 compared with £444 million in 2005/06 and £359 million in 2004/05. This excludes investment in the four regional gas distribution networks that were sold on 1 June 2005.
| | | | | | | | | | | | | |
| |
| | | 2007 | | | 2006 | | | 2005 | |
| Years ended 31 March | | £m | | | £m | | | £m | |
| |
| Capital expenditure | | | 157 | | | | 149 | | | | 120 | |
| Replacement expenditure | | | 333 | | | | 295 | | | | 239 | |
| |
| Gross investment in the continuing business | | | 490 | | | | 444 | | | | 359 | |
| |
The increase in capital expenditure in 2006/07 compared with 2005/06 and in 2005/06 compared with 2004/05 was because of a higher level of investment in the reinforcement of high pressure pipelines, such projects being dependent on forecasts of future demand, as well as higher expenditure on new connections and the replacement of commercial vehicles. The level of investment in high pressure pipelines and reinforcement mains continued during 2006/07 together with higher information technology expenditure to replace obsolete equipment in system control, operational and support activities.
Replacement expenditure has increased by 39% since 2004/05, reflecting the substantial increase in planned workload under the long-term mains replacement programme agreed with the Health and Safety Executive. During the second year of our alliance partnerships for Gas Distribution, we have laid approximately 1,850 km of gas mains with an increasing proportion of our workload comprising complex replacement of large diameter mains.
Performance under the mains replacement incentive scheme has been held broadly neutral in 2006/07.
Investment – US
Capital expenditure in the replacement, reinforcement and extension of our US gas distribution networks was £36 million in 2006/07, £25 million in 2005/06 and £30 million in 2004/05.
After excluding the effect of exchange movements of £2 million in 2006/07 compared with 2005/06, capital expenditure increased by £13 million due to increased spending of £6 million in Rhode Island. After excluding the effect of exchange movements of £1 million in 2005/06 compared with 2004/05, capital expenditure decreased by £6 million due to the completion of the automatic meter reading project in New York.
Acquisition of Rhode Island gas operations
On 24 August 2006, we acquired from Southern Union Company its Rhode Island gas distribution network for approximately £269 million, including acquisition costs of £3 million, plus the assumption of £41 million of debt. The acquisition expanded our gas distribution business by 245,000 customers and added 3,000 miles of pipeline. We agreed to carry out the existing rate plan and have committed to file a new rate plan within one year of the acquisition date. Under a regulatory agreement, rates will be frozen for at least 12 months after completion of the transaction, and we may file a rate case within those 12 months that will address future rates. The Rhode Island gas operations have largely been assimilated into Gas Distribution in the US. Our asset management practices have been adopted which will lead to more effective use of financial resources, as well as greater utilisation of existing infrastructure.
Customer service
In the UK, we have achieved all our connections standards of service over the year, along with all other standards of service set by Ofgem that relate to our gas transportation services. During the year ended 31 March 2007, we made around 40,000 new connections to our network (2005/06: 50,000). The proportion of planned service interruptions in 2006/07 was 98.92% compared with a target of 95%, while the proportion of customer complaints responded to within five working days was 94.71% in 2006/07 compared with a target of 90%.
Our gas operations in the US met all customer service standards over the past year. We installed around 5,000 new services and 277,000 feet of new gas main connections to the network.
54National Grid plc
Financial results – UK
The results for the Gas Distribution – UK segment for the years ended 31 March 2007, 2006 and 2005 were as follows:
| | | | | | | | | | | | | |
| |
| | | 2007 | | | 2006 | | | 2005 | |
| Years ended 31 March | | £m | | | £m | | | £m | |
| |
| Revenue | | | 1,193 | | | | 1,222 | | | | 1,113 | |
| Other operating income | | | 6 | | | | 4 | | | | – | |
| Operating costs excluding exceptional items | | | (790 | ) | | | (743 | ) | | | (689 | ) |
| |
| Adjusted operating profit | | | 409 | | | | 483 | | | | 424 | |
| Exceptional items | | | 3 | | | | (51 | ) | | | (91 | ) |
| |
| Operating profit | | | 412 | | | | 432 | | | | 333 | |
| |
2006/07 results compared with 2005/06
The principal movements between 2005/06 and 2006/07 can be summarised as follows:
| | | | | | | | | | | | | |
| |
| | | Revenue | | | | | | | |
| | | and other | | | | | | | |
| | | operating | | | Operating | | | Operating | |
| | | income | | | costs | | | profit | |
| | | £m | | | £m | | | £m | |
| |
| 2005/06 results | | | 1,226 | | | | (794 | ) | | | 432 | |
| Add back 2005/06 exceptional items | | | – | | | | 51 | | | | 51 | |
| |
| 2005/06 adjusted results | | | 1,226 | | | | (743 | ) | | | 483 | |
| Price changes | | | 73 | | | | – | | | | 73 | |
| Weather and volumes | | | (69 | ) | | | – | | | | (69 | ) |
| Timing on recoveries | | | (32 | ) | | | – | | | | (32 | ) |
| Depreciation and amortisation | | | – | | | | (9 | ) | | | (9 | ) |
| Business rates | | | – | | | | (23 | ) | | | (23 | ) |
| Other revenues and costs | | | 1 | | | | (15 | ) | | | (14 | ) |
| |
| 2006/07 adjusted results | | | 1,199 | | | | (790 | ) | | | 409 | |
| 2006/07 exceptional items | | | – | | | | 3 | | | | 3 | |
| |
| 2006/07 results | | | 1,199 | | | | (787 | ) | | | 412 | |
| |
Revenue and other operating income in Gas Distribution – UK fell by £27 million in 2006/07 compared with 2005/06. Net formula income was up by £4 million with the benefit of an average price increase of 8.8% implemented on 1 October 2006 giving rise to a £73 million increase in revenue, but largely offset by delivery volumes being significantly lower than the prior year reducing revenue by £69 million.
The weather in 2006/07 was significantly warmer than 2005/06 lowering consumption by 28 TWh which, combined with the impact of underlying volumes being lower by 16 TWh (caused principally by the continuing effect of high wholesale gas prices), led to an under-recovery of income of £42 million in 2006/07. Together with a £10 million under-recovery in 2005/06, this resulted in a net year-on-year timing impact on the recovery of income of £32 million.
Operating costs were £47 million higher in 2006/07 compared with 2005/06. Depreciation and amortisation costs were £9 million higher reflecting the increased capital investment in the distribution network. As in 2005/06 (see below) there was a £23 million increase in business rates following the changes in rateable values introduced from 1 April 2005. The remaining increase in operating costs of £15 million was mainly driven by workload including significant investment in maintenance and other safety-related activities.
Adjusted operating profit was £74 million lower in 2006/07 than 2005/06, a reduction of 15%. An exceptional credit of £3 million in 2006/07 related to pension elements of restructuring programmes offsetting costs associated with the creation of the new shared services organisation in the UK. Operating profit was £20 million lower in 2006/07 than 2005/06, a reduction of 5%. In summary, revenue and other operating income were £27 million lower, operating costs were £47 million higher and exceptional charges were £54 million lower.
2005/06 results compared with 2004/05
The principal movements between 2004/05 and 2005/06 can be summarised as follows:
| | | | | | | | | | | | | |
| |
| | | Revenue | | | | | | | |
| | | and other | | | | | | | |
| | | operating | | | Operating | | | Operating | |
| | | income | | | costs | | | profit | |
| | | £m | | | £m | | | £m | |
| |
| 2004/05 results | | | 1,113 | | | | (780 | ) | | | 333 | |
| Add back 2004/05 exceptional items | | | – | | | | 91 | | | | 91 | |
| |
| 2004/05 adjusted results | | | 1,113 | | | | (689 | ) | | | 424 | |
| Business rates pass-through | | | 23 | | | | (23 | ) | | | – | |
| Weather and volumes | | | 12 | | | | – | | | | 12 | |
| Other price changes | | | 10 | | | | – | | | | 10 | |
| Way Ahead operating costs | | | – | | | | 52 | | | | 52 | |
| Gas commodity costs | | | – | | | | (17 | ) | | | (17 | ) |
| Other revenues and costs | | | 68 | | | | (66 | ) | | | 2 | |
| |
| 2005/06 adjusted results | | | 1,226 | | | | (743 | ) | | | 483 | |
| 2005/06 exceptional items | | | – | | | | (51 | ) | | | (51 | ) |
| |
| 2005/06 results | | | 1,226 | | | | (794 | ) | | | 432 | |
| |
In 2005/06, revenues in Gas Distribution – UK increased by £109 million compared with 2004/05, including a £45 million increase in revenue recovered under the distribution price control formula. The weather in 2005/06 was colder than 2004/05 and that contributed £29 million of the increase, and an average price rise of 4.6% was implemented on 1 October 2005, which resulted in a further £33 million increase. That was partially offset by a £17 million reduction in underlying volumes. Other revenues increased by £64 million in 2005/06 compared with 2004/05 primarily because of the provision of services to the four regional gas distribution networks following their sales on 1 June 2005. Significant cost efficiencies were achieved as a result of the Way Ahead restructuring programme. Controllable costs, which exclude increases in ongoing pension costs and gas commodity prices, as well as the costs of providing services to the sold networks and to other National Grid businesses, decreased by 19% in real terms during the year ended 31 March 2006. Total operating costs excluding exceptional items increased by £54 million in 2005/06 compared with 2004/05. Business rates increased by £23 million following changes to rateable values from 1 April 2005, but these have been recovered through the price increases under the distribution price control, as referred to above. The remaining increases in operating costs of £31 million were primarily because of the effects of higher gas commodity prices and increases in the costs of providing services to the sold networks and to other National Grid businesses, partially offset by the savings made in controllable operating costs.
Annual Report and Accounts 2006/0755
In 2005/06 adjusted operating profit was £59 million higher than 2004/05, an increase of 14%. Exceptional charges of £51 million in 2005/06 related to restructuring costs under the Way Ahead programme. Exceptional charges of £91 million in 2004/05 also related primarily to other reorganisation initiatives aimed at delivering cost reductions. Operating profit in 2005/06 was £99 million higher in 2005/06 than 2004/05, an increase of 30% as a consequence of the above changes.
Financial results – US
The results for the Gas Distribution – US segment for the years ended 31 March 2007, 2006 and 2005 were as follows:
| | | | | | | | | | | | | |
| | | 2007 | | | 2006 | | | 2005 | |
| Years ended 31 March | | £m | | | £m | | | £m | |
| Revenue | | | 638 | | | | 571 | | | | 427 | |
| Operating costs excluding exceptional items | | | (567 | ) | | | (524 | ) | | | (394 | ) |
| |
| Adjusted operating profit | | | 71 | | | | 47 | | | | 33 | |
| Exceptional items | | | (4 | ) | | | – | | | | (16 | ) |
| |
| Operating profit | | | 67 | | | | 47 | | | | 17 | |
| |
The average exchange rates used to translate the results of US operations during 2006/07, 2005/06 and 2004/05 were $1.91:£1, $1.79:£1 and $1.87:£1 respectively.
2006/07 results compared with 2005/06
The principal movements between 2005/06 and 2006/07 can be summarised as follows:
| | | | | | | | | | | | | |
| | | | | | | Operating | | | Operating | |
| | | Revenue | | | costs | | | profit | |
| | | £m | | | £m | | | £m | |
| 2005/06 results and adjusted results | | | 571 | | | | (524 | ) | | | 47 | |
| Exchange rate movements | | | (36 | ) | | | 33 | | | | (3 | ) |
| |
| 2005/06 constant currency basis | | | 535 | | | | (491 | ) | | | 44 | |
| Purchased gas | | | (77 | ) | | | 79 | | | | 2 | |
| Rhode Island gas operations | | | 176 | | | | (159 | ) | | | 17 | |
| Bad debts | | | – | | | | (3 | ) | | | (3 | ) |
| Pension and benefit costs | | | – | | | | 5 | | | | 5 | |
| Other | | | 4 | | | | 2 | | | | 6 | |
| |
| 2006/07 adjusted results | | | 638 | | | | (567 | ) | | | 71 | |
| 2006/07 exceptional items | | | – | | | | (4 | ) | | | (4 | ) |
| |
| 2006/07 results | | | 638 | | | | (571 | ) | | | 67 | |
| |
Revenue increased by £103 million in 2006/07 compared with 2005/06 on a constant currency basis, an increase of 19%. The rise in revenue was primarily due to seven months of additional revenue from the gas distribution network in Rhode Island we acquired from Southern Union Company in August 2006. This increase was partially offset by a reduction of purchase gas recovery due to lower purchased gas costs.
Operating costs increased by £76 million in 2006/07 compared with 2005/06 on a constant currency basis, an increase of 15%. This rise is largely due to £159 million of costs incurred in the gas distribution network in Rhode Island in the seven months since its acquisition in August 2006. This increase was partially offset by lower purchased gas costs of £79 million due to lower gas prices and lower sales volumes.
Adjusted operating profit was £27 million higher in 2006/07 than 2005/06 on a constant currency basis, an increase of 61%. Exceptional charges of £4 million in 2006/07 related to merger integration initiatives.
Operating profit was £20 million higher in 2006/07 than 2005/06, an increase of 43%. In summary, revenue was £67 million higher, operating costs were £43 million higher and exceptional charges were £4 million higher.
2005/06 compared with 2004/05
The principal movements between 2004/05 and 2005/06 can be summarised as follows:
| | | | | | | | | | | | | |
| | | | | | | Operating | | | Operating | |
| | | Revenue | | | costs | | | profit | |
| | | £m | | | £m | | | £m | |
| 2004/05 results | | | 427 | | | | (410 | ) | | | 17 | |
| Add back 2004/05 exceptional items | | | – | | | | 16 | | | | 16 | |
| |
| 2004/05 adjusted results | | | 427 | | | | (394 | ) | | | 33 | |
| Exchange rate movements | | | 19 | | | | (18 | ) | | | 1 | |
| |
| 2004/05 constant currency basis | | | 446 | | | | (412 | ) | | | 34 | |
| Purchased gas | | | 128 | | | | (130 | ) | | | (2 | ) |
| Environmental | | | – | | | | 26 | | | | 26 | |
| Pension | | | – | | | | (2 | ) | | | (2 | ) |
| Other revenues and costs | | | (3 | ) | | | (6 | ) | | | (9 | ) |
| |
| 2005/06 results and adjusted results | | | 571 | | | | (524 | ) | | | 47 | |
| |
In 2005/06, revenues in Gas Distribution – US increased by £125 million compared with 2004/05 on a constant currency basis, primarily due to increased recovery of purchased gas by £128 million as a result of higher purchased gas costs.
Operating costs for 2005/06 increased by £112 million compared with 2004/05 on a constant currency basis. This increase was primarily due to higher purchased gas costs of £130 million, of which £94 million related to higher prices and £36 million to increases in volumes.
In 2005/06 adjusted operating profit was £13 million higher than 2004/05 on a constant currency basis, an increase of 38%. Operating profit in 2005/06 was £30 million higher than 2004/05, an increase of 176% as a consequence of the above changes.
56National Grid plc
About the business
Our Electricity Distribution business operates in the US. For reporting purposes it is split into two segments: US Electricity Distribution and US stranded cost recoveries.
The external and regulatory environments in which our Electricity Distribution business operates are described on pages 21 and 22, our business drivers are described on page 23 and our objectives and strategy are set out on pages 26 to 29. Further information relevant to an understanding of our Electricity Distribution business is included below:
Electricity Distribution – US
We are one of the leading electricity distribution service providers in the northeastern US, as measured by energy delivered, and one of the largest utilities in the US, as measured by the number of electricity distribution customers. US Electricity Distribution serves approximately 3.4 million electricity customers over a network of 71,000 circuit miles in New England and New York.
In the US, our electricity distribution system spans upstate New York, Massachusetts, Rhode Island, and New Hampshire to customers that include homes, small and large commercial and industrial enterprises.
Our primary business drivers are the long-term rate plans with state regulators. These plans provide incentive returns and shared savings allowances, which allow us an opportunity to benefit from efficiency gains we may identify within our operations.
We recover our costs of providing electricity to customers through delivery rates approved by applicable regulators, which are set based on historical or forecasted costs, and which include a return on our assets. The cost of the electricity supplied is passed through to customers. We are also subject to service quality standards with respect to reliability and certain aspects of customer service and safety.
New York
Our electricity delivery rates are governed by a 10 year rate plan that began on 1 February 2002. Under the rate plan, after reflecting our share of savings related to the acquisition of our New York business, we may earn a threshold return on equity for our electricity distribution business of 10.6% or 12.0% if certain customer outreach, education, competition-related and low
income incentive targets are met. In the event we earn more than 12%, varying percentages of the excess are shared with customers. The return on equity is measured on a US GAAP basis and calculated cumulatively from inception to 31 December 2005 and on a two year rolling basis thereafter. The earnings calculation used to determine the regulated returns excludes half of the synergy savings from the acquisition, net of the cost to achieve them, that were assumed in the rate plan.
The rate plan also allows for subsequent recovery of specified costs and revenue items that have occurred since the rate plan was established, once these amounts involved exceed $100 million (£51 million). These ‘deferral account’ items include changes from the levels of pension and post-retirement benefit expenses from levels specified in the rate plan, as well as various other items, including storms, environmental remediation costs, and certain rate discounts provided to customers, together with costs and revenues from changes in tax, accounting and regulatory requirements.
In 2006/07 a settlement was agreed with the New York Department of Public Service which reduced the projected deferral account balance at 31 December 2007 to a projected value of approximately £255 million excluding changes in actuals to that date and before reflecting the collection of £152 million in calendar year 2006 and 2007 already agreed.
Massachusetts
Under our long-term rate plan in Massachusetts, there is no cap on earnings and no earnings sharing rates mechanism until 2010. From May 2000 until February 2005, rates were frozen. In March 2005, a settlement credit in the company’s rates expired, resulting in an increase of £6 million in income through to February 2006. From March 2006, rates are adjusted each 1 March until 2009 by the annual percentage change in average electricity distribution rates in the northeastern US. Regulators approved annual increases in the amount of £11 million, effective 1 March 2006 and £4 million effective 1 March 2007. In 2009, actual earned savings will be determined and we will be allowed to retain 100% of annual earned savings up to £39 million and 50% of annual earned savings between £39 million and £81 million before tax. Earned savings represent the difference between a test year’s distribution revenue and our cost of providing service during the same test year, including a regional average authorised return.
We will be allowed to include our share of earned savings, if any, in demonstrating our costs of providing service to customers from January 2010 until May 2020.
Rhode Island
Our distribution rates in Rhode Island are also governed by a long-term rate plan. Between May 2000 and the end of October 2004, rates were frozen, and we were permitted to retain 100% of our Rhode Island earnings up to an allowed return on equity of 12%. We can keep 50% of earnings between 12% and 13%, and 25% of earnings in excess of 13%. With effect from November 2004 until December 2009, we agreed to lower our rates by £6 million before tax per year.
From January 2005 onwards we are able to keep an amount equal to 100% of our earnings up to an allowed return on equity of 10.5%, plus £2.6 million before tax, which represents our share of demonstrated savings subsequent to the acquisition of Eastern Utilities Associates in 2000. Earnings above that amount up to an additional 1% return on equity are to be shared equally with our customers, while additional earnings will be allocated
Annual Report and Accounts 2006/0757
75% to customers and 25% to us. We determine our earned return on equity based on a hypothetical capital structure of 50% common equity, 5% preferred equity and 45% debt.
New Hampshire
In New Hampshire, our electricity distribution network serves over 40,000 retail customers, while we also own transmission assets consisting of substations and interconnections with our other electricity operations in New England.
Distribution rates and terms of service are subject to regulatory approval. We have recently executed a settlement agreement with the staff of the New Hampshire Public Utilities Commission that would establish a five year rate plan for our electricity distribution network. The proposed rate plan includes a 9% reduction in distribution rates. Over the term of the rate plan, earnings in excess of an allowed return of 11% would be shared with customers. In addition, the plan allows for incremental increases in rates for capital expenditure incurred under our reliability enhancement program. The proposed rate plan is subject to approval by the New Hampshire Public Utilities Commission.
US stranded cost recoveries
The US stranded cost recoveries segment captures the recovery of some of our historical investments in generating plants that were divested as part of the restructuring process and wholesale power deregulation process in New England and New York. In addition, this segment includes the recovery of certain above market costs of commodity purchase contracts that we are committed to purchasing that were in place at the time of restructuring and deregulation.
We are able, with the approval of the utility commissions in the states in which we operate, to recover most of these costs through a special rate charged to electricity customers. Pursuant to the settlement and stranded cost recovery agreements in effect in each of the states in which National Grid operates, revenue from this segment will decline as the recovery of stranded costs is completed.
Current and future developments
In addition to the current and future developments described on pages 24 and 25, the following developments are relevant to the Electricity Distribution business.
Market and regulatory developments
Sharp increases in energy prices have renewed interest in the public policy debate about restructuring the nation’s electricity industry and increased the pressure on regulators and politicians to consider taking action to mitigate the effects on customers. As the debate continues, we have taken a leadership position, by advocating a well-managed system as the key to enabling robust competitive electricity markets that offer customers choice, savings and other benefits. State regulators continue strongly to support current recovery of power supply costs. We continue to collaborate with regulators, policy makers and customers to advance the development of the competitive electricity marketplace.
Proposed acquisition of KeySpan
The proposed acquisition of KeySpan would result in Electricity Distribution expanding to include KeySpan’s electric services operations, including the electric transmission and distribution system owned by Long Island Power Authority (LIPA) that serves approximately 1.1 million customers.
In addition, KeySpan produces energy for LIPA from its 4,118 MW Long Island based generating facilities; manages the fuel supplies for LIPA to fuel the Long Island generating facilities; and purchases energy, capacity and ancillary services in the open market on LIPA’s behalf. These services are provided in accordance with long-term service contracts having remaining terms that range from 1 to 6 years and power purchase agreements having remaining terms that range from 6 to 20 years.
KeySpan’s electric services operations also include ownership and leases in respect of the 2,200 MW Ravenswood facility located in Queens, New York, and the 250 MW combined-cycle Ravenswood expansion facility. All of the energy, capacity and ancillary services related to the Ravenswood generation facilities are sold on energy markets operated by the New York independent system operator. As a consequence of the planned acquisition of electricity generation facilities on Long Island, we expect to change the name of this business to Electricity Distribution & Generation.
Storms
In October 2006, we suffered the most significant storm damage experienced in western New York since our operations began serving the area more than 100 years ago. In total, more than 4,000 field and support workers were dedicated to the restoration efforts and we handled over 250,000 calls both inbound and outbound.
We were further impacted by harsh weather in January 2007, when eastern New York and New Hampshire suffered from severe snow, sleet and freezing rain. The restoration effort enlisted crews from six neighbouring utilities in addition to our own employees, and more than 1,500 forestry and line personnel worked to restore power to our customers.
Performance during the year
Descriptions of our progress against our overall objectives in the areas of performance, growth, talent, relationships (including customer service) and responsibility are set out on pages 30 to 43. We include below further information specific to Electricity Distribution with respect to our performance, growth and customer service objectives.
Performance
Our progress against our principal performance objectives during the year included the following:
| | | |
| Objective | | Performance |
Safety | | The number of employee lost time injuries in Electricity Distribution – US increased by 36% in 2006/07 to 90, compared with 66 in 2005/06 and 81 in 2004/05. As a consequence, our lost time injury frequency rate rose to 0.59 in 2006/07 from 0.45 in 2005/06 and 0.5 in 2004/05. |
| |
Reliability | | The system average interruption duration for 2006/07, being the average time the average customer is without power during the year, was 121 minutes, compared with a target of 115 minutes. |
| | | |
| | | In New England, we missed targets for reliability in the 2006 calendar year, incurring an aggregate net penalty of £5.8 million. We have requested that this penalty not be levied as reliability performance was impacted by extraordinary storms during the year. |
| | | |
| | | We missed targets for reliability in the 2006 calendar year in New York, incurring an aggregate net penalty of £4.6 million. |
| |
58National Grid plc
| | | |
| Objective | | Performance |
Efficiency | | We continued to advance efficiency initiatives, including the introduction of a mobile work management system, which equips vehicles with computers to allow for real-time online information. |
| |
Financial | | Adjusted operating profit was £67 million higher in 2006/07 than 2005/06 on a constant currency basis, an increase of 23% largely driven by the recovery of costs incurred in prior periods from the New York deferral account. Further information is included under financial results below. |
| |
Safety improvements
As a consequence of the deterioration in our safety performance this year, we are taking action to improve in 2007/08. This has included addressing areas of improvement identified following a safety evaluation we conducted in 2006, including aiming to enable management to spend more time in the field; aiming to improve the quality of safety observation tours and following up on recommendations and findings arising; developing a comprehensive, long-term staffing plan to assure adequate resources; training managers and supervisors in safety communications; and ensuring that managers and supervisors are made accountable for meeting safety objectives and safety performance is monitored.
In 2007/08, we plan to ensure our US employee safety handbook is well understood and effectively applied, that improvements are made based on feedback from employees, that we enhance the safety aspects of our annual expert training and supervisory training programmes and that we analyse and learn from incidents and near misses. We are also considering how we can improve our approach to preventing soft tissue or muscular skeletal injuries, which comprise 60% of injuries.
Reliability enhancement programme
To improve our reliability performance, we are committed to reducing the frequency and duration of service interruptions. We are therefore increasing our investments in the coming financial year for asset enhancement, replacement and maintenance. Continuation of this programme into future years should improve reliability, reduce inefficient use of resources in responding to outages and create a safer work environment.
In line with our reliability objective, in order to improve performance, we have developed and begun execution of a five year reliability enhancement programme. This includes: vegetation management – incremental tree trimming to address an increase in customer outages related to contacts with tree limbs; feeder hardening – upgrading our worst performing overhead electricity circuits by replacing aged and deteriorated components and protecting against lightning strikes and animal contacts; asset replacement – replacing aging distribution equipment before its expected end of life, including poles, underground cable, and substation equipment; and inspection and maintenance – increasing our preventive maintenance and repair activities to find potential faults before they occur to improve reliability and public safety.
Growth
Capital investment in the replacement, reinforcement and extension of our US electricity distribution networks was £218 million in 2006/07, £219 million in 2005/06 and £204 million in 2004/05. After excluding the effect of exchange movements of £14 million in 2006/07 compared with 2005/06, capital investment increased by £13 million. This reflected an increase of £19 million spend
related to our reliability enhancement programme and other increases in capital investment, partially offset by a £17 million reduction relating to the Nantucket cable project.
After excluding the effect of exchange movements of £9 million in 2005/06 compared with 2004/05, capital investment increased by £6 million due to a £14 million increase in investment in our Nantucket cable project and £5 million of other capital increases, partially offset by a lease recapitalisation of £13 million.
Customer service
Under our service quality plans, we met or exceeded our customer service targets in Massachusetts, earning an incentive of £1.6 million. We met or exceeded most of the customer service targets in New York, but incurred a penalty of £1.1 million for missing the customer satisfaction targets.
We believe that lower customer satisfaction in New York is mainly a consequence of a negative reaction to sustained higher commodity prices. However, reliability and service issues are also a factor and we are taking steps to improve customer outreach on managing cost and use, billing quality, responsiveness to customer queries, regulatory complaints and call handling. We also believe that our investment in enhancing reliability will improve the way our customers perceive us.
Financial results – Electricity Distribution – US
The results of the Electricity Distribution – US segment for the years ended 31 March 2007, 2006 and 2005 were as follows:
| | | | | | | | | | | | | |
| | | 2007 | | | 2006 | | | 2005 | |
| Years ended 31 March | | £m | | | £m | | | £m | |
| Revenue | | | 3,004 | | | | 3,134 | | | | 2,633 | |
| Other operating income | | | – | | | | 2 | | | | – | |
| Operating costs excluding exceptional items and remeasurements | | | (2,640 | ) | | | (2,819 | ) | | | (2,291 | ) |
| |
| Adjusted operating profit | | | 364 | | | | 317 | | | | 342 | |
| Exceptional items | | | (9 | ) | | | – | | | | (101 | ) |
| |
| Operating profit | | | 355 | | | | 317 | | | | 241 | |
| |
The average exchange rates used to translate the results of US operations during 2006/07, 2005/06 and 2004/05 were $1.91:£1, $1.79:£1 and $1.87:£1 respectively.
2006/07 compared with 2005/06
The principal movements between 2005/06 and 2006/07 can be summarised as follows:
| | | | | | | | | | | | | |
| | | Revenue | | | | | | | |
| | | and other | | | | | | | |
| | | operating | | | Operating | | | Operating | |
| | | income | | | costs | | | profit | |
| | | £m | | | £m | | | £m | |
| 2005/06 results and adjusted results | | | 3,136 | | | | (2,819 | ) | | | 317 | |
| Exchange movements | | | (197 | ) | | | 177 | | | | (20 | ) |
| |
| 2005/06 constant currency | | | 2,939 | | | | (2,642 | ) | | | 297 | |
| Purchased electricity | | | (16 | ) | | | 39 | | | | 23 | |
| Deferral account recoveries | | | 72 | | | | – | | | | 72 | |
| Depreciation and amortisation | | | – | | | | (9 | ) | | | (9 | ) |
| Reliability enhancement | | | – | | | | (8 | ) | | | (8 | ) |
| Bad debts | | | – | | | | (11 | ) | | | (11 | ) |
| Pension and benefit costs | | | – | | | | 28 | | | | 28 | |
| Storm costs | | | – | | | | (43 | ) | | | (43 | ) |
| Other | | | 9 | | | | 6 | | | | 15 | |
| |
| 2006/07 adjusted results | | | 3,004 | | | | (2,640 | ) | | | 364 | |
| Exceptional items | | | – | | | | (9 | ) | | | (9 | ) |
| |
| 2006/07 results | | | 3,004 | | | | (2,649 | ) | | | 355 | |
| |
Annual Report and Accounts 2006/0759
Revenue increased £65 million in 2006/07 on a constant currency basis compared with 2005/06. This was primarily due to the recovery of previously incurred costs in New York of £72 million through the deferral account mechanism. This was partially offset by lower purchased electricity and other pass-through costs of £16 million. Commodity costs are recovered in full from customers although the recovery of these costs can occur in more than one financial year.
Operating costs excluding exceptional items decreased by £2 million in 2006/07 on a constant currency basis. This was primarily due to lower purchased electricity and other pass-through costs of £39 million, which are recovered from customers as described above. Storm costs were £43 million higher in 2006/07. The majority of these storm costs will be recovered in future periods.
The £67 million increase in adjusted operating profit from US electricity distribution in 2006/07 compared to 2005/06 was primarily due to the recovery of previously incurred costs in New York, reduced pension and benefit costs, and the timing of commodity cost recovery. These were partially offset by higher storm costs, the majority of which will be recovered in future periods, and higher bad debts.
Exceptional items of £9 million in 2006/07 related to integration costs in preparation for the proposed acquisition of KeySpan. There were no exceptional items in 2005/06.
2005/06 compared with 2004/05
The principal movements between 2004/05 and 2005/06 can be summarised as follows:
| | | | | | | | | | | | | |
| | | Revenue | | | | | | | |
| | | and other | | | | | | | |
| | | operating | | | Operating | | | Operating | |
| | | income | | | costs | | | profit | |
| | | £m | | | £m | | | £m | |
| 2004/05 results | | | 2,633 | | | | (2,392 | ) | | | 241 | |
| Add back 2004/05 exceptional items | | | – | | | | 101 | | | | 101 | |
| |
| 2004/05 adjusted results | | | 2,633 | | | | (2,291 | ) | | | 342 | |
| Exchange movements | | | 117 | | | | (102 | ) | | | 15 | |
| |
| 2004/05 constant currency | | | 2,750 | | | | (2,393 | ) | | | 357 | |
| Purchased power | | | 334 | | | | (337 | ) | | | (3 | ) |
| Volume | | | 18 | | | | – | | | | 18 | |
| Weather | | | 14 | | | | – | | | | 14 | |
| Storm costs | | | – | | | | (13 | ) | | | (13 | ) |
| Depreciation and amortisation | | | – | | | | (7 | ) | | | (7 | ) |
| Pension costs | | | – | | | | (21 | ) | | | (21 | ) |
| Other | | | 20 | | | | (48 | ) | | | (28 | ) |
| |
| 2005/06 results | | | 3,136 | | | | (2,819 | ) | | | 317 | |
| |
Revenue increased £386 million in 2005/06 on a constant currency basis compared with 2004/05. This was primarily due to the recovery of higher purchased electricity costs of £334 million. Commodity costs are recovered in full from customers although the recovery of these costs can occur in more than one financial year. The remaining increases in revenue are due to favourable weather impact of £14 million, primarily due to the hot summer weather and underlying growth which added £18 million, as weather normalised deliveries to residential customers increased 1.5% over last year.
Operating costs excluding exceptional items, increased by £427 million in 2005/06 on a constant currency basis compared to 2004/05. This was primarily due to higher purchased electricity costs of £337 million. The remainder of the variance was largely due to increased pension costs of £21 million, the majority of
which is being recovered from customers in future periods, an increase in depreciation and amortisation expense of £7 million as capital projects, including new IT systems, went into service, and higher storm costs of £13 million. Costs also increased as the reliability enhancement programme began in 2005/06.
Operating profit in 2005/06 was £65 million higher than 2004/05, an increase of 26%. In summary, revenue was £386 million higher, operating costs were £320 million higher and exceptional charges were £106 million lower.
Financial performance – US stranded cost recoveries
The results of the US stranded cost recoveries segment for the years ended 31 March 2007, 2006 and 2005 were as follows:
| | | | | | | | | | | | | |
| | | 2007 | | | 2006 | | | 2005 | |
| Years ended 31 March | | £m | | | £m | | | £m | |
| Revenue | | | 426 | | | | 517 | | | | 436 | |
| Operating costs excluding exceptional items and remeasurements | | | (3 | ) | | | (28 | ) | | | 29 | |
| |
| Adjusted operating profit | | | 423 | | | | 489 | | | | 465 | |
| Remeasurements | | | 81 | | | | (49 | ) | | | (38 | ) |
| |
| Operating profit | | | 504 | | | | 440 | | | | 427 | |
| |
2006/07 compared with 2005/06
The £91 million decrease in revenue comparing 2006/07 with 2005/06 resulted from a £32 million reduction as a consequence of exchange movements, a reduction in purchased power contract cost recoveries due to lower market commodity prices and lower stranded cost recoveries in accordance with our rate plans.
Operating costs for US stranded cost recoveries decreased by £25 million, mainly because of lower purchased power contract expenses.
Remeasurements comprised a credit of £81 million in 2006/07, arising from a reduction in the carrying value of commodity contract liabilities.
Operating profit increased by £64 million as a consequence of the above changes.
2005/06 compared with 2004/05
The £81 million increase in revenue comparing 2005/06 with 2004/05 resulted from the recovery of higher purchased power contracts costs and increased recoveries of stranded costs in accordance with our rate plans. Operating costs for US stranded cost recoveries increased by £57 million, mainly because of higher purchased power contracts costs.
Remeasurements in 2005/06 comprised a charge of £49 million (2004/05: charge of £38 million) arising from an increase in the carrying value of commodity contract liabilities.
Operating profit increased by £13 million as a consequence of the above changes.
60National Grid plc
Non-regulated Businesses
and other
About the business
Our Non-regulated Businesses and other operations are located in the UK. For reporting purposes, they are not treated as a segment, but are instead reported within other activities.
The external and regulatory environments in which our Non-regulated Businesses and other operations operate are described on pages 21 and 22, our business drivers are described on page 23 and our objectives and strategy are set out on pages 26 to 29. Further information relevant to an understanding of our Non-regulated Businesses and other operations is included below:
| | | |
| Activity | | Description |
Metering | | National Grid Metering and OnStream provide installation, maintenance and meter reading services to gas and electricity suppliers in the regulated and unregulated markets. |
| | | |
| | | Our metering businesses provide services on behalf of gas suppliers for an asset base of over 20 million domestic, industrial and commercial meters. |
| |
Grain LNG | | National Grid Grain LNG is the first new liquefied natural gas (LNG) import terminal constructed in the UK for some 30 years, involving planned investment of approximately £522 million for Phases I and II. |
| |
Property | | National Grid Property is responsible for managing all our major occupied properties in the UK, and for the management, clean up and disposal of surplus properties, largely comprising former gas works. |
| |
Advantica | | Advantica is a consultancy providing engineering and software services to enhance safety in the gas, oil, electricity and water sectors, primarily in the UK, US and the Middle East. |
| |
Fulcrum
Connections | | Fulcrum Connections is the leading provider of gas connections and associated design services operating across Great Britain. |
| |
Corporate
activities | | This includes corporate overheads that are not borne by individual businesses, and expenditure incurred on business development. |
| |
The majority of our Non-regulated Businesses and other operations either operate in markets related to those of our principal businesses or provide support to our own businesses.
With the exception of National Grid Metering, our Non-regulated Businesses and other operations are only indirectly affected by the relevant regulatory regimes. National Grid Metering is regulated by Ofgem as it was the incumbent provider of meters to gas suppliers and retains a large share of the legacy installed base of gas meters in Great Britain. It is subject to price controls, although the pricing for the majority of meters is instead specified by long-term contracts which provide gas suppliers with the flexibility to replace our meters while reducing the risk of asset stranding.
OnStream is a participant in the competitive market that now exists in the provision of new meters to gas and electricity suppliers who wish to install or replace meters as required.
Grain LNG has been granted exemptions by Ofgem from the regulated third party access provisions for both Phase I and Phase II of the development. These exemptions introduced certain obligations to put in place effective measures to allow third parties to access unused capacity and are similar in nature to those in place at other new gas supply infrastructure projects in the UK.
Further information on the principal business drivers for our Non-regulated Businesses and other operations includes the following:
| | | |
Multi-year
contractual
arrangements | | The majority of National Grid Metering’s domestic meters are covered by long-term contracts with gas suppliers. |
| | |
| | OnStream has a five year contract with Centrica for the provision of gas and electricity meters. |
| | |
| | Phase I of Grain LNG is underpinned by a long-term contract with BP/Sonatrach. Similarly, Phase II, currently under construction, is underpinned by long-term contracts signed with Centrica, Gaz de France and Sonatrach. |
| |
Competition | | OnStream, Advantica and Fulcrum Connections operate in competitive markets and their revenues are therefore determined by how successful they are in obtaining business from customers. |
| |
Capital
investment | | We are investing to grow our metering businesses and in infrastructure projects such as Grain LNG. |
| |
Efficiency | | Efficiency in delivering capital programmes and in operating our businesses and corporate activities results in driving improved financial performance. |
| |
Annual Report and Accounts 2006/0761
Current and future developments
Metering competition investigation
As described on page 25, in June 2005, Ofgem announced that certain aspects of the domestic gas metering business were to be investigated by it under the Competition Act 1998 and information requested as part of this investigation has been provided to Ofgem. No findings have been issued with respect to this investigation. However, a supplemental statement of objections was issued by Ofgem in April 2007 to which we will respond shortly.
Property and environmental matters
In 2006, the Health and Safety Executive (HSE) issued new planning guidance on the development of sites in close proximity to hazardous installations, including gas holders. Without taking mitigating action, this could lead to a reduction in the selling price likely to be realised for our sites located close to gas holders. A review of the property portfolio was undertaken in the year and it is anticipated that the future impact of the new regulations can be minimised through our ongoing programme of mains replacement and holder demolition.
As described on page 25, a case is before the House of Lords regarding a former gas site which was not part of the assets that formed part of the gas privatisation in 1986 and therefore has never been owned by National Grid. We remain convinced of our case that National Grid has no legal liability with respect to this or other former UK gas sites which did not form part of the assets we acquired at the time of privatisation and believe that our position will be upheld by the House of Lords.
Performance during the year
Descriptions of our progress against our overall objectives in the areas of performance, growth, talent, relationships (including customer service) and responsibility are set out on pages 30 to 43. We include below further information specific to Non-regulated Businesses and other operations with respect to our performance, growth and customer service objectives.
Performance
Our progress against our principal performance objectives during the year included the following:
| | | |
| Objective | | Performance |
Safety | | There was an increase in the total number of employee lost time injuries in Non-regulated Businesses and other operations to 15 in 2006/07 compared with 12 in 2005/06 and 10 in 2004/05. |
| |
Reliability | | Our Non-regulated Businesses and other operations operated reliably throughout the year. |
| |
Efficiency | | Our Non-regulated Businesses and other operations operated efficiently during the year. |
| |
Financial
performance | | The financial performance of our Non-regulated Businesses and other operations improved during the year. However, this was more than offset by the impact of changes in corporate insurance costs and poorer performance from Fulcrum Connections. Further information on financial performance is included under financial results on page 62. |
| |
Growth
Investment
During the year ended 31 March 2007, we invested £258 million in our Non-regulated Businesses and other operations, £21 million lower than capital expenditure in 2005/06.
Capital expenditure in our property business was £47 million lower, principally as a result of the £42 million purchase of National Grid House in Warwick in 2005/06. In addition, capital expenditure on the Grain LNG import terminal was £42 million lower as 2005/06 saw the completion of Phase I of the terminal. These reductions were partially offset by an increase of £37 million in our metering businesses.
Capital expenditure in 2005/06 amounted to £279 million compared with £165 million in 2004/05. This reflected an increase of £85 million invested in Grain LNG, a net increase of £19 million in our metering businesses and £42 million from the purchase of National Grid House in Warwick, partially offset by a reduction of £16 million in other property capital expenditure and £16 million in other activities.
In July 2005, Grain LNG commenced commercial operations for the first phase. Grain LNG’s second phase of development was announced in March 2005 and is expected to be completed by the end of 2008. This next phase will increase the facility’s capacity to import and process LNG from 3.3 million tonnes per year up to 9.8 million tonnes per year, representing around 12% of anticipated annual UK gas demand in 2008/09. Cumulative investment has now reached £319 million out of an expected total spend of around £522 million on Phases I and II.
Further investment of £310 million in a third phase was confirmed in May 2007. This is expected to increase the capacity available at the terminal to 14.8 million tonnes, equivalent to around 20% of anticipated UK gas demand for 2010/11. Long-term contracts have been signed with E.On, Iberdrola and Centrica for the capacity and a contract has been awarded to construct a second unloading jetty, an additional 190,000 cubic metre LNG storage tank and associated processing equipment required for the additional capacity.
Both National Grid Metering and OnStream are investing in technology such as smart metering and automated meter reading systems in response to customer requirements.
We have entered into a joint venture with the owner and operator of the Dutch electricity transmission network, TenneT Holding, to construct the BritNed electricity interconnector between the UK and the Netherlands. Subject to final negotiations with suppliers and BritNed receiving an exemption from the regulators, National Grid will invest around £200 million in this project, which will make an important contribution to the UK’s security of supply when it is commissioned towards the end of 2010.
62National Grid plc
Financial results
The results for Non-regulated Businesses and other operations for the years ended 31 March 2007, 2006 and 2005 were as follows:
| | | | | | | | | | | | | |
| |
| | | 2007 | | | 2006 | | | 2005 | |
| Years ended 31 March | | £m | | | £m | | | £m | |
| |
| Revenue | | | 567 | | | | 701 | | | | 734 | |
| Other operating income | | | 71 | | | | 74 | | | | 67 | |
| Operating costs excluding exceptional items and remeasurements | | | (505 | ) | | | (625 | ) | | | (649 | ) |
| |
| Adjusted operating profit | | | 133 | | | | 150 | | | | 152 | |
| Exceptional items | | | (1 | ) | | | 18 | | | | (33 | ) |
| |
| Operating profit | | | 132 | | | | 168 | | | | 119 | |
| |
2006/07 compared with 2005/06
The principal movements between 2005/06 and 2006/07 can be summarised as follows:
| | | | | | | | | | | | | |
| |
| | | Revenue | | | | | | | |
| | | and other | | | | | | | |
| | | operating | | | Operating | | | Operating | |
| | | income | | | costs | | | profit | |
| | | £m | | | £m | | | £m | |
| |
| 2005/06 results | | | 775 | | | | (607 | ) | | | 168 | |
| Add back 2005/06 exceptional items | | | – | | | | (18 | ) | | | (18 | ) |
| |
| 2005/06 adjusted results | | | 775 | | | | (625 | ) | | | 150 | |
| Metering | | | 19 | | | | (13 | ) | | | 6 | |
| Property | | | (20 | ) | | | 18 | | | | (2 | ) |
| Grain LNG | | | 11 | | | | (8 | ) | | | 3 | |
| Fulcrum Connections | | | (134 | ) | | | 125 | | | | (9 | ) |
| Insurance and other | | | (13 | ) | | | (2 | ) | | | (15 | ) |
| |
| 2006/07 adjusted results | | | 638 | | | | (505 | ) | | | 133 | |
| 2006/07 exceptional items | | | – | | | | (1 | ) | | | (1 | ) |
| |
| 2006/07 results | | | 638 | | | | (506 | ) | | | 132 | |
| |
Revenue and other operating income from Non-regulated Businesses and other operations reduced from £775 million in 2005/06 to £638 million in 2006/07. The principal reason for this fall has been £134 million lower revenue at Fulcrum Connections, reflecting the full year impact of the loss of business from the four regional gas distribution networks disposed of in 2005/06. Revenue and other operating income was £20 million lower in our property business, reflecting the impact of the revised planning guidance for development of sites in close proximity to hazardous installations issued by the HSE. Partially offsetting these reductions, revenue was £19 million higher in our metering businesses, reflecting growth in OnStream, and revenue and other operating income at Grain LNG was £11 million higher, reflecting the first full year of Phase I operations.
Operating costs excluding exceptional items were £120 million lower in 2006/07 compared with 2005/06. Within Fulcrum Connections, operating costs were £125 million lower as a result of the loss of business from the disposed gas networks. Operating costs were also £18 million lower in our property business due to the expected reduction in stock sales. These decreases were partially offset by operating cost increases in our metering and Grain LNG businesses of £13 million and £8 million respectively as a result of the increased volumes in these businesses.
The exceptional item of £1 million in 2006/07 relates to the Non-regulated Businesses and other operations’ share of restructuring costs incurred during the year.
2005/06 compared with 2004/05
The principal movements between 2004/05 and 2005/06 can be summarised as follows:
| | | | | | | | | | | | | |
| |
| | | Revenue | | | | | | | |
| | | and other | | | | | | | |
| | | operating | | | Operating | | | Operating | |
| | | income | | | costs | | | profit | |
| | | £m | | | £m | | | £m | |
| |
| 2004/05 results | | | 801 | | | | (682 | ) | | | 119 | |
| Add back 2004/05 exceptional items | | | – | | | | 33 | | | | 33 | |
| |
| 2004/05 adjusted results | | | 801 | | | | (649 | ) | | | 152 | |
| Metering | | | (10 | ) | | | 38 | | | | 28 | |
| Property | | | (4 | ) | | | (10 | ) | | | (14 | ) |
| Grain LNG | | | 27 | | | | (16 | ) | | | 11 | |
| Insurance and other | | | (39 | ) | | | 12 | | | | (27 | ) |
| |
| 2005/06 adjusted results | | | 775 | | | | (625 | ) | | | 150 | |
| 2005/06 exceptional items | | | – | | | | 18 | | | | 18 | |
| |
| 2005/06 results | | | 775 | | | | (607 | ) | | | 168 | |
| |
Revenue and other operating income from Non-regulated Businesses and other operations fell from £801 million in 2004/05 to £775 million in 2005/06, primarily due to a reduction in corporate insurance activities of £15 million, reduced revenue from Fulcrum Connections of £10 million due to the loss of business as a result of the gas network sales during 2005, a £10 million reduction from our metering businesses, where reductions at National Grid Metering were partially offset by revenue growth in OnStream, and reductions in the mix of properties sold resulting in £4 million lower revenues at Property. The decreases were partially offset by an increase in revenue from Grain LNG following its successful commissioning in July 2005.
Operating costs excluding exceptional items reduced by £24 million to £625 million in 2005/06. The lower costs for metering are linked to the reduction in revenues along with further cost savings arising from operational efficiencies. In addition, operating costs at Fulcrum Connections were lower as a result of the disposal of gas distribution networks in the year. These were partially offset by an increase in costs at Grain LNG.
Exceptional items explain the difference between adjusted operating profit and operating profit. The favourable movement in 2005/06 relates to the gain on sale of Energis Polska and the reversal of a previous impairment in Copperbelt Energy Corporation.
Annual Report and Accounts 2006/0763
About the business
In November 2006, we announced our decision to focus on our core UK and US energy markets and to exit our wireless infrastructure operations in the UK and the US and the Basslink electricity interconnector in Australia. As a consequence of our commitment to sell these operations, and our expectation that their sales were or are highly probable, they have been presented as discontinued in our consolidated financial statements.
Our UK wireless infrastructure operations were sold to Macquarie UK Broadcast Ventures Limited on 3 April 2007 for £2.5 billion. Also in April 2007, we have agreed a sale of our wireless infrastructure operations in the US for approximately $290 million (£147 million), which is expected to complete later in 2007. We continue to progress the sale of the Basslink electricity interconnector in Australia.
UK wireless infrastructure
Our former UK wireless infrastructure business is the leading independent provider of network infrastructure to mobile network operators. It operates around 5,000 active sites used for mobile communications and is one of two providers of transmission networks for analogue and digital television and radio broadcasters with around 750 purpose-built broadcast towers and associated transmission equipment.
Certain of the UK activities of the discontinued wireless infrastructure business are subject to regulation by the Office of Communications (Ofcom), in particular its television and radio transmission infrastructure networks. It also operates two digital multiplexes under the terms of licences granted by Ofcom.
US wireless infrastructure
Our US wireless infrastructure operations provide communications infrastructure and related network services to wireless and fixed network operators in a number of states in the US. Services include the use of communication towers, wireless pylon attachments, distributed antenna system networks and related network services and a dark fibre network.
Basslink
The Basslink project is an electricity interconnector linking the electricity network on the island state of Tasmania to mainland Australia. It was successfully commissioned in April 2006 and can provide up to 600 MW of hydroelectricity to mainland Australia and up to 480 MW of electricity into Tasmania.
Basslink has a 25 year contract with Hydro Tasmania to build, own and operate the interconnector. As a holder of a transmission licence, Basslink is directly affected by the requirements of state and federal energy regulators in Australia.
We remain committed to the sale of Basslink, which we expect to occur during 2007/08.
Performance during the year
Performance
Our discontinued operations operated safely, reliably and efficiently during the year. There were two employee lost time injuries in 2006/07 both in our wireless infrastructure operations, compared with one in 2005/06 and five in 2004/05. The financial performance of these operations is described below, excluding operations discontinued in prior years.
Investment
Capital investment in operations discontinued in the year was £30 million in 2006/07 compared with £114 million in 2005/06 and £157 million in 2004/05. The decrease in capital expenditure in 2006/07 primarily reflects the completion and commissioning of the Basslink interconnector in April 2006. The decrease in 2005/06 compared with 2004/05 arose for the same reason, but was partially offset by increased capital spend on wireless infrastructure reflecting a full year’s capital expenditure compared with seven months’ capital spending in 2004/05.
Financial results
The operating results for discontinued operations for the years ended 31 March 2007, 2006 and 2005 relating to operations discontinued during the year were as follows:
| | | | | | | | | | | | | |
| |
| | | 2007 | | | 2006 | | | 2005 | |
| Years ended 31 March | | £m | | | £m | | | £m | |
| |
| Revenue and other operating income | | | 383 | | | | 325 | | | | 211 | |
| Operating costs excluding exceptional items | | | (266 | ) | | | (255 | ) | | | (169 | ) |
| |
| Adjusted operating profit | | | 117 | | | | 70 | | | | 42 | |
| Exceptional items | | | (55 | ) | | | (5 | ) | | | (13 | ) |
| |
| Operating profit | | | 62 | | | | 65 | | | | 29 | |
| |
In 2006/07, the £58 million increase in revenue and other operating income, £11 million increase in operating costs excluding exceptional items and £47 million increase in adjusted operating profit compared with 2005/06 arose from the first year of operation of the Basslink interconnector, continued growth in wireless infrastructure in the UK, and contributions from acquisitions in wireless infrastructure in the US.
In 2005/06, the £114 million increase in revenue and other operating income, £86 million increase in operating costs and £28 million increase in adjusted operating profit between 2005/06 and 2004/05 primarily reflects a full year’s (2004/05 seven months’) contribution from the UK operations of Crown Castle International Corp., synergies and underlying profit growth.
Exceptional charges in 2006/07 of £55 million arose from an impairment to goodwill recorded in our US wireless operations. Exceptional charges of £5 million in 2005/06 and £13 million in 2004/05 related to restructuring costs incurred in relation to the acquisition and integration of the UK operations of Crown Castle International Corp. with our then existing wireless infrastructure operations.
Operating profit decreased by £3 million in 2006/07 compared with 2005/06 as a consequence of the increase in adjusted operating profit of £47 million offset by the £50 million increase in exceptional items described above. Operating profit in 2005/06 was £36 million higher than 2004/05 as a consequence of the increase in adjusted operating profit and decrease in exceptional items as described above.
\
64National Grid plc
Financial position and
financial management
Going concern
Having made enquiries, the Directors consider that the Company and its subsidiary undertakings have adequate resources to continue in business for the foreseeable future and that it is therefore appropriate to adopt the going concern basis in preparing the consolidated and individual financial statements of the Company.
Our most significant commitment is the expected payment of $7.3 billion (£3.7 billion) to acquire KeySpan, together with the assumption of $4.5 billion (£2.3 billion) of debt. This acquisition is subject to regulatory approval. We are satisfied that we have adequate financial resources to complete this acquisition.
Financial position
Balance sheet
Our balance sheet at 31 March 2007 can be summarised as follows:
| | | | | | | | | | | | | |
| |
| | | | | | | | | | | Net | |
| | | Assets | | | Liabilities | | | assets | |
| | | £m | | | £m | | | £m | |
| |
| Property, plant & equipment and non-current intangible assets | | | 19,039 | | | | – | | | | 19,039 | |
| Goodwill and non-current investments | | | 1,617 | | | | – | | | | 1,617 | |
| Current assets and liabilities | | | 1,344 | | | | (2,094 | ) | | | (750 | ) |
| Other non-current assets and liabilities | | | 36 | | | | (1,902 | ) | | | (1,866 | ) |
| Post-retirement obligations | | | 37 | | | | (1,282 | ) | | | (1,245 | ) |
| Deferred tax | | | – | | | | (2,389 | ) | | | (2,389 | ) |
| Assets and liabilities held for sale | | | 1,968 | | | | (450 | ) | | | 1,518 | |
| |
| Total before net debt and held for sale | | | 24,041 | | | | (8,117 | ) | | | 15,924 | |
| Net debt | | | 4,348 | | | | (16,136 | ) | | | (11,788 | ) |
| |
| Total as at 31 March 2007 | | | 28,389 | | | | (24,253 | ) | | | 4,136 | |
| |
| Total as at 31 March 2006 | | | 25,924 | | | | (22,431 | ) | | | 3,493 | |
| |
The increase in net assets from £3,493 million at 31 March 2006 to £4,136 million at 31 March 2007 resulted from the profit from continuing operations of £1,310 million, the profit for the year from discontinued operations of £86 million, net income recognised directly in equity of £103 million and other changes in equity of £43 million, partially offset by repurchases of shares of £169 million and dividends paid of £730 million.
Net debt and gearing
Net debt increased by £938 million from £10,850 million at 31 March 2006 to £11,788 million at 31 March 2007 as cash flows from operations of £3,271 million were exceeded by the combination of capital expenditure of £2,218 million, cash paid for acquisitions of £269 million, repurchases of shares of £169 million, dividends paid of £730 million, tax paid of £313 million and other movements of £510 million.
At 31 March 2007, net debt comprised borrowings of £15,711 million and bank overdrafts of £6 million, less cash and cash equivalents of £1,593 million, financial investments of £2,098 million and derivative financial instruments with a net carrying value of £238 million (31 March 2006: £13,126 million and £3 million, less £1,452 million, £384 million and £443 million respectively).
The maturity of borrowings is provided in note 27 to the accounts. At 31 March 2007 it can be summarised as follows:
Gearing at 31 March 2007 and 31 March 2006, calculated as net debt at that date expressed as a percentage of net debt plus net assets shown in the balance sheet, amounted to 74% and 76% respectively. We do not consider that this standard gearing ratio is an appropriate measure as it does not reflect the economic value of the assets of our UK and US regulated businesses. During 2007/08, we intend to develop a new measure to monitor gearing and financial discipline.
Equity shareholders’ funds
Equity shareholders’ funds rose from £3,482 million at 31 March 2006 to £4,125 million at 31 March 2007. The increase was mainly explained by the retained profit for the year to 31 March 2007 of £818 million, partially offset by net other recognised expense of £189 million, comprising net foreign exchange adjustments relating to the retranslation of US dollar denominated net assets and associated hedges, actuarial losses, net gains on hedges and available-for-sale investments and tax thereon.
Annual Report and Accounts 2006/0765
Liquidity and treasury management
Cash flow
Cash flows from our operations are largely stable over a period of years, but they do depend on the timing of customer payments and exchange rate movements. Our electricity and gas transmission and distribution operations in the UK and US are subject to multi-year rate agreements with regulators. Significant changes in volumes, for example as a consequence of weather conditions, can affect cash inflows in particular, with abnormally mild or extreme weather driving volumes down or up respectively. Subject to this, we have essentially stable cash flows in the UK, while in the US, the regulatory mechanisms for recovering costs from customers can result in very significant cash flow swings from year to year.
Cash flow forecasting
Both short- and long-term cash flow forecasts are produced frequently to assist in identifying our liquidity requirements.
These forecasts, supplemented by a financial headroom position, are supplied to the Finance Committee of the Board regularly to demonstrate funding adequacy for at least a 12 month period. We also maintain a minimum level of committed facilities in support of that objective.
Credit facilities and unutilised Commercial Paper and Medium Term Note Programmes
We have both committed and uncommitted facilities that are available for general corporate purposes.
At 31 March 2007, we had the following committed and uncommitted facilities:
| | | | | | | | | |
| Facility | | Amount | | | Status | |
| National Grid plc |
| US commercial paper programme | | $3.0 billion | | Unutilised |
| |
| National Grid Electricity Transmission plc |
| US commercial paper programme | | $1.0 billion | | Unutilised |
| Euro commercial paper programme | | $1.0 billion | | Unutilised |
| |
| National Grid plc and National Grid Electricity Transmission plc |
| Euro medium term note programme | | €12.0 billion | | €3.2 billion
unissued |
| |
| National Grid Gas plc |
| US commercial paper programme | | $2.5 billion | | Unutilised |
| Euro commercial paper programme | | $1.25 billion | | Unutilised |
| |
| National Grid Gas plc and National Grid Gas Holdings plc |
| Euro medium term note programme | | €10 billion | | €5.9 billion
unissued |
| |
| National Grid plc and certain UK subsidiaries |
| Long-term committed facilities | | £1.29 billion | | Undrawn |
| Short-term committed facilities | | $1.5 billion | | Undrawn |
| Uncommitted borrowing facilities | | £0.9 billion | | Undrawn |
| |
| National Grid’s US subsidiaries |
| Committed facilities | | $680 million | | Undrawn |
| US commercial paper programme | | $2.0 billion | | Unutilised |
| |
The short-term (364 day) committed facilities include an option to extend these facilities. The US committed facilities provide liquidity support for New England Power Company’s tax-exempt debt programme.
In addition to the above facilities, National Grid Gas plc has signed a loan agreement for £370 million with the European Investment Bank. Of this, £190 million remains to be drawn and can be drawn before August 2008.
Note 27 to the accounts shows the maturity profile of undrawn committed borrowing facilities in sterling as at 31 March 2007.
Regulatory restrictions
As part of our regulatory arrangements, our operations are subject to a number of restrictions on the way we can operate. These include regulatory ‘ring-fences’ that require us to maintain adequate financial resources within certain parts of our operating businesses and restrict our ability to transfer funds or levy charges between certain subsidiary companies.
Treasury policy
Funding and treasury risk management for National Grid is carried out under policies and guidelines approved by the Board. The Finance Committee, a committee of the Board (for further details see page 80), is responsible for regular review and monitoring of treasury activity and for approval of specific transactions, the authority for which may be delegated. There is a Treasury function that raises funding and manages interest rate and foreign exchange rate risk.
Financing programmes exist for each of the main companies within National Grid. The Finance Committee of the Board and the finance committee or board of the appropriate subsidiary undertaking approve all funding programmes.
The Treasury function is not operated as a profit centre. Debt and treasury positions are managed in a non-speculative manner, such that all transactions in financial instruments or products are matched to an underlying current or anticipated business requirement.
The use of derivative financial instruments is controlled by policy guidelines set by the Board. Derivatives entered into in respect of gas and electricity commodities are used in support of the business’s operational requirements and the policy regarding their use is explained below.
We had borrowings outstanding at 31 March 2007 amounting to £15,711 million (31 March 2006: £13,126 million).
Appropriate committed facilities are in place, such that we believe that the maturing amounts in respect of its contractual obligations as shown in ‘Commitments and Contingencies’ in note 35 to the accounts can be met from existing cash and investments and these facilities, operating cash flows and other financings that we reasonably expect to be able to secure in the future. Our financial position and expected future operating cash flows are such that we can borrow on the wholesale capital and money markets and most of our borrowings are through public bonds and commercial paper.
We place surplus funds on the money markets, usually in the form of short-term fixed deposits that are invested with approved banks and counterparties. Details relating to cash, short-term investments and other financial assets at 31 March 2007 are shown in notes 21 and 26 to the accounts.
66National Grid plc
As of 31 March 2007, the long-term senior unsecured debt and short-term debt credit ratings respectively provided by Moody’s, Standard & Poor’s (S&P) and Fitch were as follows:
| | | | | | | | | | | | | |
| Facility | | Moody’s | | | S&P | | | Fitch | |
| National Grid plc | | | Baa1/P2 | | | | A-/A1 | | | | A-/F2 | |
| |
| National Grid Electricity Transmission plc | | | A2/P1 | | | | A/A1 | | | | A/F2 | |
| |
| National Grid Holdings One plc | | | – | | | | A-/A1 | | | | – | |
| |
| National Grid Gas plc | | | A2/P1 | | | | A/A1 | | | | A+/ F1 | |
| |
| National Grid Gas Holdings plc | | | A3 | | | | A- | | | | A | |
| |
| National Grid USA | | | P2 | | | | A-/A1 | | | | – | |
| |
| Niagara Mohawk Power Corp. | | | Baa1 | | | | A- | | | | – | |
| |
| Massachusetts Electric Co. | | | P1 | | | | A/A1 | | | | – | |
| |
| New England Power Co. | | | A1/P1 | | | | A/A1 | | | | – | |
| |
In connection with the proposed acquisition of KeySpan Corporation, our ratings have been moved to ‘creditwatch with negative implications’ by S&P. Moody’s have placed the majority of our ratings on to review for downgrade, National Grid plc on to developing outlook and National Grid Gas Holdings plc to stable. We expect the long-term credit ratings of National Grid plc from S&P and Fitch to reduce by one notch as a direct result of the KeySpan acquisition.
It is a condition of the regulatory ring-fences around National Grid Electricity Transmission plc, National Grid Gas plc and National Grid Gas Holdings plc that they use reasonable endeavours to maintain an investment grade credit rating. At these ratings, the principal borrowing entities within National Grid should have good access to the capital and money markets for future funding when necessary.
The main risks arising from our financing activities are set out below, as are the policies for managing these risks, which are agreed and reviewed by the Board and the Finance Committee.
Refinancing risk management
The Board controls refinancing risk mainly by limiting the amount of financing obligations (both principal and interest) arising on borrowings in any financial year. This policy is intended to prevent us from having an excessively large amount of debt to refinance in any given time-frame. During the year, a mixture of short-term and long-term debt was issued.
Note 23 (c) to the accounts sets out the contractual maturities of our borrowings over the next three years, with the remaining contracted borrowings maturing over a further 47 years in compliance with our refinancing risk policy.
Interest rate risk management
Our interest rate exposure arising from borrowings and deposits is managed by the use of fixed- and floating-rate debt, interest rate swaps, swaptions and forward rate agreements. Our interest rate risk management policy is to seek to minimise total financing costs (being interest costs and changes in the market value of debt) subject to constraints so that, even with large movements in interest rates, neither the interest cost nor the total financing cost can exceed pre-set limits. Some of the bonds in issue from National Grid Electricity Transmission plc, National Grid Gas Holdings plc and National Grid Gas plc are index-linked, that is their cost is linked to changes in the UK Retail Price Index (RPI). We believe that these bonds provide a good hedge for revenues and our regulatory asset values that are also RPI-linked under our price control formulae in the UK.
The performance of the Treasury function in interest rate risk management is measured by comparing the actual total financing costs of its debt with those of a passively-managed benchmark portfolio.
More information on the interest rate profile of our debt is included in note 23 to the accounts.
Foreign exchange risk management
We have a policy of hedging certain contractually committed foreign exchange transactions over a prescribed minimum size. This covers a minimum of 75% of such transactions expected to occur up to 6 months in advance and a minimum of 50% of transactions 6 to 12 months in advance. Cover generally takes the form of forward sale or purchase of foreign currencies and must always relate to underlying operational cash flows.
The principal foreign exchange risk to which we are exposed arises from assets and liabilities denominated in US dollars. In relation to these risks, the objective is to manage the US dollar proportion of our financial liabilities, by using debt and derivatives, to match the proportion of our cash flows that arise in US dollars and is available to service those liabilities.
In addition, we are exposed to currency exposures on borrowings in currencies other than sterling and the US dollar, principally the euro. This currency exposure is managed through the use of derivative financial instruments.
The currency compositions of financial liabilities and assets are shown in note 23 to the accounts.
Annual Report and Accounts 2006/0767
Counterparty risk management
Counterparty risk arises from the investment of surplus funds and from the use of derivative instruments. The Finance Committee has agreed a policy for managing such risk, which is controlled through credit limits, approvals and monitoring procedures. Further information is provided in note 23 (b) to the accounts. Where multiple transactions are entered into with a single counterparty, a master netting arrangement can be put in place to reduce our exposure to credit risk of that counterparty. At the present time, we use standard International Swap Dealers Association (ISDA) documentation, which provides for netting in respect of all transactions governed by a specific ISDA with a counterparty, when transacting interest rate and exchange rate derivatives.
Derivative financial instruments held for purposes other than trading
As part of our business operations, we are exposed to risks arising from fluctuations in interest rates and exchange rates. We use financial instruments, including derivatives, to manage exposures of this type and they are a useful tool in reducing risk. Our policy is not to use derivatives for trading purposes. Derivative transactions can, to varying degrees, carry both counterparty and market risk.
We enter into interest rate swaps to manage the composition of floating- and fixed-rate debt and so hedge the exposure of borrowings to interest rate movements. In addition, we enter into bought and written option contracts on interest rate swaps. These contracts are known as swaptions. We also enter into foreign currency swaps to manage the currency composition of borrowings and so hedge the exposure to exchange rate movements. Certain agreements are combined foreign currency and interest rate swap transactions. Such agreements are known as cross-currency swaps.
We enter into forward rate agreements to hedge interest rate risk on short-term debt and money market investments. Forward rate agreements are commitments to fix an interest rate that is to be paid or received on a notional deposit of specified maturity, starting at a future specified date.
Cross-currency and foreign exchange contracts are used to manage the foreign exchange risk arising from the investment in non-sterling subsidiaries.
More details on derivative financial instruments are provided in note 22 to the accounts.
Valuation and sensitivity analysis
We calculate the fair value of debt and derivative instruments by discounting all future cash flows by the market yield curve at the balance sheet date. The market yield curve for each currency is obtained from external sources for interest and foreign exchange rates. In the case of instruments that include options, the Black’s variation of the Black-Scholes model is used to calculate fair value.
The valuation techniques described above for interest rate swaps and currency swaps are a standard market methodology. These techniques do not take account of the credit quality of either party but this is not considered to be a significant factor unless there is a material deterioration in the credit quality of either party.
In relation to swaptions, we only use swaptions for hedging purposes with a European style exercise. As a consequence, the Black’s variation of the Black-Scholes model is considered
to be sufficiently accurate for the purpose of providing fair value information in relation to these types of swaptions. More sophisticated valuation models exist but we do not believe it is necessary to employ these models, given the extent of our activities in this area.
For debt and derivative instruments held, we utilise a sensitivity analysis technique to evaluate the effect that changes in relevant rates or prices will have on the market value of such instruments.
At 31 March 2007, the potential change in the fair value of the aggregation of long-term debt and derivative instruments, assuming an increase or decrease of 10% in the level of interest rates and exchange rates, was £138 million and £145 million for interest rates and £794 million and £971 million for exchange rates respectively (2006: £44 million and £46 million for interest rates and £427 million and £521 million for exchange rates respectively).
Commodity contracts
Power purchase contracts for normal sale and purchase
In the US, we purchase electricity and gas to supply to our customers. The contracts enable us to provide the electricity purchased by customers who do not choose to purchase their energy from independent suppliers.
Commodity derivatives
In the normal course of business, we are party to commodity derivatives. These have included indexed swap contracts, gas futures, electricity swaps, gas options, gas forwards and gas basis swaps that are principally used to manage commodity prices associated with our gas and electricity delivery operations. This includes the buying back of capacity rights already sold in accordance with our UK gas transporter licences and Uniform Network Code obligations.
These financial exposures are monitored and managed as an integral part of our financial risk management policy. At the core of this policy is a condition that we will engage in activities at risk only to the extent that those activities fall within commodities and financial markets to which we have a physical market exposure in terms and volumes consistent with our core business. We do not issue or intend to hold derivative instruments for trading purposes, and hold such instruments consistent with our various licence and regulatory obligations in the UK and US.
Commodity contracts carried at fair value
A number of power purchase agreements were replaced in 1998 with indexed swap contracts that expire in June 2008. These indexed swap contracts are the subject of regulatory rulings that allow the gains and losses to be passed on to customers.
At 31 March 2007, there were liabilities of £136 million (2006: £309 million) in respect of the above indexed swap contracts. The liability will be amortised over the remaining term of the swaps as nominal energy quantities are settled and will be adjusted as periodic reassessments are made of energy prices. A 10% movement in the market price of electricity would result in a £16 million movement in the value of the indexed swap contracts assuming a US dollar to sterling exchange rate of $1.97: £1.
68National Grid plc
The fair value of the index-linked swap contracts is based on the difference between projected future market prices and projected contract prices as applied to the notional quantities stated in the contracts and discounted using a US Treasury Bill rate curve to the current present value.
Payments made under indexed swap contracts are affected by the price of natural gas and we use New York Mercantile Exchange (NYMEX) gas futures as hedges to mitigate this impact. The futures contracts are derivative commodity instruments with gains and losses deferred as an offset to the corresponding increases and decreases in the swap payments.
We do not currently use options to hedge gas commodity. Gains relating to gas futures as at 31 March 2007 were not material.
Our rate agreement in New York allows for collection of the commodity cost of natural gas sold to customers. The regulator also requires that actions be taken to limit the volatility in gas prices passed on to customers. We meet this requirement through the use of NYMEX gas futures. These contracts are hedges of our natural gas purchases. Gains and losses are deferred until the month that the hedged contract settles. At 31 March 2007, deferred gains on these contracts were immaterial in the context of National Grid as a whole.
During 2005/06, a number of power purchase contracts reverted back to us as part of the settlement arising from USGen’s bankruptcy. The power contracts were originally entered into prior to the restructuring of the electricity industry in New England. The power delivered is not required for our normal activities and is sold in the energy markets at prices which are currently significantly below the amount we are required to pay. The fair value of these contracts amounted to £128 million at 31 March 2007 (2006: £169 million) and this has been recorded as a liability in our balance sheet.
We are also a party to several other power purchase arrangements entered into by the former generating business, the output of which is sold to third parties through back-to-back arrangements. We recover the costs incurred under the contracts, net of proceeds received on sales, from customers as part of the US stranded cost recoveries segment.
As at 31 March 2007, our obligations under all these agreements totalled £389 million (2006: £778 million). The fair value of the difference between our obligations and the expected revenues from sales is recorded in the balance sheet within commodity contract liabilities at a value of £268 million (2006: £488 million).
Commodity trading
In our UK gas transmission operation, we are obliged to offer for sale, through a series of auctions (both short- and long-term), a predetermined quantity of entry capacity for every day in the year at predefined locations. Where, on the day, the gas transmission system’s capability is constrained, such that gas is prevented from entering the system for which entry capacity rights have been sold, then UK gas transmission is required to buy back those entry capacity rights sold in excess of system capability. Forward and option contracts are used to reduce the risk and exposure to on-the-day entry capacity prices.
Our UK electricity transmission operations have also entered into electricity options, pursuant to the requirement to stabilise the electricity market in Great Britain through the operation of the British Electricity Trading and Transmission Arrangements
(BETTA). The options are for varying terms and have been entered into so that we have the ability to deliver electricity as required to meet our obligations under our UK electricity transmission licence. We have not and do not expect to enter into any significant derivatives in connection with our BETTA role.
Commitments and contingencies
Commitments and contingencies outstanding at 31 March 2007 and 2006 are summarised in the table below:
| | | | | | | | | |
| | | 2007 | | | 2006 | |
| Years ended 31 March | | £m | | | £m | |
Future capital expenditure contracted
but not provided for | | | 1,554 | | | | 1,343 | |
| Total operating lease commitments | | | 800 | | | | 831 | |
| Power commitments | | | 3,731 | | | | 4,675 | |
Other commitments, contingencies
and guarantees | | | 537 | | | | 334 | |
| |
Information regarding obligations under pension and other post-retirement benefits is given below under the heading ‘Retirement arrangements’.
The power commitments shown in the commitments and contingencies table above reflect obligations to purchase energy under long-term contracts. These contracts are used in respect of our normal sale and purchase requirements and do not include commodity contracts carried at fair value as described on page 67.
In addition to the above, we have entered into an agreement to purchase KeySpan Corporation for $7.3 billion (£3.7 billion), subject to regulatory approval.
We propose to meet all of our commitments from existing cash and investments, operating cash flows, existing credit facilities, future facilities and other financing that we reasonably expect to be able to secure in the future.
Contractual obligations at 31 March 2007
The table of contractual obligations shown below analyses our long-term contractual obligations according to payment period.
Purchase obligations reflect commitments under power commitments and future capital expenditure contracted for but not provided. The other long-term liabilities reflected in the balance sheet at 31 March 2007 comprise commodity contracts carried at fair value and other creditors that represent contractual obligations falling due after more than one year.
| | | | | | | | | | | | | | | | | | | | | |
| | | | | | | Less than | | | | | | | | | | | More than | |
| | | Total | | | 1 year | | | 1-3 years | | | 3-5 years | | | 5 years | |
| Contractual obligations | | £m | | | £m | | | £m | | | £m | | | £m | |
Financial liabilities | | | | | | | | | | | | | | | | | | | | |
| Borrowings | | | 15,937 | | | | 776 | | | | 2,878 | | | | 2,196 | | | | 10,087 | |
| Interest on borrowings | | | 8,335 | | | | 686 | | | | 1,160 | | | | 950 | | | | 5,539 | |
| Finance lease liabilities | | | 159 | | | | 17 | | | | 29 | | | | 19 | | | | 94 | |
| Other non-interest bearing liabilities | | | 1,739 | | | | 1,525 | | | | 214 | | | | – | | | | – | |
| Derivative payments | | | 3,242 | | | | 443 | | | | 889 | | | | 1,378 | | | | 532 | |
| Derivative receipts | | | (3,405 | ) | | | (382 | ) | | | (907 | ) | | | (1,527 | ) | | | (589 | ) |
| Commodity contracts | | | 389 | | | | 56 | | | | 93 | | | | 70 | | | | 170 | |
Other contractual obligations | | | | | | | | | | | | | | | | | | | | |
| Capital commitments | | | 1,554 | | | | 1,211 | | | | 324 | | | | 15 | | | | 4 | |
| Operating leases | | | 800 | | | | 80 | | | | 148 | | | | 132 | | | | 440 | |
| Power commitments | | | 3,731 | | | | 1,233 | | | | 1,118 | | | | 327 | | | | 1,053 | |
| |
Total at 31 March 2007 | | | 32,481 | | | | 5,645 | | | | 5,946 | | | | 3,560 | | | | 17,330 | |
| |
Annual Report and Accounts 2006/0769
Interest on borrowings is calculated based on borrowings at 31 March 2007 and does not reflect future debt issues. Floating rate interest has been estimated using future interest rate curves at 31 March 2007.
Off balance sheet arrangements
There were no significant off balance sheet arrangements other than the contractual obligations and commitments and contingencies described above.
Details of material litigation as at 31 March 2007
Other than the environmental remediation case currently before the House of Lords as described on page 25, we were not party to litigation that we considered to be material as at 31 March 2007.
As described on page 25, we are subject to an investigation by Ofgem with respect to metering services in the UK.
Retirement arrangements
We operate two principal occupational pension schemes in the UK, the National Grid UK Pension Scheme and the National Grid Electricity Group of the Electricity Supply Pension Scheme (National Grid Electricity Supply Pension Scheme).
With the exception of the National Grid UK Pension Scheme, which also has a defined contribution section, the above schemes are defined benefit pension schemes, which are closed to new entrants. Membership of the defined contribution section of the National Grid UK Pension Scheme is offered to all new employees in the UK.
We also operate defined benefit pension plans for our US employees. Post-retirement healthcare and life insurance benefits are also provided to qualifying retirees.
Net pension and other post-retirement obligations
Net pension obligations at 31 March 2007 included in the balance sheet were £659 million compared with £1,275 million at 31 March 2006. This comprised the present value of fund obligations of £16,044 million and unfunded obligations of £83 million, less plan assets at fair value of £15,468 million (2006: £16,520 million and £96 million, less £15,341 million respectively).
Net other post-retirement obligations at 31 March 2007 included in the balance sheet were £586 million compared with £640 million at 31 March 2006. This comprised the present value of fund obligations of £1,126 million and other post-employment liabilities of £33 million, less plan assets at fair value of £531 million and unvested benefits of £42 million (2006: £1,223 million and £34 million, less £568 million and £49 million respectively).
The total net pension and other post-retirement obligations of £1,245 million at 31 March 2007 (2006: £1,915 million) is calculated in accordance with IFRS. Net of deferred tax, these obligations amounted to £778 million (2006: £1,518 million).
The decrease of £670 million in the total net pension and other post-retirement obligations during 2006/07 arose from exchange movements of £115 million, actuarial gains of £365 million, expected returns on plan assets less interest on obligations of £57 million and employer contributions of £304 million, offset by a £130 million increase in obligations from service costs and £41 million of other movements.
The above amounts differ from the actuarial valuations used to calculate the amounts we need to pay into pension and other post-retirement pension schemes, details of which are described below.
National Grid UK Pension Scheme
The last completed full actuarial valuation of the National Grid UK Pension Scheme was as at 31 March 2006. This concluded that the pre-tax funding deficit was £371 million (£260 million net of tax) in the defined benefit section on the basis of the funding assumptions adopted by the actuary.
It has been agreed that no funding of the deficit identified in the 2006 actuarial valuation will need to be provided to the scheme until the outcome of an interim actuarial valuation at 31 March 2007 is known, following which we will pay the gross amount of any deficit up to a maximum amount of £520 million (£364 million net of tax) into the scheme. Until the 31 March 2007 actuarial valuation has been completed, we have arranged for banks to provide the trustees of the National Grid UK Pension Scheme with letters of credit. The main conditions under which these letters of credit could be drawn relate to events which would imperil the interests of the scheme, such as National Grid Gas plc, a subsidiary undertaking, becoming insolvent or a failure to make agreed payments into the fund. Employer cash contributions for the ongoing cost of the National Grid UK Pension Scheme are currently being made at a rate of 32.7% of pensionable payroll.
National Grid Electricity Supply Pension Scheme
The actuarial valuation of the National Grid Electricity Supply Pension Scheme at 31 March 2004 was completed during the year ended 31 March 2005 and revealed a pre-tax deficit of £272 million (£190 million net of tax) on the basis of the funding assumptions adopted by the actuary.
It has been agreed that no funding of the deficit identified in the 2004 actuarial valuation will need to be provided to the scheme until the outcome of the actuarial valuation at 31 March 2007 is known. At this point, we will pay the gross amount of any deficit up to a maximum amount of £68 million (£48 million net of tax) into the scheme. Until the 31 March 2007 actuarial valuation has been completed, we have arranged for banks to provide the trustees of the National Grid Electricity Supply Pension Scheme with letters of credit. The main conditions under which these letters of credit could be drawn relate to events which would imperil the interests of the scheme, such as National Grid Electricity Transmission plc, a subsidiary undertaking, becoming insolvent or the failure to make agreed payments into the fund. Employer cash contributions for the ongoing cost of the National Grid Electricity Supply Pension Scheme are currently being made at a rate of 13.1% of pensionable payroll.
National Grid US pension and post-retirement plans
The National Grid USA companies have non-contributory defined benefit pension plans covering substantially all employees. All employees, except union-represented employees hired on or after 15 July 2002 participate in a cash balance pension plan design. Under that design, pay-based credits are applied based on service time, and interest credits are applied based on an average annual 30 year Treasury bond yield. Non-union employees hired by our New England business prior to 15 July 2002 and New England business union employees generally participate
70National Grid plc
in the historic final average pay pension plan designs that have been in effect for several decades. In addition, a large number of employees hired by our New York state business prior to July 1998 are cash balance design participants who receive a larger benefit if so yielded under pre-cash balance conversion final average pay formula provisions. Employees hired by our New York business following the August 1998 cash balance design conversion participate under cash balance design provisions only.
Supplemental non-qualified, non-contributory executive retirement programmes provide additional defined pension benefits for certain executives.
We also provide post-retirement benefits other than pensions. Benefits include health care and life insurance coverage to eligible retired employees. Eligibility is based on certain age and length of service requirements and in some cases retirees must contribute to the cost of their coverage.
In New England, our funding policy is to contribute to the Plans each year the amount required to reach 100% of the Funding Target, under the Pension Protection Act of 2006, by the end of the year 2009. In New York, the funding policy is determined by our settlement agreements with the New York Public Service Commission and the amounts recovered in rates, subject to the minimum contribution required by federal law and a maximum equal to the maximum tax-deductible amount.
We manage our benefit plan investments to minimise the long-term cost of operating the plans, with a reasonable level of risk. Risk tolerance is reviewed based on the results of a periodic asset/liability study. This study includes an analysis of plan liabilities and funded status and results in the determination of the allocation of assets across equity and fixed income. Equity investments are broadly diversified across US and non-US equities, as well as across growth, value, and small and large capitalisation equity. Likewise, the fixed income portfolio is broadly diversified across the various fixed income market segments. For the other post-retirement benefits, since the earnings on a portion of the assets are taxable, those investments are managed to maximise after tax returns consistent with the broad asset class parameters established by the asset allocations. Investment risk and return is reviewed by the investment committee on a quarterly basis.
Related party transactions
We provide services to and receive services from related parties, principally joint ventures. In the year ended 31 March 2007, we charged £4 million and received charges of £26 million from related parties (other than Directors) compared with £4 million and £32 million in 2005/06 and £4 million and £24 million in 2004/05 respectively.
Further information relating to related party transactions is contained within note 34 to the accounts. Details on amounts paid to Directors is included within the Directors’ remuneration report on pages 88 to 98.
Annual Report and Accounts 2006/0771
Basis of accounting
The consolidated financial statements present our results for the years ended 31 March 2007, 2006 and 2005 and our financial position as at 31 March 2007 and 2006. They have been prepared using the accounting policies shown, in accordance with International Financial Reporting Standards (IFRS) as adopted in the European Union.
We also provide a reconciliation from our results and financial position as prepared under IFRS to the results and financial position as if they had been prepared in accordance with generally accepted accounting principles in the United States (US GAAP), together with condensed US GAAP financial information. A discussion of the principal differences between IFRS and US GAAP is provided on pages 74 and 75.
Choices permitted under IFRS
Since 1 April 2005 we have presented our consolidated financial statements in accordance with IFRS. We were required to make a number of choices on the adoption of IFRS and in addition we continue to choose from certain options that are available within accounting standards.
The principal choices made on the adoption of IFRS, which cannot be changed, were as follows:
| | | |
| Option | | Choice adopted |
Transition
date | | Our opening IFRS balance sheet was established as at 1 April 2004. As a consequence goodwill amortisation ceased on this date and we used certain balances in our previous UK GAAP financial statements as the basis for our opening IFRS balance sheet. |
| |
Business
combinations | | Business combinations prior to 1 April 2004 were not changed retrospectively. In particular, we retained the use of merger accounting for the business combination with Lattice Group. |
| |
Financial
instruments | | We adopted IAS 39 on 1 April 2005. As a consequence, the results for 2004/05 are presented using different accounting policies for financial instruments from those used for 2005/06 and 2006/07. |
| |
Carrying value
of assets at
transition | | In most cases, we used brought forward depreciated cost, as adjusted for changes in accounting policies to conform with IFRS, to be the opening carrying value under IFRS. |
| |
Share-based
payments | | We recognised all active grants retrospectively. |
| |
Cumulative
translation
differences | | We chose to measure and present cumulative translation differences arising since 1 April 2004 only. |
| |
Significant choices that we continue to make on an ongoing basis include the following:
| | | |
| Option | | Choice adopted |
Presentation
formats | | We use the nature of expense method for our income statement and total our balance sheet to net assets and total equity. |
| | |
| | In the income statement, we present subtotals of total operating profit, profit before tax and profit from continuing operations, together with additional subtotals excluding exceptional items and remeasurements. Exceptional items and remeasurements are presented on the face of the income statement. |
| |
Pensions | | We recognise actuarial gains and losses each year in the statement of recognised income and expense. |
| |
Joint ventures | | We use equity accounting for jointly controlled entities instead of the alternative proportional consolidation method. |
| |
Capitalised
interest | | We capitalise interest into the cost of assets that we construct. |
| |
Capital
contributions | | Contributions received towards capital expenditure are recorded as deferred income and amortised in line with the depreciation on the associated asset. |
| |
Timing of
goodwill
impairment
reviews | | Goodwill impairment reviews are carried out annually in the final quarter of the financial year. |
| |
Financial
instruments | | We normally opt to apply hedge accounting in most circumstances where this is permitted. For net investment hedges, we have chosen to use the spot rate method, rather than the alternative forward rate method. |
| |
Use of
UK GAAP or
IFRS in
individual
accounts | | We have not adopted IFRS, and so continue to use UK GAAP, in the individual financial statements of National Grid plc and of UK subsidiary companies. |
| |
Segmental reporting
In addition to presenting the consolidated financial results and financial position in the financial statements, we provide a breakdown of those results and balances into our business segments. The presentation of segment information is based on management responsibilities that existed at 31 March 2007 and the external and regulatory environments in which we operate. Our business segments are Transmission – UK, Transmission –US, Gas Distribution – UK, Gas Distribution – US, Electricity Distribution – US and US stranded cost recoveries, with our Non-regulated Businesses and corporate activities, including business development, being aggregated within Other activities. Our geographical segments reflect our principal activities in the UK and the US. Discontinued operations comprise our wireless infrastructure operations in the UK and the US, and the Basslink electricity interconnector in Australia. Discontinued results in prior years also include the results of the four gas distribution networks sold on 1 June 2005, which had previously been part of our UK gas distribution segment.
The business segments presented are different from those presented in the 2005/06 Annual Report in that Gas Distribution
– US has been presented separately from Electricity Distribution
– US following the establishment of Gas Distribution as a line of business covering both UK and US gas distribution activities, and wireless infrastructure has been reclassified within discontinued operations.
72National Grid plc
Critical accounting policies
The application of accounting principles requires us to make estimates, judgements and assumptions that may affect the reported amounts of assets, liabilities, revenue and expenses and the disclosure of contingent assets and liabilities in the accounts. On an ongoing basis, we evaluate our estimates using historical experience, consultation with experts and other methods that we consider reasonable in the particular circumstances to ensure compliance with IFRS and US GAAP respectively. Actual results may differ significantly from our estimates, the effect of which will be recognised in the period in which the facts that give rise to the revision become known.
Certain accounting policies have been identified as critical accounting policies, as these policies involve particularly complex or subjective decisions or assessments. The discussion of critical accounting policies below should be read in conjunction with the description of our accounting policies set out in our consolidated financial statements. Where critical accounting policies adopted under US GAAP are significantly different from the ones adopted under IFRS, additional information is included in the discussion on our US GAAP accounting on pages 74 and 75.
Our critical accounting policies and accounting treatments are considered to be:
| | | |
Estimated
asset
economic
lives | | The reported amounts for amortisation of intangible fixed assets and depreciation of property, plant and equipment can be materially affected by the judgements exercised in determining their estimated economic lives. |
| | |
| | Intangible asset amortisation and depreciation of property, plant and equipment of continuing operations amounted to £41 million and £830 million respectively in 2006/07 (2005/06: £44 million and £844 million, 2004/05: £39 million and £743 million). |
| |
Carrying value
of assets and
potential for
impairments | | The carrying value of assets recorded in the consolidated balance sheet could be materially reduced if an impairment were to be assessed as being required. Our total assets at 31 March 2007 were £28,389 million, including £18,895 million of property, plant and equipment, £1,480 million of goodwill and £144 million of other intangible assets (31 March 2006: £25,924 million including £18,935 million, £2,142 million and £321 million respectively). |
| | |
| | Impairment reviews are carried out either when a change in circumstance is identified that indicates an asset might be impaired or, in the case of goodwill, annually. An impairment review involves calculating either or both of the fair value or the value-in-use of an asset or group of assets and comparing with the carrying value in the balance sheet. These calculations involve the use of assumptions as to the price that could be obtained for, or the future cash flows that will be generated by, an asset or group of assets, together with an appropriate discount rate to apply to those cash flows. |
| |
Revenue
accruals | | Revenue includes an assessment of energy and transportation services supplied to customers between the date of the last meter reading and the year end. Changes to the estimate of the energy or transportation services supplied during this period would have an impact on our reported results. |
| | |
| | Our estimates of unbilled revenues at 31 March 2007 amounted to £200 million in the US and £246 million in the UK compared with £169 million and £268 million respectively at 31 March 2006. |
| |
| | | |
Assets and
liabilities
carried at
fair value | | Certain assets and liabilities, principally financial investments, derivative financial instruments and certain commodity contracts are carried in the balance sheet at their fair value rather than historical cost. |
| | |
| | The fair value of financial investments is based on market prices, as are those of derivative financial instruments where market prices exist. Other derivative financial instruments and those commodity contracts carried at fair value are valued using financial models, which include judgements on, in particular, future movements in exchange and interest rates as well as equity and commodity prices. |
| |
Hedge
accounting | | We use derivative financial instruments to hedge certain economic exposures arising from movements in exchange and interest rates or other factors that could affect either the value of our assets or liabilities or affect our future cash flows. |
| | |
| | Movements in the fair values of derivative financial instruments may be accounted for using hedge accounting where we meet the relevant eligibility, documentation and effectiveness testing requirements. If a hedge does not meet the strict criteria for hedge accounting, or where there is ineffectiveness or partial ineffectiveness, then the movements will be recorded in the income statement immediately instead of being recognised in the statement of recognised income and expense or by being offset by adjustments to the carrying value of debt. |
| |
Pensions
and other
post-retirement
benefit plans | | Pensions and other post-retirement benefit obligations recorded in the balance sheet are calculated actuarially using a number of assumptions about the future, including inflation, salary increases, length of service and pension and investment returns, together with the use of a discount rate based on corporate bond yields to calculate the present value of the obligation. |
| | |
| | The selection of these assumptions can have a significant impact on both the pension obligation recorded in the balance sheet and on the net charge recorded in the income statement. |
| |
Assets held
for sale and
discontinued
operations | | At 31 March 2007, the planned exit of our wireless infrastructure operations in the UK and the US and our interconnector in Australia were considered to meet the criteria to be classified as assets held for sale. |
| | |
| | At 31 March 2005, the planned sales of four of our regional gas distribution networks did not meet the criteria to be classified as assets held for sale. On 1 May 2005, these criteria were met and the assets and liabilities of these businesses were classified as assets held for sale and depreciation ceased from that date until their disposal on 1 June 2005. |
| | |
| | The results of these operations have been classified as discontinued operations and the comparatives reflect this accordingly. |
| | |
| | The determination of the date that the planned sales met the criteria to be classified as assets held for sale is a matter of judgement by management, with consequential impact on balance sheet presentation and the amount recorded for depreciation in the results of the discontinued operations. |
| |
Annual Report and Accounts 2006/0773
| | | |
Exceptional
items and
remeasure
-ments | | Exceptional items and remeasurements are items of income and expenditure that, in the judgement of management, should be disclosed separately on the basis that they are material, either by their nature or their size, to an understanding of our financial performance and distort the comparability of our financial performance between periods. |
| | |
| | Items of income or expense that are considered by management for designation as exceptional items include such items as significant restructurings, write-downs or impairments of non-current assets, material changes in environmental or decommissioning provisions, integration of acquired businesses and gains or losses on disposals of businesses or investments. Remeasurements comprise gains or losses recorded in the income statement arising from changes in the fair value of commodity contracts and of derivative financial instruments. These fair values increase or decrease as a consequence of changes in commodity and financial indices and prices over which we have no control. |
| |
Provisions | | Provisions are made for liabilities that are uncertain in estimate. These include provisions for the cost of environmental restoration and remediation, the decommissioning of nuclear facilities that we no longer own but still have a responsibility to contribute towards, restructuring and employer and public liability claims. |
| | |
| | Calculations of these provisions are based on estimated cash flows relating to these costs, discounted at an appropriate rate where the impact of discounting is significant. The total costs and timing of cash flows relating to environmental and decommissioning liabilities are based on management estimates supported by the use of external consultants. |
| | |
| | At 31 March 2007, we have recorded provisions totalling £594 million (2006: £771 million), including £372 million and £70 million (2006: £429 million and £127 million) in respect of environmental liabilities and nuclear decommissioning respectively. |
| |
Tax estimates | | Our tax charge is based on the profit for the year and tax rates in effect. The determination of appropriate provisions for taxation requires us to take into account anticipated decisions of tax authorities and estimate our ability to utilise tax benefits through future earnings and tax planning. Our estimates and assumptions may differ from future events. |
| |
In order to illustrate the impact that changes in assumptions could have on our results and financial position, the following sensitivities are presented:
| | | |
Useful asset
economic lives | | An increase in the useful economic lives of assets of one year on average would reduce our annual depreciation charge on property, plant and equipment by £44 million (pre-tax) and our annual amortisation charge on intangible assets by £7 million (pre-tax). |
| |
Revenue
accruals | | A 10% change in our estimate of unbilled revenues at 31 March 2007 would result in an increase or decrease in our recorded net assets and profit for the year by approximately £29 million net of tax. |
| |
Assets carried
at fair
value | | A 10% change in assets and liabilities carried at fair value would result in an increase or decrease in the carrying value of derivative financial instruments and commodity contract liabilities of £23 million and £27 million respectively. |
| |
| | | |
Hedge
accounting | | If the gains and losses arising on derivative financial instruments during the year ended 31 March 2007 had not achieved hedge accounting then the profit for the year would have been £246 million higher than that reported net of tax and net assets would have been £83 million lower. |
| |
Pensions | | Our pension and post-retirement obligations are sensitive to the actuarial assumptions used. A 0.1% reduction in the discount rate, a 0.5% increase in the rate of salary increases or an increase of one year in life expectancy would result in an increase in the net obligation of £260 million, £139 million and £557 million and an increase in the annual pension cost of £4 million, £8 million and £4 million respectively. |
| |
Provisions | | A 10% change in the estimates of future cash flows estimated in respect of provisions for liabilities would result in an increase or decrease in net assets of approximately £40 million. |
| |
Accounting developments
Accounting standards and interpretations adopted in 2006/07
In preparing our consolidated financial statements we have complied with International Financial Reporting Standards, International Accounting Standards and interpretations applicable for 2006/07. The following amendments to standards and interpretations were adopted during 2006/07, none of which resulted in a material change to our consolidated results, assets or liabilities in 2006/07 or in those of previous periods:
| | | |
Leases | | International Financial Reporting Interpretations Committee (IFRIC) 4 on leases provides guidance on determining when other forms of contractual arrangements should also be accounted for as leases. |
| |
Financial
instruments | | Amendments to IAS 39, IFRS 4, and IAS 21 allow for financial liabilities to be designated as fair value through profit and loss in certain circumstances, for certain financial guarantees to be recorded in the balance sheet at their fair value and permitted inter-company exchange gains and losses to be taken to equity reserves on consolidation in certain circumstances. |
| |
Other
interpretations | | IFRIC 5, IFRIC 6 and IFRIC 7 contain guidance on accounting for decommissioning, restoration and environmental funds, for waste electrical and electronic equipment and for subsidiaries in hyperinflationary economies. |
| |
Forthcoming changes in IFRS
The following accounting standards and interpretations have not yet been adopted, but are expected to be adopted in future periods.
| | | |
Segment
reporting | | IFRS 8 on segment reporting changes the requirements for segmental reporting. Assuming that it is adopted by European Union, it will apply with effect from 1 April 2009. If IFRS 8 had been adopted in 2006/07, there would have been no change in business segments reported. However, we would not have had to report on geographical segments. |
| |
Service
concessions | | IFRIC 12 on service concessions, effective from 1 April 2008, requires assets operated on behalf of a public authority as a concession, where the asset reverts back to the public authority at the conclusion of the arrangement, to be recognised as a financial or intangible asset depending on whether income is recovered from the public authority or from users. This is not expected to affect the majority of our assets and liabilities. However, we have not yet completed our assessment of this interpretation and so it is possible that there may be an impact on our assets and liabilities as a consequence of the adoption of this interpretation. |
| |
74National Grid plc
| | | |
Borrowing
costs | | An amendment of IAS 23 on borrowing costs will require interest to be capitalised into the cost of assets we construct. We already adopt this policy and so this will have no impact. |
| |
Other
interpretations | | IFRIC 8, IFRIC 9, IFRIC 10 and IFRIC 11 contain guidance on accounting for share-based exchange transactions, embedded derivatives, impairments in half yearly reports and share-based payments. These interpretations are not expected to have a material impact on our results, assets or liabilities. |
| |
US GAAP reporting
Overview
Our consolidated financial statements have been prepared in accordance with IFRS, which differs in certain significant respects from US GAAP. A reconciliation of net income and equity shareholders’ funds from IFRS to US GAAP, together with a summary of adjustments, is provided in note 38 to the accounts on page 153. In addition, condensed income statements, balance sheets and segmental information prepared in accordance with US GAAP are provided in note 39 to the accounts.
Results and financial position under US GAAP
Net income from continuing operations for 2006/07 under US GAAP was £1,092 million (2005/06: £703 million, 2004/05: £1,042 million), while net income from discontinued operations amounted to £54 million (2005/06: £604 million, 2004/05: £246 million). Consequently, net income for 2006/07 under US GAAP was £1,146 million (2005/06: £1,307 million, 2004/05: £1,288 million). This compared with the profit for the year attributable to equity shareholders under IFRS for 2006/07, 2005/06 and 2004/05 of £1,394 million, £3,848 million and £1,424 million respectively.
Shareholders’ equity under US GAAP at 31 March 2007 was £9,330 million (2006: £9,747 million) compared with £4,125 million (2006: £3,842 million) under IFRS. Because the application of merger accounting principles retained under IFRS has fundamentally affected the comparison of IFRS results with US GAAP results, the following is a discussion of the impact the application of US GAAP has had on the results, which should be read in conjunction with the rest of this Operating and Financial Review.
The principal adjustments from net income and equity shareholders’ equity under IFRS to its equivalent under US GAAP relate to differences in accounting for the business combination with Lattice Group plc as a purchase instead of as a merger, US regulatory accounting, the recording of derivative financial instruments at their fair value in the balance sheet and hedge accounting; and differences in accounting for pensions. The other adjustments between IFRS and US GAAP are explained in more detail in note 38 to the accounts.
Some of the adjustments included within the US GAAP summary income statements and balance sheet substantially reflect reclassifications of items that are presented differently under IFRS and US GAAP, but that do not significantly impact net income or net assets.
| | | |
Business
combination
with Lattice
Group | | The application of then prevailing UK GAAP to the business combination with Lattice Group plc in 2002/03 resulted in the transaction being treated as a merger, and merger accounting has been retained under IFRS. Under US GAAP, purchase accounting was applied rather than merger accounting, with Lattice Group plc considered to be the acquired entity. |
| | |
| | Unlike IFRS, our results under US GAAP include the results of Lattice Group plc from 21 October 2002, the date of the business combination, and not prior to that date. |
| | |
| | The recognition of Lattice Group plc’s assets and liabilities at fair value under US GAAP resulted in £3,824 million of goodwill being recognised. The assets acquired included the four regional gas distribution networks that were disposed of in 2005/06. The higher book value of these assets under US GAAP resulted in a significantly lower gain in 2005/06 (by some £2 billion) recognised on disposal under US GAAP as compared with IFRS. |
| |
Regulatory
assets | | These assets are recorded in the US GAAP balance sheet in accordance with the principles of Statement of Financial Accounting Standards (SFAS) 71 on accounting for the effects of certain types of regulation. SFAS 71 provides that certain costs may be deferred on the balance sheet (referred to as regulatory assets) if it is probable that the costs will be recovered through future increases in regulated revenue rates. An entity applying SFAS 71 does not need absolute assurance prior to capitalising a cost, only reasonable assurance. If the principles of SFAS 71 were not applicable, it is likely that this would result in the full or partial non-recognition of these regulatory assets and thereby materially alter the view given by the accounts. |
| | |
| | The total carrying value of regulatory assets, under US GAAP, at 31 March 2007 amounted to £2,880 million (2006: £3,051 million, 2005: £3,350 million). |
| |
Derivatives | | Under US GAAP, all derivatives are recorded at fair value except those that qualify for exemptions, such as normal purchase rules for commodity contracts. Changes in fair values of derivatives not designated as a hedge under US GAAP are recorded through earnings. We apply a hedging strategy in accordance with IFRS requirements, however, many of these hedges do not meet the requirements to achieve hedge accounting under US GAAP. This results in a much greater volatility in the US GAAP income statements. Under IFRS, the Company did not adopt IAS 39 until 1 April 2005 and, therefore, did not record derivatives at fair value in the year ended 2004/05. Upon adoption of IAS 39, the Company recorded its outstanding derivatives at fair value and took advantage of certain transition accommodations that allowed for hedge accounting. These transition alternatives were not available under US GAAP. |
| |
Pensions | | Differences exist in the measurement of pension obligations, plan assets, and periodic pension expense. The primary difference is that under US GAAP, we include actuarial gains and losses as a component of periodic pension expense while, under IFRS, these items are recorded directly to equity reserves and are not recycled through the income statement. Differences in key assumptions used to measure plan assets and obligations also create differences. |
| |
Annual Report and Accounts 2006/0775
New US accounting pronouncements adopted during 2006/07
During 2006/07, we adopted a number of new US GAAP accounting standards and interpretations issued by the US Financial Accounting Standards Board (FASB). The following standard was adopted on 31 March 2007 resulting in a change in the reported financial position under US GAAP and in the reconciliation between IFRS and US GAAP.
| | | |
Pensions | | SFAS 158 on pensions accounting was adopted on 31 March 2007. It requires deferred actuarial gains and losses in respect of defined benefit pension plans and other post-retirement benefits previously recorded in the balance sheet to instead be recorded initially within accumulated other comprehensive income within equity. Subsequently, actuarial gains and losses are recycled out of other comprehensive income and into the income statement using the same basis as deferred gains and losses were previously amortised from the balance sheet. |
| | |
| | On adoption on 31 March 2007, net assets under US GAAP increased by £51 million, comprising an increase in pension and other post-retirement benefit obligations of £196 million, a derecognition of intangibles of £41 million more than offset by the recognition of regulatory assets of £274 million and net tax of £14 million. As a consequence, the differences reported between IFRS and US GAAP in respect of these items reduced by the same amount. |
| | |
| | There was no change in the amounts reported in the income statement under US GAAP, nor in the amounts recorded within other comprehensive income with respect to the accumulated minimum pension obligation during 2006/07, 2005/06 and 2004/05. |
| |
The following new standards and interpretations were also adopted during 2006/07 but did not have a material impact on the reported results or financial position under US GAAP, nor did they result in a material change in the reconciliation between IFRS and US GAAP.
| | | |
Share-based
payments | | SFAS 123(R) was adopted on 1 April 2006. It requires all share-based payments to employees, including grants of employee stock options, to be recognised in the income statement based on their fair values. Pro forma disclosure is no longer an alternative. SFAS 123(R) is similar to our existing accounting treatment under IFRS in accordance with IFRS 2, and to the method previously adopted under SFAS 148. |
| |
Carrying
value of
inventories | | SFAS 151 was adopted on 1 April 2006, clarifying that abnormal amounts of idle facility expense, freight, handling costs and wasted materials (spoilage) should be recognised as current period expense. |
| |
Exchanges of
non-monetary
assets | | SFAS 153 was adopted on 1 April 2006. It removed an exemption which previously permitted exchanges of similar productive assets to be accounted for at the carrying value of the assets relinquished. All non- monetary transactions subsequent to 1 April 2006 (apart from those without commercial substance) must be recorded at fair value. |
| |
Errors and
changes in
accounting
policies | | SFAS 154 was adopted on 1 April 2006. It requires retrospective application to comparative financial statements for material errors and for changes in accounting principle that occur subsequent to that date, other than where (as in the case of SFAS 158 above) a new standard requires a different treatment. |
| |
Forthcoming US pronouncements not yet adopted
In preparing the US GAAP reconciliation for 2006/07, we have not reflected the impact of recent US accounting pronouncements that are expected to be adopted in future periods. The most notable of these are:
| | | |
Uncertain tax
positions | | FASB Interpretation No. (FIN) 48 on uncertain tax positions is an interpretation of SFAS 109 on accounting for taxes and seeks to reduce the diversity of the reporting of uncertain tax positions so that these can be more easily compared. The interpretation also requires qualitative and quantitative disclosures, including discussion of reasonably possible changes that might occur in unrecognised tax benefits over the following 12 months, a description of open tax years by major jurisdiction, and a roll-forward of all unrecognised tax benefits. |
| | |
| | FIN 48 is effective for financial years beginning after 15 December 2006 and any impact of adopting it will be reported as an adjustment to the opening balance of retained earnings in the year of adoption. We are currently evaluating the impact, if any, that FIN 48 will have on our results and financial position under US GAAP. |
| |
Hybrid
financial
instruments | | SFAS 155 provides a fair value measurement option for certain hybrid financial instruments, which allows the recording of an entire financial instrument at fair value rather than accounting for the host instrument and the embedded derivative separately. SFAS 155 is effective for financial years beginning after 15 September 2006. |
| |
Fair value
measurement | | SFAS 157 seeks to increase the consistency and comparability of fair value estimates. This statement defines fair value, establishes a consistent framework for measuring fair value where other pronouncements require or permit it and also expands disclosure about fair value measurements. This statement does not require any new fair value measurements. |
| | |
| | SFAS 157 is effective for financial years beginning after 15 November 2007. We are currently evaluating the impact, if any, that SFAS 157 will have on our reported financial results and position under US GAAP. |
| |
Fair value
option | | SFAS 159 permits an entity to choose to designate certain financial instruments to be recorded at their fair value through profit and loss and is effective for financial years beginning after 15 November 2007. This standard is similar to certain amendments to IFRS adopted by National Grid in 2006/07 which did not have a material impact on our financial results or position as we have not chosen to use this option under IFRS. |
| |
Further information on the differences between US GAAP and IFRS is contained in notes 38 and 39 in the consolidated financial statements.
76 National Grid plc
Independent Verifier’s Report on
Corporate Responsibility
Ernst & Young LLP was commissioned to provide independent assurance of the corporate responsibility (CR) content of National Grid plc’s (National Grid) Operating and Financial Review in the 2006/07 Annual Report and Accounts (the Report) and the website (http://www.nationalgrid.com/corporate/Our+responsibility). This statement relates to the corporate responsibility content of the Operating and Financial Review in the Annual Report and Accounts 2006/07. For our full opinion and scope please see our statement at: http://www.nationalgrid.com/corporate/Our+Responsibility/ Assurance/. The Report has been prepared by the management of National Grid, who are responsible for the collection and presentation of information within it. Our responsibility, in accordance with National Grid management’s instructions, is to carry out a limited assurance engagement on the Report in order to provide conclusions in relation to the AA1000AS1Principles of Materiality, Completeness and Responsiveness. We do not therefore accept or assume any responsibility for any other purpose or to any other person or organisation. Any reliance any such third party may place on the Report is entirely at its own risk.
Our observations and areas for improvement will be raised in a report to National Grid’s management.
What we did to form our conclusions
Our assurance engagement has been planned and performed in accordance with the AA1000AS and ISAE30002Standards. The AA1000 assurance principles have been used as criteria against which to evaluate the Report.
In order to form our conclusions, we undertook the steps outlined below:
| 1. | | Interviews with a selection of National Grid executives and senior managersto understand the current status of Corporate Responsibility (CR) activities and progress made during the reporting period. |
| 2. | | Visits to National Grid offices in the US and the UK and operations at the Isle of Grain, Milford Haven and Landulph site, Cornwallto review the systems and processes in place for managing and reporting on CR activities and to review evidence in support of claims made in the Report regarding National Grid’s CR performance. |
| 3. | | Review of selected corporate level documentsto assess management awareness of performance against non-financial
policy commitments and test the coverage of the Report. |
| 4. | | Review of stakeholder engagement activities,including engagement with the socially responsible investment
community, regulators and communities. |
| 5. | | Review of a selection of external media reportsrelating to CR aspects of National Grid’s performance, as a check on the scope and appropriateness of statements made in the Report. |
| 6. | | Review of social investment, employee and health, safety and environmental (HSE) data samples and processesto assess whether they have been collected, consolidated and reported appropriately at corporate level and at the business level. |
| 7. | | Test the consistency of the claims made in the Report regarding National Grid’s CR performance against the evidence obtained through our work. |
| | |
| 1 | | AA1000AS — AA1000 assurance standard from the Institute of Social and Ethical Accountability. |
| |
| 2 | | ISAE3000 — International Federation of the Accountants’ International Standard for Assurance Engagements Other Than Audits or Reviews of Historical Financial Information. |
Level of assurance
Our evidence gathering procedures have been designed to obtain a limited level of assurance (as set out in ISAE3000) on which to base our conclusions. The extent of evidence gathering procedures performed is less than that of a reasonable assurance engagement (such as a financial audit) and therefore a lower level of assurance is provided.
The limitations of our review
Our work and conclusions are limited to the CR content of the Operating and Financial Review in the Annual Report and Accounts found under the following headings: responsibility, safety, people, community involvement, community investment and people. Our review does not cover the content of the individual business summaries or CR data for previous years.
The scope of our work was limited to corporate level activities and visits to the offices and operations highlighted above.
Our conclusions
Based on the scope of our review our conclusions are outlined below:
Materiality
We are not aware of any material aspects concerning National Grid’s CR activities that have been excluded from the Report. However, given the importance National Grid is placing on process safety following reports issued by the Baker Panel, the US Chemical Safety and Hazard Investigation Board and the Buncefield Major Incident Investigation Board, we would expect to see further coverage on this topic in future reports.
Completeness
| n | | We are not aware of any material issues excluded from National Grid’s judgements on the content of the Report. |
| n | | We are not aware of any misstatements in the assertions made by National Grid management in the Report regarding CR activities. |
HSE, Social Investment and Employee Data
| n | | We are not aware of any material reporting units that have been excluded from the Company wide data relating to the topics above. |
| n | | Nothing has come to our attention that causes us to believe that the data relating to the above topics has not been collated properly from information reported at operations level. |
| n | | We are not aware of any errors that would materially affect the data as presented in the Report. |
Responsiveness
| n | | With the exception of the issue highlighted in relation to Materiality, we are not aware of any additional issues of stakeholder interest that are not currently included in the Report’s scope and content. |
Our Independence
This is the first year Ernst & Young LLP has provided independent assurance services in relation to National Grid’s CR reporting. With the exception of this work, we have provided no other services relating to National Grid’s approach to CR reporting.
Our Assurance Team
Our assurance team has been drawn from our global environment and sustainability network, which undertakes similar engagements to this with a number of significant UK and international businesses.
Ernst & Young LLPLondon, 16 May 2007
Annual Report and Accounts 2006/07 77
Corporate Governance
Governance
The Board of National Grid plc remains committed to embedding leading corporate governance practices throughout the organisation. It is responsible for ensuring that proper governance arrangements for the Company and its businesses, based on the Combined Code and current and developing best practice, are in place. The Board leads the Company’s governance through National Grid’s Framework for Responsible Business and its standards of conduct for all employees. We are also involved in the Business Leaders Initiative on Human Rights and have developed an inclusion and diversity vision for our businesses. The framework and standards described above, plus other documentation relating to National Grid’s governance, can be found on our website at www.nationalgrid.com.
We complied fully with all the provisions set out in Section 1 of the Combined Code on Corporate Governance, as issued by the Financial Reporting Council in 2003, throughout the year. We also seek to comply with various corporate governance guidelines, such as those issued by the Association of British Insurers, the National Association of Pension Funds and the Hermes Principles.
The Board
The Board of National Grid was composed as follows and attendance at Board meetings was as indicated from a total of 11 meetings during 2006/07:
| | | |
| Name | | Attendance* |
Chairman | | |
| Sir John Parker | | 11 of 11 |
Chief Executive | | |
| Steve Holliday (Chief Executive from 1 January 2007) | | 11 of 11 |
| Roger Urwin (to 31 December 2006) | | 9 of 9 |
Executive Directors | | |
| Steve Lucas | | 11 of 11 |
| Nick Winser | | 11 of 11 |
| Mark Fairbairn (from 1 January 2007) | | 2 of 2 |
| Edward Astle | | 11 of 11 |
| Mike Jesanis (to 31 December 2006) | | 5 of 9 |
Non-executive Directors | | |
| Ken Harvey (Senior Independent Director) | | 10 of 11 |
| Linda Adamany (from 1 November 2006) | | 5 of 5 |
| John Allan | | 7 of 11 |
| John Grant (to 31 July 2006) | | 3 of 3 |
| Paul Joskow | | 10 of 11 |
| Stephen Pettit | | 10 of 11 |
| Maria Richter | | 11 of 11 |
| George Rose | | 10 of 11 |
| |
| | |
| * | | Attendance is expressed as number of meetings attended out of number eligible to attend |
Biographical details for all the Directors can be found on pages 18 and 19, together with details of Board Committee memberships.
Directors are sent papers for meetings of the Board and those Committees of which they are a member whether they are able to attend the meeting or not. In the event that a Director is unable to attend a meeting, they are able to relay their views and comments via the relevant Committee chairman, another Committee member or the Chairman of the Board.
Provided we complete the acquisition of KeySpan, Robert B. Catell, currently Chairman and Chief Executive Officer of KeySpan, will join the Board as Deputy Chairman. The intended retirement from the Board of Paul Joskow will be with effect from 31 July 2007. He will be replaced as chairman of the Finance Committee by Maria Richter with effect from 31 July 2007.
The service contracts (Executive Directors) and letters of appointment (Non-executive Directors) of Board members are available for inspection by National Grid’s shareholders at our registered office and also at the Annual General Meeting (AGM) prior to the meeting. Further details regarding the Directors’ service contracts/letters of appointment can be found in the Directors’ Remuneration Report on pages 88 to 98. Directors are submitted for re-election by National Grid’s shareholders at the first AGM following their initial appointment and then at least once every three years. Further details regarding those Directors due for re-election at the 2007 AGM can be found in the Notice of 2007 AGM.
Non-executive Director independence
Each of the Non-executive Directors has been determined by the Board to be independent following initial consideration by the Nominations Committee. The independence of the Non-executive Directors is considered at least annually and is based on the criteria suggested in the Combined Code. Further, the Nominations Committee also considers the character, judgement and behaviour of each Non-executive Director plus their performance on the Board and the relevant Committees.
In determining length of service, the Board takes into account service on the Board of National Grid plus that on the boards of either Lattice Group plc or National Grid Group plc prior to their merger. Under these criteria, Professor Paul Joskow has now served on the Board for seven years. His time as a director of New England Electric System (NEES) is not considered to have an impact on his independence given NEES now represents a minor part of our operations overall. Professor Joskow has been viewed by the Board as a valuable member as it recognises his extensive knowledge of the US utility scene and considers him to be a world authority on utility regulation.
Chairman, Chief Executive
and Senior Independent Director
The roles of the Chairman and the Chief Executive are separate and have been defined and approved by the Board. The Chairman’s main responsibility is the leadership and management of the Board and its governance. The Chief Executive is responsible for the leadership and day-to-day management of the Company and the execution of strategy as approved by the Board.
During the year, the Chairman’s main positions outside the Company were as Senior Non-executive Director of the Court of the Bank of England, Deputy Chairman of Port and Free World Zone (Dubai) and a Non-executive Director of Carnival plc and Carnival Corporation, Inc. The Chairman’s contractual commitment to National Grid is two days per week, but in practice this is often exceeded.
78 National Grid plc
Following the announcement of Roger Urwin’s retirement, a rigorous succession process was put in place, led by the Chairman and Non-executive Directors, to identify a new Chief Executive. This led to the appointment of Steve Holliday as Deputy Chief Executive with effect from 1 April 2006, enabling a progressive and smooth handover of responsibilities in accordance with a transition plan approved by the Chairman and Non-executive Directors.
The Senior Independent Director is Ken Harvey, who has held the role since 21 October 2004. His responsibilities include leading the Non-executive Directors’ annual consideration of the Chairman’s performance. He is also available to shareholders in the event they feel it inappropriate to communicate via the Chairman, the Chief Executive or the Finance Director, but we received no such requests from shareholders during the year.
Information and professional development
The Chairman, with the support of the Company Secretary & General Counsel, is responsible for ensuring the Directors continually update their skills, knowledge and familiarity with National Grid. The aim is to ensure that Board members are equipped and have adequate information to enable them to play a fully effective part on the Board.
A new Director’s knowledge of the Company and its operations is facilitated upon appointment to the Board via a tailored and wide-ranging induction programme. For example, on the appointment of Linda Adamany on 1 November 2006, this programme included the provision of past Board materials and presentations to provide background information on the Company’s businesses and operations. Information on the Board’s processes, compliance and governance was also supplied through a Day One Information Pack. Site visits and meetings with key senior management personnel and Executive Directors were also arranged. The aim of the induction programme was to equip her with up to date knowledge of the Company and its businesses to enable her to participate fully and effectively at Board meetings at an early date following her appointment.
Mark Fairbairn, being already a senior executive within the Company, received no formal induction on his appointment to the Board with regard to the Company and its operations. However, he did receive a briefing from the Chairman and the Company Secretary & General Counsel regarding his role as a member of the Board. Steps are also being taken to ensure he is familiar with all areas of the business, particularly those outside his previous direct experience.
Following appointment, Directors’ attendance at meetings is continually monitored to ensure key site visits and presentations are not missed. Directors are also encouraged to attend external courses where they feel such education and training would support their position on the Board and its Committees. In particular, this is aimed, where necessary, at keeping Directors informed of current issues, emerging developments or increasing their effectiveness as a Director. Directors can ask the advice of the Company Secretary & General Counsel and are also given access to independent professional advice, at the Company’s expense, as necessary. No independent professional advice was requested by any of the Directors during the year other than that already provided to Committees by external advisors such as the consultants to the Remuneration Committee.
Particular attention is paid to the development of the Executive Directors. Development programmes put in place for their benefit include external mentoring, attendance at external courses and business schools and experience of other boardrooms through non-executive appointments. With the agreement of the Board and as part of their personal development, the Chief Executive, Steve Holliday, is a Non-executive Director of Marks and Spencer Group plc and Steve Lucas, Finance Director, is a Non-executive Director of Compass Group PLC.
Performance evaluation
In each financial year since 2003/04, the Board has undertaken a formal and thorough evaluation of its performance and that of its Committees and Directors.
As in previous years, in 2006/07 this took the form of a survey completed by all Directors in relation to the Board and any Committee of which they were a member at the time of the evaluation. In addition, one-to-one meetings were held between the Chairman and each Director. Additionally, certain regular attendees at specific Committee meetings were asked to complete a survey in relation to the relevant Committee.
In 2006/07, the Board considered, as it had in previous years, the merit of using an external body to manage the performance evaluation process. It concluded it remained most appropriate for the Company Secretary & General Counsel to issue the surveys and collate and analyse the results and for the Chairman to continue his practice of holding one-to-one review meetings with each of the Directors. The Board did, however, agree to reconsider this decision on an annual basis going forward.
The Board survey was revised in 2006/07 to reflect comments made in previous years and ensure the process remained fresh and relevant. The surveys covered broadly similar areas for both the Board and its Committees, as laid out in the table below.
| | | | | | | |
| Board performance | | Committees' performance |
| | Chairman
| | n | | Membership and attendance
|
| | Chief Executive*
| | | | (including internal attendance,
|
| | Non-executive Directors
| | | | external advice)
|
| | Board size, composition,
induction and training | | n | | Chairmanship |
| |
| | Board governance | | n | | Terms of reference
(including interactions with
other Committees) |
| |
| | Board performance (including
contribution to, participation in
and communication of strategy) | | n | | Role and structure
(including fulfilment of role) |
| |
| | Operation (including papers,
presentations, meeting
| | n | | Operations (including meeting
scheduling, frequency)
|
| | | scheduling, frequency) | | n | | Papers and presentations |
| |
| | Performance evaluation
(effectiveness of process) | | | | |
| |
| | |
| * | | This section of the Board survey was not completed to allow time for the Board to assess the performance of the new Chief Executive during 2007 given his appointment in January 2007 |
Based on the outcome of the various steps in the performance evaluation process, the Board considered itself to be performing effectively and to have successfully implemented the improvement action plans that followed from the previous year’s review. However, the process continued to identify areas where further improvement could aid its overall effectiveness. Actions identified from the 2006/07 evaluation process include:
| n | | considering additional development areas for Directors as appropriate; |
Annual Report and Accounts 2006/07 79
| n | | producing templates and guidance for Board and Committee papers and presentations to ensure information presented is clear and relevant; and |
| n | | devoting additional time to debating long term succession plans, particularly in relation to the Non-executive Directors (a number of whom, in two to three years time, approach the nine year independence service limit outlined in the Combined Code), as a result of recent appointments to and resignations from the Board and the planned acquisition of KeySpan. |
Following the 2005/06 evaluation process, a number of actions were implemented and these included:
| n | | reviewing and revising the Company’s core values; |
| n | | reviewing and revising the structure of Executive Committee meetings and relevant paperwork; and |
| n | | arranging additional site visits for Non-executive Directors between scheduled Board meetings. |
The Chairman’s performance was reviewed by the Non-executive Directors, led by the Senior Independent Director, in November 2006. The results of this review were discussed with the Chairman, with his overall performance and leadership deemed to be satisfactory.
Board operation
The Board of National Grid considers the overall direction and effective control of the Company and its businesses to be of utmost importance and, to that end, it reserves a number of matters for its sole consideration. A description of the Matters Reserved to the Board is available on our website. The key areas included are:
| n | | corporate governance; |
| |
| n | | strategy and finance, such as the proposal to acquire KeySpan, and approval of the budget and business plan; |
| n | | Director and employee issues such as Director succession planning (with input and recommendations from the Nominations Committee); and |
| n | | listing requirements such as dividend approval and recommendation and approval of results announcements and the Annual Report and Accounts. |
Certain items are considered at every scheduled meeting of the Board, covering the following:
| n | | safety, health and the environment; |
| n | | financial status of the Company; |
| n | | operational headlines from the Company’s businesses plus a detailed update from one of the lines of business on a rotating basis; |
| n | | update on business development and strategy implementation; |
| n | | update on external matters affecting the Company; and |
| n | | report from the Company Secretary & General Counsel including an update on the administration and governance of the Company and its businesses. |
The Chairman and Non-executive Directors meet at least once a year without any management present and at least once a year with the Chief Executive present. These meetings provide an opportunity for the Non-executive Directors to consider issues relating to the overall governance and management of the Company including succession planning and other issues within their remit as independent directors. Additionally, the Chairman regularly communicates with the Non-executive Directors on an informal basis.
| |
| The Board has delegated authority to its Committees to carry out certain tasks as defined in the Committees’ terms of reference, which have been agreed by the Board and are available on our website. These comprise the Audit, Executive, Finance, Nominations, Remuneration and Risk & Responsibility Committees. By delegating authority for the consideration of policy and oversight of specific items to these Committees, the Board ensures these items are given appropriate attention in terms of both time and priority. To keep the Board appraised of Committee activities, Committee chairmen provide a summary of the issues discussed and decisions taken at the Board meeting immediately following a Committee meeting. Draft minutes of Committee meetings are circulated to Directors once available. |
Audit Committee
The Audit Committee membership and attendance at meetings was as follows during 2006/07 from a total of four meetings:
| | | |
| Name | | Attendance* |
| George Rose (chairman) | | 4 of 4 |
| Linda Adamany (from 1 November 2006) | | 2 of 2 |
| John Allan | | 3 of 4 |
| John Grant (to 31 July 2006) | | 1 of 1 |
| Ken Harvey (1 August to 31 October 2006) | | 1 of 1 |
| Maria Richter | | 4 of 4 |
| |
| | |
| * | | Attendance is expressed as number of meetings attended out of number eligible to attend |
The Board has determined that George Rose has recent and relevant financial experience and deems him to be a suitably qualified financial expert as required by the Audit Committee’s terms of reference. His biographical details are on page 19.
Others invited to attend Audit Committee meetings on a regular basis include the Chairman, Chief Executive, Finance Director, Corporate Director of Audit, Company Secretary & General Counsel and the external auditors. Additionally, the Executive Directors, Risk & Compliance Manager and Financial Controller are invited to attend Audit Committee meetings as necessary to provide updates and background information.
The key items for which the Audit Committee has responsibility and that it has discussed during the year include:
| n | | monitoring and reviewing the effectiveness of internal audit activities and the appointment of the Corporate Director of Audit; |
| n | | making recommendations to the Board regarding the appointment of the external auditors and oversight of the external auditors; |
| n | | reviewing the effectiveness of the Company’s financial reporting and internal control policies; |
| n | | monitoring Sarbanes-Oxley compliance; |
| n | | whistleblowing and complaints procedures; |
| n | | monitoring risk and compliance management and reviewing specific risks such as those associated with the acquisition of KeySpan; |
| n | | receiving reports from the Business Separation Compliance Officer, as required under National Grid Gas plc’s gas transporter licences; and |
| n | | reviewing results statements and the Company’s Annual Report and Accounts before publication and making appropriate recommendations to the Board following review. |
All non-audit work carried out by the external auditors is subject to Audit Committee pre-approval to ensure the objectivity and independence of the external auditors is maintained. Details of
80 National Grid plc
the fees paid to the external auditors for both audit and non-audit work carried out during the year can be found in note 4 to the accounts on page 116.
Executive Committee
The Executive Committee membership and attendance at meetings was as follows during 2006/07 from a total of 11 meetings:
| | | |
| Name | | Attendance* |
| Steve Holliday (chairman from 1 September 2006) | | 11 of 11 |
| Edward Astle | | 11 of 11 |
| Mark Fairbairn (from 19 October 2006) | | 5 of 5 |
| Steve Lucas | | 11 of 11 |
| Nick Winser | | 10 of 11 |
| Roger Urwin (to 31 December 2006, chairman | | |
| to 31 August 2006**) | | 5 of 8 |
| Mike Jesanis (to 31 December 2006) | | 6 of 8 |
| Helen Mahy, Company Secretary & General Counsel | | 11 of 11 |
| |
| | |
| * | | Attendance is expressed as number of meetings attended out of number eligible to attend |
| ** | | In accordance with the handover of responsibilities plan |
Senior management personnel are invited to attend meetings of the Executive Committee as necessary to keep it fully appraised of the Company’s businesses. Attendance of management personnel at Executive Committee and other Board and Committee meetings is monitored by the Executive Committee as part of the Board’s succession planning and development programmes. This monitoring was implemented as a result of the 2005/06 performance evaluation process.
The Executive Committee is responsible for the day-to-day management of the Company and its businesses. The key items for which the Executive Committee has responsibility and that it has discussed during the year include:
| n | | reviewing reports of the financial, operational, safety and environmental performance of the Company and its businesses; |
| n | | developing and implementing strategy, subject to Board approval; |
| n | | monitoring the Company’s businesses through the receipt and consideration of regular reports; |
| n | | approving expenditure under the specific authority delegated to it by the Board; and |
| n | | approving changes to the Non-executive Directors’ remuneration after taking appropriate external advice. |
Finance Committee
The Finance Committee membership and attendance at meetings was as follows during 2006/07 from a total of six meetings:
| | | |
| Name | | Attendance* |
| Paul Joskow (chairman) | | 6 of 6 |
| Steve Holliday (from 1 January 2007) | | 1 of 2 |
| Steve Lucas | | 6 of 6 |
| Stephen Pettit | | 6 of 6 |
| Maria Richter | | 6 of 6 |
| Roger Urwin (to 31 December 2006) | | 4 of 4 |
| |
| | |
| * | | Attendance is expressed as number of meetings attended out of number eligible to attend |
The Tax & Treasury Director is invited to attend Finance Committee meetings on a regular basis to provide updates and background information.
The key items for which the Finance Committee has responsibility and that it has discussed during the year include:
| n | | granting authority for investment and funding decisions, including the funding of the planned acquisition of KeySpan; |
| n | | setting and reviewing treasury management guidelines and policy; |
| n | | granting authority for parent and subsidiary companies to enter into guarantees and indemnities under the specific authority delegated to it by the Board; |
| n | | receiving updates on taxation; |
| n | | insurance renewal strategy; and |
| n | | receiving updates on pension schemes and recommending action to the Board as appropriate. |
Nominations Committee
The Nominations Committee membership and attendance at meetings was as follows during 2006/07 from a total of six meetings:
| | | |
| Name | | Attendance* |
| Sir John Parker (chairman) | | 6 of 6 |
| John Grant (to 31 July 2006) | | 1 of 1 |
| Ken Harvey | | 6 of 6 |
| Paul Joskow | | 5 of 6 |
| George Rose | | 5 of 6 |
| |
| | |
| * | | Attendance is expressed as number of meetings attended out of number eligible to attend |
The Chief Executive is invited to attend Nominations Committee meetings on a regular basis. Additionally, the Group Human Resources Director is invited to attend Nominations Committee meetings as necessary to provide updates and background information.
The key items for which the Nominations Committee has responsibility and that it has discussed during the year include:
| n | | recommending individuals for appointment to the Board following the procedures laid down by the Board in conjunction with the Nominations Committee, including the appointments during the year of Linda Adamany (Non-executive Director) and Mark Fairbairn (Executive Director); |
| n | | reviewing the size of the Board, its structure and composition, including considering Board members’ independence (where appropriate), skills and experience to ensure these remain relevant to National Grid; |
| n | | considering the external commitments of all Directors, to ensure it is satisfied that these do not conflict or interfere with their duties as Directors of the Company; |
| n | | reviewing and refreshing the membership of Board Committees, particularly following the appointment of new Directors to the Board; |
| n | | considering succession planning for Board members, noting that during the year this focused on the smooth transition of responsibilities to the new Chief Executive; |
| n | | development and succession plans for senior management, as developed by the Chief Executive and the Group Human Resources Director; and |
| n | | Board and Committee performance evaluation. |
During the year the Nominations Committee received external support and advice on the appointments of Linda Adamany and Mark Fairbairn.
Annual Report and Accounts 2006/0781
Remuneration Committee
The Remuneration Committee membership and attendance at meetings was as follows during 2006/07 from a total of nine meetings:
| | | |
| |
| Name | | Attendance* |
| |
| John Allan (chairman) | | 8 of 9** |
| John Grant (to 31 July 2006) | | 3 of 3 |
| Ken Harvey | | 9 of 9 |
| Stephen Pettit | | 9 of 9 |
| George Rose | | 6 of 9 |
| |
| | |
| * | | Attendance is expressed as number of meetings attended out of number eligible to attend |
| |
| ** | | John Grant acted as chairman for the meeting that John Allan was unable to attend |
The Chairman and the Chief Executive are invited to attend Remuneration Committee meetings on a regular basis. Additionally, the Group Human Resources Director and the Group Head of Compensation & Benefits are invited to attend Remuneration Committee meetings as necessary to provide advice.
The key items for which the Remuneration Committee has responsibility and that it has discussed during the year include:
| n | | development of policy on Executive Director remuneration; |
| n | | determination of remuneration, including bonuses and personal targets, for Executive Directors and certain senior management personnel; and |
| n | | establishment of employee share schemes, including the introduction of the Deferred Share Plan. |
Further details on these responsibilities and the external advice received by the Committee in respect of these items can be found in the Directors’ Remuneration Report on pages 88 to 98.
No Remuneration Committee member or attendee participates in any discussion regarding his or her own remuneration.
Risk & Responsibility Committee
The Risk & Responsibility Committee membership and attendance at meetings was as follows during 2006/07 from a total of four meetings:
| | | |
| |
| Name | | Attendance* |
| |
| Stephen Pettit (chairman) | | 3 of 4** |
| Linda Adamany (from 1 November 2006) | | 2 of 2 |
| Ken Harvey | | 4 of 4 |
| Maria Richter | | 4 of 4 |
| |
| | |
| * | | Attendance is expressed as number of meetings attended out of number eligible to attend |
| |
| ** | | Ken Harvey acted as chairman for the meeting that Stephen Pettit was unable to attend |
The Chief Executive, the Corporate Responsibility Director and the Company Secretary & General Counsel are invited to attend Risk & Responsibility Committee meetings on a regular basis. Executive Directors and others, including the Risk & Compliance Manager and business representatives are invited to attend as necessary to provide updates.
The key items for which the Risk & Responsibility Committee has responsibility and that it has discussed during the year include consideration of:
| n | | the environmental impact of the Company, including climate change; |
| n | | non-financial risks to the Company, including pandemic planning; |
| n | | regular updates on the safety, health and environmental performance of the Company and its businesses; |
| n | | inclusion and diversity initiative updates; |
| n | | reviewing safety, health and environmental audit plans and the outcome of such audits; and |
| n | | regular updates on business conduct issues raised in the businesses and the outcome of any subsequent investigations. |
The Committee members made site visits during the year to:
| n | | an investment recovery facility in Syracuse; and |
| n | | a gas repair site in London. |
Disclosure committees
National Grid has established disclosure committees that are tasked with various duties relating to the material disclosures made by the Company and relevant subsidiaries.
The National Grid disclosure committee is chaired by the Finance Director and its members are the Company Secretary & General Counsel, the Tax & Treasury Director, the Financial Controller, the Director of Investor Relations, the Corporate Director of Audit, the Corporate Counsel and such other members and/or attendees as the committee from time to time considers appropriate. The committee’s role is to assist the Chief Executive and the Finance Director in fulfilling their responsibility for oversight of the accuracy and timeliness of the disclosures made by the Company. It does so through:
| n | | the design, establishment, monitoring and review of disclosure controls and other procedures to ensure information required to be disclosed is recorded, processed, summarised and reported accurately and on a timely basis and that information is accumulated and communicated to management in such a way as to allow timely decisions regarding such disclosures; |
| n | | reviewing and considering the preparation of key disclosure statements including but not limited to the Company’s Annual Report and Accounts, Annual Review, Regulatory News Service announcements in the UK (and US equivalents), press releases containing financial information, information about material acquisitions or dispositions such as the acquisition of KeySpan, presentations to holders of debt and equity securities, analysts, rating agencies and lenders; and |
| n | | reporting as necessary to the Board, the Audit Committee and the Executive Committee all relevant information with respect to the preparation of disclosure statements and the evaluation of the effectiveness of National Grid’s disclosure controls. |
82 National Grid plc
Relations with shareholders
Relations with shareholders are managed mainly by the Chief Executive, the Finance Director and the Director of Investor Relations. Meetings are held regularly throughout the year with institutional investors, fund managers and analysts to discuss the public disclosures and announcements of the Company and its businesses.
The Chairman also writes to major shareholders following the announcement of results to offer them the chance to meet him, the Senior Independent Director or any of the Non-executive Directors. He also specifically invites major shareholders to meet newly appointed Non-executive Directors. This enables major shareholders to take up with these individuals any issue they feel unable to raise with the Chief Executive and Finance Director.
The Board receives feedback at least annually from the Company’s brokers, supported by the Director of Investor Relations, on shareholders’ views. Notes from a number of analysts in the energy sector are circulated regularly to Directors. This ensures the whole Board, including the Non-executive Directors, is kept up to date with shareholder and analyst views. Additionally, in July 2006, the Chief Executive and Investor Relations department held a meeting with the UK Shareholders’ Association enabling them to gain an insight into the views of the Company’s retail shareholders.
The main form of communication with shareholders is via the Annual Review. We also run a shareholder networking programme, inviting shareholders to visit operational sites and meet Directors and staff, further details of which can be found on page 184.
The AGM is also attended by shareholders, at which they are given the opportunity to question the Board on the Company and its performance. In line with best practice, for the past two years, the Chairman has called a poll on all votes at the AGM to allow all shareholders, whether present in person or by proxy, to vote on all resolutions in proportion with their holding in National Grid. The Chairman will once again call a poll on all votes at the 2007 AGM.
Internal controls
The Board is responsible for the Company’s system of internal control and monitoring its effectiveness. It has in place an established system of internal control to be observed throughout the Company and its businesses, which it believes satisfies this responsibility.
The system of internal control depends on thorough and systematic processes for the identification and assessment of business-critical risks, including the impact of material non-compliance with legal, regulatory and internal governance requirements, and their management and monitoring over time. This system generates reports from both line managers and certain assurance providers such as Internal Audit, Corporate Responsibility and Risk & Compliance, who are independent of management.
The Board’s Committees receive reports on the Company’s system of internal control as appropriate in relation to their specific areas of responsibility. The Board’s Committees’ reports to the Board include updates in this regard.
The Board formally reviews the effectiveness of the Company’s system of internal control on an annual basis to ensure it remains robust and to identify any control weaknesses. This review includes:
| n | | the receipt of a Letter of Assurance from the Chief Executive, which consolidates key matters of interest raised through the year-end assurance process; |
| n | | assurance from its Committees as appropriate, with particular reference to the reports received from the Audit and Risk & Responsibility Committees on the reviews undertaken by them at their respective Committee meetings; and |
| n | | assurances in relation to the Company’s Sarbanes-Oxley certifications, required as a result of the Company’s New York Stock Exchange listing. |
The latest review covered the financial year to 31 March 2007 and included the period to the approval of this Annual Report and Accounts.
Sarbanes-Oxley
National Grid has carried out an assessment of its internal control over financial reporting pursuant to section 404 of the US Sarbanes-Oxley Act 2002, the requirements of which the Company is subject to as a result of its listing on the New York Stock Exchange. The management of the Company, who is responsible for establishing and maintaining an adequate system of internal control over financial reporting, evaluated the effectiveness of that system using the Committee of Sponsoring Organizations of the Treadway Commission (COSO) framework. Based on that evaluation, the management of the Company expects to conclude in its 20-F filing that the system of internal control over financial reporting was effective as at 31 March 2007.
Information assurance
Information is an important asset to the business and, like any other asset, it must be fit for purpose.
Critical to demonstrating information integrity is a process of assurance from the business that clearly demonstrates information is being sourced and managed effectively. The Company recognises these behaviours are important to achieving necessary standards. The key objective of having accurate and reliable information is supported by a risk-based, holistic approach that deals with information assurance as a business critical function. This approach ensures accurate and reliable information is available to those who need it in a timely fashion, thus enabling informed decisions that support and further our objectives.
We manage a broad range of risks to our information. Key elements in managing these risks are education, training and awareness. These initiatives emphasise the importance of information security, the quality of data collection and the affirmation process that supports our business transactions, providing evidence of our decisions and actions. We continue to work collaboratively with a variety of organisations and professional bodies to develop and implement best practice.
Annual Report and Accounts 2006/07 83
Corporate governance practices: differences from
New York Stock Exchange (NYSE) listing standards
Our corporate governance practices substantially conform to those required of US companies listed on the NYSE. The principal differences between the Company’s governance practices pursuant to the Combined Code and UK best practice and the Section 303A Corporate Governance Rules of the NYSE are:
| n | | different tests of independence for Board members are applied under the Combined Code and Section 303A; |
| n | | there is no requirement for a separate corporate governance committee in the UK; all Directors on the Board discuss and decide upon governance issues and the Nominations Committee makes recommendations to the Board with regard to certain of the responsibilities of a corporate governance committee; and |
| n | | while the Company reports compliance with the Combined Code in each Annual Report and Accounts, there is no requirement to adopt and disclose separate corporate governance guidelines. |
Risk management
Understanding and managing risks is integral to the way we run our business. We have a well established enterprise-wide risk management process that ensures risks are consistently assessed, recorded and reported in a visible, structured and continuous manner, the outputs of which are primarily used as a management tool. A secondary and natural output from this process is information that provides assurance to management at all levels and thus helps safeguard our assets and reputation. It is designed to manage rather than eliminate material risks to the achievement of our strategic and business objectives while also recognising that any such process can provide only reasonable, and not absolute, assurance against material misstatement or loss. This process complies with the Turnbull working party guidance (revised October 2005) and, in addition, contributes toward our compliance with our obligations under the Sarbanes-Oxley Act as well as other internal assurance activities.
Risk management in National Grid has become further embedded over time and our experience of this has enabled us to identify a number of key success criteria linked to both the risk management framework and process that, if in place, will help ensure the process continues to remain embedded. Understanding this in the context of a Company that continues to change size and geographic coverage has been invaluable in helping to identify strategies to enable the effective and timely integration of processes. A current example is the ongoing dialogue with KeySpan to identify how its respective enterprise-wide and energy trading risk functions are best integrated into National Grid going forward.
Within existing businesses the risk management process continues to be based on both bottom-up and top-down assessments of operational, financial and other business or project risks. From the bottom up, business units and Corporate Centre functions prepare and maintain risk registers that capture their key risks and the actions being taken to manage them. The key element in the top-down assessment of our enterprise-wide risk profile is the involvement of the Executive Directors and other senior management at critical stages in the review process. Their review of the bottom-up assessment produces an overall evaluation of
the risks that are faced by National Grid. Graphics that set out the Company’s risk profile and any significant changes to this between reporting periods have been designed to aid debate by the Executive Committee, the Risk & Responsibility Committee and the Audit Committee twice a year. The Audit Committee also reviews the risk management process at least once during each year and reports on this to the Board.
During the year we have continued to derive benefits from this process through further coordination with the Insurance team and ongoing interaction with the Internal Audit function and Sarbanes-Oxley teams. The external benchmarking exercise has continued with other FTSE 100 companies and public sector organisations to measure the effectiveness of our own approach and exchange ideas on best practice. With the move to a line of business operating model, the opportunity is being taken to restructure risk and compliance management services to ensure approaches are consistent across geographies and continue to provide value to business operations, including major projects.
Our risk management process has identified the risk factors set out on pages 84 and 85.
Compliance management
Our enterprise-wide compliance management process is now firmly established and continues to raise visibility over key obligations. The process provides assurance to the Executive Directors and senior management on the effectiveness of control frameworks to manage key internal and external obligations, and also highlights instances of significant non-compliance with those obligations. External obligations are driven primarily by key legal and regulatory requirements whereas internal obligations focus more on compliance with National Grid’s own corporate policies and procedures. A network of compliance coordinators and champions exists within businesses and Corporate Centre functions to enable the top-down/bottom-up alignment of Executive Directors’ obligations to be established and reported. Furthermore, experts for each key obligation interface with relevant business contacts to ensure the quality of information reported upwards is validated. The compliance management process is consistent with, and complementary to, our risk management process and essentially provides a more detailed breakdown of the risk of non-compliance with laws, regulations or standards of service as well as corporate policies and procedures.
Twice a year the Executive Committee, Audit Committee and Risk & Responsibility Committee receive a report setting out the key obligations across National Grid and any significant non-compliance with those, together with compliance opinions and action plans to improve controls where necessary. As with the risk management process, the Audit Committee also reviews the compliance management process at least once during each year and reports on this to the Board. The compliance management process also contributes toward the entity level testing that is performed under the Sarbanes-Oxley Act, as well as some of our other internal assurance activities. We continue to seek benchmarking opportunities to compare our enterprise-wide compliance management process to that of other similar organisations to ensure it remains best practice and fit for purpose.
84 National Grid plc
Risk factors
Our risk management process has identified the following risk factors that could have a material adverse effect on our business, financial condition, results of operations and reputation, as well as the value and liquidity of our securities. Not all of these factors are within our control. In addition, other factors besides those listed below may have an adverse effect on National Grid. Any investment decision regarding our securities and any forward-looking statements made by us should be considered in the light of these risk factors and the cautionary statement set out on the inside back cover.
Changes in law or regulation in the geographies in which we operate could have an adverse effect on our results of operations.
Many of our businesses are utilities or networks that are subject to regulation by governments and other authorities. Consequently, changes in law or regulation in the countries or states in which we operate could adversely affect us. Regulatory decisions concerning, for example, whether licences or approvals to operate are granted or are renewed, whether market developments have been satisfactorily implemented, whether there has been any breach of the terms of a licence or approval, the level of permitted revenues for our businesses and proposed business development activities could have an adverse impact on our results of operations, cash flows, the financial condition of our businesses and the ability to develop those businesses in the future. For further information, see the Operating and Financial Review and, in particular, the ‘About National Grid’ section and the ‘About the business’ sections for each of our lines of business.
Breaches of, or changes in, environmental or health and safety laws or regulations could expose us to claims for financial compensation and adverse regulatory consequences, as well as damaging our reputation.
Aspects of our activities are potentially dangerous, such as the operation and maintenance of electricity lines and the transmission and distribution of natural gas. Electricity and gas utilities also typically use and generate in their operations hazardous and potentially hazardous products and by-products. In addition, there may be other aspects of our operations that are not currently regarded or proved to have adverse effects but could become so; for example, the effects of electric and magnetic fields. We are subject to laws and regulations relating to pollution, the protection of the environment, and how we use and dispose of hazardous substances and waste materials. We are also subject to laws and regulations governing health and safety matters protecting the public and our employees. Any breach of these obligations, or even incidents that do not amount to a breach, could adversely affect our results of operations and our reputation. For further information about environmental and health and safety matters relating to our businesses, see the ‘Our Responsibility’ section of our website at www.nationalgrid.com.
Network failure or the inability to carry out critical non-network operations may have significant adverse impacts on both our financial position and our reputation.
We may suffer a major network failure or may not be able to carry out critical non-network operations. Operational performance could be adversely affected by a failure to maintain the health of the system or network, inadequate forecasting of demand or inadequate record keeping. This could cause
us to fail to meet agreed standards of service or be in breach of a licence or approval, and even incidents that do not amount to a breach could result in adverse regulatory and financial consequences, as well as harming our reputation. In addition to these risks, we may be affected by other potential events that are largely outside our control such as the impact of weather or unlawful acts of third parties. Weather conditions can affect financial performance and severe weather that causes outages or damages infrastructure will adversely affect operational and potentially business performance. Terrorist attack, sabotage or other intentional acts may also physically damage our businesses or otherwise significantly affect corporate activities and as a consequence have an adverse impact on the results of operations.
Our results of operations depend on a number of factors relating to business performance including performance against regulatory targets, recovery of incurred expenditure and the delivery of anticipated cost and efficiency savings.
Earnings maintenance and growth from our regulated gas and electricity businesses will be affected by our ability to meet or better efficiency targets set by or agreed with Ofgem and other regulators. In the US, under our state rate plans, earnings from our regulated businesses will be affected by our ability to deliver integration and efficiency savings. Earnings from our regulated businesses in both the UK and the US will be affected by our ability to recover incurred expenditure. Levels of earnings also depend on meeting service quality standards set by regulators. In addition, from time to time, we also publish cost and efficiency savings targets for our businesses in the UK and the US. We are also reorganising our operations along lines of business. To meet these targets and standards, we must continue to improve operational performance, service reliability and customer service. If we do not meet these targets and standards, we are not able to recover incurred expenditure or we do not implement this reorganisation as envisaged, we may not achieve the expected benefits, our business may be adversely affected and our performance, results of operations and our reputation may be harmed.
Business development activity, including acquisitions and disposals, may be based on incorrect assumptions or conclusions; significant liabilities may be overlooked or there may be other unanticipated or unintended effects.
In February 2006, we announced the acquisition of KeySpan. This transaction is subject to a number of conditions precedent of which the approvals by the New York Public Service Commission and the New Hampshire Public Utilities Commission remain outstanding. These approvals may not be received or they may be granted but on terms that are different than anticipated. We have also announced that we expect to achieve certain levels of synergy and efficiency savings from this transaction, but these may not subsequently be achievable. Following completion of the proposed acquisition of KeySpan the risks and uncertainties that its operations are subject to would be assumed by National Grid. Many of these risks and uncertainties are similar to those that are faced by our existing businesses; however, there are some that are not. These include: that KeySpan has generation capacity that may be subject to competition and general economic conditions having an impact on demand as well as other related risks; the risk that in-city unforced capacity prices in New York are less than expected causing loss under swap arrangements KeySpan has entered into; and that it has investments in natural
Annual Report and Accounts 2006/07 85
gas and oil exploration and production that may in certain circumstances under SEC rules require non-cash impairment. For further details concerning the acquisition of KeySpan and other transactions that we have undertaken over the period, see the ‘Acquisitions and disposals’ section of the Operating and Financial Review on page 33.
Changes to the regulatory treatment of commodity costs may have an adverse effect on the results of operations.
Changes in commodity prices could potentially impact our energy delivery businesses. Current regulatory arrangements in the UK and the US provide the ability to pass through virtually all of the increased costs related to commodity prices to consumers. However, if regulators in the UK or the US were to restrict this ability, it could have an adverse effect on our operating results.
Our reputation may be harmed if consumers of energy suffer a disruption to their supply even if this disruption is outside our control.
Our energy delivery businesses are responsible for transporting available electricity and gas. We consult with and provide information to regulators, governments and industry participants about future demand and the availability of supply. However, where there is insufficient supply, our role is to manage the relevant network safely, which in extreme circumstances may require us to disconnect consumers.
Fluctuations in exchange rates, interest rates and commodity price indices, in particular in the US dollar, could have a significant impact on our results of operations because we have substantial business interests in the US and because of the significant proportion of our borrowings, derivative financial instruments and commodity contracts that may potentially be affected by such fluctuations.
We currently have significant operations in the US and the proportion of our activities located there would substantially increase following the completion of our proposed acquisition of KeySpan. These businesses are subject to the risks normally associated with foreign operations, including the need to translate US assets and liabilities, and income and expenses, into sterling, our primary reporting currency. Our results of operations may be similarly affected because a significant proportion of our borrowings, derivative financial instruments and commodity contracts are affected by changes in exchange rates, interest rates and commodity price indices, in particular the US dollar to sterling exchange rate. For further information about this, see the ‘Financial position and financial management’ section of the Operating and Financial Review.
The nature and extent of our borrowings means that an increase in interest rates could have an adverse impact on our financial position and business results.
A significant proportion of our borrowings is subject to variable interest rates, which may fluctuate with changes to prevailing interest rates. Increases in these interest rates could therefore increase our costs and diminish our profits. For further information about this, see the ‘Financial position and financial management’ section of the Operating and Financial Review.
Our financial position may be adversely affected by a number of factors including restrictions in borrowing and debt arrangements, changes to credit ratings and effective tax rates.
We are subject to certain covenants and restrictions in relation to our listed debt securities and our bank lending facilities. We are also subject to restrictions on financing that have been imposed by regulators. These restrictions may hinder us in servicing the financial requirements of our current businesses or the financing of newly acquired or developing businesses. Our debt is rated by credit rating agencies and changes to these ratings may affect both our borrowing capacity and the cost of those borrowings. The effective rate of tax we pay may be influenced by a number of factors including changes in law and accounting standards, the proportion of our business operations that are located in the US and our overall approach to tax planning, the results of which could increase that rate.
Future funding requirements of our pension schemes could adversely affect our results of operations.
We participate in a number of pension schemes that together cover substantially all of our employees. In both the UK and the US, the principal schemes are defined benefit schemes where the scheme assets are held independently of our own financial resources. Estimates of the amount and timing of future funding for these schemes are based on various actuarial assumptions and other factors including, among other things, the actual and projected market performance of the scheme assets, future long-term bond yields, average life expectancies and relevant legal requirements. The impact of these assumptions and other factors may require us to make additional contributions to these pension schemes which, to the extent they are not recoverable under our price controls or state rate plans, could adversely affect our results of operations.
New or revised accounting standards, rules and interpretations by the UK, US or international accounting standard setting boards and other relevant bodies could have an adverse effect on our reported financial results.
The accounting treatment under International Financial Reporting Standards (IFRS), as adopted by the European Union, of replacement expenditure, regulatory assets, pension and post-retirement benefits, derivative financial instruments and commodity contracts significantly affect the way we report our financial position and results of operations. As a body of practice develops for IFRS, the application and interpretation of accounting principles to our circumstances, and to those areas in particular, could result in changes in the financial results and financial position that we report. In addition, new standards, rules or interpretations may be issued that could also have significant effects.
86 National Grid plc
Directors’ Report
for the year ended 31 March 2007
Directors
The biographies of the persons serving as Directors as at the date of this report are set out on pages 18 and 19. The names of all persons serving as Directors during the financial year are included on page 98, detailed in the table setting out Directors’ beneficial interests.
Directors’ and Officers’ liability insurance cover is arranged and qualifying third party indemnities, in accordance with sections 309A-B of the Companies Act 1985, are in place for each Director.
The Directors’ interests in shares and in options to receive shares are set out in the Directors’ Remuneration Report on pages 88 to 98.
Code of Ethics
The Board has adopted a Code of Ethics for senior financial professionals. This code is available on our website at www.nationalgrid.com (where any amendments or waivers will also be posted). There were no amendments to, or waivers of, our Code of Ethics during the year.
Principal activities, business review and future developments
National Grid plc is the ultimate holding company of a group of companies involved principally in the transmission and distribution of electricity and gas in the UK and northeastern US.
The Directors consider that the requirement to produce a business review is fulfilled by the inclusion in this Annual Report and Accounts of an Operating and Financial Review (on pages 20 to 75) and the Corporate Governance section (on pages 77 to 85).
Dividends
The Directors are recommending a final dividend of 17.8 pence per ordinary share ($1.7638 per American Depositary Share) be paid on 22 August 2007 to shareholders on the register at 8 June 2007. Further details in respect of dividend payments can be found on page 43.
Political donations and expenditure
National Grid made no political donations in the UK or European Union during the year (including donations as defined for the purposes of the Political Parties, Elections and Referendums Act 2000).
National Grid USA and certain subsidiaries made political donations of $100,000 (£52,289) during the year. National Grid USA’s political action committees, funded partly by voluntary employee contributions, gave $149,709 (£78,282) to political and campaign committees in 2006/07.
Charitable donations
During 2006/07, some £9 million (2005/06: £7.7 million) was invested in support of community initiatives and relationships. The London Benchmarking Group model was used to assess this overall community investment. Direct donations to charitable organisations amounted to £2.9 million (2005/06: £2.7 million).
In addition to our charitable donations, substantial support was provided for our Affordable Warmth Programme, education programme, university research and our Young Offenders Into Work Programme.
Financial instruments
Details on the use of financial instruments and financial risk management are included on pages 65 to 67.
Post balance sheet events
On 3 April 2007, we completed the sale of our UK wireless infrastructure business for cash proceeds of £2.5 billion.
Also in April, we agreed to the sale of our US wireless infrastructure operations for proceeds of approximately $290 million (£147 million). Completion is expected in the autumn of 2007.
Research and development
Expenditure on research and development during the year was £6 million, compared with £7 million in 2005/06.
Share purchases
At the Company’s Annual General Meeting in 2006, shareholder authority was given to purchase up to 10% of our ordinary shares.
As part of our interim results for the six months to 30 September 2006, a share buy-back programme was announced to return around $1.9 billion (£1 billion) to shareholders. This return is based on cash flows from stranded assets under our US rate plans.
This ordinary share buy-back commenced on 20 November 2006 and, as at the date of this report, 22,388,381 ordinary shares of 1117/43pence had been repurchased for an aggregate consideration of £168,983,332.59 (representing approximately 1% of our issued share capital). All of these shares were cancelled. The repurchases leave the Company with authority to buy back a further 250 million ordinary shares.
The Directors intend to seek shareholder approval to renew this authority at this year’s Annual General Meeting.
Companies are permitted to hold repurchased shares as treasury shares rather than cancelling them. The Directors have no current intention to hold repurchased shares as treasury shares, other than as may be required for employee share schemes.
Annual Report and Accounts 2006/07 87
Return of cash: B shares
Under the return of cash, approved by shareholders on 25 July 2005, holders of B shares could elect to retain them for future repurchases. A further repurchase offer was made on 8 August 2006 and an additional 39,521,422 B shares were repurchased at 65 pence per share. Following this repurchase 45,815,437 B shares remained in issue.
Employees
Over the past year, National Grid has continued to demonstrate how it values its employees. The company-wide publication National Grid World is now issued twice a year in line with the interim and end of year financial results. In 2006/07 it has provided employees with an overview of performance, updates on the acquisition of Rhode Island gas distribution operations and KeySpan, alongside material setting out our changing strategy and new operating model. Feedback from employees has been largely positive. This publication is only one example of the multiple communication channels we have established and continue to develop to ensure the timely cascade of critical information to employees. A number of these channels have been established to support dialogue between employees and management.
In July 2006, we conducted a company-wide employee opinion survey. Over 11,000 employees (58%) took part in the process, a 9% increase on the response rate when the survey was conducted in 2004. The survey demonstrated that employees better understand the Company’s strategy and the need for change. They believe that the business is heading in the right direction and are willing to do their jobs differently to help us improve. Safety continues to be recognised as one of National Grid’s key strengths.
Areas that the survey highlighted as needing improvement included general management behaviours around communication with employees and performance management. Action plans have now been developed by each of the businesses to address their key priorities for improvement.
National Grid’s core values are integrity, ownership and respect. Responses to the 2006 employee opinion survey demonstrated that respect and integrity are becoming embedded in the culture of the organisation. Our inclusion and diversity vision is to develop and operate our business in a way that results in a more inclusive and diverse culture. This supports the attraction and retention of the best people, improves effectiveness, delivers superior performance and enhances the success of the Company. Employees are provided with the opportunity to develop to their full potential regardless of race, gender, nationality, age, disability, sexual orientation, religion and background. We support a number of employee interest groups including groups for women and new starters. These receive Executive Director sponsorship. Over the past year, additional networks have been launched to support disabled employees and those from an ethnic minority background.
Employee share ownership of the Company is facilitated among UK employees by the operation of both the Sharesave scheme and share incentive plans. In the US, employees are able to invest in the Company through employee incentive thrift plans.
In the UK, approximately 72% of employees participate in sharesave schemes. There are also about 7,600 participants in the share incentive plans. Of current US employees participating in the National Grid USA Incentive Thrift Plans I and II, approximately 74% and 79% respectively hold ADSs.
Policy and practice on payment of creditors
It is National Grid’s policy to include in contracts, or other agreements, terms of payment with suppliers. Once agreed, we aim to abide by these payment terms.
The average creditor payment period at 31 March 2007 for National Grid’s principal operations in the UK was 19 days (20 days at 31 March 2006).
Audit information
Having made the requisite enquiries, so far as the Directors in office at the date of the signing of this report are aware, taking into account their periods of office, there is no relevant audit information (as defined by Section 234ZA of the Companies Act 1985) of which the Company’s auditors are unaware, and the Directors have taken all the steps they ought to have taken to make themselves aware of any relevant audit information and to establish that the Company’s auditors are aware of that information.
Material interests in shares
As at the date of this report, National Grid had been notified of the following beneficial interests in 3% or more of its issued share capital:
| | | | | |
| |
| | | % of |
| | | issued |
| | | share |
| | | capital |
| |
| Legal and General Investment Management Ltd | | | 4.12 | |
| Fidelity International Limited | | | 3.06 | |
| |
No further notifications have been received.
Annual General Meeting
National Grid’s 2007 Annual General Meeting will be held on Monday 30 July 2007 at The ICC in Birmingham. Details are set out in the separate Notice of Annual General Meeting.
On behalf of the Board
Helen Mahy
Company Secretary and General Counsel
16 May 2007
National Grid plc, 1-3 Strand, London WC2N 5EH
Registered in England and Wales No. 4031152
88 National Grid plc
Directors’ Remuneration Report
We are pleased to present the Directors’ Remuneration Report for 2006/07. Our policy of relating pay to the performance of the Company continues to be a strong principle underlying the Remuneration Committee’s consideration of executive remuneration.
This year we have thoroughly reviewed our remuneration policy, in the light of the proposed KeySpan acquisition and therefore the larger and more complex scope of many of our senior roles; and to ensure it continues to attract and retain high calibre individuals to deliver the highest possible performance for our shareholders. We have consulted with our major shareholders and their representative bodies regarding our proposals to make adjustments to our annual bonus plan and the Performance Share Plan (our long-term incentive plan).
Following this consultation process, we will be increasing the maximum annual bonus opportunity for Executive Directors to 150% of salary for the performance year 2007/08.
While increasing the maximum bonus opportunity, we have amended the performance targets to be more stretching in the future. In addition, the framework has been adjusted so that, for Executive Directors, only 40% of the bonus (60% of salary) will be payable for target performance instead of the current 50%.
With respect to the Performance Share Plan, we intend to increase the maximum award to 200% of salary. However, in order to allow some flexibility for the future we will seek approval from shareholders, at the Annual General Meeting, to increase the maximum award permissible under the Performance Share Plan to 250% of salary. The upper target of the Performance Share Plan will be amended to be more challenging (detailed in the main body of this report).
Therefore, we believe the proposed arrangements will provide an appropriate and balanced opportunity for executives and will continue to align our incentive plans with the Company’s strategic objectives and our shareholders’ interests generally.
Overall, we believe salary levels and the mix between fixed and variable compensation are appropriate, however, we shall continue to review the remuneration package on a regular basis to ensure it remains so.
We are confident our approach continues to motivate and engage the team leading the Company, while encouraging the achievement of stretching targets.
John Allan
Chairman of the Remuneration Committee
Remuneration Committee
The Remuneration Committee members are John Allan, Ken Harvey, Stephen Pettit and George Rose. Each of these Non-executive Directors is regarded by the Board as independent and served throughout the year.
The Group Human Resources Director and Group Head of Compensation and Benefits provide advice on remuneration policies and practices and are usually invited to attend meetings, along with the Chairman and the Chief Executive.
No Director or other attendee is present during any discussion regarding his or her own remuneration.
The Remuneration Committee is responsible for developing Company policy regarding executive remuneration and for determining the remuneration of the Executive Directors and executives below Board level who report directly to the Chief Executive. It also monitors the remuneration of other senior employees of the Company and provides direction over the Company’s share plans.
The Board has accepted all the recommendations made by the Remuneration Committee during the year.
The Remuneration Committee has authority to obtain the advice of outside independent remuneration consultants. It is solely responsible for their appointment, retention and termination; and for approval of their fees and other terms.
In the year to 31 March 2007, the following advisors provided services to the Remuneration Committee:
| n | | Deloitte & Touche LLP, independent remuneration advisors. They also provide taxation and financial advice to the Company; |
| n | | Alithos Limited, provision of Total Shareholder Return calculations for the Performance Share Plan and Executive Share Option Plan; |
| n | | Linklaters, advice relating to Directors’ service contracts as well as providing other legal advice to the Company; and |
| n | | Mercer Human Resource Consulting Limited, advice relating to pension taxation legislation. They also provide general advice with respect to human resource issues across the Company. |
Remuneration policy
The Remuneration Committee determines remuneration policy and practices with the aim of attracting, motivating and retaining high calibre Executive Directors and other senior employees to deliver value for shareholders and high levels of customer service, safety and reliability in an efficient and responsible manner. The Remuneration Committee sets remuneration policies and practices in line with best practice in the markets in which the Company operates. Remuneration policies continue to be framed around the following key principles:
| n | | total rewards should be set at levels that are competitive in the relevant market; |
| n | | a significant proportion of the Executive Directors’ total reward should be performance based. Performance based incentives will be earned through the achievement of demanding targets for short-term business and personal performance as well as long-term shareholder value creation, consistent with our Framework for Responsible Business which can be found at: www.nationalgrid.com/corporate/ About+Us/CorporateGovernance/Other; |
| n | | for higher levels of performance, rewards should be substantial but not excessive; and |
| n | | incentive plans, performance measures and targets should be stretching and aligned as closely as possible with shareholders’ interests. |
It is currently intended to continue this policy in subsequent years.
Annual Report and Accounts 2006/0789
Executive Directors’ remuneration
Remuneration packages for Executive Directors consist of the following elements:
| n | | salary; |
| n | | annual bonus including the Deferred Share Plan; |
| n | | long-term incentive, the Performance Share Plan; |
| n | | all-employee share plans; |
| n | | pension contributions; and |
| n | | non-cash benefits. |
Salary
Salaries are reviewed annually and targeted broadly at the median position in the relevant market. In determining the relevant market, the Remuneration Committee takes account of the regulated nature of the majority of the Company’s operating activities along with the size, complexity and international scope of the business. For UK-based Executive Directors, a UK market is used and a US market is used for US-based Executive Directors. In setting individual salary levels, the Remuneration Committee takes into account business performance, the individual’s performance and experience in the role; and salary practices prevailing for other employees in the Company.
Annual bonus including the Deferred Share Plan (DSP)
Annual bonuses are based on achievement of a combination of demanding Company, individual and, where applicable, divisional targets. The principal measures of Company performance are adjusted earnings per share (EPS) and cash flow; the main divisional measures are divisional operating profit and divisional cash flow. Financial targets represent 70% of the bonus. Individual targets, representing 30% of the bonus, are set in relation to key operating and strategic objectives and include overriding measures for safety and customer service performance. The Remuneration Committee sets targets at the start of the year and reviews performance against those targets at year end. The Remuneration Committee may use its discretion to reduce payments to take account of significant safety or service standard incidents, or to increase them in the event of exceptional value creation.
Performance against Company and divisional financial targets for this year is shown in the table below:
| | | | | |
| | | Level of performance achieved in 2006/07 |
| Financial measures | | as determined by the Remuneration Committee |
| | | Company targets | | Divisional targets |
| |
| Adjusted EPS | | Stretch | | |
| | | | | |
| Cash flow | | Stretch | | |
| | | | | |
| Operating profit | | | | Between Target
and Stretch (i) |
| | | | | |
| Cash flow | | | | Stretch (ii) |
| | | | | |
| Earnings | | | | Between Threshold
and Target (iii) |
| |
| | |
| (i) | | Except Transmission, where Stretch performance was achieved. |
| (ii) | | Except Transmission, where between Target and Stretch performance was achieved. |
| (iii) | | US Distribution financial measure only. |
In 2006/07, the maximum annual bonus opportunity for Executive Directors was 100% of base salary, with 50% being paid for target performance. As outlined above, the maximum will be increased to 150% of base salary for the 2007/08 performance year, with 40% of the bonus (60% of salary) being paid for target performance. One half of any bonus earned is automatically deferred into National Grid shares (ADSs for
US-based Executive Directors) through the DSP. The shares are held in trust for three years before release. During this time, they are not owned by the Executive Directors and, therefore, no dividends are paid. The Remuneration Committee may, at the time of release of the shares, use its discretion to pay a cash amount equivalent to the value of the dividends that would have accumulated on the deferred shares. For the 2007/08 bonus and onwards, the deferred shares may be forfeited if the Executive Director ceases employment during the three year holding period as a ‘bad leaver’, for example, resignation. The newly introduced forfeiture provisions will serve as a strong retention tool.
The Remuneration Committee believes that requiring Executive Directors to invest a substantial amount of their bonus in National Grid shares increases the proportion of rewards linked to both short-term performance and longer-term total shareholder returns. This practice also ensures that Executive Directors share a significant level of personal risk with the Company’s shareholders. In line with US market practice, US-based Executive Directors’ bonuses are pensionable.
Long-term incentive – Performance Share Plan (PSP)
Executive Directors and approximately 350 other senior employees who have significant influence over the Company’s ability to meet its strategic objectives, may receive an award which will vest subject to the achievement of performance conditions set by the Remuneration Committee at the date of grant. The value of shares (ADSs for US-based Executive Directors) constituting an award (as a percentage of salary) varies by grade and seniority subject to a maximum, for Executive Directors, of 125% of salary. As outlined above, subject to shareholder approval being obtained, we will grant awards to Executive Directors in 2007 with a value of 200% of salary. The provisions in the PSP rules will allow awards up to a maximum value of 250% of salary, in order to provide a degree of flexibility for the future. Therefore, if approved by shareholders, the 2007 award will be granted in two parts, a June award based on the current maximum of 125% of salary and a second award after the announcement of our interim financial results, for the difference up to 200% for Executive Directors. This will result in the 2007 award, should performance criteria be met, being released to participants in two parts, in June 2011 and November/December 2011.
Awards were made at the maximum percentage of 125% of salary to Executive Directors in the year 2006/07. Shares vest after three years, subject to the satisfaction of the relevant performance criteria. Vested shares must then be held for a further period (the retention period) after which they are released to the participant on the fourth anniversary of the date of grant. During the retention period, the Remuneration Committee has discretion to pay an amount, equivalent in cash or shares, to the dividend which would have been paid on the vested shares.
Under the terms of the PSP, the Remuneration Committee may allow shares to vest early to departing participants, including Executive Directors, to the extent the performance condition has been met, in which event the number of shares that vest will be pro-rated to reflect the proportion of the performance period that has elapsed at the date of departure.
Awards made in June 2003 and June 2004 were based on the Company’s Total Shareholder Return (TSR) performance
90 National Grid plc
over a three year period relative to the TSR performance of the following group of comparator companies:
| | | |
| Ameren Corporation | | Iberdrola SA |
| AWG plc | | International Power plc |
| Centrica plc | | Kelda Group plc |
| Consolidated Edison, Inc. | | Pennon Group plc |
| Dominion Resources, Inc. | | RWE AG |
| E.ON AG | | Scottish Power plc |
| Electrabel SA | | Scottish & Southern Energy plc |
| Endesa SA | | Severn Trent plc |
| Enel SpA | | The Southern Company, Inc. |
| Exelon Corporation | | Suez SA |
| FirstEnergy Corporation | | United Utilities plc |
| FPL Group, Inc. | | Viridian Group plc |
| Gas Natural SDG SA | | |
In calculating TSR for the 2003 and 2004 awards, it is assumed all dividends are reinvested. No shares will be released if the Company’s TSR over the three year period, when ranked against that of each of the comparator companies, falls below the median. For TSR at the median, 30% of the shares awarded will be released, 100% of the shares awarded will be released for TSR ranking at the upper quartile or above. For performance between median and upper quartile, the number of shares released is calculated on a straight-line basis.
Following consultation in 2005 with our major shareholders, new performance conditions were introduced for the 2005 award onwards, so that 50% of any award is based on the Company’s TSR performance when compared to the FTSE 100 (on the date of grant) and 50% is based on the annualised growth of the Company’s EPS. This approach will continue going forward.
These measures are used because the Remuneration Committee continues to believe they offer a balance between meeting the needs of shareholders (by measuring TSR performance against other large UK companies) and providing a measure of performance (EPS growth) over which the Executive Directors have direct influence. The Remuneration Committee considers the PSP performance conditions to be at least as challenging as the previous single performance criterion.
In calculating TSR for the 2005 and 2006 awards, it is assumed that all dividends are reinvested. No shares will be released under the TSR part of the award if the Company’s TSR over the three year performance periods, when ranked against that of the FTSE 100 comparator group, falls below the median. For TSR at the median, 30% of those shares will be released, 100% will be released where National Grid’s TSR performance is 7.5% above that of the median company in the FTSE 100 (upper target).
The EPS measure is calculated by reference to National Grid’s real EPS growth. Where annualised growth in adjusted EPS (excluding exceptional items and including continuing operations only) over the three year performance periods exceeds the average annual increase in RPI (the general index of retail prices for all items) over the same period by 3% (threshold performance), 30% of the shares under the EPS part of the award will be released, 100% of the shares will be released where EPS growth exceeds RPI growth by 6% (upper target). As part of our proposals for the 2007 awards, we intend to increase the performance required for 100% vesting of the shares for EPS growth exceeding RPI growth by 8% (upper target), which the Remuneration Committee considers to be more challenging.
For performance (for each target) between threshold and the upper target, the number of shares released is calculated on a straight-line basis.
If the Remuneration Committee considers, in its absolute discretion, the underlying financial performance of the Company does not justify the vesting of awards, even if either or both the TSR condition and the EPS condition are satisfied in whole or in part, it can declare that some or all of the award lapses.
No re-testing of performance is permitted for any of the PSP awards that do not vest after the three year performance period and any such awards lapse.
The performance criterion for the 2003 award was not reached and this award has lapsed in full.
Executive Directors’ remuneration package
Illustrated below is the current remuneration package for Executive Directors (excluding pensions, all-employee share plans and non-cash benefits) for both ‘maximum stretch’ performance and assuming ‘on target’ performance based on 50% for the annual bonus plan; and TSR and EPS performance such that 37.5% of PSP awards are released to participants at the end of the performance period and subsequent retention period.
On the same basis, illustrated below is the proposed remuneration package for Executive Directors except, ‘on target’ performance is based on 40% (60% of salary) for the annual bonus plan and 60% for PSP awards.
Annual Report and Accounts 2006/0791
All-employee share plans
| n | | Sharesave: Employees resident in the UK, including UK-based Executive Directors, are eligible to participate in HM Revenue and Customs approved all-employee Sharesave schemes. Under these schemes, participants may contribute between £5 and £250 in total each month, for a fixed period of three years, five years or both. Contributions are taken from net salary. At the end of the savings period, these contributions can be used to purchase ordinary shares in National Grid at a discount capped at 20% of the market price set at the launch of the scheme. |
| n | | Share Incentive Plan (SIP): Employees resident in the UK, including UK-based Executive Directors, are eligible to participate in the SIP. Contributions up to £125 are taken from participants’ gross salary and used to purchase ordinary shares in National Grid each month. The shares are placed in trust and if they are left in trust for at least five years, they can be removed free of UK income tax and National Insurance Contributions. |
| n | | US Incentive Thrift Plans: Employees resident in the US, (including US-based Executive Directors), are eligible to participate in the Thrift Plans, tax-advantaged savings plans (commonly referred to as 401(k) plans) provided for employees of National Grid’s US companies. These are defined contribution pension plans that give participants the opportunity to invest a maximum of 50% of salary (pre-tax) and/or up to 15% of salary (post-tax) up to applicable Federal salary limits (US$220,000 for calendar year 2006 and US$225,000 for 2007). The Company then matches 100% of the first 2% and 75% of the next 4% of salary contributed, resulting in a maximum matching contribution of 5% of salary up to the Federal salary cap. Employees may invest their own and Company contributions in National Grid shares or various mutual fund options. |
Pensions
Current UK-based Executive Directors are provided with final salary pension benefits. The pension provisions for the UK-based Executive Directors are designed to provide a pension of one thirtieth of final salary at age 60 for each year of service subject to a maximum of two thirds of final salary, including any pension rights earned in previous employment. Within the pension schemes, the pensionable salary is normally the base salary in the 12 months prior to leaving the Company. Life assurance provision of four times pensionable salary and a spouse’s pension equal to two thirds of the Executive Director’s pension are provided on death.
UK-based Executive Directors who joined the Company after 31 May 1989 have been able to participate in an unfunded scheme in respect of those benefits earned on pay above the HM Revenue and Customs Earnings Cap. An appropriate provision in respect of the unfunded scheme has been made in the Company’s balance sheet.
In response to the pensions taxation legislation which came into force on 6 April 2006 (A Day), the Remuneration Committee ensured the pension policy post A Day did not provide the Executive Directors with additional benefit accrual as a result of the change in pensions taxation. The current UK-based Executive Directors have elected to participate in the unfunded scheme in respect of any benefits in excess of the Lifetime Allowance or their Personal Lifetime Allowance. These Executive Directors are able to cease accrual in the pension schemes and
take a 30% cash allowance in lieu of pension if they so wish. These choices are in line with those offered to current senior employees in the Company, except the cash allowance varies depending upon organisational grade.
Mike Jesanis participated in a qualified pension plan and an executive supplemental retirement plan provided by National Grid’s US companies, prior to ceasing employment as an Executive Director on 31 December 2006. These plans are non-contributory defined benefit arrangements. The qualified plan is directly funded, while the supplemental plan is indirectly funded through a ‘rabbi trust’. Benefits are calculated using a formula based on years of service and highest average compensation over five consecutive years. In line with many US plans, the calculation of benefits under the arrangements takes into account salary, bonuses and incentive share awards (the DSP) but not share options or the PSP awards. The normal retirement age under the qualified pension plan is 65. The executive supplemental plan, however, provides unreduced pension benefits from age 55. On the death of the participating Executive Director, the plans also provide for a spouse’s pension of at least 50% of that accrued by the participating Executive Director. Benefits under these arrangements do not increase once in payment.
Non-cash benefits
The Company provides competitive benefits to Executive Directors, such as a fully expensed car or a cash alternative in lieu of car and fuel, use of a driver when required, private medical insurance and life assurance. Business expenses incurred are reimbursed in such a way as to give rise to no benefit to the Director.
Flexible Benefits Plan
Additional benefits may be purchased under the Flexible Benefits Plan (the Plan), in which UK-based Executive Directors, along with most other UK employees, have been given the opportunity to participate. The Plan operates by way of salary sacrifice, that is, the participants’ salaries are reduced by the monetary value used to purchase benefits under the Plan. Many of the benefits are linked to purchasing additional healthcare and insurance products for employees and their families. A number of the Executive Directors participate in this Plan and details of the impact on their salaries are shown in table 1A on page 93.
A similar plan is offered to US-based employees. However, it is not a salary sacrifice plan and therefore does not affect salary values. Mike Jesanis participated in this plan.
Share ownership guidelines
Executive Directors are required to build up and retain a shareholding representing at least 100% of annual salary. This will be achieved by retaining at least 50% of the after-tax gain on any options exercised or shares received through the long-term incentive or all-employee share plans and will include any shares held beneficially.
Share dilution through the operation of share-based
incentive plans
Where shares may be issued or treasury shares reissued to satisfy incentives, the aggregate dilution resulting from executive incentives will not exceed 5% in any 10 year period. Dilution resulting from all incentives, including all-employee incentives, will not exceed 10% in any 10 year period. The Remuneration Committee reviews dilution against these limits regularly and under these limits, the Company currently has headroom of 3.9% and 5.8% respectively.
92 National Grid plc
Executive Directors’ service contracts
Service contracts for all Executive Directors provide for one year’s notice by either party. The Remuneration Committee operates a policy of mitigation of losses in the event of an Executive Director’s employment being terminated by the Company. If this occurs, the departing Executive Director would be expected to mitigate any losses incurred as a result of the termination. Therefore, entitlement to the payment of 12 months’ remuneration on early termination is not automatic, but instead is based on the circumstances of the termination. The Remuneration Committee, in determining any other such payments, will give due regard to the comments and recommendations of the UK Listing Authority’s Listing Rules, the Combined Code on Corporate Governance, as issued by the Financial Reporting Council, and other requirements of legislation, regulation and good governance.
| | | | | |
| |
| | | Date of contract | | Notice period |
| |
Executive Directors | | | | |
| Steve Holliday | | 1 April 2006 | | 12 months |
| Roger Urwin (i) | | 17 November 1995 | | 12 months |
| Steve Lucas | | 13 June 2002 | | 12 months |
| Nick Winser | | 28 April 2003 | | 12 months |
| Mark Fairbairn (ii) | | 23 January 2007 | | 12 months |
| Edward Astle | | 27 July 2001 | | 12 months |
| Mike Jesanis (iii) | | 8 July 2004 | | 12 months |
| |
| | |
| (i) | | Roger Urwin left the Board on 31 December 2006. |
| (ii) | | Mark Fairbairn was appointed to the Board on 1 January 2007. |
| (iii) | | Mike Jesanis left the Board on 31 December 2006. |
External appointments and retention of fees
With the approval of the Board in each case, Executive Directors may normally accept an external appointment as a non-executive director of another company and retain any fees received. The table below details the Executive Directors who served as non-executive directors in other companies during the year ended 31 March 2007.
| | | | | | | |
| |
| | | Company | | Retained fees (£) |
| |
Executive Directors | | | | |
| Steve Holliday | | Marks and Spencer Group plc | | | | 60,000 |
| Roger Urwin | | Utilico Investment Trust plc (i) | | | | 16,500 |
| | | Alfred McAlpine plc (ii) | | | | 17,000 |
| Steve Lucas | | Compass Group PLC | | | | 70,000 |
| |
| | |
| (i) | | Fees paid for the period 1 April 2006 to 31 December 2006. |
| (ii) | | Fees paid for the period 1 September 2006 to 31 December 2006. |
Non-executive Directors’ remuneration
Non-executive Directors’ fees are determined by the Executive Directors subject to the limits applied by National Grid’s articles of association. Non-executive Directors’ remuneration comprises an annual fee (£35,000, which rose to £45,000 on 1 January 2007) and a fee for each Board meeting attended (£1,500) with a higher fee for meetings held outside the Non-executive Director’s country of residence (£3,000, which rose to £4,000 on 1 January 2007). An additional fee of £12,500 is payable for chairmanship of a Board Committee and for holding the position of Senior Independent Director. The Audit Committee chairman receives a chairmanship fee of £15,000 to recognise the additional responsibilities commensurate with this role. The Chairman is covered by the Company’s personal accident and private medical insurance schemes and the Company provides him with life assurance cover, a car (with driver when appropriate) and fuel expenses. Non-executive Directors do not participate in the annual bonus plan or in any long-term incentive plan, nor do they receive any pension benefits from the Company.
Non-executive Directors’ letters of appointment
The Chairman’s letter of appointment provides for a period of six months’ notice to give the Company reasonable security with regard to his service. The terms of engagement of Non-executive Directors other than the Chairman are also set out in letters of appointment. For all Non-executive Directors, their initial appointment and any subsequent reappointment is subject to election by shareholders. The letters of appointment do not contain provision for termination payments.
| | | | | |
| |
| | | Date of letter | | End of period |
| | | of appointment | | of appointment |
| |
Non-executive Directors | | |
| Sir John Parker | | 27 March 2007 | | 2009 AGM |
| Ken Harvey | | 27 March 2007 | | 2009 AGM |
| Linda Adamany (i) | | 20 October 2006 | | 2007 AGM |
| John Allan | | 3 November 2005 | | 2008 AGM |
| Paul Joskow | | 3 November 2005 | | 2008 AGM |
| Stephen Pettit | | 27 March 2007 | | 2009 AGM |
| Maria Richter | | 30 September 2003 | | 2007 AGM |
| George Rose | | 27 March 2007 | | 2009 AGM |
| |
| | |
| (i) | | Linda Adamany was appointed to the Board on 1 November 2006. |
Performance graph
The graph below represents the comparative TSR performance of the Company from 31 March 2002 to 31 March 2007. For the period before the merger of National Grid Group plc and Lattice Group plc, the TSR shown is that of National Grid Group plc.
This graph represents the Company’s performance against the performance of the FTSE 100 index, which is considered suitable for this purpose as it is a broad equity market index of which National Grid is a constituent. This graph has been produced in accordance with the requirements of Schedule 7A to the Companies Act 1985.
In drawing this graph it has been assumed that all dividends have been reinvested. The TSR level shown at 31 March each year is the average of the closing daily TSR levels for the 30 day period up to and including that date.
Annual Report and Accounts 2006/0793
Remuneration outcomes during the year ended 31 March 2007
Sections 1, 2, 3, 4 and 6 comprise the ‘auditable’ part of the Directors’ Remuneration Report, being the information required by Part 3 of Schedule 7A to the Companies Act 1985.
1. Directors’ emoluments
The following tables set out an analysis of the pre-tax emoluments during the years ended 31 March 2007 and 2006, including bonuses but excluding pensions, for individual Directors who held office in National Grid during the year ended 31 March 2007.
| | | | | | | | | | | | | | | | | | | | | | | | | | | | | |
| | | | | | | | | | | | | | | | | | | | | | | | | | | Year ended | |
| Table 1A | Year ended 31 March 2007 | | | 31 March
2006 | |
| | | | | | | | | | | Benefits | | | Benefits | | | | | | | | | | |
| | | | | | | Annual | | | in kind (i) | | | in kind (i) | | | Termination | | | | | | | |
| | | Salary | | | bonus | | | (cash) | | | (non-cash) | | | payments | | | Total | | | Total | |
| | | £000s | | | £000s | | | £000s | | | £000s | | | £000s | | | £000s | | | £000s | |
| |
| Executive Directors | | | | | | | | | | | | | | | | | | | | | | | | | | | | |
| Steve Holliday (ii) | | | 656 | | | | 617 | | | | – | | | | 19 | | | | – | | | | 1,292 | | | | 870 | |
| Roger Urwin (iii) | | | 648 | | | | 716 | | | | – | | | | 23 | | | | – | | | | 1,387 | | | | 1,518 | |
| Steve Lucas (iv) | | | 472 | | | | 426 | | | | – | | | | 30 | | | | – | | | | 928 | | | | 848 | |
| Nick Winser | | | 420 | | | | 372 | | | | – | | | | 14 | | | | – | | | | 806 | | | | 771 | |
| Mark Fairbairn (iv) (v) | | | 100 | | | | 84 | | | | – | | | | 5 | | | | – | | | | 189 | | | | – | |
| Edward Astle (iv) | | | 420 | | | | 406 | | | | 12 | | | | 9 | | | | – | | | | 847 | | | | 759 | |
| Mike Jesanis (vi) | | | 411 | | | | 276 | | | | 7 | | | | 11 | | | | 1,377 | | | | 2,082 | | | | 874 | |
| |
Total | | | 3,127 | | | | 2,897 | | | | 19 | | | | 111 | | | | 1,377 | | | | 7,531 | | | | 5,640 | |
| |
| | |
| (i) | | Benefits in kind comprise benefits such as private medical insurance, life assurance, either a fully expensed car or cash in lieu of a car and the use of a driver when required. |
| (ii) | | Steve Holliday’s salary was £600,000 from 1 April 2006 to 31 December 2006 while in the role of Deputy Chief Executive and was increased to £825,000 with effect from 1 January 2007 on appointment to Chief Executive. |
| (iii) | | Roger Urwin’s annual salary on leaving was £820,000. The figure above is a pro-rated salary for nine months and includes £33,000 in lieu of outstanding annual leave entitlement. He did not receive additional severance payments. |
| (iv) | | These Executive Directors participate in the Flexible Benefits Plan which operates by way of salary sacrifice, therefore, their salaries are reduced by the benefits they have purchased. The value of these benefits is included in the Benefits in kind (non-cash) figure. The values are: Steve Lucas £7,944, Mark Fairbairn £12.51 and Edward Astle £16.68. |
| (v) | | Mark Fairbairn was appointed to the Board on 1 January 2007. |
| (vi) | | Mike Jesanis ceased employment on 31 December 2006. On leaving, he received £65,000 (included in the salary figure above) in lieu of outstanding annual leave entitlement. He received a pro-rated bonus of £276,000 on leaving and £1,377,000 with respect to termination payments (which includes legal costs). In addition, he received £340,000 with respect to a consultancy arrangement. This arrangement will cease on 30 June 2007. The exchange rate averaged over the year 1 April 2006 to 31 March 2007 used for Mike Jesanis’s values is US$1.91:£1. The exchange rate for the previous year was US$1.79:£1. |
| | | | | | | | | | | | | | | | | |
| | | | | | | | | | | | | | | Year ended | |
| Table 1B | Year ended 31 March 2007 | | | 31 March
2006 | |
| | | | | | | Other | | | | | | | |
| | | Fees | | | Emoluments | | | Total | | | Total | |
| | | £000s | | | £000s | | | £000s | | | £000s | |
| |
| Non-executive Directors | | | | | | | | | | | | | | | | |
| Sir John Parker (i) | | | 500 | | | | 53 | | | | 553 | | | | 445 | |
| Ken Harvey | | | 68 | | | | – | | | | 68 | | | | 67 | |
| Linda Adamany (ii) | | | 25 | | | | – | | | | 25 | | | | – | |
| John Allan | | | 62 | | | | – | | | | 62 | | | | 45 | |
| Paul Joskow | | | 80 | | | | – | | | | 80 | | | | 74 | |
| Stephen Pettit | | | 68 | | | | – | | | | 68 | | | | 68 | |
| Maria Richter | | | 71 | | | | – | | | | 71 | | | | 61 | |
| George Rose | | | 71 | | | | – | | | | 71 | | | | 67 | |
| John Grant (iii) | | | 18 | | | | – | | | | 18 | | | | 67 | |
| |
Total | | | 963 | | | | 53 | | | | 1,016 | | | | 894 | |
| |
| | |
| (i) | | Sir John Parker’s other emoluments comprise a fully expensed car, private medical insurance and life assurance. |
| (ii) | | Linda Adamany was appointed to the Board on 1 November 2006. |
| (iii) | | John Grant retired from the Board on 31 July 2006. |
94 National Grid plc
2. Directors’ pensions
The table below gives details of the Executive Directors’ pension benefits in accordance with both Schedule 7A of the Companies Act 1985 and the UK Listing Authority’s Listing Rules.
| | | | | | | | | | | | | | | | | | | | | | | | | | | | | | | | | |
| | | | | | | | | | | | | | | | | | | | | | | | | | | | | | | Transfer value | |
| | | | | | | | | | | | | | | | | | | | | | | | | | | | | | | of increase in | |
| | | | | | | Additional | | | | | | | | | | | | | | | | | | | Additional | | | accrued benefit | |
| | | Personal | | | benefit earned | | | | | | | Transfer value of | | | Increase in | | | benefit earned in | | | in the year ended | |
| | | contributions | | | during year | | | Accrued | | | accrued benefits | | | transfer | | | the year ended | | | 31 March 2007 | |
| | | made to the | | | ended | | | entitlement as at | | | as at 31 March (i) | | | value less | | | 31 March 2007 | | | (excluding inflation | |
| | | scheme | | | 31 March 2007 | | | 31 March 2007 | | | | | | | | | | | Director’s | | | (excluding | | | & Director | |
| Table 2 | | during the year
£000s | | | pension
£000s | | | pension
£000s | | | 2007
£000s | | | 2006
£000s | | | contributions
£000s | | | inflation) pension
£000s | | | contributions)
£000s | |
| |
| Steve Holliday (ii) | | | 16 | | | | 69 | | | | 157 | | | | 2,745 | | | | 1,485 | | | | 1,244 | | | | 66 | | | | 1,134 | |
| Roger Urwin (iii) | | | 37 | | | | 27 | | | | 564 | | | | 12,714 | | | | 11,291 | | | | 1,386 | | | | 13 | | | | 224 | |
| Steve Lucas | | | 29 | | | | 39 | | | | 199 | | | | 3,535 | | | | 2,725 | | | | 781 | | | | 34 | | | | 585 | |
| Nick Winser (iv) | | | 25 | | | | 21 | | | | 152 | | | | 2,406 | | | | 2,000 | | | | 381 | | | | 16 | | | | 213 | |
| Mark Fairbairn (v) | | | 19 | | | | 27 | | | | 116 | | | | 2,014 | | | | 1,483 | | | | 512 | | | | 24 | | | | 388 | |
| Edward Astle | | | 16 | | | | 17 | | | | 78 | | | | 1,416 | | | | 1,086 | | | | 314 | | | | 15 | | | | 253 | |
| Mike Jesanis (vi) | | | 0 | | | | 13 | | | | 292 | | | | 2,828 | | | | 2,497 | | | | 331 | | | | 13 | | | | 429 | |
| |
| | |
| (i) | | The transfer values shown at 31 March 2006 and 2007 represent the value of each Executive Director’s accrued benefits based on total service completed to the relevant date.
The transfer values for the UK Executive Directors have been calculated in accordance with guidance note ‘GN11’ issued by the Institute of Actuaries and the Faculty of Actuaries.
The transfer values for the US Director have been calculated using discount rates based on high yield US corporate bonds and associated yields at the relevant dates. |
| (ii) | | The above information takes into account a lump sum benefit related to a previous transfer-in. This means that as well as the pension quoted above, there is an accrued lump sum entitlement of £77,000 as at 31 March 2007. The increase to the accumulated lump sum including inflation was £27,000 and excluding inflation was £25,000 in the year to 31 March 2007. The transfer value information above includes the value of the lump sum. |
| (iii) | | The accrued entitlement is calculated as at 31 December 2006, the date Roger Urwin retired from the Board. The value of the pension as at 31 March 2007, which has increased by an additional £21,000 per annum, reflects the compensation for the late payment of the benefits to which he was entitled at the start of the year. The transfer value at 31 March 2007 is calculated on the transfer basis used for pensioners, as Roger Urwin had retired from the Board. The comparative figure for 31 March 2006 is calculated on the transfer basis for non-pensioner members. The change in methodology accounts for £1,043,000 of the increase in transfer value. |
| (iv) | | The above information allows for the accrual of a pension benefit of two thirds of salary at age 60 taking into account standard benefits earned prior to 1 September 1998. This means that, as well as the pension above, there is an accrued lump sum entitlement of £236,000 as at 31 March 2007. The increase to the accumulated lump sum including inflation was £20,000 and excluding inflation was £12,000 in the year to 31 March 2007. The transfer value information above includes the value of the lump sum. |
| (v) | | Mark Fairbairn joined the Board on 1 January 2007. The above information takes into account a lump sum benefit relating to a previous transfer-in. This means that, as well as the pension above, there is an accrued lump sum entitlement of £197,000 as at 31 March 2007. The increase to the accumulated lump sum including inflation was £36,000 and excluding inflation was £30,000 in the year to 31 March 2007. The transfer value information above includes the value of the lump sum. |
| (vi) | | The accrued entitlement is calculated as at 31 December 2006, the date Mike Jesanis ceased employment. Through participation in a Thrift Plan in the US, the Company also made contributions worth £4,230.12 to a defined contribution pension arrangement. The exchange rates as at 31 March 2007 and 31 December 2006, which have been used to convert the figures from US dollars to pounds sterling, are US$1.97:£1 and US$1.96:£1. The exchange rate as at 31 March 2006 was US$1.74:£1. |
3. Directors’ interests in share options
The table below gives details of the Executive Directors’ holdings of share options awarded under the Executive Share Option Plan (ESOP), the Share Matching Plan (Share Match) and Sharesave schemes.
| | | | | | | | | | | | | | | | | | | | | | | | | | | | | |
| | | Options held at | | | Options | | | Market price | | | | | | | Options held at | | | | | | | |
| | | 1 April 2006 | | | exercised or | | | at date of | | | | | | 31 March 2007 | | | Exercise price | | | | |
| Table 3 | | or, if later, on
appointment* | | | lapsed during
the year | | | exercise
(pence) | | | Options granted
during the year | | | or, if later, on
retirement† | | | per share
(pence) | | | Normal exercise period |
| |
| Steve Holliday | | | | | | | | | | | | | | | | | | | | | | | | | | | | |
| ESOP | | | 67,497 | | | | – | | | | – | | | | – | | | | 67,497 | | | | 481.5 | | | June 2005 to June 2012 |
| | | | | | | | | | | | | | | | | | | | | | | | | | | | | |
| Share Match | | | 10,350 | | | | – | | | | – | | | | – | | | | 10,350 | | | 100 in total | | | June 2005 to June 2012 |
| | | | 14,083 | | | | – | | | | – | | | | – | | | | 14,083 | | | 100 in total | | | June 2006 to June 2013 |
| | | | 18,713 | | | | – | | | | – | | | | – | | | | 18,713 | | | nil | | | May 2007 to May 2014 |
| | | | 9,983 | | | | – | | | | – | | | | – | | | | 9,983 | | | nil | | | June 2008 to June 2015 |
| | | | | | | | | | | | | | | | | | | | | | | | | | | | | |
| Sharesave | | | 4,692 | | | | – | | | | – | | | | – | | | | 4,692 | | | | 350 | | | Mar 2008 to Aug 2008 |
| |
Total | | | 125,318 | | | | – | | | | | | | | – | | | | 125,318 | | | | | | | | | |
| |
| | | | | | | | | | | | | | | | | | | | | | | | | | | | | |
| Roger Urwin | | | | | | | | | | | | | | | | | | | | | | | | | | | | |
| ESOP | | | 169,340 | | | | – | | | | – | | | | – | | | | 169,340 | † | | | 280.5 | | | Jan 2007 to Sep 2007 |
| | | | 91,656 | | | | – | | | | – | | | | – | | | | 91,656 | † | | | 375.75 | | | Jan 2007 to Dec 2007 |
| | | | 22,098 | | | | – | | | | – | | | | – | | | | 22,098 | † | | | 455.25 | | | Jan 2007 to Dec 2007 |
| | | | 33,867 | | | | – | | | | – | | | | – | | | | 33,867 | † | | | 531.5 | | | Jan 2007 to Dec 2008 |
| | | | 124,610 | | | | – | | | | – | | | | – | | | | 124,610 | † | | | 481.5 | | | Jan 2007 to Dec 2008 |
| | | | | | | | | | | | | | | | | | | | | | | | | | | | | |
| Share Match | | | 18,644 | | | | – | | | | – | | | | – | | | | 18,644 | † | | 100 in total | | | Jan 2007 to Jun 2007 |
| | | | 25,000 | | | | – | | | | – | | | | – | | | | 25,000 | † | | 100 in total | | | Jan 2007 to Dec 2008 |
| | | | 30,762 | | | | – | | | | – | | | | – | | | | 30,762 | † | | nil | | | Jan 2007 to Dec 2008 |
| | | | 25,570 | | | | – | | | | – | | | | – | | | | 25,570 | † | | nil | | | Jan 2007 to Dec 2008 |
| | | | | | | | | | | | | | | | | | | | | | | | | | | | | |
| Sharesave | | | 2,910 | | | | – | | | | – | | | | – | | | | 2,910 | †(i) | | | 317 | | | Apr 2007 to Sep 2007 |
| |
Total | | | 544,457 | | | | – | | | | | | | | – | | | | 544,457 | † | | | | | | | | |
| |
Annual Report and Accounts 2006/0795
3. Directors’ interests in share options (continued)
| | | | | | | | | | | | | | | | | | | | | | | | | | | | | |
| | | Options held at | | | Options | | | Market price | | | | | | | Options held at | | | | | | | |
| | | 1 April 2006 | | | exercised or | | | at date of | | | | | | 31 March 2007 | | | Exercise price | | | | |
| Table 3(continued) | | or, if later, on
appointment* | | | lapsed during
the year | | | exercise
(pence) | | | Options granted
during the year | | | or, if later, on
retirement† | | | per share
(pence) | | | Normal exercise period |
| |
| Steve Lucas | | | | | | | | | | | | | | | | | | | | | | | | | | | | |
| ESOP | | | 54,404 | | | | – | | | | – | | | | – | | | | 54,404 | | | | 434.25 | | | Dec 2005 to Dec 2012 |
| | | | | | | | | | | | | | | | | | | | | | | | | | | | | |
| Share Match | | | 16,909 | | | | – | | | | – | | | | – | | | | 16,909 | | | nil | | | May 2007 to May 2014 |
| | | | 14,778 | | | | – | | | | – | | | | – | | | | 14,778 | | | nil | | | June 2008 to June 2015 |
| | | | | | | | | | | | | | | | | | | | | | | | | | | | | |
| Sharesave | | | – | | | | – | | | | – | | | | 1,693 | | | | 1,693 | | | | 558 | | | Apr 2010 to Sep 2010 |
| |
Total | | | 86,091 | | | | – | | | | | | | | 1,693 | | | | 87,784 | | | | | | | | | |
| |
| | | | | | | | | | | | | | | | | | | | | | | | | | | | | |
| Nick Winser | | | | | | | | | | | | | | | | | | | | | | | | | | | | |
| ESOP | | | 19,755 | | | | – | | | | – | | | | – | | | | 19,755 | | | | 531.5 | | | June 2003 to June 2010 |
| | | | | | | | | | | | | | | | | | | | | | | | | | | | | |
| Share Match | | | 3,937 | | | 3,937 | (ii) | | 592.5 | | | | – | | | | – | | | 100 in total | | | June 2006 to June 2013 |
| | | | 14,059 | | | | – | | | | – | | | | – | | | | 14,059 | | | nil | | | May 2007 to May 2014 |
| | | | 11,581 | | | | – | | | | – | | | | – | | | | 11,581 | | | nil | | | June 2008 to June 2015 |
| |
Total | | | 49,332 | | | | 3,937 | | | | | | | | – | | | | 45,395 | | | | | | | | | |
| |
| | | | | | | | | | | | | | | | | | | | | | | | | | | | | |
| Mark Fairbairn | | | | | | | | | | | | | | | | | | | | | | | | | | | | |
| ESOP | | | 8,649 | * | | | – | | | | – | | | | – | | | | 8,649 | | | | 375.75 | | | June 2001 to June 2008 |
| | | | 2,180 | * | | | – | | | | – | | | | – | | | | 2,180 | | | | 435.75 | | | July 2002 to July 2009 |
| | | | 33,489 | * | | | – | | | | – | | | | – | | | | 33,489 | | | | 531.5 | | | June 2003 to June 2010 |
| | | | 31,152 | * | | | – | | | | – | | | | – | | | | 31,152 | | | | 481.5 | | | June 2005 to June 2012 |
| | | | | | | | | | | | | | | | | | | | | | | | | | | | | |
| Share Match | | | 4,897 | * | | | – | | | | – | | | | – | | | | 4,897 | | | nil | | | May 2007 to May 2014 |
| | | | 2,134 | * | | | – | | | | – | | | | – | | | | 2,134 | | | nil | | | June 2008 to June 2015 |
| | | | | | | | | | | | | | | | | | | | | | | | | | | | | |
| Sharesave | | | 833 | * | | | – | | | | – | | | | – | | | | 833 | | | | 397 | | | Sep 2007 to Feb 2008 |
| | | | 862 | * | | | – | | | | – | | | | – | | | | 862 | | | | 383 | | | Apr 2010 to Sep 2010 |
| | | | 1,760 | * | | | – | | | | – | | | | – | | | | 1,760 | | | | 558 | | | Apr 2012 to Sep 2012 |
| |
Total | | | 85,956 | * | | | – | | | | | | | | – | | | | 85,956 | | | | | | | | | |
| |
| | | | | | | | | | | | | | | | | | | | | | | | | | | | | |
| Edward Astle | | | | | | | | | | | | | | | | | | | | | | | | | | | | |
| ESOP | | | 67,497 | | | | – | | | | – | | | | – | | | | 67,497 | | | | 481.5 | | | June 2005 to June 2012 |
| | | | 131,086 | | | | – | | | | – | | | | – | | | | 131,086 | | | | 400.5 | | | June 2006 to June 2013 |
| | | | | | | | | | | | | | | | | | | | | | | | | | | | | |
| Share Match | | | 6,553 | | | | – | | | | – | | | | – | | | | 6,553 | | | 100 in total | | | June 2005 to June 2012 |
| | | | 13,812 | | | | – | | | | – | | | | – | | | | 13,812 | | | 100 in total | | | June 2006 to June 2013 |
| | | | 15,716 | | | | – | | | | – | | | | – | | | | 15,716 | | | nil | | | May 2007 to May 2014 |
| | | | 14,637 | | | | – | | | | – | | | | – | | | | 14,637 | | | nil | | | June 2008 to June 2015 |
| |
Total | | | 249,301 | | | | – | | | | | | | | – | | | | 249,301 | | | | | | | | | |
| |
| | | | | | | | | | | | | | | | | | | | | | | | | | | | | |
| Mike Jesanis | | | | | | | | | | | | | | | | | | | | | | | | | | | | |
| ESOP | | | 77,861 | | | | – | | | | – | | | | – | | | 77,861 | †(iii) | | 566.5 | | | Jan 2007 to Dec 2007 |
| | | | 66,099 | | | | – | | | | – | | | | – | | | 66,099 | †(iii) | | 481.5 | | | Jan 2007 to Dec 2007 |
| |
Total | | | 143,960 | | | | – | | | | | | | | – | | | | 143,960 | † | | | | | | | | |
| |
| | | | | | | | | | | | | | | | | | | | | | | | | | | | | |
| Phantom ADSs (iv) | | | 699 | | | | 717 | | | | $54.34 | | | | 18 | | | | – | | | | $39.590 | | | | | |
| | | | 3,000 | | | | 3,076 | | | | $54.34 | | | | 76 | | | | – | | | | $34.270 | | | | | |
| | | | 3,452 | | | | 3,539 | | | | $54.34 | | | | 87 | | | | – | | | | $32.320 | | | | | |
| | | | 3,039 | | | | 3,116 | | | | $54.34 | | | | 77 | | | | – | | | | $39.376 | | | | | |
| | | | 4,730 | | | | 4,850 | | | | $54.34 | | | | 120 | | | | – | | | | $47.762 | | | | | |
| |
Total (Phantom ADSs) | | | 14,920 | | | | 15,298 | | | | | | | | 378 | | | | – | | | | | | | | | |
| |
| | |
| (i) | | In accordance with the Rules of the scheme, the option had been granted three years prior to Roger Urwin’s leave date and he was therefore able to complete the contract and exercise his option during the normal exercise period. |
| (ii) | | Nick Winser exercised a Share Match award over 3,937 shares. The market price at the date of exercise was 592.5p and he was required to pay 100p to exercise the award. He also received £2,348 in respect of a cash payment in lieu of dividends on the exercise of the Share Match award. |
| (iii) | | Mike Jesanis exercised his options over 143,960 shares in January 2007 at a market price of 721p, after he ceased employment on 31 December 2006. |
| (iv) | | In place of participation in the Share Matching Plan, Mike Jesanis elected to defer the ADS component of his bonuses between 2001 and 2005 inclusively into a deferred compensation plan. For a Phantom award under the deferred compensation plan, the ADS market value is tracked, additional value is accrued for dividends and the value is delivered, net of normal US deductions, depending on the participants’ election ie in 10 years, on a specified age date from 55 to 75, or on leaving, including retirement. The closing market price of ADSs at 30 March 2007, the last business day for the year ended 31 March 2007, was US$78.81. The range during the year was $78.81 (high) and $48.83 (low). Each ADS represents five ordinary shares. |
96 National Grid plc
3. Directors’ interests in share options (continued)
Executive Share Option Plan (ESOP)
No further awards will be made under this plan but there are outstanding options granted in previous years. Such options will normally be exercisable between the third and tenth anniversary of the date of grant, subject to a performance condition. The performance condition attached to the outstanding ESOP options is set out below. If the performance condition is not satisfied after the first three years, it will be re-tested as indicated.
Options worth up to 100% of an optionholder’s base salary will become exercisable in full if TSR, measured over the period of three years beginning with the financial year in which the option is granted, is at least median compared with a comparator group of companies. Grants in excess of 100% of salary vest on a sliding scale, becoming fully exercisable if the Company’s TSR is in the top quartile.
Grants made in 2000
The performance condition attached to options granted in June 2000 is tested annually throughout the lifetime of the option. These options remain unvested.
The comparator group for the 2000 award is unaudited and this information follows below. The Remuneration Committee at that time believed the group to be an appropriate mix of energy distribution sector companies, including UK and international utilities.
| | | | | | | |
| Allegheny Energy, Inc. | | Energy East Corporation | | NSTAR | | Scottish Power plc |
| BG Group plc | | FPL Group, Inc. | | Powergen plc | | The Southern Company, Inc. |
| British Energy plc | | GPU, Inc. | | Progress Energy, Inc. | | TXU, Corp |
| Central & South West Corporation | | Innogy Holdings plc | | Public Service Enterprise | | United Utilities plc |
| Consolidated Edison, Inc. | | International Power plc | | Group, Inc. | | Xcel Energy, Inc. |
| Duke Energy Corporation | | Niagara Mohawk Holdings, Inc. | | Scottish & Southern Energy plc | | |
Grants made in 2003
In June 2003, Edward Astle received a grant of Executive Share Options on the basis of 1.5 times base salary at that time, as a one-off award, to fulfill an existing contractual commitment made on his recruitment. He was the only participant to receive such an award in 2003. The comparator group used for this award is unaudited and was the same group as that used for the 2003 PSP award (see page 90). The first test of the performance criterion was undertaken in March 2006. The performance criterion was not met and was, therefore, re-tested in March 2007, where the performance criterion was not met again. The final re-test will be undertaken in March 2008.
No alteration to the advantage of the participant may be made without prior approval of shareholders.
Annual Report and Accounts 2006/07 97
4. Directors’ interests in the PSP and DSP
The table below gives details of the Executive Directors’ holdings of conditional shares awarded under the PSP. Under the PSP, Executive Directors receive a conditional award of shares, up to a current maximum of 125% of salary, which is subject to performance criteria over a three year performance period (see pages 89 and 90 for further details). Shares are then released on the fourth anniversary of the date of grant, following a retention period. The table includes conditional share awards under the DSP, whereby Executive Directors receive an award of shares representing one half of any bonus earned in the year. The deferred shares are held in Trust for three years before release.
| | | | | | | | | | | | | | | | | | | | | | | | | | | | | | | | | | | | | |
| | | | | | | PSP and DSP | | | | | | | | | | | | | | | | | | | | | | | Conditional | | | | |
| | | | | | | Conditional awards | | | | | | | | | | | | | | | | | | | | | | | awards at | | | | |
| | | | | | | at 31 March 2006 | | | Awards | | | Awards | | | Awards | | | Market price | | | | | | | 31 March 2007 | | | | |
| | | Type of | | or, if later, on | | | lapsed | | | vested | | | granted | | | at award | | | Date of | | or, if earlier, on | | | Release |
| | | award | | appointment* | | | during year | | | in year | | | during year | | | (pence except#) | | | award | | retirement† | | | date |
| |
| | | | | | | | | | | | | | | | | | | | | | | | | | | | | | | | | | | | | |
| Steve Holliday | | PSP | | | 115,669 | | | | 115,669 | (i) | | | – | | | | – | | | | 405.25 | | | June 2003 | | | – | | | | – |
| | | PSP | | | 117,681 | | | | – | | | | – | | | | – | | | | 424.875 | | | June 2004 | | | 117,681 | | | June 2008 |
| | | PSP | | | 100,801 | | | | – | | | | – | | | | – | | | | 527.03 | | | June 2005 | | | 100,801 | | | June 2009 |
| | | PSP | | | – | | | | – | | | | – | | | | 126,788 | | | | 591.5382 | | | June 2006 | | | 126,788 | | | June 2010 |
| | | DSP | | | – | | | | – | | | | – | | | | 36,389 | | | | 583.96 | | | June 2006 | | | 36,389 | | | June 2009 |
| |
Total | | | | | | | 334,151 | | | | 115,669 | | | | – | | | | 163,177 | | | | | | | | | | | | 381,659 | | | | | |
| |
| | | | | | | | | | | | | | | | | | | | | | | | | | | | | | | | | | | | | |
| Roger Urwin | | PSP | | | 195,866 | | | | 195,866 | (i) | | | – | | | | – | | | | 405.25 | | | June 2003 | | | – | † | | | – |
| | | PSP | | 198,587 | (ii) | | | – | | | | – | | | | – | | | | 424.875 | | | June 2004 | | | 198,587 | † | | June 2008 |
| | | PSP | | 181,442 | (ii) | | | – | | | | – | | | | – | | | | 527.03 | | | June 2005 | | | 181,442 | † | | June 2009 |
| | | DSP | | | – | | | | – | | | | – | | | | 62,881 | | | | 583.96 | | | June 2006 | | | 62,881 | † | | July 2007 |
| |
Total | | | | | | | 575,895 | | | | 195,866 | | | | – | | | | 62,881 | | | | | | | | | | | | 442,910 | † | | | | |
| |
| | | | | | | | | | | | | | | | | | | | | | | | | | | | | | | | | | | | | |
| Steve Lucas | | PSP | | | 115,669 | | | | 115,669 | (i) | | | – | | | | – | | | | 405.25 | | | June 2003 | | | – | | | | – |
| | | PSP | | | 116,210 | | | | – | | | | – | | | | – | | | | 424.875 | | | June 2004 | | | 116,210 | | | June 2008 |
| | | PSP | | | 99,615 | | | | – | | | | – | | | | – | | | | 527.03 | | | June 2005 | | | 99,615 | | | June 2009 |
| | | PSP | | | – | | | | – | | | | – | | | | 101,430 | | | | 591.5382 | | | June 2006 | | | 101,430 | | | June 2010 |
| | | DSP | | | – | | | | – | | | | – | | | | 34,882 | | | | 583.96 | | | June 2006 | | | 34,882 | | | June 2009 |
| |
Total | | | | | | | 331,494 | | | | 115,669 | | | | – | | | | 136,312 | | | | | | | | | | | | 352,137 | | | | | |
| |
| | | | | | | | | | | | | | | | | | | | | | | | | | | | | | | | | | | | | |
| Nick Winser | | PSP | | | 92,535 | | | | 92,535 | (i) | | | – | | | | – | | | | 405.25 | | | June 2003 | | | – | | | | – |
| | | PSP | | | 98,558 | | | | – | | | | – | | | | – | | | | 424.875 | | | June 2004 | | | 98,558 | | | June 2008 |
| | | PSP | | | 91,314 | | | | – | | | | – | | | | – | | | | 527.03 | | | June 2005 | | | 91,314 | | | June 2009 |
| | | PSP | | | – | | | | – | | | | – | | | | 88,751 | | | | 591.5382 | | | June 2006 | | | 88,751 | | | June 2010 |
| | | DSP | | | – | | | | – | | | | – | | | | 31,316 | | | | 583.96 | | | June 2006 | | | 31,316 | | | June 2009 |
| |
Total | | | | | | | 282,407 | | | | 92,535 | | | | – | | | | 120,067 | | | | | | | | | | | | 309,939 | | | | | |
| |
| | | | | | | | | | | | | | | | | | | | | | | | | | | | | | | | | | | | | |
| Mark Fairbairn | | PSP | | | 47,072 | * | | | – | | | | – | | | | – | | | | 424.875 | | | June 2004 | | | 47,072 | | | June 2008 |
| | | PSP | | | 40,225 | * | | | – | | | | – | | | | – | | | | 527.03 | | | June 2005 | | | 40,225 | | | June 2009 |
| | | PSP | | | 40,572 | * | | | – | | | | – | | | | 40,572 | | | | 591.5382 | | | June 2006 | | | 40,572 | | | June 2010 |
| | | DSP | | | 10,800 | * | | | – | | | | – | | | | 10,800 | | | | 583.96 | | | June 2006 | | | 10,800 | | | June 2009 |
| |
Total | | | | | | | 138,669 | * | | | – | | | | – | | | | 51,372 | | | | | | | | | | | | 138,669 | | | | | |
| |
| | | | | | | | | | | | | | | | | | | | | | | | | | | | | | | | | | | | | |
| Edward Astle | | PSP | | | 107,958 | | | | 107,958 | (i) | | | – | | | | – | | | | 405.25 | | | June 2003 | | | – | | | | – |
| | | PSP | | | 110,326 | | | | – | | | | – | | | | – | | | | 424.875 | | | June 2004 | | | 110,326 | | | June 2008 |
| | | PSP | | | 94,872 | | | | – | | | | – | | | | – | | | | 527.03 | | | June 2005 | | | 94,872 | | | June 2009 |
| | | PSP | | | – | | | | – | | | | – | | | | 88,751 | | | | 591.5382 | | | June 2006 | | | 88,751 | | | June 2010 |
| | | DSP | | | – | | | | – | | | | – | | | | 28,769 | | | | 583.96 | | | June 2006 | | | 28,769 | | | June 2009 |
| |
Total | | | | | | | 313,156 | | | | 107,958 | | | | – | | | | 117,520 | | | | | | | | | | | | 322,718 | | | | | |
| |
| | | | | | | | | | | | | | | | | | | | | | | | | | | | | | | | | | | | | |
| Mike Jesanis | | PSP | | | 41,871 | | | | 41,871 | (i) | | | – | | | | – | | | | 405.25 | | | June 2003 | | | – | † | | | – |
| | | PSP | | | ADSs 19,987 | (iii,iv) | | | – | | | | – | | | | – | | | | $39.4 | # | | June 2004 | | | ADSs 19,987 | † | | June 2007 |
| | | PSP | | | ADSs 21,634 | (iii,iv) | | | – | | | | – | | | | – | | | | $48.5 | # | | June 2005 | | | ADSs 21,634 | † | | June 2007 |
| | | PSP | | | – | | | | – | | | | – | | | | ADSs 20,435 | (iii,iv) | | | $53.8284 | # | | June 2006 | | | ADSs 20,435 | † | | June 2007 |
| | | DSP | | | – | | | | – | | | | – | | | | ADSs 6,203 | (iii) | | | $54.0483 | # | | June 2006 | | | ADSs 6,203 | † | | June 2007 |
| |
Totals | | Shares | | | 41,871 | | | | 41,871 | | | | – | | | | – | | | | | | | | | | | | – | † | | | | |
| | | ADSs | | | 41,621 | | | | – | | | | – | | | | 26,638 | | | | | | | | | | | | 68,259 | † | | | | |
| |
| | |
| (i) | | For PSP awards granted in 2003, the performance condition was not satisfied at the end of the three year performance period. As a result, the award has lapsed in full. |
| (ii) | | For PSP awards granted in 2004 and 2005 to Roger Urwin, these awards will not vest until, subject to performance criteria being met, the original vesting date three years after the dates of grant. If the performance criteria is met, Roger Urwin will receive his awards pro-rated on the basis of the performance criteria having been achieved and time pro-rated from the date of grant to his retirement date. |
| (iii) | | Mike Jesanis received awards over ADSs for all awards from 2004 onwards. Each ADS represents five ordinary shares. |
| (iv) | | On ceasing employment, Mike Jesanis’s June 2004 award lapsed. Partial vesting of the 2005 award occurred resulting in 3,261 ADSs vesting representing the TSR element of the award and 5,408 ADSs vesting with respect to the EPS element of the award. For the 2006 award 1,702 ADSs vested representing the TSR element of the award and all the ADSs lapsed with respect to EPS, as the performance criteria was not met. |
98 National Grid plc
3. Directors’ beneficial interests
The Directors’ beneficial interests (which include those of their families) in National Grid ordinary shares of 1117/43 pence each are shown below.
| | | | | | | | | | | | | | | | | |
| |
| | | | | | | | | | | Options/awards over | | | Options/awards over | |
| | | Ordinary shares at | | | Ordinary shares at | | | ordinary shares at | | | ordinary shares at | |
| | | 31 March 2007 | | | 1 April 2006 | | | 31 March 2007 | | | 1 April 2006 | |
| | | or, if earlier, on | | | or, if later, on | | | or, if earlier, on | | | or, if later, on | |
| | | retirement†(i) | | | appointment* | | | retirement† | | | appointment* | |
| |
| Sir John Parker | | | 63,994 | | | | 55,832 | | | | – | | | | – | |
| Steve Holliday (ii) (iii) | | | 28,293 | | | | 28,063 | | | | 506,977 | | | | 531,405 | |
| Roger Urwin (iv) | | | 247,810 | † | | | 247,630 | | | | 987,367 | † | | | 1,253,566 | |
| Steve Lucas (ii) (iv) (v) | | | 69,412 | | | | 159,379 | | | | 439,921 | | | | 417,585 | |
| Nick Winser (ii) | | | 60,624 | | | | 56,687 | | | | 355,334 | | | | 355,895 | |
| Mark Fairbairn (ii) (iii) (iv) | | | 20,838 | | | | 20,495 | * | | | 224,625 | | | | 224,625 | * |
| Edward Astle (ii) | | | 28,428 | | | | 28,428 | | | | 572,019 | | | | 756,409 | |
| Mike Jesanis | | | 3,362 | † | | | 3,281 | | | | 485,255 | † | | | 445,105 | |
| Ken Harvey (iv) | | | 3,399 | | | | 3,399 | | | | – | | | | – | |
| Linda Adamany | | | – | | | | – | * | | | – | | | | – | |
| John Allan | | | 2,000 | | | | 2,000 | | | | – | | | | – | |
| Paul Joskow | | | 4,385 | | | | 4,385 | | | | – | | | | – | |
| Stephen Pettit | | | 2,632 | | | | 2,632 | | | | – | | | | – | |
| Maria Richter | | | 1,755 | | | | 1,755 | | | | – | | | | – | |
| George Rose (iv) | | | 4,409 | | | | 4,409 | | | | – | | | | – | |
| John Grant | | | 8,775 | † | | | 8,775 | | | | – | | | | – | |
| |
| | |
| (i) | | There has been no other change in the beneficial interests of the Directors in ordinary shares between 1 April 2007 and 16 May 2007, except in respect of routine monthly purchases under the SIP (see note (iii) below). |
| (ii) | | Each of the Executive Directors, with the exception of Roger Urwin and Mike Jesanis, was for Companies Act purposes deemed to be a potential beneficiary under the National Grid 1996 Employee Benefit Trust and the National Grid plc Employee Share Trust and thereby to have an interest in 54,695 ordinary shares and 24,409 B shares held by the National Grid 1996 Employee Benefit Trust and 293,838 ordinary shares and 14,855 B shares held by the National Grid Group Employee Share Trust as at 31 March 2007. |
| (iii) | | Beneficial interest includes shares purchased under the monthly operation of the SIP in the year to 31 March 2007. In April and May 2007 a further 31 shares were purchased on behalf of each of Steve Holliday and Mark Fairbairn. |
| (iv) | | Following the Return of Cash and the issue of B shares in 2005, the following Directors held B shares as at 31 March 2007: Roger Urwin 58,397; Steve Lucas 318; Mark Fairbairn 6,132; Ken Harvey 3,874 and George Rose 5,025. |
| (v) | | Steve Lucas was for Companies Act purposes deemed to be a potential beneficiary in 24,834 ordinary shares and 23,948 B shares held by Lattice Group Trustees Limited as trustee of the Lattice Group Employee Share Ownership Trust as at 31 March 2007. |
6. National Grid share price range
The closing price of a National Grid ordinary share on 30 March 2007, being the last business day for the year ended 31 March 2007, was 797.5p. The range during the year was 797.5p (high) and 552p (low). Please note the Register of Directors’ Interests contains full details of shareholdings and options/awards held by Directors as at 31 March 2007.
On behalf of the Board
Helen Mahy
Company Secretary and General Counsel
16 May 2007
Annual Report and Accounts 2006/07 99
Contents to financial statements
| | | |
| 100 | | Statement of Directors’ responsibilities |
| 101 | | Independent Auditors’ report to the Members of National Grid plc |
| 102 | | Accounting policies |
| 108 | | Consolidated income statement |
| 109 | | Consolidated balance sheet |
| 110 | | Consolidated statement of recognised income and expense |
| 111 | | Consolidated cash flow statement |
| 112 | | Notes to the accounts |
| 112 | | Note 1 – Adoption of new accounting standards |
| 113 | | Note 2 – Segmental analysis |
| 116 | | Note 3 – Other operating income |
| 116 | | Note 4 – Operating costs |
| 117 | | Note 5 – Exceptional items and remeasurements |
| 118 | | Note 6 – Payroll costs and employees |
| 118 | | Note 7 – Directors’ emoluments |
| 119 | | Note 8 – Pensions and other post-retirement benefits |
| 123 | | Note 9 – Finance income and costs |
| 124 | | Note 10 – Taxation |
| 125 | | Note 11 – Discontinued operations |
| 126 | | Note 12 – Dividends |
| 126 | | Note 13 – Earnings per share |
| 127 | | Note 14 – Goodwill |
| 128 | | Note 15 – Acquisitions |
| 129 | | Note 16 – Other intangible assets |
| 130 | | Note 17 – Property, plant and equipment |
| 130 | | Note 18 – Investments in joint ventures |
| 131 | | Note 19 – Deferred tax assets and liabilities |
| 132 | | Note 20 – Other non-current receivables |
| 132 | | Note 21 – Financial and other investments |
| 133 | | Note 22 – Derivative financial instruments |
| 135 | | Note 23 – Financial risk factors |
| 138 | | Note 24 – Inventories |
| | | |
| 139 | | Note 25 – Trade and other receivables |
| 140 | | Note 26 – Cash and cash equivalents |
| 140 | | Note 27 – Borrowings |
| 143 | | Note 28 – Trade and other payables |
| 143 | | Note 29 – Other non-current liabilities |
| 144 | | Note 30 – Provisions |
| 145 | | Note 31 – Share capital |
| 149 | | Note 32 – Reconciliation of movements in total equity |
| 150 | | Note 33 – Consolidated cash flow statement |
| 151 | | Note 34 – Related party transactions |
| 151 | | Note 35 – Commitments and contingencies |
| 152 | | Note 36 – Subsidiary undertakings and joint ventures |
| 153 | | Note 37 – Subsequent events |
| 153 | | Note 38 – Differences between IFRS and US generally accepted accounting principles |
| 163 | | Note 39 – Condensed US GAAP financial information |
| 167 | | Note 40 – National Grid Gas plc additional US GAAP disclosures |
| 173 | | Company accounting policies |
| 175 | | Company balance sheet |
| 176 | | Notes to the Company accounts |
| 176 | | Note 1 – Adoption of new accounting standards |
| 177 | | Note 2 – Fixed asset investments |
| 177 | | Note 3 – Debtors |
| 177 | | Note 4 – Creditors (amounts falling due within one year) |
| 177 | | Note 5 – Borrowings |
| 178 | | Note 6 – Provisions for liabilities and charges |
| 178 | | Note 7 – Share capital |
| 178 | | Note 8 – Reserves |
| 179 | | Note 9 – Reconciliation of movements in equity shareholders’ funds |
| 179 | | Note 10 – Commitments and contingencies |
| 179 | | Note 11 – Directors and employees |
100 National Grid plc
Statement of Directors’ responsibilities
The Directors are responsible for preparing the Annual Report and Accounts, including the consolidated financial statements and the Company financial statements and the Directors’ remuneration report, in accordance with applicable law and regulations.
Company law requires the Directors to prepare financial statements for each financial year. Under that law the Directors have prepared the consolidated financial statements in accordance with International Financial Reporting Standards (IFRS) as adopted by the European Union, and the Company financial statements and the Directors’ remuneration report in accordance with applicable law and United Kingdom Accounting Standards (United Kingdom Generally Accepted Accounting Practice). The consolidated financial statements and Company financial statements are required by law to give a true and fair view of the state of affairs of the Company on a consolidated and individual basis and of the consolidated profit of the Company for that period.
In preparing those financial statements, the Directors are required to:
| n | | select suitable accounting policies and then apply them consistently; |
| n | | make judgements and estimates that are reasonable and prudent; |
| n | | state that the consolidated financial statements comply with IFRS as adopted by the European Union, and with regard to the Company financial statements that applicable UK Accounting Standards have been followed, subject to any material departures disclosed and explained in the financial statements; and |
| n | | prepare the consolidated financial statements and Company financial statements on a going concern basis unless it is inappropriate to presume that the Company will continue in business, in which case there should be supporting assumptions or qualifications as necessary. |
The Directors confirm that they have complied with the above requirements in preparing both the consolidated financial statements and the Company financial statements.
The Directors are responsible for keeping proper accounting records that disclose with reasonable accuracy at any time the financial position of the Company on a consolidated and individual basis and to enable them to ensure that the consolidated financial statements comply with the Companies Act 1985 and Article 4 of the IAS Regulation and the Company financial statements and the Directors’ remuneration report comply with the Companies Act 1985. They are also responsible for safeguarding the assets of the Company and its subsidiaries and hence for taking reasonable steps for the prevention and detection of fraud and other irregularities.
Annual Report and Accounts 2006/07 101
Independent Auditors’ report to the Members of National Grid plc
We have audited the consolidated and Company financial statements (the ‘‘Financial Statements’’) of National Grid plc for the year ended 31 March 2007, which comprise the consolidated income statement, the consolidated and Company balance sheets, the consolidated cash flow statement, the consolidated statement of recognised income and expense, the Accounting policies and Company accounting policies, the Notes to the accounts and the Notes to the Company accounts. These financial statements have been prepared under the accounting policies set out therein. We have also audited the information in the Directors’ remuneration report that is described as having been audited.
Respective responsibilities of Directors and auditors
The Directors’ responsibilities for preparing the Annual Report and the consolidated financial statements in accordance with applicable law and International Financial Reporting Standards (IFRS) as adopted by the European Union, and for preparing the parent company financial statements and the Directors’ remuneration report in accordance with applicable law and United Kingdom Accounting Standards (United Kingdom Generally Accepted Accounting Practice) are set out in the Statement of Directors’ Responsibilities.
Our responsibility is to audit the Financial Statements and the part of the Directors’ remuneration report to be audited in accordance with relevant legal and regulatory requirements and International Standards on Auditing (UK and Ireland). This report, including the opinion, has been prepared for and only for the Company’s members as a body in accordance with Section 235 of the Companies Act 1985 and for no other purpose. We do not, in giving this opinion, accept or assume responsibility for any other purpose or to any other person to whom this report is shown or into whose hands it may come save where expressly agreed by our prior consent in writing.
We report to you our opinion as to whether the financial statements give a true and fair view and whether the financial statements and the part of the Directors’ remuneration report to be audited have been properly prepared in accordance with the Companies Act 1985 and whether, in addition, the consolidated financial statements have been properly prepared in accordance with Article 4 of the IAS Regulation. We also report to you whether in our opinion the information given in the Directors’ report is consistent with the Financial Statements. The information given in the Directors’ report includes that specific information presented in the Operating and Financial Review and Corporate Governance section that is cross referred from the principal activities, business review and future developments section of the Directors’ report.
In addition we report to you if, in our opinion, the Company has not kept proper accounting records, if we have not received all the information and explanations we require for our audit, or if information specified by law regarding Directors’ remuneration and other transactions is not disclosed.
We review whether the Corporate Governance statement reflects the Company’s compliance with the nine provisions of the Combined Code (2003) specified for our review by the Listing Rules of the Financial Services Authority, and we report if it does not. We are not required to consider whether the Board’s
statements on internal control cover all risks and controls, or form an opinion on the effectiveness of the Group’s corporate governance procedures or its risk and control procedures.
We read other information contained in the Annual Report and consider whether it is consistent with the audited financial statements. The other information comprises only the items listed in the contents section of the Annual Report, excluding the 2007 audited financial statements and the part of the Directors’ remuneration report to be audited. We consider the implications for our report if we become aware of any apparent misstatements or material inconsistencies with the financial statements. Our responsibilities do not extend to any other information.
Basis of audit opinion
We conducted our audit in accordance with International Standards on Auditing (UK and Ireland) issued by the Auditing Practices Board. An audit includes examination, on a test basis, of evidence relevant to the amounts and disclosures in the financial statements and the part of the Directors’ remuneration report to be audited. It also includes an assessment of the significant estimates and judgements made by the Directors in the preparation of the Financial Statements, and of whether the accounting policies are appropriate to the Group’s and Company’s circumstances, consistently applied and adequately disclosed.
We planned and performed our audit so as to obtain all the information and explanations which we considered necessary in order to provide us with sufficient evidence to give reasonable assurance that the financial statements and the part of the Directors’ remuneration report to be audited are free from material misstatement, whether caused by fraud or other irregularity or error. In forming our opinion we also evaluated the overall adequacy of the presentation of information in the financial statements and the part of the Directors’ remuneration report to be audited.
Opinion
In our opinion:
| n | | the consolidated financial statements give a true and fair view, in accordance with IFRSs as adopted by the European Union, of the state of the Group’s affairs as at 31 March 2007 and of its profit and cash flows for the year then ended; |
| n | | the consolidated financial statements have been properly prepared in accordance with the Companies Act 1985 and Article 4 of the IAS Regulation; |
| n | | the Company financial statements give a true and fair view, in accordance with United Kingdom Generally Accepted Accounting Practice, of the state of the parent company’s affairs as at 31 March 2007; |
| n | | the Company financial statements and the part of the Directors’ remuneration report to be audited have been properly prepared in accordance with the Companies Act 1985; and |
| n | | the information given in the Directors’ report is consistent with the financial statements. |
PricewaterhouseCoopers LLP
Chartered Accountants and Registered Auditors
London
16 May 2007
102 National Grid plc
Accounting policies
for the year ended 31 March 2007
(a) Basis of preparation of consolidated financial statements
These consolidated financial statements have been prepared in accordance with International Financial Reporting Standards (IFRS) adopted by the European Union. They are prepared on the basis of all IFRSs and Interpretations that are mandatory for periods ending 31 March 2007 and in accordance with applicable United Kingdom law and Article 4 of the IAS Regulation. The 2006 and 2005 comparative financial information has also been prepared on this basis, with the exception of certain standards, details of which are given below, for which comparative information has not been restated.
In respect of the comparative financial information disclosed for the year ended 31 March 2005, IFRS 1 requires that estimates made under IFRS must be consistent with estimates made for the same date under generally accepted accounting principles in the United Kingdom (UK GAAP) except where adjustments are required to reflect any differences in accounting policies.
The consolidated financial statements have been prepared on a historical cost basis, except for the recording of pension liabilities and revaluation of certain financial instruments from 1 April 2005 onwards, the date of adoption of IAS 32 ‘Financial Instruments: Presentation and Disclosure’ and IAS 39 ‘Financial Instruments: Recognition and Measurement’.
These consolidated financial statements are presented in pounds sterling.
Our wireless infrastructure business and our Australian interconnector business have been classified as held for sale in the consolidated balance sheet and as discontinued in the consolidated income statement, in accordance with our accounting policy – (i) Discontinued operations, assets and businesses held for sale. Prior period income statements have been adjusted accordingly.
The preparation of financial statements requires management to make estimates and assumptions that affect the reported amounts of assets and liabilities, disclosures of contingent assets and liabilities and the reported amounts of revenue and expenses during the reporting period. Actual results could differ from these estimates.
(b) Basis of consolidation
The consolidated financial statements incorporate the financial statements of the Company and its subsidiaries, together with a share of the results, assets and liabilities of jointly controlled entities (joint ventures) using the equity method of accounting, where the investment is carried at cost plus post-acquisition changes in the share of net assets of the joint venture, less any provision for impairment.
A subsidiary is defined as an entity controlled by the Company. Control is achieved where the Company has the power to govern the financial and operating policies of an entity so as to obtain benefits from its activities. A joint venture is an entity established to engage in economic activity, which the Company jointly controls with its fellow venturers.
Losses in excess of the consolidated interest in joint ventures are not recognised, except where the Company or its subsidiaries have made a commitment to make good those losses.
Where necessary, adjustments are made to bring the accounting policies used under relevant local GAAP in the individual financial statements of the Company, subsidiaries and joint ventures into line with those used by the Company in its consolidated financial statements under IFRS. Inter-company transactions are eliminated.
The results of subsidiaries and joint ventures acquired or disposed of during the year are included in the consolidated income statement from the effective date of acquisition or up to the effective date of disposal, as appropriate.
Acquisitions are accounted for using the purchase method, where the purchase price is allocated to assets and liabilities on a fair value basis and the remainder recognised as goodwill.
(c) Foreign currencies
Transactions in currencies other than the functional currency of the Company or subsidiary concerned are recorded at the rates of exchange prevailing on the dates of the transactions. At each balance sheet date, monetary assets and liabilities that are denominated in foreign currencies are retranslated at closing exchange rates. Other non-monetary assets are not retranslated unless they are carried at fair value.
As set out in note (p) below, as permitted by IFRS 1, prior to 1 April 2005 the Company adopted the then prevailing UK GAAP for hedge accounting in its consolidated financial statements and, consequently, monetary assets and liabilities denominated in foreign currencies were translated at hedged rates instead of closing exchange rates.
Gains and losses arising on retranslation of monetary assets and liabilities are included in the income statement.
On consolidation, the assets and liabilities of operations that have a functional currency different from the Company’s functional currency of sterling are translated at exchange rates prevailing at the balance sheet date. Income and expense items are translated at the weighted average exchange rates for the period. Exchange differences arising are classified as equity and transferred to the consolidated translation reserve.
(d) Goodwill
Goodwill arising on a business combination represents the excess of the cost of acquisition over the Company’s consolidated interest in the fair value of the identifiable assets and liabilities of a subsidiary or joint venture at the date of acquisition.
Goodwill is recognised as an asset and is not amortised, but is reviewed for impairment at least annually. Any impairment is recognised immediately in the income statement and is not subsequently reversed.
Goodwill recorded under UK GAAP arising on acquisitions before 1 April 2004, the date of transition to IFRS, has been frozen at that date, subject to testing for impairment.
Goodwill and fair value adjustments arising on the acquisition of a foreign entity are treated as assets and liabilities of the foreign entity and translated at the closing exchange rate.
Annual Report and Accounts 2006/07 103
(e) Intangible assets other than goodwill
With the exception of goodwill, as described above, identifiable intangible assets are recorded at cost less accumulated amortisation and any provision for impairment.
Internally generated intangible fixed assets, such as software, are recognised only if an asset is created that can be identified; it is probable that the asset created will generate future economic benefits; and that the development cost of the asset can be measured reliably. Where no internally generated intangible asset can be recognised, development expenditure is recorded as an expense in the period in which it is incurred.
On a business combination, as well as recording separable intangible assets possessed by the acquired entity at their fair value, identifiable intangible assets that arise from contractual or other legal rights are also included in the balance sheet at their fair value.
Intangible assets, other than goodwill, are amortised on a straight-line basis over their estimated economic useful lives. Amortisation periods for categories of intangible assets are:
| | | | | |
| Amortisation periods | | Years |
| |
| Software | | 3 to 5 |
| Acquired customer relationships | | 10 to 25 |
| Other | | – telecommunication licences | | 10 to 25 |
| | | – other licences and other intangibles | | 3 to 5 |
| |
(f) Property, plant and equipment
Property, plant and equipment is recorded at cost or deemed cost at the date of transition to IFRS, less accumulated depreciation and any impairment losses.
Cost includes payroll and finance costs incurred which are directly attributable to the construction of property, plant and equipment as well as the cost of any associated asset retirement obligations.
Property, plant and equipment includes assets in which National Grid’s interest comprises legally protected statutory or contractual rights of use.
Additions represent the purchase or construction of new assets, including capital expenditure for safety and environmental assets, and extensions to, enhancements to, or replacement of existing assets.
Contributions received towards the cost of property, plant and equipment are included in creditors as deferred income and credited on a straight-line basis to the income statement over the estimated economic useful lives of the assets to which they relate.
No depreciation is provided on freehold land and assets in the course of construction.
Other property, plant and equipment are depreciated, principally on a straight-line basis, at rates estimated to write off their book values over their estimated useful economic lives. In assessing estimated useful economic lives, which are reviewed on a regular basis, consideration is given to any contractual arrangements and operational requirements relating to particular assets. Unless otherwise determined by operational requirements, the depreciation periods for the principal categories of property, plant and equipment are, in general, as shown in the table below:
| | | | | |
| Depreciation periods | Years |
| |
| Freehold and leasehold buildings | | up to 65 |
| Plant and machinery | | |
| | | Electricity transmission plant | | 15 to 60 |
| | | Electricity distribution plant | | 15 to 60 |
| | | Interconnector plant | | 15 to 60 |
| | | Gas plant – mains, services and regulating equipment | | 30 to 100 |
| | | Gas plant – storage | | 40 |
| | | Gas plant – meters | | 10 to 33 |
| | | Wireless infrastructure | | 20 to 55 |
| Motor vehicles and office equipment | | up to 10 |
| |
(g) Impairment of assets
Impairments of assets are calculated as the difference between the carrying value of the asset and its recoverable amount, if lower. Where such an asset does not generate cash flows that are independent from other assets, the recoverable amount of the cash-generating unit to which that asset belongs is estimated.
Recoverable amount is defined as the higher of fair value less costs to sell and estimated value in use at the date the impairment review is undertaken.
Value in use represents the present value of expected future cash flows, discounted using a pre-tax discount rate that reflects current market assessments of the time value of money and the risks specific to the asset for which the estimates of future cash flows have not been adjusted.
Goodwill is tested for impairment at least annually. Otherwise, tests for impairment are carried out only if there is some indication that the carrying value of the assets may have been impaired.
Impairments are recognised in the income statement and are disclosed separately.
(h) Taxation
Current tax
Current tax assets and liabilities for the current and prior periods are measured at the amount expected to be recovered from or paid to the taxation authorities. The tax rates and tax laws used to compute the amount are those that are enacted or substantively enacted by the balance sheet date.
Deferred tax and investment tax credits
Deferred tax is provided using the balance sheet liability method and is recognised on temporary differences between the carrying amounts of assets and liabilities in the financial statements and the corresponding tax bases used in the computation of taxable profit.
104 National Grid plc
Deferred tax liabilities are generally recognised on all taxable temporary differences and deferred tax assets are recognised to the extent that it is probable that taxable profits will be available against which deductible temporary differences can be utilised. Such assets and liabilities are not recognised if the temporary difference arises from the initial recognition of goodwill or from the initial recognition (other than a business combination) of other assets and liabilities in a transaction that affects neither the accounting profits nor the taxable profits.
Deferred tax liabilities are recognised on taxable temporary differences arising on investments in subsidiaries and jointly controlled entities, except where the Company is able to control the reversal of the temporary difference and it is probable that the temporary difference will not reverse in the foreseeable future.
Deferred tax is calculated at the tax rates that are expected to apply in the period when the liability is settled or the asset is realised, based on the tax rates (and tax laws) that have been enacted or substantively enacted by the balance sheet date. Deferred tax is charged or credited to the income statement, except where it relates to items charged or credited directly to equity, in which case the deferred tax is also dealt with in equity.
The carrying amount of deferred tax assets is reviewed at each balance sheet date and reduced to the extent that it is no longer probable that sufficient taxable profits will be available to allow all or part of the deferred tax asset to be recovered. Unrecognised deferred tax assets are reassessed at each balance sheet date and are recognised to the extent that it has become probable that future taxable profit will allow the deferred tax asset to be recovered.
Deferred tax assets and liabilities are offset when there is a legally enforceable right to set off current tax assets against current tax liabilities, and when they relate to income taxes levied by the same taxation authority and the Company and its subsidiaries intend to settle their current tax asset and liabilities on a net basis.
Investment tax credits are amortised over the economic life of the asset which gives rise to the credits.
(i) Discontinued operations, assets and businesses held for sale
Cash flows and operations that relate to a major component of the business or geographical region that has been sold or is classified as held for sale are shown separately from continuing operations.
Assets and businesses classified as held for sale are measured at the lower of carrying amount and fair value less costs to sell. No depreciation is charged on assets and businesses classified as held for sale.
Assets and businesses are classified as held for sale if their carrying amount will be recovered or settled principally through a sale transaction rather than through continuing use. This condition is regarded as met only when the sale is highly probable and the assets or businesses are available for immediate sale in their present condition. Management must be committed to the sale, which should be expected to qualify for recognition as a completed sale within one year from the date of classification.
Finance income or costs are included in discontinued operations only in respect of financial assets or liabilities classified as held for sale or derecognised on sale.
(j) Inventories
Inventories are stated at the lower of cost and net realisable value. Cost comprises direct materials and, where applicable, direct labour costs as well as those overheads that have been incurred in bringing the inventories to their present location and condition.
(k) Decommissioning and environmental costs
Provision is made for decommissioning and environmental costs, based on future estimated expenditures, discounted to present values. Where appropriate, the establishment of a provision is recorded as part of the original cost of the related property, plant and equipment.
Changes in the provision arising from revised estimates or discount rates or changes in the expected timing of expenditures that relate to property, plant and equipment are recorded as adjustments to their carrying value and depreciated prospectively over their remaining estimated useful economic lives; otherwise such changes are recognised in the income statement.
The unwinding of the discount is included within the income statement as a financing charge.
(l) Revenue
Revenue primarily represents the sales value derived from the transmission and distribution of energy and recovery of US stranded costs together with the sales value derived from the provision of other services, including wireless infrastructure services, to customers during the year and excludes value added tax and intra-group sales.
US stranded costs are various generation-related costs incurred prior to the divestiture of generation assets beginning in the late 1990s and costs of legacy contracts that are in general being recovered over the period up to 2011. The recovery of stranded costs and other amounts allowed to be collected from customers under regulatory arrangements are recognised in the period in which they are recoverable from customers.
Revenue includes an assessment of energy and transportation services supplied to customers between the date of the last meter reading and the year end.
Where revenue received or receivable exceeds the maximum amount permitted by regulatory agreement and adjustments will be made to future prices to reflect this over-recovery, no liability is recognised. Similarly no asset is recognised where a regulatory agreement permits adjustments to be made to future prices in respect of an under-recovery.
(m) Pensions and other post-retirement benefits
For defined benefit retirement schemes, the cost of providing benefits is determined using the projected unit method, with actuarial valuations being carried out at each balance sheet date.
Current service cost is recognised in operating costs in the period in which the defined benefit obligation increases as a result of employee services.
Actuarial gains and losses are recognised in full in the period in which they occur in the statement of recognised income and expense.
Past service costs are recognised immediately to the extent that benefits are already vested. Otherwise such costs are amortised on a straight-line basis over the period until the benefits vest.
Annual Report and Accounts 2006/07 105
Settlements are recognised when a transaction is entered into that eliminates all further legal or constructive obligations for benefits under a scheme.
Curtailments are recognised when a commitment is made to a material reduction in the number of employees covered by a scheme.
The retirement benefit obligations recognised in the balance sheet represent the present value of the defined benefit obligations, as reduced by the fair value of scheme assets and any unrecognised past service cost.
The expected return on scheme assets and the unwinding of the discount on defined benefit obligations are recognised within interest income and expense respectively.
(n) Leases
Rentals under operating leases are charged to income on a straight-line basis over the term of the relevant lease.
Assets held under finance leases are recognised at their fair value or, if lower, the present value of the minimum lease payments on inception, and depreciated over their useful economic lives. The corresponding liability is recognised as a finance lease obligation within borrowings. Rental payments are apportioned between finance costs and reduction in the finance lease obligation, so as to achieve a constant rate of interest.
(o) Financial instruments
Financial assets, liabilities and equity instruments are classified according to the substance of the contractual arrangements entered in to.
An equity instrument is any contract that evidences a residual interest in the consolidated assets of the Company after deducting all of its liabilities and is recorded at the proceeds received, net of direct issue costs.
Trade receivables are initially recognised at fair value and subsequently measured at amortised cost, less any appropriate allowances for estimated irrecoverable amounts. A provision is established for irrecoverable amounts when there is objective evidence that amounts due under the original payment terms will not be collected. Indications that the trade receivable may become irrecoverable would include financial difficulties of the debtor, likelihood of the debtor’s insolvency, and default or significant failure of payment.
Loans receivable and other receivables are carried at amortised cost using the effective interest rate method. Interest income, together with gains and losses when the loans and receivables are derecognised or impaired, are recognised in the income statement.
Other financial investments are initially measured at cost including transaction costs and, with effect from 1 April 2005, are subsequently carried at fair value. Changes in the fair value of investments classified at fair value through profit and loss are included in the income statement, while changes in the fair value of investments classified as available-for-sale are recognised directly in equity, until the investment is disposed of or is determined to be impaired. At this time the cumulative gain or loss previously recognised in equity is included in the net profit or loss for the period. Investment income on investments classified at fair value through profit and loss and on available-for-sale investments is recognised in the income statement as it accrues.
Interest-bearing loans and overdrafts are recorded at their initial fair value which normally reflects the proceeds received, net of direct issue costs less any repayments, and subsequently stated at amortised cost, inclusive of accrued interest. Any difference between the proceeds after direct issue costs and the redemption value is recognised in the income statement over the life of the borrowing.
Finance charges, including premiums payable on settlement or redemption and direct issue costs, are accounted for on an accruals basis using the effective interest rate method.
With effect from 1 April 2005 derivative financial instruments are recognised initially at fair value, and are subsequently also measured at fair value. Commodity contracts that meet the definition of a derivative and which are not used for own purposes are also carried at fair value. Changes in the fair value of derivative financial instruments are included in the income statement to the extent hedge accounting is not applied.
Subsequent to initial recognition, the fair values of financial instruments measured at fair value that are quoted in active markets are based on bid prices for assets held and offer prices for issued liabilities. When independent prices are not available, fair values are determined by using valuation techniques which refer to observable market data. These include comparison with similar instruments where market observable prices exist, discounted cash flow analysis, option pricing models and other valuation techniques commonly used by market participants.
Borrowing costs directly attributable to the acquisition, construction or production of qualifying assets (being assets that necessarily take a substantial period of time to get ready for their intended use or sale) are added to their cost. Such additions cease when the assets are substantially ready for their intended use or sale. All other borrowing costs are recognised in the income statement in the period in which they are incurred.
Purchases and sales of financial assets are usually recognised on the trade date, being the date of commitment to purchase or sell the assets.
(p) Hedge accounting and derivative financial instruments
The Company and its subsidiaries enter into both derivative financial instruments (derivatives) and non-derivative financial instruments in order to manage interest rate and foreign currency exposures and commodity price risks in respect of expected energy usage. The principal derivatives used include interest rate swaps, forward rate agreements, currency swaps, forward foreign currency contracts, interest rate swaptions and indexed swap contracts relating to the purchase of energy.
All derivative transactions are undertaken, or maintained, with a view to managing the interest, currency or commodity price risks associated with underlying business activities and the financing of those activities.
From 1 April 2005, the accounting policy for hedge accounting is described below.
Changes in the carrying value of financial instruments that are designated and effective as hedges of future cash flows (cash flow hedges) are recognised directly in equity and any ineffective portion is recognised immediately in the income statement. Amounts deferred in equity in respect of cash flow hedges are subsequently recognised in the income statement in the same period in which
106 National Grid plc
the hedged item affects net profit or loss. Where a non-financial asset or a non-financial liability results from a forecasted transaction or firm commitment being hedged, the amounts deferred in equity are included in the initial measurement of that non-monetary asset or liability.
Changes in the carrying value of financial instruments that are designated as hedges of the changes in the fair value of assets or liabilities (fair value hedges) are recognised in the income statement. An offsetting amount is recorded as an adjustment to the carrying value of the hedged items, with a corresponding entry in the income statement, to the extent that the adjustment to the carrying value is attributable to the risk being hedged and that the fair value hedge is effective.
Exchange gains or losses arising on financial instruments that are designated and effective as hedges of the Company’s consolidated net investment in overseas operations (net investment hedges) are recorded directly in equity, with any ineffective portion recognised immediately in the income statement.
Changes in the fair value of derivatives that do not qualify for hedge accounting are recognised in the income statement as they arise, within finance costs. Remeasurements of commodity contracts carried at fair value are recognised in the income statement, with changes due to movements in commodity prices recorded in operating costs and changes relating to movements in interest rates recorded in finance costs.
Hedge accounting is discontinued when the hedging instrument expires or is sold, terminated, exercised, or no longer qualifies for hedge accounting. At that time, any cumulative gains or losses relating to cash flow hedges recognised in equity are initially retained in equity and subsequently recognised in the income statement in the same periods in which the previously hedged item affects net profit or loss. Amounts deferred in equity in respect to net investment hedges are subsequently recognised in the income statement in the event of the disposal of the overseas operations concerned. For fair value hedges, the cumulative adjustment recorded to the carrying value of the hedged item at the date hedge accounting is discontinued, is amortised to the income statement using the effective interest rate method.
If a hedged forecast transaction is no longer expected to occur, the net cumulative gain or loss recognised in equity is transferred to the income statement immediately.
Derivatives embedded in other financial instruments or other host contracts are treated as separate derivatives when their risks and characteristics are not closely related to those of host contracts.
Prior to 1 April 2005 and the adoption of IAS 32 and IAS 39, derivatives used for hedging purposes were not recorded on the balance sheet as assets or liabilities. Monetary assets and liabilities in foreign currencies were retranslated at hedged rates instead of closing rates. Exchange gains and losses relating to the hedge of the net investment in overseas subsidiaries were recorded directly in equity.
As permitted by the provisions of IFRS 1, the consolidated income statement for the year ended 31 March 2005 has not been restated to reflect either the adoption of IAS 32 or IAS 39.
(q) Share-based payments
The Company issues equity-settled share-based payments to certain employees of the Company’s subsidiary undertakings.
Equity-settled share-based payments are measured at fair value at the date of grant. The fair value determined at the grant date of the equity-settled share-based payments is expensed on a straight-line basis over the vesting period, based on an estimate of the number of shares that will eventually vest.
(r) Business performance, exceptional items and remeasurements
Our financial performance is analysed into two components: business performance, which excludes exceptional items and remeasurements; and exceptional items and remeasurements. Exceptional items and remeasurements are excluded from the measures of business performance used by management to monitor financial performance as they are considered to distort the comparability of our reported financial performance from year to year. Business performance measures presented on the face of the income statement or in the notes to the accounts include operating profit before exceptional items and remeasurements, profit before tax before exceptional items and remeasurements, profit for the year before exceptional items and remeasurements and adjusted earnings per share (which excludes exceptional items and remeasurements).
Exceptional items and remeasurements are items of income and expenditure that, in the judgement of management, should be disclosed separately on the basis that they are material, either by their nature or their size, to an understanding of our financial performance and significantly distort the comparability of financial performance between periods. Items of income or expense that are considered by management for designation as exceptional items include such items as significant restructurings, write-downs or impairments of non-current assets, material changes in environmental or decommissioning provisions, integration of acquired businesses and gains or losses on disposals of businesses or investments. Remeasurements comprise gains or losses recorded in the income statement arising from changes in the fair value of commodity contracts and of derivative financial instruments to the extent that hedge accounting is not achieved or is not effective.
(s) Restructuring costs
Costs arising from restructuring programmes primarily relate to redundancy costs. Redundancy costs are charged to the income statement in the year in which an irrevocable commitment is made to incur the costs and the main features of the restructuring plan have been announced to affected employees.
(t) Other operating income
Other operating income includes profits or losses arising on the disposal of properties by our property management business, which is considered to be part of normal recurring operating activities.
Annual Report and Accounts 2006/07 107
(u) Emission allowances
Emission allowances are recorded as an intangible asset within current assets and are initially recorded at deemed cost and subsequently at the lower of deemed cost and net realisable value. For allocations of emission allowances granted by the UK Government, deemed cost is measured as fair value at the date of allocation. Receipts of such grants are treated as deferred income and are recognised in the income statement over the period to which they relate. A provision is recorded in respect of the obligation to deliver emission allowances and charges are recognised in the income statement in the period in which carbon dioxide emissions are made.
Income from emission allowances which are sold is reported as part of other operating income.
(v) Cash and cash equivalents
Cash and cash equivalents include cash held at bank and in hand, together with short-term highly liquid investments with an original maturity of less than three months that are readily convertible to known amounts of cash and subject to an insignificant change in value.
(w) Other reserves
Other reserves have arisen primarily as a result of the application of merger accounting principles under the then prevailing UK GAAP, which under IFRS 1 was retained for mergers that occurred prior to the IFRS transition date of 1 April 2004. Under merger accounting principles, the difference between the carrying amount of the capital structure of the acquiring vehicle and that of the acquired business was treated as a merger difference and included within reserves.
As the amounts included in other reserves are not attributable to any of the other classes of equity presented, they have been disclosed as a separate classification of equity.
(x) Dividends
Interim dividends are recognised when they are paid to the Company’s shareholders. Final dividends are recognised when they are approved by shareholders.
(y) Key sources of estimation uncertainty
The preparation of financial statements requires management to make estimates and assumptions that affect the reported amounts of assets and liabilities, disclosures of contingent assets and liabilities and the reported amounts of revenue and expenses during the reporting period. Actual results could differ from these estimates. Information about such judgements and estimation is contained in the accounting policies or the notes to the accounts, and the key areas are summarised below.
Areas of judgement that have the most significant effect on the amounts recognised in the financial statements are:
| n | | The categorisation of certain items as exceptional and the definition of adjusted earnings – notes 5 and 13. |
| n | | The exemptions adopted under IFRS including, in particular, those relating to business combinations – Accounting policies (a) Basis of preparation of consolidated financial statements. |
| n | | Classification of business activities as held for sale and discontinued operations – Accounting policies (i) Discontinued operations, assets and businesses held for sale. |
Key sources of estimation uncertainty that have a significant risk of causing a material adjustment to the carrying amounts of assets and liabilities within the next financial year are:
| n | | Impairment of goodwill – Accounting policies (d) Goodwill and note 14. |
| n | | Review of residual lives, carrying values and impairment charges for other intangible assets and property, plant and equipment – Accounting policies (e) Intangible assets other than goodwill, (f) Property, plant and equipment and (g) Impairment of assets. |
| n | | Estimation of liabilities for pension and other post-retirement benefits – note 8. |
| n | | Valuation of financial instruments and derivatives – notes 22 and 23. |
| n | | Revenue recognition and assessment of unbilled revenue –Accounting policies (l) Revenue. |
| n | | Recoverability of deferred tax assets – Accounting policies (h) Taxation and note 19. |
| n | | Environmental and decommissioning liabilities – note 30. |
| n | | Hedge accounting and derivative financial instruments –Accounting polices (p) Hedge accounting and derivative financial instruments. |
108 National Grid plc
Consolidated income statement
for the years ended 31 March
| | | | | | | | | | | | | | | | | |
| |
| | | | | | | 2007 | | | 2006* | | | 2005* | |
| | | Notes | | | £m | | | £m | | | £m | |
| |
Revenue | | | 2(a | ) | | | 8,695 | | | | 8,868 | | | | 7,174 | |
| Other operating income | | | 3 | | | | 83 | | | | 80 | | | | 67 | |
| Operating costs | | | 4 | | | | (6,265 | ) | | | (6,574 | ) | | | (5,128 | ) |
| |
Operating profit | | | | | | | | | | | | | | | | |
| Before exceptional items and remeasurements | | | 2(b | ) | | | 2,454 | | | | 2,457 | | | | 2,401 | |
| Exceptional items and remeasurements | | | 5 | | | | 59 | | | | (83 | ) | | | (288 | ) |
Total operating profit | | | 2(b | ) | | | 2,513 | | | | 2,374 | | | | 2,113 | |
| Interest income and similar income | | | 9 | | | | 1,144 | | | | 1,036 | | | | 945 | |
| Interest expense and other finance costs | | | | | | | | | | | | | | | | |
| Before exceptional items and remeasurements | | | 9 | | | | (1,691 | ) | | | (1,638 | ) | | | (1,649 | ) |
| Exceptional items and remeasurements | | | 5,9 | | | | (217 | ) | | | (57 | ) | | | – | |
| | | | 9 | | | | (1,908 | ) | | | (1,695 | ) | | | (1,649 | ) |
| Share of post-tax results of joint ventures | | | 2(c | ) | | | 2 | | | | 3 | | | | 3 | |
| |
Profit before taxation | | | | | | | | | | | | | | | | |
| Before exceptional items and remeasurements | | | | | | | 1,909 | | | | 1,858 | | | | 1,700 | |
| Exceptional items and remeasurements | | | 5 | | | | (158 | ) | | | (140 | ) | | | (288 | ) |
Total profit before taxation | | | | | | | 1,751 | | | | 1,718 | | | | 1,412 | |
| Taxation | | | | | | | | | | | | | | | | |
| Before exceptional items and remeasurements | | | 10 | | | | (611 | ) | | | (565 | ) | | | (424 | ) |
| Exceptional items and remeasurements | | | 5,10 | | | | 170 | | | | 30 | | | | 118 | |
| Total taxation | | | 10 | | | | (441 | ) | | | (535 | ) | | | (306 | ) |
| |
Profit from continuing operations after taxation | | | | | | | | | | | | | | | | |
| Before exceptional items and remeasurements | | | | | | | 1,298 | | | | 1,293 | | | | 1,276 | |
| Exceptional items and remeasurements | | | 5 | | | | 12 | | | | (110 | ) | | | (170 | ) |
Profit for the year from continuing operations | | | | | | | 1,310 | | | | 1,183 | | | | 1,106 | |
Profit for the year from discontinued operations | | | | | | | | | | | | | | | | |
| Before exceptional items and remeasurements | | | 11 | | | | 104 | | | | 77 | | | | 379 | |
| Exceptional items and remeasurements | | | 11 | | | | (18 | ) | | | 2,590 | | | | (61 | ) |
| | | | 11 | | | | 86 | | | | 2,667 | | | | 318 | |
| |
Profit for the year | | | | | | | 1,396 | | | | 3,850 | | | | 1,424 | |
| |
| Attributable to: | | | | | | | | | | | | | | | | |
| Equity shareholders of the parent | | | | | | | 1,394 | | | | 3,848 | | | | 1,424 | |
| Minority interests | | | | | | | 2 | | | | 2 | | | | – | |
| |
| | | | | | | | 1,396 | | | | 3,850 | | | | 1,424 | |
| |
Earnings per share from continuing operations | | | | | | | | | | | | | | | | |
| Basic | | | 13 | | | | 48.1p | | | | 41.6p | | | | 35.9p | |
| Diluted | | | 13 | | | | 47.8p | | | | 41.4p | | | | 35.7p | |
Earnings per share | | | | | | | | | | | | | | | | |
| Basic | | | 13 | | | | 51.3p | | | | 135.6p | | | | 46.2p | |
| Diluted | | | 13 | | | | 50.9p | | | | 135.0p | | | | 46.0p | |
| |
*Comparatives have been adjusted to reclassify amounts relating to discontinued operations
The notes on pages 112 to 172 form part of the consolidated financial statements.
Annual Report and Accounts 2006/07 109
Consolidated balance sheet
at 31 March
| | | | | | | | | | | | | |
| |
| | | | | | | 2007 | | | 2006 | |
| | | Notes | | | £m | | | £m | |
| |
Non-current assets | | | | | | | | | | | | |
| Goodwill | | | 14 | | | | 1,480 | | | | 2,142 | |
| Other intangible assets | | | 16 | | | | 144 | | | | 321 | |
| Property, plant and equipment | | | 17 | | | | 18,895 | | | | 18,935 | |
| Investments in joint ventures | | | 18 | | | | 5 | | | | 12 | |
| Deferred tax assets | | | 19 | | | | – | | | | 159 | |
| Other receivables | | | 20 | | | | 73 | | | | 38 | |
| Financial and other investments | | | 21 | | | | 132 | | | | 148 | |
| Derivative financial assets | | | 22 | | | | 380 | | | | 351 | |
| |
| Total non-current assets | | | | | | | 21,109 | | | | 22,106 | |
| |
Current assets | | | | | | | | | | | | |
| Other intangible assets | | | 16 | | | | 2 | | | | 41 | |
| Inventories | | | 24 | | | | 106 | | | | 108 | |
| Trade and other receivables | | | 25 | | | | 1,236 | | | | 1,519 | |
| Financial and other investments | | | 21 | | | | 2,098 | | | | 384 | |
| Derivative financial assets | | | 22 | | | | 277 | | | | 314 | |
| Cash and cash equivalents | | | 26 | | | | 1,593 | | | | 1,452 | |
| |
| Total current assets | | | | | | | 5,312 | | | | 3,818 | |
| |
| Assets of businesses held for sale | | | 11 | | | | 1,968 | | | | – | |
| |
Total assets | | | 2(d | ) | | | 28,389 | | | | 25,924 | |
| |
Current liabilities | | | | | | | | | | | | |
| Bank overdrafts | | | 26 | | | | (6 | ) | | | (3 | ) |
| Borrowings | | | 27 | | | | (1,025 | ) | | | (2,839 | ) |
| Derivative financial liabilities | | | 22 | | | | (235 | ) | | | (92 | ) |
| Trade and other payables | | | 28 | | | | (1,852 | ) | | | (2,095 | ) |
| Current tax liabilities | | | | | | | (75 | ) | | | (419 | ) |
| Provisions | | | 30 | | | | (167 | ) | | | (235 | ) |
| |
| Total current liabilities | | | | | | | (3,360 | ) | | | (5,683 | ) |
| |
Non-current liabilities | | | | | | | | | | | | |
| Borrowings | | | 27 | | | | (14,686 | ) | | | (10,287 | ) |
| Derivative financial liabilities | | | 22 | | | | (184 | ) | | | (130 | ) |
| Other non-current liabilities | | | 29 | | | | (1,475 | ) | | | (1,719 | ) |
| Deferred tax liabilities | | | 19 | | | | (2,389 | ) | | | (2,161 | ) |
| Pensions and other post-retirement benefit obligations | | | 8 | | | | (1,282 | ) | | | (1,915 | ) |
| Provisions | | | 30 | | | | (427 | ) | | | (536 | ) |
| |
| Total non-current liabilities | | | | | | | (20,443 | ) | | | (16,748 | ) |
| |
| Liabilities of businesses held for sale | | | 11 | | | | (450 | ) | | | – | |
| |
Total liabilities | | | 2(d | ) | | | (24,253 | ) | | | (22,431 | ) |
| |
Net assets | | | | | | | 4,136 | | | | 3,493 | |
| |
Equity | | | | | | | | | | | | |
| Called up share capital | | | 31 | | | | 308 | | | | 310 | |
| Share premium account | | | 32 | | | | 1,332 | | | | 1,316 | |
| Retained earnings | | | 32 | | | | 7,635 | | | | 6,817 | |
| Translation reserve | | | 32 | | | | (48 | ) | | | 127 | |
| Cash flow hedge reserve | | | 32 | | | | 26 | | | | 37 | |
| Available-for-sale investment reserve | | | 32 | | | | 1 | | | | 6 | |
| Other reserves | | | 32 | | | | (5,129 | ) | | | (5,131 | ) |
| |
Total parent company shareholders’ equity | | | | | | | 4,125 | | | | 3,482 | |
| Minority interests | | | 32 | | | | 11 | | | | 11 | |
| |
Total equity | | | | | | | 4,136 | | | | 3,493 | |
| |
These financial statements comprising the consolidated income statement, consolidated balance sheet, consolidated statement of recognised income and expense, consolidated cash flow statement and the related notes 1 to 40, were approved by the Board of Directors on 16 May 2007 and were signed on its behalf by:
Sir John ParkerChairman
Steve LucasFinance Director
110 National Grid plc
Consolidated statement of recognised income and expense
for the years ended 31 March
| | | | | | | | | | | | | | | | | |
| |
| | | | | | | 2007 | | | 2006 | | | 2005 | |
| | | Notes | | | £m | | | £m | | | £m | |
| |
| Exchange adjustments | | | | | | | (179 | ) | | | 141 | | | | (6 | ) |
| Actuarial net gain | | | 8 | | | | 365 | | | | 181 | | | | 253 | |
| Net gains/(losses) taken to equity in respect of cash flow hedges | | | | | | | 47 | | | | (12 | ) | | | – | |
| Transferred to profit or loss on cash flow hedges | | | | | | | (45 | ) | | | (20 | ) | | | – | |
| Net (losses)/gains taken to equity on available-for-sale investments | | | | | | | (3 | ) | | | 4 | | | | – | |
| Transferred to profit or loss on sale of available-for-sale investments | | | | | | | (1 | ) | | | (1 | ) | | | – | |
| Tax on items taken directly to or transferred from equity | | | 10 | | | | (81 | ) | | | (43 | ) | | | (66 | ) |
| |
Net income recognised directly in equity | | | | | | | 103 | | | | 250 | | | | 181 | |
| Profit for the year | | | | | | | 1,396 | | | | 3,850 | | | | 1,424 | |
| |
Total recognised income and expense for the year | | | | | | | 1,499 | | | | 4,100 | | | | 1,605 | |
| |
| Attributable to: | | | | | | | | | | | | | | | | |
| Equity shareholders of the parent | | | | | | | 1,498 | | | | 4,097 | | | | 1,605 | |
| Minority interests | | | | | | | 1 | | | | 3 | | | | – | |
| |
| | | | | | | | 1,499 | | | | 4,100 | | | | 1,605 | |
| |
| | | | | | | | | | | | | | | | | |
| Effect of change in accounting policy – IAS 39 (i) | | | | | | | – | | | | (43 | ) | | | – | |
| |
| | |
| (i) | | IAS 32 ‘Financial Instruments: Disclosure and Presentation’ and IAS 39 ‘Financial Instruments: Recognition and Measurement’ were adopted prospectively with effect from 1 April 2005, in accordance with the transition provisions of IFRS 1. The impact of IAS 39 attributable to minority interests was £nil. |
Annual Report and Accounts 2006/07 111
Consolidated cash flow statement
for the years ended 31 March
| | | | | | | | | | | | | | | | | |
| | | | | | | 2007 | | | 2006 | * | | 2005 | * |
| | | Notes | | | £m | | | £m | | | £m | |
| |
Cash flows from operating activities | | | | | | | | | | | | | | | | |
| Total operating profit | | | | | | | 2,513 | | | | 2,374 | | | | 2,113 | |
| Adjustments for: | | | | | | | | | | | | | | | | |
| Exceptional items and remeasurements | | | | | | | (59 | ) | | | 83 | | | | 288 | |
| Depreciation and amortisation | | | | | | | 871 | | | | 888 | | | | 782 | |
| Share-based payment charge | | | | | | | 15 | | | | 14 | | | | 12 | |
| Changes in working capital | | | | | | | 18 | | | | (206 | ) | | | (117 | ) |
| Changes in provisions | | | | | | | (57 | ) | | | (25 | ) | | | (126 | ) |
| Changes in pensions and other post-retirement benefit obligations | | | | | | | (125 | ) | | | (40 | ) | | | (19 | ) |
| Cash flows relating to exceptional items | | | | | | | (86 | ) | | | (115 | ) | | | (113 | ) |
| |
| Cash flows generated from continuing operations | | | | | | | 3,090 | | | | 2,973 | | | | 2,820 | |
| Cash flows relating to discontinued operations | | | 33(a | ) | | | 181 | | | | 138 | | | | 638 | |
| |
| Cash generated from operations | | | | | | | 3,271 | | | | 3,111 | | | | 3,458 | |
| Tax paid – continuing operations | | | | | | | (310 | ) | | | (103 | ) | | | (52 | ) |
| Tax paid – discontinued operations | | | | | | | (3 | ) | | | (37 | ) | | | (98 | ) |
| |
Net cash inflow from operating activities | | | | | | | 2,958 | | | | 2,971 | | | | 3,308 | |
| |
Cash flows from investing activities | | | | | | | | | | | | | | | | |
| Acquisition of subsidiaries, net of cash acquired | | | 15 | | | | (269 | ) | | | – | | | | – | |
| Sale of investments in joint ventures and other investments | | | | | | | 19 | | | | 8 | | | | 8 | |
| Purchases of intangible assets | | | | | | | (33 | ) | | | (15 | ) | | | (79 | ) |
| Purchases of property, plant and equipment | | | | | | | (2,185 | ) | | | (1,657 | ) | | | (1,300 | ) |
| Disposals of property, plant and equipment | | | | | | | 21 | | | | 18 | | | | 22 | |
| Purchases of financial investments | | | | | | | (3,699 | ) | | | (2,870 | ) | | | (113 | ) |
| Sales of financial investments | | | | | | | 1,974 | | | | 2,895 | | | | 54 | |
| Dividends received from joint ventures | | | | | | | – | | | | 2 | | | | 5 | |
| |
| Cash flows used in continuing operations – investing activities | | | | | | | (4,172 | ) | | | (1,619 | ) | | | (1,403 | ) |
| Cash flows relating to discontinued operations – disposal proceeds | | | | | | | 27 | | | | 5,750 | | | | – | |
| Cash flows relating to discontinued operations – acquisition of subsidiaries, net of cash acquired | | | 15 | | | | (85 | ) | | | – | | | | (1,122 | ) |
| Cash flows relating to discontinued operations – other investing activities | | | | | | | (47 | ) | | | (209 | ) | | | (450 | ) |
| |
Net cash flow (used in)/from investing activities | | | | | | | (4,277 | ) | | | 3,922 | | | | (2,975 | ) |
| |
Cash flows from financing activities | | | | | | | | | | | | | | | | |
| Proceeds from issue of share capital | | | | | | | 16 | | | | 54 | | | | 13 | |
| Proceeds from loans received | | | | | | | 5,519 | | | | 1,026 | | | | 998 | |
| Repayment of loans | | | | | | | (2,311 | ) | | | (1,714 | ) | | | (868 | ) |
| Net movements in short-term borrowings and derivatives | | | | | | | (163 | ) | | | (1,616 | ) | | | 922 | |
| Interest received | | | | | | | 216 | | | | 130 | | | | 75 | |
| Interest paid | | | | | | | (813 | ) | | | (834 | ) | | | (837 | ) |
| Exceptional finance costs on the repayment of debt | | | | | | | (45 | ) | | | (49 | ) | | | – | |
| Dividends paid to shareholders | | | | | | | (730 | ) | | | (745 | ) | | | (628 | ) |
| Cash paid to shareholders under B share scheme | | | | | | | (26 | ) | | | (1,957 | ) | | | – | |
| Repurchase of share capital | | | | | | | (169 | ) | | | – | | | | – | |
| Purchase of treasury shares | | | | | | | – | | | | (7 | ) | | | – | |
| |
Net cash flow from/(used in) financing activities | | | | | | | 1,494 | | | | (5,712 | ) | | | (325 | ) |
| |
Net increase in cash and cash equivalents | | | | | | | 175 | | | | 1,181 | | | | 8 | |
| Exchange movements | | | | | | | (14 | ) | | | 14 | | | | (1 | ) |
| Amounts reclassified as assets of businesses held for sale | | | | | | | (23 | ) | | | – | | | | – | |
| Net cash and cash equivalents at start of year (i) | | | | | | | 1,449 | | | | 254 | | | | 247 | |
| |
Net cash and cash equivalents at end of year (i) | | | 26 | | | | 1,587 | | | | 1,449 | | | | 254 | |
| |
*Comparatives have been adjusted to reclassify amounts relating to discontinued operations
| | |
| (i) | | Net of bank overdrafts. |
112 National Grid plc
Notes to the accounts
1. Adoption of new accounting standards
New IFRS accounting standards and interpretations adopted in 2006/07
During the year ended 31 March 2007 the Company adopted the following amendments to standards and interpretations. None of these had a material impact on consolidated results or assets and liabilities.
International Financial Reporting Interpretations Committee (IFRIC) 4 ‘Determining whether an arrangement contains a lease’ provides guidance on determining whether arrangements which convey the right to use an asset in return for a series of payments should be accounted for in accordance with IAS 17 ‘Leases’.
IFRIC 5 ‘Rights to Interests arising from Decommissioning, Restoration and Environmental Rehabilitation Funds’ addresses the issues of how a contributor to such a fund should account for its interest in the fund and how obligations to make additional contributions should be accounted for.
IFRIC 6 ‘Liabilities arising from participating in a specific market – Waste electrical and electronic equipment’ relates to the European Union’s Directive on waste electrical and electronic equipment, which deals with the responsibility of producers for the backlog of waste for goods sold to private households.
IFRIC 7 ‘Applying the restatement approach under IAS 29, Financial reporting in hyperinflationary economies’ deals with what is meant by the phrase ‘measuring unit, current at the balance sheet date’ and also with how an entity accounts for opening deferred tax items in its restated financial statements.
Amendment to IAS 39 ‘Financial Instruments: Recognition and Measurement: The Fair Value Option’ restricts the ability of entities to designate financial assets and liabilities at fair value through profit or loss to those financial instruments that meet certain specified conditions.
Amendment to IAS 39 ‘Financial Instruments: Recognition and Measurement’, and IFRS 4 ‘Insurance Contracts: Financial Guarantee Contracts’ define a financial guarantee contract and specify which accounting standard will apply to such contracts. Generally, financial guarantee contracts are within the scope of IAS 39. However, where the issuer of a financial guarantee contract has previously asserted that it regards such contracts as insurance contracts, then they may elect to apply either IAS 39 or IFRS 4 to those contracts. The Company accounts for such contracts as insurance contracts.
Amendment to IAS 21 ‘The Effects of Changes in Foreign Exchange Rates’ clarifies the requirements of IAS 21 regarding an entity’s investment in foreign operations and, in particular, the treatment of monetary items entered into as net investment hedges.
New IFRS accounting standards and interpretations not yet adopted
The Company has yet to adopt the following standards and interpretations. These will be adopted on 1 April 2007, but are not expected to have a material impact on consolidated results or assets and liabilities.
IFRIC 8 ‘Scope of IFRS 2’ addresses the issue of whether IFRS 2 ‘Share-Based Payment’ applies to transactions in which the entity cannot identify specifically some or all of the goods or services received.
IFRIC 9 ‘Reassessment of Embedded Derivatives’ prohibits reassessment of the treatment of embedded derivatives subsequent to initial recognition unless there is a change in the terms of the contract that significantly modifies the cash flows that otherwise would be required under the contract, in which case reassessment is required.
IFRIC 10 ‘Interim financial reporting and impairment’ states that any impairment losses on goodwill and certain financial assets recognised in an interim financial statement may not be reversed in subsequent interim or annual financial statements.
IFRIC 11 ‘IFRS 2 – Group and treasury share transactions’ provides guidance on whether share-based transactions involving treasury shares or involving subsidiary undertakings (for instance, options over a parent’s shares) should be accounted for as equity-settled or cash-settled share-based payment transactions.
Annual Report and Accounts 2006/07 113
1. Adoption of new accounting standards (continued)
New IFRS accounting standards and interpretations not yet endorsed by the EU
IFRS 8 ‘Operating segments’ sets out the requirements for the disclosure of information about an entity’s operating segments and about the entity’s products and services, the geographical areas in which it operates and its major customers. IFRS 8 achieves convergence with the US accounting standard, SFAS 131 ‘Disclosures about Segments of an Enterprise and Related Information’ with minor differences. If this standard had been implemented in the year ended 31 March 2007, it is not expected that it would have had a material impact on consolidated results or the presentation of those results.
Amendment to IAS 23 ‘Borrowing costs’ removes the option of immediately recognising as an expense borrowing costs that relate to assets that take a substantial period of time to get ready for use or sale. Implementation of this amendment is not expected to have any impact on consolidated results or consolidated assets and liabilities as the Company’s accounting policy is to capitalise borrowing costs.
IFRIC 12, ‘Service concession arrangements’ applies to contractual arrangements whereby a private sector operator participates in the development, financing, operation and maintenance of infrastructure for public sector services, for example, under private finance initiative contracts (PFI) contracts. The impact of this interpretation on consolidated results or consolidated assets and liabilities has not yet been assessed.
2. Segmental analysis
Segmental information is presented in accordance with the management responsibilities and economic characteristics, including consideration of risks and returns, of business activities. The Company assesses the performance of its businesses principally on the basis of operating profit before exceptional items and remeasurements. The primary reporting format is by business and the secondary reporting format is by geographical area.
The following table describes the main activities for each business segment:
| | | |
| |
| Transmission – UK | | High-voltage electricity transmission networks, the gas transmission network in the UK, the UK liquefied natural gas (LNG) storage activities and the French electricity interconnector |
| Transmission – US | | High-voltage electricity transmission networks in New York and New England |
| Gas Distribution – UK | | Four of the eight regional networks of Great Britain’s gas distribution system |
| Gas Distribution – US | | Gas distribution in New York and New England |
| Electricity Distribution – US | | Electricity distribution in New York and New England |
| US stranded cost recoveries | | The recovery of stranded costs from US electricity distribution customers as permitted by regulatory agreements |
| |
Other activities primarily relate to: UK-based gas metering activities; UK property management; a UK LNG import terminal; engineering consulting and software; together with corporate activities, including business development.
Discontinued operations comprise broadcast and mobile telephone infrastructure solutions in the UK and the US and an electricity interconnector in Australia. The wireless infrastructure operations in the UK were sold on 3 April 2007. Discontinued operations also include the operations of the four UK gas distribution networks that were sold on 1 June 2005 and the results of Citelec, an Argentinian joint venture sold during August 2004. The results for discontinued operations are disclosed in note 11.
Our segments have changed from that previously reported as a consequence of: changes in organisational and management structure; the classification of wireless infrastructure (previously a segment) and our Australian interconnector business as discontinued; and the acquisition from Southern Union Company of its gas distribution network in Rhode Island on 24 August 2006. In particular, our US electricity distribution and US gas distribution operations are now reported as separate segments. The segment results for the years ended 31 March 2006 and 31 March 2005 have been re-presented to reflect these changes.
Sales between businesses are priced having regard to the regulatory and legal requirements to which the businesses are subject.
114 National Grid plc
2.Segmental analysis (continued)
a) Revenue
| | | | | | | | | | | | | | | | | | | | | | | | | | | | | | | | | | | | | |
| | | | | | | Sales | | | Sales | | | | | | | Sales | | | Sales | | | | | | | Sales | | | Sales | |
| | | Total | | | between | | | to third | | | Total | | | between | | | to third | | | Total | | | between | | | to third | |
| | | sales | | | businesses | | | parties | | | sales | | | businesses | | | parties | | | sales | | | businesses | | | parties | |
| | | 2007 | | | 2007 | | | 2007 | | | 2006* | | | 2006* | | | 2006* | | | 2005* | | | 2005* | | | 2005* | |
| | | £m | | | £m | | | £m | | | £m | | | £m | | | £m | | | £m | | | £m | | | £m | |
| |
| Business segments | | | | | | | | | | | | | | | | | | | | | | | | | | | | | | | | | | | | |
| – continuing operations | | | | | | | | | | | | | | | | | | | | | | | | | | | | | | | | | | | | |
| Transmission – UK | | | 2,816 | | | | 18 | | | | 2,798 | | | | 2,710 | | | | 15 | | | | 2,695 | | | | 1,995 | | | | 10 | | | | 1,985 | |
| Transmission – US | | | 270 | | | | 47 | | | | 223 | | | | 310 | | | | 48 | | | | 262 | | | | 284 | | | | 45 | | | | 239 | |
| Gas Distribution – UK | | | 1,193 | | | | 92 | | | | 1,101 | | | | 1,222 | | | | 86 | | | | 1,136 | | | | 1,113 | | | | 135 | | | | 978 | |
| Gas Distribution – US | | | 638 | | | | – | | | | 638 | | | | 571 | | | | – | | | | 571 | | | | 427 | | | | – | | | | 427 | |
| Electricity Distribution – US | | | 3,004 | | | | 2 | | | | 3,002 | | | | 3,134 | | | | 2 | | | | 3,132 | | | | 2,633 | | | | 2 | | | | 2,631 | |
| US stranded cost recoveries | | | 426 | | | | – | | | | 426 | | | | 517 | | | | – | | | | 517 | | | | 436 | | | | – | | | | 436 | |
| Other activities | | | 567 | | | | 60 | | | | 507 | | | | 701 | | | | 146 | | | | 555 | | | | 734 | | | | 256 | | | | 478 | |
| |
| | | | 8,914 | | | | 219 | | | | 8,695 | | | | 9,165 | | | | 297 | | | | 8,868 | | | | 7,622 | | | | 448 | | | | 7,174 | |
| |
| Total excluding US stranded cost recoveries | | | | | | | | | | 8,269 | | | | | | | | | | | | 8,351 | | | | | | | | | | | | 6,738 | |
| US stranded cost recoveries | | | | | | | | | | | 426 | | | | | | | | | | | | 517 | | | | | | | | | | | | 436 | |
| |
| | | | | | | | | | | | 8,695 | | | | | | | | | | | | 8,868 | | | | | | | | | | | | 7,174 | |
| |
| Geographical segments | | | | | | | | | | | | | | | | | | | | | | | | | | | | | | | | | | | | |
| UK | | | | | | | | | | | 4,397 | | | | | | | | | | | | 4,374 | | | | | | | | | | | | 3,428 | |
| US | | | | | | | | | | | 4,298 | | | | | | | | | | | | 4,494 | | | | | | | | | | | | 3,746 | |
| |
| | | | | | | | | | | | 8,695 | | | | | | | | | | | | 8,868 | | | | | | | | | | | | 7,174 | |
| |
| |
| * Comparatives have been adjusted to reclassify amounts relating to discontinued operations | |
The table above represents revenue from continuing operations only, as disclosed in the consolidated income statement. Revenue from discontinued operations for the year ended 31 March 2007 was £383m (2006: £493m; 2005: £1,313m). See note 11 for additional disclosures relating to discontinued operations.
The analysis of revenue by geographical area is on the basis of destination. There are no material sales between the UK and US geographical areas.
Approximately 9% (2006: 9%; 2005: 9%) of revenue for the year ended 31 March 2007 amounting to approximately £0.8bn (2006: £0.9bn; 2005: £0.7bn) derives from a single customer, the Centrica group. The majority of this revenue is in the Gas Distribution – UK segment with lesser amounts in Other activities and the Transmission – UK segment.
b) Operating profit
| | | | | | | | | | | | | | | | | | | | | | | | | |
| | | Before exceptional items | | | After exceptional items | |
| | | and remeasurements | | | and remeasurements | |
| | | 2007 | | | 2006* | | | 2005* | | | 2007 | | | 2006* | | | 2005* | |
| | | £m | | | £m | | | £m | | | £m | | | £m | | | £m | |
| |
| Business segments – continuing operations | | | | | | | | | | | | | | | | | | | | | | | | |
| Transmission – UK | | | 946 | | | | 844 | | | | 859 | | | | 936 | | | | 843 | | | | 857 | |
| Transmission – US | | | 108 | | | | 127 | | | | 126 | | | | 107 | | | | 127 | | | | 119 | |
| Gas Distribution – UK | | | 409 | | | | 483 | | | | 424 | | | | 412 | | | | 432 | | | | 333 | |
| Gas Distribution – US | | | 71 | | | | 47 | | | | 33 | | | | 67 | | | | 47 | | | | 17 | |
| Electricity Distribution – US | | | 364 | | | | 317 | | | | 342 | | | | 355 | | | | 317 | | | | 241 | |
| US stranded cost recoveries | | | 423 | | | | 489 | | | | 465 | | | | 504 | | | | 440 | | | | 427 | |
| Other activities | | | 133 | | | | 150 | | | | 152 | | | | 132 | | | | 168 | | | | 119 | |
| |
| | | | 2,454 | | | | 2,457 | | | | 2,401 | | | | 2,513 | | | | 2,374 | | | | 2,113 | |
| |
| Total excluding US stranded cost recoveries | | | 2,031 | | | | 1,968 | | | | 1,936 | | | | 2,009 | | | | 1,934 | | | | 1,686 | |
| US stranded cost recoveries | | | 423 | | | | 489 | | | | 465 | | | | 504 | | | | 440 | | | | 427 | |
| |
| | | | 2,454 | | | | 2,457 | | | | 2,401 | | | | 2,513 | | | | 2,374 | | | | 2,113 | |
| |
| Geographical segments | | | | | | | | | | | | | | | | | | | | | | | | |
| UK | | | 1,491 | | | | 1,478 | | | | 1,435 | | | | 1,482 | | | | 1,423 | | | | 1,310 | |
| US | | | 963 | | | | 979 | | | | 966 | | | | 1,031 | | | | 930 | | | | 803 | |
| Rest of the world | | | – | | | | – | | | | – | | | | – | | | | 21 | | | | – | |
| |
| | | | 2,454 | | | | 2,457 | | | | 2,401 | | | | 2,513 | | | | 2,374 | | | | 2,113 | |
| |
| |
| * Comparatives have been adjusted to reclassify amounts relating to discontinued operations | |
The table above represents operating profit from continuing operations only, as disclosed in the consolidated income statement, and excludes the results of discontinued operations. Operating profit before exceptional items and remeasurements for discontinued operations for the year ended 31 March 2007 was £117m (2006: £131m; 2005: £552m). Operating profit after exceptional items and remeasurements for discontinued operations for the year ended 31 March 2007 was £62m (2006: £111m; 2005: £465m).
See note 11 for additional disclosures on discontinued operations.
Annual Report and Accounts 2006/07115
2. Segmental analysis (continued)
c) Share of post-tax results of joint ventures
The share of joint ventures’ post-tax results relate to electricity activities and are located in the Rest of the World geographical segment (2007: £2m; 2006: £3m; 2005: £3m).
d) Total assets and total liabilities
| | | | | | | | | | | | | | | | | |
| | | Total assets | | Total liabilities |
| | | 2007 | | | 2006* | | | 2007 | | | 2006* | |
| | | £m | | | £m | | | £m | | | £m | |
| |
| Business segments – continuing operations | | | | | | | | | | | | | | | | |
| Transmission – UK | | | 8,060 | | | | 7,181 | | | | (946 | ) | | | (1,447 | ) |
| Transmission – US | | | 1,481 | | | | 1,653 | | | | (19 | ) | | | (48 | ) |
| Gas Distribution – UK | | | 5,404 | | | | 5,091 | | | | (1,192 | ) | | | (1,154 | ) |
| Gas Distribution – US | | | 1,109 | | | | 867 | | | | (231 | ) | | | (230 | ) |
| Electricity Distribution – US | | | 4,471 | | | | 4,889 | | | | (1,320 | ) | | | (1,557 | ) |
| US stranded cost recoveries | | | 65 | | | | 104 | | | | (377 | ) | | | (665 | ) |
| Other activities | | | 1,478 | | | | 1,543 | | | | (1,091 | ) | | | (1,076 | ) |
| |
| | | | 22,068 | | | | 21,328 | | | | (5,176 | ) | | | (6,177 | ) |
| Discontinued operations | | | 1,968 | | | | 1,924 | | | | (477 | ) | | | (323 | ) |
| |
| | | | 24,036 | | | | 23,252 | | | | (5,653 | ) | | | (6,500 | ) |
| Joint ventures – continuing operations (electricity activities) | | | 5 | | | | 12 | | | | – | | | | – | |
| Unallocated | | | 4,348 | | | | 2,660 | | | | (18,600 | ) | | | (15,931 | ) |
| |
| | | | 28,389 | | | | 25,924 | | | | (24,253 | ) | | | (22,431 | ) |
| |
| Geographical segments | | | | | | | | | | | | | | | | |
| UK | | | 16,405 | | | | 15,227 | | | | (3,683 | ) | | | (3,948 | ) |
| US | | | 7,288 | | | | 7,659 | | | | (1,966 | ) | | | (2,522 | ) |
| Rest of the World | | | 348 | | | | 378 | | | | (4 | ) | | | (30 | ) |
| Unallocated | | | 4,348 | | | | 2,660 | | | | (18,600 | ) | | | (15,931 | ) |
| |
| | | | 28,389 | | | | 25,924 | | | | (24,253 | ) | | | (22,431 | ) |
| |
| |
| * Comparatives have been adjusted to reclassify amounts relating to discontinued operations | |
The analysis of total assets and total liabilities includes all attributable goodwill and excludes inter-business balances. Unallocated total assets comprise cash and cash equivalents, taxation, current financial investments and derivative financial assets. Unallocated total liabilities comprise bank overdrafts, borrowings, derivative financial liabilities and taxation.
e) Other segmental information
| | | | | | | | | | | | | | | | | | | | | | | | | |
| | | Capital expenditure | | Depreciation and amortisation |
| | | 2007 | | | 2006 | * | | 2005 | * | | 2007 | | | 2006 | * | | 2005 | * |
| | | £m | | | £m | | | £m | | | £m | | | £m | | | £m | |
| |
| Business segments – continuing operations | | | | | | | | | | | | | | | | | | | | | | | | |
| Transmission – UK | | | 1,235 | | | | 849 | | | | 529 | | | | 352 | | | | 377 | | | | 296 | |
| Transmission – US | | | 108 | | | | 91 | | | | 74 | | | | 41 | | | | 45 | | | | 41 | |
| Gas Distribution – UK | | | 490 | | | | 444 | | | | 359 | | | | 170 | | | | 161 | | | | 163 | |
| Gas Distribution – US | | | 36 | | | | 25 | | | | 30 | | | | 24 | | | | 19 | | | | 18 | |
| Electricity Distribution – US | | | 218 | | | | 219 | | | | 204 | | | | 127 | | | | 126 | | | | 117 | |
| Other activities | | | 258 | | | | 279 | | | | 165 | | | | 157 | | | | 160 | | | | 147 | |
| |
| | | | 2,345 | | | | 1,907 | | | | 1,361 | | | | 871 | | | | 888 | | | | 782 | |
| Discontinued operations | | | 30 | | | | 201 | | | | 544 | | | | 72 | | | | 77 | | | | 213 | |
| |
| | | | 2,375 | | | | 2,108 | | | | 1,905 | | | | 943 | | | | 965 | | | | 995 | |
| |
| Geographical segments | | | | | | | | | | | | | | | | | | | | | | | | |
| UK | | | 2,007 | | | | 1,697 | | | | 1,455 | | | | 739 | | | | 771 | | | | 816 | |
| US | | | 365 | | | | 340 | | | | 312 | | | | 196 | | | | 194 | | | | 179 | |
| Rest of the World | | | 3 | | | | 71 | | | | 138 | | | | 8 | | | | – | | | | – | |
| |
| | | | 2,375 | | | | 2,108 | | | | 1,905 | | | | 943 | | | | 965 | | | | 995 | |
| |
| |
| * Comparatives have been adjusted to reclassify amounts relating to discontinued operations | |
Capital expenditure comprises additions to property, plant and equipment and other intangible assets amounting to £2,343m (2006: £2,093m; 2005: £1,827m) and £32m (2006: £15m; 2005: £78m) respectively.
Depreciation and amortisation includes depreciation of property, plant and equipment and amortisation of other intangible assets amounting to £889m (2006: £908m; 2005: £950m) and £54m (2006: £57m; 2005: £45m) respectively.
116 National Grid plc
3.Other operating income
Other operating income represents income on disposal of property, plant and equipment, principally properties disposed of by our property management business.
4. Operating costs
| | | | | | | | | | | | | | | | | | | | | | | | | | | | | | | | | | | | | |
| | | Before exceptional items | | | Exceptional items | | | | |
| | | and remeasurements | | | and remeasurements | | | Total | |
| | | 2007 | | | 2006* | | | 2005* | | | 2007 | | | 2006* | | | 2005* | | | 2007 | | | 2006* | | | 2005* | |
| | | £m | | | £m | | | £m | | | £m | | | £m | | | £m | | | £m | | | £m | | | £m | |
| |
| Depreciation of property, plant and equipment | | | 830 | | | | 844 | | | | 743 | | | | – | | | | – | | | | – | | | | 830 | | | | 844 | | | | 743 | |
| Amortisation of intangible assets | | | 41 | | | | 44 | | | | 39 | | | | – | | | | – | | | | – | | | | 41 | | | | 44 | | | | 39 | |
| Payroll costs (note 6(a)) | | | 794 | | | | 807 | | | | 795 | | | | 26 | | | | 47 | | | | 91 | | | | 820 | | | | 854 | | | | 886 | |
| Other operating charges: | | | | | | | | | | | | | | | | | | | | | | | | | | | | | | | | | | | | |
| Purchases of electricity | | | 1,674 | | | | 1,928 | | | | 1,451 | | | | (81 | ) | | | 49 | | | | 38 | | | | 1,593 | | | | 1,977 | | | | 1,489 | |
| Purchases of gas | | | 544 | | | | 566 | | | | 357 | | | | – | | | | – | | | | – | | | | 544 | | | | 566 | | | | 357 | |
| Rates and property taxes | | | 472 | | | | 437 | | | | 403 | | | | – | | | | – | | | | – | | | | 472 | | | | 437 | | | | 403 | |
| Electricity transmission services scheme direct costs | | | 558 | | | | 536 | | | | 301 | | | | – | | | | – | | | | – | | | | 558 | | | | 536 | | | | 301 | |
| Payments to Scottish electricity transmission network owners | | | 237 | | | | 259 | | | | – | | | | – | | | | – | | | | – | | | | 237 | | | | 259 | | | | – | |
| Other operating charges | | | 1,174 | | | | 1,070 | | | | 751 | | | | (4 | ) | | | (13 | ) | | | 159 | | | | 1,170 | | | | 1,057 | | | | 910 | |
| | | | 4,659 | | | | 4,796 | | | | 3,263 | | | | (85 | ) | | | 36 | | | | 197 | | | | 4,574 | | | | 4,832 | | | | 3,460 | |
| |
| | | | 6,324 | | | | 6,491 | | | | 4,840 | | | | (59 | ) | | | 83 | | | | 288 | | | | 6,265 | | | | 6,574 | | | | 5,128 | |
| |
| Operating costs include: | | | | | | | | | | | | | | | | | | | | | | | | | | | | | | | | | | | | |
| Research expenditure | | | | | | | | | | | | | | | | | | | | | | | | | | | 6 | | | | 7 | | | | 9 | |
| Operating lease rentals | | | | | | | | | | | | | | | | | | | | | | | | | | | | | | | | | | | | |
| Plant and machinery | | | | | | | | | | | | | | | | | | | | | | | | | | | 21 | | | | 23 | | | | 20 | |
| Other | | | | | | | | | | | | | | | | | | | | | | | | | | | 63 | | | | 53 | | | | 36 | |
| |
| * Comparatives have been adjusted to reclassify amounts relating to discontinued operations | | | | | | | | | | | |
| | | | | | | | | | | | | | | | | | | | | | | | | | | | | | | | | | | | | |
| Auditors’ remuneration | | | | | | | | | | | | | | | | | | | | | | | | | | | | | | | | | | | | |
| Audit services | | | | | | | | | | | | | | | | | | | | | | | | | | | | | | | | | | | | |
| Audit of parent company and consolidated financial statements | | 1.2 | | | | 1.4 | | | | 1.1 | |
| Other services | | | | | | | | | | | | | | | | | | | | | | | | | | | | | | | | | | | | |
| Audit of subsidiary financial statements pursuant to legislation | | 2.8 | | | | 2.0 | | | | 2.6 | |
| Other services supplied pursuant to legislation | | 2.2 | | | | 0.8 | | | | 1.1 | |
| Services relating to tax compliance | | 0.6 | | | | 0.5 | | | | 0.5 | |
| Services relating to tax advisory | | 0.7 | | | | 0.9 | | | | 0.8 | |
| Services relating to corporate finance transactions | | 1.4 | | | | 0.4 | | | | 0.3 | |
| All other services | | 1.3 | | | | 0.8 | | | | 1.3 | |
| Fees paid by associated pension schemes | | | | | | | | | | | |
| Audit of pension schemes of the company pursuant to legislation | | 0.2 | | | | 0.1 | | | | 0.1 | |
| |
| | | | | | | | | | | | | | | | | | | | | | | | | | | | 10.4 | | | | 6.9 | | | | 7.8 | |
| |
| Total services pursuant to legislation | | 6.4 | | | | 4.3 | | | | 4.9 | |
| Total other services | | 4.0 | | | | 2.6 | | | | 2.9 | |
| |
| | | | | | | | | | | | | | | | | | | | | | | | | | | | 10.4 | | | | 6.9 | | | | 7.8 | |
| |
Other services supplied pursuant to legislation represent fees payable for services in relation to other statutory filings or engagements that are required to be carried out by the auditor. In particular, this includes fees for reports under section 404 of the US Public Company Accounting Reform and Investor Protection Act of 2002 (Sarbanes-Oxley) and audit reports on regulatory returns.
Services relating to corporate finance transactions primarily relate to the proposed acquisition of KeySpan in 2007.
All other services include costs relating to market and financial analysis, treasury related projects together with sundry services, subject to Audit Committee approval.
Annual Report and Accounts 2006/07117
5. Exceptional items and remeasurements
Exceptional items and remeasurements are items of income and expenditure that, in the judgement of management, should be disclosed separately on the basis that they are material, either by their nature or their size, to an understanding of our financial performance and significantly distort the comparability of financial performance between periods. Items of income or expense that are considered by management for designation as exceptional items include such items as significant restructurings, write-downs or impairments of non-current assets, material changes in environmental or decommissioning provisions, integration of acquired businesses and gains or losses on disposals of businesses or investments. Remeasurements comprise gains or losses recorded in the income statement arising from changes in the fair value of commodity contracts and of derivative financial instruments to the extent that hedge accounting is not achieved or is not effective.
| | | | | | | | | | | | | |
| | | 2007 | | | 2006* | | | 2005* | |
| | | £m | | | £m | | | £m | |
| |
| Exceptional items – restructuring costs (i) | | | 22 | | | | 55 | | | | 108 | |
| Exceptional items – past service pension costs (ii) | | | – | | | | – | | | | 41 | |
| Exceptional items – environmental related provisions (iii) | | | – | | | | – | | | | 101 | |
| Exceptional items – profit on sale and reversal of impairment (iv) | | | – | | | | (21 | ) | | | – | |
| Remeasurements – commodity contracts (v) | | | (81 | ) | | | 49 | | | | 38 | |
| |
Total exceptional items and remeasurements included within operating profit | | | (59 | ) | | | 83 | | | | 288 | |
| |
| Exceptional finance costs (vi) | | | 45 | | | | 49 | | | | – | |
| Remeasurements – commodity contracts (v) | | | 19 | | | | 14 | | | | – | |
| Remeasurements – net losses/(gains) on derivative financial instruments (vii) | | | 153 | | | | (6 | ) | | | – | |
| |
Total exceptional items and remeasurements included within finance costs | | | 217 | | | | 57 | | | | – | |
| |
Total exceptional items and remeasurements before taxation | | | 158 | | | | 140 | | | | 288 | |
| |
| Tax on restructuring costs (i) | | | (12 | ) | | | (7 | ) | | | (34 | ) |
| Tax on exceptional past service pension costs (ii) | | | – | | | | – | | | | (17 | ) |
| Tax on environmental related provisions (iii) | | | – | | | | – | | | | (39 | ) |
| Tax on commodity contract remeasurements (v) | | | 25 | | | | (25 | ) | | | (15 | ) |
| Tax on exceptional finance costs (vi) | | | (14 | ) | | | (15 | ) | | | – | |
| Tax on derivative financial instrument remeasurements (vii) | | | (169 | ) | | | 17 | | | | – | |
| Other exceptional tax credits (viii) | | | – | | | | – | | | | (13 | ) |
| |
Tax on exceptional items and remeasurements | | | (170 | ) | | | (30 | ) | | | (118 | ) |
| |
Total exceptional items and remeasurements | | | (12 | ) | | | 110 | | | | 170 | |
| |
| | | | | | | | | | | | | |
| Total exceptional items after taxation | | | 41 | | | | 61 | | | | 147 | |
| Total commodity contract remeasurements after taxation | | | (37 | ) | | | 38 | | | | 23 | |
| Total derivative financial instrument remeasurements after taxation | | | (16 | ) | | | 11 | | | | – | |
| |
Total exceptional items and remeasurements after taxation | | | (12 | ) | | | 110 | | | | 170 | |
| |
| |
| * Comparatives have been adjusted to reclassify amounts relating to discontinued operations | |
| | |
| |
| (i) | | Restructuring costs relate to planned cost reduction programmes in the UK and US (2006: UK only) businesses. For the year ended 31 March 2007, restructuring costs included pension related costs of £10m arising as a result of redundancies (2006: £25m; 2005: £22m). |
| (ii) | | Past service pension costs arose from the renegotiation of terms and conditions of service with certain employees in the US. |
| (iii) | | During the year ended 31 March 2005, a review of the environmental provisions was undertaken to take into account the impact of changes to UK regulations on waste disposal. This review, together with related revisions to the expected UK expenditure profile, resulted in a charge of £41m in 2005. Following a similar review in the US of environmental provisions, an additional exceptional charge of £60m was made for site restoration, which reflected experience of restoring similar sites. |
| (iv) | | Reversal of a prior year impairment of £13m related to National Grid’s investment in Copperbelt Energy Corporation (CEC) and a gain on disposal of an investment in Energis Polska of £8m. |
| (v) | | Remeasurements – commodity contracts represent mark-to-market movements on certain commodity contract obligations, primarily indexed-linked swap contracts, in the US. Under the existing rate plans in the US, commodity costs are fully recovered from customers, although the pattern of recovery may differ from the pattern of costs incurred. These movements are comprised of those impacting operating profit which are based on the change in the commodity contract liability and those impacting finance costs as a result of changing discount rates due to market fluctuations. |
| (v) | | Exceptional finance costs for the year ended 31 March 2007 represent debt redemption costs related to the restructuring of our debt portfolio. For 2006 these related to costs incurred on the early redemption of debt following the disposal of four gas distribution networks (£39m), together with issue costs associated with the B share scheme (£10m). |
| (vii) | | Remeasurements – net losses/(gains) on derivative financial instruments comprise losses and gains arising on derivative financial instruments reported in the income statement. These exclude gains and losses for which hedge accounting has been effective, which have been recognised directly in equity or offset by adjustments to the carrying value of debt. |
| | | These remeasurements include a loss of £126m (2006: £nil; 2005: £nil) relating to pre-tax losses on investment related derivative financial instruments that offset on a post-tax basis. The tax credit includes a £56m adjustment in respect of prior years (2006: £nil; 2005: £nil). |
| (viii) | | The exceptional tax credit in 2005 includes: a credit of £22m associated with the prior period disposal of Energis, a former associate company; a £3m credit associated with the prior period write-down of investments; and a £12m charge relating to the settlement of the liabilities arising from operating National Grid’s Qualifying Employee Share Ownership Trust. |
118 National Grid plc
6.Payroll costs and employees
a) Payroll costs
| | | | | | | | | | | | | |
| | | 2007 | | | 2006* | | | 2005* | |
| | | £m | | | £m | | | £m | |
| |
| Wages and salaries | | | 819 | | | | 857 | | | | 876 | |
| Social security costs | | | 65 | | | | 59 | | | | 55 | |
| Other pension costs | | | 132 | | | | 140 | | | | 146 | |
| Share-based payments | | | 15 | | | | 14 | | | | 12 | |
| Severance costs | | | 14 | | | | 23 | | | | 12 | |
| |
| | | | 1,045 | | | | 1,093 | | | | 1,101 | |
| Less: payroll costs capitalised | | | (225 | ) | | | (239 | ) | | | (215 | ) |
| |
| | | | 820 | | | | 854 | | | | 886 | |
| |
| |
| * Comparatives have been adjusted to reclassify amounts relating to discontinued operations | |
Payroll costs above represent continuing operations only. Payroll costs of discontinued operations for the year ended 31 March 2007 were £37m (2006: £67m; 2005: £165m).
b) Number of employees
| | | | | | | | | | | | | | | | | |
| | | 31 March | | | Average | | | Average* | | | Average* | |
| | | 2007 | | | 2007 | | | 2006 | | | 2005 | |
| | | Number | | | Number | | | Number | | | Number | |
| |
| UK | | | 10,015 | | | | 10,356 | | | | 10,722 | | | | 11,131 | |
| US | | | 8,753 | | | | 8,618 | | | | 8,400 | | | | 8,649 | |
| Rest of the world | | | 8 | | | | 8 | | | | 4 | | | | 9 | |
| |
| Continuing operations | | | 18,776 | | | | 18,982 | | | | 19,126 | | | | 19,789 | |
| Discontinued operations | | | 735 | | | | 730 | | | | 1,403 | | | | 4,818 | |
| |
| | | | 19,511 | | | | 19,712 | | | | 20,529 | | | | 24,607 | |
| |
| |
| * Comparatives have been adjusted to reclassify amounts relating to discontinued operations | |
The vast majority of employees in:
| – | | the US are either directly or indirectly employed in the transmission and distribution of electricity or the distribution of gas. |
| |
| – | | the UK are either directly or indirectly employed in the transmission and distribution of gas or the transmission of electricity. |
At 31 March 2007, 2,026 employees were employed in other operations.
c) Key management compensation
| | | | | | | | | | | | | |
| | | 2007 | | | 2006 | | | 2005 | |
| | | £m | | | £m | | | £m | |
| |
| Salaries and short-term employee benefits | | | 8 | | | | 7 | | | | 6 | |
| Post-employment benefits | | | 5 | | | | 5 | | | | 4 | |
| Termination benefits | | | 1 | | | | – | | | | – | |
| Share-based payments | | | 3 | | | | 2 | | | | 2 | |
| |
| | | | 17 | | | | 14 | | | | 12 | |
| |
Key management compensation relates to the Board of Directors, including the Executive Directors and Non-executive Directors for the years presented, together with Mark Fairbairn for the three months prior to his appointment as Executive Director for Gas Distribution on 1 January 2007 and Cheryl LaFleur, acting executive director for Electricity Distribution, for the period from 1 October 2006. In addition to the amounts above Mike Jesanis received £0.3m with respect to a consultancy arrangement which will expire on 30 June 2007.
7. Directors’ emoluments
Details of Directors’ emoluments are contained in the auditable part of the Directors’ remuneration report on pages 88 to 98, which form part of these accounts.
Annual Report and Accounts 2006/07119
8. Pensions and other post-retirement benefits
Substantially all National Grid’s employees are members of either defined benefit or defined contribution pension plans.
In the UK the principal schemes are the National Grid UK Pension Scheme and the National Grid Electricity Group of the Electricity Supply Pension Scheme, and, in addition, the National Grid Wireless Pension Scheme, which was disposed on 3 April 2007. In the US we have a number of defined benefit pension plans and we also provide health care and life insurance benefits to eligible retired US employees.
National Grid UK Pension Scheme
The National Grid UK Pension Scheme provides final salary defined benefits for employees who joined prior to 31 March 2002 and defined contribution benefits for employees joining from 1 April 2002. The scheme is funded with assets held in a separate trustee administered fund. It is subject to independent actuarial valuations at least every three years, on the basis of which the qualified actuary certifies the rate of employers’ contribution, which, together with the specified contributions payable by the employees and proceeds from the scheme’s assets, are expected to be sufficient to fund the benefits payable under the scheme.
The latest full actuarial valuation was carried out by Watson Wyatt LLP at 31 March 2006. The aggregate market value of the scheme’s assets was £12,743m and the value of the assets represented 97% of the actuarial value of benefits due to members, calculated on the basis of pensionable earnings and service at 31 March 2006 on an ongoing basis and allowing for projected increases in pensionable earnings. There was a funding deficit of £371m on the valuation date.
The results of the actuarial valuation carried out at 31 March 2006 showed that, based on long-term financial assumptions, the contribution rate required to meet future benefit accrual was 32% of pensionable earnings (29% employers and 3% employees). The ongoing contribution rate does not include an allowance for administration expenses. These contributions are reviewed annually. From 1 April 2007, the rate used for the recovery of administration costs was 3.7% of salary. Employers are currently, therefore, paying a total contribution rate of 32.7%. In line with the agreement made after the 2003 valuation, no funding of the deficit identified in the 2006 actuarial valuation will need to be provided to the scheme until the outcome of the actuarial assessment at 31 March 2007 is known. At this point, National Grid will pay the gross amount of any deficit up to a maximum amount of £520m (£364m net of tax) into the scheme. Until the 31 March 2007 actuarial valuation has been completed, National Grid has arranged for banks to provide the trustees of the National Grid UK Pension Scheme with letters of credit. The main conditions under which these letters of credit could be drawn relate to events that would imperil the interests of the scheme, such as National Grid Gas plc, a subsidiary undertaking, becoming insolvent or National Grid failing to make agreed payments into the scheme.
Electricity Supply Pension Scheme
The Electricity Supply Pension Scheme provides final salary defined benefits on a funded basis. The assets of the scheme are held in a separate trustee administered fund. The scheme is divided into sections, one of which is National Grid’s section. National Grid’s section of the scheme was closed to new entrants on 1 April 2006. It is subject to independent actuarial valuations at least every three years, on the basis of which the qualified actuary certifies the rate of employers’ contribution, which, together with the specified contributions payable by the employees and proceeds from the scheme’s assets, are expected to be sufficient to fund the benefits payable under the scheme.
The latest full actuarial valuation as at 31 March 2007 is currently being carried out by Hewitt Bacon Woodrow. The last completed full actuarial valuation was carried out by Hewitt Bacon Woodrow at 31 March 2004. The aggregate market value of the scheme’s assets at that date was £1,110m and the value of the assets represented 80% of the actuarial value of benefits due to members calculated on the basis of pensionable earnings and service at 31 March 2004 on an ongoing basis and allowing for projected increases in pensionable earnings.
The results of the actuarial valuation carried out at 31 March 2004 showed that, based on long-term financial assumptions, the contribution rate required to meet future benefit accrual was 19.1% of pensionable earnings (13.1% employers and 6% employees). This contribution rate will be reviewed as part of the next independent actuarial valuation being carried out currently.
It has been agreed that no funding of the deficit identified in the 2004 actuarial valuation will need to be provided to the scheme until the outcome of the actuarial valuation at 31 March 2007 is known. At this point, National Grid will pay the gross amount of any deficit up to a maximum amount of £68m (£48m net of tax) into the scheme. Until the 31 March 2007 actuarial valuation has been completed, National Grid has arranged for banks to provide the trustees of the scheme with letters of credit. The main conditions under which these letters of credit could be drawn relate to events which would imperil the interests of the scheme, such as National Grid Electricity Transmission plc, a subsidiary undertaking, becoming insolvent or National Grid failing to make agreed payments into the scheme.
National Grid Wireless Pension Scheme
Obligations under this scheme were transferred on 3 April 2007 following the disposal of our wireless infrastructure operations in the UK. The deficit in the scheme at 31 March 2007, calculated in accordance with IAS 19, was £1m, which is included within liabilities of businesses held for sale.
The scheme provides final salary defined benefits for service up to and including 30 June 2003 and a career averaged pension for service after 1 July 2003 on a funded basis.
The last completed full actuarial valuation was carried out as at 31 December 2005. There was a funding deficit of £12.6m on the valuation date. A deficit payment of £9m was made during March 2007.
120National Grid plc
8.Pensions and other post-retirement benefits (continued)
US defined benefit pension plans
National Grid’s pension plans in the US provide annuity or lump sum payments for all vested employees. In addition, all employees with greater than one year’s service are provided with defined contribution benefits. The assets of the plans are held in separate trustee administered funds.
The defined benefit plans are valued on an annual basis. The latest full actuarial valuations of these plans were carried out by Hewitt Associates LLC at 1 April 2006. The aggregate market value of the assets relating to National Grid’s US defined benefit plans at 31 March 2006 totalled £1,235m and the actuarial value of the assets represented 96% of the actuarial value of the benefits due to members, based on service through 31 March 2006 and after allowing for future salary increases. There was a funding deficit of £54m at 31 March 2006.
Employees do not contribute to the defined benefit plans. Employer contributions are made in accordance with the rules set out by the US Internal Revenue Code. These contributions vary according to the funded status of the plans and the amounts that are tax deductible. At present, there is some flexibility in the amount that is contributed on an annual basis. The policy for the New York plan is to set the contribution amount equal to the amount that is collected in rates. These contributions are expected to meet the requirements of the Pension Protection Act of 2006. In New England, our subsidiaries contribute an amount such that 100% of the Funding Target under the Pension Protection Act will be obtained by 2009.
US retiree healthcare and life insurance
National Grid provides healthcare and life insurance to eligible retired US employees. Eligibility is based on certain age and length of service requirements and in some cases retirees must contribute to the cost of their coverage.
The latest full actuarial valuations of these plans were carried out by Hewitt Associates LLC at 31 March 2006. The plans are valued on an annual basis. The aggregate market value of the assets relating to National Grid’s US health and welfare plans at 31 March 2006 totalled £568m and the actuarial value of the assets represented 46% of the actuarial value of the benefits due to members. There was a funding deficit of £654m at 31 March 2006.
In the US, there is no governmental requirement to pre-fund post-retirement health and welfare plans. However, there may be requirements under the various state regulatory agreements to contribute to these plans. Depending upon the rate jurisdiction and the plan, the funding level may be: equal to the expense as determined under SFAS 106; equal to the amount collected in rates; equal to the maximum tax deductible contribution; or zero. These requirements may change as rate agreements are reset.
| | | | | | | | | | | | | | | | | | | | | | | | | |
| | | Pensions | | US other post-retirement benefits |
| | | 2007 | | | 2006* | | | 2005* | | | 2007 | | | 2006 | | | 2005 | |
| | | £m | | | £m | | | £m | | | £m | | | £m | | | £m | |
| |
The amounts recognised in the income statement are as follows: | | | | | | | | | | | | | | | | | | | | | | | | |
| Defined contribution scheme costs | | | 3 | | | | 2 | | | | 2 | | | | – | | | | – | | | | – | |
Defined benefit scheme costs | | | | | | | | | | | | | | | | | | | | | | | | |
| Current service cost | | | 113 | | | | 112 | | | | 106 | | | | 15 | | | | 16 | | | | 11 | |
| Past service cost | | | – | | | | – | | | | 16 | | | | 7 | | | | 6 | | | | 25 | |
| Curtailment (gain)/loss on redundancies | | | (10 | ) | | | (24 | ) | | | 22 | | | | – | | | | – | | | | – | |
| Special termination benefits on redundancies | | | 23 | | | | 45 | | | | – | | | | – | | | | – | | | | – | |
| Curtailment cost – augmentations | | | 3 | | | | 5 | | | | – | | | | – | | | | – | | | | – | |
| |
| Total in payroll costs – continuing | | | 132 | | | | 140 | | | | 146 | | | | 22 | | | | 22 | | | | 36 | |
| |
| Interest cost | | | 806 | | | | 826 | | | | 824 | | | | 63 | | | | 63 | | | | 56 | |
| Expected return on plan assets | | | (885 | ) | | | (860 | ) | | | (842 | ) | | | (41 | ) | | | (41 | ) | | | (39 | ) |
| |
| Total in finance costs – continuing | | | (79 | ) | | | (34 | ) | | | (18 | ) | | | 22 | | | | 22 | | | | 17 | |
| |
| Current service costs | | | 2 | | | | 7 | | | | 28 | | | | – | | | | – | | | | – | |
| Interest cost | | | 2 | | | | 2 | | | | 1 | | | | – | | | | – | | | | – | |
| Expected return on plan assets | | | (2 | ) | | | (2 | ) | | | (1 | ) | | | – | | | | – | | | | – | |
| Curtailment/settlement gain on sale of distribution networks | | | – | | | | (168 | ) | | | – | | | | – | | | | – | | | | – | |
| |
| Total in discontinued operations | | | 2 | | | | (161 | ) | | | 28 | | | | – | | | | – | | | | – | |
| |
| |
| * Comparatives have been adjusted to reclassify amounts relating to discontinued operations | |
Annual Report and Accounts 2006/07121
8. Pensions and other post-retirement benefits (continued)
| | | | | | | | | | | | | | | | | | | | | | | | | |
| | | Pensions | | US other post-retirement benefits |
| | | 2007 | | | 2006 | | | 2005 | | | 2007 | | | 2006 | | | 2005 | |
| | | £m | | | £m | | | £m | | | £m | | | £m | | | £m | |
| |
The amounts recognised in the balance sheet are as follows: | | | | | | | | | | | | | | | | | | | | | | | | |
| Present value of funded obligations | | | (16,044 | ) | | | (16,520 | ) | | | (15,679 | ) | | | (1,126 | ) | | | (1,223 | ) | | | (1,068 | ) |
| Fair value of plan assets | | | 15,468 | | | | 15,341 | | | | 14,077 | | | | 531 | | | | 568 | | | | 488 | |
| |
| | | | (576 | ) | | | (1,179 | ) | | | (1,602 | ) | | | (595 | ) | | | (655 | ) | | | (580 | ) |
| Present value of unfunded obligations | | | (83 | ) | | | (96 | ) | | | (90 | ) | | | – | | | | – | | | | – | |
| Other post-employment liabilities | | | – | | | | – | | | | – | | | | (33 | ) | | | (34 | ) | | | (34 | ) |
| Unrecognised past service cost | | | – | | | | – | | | | – | | | | 42 | | | | 49 | | | | 50 | |
| |
| Net liability in the balance sheet | | | (659 | ) | | | (1,275 | ) | | | (1,692 | ) | | | (586 | ) | | | (640 | ) | | | (564 | ) |
| |
| Liabilities | | | (696 | ) | | | (1,275 | ) | | | (1,718 | ) | | | (586 | ) | | | (640 | ) | | | (564 | ) |
| Assets | | | 37 | | | | – | | | | 26 | | | | – | | | | – | | | | – | |
| |
| Net liability | | | (659 | ) | | | (1,275 | ) | | | (1,692 | ) | | | (586 | ) | | | (640 | ) | | | (564 | ) |
| |
| | | | | | | | | | | | | | | | | | | | | | | | | |
Changes in the present value of the defined benefit obligation | | | | | | | | | | | | | | | | | | | | | | | | |
| Opening defined benefit obligation (including unfunded obligations) | | | 16,616 | | | | 15,769 | | | | 15,403 | | | | 1,223 | | | | 1,068 | | | | 1,002 | |
| Current service cost | | | 115 | | | | 119 | | | | 134 | | | | 15 | | | | 16 | | | | 11 | |
| Interest cost | | | 808 | | | | 828 | | | | 825 | | | | 63 | | | | 63 | | | | 56 | |
| Actuarial (gains)/losses | | | (450 | ) | | | 1,300 | | | | 147 | | | | 4 | | | | 40 | | | | 5 | |
| Curtailment (gain)/loss on redundancies | | | (10 | ) | | | (24 | ) | | | 22 | | | | – | | | | – | | | | – | |
| Curtailment gain on sale of distribution networks | | | – | | | | (168 | ) | | | – | | | | – | | | | – | | | | – | |
| Settlement on sale of distribution networks | | | – | | | | (589 | ) | | | – | | | | – | | | | – | | | | – | |
| Net transfers and disposals | | | 1 | | | | (15 | ) | | | – | | | | – | | | | – | | | | – | |
| Gains on settlements | | | – | | | | (20 | ) | | | (1 | ) | | | – | | | | – | | | | – | |
| Special termination benefits | | | 23 | | | | 45 | | | | – | | | | – | | | | – | | | | – | |
| Curtailment cost – augmentations | | | 3 | | | | 5 | | | | – | | | | – | | | | – | | | | – | |
| Acquisition of subsidiary undertakings | | | 89 | | | | – | | | | 31 | | | | 19 | | | | – | | | | – | |
| Plan amendment | | | – | | | | – | | | | 17 | | | | 6 | | | | – | | | | 79 | |
| Employee contributions | | | 14 | | | | 14 | | | | 17 | | | | – | | | | – | | | | – | |
| Benefits paid (including unfunded obligations) | | | (845 | ) | | | (775 | ) | | | (783 | ) | | | (62 | ) | | | (59 | ) | | | (52 | ) |
| Transferred to liabilities of businesses held for sale | | | (48 | ) | | | – | | | | – | | | | – | | | | – | | | | – | |
| Exchange adjustments | | | (189 | ) | | | 127 | | | | (43 | ) | | | (142 | ) | | | 95 | | | | (33 | ) |
| |
| Closing defined benefit obligation (including unfunded obligations) | | | 16,127 | | | | 16,616 | | | | 15,769 | | | | 1,126 | | | | 1,223 | | | | 1,068 | |
| |
| | | | | | | | | | | | | | | | | | | | | | | | | |
Changes in the fair value of plan assets | | | | | | | | | | | | | | | | | | | | | | | | |
| Opening fair value of plan assets | | | 15,341 | | | | 14,077 | | | | 13,411 | | | | 568 | | | | 488 | | | | 496 | |
| Expected return on plan assets | | | 887 | | | | 862 | | | | 843 | | | | 41 | | | | 41 | | | | 39 | |
| Actuarial (losses)/gains | | | (93 | ) | | | 1,497 | | | | 418 | | | | 12 | | | | 24 | | | | (13 | ) |
| Assets distributed on settlements and transfers | | | – | | | | (623 | ) | | | – | | | | – | | | | – | | | | – | |
| Transfers in | | | 1 | | | | – | | | | – | | | | – | | | | – | | | | – | |
| Employer contributions | | | 276 | | | | 191 | | | | 184 | | | | 28 | | | | 30 | | | | 32 | |
| Employee contributions | | | 14 | | | | 14 | | | | 17 | | | | – | | | | – | | | | – | |
| Acquisition of subsidiary undertakings | | | 82 | | | | – | | | | 21 | | | | 7 | | | | – | | | | – | |
| Benefits paid | | | (845 | ) | | | (774 | ) | | | (783 | ) | | | (58 | ) | | | (59 | ) | | | (52 | ) |
| Transferred to liabilities of businesses held for sale | | | (46 | ) | | | – | | | | – | | | | – | | | | – | | | | – | |
| Exchange adjustments | | | (149 | ) | | | 97 | | | | (34 | ) | | | (67 | ) | | | 44 | | | | (14 | ) |
| |
| Closing fair value of plan assets | | | 15,468 | | | | 15,341 | | | | 14,077 | | | | 531 | | | | 568 | | | | 488 | |
| |
| | | | | | | | | | | | | | | | | | | | | | | | | |
Actual return on plan assets | | | 794 | | | | 2,359 | | | | 1,261 | | | | 53 | | | | 65 | | | | 26 | |
| |
| | | | | | | | | | | | | | | | | | | | | | | | | |
Expected contributions to defined benefit plans in the following year | | | 307 | | | | 153 | | | | 164 | | | | 27 | | | | 50 | | | | 50 | |
| |
Amounts recognised in statement of recognised income and expense | | | | | | | | | | | | | | | | | | | | | | | | |
| Actuarial net gain/(loss) during the year | | | 357 | | | | 197 | | | | 271 | | | | 8 | | | | (16 | ) | | | (18 | ) |
| Exchange differences | | | 40 | | | | (30 | ) | | | 9 | | | | 75 | | | | (51 | ) | | | 19 | |
| |
| Total recognised for the year | | | 397 | | | | 167 | | | | 280 | | | | 83 | | | | (67 | ) | | | 1 | |
| |
| Cumulative actuarial gain/(loss) | | | 825 | | | | 468 | | | | 271 | | | | (26 | ) | | | (34 | ) | | | (18 | ) |
| |
122 National Grid plc
8.Pensions and other post-retirement benefits (continued)
The major categories of plan assets as a percentage of total plan assets were as follows:
| | | | | | | | | | | | | | | | | | | | | | | | | | | | | | | | | | | | | |
| | | UK pensions | | US pensions | | US other post-retirement benefits |
| | | 2007 | | | 2006 | | | 2005 | | | 2007 | | | 2006 | | | 2005 | | | 2007 | | | 2006 | | | 2005 | |
| | | % | | | % | | | % | | | % | | | % | | | % | | | % | | | % | | | % | |
| |
| Equities (i) | | | 35.8 | | | | 40.7 | | | | 41.5 | | | | 63.7 | | | | 66.4 | | | | 64.5 | | | | 68.5 | | | | 69.0 | | | | 65.0 | |
| Corporate bonds | | | 18.6 | | | | 19.2 | | | | 17.3 | | | | 33.5 | | | | 32.0 | | | | 34.0 | | | | 31.1 | | | | 30.6 | | | | 33.8 | |
| Gilts | | | 33.9 | | | | 30.1 | | | | 31.9 | | | | – | | | | – | | | | – | | | | – | | | | – | | | | – | |
| Property | | | 8.5 | | | | 8.5 | | | | 8.0 | | | | – | | | | 0.2 | | | | 0.3 | | | | – | | | | – | | | | – | |
| Other | | | 3.2 | | | | 1.5 | | | | 1.3 | | | | 2.8 | | | | 1.4 | | | | 1.2 | | | | 0.4 | | | | 0.4 | | | | 1.2 | |
| |
| Total | | | 100.0 | | | | 100.0 | | | | 100.0 | | | | 100.0 | | | | 100.0 | | | | 100.0 | | | | 100.0 | | | | 100.0 | | | | 100.0 | |
| |
| | |
| (i) | | Included within equities at 31 March 2007 were ordinary shares of National Grid plc with a value of £24m (2006: £25m). No other financial instrument issued by National Grid plc was held (2006: £nil). |
| | | | | | | | | | | | | | | | | | | | | | | | | | | | | | | | | | | | | |
| The principal actuarial assumptions used were: | | | | | | | | | | | | | | | | | | | | | | | | | | | | | | | | | | | | |
| Discount rate (i) | | | 5.4 | | | | 4.9 | | | | 5.4 | | | | 5.8 | | | | 6.0 | | | | 5.8 | | | | 5.8 | | | | 6.0 | | | | 5.8 | |
| Expected return on plan assets | | | 6.1 | | | | 5.8 | | | | 6.2 | | | | 8.3 | | | | 8.3 | | | | 8.3 | | | | 8.3 | | | | 8.3 | | | | 8.3 | |
| Rate of increase in salaries (ii) | | | 4.2 | | | | 3.9 | | | | 3.9 | | | | 4.1 | | | | 4.1 | | | | 4.1 | | | | 4.1 | | | | 4.1 | | | | 4.1 | |
| Rate of increase in pensions in payment and deferred pensions | | | 3.3 | | | | 3.0 | | | | 3.0 | | | | – | | | | – | | | | – | | | | n/a | | | | n/a | | | | n/a | |
| Rate of increase in Retail Price Index or equivalent | | | 3.2 | | | | 2.9 | | | | 2.9 | | | | 2.5 | | | | 3.0 | | | | 3.0 | | | | n/a | | | | n/a | | | | n/a | |
| Initial healthcare cost trend rate | | | n/a | | | | n/a | | | | n/a | | | | n/a | | | | n/a | | | | n/a | | | | 10.0 | | | | 10.0 | | | | 10.0 | |
| Ultimate healthcare cost trend rate | | | n/a | | | | n/a | | | | n/a | | | | n/a | | | | n/a | | | | n/a | | | | 5.0 | | | | 5.0 | | | | 5.0 | |
| |
| | |
| (i) | | The discount rates for pension liabilities have been determined by reference to appropriate yields prevailing in the UK and US debt markets at the balance sheet date. |
| (ii) | | A promotional age-related scale has also been used where appropriate. |
| (iii) | | The pensions and other post-retirement benefit assumptions allow for future improvements in mortality. |
The assumed life expectations for a retiree at age 65 are:
| | | | | | | | | |
| | | UK | | | US | |
| | | years | | | years | |
| |
Today: | | | | | | | | |
| Males | | | 20.1 | | | | 17.6 | |
| Females | | | 22.5 | | | | 20.2 | |
| |
In 20 years: | | | | | | | | |
| Males | | | 21.2 | | | | 17.6 | |
| Females | | | 23.6 | | | | 20.2 | |
| |
Sensitivities at 31 March 2007 – all other assumptions held constant:
| n | | a 0.1% reduction in the discount rate would lead to an increase in the pension and other post-retirement obligation of £260m and an increase in the annual pension cost of £4m. |
| n | | a 0.5% increase in the long-term rate of increase in salaries would lead to an increase in the pension and other post-retirement obligation of £139m and an increase in the annual pension cost of £8m. |
| n | | an increase of one year to life expectations at age 60 would lead to an increase in the pension and other post-retirement obligation of £557m and to an increase in the annual pension cost of £4m. |
In respect of UK schemes, the expected long-term rate of return on assets has been set reflecting the price inflation expectation, the expected real return on each major asset class and the long-term asset allocation strategy adopted for each plan. The expected real returns on specific asset classes reflect historical returns, investment yields on the measurement date and general future return expectations, and have been set after taking advice from the schemes’ actuaries. The current target asset allocation for the National Grid UK Pension Scheme is 36% equities, 56% bonds and 8% property and other. The current target asset allocation for National Grid’s section of the Electricity Supply Pension Scheme is 61% equities, 32% bonds, 7% property and other.
In respect of US schemes, the estimated rate of return for various passive asset classes is based both on analysis of historical rates of return and forward-looking analysis of risk premiums and yields. Current market conditions, such as inflation and interest rates, are evaluated in connection with the setting of our long-term assumptions. A small premium is added for active management of both equity and fixed income. The rates of return for each asset class are then weighted in accordance with our target asset allocation, and the resulting long-term return on asset rate is then applied to the market-related value of assets. The long-term target asset allocation for the US pension schemes is 62% equities, 34% bonds and 4% property and other. The long-term target asset allocation for other post-retirement benefit schemes is 68% equities and 32% bonds.
Annual Report and Accounts 2006/07123
8. Pensions and other post-retirement benefits (continued)
Assumed healthcare cost trend rates have a significant impact on the amounts recognised in the income statement. A one percentage point change in assumed healthcare cost trend rates would have the following effects:
| | | | | | | | | | | | | |
| |
| | | 2007 | | | 2006 | | | 2005 | |
| | | £m | | | £m | | | £m | |
| |
Increase | | | | | | | | | | | | |
| Effect on the aggregate of the service cost and interest cost | | | 14 | | | | 15 | | | | 12 | |
| Effect on defined benefit obligation | | | 170 | | | | 186 | | | | 156 | |
Decrease | | | | | | | | | | | | |
| Effect on the aggregate of the service cost and interest cost | | | (12 | ) | | | (12 | ) | | | (10 | ) |
| Effect on defined benefit obligation | | | (147 | ) | | | (161 | ) | | | (136 | ) |
| |
| Experience gains on liabilities | �� | | 9 | | | | 192 | | | | 42 | |
| Experience (losses)/gains on assets | | | (81 | ) | | | 1,521 | | | | 405 | |
| |
9. Finance income and costs
| | | | | | | | | | | | | |
| |
| | | 2007 | | | 2006 | * | | 2005 | * |
| | | £m | | | £m | | | £m | |
| |
| Pensions – expected return on scheme assets | | | 926 | | | | 901 | | | | 881 | |
| Interest income on financial instruments | | | 218 | | | | 135 | | | | 64 | |
| |
| Interest income and similar income | | | 1,144 | | | | 1,036 | | | | 945 | |
| |
| | | | | | | | | | | | | |
| Pensions – interest on scheme liabilities | | | (869 | ) | | | (889 | ) | | | (880 | ) |
| Interest expense on financial liabilities held at amortised cost | | | (817 | ) | | | (742 | ) | | | (818 | ) |
| Exceptional debt redemption and B share issue costs | | | (45 | ) | | | (49 | ) | | | – | |
| Interest on derivatives | | | (54 | ) | | | (49 | ) | | | – | |
| Unwinding of discounts on provisions | | | (21 | ) | | | (18 | ) | | | (14 | ) |
| Less: interest capitalised | | | 70 | | | | 60 | | | | 63 | |
| |
| Interest expense | | | (1,736 | ) | | | (1,687 | ) | | | (1,649 | ) |
| |
| Net gains/(losses) on derivative financial instruments: | | | | | | | | | | | | |
| Ineffectiveness on derivatives designated as fair value hedges | | | 18 | | | | (10 | ) | | | – | |
| Ineffectiveness on derivatives designated as cash flow hedges | | | – | | | | 17 | | | | – | |
| Ineffectiveness on derivatives designated as net investment hedges | | | 25 | | | | (25 | ) | | | – | |
| On undesignated forward rate risk relating to derivatives designated as net investment hedges | | | (82 | ) | | | 36 | | | | – | |
| On derivatives not designated as hedges or ineligible for hedge accounting | | | (114 | ) | | | (12 | ) | | | – | |
| Financial element of remeasurements on commodity contracts | | | (19 | ) | | | (14 | ) | | | – | |
| |
| Net losses on derivative financial instruments and commodity contracts | | | (172 | ) | | | (8 | ) | | | – | |
| |
| Interest expense and other finance costs | | | (1,908 | ) | | | (1,695 | ) | | | (1,649 | ) |
| |
| | | | | | | | | | | | | |
Net finance costs | | | (764 | ) | | | (659 | ) | | | (704 | ) |
| |
| Comprising: | | | | | | | | | | | | |
| Interest income and similar income | | | 1,144 | | | | 1,036 | | | | 945 | |
| Interest expense and other finance costs | | | | | | | | | | | | |
| Before exceptional items and remeasurements | | | (1,691 | ) | | | (1,638 | ) | | | (1,649 | ) |
| Exceptional items and remeasurements | | | (217 | ) | | | (57 | ) | | | – | |
| |
| | | | (764 | ) | | | (659 | ) | | | (704 | ) |
| |
*Comparatives have been adjusted to reclassify amounts relating to discontinued operations
Interest income on financial instruments comprises interest income from bank deposits and other financial assets £214m (2006: £130m; 2005: £59m), interest receivable on finance leases £3m (2006: £4m; 2005: £5m) and gains, transferred from equity, on disposal of available-for-sale investments £1m (2006: £1m; 2005: £nil).
Interest expense on financial liabilities held at amortised cost comprises interest on bank loans and overdrafts £48m (2006: £33m; 2005: £45m), interest on other borrowings £768m (2006: £708m; 2005: £770m) and interest on finance leases £1m (2006: £1m; 2005: £3m).
Interest on funding attributable to assets in the course of construction was capitalised during the year at a rate of 5.6% (2006: 5.5%; 2005: 5.6%).
Interest expense and other finance costs include £45m (2006: £39m; 2005: £12m) relating to losses incurred on the repurchase of debt and £nil (2006: £10m; 2005: £nil) associated with the issue of B shares.
Derivative net gains on fair value hedges comprise a net loss on the hedging instruments of £100m (2006: £11m; 2005: £nil) offset by a net gain of £118m (2006: £1m; 2005: £nil) from the fair value adjustments to the carrying value of debt.
Net losses on derivatives not designated as hedges or ineligible for hedge accounting includes a loss of £126m (2006: £nil) relating to pre-tax losses on investment related derivative financial instruments that offset on a post-tax basis.
124National Grid plc
10. Taxation
Taxation on items charged/(credited) to the income statement
| | | | | | | | | | | | | |
| |
| | | 2007 | | | 2006 | * | | 2005 | * |
| | | £m | | | £m | | | £m | |
| |
| United Kingdom | | | | | | | | | | | | |
| Corporation tax at 30% | | | 66 | | | | 269 | | | | 22 | |
| Adjustment in respect of prior years (i) | | | (28 | ) | | | (8 | ) | | | (19 | ) |
| Deferred tax (ii) | | | 177 | | | | – | | | | 80 | |
| |
| | | | 215 | | | | 261 | | | | 83 | |
| |
| Overseas | | | | | | | | | | | | |
| Corporate tax | | | 109 | | | | 122 | | | | 33 | |
| Adjustment in respect of prior years | | | (149 | ) | | | 23 | | | | (22 | ) |
| Deferred tax (ii) | | | 266 | | | | 129 | | | | 212 | |
| |
| | | | 226 | | | | 274 | | | | 223 | |
| |
| Taxation | | | 441 | | | | 535 | | | | 306 | |
| |
| Comprising: | | | | | | | | | | | | |
| Taxation excluding exceptional items and remeasurements | | | 611 | | | | 565 | | | | 424 | |
| Taxation on exceptional items and remeasurements (note 5) | | | (170 | ) | | | (30 | ) | | | (118 | ) |
| |
| | | | 441 | | | | 535 | | | | 306 | |
| |
*Comparatives have been adjusted to reclassify amounts relating to discontinued operations
| | |
| (i) | | The UK corporation tax adjustment in respect of prior years includes £51m (2006: £nil; 2005: £10m) that relates to exceptional items and remeasurements.
|
| (ii) | | Included within the deferred tax charge is an amount relating to prior years of £73m (2006: £35m tax credit; 2005: £11m tax credit) before exceptional items and remeasurements and £68m (2006: £35m tax credit; 2005: £14m tax credit) after exceptional items and remeasurements respectively. |
Taxation on items charged/(credited) to equity
| | | | | | | | | | | | | |
| |
| | | 2007 | | | 2006 | | | 2005 | |
| | | £m | | | £m | | | £m | |
| |
| Corporation tax credit on employee share schemes | | | (2 | ) | | | – | | | | – | |
| Deferred tax charge on available-for-sale investments | | | 1 | | | | 1 | | | | – | |
| Deferred tax charge/(credit) on revaluation of cash flow hedges | | | 10 | | | | (20 | ) | | | – | |
| Deferred tax credit on employee share schemes | | | (11 | ) | | | (7 | ) | | | (4 | ) |
| Deferred tax charge on actuarial gains | | | 70 | | | | 62 | | | | 66 | |
| |
| | | | 68 | | | | 36 | | | | 62 | |
| |
| Total tax charge recognised in consolidated statement of recognised income and expense | | | 81 | | | | 43 | | | | 66 | |
| Total tax credit recognised directly in equity (note 32) | | | (13 | ) | | | (7 | ) | | | (4 | ) |
| |
| | | | 68 | | | | 36 | | | | 62 | |
| |
The tax charge for the year after exceptional items and remeasurements is lower (2006: higher; 2005: lower) than the standard rate of corporation tax in the UK (30%). The differences are explained below:
| | | | | | | | | | | | | | | | | | | | | | | | | |
| |
| | | Before | | | After | | | Before | | | After | | | Before | | | After | |
| | | exceptional | | | exceptional | | | exceptional | | | exceptional | | | exceptional | | | exceptional | |
| | | items and | | | items and | | | items and | | | items and | | | items and | | | items and | |
| | | remeasure- | | | remeasure- | | | remeasure- | | | remeasure- | | | remeasure- | | | remeasure- | |
| | | ments | | | ments | | | ments | | | ments | | | ments | | | ments | |
| | | 2007 | | | 2007 | | | 2006 | * | | 2006 | * | | 2005 | * | | 2005 | * |
| | | £m | | | £m | | | £m | | | £m | | | £m | | | £m | |
| |
| Profit before taxation | | | | | | | | | | | | | | | | | | | | | | | | |
| Before exceptional items and remeasurements | | | 1,909 | | | | 1,909 | | | | 1,858 | | | | 1,858 | | | | 1,700 | | | | 1,700 | |
| Exceptional items and remeasurements | | | – | | | | (158 | ) | | | – | | | | (140 | ) | | | – | | | | (288 | ) |
| |
| Profit before taxation from continuing operations | | | 1,909 | | | | 1,751 | | | | 1,858 | | | | 1,718 | | | | 1,700 | | | | 1,412 | |
| |
| Profit on continuing operations multiplied by rate of corporation tax in the UK of 30% (2006: 30%; 2005: 30%) | | | 573 | | | | 525 | | | | 557 | | | | 515 | | | | 510 | | | | 424 | |
| Effects of: | | | | | | | | | | | | | | | | | | | | | | | | |
| Adjustments in respect of previous years | | | (53 | ) | | | (109 | ) | | | (16 | ) | | | (12 | ) | | | (41 | ) | | | (54 | ) |
| Expenses not deductible for tax purposes | | | 44 | | | | 111 | | | | 84 | | | | 108 | | | | 85 | | | | 47 | |
| Non-taxable income | | | (61 | ) | | | (154 | ) | | | (178 | ) | | | (180 | ) | | | (170 | ) | | | (120 | ) |
| Adjustment in respect of foreign tax rates | | | 64 | | | | 70 | | | | 68 | | | | 58 | | | | 37 | | | | 22 | |
| Impact of employee share schemes | | | 9 | | | | 9 | | | | (5 | ) | | | (5 | ) | | | (2 | ) | | | (2 | ) |
| Other | | | 35 | | | | (11 | ) | | | 55 | | | | 51 | | | | 5 | | | | (11 | ) |
| |
| Total taxation from continuing operations | | | 611 | | | | 441 | | | | 565 | | | | 535 | | | | 424 | | | | 306 | |
| |
| | | | | | | | | | | | | | | | | | | | | | | | | |
| |
| | | | % | | | | % | | | | % | | | | % | | | | % | | | | % | |
| |
| At the effective income tax rate | | | 32.0 | | | | 25.2 | | | | 30.4 | | | | 31.1 | | | | 24.9 | | | | 21.7 | |
| |
*Comparatives have been adjusted to reclassify amounts relating to discontinued operations
Factors that may affect future tax charges
The UK rate of corporation tax is expected to decrease from the current rate of 30% to 28% in 2008/2009. We are in the process of evaluating the impact this tax rate will have on our future tax charge.
There are £nil (2006: £nil; 2005: £39m) non-trade deficits recognised and carried forward in the year.
Annual Report and Accounts 2006/07125
11. Discontinued operations
During the year, our wireless infrastructure operations in the UK and US and Australian interconnector were reclassified as businesses held for sale in the expectation that they will be disposed of during the year ending 31 March 2008. The wireless infrastructure business in the UK was sold on 3 April 2007. During the year ended 31 March 2006 holdings in four of the eight UK gas distribution networks were disposed of. During August 2004, the Argentinian joint venture, Citelec was disposed of.
Results of discontinued operations
| | | | | | | | | | | | | |
| |
| | | 2007 | | | 2006 | | | 2005 | |
| | | £m | | | £m | | | £m | |
| |
| Revenue | | | 383 | | | | 493 | | | | 1,313 | |
| Operating costs | | | (321 | ) | | | (382 | ) | | | (848 | ) |
| |
| Operating profit before exceptional items | | | 117 | | | | 131 | | | | 552 | |
| Exceptional items (i) | | | (55 | ) | | | (20 | ) | | | (87 | ) |
Total operating profit from discontinued operations | | | 62 | | | | 111 | | | | 465 | |
| Net finance costs before remeasurement finance income | | | (2 | ) | | | (4 | ) | | | (2 | ) |
| Remeasurement finance income (ii) | | | 37 | | | | – | | | | – | |
| Share of post-tax results of joint venture | | | – | | | | – | | | | (5 | ) |
| |
Profit before tax from discontinued operations | | | 97 | | | | 107 | | | | 458 | |
| Taxation | | | (11 | ) | | | (45 | ) | | | (153 | ) |
| |
Profit after tax from discontinued operations | | | 86 | | | | 62 | | | | 305 | |
| |
| | | | | | | | | | | | | |
| Gain on disposal of gas distribution networks | | | – | | | | 2,636 | | | | – | |
| Gain on disposal of joint venture | | | – | | | | – | | | | 13 | |
| |
Gain on disposal of discontinued operations before tax | | | – | | | | 2,636 | | | | 13 | |
| Taxation | | | – | | | | (31 | ) | | | – | |
| |
Gain on disposal of discontinued operations | | | – | | | | 2,605 | | | | 13 | |
| |
| | | | | | | | | | | | | |
Total profit for the year from discontinued operations | | | | | | | | | | | | |
| Before exceptional items and remeasurements | | | 104 | | | | 77 | | | | 379 | |
| Exceptional items and remeasurements | | | (18 | ) | | | 2,590 | | | | (61 | ) |
| |
| | | | 86 | | | | 2,667 | | | | 318 | |
| |
| | |
| (i) | | The operating exceptional item for the year ended 31 March 2007 related to an impairment of goodwill within US wireless infrastructure operations. Operating exceptional items for the year ended 31 March 2006 related to a fine (£15m) incurred in respect of a breach of health and safety laws in 1999 and to restructuring costs (£5m). Operating exceptional items for the year ended 31 March 2005 related to restructuring costs (£83m) and to environmental costs (£4m).
|
| (ii) | | Remeasurement finance income for the year ended 31 March 2007 comprised £24m relating to the recognition of gains on the termination of a hedging arrangement and to £13m of subsequent mark-to-market gains. |
The following assets and liabilities relate to businesses held for sale at 31 March 2007. There were no businesses held for sale at
31 March 2006.
| | | | | |
| |
| | | 2007 | |
| | | £m | |
| |
Non-current assets | | | | |
| Goodwill | | | 573 | |
| Other intangible assets | | | 206 | |
| Property, plant and equipment | | | 1,003 | |
| Other receivables | | | 9 | |
| |
| Non-current assets | | | 1,791 | |
| |
Current assets | | | | |
| Inventories | | | 3 | |
| Derivative financial assets | | | 39 | |
| Trade and other receivables | | | 112 | |
| Cash and cash equivalents | | | 23 | |
| |
| Current assets | | | 177 | |
| |
Assets of businesses held for sale | | | 1,968 | |
| |
Current liabilities | | | | |
| Trade and other payables | | | (198 | ) |
| Current tax liabilities | | | (1 | ) |
| Provisions | | | (1 | ) |
| |
| Total current liabilities | | | (200 | ) |
| |
Non-current liabilities | | | | |
| Borrowings | | | (20 | ) |
| Other non-current liabilities | | | (78 | ) |
| Deferred tax liabilities | | | (124 | ) |
| Pensions and post-retirement obligations | | | (2 | ) |
| Provisions | | | (26 | ) |
| |
| Non-current liabilities | | | (250 | ) |
| |
Liabilities of businesses held for sale | | | (450 | ) |
| |
126National Grid plc
12. Dividends
The following table shows the dividends paid to equity shareholders:
| | | | | | | | | | | | | | | | | | | | | | | | | |
| |
| | | 2007 | | | | | | | 2006 | | | | | | | 2005 | | | | |
| | | pence | | | | | | | pence | | | | | | | pence | | | | |
| | | (per ordinary | | | 2007 | | | (per ordinary | | | 2006 | | | (per ordinary | | | 2005 | |
| | | share | ) | | £m | | | share | ) | | £m | | | share | ) | | £m | |
| |
Ordinary dividends | | | | | | | | | | | | | | | | | | | | | | | | |
| Interim dividend for the year ended 31 March 2007 | | | 10.9 | | | | 297 | | | | – | | | | – | | | | – | | | | – | |
| Final dividend for the year ended 31 March 2006 | | | 15.9 | | | | 433 | | | | – | | | | – | | | | – | | | | – | |
| Interim dividend for the year ended 31 March 2006 | | | – | | | | – | | | | 10.2 | | | | 276 | | | | – | | | | – | |
| Final dividend for the year ended 31 March 2005 | | | – | | | | – | | | | 15.2 | | | | 469 | | | | – | | | | – | |
| Interim dividend for the year ended 31 March 2005 | | | – | | | | – | | | | – | | | | – | | | | 8.5 | | | | 262 | |
| Final dividend for the year ended 31 March 2004 | | | – | | | | – | | | | – | | | | – | | | | 11.9 | | | | 366 | |
| |
| | | | 26.8 | | | | 730 | | | | 25.4 | | | | 745 | | | | 20.4 | | | | 628 | |
| |
In addition, the Directors are proposing a final dividend for 2007 of 17.8p per share that will absorb £481m of shareholders’ equity. It will be paid on 22 August 2007 to shareholders who are on the register of members at 8 June 2007.
13. Earnings per share
Earnings per ordinary share have been calculated by dividing the profit for the year attributable to equity shareholders of the parent company by the weighted average number of ordinary shares in issue during the year.
Adjusted earnings per share, excluding exceptional items and remeasurements, are provided to reflect the business performance measures used by the Company as described in Accounting polices (r) Business performance, exceptional items and remeasurements. Further details of exceptional items and remeasurements can be found in note 5 to the accounts.
a) Basic earnings per share
| | | | | | | | | | | | | | | | | | | | | | | | | |
| |
| | | | | | | Earnings | | | | | | | Earnings | | | | | | | Earnings | |
| | | Earnings | | | per share | | | Earnings | | | per share | | | Earnings | | | per share | |
| | | 2007 | | | 2007 | | | 2006 | * | | 2006 | * | | 2005 | * | | 2005 | * |
| | | £m | | | pence | | | £m | | | pence | | | £m | | | pence | |
| |
Adjusted earnings – continuing operations | | | 1,296 | | | | 47.7 | | | | 1,291 | | | | 45.5 | | | | 1,276 | | | | 41.4 | |
| Exceptional items after taxation | | | (41 | ) | | | (1.5 | ) | | | (61 | ) | | | (2.2 | ) | | | (147 | ) | | | (4.8 | ) |
| Commodity contract remeasurements after taxation | | | 37 | | | | 1.3 | | | | (38 | ) | | | (1.3 | ) | | | (23 | ) | | | (0.7 | ) |
| Derivative financial instruments remeasurements after taxation | | | 16 | | | | 0.6 | | | | (11 | ) | | | (0.4 | ) | | | �� | | | | – | |
| |
Earnings – continuing operations | | | 1,308 | | | | 48.1 | | | | 1,181 | | | | 41.6 | | | | 1,106 | | | | 35.9 | |
| |
Adjusted earnings – discontinued operations | | | 104 | | | | 3.8 | | | | 77 | | | | 2.7 | | | | 379 | | | | 12.3 | |
| Gain on disposal of gas distribution networks after taxation | | | – | | | | – | | | | 2,605 | | | | 91.8 | | | | – | | | | – | |
| Other exceptional items after taxation | | | (18 | ) | | | (0.6 | ) | | | (15 | ) | | | (0.5 | ) | | | (61 | ) | | | (2.0 | ) |
| |
Earnings – discontinued operations | | | 86 | | | | 3.2 | | | | 2,667 | | | | 94.0 | | | | 318 | | | | 10.3 | |
| |
Basic earnings | | | 1,394 | | | | 51.3 | | | | 3,848 | | | | 135.6 | | | | 1,424 | | | | 46.2 | |
| |
| | | | | | | | | | | | | | | | | | | | | | | | | |
| |
| | | | | | | 2007 | | | | | | | 2006 | | | | | | | 2005 | |
| | | | | | | millions | | | | | | | millions | | | | | | | millions | |
| |
| Weighted average number of shares – basic | | | | | | | 2,719 | | | | | | | | 2,837 | | | | | | | | 3,082 | |
| |
*Comparatives have been adjusted to reclassify amounts relating to discontinued operations
b) Diluted earnings per share
| | | | | | | | | | | | | | | | | | | | | | | | | |
| |
| | | | | | | Earnings | | | | | | | Earnings | | | | | | | Earnings | |
| | | Earnings | | | per share | | | Earnings | | | per share | | | Earnings | | | per share | |
| | | 2007 | | | 2007 | | | 2006 | * | | 2006 | * | | 2005 | * | | 2005 | * |
| | | £m | | | pence | | | £m | | | pence | | | £m | | | pence | |
| |
Adjusted diluted earnings – continuing operations | | | 1,296 | | | | 47.4 | | | | 1,291 | | | | 45.3 | | | | 1,276 | | | | 41.2 | |
| Exceptional items after taxation | | | (41 | ) | | | (1.5 | ) | | | (61 | ) | | | (2.2 | ) | | | (147 | ) | | | (4.8 | ) |
| Commodity contract remeasurements after taxation | | | 37 | | | | 1.3 | | | | (38 | ) | | | (1.3 | ) | | | (23 | ) | | | (0.7 | ) |
| Derivative financial instruments remeasurements after taxation | | | 16 | | | | 0.6 | | | | (11 | ) | | | (0.4 | ) | | | – | | | | – | |
| |
Diluted earnings – continuing operations | | | 1,308 | | | | 47.8 | | | | 1,181 | | | | 41.4 | | | | 1,106 | | | | 35.7 | |
| |
Adjusted diluted earnings – discontinued operations | | | 104 | | | | 3.8 | | | | 77 | | | | 2.7 | | | | 379 | | | | 12.3 | |
| Gain on disposal of gas distribution networks after taxation | | | – | | | | – | | | | 2,605 | | | | 91.4 | | | | – | | | | – | |
| Other exceptional items after taxation | | | (18 | ) | | | (0.7 | ) | | | (15 | ) | | | (0.5 | ) | | | (61 | ) | | | (2.0 | ) |
| |
Diluted earnings – discontinued operations | | | 86 | | | | 3.1 | | | | 2,667 | | | | 93.6 | | | | 318 | | | | 10.3 | |
| |
Diluted earnings | | | 1,394 | | | | 50.9 | | | | 3,848 | | | | 135.0 | | | | 1,424 | | | | 46.0 | |
| |
| | | | | | | | | | | | | | | | | | | | | | | | | |
| |
| | | | | | | 2007 | | | | | | | 2006 | | | | | | | 2005 | |
| | | | | | | millions | | | | | | | millions | | | | | | | millions | |
| |
| Weighted average number of shares – diluted | | | | | | | 2,737 | | | | | | | | 2,851 | | | | | | | | 3,096 | |
| |
*Comparatives have been adjusted to reclassify amounts relating to discontinued operations
Annual Report and Accounts 2006/07127
14. Goodwill
| | | | | |
| |
| | | £m | |
| |
| Cost at 1 April 2005 | | | 2,045 | |
| Exchange adjustments | | | 111 | |
| |
| Cost at 31 March 2006 | | | 2,156 | |
| Exchange adjustments | | | (192 | ) |
| Acquisition of subsidiary undertakings | | | 157 | |
| Reclassification to assets of businesses held for sale | | | (641 | ) |
| |
| Cost at 31 March 2007 | | | 1,480 | |
| |
| | | | | |
| Accumulated impairment losses at 1 April 2005 and 1 April 2006 | | | 14 | |
| Exchange adjustments | | | (1 | ) |
| Impairment charge | | | 55 | |
| Reclassification to assets of businesses held for sale | | | (68 | ) |
| |
| Accumulated impairment losses at 31 March 2007 | | | – | |
| |
Net book value at 31 March 2007 | | | 1,480 | |
| |
| Net book value at 31 March 2006 | | | 2,142 | |
| |
Goodwill is reviewed annually for impairment. The amounts disclosed above as at 31 March 2007 include balances relating to our operations in New England of £915m (2006: £882m; 2005: £823m) and New York of £565m (2006: £639m; 2005: £592m).
Within the New England and New York operations, goodwill is allocated to the individual subsidiary companies. These are defined as cash generating units for impairment testing purposes. The recoverability of the goodwill as at 31 March 2007 that relates entirely to the New England and New York operations has been assessed by comparing the carrying value of these operations with the recoverable amount on a value-in-use basis. This has been calculated based on projections that incorporate our best estimates of future cash flows, customer rates, costs, future prices, growth, operating costs and the cash flows, prepared from internal forecasts for the next five years extrapolated into the future by using a 2% growth rate. Cash flow projections have been discounted to reflect the time value of money, using a discount rate of 6%. The discount rate is the post-tax weighted average cost of capital. On a pre-tax basis it is estimated that the discount rate would be approximately 10%.
Goodwill with respect to wireless infrastructure operations in the UK of £557m (2006: £557m; 2005: £557m) has been reclassified to assets of businesses held for sale as at 31 March 2007, as has goodwill with respect to our US wireless infrastructure operations of £16m (2006: £64m; 2005: £59m). The impairment charge for the year ended 31 March 2007 relates entirely to discontinued operations.
The recoverable amount of the goodwill relating to wireless infrastructure operations in the UK has been based on an assessment of the fair value of the operation. This has been determined by considering other recent transactions and external information on valuations placed on similar wireless infrastructure businesses, including National Grid Wireless. The key assumption used relates to the earnings multiples that might be applicable in the purchase or sale of wireless infrastructure networks.
128National Grid plc
15. Acquisitions
On 24 August 2006, the acquisition from Southern Union Company of its Rhode Island gas distribution network was completed for total consideration of £269m, including acquisition costs of £3m. The goodwill arising on the acquisition was £144m. Goodwill principally relates to synergies, cost improvements, market and regulatory position, the assembled workforce and the potential for future growth.
The acquired operations form part of the Gas Distribution business and are presented within the Gas Distribution – US segment.
Other acquisitions that were carried out during the year ended 31 March 2007 were those of telecommunications tower operations in the US. The book and fair value of assets acquired was £72m compared with total cash consideration of £85m, giving rise to goodwill of £13m. Following the decision by management to exit our wireless infrastructure operations these acquisitions have been reported within discontinued operations and are presented in the balance sheet as businesses held for sale.
| | | | | | | | | | | | | | | | | | | | | |
| |
| | | | | | | | | | | | | | | Other | | | | |
| | | Rhode Island gas acquisition | | | acquisitions | | | | |
| | | Book | | | | | | | | | | | | | |
| | | value at | | | | | | | | | | | | | |
| | | acquisition | | | Fair value | | | Final | | | Book and | | | Total | |
| | | under IFRS | | | adjustments | | | fair value | | | fair value | | | fair value | |
| | | £m | | | £m | | | £m | | | £m | | | £m | |
| |
| Intangible assets | | | 9 | | | | – | | | | 9 | | | | 46 | | | | 55 | |
| Property, plant and equipment | | | 141 | | | | 1 | | | | 142 | | | | 28 | | | | 170 | |
| Inventories | | | 19 | | | | – | | | | 19 | | | | – | | | | 19 | |
| Trade and other receivables | | | 39 | | | | – | | | | 39 | | | | 1 | | | | 40 | |
| Deferred tax assets | | | 4 | | | | 7 | | | | 11 | | | | – | | | | 11 | |
| Current liabilities | | | (20 | ) | | | – | | | | (20 | ) | | | (3 | ) | | | (23 | ) |
| Borrowings | | | (41 | ) | | | (7 | ) | | | (48 | ) | | | – | | | | (48 | ) |
| Pensions and other post-retirement benefit obligations | | | (25 | ) | | | 6 | | | | (19 | ) | | | – | | | | (19 | ) |
| Provisions | | | (2 | ) | | | (6 | ) | | | (8 | ) | | | – | | | | (8 | ) |
| |
| Net assets acquired | | | 124 | | | | 1 | | | | 125 | | | | 72 | | | | 197 | |
| | | | | | | | | | | | | |
| Goodwill arising on acquisition | | | | | | | | | | | 144 | | | | 13 | | | | 157 | |
| | | | | | | | | | | |
| Total consideration | | | | | | | | | | | 269 | | | | 85 | | | | 354 | |
| | | | | | | | | | | |
Fair value adjustments primarily related to the revaluation of pensions and other post-retirement obligations, provisions and borrowings to their fair value at the date of acquisition. The fair values of the assets and liabilities acquired have been updated from the provisional fair values reported in our half year results for the six months ended 30 September 2006. Deferred tax assets on these adjustments amounted to £7m.
The outflow of cash and cash equivalents on the acquisitions in 2007 was as follows:
| | | | | | | | | | | | | |
| |
| | | Rhode Island | | | Other | | | | |
| | | gas | | | acquisitions | | | Total | |
| | | £m | | | £m | | | £m | |
| |
| Cash consideration | | | 269 | | | | 85 | | | | 354 | |
| |
In the consolidated income statement for the year ended 31 March 2007 the operating profit of the Rhode Island gas distribution network was £17m representing the post-acquisition results for the acquired business. If the Rhode Island gas distribution network had been acquired on 1 April 2006, the results would not have been materially different.
Annual Report and Accounts 2006/07129
16. Other intangible assets
| | | | | | | | | | | | | | | | | |
| |
| | | | | | | Customer | | | | | | | |
| | | Software | | | relationships | | | Other | | | Total | |
| | | £m | | | £m | | | £m | | | £m | |
| |
Non-current | | | | | | | | | | | | | | | | |
| Cost at 1 April 2005 | | | 273 | | | | 164 | | | | 32 | | | | 469 | |
| Exchange adjustments | | | 8 | | | | – | | | | – | | | | 8 | |
| Additions | | | 14 | | | | – | | | | 1 | | | | 15 | |
| Disposals | | | (3 | ) | | | – | | | | – | | | | (3 | ) |
| |
| Cost at 31 March 2006 | | | 292 | | | | 164 | | | | 33 | | | | 489 | |
| Exchange adjustments | | | (5 | ) | | | – | | | | (5 | ) | | | (10 | ) |
| Acquisition of subsidiary undertakings | | | – | | | | – | | | | 55 | | | | 55 | |
| Additions | | | 20 | | | | – | | | | 12 | | | | 32 | |
| Reclassification to assets of businesses held for sale | | | (21 | ) | | | (164 | ) | | | (71 | ) | | | (256 | ) |
| |
| Cost at 31 March 2007 | | | 286 | | | | – | | | | 24 | | | | 310 | |
| |
| | | | | | | | | | | | | | | | | |
| Amortisation at 1 April 2005 | | | 97 | | | | 6 | | | | 8 | | | | 111 | |
| Exchange adjustments | | | 3 | | | | – | | | | – | | | | 3 | |
| Amortisation charge for the year (i) | | | 45 | | | | 11 | | | | 1 | | | | 57 | |
| Disposals | | | (3 | ) | | | – | | | | – | | | | (3 | ) |
| |
| Amortisation at 31 March 2006 | | | 142 | | | | 17 | | | | 9 | | | | 168 | |
| Exchange adjustments | | | (3 | ) | | | – | | | | (3 | ) | | | (6 | ) |
| Amortisation charge for the year (i) | | | 38 | | | | 11 | | | | 5 | | | | 54 | |
| Reclassification to assets of businesses held for sale | | | (12 | ) | | | (28 | ) | | | (10 | ) | | | (50 | ) |
| |
| Amortisation at 31 March 2007 | | | 165 | | | | – | | | | 1 | | | | 166 | |
| |
Net book value at 31 March 2007 | | | 121 | | | | – | | | | 23 | | | | 144 | |
| |
| Net book value at 31 March 2006 | | | 150 | | | | 147 | | | | 24 | | | | 321 | |
| |
| (i) | | Includes amounts in respect of discontinued operations of £13m (2006: £13m). |
| | | | | |
| Expected amortisation of intangible assets for the next five years ending 31 March is: | | £m | |
| |
| 2008 | | | 47 | |
| 2009 | | | 49 | |
| 2010 | | | 25 | |
| 2011 | | | 15 | |
| 2012 | | | 8 | |
| |
Current other intangible assets consist of emissions allowances of £2m (2006: £41m).
130National Grid plc
17. Property, plant and equipment
| | | | | | | | | | | | | | | | | | | | | |
| |
| | | | | | | | | | | Assets | | | Motor | | | | |
| | | | | | | Plant | | | in the | | | vehicles | | | | |
| | | Land and | | | and | | | course of | | | and office | | | | |
| | | buildings | | | machinery | | | construction | | | equipment | | | Total | |
| | | £m | | | £m | | | £m | | | £m | | | £m | |
| |
| Cost at 1 April 2005 | | | 911 | | | | 30,816 | | | | 1,269 | | | | 809 | | | | 33,805 | |
| Exchange adjustments | | | 35 | | | | 562 | | | | 12 | | | | 1 | | | | 610 | |
| Additions | | | 65 | | | | 588 | | | | 1,339 | | | | 101 | | | | 2,093 | |
| Disposal of subsidiary undertakings | | | (30 | ) | | | (6,976 | ) | | | (9 | ) | | | (253 | ) | | | (7,268 | ) |
| Other disposals | | | (25 | ) | | | (128 | ) | | | – | | | | (18 | ) | | | (171 | ) |
| Reclassifications | | | 18 | | | | 840 | | | | (895 | ) | | | 37 | | | | – | |
| |
| Cost at 31 March 2006 | | | 974 | | | | 25,702 | | | | 1,716 | | | | 677 | | | | 29,069 | |
| Exchange adjustments | | | (53 | ) | | | (841 | ) | | | (27 | ) | | | (1 | ) | | | (922 | ) |
| Additions | | | 16 | | | | 604 | | | | 1,611 | | | | 112 | | | | 2,343 | |
| Acquisition of subsidiary undertakings | | | 12 | | | | 157 | | | | 1 | | | | – | | | | 170 | |
| Reclassification to assets of businesses held for sale | | | (152 | ) | | | (1,292 | ) | | | (2 | ) | | | (22 | ) | | | (1,468 | ) |
| Other disposals | | | (57 | ) | | | (112 | ) | | | – | | | | (36 | ) | | | (205 | ) |
| Other reclassifications | | | 38 | | | | 1,248 | | | | (1,327 | ) | | | 41 | | | | – | |
| |
| Cost at 31 March 2007 | | | 778 | | | | 25,466 | | | | 1,972 | | | | 771 | | | | 28,987 | |
| |
| | | | | | | | | | | | | | | | | | | | | |
| Depreciation at 1 April 2005 | | | 282 | | | | 10,286 | | | | – | | | | 592 | | | | 11,160 | |
| Exchange adjustments | | | 7 | | | | 200 | | | | – | | | | – | | | | 207 | |
| Depreciation charge for the year (i) | | | 17 | | | | 816 | | | | – | | | | 75 | | | | 908 | |
| Disposal of subsidiary undertakings | | | (13 | ) | | | (1,781 | ) | | | – | | | | (200 | ) | | | (1,994 | ) |
| Other disposals | | | (9 | ) | | | (121 | ) | | | – | | | | (17 | ) | | | (147 | ) |
| |
| Depreciation at 31 March 2006 | | | 284 | | | | 9,400 | | | | – | | | | 450 | | | | 10,134 | |
| Exchange adjustments | | | (10 | ) | | | (311 | ) | | | – | | | | (1 | ) | | | (322 | ) |
| Depreciation charge for the year (i) | | | 18 | | | | 801 | | | | – | | | | 70 | | | | 889 | |
| Reclassification to assets of businesses held for sale | | | (97 | ) | | | (350 | ) | | | – | | | | (18 | ) | | | (465 | ) |
| Other disposals | | | (3 | ) | | | (107 | ) | | | – | | | | (34 | ) | | | (144 | ) |
| |
| Depreciation at 31 March 2007 | | | 192 | | | | 9,433 | | | | – | | | | 467 | | | | 10,092 | |
| |
Net book value at 31 March 2007 | | | 586 | | | | 16,033 | | | | 1,972 | | | | 304 | | | | 18,895 | |
| |
| Net book value at 31 March 2006 | | | 690 | | | | 16,302 | | | | 1,716 | | | | 227 | | | | 18,935 | |
| |
| (i) | | Includes amounts in respect of discontinued operations of £59m (2006: £64m). |
The net book value of land and buildings comprised:
| | | | | | | | | |
| |
| | | 2007 | | | 2006 | |
| | | £m | | | £m | |
| |
| Freehold | | | 540 | | | | 649 | |
| Long leasehold (over 50 years) | | | 13 | | | | 13 | |
| Short leasehold (under 50 years) | | | 33 | | | | 28 | |
| |
| | | | 586 | | | | 690 | |
| |
The cost of property, plant and equipment at 31 March 2007 included £565m (2006: £504m) relating to interest capitalised.
Included within trade and other payables and other non-current liabilities at 31 March 2007 are contributions to the cost of property, plant and equipment amounting to £28m (2006: £31m) and £1,079m (2006: £1,018m) respectively.
The carrying value of property, plant and equipment held under finance leases at 31 March 2007 was £107m (2006: £134m). Additions during the year include £1m (2006: £31m) of property, plant and equipment held under finance leases.
18. Investments in joint ventures
| | | | | |
| |
| | | £m | |
| |
| At 1 April 2005 | | | 17 | |
| Exchange adjustments | | | 2 | |
| Disposals | | | (2 | ) |
| Share of retained profit | | | 3 | |
| Dividends received | | | (2 | ) |
| Impairment provision written back (i) | | | 13 | |
| Reclassification | | | (19 | ) |
| |
| At 31 March 2006 | | | 12 | |
| Exchange adjustments | | | (1 | ) |
| Disposals | | | (8 | ) |
| Share of retained profit | | | 2 | |
| |
At 31 March 2007 | | | 5 | |
| |
| (i) | | For the year ended 31 March 2006, a £13m reversal of impairment in the investment in National Grid’s joint venture, Copperbelt Energy Corporation (CEC) was recorded. As at 31 March 2006, National Grid had agreed, but not completed, the sale of its interest in CEC at a price that was £13m higher than the net carrying value of the investment after prior year impairments. As the sales process was at an advanced stage and there was a strong indication of an increase in the investment’s external market value, a reversal of impairment was recognised in accordance with IAS 36 and IFRS 5. CEC was disposed of on 27 October 2006. |
Annual Report and Accounts 2006/07131
19. Deferred tax assets and liabilities
The following are the major deferred tax assets and liabilities recognised, and the movements thereon, during the current and prior reporting periods:
Deferred tax (assets)/liabilities
| | | | | | | | | | | | | | | | | | | | | | | | | |
| |
| | | | | | | | | | | Pensions | | | | | | | | | | | |
| | | | | | | | | | | and other | | | | | | | | | | | |
| | | Accelerated | | | Employee | | | post- | | | | | | | Other net | | | | |
| | | tax | | | share | | | retirement | | | Financial | | | temporary | | | | |
| | | depreciation | | | options | | | benefits | | | instruments | | | differences | | | Total | |
| | | £m | | | £m | | | £m | | | £m | | | £m | | | £m | |
| |
| Deferred tax assets at 31 March 2005 | | | – | | | | (18 | ) | | | (462 | ) | | | – | | | | (931 | ) | | | (1,411 | ) |
| Deferred tax liabilities at 31 March 2005 | | | 4,098 | | | | – | | | | – | | | | – | | | | 184 | | | | 4,282 | |
| |
| At 31 March 2005 | | | 4,098 | | | | (18 | ) | | | (462 | ) | | | – | | | | (747 | ) | | | 2,871 | |
| First time adoption of IAS 39 | | | – | | | | – | | | | – | | | | 38 | | | | (54 | ) | | | (16 | ) |
| |
| At 1 April 2005 | | | 4,098 | | | | (18 | ) | | | (462 | ) | | | 38 | | | | (801 | ) | | | 2,855 | |
| Exchange adjustments | | | 60 | | | | – | | | | (10 | ) | | | – | | | | (72 | ) | | | (22 | ) |
| Charged/(credited) to income statement | | | 31 | | | | (3 | ) | | | 25 | | | | (4 | ) | | | 130 | | | | 179 | |
| (Credited)/charged to equity | | | – | | | | (7 | ) | | | 62 | | | | (20 | ) | | | 1 | | | | 36 | |
| Disposal of subsidiary undertakings | | | (1,068 | ) | | | – | | | | – | | | | – | | | | 9 | | | | (1,059 | ) |
| Other | | | – | | | | – | | | | (12 | ) | | | – | | | | 25 | | | | 13 | |
| |
| At 31 March 2006 | | | 3,121 | | | | (28 | ) | | | (397 | ) | | | 14 | | | | (708 | ) | | | 2,002 | |
| |
| Deferred tax assets at 31 March 2006 | | | (5 | ) | | | (28 | ) | | | (397 | ) | | | (6 | ) | | | (835 | ) | | | (1,271 | ) |
| Deferred tax liabilities at 31 March 2006 | | | 3,126 | | | | – | | | | – | | | | 20 | | | | 127 | | | | 3,273 | |
| |
| At 1 April 2006 | | | 3,121 | | | | (28 | ) | | | (397 | ) | | | 14 | | | | (708 | ) | | | 2,002 | |
| Exchange adjustments | | | (90 | ) | | | – | | | | 13 | | | | – | | | | 91 | | | | 14 | |
| Charged/(credited) to income statement | | | 321 | | | | 9 | | | | 82 | | | | (9 | ) | | | 54 | | | | 457 | |
| (Credited)/charged to equity | | | – | | | | (11 | ) | | | 70 | | | | 11 | | | | – | | | | 70 | |
| Acquisition of subsidiary undertakings | | | – | | | | – | | | | 2 | | | | – | | | | (13 | ) | | | (11 | ) |
| Reclassification to liabilities of businesses held for sale | | | (129 | ) | | | 1 | | | | 1 | | | | – | | | | 3 | | | | (124 | ) |
| Other | | | 63 | | | | – | | | | (238 | ) | | | 5 | | | | 151 | | | | (19 | ) |
| |
At 31 March 2007 | | | 3,286 | | | | (29 | ) | | | (467 | ) | | | 21 | | | | (422 | ) | | | 2,389 | |
| |
| Deferred tax assets at 31 March 2007 | | | (4 | ) | | | (29 | ) | | | (532 | ) | | | (9 | ) | | | (452 | ) | | | (1,026 | ) |
| Deferred tax liabilities at 31 March 2007 | | | 3,290 | | | | – | | | | 65 | | | | 30 | | | | 30 | | | | 3,415 | |
| |
| | | | 3,286 | | | | (29 | ) | | | (467 | ) | | | 21 | | | | (422 | ) | | | 2,389 | |
| |
Deferred tax charged to the income statement includes £14m (2006: £49m; 2005: £49m) reported within profits for the year from discontinued operations.
Deferred tax assets and liabilities are only offset where there is a legally enforceable right of offset and there is intention to settle the balances net. The following is an analysis of the deferred tax balances (after offset) for balance sheet purposes:
| | | | | | | | | |
| |
| | | 2007 | | | 2006 | |
| | | £m | | | £m | |
| |
| Deferred tax liabilities | | | 2,389 | | | | 2,161 | |
| Deferred tax assets | | | – | | | | (159 | ) |
| |
| | | | 2,389 | | | | 2,002 | |
| |
At the balance sheet date there were no material current deferred tax assets or liabilities (2006: £nil).
Deferred tax assets in respect of capital losses, non-trade deficits, trading losses and pre-trading expenditure have not been recognised as their future recovery is uncertain or not currently anticipated. The deferred tax assets not recognised are as follows:
| | | | | | | | | |
| |
| | | 2007 | | | 2006 | |
| | | £m | | | £m | |
| |
| Capital losses | | | 216 | | | | 338 | |
| Non-trade deficits | | | 203 | | | | 166 | |
| Trading losses | | | 3 | | | | 17 | |
| Pre-trading expenditure | | | – | | | | 9 | |
| |
The capital losses, non-trade deficits, trading losses and pre-trading expenditure are available to carry forward indefinitely. The capital losses can be offset against specific types of future capital gains, non-trade deficits against specific future non-trade profits and the trading losses and pre-trading expenditure against specific future trading profits.
The aggregate amount of temporary differences associated with the unremitted earnings of overseas subsidiaries and joint ventures for which deferred tax liabilities have not been recognised at the balance sheet date is approximately £811m (2006: £546m). No liability is recognised in respect of the differences because the Company and its subsidiaries are in a position to control the timing of the reversal of the temporary differences and it is probable that such differences will not reverse in the foreseeable future.
132National Grid plc
20. Other non-current receivables
| | | | | | | | | |
| |
| | | 2007 | | | 2006 | |
| | | £m | | | £m | |
| |
| Lease debtors | | | 15 | | | | 23 | |
| Prepayments | | | 6 | | | | 7 | |
| Other debtors | | | 15 | | | | 8 | |
| Pension asset | | | 37 | | | | – | |
| |
| | | | 73 | | | | 38 | |
| |
The fair value of other non-current receivables at 31 March 2007 was £72m (2006: £37m).
21. Financial and other investments
| | | | | | | | | |
| |
| | | 2007 | | | 2006 | |
| | | £m | | | £m | |
| |
Non-current | | | | | | | | |
| Available-for-sale investments | | | 132 | | | | 142 | |
| Loans and receivables | | | – | | | | 6 | |
| |
| | | | 132 | | | | 148 | |
| |
| | | | | | | | | |
| |
| | | 2007 | | | 2006 | |
| | | £m | | | £m | |
| |
Current | | | | | | | | |
| Available-for-sale investments | | | 1,800 | | | | 254 | |
| Loans and receivables | | | 298 | | | | 130 | |
| |
| | | | 2,098 | | | | 384 | |
| |
| Total financial and other investments | | | 2,230 | | | | 532 | |
| |
Financial and other investments include the following:
| | | | | | | | | |
| |
| | | 2007 | | | 2006 | |
| | | £m | | | £m | |
| |
| Investments in short-term UK money funds | | | 1,591 | | | | 30 | |
| UK managed investments in equity and bonds | | | 213 | | | | 254 | |
| US managed investments in equity and bonds | | | 74 | | | | 79 | |
| Bank deposits | | | 250 | | | | – | |
| Restricted cash balances | | | 44 | | | | 100 | |
| Cash surrender value of life insurance policies | | | 53 | | | | 59 | |
| Other investments | | | 5 | | | | 10 | |
| |
| | | | 2,230 | | | | 532 | |
| |
Available-for-sale investments are recorded at fair value. The carrying value of loans and receivables approximates their fair value.
The maximum exposure to credit risk at the reporting date is the fair value of the financial investments – refer to note 23 for further information on our treasury related credit risk. None of the financial investments is past due or impaired.
Included within current financial and other investments are £1,872m (2006: £100m) of floating-rate, interest-bearing investments. The remaining balance is non interest-bearing, being investments in equity securities and other similar investments.
Included within restricted cash balances is £22m (2006: £20m) in respect of cash posted by the Company and its subsidiaries under collateral agreements.
The carrying amounts of financial and other investments are denominated in the following currencies:
| | | | | | | | | |
| |
| | | 2007 | | | 2006 | |
| | | £m | | | £m | |
| |
Non-current | | | | | | | | |
| US dollar | | | 132 | | | | 148 | |
| |
| | | | 132 | | | | 148 | |
| |
Current | | | | | | | | |
| Sterling | | | 1,663 | | | | 338 | |
| US dollar | | | 345 | | | | 46 | |
| Euro | | | 61 | | | | – | |
| Other | | | 29 | | | | – | |
| |
| | | | 2,098 | | | | 384 | |
| |
Annual Report and Accounts 2006/07133
22. Derivative financial instruments
Derivatives are financial instruments that derive their value from the price of an underlying item such as interest rates, foreign exchange, credit spreads, commodities and equity or other indices. Derivatives enable their users to alter exposure to market or credit risks. We use derivatives to manage both our treasury and operational market risks.
Derivatives are carried at fair value and are shown in the balance sheet as separate totals of assets and liabilities. Asset values represent the cost of replacing all transactions with a fair value in our favour assuming that all relevant counterparties default at the same time, and that the transactions can be replaced immediately in the market. Liability values represent the cost to counterparties of replacing all their transactions with a fair value in their favour in the case of default. Derivative assets and liabilities on different transactions are only netted if the transactions are with the same counterparty, a legal right of set-off exists and the cash flows are intended to be settled on a net basis.
Treasury financial instruments
Derivatives are used for hedging purposes in the management of exposure to market risks. This enables the optimisation of the overall cost of accessing debt capital markets, and to mitigate the market risk which would otherwise arise from the maturity and other profiles of its assets and liabilities.
Hedging policies using derivative financial instruments are further explained in note 23. Derivatives that are held as hedging instruments are formally designated as hedges as defined in IAS 39. Derivatives may qualify as hedges for accounting purposes if they are fair value hedges, cash flow hedges or net investment hedges. These are described as follows:
Fair value hedges
Fair value hedges principally consist of interest rate and cross-currency swaps that are used to protect against changes in the fair value of fixed-rate, long-term financial instruments due to movements in market interest rates. For qualifying fair value hedges, all changes in the fair value of the derivative and changes in the fair value of the item in relation to the risk being hedged are recognised in the income statement. If the hedge relationship is terminated, the fair value adjustment to the hedged item continues to be reported as part of the basis of the item and is amortised to the income statement as a yield adjustment over the remainder of the hedging period.
Cash flow hedges
Exposure arises from the variability in future interest and currency cash flows on assets and liabilities which bear interest at variable rates. Interest rate and cross-currency swaps are maintained, and designated as cash flow hedges, where they qualify, to manage this exposure. Fair value changes on designated cash flow hedges are initially recognised directly in the cash flow hedge reserve, as gains or losses recognised in equity. Amounts are transferred from equity and recognised in the income statement as the income or expense is recognised on the hedged asset or liability.
Forward foreign currency contracts are used to hedge anticipated and committed future currency cash flows. Where these contracts qualify for hedge accounting they are designated as cash flow hedges. On recognition of the underlying transaction in the financial statements, the associated hedge gains and losses deferred in equity are transferred and included with the recognition of the underlying transaction.
The gains and losses on ineffective portions of such derivatives are recognised immediately in the income statement.
When a hedging instrument expires or is sold, or when a hedge no longer meets the criteria for hedge accounting, any cumulative gain or loss existing in equity at that time remains in equity and is recognised when the forecast transaction is ultimately recognised in the income statement or on the balance sheet. When a forecast transaction is no longer expected to occur, the cumulative gain or loss that was reported in equity is immediately transferred to the income statement.
Net investment hedges
Borrowings, cross-currency swaps and forward currency contracts are used in the management of the foreign exchange exposure arising from the investment in non sterling denominated subsidiaries. Where these contracts qualify for hedge accounting they are designated as net investment hedges.
The cross-currency swaps and forward foreign currency contracts are hedge accounted using the spot to spot method. The foreign exchange gain or loss on retranslation of the debt and the spot to spot movements on the cross-currency swaps and forward currency contracts are transferred to equity to offset gains or losses on translation of the net investment in the non sterling denominated subsidiaries.
Derivatives not in a formal hedge relationship
Our policy is not to use derivatives for trading purposes, however, due to the complex nature of hedge accounting under IAS 39 some derivatives may not qualify for hedge accounting, or are specifically not designated as a hedge where natural offset is more appropriate.
Changes in the fair value of any derivative instruments that do not qualify for hedge accounting are recognised immediately in the income statement within interest expense and other finance costs.
Operational financial instruments
Commodity derivatives are used to manage commodity prices associated with our commodity delivery operations. Information regarding our commodity contracts is shown in notes 28 and 29.
134National Grid plc
22. Derivative financial instruments (continued)
Our use of derivatives may entail a derivative transaction qualifying for one or more hedge type designations under IAS 39. The fair value and their notional amounts by designated hedge type can be analysed as follows:
| | | | | | | | | | | | | | | | | | | | | | | | | | | | | | | | | |
| |
| | | 2007 | | | 2006 | |
| | | Asset | | | Liability | | | Asset | | | Liability | |
| | | Fair value | | | Notional | | | Fair value | | | Notional | | | Fair value | | | Notional | | | Fair value | | | Notional | |
| | | £m | | | £m | | | £m | | | £m | | | £m | | | £m | | | £m | | | £m | |
| |
Fair value hedges | | | | | | | | | | | | | | | | | | | | | | | | | | | | | | | | |
| Interest rate swaps | | | 16 | | | | (555 | ) | | | (30 | ) | | | (1,208 | ) | | | 92 | | | | (1,408 | ) | | | (9 | ) | | | (908 | ) |
| Cross-currency interest rate swaps | | | 50 | | | | (859 | ) | | | (137 | ) | | | (1,541 | ) | | | 146 | | | | (1,453 | ) | | | (72 | ) | | | (755 | ) |
| |
| | | | 66 | | | | (1,414 | ) | | | (167 | ) | | | (2,749 | ) | | | 238 | | | | (2,861 | ) | | | (81 | ) | | | (1,663 | ) |
| |
Cash flow hedges | | | | | | | | | | | | | | | | | | | | | | | | | | | | | | | | |
| Interest rate swaps | | | 15 | | | | (996 | ) | | | (6 | ) | | | (305 | ) | | | 80 | | | | (436 | ) | | | (16 | ) | | | (685 | ) |
| Cross-currency interest rate swaps | | | 69 | | | | (1,418 | ) | | | (25 | ) | | | (829 | ) | | | 112 | | | | (1,745 | ) | | | (22 | ) | | | (804 | ) |
| Foreign exchange forward contracts | | | – | | | | (45 | ) | | | – | | | | (39 | ) | | | 3 | | | | (78 | ) | | | (3 | ) | | | 24 | |
| |
| | | | 84 | | | | (2,459 | ) | | | (31 | ) | | | (1,173 | ) | | | 195 | | | | (2,259 | ) | | | (41 | ) | | | (1,465 | ) |
| |
Net investment hedges | | | | | | | | | | | | | | | | | | | | | | | | | | | | | | | | |
| Cross-currency interest rate swaps | | | 270 | | | | (1,651 | ) | | | (32 | ) | | | (524 | ) | | | 210 | | | | (2,639 | ) | | | (56 | ) | | | (1,090 | ) |
| Foreign exchange forward contracts | | | 4 | | | | (791 | ) | | | (13 | ) | | | (1,338 | ) | | | – | | | | 37 | | | | – | | | | 27 | |
| |
| | | | 274 | | | | (2,442 | ) | | | (45 | ) | | | (1,862 | ) | | | 210 | | | | (2,602 | ) | | | (56 | ) | | | (1,063 | ) |
| |
Derivatives not in a formal hedge relationship | | | | | | | | | | | | | | | | | | | | | | | | | | | | | | | | |
| Interest rate swaps | | | 17 | | | | (2,088 | ) | | | (35 | ) | | | (1,874 | ) | | | 22 | | | | (949 | ) | | | (42 | ) | | | (1,337 | ) |
| Cross-currency interest rate swaps | | | 123 | | | | (1,685 | ) | | | (4 | ) | | | (124 | ) | | | – | | | | (2 | ) | | | (2 | ) | | | (12 | ) |
| Foreign exchange forward contracts | | | – | | | | – | | | | – | | | | – | | | | – | | | | (24 | ) | | | – | | | | 27 | |
| Equity index-linked (i) | | | 145 | | | | (250 | ) | | | (189 | ) | | | (357 | ) | | | – | | | | – | | | | – | | | | – | |
| |
| | | | 285 | | | | (4,023 | ) | | | (228 | ) | | | (2,355 | ) | | | 22 | | | | (975 | ) | | | (44 | ) | | | (1,322 | ) |
| |
| | | | 709 | | | | (10,338 | ) | | | (471 | ) | | | (8,139 | ) | | | 665 | | | | (8,697 | ) | | | (222 | ) | | | (5,513 | ) |
| |
| Hedge positions offset within derivative instruments | | | (52 | ) | | | – | | | | 52 | | | | – | | | | – | | | | – | | | | – | | | | – | |
| |
Total | | | 657 | | | | (10,338 | ) | | | (419 | ) | | | (8,139 | ) | | | 665 | | | | (8,697 | ) | | | (222 | ) | | | (5,513 | ) |
| |
| (i) | | The equity index-linked derivatives are investment related derivative financial instruments that offset each other on a post-tax basis. |
The maturity of derivative financial instruments is as follows:
| | | | | | | | | | | | | | | | | |
| |
| | | 2007 | | | 2006 | |
| | | Assets | | | Liabilities | | | Assets | | | Liabilities | |
| | | £m | | | £m | | | £m | | | £m | |
| |
| In one year or less | | | 277 | | | | (235 | ) | | | 314 | | | | (92 | ) |
| |
Current | | | 277 | | | | (235 | ) | | | 314 | | | | (92 | ) |
| |
| In more than one year, but not more than two years | | | 26 | | | | (10 | ) | | | 3 | | | | (1 | ) |
| In more than two years, but not more than three years | | | 12 | | | | (7 | ) | | | 56 | | | | (6 | ) |
| In more than three years, but not more than four years | | | 5 | | | | (3 | ) | | | 18 | | | | (6 | ) |
| In more than four years, but not more than five years | | | 173 | | | | (22 | ) | | | 1 | | | | (1 | ) |
| In more than five years | | | 164 | | | | (142 | ) | | | 273 | | | | (116 | ) |
| |
Non-current | | | 380 | | | | (184 | ) | | | 351 | | | | (130 | ) |
| |
| | | | 657 | | | | (419 | ) | | | 665 | | | | (222 | ) |
| |
Annual Report and Accounts 2006/07135
23. Financial risk factors
Our activities expose us to a variety of financial risks: market risk (including currency risk; fair value interest rate risk; cash flow interest rate risk); credit risk and liquidity risk. The overall risk management programme focuses on the unpredictability of financial markets and seeks to minimise potential adverse effects on financial performance. Derivative financial instruments are used to hedge certain risk exposures.
Risk management is carried out by a central treasury department under policies approved by the Board of Directors. This department identifies, evaluates and hedges financial risks in close cooperation with the operating units. The Board provides written principles for overall risk management, as well as written policies covering specific areas, such as foreign exchange risk, interest rate risk, credit risk, use of derivative financial instruments and non-derivative financial instruments, and investment of excess liquidity as discussed further in our treasury policy, described on pages 65 to 67.
(a) Market risk
(i) Foreign exchange risk
National Grid operates internationally and is exposed to foreign exchange risk arising from various currency exposures, primarily with respect to the US dollar. Foreign exchange risk arises from future commercial transactions, recognised assets and liabilities and investments in foreign operations.
With respect to near term foreign exchange risk, we use foreign exchange forwards to manage foreign exchange transaction exposure. Our policy is to hedge a minimum percentage of known contracted foreign currency flows in the period out to 6 months and also in the period 6 to 12 months in order to mitigate foreign currency movements in the intervening period. Where cash forecasts are uncertain, we generally cover a percentage of the foreign currency flows depending on the certainty of the cash flows.
We also manage the foreign exchange exposure to net investments in foreign operations, within a policy range, by maintaining a percentage of net debt and foreign exchange forwards in the relevant currency. The primary managed foreign exchange exposure arises from the US dollar denominated assets and liabilities held by the US operations, and a small Australian dollar foreign exchange exposure with respect to our operations in Australia.
During 2007 and 2006, derivative financial instruments were used to manage foreign currency risk as follows:
| | | | | | | | | | | | | | | | | | | | | | | | | | | | | | | | | | | | | | | | | |
| |
| | | 2007 | | | 2006 | |
| | | Sterling | | | Euro | | | US dollar | | | Other | | | Total | | | Sterling | | | Euro | | | US dollar | | | Other | | | Total | |
| | | £m | | | £m | | | £m | | | £m | | | £m | | | £m | | | £m | | | £m | | | £m | | | £m | |
| |
| Cash and cash equivalents | | | 733 | | | | 2 | | | | 858 | | | | – | | | | 1,593 | | | | 1,090 | | | | 12 | | | | 350 | | | | – | | | | 1,452 | |
| Financial investments | | | 1,663 | | | | 61 | | | | 345 | | | | 29 | | | | 2,098 | | | | 338 | | | | – | | | | 46 | | | | – | | | | 384 | |
| Bank overdrafts | | | (6 | ) | | | – | | | | – | | | | – | | | | (6 | ) | | | (3 | ) | | | – | | | | – | | | | – | | | | (3 | ) |
| Borrowings | | | (8,024 | ) | | | (4,677 | ) | | | (2,443 | ) | | | (567 | ) | | | (15,711 | ) | | | (5,636 | ) | | | (4,023 | ) | | | (2,477 | ) | | | (990 | ) | | | (13,126 | ) |
| |
Pre-derivative position | | | (5,634 | ) | | | (4,614 | ) | | | (1,240 | ) | | | (538 | ) | | | (12,026 | ) | | | (4,211 | ) | | | (4,011 | ) | | | (2,081 | ) | | | (990 | ) | | | (11,293 | ) |
| Derivative effect | | | (1,709 | ) | | | 4,693 | | | | (2,972 | ) | | | 226 | | | | 238 | | | | (2,113 | ) | | | 3,946 | | | | (2,151 | ) | | | 761 | | | | 443 | |
| |
Net debt position | | | (7,343 | ) | | | 79 | | | | (4,212 | ) | | | (312 | ) | | | (11,788 | ) | | | (6,324 | ) | | | (65 | ) | | | (4,232 | ) | | | (229 | ) | | | (10,850 | ) |
| |
The exposure to US dollars largely relates to our net investment hedge activities as described and shown in note 22.
(ii) Cash flow and fair value interest rate risk
Except for the investments held pending the proposed acquisition of KeySpan, which receive floating rate interest, there are no significant interest-bearing assets maintained on an ongoing basis. The income and operating cash flows are substantially independent of changes in market interest rates.
Interest rate risk arises from long-term borrowings. Borrowings issued at variable rates expose National Grid to cash flow interest rate risk. Borrowings issued at fixed-rates expose National Grid to fair value interest rate risk. Our interest rate risk management policy as further explained on page 66 is to minimise the finance costs (being interest costs and changes in the market value of debt). Some of our borrowings issued are index-linked; that is, their cost is linked to changes in the UK retail price index (RPI). We believe that these borrowings provide a good hedge for revenues and our regulatory asset values that are also RPI-linked.
136National Grid plc
23. Financial risk factors (continued)
(a) Market risk (continued)
(ii) Cash flow and fair value interest rate risk (continued)
The following table sets out the carrying amount, by contractual maturity, of borrowings that are exposed to interest rate risk before taking into account interest rate swaps:
| | | | | | | | | |
| |
| | | 2007 | | | 2006 | |
| | | £m | | | £m | |
| |
Fixed interest rate borrowings | | | | | | | | |
| In one year or less | | | (619 | ) | | | (2,028 | ) |
| In more than one year, but not more than two years | | | (1,525 | ) | | | (364 | ) |
| In more than two years, but not more than three years | | | (569 | ) | | | (1,232 | ) |
| In more than three years, but not more than four years | | | (263 | ) | | | (870 | ) |
| In more than four years, but not more than five years | | | (901 | ) | | | (261 | ) |
| In more than five years | | | (4,886 | ) | | | (4,573 | ) |
| |
| | | | (8,763 | ) | | | (9,328 | ) |
Floating interest rate borrowings (including RPI) | | | (6,948 | ) | | | (3,798 | ) |
| |
Total borrowings | | | (15,711 | ) | | | (13,126 | ) |
| |
During 2007 and 2006, net debt was managed using derivative instruments to hedge interest rate risk as follows:
| | | | | | | | | | | | | | | | | | | | | | | | | | | | | | | | | | | | | | | | | |
| |
| | | 2007 | | | 2006 | |
| | | Fixed- | | | Floating- | | | | | | | | | | | | | | | Fixed- | | | Floating- | | | | | | | | | | |
| | | rate | | | rate | | | RPI | (i) | | Other | (ii) | | Total | | | rate | | | rate | | | RPI | (i) | | Other | (ii) | | Total | |
| | | £m | | | £m | | | £m | | | £m | | | £m | | | £m | | | £m | | | £m | | | £m | | | £m | |
| |
| Cash and cash equivalents | | | – | | | | 1,593 | | | | – | | | | – | | | | 1,593 | | | | – | | | | 1,452 | | | | – | | | | – | | | | 1,452 | |
| Financial investments | | | – | | | | 1,872 | | | | – | | | | 226 | | | | 2,098 | | | | – | | | | 100 | | | | – | | | | 284 | | | | 384 | |
| Bank overdrafts | | | – | | | | (6 | ) | | | – | | | | – | | | | (6 | ) | | | – | | | | (3 | ) | | | – | | | | – | | | | (3 | ) |
| Borrowings | | | (8,763 | ) | | | (3,301 | ) | | | (3,647 | ) | | | – | | | | (15,711 | ) | | | (9,328 | ) | | | (2,396 | ) | | | (1,402 | ) | | | – | | | | (13,126 | ) |
| |
Pre-derivative position | | | (8,763 | ) | | | 158 | | | | (3,647 | ) | | | 226 | | | | (12,026 | ) | | | (9,328 | ) | | | (847 | ) | | | (1,402 | ) | | | 284 | | | | (11,293 | ) |
| Derivative effect | | | 2,747 | | | | (2,501 | ) | | | – | | | | (8 | ) | | | 238 | | | | 4,162 | | | | (3,742 | ) | | | – | | | | 23 | | | | 443 | |
| |
Net debt position | | | (6,016 | ) | | | (2,343 | ) | | | (3,647 | ) | | | 218 | | | | (11,788 | ) | | | (5,166 | ) | | | (4,589 | ) | | | (1,402 | ) | | | 307 | | | | (10,850 | ) |
| |
| (i) | | Represents financial instruments which are linked to the UK retail price index. |
| (ii) | | Represents financial instruments which are not directly affected by interest rate risk, such as investments in equity or other similar financial instruments. |
(b) Credit risk
Credit risk is managed on a portfolio basis. Credit risk arises from cash and cash equivalents, derivative financial instruments and deposits with banks and financial institutions, as well as credit exposures to wholesale and retail customers, including outstanding receivables and committed transactions.
Treasury related credit risk
Counterparty risk arises from the investment of surplus funds and from the use of derivative instruments. As at 31 March 2007 the following limits were in place for investments held with banks and financial institutions:
| | | | | | | | | |
| |
| | | Maximum limit | | | Long-term limit | |
| | | £m | | | £m | |
| |
Rating | | | | | | | | |
| AAA rated G8 sovereign entities | | | Unlimited | | | | Unlimited | |
| Triple ‘A’ vehicles | | | 140 | | | | 140 | |
| Triple ‘A’ range institutions (AAA) | | | 620 to 965 | | | | 310 to 505 | |
| Double ‘A’ range institutions (AA) | | | 345 to 450 | | | | 175 to 225 | |
| Single ‘A’ range institutions (A) | | | 80 to 140 | | | | 40 to 70 | |
| |
As at 31 March 2007 and 2006, we had a number of exposures to individual counterparties. In accordance with our treasury policies and exposure management practices, counterparty credit exposure limits are continually monitored and no individual exposure is considered significant in the ordinary course of treasury management activity. Management does not expect any significant losses from non-performance by these counterparties.
The counterparty exposure under derivative financial contracts as shown in note 22 was £657m (2006: £665m), after netting agreements it was £364m (2006: £524m). This exposure is further reduced by collateral received as shown in note 27.
Wholesale and retail credit risk
Our principal commercial exposure in the UK is governed by the credit rules within the regulated codes Uniform Network Code and Connection and Use of System Code. These lay down the level of credit relative to the Regulatory Asset Value (RAV) for each credit rating. In the US, we are required to provide electricity and gas under state regulations. Our credit policies and practices are designed to limit credit exposure by collecting deposits prior to providing utility services. Collection activities are managed on a daily basis. The utilisation of credit limits is regularly monitored. Sales to retail customers are usually settled in cash or using major credit cards. Management does not expect any significant losses of receivables that have not been provided for as shown in note 25.
Annual Report and Accounts 2006/07137
23. Financial risk factors (continued)
(c) Liquidity analysis
We manage our liquidity requirements by the use of both short- and long-term cash flow forecasts. These forecasts are supplemented by a financial headroom position which is used to demonstrate funding adequacy for at least a 12 month period.
The following is an analysis of the contractual undiscounted cash flows payable under financial liabilities and derivative assets and liabilities as at the balance sheet date:
| | | | | | | | | | | | | | | | | | | | | |
| |
| | | | | | | Due | | | Due | | | Due | | | | |
| | | Due | | | between | | | between | | | 3 years | | | | |
| | | within | | | 1 and 2 | | | 2 and 3 | | | and | | | | |
| At 31 March 2007 | | 1 year | | | years | | | years | | | beyond | | | Total | |
| | £m | | | £m | | | £m | | | £m | | | £m | |
| |
Non derivative financial liabilities | | | | | | | | | | | | | | | | | | | | |
| Borrowings, excluding finance lease liabilities | | | (776 | ) | | | (1,865 | ) | | | (1,013 | ) | | | (12,283 | ) | | | (15,937 | ) |
| Interest payments on borrowings (i) | | | (686 | ) | | | (612 | ) | | | (548 | ) | | | (6,489 | ) | | | (8,335 | ) |
| Finance lease liabilities | | | (17 | ) | | | (17 | ) | | | (12 | ) | | | (113 | ) | | | (159 | ) |
| Other non interest-bearing liabilities | | | (1,525 | ) | | | (214 | ) | | | – | | | | – | | | | (1,739 | ) |
| | | | | | | | | | | | | | | | | | | | | |
Derivative financial liabilities | | | | | | | | | | | | | | | | | | | | |
| Derivative contracts – receipts | | | 382 | | | | 608 | | | | 299 | | | | 2,116 | | | | 3,405 | |
| Derivative contracts – payments | | | (443 | ) | | | (571 | ) | | | (318 | ) | | | (1,910 | ) | | | (3,242 | ) |
| Commodity contracts | | | (56 | ) | | | (55 | ) | | | (38 | ) | | | (240 | ) | | | (389 | ) |
| |
Total at 31 March 2007 | | | (3,121 | ) | | | (2,726 | ) | | | (1,630 | ) | | | (18,919 | ) | | | (26,396 | ) |
| |
| | | | | | | | | | | | | | | | | | | | | |
| |
| | | | | | | Due | | | Due | | | Due | | | | |
| | | Due | | | between | | | between | | | 3 years | | | | |
| | | within | | | 1 and 2 | | | 2 and 3 | | | and | | | | |
| At 31 March 2006 | | 1 year | | | years | | | years | | | beyond | | | Total | |
| | £m | | | £m | | | £m | | | £m | | | £m | |
| |
Non derivative financial liabilities | | | | | | | | | | | | | | | | | | | | |
| Borrowings, excluding finance lease liabilities | | | (2,569 | ) | | | (404 | ) | | | (1,317 | ) | | | (8,948 | ) | | | (13,238 | ) |
| Interest payments on borrowings (i) | | | (572 | ) | | | (488 | ) | | | (439 | ) | | | (3,982 | ) | | | (5,481 | ) |
| Finance lease liabilities | | | (20 | ) | | | (26 | ) | | | (22 | ) | | | (124 | ) | | | (192 | ) |
| Other non interest-bearing liabilities | | | (1,582 | ) | | | (324 | ) | | | – | | | | – | | | | (1,906 | ) |
| | | | | | | | | | | | | | | | | | | | | |
Derivative financial liabilities | | | | | | | | | | | | | | | | | | | | |
| Derivative contracts – receipts | | | 1,170 | | | | 87 | | | | 248 | | | | 1,225 | | | | 2,730 | |
| Derivative contracts – payments | | | (1,046 | ) | | | (122 | ) | | | (209 | ) | | | (1,011 | ) | | | (2,388 | ) |
| Commodity contracts | | | (113 | ) | | | (114 | ) | | | (112 | ) | | | (439 | ) | | | (778 | ) |
| |
| Total at 31 March 2006 | | | (4,732 | ) | | | (1,391 | ) | | | (1,851 | ) | | | (13,279 | ) | | | (21,253 | ) |
| |
| (i) | | The interest on borrowings is calculated based on borrowings held at 31 March without taking account of future issues. Floating-rate interest is estimated using a future interest rate curve as at 31 March. |
138National Grid plc
23. Financial risk factors (continued)
(d) Sensitivity analysis
Financial instruments affected by market risk include borrowings, deposits, derivative financial instruments and commodity contracts. The following analysis, required by IFRS 7, is intended to illustrate the sensitivity to changes in market variables, being UK and US interest rates, the UK retail price index and the US dollar to sterling exchange rate on our financial instruments. We have excluded from this analysis the impact of movements in market variables on the carrying value of our commodity contracts as we are able to substantially recover the costs of these contracts from customers in future periods.
The analysis also excludes the impact of movements in market variables on the carrying value of pension and other post-retirement obligations, provisions and on the non-financial assets and liabilities of overseas subsidiaries.
The sensitivity analysis has been prepared on the basis that the amount of net debt, the ratio of fixed to floating interest rates of the debt and derivatives portfolio and the proportion of financial instruments in foreign currencies are all constant and on the basis of the hedge designations in place at 31 March 2007 and 31 March 2006, respectively. As a consequence, this sensitivity analysis relates to the positions at those dates and is not representative of the years then ended, as all of these varied.
The following assumptions were made in calculating the sensitivity analysis:
| n | | the balance sheet sensitivity to interest rates relates only to derivative financial instruments and available-for-sale investments, as debt and other deposits are carried at amortised cost and so their carrying value does not change as interest rates move; |
| n | | the sensitivity of accrued interest to movements in interest rates is calculated on net floating rate exposures on debt, deposits and derivative instruments; |
| n | | changes in the carrying value of derivatives from movements in interest rates designated as cash flow hedges are assumed to be recorded fully within equity; |
| n | | changes in the carrying value of derivative financial instruments designated as net investment hedges from movements in interest rates are recorded in the income statement as they are designated using the spot rather than the forward translation method. The impact of movements in the US dollar to sterling exchange rate are recorded directly in equity; |
| n | | changes in the carrying value of derivative financial instruments not in hedging relationships only affect the income statement; |
| n | | all other changes in the carrying value of derivative financial instruments designated as hedges are fully effective with no impact on the income statement; |
| n | | debt with a maturity below one year is floating rate for the accrued interest part of the calculation; |
| n | | the floating leg of any swap or any floating-rate debt is treated as not having any interest rate already set, therefore a change in interest rates affects a full 12 month period for the accrued interest portion of the sensitivity calculations; and |
| n | | sensitivity to the retail price index does not take into account any changes to revenue or operating costs that are affected by the retail price index or inflation generally. |
Using the above assumptions, the following table shows the illustrative effect on the income statement and items that are recognised directly in equity that would result from reasonably possible movements in changes in the UK retail price index, UK and US interest rates and in the US dollar to sterling exchange rate, before the effects of tax.
| | | | | | | | | | | | | | | | | |
| |
| | | 2007 | | 2006 |
| | | Income | | | | | | | Income | | | | |
| | | statement | | | Equity | | | statement | | | Equity | |
| | | -/+ £m | | | -/+ £m | | | -/+ £m | | | -/+ £m | |
| |
| UK retail price index +/- 0.50% | | | 18 | | | | – | | | | 7 | | | | – | |
| UK interest rates +/- 0.50% | | | 50 | | | | 62 | | | | 63 | | | | 70 | |
| US interest rates +/- 0.50% | | | 37 | | | | 11 | | | | 30 | | | | 10 | |
| US dollar exchange rate +/- 10% | | | 52 | | | | 194 | | | | 52 | | | | 228 | |
| |
24. Inventories
| | | | | | | | | |
| |
| | | 2007 | | | 2006 | |
| | | £m | | | £m | |
| |
| Raw materials and consumables | | | 69 | | | | 62 | |
| Work in progress | | | 17 | | | | 22 | |
| Fuel stocks | | | 20 | | | | 24 | |
| |
| | | | 106 | | | | 108 | |
| |
£97m of inventories were consumed during the year (2006: £58m; 2005: £56m). The above table includes a £3m provision for obsolescence as at 31 March 2007 (2006: £4m).
Annual Report and Accounts 2006/07139
25. Trade and other receivables
| | | | | | | | | |
| |
| | | 2007 | | | 2006 | |
| | | £m | | | £m | |
| |
| Trade receivables | | | 638 | | | | 838 | |
| Other receivables | | | 60 | | | | 137 | |
| Prepayments and accrued income | | | 538 | | | | 525 | |
| Asset held for sale | | | – | | | | 19 | |
| |
| | | | 1,236 | | | | 1,519 | |
| |
On 27 October 2006 a subsidiary sold its interest in a joint venture, Copperbelt Energy Corporation plc. The joint venture investment was classified as an asset held for sale at 31 March 2006.
Trade receivables are non interest-bearing and generally have a 30-90 day term. Due to their short maturities, the fair value of trade and other receivables approximates to their book value. Asset held for sale is recorded at fair value. All other receivables are recorded at amortised cost.
The carrying amounts of trade and other receivables are denominated in the following currencies, which in most instances are the functional currency of the respective subsidiaries. Our exposure to US dollars forms part of our net investment in our US subsidiaries which is further described in note 23 (a). We do not have any other significant exposure to currency risk on these amounts.
| | | | | | | | | |
| |
| | | 2007 | | | 2006 | |
| | | £m | | | £m | |
| |
| Sterling | | | 465 | | | | 687 | |
| US dollar | | | 771 | | | | 832 | |
| |
| | | | 1,236 | | | | 1,519 | |
| |
Provision for impairment of receivables
| | | | | |
| |
| | | £m | |
| |
| At 1 April 2005 | | | 133 | |
| Exchange adjustments | | | (9 | ) |
| Charge for the year | | | 24 | |
| Uncollectable amounts written off, net of recoveries | | | (41 | ) |
| |
| At 31 March 2006 | | | 107 | |
| Exchange adjustments | | | (12 | ) |
| Charge for the year | | | 63 | |
| Uncollectable amounts written off, net of recoveries | | | (51 | ) |
| Reclassification to assets held for sale | | | (5 | ) |
| |
At 31 March 2007 | | | 102 | |
| |
As at 31 March 2007, trade receivables of £18m (2006: £28m) were past due but not impaired. The ageing analysis of these trade receivables is as follows:
| | | | | | | | | |
| |
| | | 2007 | | | 2006 | |
| | | £m | | | £m | |
| |
| Up to 3 months past due | | | 10 | | | | 9 | |
| 3 to 6 months past due | | | 2 | | | | 3 | |
| Over 6 months past due | | | 6 | | | | 16 | |
| |
| | | | 18 | | | | 28 | |
| |
Refer to note 23 for further information about our wholesale and retail credit risk.
26. Cash and cash equivalents
| | | | | | | | | |
| |
| | | 2007 | | | 2006 | |
| | | £m | | | £m | |
| |
| Cash at bank | | | 50 | | | | 46 | |
| Short-term deposits | | | 1,543 | | | | 1,406 | |
| |
Cash and cash equivalents | | | 1,593 | | | | 1,452 | |
| |
Bank overdrafts | | | (6 | ) | | | (3 | ) |
| |
| Net cash and cash equivalents | | | 1,587 | | | | 1,449 | |
| |
The carrying amounts of cash and cash equivalents and bank overdrafts approximates their fair values.
Cash at bank earns interest at floating rates based on daily bank deposit rates. Short-term deposits are made for varying periods of between one day and three months, depending on the immediate cash requirements, and earn interest at the respective short-term deposit rates.
140National Grid plc
26. Cash and cash equivalents (continued)
Net cash and cash equivalents are held in the following currencies; those held in currencies other than sterling have been converted into sterling at year-end exchange rates:
| | | | | | | | | |
| |
| | | 2007 | | | 2006 | |
| | | £m | | | £m | |
| |
| Sterling | | | 727 | | | | 1,087 | |
| Euro | | | 2 | | | | 12 | |
| US dollar | | | 858 | | | | 350 | |
| |
| | | | 1,587 | | | | 1,449 | |
| |
National Grid USA and its public utility subsidiaries (all consolidated subsidiaries) are subject to restrictions on the payment of dividends by administrative order and contract. At 31 March 2007, £132m (2006: £46m) of cash and cash equivalents were restricted.
27. Borrowings
The following table analyses borrowings, excluding bank overdrafts:
| | | | | | | | | |
| |
| | | 2007 | | | 2006 | |
| | | £m | | | £m | |
| |
Current | | | | | | | | |
| Bank loans | | | 136 | | | | 717 | |
| Bonds | | | 849 | | | | 1,982 | |
| Finance leases | | | 10 | | | | 14 | |
| Other loans | | | 30 | | | | 126 | |
| |
| | | | 1,025 | | | | 2,839 | |
| |
Non-current | | | | | | | | |
| Bank loans | | | 930 | | | | 550 | |
| Bonds | | | 13,544 | | | | 9,485 | |
| Finance leases | | | 92 | | | | 115 | |
| Other loans | | | 120 | | | | 137 | |
| |
| | | | 14,686 | | | | 10,287 | |
| |
Total borrowings | | | 15,711 | | | | 13,126 | |
| |
Total borrowings are repayable as follows:
| | | | | | | | | |
| |
| | | 2007 | | | 2006 | |
| | | £m | | | £m | |
| |
| In one year or less | | | 1,025 | | | | 2,839 | |
| In more than one year, but not more than two years | | | 1,869 | | | | 404 | |
| In more than two years, but not more than three years | | | 1,011 | | | | 1,288 | |
| In more than three years, but not more than four years | | | 748 | | | | 1,090 | |
| In more than four years, but not more than five years | | | 1,411 | | | | 294 | |
| In more than five years: | | | | | | | | |
| by instalments | | | 116 | | | | 131 | |
| other than by instalments | | | 9,531 | | | | 7,080 | |
| |
| | | | 15,711 | | | | 13,126 | |
| |
The carrying amounts of borrowings are denominated in the following currencies:
| | | | | | | | | |
| |
| | | 2007 | | | 2006 | |
| | | £m | | | £m | |
| |
| Sterling | | | 8,024 | | | | 5,636 | |
| US dollar | | | 2,443 | | | | 2,477 | |
| Euro | | | 4,677 | | | | 4,023 | |
| Other currencies | | | 567 | | | | 990 | |
| |
| | | | 15,711 | | | | 13,126 | |
| |
The fair value of borrowings at 31 March 2007 was £15,913m (2006: £13,757m). Market values, where available, have been used to determine fair value. Where market values are not available, fair values have been calculated by discounting cash flows at prevailing interest rates.
Charges over property, plant and other assets were provided as collateral over borrowings totalling £418m at 31 March 2007 (2006: £607m).
The notional amount outstanding of the debt portfolio at 31 March 2007 was £16,042m (2006: £13,230m).
Annual Report and Accounts 2006/07141
27. Borrowings (continued)
Collateral is placed with or received from any counterparty where we have entered into a credit support annex to the ISDA Master Agreement once the current marked-to-market valuation of the trades between the parties exceeds an agreed threshold. Included in current bank loans is £134m (2006: £240m) in respect of cash received under collateral agreements. Cash placed under collateral agreements is shown in note 21 Financial and other investments.
Obligations under finance leases at the balance sheet dates are analysed as follows:
| | | | | | | | | |
| |
| | | 2007 | | | 2006 | |
| | | £m | | | £m | |
| |
| Gross finance lease liabilities repayable as follows: | | | | | | | | |
| In one year or less | | | 17 | | | | 20 | |
| In more than one year, but not more than five years | | | 48 | | | | 47 | |
| In more than five years | | | 94 | | | | 125 | |
| |
| | | | 159 | | | | 192 | |
| Less: finance charges allocated to future periods | | | (57 | ) | | | (63 | ) |
| |
| | | | 102 | | | | 129 | |
| |
| The present value of finance lease liabilities is as follows: | | | | | | | | |
| In one year or less | | | 9 | | | | 14 | |
| In more than one year, but not more than five years | | | 21 | | | | 26 | |
| In more than five years | | | 72 | | | | 89 | |
| |
| | | | 102 | | | | 129 | |
| |
The table below shows our significant bonds in issue, being £50m notional value or greater. Unless otherwise indicated, these instruments were outstanding at both 31 March 2007 and 31 March 2006.
| | | |
| |
| Issuer | | Description of instrument |
| |
| British Transco Finance Inc. | | USD 300 million 6.625% Fixed Rate Instruments due 2018 |
| British Transco International Finance BV (i) | | USD 350 million 7.0% Fixed Rate Instruments due 2006 |
| British Transco International Finance BV | | FRF 2,000 million 5.125% Fixed Rate Instruments due 2009 |
| British Transco International Finance BV | | USD 1,500 million Zero Coupon Bond due 2021 |
| National Grid Electricity Transmission plc | | EUR 600 million 4.125% Fixed Rate Instruments due 2008 |
| National Grid Electricity Transmission plc | | GBP 250 million 4.75% Fixed Rate Instruments due 2010 |
| National Grid Electricity Transmission plc | | GBP 300 million 2.983% Guaranteed Retail Price Index-Linked Instruments due 2018 |
| National Grid Electricity Transmission plc | | GBP 220 million 3.806% Retail Price Index-Linked Instruments due 2020 |
| National Grid Electricity Transmission plc | | GBP 450 million 5.875% Fixed Rate Instruments due 2024 |
| National Grid Electricity Transmission plc | | GBP 360 million 6.5% Fixed Rate Instruments due 2028 |
| National Grid Electricity Transmission plc | | GBP 70 million 3.589% Limited Retail Price Index-Linked Instruments due 2030 |
| National Grid Electricity Transmission plc | | GBP 50 million 2.817% Guaranteed Limited Retail Price Index-Linked Instruments due 2032 |
| National Grid Electricity Transmission plc | | GBP 75 million 5.0% Fixed Rate Instruments due 2035 |
| National Grid Electricity Transmission plc | | GBP 50 million 2.2280% Retail Price Index-Linked Instruments due 2035 |
| National Grid Electricity Transmission plc | | GBP 75 million 2.0353% Retail Price Index-Linked Instruments due 2035 |
| National Grid Electricity Transmission plc | | GBP 50 million 1.8204% Retail Price Index-Linked Instruments due 2035 |
| National Grid Electricity Transmission plc | | JPY 10,000 million Callable Fixed Rate Notes due 2035 |
| National Grid Electricity Transmission plc (ii) | | GBP 200 million 1.6449% RPI-Linked Instruments due 2036 |
| National Grid Electricity Transmission plc (ii) | | GBP 50 million 1.6747% RPI-Linked Instruments due 2036 |
| National Grid Electricity Transmission plc (ii) | | GBP 50 million 1.819% RPI-Linked Instruments due 2056 |
| National Grid Electricity Transmission plc (ii) | | GBP 150 million 1.823% RPI-Linked Instruments due 2056 |
| National Grid Electricity Transmission plc (ii) | | GBP 50 million 1.797% RPI-Linked Instruments due 2056 |
| National Grid Electricity Transmission plc (ii) | | GBP 50 million 1.6574% RPI-Linked Instruments due 2056 |
| National Grid plc (ii) | | CAD 200 million 4.98% Fixed Rate Instruments due 2011 |
| National Grid plc | | EUR 500 million 3.75% Fixed Rate Instruments due 2008 |
| National Grid plc (ii) | | EUR 1,000 million 4.125% Fixed Rate Instruments due 2013 |
| National Grid plc | | EUR 600 million 5.0% Fixed Rate Instruments due 2018 |
| National Grid plc | | EUR 500 million 4.375% Fixed Rate Instruments due 2020 |
| National Grid plc (ii) | | EUR 600 million Floating Rate Instruments due 2010 |
| National Grid plc (ii) | | EUR 300 million Floating Rate Instruments due 2008 |
| National Grid plc (ii) | | EUR 750 million Floating Rate Instruments due 2012 |
| National Grid plc (ii) | | EUR 300 million Floating Rate Instruments due 2009 |
| National Grid plc (ii) | | EUR 450 million Floating Rate Instruments due 2008 |
| National Grid plc (ii) | | EUR 100 million 3.25% Fixed Rate Instruments due 2009 |
| National Grid plc (ii) | | GBP 300 million 5.25% Fixed Rate Instruments due 2011 |
| National Grid plc (ii) | | GBP 250 million 5.5% Fixed Rate Instruments due 2013 |
| National Grid plc (ii) | | USD 1,000 million 6.3% Notes due 2016 |
| National Grid plc (ii) | | USD 100 million Floating Rate Instruments due 2011 |
142National Grid plc
27. Borrowings (continued)
| | | |
| |
| Issuer | | Description of instrument |
| |
| New England Power Company | | USD 135.85 million Tax Exempt Pollution Control Revenue Bonds, Variable Rate due 2020 |
| New England Power Company | | USD 106.15 million Tax Exempt Pollution Control Revenue Bonds, Variable Rate due 2022 |
| NGG Finance plc (i) | | EUR 1,250 million 5.25% Fixed Rate Instruments due 2006 |
| NGG Finance plc | | EUR 750 million 6.125% Fixed Rate Instruments due 2011 |
| Niagara Mohawk Power Corporation (i) | | USD 275 million 7.75% Taxable First Mortgage Bonds due 2006 |
| Niagara Mohawk Power Corporation | | USD 200 million 8.875% Senior Notes due 2007 |
| Niagara Mohawk Power Corporation | | USD 600 million 7.75% Senior Notes due 2008 |
| Niagara Mohawk Power Corporation (iii) | | USD 115.71 million 7.2% Tax-Exempt First Mortgage Bonds due 2029 |
| National Grid Gas Holdings plc | | GBP 503.078 million Floating Rate Instruments due 2009 |
| National Grid Gas Holdings plc | | GBP 503.078 million 4.1875% Index-Linked Instruments due 2022 |
| National Grid Gas Holdings plc | | GBP 503.078 million 7.0% Fixed Rate Instruments due 2024 |
| National Grid Gas plc (i) | | EUR 650 million 5.25% Fixed Rate Instruments due 2006 |
| National Grid Gas plc (i) | | GBP 250 million 6.125% Fixed Rate Instruments due 2006 |
| National Grid Gas plc | | GBP 300 million 5.625% Fixed Rate Instruments due 2007 |
| National Grid Gas plc | | GBP 250 million 8.875% Fixed Rate Instruments due 2008 |
| National Grid Gas plc | | AUD 500 million 7.0% Fixed Rate Instruments due 2008 |
| National Grid Gas plc | | GBP 300 million 5.375% Fixed Rate Instruments due 2009 |
| National Grid Gas plc | | GBP 300 million 6.0% Fixed Rate Instruments due 2017 |
| National Grid Gas plc | | GBP 275 million 8.75% Fixed Rate Instruments due 2025 |
| National Grid Gas plc | | GBP 50 million 6.2% Fixed Rate Instruments due 2028 |
| National Grid Gas plc (ii) | | GBP 100 million 1.6747% RPI-Linked Instruments due 2036 |
| National Grid Gas plc (ii) | | GBP 115 million 1.7298% RPI-Linked Instruments due 2046 |
| National Grid Gas plc (ii) | | GBP 100 million 1.6298% RPI-Linked Instruments due 2048 |
| National Grid Gas plc (ii) | | GBP 100 million 1.5522% RPI-Linked Instruments due 2048 |
| National Grid Gas plc (ii) | | GBP 300 million 1.754% RPI-Linked Instruments due 2036 |
| National Grid Gas plc (ii) | | GBP 140 million 1.7864% Index-Linked Instruments due 2037 |
| National Grid Gas plc (ii) | | GBP 50 million 1.7552% Index-Linked Instruments due 2037 |
| National Grid Gas plc (ii) | | GBP 50 million 1.6783% Index-Linked Instruments due 2037 |
| National Grid Gas plc (ii) | | GBP 100 million 1.9158% Index-Linked Instruments due 2037 |
| National Grid Gas plc (ii) | | GBP 50 million 1.8928% Index-Linked Instruments due 2037 |
| National Grid Gas plc (ii) | | GBP 65 million 1.9211% Index-Linked Instruments due 2037 |
| National Grid Gas plc (ii) | | GBP 50 million 1.7642% Index-Linked Instruments due 2037 |
| National Grid Gas plc (ii) | | GBP 100 million 1.7762% Index-Linked Instruments due 2037 |
| |
| | |
| (i) | | Matured during the year ended 31 March 2007. |
| (ii) | | Issued during the year ended 31 March 2007. |
| (iii) | | Secured against the assets of Niagara Mohawk Power Corporation. |
The following significant bonds were announced to the market prior to the year end. However, they were not issued until after
31 March 2007.
| | | |
| |
| Issuer | | Description of instrument |
| |
| National Grid Electricity Transmission plc | | GBP 50 million 1.8055% Index-Linked Instruments due 2039 |
| National Grid Electricity Transmission plc | | GBP 150 million 1.8575% Index-Linked Instruments due 2039 |
| National Grid Gas plc | | GBP 100 million 1.7744% Index-Linked Instruments due 2039 |
| National Grid Gas plc | | GBP 100 million 1.8625% Index-Linked Instruments due 2039 |
| |
Borrowing facilities
At 31 March 2007, there were bilateral committed credit facilities of £1,290m (2006: £1,340m), of which £1,290m (2006: £1,340m) were undrawn. In addition, there were committed credit facilities from syndicates of banks of £879m at 31 March 2007 (2006: £1,095m), of which £879m (2006: £1,095m) were undrawn. An analysis of the maturity of these undrawn committed facilities is shown below:
Undrawn committed borrowing facilities
| | | | | | | | | |
| |
| | | 2007 | | | 2006 | |
| | | £m | | | £m | |
| |
| Expiring: | | | | | | | | |
| In one year or less | | | 762 | | | | 50 | |
| In more than one year, but not more than two years | | | – | | | | 891 | |
| In more than two years | | | 1,407 | | | | 1,494 | |
| |
| | | | 2,169 | | | | 2,435 | |
| |
At 31 March 2007, of the unused facilities £2,052m (2006: £2,232m) was held as back-up to commercial paper and similar borrowings.
Annual Report and Accounts 2006/07143
28. Trade and other payables
| | | | | | | | | |
| |
| | | 2007 | | | 2006 | |
| | | £m | | | £m | |
| |
| Trade payables | | | 1,246 | | | | 1,313 | |
| Commodity contract liabilities | | | 138 | | | | 174 | |
| Social security and other taxes | | | 108 | | | | 147 | |
| Other payables | | | 279 | | | | 269 | |
| Deferred income | | | 81 | | | | 192 | |
| |
| | | | 1,852 | | | | 2,095 | |
| |
Due to their short maturities, the fair value of trade and other payables approximates to their book value. Commodity contract liabilities are recorded at fair value. All other trade and other payables are recorded at amortised cost.
The carrying amounts of trade and other payables are denominated in the following currencies, which are the functional currency of the respective subsidiaries. Our exposure to US dollars forms part of our net investment in our US subsidiaries which is further described in note 23 (a). We do not have any other significant exposure to currency risk on these amounts.
| | | | | | | | | |
| |
| | | 2007 | | | 2006 | |
| | | £m | | | £m | |
| |
| Sterling | | | 1,287 | | | | 1,449 | |
| US dollar | | | 565 | | | | 646 | |
| |
| | | | 1,852 | | | | 2,095 | |
| |
29. Other non-current liabilities
| | | | | | | | | |
| |
| | | 2007 | | | 2006 | |
| | | £m | | | £m | |
| |
| Commodity contract liabilities | | | 130 | | | | 314 | |
| Other payables | | | 214 | | | | 324 | |
| Deferred income | | | 1,131 | | | | 1,081 | |
| |
| | | | 1,475 | | | | 1,719 | |
| |
Commodity contract liabilities are recorded at fair value. All other non-current liabilities are recorded at amortised cost. The fair value of other payables at 31 March 2007 was £204m (2006: £309m).
The carrying amounts of other non-current liabilities are denominated in the following currencies, which are the functional currency of the respective subsidiaries. Our exposure to US dollars forms part of our net investment in our US subsidiaries which is further described in note 23 (a). We do not have any other significant exposure to currency risk on these amounts.
| | | | | | | | | |
| |
| | | 2007 | | | 2006 | |
| | | £m | | | £m | |
| |
| Sterling | | | 1,140 | | | | 1,168 | |
| US dollar | | | 335 | | | | 551 | |
| |
| | | | 1,475 | | | | 1,719 | |
| |
Commodity contract liabilities
Commodity contract liabilities are contracts for the purchase of electricity and gas, or derivative commodity instruments, which are carried at fair value in the balance sheet. They comprise purchased power obligations in the US, index-linked swap contracts in the US and New York Mercantile Exchange (NYMEX) gas and electricity futures that do not qualify as hedges of future sales.
Under our rate plans in the US, payments made under these contracts are recovered from customers.
The maturity of commodity contract liabilities measured at fair value can be analysed as follows:
| | | | | | | | | |
| |
| | | 2007 | | | 2006 | |
| | | £m | | | £m | |
| |
| In one year or less | | | 138 | | | | 174 | |
| |
Current | | | 138 | | | | 174 | |
| |
| In more than one year, but not more than two years | | | 42 | | | | 169 | |
| In more than two years, but not more than three years | | | 11 | | | | 50 | |
| In more than three years, but not more than four years | | | 12 | | | | 15 | |
| In more than four years, but not more than five years | | | 12 | | | | 13 | |
| In more than five years | | | 53 | | | | 67 | |
| |
Non-current | | | 130 | | | | 314 | |
| |
| | | | 268 | | | | 488 | |
| |
Commodity contract liabilities of £268m (2006: £488m) include £136m (2006: £309m) of electricity swaps with notional quantities totalling 6,845,127 MWh (2006: 9,223,107 MWh). Other commodity contract liabilities, relating to power purchase commitments over periods of 2 to 12 years, do not have specified notional quantities. As at 31 March 2007 our obligations under those agreements totalled £389m (2006: £778m).
144National Grid plc
30. Provisions
| | | | | | | | | | | | | | | | | | | | | | | | | |
| |
| | | | | | | | | | | | | | | | | | | | | | | Total | |
| | | Decommissioning | | | Environmental | | | Emissions | | | Restructuring | | | Other | | | provisions | |
| | | £m | | | £m | | | £m | | | £m | | | £m | | | £m | |
| |
| At 1 April 2005 | | | 105 | | | | 491 | | | | 4 | | | | 90 | | | | 101 | | | | 791 | |
| Exchange adjustments | | | 9 | | | | 19 | | | | – | | | | – | | | | – | | | | 28 | |
| Disposal of subsidiary undertakings | | | – | | | | (44 | ) | | | – | | | | – | | | | (22 | ) | | | (66 | ) |
| Additions | | | 18 | | | | 3 | | | | 19 | | | | 35 | | | | 70 | | | | 145 | |
| Reclassification from working capital | | | 24 | | | | – | | | | – | | | | – | | | | 5 | | | | 29 | |
| Unwinding of discount | | | 3 | | | | 15 | | | | – | | | | – | | | | – | | | | 18 | |
| Utilised | | | (32 | ) | | | (55 | ) | | | – | | | | (50 | ) | | | (37 | ) | | | (174 | ) |
| |
| At 31 March 2006 | | | 127 | | | | 429 | | | | 23 | | | | 75 | | | | 117 | | | | 771 | |
| Exchange adjustments | | | (12 | ) | | | (27 | ) | | | – | | | | – | | | | – | | | | (39 | ) |
| Acquisition of subsidiary undertakings | | | 1 | | | | 7 | | | | – | | | | – | | | | – | | | | 8 | |
| Additions | | | – | | | | 14 | | | | 13 | | | | 14 | | | | 1 | | | | 42 | |
| Unused amounts reversed | | | (13 | ) | | | (11 | ) | | | (23 | ) | | | (1 | ) | | | (2 | ) | | | (50 | ) |
| Reclassification to working capital | | | – | | | | (4 | ) | | | – | | | | – | | | | – | | | | (4 | ) |
| Reclassification to assets of businesses held for sale | | | (12 | ) | | | – | | | | – | | | | – | | | | (15 | ) | | | (27 | ) |
| Unwinding of discount | | | 4 | | | | 15 | | | | – | | | | – | | | | 2 | | | | 21 | |
| Utilised | | | (25 | ) | | | (51 | ) | | | (12 | ) | | | (32 | ) | | | (8 | ) | | | (128 | ) |
| |
At 31 March 2007 | | | 70 | | | | 372 | | | | 1 | | | | 56 | | | | 95 | | | | 594 | |
| |
Provisions have been analysed as current and non-current as follows:
| | | | | | | | | |
| |
| | | 2007 | | | 2006 | |
| | | £m | | | £m | |
| |
| Current | | | 167 | | | | 235 | |
| Non-current | | | 427 | | | | 536 | |
| |
| | | | 594 | | | | 771 | |
| |
Decommissioning provision
The decommissioning provision of £70m at 31 March 2007 primarily represented the net present value of the estimated expenditure (discounted at a nominal rate of 5.3%) expected to be incurred in respect of the decommissioning of certain nuclear generating units. It also included £9m relating to other asset retirement obligations. Expenditure is expected to be incurred between financial years 2008 and 2015.
Environmental provision
The environmental provision represents the estimated environmental restoration and remediation costs relating to a number of sites owned and managed by subsidiary undertakings.
At 31 March 2007, £168m (2006: £193m) of the environmental provision represented the net present value of the estimated statutory decontamination costs of old gas manufacturing sites in the UK (discounted using a nominal rate of 5.6%). The anticipated timing of the cash flows for statutory decontamination cannot be predicted with certainty, but they are expected to be incurred over the financial years 2008 to 2058 with some 69% of the spend projected to be spent over the next five years.
There are a number of uncertainties that affect the calculation of the provision for UK gas site decontamination, including the impact of regulation, the accuracy of the site surveys, unexpected contaminants, transportation costs, the impact of alternative technologies and changes in the discount rate. We have made our best estimate of the financial effect of these uncertainties in the calculation of the provision, but future material changes in any of the assumptions could materially impact on the calculation of the provision and hence the income statement.
The undiscounted amount of the provision at 31 March 2007 relating to UK gas site decontamination was £246m (2006: £239m), being the undiscounted best estimate of the liability having regard to the uncertainties referred to above.
The environmental provision at 31 March 2007 also included £200m (2006: £227m) which represents the net present value of estimated remediation expenditure in the US that has been discounted at a nominal rate of 6.0%. This expenditure is expected to be incurred between financial years 2008 and 2047. The uncertainties regarding the calculation of this provision are similar to those considered in respect of UK gas decontamination. However, unlike the UK, with the exception of immaterial amounts of such costs, this expenditure is expected to be recoverable from rate payers under the terms of various rate agreements in the US.
The undiscounted amount of the environmental provision relating to US sites amounted to £296m at 31 March 2007 (2006: £333m). We do not have sufficient information to calculate a range of outcomes, but it is expected that any outcome of the liability would be recovered from rate payers (with the exception of immaterial amounts of site costs).
The remainder of the environmental provision of £4m (2006: £9m) related to the expected cost of remediation of certain other sites in the UK. This is calculated on an undiscounted basis and is expected to be utilised within the next five years.
The undiscounted amount of the total environmental provision at 31 March 2007 is £546m (2006: £581m).
Annual Report and Accounts 2006/07145
30. Provisions (continued)
Emissions provision
The provision for emission costs is expected to be settled using emission allowances granted which are reported as an intangible asset.
Restructuring provision
At 31 March 2007, £31m of the total restructuring provision (2006: £34m) consisted of provisions for the disposal of surplus leasehold interests and rates payable on surplus properties. The remainder of the restructuring provision related to business reorganisation costs in the UK, to be paid between financial years 2008 and 2016.
Other provisions
Other provisions at 31 March 2007 included £49m (2006: £51m) of estimated liabilities in respect of past events insured by insurance subsidiary undertakings, including employer liability claims. In accordance with insurance industry practice, these estimates are based on experience from previous years and there is, therefore, no identifiable payment date. Other provisions at 31 March 2007 also included £24m (2006: £28m) in respect of the sales of four UK gas distribution networks relating to property transfer costs; and £11m (2006: £11m) in respect of obligations associated with the impairment of investments in joint ventures.
31. Share capital
| | | | | | | | | |
| |
| | | Allotted, called up |
| | | and fully paid |
| Ordinary shares | | millions | | | £m | |
| |
| At 1 April 2004 | | | 3,088 | | | | 309 | |
| Issued during the year | | | 2 | | | | – | |
| |
| At 31 March 2005 | | | 3,090 | | | | 309 | |
| Issued during the year | | | 8 | | | | 1 | |
| Effect of share consolidation (i) | | | (378 | ) | | | – | |
| |
| At 31 March 2006 | | | 2,720 | | | | 310 | |
| Issued during the year | | | 4 | | | | – | |
| Repurchased during the year (ii) | | | (23 | ) | | | (2 | ) |
| |
At 31 March 2007 | | | 2,701 | | | | 308 | |
| |
| | |
| (i) | | On 29 July 2005, the ordinary share capital was consolidated with 43 new ordinary shares of 1117/43 pence each issued for every 49 existing ordinary shares of 10 pence each cancelled. |
| (ii) | | From 20 November 2006 to 22 March 2007, the Company repurchased, and subsequently cancelled, under its share buy-back programme 22,388,381 ordinary shares for aggregate consideration of £169m, including transaction costs. The shares repurchased have a nominal value of 1117/43 pence each and represented 1% of the ordinary shares in issue as at 31 March 2007. The excess of the consideration over the nominal value has been charged against retained earnings. |
The total consideration received in respect of ordinary shares issued during the year ended 31 March 2007 was £16m (2006: £28m; 2005: £9m).
In June 2005, we issued a Circular to Shareholders, dated 6 June 2005, outlining a £2bn return of cash to shareholders by way of a B share scheme. Shareholders were issued one B share (a non-cumulative preference share of 10 pence nominal value per share) for every existing ordinary share they held. Shareholders then had choices in respect of the B shares and the return of cash, details of which were set out in the Circular to Shareholders.
At the same time that the B shares were issued, the ordinary shares were consolidated to reflect the return of cash. Shareholders received 43 new ordinary shares (of 1117/43 pence nominal value per share) for every 49 existing ordinary shares (of 10 pence nominal value per share) held on the record date of 29 July 2005. This resulted in the existing 3,091,247,761 issued ordinary shares of 10 pence each, at 29 July 2005, being replaced by a total of 2,712,727,627 new ordinary shares of 1117/43 pence each. In addition, 3,091,247,761 B shares of 10 pence each were also issued. To facilitate the above, the authorised share capital of the Company was increased from £500m to £815m by the creation of 3,150m B shares of 10 pence each.
At 31 March 2007 and 31 March 2006, the authorised share capital of the Company was £815m (4,388m ordinary shares of 1117/43 pence each and 3,150m B shares of 10 pence each). At 31 March 2005, the authorised share capital of the Company was £500m (5,000m ordinary shares of 10 pence each).
146National Grid plc
31. Share capital (continued)
Share option and award plans
We operate three principal forms of share option and award plans. They are an employee Sharesave scheme, a Performance Share Plan (PSP) and the Deferred Share Plan.
In any 10 year period, the maximum number of shares that may be issued or issuable pursuant to the exercise of options under all of the share option plans may not exceed the number of shares representing 10% of the issued ordinary share capital.
The Sharesave scheme is savings-related where, under normal circumstances, share options are exercisable on completion of a three and/or five year Save-As-You-Earn contract. The exercise price of options granted represents 80% of the market price at the date the option was granted.
Under the PSP, awards have been made to Executive Directors and approximately 350 senior employees. Awards made in 2004 are subject to Total Shareholder Return (TSR) performance based on a comparator group of UK and international utilities over a three year period. For awards made in 2005 and 2006, the criteria was amended so that 50% is based on the Company’s TSR performance when compared to the FTSE 100 and 50% is based on the annualised growth of the Company’s EPS. Awards are delivered in National Grid plc shares. At 31 March 2007 the number of conditional awards of ordinary share equivalents outstanding under the PSP was 7,979,436 (2006: 9,235,636; 2005: 6,653,420) of which nil (2006: nil; 2005: nil) were available for release. The number of conditional awards during the year ended 31 March 2007 was 2,624,055 (2006: 3,066,047; 2005: 3,635,062) with lapses/forfeits during the year of 3,833,775 (2006: 478,324; 2005: 436,700) and vestings during the year of 50,840 (2006: nil; 2005: 2,997).
Under the Deferred Share Plan, one half of any bonus earned by Executive Directors and a predetermined part of any bonus earned by UK senior employees is automatically deferred into National Grid shares. The shares are held in trust for three years before release. At 31 March 2007 the number of conditional awards of ordinary share equivalents was 395,629 of which 99,140 were available for release. The number of conditional awards during the year ended 31 March 2007 was 409,461 with 13,832 vested during the year.
In addition we have a number of historical plans under which awards are still outstanding but no further awards are being granted. These include the Executive Plan, the Share Matching Plan and the Transitional Share Awards and Special Share Awards.
The Executive Plan applied to senior executives, including Executive Directors. Options granted for the 1999/2000 financial year were subject to the achievement of performance targets related to earnings per share growth over a three year period and have now vested. Options granted for the 2000/01 financial year and thereafter are subject to the achievement of performance targets related to total shareholder return over a three year period. The share options are generally exercisable between the third and tenth anniversaries of the date of grant if the relevant performance target is achieved. The 2000 awards remain unvested.
The Share Matching Plan applied to Executive Directors and other senior employees whereby a predetermined part of each participant’s bonus entitlement was automatically deferred into National Grid plc shares (known as qualifying shares) and a matching award may be exercised under the Plan after a three year period provided the Director or senior employee is still employed by the Company or its subsidiary undertakings. At 31 March 2007 the number of options over ordinary shares outstanding under the Share Matching Plan was 383,848 (2006: 435,583; 2005: 341,482) of which 163,616 (2006: 45,384; 2005: 28,534) were exercisable. No options were granted during the year ended 31 March 2007 (2006: 149,232; 2005: 171,460) with lapses during the year of nil (2006: 1,489; 2005: nil) and exercises during the year of 51,735 (2006: 53,642; 2005: 42,163).
The Transitional Share Awards and Special Share Awards were made during the year ended 31 March 2005 to wireless employees and had a vesting period of four and two years respectively, provided the employee was still employed by the Company or its subsidiary undertakings. The number of awards made during the year ended 31 March 2005 were 188,650 and 45,700 respectively. At 31 March 2007 the number of conditional awards of ordinary share equivalents outstanding in relation to the Transitional Share Award and Special Share Awards were 77,293 (2006: 121,170; 2005: 188,650) and nil (2006: 11,000; 2005: 45,700) with lapses during the year of 5,894 (2006: 22,560; 2005: nil) and nil (2006: 16,825; 2005: nil) and vestings during the year of 38,793 (2006: 44,110; 2005: nil) and 11,000 (2006: 17,875; 2005: nil) respectively. Following the sale of the UK wireless infrastructure operations it was agreed that the outstanding share equivalents vested in full on completion of the disposal.
Annual Report and Accounts 2006/07147
31. Share capital (continued)
Movement in options to subscribe for ordinary shares under the Company’s various options schemes for the three years ended 31 March 2007 is shown below and includes those options related to shares issued to employee benefit trusts:
| | | | | | | | | | | | | | | | | | | | | |
| |
| | | Sharesave | | Executive Plan | | Total | |
| | | scheme options | | options | | options | |
| | | Weighted | | | | | | | Weighted | | | | | | | | |
| | | average | | | | | | | average | | | | | | | | |
| | | price | | | | | | | price | | | | | | | | |
| | | £ | | | millions | | | £ | | | millions | | | millions | |
| |
| At 31 March 2004 | | | 3.32 | | | | 31.7 | | | | 4.84 | | | | 12.0 | | | | 43.7 | |
| Granted | | | 3.83 | | | | 4.8 | | | | – | | | | – | | | | 4.8 | |
| Lapsed – expired | | | 3.36 | | | | (1.5 | ) | | | 5.02 | | | | (1.1 | ) | | | (2.6 | ) |
| Exercised | | | 3.37 | | | | (3.8 | ) | | | 3.90 | | | | (0.5 | ) | | | (4.3 | ) |
| |
| At 31 March 2005 | | | 3.35 | | | | 31.2 | | | | 4.86 | | | | 10.4 | | | | 41.6 | |
| Granted | | | 4.34 | | | | 5.6 | | | | – | | | | – | | | | 5.6 | |
| Lapsed – expired | | | 3.33 | | | | (4.1 | ) | | | 4.32 | | | | (0.9 | ) | | | (5.0 | ) |
| Exercised | | | 3.25 | | | | (12.8 | ) | | | 4.04 | | | | (2.3 | ) | | | (15.1 | ) |
| |
| At 31 March 2006 | | | 3.68 | | | | 19.9 | | | | 5.01 | | | | 7.2 | | | | 27.1 | |
| Granted | | | 5.58 | | | | 4.2 | | | | – | | | | – | | | | 4.2 | |
| Lapsed – expired | | | 3.82 | | | | (0.9 | ) | | | 5.48 | | | | (1.9 | ) | | | (2.8 | ) |
| Exercised | | | 3.43 | | | | (1.9 | ) | | | 5.00 | | | | (2.1 | ) | | | (4.0 | ) |
| |
At 31 March 2007 | | | 4.07 | | | | 21.3 | | | | 4.74 | | | | 3.2 | | | | 24.5 | |
| |
Included within options outstanding at 31 March 2007, 31 March 2006 and 31 March 2005 were the following options that were exercisable:
| | | | | | | | | | | | | | | | | | | | | |
At 31 March 2007 | | | 3.17 | | | | 4.1 | | | | 4.63 | | | | 2.4 | | | | 6.5 | |
| |
| At 31 March 2006 | | | 3.24 | | | | 0.5 | | | | 5.03 | | | | 7.1 | | | | 7.6 | |
| |
| At 31 March 2005 | | | 3.25 | | | | 0.3 | | | | 4.99 | | | | 6.3 | | | | 6.6 | |
| |
The weighted average remaining contractual life of options in the employee Sharesave scheme at 31 March 2007 was 3 years and 1 month. These options have exercise prices between £3.15 and £5.58.
The weighted average share price at the exercise dates was as follows:
| | | | | | | | | | | | | |
| |
| | | 2007 | | | 2006 | | | 2005 | |
| | | £ | | | £ | | | £ | |
| |
| Sharesave scheme options | | | 6.50 | | | | 5.89 | | | | 4.49 | |
| Executive Plan options | | | 6.68 | | | | 5.50 | | | | 4.65 | |
| |
Options outstanding and exercisable and their weighted average exercise prices for the respective ranges of exercise prices and years at 31 March 2007 are as follows:
| | | | | | | | | | | | | | | | �� | | | | | | | | | |
| |
| | | Weighted average | | | | | | | Weighted average | | | | | | | | | | |
| | | exercise price of | | | Number | | | exercise price of | | | Number | | | Exercise price | | | Normal dates | |
| | | exercisable options | | | exercisable | | | outstanding options | | | outstanding | | | per share | | | of exercise | |
| | | £ | | | millions | | | £ | | | millions | | | pence | | | years | |
| |
| Executive Plan | | | 2.81 | | | | 0.2 | | | | 2.81 | | | | 0.2 | | | | 258.0 - 280.5 | | | | 2001 - 2008 | |
| | | | 3.82 | | | | 0.3 | | | | 3.82 | | | | 0.3 | | | | 375.8 - 490.0 | | | | 2002 - 2009 | |
| | | | 5.34 | | | | 0.4 | | | | 5.34 | | | | 0.4 | | | | 424.0 - 566.5 | | | | 2003 - 2010 | |
| | | | 5.28 | | | | 0.1 | | | | 5.31 | | | | 0.8 | | | | 526.0 - 623.0 | | | | 2004 - 2011 | |
| | | | 4.71 | | | | 1.4 | | | | 4.71 | | | | 1.4 | | | | 434.3 - 481.5 | | | | 2006 - 2013 | |
| | | | 4.05 | | | | – | | | | 4.05 | | | | 0.1 | | | | 405.0 | | | | 2007 - 2014 | |
| |
| | | | 4.63 | | | | 2.4 | | | | 4.74 | | | | 3.2 | | | | | | | | | |
| |
Cash of £16m (2006: £54m; 2005: £13m) was received on exercise of all share options during the year. The tax benefits realised from stock options exercised during the year was £5m (2006: £5m; 2005: £nil).
The aggregate intrinsic value of all options outstanding and exercisable at 31 March 2007 amounted to £115m and £29m respectively.
Share-based payment charges
Under IFRS, a charge is made to the income statement based on the fair value of grants in accordance with IFRS 2 ‘Share-based Payment’. All share awards are equity settled.
The charge to the income statement for the year ended 31 March 2007 was £15m (2006: £17m; 2005: £16m). The related tax (charge)/benefit recognised in the income statement was £(9)m (2006: £2m; 2005: £7m).
148National Grid plc
31. Share capital (continued)
Awards under share option plans
The average share prices at the date of options being granted during each of the three financial years ended 31 March were as follows:
| | | | | | | | | | | | | |
| |
| | | 2007 | | | 2006 | | | 2005 | |
| |
| Where the exercise price is less than the market price at the date of grant | | | 746.0p | | | | 569.0p | | | | 496.0p | |
| |
The average exercise prices of the options granted during each of the three financial years ended 31 March were as follows:
| | | | | | | | | | | | | |
| |
| | | 2007 | | | 2006 | | | 2005 | |
| |
| Where the exercise price is less than the market price at the date of grant | | | 558.0p | | | | 434.0p | | | | 383.0p | |
| |
The average fair values of the options granted during each of the three financial years ended 31 March were estimated as follows:
| | | | | | | | | | | | | |
| |
| | | 2007 | | | 2006 | | | 2005 | |
| |
| Where the exercise price is less than the market price at the date of grant | | | 166.8p | | | | 128.0p | | | | 90.4p | |
| |
The fair values of the options granted were estimated using the following principal assumptions:
| | | | | | | | | | | | | |
| |
| | | 2007 | | | 2006 | | | 2005 | |
| |
| Dividend yield (%) | | | 4.5 | | | | 4.5 | | | | 5.5-5.8 | |
| Volatility (%) | | | 15.6-18.9 | | | | 15.6-18.9 | | | | 15.4 | |
| Risk-free investment rate (%) | | | 4.2 | | | | 4.2 | | | | 4.5 | |
| Average life (years) | | | 3.9 | | | | 4.3 | | | | 4.0 | |
| |
The fair values of awards under the Sharesave scheme have been calculated using the Black-Scholes European model for awards made prior to 1 April 2006. This is considered appropriate given the short exercise window of sharesave options. The fair value of awards made in 2007 have been calculated by reference to the prior year’s Black-Scholes European model calculation.
Volatility has been derived based on the following:
| (i) | | implied volatility in traded options over the Company’s shares; |
| (ii) | | historical volatility of the Company’s shares from October 2002 (the date of the business combination with Lattice Group plc); and |
| (iii) | | implied volatility of comparator companies where options in their shares are traded. |
Volatility is assumed to revert from its current implied level to its long run mean, based on historical volatility under (ii) above.
Awards under other share scheme plans
The average share prices and fair values at the date share awards were granted during each of the three financial years ended 31 March were as follows:
| | | | | | | | | | | | | |
| |
| | | 2007 | | | 2006 | | | 2005 | |
| |
| Average share price | | | 594.0p | | | | 535.6p | | | | 431.7p | |
| Average fair value | | | 403.1p | | | | 358.0p | | | | 210.6p | |
| |
The fair values of the awards granted were estimated using the following principal assumptions:
| | | | | | | | | | | | | |
| |
| | | 2007 | | | 2006 | | | 2005 | |
| |
| Dividend yield (%) | | | 4.4 | | | | 4.4 | | | | 5.3-5.7 | |
| Volatility (%) | | | 19.9 | | | | 19.9 | | | | 15.4 | |
| Risk-free investment rate (%) | | | 4.1 | | | | 4.1 | | | | 4.5-5.2 | |
| |
Fair values have been calculated using a Monte Carlo simulation model for awards with total shareholder return performance conditions made prior to 1 April 2006. The fair value of awards made in 2007 has been calculated by reference to the prior year’s Monte Carlo simulation model calculation. Fair values of awards with performance conditions based on earnings per share have been calculated using the share price at date of grant less the present value of dividends foregone during the performance period.
For other share scheme awards, where the primary vesting condition is that employees complete a specified number of years service, the fair value has been calculated as the share price at date of grant, adjusted to recognise the extent to which participants do not receive dividends over the vesting period.
Volatility for share awards has been calculated on the same basis as used for share options, as described above.
Annual Report and Accounts 2006/07149
32. Reconciliation of movements in total equity
| | | | | | | | | | | | | | | | | | | | | | | | | | | | | | | | | | | | | | | | | |
| |
| | | | | | | | | | | | | | | | | | | | | | | Available- | | | | | | | | | | | | | | |
| | | Called-up | | | Share | | | | | | | | | | | Cash flow | | | for-sale | | | | | | | Total | | | | | | | |
| | | share | | | premium | | | Retained | | | Translation | | | hedge | | | investment | | | Other | | | shareholders’ | | | Minority | | | Total | |
| | | capital | | | account | | | earnings | | | reserve | | | reserve | | | reserve | | | reserves | | | equity | | | interests | | | equity | |
| | | £m | | | £m | | | £m | | | £m | | | £m | | | £m | | | £m | | | £m | | | £m | | | £m | |
| |
| At 1 April 2004 | | | 309 | | | | 1,280 | | | | 4,642 | | | | – | | | | – | | | | – | | | | (5,131 | ) | | | 1,100 | | | | 10 | | | | 1,110 | |
Net income/(expense) recognised
directly in equity | | | – | | | | – | | | | 187 | | | | (6 | ) | | | – | | | | – | | | | – | | | | 181 | | | | – | | | | 181 | |
| Profit for the year | | | – | | | | – | | | | 1,424 | | | | – | | | | – | | | | – | | | | – | | | | 1,424 | | | | – | | | | 1,424 | |
| Equity dividends | | | – | | | | – | | | | (628 | ) | | | – | | | | – | | | | – | | | | – | | | | (628 | ) | | | – | | | | (628 | ) |
| Issue of ordinary share capital | | | – | | | | 9 | | | | – | | | | – | | | | – | | | | – | | | | – | | | | 9 | | | | – | | | | 9 | |
| Movement in shares held by employee share trusts | | | – | | | | – | | | | 5 | | | | – | | | | – | | | | – | | | | – | | | | 5 | | | | – | | | | 5 | |
| Share-based payment | | | – | | | | – | | | | 16 | | | | – | | | | – | | | | – | | | | – | | | | 16 | | | | – | | | | 16 | |
| Tax on share-based payment | | | – | | | | – | | | | 4 | | | | – | | | | – | | | | – | | | | – | | | | 4 | | | | – | | | | 4 | |
| |
| At 31 March 2005 | | | 309 | | | | 1,289 | | | | 5,650 | | | | (6 | ) | | | – | | | | – | | | | (5,131 | ) | | | 2,111 | | | | 10 | | | | 2,121 | |
| Adoption of IAS 39 | | | – | | | | – | | | | (91 | ) | | | (7 | ) | | | 51 | | | | 4 | | | | – | | | | (43 | ) | | | – | | | | (43 | ) |
| |
| At 1 April 2005 | | | 309 | | | | 1,289 | | | | 5,559 | | | | (13 | ) | | | 51 | | | | 4 | | | | (5,131 | ) | | | 2,068 | | | | 10 | | | | 2,078 | |
| Net income/(expense) recognised directly in equity | | | – | | | | – | | | | 121 | | | | 140 | | | | (14 | ) | | | 2 | | | | – | | | | 249 | | | | 1 | | | | 250 | |
| Profit for the year | | | – | | | | – | | | | 3,848 | | | | – | | | | – | | | | – | | | | – | | | | 3,848 | | | | 2 | | | | 3,850 | |
| Equity dividends | | | – | | | | – | | | | (745 | ) | | | – | | | | – | | | | – | | | | – | | | | (745 | ) | | | – | | | | (745 | ) |
| Return of capital to shareholders through B share scheme | | | – | | | | – | | | | (2,009 | ) | | | – | | | | – | | | | – | | | | – | | | | (2,009 | ) | | | – | | | | (2,009 | ) |
| Issue of ordinary share capital | | | 1 | | | | 27 | | | | – | | | | – | | | | – | | | | – | | | | – | | | | 28 | | | | – | | | | 28 | |
| Other movements in minority interests | | | – | | | | – | | | | – | | | | – | | | | – | | | | – | | | | – | | | | – | | | | (2 | ) | | | (2 | ) |
| Movement in shares held in employee share trusts | | | – | | | | – | | | | 19 | | | | – | | | | – | | | | – | | | | – | | | | 19 | | | | – | | | | 19 | |
| Share-based payment | | | – | | | | – | | | | 17 | | | | – | | | | – | | | | – | | | | – | | | | 17 | | | | – | | | | 17 | |
| Tax on share-based payment | | | – | | | | – | | | | 7 | | | | – | | | | – | | | | – | | | | – | | | | 7 | | | | – | | | | 7 | |
| |
| At 31 March 2006 | | | 310 | | | | 1,316 | | | | 6,817 | | | | 127 | | | | 37 | | | | 6 | | | | (5,131 | ) | | | 3,482 | | | | 11 | | | | 3,493 | |
| Net income/(expense) recognised directly in equity | | | – | | | | – | | | | 295 | | | | (175 | ) | | | (11 | ) | | | (5 | ) | | | – | | | | 104 | | | | (1 | ) | | | 103 | |
| Profit for the year | | | – | | | | – | | | | 1,394 | | | | – | | | | – | | | | – | | | | – | | | | 1,394 | | | | 2 | | | | 1,396 | |
| Equity dividends | | | – | | | | – | | | | (730 | ) | | | – | | | | – | | | | – | | | | – | | | | (730 | ) | | | – | | | | (730 | ) |
| Issue of ordinary share capital | | | – | | | | 16 | | | | – | | | | – | | | | – | | | | – | | | | – | | | | 16 | | | | – | | | | 16 | |
| Repurchase of shares | | | (2 | ) | | | – | | | | (169 | ) | | | – | | | | – | | | | – | | | | 2 | | | | (169 | ) | | | – | | | | (169 | ) |
| Other movements in minority interests | | | – | | | | – | | | | – | | | | – | | | | – | | | | – | | | | – | | | | – | | | | (1 | ) | | | (1 | ) |
| Share-based payment | | | – | | | | – | | | | 15 | | | | – | | | | – | | | | – | | | | – | | | | 15 | | | | – | | | | 15 | |
| Tax on share-based payment | | | – | | | | – | | | | 13 | | | | – | | | | – | | | | – | | | | – | | | | 13 | | | | – | | | | 13 | |
| |
At 31 March 2007 | | | 308 | | | | 1,332 | | | | 7,635 | | | | (48 | ) | | | 26 | | | | 1 | | | | (5,129 | ) | | | 4,125 | | | | 11 | | | | 4,136 | |
| |
As at 31 March 2007 and 31 March 2006 the Company and its subsidiary undertakings had nil own shares included in retained earnings. As at 31 March 2005, own shares were included in the retained earnings reserve related to seven million 10p ordinary shares in National Grid plc, held by employee share trusts for the purpose of satisfying certain obligations under various share option schemes operated by National Grid. The carrying value of £29m (market value £33m) represented the exercise amounts receivable in respect of those shares that were issued at market value by the Company and the cost in respect of those shares purchased in the open market. Funding was provided to the trusts by subsidiary undertakings. The trusts waived their rights to dividends on those shares.
Other reserves primarily represent the difference between the carrying value of subsidiary undertakings, investments and their respective capital structures following the Lattice demerger from BG Group plc and the 1999 Lattice refinancing of £(5,745)m. The reserve also included merger differences of £221m and £359m together with unrealised gains of £32m on transfer of fixed assets to a former joint venture which subsequently became a subsidiary undertaking.
Gains and losses recognised in the cash flow hedge reserve on interest rate swap contracts as of 31 March 2007 will be continuously transferred to the income statement until the borrowings are repaid (note 27).
The amount of the cash flow hedge reserve due to be released from reserves to the income statement within the next year is £10m, with the remaining amount due to be released with the same maturity profile as borrowings in note 27.
150National Grid plc
33. Consolidated cash flow statement
a) Cash flow from operating activities – discontinued operations
| | | | | | | | | | | | | |
| |
| | | 2007 | | | 2006 | | | 2005 | |
| | | £m | | | £m | | | £m | |
| |
| Operating profit | | | 62 | | | | 111 | | | | 465 | |
| Adjustments for: | | | | | | | | | | | | |
| Exceptional items | | | 55 | | | | 20 | | | | 87 | |
| Depreciation and amortisation | | | 72 | | | | 77 | | | | 213 | |
| Share-based payment charge | | | – | | | | 3 | | | | 4 | |
| Changes in working capital, provisions and pensions | | | (8 | ) | | | (47 | ) | | | (50 | ) |
| Cash flow relating to exceptional items | | | – | | | | (26 | ) | | | (81 | ) |
| |
Cash flow relating to discontinued operations | | | 181 | | | | 138 | | | | 638 | |
| |
b) Reconciliation of net cash flow to movement in net debt
| | | | | | | | | | | | | |
| |
| | | 2007 | | | 2006 | | | 2005 | |
| | | £m | | | £m | | | £m | |
| |
| Movement in cash and cash equivalents | | | 175 | | | | 1,181 | | | | 8 | |
| Increase/(decrease) in financial investments | | | 1,725 | | | | (25 | ) | | | 59 | |
| (Increase)/decrease in borrowings and derivatives | | | (3,045 | ) | | | 2,304 | | | | (1,052 | ) |
| Cash paid to shareholders under B share scheme | | | 26 | | | | 1,957 | | | | – | |
| Net interest paid (i) | | | 597 | | | | 704 | | | | n/a | |
| |
| Change in net debt resulting from cash flows | | | (522 | ) | | | 6,121 | | | | (985 | ) |
| Exchange adjustments (i) | | | – | | | | – | | | | 112 | |
| Changes in fair value of financial assets and liabilities and exchange movements (i) | | | 331 | | | | (299 | ) | | | n/a | |
| Issue of B shares | | | – | | | | (2,009 | ) | | | – | |
| Net interest charge (i) | | | (655 | ) | | | (660 | ) | | | n/a | |
| Acquisition of subsidiary undertaking | | | (48 | ) | | | – | | | | – | |
| Amounts reclassified to businesses held for sale | | | (42 | ) | | | – | | | | – | |
| Other non-cash movements | | | (2 | ) | | | (17 | ) | | | (28 | ) |
| |
| Movement in net debt (net of related derivative financial instruments) in the year | | | (938 | ) | | | 3,136 | | | | (901 | ) |
| Net debt at start of year | | | (10,850 | ) | | | (13,638 | ) | | | (12,737 | ) |
| Impact of adoption of IAS 32 and IAS 39 (i) | | | – | | | | (348 | ) | | | – | |
| |
| Net debt (net of related derivative financial instruments) at end of year | | | (11,788 | ) | | | (10,850 | ) | | | (13,638 | ) |
| |
| | |
| (i) | | The adoption of IAS 39 resulted in changes to the carrying value of borrowings and financial investments as at 1 April 2005. |
c) Analysis of changes in net debt
| | | | | | | | | | | | | | | | | | | | | |
| |
| | | | | | | | | | | | | | | Other | | | | |
| | | At 1 April | | | Cash | | | Exchange | | | non-cash | | | At 31 March | |
| | | 2004 | | | flow | | | adjustments | | | movements | | | 2005 | |
| | | £m | | | £m | | | £m | | | £m | | | £m | |
| |
| Cash and cash equivalents | | | 273 | | | | – | | | | (1 | ) | | | – | | | | 272 | |
| Bank overdrafts | | | (26 | ) | | | 8 | | | | – | | | | – | | | | (18 | ) |
| |
| | | | 247 | | | | 8 | | | | (1 | ) | | | – | | | | 254 | |
| Financial investments | | | 343 | | | | 59 | | | | (4 | ) | | | – | | | | 398 | |
| Borrowings | | | (13,327 | ) | | | (1,052 | ) | | | 117 | | | | (28 | ) | | | (14,290 | ) |
| |
| | | | (12,737 | ) | | | (985 | ) | | | 112 | | | | (28 | ) | | | (13,638 | ) |
| |
| | | | | | | | | | | | | | | | | | | | | | | | | | | | | | | | | |
| |
| | | | | | | Impact of | | | | | | | | | | | | | | | | | | | | | | |
| | | | | | | adoption of | | | | | | | Fair | | | | | | | | | | | Other | | | | |
| | | At 1 April | | | IAS 32 and | | | Cash | | | value gains | | | Issue of | | | Interest | | | non-cash | | | At 31 March | |
| | | 2005 | | | IAS 39 (i) | | | flow | | | and losses | | | B shares | | | charges | | | movements | | | 2006 | |
| | | £m | | | £m | | | £m | | | £m | | | £m | | | £m | | | £m | | | £m | |
| |
| Cash and cash equivalents | | | 272 | | | | – | | | | 1,166 | | | | 14 | | | | – | | | | – | | | | – | | | | 1,452 | |
| Bank overdrafts | | | (18 | ) | | | – | | | | 15 | | | | – | | | | – | | | | – | | | | – | | | | (3 | ) |
| |
| | | | 254 | | | | – | | | | 1,181 | | | | 14 | | | | – | | | | – | | | | – | | | | 1,449 | |
| Financial investments (ii) | | | 398 | | | | 3 | | | | (155 | ) | | | 3 | | | | – | | | | 135 | | | | – | | | | 384 | |
| Borrowings (ii) | | | (14,290 | ) | | | (894 | ) | | | 5,037 | | | | (207 | ) | | | (2,009 | ) | | | (746 | ) | | | (17 | ) | | | (13,126 | ) |
| Derivatives (ii) | | | – | | | | 543 | | | | 58 | | | | (109 | ) | | | – | | | | (49 | ) | | | – | | | | 443 | |
| |
| | | | (13,638 | ) | | | (348 | ) | | | 6,121 | | | | (299 | ) | | | (2,009 | ) | | | (660 | ) | | | (17 | ) | | | (10,850 | ) |
| |
| | | | | | | | | | | | | | | | | | | | | | | | | |
| |
| | | | | | | | | | | Fair | | | | | | | Other | | | | |
| | | At 1 April | | | Cash | | | value gains | | | Interest | | | non-cash | | | At 31 March | |
| | | 2006 | | | flow | | | and losses | | | charges | | | movements | | | 2007 | |
| | | £m | | | £m | | | £m | | | £m | | | £m | | | £m | |
| |
| Cash and cash equivalents | | | 1,452 | | | | 178 | | | | (14 | ) | | | – | | | | (23 | ) | | | 1,593 | |
| Bank overdrafts | | | (3 | ) | | | (3 | ) | | | – | | | | – | | | | – | | | | (6 | ) |
| |
| | | | 1,449 | | | | 175 | | | | (14 | ) | | | – | | | | (23 | ) | | | 1,587 | |
| Financial investments (ii) | | | 384 | | | | 1,509 | | | | (9 | ) | | | 215 | | | | (1 | ) | | | 2,098 | |
| Borrowings (ii) | | | (13,126 | ) | | | (2,233 | ) | | | 511 | | | | (833 | ) | | | (30 | ) | | | (15,711 | ) |
| Derivatives (ii) | | | 443 | | | | 27 | | | | (157 | ) | | | (37 | ) | | | (38 | ) | | | 238 | |
| |
| | | | (10,850 | ) | | | (522 | ) | | | 331 | | | | (655 | ) | | | (92 | ) | | | (11,788 | ) |
| |
| | |
| (i) | | There are no comparatives for net debt-related derivative assets and liabilities at 31 March 2005 as National Grid adopted IAS 39 with effect from 1 April 2005 consistent with the requirements of IFRS 1. The adoption of IAS 39 also resulted in changes to the carrying value of borrowings and financial investments as at 1 April 2005. |
| (ii) | | Includes interest. |
Annual Report and Accounts 2006/07151
34. Related party transactions
The following information is provided in accordance with IAS 24, Related Party Disclosures, as being material transactions with related parties during the year. These transactions are with joint ventures and a pension plan and were in the normal course of business and are summarised below:
| | | | | | | | | | | | | |
| |
| | | 2007 | | | 2006 | | | 2005 | |
| | | £m | | | £m | | | £m | |
| |
| Sales: Services supplied to a pension plan | | | 4 | | | | 4 | | | | 4 | |
| | | | | | | | | | | | | |
| Purchases: Services received from joint ventures | | | 26 | | | | 32 | | | | 24 | |
| |
At 31 March 2007, there were amounts receivable and payable from and to related parties amounting to £nil (2006: £nil; 2005: £1m) and £2m (2006: £1m; 2005: £1m) respectively, which are due on normal commercial terms.
Details of investments in principal subsidiary undertakings and joint ventures are disclosed in note 36 and information relating to pension fund arrangements is disclosed in note 8. Details of Directors and key management remuneration is set out in note 6 and the Directors’ remuneration report.
35. Commitments and contingencies
a) Future capital expenditure
| | | | | | | | | |
| |
| | | 2007 | | | 2006 | |
| | | £m | | | £m | |
| |
| Contracted for but not provided | | | 1,554 | | | | 1,343 | |
| |
b) Lease commitments
Total commitments under non-cancellable operating leases were as follows:
| | | | | | | | | |
| |
| | | 2007 | | | 2006 | |
| | | £m | | | £m | |
| |
| In one year or less | | | 80 | | | | 87 | |
| In more than one year, but not more than two years | | | 76 | | | | 80 | |
| In more than two years, but not more than three years | | | 72 | | | | 75 | |
| In more than three years, but not more than four years | | | 68 | | | | 71 | |
| In more than four years, but not more than five years | | | 64 | | | | 67 | |
| In more than five years | | | 440 | | | | 451 | |
| |
| | | | 800 | | | | 831 | |
| |
c) Power commitments
At 31 March 2007, there were obligations to purchase energy under long-term contracts. The following table analyses these commitments, excluding commodity contracts carried at fair value (notes 28 and 29):
| | | | | | | | | |
| |
| | | 2007 | | | 2006 | |
| | | £m | | | £m | |
| |
| In one year or less | | | 1,233 | | | | 1,391 | |
| In more than one year, but not more than two years | | | 642 | | | | 821 | |
| In more than two years, but not more than three years | | | 476 | | | | 641 | |
| In more than three years, but not more than four years | | | 186 | | | | 494 | |
| In more than four years, but not more than five years | | | 141 | | | | 14 | |
| In more than five years | | | 1,053 | | | | 1,314 | |
| |
| | | | 3,731 | | | | 4,675 | |
| |
In addition, power commitments under commodity contracts recorded at fair value and incorporated in Other non-current liabilities were £389m (2006: £778m).
d) KeySpan
We have agreed to purchase KeySpan Corporation, a US utility company for $7.3bn (£3.7bn), conditional on regulatory approval.
e) Other commitments, contingencies and guarantees
The value of other commitments, contingencies and guarantees at 31 March 2007 amounted to £537m (2006: £334m), including guarantees amounting to £229m (2006: £149m) and commitments largely relating to gas purchasing and property remediation of £198m (2006: £114m). The value of other commitments and contingencies relating to businesses held for sale was £62m.
Details of the guarantees entered into by the Company or its subsidiary undertakings at 31 March 2007 are shown below:
| (i) | | a guarantee of £50m of the obligations of a subsidiary undertaking to make payments in respect of any liabilities under a meter operating contract that runs until May 2008; |
| (ii) | | an uncapped guarantee, for which the maximum liability is estimated at £40m, to The Crown Estates in support of the transfer of the interconnector between France and England to National Grid Interconnectors Limited as part of the Licence to Assign Lease. This is ongoing; |
| (iii) | | a guarantee in support of the payment obligations of a subsidiary undertaking in respect of a combined heat and power plant which will increase to approximately £40m in February 2010. This reduces following commissioning, expected to be in February 2010, by £2m per annum until it expires in 2027; |
152National Grid plc
35. Commitments and contingencies (continued)
e) Other commitments, contingencies and guarantees (continued)
| (iv) | | guarantees of £20m relating to certain property obligations of subsidiary undertakings. The bulk of these expire by December 2025; |
| (v) | | guarantees in respect of a former associate amounting to £14m, the bulk of which relates to its obligations to supply telecommunications services. These are open-ended; |
| (vi) | | a guarantee of the payment obligations of a subsidiary undertaking in respect of a power connection agreement amounting to a maximum potential payout of £14m subject to a cap of £7m per annum. This runs until December 2024; |
| (vii) | | indemnities estimated to be up to a maximum of £14m given to the trustees of a defined contribution pension scheme. These are open-ended; |
| (viii) | | a guarantee of the payment obligations of a subsidiary undertaking in respect of a nitrogen supply agreement amounting to a maximum potential payout of £12m subject to a cap of £1m per annum. This runs until November 2019; and |
| (ix) | | other guarantees amounting to £25m arising in the normal course of business and entered into on normal commercial terms. These guarantees run for varying lengths of time. |
Subsequent to 31 March 2007, we issued letters of support to third parties currently amounting to approximately £193m in total relating to the BritNed electricity interconnector project. In addition, we entered into a guarantee in favour of a third party of approximately £260m with respect to the construction contract for Phase III of the Grain LNG import terminal.
f) Amounts receivable under sublease arrangements
The total of future minimum sublease payments expected to be received under non-cancellable subleases is £32m (2006: £26m).
g) Litigation and claims
National Grid, together with the Environment Agency, sought judicial review to clarify the legal position with regard to the remediation of a site in Bawtry, Yorkshire, a former gas site which was not part of the assets that formed part of the gas privatisation in 1986 and therefore had never been owned by National Grid. On 17 May 2006, the High Court found in favour of the Environment Agency. However, the judgement concluded that the matters raised in the proceedings were of considerable general importance and permission to apply for leave to appeal directly to the House of Lords was granted.
A hearing before the House of Lords has been set for 21 and 22 May 2007 and a judgement is expected in the summer of 2007.
We remain convinced of our case that National Grid has no legal liability with respect to the site in Bawtry, nor for other former UK gas sites which did not form part of the assets we acquired at the time of privatisation, and believe that our position will be upheld by the House of Lords.
At this stage we are unable to estimate reliably the impact of an adverse decision.
36. Subsidiary undertakings and joint ventures
Principal subsidiary undertakings
The principal subsidiary undertakings included in the consolidated accounts at 31 March 2007 are listed below. These undertakings are wholly-owned and, unless otherwise indicated, are incorporated in Great Britain.
| | | |
| |
| | | Principal activity |
| |
| National Grid Gas plc (i) | | Gas transportation |
| National Grid Electricity Transmission plc (i) | | Transmission of electricity in England and Wales |
| New England Power Company (Incorporated in the US) (i) | | Transmission of electricity |
| Massachusetts Electric Company (Incorporated in the US) (i) | | Distribution of electricity |
| The Narragansett Electric Company (Incorporated in the US) (i) | | Distribution of electricity |
| Niagara Mohawk Power Corporation (Incorporated in the US) (i) | | Distribution and transmission of electricity and gas |
| National Grid Wireless No 2 Limited (i) (iii) | | Telecommunications infrastructure |
| National Grid Wireless Limited (i) (iii) | | Telecommunications and broadcast infrastructure |
| NGG Finance plc (ii) | | Financing |
| British Transco International Finance B.V. (Incorporated in The Netherlands) (i) | | Financing |
| National Grid Property Limited (i) | | Property |
| National Grid Holdings One plc (ii) | | Holding company |
| Lattice Group plc (i) | | Holding company |
| National Grid USA (Incorporated in the US) (i) | | Holding company |
| Niagara Mohawk Holdings Inc. (Incorporated in the US) (i) | | Holding company |
| National Grid Commercial Holdings Limited (i) | | Holding company |
| National Grid Gas Holdings plc (i) | | Holding company |
| National Grid (US) Holdings Limited (ii) | | Holding company |
| National Grid Holdings Limited (i) | | Holding company |
| |
| | |
| (i) | | Issued ordinary share capital held by subsidiary undertakings. |
| (ii) | | Issued ordinary share capital held by National Grid plc. |
| (iii) | | Included within wireless infrastructure operations in the UK which was sold on 3 April 2007. |
Principal joint venture
At 31 March 2006, the joint venture investment in 38.5% of the ordinary shares of Copperbelt Energy Corporation plc, a company involved in the transmission, distribution and supply of electricity in Zambia, was classified as an asset held for sale and the sale completion was made on 27 October 2006.
A full list of all subsidiary and associated undertakings is available from the Company Secretary and General Counsel of the Company.
Annual Report and Accounts 2006/07153
37. Subsequent events
On 3 April 2007, our wireless infrastructure operations in the UK were disposed of for cash proceeds of £2.5bn. In April 2007, we also agreed to the sale of our US wireless infrastructure operations with completion expected in the autumn of 2007 for proceeds of approximately $290m.
38. Differences between IFRS and US generally accepted accounting principles
National Grid prepares its consolidated financial statements in accordance with International Financial Reporting Standards (IFRS) as adopted by the European Union, which differ in certain respects from generally accepted accounting principles in the United States (US GAAP). IFRS as adopted by the European Union is materially the same as IFRS published by the International Accounting Standards Board (IASB).
The most significant difference between IFRS and US GAAP as it relates to National Grid is that the business combination with Lattice Group plc was accounted for as a merger (pooling of interests) under the then prevailing accounting standards generally accepted in the UK (UK GAAP). This accounting treatment of the transaction and its resulting account balances were retained at 1 April 2004, the date of transition to IFRS. Under US GAAP, this transaction was accounted for as an acquisition (purchase accounting) of Lattice Group plc. Consequently, under IFRS, the accounts represent the combined accounts of National Grid plc and Lattice Group plc on an historical cost basis for all periods presented. Under US GAAP, the accounts presented include Lattice Group plc and subsidiaries at fair value at the date of acquisition.
Condensed income statements, statements of comprehensive income and changes in shareholders’ equity and balance sheets in accordance with US GAAP disclosure requirements are presented in note 39. The balance sheets at 31 March 2006 and 31 March 2007 include the impact of the fair value of the acquired assets and liabilities of Lattice Group plc prepared under US GAAP at the date of acquisition. The effect of US GAAP adjustments on the profit for the financial year attributable to equity shareholders and shareholders’ equity is set out below.
Reconciliation of profit from IFRS to US GAAP
The following is a summary of the material adjustments to profit that would have been required if US GAAP had been applied instead of IFRS:
| | | | | | | | | | | | | | | | | |
| |
| | | | | | | 2007 | | | 2006 | * | | 2005 | * |
| | | Notes | | | £m | | | £m | | | £m | |
| |
Profit for the year attributable to equity shareholders under IFRS | | | | | | | 1,394 | | | | 3,848 | | | | 1,424 | |
Adjustments to conform with US GAAP | | | | | | | | | | | | | | | | |
| Purchase accounting | | | (a | ) | | | (124 | ) | | | (127 | ) | | | (176 | ) |
| US regulatory accounting | | | (b | ) | | | (474 | ) | | | (269 | ) | | | (246 | ) |
| Pensions and other post-retirement benefits | | | (c | ) | | | (94 | ) | | | (56 | ) | | | (21 | ) |
| Financial instruments | | | (d | ) | | | 160 | | | | (108 | ) | | | 254 | |
| Severance and onerous lease costs | | | (e | ) | | | 2 | | | | (63 | ) | | | 62 | |
| Revenue recognition | | | (f | ) | | | 5 | | | | (48 | ) | | | 5 | |
| Discounting of provisions | | | (i | ) | | | 3 | | | | (14 | ) | | | – | |
| Sale and leaseback | | | (k | ) | | | (19 | ) | | | – | | | | – | |
| Current tax | | | (l | ) | | | 15 | | | | – | | | | – | |
| Deferred taxation | | | (m | ) | | | 295 | | | | 208 | | | | 19 | |
| Other | | | (n | ) | | | 15 | | | | (1 | ) | | | 2 | |
| Discontinued operations | | | (a), (c), (d), (g), (h | ) | | | (32 | ) | | | (2,349 | ) | | | (51 | ) |
| Discontinued operations – deferred taxation | | | (m | ) | | | – | | | | 286 | | | | 16 | |
| | | | | | | | (248 | ) | | | (2,541 | ) | | | (136 | ) |
| |
Net income under US GAAP | | | | | | | 1,146 | | | | 1,307 | | | | 1,288 | |
| |
| | |
| * | | Reclassified as a result of businesses qualifying as discontinued operations in 2006/07. The 2005 comparatives have been restated due to the change in methodology for calculating net periodic pension charge, as described in note 38 (c) |
Reconciliation of shareholders’ equity from IFRS to US GAAP
The following is a summary of the material adjustments to shareholders’ equity that would have been required if US GAAP had been applied instead of IFRS:
| | | | | | | | | | | | | |
| |
| | | | | | | 2007 | | | 2006 | |
| | | Notes | | | £m | | | £m | |
| |
Total shareholders’ equity under IFRS | | | | | | | 4,125 | | | | 3,482 | |
Adjustments to conform with US GAAP | | | | | | | | | | | | |
| Purchase accounting – property, plant and equipment | | | (a | ) | | | 2,038 | | | | 2,162 | |
| Purchase accounting – goodwill | | | (g | ) | | | 2,648 | | | | 2,689 | |
| US regulatory accounting | | | (b | ) | | | 2,209 | | | | 2,702 | |
| Pensions and other post-retirement benefits | | | (c | ) | | | – | | | | 886 | |
| Financial instruments | | | (d | ) | | | 10 | | | | 119 | |
| Revenue recognition | | | (f | ) | | | (37 | ) | | | (42 | ) |
| Intangible assets | | | (h | ) | | | 26 | | | | 28 | |
| Provisions | | | (i | ) | | | (142 | ) | | | (154 | ) |
| Non-reversal of impairments | | | (j | ) | | | (23 | ) | | | (39 | ) |
| Sale and leaseback | | | (k | ) | | | (19 | ) | | | – | |
| Deferred taxation | | | (m | ) | | | (1,477 | ) | | | (2,090 | ) |
| Other | | | (n | ) | | | (28 | ) | | | 4 | |
| | | | | | | | 5,205 | | | | 6,265 | |
| |
Shareholders’ equity under US GAAP | | | | | | | 9,330 | | | | 9,747 | |
| |
154National Grid plc
38. Differences between IFRS and US generally accepted accounting principles (continued)
The principal differences between IFRS and US GAAP, as applied in preparing the accounts under US GAAP, are set out below:
a) Purchase accounting – property, plant and equipment
In accordance with IFRS 1, business combinations that occurred prior to 31 March 2004 have not been restated. The business combination with Lattice Group plc has therefore not been adjusted from the amount calculated under the Company’s previous basis of accounting under UK GAAP and continues to be accounted for as a merger (pooling of interests) under IFRS. However, under US GAAP the business combination was accounted for using purchase accounting. As a consequence, fair value adjustments have been recognised under US GAAP in relation to property, plant and equipment, which are being depreciated over the related assets’ useful economic lives. As a result, goodwill arising on the purchase has been recognised under US GAAP.
The impact of this adjustment has been to decrease other operating income by £8m (2006: £29m; 2005: £31m) due to the fair value impact on the net book value of property, plant and equipment disposed, increase the depreciation charge by £116m (2006: £98m; 2005: £138m), and increase other charges by £nil (2006: £nil; 2005: £7m).
Purchase accounting adjustments and goodwill associated with the businesses, which were disposed during 2005/06 have been recycled to net income and recognised as a reduction in the gain on disposal compared with that recorded under IFRS. These adjustments are reported within discontinued operations.
b) US regulatory accounting
Statement of Financial Accounting Standard (SFAS) 71 ‘Accounting for the Effects of Certain Types of Regulation’ establishes US GAAP for utilities whose regulators have the power to approve and/or regulate rates that may be charged to customers. Provided that through the regulatory process the utility is substantially assured of recovering its allowable costs by the collection of revenue from its customers, such costs not yet recovered are deferred as regulatory assets. Such recoverable assets, which would be recognised as regulatory assets under US GAAP, are not recognised as assets under IFRS on the basis that they do not meet the criteria for recognition as an asset, intangible or other, under IFRS and are therefore expensed. Under US GAAP, these costs are amortised over the period indicated in the rate agreements with the regulators.
Regulatory liabilities are recorded for revenues collected for payment of future costs or for future return to customers. Under IFRS, these amounts are recognised as revenue when receivable.
The principal impacts of this adjustment on the income statement are a decrease to revenue of £21m (2006: £89m increase; 2005: £37m increase), an increase in purchases of electricity of £288m (2006: £116m; 2005: £182m) and an increase in other charges (principally regulatory asset amortisation) of £182m (2006: £271m; 2005: £96m). In the balance sheet, the principal impacts are to report current regulatory assets of £305m (2006: £246m) and non-current regulatory assets of £2,575m (2006: £2,805m), increase property, plant and equipment by £265m (2006: £222m), and increase other non-current liabilities by £873m (2006: £381m).
The following table details the various material components and amounts of regulatory assets net of related regulatory liabilities and the impact of US regulatory accounting:
| | | | | | | | | |
| |
| | | Net impact of |
| | | US regulatory accounting |
| | | 2007 | | | 2006 | |
| | | £m | | | £m | |
| |
| Stranded costs and CTC (i) related | | | 1,092 | | | | 1,355 | |
| Purchased power and deferrals | | | 67 | | | | 124 | |
| Derivative instruments | | | 263 | | | | 478 | |
| Environmental, remediation and decommissioning | | | 350 | | | | 418 | |
| Pensions and post-retirement benefits | | | 499 | | | | 265 | |
| Other | | | (62 | ) | | | 62 | |
| |
| | | | 2,209 | | | | 2,702 | |
| |
| | |
| (i) | | Contract Termination Charge and Competitive Transmission Charge (collectively referred to as CTC). |
c) Pensions and other post-retirement benefits
The Company has adopted SFAS 158 ‘Employers’ Accounting for Defined Benefit Pension and Other Post-retirement Plans, an amendment of FASB statements No. 87, 106 and 132(R)’ (SFAS 158).
The incremental effect of applying SFAS 158 is set out below:
| | | | | | | | | | | | | |
| |
| | | Before | | | | | | | After | |
| | | application of | | | | | | | application of | |
| | | SFAS 158 | | | Adjustments | | | SFAS 158 | |
| | | £m | | | £m | | | £m | |
| |
| Intangible assets | | | 41 | | | | (41 | ) | | | – | |
| Regulatory assets | | | 20 | | | | 274 | | | | 294 | |
| Post-retirement benefits | | | (1,026 | ) | | | (196 | ) | | | (1,222 | ) |
| Deferred tax | | | 339 | | | | 14 | | | | 353 | |
| |
| Accumulated comprehensive loss | | | (626 | ) | | | 51 | | | | (575 | ) |
| |
Net losses of £87m included in accumulated comprehensive loss are expected to be recognised as a component of net periodic cost in the year ending 31 March 2008, of which £13m is in respect of prior service costs.
The effect of SFAS 158 was to increase assets by £233m, increase liabilities by £182m and increase equity by £51m.
Annual Report and Accounts 2006/07155
38. Differences between IFRS and US generally accepted accounting principles (continued)
c) Pensions and other post-retirement benefits (continued)
Under IFRS, actuarial gains and losses are recognised in the statement of recognised income and expense in the year in which they occur. Under US GAAP, amortisation of unrecognised actuarial gains and losses that fall outside a specified corridor are recognised within the income statement.
Interest costs associated with pension and other post-retirement benefit obligations are presented within finance costs under IFRS as opposed to within net periodic pension costs under US GAAP.
Under IFRS, curtailment or settlement gains and losses are included in full in the income statement. Under US GAAP, these gains and losses are recognised in the income statement to the extent that they exceed unrecognised losses.
In 2007 the method of calculating the market related value in one pension plan has been changed. Previously gains or losses on assets in the plan were deferred and recognised over a five year period. The fair value method is now used to determine the market related value. The Company believes it is preferable to change to the fair value method of determining the market related value of plan assets for this plan because it promotes consistency with its other pension plans in measuring the net periodic pension costs. This, in turn, will help provide a measure of net periodic pension cost that is more comparable and understandable to users.
In respect of certain plans in the United States, the Company continues to adopt a market related value which defers gains or losses over a five year period. This is consistent with the rate plans agreed with the regulators of the subsidiaries participating in plans. The recognition of pension costs therefore reflects the underlying economic environment of those subsidiaries.
The change in the method for determining the market related value has increased income from continuing operations and net income for the year ended 31 March 2007 by £15m (2006: £nil; 2005: £16m reduction in net income) and basic and diluted earnings per share by 0.6p (2006: nil; 2005: 0.5p reduction in earnings per share) and 0.5p (2006: nil; 2005: 0.5p reduction in earnings per share) respectively. As at 31 March 2004, retained earnings and other comprehensive loss were reduced by £37m. The reduction in accumulated other comprehensive loss reflects a reduction in the additional minimum pension liability. As at 31 March 2005 and 2006 retained earnings and other comprehensive loss were reduced by £53m.
The pensions and other post-retirement benefits US GAAP adjustment reported in the tables on page 151 impacts on the following lines in the consolidated income statement: increasing depreciation by £1m (2006: £1m; 2005: £nil) for depreciation on capitalised pension costs; increasing payroll costs by £36m (2006: £67m; 2005: £49m); decreasing other charges by £nil (2006: £nil; 2005: £27m); and increasing net finance costs by £57m (2006: decrease of £12m; 2005: decrease of £1m). On the balance sheet, the adjustment principally affects the reported pensions post-retirement and other liabilities.
The net periodic charge for pensions and other post-retirement benefits is as follows:
| | | | | | | | | | | | | | | | | | | | | | | | | |
| |
| | | Pensions | | Other post-retirement benefits |
| | | 2007 | | | 2006 | * | | 2005 | * | | 2007 | | | 2006 | | | 2005 | |
| | | £m | | | £m | | | £m | | | £m | | | £m | | | £m | |
| |
Continuing operations | | | | | | | | | | | | | | | | | | | | | | | | |
| Defined contribution scheme cost | | | 3 | | | | 2 | | | | 2 | | | | – | | | | – | | | | – | |
Defined benefit schemes | | | | | | | | | | | | | | | | | | | | | | | | |
| Service cost | | | 113 | | | | 111 | | | | 107 | | | | 15 | | | | 16 | | | | 12 | |
| Interest cost | | | 803 | | | | 802 | | | | 828 | | | | 63 | | | | 63 | | | | 56 | |
| Expected return on plan assets | | | (882 | ) | | | (847 | ) | | | (847 | ) | | | (41 | ) | | | (41 | ) | | | (40 | ) |
| Amortisation of prior service cost | | | 6 | | | | 5 | | | | 6 | | | | 7 | | | | 6 | | | | 3 | |
| Amortisation of previously unrecognised actuarial losses | | | 54 | | | | 58 | | | | 55 | | | | 23 | | | | – | | | | 20 | |
| |
| | | | 97 | | | | 131 | | | | 151 | | | | 67 | | | | 44 | | | | 51 | |
| Release of pension provision | | | (2 | ) | | | (2 | ) | | | (2 | ) | | | – | | | | – | | | | – | |
| |
| | | | 95 | | | | 129 | | | | 149 | | | | 67 | | | | 44 | | | | 51 | |
| |
Discontinued operations | | | | | | | | | | | | | | | | | | | | | | | | |
| Service cost | | | 2 | | | | 7 | | | | 28 | | | | – | | | | – | | | | – | |
| Interest cost | | | 2 | | | | 2 | | | | 1 | | | | – | | | | – | | | | – | |
| Expected return on plan assets | | | (2 | ) | | | (2 | ) | | | (1 | ) | | | – | | | | – | | | | – | |
| |
| | | | 2 | | | | 7 | | | | 28 | | | | – | | | | – | | | | – | |
| |
*Comparatives have been restated to include impact of change in method of valuing plan assets. They have also been restated to reclassify amounts relating to discontinued operations
The additional cost/(gain) incurred in respect of severance cases computed in accordance with SFAS 88 ‘Employers’ Accounting for Settlements and Curtailments of Defined Benefit Pension Plans and for Termination Benefits’ is as follows:
| | | | | | | | | | | | | |
| |
| | | 2007 | | | 2006 | | | 2005 | |
| | | £m | | | £m | | | £m | |
| |
| Cost of termination benefits and curtailments – continuing operations | | | 42 | | | | 32 | | | | 30 | |
| Gain on termination benefits and curtailments – discontinued operations | | | – | | | | (41 | ) | | | – | |
| |
| | | | 42 | | | | (9 | ) | | | 30 | |
| |
156National Grid plc
38. Differences between IFRS and US generally accepted accounting principles (continued)
c) Pensions and other post-retirement benefits (continued)
The principal financial assumptions used for the SFAS 87 calculations of net periodic charge, based on a measurement date of 31 March 2006 in respect of the US and UK defined benefit schemes are shown below:
| | | | | | | | | | | | | | | | | | | | | | | | | |
| |
| | | US | | UK |
| | | 2007 | | | 2006 | | | 2005 | | | 2007 | | | 2006 | | | 2005 | |
| | | % | | | % | | | % | | | % | | | % | | | % | |
| |
| Discount rate | | | 6.0 | | | | 5.8 | | | | 5.8 | | | | 4.9 | | | | 5.1 | | | | 5.5 | |
| Expected return on assets | | | 7.8-8.3 | | | | 7.0-8.3 | | | | 8.3 | | | | 5.8-6.4 | | | | 5.8-6.4 | | | | 6.2-6.7 | |
| General salary increases | | | 3.9-4.3 | | | | 3.9-4.3 | | | | 3.3-5.3 | | | | 3.9 | | | | 3.9 | | | | 3.9 | |
| Pension increases | | nil | | | nil | | | nil | | | | 3.0 | | | | 3.0 | | | | 3.0 | |
| |
The assumptions used for other post-retirement costs relate solely to US schemes. These assumptions were that the discount rate used would be 6% (2006: 5.8%; 2005: 5.75%) and that medical costs would increase by 10% (2006: 10%; 2005: 10%), decreasing to 5% (2006: 5%; 2005: 5%) by 2011 and remain at 5% (2006: 5%; 2005: 5%) thereafter.
A reconciliation of the funded status of the pension and other post-retirement schemes to the net accrued benefit liability that was included in the consolidated balance sheet prepared under US GAAP is as follows:
| | | | | | | | | | | | | | | | | |
| |
| | | | | | | | | | | Other |
| | | Pensions | | post-retirement benefits |
| | | 2007 | | | 2006 | | | 2007 | | | 2006 | |
| | | £m | | | £m | | | £m | | | £m | |
| |
| Projected benefit obligation at 31 March (i) | | | (16,113 | ) | | | (16,603 | ) | | | (1,126 | ) | | | (1,223 | ) |
| Fair value of plan assets at 31 March | | | 15,486 | | | | 15,358 | | | | 531 | | | | 568 | |
| |
| Excess of projected benefit obligation over plan assets | | | (627 | ) | | | (1,245 | ) | | | (595 | ) | | | (655 | ) |
| Unrecognised net actuarial loss | | | – | | | | 755 | | | | – | | | | 335 | |
| Unrecognised prior service cost | | | – | | | | 56 | | | | – | | | | 69 | |
| |
| Net accrued benefit liability – before minimum liability adjustment | | | (627 | ) | | | (434 | ) | | | (595 | ) | | | (251 | ) |
| Additional minimum liability adjustment | | | – | | | | (396 | ) | | | – | | | | – | |
| |
| Net accrued benefit liability | | | (627 | ) | | | (830 | ) | | | (595 | ) | | | (251 | ) |
| |
| | |
| (i) | | The projected benefit obligation of pensions at 31 March 2007 includes £83m (2006: £96m) in respect of unfunded obligations. |
| | | | | | | | | | | | | | | | | |
| Non-current liabilities (ii) | | | (675 | ) | | | (1,026 | ) | | | (595 | ) | | | (251 | ) |
| Assets (pre-paid costs) | | | 48 | | | | 196 | | | | – | | | | – | |
| |
| Net accrued benefit liability (ii) | | | (627 | ) | | | (830 | ) | | | (595 | ) | | | (251 | ) |
| |
| | |
| (ii) | | The difference between pension and other post-retirement non-current liabilities shown above and the amounts reflected in the balance sheet as ‘Pensions and other post-retirement obligations’ in note 39 primarily represents other post-employment benefits. |
Following adoption of SFAS 158, no amount is recognised as an additional minimum liability as at 31 March 2007. A regulatory asset of £294m has been recognised in relation to the post-retirements benefit liabilities.
At 31 March 2006, as required under SFAS 87, an intangible asset of £56m was recognised in relation to the additional minimum liability, being equal to the unrecognised prior service cost. A regulatory asset of £46m was also created. The remaining additional minimum liability of £294m was included in other comprehensive income.
The principal financial assumptions used for the SFAS 87 calculations of the projected benefit obligation, based on a measurement date of 31 March 2007, in respect of the US and UK defined benefit schemes are shown below:
| | | | | | | | | | | | | | | | | | | | | | | | | |
| |
| | | US | | UK |
| | | 2007 | | | 2006 | | | 2005 | | | 2007 | | | 2006 | | | 2005 | |
| | | % | | | % | | | % | | | % | | | % | | | % | |
| |
| Discount rate | | | 5.8 | | | | 6.0 | | | | 5.8 | | | | 5.4 | | | | 4.9 | | | | 5.4 | |
| General salary increases | | | 3.9-4.3 | | | | 3.9-4.3 | | | | 3.9-4.3 | | | | 4.2 | | | | 3.9 | | | | 3.9 | |
| Pension increases | | nil | | | nil | | | nil | | | | 3.25 | | | | 2.95 | | | | 3.0 | |
| |
Annual Report and Accounts 2006/07157
38. Differences between IFRS and US generally accepted accounting principles (continued)
c) Pensions and other post-retirement benefits (continued)
The accumulated benefit obligation for pensions was £15,342m at 31 March 2007 (2006: £16,180m), including £3,040m in respect of schemes that had a deficit of assets compared to accumulated benefit obligations. The total associated assets of these schemes were £2,610m at 31 March 2007. The Company has followed approach two of Emerging Issues Task Force (EITF) Abstract 88-1 in calculating the accumulated benefit obligation. Changes in the projected benefit obligation and changes in the fair value of plan assets are shown below:
| | | | | | | | | | | | | | | | | |
| |
| | | | | | | | | | | Other |
| | | Pensions | | post-retirement benefits |
| | | 2007 | | | 2006 | | | 2007 | | | 2006 | |
| | | £m | | | £m | | | £m | | | £m | |
| |
| Projected benefit obligation at start of year | | | 16,603 | | | | 15,758 | | | | 1,223 | | | | 1,068 | |
| Service cost | | | 115 | | | | 118 | | | | 15 | | | | 16 | |
| Interest cost | | | 805 | | | | 804 | | | | 63 | | | | 63 | |
| Plan participants’ contributions | | | 14 | | | | 14 | | | | – | | | | – | |
| Plan amendment – prior service cost | | | – | | | | – | | | | – | | | | – | |
| Terminations | | | 23 | | | | 49 | | | | – | | | | – | |
| Curtailments | | | 4 | | | | (157 | ) | | | – | | | | – | |
| Actuarial (gain)/loss | | | (464 | ) | | | 1,301 | | | | 4 | | | | 40 | |
| Benefits paid | | | (758 | ) | | | (775 | ) | | | (62 | ) | | | (59 | ) |
| Settlements (i) | | | (87 | ) | | | (619 | ) | | | – | | | | – | |
| Acquisition of subsidiary undertakings | | | 89 | | | | – | | | | 25 | | | | – | |
| Transfers | | | 1 | | | | (17 | ) | | | – | | | | – | |
| Reclassified as liabilities of businesses held for sale | | | (48 | ) | | | – | | | | – | | | | – | |
| Exchange adjustments | | | (184 | ) | | | 127 | | | | (142 | ) | | | 95 | |
| |
| Projected benefit obligation at end of year | | | 16,113 | | | | 16,603 | | | | 1,126 | | | | 1,223 | |
| |
| Fair value of plan assets at start of year | | | 15,358 | | | | 14,086 | | | | 568 | | | | 488 | |
| Actual return on assets | | | 796 | | | | 2,370 | | | | 53 | | | | 65 | |
| Employer contributions | | | 276 | | | | 191 | | | | 28 | | | | 30 | |
| Plan participants’ contributions | | | 14 | | | | 14 | | | | – | | | | – | |
| Benefits paid | | | (758 | ) | | | (774 | ) | | | (58 | ) | | | (59 | ) |
| Settlements (i) | | | (87 | ) | | | (609 | ) | | | – | | | | – | |
| Acquisition of subsidiary undertakings | | | 82 | | | | – | | | | 7 | | | | – | |
| Transfers | | | – | | | | (15 | ) | | | – | | | | – | |
| Reclassified as liabilities of businesses held for sale | | | (46 | ) | | | – | | | | – | | | | – | |
| Exchange adjustments | | | (149 | ) | | | 95 | | | | (67 | ) | | | 44 | |
| |
| Fair value of plan assets at end of year | | | 15,486 | | | | 15,358 | | | | 531 | | | | 568 | |
| |
| | |
| (i) | | For the year ended 31 March 2007, settlements shown above of £87m were classified as benefits paid under IFRS (see note 8). |
As at 31 March 2007 the following benefit payments, which reflect future service as appropriate, are expected to be paid:
| | | | | | | | | |
| |
| | | | | | | Other | |
| | | | | | | post- | |
| | | | | | | retirement | |
| | | Pensions | | | benefits | |
| Year ended 31 March | | £m | | | £m | |
| |
| 2008 | | | 765 | | | | 60 | |
| 2009 | | | 779 | | | | 65 | |
| 2010 | | | 795 | | | | 67 | |
| 2011 | | | 812 | | | | 70 | |
| 2012 | | | 831 | | | | 72 | |
| 2013-2017 | | | 4,643 | | | | 377 | |
| |
In the UK, the trustees for each plan are responsible for setting the long-term strategy after consultation with the Company and its professional advisers. The trustees’ objectives are to invest in assets of appropriate liquidity, which, together with future contributions from employers and members, would expect to: generate income and capital growth to meet the cost of benefits from the plans; limit the risk; and minimise the long-term cost. In the US, pension plan investments are managed to minimise the long-term cost of operating the plan, with a reasonable level of risk.
Risk tolerance is determined as a result of periodic asset/liability studies that analyse plan liabilities and funded status and results in the determination of the allocation of assets.
Equity investments, fixed income and index-linked portfolios are broadly diversified. Investments are also held in property, private equity and timber with the objective of enhancing long-term returns while improving diversification. Investment risk and return are reviewed by investment committees on a quarterly basis.
Expected subsidy receipts in respect of healthcare benefits are as follows:
| | | | | |
| |
| | | £m | |
| |
| 2008 | | | 4 | |
| 2009 | | | 4 | |
| 2010 | | | 4 | |
| 2011 | | | 4 | |
| 2012 | | | 5 | |
| 2013-2017 | | | 25 | |
| |
158National Grid plc
38. Differences between IFRS and US generally accepted accounting principles (continued)
d) Financial instruments
On 1 April 2005, the Company adopted IAS 39 in its consolidated financial statements and as a consequence derivatives are now recognised in the balance sheet at their fair value, similar to the requirements of SFAS 133 ‘Accounting for Derivative Instruments and Hedging Activities’ (SFAS 133). In accordance with IAS 39, the Company has adopted hedge accounting in its consolidated financial statements and has designated hedges as either fair value, cash flow or foreign currency exposures of net investments in foreign operations. Although similar in nature to SFAS 133 there are differences between the requirements of IAS 39 and SFAS 133, in particular SFAS 133 does not include the transitional provisions of IAS 39 that permitted hedges to be recognised as effective on 1 April 2005. Accordingly, certain derivatives qualify for hedge accounting under IFRS but not under US GAAP. Where hedges that meet the requirements of IAS 39 also meet the requirements of SFAS 133 they are accounted for as hedges under US GAAP, otherwise the fair value adjustments of the hedges are recognised in the US GAAP income statement and hence are included as reconciling differences.
Under US GAAP, as required by SFAS 133, all derivative financial instruments, including derivatives embedded within other contracts, are required to be recognised in the balance sheet as either assets or liabilities and measured at fair value. SFAS 133 permits hedge accounting in specific circumstances, where the hedge is designated and documented as one of three types: fair value; cash flow; or foreign currency exposures of net investments in foreign operations. Provided that it can be demonstrated that the hedge is highly effective and the relevant hedging criteria have been met, then in respect of fair value hedges, both the change in fair value of the derivative and hedged item are reflected in net income in the period. For cash flow hedges and hedges of foreign currency exposures of net investments in foreign operations, changes in fair value are reflected through other comprehensive income. In the event that the conditions for hedge accounting are not met, changes in the fair value of derivatives are reflected in net income.
Prior to 31 March 2005, the Company did not apply hedge accounting for the purposes of SFAS 133 except for certain hedges of net investments in foreign operations. Excluding the hedges of net investments that were designated and qualified as hedges under SFAS 133, the reconciliation to net income for the year ended 31 March 2005 reflected the changes in fair value of derivative financial instruments that were given hedge accounting under IFRS. There was no reconciling adjustment for the hedges of net investments for which the Company had adopted hedge accounting under SFAS 133, as realised and unrealised gains and losses were taken to other comprehensive income under US GAAP.
Contracts that qualify as normal purchases and normal sales and are designated as such are excluded from the requirements of SFAS 133. In line with the treatment under IFRS, the realised gains and losses on these contracts are reflected in the income statement at the contract settlement date.
The financial instruments US GAAP adjustment affect the reported net finance cost in the income statement. On the balance sheet, this adjustment represents the reclassification of reported derivative financial assets and liabilities (both current and non-current), with an associated decrease in reported current borrowings of £nil (2006: £7m) and non-current borrowings of £10m (2006: £112m).
e) Severance and onerous lease costs
Under IFRS, severance costs in respect of voluntary severance arrangements are provided for when it is determined that a constructive or legal obligation has arisen from a restructuring programme, where it is probable that it will result in the outflow of economic benefits and the costs involved can be estimated with reasonable accuracy. Under US GAAP, such severance costs are recognised when the employees accept the severance offer. Accordingly, timing differences between IFRS and US GAAP arise on the recognition of such costs.
Similarly, under IFRS future costs related to property leases have been accrued for in connection with vacating certain premises. Under US GAAP a liability was recognised when the ‘cease use’ date was reached, resulting in a timing difference between IFRS and US GAAP on the recognition of such costs.
f) Revenue recognition
Under US GAAP, revenue is recognised in the period that the service is provided up to the maximum revenue allowed under the terms of the relevant regulatory regime for businesses outside of the scope of SFAS 71. Under IFRS, any such revenue received or receivable in excess of the maximum revenue allowed for the period, under the terms of the relevant regulatory regime, is recognised as income, even where prices will be reduced in a future period.
Annual Report and Accounts 2006/07159
38. Differences between IFRS and US generally accepted accounting principles (continued)
g) Goodwill
Under IFRS, the business combination with Lattice Group plc has been accounted for on the same basis as previous GAAP (UK GAAP) as a merger (pooling of interest) while under US GAAP, this transaction was accounted for as an acquisition (purchase accounting) of Lattice Group plc. As acquisitions made prior to 1 April 2004 were accounted for under UK GAAP, and were not reopened on transition to IFRS, differences in measurement also exist between US GAAP and IFRS. As a result, the US GAAP fair value of net assets of subsidiary undertakings acquired differs from the fair value of net assets as determined under IFRS. In addition, until 31 March 2004 goodwill was amortised under previous GAAP (UK GAAP) whereas under US GAAP amortisation of goodwill ceased on adoption of SFAS 141 ‘Business Combinations’. The balance sheet adjustment includes a reduction to goodwill of £31m in respect of businesses held for sale as at 31 March 2007.
h) Intangible assets
Under IFRS, in a business combination, intangible assets that meet certain criteria are recognised as assets, separate from goodwill, at fair value. Under US GAAP, these criteria are similar, however the creation of the intangibles includes the recognition of notional tax benefits. All of this adjustment relates to assets of businesses held for sale as at 31 March 2007.
i) Provisions
IFRS requires the time value of money to be taken into account when making a provision. US GAAP, however, only permits a provision to be discounted where the amount of the liability and the timing of payments are fixed or reliably determinable or where the obligation is a fair value obligation. Amounts associated with the unwinding of discounts on provisions are shown within interest expense under IFRS.
j) Impairments
During the financial year ended 31 March 1990, an impairment provision was recorded in respect of certain property, plant and equipment. As required under IFRS, part of this impairment provision was subsequently released and shareholders’ equity credited. Under US GAAP, this partial release is not permitted. During 2005/06 an impairment in respect of a joint venture was reversed under IFRS, whereas under US GAAP such reversal was not permitted which subsequently resulted in a higher gain on disposal of the joint venture in 2006/07.
k) Sale and leaseback
Under IFRS, where an asset is sold and then leased back and where the resultant lease is an operating lease, the gain on disposal is recognised immediately, provided that the sale price is established at fair value. Under US GAAP this gain is deferred and recognised over the related rental period.
l) Current tax
Under US GAAP, in accordance with EITF 93-7 ‘Uncertainties related to Income Taxes in a Purchase Business Combination’, an adjustment to pre-acquisition tax positions has resulted in a corresponding adjustment to goodwill. Under IFRS, no adjustment to goodwill is made and the tax adjustment is taken to net income.
m) Deferred taxation
The deferred taxation adjustment principally reflects the tax effect of the other measurement and recognition differences between IFRS and US GAAP.
The corporate tax charge on continuing operations under US GAAP is analysed between current taxes and deferred taxes as follows:
| | | | | | | | | | | | | |
| |
| | | 2007 | | | 2006 | | | 2005 | |
| | | £m | | | £m | | | £m | |
| |
| Current taxes (credit)/charge | | | (17 | ) | | | 406 | | | | 14 | |
| Deferred taxes charge/(credit) | | | 149 | | | | (85 | ) | | | 285 | |
| |
| Tax charge | | | 132 | | | | 321 | | | | 299 | |
| |
The net deferred tax liability under US GAAP is analysed as follows:
| | | | | | | | | |
| |
| | | 2007 | | | 2006 | |
| | | £m | | | £m | |
| |
| Deferred taxation liabilities: | | | | | | | | |
| Excess of book value over taxation value of fixed assets | | | 3,906 | | | | 3,778 | |
| Other temporary differences | | | 972 | | | | 1,494 | |
| |
| | | | 4,878 | | | | 5,272 | |
| Deferred taxation assets: | | | | | | | | |
| Other temporary differences (i) | | | (1,018 | ) | | | (1,252 | ) |
| |
| | | | 3,860 | | | | 4,020 | |
| |
| Analysed as follows: | | | | | | | | |
| Current | | | (60 | ) | | | (43 | ) |
| Non-current | | | 3,920 | | | | 4,063 | |
| |
| | | | 3,860 | | | | 4,020 | |
| |
| | |
| (i) | | Deferred taxation assets at 31 March 2007 were stated net of a £422m valuation allowance adjustment in respect of capital losses, non-trade deficits, trading losses and pre-trading expenditure (2006: £530m; 2005: £493m). |
160National Grid plc
38. Differences between IFRS and US generally accepted accounting principles (continued)
n) Other
Other differences between IFRS and US GAAP are not individually material and relate to differences arising from the recognition of amortisation expense on certain assets, timing differences related to recognition of provisions, share-based payment charges and other interest income.
Other US GAAP disclosures
Non-GAAP measures
In preparing the accounts in accordance with the Companies Act 1985 and IFRS, certain information is presented that could be viewed as ‘non-GAAP’ under regulations issued by the US Securities and Exchange Commission if our primary financial statements were reported under US GAAP. We consider that the use of such measures is in conformity and expressly permitted by IAS 1 ‘Presentation of Financial Statements’. Our accounting policy on page 106 describes the use of these measures. Non-GAAP measures are not included in our condensed US GAAP statements.
Other presentational differences between IFRS and US GAAP
Under IFRS, assets in the balance sheet are presented in ascending order of liquidity and the balance sheet is analysed between net assets and shareholders’ funds. Under US GAAP, assets are presented in descending order of liquidity and the balance sheet is analysed between total assets and liabilities and shareholders’ equity as used in the presentation in note 39.
i) Capital contributions – Capital contributions are received for certain qualifying construction projects. Under IFRS, these contributions are recorded as deferred income (within other liabilities), whereas under US GAAP, these contributions are recorded as a reduction of £1,107m (2006: £1,049m) against the assets’ cost.
ii) Emission rights – Under IFRS, emission allowances are recorded as intangible assets and a provision is recorded for emission costs incurred. Under US GAAP, the value of the emission allowances is reclassified to reduce the recorded provision, resulting in a net liability presentation.
iii) Deferred tax assets and liabilities – Under IFRS, deferred tax assets and liabilities are presented separately as non-current assets and non-current liabilities. Under US GAAP, deferred tax assets and liabilities are recorded as current or non-current based on the classification of the related asset or liability. Deferred tax assets and liabilities not related to an asset or liability are classified as current or non-current according to the expected reversal date. Current deferred tax assets and liabilities and non-current deferred tax assets and liabilities are offset if they relate to a particular tax paying component of an enterprise and are within a particular tax jurisdiction.
iv) Accrued interest on borrowings – Accrued interest on borrowings is classified within borrowings under IFRS and accrued liabilities under US GAAP.
v) Cumulative preference shares – These non-equity instruments are presented within borrowings under IFRS, but shown separately from shareholders’ equity and liabilities under US GAAP.
vi) Capital leases – Certain leases which qualify as finance (capital) leases under IFRS are treated as operating leases under US GAAP. This results in a reduction to property, plant and equipment and borrowings for US GAAP reporting.
vii) Assets held for sale – Under IFRS, assets and liabilities of businesses held for sale are presented separately from current and non-current assets and liabilities. Under US GAAP, these amounts are presented within current assets and current liabilities respectively.
viii) Earnings per share (EPS) – Under US GAAP, earnings per share are required to be adjusted retroactively as a result of the 43 for 49 share consolidation related to the B share scheme, accounted for as a share consolidation and a return of capital. Under IFRS, the B share scheme is accounted for as an in-substance share repurchase at fair value, with EPS being impacted prospectively from the transaction date and no restatement of prior periods, in accordance with IAS 33 ‘Earnings per share’.
Restricted net assets
National Grid USA and its public utility subsidiaries, all consolidated subsidiaries of the Company, are subject to restrictions on the payment of dividends by administrative order and contract. Orders by the Federal Energy Regulatory Commission and applicable state regulatory commissions limit the payment of dividends as follows. The subsidiaries may pay dividends in an amount up to cumulative retained earnings, including pre-acquisition retained earnings. Other orders by federal and state commissions require National Grid USA and its public utility subsidiaries to maintain a ratio of at least 30% equity to capital, and debt covenants in effect require that this ratio be maintained at a level of at least 35%. At 31 March 2007, £2.9bn of net assets were restricted, representing 31% of the Company’s consolidated net assets under US GAAP at that date.
Annual Report and Accounts 2006/07161
38. Differences between IFRS and US generally accepted accounting principles (continued)
n) Other (continued)
New US Accounting Standards adopted during 2006/07
SFAS 158
In September 2006, the FASB issued Statement of Financial Accounting Standard No. 158 ‘Employers’ Accounting for Defined Benefit Pension and Other Post-retirement Plans, an amendment of FASB statements No. 87, 106 and 132(R)’ (SFAS 158). This standard requires recognition of a net liability or asset and an offsetting adjustment to accumulated other comprehensive income to report the funded status of defined benefit pension and other post-retirement benefit plans. SFAS 158 requires prospective application, recognition and disclosure requirements effective for the year ended 31 March 2007. The Company adopted SFAS 158 on 31 March 2007. This has had the effect of substantially reducing (but not completely eliminating) the difference in shareholders’ equity between IFRS and US GAAP as at 31 March 2007. The difference in net income between IFRS and US GAAP in future periods is likely to remain substantially unchanged.
SFAS 123(R)
In December 2004, the FASB issued FASB Statement No. 123 (revised 2004) ‘Share-Based Payment’ (SFAS 123(R)), which is a revision of FASB Statement No. 123 ‘Accounting for Stock-Based Compensation’ (SFAS 123). SFAS 123(R) supersedes APB Opinion No. 25 ‘Accounting for Stock Issued to Employees’, and amends FASB Statement No. 95 ‘Statement of Cash Flows’. Generally, the approach in SFAS 123(R) is similar to the approach described in SFAS 123. However, SFAS 123(R) requires all share-based payments to employees, including grants of employee stock options, to be recognised in the income statement based on their fair values. Pro-forma disclosure is no longer an alternative. The Company adopted SFAS 123(R) as of 1 April 2006.
SFAS 123(R) permits adoption of the requirements using one of two methods: a ‘modified prospective’ method where the requirements are applied to all share-based payments granted after the effective date of the pronouncement; or a ‘modified retrospective’ method which allows entities to restate prior periods based on the amounts previously recognised under SFAS 123 for the purposes of pro forma disclosures. The Company adopted SFAS 123(R) using the modified prospective method.
The Company adopted the fair-value based method of accounting for share-based payments using the ‘retroactive restatement method’ described in FASB Statement No. 148 ‘Accounting for Stock-Based Compensation – Transition and Disclosure’. The Company continues to use the Black-Scholes European option pricing model and, for awards based on total shareholder returns, a Monte Carlo simulation model, to estimate the value of stock options granted to employees upon adoption of SFAS 123(R). The adoption of SFAS 123(R) has not had a material impact on its accounts.
SFAS 151
The FASB issued SFAS No. 151 ‘Inventory Costs – an amendment of ARB No. 43’ (SFAS 151). SFAS 151 clarifies the accounting for abnormal amounts of idle facility expense, freight, handling costs and wasted materials (spoilage) as current period charges. SFAS 151 is effective for fiscal periods beginning after 15 June 2005. The adoption of SFAS 151 has not had a material effect on the Company’s accounts.
SFAS 153
In December 2004, as part of the FASB’s short-term convergence project with the International Accounting Standards Board, the FASB issued FASB Statement No. 153 ‘Exchanges of Non-Monetary Assets’ (SFAS 153), which is an amendment to APB Opinion No. 29 ‘Accounting for Non-Monetary Transactions’ (APB 29). APB 29 provided an exemption to its general principle of measuring such transactions at fair value where the exchange related to similar productive assets. The exemption permitted the exchange to be valued at the recorded amount of the assets relinquished. SFAS 153 removes this exemption so that all non-monetary transactions (apart from those without commercial substance) are recorded at fair value. The Company adopted SFAS 153 prospectively for all transactions taking place from 1 April 2006. The adoption of SFAS 153 has not had a material impact on its accounts.
SFAS 154
In May 2005, the FASB issued SFAS No. 154 ‘Accounting Changes and Error Corrections – a replacement of APB Opinion No. 20 and FASB Statement No. 3’ (SFAS 154). SFAS 154 requires retrospective application of prior periods’ financial statements for changes in accounting principle. SFAS 154 applies to accounting periods beginning after 15 December 2005. The adoption of SFAS 154 has not had a material effect on the Company’s accounts.
162National Grid plc
38. Differences between IFRS and US generally accepted accounting principles (continued)
n) Other (continued)
Recent US pronouncements not yet adopted
SFAS 155
In February 2006, the FASB issued SFAS No. 155 ‘Accounting for Certain Hybrid Financial Instruments – an amendment of SFAS No. 133 and SFAS No. 140’ (SFAS 155). SFAS 155 provides clarification on specific points related to derivative accounting. It provides a fair value measurement option for certain hybrid financial instruments that contain embedded derivatives that would otherwise require bifurcation. It also requires that beneficial interests in securitised financial assets be analysed to determine whether they are freestanding derivatives or whether they are hybrid instruments that contain embedded derivatives requiring bifurcation. SFAS 155 is effective for fiscal years beginning after 15 September 2006. The Company does not believe that the adoption of SFAS 155 will have a material effect on its accounts.
SFAS 157
In September 2006, the FASB issued SFAS No. 157 ‘Fair Value Measurements’ (SFAS 157). SFAS 157 provides enhanced guidance for using fair value to measure assets and liabilities when other pronouncements require or permit fair value measurements, but does not require any new fair value measurements. The statement defines fair value, establishes a framework for measuring fair value under US GAAP and expands disclosures about fair value measurements. The Company does not believe that the adoption of SFAS 157 will have a material effect on its accounts.
SFAS 159
In February 2007, the FASB issued SFAS No. 159 ‘The Fair Value Option for Financial Assets and Financial Liabilities – Including an amendment of FASB Statement No. 115’ (SFAS 159). SFAS 159 permits an entity, at specified election dates, to choose to measure certain financial instruments and other items at fair value. The objective of SFAS 159 is to provide entities with the opportunity to mitigate volatility in reported earnings caused by measuring related assets and liabilities differently, without having to apply complex hedge accounting provisions. SFAS 159 also contains rules concerning the presentation of items measured at fair value and corresponding disclosures in the notes to the financial statements. The application of SFAS 159 is mandatory for fiscal years that begin after 15 November 2007. The Company is currently evaluating the potential effects on its accounts of applying SFAS 159.
FIN 48
In July 2006, the FASB issued Financial Interpretation No. 48 ‘Accounting for Uncertainty in Income Taxes – an interpretation of FASB Statement No. 109’ (FIN 48), which specifies how tax benefits for uncertain tax positions are to be recognised, measured and derecognised in financial statements. FIN 48 requires certain disclosures of uncertain tax matters, specifies how reserves for uncertain tax provisions should be classified in the balance sheet and provides transition and interim-period guidance. FIN 48 is effective for years beginning after 15 December 2006. The Company is currently evaluating the potential effects on its accounts of applying FIN 48.
Annual Report and Accounts 2006/07163
39. Condensed US GAAP financial information
Condensed US GAAP financial information is presented to show more clearly the operating and financial position that would have been reported under US GAAP as follows:
Condensed consolidated US GAAP income statement
| | | | | | | | | | | | | |
| |
| | | 2007 | | | | | | | 2007 | |
| | | National | | | 2007 | | | National | |
| | | Grid | | | US GAAP | | | Grid | |
| | | (IFRS | ) | | adjustments | | | (US GAAP | ) |
| | | £m | | | £m | | | £m | |
| |
| Revenue | | | 8,695 | | | | (9 | ) | | | 8,686 | |
| Other operating income | | | 83 | | | | (14 | ) | | | 69 | |
| Operating costs | | | | | | | | | | | | |
| Depreciation and amortisation | | | (871 | ) | | | (145 | ) | | | (1,016 | ) |
| Payroll costs | | | (820 | ) | | | 4 | | | | (816 | ) |
| Purchases of electricity | | | (1,593 | ) | | | (294 | ) | | | (1,887 | ) |
| Purchases of gas | | | (544 | ) | | | 5 | | | | (539 | ) |
| Rates and property taxes | | | (472 | ) | | | 1 | | | | (471 | ) |
| Electricity transmission services scheme direct costs | | | (558 | ) | | | (7 | ) | | | (565 | ) |
| Payments to Scottish electricity transmission network owners | | | (237 | ) | | | – | | | | (237 | ) |
| Expense relating to impairment of receivables | | | (63 | ) | | | – | | | | (63 | ) |
| Other operating charges | | | (1,107 | ) | | | (192 | ) | | | (1,299 | ) |
| | | | (6,265 | ) | | | (628 | ) | | | (6,893 | ) |
| |
| Operating profit | | | 2,513 | | | | (651 | ) | | | 1,862 | |
| Net finance costs | | | (764 | ) | | | 126 | | | | (638 | ) |
| Share of post-tax results of joint ventures | | | 2 | | | | (2 | ) | | | – | |
| |
| Profit before taxation | | | 1,751 | | | | (527 | ) | | | 1,224 | |
| Taxation | | | (441 | ) | | | 309 | | | | (132 | ) |
| |
| Profit for the year | | | 1,310 | | | | (218 | ) | | | 1,092 | |
| Minority interests | | | (2 | ) | | | – | | | | (2 | ) |
| Interest in equity accounted affiliates (net of tax of £nil) | | | – | | | | 2 | | | | 2 | |
| |
| Net income from continuing operations attributable to equity shareholders | | | 1,308 | | | | (216 | ) | | | 1,092 | |
| Net income from discontinued operations (net of tax of £11m charge) | | | 86 | | | | (32 | ) | | | 54 | |
| |
| Net income for the year attributable to equity shareholders | | | 1,394 | | | | (248 | ) | | | 1,146 | |
| |
| Basic earnings per share under US GAAP (pence) – continuing operations | | | | | | | | | | | 40.2p | |
| Diluted earnings per share under US GAAP (pence) – continuing operations | | | | | | | | | | | 39.9p | |
| |
| Basic earnings per ADS under US GAAP (pence) – continuing operations | | | | | | | | | | | 201.0p | |
| Diluted earnings per ADS under US GAAP (pence) – continuing operations | | | | | | | | | | | 199.5p | |
| |
| Basic earnings per share under US GAAP (pence) – discontinued operations | | | | | | | | | | | 2.0p | |
| Diluted earnings per share under US GAAP (pence) – discontinued operations | | | | | | | | | | | 2.0p | |
| |
| Basic earnings per ADS under US GAAP (pence) – discontinued operations | | | | | | | | | | | 10.0p | |
| Diluted earnings per ADS under US GAAP (pence) – discontinued operations | | | | | | | | | | | 10.0p | |
| |
| Basic earnings per share under US GAAP (pence) | | | | | | | | | | | 42.2p | |
| Diluted earnings per share under US GAAP (pence) | | | | | | | | | | | 41.9p | |
| |
| Basic earnings per ADS under US GAAP (pence) | | | | | | | | | | | 211.0p | |
| Diluted earnings per ADS under US GAAP (pence) | | | | | | | | | | | 209.5p | |
| |
| Weighted average number of shares in issue (million) – for basic EPS | | | | | | | | | | | 2,719 | |
| |
| Weighted average number of shares in issue (million) – for diluted EPS | | | | | | | | | | | 2,737 | |
| |
164National Grid plc
39. Condensed US GAAP financial information (continued)
Condensed consolidated US GAAP income statement (continued)
| | | | | | | | | | | | | |
| |
| | | 2006 | | | | | | | 2006 | |
| | | National | | | 2006 | | | National | |
| | | Grid | | | US GAAP | | | Grid | |
| | | (IFRS | ) | | adjustments | | | (US GAAP | ) |
| | | £m | * | | £m | * | | £m | * |
| |
| Revenue | | | 8,868 | | | | 23 | | | | 8,891 | |
| Other operating income | | | 80 | | | | (30 | ) | | | 50 | |
| Operating costs | | | | | | | | | | | | |
| Depreciation and amortisation | | | (888 | ) | | | (120 | ) | | | (1,008 | ) |
| Payroll costs | | | (854 | ) | | | (41 | ) | | | (895 | ) |
| Purchases of electricity | | | (1,977 | ) | | | (116 | ) | | | (2,093 | ) |
| Purchases of gas | | | (566 | ) | | | 3 | | | | (563 | ) |
| Rates and property taxes | | | (437 | ) | | | (2 | ) | | | (439 | ) |
| Electricity transmission services scheme direct costs | | | (536 | ) | | | – | | | | (536 | ) |
| Payments to Scottish electricity transmission network owners | | | (259 | ) | | | – | | | | (259 | ) |
| Expense relating to impairment of receivables | | | (24 | ) | | | – | | | | (24 | ) |
| Other operating charges | | | (1,033 | ) | | | (342 | ) | | | (1,375 | ) |
| | | | (6,574 | ) | | | (618 | ) | | | (7,192 | ) |
| |
| Operating profit | | | 2,374 | | | | (625 | ) | | | 1,749 | |
| Net finance costs | | | (659 | ) | | | (66 | ) | | | (725 | ) |
| Share of post-tax results of joint ventures | | | 3 | | | | (3 | ) | | | – | |
| |
| Profit before taxation | | | 1,718 | | | | (694 | ) | | | 1,024 | |
| Taxation | | | (535 | ) | | | 214 | | | | (321 | ) |
| |
| Profit for the year | | | 1,183 | | | | (480 | ) | | | 703 | |
| Minority interests | | | (2 | ) | | | (1 | ) | | | (3 | ) |
| Interest in equity accounted affiliates (net of tax of £nil) | | | – | | | | 3 | | | | 3 | |
| |
| Net income from continuing operations attributable to equity shareholders | | | 1,181 | | | | (478 | ) | | | 703 | |
| Net income from discontinued operations (net of tax of £210m credit) | | | 2,667 | | | | (2,063 | ) | | | 604 | |
| |
| Net income for the year attributable to equity shareholders | | | 3,848 | | | | (2,541 | ) | | | 1,307 | |
| |
| Basic earnings per share under US GAAP (pence) – continuing operations | | | | | | | | | | | 25.9p | |
| Diluted earnings per share under US GAAP (pence) – continuing operations | | | | | | | | | | | 25.8p | |
| |
| Basic earnings per ADS under US GAAP (pence) – continuing operations | | | | | | | | | | | 129.5p | |
| Diluted earnings per ADS under US GAAP (pence) – continuing operations | | | | | | | | | | | 129.0p | |
| |
| Basic earnings per share under US GAAP (pence) – discontinued operations | | | | | | | | | | | 22.3p | |
| Diluted earnings per share under US GAAP (pence) – discontinued operations | | | | | | | | | | | 22.2p | |
| |
| Basic earnings per ADS under US GAAP (pence) – discontinued operations | | | | | | | | | | | 111.5p | |
| Diluted earnings per ADS under US GAAP (pence) – discontinued operations | | | | | | | | | | | 111.0p | |
| |
| Basic earnings per share under US GAAP (pence) | | | | | | | | | | | 48.2p | |
| Diluted earnings per share under US GAAP (pence) | | | | | | | | | | | 48.0p | |
| |
| Basic earnings per ADS under US GAAP (pence) | | | | | | | | | | | 241.0p | |
| Diluted earnings per ADS under US GAAP (pence) | | | | | | | | | | | 240.0p | |
| |
| Weighted average number of shares in issue (million) – for basic EPS | | | | | | | | | | | 2,710 | |
| |
| Weighted average number of shares in issue (million) – for diluted EPS | | | | | | | | | | | 2,724 | |
| |
| | |
| *Comparatives have been adjusted to reclassify amounts relating to discontinued operations |
Annual Report and Accounts 2006/07165
39. Condensed US GAAP financial information (continued)
Condensed consolidated US GAAP income statement (continued)
| | | | | | | | | | | | | |
| |
| | | 2005 | | | | | | | 2005 | |
| | | National | | | 2005 | | | National | |
| | | Grid | | | US GAAP | | | Grid | |
| | | (IFRS | ) | | adjustments | | | (US GAAP | ) |
| | | £m | * | | £m | * | | £m | * |
| |
| Revenue | | | 7,174 | | | | 34 | | | | 7,208 | |
| Other operating income | | | 67 | | | | (31 | ) | | | 36 | |
| Operating costs | | | | | | | | | | | | |
| Depreciation and amortisation | | | (782 | ) | | | (132 | ) | | | (914 | ) |
| Payroll costs | | | (886 | ) | | | 31 | | | | (855 | ) |
| Purchases of electricity | | | (1,489 | ) | | | (182 | ) | | | (1,671 | ) |
| Purchases of gas | | | (357 | ) | | | – | | | | (357 | ) |
| Rates and property taxes | | | (403 | ) | | | – | | | | (403 | ) |
| Electricity transmission services scheme direct costs | | | (301 | ) | | | – | | | | (301 | ) |
| Payments to Scottish electricity transmission network owners | | | – | | | | – | | | | – | |
| Expense relating to impairment of receivables | | | (41 | ) | | | – | | | | (41 | ) |
| Other operating charges | | | (869 | ) | | | (30 | ) | | | (899 | ) |
| | | | (5,128 | ) | | | (313 | ) | | | (5,441 | ) |
| |
| Operating profit | | | 2,113 | | | | (310 | ) | | | 1,803 | |
| Net finance costs | | | (704 | ) | | | 246 | | | | (458 | ) |
| Share of post-tax results of joint ventures | | | 3 | | | | (3 | ) | | | – | |
| |
| Profit before taxation | | | 1,412 | | | | (67 | ) | | | 1,345 | |
| Taxation | | | (306 | ) | | | 7 | | | | (299 | ) |
| |
| Profit for the year | | | 1,106 | | | | (60 | ) | | | 1,046 | |
| Minority interests | | | – | | | | (2 | ) | | | (2 | ) |
| Interest in equity accounted affiliates (net of tax of £2m) | | | – | | | | (2 | ) | | | (2 | ) |
| |
| Net income from continuing operations attributable to equity shareholders | | | 1,106 | | | | (64 | ) | | | 1,042 | |
| Net income from discontinued operations (net of tax of £137m charge) | | | 318 | | | | (72 | ) | | | 246 | |
| |
| Net income for the year attributable to equity shareholders | | | 1,424 | | | | (136 | ) | | | 1,288 | |
| |
| Basic earnings per share under US GAAP (pence) – continuing operations | | | | | | | | | | | 38.5p | |
| Diluted earnings per share under US GAAP (pence) – continuing operations | | | | | | | | | | | 38.3p | |
| |
| Basic earnings per ADS under US GAAP (pence) – continuing operations | | | | | | | | | | | 192.5p | |
| Diluted earnings per ADS under US GAAP (pence) – continuing operations | | | | | | | | | | | 191.5p | |
| |
| Basic earnings per share under US GAAP (pence) – discontinued operations | | | | | | | | | | | 9.1p | |
| Diluted earnings per share under US GAAP (pence) – discontinued operations | | | | | | | | | | | 9.0p | |
| |
| Basic earnings per ADS under US GAAP (pence) – discontinued operations | | | | | | | | | | | 45.5p | |
| Diluted earnings per ADS under US GAAP (pence) – discontinued operations | | | | | | | | | | | 45.0p | |
| |
| Basic earnings per share under US GAAP (pence) | | | | | | | | | | | 47.6p | |
| Diluted earnings per share under US GAAP (pence) | | | | | | | | | | | 47.3p | |
| |
| Basic earnings per ADS under US GAAP (pence) | | | | | | | | | | | 238.0p | |
| Diluted earnings per ADS under US GAAP (pence) | | | | | | | | | | | 236.5p | |
| |
| Weighted average number of shares in issue (million) – for basic EPS | | | | | | | | | | | 2,705 | |
| |
| Weighted average number of shares in issue (million) – for diluted EPS | | | | | | | | | | | 2,719 | |
| |
| |
| * | The method adopted to calculate the market related value of post-retirement plan assets has been amended to achieve greater consistency between pension plans. Consequently, prior year comparatives have been adjusted. Comparatives have also been adjusted to reclassify amounts relating to discontinued operations |
Consolidated statement of comprehensive income and changes in shareholders’ equity under US GAAP
| | | | | | | | | | | | | |
| |
| | | 2007 | | | 2006 | | | 2005 | |
| | | £m | | | £m | | | £m | |
| |
| Net income | | | 1,146 | | | | 1,307 | | | | 1,288 | |
| Additional minimum pension liability (net of tax of £28m, £82m and £23m) | | | (51 | ) | | | 168 | | | | 49 | |
| Exchange adjustments (i) | | | (686 | ) | | | 368 | | | | (80 | ) |
| Mark-to-market of financial instruments (net of tax of £5m, £nil and £43m) | | | 5 | | | | 3 | | | | 111 | |
| |
| Comprehensive income | | | 414 | | | | 1,846 | | | | 1,368 | |
| Dividends | | | (730 | ) | | | (745 | ) | | | (628 | ) |
| Shares issued | | | 16 | | | | 28 | | | | 9 | |
| Share-based payment (net of tax of £9m) | | | 1 | | | | 17 | | | | 16 | |
| Return of capital to shareholders through B share scheme | | | – | | | | (2,009 | ) | | | – | |
| Repurchase of shares | | | (169 | ) | | | – | | | | – | |
| Movement in treasury stock | | | – | | | | 19 | | | | 5 | |
| Adjustment to initially apply SFAS 158 (including tax of £14m) | | | 51 | | | | – | | | | – | |
| Shareholders’ equity at 1 April | | | 9,747 | | | | 10,591 | | | | 9,821 | |
| |
| Shareholders’ equity at 31 March | | | 9,330 | | | | 9,747 | | | | 10,591 | |
| |
| | |
| (i) | | Included within exchange adjustments is £37m relating to gains on net investment hedges during the year (2006: £91m loss; 2005: £nil). |
166National Grid plc
39. Condensed US GAAP financial information (continued)
Condensed consolidated US GAAP balance sheet
| | | | | | | | | |
| |
| | | 2007 | | | 2006 | |
| | | £m | | | £m | |
| |
Assets | | | | | | | | |
| Current assets | | | | | | | | |
| Cash and cash equivalents | | | 1,606 | | | | 1,466 | |
| Marketable securities | | | 2,098 | | | | 384 | |
| Accounts and notes receivable | | | 638 | | | | 838 | |
| Inventories | | | 106 | | | | 108 | |
| Regulatory assets | | | 305 | | | | 246 | |
| Prepaid expenses and other current assets | | | 879 | | | | 963 | |
| Assets of businesses held for sale | | | 1,963 | | | | – | |
| |
Total current assets | | | 7,595 | | | | 4,005 | |
| Property, plant and equipment | | | 20,068 | | | | 20,235 | |
| Goodwill | | | 4,159 | | | | 4,831 | |
| Other intangible assets | | | 127 | | | | 390 | |
| Investments | | | 137 | | | | 160 | |
| Regulatory assets | | | 2,575 | | | | 2,805 | |
| Other receivables | | | 465 | | | | 526 | |
| |
Total assets | | | 35,126 | | | | 32,952 | |
| |
Liabilities and shareholders’ equity | | | | | | | | |
| Current liabilities | | | | | | | | |
| Bank overdrafts | | | 6 | | | | 3 | |
| Accounts payable | | | 2,180 | | | | 2,366 | |
| Short-term borrowings (i) | | | 783 | | | | 2,565 | |
| Accrued income taxes | | | 71 | | | | 419 | |
| Other accrued liabilities (i) | | | 363 | | | | 257 | |
| Liabilities of businesses held for sale | | | 458 | | | | – | |
| |
Total current liabilities | | | 3,861 | | | | 5,610 | |
| Long-term borrowings | | | 14,586 | | | | 10,059 | |
| Pensions and other post-retirement benefits | | | 1,329 | | | | 1,348 | |
| Deferred income taxes | | | 3,920 | | | | 4,063 | |
| Other liabilities | | | 2,063 | | | | 2,084 | |
| |
Total liabilities | | | 25,759 | | | | 23,164 | |
| |
| Minority interest – equity | | | 11 | | | | 11 | |
| Cumulative preference stock issued by subsidiary undertakings | | | 26 | | | | 30 | |
| | | | | | | | | |
Shareholders’ equity | | | | | | | | |
| Common stock (par value £0.1139 per share; shares authorised 4,388m; shares issued 2007: 2,701m; 2006: 2,720m) | | | 308 | | | | 310 | |
| Additional paid in capital | | | 7,863 | | | | 7,837 | |
| Other reserves (ii) | | | 359 | | | | 359 | |
| Retained earnings (iii) | | | 2,107 | | | | 1,867 | |
| Accumulated comprehensive loss (iii) | | | (1,307 | ) | | | (626 | ) |
| |
Shareholders’ equity | | | 9,330 | | | | 9,747 | |
| |
Total liabilities and shareholders’ equity | | | 35,126 | | | | 32,952 | |
| |
Accumulated comprehensive loss can be analysed as follows:
| | | | | | | | | |
| |
| | | 2007 | | | 2006 | |
| | | £m | | | £m | |
| |
| Cumulative translation adjustment | | | (1,139 | ) | | | (453 | ) |
| Additional minimum pension liability (iii) | | | – | | | | (294 | ) |
| Post-retirement benefit liabilities not yet recognised in net periodic pension cost (iv) | | | (337 | ) | | | – | |
| Unrealised gains on derivatives | | | 23 | | | | 9 | |
| Unrealised gains on available-for-sale investments | | | 3 | | | | 7 | |
| Taxation | | | 139 | | | | 101 | |
| Other | | | 4 | | | | 4 | |
| |
| | | | (1,307 | ) | | | (626 | ) |
| |
| | |
| (i) | | Accrued interest of £269m at 31 March 2006 has been reclassified from short-term borrowings to accounts payable. IFRS requires accrued interest to be presented within borrowings while US GAAP requires accrued interest to be presented separately from borrowings. |
| (ii) | | Other reserves relates to a group reconstruction, resulting in a difference between the capital structure of the new parent company and the capital structure of the former holding company. |
| (iii) | | The method adopted to calculate the market related value of post-retirement plan assets has been amended to achieve greater consistency between pension plans. Consequently, prior year comparatives have been adjusted. |
| (iv) | | Post-retirement benefit liabilities not yet recognised in net periodic pension cost comprises prior service cost of £102m and unrecognised losses of £529m, offset by a regulatory asset of £294m. |
| (v) | | Comparative amounts have been reclassified to present derivative financial instruments separately from related borrowings. |
Annual Report and Accounts 2006/07167
39. Condensed US GAAP financial information (continued)
Segmental information under US GAAP
Management assesses segmental performance on an IFRS basis and this segmental information is presented in note 2. Segments have been determined in accordance with SFAS 131 ‘Disclosures about Segments of an Enterprise and Related Information’ and segmented financial information in note 2 has been presented in accordance with the disclosure requirements of US GAAP.
Goodwill
| | | | | | | | | | | | | | | | | | | | | | | | | | | | | | | | | | | | | |
| |
| | | UK electricity | | | | | | | | | | | | | | | | | | | US stranded | | | | | | | | | | |
| | | and gas | | | US electricity | | | UK gas | | | US gas | | | US electricity | | | cost | | | Wireless | | | Other | | | | |
| | | transmission | | | transmission | | | distribution | | | distribution | | | distribution | | | recoveries | | | infrastructure | | | activities | | | Total | |
| | | £m | | | £m | | | £m | | | £m | | | £m | | | £m | | | £m | | | £m | | | £m | |
| |
| 1 April 2005 | | | 756 | | | | 337 | | | | 2,990 | | | | 112 | | | | 1,198 | | | | – | | | | 592 | | | | 74 | | | | 6,059 | |
| Exchange adjustments | | | – | | | | 29 | | | | – | | | | 10 | | | | 106 | | | | – | | | | 5 | | | | – | | | | 150 | |
| Disposals | | | – | | | | – | | | | (1,369 | ) | | | – | | | | – | | | | – | | | | – | | | | – | | | | (1,369 | ) |
| Adjustments to provisional fair value | | | – | | | | – | | | | – | | | | – | | | | – | | | | – | | | | (9 | ) | | | – | | | | (9 | ) |
| |
| 1 April 2006 | | | 756 | | | | 366 | | | | 1,621 | | | | 122 | | | | 1,304 | | | | – | | | | 588 | | | | 74 | | | | 4,831 | |
| Exchange adjustments | | | – | | | | (43 | ) | | | – | | | | (21 | ) | | | (162 | ) | | | – | | | | – | | | | – | | | | (226 | ) |
| Additions | | | – | | | | – | | | | – | | | | 128 | | | | – | | | | – | | | | 13 | | | | – | | | | 141 | |
| Disposals | | | – | | | | – | | | | – | | | | – | | | | – | | | | – | | | | – | | | | – | | | | – | |
| Adjustments to fair values | | | – | | | | 4 | | | | – | | | | 2 | | | | 8 | | | | – | | | | – | | | | – | | | | 14 | |
| Impairment charge | | | – | | | | – | | | | – | | | | – | | | | – | | | | – | | | | (63 | ) | | | – | | | | (63 | ) |
| Reclassified as held for sale | | | – | | | | – | | | | – | | | | – | | | | – | | | | – | | | | (538 | ) | | | – | | | | (538 | ) |
| |
31 March 2007 | | | 756 | | | | 327 | | | | 1,621 | | | | 231 | | | | 1,150 | | | | – | | | | – | | | | 74 | | | | 4,159 | |
| |
40. National Grid Gas plc additional US GAAP disclosures
The following condensed consolidating financial information, comprising income statements, balance sheets and cash flow statements, is given in respect of National Grid Gas plc (Subsidiary guarantor), which became joint full and unconditional guarantor on 11 May 2004 with National Grid plc (Parent guarantor) of the 6.625% Guaranteed Notes due 2018 issued in June 1998 by British Transco Finance Inc. (then known as British Gas Finance Inc.) (Issuer of notes). National Grid Gas plc and British Transco Finance Inc. are wholly-owned subsidiaries of National Grid plc.
The following financial information for National Grid plc, National Grid Gas plc and British Transco Finance Inc. on a condensed consolidating basis is intended to provide investors with meaningful and comparable financial information and is provided pursuant to Rule 3-10 of Regulation S-X in lieu of the separate financial statements of each subsidiary issuer of public debt securities.
In addition, the financial information for National Grid plc is provided pursuant to Rule 4-08(e) of Regulation S-X. This parent company-only financial information should be read in conjunction with the Company’s financial statements and footnotes presented in our 2006/07 Annual Report and Accounts.
Summary income statements are presented, on a consolidating basis, for the three years ended 31 March 2007. Summary income statements of National Grid plc and National Grid Gas plc are presented under US GAAP measurement principles, as modified by the inclusion of the results of subsidiary undertakings on the basis of equity accounting principles.
The summary balance sheets of National Grid plc and National Grid Gas plc include the investments in subsidiaries recorded under the equity method for the purposes of presenting condensed consolidating financial information under US GAAP. The US GAAP summary balance sheets present these investments within ‘Investments’.
The consolidation adjustments column includes the necessary amounts to eliminate the inter-company balances and transactions between National Grid plc, National Grid Gas plc, British Transco Finance Inc. and other subsidiaries.
168National Grid plc
40. National Grid Gas plc additional US GAAP disclosures (continued)
Summary income statement for the year ended 31 March 2007 – US GAAP
| | | | | | | | | | | | | | | | | | | | | | | | | |
| |
| | | Parent | | | Issuer of | | | Subsidiary | | | | | | | | | | | | |
| | | guarantor | | | notes | | | guarantor | | | | | | | | | | | | |
| | | National | | | British | | | National | | | | | | | | | | | National | |
| | | Grid | | | Transco | | | Grid Gas | | | Other | | | Consolidation | | | Grid | |
| | | plc | | | Finance Inc | . | | plc | | | subsidiaries | | | adjustments | | | consolidated | |
| | | £m | | | £m | | | £m | | | £m | | | £m | | | £m | |
| |
| Revenue | | | – | | | | – | | | | 2,248 | | | | 6,756 | | | | (318 | ) | | | 8,686 | |
| Other operating income | | | – | | | | – | | | | 6 | | | | 63 | | | | – | | | | 69 | |
| Operating costs | | | | | | | | | | | | | | | | | | | | | | | | |
| Depreciation and amortisation | | | – | | | | – | | | | (505 | ) | | | (511 | ) | | | – | | | | (1,016 | ) |
| Payroll costs | | | – | | | | – | | | | (226 | ) | | | (590 | ) | | | – | | | | (816 | ) |
| Purchases of electricity | | | – | | | | – | | | | – | | | | (1,887 | ) | | | – | | | | (1,887 | ) |
| Purchases of gas | | | – | | | | – | | | | (113 | ) | | | (426 | ) | | | – | | | | (539 | ) |
| Rates and property taxes | | | – | | | | – | | | | (211 | ) | | | (260 | ) | | | – | | | | (471 | ) |
| Electricity transmission services scheme direct costs | | | – | | | | – | | | | – | | | | (565 | ) | | | – | | | | (565 | ) |
| Payments to Scottish electricity transmission network owners | | | – | | | | – | | | | – | | | | (237 | ) | | | – | | | | (237 | ) |
| Expense relating to impairment of receivables | | | – | | | | – | | | | 1 | | | | (64 | ) | | | – | | | | (63 | ) |
| Other operating charges | | | (2 | ) | | | – | | | | (532 | ) | | | (1,088 | ) | | | 323 | | | | (1,299 | ) |
| | | | (2 | ) | | | – | | | | (1,586 | ) | | | (5,628 | ) | | | 323 | | | | (6,893 | ) |
| |
| Operating profit | | | (2 | ) | | | – | | | | 668 | | | | 1,191 | | | | 5 | | | | 1,862 | |
| Net finance costs | | | 15 | | | | – | | | | (304 | ) | | | (349 | ) | | | – | | | | (638 | ) |
| Dividends receivable | | | – | | | | – | | | | – | | | | 1,850 | | | | (1,850 | ) | | | – | |
| |
| Profit before taxation | | | 13 | | | | – | | | | 364 | | | | 2,692 | | | | (1,845 | ) | | | 1,224 | |
| Taxation | | | 8 | | | | – | | | | (210 | ) | | | 70 | | | | – | | | | (132 | ) |
| |
| Profit for the year | | | 21 | | | | – | | | | 154 | | | | 2,762 | | | | (1,845 | ) | | | 1,092 | |
| Minority interests | | | – | | | | – | | | | – | | | | (2 | ) | | | – | | | | (2 | ) |
| Interest in equity accounted affiliates | | | 1,071 | | | | – | | | | 12 | | | | 2 | | | | (1,083 | ) | | | 2 | |
| |
| Net income from continuing operations attributable to equity shareholders | | | 1,092 | | | | – | | | | 166 | | | | 2,762 | | | | (2,928 | ) | | | 1,092 | |
| Net income from discontinued operations | | | 54 | | | | – | | | | 13 | | | | 32 | | | | (45 | ) | | | 54 | |
| |
Net income for the year attributable to equity shareholders | | | 1,146 | | | | – | (i) | | | 179 | | | | 2,794 | | | | (2,973 | ) | | | 1,146 | |
| |
| | |
| (i) | | Net income for the year for British Transco Finance Inc. is £nil as interest payable to external bond holders is offset by interest receivable on loans to National Grid Gas plc. |
Summary income statement for the year ended 31 March 2006 – US GAAP
| | | | | | | | | | | | | | | | | | | | | | | | | |
| |
| | | Parent | | | Issuer of | | | Subsidiary | | | | | | | | | | | | |
| | | guarantor | | | notes | | | guarantor | | | | | | | | | | | | |
| | | National | | | British | | | National | | | | | | | | | | | National | |
| | | Grid | | | Transco | | | Grid Gas | | | Other | | | Consolidation | | | Grid | |
| | | plc | | | Finance Inc. | | | plc | | | subsidiaries | | | adjustments | | | consolidated | |
| | | £m | * | | £m | * | | £m | * | | £m | * | | £m | * | | £m | * |
| |
| Revenue | | | 1 | | | | – | | | | 2,261 | | | | 6,992 | | | | (363 | ) | | | 8,891 | |
| Other operating income | | | – | | | | – | | | | 4 | | | | 46 | | | | – | | | | 50 | |
| Operating costs | | | | | | | | | | | | | | | | | | | | | | | | |
| Depreciation and amortisation | | | – | | | | – | | | | (492 | ) | | | (516 | ) | | | – | | | | (1,008 | ) |
| Payroll costs | | | – | | | | – | | | | (282 | ) | | | (613 | ) | | | – | | | | (895 | ) |
| Purchases of electricity | | | – | | | | – | | | | – | | | | (2,093 | ) | | | – | | | | (2,093 | ) |
| Purchases of gas | | | – | | | | – | | | | (148 | ) | | | (415 | ) | | | – | | | | (563 | ) |
| Rates and property taxes | | | – | | | | – | | | | (180 | ) | | | (259 | ) | | | – | | | | (439 | ) |
| Electricity transmission services scheme direct costs | | | – | | | | – | | | | – | | | | (536 | ) | | | – | | | | (536 | ) |
| Payments to Scottish electricity transmission network owners | | | – | | | | – | | | | – | | | | (259 | ) | | | – | | | | (259 | ) |
| Expense relating to impairment of receivables | | | – | | | | – | | | | – | | | | (24 | ) | | | – | | | | (24 | ) |
| Other operating charges | | | – | | | | – | | | | (977 | ) | | | (1,193 | ) | | | 795 | | | | (1,375 | ) |
| | | | – | | | | – | | | | (2,079 | ) | | | (5,908 | ) | | | 795 | | | | (7,192 | ) |
| |
| Operating profit | | | 1 | | | | – | | | | 186 | | | | 1,130 | | | | 432 | | | | 1,749 | |
| Net finance costs | | | (29 | ) | | | – | | | | (215 | ) | | | (481 | ) | | | – | | | | (725 | ) |
| Dividends receivable | | | – | | | | – | | | | – | | | | 310 | | | | (310 | ) | | | – | |
| |
| Profit before taxation | | | (28 | ) | | | – | | | | (29 | ) | | | 959 | | | | 122 | | | | 1,024 | |
| Taxation | | | 42 | | | | – | | | | (64 | ) | | | (299 | ) | | | – | | | | (321 | ) |
| |
| Profit for the year | | | 14 | | | | – | | | | (93 | ) | | | 660 | | | | 122 | | | | 703 | |
| Minority interests | | | – | | | | – | | | | – | | | | (3 | ) | | | – | | | | (3 | ) |
| Interest in equity accounted affiliates | | | 689 | | | | – | | | | 452 | | | | 3 | | | | (1,141 | ) | | | 3 | |
| |
| Net income from continuing operations attributable to equity shareholders | | | 703 | | | | – | | | | 359 | | | | 660 | | | | (1,019 | ) | | | 703 | |
| Net income from discontinued operations | | | 604 | | | | – | | | | 546 | | | | 70 | | | | (616 | ) | | | 604 | |
| |
| Net income for the year attributable to equity shareholders | | | 1,307 | | | | – | (i) | | | 905 | | | | 730 | | | | (1,635 | ) | | | 1,307 | |
| |
| |
| * | Comparatives have been adjusted to reclassify amounts relating to discontinued operations |
| | |
| (i) | | Net income for the year for British Transco Finance Inc. is £nil as interest payable to external bond holders is offset by interest receivable on loans to National Grid Gas plc. |
Annual Report and Accounts 2006/07169
40. National Grid Gas plc additional US GAAP disclosures (continued)
Summary income statement for the year ended 31 March 2005 – US GAAP
| | | | | | | | | | | | | | | | | | | | | | | | | |
| |
| | | Parent | | | Issuer of | | | Subsidiary | | | | | | | | | | | | |
| | | guarantor | | | notes | | | guarantor | | | | | | | | | | | | |
| | | National | | | British | | | National | | | | | | | | | | | National | |
| | | Grid | | | Transco | | | Grid Gas | | | Other | | | Consolidation | | | Grid | |
| | | plc | | | Finance Inc. | | | plc | | | subsidiaries | | | adjustments | | | consolidated | |
| | | £m | * | | £m | * | | £m | * | | £m | * | | £m | * | | £m | * |
| |
| Revenue | | | 1 | | | | – | | | | 2,041 | | | | 5,680 | | | | (514 | ) | | | 7,208 | |
| Other operating income | | | – | | | | – | | | | 2 | | | | 34 | | | | – | | | | 36 | |
| Operating costs | | | | | | | | | | | | | | | | | | | | | | | | |
| Depreciation and amortisation | | | – | | | | – | | | | (497 | ) | | | (417 | ) | | | – | | | | (914 | ) |
| Payroll costs | | | (2 | ) | | | – | | | | (276 | ) | | | (577 | ) | | | – | | | | (855 | ) |
| Purchases of electricity | | | – | | | | – | | | | – | | | | (1,671 | ) | | | – | | | | (1,671 | ) |
| Purchases of gas | | | – | | | | – | | | | (85 | ) | | | (272 | ) | | | – | | | | (357 | ) |
| Rates and property taxes | | | – | | | | – | | | | (160 | ) | | | (243 | ) | | | – | | | | (403 | ) |
| Electricity transmission services scheme direct costs | | | – | | | | – | | | | – | | | | (301 | ) | | | – | | | | (301 | ) |
| Payments to Scottish electricity transmission network owners | | | – | | | | – | | | | – | | | | – | | | | – | | | | – | |
| Expense relating to impairment of receivables | | | – | | | | – | | | | 4 | | | | (45 | ) | | | – | | | | (41 | ) |
| Other operating charges | | | (29 | ) | | | – | | | | (3,276 | ) | | | (944 | ) | | | 3,350 | | | | (899 | ) |
| | | | (31 | ) | | | – | | | | (4,290 | ) | | | (4,470 | ) | | | 3,350 | | | | (5,441 | ) |
| |
| Operating profit | | | (30 | ) | | | – | | | | (2,247 | ) | | | 1,244 | | | | 2,836 | | | | 1,803 | |
| Net finance costs | | | 123 | | | | – | | | | (443 | ) | | | (144 | ) | | | 6 | | | | (458 | ) |
| Dividends receivable | | | – | | | | – | | | | – | | | | 500 | | | | (500 | ) | | | – | |
| |
| Profit before taxation | | | 93 | | | | – | | | | (2,690 | ) | | | 1,600 | | | | 2,342 | | | | 1,345 | |
| Taxation | | | (20 | ) | | | – | | | | (32 | ) | | | (245 | ) | | | (2 | ) | | | (299 | ) |
| |
| Profit for the year | | | 73 | | | | – | | | | (2,722 | ) | | | 1,355 | | | | 2,340 | | | | 1,046 | |
| Minority interests | | | – | | | | – | | | | – | | | | (2 | ) | | | – | | | | (2 | ) |
| Interest in equity accounted affiliates | | | 969 | | | | – | | | | 2,930 | | | | (2 | ) | | | (3,899 | ) | | | (2 | ) |
| |
| Net income from continuing operations attributable to equity shareholders | | | 1,042 | | | | – | | | | 208 | | | | 1,351 | | | | (1,559 | ) | | | 1,042 | |
| Net income from discontinued operations | | | 246 | | | | – | | | | 267 | | | | (21 | ) | | | (246 | ) | | | 246 | |
| |
| Net income for the year attributable to equity shareholders | | | 1,288 | | | | – | (i) | | | 475 | | | | 1,330 | | | | (1,805 | ) | | | 1,288 | |
| |
| |
| * | The method adopted to calculate the market related value of post-retirement plan assets has been amended to achieve greater consistency between pension plans. Consequently, prior year comparatives have been adjusted. Comparatives have also been adjusted to reclassify amounts relating to discontinued operations |
| | |
| (i) | | Net income for the year for British Transco Finance Inc. is £nil as interest payable to external bond holders is offset by interest receivable on loans to National Grid Gas plc. |
170National Grid plc
40. National Grid Gas plc additional US GAAP disclosures (continued)
Balance sheet as at 31 March 2007 – US GAAP
| | | | | | | | | | | | | | | | | | | | | | | | | |
| |
| | | Parent | | | Issuer of | | | Subsidiary | | | | | | | | | | | | |
| | | guarantor | | | notes | | | guarantor | | | | | | | | | | | | |
| | | National | | | British | | | National | | | | | | | | | | | National | |
| | | Grid | | | Transco | | | Grid Gas | | | Other | | | Consolidation | | | Grid | |
| | | plc | | | Finance Inc | . | | plc | | | subsidiaries | | | adjustments | | | consolidated | |
| | | £m | | | £m | | | £m | | | £m | | | £m | | | £m | |
| |
| Assets | | | | | | | | | | | | | | | | | | | | | | | | |
| Current assets | | | | | | | | | | | | | | | | | | | | | | | | |
| Cash and cash equivalents | | | 748 | | | | – | | | | 172 | | | | 686 | | | | – | | | | 1,606 | |
| Marketable securities | | | 282 | | | | – | | | | 305 | | | | 1,511 | | | | – | | | | 2,098 | |
| Accounts and notes receivable | | | 3 | | | | – | | | | 195 | | | | 440 | | | | – | | | | 638 | |
| Inventories | | | – | | | | – | | | | 28 | | | | 78 | | | | – | | | | 106 | |
| Amounts owed by subsidiary undertakings | | | 9,047 | | | | – | | | | 5,703 | | | | 5,200 | | | | (19,950 | ) | | | – | |
| Regulatory assets | | | – | | | | – | | | | – | | | | 305 | | | | – | | | | 305 | |
| Prepaid expenses and other current assets | | | 119 | | | | – | | | | 42 | | | | 718 | | | | – | | | | 879 | |
| Assets of businesses held for sale | | | – | | | | – | | | | – | | | | 1,963 | | | | – | | | | 1,963 | |
| |
| Total current assets | | | 10,199 | | | | – | | | | 6,445 | | | | 10,901 | | | | (19,950 | ) | | | 7,595 | |
| Property, plant and equipment | | | – | | | | – | | | | 10,589 | | | | 9,509 | | | | (30 | ) | | | 20,068 | |
| Goodwill | | | – | | | | – | | | | 2,451 | | | | 1,708 | | | | – | | | | 4,159 | |
| Intangible assets | | | – | | | | – | | | | 41 | | | | 86 | | | | – | | | | 127 | |
| Investments | | | 6,700 | | | | – | | | | 67 | | | | 16,299 | | | | (22,929 | ) | | | 137 | |
| Amounts owed by subsidiary undertakings | | | – | | | | 156 | | | | – | | | | – | | | | (156 | ) | | | – | |
| Regulatory assets | | | – | | | | – | | | | – | | | | 2,575 | | | | – | | | | 2,575 | |
| Other receivables | | | 195 | | | | – | | | | 67 | | | | 203 | | | | – | | | | 465 | |
| |
Total assets | | | 17,094 | | | | 156 | | | | 19,660 | | | | 41,281 | | | | (43,065 | ) | | | 35,126 | |
| |
| Liabilities and shareholders’ equity | | | | | | | | | | | | | | | | | | | | | | | | |
| Current liabilities | | | | | | | | | | | | | | | | | | | | | | | | |
| Bank overdrafts | | | – | | | | – | | | | 6 | | | | – | | | | – | | | | 6 | |
| Accounts payable | | | – | | | | – | | | | 587 | | | | 1,593 | | | | – | | | | 2,180 | |
| Short-term borrowings | | | 359 | | | | 3 | | | | 346 | | | | 75 | | | | – | | | | 783 | |
| Accrued income taxes | | | – | | | | – | | | | 40 | | | | 31 | | | | – | | | | 71 | |
| Amounts owed to subsidiary undertakings | | | 2,776 | | | | – | | | | 2,424 | | | | 14,750 | | | | (19,950 | ) | | | – | |
| Other accrued liabilities | | | 52 | | | | – | | | | 82 | | | | 306 | | | | (77 | ) | | | 363 | |
| Liabilities of businesses held for sale | | | – | | | | – | | | | – | | | | 458 | | | | – | | | | 458 | |
| |
| Total current liabilities | | | 3,187 | | | | 3 | | | | 3,485 | | | | 17,213 | | | | (20,027 | ) | | | 3,861 | |
| Long-term borrowings | | | 4,513 | | | | 153 | | | | 3,214 | | | | 6,706 | | | | – | | | | 14,586 | |
| Amounts owed to subsidiary undertakings | | | – | | | | – | | | | – | | | | 156 | | | | (156 | ) | | | – | |
| Post-retirement benefits | | | – | | | | – | | | | – | | | | 1,338 | | | | (9 | ) | | | 1,329 | |
| Deferred income taxes | | | 10 | | | | – | | | | 2,153 | | | | 1,757 | | | | – | | | | 3,920 | |
| Other liabilities | | | 54 | | | | – | | | | 1,169 | | | | 840 | | | | – | | | | 2,063 | |
| |
Total liabilities | | | 7,764 | | | | 156 | | | | 10,021 | | | | 28,010 | | | | (20,192 | ) | | | 25,759 | |
| |
| Minority interest – equity | | | – | | | | – | | | | – | | | | 11 | | | | – | | | | 11 | |
| Cumulative preference stock issued by subsidiary undertakings | | | – | | | | – | | | | – | | | | 26 | | | | – | | | | 26 | |
| | | | | | | | | | | | | | | | | | | | | | | | | |
| Shareholders’ equity | | | | | | | | | | | | | | | | | | | | | | | | |
| Common stock | | | 308 | | | | – | | | | 45 | | | | 541 | | | | (586 | ) | | | 308 | |
| Additional paid in capital | | | 7,863 | | | | – | | | | 9,680 | | | | 9,336 | | | | (19,016 | ) | | | 7,863 | |
| Other reserves | | | 359 | | | | – | | | | – | | | | – | | | | – | | | | 359 | |
| Retained earnings | | | 2,107 | | | | – | | | | (17 | ) | | | 4,686 | | | | (4,669 | ) | | | 2,107 | |
| Accumulated comprehensive loss | | | (1,307 | ) | | | – | | | | (69 | ) | | | (1,329 | ) | | | 1,398 | | | | (1,307 | ) |
| |
Shareholders’ equity | | | 9,330 | | | | – | | | | 9,639 | | | | 13,234 | | | | (22,873 | ) | | | 9,330 | |
| |
Total liabilities and shareholders’ equity | | | 17,094 | | | | 156 | | | | 19,660 | | | | 41,281 | | | | (43,065 | ) | | | 35,126 | |
| |
Annual Report and Accounts 2006/07171
40. National Grid Gas plc additional US GAAP disclosures (continued)
Balance sheet as at 31 March 2006 – US GAAP
| | | | | | | | | | | | | | | | | | | | | | | | | |
| |
| | | Parent | | | Issuer of | | | Subsidiary | | | | | | | | | | | | |
| | | guarantor | | | notes | | | guarantor | | | | | | | | | | | | |
| | | National | | | British | | | National | | | | | | | | | | | National | |
| | | Grid | | | Transco | | | Grid Gas | | | Other | | | Consolidation | | | Grid | |
| | | plc | | | Finance Inc. | | | plc | | | subsidiaries | | | adjustments | | | consolidated | |
| | | £m | | | £m | | | £m | | | £m | | | £m | | | £m | |
| |
| Assets | | | | | | | | | | | | | | | | | | | | | | | | |
| Current assets | | | | | | | | | | | | | | | | | | | | | | | | |
| Cash and cash equivalents | | | 1,046 | | | | 1 | | | | 221 | | | | 212 | | | | (14 | ) | | | 1,466 | |
| Marketable securities | | | – | | | | – | | | | 35 | | | | 349 | | | | – | | | | 384 | |
| Accounts and notes receivable | | | 16 | | | | 3 | | | | 171 | | | | 648 | | | | – | | | | 838 | |
| Inventories | | | – | | | | – | | | | 23 | | | | 85 | | | | – | | | | 108 | |
| Amounts owed by subsidiary undertakings | | | 7,093 | | | | – | | | | 5,722 | | | | 4,529 | | | | (17,344 | ) | | | – | |
| Regulatory assets | | | – | | | | – | | | | – | | | | 246 | | | | – | | | | 246 | |
| Prepaid expenses and other current assets | | | 64 | | | | – | | | | 101 | | | | 798 | | | | – | | | | 963 | |
| |
| Total current assets | | | 8,219 | | | | 4 | | | | 6,273 | | | | 6,867 | | | | (17,358 | ) | | | 4,005 | |
| Property, plant and equipment | | | – | | | | – | | | | 8,983 | | | | 11,287 | | | | (35 | ) | | | 20,235 | |
| Goodwill | | | – | | | | – | | | | 2,377 | | | | 2,454 | | | | – | | | | 4,831 | |
| Intangible assets | | | – | | | | – | | | | 33 | | | | 357 | | | | – | | | | 390 | |
| Investments | | | 5,209 | | | | – | | | | 52 | | | | 16,323 | | | | (21,424 | ) | | | 160 | |
| Amounts owed by subsidiary undertakings | | | – | | | | 157 | | | | – | | | | – | | | | (157 | ) | | | – | |
| Regulatory assets | | | – | | | | – | | | | – | | | | 2,805 | | | | – | | | | 2,805 | |
| Other receivables | | | 79 | | | | – | | | | 91 | | | | 356 | | | | – | | | | 526 | |
| |
Total assets | | | 13,507 | | | | 161 | | | | 17,809 | | | | 40,449 | | | | (38,974 | ) | | | 32,952 | |
| |
| Liabilities and shareholders’ equity | | | | | | | | | | | | | | | | | | | | | | | | |
| Current liabilities | | | | | | | | | | | | | | | | | | | | | | | | |
| Bank overdrafts | | | 14 | | | | – | | | | – | | | | 3 | | | | (14 | ) | | | 3 | |
| Accounts payable | | | – | | | | – | | | | 436 | | | | 1,930 | | | | – | | | | 2,366 | |
| Short-term borrowings | | | 114 | | | | 4 | | | | 689 | | | | 1,758 | | | | – | | | | 2,565 | |
| Accrued income taxes | | | – | | | | – | | | | 70 | | | | 349 | | | | – | | | | 419 | |
| Amounts owed to subsidiary undertakings | | | 1,813 | | | | – | | | | 920 | | | | 14,611 | | | | (17,344 | ) | | | – | |
| Other accrued liabilities | | | 63 | | | | – | | | | 111 | | | | 160 | | | | (77 | ) | | | 257 | |
| |
| Total current liabilities | | | 2,004 | | | | 4 | | | | 2,226 | | | | 18,811 | | | | (17,435 | ) | | | 5,610 | |
| Long-term borrowings | | | 1,741 | | | | 157 | | | | 2,005 | | | | 6,156 | | | | – | | | | 10,059 | |
| Amounts owed to subsidiary undertakings | | | – | | | | – | | | | – | | | | 157 | | | | (157 | ) | | | – | |
| Post-retirement benefits | | | – | | | | – | | | | – | | | | 1,348 | | | | – | | | | 1,348 | |
| Deferred income taxes | | | 15 | | | | – | | | | 2,151 | | | | 1,897 | | | | – | | | | 4,063 | |
| Other liabilities | | | – | | | | – | | | | 226 | | | | 1,858 | | | | – | | | | 2,084 | |
| |
Total liabilities | | | 3,760 | | | | 161 | | | | 6,608 | | | | 30,227 | | | | (17,592 | ) | | | 23,164 | |
| |
| Minority interest – equity | | | – | | | | – | | | | – | | | | 11 | | | | – | | | | 11 | |
| Cumulative preference stock issued by subsidiary undertakings | | | – | | | | – | | | | – | | | | 30 | | | | – | | | | 30 | |
| | | | | | | | | | | | | | | | | | | | | | | | | |
| Shareholders’ equity | | | | | | | | | | | | | | | | | | | | | | | | |
| Common stock | | | 310 | | | | – | | | | 45 | | | | 541 | | | | (586 | ) | | | 310 | |
| Additional paid in capital | | | 7,837 | | | | – | | | | 9,680 | | | | 8,072 | | | | (17,752 | ) | | | 7,837 | |
| Other reserves | | | 359 | | | | – | | | | – | | | | – | | | | – | | | | 359 | |
| Retained earnings | | | 1,867 | | | | – | | | | 1,476 | | | | 2,194 | | | | (3,670 | ) | | | 1,867 | |
| Accumulated comprehensive loss | | | (626 | ) | | | – | | | | – | | | | (626 | ) | | | 626 | | | | (626 | ) |
| Treasury stock | | | – | | | | – | | | | – | | | | – | | | | – | | | | – | |
| |
Shareholders’ equity | | | 9,747 | | | | – | | | | 11,201 | | | | 10,181 | | | | (21,382 | ) | | | 9,747 | |
| |
Total liabilities and shareholders’ equity | | | 13,507 | | | | 161 | | | | 17,809 | | | | 40,449 | | | | (38,974 | ) | | | 32,952 | |
| |
172National Grid plc
40. National Grid Gas plc additional US GAAP disclosures (continued)
Cash flow statements – US GAAP
| | | | | | | | | | | | | | | | | | | | | | | | | |
| |
| | | Parent | | | Issuer of | | | Subsidiary | | | | | | | | | | | | |
| | | guarantor | | | notes | | | guarantor | | | | | | | | | | | | |
| | | National | | | British | | | National | | | | | | | | | | | National | |
| | | Grid | | | Transco | | | Grid Gas | | | Other | | | Consolidation | | | Grid | |
| | | plc | | | Finance Inc | . | | plc | | | subsidiaries | | | adjustments | | | consolidated | |
| | | £m | | | £m | | | £m | | | £m | | | £m | | | £m | |
| |
Year ended 31 March 2007 | | | | | | | | | | | | | | | | | | | | | | | | |
| Net cash provided by/(used in) operating activities – continuing operations | | | 221 | | | | – | | | | 1,341 | | | | 3,288 | | | | (2,071 | ) | | | 2,779 | |
| Net cash used in operating activities – discontinued operations | | | – | | | | – | | | | – | | | | 178 | | | | – | | | | 178 | |
| |
| Net cash provided by/(used in) operating activities | | | 221 | | | | – | | | | 1,341 | | | | 3,466 | | | | (2,071 | ) | | | 2,957 | |
| |
| Net cash used in investing activities – continuing operations | | | (1,545 | ) | | | – | | | | (1,429 | ) | | | (2,462 | ) | | | 1,264 | | | | (4,172 | ) |
| Net cash provided by/(used in) investing activities – discontinued operations | | | – | | | | – | | | | 27 | | | | (132 | ) | | | – | | | | (105 | ) |
| |
| Net cash used in investing activities | | | (1,545 | ) | | | – | | | | (1,402 | ) | | | (2,594 | ) | | | 1,264 | | | | (4,277 | ) |
| |
| Net cash provided by/(used in) financing activities | | | 1,040 | | | | (1 | ) | | | 6 | | | | (358 | ) | | | 807 | | | | 1,494 | |
| |
(Decrease)/increase in cash and cash equivalents in the year | | | (284 | ) | | | (1 | ) | | | (55 | ) | | | 514 | | | | – | | | | 174 | |
| |
| | | | | | | | | | | | | | | | | | | | | | | | | |
Year ended 31 March 2006* | | | | | | | | | | | | | | | | | | | | | | | | |
| Net cash (used in)/provided by operating activities – continuing operations | | | (9 | ) | | | 1 | | | | 1,501 | | | | 1,428 | | | | (802 | ) | | | 2,119 | |
| Net cash (used in)/provided by operating activities – discontinued operations | | | – | | | | – | | | | (57 | ) | | | 158 | | | | – | | | | 101 | |
| |
| Net cash (used in)/provided by operating activities | | | (9 | ) | | | 1 | | | | 1,444 | | | | 1,586 | | | | (802 | ) | | | 2,220 | |
| |
| Net cash used in investing activities – continuing operations | | | – | | | | – | | | | (681 | ) | | | (940 | ) | | | – | | | | (1,621 | ) |
| Net cash provided by/(used in) investing activities – discontinued operations | | | – | | | | – | | | | 5,635 | | | | (94 | ) | | | – | | | | 5,541 | |
| |
| Net cash provided by/(used in) investing activities | | | – | | | | – | | | | 4,954 | | | | (1,034 | ) | | | – | | | | 3,920 | |
| |
| Net cash provided by/(used in) financing activities | | | 937 | | | | – | | | | (6,181 | ) | | | (517 | ) | | | 788 | | | | (4,973 | ) |
| |
| Increase in cash and cash equivalents in the year | | | 928 | | | | 1 | | | | 217 | | | | 35 | | | | (14 | ) | | | 1,167 | |
| |
| | | | | | | | | | | | | | | | | | | | | | | | | |
Year ended 31 March 2005* | | | | | | | | | | | | | | | | | | | | | | | | |
| Net cash provided by/(used in) operating activities – continuing operations | | | 1,108 | | | | (1 | ) | | | 3,594 | | | | 1,754 | | | | (4,522 | ) | | | 1,933 | |
| Net cash provided by operating activities – discontinued operations | | | – | | | | – | | | | 449 | | | | 101 | | | | – | | | | 550 | |
| |
| Net cash provided by/(used in) operating activities | | | 1,108 | | | | (1 | ) | | | 4,043 | | | | 1,855 | | | | (4,522 | ) | | | 2,483 | |
| |
| Net cash used in investing activities – continuing operations | | | (273 | ) | | | – | | | | (5,126 | ) | | | (717 | ) | | | 4,763 | | | | (1,353 | ) |
| Net cash used in investing activities – discontinued operations | | | – | | | | – | | | | (323 | ) | | | (1,249 | ) | | | – | | | | (1,572 | ) |
| |
| Net cash used in investing activities | | | (273 | ) | | | – | | | | (5,449 | ) | | | (1,966 | ) | | | 4,763 | | | | (2,925 | ) |
| |
| Net cash (used in)/provided by financing activities | | | (723 | ) | | | – | | | | 1,336 | | | | 68 | | | | (241 | ) | | | 440 | |
| |
| Increase/(decrease) in cash and cash equivalents in the year | | | 112 | | | | (1 | ) | | | (70 | ) | | | (43 | ) | | | – | | | | (2 | ) |
| |
| | |
| *Comparatives have been adjusted to reclassify amounts relating to discontinued operations |
Cash dividends were received by National Grid plc from consolidated subsidiaries amounting to £220m during the year ended 31 March 2007 (2006: £nil; 2005: £1,139m).
Annual Report and Accounts 2006/07173
Company accounting policies
(a) Basis of preparation of individual financial statements
These individual financial statements of the Company have been prepared in accordance with applicable UK accounting and financial reporting standards and the Companies Act 1985.
The individual financial statements of the Company have been prepared on a historical cost basis, except for the revaluation of financial instruments.
These financial statements are presented in pounds sterling because that is the currency of the primary economic environment in which the Company operates.
The Company has not presented its own profit and loss account as permitted by section 230 of the Companies Act 1985. The Company has taken the exemption from preparing a cash flow statement under the terms of FRS 1 (revised 1996) ‘Cash flow statements’.
In accordance with exemptions under FRS 8 ‘Related party disclosures’, the Company has not disclosed transactions with related parties, as the Company’s accounts are presented together with its consolidated financial statements. Further, in accordance with exemptions under FRS 29 ‘Financial Instruments: Disclosures’, the Company has not presented the financial instruments disclosures required by the standard, as disclosures which comply with the standard are included in the consolidated financial statements.
The preparation of financial statements requires management to make estimates and assumptions that affect the reported amounts of assets and liabilities, disclosures of contingent assets and liabilities and the reported amounts of revenue and expenses during the reporting period. Actual results could differ from these estimates.
(b) Fixed asset investments
Investments held as fixed assets are stated at cost less any provisions for impairment. Investments are reviewed for impairment if events or changes in circumstances indicate that the carrying amount may not be recoverable. Impairments are calculated such that the carrying value of the fixed asset investment is the lower of its cost or recoverable amount. Recoverable amount is the higher of its net realisable value and its value in use.
(c) Deferred taxation
Deferred taxation is provided in full on all material timing differences, with certain exceptions. No provision for deferred taxation is made for any timing differences on non-monetary assets arising from fair value adjustments, except where there is a binding agreement to sell the assets concerned. However, no provision is made where it is more likely than not that any taxable gain will be rolled over into replacement assets.
Deferred tax assets are only recognised to the extent that they are considered recoverable.
Deferred tax balances have not been discounted.
(d) Foreign currencies
Transactions in currencies other than the functional currency of the Company are recorded at the rates of exchange prevailing on the dates of the transactions. At each balance sheet date, monetary assets and liabilities that are denominated in foreign currencies are retranslated at closing exchange rates.
Gains and losses arising on retranslation of monetary assets and liabilities are included in the profit and loss account.
(e) Financial instruments
Financial assets, liabilities and equity instruments are classified according to the substance of the contractual arrangements entered into. An equity instrument is any contract that evidences a residual interest in the assets of the Company after deducting all of its liabilities and is recorded at the proceeds received, net of direct issue costs.
Loans receivable are carried at amortised cost using the effective interest rate method less any allowance for estimated impairments. A provision is established for impairments when there is objective evidence that the Company will not be able to collect all amounts due under the original terms of the loan. Interest income, together with losses when the loans are impaired are recognised in the profit and loss account.
Current asset investments are initially measured at cost including transaction costs. Changes in the fair value of investments classified as available-for-sale are recognised directly in equity, until the investment is disposed of or is determined to be impaired. At this time the cumulative gain or loss previously recognised in equity is included in net profit or loss for the period. Investment income on investments classified as available-for-sale is recognised in the profit and loss account as it accrues.
Interest-bearing loans and overdrafts are recorded at the proceeds received, net of direct issue costs, plus accrued interest less any repayments.
Finance charges are recognised in the profit and loss account in the period in which they are incurred.
Derivative financial instruments are recorded as described below.
(f) Hedge accounting and derivative financial instruments
The Company enters into derivative financial instruments (‘derivatives’) in order to manage its interest rate and foreign currency exposures. The principal derivatives used include interest rate swaps, forward rate agreements, currency swaps, forward foreign currency contracts and interest rate swaptions.
All derivative transactions are undertaken, or maintained, with a view to managing the interest or currency risks associated with the Company’s underlying business activities and the financing of those activities.
Derivatives are carried in the balance sheet at their fair value.
174National Grid plc
Changes in the carrying value of financial instruments that are designated and effective as hedges of future cash flows (‘cash flow hedges’) are recognised directly in equity and any ineffective portion is recognised immediately in the profit and loss account. Amounts deferred in equity in respect of cash flow hedges are subsequently recognised in the profit and loss account in the same period in which the hedged item affects net profit or loss.
Changes in the carrying value of financial instruments that are designated as hedges of the changes in the fair value of assets or liabilities (‘fair value hedges’) are recognised in the profit and loss account. An offsetting amount is recorded as an adjustment to the carrying value of hedged items, with a corresponding entry in the profit and loss account, to the extent that the change is attributable to the risk being hedged and that the fair value hedge is effective.
Changes in the fair value of derivatives that do not qualify for hedge accounting are recognised in the profit and loss account as they arise.
Hedge accounting is discontinued when the hedging instrument expires or is sold, terminated, exercised, or no longer qualifies for hedge accounting. At that time, any cumulative gains or losses relating to cash flow hedges recognised in equity are initially retained in equity and subsequently recognised in the profit and loss account in the same periods in which the previously hedged item affects net profit or loss. For fair value hedges the cumulative adjustment recorded to its carrying value at the date hedge accounting is discontinued is amortised to the profit and loss account using the effective interest rate method.
If a hedged transaction is no longer expected to occur, the net cumulative gain or loss recognised in equity is transferred to the profit and loss account immediately.
Derivatives embedded in other financial instruments or other host contracts are treated as separate derivatives when their risks and characteristics are not closely related to those of host contracts.
(g) Parent Company guarantees
The Company has guaranteed the repayment of the principal and any associated premium and interest on specific loans due from certain subsidiary undertakings to third parties. In the event of default or non-performance by the subsidiary, the Company recognises such guarantees as insurance contracts, at fair value with a corresponding increase in the carrying value of the investment.
(h) Share-based payments
The Company issues equity-settled share-based payments to certain employees of subsidiary undertakings, detailed in the Directors’ Report, the Directors’ Remuneration Report and in note 31 in the consolidated financial statements.
Equity-settled share-based payments are measured at fair value at the date of grant. The Company has no employees. Equity-settled share-based payments that are made available to employees of the Company’s subsidiaries are treated as increases in equity over the vesting period of the award, with a corresponding increase in the Company’s investments in subsidiaries, based on an estimate of the number of shares that will eventually vest. Where payments are subsequently received from subsidiaries, these are accounted for as a disposal of investment.
(i) Dividends
Interim dividends are recognised when they are paid to the Company’s shareholders. Final dividends are recognised when they are approved by shareholders.
Annual Report and Accounts 2006/07175
Company balance sheet
at 31 March
| | | | | | | | | | | | | |
| |
| | | | | | | 2007 | | | 2006 | |
| | | Notes | | | £m | | | £m | |
| |
Fixed assets | | | | | | | | | | | | |
| Investments | | | 2 | | | | 3,707 | | | | 2,428 | |
| |
| | | | | | | | 3,707 | | | | 2,428 | |
| |
Current assets | | | | | | | | | | | | |
| Debtors (amounts falling due within one year) | | | 3 | | | | 9,050 | | | | 7,109 | |
| Debtors (amounts falling due after more than one year) | | | 3 | | | | 3 | | | | – | |
| Derivative financial instruments (amounts falling due within one year) | | | | | | | 119 | | | | 64 | |
| Derivative financial instruments (amounts falling due after more than one year) | | | | | | | 192 | | | | 79 | |
| Current asset investments | | | | | | | 1,030 | | | | 1,046 | |
| |
| | | | | | | | 10,394 | | | | 8,298 | |
Creditors (amounts falling due within one year) | | | | | | | | | | | | |
| Borrowings | | | 5 | | | | (360 | ) | | | (109 | ) |
| Derivative financial instruments | | | | | | | (29 | ) | | | (21 | ) |
| Other creditors | | | | | | | (2,799 | ) | | | (1,876 | ) |
| | | | 4 | | | | (3,188 | ) | | | (2,006 | ) |
| |
Net current assets | | | | | | | 7,206 | | | | 6,292 | |
| |
Total assets less current liabilities | | | | | | | 10,913 | | | | 8,720 | |
Creditors (amounts falling due after more than one year) | | | | | | | | | | | | |
| Borrowings | | | 5 | | | | (4,524 | ) | | | (1,715 | ) |
| Derivative financial instruments | | | | | | | (54 | ) | | | (56 | ) |
Provisions for liabilities and charges | | | | | | | | | | | | |
| Deferred taxation | | | 6 | | | | – | | | | (5 | ) |
| |
Net assets employed | | | | | | | 6,335 | | | | 6,944 | |
| |
Capital and reserves | | | | | | | | | | | | |
| Called up share capital | | | 7 | | | | 308 | | | | 310 | |
| Share premium account | | | 8 | | | | 1,332 | | | | 1,316 | |
| Cash flow hedge reserve | | | 8 | | | | 22 | | | | 7 | |
| Other reserves | | | 8 | | | | 91 | | | | 74 | |
| Profit and loss account | | | 8 | | | | 4,582 | | | | 5,237 | |
| |
Equity shareholders’ funds | | | 9 | | | | 6,335 | | | | 6,944 | |
| |
Commitments and contingencies are shown in note 10 to the Company accounts on page 179.
The notes on pages 176 to 179 form part of the individual financial statements of the Company, which were approved by the Board of Directors on 16 May 2007 and were signed on its behalf by:
Sir John ParkerChairman
Steve LucasFinance Director
176National Grid plc
Notes to the Company accounts
1. Adoption of new accounting standards
New financial reporting standards (FRS) and abstracts adopted in 2006/07
During the year the Company has adopted the following FRSs and abstracts:
Amendment to FRS 17 ‘Retirement benefits’ replaces the disclosures required by FRS 17 with those of IAS 19, ‘Employee benefits’, its international equivalent and amends paragraph 16 of FRS 17, so that for quoted securities, the current bid price (rather than the mid-market value) is taken as fair value. Implementation of this standard has not had a material impact on the Company’s results or assets and liabilities.
Amendment to FRS 23 ‘The Effects of Changes in Foreign Exchange Rates’ clarifies the requirements of FRS 23 regarding an entity’s investment in foreign operations and, in particular, the treatment of monetary items entered into as net investment hedges. Implementation of this amendment had no impact on the Company’s results or assets and liabilities.
UITF Abstract 41, ‘Scope of FRS 20 (IFRS 2)’ addresses the issue of whether FRS 20 ‘Share-based payment’, applies to transactions in which the entity cannot identify specifically some or all of the goods or services received. Implementation of this abstract has not had a material impact on the Company’s results or assets and liabilities.
UITF Abstract 45, ‘Liabilities arising from participating in a specific market – Waste electrical and electronic equipment’ relates to the European Union’s Directive on waste electrical and electronic equipment and deals with the responsibility of producers for the backlog of waste for goods sold to private households. Implementation of this abstract has not had a material impact on the Company’s results or assets and liabilities.
New financial reporting standards (FRS) and abstracts not yet adopted
The following standards and abstracts will be adopted in future periods:
Amendment to FRS 26: ‘Financial instruments: Measurement – Recognition and derecognition’ implements the recognition and derecognition material in IAS 39. The requirements of FRS 5, ‘Reporting the substance of transactions’, are superseded for transactions that fall within FRS 26’s scope, but FRS 5 continues to apply to transactions in non-financial assets and liabilities. Implementation of this standard is not expected to have a material impact on the Company’s results or assets and liabilities.
UITF Abstract 42, ‘Reassessment of embedded derivatives’ prohibits reassessment of the treatment of embedded derivatives subsequent to initial recognition unless there is a change in the terms of the contract that significantly modifies the cash flows that otherwise would be required under the contract, in which case reassessment is required. Implementation of this abstract is not expected to have a material impact on the Company’s results or assets and liabilities.
UITF Abstract 44, ‘FRS 20 (IFRS 2) – Group and treasury share transactions’ provides guidance on whether share-based transactions involving treasury shares or involving Group entities (for instance, options over a parent’s shares) should be accounted for as equity-settled or cash-settled. Implementation of this abstract is not expected to have a material impact on the Company’s results or assets and liabilities.
Annual Report and Accounts 2006/07177
2. Fixed asset investments
| | | | | |
| |
| | | Subsidiary | |
| | | undertakings | |
| | | £m | |
| |
| At 1 April 2005 | | | 2,428 | |
| Additions | | | 6 | |
| Disposals | | | (6 | ) |
| |
| At 31 March 2006 | | | 2,428 | |
| Additions | | | 1,279 | |
| |
At 31 March 2007 | | | 3,707 | |
| |
During the year the Company acquired a further 92,741 ordinary shares of £1 each in National Grid (US) Holdings Limited for a total consideration of £1,264m.
The names of the principal subsidiary undertakings and joint ventures are included in note 36 in the consolidated financial statements.
3. Debtors
| | | | | | | | | |
| |
| | | 2007 | | | 2006 | |
| | | £m | | | £m | |
| |
| Amounts falling due within one year: | | | | | | | | |
| Amounts owed by subsidiary undertakings | | | 9,047 | | | | 7,105 | |
| Prepayments and accrued income | | | 3 | | | | 4 | |
| |
| | | | 9,050 | | | | 7,109 | |
| |
| Amounts falling due after more than one year: | | | | | | | | |
| Deferred taxation (note 6) | | | 3 | | | | – | |
| |
4. Creditors (amounts falling due within one year)
| | | | | | | | | |
| |
| | | 2007 | | | 2006 | |
| | | £m | | | £m | |
| |
| Borrowings (note 5) | | | 360 | | | | 109 | |
| Derivative financial instruments | | | 29 | | | | 21 | |
| Amounts owed to subsidiary undertakings | | | 2,776 | | | | 1,856 | |
| Other creditors | | | 23 | | | | 20 | |
| |
| | | | 3,188 | | | | 2,006 | |
| |
The notional amounts relating to financial instruments held to manage interest rate and currency profiles for interest rate swaps and forward rate agreements, foreign currency contracts and cross-currency swaps at 31 March 2007 were £2,935m (2006: £2,926m) and £7,983m (2006: £3,454m) respectively.
5. Borrowings
The following table analyses the Company’s total borrowings:
| | | | | | | | | |
| |
| | | 2007 | | | 2006 | |
| | | £m | | | £m | |
| |
| Amounts falling due within one year: | | | | | | | | |
| Bank loans and overdrafts | | | 30 | | | | 27 | |
| Bonds | | | 301 | | | | 27 | |
| Other loans | | | 29 | | | | 55 | |
| |
| | | | 360 | | | | 109 | |
| |
| Amounts falling due after more than one year: | | | | | | | | |
| Bonds | | | 4,524 | | | | 1,715 | |
| |
| | | | 4,524 | | | | 1,715 | |
| |
| Total borrowings | | | 4,884 | | | | 1,824 | |
| |
| | | | | | | | | |
| |
| | | 2007 | | | 2006 | |
| | | £m | | | £m | |
| |
| Total borrowings are repayable as follows: | | | | | | | | |
| In one year or less | | | 360 | | | | 109 | |
| In more than one year, but not more than two years | | | 642 | | | | – | |
| In more than two years, but not more than three years | | | 295 | | | | 348 | |
| In more than three years, but not more than four years | | | 495 | | | | – | |
| In more than four years, but not more than five years | | | 897 | | | | 37 | |
| In more than five years, other than by instalments | | | 2,195 | | | | 1,330 | |
| |
| | | | 4,884 | | | | 1,824 | |
| |
The notional amount of borrowings outstanding as at 31 March 2007 was £4,872m (2006: £1,835m).
178National Grid plc
6. Provisions for liabilities and charges
| | | | | |
| |
| | | Deferred | |
| | | taxation | |
| | | £m | |
| |
| At 31 March 2005 | | | – | |
| First time adoption of FRS 26 | | | 19 | |
| |
| At 1 April 2005 | | | 19 | |
| Credited to equity | | | (14 | ) |
| |
| At 31 March 2006 | | | 5 | |
| |
| At 1 April 2006 | | | 5 | |
| Charged to equity | | | 4 | |
| Credited to the profit and loss account (i) | | | (12 | ) |
| Transferred to debtors (note 3) (ii) | | | 3 | |
| |
At 31 March 2007 | | | – | |
| |
| | |
| (i) | | Included is a deferred tax credit of £13m in respect of prior years (2006: £nil). |
| (ii) | | Included is a current deferred tax asset of £1m (2006: £nil). |
Factors that may affect future deferred tax charges
The UK rate of corporation tax is expected to decrease from the current rate of 30% to 28% in 2008/2009. We are in the process of evaluating the impact this tax rate will have on our future deferred tax charge.
7. Share capital
| | | | | | | | | | | | | | | | | |
| |
| | | Allotted and issued | | | Called up and fully paid | |
| | | number | | | £ | | | millions | | | £m | |
| |
| At 1 April 2005 | | | 3,090,202,955 | | | | 309,020,296 | | | | 3,090 | | | | 309 | |
| Issued during the year | | | 8,016,297 | | | | 898,906 | | | | 8 | | | | 1 | |
| Effect of share consolidation (i) | | | (378,520,134 | ) | | | – | | | | (378 | ) | | | – | |
| |
| At 31 March 2006 | | | 2,719,699,118 | | | | 309,919,202 | | | | 2,720 | | | | 310 | |
| Issued during the year | | | 3,748,135 | | | | 427,113 | | | | 4 | | | | – | |
| Repurchased during the year (ii) | | | (22,388,381 | ) | | | (2,551,234 | ) | | | (23 | ) | | | (2 | ) |
| |
At 31 March 2007 | | | 2,701,058,872 | | | | 307,795,081 | | | | 2,701 | | | | 308 | |
| |
| | |
| (i) | | On 29 July 2005, the ordinary share capital was consolidated, with 43 new ordinary shares of 1117/43 pence each issued for every 49 existing ordinary shares of 10 pence each cancelled. |
| (ii) | | From 20 November 2006 to 22 March 2007, the Company repurchased, and subsequently cancelled, under its share buy-back programme 22,388,381 ordinary shares for aggregate consideration of £169m, including transaction costs. The shares repurchased have a nominal value of 1117/43 pence each and represented 1% of the ordinary shares in issue as at 31 March 2007. The excess of the consideration over the nominal value has been recharged against retained earnings. |
For further details on share capital, see note 31 in the consolidated financial statements.
8. Reserves
| | | | | | | | | | | | | | | | | |
| |
| | | Share | | | Cash flow | | | | | | | Profit | |
| | | premium | | | hedge | | | Other | | | and loss | |
| | | account | | | reserve | | | reserves | | | account | |
| | | £m | | | £m | | | £m | | | £m | |
| |
| At 1 April 2005 | | | 1,289 | | | | 39 | | | | 61 | | | | 7,957 | |
| Exchange adjustments | | | – | | | | – | | | | 7 | | | | – | |
| Net loss transferred from equity in respect of cash flow hedges (net of tax) | | | – | | | | (32 | ) | | | – | | | | – | |
| Ordinary shares issued during the year | | | 27 | | | | – | | | | – | | | | – | |
| Share-based payment | | | – | | | | – | | | | 6 | | | | – | |
| Return of capital to shareholders through B share scheme | | | – | | | | – | | | | – | | | | (2,009 | ) |
| Retained loss for the year | | | – | | | | – | | | | – | | | | (711 | ) |
| |
| At 1 April 2006 | | | 1,316 | | | | 7 | | | | 74 | | | | 5,237 | |
| Net loss transferred from equity in respect of cash flow hedges (net of tax) | | | – | | | | 15 | | | | – | | | | – | |
| Ordinary shares issued during the year | | | 16 | | | | – | | | | – | | | | – | |
| Repurchase of shares | | | – | | | | – | | | | 2 | | | | (169 | ) |
| Share-based payment | | | – | | | | – | | | | 15 | | | | – | |
| Retained loss for the year | | | – | | | | – | | | | – | | | | (486 | ) |
| |
At 31 March 2007 | | | 1,332 | | | | 22 | | | | 91 | | | | 4,582 | |
| |
The Company has not presented its own profit and loss account as permitted by section 230 of the Companies Act 1985. The Company’s profit after taxation was £244m (2006: £34m). Of the Company’s profit and loss account reserve of £4,582m at 31 March 2007 (2006: £5,237m), £2,131m (2006: £2,581m) relating to gains on intra-group transactions was not distributable to shareholders.
Annual Report and Accounts 2006/07179
9. Reconciliation of movements in equity shareholders’ funds
| | | | | | | | | |
| |
| | | 2007 | | | 2006 | |
| | | £m | | | £m | |
| |
| Profit for the year after taxation | | | 244 | | | | 34 | |
| Dividends | | | (730 | ) | | | (745 | ) |
| |
| Retained loss for the financial year | | | (486 | ) | | | (711 | ) |
| Net proceeds of issue of ordinary shares | | | 16 | | | | 28 | |
| Return of capital to shareholders through B share scheme | | | – | | | | (2,009 | ) |
| Movement on cash flow hedge reserve (net of tax) | | | 15 | | | | (32 | ) |
| Share-based payment | | | 15 | | | | 13 | |
| Repurchase of ordinary shares | | | (169 | ) | | | – | |
| |
| Net decrease in equity shareholders’ funds | | | (609 | ) | | | (2,711 | ) |
| Opening equity shareholders’ funds | | | 6,944 | | | | 9,655 | |
| |
Closing equity shareholders’ funds | | | 6,335 | | | | 6,944 | |
| |
10. Commitments and contingencies
The Company has guaranteed the repayment of principal sum, any associated premium and interest on specific loans due from certain subsidiary undertakings to third parties. At 31 March 2007, the sterling equivalent amounted to £650m (2006: £2,223m). The guarantees are for varying terms between 3 months and 11 years.
The Company has also guaranteed the lease obligations of a former associate to a subsidiary undertaking, amounting to £23m (2006: £31m).
11. Directors and employees
There are no employees of the Company (2006: nil). The Directors of the Company were paid by another subsidiary undertaking in 2007 and 2006. Details of Directors’ emoluments are contained in note 6 in the consolidated financial statements and the Directors’ remuneration report.
180National Grid plc
Glossary of Terms
Term used in Annual Report
Accounts
Acquisition accounting
Allotted
Borrowings
Called up share capital
Capital allowances
Trade payables
Trade receivables
Finance lease
Financial year
Freehold
Freehold land
Joint venture
Merger accounting
Net asset value
Operating profit
Pension scheme
Profit
Profit for the year
Provision for doubtful debts
Provisions
Reconciliation of movements in total equity
Equity reserves
Share capital
Share premium account
US equivalent or brief description
Financial statements
Purchase accounting
Issued
Debt
Common stock issued and fully paid
Tax depreciation allowances
Accounts payable
Accounts receivable
Capital lease
Fiscal year
Ownership with absolute rights in perpetuity
Land owned
Equity investment
Pooling of interests
Book value
Net operating income
Pension plan
Income (or earnings)
Net income
Allowance for bad and doubtful accounts receivable
Long-term liabilities other than debt and specific accounts payable
Statement of changes in stockholders’ equity
Stockholders’ equity other than common stock
Ordinary shares, capital stock or common stock issued and fully paid
Additional paid-in capital relating to proceeds of sale of stock in excess of par value or paid-in surplus (not distributable)
Annual Report and Accounts 2006/07181
Definitions
References in the Annual Report and Accounts to the ‘Company’, ‘we’, ‘our’ and ‘us’ refer to National Grid and its subsidiaries.
American Depositary Shares, or ADSs
Securities of National Grid listed on the New York Stock Exchange, each of which represents the right to receive five ordinary shares.
B shares
Non-Cumulative preference shares of 10 pence nominal value each.
BETTA
The British Electricity Trading and Transmission Arrangements.
Board
The Board of Directors of the Company.
Combined Code
The Combined Code on Corporate Governance, as issued by the Financial Reporting Council.
Corporate Centre
Core corporate functions operating from the Company’s head office.
FERC
US Federal Energy Regulatory Commission.
FRS
UK Financial Reporting Standard.
GAAP
Generally accepted accounting principles.
GW
Gigawatt, 109 watts.
GWh
Gigawatt hours.
HSE
Health and Safety Executive.
IAS
International Accounting Standard.
IFRS
International Financial Reporting Standard.
KeySpan
KeySpan Corporation.
kV
Kilovolt, 103 volts.
kW
Kilowatt, 103 watts.
kWh
Kilowatt hours.
Lifetime Allowance
The lifetime allowance is an overall ceiling on the amount of tax privileged pension savings that any one individual can draw.
LNG
Liquefied natural gas.
lost time injury
A work-related injury that causes a person to be away from work for at least one normal shift after the shift on which the injury occurs, because the person is unfit to perform his or her duties.
mcm
Million cubic metres.
mcm/d
Million cubic metres per day.
MW
Megawatt, 106 watts.
MWh
Megawatt hours.
National Grid Wireless
National Grid Wireless Limited, formerly Crown Castle UK Limited.
Ofgem
The Office of Gas and Electricity Markets.
ordinary shares
Ordinary shares of 1117/43 pence nominal value each.
Personal Lifetime Allowance
The lifetime allowance applicable to individuals who have registered their pre 6 April 2006 pension benefits for protection.
Rhode Island gas
The Rhode Island gas distribution business acquired from Southern Union Company.
SEC
US Securities and Exchange Commission.
SFAS
US Statement of Financial Accounting Standards.
tonnes CO2 equivalent
Measure of greenhouse gas emissions in relation to the impact of carbon dioxide.
TW
Terawatt, 1012 watts.
TWh
Terawatt hours.
Way Ahead
The restructuring programme implemented in the retained Gas Distribution – UK business commenced in 2004/05 following the announcement of the planned sales of four gas distribution networks.
182 National Grid plc
Summary consolidated financial information
Financial summary (unaudited)
The financial summary set out below has been derived from the audited consolidated financial statements of National Grid for the five financial years ended 31 March 2007. It should be read in conjunction with the consolidated financial statements and related notes, together with the Operating and Financial Review. The information presented below for the years ended 31 March 2005, 2006 and 2007 has been prepared under IFRS as adopted by the European Union. For the year ended 31 March 2005, information is also presented under UK GAAP. For the years ended 31 March 2004 and 2003, information has been presented under UK GAAP, as no IFRS information has been prepared prior to the date of adoption of IFRS (1 April 2004). Comparatives have been adjusted to reclassify amounts relating to discontinued operations.
| | | | | | | | | | | | | | | | | | | | | | | | | |
| | | IFRS | | | As previously measured under UK GAAP | |
| | | 31 March | | | 31 March | | | 31 March | | | 31 March | | | 31 March | | | 31 March | |
| Summary income statement | | 2007 | | | 2006 | | | 2005 | | | 2005 | | | 2004 | | | 2003 | |
| | £m | | | £m | | | £m | | | £m | | | £m | | | £m | |
| |
| Revenue | | | 8,695 | | | | 8,868 | | | | 7,174 | | | | 8,313 | | | | 9,019 | | | | 9,389 | |
| Operating profit | | | | | | | | | | | | | | | | | | | | | | | | |
| Before exceptional items, remeasurements and goodwill amortisation | | | 2,454 | | | | 2,457 | | | | 2,401 | | | | 2,166 | | | | 2,210 | | | | 2,146 | |
| Exceptional items and remeasurements | | | 59 | | | | (83 | ) | | | (288 | ) | | | (241 | ) | | | (271 | ) | | | (332 | ) |
| Goodwill amortisation | | | n/a | | | | n/a | | | | n/a | | | | (85 | ) | | | (95 | ) | | | (98 | ) |
| | | | 2,513 | | | | 2,374 | | | | 2,113 | | | | 1,840 | | | | 1,844 | | | | 1,716 | |
| Profit before taxation | | | | | | | | | | | | | | | | | | | | | | | | |
| Before exceptional items, remeasurements and goodwill amortisation | | | 1,909 | | | | 1,858 | | | | 1,700 | | | | 1,420 | | | | 1,388 | | | | 1,207 | |
| Exceptional items and remeasurements | | | (158 | ) | | | (140 | ) | | | (288 | ) | | | (158 | ) | | | 51 | | | | (462 | ) |
| Goodwill amortisation | | | n/a | | | | n/a | | | | n/a | | | | (85 | ) | | | (95 | ) | | | (98 | ) |
| | | | 1,751 | | | | 1,718 | | | | 1,412 | | | | 1,177 | | | | 1,344 | | | | 647 | |
| Profit for the year attributable to equity shareholders | | | | | | | | | | | | | | | | | | | | | | | | |
| Before exceptional items, remeasurements and goodwill amortisation | | | 1,400 | | | | 1,368 | | | | 1,655 | | | | 1,100 | | | | 1,038 | | | | 824 | |
| Exceptional items and remeasurements | | | (6 | ) | | | 2,480 | | | | (231 | ) | | | (78 | ) | | | 137 | | | | (362 | ) |
| Goodwill amortisation | | | n/a | | | | n/a | | | | n/a | | | | (85 | ) | | | (95 | ) | | | (98 | ) |
| | | | 1,394 | | | | 3,848 | | | | 1,424 | | | | 937 | | | | 1,080 | | | | 364 | |
| |
Summary statement of net assets | | | | | | | | | | | | | | | | | | | | | | | | |
| Non-current assets | | | 21,109 | | | | 22,106 | | | | 25,596 | | | | 19,897 | | | | 18,394 | | | | 18,954 | |
| Current assets | | | 5,312 | | | | 3,818 | | | | 1,964 | | | | 4,814 | | | | 5,003 | | | | 5,950 | |
| Assets of businesses held for sale | | | 1,968 | | | | – | | | | – | | | | – | | | | – | | | | – | |
| Total assets | | | 28,389 | | | | 25,924 | | | | 27,560 | | | | 24,711 | | | | 23,397 | | | | 24,904 | |
| Current liabilities | | | (3,360 | ) | | | (5,683 | ) | | | (5,974 | ) | | | (5,679 | ) | | | (4,147 | ) | | | (4,729 | ) |
| Non-current liabilities | | | (20,443 | ) | | | (16,748 | ) | | | (19,465 | ) | | | (17,172 | ) | | | (17,613 | ) | | | (18,653 | ) |
| Liabilities of businesses held for sale | | | (450 | ) | | | – | | | | – | | | | – | | | | – | | | | – | |
| Total liabilities | | | (24,253 | ) | | | (22,431 | ) | | | (25,439 | ) | | | (22,851 | ) | | | (21,760 | ) | | | (23,382 | ) |
| |
| Net assets | | | 4,136 | | | | 3,493 | | | | 2,121 | | | | 1,860 | | | | 1,637 | | | | 1,522 | |
| |
Summary cash flow statement | | | | | | | | | | | | | | | | | | | | | | | | |
| Cash generated from operations | | | | | | | | | | | | | | | | | | | | | | | | |
| Continuing operations | | | 3,090 | | | | 2,973 | | | | 2,820 | | | | 2,909 | | | | 2,810 | | | | 2,826 | |
| Discontinued operations | | | 181 | | | | 138 | | | | 638 | | | | n/a | | | | n/a | | | | n/a | |
| |
| | | | 3,271 | | | | 3,111 | | | | 3,458 | | | | 2,909 | | | | 2,810 | | | | 2,826 | |
| Tax paid – continuing and discontinued operations | | | (313 | ) | | | (140 | ) | | | (150 | ) | | | (150 | ) | | | (18 | ) | | | (112 | ) |
| |
| Net cash inflow from operating activities | | | 2,958 | | | | 2,971 | | | | 3,308 | | | | 2,759 | | | | 2,792 | | | | 2,714 | |
| Net cash flows (used in)/from investing activities | | | (4,277 | ) | | | 3,922 | | | | (2,975 | ) | | | n/a | | | | n/a | | | | n/a | |
| Dividends received from joint ventures | | | n/a | | | | n/a | | | | n/a | | | | 5 | | | | 8 | | | | 11 | |
| Net cash outflow for capital expenditure and financial investment | | | n/a | | | | n/a | | | | n/a | | | | (1,262 | ) | | | (1,254 | ) | | | (1,407 | ) |
| Net cash (outflow)/inflow for acquisitions and disposals | | | n/a | | | | n/a | | | | n/a | | | | (1,130 | ) | | | 7 | | | | 163 | |
| Net cash (outflow)/inflow for the management of liquid resources | | | n/a | | | | n/a | | | | n/a | | | | (54 | ) | | | (48 | ) | | | (138 | ) |
| Net cash flows from/(used in) financing activities | | | 1,494 | | | | (5,712 | ) | | | (325 | ) | | | n/a | | | | n/a | | | | n/a | |
| Net cash outflow for returns on investments and servicing of finance | | | n/a | | | | n/a | | | | n/a | | | | (758 | ) | | | (692 | ) | | | (912 | ) |
| Equity dividends paid | | | n/a | | | | n/a | | | | n/a | | | | (628 | ) | | | (560 | ) | | | (571 | ) |
| Net cash inflow/(outflow) from financing activities | | | n/a | | | | n/a | | | | n/a | | | | 1,081 | | | | (240 | ) | | | 174 | |
| |
| Net increase in cash and cash equivalents (UK GAAP – cash only) | | | 175 | | | | 1,181 | | | | 8 | | | | 13 | | | | 13 | | | | 34 | |
| |
| | | | | | | | | | | | | | | | | | | | | |
| | | 31 March | | | 31 March | | | 31 March | | | 31 March | | | 31 March | |
| Amounts in accordance with US GAAP | | 2007 | | | 2006 | | | 2005 | | | 2004 | | | 2003 | |
| | £m* | | | £m* | | | £m* | | | £m* | | | £m* | |
| |
| Revenue | | | 8,686 | | | | 8,891 | | | | 7,208 | | | | 7,747 | | | | 6,730 | |
| Net income | | | 1,146 | | | | 1,307 | | | | 1,288 | | | | 961 | | | | 738 | |
| Earnings per ADS | | | | | | | | | | | | | | | | | | | | |
| Basic | | | 211.0p | | | | 241.0p | | | | 238.0p | | | | 178.4p | | | | 179.1p | |
| Diluted | | | 209.5p | | | | 240.0p | | | | 236.5p | | | | 177.9p | | | | 174.3p | |
| Total assets | | | 35,126 | | | | 32,952 | | | | 37,274 | | | | 35,347 | | | | 36,947 | |
| Net assets employed/total shareholders’ funds | | | 9,367 | | | | 9,788 | | | | 10,629 | | | | 9,875 | | | | 9,515 | |
| Equity shareholders’ funds | | | 9,330 | | | | 9,747 | | | | 10,591 | | | | 9,821 | | | | 9,426 | |
| |
*Unless stated
Annual Report and Accounts 2006/07183
Shareholder Information
Financial calendar
The following dates have been announced or are indicative of future dates:
| | |
| | | |
| |
| 6 June 2007 | | Ordinary shares go ex-dividend |
| |
| 8 June 2007 | | Ordinary share dividend record date |
| |
| 11 July 2007 | | DRIP election deadline 2006/07 final dividend |
| |
| 30 July 2007 | | 2007 Annual General Meeting |
| |
| 22 August 2007 | | 2006/07 final dividend paid on ordinary shares |
| |
| 15 November 2007 | | 2007/08 interim results |
| |
| 28 November 2007 | | Ordinary shares go ex-dividend |
| |
| 30 November 2007 | | Ordinary share dividend record date |
| |
| 7 December 2007 | | DRIP election deadline 2007/08 interim dividend |
| |
| 23 January 2008 | | 2007/08 interim dividend paid on ordinary shares |
| |
| May 2008 | | 2007/08 preliminary results |
| |
| June 2008 | | Ordinary shares go ex-dividend |
| |
| June 2008 | | Ordinary share dividend record date |
| |
| July 2008 | | DRIP election deadline 2007/08 final dividend |
| |
| July 2008 | | 2008 Annual General Meeting |
| |
| August 2008 | | 2007/08 final dividend paid on ordinary shares |
| |
Electronic communication
As a shareholder you can manage your holding online at www.nationalgrid.com/shareholders. This allows you to check your shareholding, recent dividend payments and information such as address and any direct payment details. If you register you can also change information such as your home address and bank details or apply to join the dividend reinvestment plan (see below).
You also have the option to elect to receive documents from National Grid electronically. This means that, instead of receiving the Annual Report and Accounts, Notice of Annual General Meeting and Proxy Card in the post, you will receive an email detailing where the documents can be found on our website and explaining how you can appoint a proxy online. This helps us to manage the cost of maintaining the share register and will save some of the 241 tonnes of paper used in our Annual Report mailing each year.
For full details of the services available or to opt for electronic documentation please visit www.nationalgrid.com/shareholders.
Website
More information about National Grid, including up-to-date announcements, and current and historical share prices, is available on our website at www.nationalgrid.com.
Dividends
National Grid normally pays dividends twice each year, an interim dividend in January and a final dividend in August. Of the total dividend paid each year one third is normally paid as the interim and two thirds as the final dividend.
Shareholders can choose to have dividend payments paid directly into their nominated bank or building society account. This means that the dividend will be in the account on the day of payment, there will be no delays paying in cheques, and there is no possibility of losing or damaging cheques. Tax vouchers will still be provided for your records.
Over half a million shareholders have elected to have their dividends paid to them directly. As well as being convenient for the shareholder this also saves money and paper, as fewer cheques need to be produced and sent out.
To request direct payment of your dividends please contact Capita Registrars or register electronically at www.nationalgrid.com/shareholders.
If you think you have outstanding dividend payments please contact Capita Registrars who will be able to confirm this and provide duplicate cheques if necessary (an administrative charge may be payable).
Details of previous dividends and information about proposed dividends can be found on our website.
Dividend reinvestment plan (DRIP)
A DRIP is in place allowing shareholders to use their dividend payments to purchase additional National Grid shares. To join the DRIP contact Capita Registrars or register electronically at www.nationalgrid.com/shareholders. Please note that charges, as set out in the relevant terms and conditions, are payable in respect of the DRIP.
Share dealing
A low-cost share dealing service is available from Capita Registrars, allowing you to buy and sell National Grid ordinary shares by telephone and online. Trading by telephone or online allows you to know the price of the shares at the time that you deal.
For more information please call 0870 458 4577 (8am – 4.30pm) or visit www.capitadeal.com.
A postal dealing service is also available. For a postal dealing form please call 0870 162 3116.
High street banks may also offer share dealing services.
These details are provided for information only and any action you take is at your own risk. If you have any doubt as to the action you should take, you are recommended to seek your own financial advice from your stockbroker, bank manager, accountant or other independent financial advisor authorised pursuant to the Financial Services and Markets Act 2000.
184 National Grid plc
Shareholder Networking
National Grid operates a Shareholder Networking programme, the aim of which is to allow shareholders to gain a better understanding of the business. The programme runs over two days and includes visits to operational sites and presentations by senior managers and employees. Participants also have the opportunity to meet and question Directors during the programme, the costs of which (including shareholder travel to and from the event) are covered by National Grid.
The programme normally operates during early December.
If you would like to take part, please write to:
Shareholder Networking Organiser
National Grid House
Warwick Technology Park
Gallows Hill
Warwick CV34 6DA
Participants will be selected by ballot from those applying, with priority given to those who have not recently attended.
ShareGift
If you hold only a few shares and feel that it is uneconomical or not worthwhile to sell them, you could consider donating your shares to charity. ShareGift is an independent registered charity (no. 1052686) that provides a free service for shareholders wishing to give holdings of shares to benefit charitable causes. For more information please visit www.ShareGift.org or call Capita Registrars.
Individual Savings Accounts (ISAs)
Corporate ISAs for National Grid shares are available from Stocktrade. For more information call Stocktrade on 0131 240 0443 or write to Stocktrade, 81 George Street, Edinburgh EH2 3ES. National Grid cannot advise you on what action, if any, you should take in respect of your shares.
Capital Gains Tax (CGT)
CGT information relating to National Grid shares (including details in respect of British Gas shares) can be found on our website or obtained from Capita Registrars. Share prices on specific dates can be found on our website using the historic share price look-up facility.
Alternative formats
Audio tape, braille and large print versions of the Annual Review are available. If you wish to receive any of these documents please contact Capita Registrars.
Shareholders
The following table includes a brief analysis of shareholder numbers and shareholdings as at 31 March 2007:
| | | | | | | | | | | | | | | | | |
| Size of | | Number of | | | % of | | | Number of | | | % of | |
| shareholding | | shareholders | | | shareholders | | | shares | | | shares | |
| |
| 1-50 | | | 232,565 | | | | 19.07 | | | | 7,252,130 | | | | 0.27 | |
| 51-100 | | | 364,600 | | | | 29.90 | | | | 24,716,068 | | | | 0.91 | |
| 101-500 | | | 523,832 | | | | 42.95 | | | | 103,793,487 | | | | 3.84 | |
| 501-1,000 | | | 52,962 | | | | 4.34 | | | | 37,159,735 | | | | 1.38 | |
| 1,001-10,000 | | | 43,294 | | | | 3.55 | | | | 100,416,828 | | | | 3.72 | |
| 10,001-50,000 | | | 1,203 | | | | 0.10 | | | | 24,430,715 | | | | 0.90 | |
| 50,001-100,000 | | | 232 | | | | 0.02 | | | | 17,220,012 | | | | 0.64 | |
| 100,001-500,000 | | | 484 | | | | 0.04 | | | | 117,414,426 | | | | 4.35 | |
| 500,001-1,000,000 | | | 151 | | | | 0.01 | | | | 105,716,687 | | | | 3.91 | |
| 1,000,001+ | | | 288 | | | | 0.02 | | | | 2,162,938,784 | | | | 80.08 | |
| |
Total | | | 1,219,611 | | | | 100 | | | | 2,701,058,872 | | | | 100 | |
| |
Share price
The following graph represents the movement of National Grid’s share price during 2006/07:
Cautionary Statement
This document comprises the Annual Report and Accounts for the year ending 31 March 2007 for National Grid and its subsidiaries. It contains the Directors’ Report and Financial Statements, together with the Independent Auditors’ Report thereon, as required by the UK Companies Act 1985. The Annual Review of National Grid for the same period is published as a separate document. The Directors’ Report on pages 86 and 87 and the Directors’ Remuneration Report on pages 88 to 98 have each been drawn up in accordance with the requirements of English law, and liability in respect thereof is also governed by English law. In particular, the liability of the Directors for these reports is solely to National Grid.
This document also contains certain statements that are neither reported financial results nor other historical information. These statements are forward-looking statements within the meaning of Section 27A of the Securities Act of 1933, as amended, and Section 21E of the Securities Exchange Act of 1934, as amended. These statements include information with respect to our financial condition, our results of operations and businesses, strategy, plans and objectives. Words such as ‘anticipates’, ‘expects’, ‘intends’, ‘plans’, ‘believes’, ‘seeks’, ‘estimates’, ‘may’, ‘will’, ‘continue’, ‘project’ and similar expressions, as well as statements in the future tense, identify forward-looking statements. These forward-looking statements are not guarantees of our future performance and are subject to assumptions, risks and uncertainties that could cause actual future results to differ materially from those expressed in or implied by such forward-looking statements. Many of these assumptions, risks and uncertainties relate to factors that are beyond our ability to control or estimate precisely, such as delays in obtaining, or adverse conditions contained in, regulatory approvals and contractual consents, including those required to complete the proposed acquisition of KeySpan when or as planned, unseasonable weather affecting the demand for electricity and gas, competition and industry restructuring, changes in economic conditions, currency fluctuations, changes in interest and tax rates, changes in energy market prices, changes in historical weather patterns, changes in laws, regulations or regulatory policies, developments in legal or public policy doctrines, the impact of changes to accounting standards and technological developments. Other factors that could cause actual results to differ materially from those described in this document include the ability to integrate the businesses relating to announced acquisitions with our existing business to realise the expected synergies from such integration, the availability of new acquisition opportunities and the timing and success of future acquisition opportunities, the timing and success or other impact of the sales of our non-core businesses, the failure for any reason to achieve reductions in costs or to achieve operational efficiencies, the failure to retain key management, the behaviour of UK electricity market participants on system balancing, the timing of amendments in prices to shippers in the UK gas market, the performance of our pension schemes and the regulatory treatment of pension costs, and any adverse consequences arising from outages on or otherwise affecting energy networks, including gas pipelines, which we own or operate. For a more detailed description of some of these assumptions, risks and uncertainties, together with any other risk factors, please see our filings with and submissions to the US Securities and Exchange Commission (the ‘SEC’) (and in particular the ‘Risk factors’ and ‘Operating and Financial Review’ sections in our most recent Annual Report on Form 20-F). Except as may be required by law or regulation, National Grid undertakes no obligation to update any of its forward-looking statements. The effects of these factors are difficult to predict. New factors emerge from time to time and we cannot assess the potential impact of any such factor on our activities or the extent to which any factor, or combination of factors, may cause results to differ materially from those contained in any forward-looking statement.
National Grid plc
1-3 Strand, London WC2N 5EH, United Kingdom
Registered in England and Wales No. 4031152
UK Shareholder enquiries: 0870 242 2379
US Shareholder enquiries: 1-800-466-7215
www.nationalgrid.com
Designed and produced by Corporate Edge
Printed by St Ives Westerham Press
| National Grid plc 1-3 Strand, London WC2N 5EH, United Kingdom Registered in England and Wales No. 4031152 UK Shareholder enquiries: 0870 242 2379 US Shareholder enquiries: 1-800-466-7215 www.nationalgrid.com |