directly-connected customers for use of and connection to the transmission system. Use of system charges are levied in respect of the provision of transmission assets/infrastructure (the Transmission Owner activity) and for operating the system (the System Operator activity).
NGC is permitted to set charges for connections to the transmission system made since March 1990 to recover the costs directly or indirectly incurred in providing connections, together with a reasonable rate of return.
The current price control was introduced on 1 April 2001. It was expected to remain in force until 31 March 2006, but is likely to be extended to 31 March 2007. Negotiations on the detail of the extension to the price control are ongoing and are expected to conclude during 2005.
An amended charging methodology for the Transmission Owner, known as ‘Plugs’, was introduced from 1 April 2004. The total revenue recoverable by NGC under its licence remains unchanged. The changes modified the ownership boundary between what was part of the transmission network, shared by all users, and what were separate connection assets attributable to specific users. This required NGC to make repayments to connected parties associated with relevant assets that have been subject to capital contributions or other accelerated payment terms. In total, these repayments will be in the region of £70 million of which the majority will be treated as capital expenditure for regulatory purposes.
Over the course of 2003/04, we have maintained our average annual availability of the electricity network at 95.2% compared to 95.8% in 2002/03, 95.4% in 2001/02 and our five-year average was 95.6% in 2003/04. System availability at winter peak demand was 98.0% in 2003/04 compared with 98.8% in 2002/03 and 98.3% in 2001/02 and our five-year average was 98.6% in 2003/04.
During 2003/04, 99.9997% of the energy demanded was delivered by the transmission system compared to our 10-year average of 99.9999%. There were two significant loss of supply incidents. One affected around 400,000 retail customers across parts of South London where restoration of the transmission system took 37 minutes; regrettably, however, disruption to rail services continued for some time afterwards. The second incident affected around 200,000 retail customers across parts of the West Midlands and restoration of the transmission system was completed within 42 minutes.
Following its investigation, the Department of Trade and Industry’s Engineering Inspectorate considered prosecution was not appropriate, but made a number of recommendations which we have accepted and actions are well advanced to implement them.
Ofgem is also investigating the incidents to determine whether there was a breach of statutory or licence obligations by NGC. We expect the outcome during the summer.
Under the terms of the gas transporter licence, Transco receives income through charges to shippers for entry and exit capacity (Transmission Owner activity) and commodity charges (System Operator activity). The system entry capacity charges are set via auctions. The exit capacity charges and the entry capacity auction proceeds together recover the allowed revenue under the Transmission Owner price control in respect of the provision of the transmission assets.
Further detailed arrangements for the industry are provided through the Network Code, a legal document that defines the obligations, responsibilities and roles of the industry
Back to Contents
Operating Review_continued
participants. Under the Network Code, our UK Transmission business undertakes the role of ‘Top-up’ manager. This requires the setting, monitoring and then the preservation of storage levels to protect gas stocks under prolonged and severe winter conditions. Under severe winter conditions this may entail the purchase of gas from the open market to maintain the prescribed levels of gas storage stocks. Where there is a shortage of gas available to the market this may lead the business to incur significant costs.
Our gas transporter licence has an Income Adjusting Event provision that may provide changes to our income to allow the recovery of significant increases in efficiently incurred costs.
Operating performance
The winter of 2003/04 saw a maximum demand for gas of 444 mcm on 28 January 2004. This compared with the previous year’s peak recorded on 7 January 2003 of 450 mcm.
The ability of the gas transmission system to transport the available gas is dependent on the performance of our compressor fleet. The performance of the compressor fleet is measured by the average time elapsed between breakdowns for the fleet; a longer time indicates better performance. Over 2003/04, the mean (or average) time between compressor failures was 11% above our five-year average, following on from an 18% increase in the mean time between failures in 2002/03.
US Transmission
Background information
In the US, we own and operate an electricity transmission network of approximately 14,000 miles. Our US Transmission business operates, at 69 kV and above, approximately 9,000 miles of overhead lines, underground cables, a 139 mile direct current transmission line and 526 substations. We are the largest electricity transmission service provider in the northeastern US by reference to the length of these high-voltage transmission lines. The remainder is operated as part of our US electricity distribution business.
US Transmission provides electricity transmission in New York through Niagara Mohawk Power Corporation and in New England principally through New England Power Company and The Narragansett Electric Company.
In addition, in the Midwest of the US, GridAmerica manages a range of electricity transmission operations on behalf of its three participant utilities. These include operational planning, outage management and scheduling of transmission service. It is the first multi-system independent transmission company and was formed under agreements with Ameren, First Energy, Northern Indiana Public Service Company and the Midwest Independent System Operator (MISO). The agreements have provisions that allow the participant utilities to sell their transmission assets to GridAmerica for cash and stock.
GridAmerica began operations in October 2003 with two out of the three participant companies before final approvals were received for Ameren’s participation on 1 May 2004. With the inclusion of Ameren, GridAmerica provides services in a geographic area which includes over 14,000 miles of transmission lines across five states.
Regulation
In New England, the electricity transmission revenues are collected under regional and local tariffs approved by the Federal Energy Regulatory Commission (FERC) which allow it to recover the costs of providing transmission services, with a return on capital. In New York, the transmission business revenues are collected under FERC and state tariffs with state provisions similar to the distribution regulation discussed on page 30. GridAmerica revenues are received from the MISO under a rate schedule approved by the FERC, along with management fees paid by the three participant utilities.
The transmission sector in the US is undergoing fundamental structural change. In its Order 2000, the FERC required electricity utilities to file proposals for transferring to Regional Transmission Organisations (RTOs) the management of transmission assets and the tariffs setting out the rates, terms and conditions of transmission service.
The US Transmission business currently operates within two independent system operators (ISOs), ISO New England Inc. and New York ISO, which administer the markets and provide oversight of transmission in their respective regions. The FERC issued an order on 24 March 2004 approving the proposal for an RTO by ISO New England and New England transmission owners including our subsidiary New England Power Company. The FERC’s approval is subject to conditions and modifications. There are currently no active plans to create an RTO for New York.
GridAmerica and its participant companies are members of MISO which has been approved by FERC as an RTO.
Financial performance
For the average exchange rates used in translating the US financial results, please see pages 37 and 41 in the Financial Review.
US electricity transmission turnover for the year ended 31 March 2004 was £318 million, compared with £407 million in 2002/03 and £278 million in 2001/02.
The £89 million reduction in US electricity transmission turnover from 2002/03 to 2003/04, including an unfavourable exchange rate impact of £22 million, reflects a reclassification of New England Power Pool billings from transmission to distribution segments. This movement was offset by an equal movement in costs.
The £129 million increase in turnover comparing 2001/02 and 2002/03, including an unfavourable exchange rate impact of £26 million, was mainly as a result of the first full year results of Niagara Mohawk (acquired 31 January 2002).
US electricity transmission adjusted operating profit for the year ended 31 March 2004 was £133 million, compared with £128 million in 2002/03 and £87 million in 2001/02.
US electricity transmission operating profit for the year ended 31 March 2004 was £105 million, compared with £103 million in 2002/03 and £64 million in 2001/02.
Exceptional charges and goodwill amortisation explain the difference between adjusted operating profit and operating profit. These exceptional charges are discussed in the context of all exceptional items of the Group on pages 36 and 40. Goodwill amortisation is discussed in the context of the Group as a whole on pages 36 and 39.
The £5 millon increase in adjusted operating profit comparing 2003/04 with 2002/03,
Annual Report and Accounts 2003/04_National Grid Transco 29
Back to Contents
Operating Review_continued
including an unfavourable exchange rate impact of £8 million, was primarily due to the pass-through allowance for certain of the exceptional reorganisation costs and the first six months profits from GridAmerica of £2 million.
The £41 million increase in adjusted operating profit comparing 2002/03 with 2001/02, including an unfavourable exchange rate impact of £8 million, was primarily due to the first full year results from the Niagara Mohawk acquisition.
Operating performance
The blackout in the northeastern US and Canada on 14 August 2003, which started in the Midwest and cascaded into our service area, caused a loss of power to more than 800,000 of our Niagara Mohawk customers in upstate New York. Our staff and systems performed well and our customers were among the first to have their power restored after only seven hours.
In testimony before the US Congress about the blackout, Nick Winser, our Director of UK and US Transmission, highlighted the need to encourage the formation of independent transmission companies, to require the establishment of streamlined regional planning processes, to establish pricing policies that promote and reward investments in necessary grid upgrades, and to eliminate barriers to the siting of new transmission facilities.
Investment in the network
Capital investment in the replacement, reinforcement and extension of the US electricity transmission networks in 2003/04 was £53 million, compared with £49 million in 2002/03 and £38 million in 2001/02.
Investment in electricity transmission systems is, by its nature, variable. The systems consist of large, long-lived assets that typically will be replaced simultaneously with adjacent assets to maximise system availability.
The increase in capital expenditure in 2002/03 when compared to 2001/02 was mainly due to the inclusion of the first full year results of Niagara Mohawk (acquisition completed in January 2002). The summary above includes two months for Niagara Mohawk in 2001/02.
US Distribution
Background information
National Grid USA is one of the leading electricity distribution service providers in the northeastern US, as measured by energy delivered, and one of the largest utilities in the US, as measured by the number of electricity distribution customers. US electricity distribution serves approximately 3.3 million customers over a network of 62,000 circuit miles. US gas distribution serves around 560,000 customers over a network of 8,000 miles.
The company provides electricity and gas distribution in New York through its subsidiary Niagara Mohawk Power Corporation. It provides electricity distribution in New England through its subsidiaries Massachusetts Electric Company, Nantucket Electric Company, The Narragansett Electric Company and Granite State Electric Company.
Regulation
Massachusetts distribution rates (Massachusetts Electric Company and Nantucket Electric Company)
Under the Massachusetts Electric distribution rate plan approved by the Massachusetts Department of Telecommunications and Energy, distribution rates were reduced by $10 million on 1 May 2000 and will remain frozen until the end of February 2005. From March 2005 to the end of December 2009, distribution rates will be indexed to the average of distribution rates of similarly unbundled investor-owned utilities in New England, New York, New Jersey and Pennsylvania. Massachusetts Electric has agreed that increases in its distribution rates will initially be capped at 90% of the regional average. Based on a predetermined formula, annual savings related to Massachusetts Electric’s acquisition by National Grid that are achieved up to the end of 2009 will be calculated and shared equitably with customers from January 2010 until May 2020.
Nantucket Electric’s distribution rates are linked to Massachusetts Electric’s rates and became effective on 1 May 2000.
Rhode Island distribution rates (The Narragansett Electric Company)
Under the rate plan for Narragansett Electric, approved by the Rhode Island Public Utilities Commission (RIPUC), distribution rates were reduced by approximately $13 million on 1 May 2000 and will remain frozen until 31 December 2004. During the rate freeze, Narragansett Electric is permitted to retain earnings up to 12% return on equity. Any earnings between 12% and 13% will be shared equally with customers. If earnings exceed 13%, the excess will be divided between customers and the company, with customers receiving 75%.
From 1 January 2005, distribution rates will generally be determined by the RIPUC in accordance with Narragansett Electric’s cost of service. From that date, until the end of 2019, the company will be able to include in its cost of service half of any proven savings achieved since the merger of two former distribution companies that belonged to Eastern Utilities Associates (EUA – which became part of the Group in 2000) with Narragansett Electric. Narragansett Electric has filed evidence of annual EUA merger savings of approximately $16 million, subject to approval by the RIPUC. Our potential share of these savings is about $8 million annually until 2019, provided we maintain our cost of service below certain thresholds. These savings will be subject to further verification by 2007.
New Hampshire distribution rates (Granite State Electric Company)
The current rates for Granite State Electric are subject to regulation by the New Hampshire Public Utilities Commission and became effective in July 1998. These rates reflect expenses for the year ended 31 December 1994 and a 10% allowed return on equity.
New York distribution rates (Niagara Mohawk Power Corporation)
Niagara Mohawk’s distribution rates are regulated by the New York State Public Service Commission (NYPSC). As part of the regulatory approval process for the acquisition of Niagara Mohawk, a 10-year rate plan was approved by the NYPSC and became effective on 31 January 2002. Electricity delivery rates were reduced by $152 million and are subject to only limited adjustments for a period of 10 years. However, Niagara Mohawk will continue to be able to adjust rates to recover the full commodity costs of generation. Under the plan, after reflecting its share of savings related to the acquisition, Niagara Mohawk may earn a return on equity of up to 11.75%, or 12.0% if certain customer education targets are met.
30 National Grid Transco_Annual Report and Accounts 2003/04
Back to Contents
Operating Review_continued
Returns above this level are then subject to a sharing mechanism with customers.
The 10-year rate plan also provides for a freeze on gas delivery rates until the end of 2004, but permits Niagara Mohawk to pass through to customers gas commodity and transportation costs. Niagara Mohawk may earn a threshold return on equity of up to 10%, or 12% if certain customer migration and education goals are met, and is required to share with customers earnings above this threshold.
Financial performance
For the average exchange rates used in translating the US financial results, please see pages 37 and 41 in the Financial Review.
The US electricity distribution and US gas distribution segments are discussed together as US Distribution. The figures given for electricity distribution and stranded costs together constitute the US electricity distribution segment. Stranded costs are the costs associated with the divestment of generating assets. Our regulators allow us to recover these costs, along with a return, from ratepayers.
The summary includes two months of results for Niagara Mohawk (acquisition completed on 31 January 2002) in the comparative figures for the year ended 31 March 2002.
| Turnover for US electricity distribution was as follows: |
| • | electricity distribution: £3,030 million for the year ended 31 March 2004 compared to £2,860 million in 2002/03 and £1,962 million in 2001/02; and |
| • | stranded costs: £507 million for the year ended 31 March 2004 compared to £586 million in 2002/03 and £320 million in 2001/02. |
Turnover for US gas distribution was £464 million for the year ended 31 March 2004 compared to £446 million in 2002/03 and £104 million in 2001/02.
In 2003/04, turnover in electricity distribution increased by £170 million, notwithstanding an unfavourable exchange rate impact of £172 million. Sales volume growth, an increase in commodity costs and the reclassification of certain FERC-regulated tariff charges previously reported as transmission contributed to higher turnover, but the return to normal weather patterns, and hence lower energy usage, partially offset the increase. The increase in commodity costs and tariff charges were both offset by increased operating costs.
Stranded costs turnover decreased by £79 million in 2003/04, including an unfavourable exchange rate impact of £29 million. Most of this decrease was attributable to lower returns on the reducing stranded cost asset, which were expected, combined with the impact of weaker sales and reduced purchased power contract costs (these are included in our stranded cost recovery and are offset by a corresponding movement in operating cost).
Turnover for US gas distribution increased by £18 million in 2003/04, including an unfavourable exchange rate impact of £26 million. This increase was primarily due to higher commodity costs.
Turnover increased by £898 million, £266 million and £342 million for electricity distribution, stranded costs and gas distribution respectively in 2002/03. These increases reflect the acquisition of Niagara Mohawk in January 2002 and the first full year of results from it in the year ended 31 March 2003.
Electricity distribution deliveries grew in the US in 2003/04 by 0.8% and in 2002/03 by 0.6% after normalising for weather. Strong residential and small commercial and industrial sales were partially offset by continued weakness in the industrial sector. Weather had a positive impact of approximately £7 million, which was less significant than the previous year. In 2002/03, the Group was aided by weather that was hotter than normal during the summer and colder than normal during the winter, causing an increase in energy use to run air conditioning and heating systems. This amounted to £34 million more turnover than normal in the 2002/03 financial year.
| Adjusted operating profit for US electricity distribution was as follows: |
| • | electricity distribution: £315 million for the year ended 31 March 2004 compared to £343 million in 2002/03 and £187 million in 2001/02; and |
| • | stranded costs: £134 million for the year ended 31 March 2004 compared to £170 million in2002/03 and £79 million in 2001/02. |
Adjusted operating profit for US gas distribution was £48 million for the year ended 31 March 2004 compared to £58 million in 2002/03 and £17 million in 2001/02.
| Operating profit for US electricity distribution was as follows: |
| • | electricity distribution: £158 million for the year ended 31 March 2004 compared to £241 million in 2002/03 and £65 million in 2001/02; and |
| • | stranded costs: £136 million for the year ended 31 March 2004 compared to £172 million in 2002/03 and £84 million in 2001/02 |
Operating profit for US gas distribution was £37 million for the year ended 31 March 2004 compared to £49 million in 2002/03 and £8 million in 2001/02.
Exceptional charges and goodwill amortisation explain the difference between adjusted operating profit and operating profit. These exceptional charges are discussed in the context of all exceptional items of the Group on pages 36 and 40. Goodwill amortisation is discussed in the context of the Group as a whole on pages 36 and 39.
Electricity distribution adjusted operating profit decreased by £28 million in 2003/04 over 2002/03 and included an unfavourable exchange rate impact of £18 million. A return to normal weather combined with a one-off cost primarily related to storms was partially offset by growth in electricity deliveries and cost reductions.
Stranded costs adjusted operating profit decreased by £36 million, including an unfavourable exchange rate impact of £8 million. Lower returns, as expected, combined with the impact of weaker industrial sales made up the majority of this decrease.
US gas distribution adjusted operating profit decreased by £10 million and included an unfavourable exchange rate impact of £3 million. This decrease was primarily due to a one-off cost of £10 million related to the reversal of a previous over-collection of state income tax, which was partially offset by lower costs.
Annual Report and Accounts 2003/04_National Grid Transco 31
Back to Contents
Operating Review_continued
Adjusted operating profit for US electricity distribution and US gas distribution increased by a total of £288 million in 2002/03 over 2001/02 primarily due to the first full year of results from the Niagara Mohawk acquisition. After excluding 10 months’ results relating to Niagara Mohawk from the 2002/03 results to place them on a basis comparable with 2001/02, the exchange rate impact on the 2002/03 results was a loss of £34 million based on the 2001/02 average exchange rate.
The Group previously announced a goal across its US Transmission and US Distribution operations to reduce controllable costs by 20% in real terms by the end of the 2004/05 financial year. By 31 March 2004, we had achieved a cumulative reduction of 10% in real terms from March 2002. This translates to an annualised rate of 15%.
Operating performance
We work toward service quality standards that the state regulators expect us to achieve. If we fall below a prescribed standard, we can incur a penalty. If we do better than the standard, we can in certain cases achieve an incentive. US Distribution met or exceeded almost all of its standards and earned an aggregate net incentive of £0.8 million in calendar year 2003, which was driven by very favourable performance in all customer service-related measures.
The number of Lost Time Injuries in US Distribution increased by 14% in 2003/04. We are continuing to focus on identifying and addressing near misses as we believe this is an important investment in improving our long-term safety performance.
| Investment in the networks |
| Capital investment in the replacement, reinforcement and extension of the US Distribution networks in 2003/04 was: |
| • | US electricity distribution: £227 million, compared with £209 million in 2002/03 and £141 million in 2001/02; and |
| • | US gas distribution: £50 million, compared with £40 million in 2002/03 and £3 million in 2001/02. |
US electricity distribution spending increased by £18 million in 2003/04, including a favourable exchange rate impact of £13 million. US gas distribution spending increased by £10 million in 2003/04, including a favourable exchange rate impact of £3 million. US Distribution included spending to establish automated meter reading of £50 million in 2003/04 compared with £39 million in 2002/03 and £29 million in 2001/02. The £11 million increase in 2003/04 includes a favourable exchange rate impact of £3 million. The large increases from 2001/02 to 2002/03 reflect the acquisition of Niagara Mohawk in January 2002, with two months included in 2001/02 and a full year included for 2002/03.
UK Gas Distribution
Background information
The UK Gas Distribution business of National Grid Transco is operated by Transco and comprises almost all of Britain’s gas distribution system. The gas distribution system consists of approximately 170,000 miles of distribution pipelines and is the largest gas distribution system in Europe. Gas is transported on behalf of approximately 70 active gas shippers from the National Transmission System through the eight regional distribution networks to around 21 million consumers.
As well as gas transportation, Transco is responsible for the safety, development and maintenance of the transportation system and operates the national gas emergency service.
Regulation
On 1 April 2002, the activities of Transco’s distribution business became subject to a separate five-year price control formula (‘distribution price control formula’). With effect from 1 April 2004, this single price control formula was disaggregated into eight separate price control formulae (‘networks price control formulae’) to cover the activities of the eight regional distribution networks.
The new networks price control formulae take the same form as the distribution price control formula, with a maximum allowed revenue assigned to each network. Each formula retains the 65% fixed, 35% variable revenue associated with transportation volume changes, a mains replacement incentive mechanism and the pass-through of prescribed rates and gas transporter licence fees.
Each network has been allocated a regulatory value associated with its distribution assets, using an estimate of Transco’s distribution business regulatory value as at 1 April 2002. The allocation was done in a manner to minimise unnecessary regional differentials in transportation charges. The networks price control formulae also incorporate the same cost of capital assumptions at a real pre-tax rate of 6.25%.
To set the new networks price control formulae it was also necessary to allocate allowances for operating costs, capital expenditure, replacement expenditure, regulatory depreciation and transportation volumes. Projected replacement expenditure continues to be divided 50:50 between regulatory capital and regulatory operating expenditure, thereby ensuring that the cost of the iron mains replacement programme does not fall wholly on today’s customers but is shared with future customers. The regulatory treatment of replacement expenditure contrasts with the accounting treatment where all such costs are expensed (see critical accounting policies – replacement expenditure on page 47).
Each network is subject to its own mains replacement incentive mechanism and retains 33% of any outperformance against Ofgem’s annual cost targets as additional profit, or alternatively, bears 50% of any overspend if it underperforms.
In 2003/04, operating under the distribution price control formula Transco made an estimated £10 million of additional profit from this mechanism.
Financial performance
UK Gas Distribution turnover for the year ended 31 March 2004 was £2,245 million, compared with £2,089 million in 2002/03 and £2,013 million in 2001/02.
| Principal factors behind the £156 million increase in turnover comparing 2003/04 to 2002/03 were: |
| • | an increase in revenue recovered under the distribution price control formula of £84 million, primarily because of a 5% price increase implemented in October 2003 which added £79 million, combined with an increase in underlying volumes which added £21 million, but offset by an £11 million reduction because of relatively mild weather; and |
| • | a £72 million increase in other, relatively low margin income, primarily because of |
32 National Grid Transco_Annual Report and Accounts 2003/04
Back to Contents
Operating Review_continued
| | increased work for the Group’s other businesses, such as increased workload undertaken by Transco’s emergency service on behalf of the Group’s regulated and non-regulated metering businesses. |
Principal factors behind the £76 million increase in turnover comparing 2002/03 to 2001/02 were an increase in revenue recovered under the distribution price control formula of £33 million, of which £23 million was due to an increase in underlying volumes, while £10 million was the result of relatively cold weather. In addition, there was an increase of £43 million in other income primarily because of increased work for the Group’s other businesses.
UK Gas Distribution adjusted operating profit for the year ended 31 March 2004 was £729 million, compared with £554 million in 2002/03 and £548 million in 2001/02.
UK Gas Distribution operating profit for the year ended 31 March 2004 was £640 million, compared with £443 million in 2002/03 and £504 million in 2001/02.
Exceptional charges which explain the difference between adjusted operating profit and operating profit are discussed in the context of all exceptional items of the Group on pages 36 and 40.
The £175 million increase in adjusted operating profit comparing 2003/04 to 2002/03 was mainly a result of an £84 million increase in formula income, a £103 million reduction in controllable operating costs and a £17 million reduction in replacement expenditure. This was offset by a net increase in depreciation and amortisation of capital contributions of £11 million and a £23 million charge for UK Gas Distribution’s share of the Lattice pensions deficit.
Principal factors behind the £6 million increase in adjusted operating profit comparing 2002/03 to 2001/02 were an increase in revenue recovered under the distribution price control formula of £33 million, combined with a £26 million reduction in controllable operating costs, offset by increased depreciation of £9 million and an increase in replacement expenditure of £37 million (see critical accounting policies – replacement expenditure on page 47).
UK Gas Distribution’s replacement expenditure (repex) for the year ended 31 March 2004 was £388 million, compared with £405 million in 2002/03 and £368 million in 2001/02.
The £37 million increase in repex in 2002/03 compared with 2001/02 was due to the completion of the Medium Pressure Ductile Iron replacement programme in 2002/03. The £17 million reduction comparing 2003/04 to 2002/03 was associated with the start of the iron mains replacement programme with 2003/04 representing the lowest year of expenditure planned until 2007.
UK Gas Distribution’s controllable costs in 2003/04 were £103 million lower than 2002/03 and 7% lower than the 2003/04 allowance agreed with Ofgem as part of the five-year distribution price control formula agreed in April 2002. The reduction was a direct result of the implementation of restructuring plans announced in September 2002, coupled with continued investment in technology and the centralisation of activities, and aided by synergies from the merger of National Grid and Lattice.
Operating performance
Gas throughput was 706 TWh in 2003/04, compared with 708 TWh in 2002/03 and 697 TWh in 2001/02. If the weather had corresponded to seasonal normal temperatures, it is estimated that gas throughput would have been 732 TWh in 2003/04, compared with 730 TWh in 2002/03 and 727 TWh in 2001/02.
While there has been underlying growth of 1.9% in demand from small users (2002/03 2.0% demand growth), 2003/04 saw a 3.5% reduction in underlying demand from business and other large users (2002/03 1.6% reduction), which can be attributed to higher gas prices, power stations being off-line and recession in a number of manufacturing sectors.
Standards of service
Over the past few months we have been working with Ofgem and the wider industry to implement plans to improve the standards of service provided by Transco in relation to its connections activities. While Ofgem has recognised that the performance of the connections service provided by Transco has improved, in May 2004 it confirmed a financial penalty of £1 million in relation to earlier performance problems.
The problems we have had with our connections operations have adversely impacted our overall standards of service performance and as a result there is some room for improvement. Despite this we have once again exceeded our safety-related standards of service targets with more than 98% of ‘uncontrolled’ gas escapes (where the gas leak cannot be controlled by turning the gas supply off at the meter) attended within one hour, and more than 99% of ‘controlled’ gas escapes (where the gas leak can be controlled at the meter) attended within two hours.
Safety
Using DuPont Safety Resources, we have been working to improve our overall safety, health and environmental performance through the implementation of best practice in UK Gas Distribution. Over the last 12 months, we have demonstrated a continued improvement with a 22% reduction in employee Lost Time Injuries (LTIs). By working closely with our supply chain partners to share best practice, we have also made significant steps in improving their performance resulting in a 43% reduction in their LTIs. We have initiated new training, which we believe will educate and change behaviours to drive improved safety performance further towards our goal of zero injuries.
Investment in the network
Capital expenditure in the reinforcement and extension of Transco’s gas distribution network was £293 million in 2003/04, compared with £380 million in 2002/03 and £455 million in 2001/02. The reductions in capital expenditure comparing 2003/04 to 2002/03 and 2002/03 to 2001/02 were principally due to the fact that investment in the high pressure pipelines in the distribution networks incorporates a number of large projects and is dependent on forecasts of future demand. The profile of expenditure over time is stepped with the commencement and completion of projects to expand the network. As a result of the level of project activity, expenditure in 2001/02 was particularly high due to a number of large projects being undertaken. It fell by £75 million in 2002/03 and then by a further £87 million in 2003/04 with the completion of these projects.
During the year ended 31 March 2004, Transco made over 100,000 new connections to its network. The total number of new connections to Britain’s network, taking into account other
Annual Report and Accounts 2003/04_National Grid Transco 33
Back to Contents
Operating Review_continued
connections made by third parties, is estimated to be in excess of 200,000.
Network sales
Plans for the possible sale of up to four of Transco’s eight distribution networks, announced in May 2003, have progressed steadily over the past year. A large number of indicative bids for the five networks potentially identified for sale (Scotland, Wales and West, North of England, North West and South of England) were received and discussions have continued with a number of parties. It is expected that the results of the sales process will be announced this summer with any sales due for completion in early 2005.
National Grid Transco has been discussing its plans with Ofgem and the wider industry through industry workstreams. In April 2004, Ofgem gave approval for the next phase of work to consider the implications of the proposed network sales on the basis that it is in consumers’ interests. Completion of this phase of work is expected by the end of July and Ofgem’s final consent to specific sales is expected in the second half of 2004.
The HSE has been kept appraised of all developments and will need to approve new safety cases and any changes proposed by National Grid Transco before the sales can complete. The 0800 111 999 national gas emergency service number will remain the same and will continue to be managed by National Grid Transco. The emergency engineers who are currently dispatched to attend public reported gas escapes and gas emergencies within each network will be included as part of any network sale.
Although we may sell up to four networks, if this maximises value, we remain committed to a substantial gas distribution business in Britain and we will continue to be the largest operator of gas distribution assets in the country.
The ‘Way Ahead’ for our retained distribution networks
We have begun our ‘Way Ahead’ restructuring programme in the networks that we will retain. This involves a move to a more centralised structure that will enable us to place increased emphasis on safety and efficiency, the deployment of best practice across the organisation, and facilitate our aim to be the best in the world at balancing cost, performance and risk. Any network that is currently part of the sale process, but is not subsequently sold, will be incorporated into the Way Ahead programme later this year.
This should enable us to deliver major reductions in controllable operating expenditure.
Other businesses
Progress continues to be made by the Group to re-focus the portfolio of other businesses to the provision of infrastructure and related services where we can exploit our core skills and assets to create value.
The adjusted operating profit for Group undertakings within other activities for the year ended 31 March 2004 was £103 million, compared with £143 million in 2002/03 and £206 million in 2001/02.
Operating profit for Group undertakings within other activities for the year ended 31 March 2004 was £24 million, compared with £24 million in 2002/03 and £120 million in 2001/02.
Exceptional charges and goodwill amortisation explain the difference between adjusted operating profit and operating profit. These exceptional charges are discussed in the context of all exceptional items of the Group on pages 36 and 40. Goodwill amortisation is discussed on pages 36 and 39.
The £40 million reduction in adjusted operating profit in 2003/04 was mainly a result of a £29 million improvement in the profitability of Gridcom, offset by an increased depreciation charge in the Transco metering business, increased losses at Fulcrum Connections, increased pension costs, and start-up costs in OnStream and Isle of Grain import facility.
Included within the other activities are the businesses described below.
Gridcom
Gridcom provides communications infrastructure solutions to fibre and wireless network operators in the UK and northeastern US.
Gridcom builds, leases and operates sites for the base stations and radio masts needed by mobile operators, exploiting the Group’s project management skills and electricity and gas infrastructure. In the US, it also offers dark fibre and related facilities to telecoms operators. In the UK, demand for Gridcom’s services was static for most of 2003/04 as mobile operators delayed the roll-out of their 3G (third generation) platforms. However, significant operational improvements have been made in the UK business to reduce costs, improve safety, reducing employee Lost Time Injuries by 76%, and provide a profitable foundation to meet the expected growth in demand.
In the US, demand for Gridcom’s services from mobile operators has increased during 2003/04 and improvements have been made to the profitability of the dark fibre business.
Metering
Our two UK metering businesses – the Transco metering business and OnStream, our competitive metering business – provide installation, maintenance and meter reading services to gas shippers, including British Gas Trading. During 2003/04, we have continued to focus on the challenges and opportunities of competition, which Ofgem is introducing in the UK metering market.
Transco metering business
The priority of the Transco metering business continues to be the provision of services for our currently installed base of approximately 20 million domestic gas meters. In the last quarter of 2003/04, we successfully secured long-term usage contracts, including a new pricing structure, with gas suppliers, covering substantially all of our meters, to secure a long-term revenue stream for current, new and replacement meters.
OnStream
We created OnStream to take advantage of the opportunities in the emerging competitive market for new gas and electricity meters. During the year, the business mobilised for its first contracts with British Gas Trading to provide service in four regions of the UK, representing a customer base of around 11 million gas and electricity meters.
Interconnectors
We operate electricity interconnectors between England and Scotland and England and France which provide access to alternative
34 National Grid Transco_Annual Report and Accounts 2003/04
Back to Contents
Operating Review_continued
wholesale electricity markets and additional sources of supply.
The Basslink project, to build, own and operate a 600 MW interconnector linking the electricity network on the island state of Tasmania to the transmission network on the Australian mainland has continued on schedule and is still due for completion in late 2005.
Capital expenditure on this project was £78 million in 2003/04, compared with £50 million in 2002/03 and £6 million in 2001/02.
Total project costs remain on budget and the total cost to completion, excluding capitalised finance costs, is expected to be approximately £300 million.
Liquefied Natural Gas
Our Liquefied Natural Gas business continues to provide gas storage facilities to Transco to help meet its security of supply obligations.
During 2003/04, we commenced work on a £130 million project to develop an LNG import facility on the Isle of Grain, and have signed a 20-year contract to sell the capacity to BP and Sonatrach following its scheduled completion date in early 2005. In 2003/04, we have incurred capital expenditure of £58 million, compared with £2 million in 2002/03, and transferred £20 million of assets from the existing LNG business. The facility will have the capacity to import, store and supply 4 bcm of LNG into the UK market from 2005 – representing approximately 4% of UK demand. The UK market is expected to require new and increasing volumes of imported gas from 2005 to supplement the UK’s existing indigenous supplies.
Fulcrum Connections
During 2003/04, Fulcrum Connections provided, on behalf of Transco, 130,000 new gas connections and gas meter alterations to domestic and industrial customers, a similar number to last year. The business worked hard during the year to improve customer service. By 31 March 2004, Fulcrum had made substantial improvements in the number of standards of service achieved and enjoyed increased levels of customer satisfaction compared to 2002/03. This was recognised by Ofgem when it confirmed its fine on Transco in relation to earlier performance problems in the business. Fulcrum also made impressive improvements in its safety performance, with an 88% reduction in the number of employee Lost Time Injuries.
SecondSite Property
SecondSite Property’s principal activity is the management, clean up and disposal of surplus non-operational properties (including former Transco and National Grid sites in the UK), largely comprising contaminated former gas works. SecondSite Property aims to tackle the historic legacy of gas manufacture on our sites so that they can be reclaimed and returned to beneficial community use.
During the year ended 31 March 2004, SecondSite Property disposed of 91 properties and generated £154 million in disposal proceeds, compared with 74 properties and £89 million in 2002/03 and 74 properties and £128 million in 2001/02. These disposals contributed profit on the disposal of fixed assets of £88 million in 2003/04 compared with £54 million in 2002/03 and £100 million in 2001/02.
Advantica
Advantica provides technology-based solutions to Transco, other utilities and pipeline operators worldwide and operates in Europe and the US. The company has been defined as non-core and was restructured in March 2004 to reduce operating costs and respond to market conditions.
Discontinued operations
During the year, we have continued our exit from our non-core businesses. We completed the sale of Lattice Energy Services and also sold our interests in Bulldog Communications and EnMO. We have also agreed the sale of our interests in Citelec (which holds 65% of Transener, our electricity transmission joint venture in Argentina) and viavera, the former subject to appropriate regulatory and government approvals.
We are currently in the process of selling our investments in Intelig and Urband. We will not provide any additional funding to the remaining altnet (alternative telecoms network) businesses over and above existing provisions and remain confident that we will complete our exit from them within the provisions that we announced in November 2001.
Annual Report and Accounts 2003/04_National Grid Transco 35
Back to Contents
Directors’ Report and Operating and Financial Review
Financial Review
Segmental reporting
The presentation of segment information is based on the management responsibilities that existed at 31 March 2004. Minor changes to the definition of segments were made during 2003/04, the principal effect of which was to reclassify the results of the UK Interconnectors and LNG Storage businesses from ‘UK electricity and gas transmission’ to ‘Other activities’. Comparative figures for 2002/03 and 2001/02 were restated accordingly. The result of the restatement was to reclassify £26 million and £25 million of operating and adjusted operating profit from ‘UK electricity and gas transmission’ to ‘Other activities’ for 2002/03 and 2001/02 respectively.
A review of the operational and financial performance of the reporting segments is contained on pages 25 to 35 together with additional financial and performance information relating to the segments.
Financial year ended 31 March 2004 (2003/04) compared with financial year ended 31 March 2003 (2002/03)
Group turnover
Group turnover decreased from £9,400 million in 2002/03 to £9,033 million in 2003/04, a fall of £367 million, primarily reflecting a reduction in turnover relating to discontinued operations which dropped from £567 million in 2002/03 to £158 million in 2003/04.
The vast majority of the discontinued turnover related to EnMO, which provides the on-the-day commodity market for gas trading in Great Britain, and was disposed of by the Group during 2003/04.
Group operating profit
Group total operating profit rose by £126 million to £1,862 million in 2003/04. This reflected an increase in adjusted operating profit of £53 million and a reduction in net operating exceptional charges of £70 million as compared with 2002/03. The main reason for the increase in adjusted operating profit was the strong performance of UK gas distribution. On pages 25 to 35, we explain the improvement in adjusted operating profit performance for UK gas distribution and movements for the other businesses. Net operating exceptional items included within total operating profit that related to both continuing and discontinued operations moved from a net charge of £347 million in 2002/03 to a net charge of £277 million in 2003/04. A separate discussion of operating and non-operating exceptional items for 2003/04, 2002/03 and 2001/02 is included below.
Joint ventures
On 15 March 2004, National Grid Transco agreed to sell its 42.5% stake in Citelec, the holding company of Transener, which owns and operates a transmission system in Argentina.
National Grid Transco continued to account for Citelec’s results under hyper-inflationary accounting principles during 2003/04. The application of these principles had no material impact on the results for the year ended 31 March 2004 and Citelec had no impact on earnings during the year.
Goodwill amortisation
Goodwill amortisation for 2003/04 fell from £102 million to £99 million. The reduction reflected the reduced sterling cost of US dollar denominated goodwill amortisation as a result of the weakening of the US dollar during 2003/04.
Exceptional items – 2003/04
The results for the year ended 31 March 2004 included total net exceptional pre-tax credits of £45 million. Pre-tax net credits were made up of pre-tax net charges of £277 million of operating exceptional charges (restructuring and environmental costs) relating to continuing operations offset by £322 million of non-operating exceptional credits. The net £45 million credits comprised:
| • | restructuring costs which consisted of £24 million of costs associated with the proposed disposal of UK-based distribution networks (see page 34 for a further discussion of the proposed disposal) and other costs of £225 million, totalling £249 million (£170 million after tax). The other costs primarily related to planned cost reduction programmes which comprised: £100 million for US distribution businesses and US transmission; £77 million for UK distribution; £14 million for UK transmission; and £34 million for other businesses; |
| • | £28 million of environmental costs (£28 million after tax). Following the completion of an investigative site survey in the UK, the estimate of environmental liabilities was altered to reflect the best estimate of these liabilities having regard to relevant legislation. This has resulted in an additional charge being reflected in the profit and loss account; |
| • | £226 million gain on assets held for exchange (£226 million after tax) relating to the profit recognised on Energis shares, with a carrying value of £17 million, delivered to Equity Plus Income Convertible Securities (EPICs) bondholders on 6 May 2003 in settlement of all EPICs outstanding at that date that had a carrying value of £243 million. This transaction represented the culmination of a deferred sale arrangement entered into in February 1999; and |
| • | £96 million gain on sales of property and other tangible fixed assets (£96 million after tax). |
Interest
Net interest fell from £970 million in 2002/03 to £822 million in 2003/04. In 2002/03, exceptional financing costs relating to a joint venture of £31 million were incurred. A separate discussion of exceptional financing costs for 2002/03 is contained in ‘Exceptional items’ on page 40, when comparing the results for 2002/03 with those of 2001/02.
Net interest, excluding exceptional items, fell from £939 million in 2002/03 to £822 million in 2003/04. This reduction was primarily explained by: the refinancing of debt in the UK and US; lower short-term interest rates; the weaker US dollar; and a lower level of Group net debt. In addition, there was a higher level of capitalised interest as a result of financing costs incurred in respect of ongoing capital expenditure programmes and a reduction in interest cost from former joint ventures. These impacts more than offset a net increase of £55 million in pension interest costs (net of capitalised interest) principally arising from the recognition of additional net interest from the actuarial valuation of the Lattice pension scheme undertaken at 31 March 2003. This is discussed further under ‘Retirement arrangements’ and ‘Pension accounting’ on page 37.
Taxation
The net tax charge rose from £245 million in 2002/03 to £261 million in 2003/04. The tax charge for 2003/04 of £261 million included net exceptional tax credits amounting to £89 million (2002/03: £128 million). Excluding the
36 National Grid Transco_Annual Report and Accounts 2003/04
Back to Contents
Financial Review_continued
exceptional tax items and current tax adjustments for prior years, the effective tax rate for 2003/04 based on adjusted profit before taxation was 25.1% (2002/03: 29.9%) compared with the standard corporation tax rate in the UK of 30%. The effective tax rate for 2003/04 based on profit before taxation after exceptional items was 19.1% (2002/03: 36.7%).
A reconciliation of the main components giving rise to the difference between the relevant effective tax rate and the UK standard corporation tax rate is shown in note 9 to the accounts on page 86.
Exchange rates
The Group has used the weighted average exchange rate to translate all US dollar results into sterling for 2003/04 and 2002/03, being £1.00 = $1.68 and £1.00 = $1.59 for each year respectively. The balance sheets at 31 March 2004 and 31 March 2003 have been translated at £1.00 = $1.83 and £1.00 = $1.58 respectively.
Exchange rate movements had an adverse effect on the translation of US dollar denominated operating profit and adjusted operating profit for 2003/04 compared with 2002/03. If the rate that applied during 2002/03 had been used, sterling operating profit and adjusted operating profit for 2003/04 would have been higher by around £24 million and £36 million respectively, giving a sterling operating profit and adjusted operating profit of approximately £1,886 million and £2,274 million respectively.
The effect of movements in the US dollar exchange rate on adjusted operating profit and operating profit was largely offset by the reduced sterling cost of US dollar debt taken out to finance US dollar denominated investments and the reduced sterling cost of US taxes. As a result, the impact of the higher US dollar rate on results arising in the US did not have a significant effect on adjusted earnings per share or earnings per share.
Retirement arrangements
The Group operates two major UK occupational pension schemes – the National Grid Company Group of the Electricity Supply Pension Scheme (the National Grid Scheme) and the Lattice Group Pension Scheme (the Lattice Scheme). The National Grid Scheme is a defined benefit pension scheme. The Lattice Scheme has a defined benefit section that is effectively closed to new entrants and a defined contribution section. There are no current plans to merge the two schemes.
In addition to the UK schemes, employees of National Grid USA companies are eligible to receive retirement income benefits primarily through defined benefit arrangements. Post-retirement healthcare and life insurance benefits are also provided to qualifying retirees.
An actuarial valuation of the Lattice Scheme was carried out at 31 March 2003, while the National Grid Scheme actuarial valuation is being carried out at 31 March 2004 and has not yet been completed.
In respect of the US-based pension and other post-retirement schemes, the latest full actuarial valuations were carried out at 1 April 2003. These valuations were updated using assumptions and market values at 31 March 2004.
In August 2003, the New York State Public Service Commission approved a settlement with Niagara Mohawk, a Group undertaking, following an audit that identified reconciliation issues between the rate allowance and actual costs of Niagara Mohawk’s pension and other post-retirement benefits. The settlement resolved all issues associated with those obligations for the period prior to its acquisition by the Group and, among other things, covered the funding of Niagara Mohawk’s pension and post-retirement benefit plans. As part of the settlement, the Group provided $132 million (£83 million) of tax-deductible funding during 2002/03 and provided an additional $177 million (£105 million), on a tax-deductible basis, during 2003/04. Under the terms of the settlement, the Group will earn a rate of return of at least 6.60% (nominal) on $209 million of this funding through to 31 December 2011. In addition, the Group is eligible to earn 80% of the amount by which the rate of return on the pension and post-retirement benefit funds exceeds 5.34% (nominal) measured at 31 December 2011.
In addition to the funding provided in respect of the Niagara Mohawk settlement referred to above, other contributions made in respect of US-based pension and other post-retirement schemes were higher in 2003/04 than 2002/03. This arose primarily because the Group was able to make more efficient tax-deductible funding payments in 2003/04 than were possible in 2002/03, together with higher contributions in 2003/04 associated with the Group’s early retirement programmes.
The actuarial valuation of the Lattice Scheme at 31 March 2003, covering current and former UK gas employees and other former Lattice businesses, was completed during the year ended 31 March 2004. This revealed that the pre-tax deficit was £879 million (£615 million net of tax) in the defined benefit section on the basis of the funding assumptions adopted by the actuary. It is intended that there will be annual assessments of the Lattice Scheme with the next assessment being conducted at 31 March 2004. This assessment is in the process of being carried out and therefore the outcome is currently unknown.
It has been agreed that no funding of the deficit identified in the 2003 actuarial valuation will need to be provided to the scheme until the outcome of the actuarial valuation at 31 March 2007 is known. At this point, the Group will pay the gross amount of any deficit up to a maximum amount of £520 million (£364 million net of tax) into the scheme. Until the 31 March 2007 actuarial valuation has been completed, the Group has arranged for banks to provide the trustees of the Lattice Scheme with letters of credit. The main conditions under which these letters of credit could be drawn relate to events which would imperil the interests of the scheme, such as Transco plc, a Group undertaking, becoming insolvent or the Group failing to make agreed payments into the fund. Cash contributions for the ongoing cost of the Lattice Scheme are currently being made at a rate of 22.3% of pensionable payroll.
Pension accounting
The Group continues to account for pensions under UK GAAP in accordance with Statement of Standard Accounting Practice 24 (SSAP 24) and, consistent with that statement, the Group had been spreading pension surpluses and deficits over the remaining service lives of employees based on the information contained in the last formal actuarial valuations.
As referred to on page 41 under ‘Pension accounting’, during 2002/03, the Group made a decision to suspend the recognition of any
Annual Report and Accounts 2003/04_National Grid Transco 37
Back to Contents
Financial Review_continued
further pension surplus during 2002/03 in respect of the UK pension schemes.
During 2003/04, the actuarial funding and SSAP 24 valuations of the Lattice Scheme undertaken at 31 March 2003 were completed. The charge for 2003/04 under SSAP 24 in respect of this scheme amounted to £144 million compared with £78 million for 2002/03. Of this charge, £80 million related to the ongoing cost (2002/03: £97 million), £33 million related to the spreading of the deficit (2002/03: £19 million credit), and £31 million related to the net interest charge (2002/03: £8 million credit). The ongoing SSAP 24 cost represents 23.0% (21.4% excluding administrative costs) of pensionable payroll.
As the 31 March 2004 actuarial valuation of the National Grid Scheme has not been completed, there has been no further amortisation in 2003/04 of any surplus arising from the previous formal actuarial valuation undertaken at 31 March 2001. This is consistent with the approach adopted during 2002/03.
The Group does not account for pension costs under Financial Reporting Standard (FRS) 17 ‘Retirement benefits’, but provides the necessary disclosures required by this standard. Substantially as a result of the improvement in world stock markets, the Group’s net FRS 17 deficit fell from £2,262 million at 31 March 2003 to £1,563 million at 31 March 2004.
Further disclosures relating to pensions consistent with the requirements of UK GAAP are given in note 7 to the accounts on page 82.
Earnings per share
Adjusted basic earnings per share for 2003/04 were 34.7 pence compared with 28.3 pence for 2002/03. Basic earnings per share for 2003/04 rose from 12.7 pence in 2002/03 to earnings of 35.8 pence per share, reflecting a movement from net exceptional charges in 2002/03 to net exceptional credits in 2003/04 and an increase in adjusted operating profit.
The reconciliation from basic earnings per share of 35.8 pence (2002/03: 12.7 pence) to adjusted earnings per share of 34.7 pence (2002/03: 28.3 pence) involves adjusting for goodwill amortisation of 3.2 pence (2002/03: 3.3 pence) and net exceptional credits, including the effect of tax, amounting to 4.3 pence (2002/03: 12.3 pence (net exceptional charges)).
Ordinary dividends
The total ordinary dividend for 2003/04 (£609 million) amounted to 19.78 pence per ordinary share and represented an increase of 15% over the previous year’s ordinary dividend per share. The total ordinary dividend per share was covered 1.8 times by both adjusted and basic earnings per ordinary share. The table below shows the ordinary dividends paid or payable by National Grid Transco or National Grid, as appropriate (see ‘Dividend policy’ below), for the last five financial years. These dividends do not include any associated UK tax credit in respect of such dividends.
Dividends expressed in US dollars per ADS in the table below reflect the actual amount paid to ADS holders, expressed to two decimal places, with respect to all amounts with the exception of the final ordinary dividend for 2003/04. The final ordinary dividend per ADS for 2003/04 reflects the declared US dollar amount expressed to two decimal places.
Dividend policy
As announced on 20 November 2003, the Board has recommended a 15% increase in its dividend per share for the year ended 31 March 2004. Going forward, the Board has declared its dividend policy is to aim to increase dividends per ordinary share, expressed in sterling, by 7% nominal in each financial year to 31 March 2008.
Prior to the announcement on 20 November 2003, the Group had adopted at the date of the merger of National Grid and Lattice, National Grid’s dividend policy, which had been to aim to increase dividends per share (as expressed in pounds sterling) by a real rate of 5% in each of the financial years to 31 March 2006.
Reporting the Lattice dividend history is complicated by the fact that Lattice only demerged from BG Group from 23 October 2000 and therefore only paid dividends in respect of periods after that date. In addition, prior to 31 March 2002, Lattice had a 31 December financial year end. As a consequence, any historical comparison of dividends paid or payable by National Grid Transco in 2002/03 should be made by reference to National Grid’s dividends, which is the basis upon which the table below is presented.
| Dividends | 2003/04 | | 2002/03 | | 2001/02 | | 2000/01 | | 1999/00 | |
| | p | | p | | p | | p | | p | |
|
|
|
|
|
|
|
|
|
| |
| Interim | 7.91 | | 6.86 | | 6.46 | | 6.05 | | 5.59 | |
| Final | 11.87 | | 10.34 | | 9.58 | | 9.03 | | 8.35 | |
|
|
|
|
|
|
|
|
|
| |
| Total ordinary dividends | 19.78 | | 17.20 | | 16.04 | | 15.08 | | 13.94 | |
|
|
|
|
|
|
|
|
|
| |
| | | | | | | | | | | |
| US dollar per ADS | 2003/04 | | 2002/03 | | 2001/02 | | 2000/01 | | 1999/00 | |
| | $ | | $ | | $ | | $ | | $ | |
|
|
|
|
|
|
|
|
|
| |
| Interim | 0.67 | | 0.54 | | 0.47 | | 0.45 | | 0.46 | |
| Final | 1.05 | | 0.84 | | 0.73 | | 0.65 | | 0.63 | |
|
|
|
|
|
|
|
|
|
| |
| Total ordinary dividends | 1.72 | | 1.38 | | 1.20 | | 1.10 | | 1.09 | |
|
|
|
|
|
|
|
|
|
| |
Application of UK GAAP accounting policies
As explained above, the application of UK GAAP to the business combination of Lattice and National Grid resulted in the transaction being treated as a merger. As a result, the financial information presented for all years has been prepared on the basis of common accounting policies as if the Group had always applied those accounting policies.
| The Group has adopted the provisions of Urgent Issues Task Force (UITF) 38 ‘Accounting for ESOP trusts’ during 2003/04. This pronouncement requires the following accounting: |
| • | Shares held by employee share trusts, previously reported as part of ‘Fixed asset investments – own shares’, are now reported as a deduction from shareholders’ funds at the amount paid for those shares. This has resulted in the recognition of a prior year adjustment and corresponding restatement of prior years’ accounts. The net impact of this restatement was to reduce ‘Fixed asset investments – own shares’ and equity shareholders’ funds at 31 March 2003 by £39 million. There was no impact on the profit and loss account. |
On 8 April 2004, the Accounting Standards Board issued FRS 20 ‘Share based payment’. It is the intention of the Group to adopt the
38 National Grid Transco_Annual Report and Accounts 2003/04
Back to Contents
Financial Review_continued
| provisions of FRS 20 with effect from 1 April 2004. The standard requires the following accounting: |
| • | Where shares or rights to shares are granted to third parties, including employees, a charge should be recognised in the profit and loss account based on the fair value of the shares at the date the grant of shares or right to shares is made. If this accounting policy had been adopted for this report and accounts, it is estimated that in respect of 2003/04, 2002/03 and 2001/02 adjusted operating profit would have been reduced by £25 million, £37 million and £18 million respectively and that adjusted basic earnings per share would have been reduced by 0.8 pence, 1.2 pence and 0.6 pence. Operating profit for these years would have been reduced by £25 million, £40 million and £18 million and basic earnings per share would have been reduced by 0.8 pence, 1.3 pence and 0.6 pence. |
Financial year ended 31 March 2003 (2002/03) compared with financial year ended 31 March 2002 (2001/02)
Group turnover
Group turnover for 2002/03 increased by £1,846 million over 2001/02 to £9,400 million, reflecting a full year’s turnover being recorded in respect of Niagara Mohawk, which was acquired by the Group on 31 January 2002. Therefore this only affected the results of 2001/02 for two months while impacting on the results for 2002/03 for the full year.
Group operating profit
Group total operating profit rose by £1,377 million to £1,736 million in 2002/03, primarily reflecting a movement in total operating exceptional net charges relating to both continuing and discontinued operations, which fell from £1,327 million in 2001/02 to £347 million in 2002/03.
Niagara Mohawk contributed £83 million to adjusted operating profit and £2 million to operating profit in 2001/02 for the period from the date of acquisition to 31 March 2002.
A separate discussion of exceptional items relating to 2002/03 and 2001/02 is given on page 40.
Group total adjusted operating profit rose by £402 million to £2,185 million, primarily reflecting increased adjusted operating profit from US electricity transmission and US electricity distribution which reported a full year’s contribution from the acquisition of Niagara Mohawk. As a result, the contribution of US electricity transmission and US electricity distribution rose from £353 million in 2001/02 to £641 million in 2002/03, an increase of £288 million, accounting for 72% of the total increase.
Total operating profit from Group undertakings included losses of £194 million relating to discontinued operations compared with £496 million for 2001/02, as a result of the sale of, or exit by the Group from, certain business activities during the year. The principal businesses exited during 2002/03 included The Leasing Group and 186k, a UK-based fibre optic telecommunications company.
Group operating profit also included a profit of £109 million compared with losses of £672 million in 2001/02 relating to the discontinued activities of joint ventures and the associate. A discussion of the impact the activities of discontinued joint ventures and the associate have had on the results is given below.
Joint ventures and associate
On 16 July 2002, Energis plc (‘Energis’) went into administration. As a direct result of this event, Energis ceased to be an associate of the Group from that date. The results for 2002/03 were not affected by this change in status, because the Group’s investment in Energis had been fully written down during 2001/02 and Energis had not publicly declared any results since reporting its results for the six months ended 30 September 2001.
The Group ceased equity accounting for Intelig, its Brazilian telecoms joint venture, with effect from 30 September 2002. This arose as a result of the Group’s share of net assets falling to zero and the Group declaring its intention not to fund this business any further while pursuing a withdrawal strategy.
During 2002/03, the Group’s interests in Energis Polska, Manquehue net and Silica Networks were disposed of or, in the case of Energis Polska, the interest reduced to a level where the Group had no significant influence on the activities of this business. As a result, these entities are no longer equity accounted for, and any loss arising from the disposal or reduction in interest has been reflected in exceptional items.
As explained in ‘Exceptional items – 2002/03’ on page 40, the total operating profit for 2002/03 of joint ventures (discontinued operations) included an exceptional pre-tax credit amounting to £129 million. The £129 million credit represented the partial release of impairment provisions charged in the year ended 31 March 2002 to match the recognition of retained losses arising from these joint ventures, and is recorded within the net £109 million credit relating to the Group’s ‘share of joint ventures’ and associate’s operating profit/(loss) – discontinued operations’.
The retained losses of the joint ventures against which the provisions were being released were reflected in the profit and loss account according to their nature, for example: share of operating loss; share of net interest; and share of tax. However, the principal element was an exceptional net interest charge of £92 million (before and after tax) relating to the Group’s share of exchange losses incurred on foreign exchange borrowings denominated in US dollars reported by Intelig.
Operating losses of £672 million recorded in 2001/02 in respect of the discontinued activities of share of joint ventures’ and associate’s operating profit/(loss) reflect the very significant level of impairment charges incurred during that year.
Operating results for all the above associate and joint ventures have been reflected in the accounts within ‘share of joint ventures’ and associate’s operating profit/(loss) – discontinued operations’.
Goodwill amortisation
Goodwill amortisation for 2002/03 rose from £97 million to £102 million. This increase reflected a full year’s amortisation of goodwill relating to the prior year’s acquisition of Niagara Mohawk, partially offset by the following: |
| • | no recognition of the Group’s share of goodwill amortisation in 2002/03 in respect of Energis; and |
| • | the reduced sterling cost of US dollar denominated goodwill amortisation as a result of the weakening of the US dollar. |
Annual Report and Accounts 2003/04_National Grid Transco 39
Back to Contents
Financial Review_continued
Exceptional items – 2002/03
The results for 2002/03 included total net exceptional pre-tax charges of £477 million (£349 million post-tax). Pre-tax charges were made up of pre-tax net charges of £308 million and £39 million of operating exceptional items relating to continuing and discontinued operations respectively; £99 million of non-operating exceptional items; and £31 million of financing exceptional charges. In addition, the Group recorded £28 million of exceptional minority interest charge. These net charges comprised: |
| • | costs arising from the Merger of £184 million (£147 million after tax) related to transaction costs of the Merger, together with related employee share scheme costs amounting to £79 million and other property and employee costs of £105 million; |
| • | restructuring costs principally arising from business-related efficiency programmes of £209 million (£165 million after tax). These costs were mainly severance-related; |
| • | an impairment charge related to the Group’s telecoms assets held by 186k of £168 million (£143 million after tax). The Group wrote down the assets of 186k consistent with its announced intention to withdraw from the altnet sector. Subsequent to the impairment charge, the majority of the assets relating to 186k were sold for a nominal sum to a third party; |
| • | a £135 million credit (£155 million after tax) in respect of Intelig and other telecoms joint ventures of which £129 million was reflected in ‘share of joint ventures’ and associate’s operating profit/(loss) – discontinued operations’ – see ‘Joint ventures and associate’ on page 39; |
| • | an exceptional net interest loss of £31 million (before and after tax). This related to the Group’s share of exchange losses incurred on foreign exchange borrowings of £98 million (£92 million of which related to Intelig as referred to in ‘Joint ventures and associate’ on page 39) partially offset by a gain on net monetary liabilities of £67 million as a result of the adoption of hyper-inflationary accounting, under UK GAAP, relating to Citelec, the Group’s Argentinian joint venture – see ‘Exchange rates and hyper-inflation’ on page 41; |
| • | a £28 million minority interest charge, being their share of the £61 million net exceptional credit related to the Argentinian joint venture (Citelec) – see ‘Exchange rates and hyper-inflation’ on page 41; |
| • | a £68 million loss (before and after tax) arising from the sale of the Group’s leasing business, The Leasing Group, and the termination of 186k’s operations following the sale of 186k’s assets for a nominal amount to a third party as referred to above; and |
| • | a net profit on the disposal of tangible fixed assets of £48 million (£50 million after tax). |
Exceptional items – 2001/02
The results for 2001/02 included net exceptional pre-tax charges of £1,313 million (£1,147 million post-tax).
| Pre-tax net exceptional charges were made up of £285 million and £1,042 million of operating exceptional items relating to continuing and discontinued operations respectively and £142 million of financing exceptional charges, partially offset by non-operating exceptional credits of £156 million. In addition, the Group recorded £50 million of exceptional minority interest credit. The net charges comprised: |
| • | £792 million impairment of the Group’s joint venture and associate investments (£775 million after tax) primarily arising from the decision to exit from its Latin American telecoms investments and the full impairment of the investment in Energis, following the collapse in the associate’s share price. The impairment charges resulted in writing down the value of these investments to £nil and the recording of associated liabilities; |
| • | £250 million impairment of assets in 186k (£175 million after tax). The basis of this charge was to write down these assets to their estimated recoverable amounts; |
| • | the Group’s share of the pre- and post-tax exceptional charge of a telecoms joint venture (SST) amounting to £48 million, reflecting the write down of an investment and goodwill in that joint venture, prior to the acquisition of all the issued ordinary share capital of this entity by the Group; |
| • | an impairment of the Group’s LNG storage assets of £50 million (£35 million after tax), reflecting a reduction in the expected future cash flows under the current regulatory arrangements; |
| • | restructuring and integration costs within the UK businesses and the integration of Niagara Mohawk, which amounted to £187 million (£130 million after tax); and |
| • | the Group’s share of Citelec’s foreign exchange pre- and post-tax financing charge which amounted to £142 million relating to the devaluation of the Argentine peso. |
| |
| These exceptional losses were partially offset by: |
| • | pre-tax profits amounting to £94 million (£96 million after tax) relating to the sale of tangible fixed assets; |
| • | a £31 million pre- and post-tax gain on the sale of BG Group shares by the Lattice ‘All Employee Share Ownership Plan’; |
| • | an exceptional pre- and post-tax profit of £31 million relating to the gain on disposal of investments; and |
| • | a credit of £50 million relating to the Group’s share of the minority interest’s share of the foreign exchange financing charge referred to above. |
Interest
Net interest rose from £799 million in 2001/02 to £970 million in 2002/03. Both years included exceptional financing costs amounting to £142 million and £31 million in 2001/02 and 2002/03 respectively. A separate discussion of exceptional financing costs is contained in ‘Exceptional items – 2002/03’ and ‘Exceptional items – 2001/02’ as shown above.
Net interest, excluding exceptional items, rose from £657 million in 2001/02 to £939 million for 2002/03. This increase is explained by a full year’s interest charge in respect of the acquisition of Niagara Mohawk and foreign exchange movements.
Taxation
The net tax charge rose to £245 million in 2002/03 from £85 million in 2001/02 and included an exceptional tax credit on pre-tax exceptional items amounting to £128 million and £166 million in 2002/03 and 2001/02 respectively, giving rise to effective tax rates of 36.7% and 29.9% (negative) for these years.
Excluding the exceptional tax items and current tax adjustments to prior years, the effective tax rate for 2002/03 and 2001/02 based on adjusted profit before taxation was 29.9% and 29.0% respectively, compared with the standard corporation tax rate in the UK of 30% for both years. The effective tax rate for 2002/03 and 2001/02 based on profit before taxation and before exceptional items was 32.6% and 24.4% respectively.
40 National Grid Transco_Annual Report and Accounts 2003/04
Back to Contents
Financial Review_continued
A reconciliation of the main components giving rise to the difference between the relevant effective tax rate and the UK standard corporation tax rate is shown in note 9 to the accounts on page 86.
Exchange rates and hyper-inflation
The Group has used the weighted average exchange rate to translate all US dollar results into sterling for 2002/03 and 2001/02, being £1.00 = $1.59 and £1.00 = $1.44 respectively.
Exchange rate movements had an adverse effect on the translation of US dollar denominated operating profit and adjusted operating profit for 2002/03 compared with 2001/02. If the exchange rate that applied during 2001/02 had been used, sterling operating profit and adjusted operating profit for 2002/03 would have been higher by around £57 million and £74 million respectively, giving a sterling operating and adjusted operating profit of approximately £1,793 million and £2,259 million.
The above analysis does not take into account the fact that Niagara Mohawk only impacted on Group results for two months in 2001/02. On the basis of excluding 10 months’ results relating to Niagara Mohawk from the 2002/03 results, to place them on a basis comparable with 2001/02, it is estimated that on this pro forma basis adjusted operating profit would have been higher by around £34 million.
The effect of exchange rate movements on adjusted operating profit and operating profit were largely offset by the reduced sterling cost of US dollar debt taken out to finance US dollar denominated investments and the reduced sterling cost of US taxes. As a result, the impact of the higher US dollar rate on results arising in the US did not have a significant effect on adjusted earnings per share or earnings per share.
Exchange rate movements only marginally affected the Group’s recognition of operating losses that arose in respect of Intelig, the Group’s Brazilian telecoms joint venture, during 2002/03. This reflected sterling strengthening against the Brazilian currency during the period that the Group equity accounted for Intelig – see ‘Joint ventures and associate’ on page 39. The Group estimated that, compared with the average exchange rate for 2001/02, this effect reduced our share of operating losses by around £2 million.
The Group’s joint venture in Argentina, Citelec, operated within a hyper-inflationary economy. In accordance with UK GAAP, the accounts of the joint venture, which included Transener, a transmission company, were prepared using hyper-inflationary accounting principles. This resulted in all entries in the joint venture’s accounts being measured at the current purchasing price.
The fall in the Argentinian exchange rate gave rise to the recognition of the Group’s share of exchange losses arising on this joint venture’s US dollar denominated debt, that amounted to £6 million. This loss was more than offset by the Group’s share of a gain on net monetary liabilities of £67 million, as a result of inflating the liabilities as part of the hyper-inflationary adjustments referred to above. Together with the minority interest’s share of these items, all these effects were reflected as exceptional in the profit and loss account.
Pension accounting
During 2002/03, while valuations of the UK pension schemes had not been carried out, the Board considered that such valuations would, in all likelihood, reveal a deficit in both the UK schemes. The continuing recognition of a surplus relating to previous actuarial valuations was considered incompatible with this position, and until the next actuarial valuations were undertaken or completed, the decision was taken to suspend the recognition of any further pension surplus in respect of both schemes. Consequently, with effect from 1 October 2002, the spreading of pension surpluses in respect of the UK defined benefit schemes, based on their last formal actuarial valuations at 31 March 2001, was suspended.
Operating profit and net interest in 2001/02 included £21 million and £12 million credits respectively in respect of the recognition of the UK pension schemes’ surplus up to 30 September 2002, and totalled £33 million (£23 million net of tax). As a result of the suspension of the recognition of any further pension surplus since that date, adjusted operating profit and net interest were reduced and increased by £21 million and £10 million respectively compared with the ongoing recognition of a surplus. Accordingly, adjusted profit before tax was reduced by around £31 million (£22 million net of tax).
Earnings per share
Adjusted basic earnings per share for 2002/03 were 28.3 pence compared with 30.8 pence for 2001/02. Basic earnings per share for 2002/03 rose from a loss per share of 11.3 pence in 2001/02 to earnings of 12.7 pence per share, reflecting a reduction in net exceptional charges between the two years. The reconciliation from basic earnings per share of 12.7 pence (2001/02: loss of 11.3 pence) to adjusted earnings per share of 28.3 pence (2001/02: 30.8 pence) involved adjusting for goodwill amortisation of 3.3 pence (2001/02: 3.4 pence) and net exceptional charges, including the effect of tax, amounting to 12.3 pence (2001/02: 38.7 pence).
Ordinary dividends
The total ordinary dividend for 2002/03 (£530 million) amounted to 17.20 pence per ordinary share. This represented an increase of 7.2% (5% in real terms) over the previous year’s National Grid ordinary dividend per share, as this was the most appropriate dividend comparison for the reason explained in ‘Dividend policy’ on page 38. The total ordinary dividend per share was covered 1.6 times by adjusted earnings per ordinary share and 0.7 times by basic earnings per ordinary share.
Liquidity, resources and capital expenditure
Cash flow
Net cash inflow from operations in 2003/04 was £2,810 million compared with £2,826 million in 2002/03 and £2,291 million in 2001/02. Included within net cash inflow from operations were exceptional cash outflows of £248 million, £328 million, and £103 million in 2003/04, 2002/03 and 2001/02 respectively.
Net cash inflow from operations before exceptional items was £3,058 million in 2003/04 compared with £3,154 million in 2002/03 and £2,394 million in 2001/02. The net cash inflow from operations before exceptional items in 2003/04 was £96 million lower than 2002/03, reflecting higher US related pension payments, adverse exchange rate variancies, and higher commodity costs that are expected to be recovered next year, partially offset by other favourable movements in working capital.
Annual Report and Accounts 2003/04_National Grid Transco 41
Back to Contents
Financial Review_continued
The 2002/03 increase in net cash flow from operations before exceptional items reflected the first full-year contribution from Niagara Mohawk. Exceptional cash flows in 2003/04 and 2001/02 related principally to cash flows that arose from restructuring initiatives and environmental expenditure while those relating to 2002/03 also included Merger-related costs.
Payments to the providers of finance, in the form of dividends and interest, totalled £1,252 million (net) in 2003/04 compared with £1,483 million in 2002/03 and £1,183 million in 2001/02. Net interest cash outflows increased from £696 million in 2001/02 to £901 million in 2002/03 and fell to £686 million in 2003/04. The increase between 2001/02 and 2002/03 primarily reflected the additional net interest expense incurred for a full year following the acquisition of Niagara Mohawk. The reduction in 2003/04 reflected the beneficial impact of refinancing debt, lower short-term interest rates and the weaker US dollar.
| Net corporate tax payments amounted to £18 million in 2003/04 compared with £112 million in 2002/03 and £212 million in 2001/02. Net corporate tax payments in 2003/04 were lower than in 2002/03, primarily as a result of: |
| • | the cessation of trade of 186k, referred to below, also reduced corporation tax payments in 2003/04; and |
| • | a repayment of corporate tax arising from the settlement of tax liabilities of around £44 million. |
| | |
| Net corporate tax payments in 2002/03 were lower than in 2001/02, mainly as a result of: |
| • | the cessation of trade of 186k which created balancing allowances that reduced UK corporation tax payable in 2002/03 by around £60 million; and |
| • | the interaction of the timing of UK corporation tax payments on account and the Lattice Group post-tax exceptional charge in 2002/03, that resulted in a reduction of around £40 million compared with 2001/02. |
Purchases of tangible and intangible fixed assets net of disposal proceeds absorbed cash of £1,254 million compared with £1,407 million in 2002/03 and £1,543 million in 2001/02.
The reduction of £153 million in purchases of tangible and intangible fixed assets net of disposal proceeds from 2002/03 to 2003/04 reflected lower purchases of fixed assets amounting to £118 million, primarily related to reduced capital expenditure by UK gas distribution and discontinued operations. This reduction has been partially offset by increased purchases in relation to the construction of the Basslink Interconnector and Isle of Grain LNG projects which are discussed on page 35. In addition, there was an increase in disposal proceeds of £35 million, mainly linked to the sale of property. Discontinued operations capital expenditure for 2002/03 related primarily to 186k and The Leasing Group, which were disposed of during 2002/03.
The reduction in net cash outflow between 2001/02 and 2002/03 primarily reflected: reductions in UK gas distribution, UK electricity and gas transmission; the disposal of The Leasing Group which previously purchased commercial vehicles and other assets for the Group; and reduced expenditure on 186k assets; partially offset by increased capital expenditure arising from the acquisition of Niagara Mohawk.
Cash outflow in 2003/04 relating to the acquisition of Group undertakings and other investments amounted to £26 million compared with £165 million and £1,006 million in 2002/03 and 2001/02 respectively. Cash outflow in 2002/03 included £153 million related to the expected contractual funding obligations in respect of joint ventures. Cash outflows in 2001/02 of £1,006 million included £932 million (including overdrafts acquired) connected to the acquisition of Niagara Mohawk.
Cash inflow from the disposal of investments in 2003/04 amounted to £33 million compared with 2002/03 of £328 million and £37 million in 2001/02. The 2002/03 inflow related primarily to the receipt of £157 million in respect of the full settlement of deferred payment arrangements arising from the sale of nuclear plant conducted before the completion of the acquisition of Niagara Mohawk, £53 million from the sale of other nuclear assets and £92 million from the sale of The Leasing Group.
During 2003/04, the Group terminated some cross currency swaps, resulting in a cash inflow of £148 million. As a result of this transaction, the underlying borrowing which had been hedged by these swaps was translated to sterling, at the prevailing spot rate, resulting in an increase in net sterling borrowing of £140 million. Consequently, the impact of the termination of cross currency swaps on net debt was insignificant.
During 2002/03, the Group purchased for cancellation 24.2 million shares resulting in a cash outflow of £97 million.
Equity shareholders’ funds
Equity shareholders’ funds rose from £1,113 million (restated) at 31 March 2003 to £1,213 million at 31 March 2004. This increase was mainly explained by the retained profit for the year of £490 million, partially offset by net foreign exchange adjustments amounting to £417 million, primarily related to the retranslation of US dollar denominated net assets and associated hedges.
Capital expenditure
Capital expenditure in 2003/04 was £1,481 million compared with £1,520 million in 2002/03 and £1,847 million in 2001/02. The total level of capital expenditure for continuing operations of £1,481 million in 2003/04 was higher than capital expenditure for 2002/03 (continuing operations) by £56 million, this reflected higher capital expenditure: in constructing the Basslink Interconnector and Isle of Grain LNG; within US electricity distribution; and within UK electricity and gas transmission. The higher capital expenditure was partially offset by a fall in capital expenditure within UK gas distribution.
The lower level of capital expenditure for 2002/03 compared with 2001/02 reflected a lower level of capital expenditure relating to UK gas distribution and UK electricity and gas transmission and reduced capital expenditure relating to discontinued operations.
The operating review on pages 25 to 35 contains a discussion of any significant variance between years relating to capital expenditure by reporting segment and provides details of any material capital expenditure programmes.
Net debt and gearing
Net debt fell from £13,878 million at 31 March 2003 to £12,632 million at 31 March 2004, primarily as a result of: the impact of the depreciation of the US dollar against sterling on
42 National Grid Transco_Annual Report and Accounts 2003/04
Back to Contents
Financial Review_continued
US dollar denominated net debt (excluding the impact of cross currency swaps – £140 million loss) amounting to £674 million; cash flows (excluding the impact of cross currency swaps – £148 million) of £339 million; and the settlement of the EPICs bond on 6 May 2004 amounting to £243 million.
The composition of net debt at 31 March 2004 is shown in note 27 to the accounts on page 102.
Gearing at 31 March 2004, calculated as net debt at that date expressed as a percentage of net debt plus net assets shown by the balance sheet, amounted to 91%, compared with 92% at 31 March 2003. By comparison, the gearing ratio, adjusted for the inclusion of UK regulated businesses at their estimated regulatory asset values (‘adjusted gearing ratio’), amounted to 55% at 31 March 2004 compared with 59% at 31 March 2003.
The Group believes this adjusted ratio is a more relevant measure of gearing than one based on book values alone, because the book values do not reflect the economic value of the UK regulated business assets. A reconciliation of the adjustments necessary to calculate adjusted net assets is shown in the table below:
| Adjustment to net assets | 2004 | | 2003 | |
| | | | (restated) | |
| | £m | | £m | |
|
|
|
| |
| Net assets per balance sheet | 1,263 | | 1,197 | |
| Adjustment for increase in UK business regulatory values | 8,900 | | 8,570 | |
|
|
|
| |
| Adjusted net assets | 10,163 | | 9,767 | |
|
|
|
| |
As a registered holding company, under the US Public Utility Holding Company Act of 1935 (PUHCA), National Grid Transco operates under certain regulatory restrictions applied by the SEC. As a result, the scope of the financing activity of the Group is limited to specific areas that are authorised from time to time, such authorisation being currently set sufficient to cover all normal requirements. In addition, the Company is required to maintain its consolidated common stock equity as a percentage of its total consolidated capitalisation (defined in general as common stock equity plus preferred stock plus gross debt) measured on a book value (US GAAP) basis at 30% or above. At 31 March 2004, this ratio stood at 41.3%.
Cash flow forecasting
Both short- and long-term cash flow forecasts are produced frequently to assist in identifying the liquidity requirements of the Group.
These forecasts are supplemented by a financial headroom position that is supplied to the Finance Committee of the Board regularly to demonstrate funding adequacy for at least a 12-month period. The Group also maintains a minimum level of committed facilities in support of that objective.
Credit facilities and unutilised Commercial Paper and Medium Term Note Programmes
The Group has both committed and uncommitted facilities that are available for general corporate purposes.
At 31 March 2004, National Grid Transco had a US$2.0 billion US Commercial Paper Programme (US$1.35 billion unutilised); National Grid Company plc had a US$1.0 billion US Commercial Paper Programme (unutilised) and a US$1.0 billion Euro Commercial Paper Programme (unutilised); and National Grid Transco and National Grid Company plc had a joint Euro Medium Term Note Programme of €6 billion (€3.8 billion unissued). Transco plc had a US$2.5 billion US Commercial Paper Programme (unutilised) and a US$1.25 billion Euro Commercial Paper Programme (US$0.9 billion unutilised); and Transco plc and Transco Holdings plc had a joint Euro Medium Term Note Programme of €7.0 billion (€2.6 billion unissued).
At 31 March 2004, the Group in the UK had £1.22 billion and $1.49 billion of short-term (364 day) committed facilities (undrawn), £0.58 billion of long-term committed facilities (undrawn) and £1.0 billion of uncommitted borrowing facilities (undrawn). The short-term committed facilities include an option to extend these facilities.
The National Grid USA Group had committed facilities of $439 million, all of which were undrawn at 31 March 2004. These facilities provide liquidity support for the subgroup New England Power Company’s tax-exempt debt programme.
In addition to the above facilities, at 31 March 2004, Basslink had a A$630 million loan facility (A$362 million undrawn) and Isle of Grain LNG had a £30 million facility of which £15 million remained undrawn.
Note 21 to the accounts on page 95 shows the maturity profile of all undrawn committed borrowing facilities of the Group in sterling at 31 March 2004.
Treasury policy
The funding and treasury risk management of the Group is carried out by a central department operating under policies and guidelines approved by the Board. The Finance Committee, a committee of the Board, is responsible for regular review and monitoring of treasury activity and for approval of specific transactions, the authority for which may be delegated. The Group has a Treasury function that raises all the funding for the Group and manages interest rate and foreign exchange rate risk.
The Group has separate financing programmes for each of the main Group companies. The Finance Committee of the Board and the Finance Committee of the appropriate Group undertaking approve all funding programmes.
The Treasury function is not operated as a profit centre. Debt and treasury positions are managed in a non-speculative manner, such that all transactions in financial instruments or products are matched to an underlying current or anticipated business requirement.
The use of derivative financial instruments is controlled by policy guidelines set by the Board. Derivatives entered into in respect of gas and electricity commodities are used in support of the business’ operational requirements and the policy regarding their use is explained on page 45.
As a result of PUHCA and other US regulatory limits applicable to certain US companies in the Group, the freedom of these companies to provide financing among themselves is restricted. Nevertheless, external financings or other arrangements are in place to ensure that Group companies have adequate access to short-term liquidity.
The Group had borrowings outstanding at 31 March 2004 amounting to £13,248 million. The table on page 46 shows the expected maturity of these and other contractual obligations.
Annual Report and Accounts 2003/04_National Grid Transco 43
Back to Contents
Financial Review_continued
The Group has in place appropriate committed facilities, and believes that the maturing amounts in respect of its contractual obligations as shown on page 46 can be met from these facilities, operating cash flows and other refinancings that it reasonably expects to be able to secure in the future. The Group’s financial position enables it to borrow on the wholesale capital and money markets and most of its borrowings are through public bonds and commercial paper.
The Group places surplus funds on the money markets usually in the form of short-term fixed deposits that are invested with approved banks and counterparties. Details relating to the Group’s cash, short-term investments and other financial assets at 31 March 2004 are shown in note 21 to the accounts on page 94.
There exists within the Group different credit rated entities. For example, National Grid Company plc has a credit rating of A2/A. Transco plc has a credit rating of A2/A. Transco Holdings plc has been separately rated A3/A-. National Grid Transco has a credit rating of Baa1/A-.
It is a condition of the regulatory ring-fences around National Grid Company plc, Transco plc and Transco Holdings plc that they use reasonable endeavours to maintain an investment grade credit rating. It is also an SEC requirement that National Grid Transco maintains an investment grade credit rating. At these ratings, the principal borrowing entities of the Group should have ready access to the capital and money markets for future funding when necessary.
The main risks arising from the Group’s financing activities are set out below. The Board and the Finance Committee review and agree policies for managing each risk and they are summarised below.
Refinancing risk management
The Board mainly controls refinancing risk by limiting the amount of financing obligations (both principal and interest) arising on borrowings in any 12-month and 36-month period. This policy restricts the Group from having an excessively large amount of debt to refinance in a given time-frame. During the year, a mixture of short-term and long-term debt was issued.
Interest rate risk management
The interest rate exposure of the Group arising from its borrowings and deposits is managed by the use of fixed and floating rate debt, interest rate swaps, swaptions and forward rate agreements. The Group’s interest rate risk management policy is to seek to minimise total financing costs (ie interest costs and changes in the market value of debt) subject to constraints so that, even with large movements in interest rates, neither the interest cost nor the total financing cost can exceed pre-set limits. Some of the bonds in issue from National Grid Company plc and Transco Holdings plc are index-linked, ie their cost is linked to changes in the UK Retail Price Index (RPI). The Group believes these bonds provide a good hedge for revenues that are also RPI-linked under the price control formula.
The performance of the Treasury function in interest rate risk management is measured by comparing the actual total financing costs of its debt with those of a passively-managed benchmark portfolio.
Foreign exchange risk management
The Group has a policy of hedging certain contractually committed foreign exchange transactions over a prescribed minimum size. It covers 75% of such transactions expected to occur up to six months in advance and 50% of transactions in the six to 12-month period in advance. Cover generally takes the form of forward sale or purchase of foreign currencies and must always relate to underlying operational cash flows.
The principal foreign exchange risk to which the Group is exposed arises from assets and liabilities not denominated in sterling. In relation to these risks, the objective is to match the US dollar proportion of the Group’s financial liabilities to the proportion of its cash flow that arises in dollars and is available to service those liabilities.
Foreign exchange fluctuations will affect the translated value of overseas earnings. This translation has no impact on the cash flows of the Group, and accordingly is not hedged other than indirectly through the natural hedge of having foreign currency interest expense arising on currency denominated liabilities. Dividend flows may be hedged through matching with interest flows or by forward foreign exchange deals and options.
The currency and average interest rate composition of the Group’s financial liabilities and assets is shown in note 21 to the accounts on pages 93 and 94 respectively.
Counterparty risk management
Counterparty risk arises from the investment of surplus funds and from the use of derivative instruments. The Finance Committee has agreed a policy for managing such risk, which is controlled through credit limits, approvals and monitoring procedures.
Derivative financial instruments held for purposes other than trading
As part of its business operations, the Group is exposed to risks arising from fluctuations in interest rates and exchange rates. The Group uses off balance sheet derivative financial instruments (derivatives) to manage exposures of this type and as such they are a useful tool in reducing risk. The Group’s policy is not to use derivatives for trading purposes. Derivative transactions can, to varying degrees, carry both counterparty and market risk.
The Group enters into interest rate swaps to manage the composition of floating and fixed rate debt and so hedge the exposure of borrowings to interest rate movements. In addition, the Group enters into bought and written option contracts on interest rate swaps. These contracts are known as ‘swaptions’. The Group also enters into foreign currency swaps to manage the currency composition of borrowings and so hedge the exposure to exchange rate movements. Certain agreements are combined foreign currency and interest rate swap transactions. Such agreements are known as cross currency swaps.
The Group enters into forward rate agreements to hedge interest rate risk on short-term debt and money market investments. Forward rate agreements are commitments to fix an interest rate that is to be paid or received on a notional deposit of specified maturity, starting at a future specified date.
Valuation and sensitivity analysis
The Group calculates the fair value of debt and derivative instruments by discounting all future cash flows by the market yield curve at the balance sheet date. The market yield curve for each currency is obtained from the Reuters or
44 National Grid Transco_Annual Report and Accounts 2003/04
Back to Contents
Financial Review_continued
Bloomberg screen notes for interest and foreign exchange rates. In the case of instruments with optionality, the Black’s variation of the Black-Scholes model is used to calculate fair value.
The valuation techniques described above for interest rate swaps and currency swaps are a standard market methodology. These techniques do not take account of the credit quality of either party but this is not considered to be a significant factor unless there is a material deterioration in the credit quality of either party.
In relation to swaptions, the Group only uses swaptions for hedging purposes with a European style exercise. As a consequence, the Black’s variation of the Black-Scholes model is considered to be sufficiently accurate for the purpose of providing fair value information in relation to these types of swaptions. More sophisticated valuation models exist but the Group does not believe it is necessary to employ these models, given the extent of its activities in this area.
The valuations obtained using the techniques described above are used for the purpose of disclosure of fair value information under UK GAAP as shown in note 21 to the accounts on page 95 and for recognition, where appropriate, under US GAAP as shown in notes 31 and 32 to the accounts commencing on page 105.
For debt and derivative instruments held, the Group utilises a sensitivity analysis technique to evaluate the effect that changes in relevant rates or prices will have on the market value of such instruments.
At 31 March 2004, the potential change in the fair value of the aggregation of long-term debt and derivative instruments, assuming an increase or decrease of 10% in the level of interest rates and exchange rates, was £(169) million and £174 million for interest rates and £(362) million and £443 million for exchange rates respectively.
Commodity price hedging
In the normal course of business, the Group is party to commodity derivatives. These have included indexed swap contracts, gas futures, electricity swaps, gas options, gas forwards and gas basis swaps that are principally used to manage commodity prices associated with its gas and electricity delivery operations. This includes the buying back of capacity rights already sold in accordance with the Group’s UK gas transporter licence and Network Code obligations.
These financial exposures are monitored and managed as an integral part of the Group’s financial risk management policy. At the core of this policy is a condition that the Group will engage in activities at risk only to the extent that those activities fall within commodities and financial markets to which it has a physical market exposure in terms and volumes consistent with its core business. The Group does not issue or intend to hold derivative instruments for trading purposes, and holds such instruments consistent with its various licence and regulatory obligations in the UK and US.
As a result of the restructuring of the electricity industry in New York State during 1998, Niagara Mohawk replaced existing power purchase agreements with indexed swap contracts that expire in June 2008. The indexed swaps and fossil fuel plant swaps are the subject of regulatory rulings that allow the gains and losses to be passed on to customers.
At 31 March 2004, the Group had liabilities of £391 million in respect of the indexed swap contracts and has recorded a corresponding regulatory asset. The asset and liability will be amortised over the remaining term of the swaps as nominal energy quantities are settled and will be adjusted as periodic reassessments are made of energy prices. A 10% movement in the market price of electricity would result in a £37 million movement in the value of the indexed linked swap contracts assuming the US dollar to sterling exchange rate of $1.83 to £1.00. There would be no impact on earnings as there would be a corresponding movement in the book value of the related regulatory asset.
The fair value of the indexed linked swap contracts is based on the difference between projected future market prices and projected contract prices as applied to the notional quantities stated in the contracts and discounted using a US LIBOR rate curve to the current present value.
Payments made by Niagara Mohawk under indexed swap contracts are affected by the price of natural gas. Niagara Mohawk uses New York Mercantile Exchange (NYMEX) gas futures as hedges to mitigate this impact. The futures contracts are derivative instruments with gains and losses deferred as an offset to the corresponding increases and decreases in the swap payments. As at 31 March 2004, the last options to which Niagara Mohawk was counterparty expired and there were no open option positions outstanding at this date. Niagara Mohawk is not currently using options to hedge its gas commodity. Gains relating to gas futures at 31 March 2004 were not material and, as a result of regulatory treatments, have no impact on earnings.
Niagara Mohawk’s gas rate agreement allows for collection of the commodity cost of natural gas sold to customers. The regulator also requires that actions be taken to limit the volatility in gas prices passed on to customers. Niagara Mohawk meets this requirement through the use of NYMEX gas futures and combinations of NYMEX call and put options structured as ‘collars’. These contracts are hedges of Niagara Mohawk’s natural gas purchases. Gains and losses are deferred until the month that the hedged contract settles. At 31 March 2004, deferred gains on these contracts were immaterial in the context of the Group as a whole.
The UK gas transmission operation is obliged to offer for sale through a series of auctions (both short- and long-term) a pre-determined quantity of entry capacity for every day in the year at predefined locations. Where, on the day, the gas transmission system’s capability is constrained, such that gas is prevented from entering the system for which entry capacity rights have been sold, then UK gas transmission is required to buy back those entry capacity rights sold in excess of system capability. Forward and option contracts are used to reduce the risk and exposure to on-the-day entry capacity prices.
UK electricity transmission operations have also entered into electricity options, pursuant to the requirement to stabilise the electricity market in England and Wales through the operation of the New Electricity Trading Arrangements (NETA). The options are for varying terms and have been entered into so that the Group has the ability to
Annual Report and Accounts 2003/04_National Grid Transco 45
Back to Contents
Financial Review_continued
deliver electricity as required to meet its obligations under the electricity transmission licence. The Group has not and does not expect to enter into any significant derivatives in connection with its NETA role.
Commitments, contingencies and litigation
Commitments and contingencies
The Group’s commitments and contingencies outstanding at 31 March are summarised in the table below:
| Commitments and contingencies | 2004 | | 2003 | |
| | £m | £m |
|
|
|
| |
| Future capital expenditure contracted for but not provided | 448 | | 664 | |
| Total operating lease commitments | 478 | | 476 | |
| Power commitments | 5,555 | | 6,675 | |
| Other commitments, contingencies and guarantees | 263 | | 221 | |
|
|
|
| |
Pages 37 and 38 give information regarding the Group’s obligations under pension and other post-retirement benefits.
The power commitments shown in the Commitments and contingencies table above reflect the Group’s obligation to purchase energy under long-term contracts. To the extent that power commitment obligations exceed the above market values that are attributable to these contracts, the net present value of these amounts is reflected in creditors and is not shown in this table. At 31 March 2004, the component of power commitments representing the above market value amounts included within creditors, amounts falling due within one year and amounts falling due after more than one year totalled £57 million (31 March 2003: £68 million) and £149 million (31 March 2003: £253 million) respectively.
The Group proposes to meet all of its commitments from operating cash flows, existing credit facilities, and future facilities and other financing that it reasonably expects to be able to secure in the future.
Contractual obligations at 31 March 2004
The table of contractual obligations shown below analyses the long-term contractual obligations of the Group according to its payment period. Purchase obligations reflect the Group’s commitments under power commitments (excluding the above market amounts) and future capital expenditure contracted for but not provided. The other long-term liabilities reflected in the balance sheet at 31 March 2004 comprise the net present value of purchase power obligations in respect of above market amounts; liability for indexed linked swap contracts; and other creditors that represent contractual obligations falling due after more than one year.
Off balance sheet arrangements
With the exception of derivative financial instruments used for the purpose of managing risks associated with fluctuations in interest rates, exchange rates, and commodity prices, described on pages 44 to 46, the Group does not have any other off balance sheet arrangements that have or are likely to have any current or future effect on the financial condition, changes in financial condition, revenues or expenses, results of operations, liquidity, capital expenditures or capital resources that are material.
Note 21 to the accounts on page 95 provides fair value information in relation to all off balance sheet derivative financial instruments used by the Group.
| Contractual obligations | | | Less than | | | | | | More than | |
| | Total | one year | 1-3 years | 3-5 years | 5 years |
|
|
|
|
|
|
|
|
|
| |
| Total borrowings | 13,248 | | 1,706 | | 2,920 | | 2,033 | | 6,589 | |
| Operating lease commitments | 478 | | 59 | | 85 | | 63 | | 271 | |
| Purchase obligations | 6,003 | | 1,389 | | 1,345 | | 1,134 | | 2,135 | |
| Other long-term liabilities reflected in the balance sheet at 31 March 2004 | 699 | | 199 | | 298 | | 154 | | 48 | |
|
|
|
|
|
|
|
|
|
| |
| Total | 20,428 | | 3,353 | | 4,648 | | 3,384 | | 9,043 | |
|
|
|
|
|
|
|
|
|
| |
Details of material litigation to which the Group was a party at 31 March 2004
Following a fatal accident in Larkhall, Lanarkshire in December 1999 in which four people died, Transco faces charges alleging breaches of sections 3 and 33 of the Health & Safety at Work Act 1974. The case is currently listed for trial in Edinburgh commencing on 27 September 2004. The maximum penalty for breach of either of the above sections is an unlimited fine.
Regulatory authorities from Rhode Island, New Hampshire and Massachusetts have expressed an intent to challenge the reasonableness of a transaction entered into by National Grid USA, in connection with the sale of its interest in the Millstone 3 nuclear unit in 2001.
The Group has received notification of violations of US air pollution laws relating to the operation of two coal-fired generation plants, formerly owned by Niagara Mohawk. As a consequence, the State of New York is seeking substantial fines against the Group and the current owners of these generation plants. The Group is resisting these claims and is pursuing a related dispute between it and the purchaser of these plants.
Further details of litigation and other material disputes are contained within note 29 to the accounts on page 104.
Critical accounting policies
The Group accounts are prepared in accordance with UK GAAP. The Group’s accounting policies are described on pages 71 to 73 of the accounts.
Management is required to make estimates and assumptions that may affect the reported amounts of assets, liabilities, revenue, expenses and the disclosure of contingent assets and liabilities in the accounts. For example, the estimates and judgements used to calculate the provision for doubtful debts will impact on the carrying value of debtors and on the charge for bad debt expense. The following matters are considered to have a critical impact on the accounting policies adopted by the Group.
Estimated asset economic lives
The adoption of particular asset economic lives in respect of goodwill and tangible fixed assets can materially affect the reported amounts for goodwill amortisation and depreciation of tangible fixed assets.
46 National Grid Transco_Annual Report and Accounts 2003/04
Back to Contents
Financial Review_continued
Goodwill, under UK GAAP, is principally being amortised over 20 years, and the economic lives of tangible fixed assets are disclosed in ‘Accounting policies – e) Tangible fixed assets and depreciation’ on page 71. The adoption of particular economic lives involves the exercise of judgement and can materially affect the profit and loss account. For the year ended 31 March 2004, the Group profit and loss account reflected goodwill amortisation and depreciation of tangible fixed assets amounting to £99 million and £866 million respectively.
In businesses such as ours, which are capital intensive in nature and have long tangible fixed asset lives, goodwill is similarly expected to have a long asset life. Therefore, goodwill is amortised over a long life, typically 20 years. If goodwill were amortised over 10 or 30 years, the impact on goodwill amortised would be to increase or reduce goodwill amortisation by approximately £100 million and £30 million per annum respectively. This sensitivity assumes the average UK/US exchange rate as applied in 2003/04. Goodwill is not amortised under US GAAP but is subject to regular impairment reviews.
Because of the different accounting that applied to the National Grid and Lattice merger under UK and US GAAP, no goodwill was created in respect of this transaction under UK GAAP. Conversely, under US GAAP, the Merger was accounted for as an acquisition and goodwill was recognised. This accounting is explained further – see ‘US GAAP reporting’ on page 49.
Impairment of fixed assets
Goodwill, fixed asset investments and tangible fixed assets are reviewed for impairment in accordance with UK GAAP. Future events could cause these assets to be impaired, resulting in an adverse effect on the future results of the Group.
Reviews for impairments are carried out under UK GAAP in the event that circumstances or events indicate the carrying value of fixed assets may not be recoverable. Examples of circumstances or events that might indicate that impairment had occurred include: a pattern of losses involving the fixed asset; a decline in the market value for a particular fixed asset; and an adverse change in the business or market in which the fixed asset is involved.
When a review for impairment is carried out under UK GAAP, the carrying value of the asset, or group of assets if it is not reasonably practicable to identify cash flows arising from an individual fixed asset, is compared with the recoverable amount of that asset or group of assets. The recoverable amount is determined as being the higher of the expected net realisable value or the present value of the expected cash flows attributable to that asset or groups of assets. The discount rate used to determine the present value is an estimate of the rate the market would expect on an equally risky investment and is calculated on a pre-tax basis. Estimates of future cash flows relating to particular assets or groups of assets involve exercising a significant amount of judgement.
During the year ended 31 March 2004, reviews for impairments were carried out in respect of goodwill in general, and other assets attributable to Advantica, telecoms, metering, interconnectors and LNG. With the exception of Advantica and some telecoms related assets, which recorded impairment charges of £20 million within restructuring costs, no other impairment charges have been recorded.
For US GAAP reporting purposes goodwill is reviewed for impairment on an annual basis, including the goodwill recognised in respect of the Lattice acquisition. Some goodwill has been impaired relating to Advantica, which was acquired as part of the Lattice acquisition, and this is referred to further under ‘US GAAP reporting’ on page 50.
Replacement expenditure
This expenditure represents the cost of planned maintenance on gas mains and services assets, the vast majority of which relate to the Group’s UK gas distribution business. This expenditure is principally undertaken to maintain the safety of the gas network in the UK and is written off to the profit and loss account as incurred, as such expenditure does not enhance the economic performance of those assets. If such expenditure in the future were considered to enhance these assets, it would be capitalised and treated as an addition to tangible fixed assets, thereby significantly affecting the reporting of future results.
The total amount charged to the profit and loss account in respect of replacement expenditure during the year ended 31 March 2004 was £388 million. This accounting policy only materially affects the results of the UK gas distribution segment.
Under US GAAP, this expenditure is capitalised and depreciated over its expected useful life. The US GAAP accounting policy is shown in note 32 to the accounts ‘Fixed assets – impact of Lattice purchase accounting and replacement expenditure’ on page 116.
Regulatory assets
These assets are recorded in the accounts under UK GAAP in accordance with the principles of SFAS 71 ‘Accounting for the Effects of Certain Types of Regulation’, a US GAAP accounting standard. If the principles of SFAS 71 were not applicable, it is likely that this would result in the full or partial non-recognition of these assets, and thereby materially alter the view given by the accounts.
In applying the principles of SFAS 71, UK GAAP measurement principles are followed in the preparation of the Group’s UK GAAP results. Regulatory assets under UK GAAP are only recognised if a US GAAP regulatory asset has already been recognised, but UK GAAP measurement principles are followed with only those regulatory assets arising as a result of a past transaction or event being recorded. Regulatory assets are only recognised in respect of US activities and primarily relate to the US electricity distribution segment.
The total carrying value of regulatory assets, under UK GAAP, at 31 March 2004 amounted to £3,111 million.
Turnover
Turnover includes an assessment of energy and transportation services supplied to customers between the date of the last meter reading and the year end. Changes to the estimate of the energy or transportation services supplied during this period would have an impact on the reported results of the Group.
Estimates of energy supplied are based on a combination of known energy purchases and the historical pattern of billings information. These estimates only affect US electricity transmission, US electricity distribution and US gas activities.
Annual Report and Accounts 2003/04_National Grid Transco 47
Back to Contents
Financial Review_continued
Turnover in respect of transportation services supplied comprises amounts invoiced to shippers plus an estimate for transportation services supplied but not yet invoiced, which substantially represent the transportation services supplied in respect of the last month of the year. The estimated element of turnover is determined as the total of commodity services supplied, calculated from the actual volume of gas transported at estimated weighted average prices, based on recent history and the value of capacity services supplied, which are contracted amounts. This estimate affects the UK gas distribution and UK electricity and gas transmission segments.
Under UK GAAP, the Group is not permitted to recognise and has not recognised any liability for amounts received or receivable from customers in excess of the maximum amount allowed for the year under regulatory agreements that will result in an adjustment to future prices. Under US GAAP, such liabilities are recognised.
Pensions and other post-retirement benefits
The cost of providing pensions and other post-retirement benefits is charged to the profit and loss account on a systematic basis over the service lives of the employees in the scheme in accordance with SSAP 24. A new UK accounting standard (FRS 17) will eventually replace existing UK GAAP and significantly change the measurement and disclosure of pension and other post-retirement costs in the Group accounts.
Pension and other post-retirement benefits are inherently long term, and future experience may differ from the actuarial assumptions used to determine the net charge for ‘pension and other post-retirement charges’. Note 7 to the accounts on page 82 describes the principal assumptions that have been used to determine the pension and post-retirement charges in accordance with current UK GAAP. The calculation of any charge relating to ‘pensions and other post-retirement benefits’ is clearly dependent on the assumptions used, which reflects the exercise of judgement. Management exercises that judgement having regard to independent actuarial advice.
As shown in note 7 to the accounts on pages 83 and 84, the application of the measurement principles of FRS 17 would significantly affect the results of the Group, reducing the pre exceptional net charge for ‘pensions and other post-retirement benefits’ by £72 million (pre-tax).
Restructuring costs
The application of UK GAAP measurement principles results in the recognition of restructuring costs, mainly redundancy related, when the Group is irrevocably committed to the expenditure, with the main features of any restructuring plan being communicated to affected employees. If material, these costs are recognised as exceptional.
Restructuring costs recognised by the Group are referred to in ‘Exceptional items’ for each year and are discussed earlier in this Financial Review.
Under US GAAP, redundancy costs arising from the Group’s voluntary severance arrangements are only recognised when the employee accepts the voluntary severance offer. As a result, there is a difference in timing in the recognition of these costs between UK and US GAAP.
Derivative financial instruments
Derivatives are used by the Group to manage its interest rate, foreign currency and commodity price risks in respect of expected energy usage. All such transactions are undertaken to provide a commercial hedge of risks entered into by the Group.
UK GAAP applies an ‘historical cost’ and ‘hedge accounting’ model to these derivatives. Substantially, this model results in gains and losses arising on derivatives being recognised in the profit and loss account or statement of total recognised gains and losses at the same time as the gain or loss on the item being hedged is recognised. Indexed linked swap contracts are carried in the UK GAAP balance sheet within creditors, with a total liability amounting to £391 million at 31 March 2004. The best estimate of this liability was the estimated market value of the swaps at 31 March 2004 determined on the basis of the technique discussed on page 45.
The application of a ‘fair value’ model would result in derivatives being marked to market. Gains or losses relating to these derivatives may or may not be recognised in the profit and loss account or statement of total recognised gains and losses at the same time as any related gains or losses on underlying economic exposures, depending upon whether the derivatives are deemed to have a hedging relationship.
Note 21 to the accounts on pages 93 to 95 gives a significant amount of detail relating to the Group’s financial instruments. This includes the identification of the difference between the ‘carrying value’ and fair value of the Group’s financial instruments, including derivatives.
International Financial Reporting Standards and US GAAP both apply a fair value model to the recognition of gains and losses on derivatives.
The discussion on pages 44 and 45 dealing with derivatives (including commodity derivatives) refers to the manner in which fair values are established and used for the purposes of disclosure under UK GAAP and recognition under US GAAP.
Environmental liabilities
Provision is made for liabilities arising from environmental restoration and remediation costs relating to various sites owned by the Group. The calculation of this provision is based on estimated cash flows relating to these costs discounted at an appropriate rate where the impact of discounting is material. The total costs and timing of cash flows relating to environmental liabilities are based on management estimates supported by the use of external consultants. There may be variances from these amounts that could materially affect future results as demonstrated by the recognition of additional exceptional environmental costs during 2003/04, which arose as a result of a UK site investigation – see ‘Exceptional items –2003/04’ on page 36.
International Financial Reporting Standards
An ‘International Accounting Standards Regulation’ was adopted by the Council of the European Union (EU) in June 2002. This regulation requires all EU companies listed on an EU stock exchange to use ‘endorsed’ International Financial Reporting Standards (IFRS), published by the International Accounting Standards Board (IASB), in drawing up their financial statements for accounting periods beginning on or after 1 January 2005. The IASB published 15 revised standards in December 2003 and issued four new standards and two revised standards in the first quarter of 2004.
48 National Grid Transco_Annual Report and Accounts 2003/04
Back to Contents
Financial Review_continued
This completes the set of standards which are likely to be required to be adopted in 2005. A process of endorsement of IFRSs has been established by the EU for completion in sufficient time to allow adoption by companies in 2005. The Group’s first full financial statements to be produced under IFRS will be for the year ending 31 March 2006.
The Group has established a plan to achieve a smooth transition to IFRS. This plan involves examining all implementation aspects, including changes to accounting policies, systems impacts and the wider business issues that arise from such a change. We expect that the Group will be fully prepared for the transition in 2005. However, the adoption of particular standards is dependent upon the completion of the standard-setting process by the IASB and the endorsement of such standards by the EU.
The Group has not yet determined the full effects of adopting IFRS. Our preliminary view is that the major differences between our current accounting practice and IFRS will be in respect of hedge accounting, accounting for business combinations (including the accounting treatment of goodwill) and share-based payments. In addition, the Group is still evaluating the impact of adopting IFRS with regard to the accounting for regulatory assets, pensions, taxation and replacement expenditure.
Related party transactions
The Group provides services to and receives services from its related parties. In the year ended 31 March 2004, the Group charged £6 million and received charges of £25 million from its related parties. Further information relating to related party transactions is contained within note 28 to the accounts on page 102.
Changes and developments
Any significant changes and developments that have occurred since 31 March 2004 have been noted in this Annual Report and Accounts 2003/04.
Going concern
Having made enquiries, the Directors consider that the Company and the Group have adequate resources to continue in business for the foreseeable future and that it is therefore appropriate to adopt the going concern basis in preparing the accounts.
US GAAP reporting
The accounts have been prepared in accordance with UK GAAP, which differs in certain significant respects from US GAAP. The US GAAP accounting information in note 32 to the accounts on pages 112 to 120 gives a summary of the main differences between the amounts determined in accordance with the Group’s accounting policies (based on UK GAAP) and those determined in accordance with US GAAP. In addition, summary income statements, summary balance sheets, summary cash flows and a reconciliation of net income and equity shareholders’ funds from UK to US GAAP are provided in note 31 to the accounts on pages 105 to 112.
The comparative figures for discontinued operations and continuing operations have been restated for 2001/02 for US GAAP reporting purposes. This restatement does not affect UK GAAP reported figures. This restatement arises because the results of operations relating to joint ventures and associate, from which the Group has now exited and which were treated as discontinued operations under UK GAAP, were reported as part of discontinued operations under US GAAP. This treatment is not permitted under US GAAP as these results should have been reported as part of the interest in equity accounted affiliates. The net loss or income reported under US GAAP for 2001/02 was not affected by this restatement.
The effect of this restatement is to reclassify an amount of net loss of £857 million for 2001/02 from discontinued operations to continuing operations through a restatement of the interest in equity accounted affiliates. Earnings per share for continuing and discontinued operations have similarly been restated. The discussion of results relating to 2001/02 has been amended to reflect this restatement.
As referred to earlier, UK GAAP merger accounting principles have been adopted in accounting for the business combination of National Grid and Lattice. Under US GAAP, acquisition accounting principles were applied to the business combination, which is a fundamentally different method of accounting from merger accounting. Under US GAAP, National Grid is viewed as the acquirer of Lattice, and as a result the separately identifiable net assets attributable to Lattice were fair valued at the date of acquisition on 21 October 2002.
A further consequence of acquisition accounting, in contrast to merger accounting, is that the results of the Group under US GAAP only include the results of Lattice with effect from the date of acquisition. Therefore, under US GAAP, in respect of the Group results for the three years ended 31 March 2004, Lattice results only feature in the period from 21 October 2002 to 31 March 2004. In addition, because fair values were attributed to Lattice’s separately identifiable net assets, rather than the book values as used in merger accounting, goodwill was recognised.
Final goodwill amounting to £3,824 million was recognised under US GAAP relating to the acquisition of Lattice by National Grid. No goodwill was recognised under UK GAAP. The methodology for determining goodwill involved attributing fair values to separately identifiable net assets and valuing the consideration, primarily National Grid Transco shares, at fair value. This process is described in note 32 to the accounts on page 112.
Individually, the most significant adjustment to establish the fair value of the net assets acquired were the fair values attributed to property, plant and equipment (PPE). Within this adjustment, the most significant element accounting for 94% of the total adjustment to PPE related to Transco. Management determined the appropriate adjustment to be made and no external specialists were used. Management believes that its knowledge of the UK regulatory environment within which Transco operates is superior to that of external specialists and therefore it was better qualified to estimate the relevant fair values.
Net income from continuing operations for 2003/04 under US GAAP was £998 million (2002/03: £790 million; 2001/02: £152 million (net loss)). The US GAAP results for 2003/04, 2002/03 and 2001/02 included losses relating to discontinued operations amounting to £nil; £39 million; and £1 million respectively. Consequently, net income for 2003/04 under US GAAP was £998 million (2002/03: £751 million; 2001/02: £167 million (net loss)). This compared with the net income/(loss) under UK GAAP for 2003/04, 2002/03 and 2001/02 of £1,099 million; £391 million; and £321 million (net loss) respectively.
Equity shareholders’ funds under US GAAP at 31 March 2004 were £9,821 million (31 March
Annual Report and Accounts 2003/04_National Grid Transco 49
Back to Contents
Financial Review_continued
2003: £9,426 million) compared with £1,213 million (31 March 2003: £1,113 million (restated)) under UK GAAP.
Because the application of merger accounting principles under UK GAAP has fundamentally affected the comparison of UK GAAP results with US GAAP results, the following is a discussion of the impact the application of US GAAP has had on the results, which should be read in conjunction with the Operating Review on pages 25 to 35 and the rest of this Financial Review.
| The treatment of Lattice as an acquisition under US GAAP has significantly affected the UK electricity and gas transmission segment, UK gas distribution segment, and ‘Other’, as compared with the treatment under UK GAAP. The remaining segments are unaffected by differences between merger and acquisition accounting principles. Consequently, this has impacted on the results of the segments, as follows: |
| • | the results of the UK electricity and gas transmission segment for 2001/02 under US GAAP relate solely to UK electricity activities, excluding the impact of any gas transmission activity, which is shown under UK GAAP. UK gas transmission impacted on the UK electricity and gas transmission from the date of acquisition on 21 October 2002 and contributed £94 million to operating profit for 2002/03. In 2003/04, the UK electricity and gas transmission segment contributed £686 million to operating profit; |
| • | UK gas distribution is a segment that was created following the acquisition of Lattice. As a result, there is no effect on the operating result of UK gas distribution for 2001/02 but the segment contributed £567 million and £771 million to operating profit for 2002/03 and 2003/04 respectively; and |
| • | similarly, the operating loss of £5 million for ‘Other’ in respect of 2001/02 relates solely to the activities of National Grid, which related primarily to the activities of Interconnectors, contracting and other costs incurred that were not attributable to business segments. In 2003/04 and 2002/03, the operating loss of ‘Other’ amounted to £8 million and £37 million respectively. |
Note 31 to the accounts on pages 105 to 112 show a summary income statement for 2003/04, 2002/03 and 2001/02 under US GAAP. These statements have reconciled the impact that material US GAAP adjustments have had on the UK GAAP income statement, including the impact of the elimination of all merger accounting (pooling of interests) adjustments under UK GAAP, and the inclusion of acquisition (purchase accounting) adjustments under US GAAP. The adjustments eliminating the pre-acquisition UK GAAP results affecting turnover and operating costs are much larger in 2001/02 than in 2002/03 or 2003/04, reflecting the fact that Lattice was acquired on 21 October 2002.
Some of the adjustments included within the US GAAP summary income statements and balance sheet substantially reflect reclassifications of items that are treated differently under UK GAAP and US GAAP, but that do not significantly impact on net income or net assets.
Under UK GAAP, the operating results of discontinued operations of Group undertakings are classified as part of total operating profit, whereas under US GAAP these amounts are shown net of any related interest and tax and shown as ‘net loss from discontinued operations’. In respect of the discontinued activities of joint ventures, under UK GAAP these activities are also classified as part of total operating profit, whereas under US GAAP these amounts are accounted for within ‘interest in equity accounted affiliates’. The share of equity affiliates’ operating profit/(loss), net interest, taxation, and minority interests are disclosed separately under UK GAAP, whereas under US GAAP, all these amounts are accounted for within ‘interest in equity accounted affiliates’.
Under UK GAAP, the results of Citelec, an equity accounted affiliate, is accounted for under hyper-inflationary accounting rules. Under US GAAP, the results of Citelec are not accounted for under hyper-inflationary accounting rules, but this does not give rise to any significant difference to the UK GAAP accounting, as Citelec has been impaired under US GAAP and is carried at £nil under US GAAP, as it is under UK GAAP.
The principal adjustments to UK GAAP net income that have had a net impact in arriving at US GAAP net income mainly relate to adjustments arising from the treatment of the Lattice business combination as an acquisition under US GAAP; the capitalisation of replacement expenditure under US GAAP; the adoption of a fair value model for the recognition of derivative financial instruments under US GAAP; and the non-amortisation of goodwill under US GAAP. There are other adjustments, and these are explained in more detail in note 31 and note 32 to the accounts on pages 105 to 120.
US GAAP applies a fair value model for the purposes of accounting for derivative financial instruments, and the Group applies a hedging strategy which meets UK GAAP requirements, but does not meet US GAAP hedge accounting requirements. This results in a much greater volatility in the US GAAP income statements.
The treatment of the business combination of Lattice as an acquisition by National Grid resulted in the recognition of provisional goodwill amounting to £3,813 million which, as a result of the finalisation of the fair value adjustments during 2003/04, was subsequently revised to £3,824 million, as referred to on page 49. The acquisition of Lattice required an allocation of the purchase price to the acquired assets and liabilities of Lattice. Final changes to the provisional fair values attributed to the net assets of Lattice at 31 March 2003 arose from amendments to PPE fair values and tax balances (discussed further in note 32 to the accounts on page 113), which were completed within one year of the date of acquisition. It is the application of these acquisition accounting adjustments that explains the vast majority of the increase in equity shareholders’ funds at 31 March 2004 from £1,213 million under UK GAAP to £9,821 million under US GAAP.
During 2003/04, the additional minimum pension liability recognised as required by SFAS 87 fell by £743 million to £840 million. Of this total movement of £743 million, £633 million has been recorded through other comprehensive income.
Following a review of goodwill and other long-lived assets for impairment during 2003/04, evidence of impairment of goodwill and other intangible assets relating to Advantica was revealed. This resulted in an additional impairment charge relating to these assets being incurred under US GAAP amounting to £31 million. These charges are recorded in respect of ‘Other’.
During 2001/02, the Group adopted SFAS 133 ‘Accounting for Derivative Instruments and Hedging Activities’. The impact of adopting this
50 National Grid Transco_Annual Report and Accounts 2003/04
Back to Contents
Financial Review_continued
standard is shown in the 2001/02 summary income statement prepared under US GAAP on page 108.
During 2002/03, the Group adopted SFAS 148 ‘Accounting for Stock-Based Compensation – Transition and Disclosure – an amendment of FASB Statement No 123’. Prior to the adoption of this standard, the Group had accounted for stock compensation in accordance with APB 25. The Group adopted the retrospective method of accounting as permitted by this standard.
| During 2003/04, the Group adopted the following US GAAP accounting standards to the extent necessary to comply with its reporting obligations in respect of this annual report: |
| • | SFAS 132 ‘Employers’ Disclosures about Pensions and Other Post-Retirement Benefits – an amendment of FASB Statements No 87, 88 and 106’ (SFAS 132); |
| • | SFAS 143 ‘Accounting for Asset Retirement Obligations’ (SFAS 143); |
| • | SFAS 150 ‘Accounting for Certain Financial Instruments with Characteristics of both Liabilities and Equity’ (SFAS 150); |
| • | FIN 46 ‘Consolidation of Variable Interest Entities, an interpretation of Accounting Research Bulletin (ARB) 51’ . |
The impact of SFAS 132, SFAS 143 and SFAS 150 is discussed in note 32 on page 120.
FIN 46 addresses the consolidation of entities for which control is achieved through means other than through voting rights (‘variable interest entities’ or ‘VIE’) by clarifying the application of ARB 51 ‘Consolidated Financial Statements’ to certain entities in which equity investors do not have the characteristics of a controlling financial interest or do not have sufficient equity at risk for the entity to finance its activities without additional subordinated financial support from other parties. FIN 46 provides guidance on how to determine when and which business enterprise (the ‘primary beneficiary’) should consolidate the VIE. In addition, FIN 46 requires that both the primary beneficiary and all other enterprises with a significant variable interest in a VIE make additional disclosures.
FIN 46 was revised in December 2003, following the issuance by the FASB of certain modifications to the original FIN 46. The disclosure provisions of FIN 46 are effective in all financial statements initially issued after 31 January 2003. FIN 46 is required to be immediately applied by all entities with a variable interest in a VIE created after 31 January 2003. A public foreign private issuer with a variable interest in a VIE created before 1 February 2003 is required to apply FIN 46 to that entity from 1 April 2004.
There have been no entities created since 31 January 2003 which fall within the scope of FIN 46 and therefore the application of FIN 46 has not had any material impact on the results or the financial condition of the Group. The impact of FIN 46 on future results is still being assessed in respect of the as yet unapplied provisions of the standard.
In January 2004, the FASB issued FASB Staff Position (FSP) 106-1 ‘Accounting and Disclosure Requirements Related to Medicare Prescription Drug, Improvement and Modernization Act of 2003 (the ‘Act’)’. This FSP addresses the accounting implications of the newly issued Act to an entity that sponsors a post-retirement healthcare plan that provides prescription drug benefits. This Act, signed into law in December 2003 in the United States, introduces a prescription drug benefit under Medicare as well as a federal subsidy to sponsors of certain retiree healthcare benefit plans. The FSP includes an election to defer accounting for the implications of this new law until specific authoritative guidance to address the accounting treatment has been issued. As such, as a result of the lack of the existence of such guidance, any measure included in these accounts of the accumulated post-retirement benefit obligation (APBO) or net periodic post-retirement benefit cost in the accounts or accompanying notes do not reflect the effect of the Act on the plan. Authoritative guidance, when issued, could require a change in previously reported information.
Other matters
Inflation
In the UK, the Group’s operating costs may be affected by inflation both in terms of potential cost increases and in terms of the regulatory revenue control, which is influenced by, among other things, movements in the UK Retail Price Index. While higher inflation would tend to increase the Group’s cost base, this impact would be more than offset by increased revenue allowed under the Group’s regulated revenue controls.
Higher inflation would increase the cost base of the Group’s US businesses. However, if there is a significant change in the rate of inflation, as measured by the change in the Gross Domestic Product Implicit Price Deflator, the regulatory settlements in Massachusetts, Rhode Island and New York allow for additional distribution revenue to be recovered from customers. In recent years, inflation in the UK and US has been relatively stable and has not significantly affected the period under review.
Seasonality
Although demand for electricity and gas can vary on a seasonal basis, the Group’s UK transmission turnover and adjusted earnings are not, generally speaking, subject to substantial seasonal variations, because the largest elements of UK transmission turnover relate to customers’ use of the transmission systems. Customers are charged for these services in a number of ways, some giving rise to variation in income over a financial year, but overall this typically provides for a relatively constant revenue stream over the course of the financial year.
UK gas distribution is subject to regulatory agreements governing the maximum revenue that should be billed in a financial year. The timings of the recognition of these revenues are such that typically 60% of total revenue would be recognised in the second half of the year.
US electricity transmission would normally provide for a relatively constant revenue stream over the course of a financial year. US electricity distribution and US gas would usually expect total revenues in the second half of the financial year to be higher than the first half, as a result of a higher demand for energy in the winter months.
Euro
In January 2002, the euro was introduced as the cash currency in 12 European Union countries. This has had a minimal impact on the operations of the Group.
Annual Report and Accounts 2003/04_National Grid Transco 51
Back to Contents
Directors’ Report and Operating and Financial Review
Corporate Governance and Risk Factors
Corporate governance
Combined Code statement of compliance
National Grid Transco is subject to the Combined Code on Corporate Governance that is appended to the Listing Rules of the UK Listing Authority. The Combined Code sets out principles and provisions relating to the good governance of companies.
The Combined Code has recently been subject to review (the Higgs Review of the role and effectiveness of non-executive directors) which resulted in the publication of a new Combined Code, applicable to financial years starting on or after 1 November 2003.
Throughout the year, National Grid Transco has complied with all of the relevant provisions set out in the Combined Code as applicable for financial years starting prior to 1 November 2003. Additionally, as at the date of this report, the Company complies with the relevant provisions of the new Combined Code as applicable for financial years starting on or after 1 November 2003. The following information is compiled in accordance with the new Combined Code.
The Board
The Board currently consists of 14 Directors comprising the Chairman, six Executive Directors (including the Group Chief Executive) and seven Non-executive Directors (including the Deputy Chairman and Senior Independent Director). Short biographical details of each of the Directors are included on pages 18 and 19.
There were two changes to the Executive Directors on the Board during the year. Nick Winser was appointed on 28 April 2003 as Group Director responsible for UK and US Transmission. John Wybrew retired on 30 November 2003, having previously been Group Corporate Affairs Director. His role was divided between the remaining Executive Directors and certain senior managers.
There were also two changes to the Non-executive members of the Board. Bonnie Hill retired on 21 July 2003 and Maria Richter was appointed on 1 October 2003.
It has been announced that Rick Sergel will retire at this year’s Annual General Meeting (AGM) being replaced on the Board by Mike Jesanis.
All Directors are required to be re-elected by shareholders at the AGM following their appointment by the Board and then at least once every three years. To ensure that a representative number of Directors are re-elected each year, one-third of Directors (excluding new appointments) must stand for re-election at each AGM.
In the opinion of the Board each of the Non-executive Directors is currently independent under the guidelines set out in the new Combined Code. This opinion is based on current participation and performance on both the Board and Board Committees including consideration of the length of service at National Grid Transco together with that at either Lattice or National Grid.
The main duties of the Chairman outside of the Group are included in his biography on page 18. During the year, the Chairman resigned as a Non-executive Director of Brambles Industries plc (October 2003). It has been announced that as from 1 June 2004 Sir John Parker will become the senior Non-executive Director designate of the Court of the Bank of England, taking over the chair in February 2005.
The Board is led by the Chairman whose role, along with that of the Group Chief Executive, has been set out and approved by the Board.
| In order to ensure effective control of the Group the Board restricts certain decisions to itself. |
| These matters reserved to the Board include: |
| • | establishing Board Committees, setting terms of reference, reviewing activities and where appropriate ratifying decisions; |
| • | internal control arrangements; |
| • | results announcements to stock exchanges where National Grid Transco shares are traded and the approval of the Annual Report and Accounts (in conjunction with the Audit Committee); |
| • | approval of the Group’s business plan; |
| • | overall Group business strategy; |
| • | approval of Group financial policy; and |
| • | matters of strategic importance likely to impact the Group. |
The Board manages these matters at its regular Board meetings and strategy days. It also receives reports and presentations from each of the operating divisions, key central functions and minutes and/or oral reports of Board Committee meetings. This ensures that all Directors are aware of, and are in a position to monitor effectively, Group operations and current issues.
The Chairman meets the Non-executive Directors at least twice per year in formal session (once with the Group Chief Executive present). These meetings and other regular informal discussions create the opportunity for valuable input from the Non-executive Directors.
The Board is also ultimately responsible for the Group’s system of internal control and for reviewing its effectiveness. National Grid Transco’s system of internal control helps to safeguard the Group’s assets and is designed to manage, rather than eliminate, material risks to the achievement of the Group’s business objectives. The review of internal control recognises that any such system can provide only reasonable, and not absolute, assurance against material misstatement or loss.
The Board, together with the Executive, Audit and Risk & Responsibility Committees, is central to the internal control process. Throughout the year the Board receives reports from each of these Committees and as part of the year-end process receives the Group Chief Executive’s Letter of Assurance. This process seeks to confirm compliance with all major internal and external requirements along with the existence of appropriate controls and processes to manage risks and to provide details of material risks and control weaknesses. The Board additionally conducts a formal review of the effectiveness of internal controls based on the information and assurances provided to it directly and via the Committees mentioned.
In response to Section 406 of the US Sarbanes-Oxley Act 2002, the Board has adopted a Code of Ethics for senior financial professionals. This code is available on the Group website at www.ngtgroup.com/about/mn_corp_govern.html (where any amendments or waivers will also be posted).
52 National Grid Transco_Annual Report and Accounts 2003/04
Back to Contents
Corporate Governance and Risk Factors_continued
Board Committees
To ensure that the broad range of responsibilities that fall to the Board are managed effectively and in an appropriate manner, it has established a number of Committees. These are the Audit, Executive, Finance, Nominations, Remuneration, and Risk & Responsibility Committees.
Each Committee has established terms of reference, agreed by both the Committee and by the Board. The terms of reference for each of these Committees are published on the Group website at www.ngtgroup.com/about/mn_corp_govern.html.
Audit Committee
The members of the Audit Committee are John Grant, Ken Harvey and Paul Joskow. The Committee is chaired by George Rose. Each of these Non-executive Directors is independent. The Board has determined that George Rose is an ‘audit committee financial expert’ as required by the Audit Committee terms of reference and pursuant to Section 407 of the Sarbanes-Oxley Act (for his biographical details see page 19).
The Chairman, Deputy Chairman, Group Chief Executive, Group Finance Director, external auditors, Group Head of Audit, and Group Company Secretary and General Counsel are invited to attend most meetings.
| The Audit Committee’s main responsibilities are: |
| • | reviewing and reporting to the Board on the effectiveness of the Group’s financial reporting and internal control policies (including risk and compliance management); |
| • | approving the terms of reference of the internal audit function and ensuring resource requirements are adequate for effective performance; |
| • | approving, appointing, setting the compensation for and the oversight of the Group’s external auditors; |
| • | reviewing the integrity of the Group’s financial statements; and |
| • | reviewing the Annual Report and Accounts, Annual Review, Annual Report on Form 20-F and other reports filed with the SEC containing financial statements and reviewing reports of, and discussing issues raised by, the Disclosure Committee in connection with these disclosures. |
During the year, the Audit Committee met separately with the external auditors without management being present.
| Expanding on the Audit Committee’s role with respect to the external auditors the Committee is responsible for managing the relationship which includes (but is not limited to): |
| • | ensuring the independence and objectivity of the external auditors and the adequacy of the audit procedures; |
| • | consideration of the audit fees paid and the approval in advance of all non-audit fees paid to the external auditors; and |
| • | discussions with the external auditors concerning compliance with accounting standards. |
Details of both the audit and non-audit fees paid to the auditors during the year are set out in note 3 to the accounts on page 79.
Executive Committee
The Board has essentially delegated the day-to-day running of the Group to the Executive Committee which is made up of each of the Executive Directors, the Group Company Secretary and General Counsel and Mike Jesanis as Chief Operating Officer of National Grid USA. The Executive Committee is chaired by the Group Chief Executive.
The Executive Committee is responsible for managing and safeguarding the interests of the Group. In managing the Group the Committee is responsible for furthering Group strategy, business objectives and other targets established by the Board.
The Executive Committee’s key tasks include keeping under review the adequacy of reporting arrangements and the effectiveness of internal control and risk management. At its regular meetings it considers safety and environmental performance reports and operational business performance reports. The Executive Committee also considers the Group’s annual business plan, the capital allocation programme and the annual operating budget.
On behalf of the Board the Executive Committee receives and considers half yearly due diligence and certifications by the operating businesses and corporate centre functions in connection with the completeness and accuracy of financial statements and associated disclosures. The Committee also receives regular reports on the results of internal audits and, on an exception basis, on safety and environmental audits and occupational health reviews.
Finance Committee
The Finance Committee is chaired by Paul Joskow, the other members being Roger Urwin, Steve Lucas, Stephen Pettit and Maria Richter (who joined the Committee following her appointment to the Board in October 2003).
The Finance Committee is responsible for setting investment and financing policy decisions including items such as bank accounts, guarantees and treasury management. The Finance Committee also provides recommendations to the Board in respect of tax, pensions and insurance strategy.
Nominations Committee
The members of the Nominations Committee are James Ross, John Grant, Ken Harvey and George Rose, each of whom is independent. Sir John Parker chairs the Committee.
The main responsibility of the Nominations Committee is to keep under review the size, structure and composition of the Board. When necessary it is the responsibility of the Committee to identify and nominate for appointment Board Directors and direct reports to the Group Chief Executive. The Nominations Committee must also consider the annual reappointment of Directors, proposing which Directors should retire and seek reappointment by shareholders, having first considered the effectiveness and independence of any Non-executive Directors.
The Nominations Committee is also responsible for reviewing the leadership needs of the Group and for co-ordinating the review of the Board and Committees as well as Director independence each year.
Remuneration Committee
The Remuneration Committee members are Ken Harvey, Stephen Pettit (who was appointed to the Committee in November 2003) and George Rose. The Committee chairman is John Grant. Bonnie Hill was a member of the Committee until her retirement from the Board in July 2003. Each of these Non-executive Directors is independent.
Annual Report and Accounts 2003/04_National Grid Transco 53
Back to Contents
Corporate Governance and Risk Factors_continued
The Chairman, Deputy Chairman, Group Chief Executive and the Group Human Resources Director are invited to attend meetings as appropriate.
| The responsibilities of the Remuneration Committee are to: |
| • | determine remuneration policy and packages for the Chairman, Deputy Chairman, Executive Directors and direct reports to the Group Chief Executive; and |
| • | determine policy on share schemes and awards under these schemes to Executive Directors and direct reports to the Group Chief Executive. |
The Committee is also responsible for ensuring that the employee pay and benefit structures are aligned throughout the Group and for compiling and recommending to the Board for approval the Directors’ Remuneration Report on pages 58 to 67.
The Remuneration Committee has authority to obtain the advice of outside independent remuneration consultants and, where appointed, is solely responsible for their retention, termination, approval of fees and other terms.
Risk & Responsibility Committee
James Ross chairs the Risk & Responsibility Committee, its other members being Stephen Pettit and Maria Richter (who joined the Committee following her appointment to the Board in October 2003). Bonnie Hill had been a member of the Committee until her retirement from the Board in July 2003.
The Group Chief Executive, two external specialists (advisors on safety and environmental affairs), the Group Corporate Responsibility Director and the Group Company Secretary and General Counsel are expected to attend meetings.
| The responsibility of the Committee is to review the strategies, policies, management, initiatives, targets and performance of the Group, and where appropriate its suppliers and contractors, in the following areas: |
| • | occupational and public safety; |
| • | environment; |
| • | occupational health; |
| • | equality and diversity; |
| • | human rights; |
| • | business ethics; and |
| • | the role of the Group in society. |
The Risk & Responsibility Committee is involved in the internal control process as it considers and provides reports to the Audit Committee on reputational risks and other risks of a non-financial nature including safety, health and environmental risks.
Board and Board Committee attendance
The following table indicates the number of meetings of the Board and each of its Committees held during the year and the number of those meetings that each of the Directors attended as a member:
| | | | | | | | Board Committees | | | | | |
|
|
|
|
|
|
|
|
|
|
|
|
|
| |
| | Board | | Audit | | Executive | | Finance | | Nominations | | Remuneration | | Risk & | |
| | | | | | | | | | | | | | Responsibility | |
|
|
|
|
|
|
|
|
|
|
|
|
|
| |
| Number of meetings | 11 | | 5 | | 14 | | 7 | | 8 | | 8 | | 4 | |
|
|
|
|
|
|
|
|
|
|
|
|
|
| |
| Sir John Parker (Chairman) | 11 | | – | | – | | – | | 8 | | – | | – | |
|
|
|
|
|
|
|
|
|
|
|
|
|
| |
| Executive Directors | | | | | | | | | | | | | | |
|
|
|
|
|
|
|
|
|
|
|
|
|
| |
| Roger Urwin (Group Chief Executive) | 11 | | – | | 14 | | 7 | | – | | – | | – | |
|
|
|
|
|
|
|
|
|
|
|
|
|
| |
| Edward Astle | 11 | | – | | 13 | | – | | – | | – | | – | |
|
|
|
|
|
|
|
|
|
|
|
|
|
| |
| Steve Holliday | 10 | | – | | 13 | | – | | – | | – | | – | |
|
|
|
|
|
|
|
|
|
|
|
|
|
| |
| Mike Jesanis (i) | – | | – | | 14 | | – | | – | | – | | – | |
|
|
|
|
|
|
|
|
|
|
|
|
|
| |
| Steve Lucas | 10 | | – | | 12 | | 7 | | – | | – | | – | |
|
|
|
|
|
|
|
|
|
|
|
|
|
| |
| Rick Sergel | 11 | | – | | 13 | | – | | – | | – | | – | |
|
|
|
|
|
|
|
|
|
|
|
|
|
| |
| Nick Winser (ii) | 9 | | – | | 11 | | – | | – | | – | | – | |
|
|
|
|
|
|
|
|
|
|
|
|
|
| |
| John Wybrew (iii) | 7 | | – | | 10 | | – | | – | | – | | – | |
|
|
|
|
|
|
|
|
|
|
|
|
|
| |
| Non–executive Directors | | | | | | | | | | | | | | |
|
|
|
|
|
|
|
|
|
|
|
|
|
| |
| James Ross (Deputy Chairman and Senior Independent Director) | 10 | | – | | – | | – | | 8 | | – | | 4 | |
|
|
|
|
|
|
|
|
|
|
|
|
|
| |
| John Grant | 10 | | 5 | | – | | – | | 8 | | 8 | | – | |
|
|
|
|
|
|
|
|
|
|
|
|
|
| |
| Ken Harvey | 10 | | 4 | | – | | – | | 7 | | 7 | | – | |
|
|
|
|
|
|
|
|
|
|
|
|
|
| |
| Bonnie Hill (iv) | 3 | | – | | – | | – | | – | | 3 | | 1 | |
|
|
|
|
|
|
|
|
|
|
|
|
|
| |
| Paul Joskow | 11 | | 5 | | – | | 7 | | – | | – | | – | |
|
|
|
|
|
|
|
|
|
|
|
|
|
| |
| Stephen Pettit (v) | 10 | | – | | – | | 6 | | – | | 2 | | 4 | |
|
|
|
|
|
|
|
|
|
|
|
|
|
| |
| Maria Richter (vi) | 6 | | – | | – | | 3 | | – | | – | | 2 | |
|
|
|
|
|
|
|
|
|
|
|
|
|
| |
| George Rose | 10 | | 5 | | – | | – | | 8 | | 7 | | – | |
|
|
|
|
|
|
|
|
|
|
|
|
|
| |
| (i) | Mike Jesanis was not attending the Executive Committee as a member of the Board but as Chief Operating Officer of National Grid USA. |
| (ii) | Nick Winser was appointed to the Board on 1 May 2003. |
| (iii) | John Wybrew resigned from the Board on 30 November 2003. |
| (iv) | Bonnie Hill resigned from the Board on 21 July 2003. |
| (v) | Stephen Pettit was appointed to the Remuneration Committee on 18 November 2003. |
| (vi) | Maria Richter was appointed to the Board on 1 October 2003. |
54 National Grid Transco_Annual Report and Accounts 2003/04
Back to Contents
Corporate Governance and Risk Factors_continued
Disclosure committees
In response to the requirements of the Sarbanes-Oxley Act, National Grid Transco constituted several disclosure committees across the Group. The Group Finance Director chairs the Group disclosure committee. The main purpose of this committee is to ensure that when disclosing information the Company represents itself completely, fairly and accurately to its security holders and that it complies with applicable laws and stock exchange requirements. The committee is also responsible for reviewing the evaluation of disclosure controls.
Board effectiveness
The effectiveness of the Board, its Committees and each of the Directors is important to the operation of the Group. A formal evaluation process has been established to address this issue. This process is in the form of a questionnaire used to assess the effectiveness of the Board, the Chairman and each of the Committees. The questionnaire is supplemented by one-to-one meetings between the Chairman and each of the Directors where individual performance is openly discussed. The Non-executive Directors also meet separately to discuss the performance of the Chairman. Based on the output of the questionnaire and the one-to-one meetings, an action plan is drawn up to ensure continuous improvement in Board processes and procedures. This evaluation process highlighted several areas where improvements have been made to processes and Board Committee terms of reference, particularly in terms of interaction between the Committees.
Communication with shareholders
During the year the Group Chief Executive and Group Finance Director have regular meetings with institutional investors, fund managers and analysts to discuss information made public by the Group. In addition the Chairman reminds major shareholders, in writing, of his availability (along with that of the Senior Independent Director or Non-executive Directors where required) should there be issues which shareholders may wish to raise.
To ensure that the Board is effectively informed of shareholder views it receives regular presentations, in particular twice a year following the publication of results. Feedback on major shareholders’ views is provided by the Company’s brokers and supplemented by the Group Head of Investor Relations. This ensures that all Board members, including the Non-executive Directors, are aware of the views of major shareholders and of any outstanding issues that they may have.
The principal method of communicating with the majority of shareholders is via the Annual Review. All shareholders also have the opportunity to attend the Company’s AGM and to question Directors on any issues relating to the management of the Company. The Group also has in place a Shareholder Networking Programme, which allows a small number of shareholders to visit operational sites and meet with senior managers and Directors. More details of the Shareholder Networking Programme are on page 135.
Corporate governance practices: differences to New York Stock Exchange (NYSE) listing standards
The corporate governance practices of the Group substantially conform to those required of US companies listed on the NYSE. The principal area of difference is that governance issues are not considered by a separate committee of independent Non-executive Directors, but by the Board as a whole, as is usual practice in the UK.
| Risk management overview |
| In the course of 2003/04 and in close collaboration with our operating businesses and Corporate Centre functions, we have developed a best practice Group-wide risk management process to replace the respective processes that both National Grid and Lattice had in place at the time of Merger. The new enhanced process requires us to define our Group objectives and then consider the key risks that may prevent us from achieving those objectives. For the purposes of this exercise five Group objectives, considered fundamental to the success of National Grid Transco, have been set. These are as follows: |
| • | to continue to earn the right to operate our regulated businesses; |
| • | to conduct effective regulatory management; |
| • | to deliver top quartile financial performance; |
| • | to identify, pursue and successfully develop new business opportunities; and |
| • | to continue to earn the respect and support of key stakeholders and employees. |
Risk factors
As a consequence of operating its risk management process, the Group has identified the following risk factors that could have a materially adverse effect on its business, turnover, profits, assets, liquidity, resources and/or reputation. Not all these factors are within the Group’s control. Other factors besides those listed below may adversely affect the Group. Any forward-looking statements in this document or otherwise made by the Group should be considered in light of these risk factors and the cautionary statement set out on the inside front cover.
Changes in law or regulation in the countries and states in which we operate could have an adverse effect on the Group’s results of operations.
Many of the Group’s businesses are utilities that are subject to the laws of and regulation by governments and/or regulatory authorities. Consequently, changes in law or regulation in the countries and/or states in which those businesses operate could have an adverse effect on the Group. Decisions by regulators concerning, for example, whether licences or approvals to operate are renewed or not, whether there has been breach of the terms of any licence or approval, the level of permitted revenues for those businesses and proposed business development activities, could have an adverse impact not only on results of operations, but also on cash flows, financial condition and the ability to develop those businesses in the future. For further information on this subject please see the Operating Review and Financial Review sections of this document and in particular, the ‘Regulatory environment’ section on pages 25 and 26.
Breaches of environmental and health and safety laws or regulations could expose the Group to claims for financial compensation, adverse regulatory consequences and/or otherwise damage relationships with the Group’s stakeholders.
Aspects of the Group’s activities are inherently dangerous, such as the operation and maintenance of electricity lines and the transmission and distribution of natural gas. Electricity and gas utilities also typically use and generate in their operations a range of potentially hazardous products and by-products. The Group is subject to laws and regulations
Annual Report and Accounts 2003/04_National Grid Transco 55
Back to Contents
Corporate Governance and Risk Factors_continued
relating to pollution, the protection of the environment, and how it uses and disposes of hazardous substances and waste materials. In addition, there may be other aspects of operations that are not currently regarded or proved to have adverse effects but could become so, for example, the effects of electric and magnetic fields (EMFs). The Group is subject to numerous and ever increasing laws and regulations governing health and safety and environmental matters, protecting both the public and its employees. Any breach of these requirements or regulations, or even incidents relating to the environment or health and safety that do not amount to a breach, could adversely affect the results of operations and/or the Group’s reputation. For further information about environmental and safety matters relating to Group businesses, please see the Responsibility section of the website at www.ngtgroup.com/responsibility.
Network failure or the inability to carry out critical non-network operations may cause the Group significant adverse consequences to both financial position and reputation.
The Group may suffer a major network failure and/or may not be able to carry out critical non-network operations. Risks to operational performance could arise from a failure to maintain the health of the system or network, inadequate forecasting of demand or inadequate record keeping. Any failure that arises out of any action or omission by any of the Group’s businesses could cause that business to be in breach of a licence or approval as well as potentially causing harm to the Group’s reputation and significant adverse financial consequences. In addition to these risks, Group businesses are subject to risks that are largely outside of their control such as the weather or security breaches. Weather conditions can affect financial performance, particularly in the US, and severe weather that causes outages or damages infrastructure will adversely affect both operational and business performance. Terrorist attack or sabotage may also physically damage the Group’s businesses or otherwise significantly affect corporate activities and as a consequence impact the results of the Group’s operations.
The Group’s results of operations are dependent on a number of factors relating to business performance including ability to outperform regulatory targets and reach anticipated cost and efficiency savings targets.
Earnings maintenance and growth from UK regulated gas and electricity businesses will be affected by the Group’s ability to outperform regulatory efficiency targets set by Ofgem. The Group has also published cost and efficiency savings targets for its regulated businesses in the UK and the US. To meet these targets, it must continue to improve management and operational performance. In the US, under the state rate plans, earnings from US regulated businesses will be affected by their ability to deliver integration and efficiency savings. US earnings are also dependent on meeting service quality standards set by state regulators. To meet such standards, the Group must improve service reliability and customer service. If the Group does not meet the targets and standards referred to above, both its results of operations and its reputation may be adversely affected.
Fluctuations in the value of the US dollar could have a significant impact on results of operations because of the material nature of the Group’s businesses in the US, and the proportion of the Group’s debt that is denominated in dollars.
The Group has significant operations in the US. These operations are subject to the risks normally associated with such businesses, including the need to translate US assets and profits into the Group’s primary reporting currency, sterling. Results of operations may be similarly impacted because the Group holds a significant proportion of borrowings in US dollars. For further information related to this see ‘Foreign exchange risk management’ on page 44.
The nature and extent of the Group’s borrowings mean that an increase in interest rates could have an adverse impact on the financial position of National Grid Transco.
A significant proportion of the Group’s borrowings are subject to variable interest rates that may fluctuate with changes to prevailing interest rates. Increases in these interest rates could therefore result in reduced levels of profit for the Group. For further information see ‘Interest rate risk management’ on page 44.
The Group’s overall financial position may be adversely affected by a number of factors including restrictions in borrowing and debt arrangements, changes to credit ratings and effective tax rates.
The Group is subject to certain covenants and restrictions in relation to its listed debt securities and its bank lending facilities. Such restrictions may hinder the Group in servicing the financial requirements of its current businesses or the financing of newly acquired or developed businesses. The debt of National Grid Transco and certain of its subsidiaries is rated by credit rating agencies and changes in these ratings may affect both the borrowing capacity of the Group as a whole and the cost of those borrowings. The effective rate of tax paid by the Group may be influenced by a number of factors including changes in law and regulation and the Group’s overall approach to such matters, the results of which could increase or decrease that rate.
Changes to the regulatory treatment of commodity costs may have an adverse effect on the results of operations.
The costs incurred by the Group’s electricity businesses in purchasing electricity are subject to movements in underlying commodity prices, particularly those of oil and gas. Current regulatory arrangements in the UK and US provide the ability to pass through virtually all of the increased costs related to commodity prices by way of higher prices. If regulators in the UK or the US limit or remove the Group’s ability to pass through commodity costs to customers it may have a material effect on operating results. For more information, see the Operating Review section of this document.
56 National Grid Transco_Annual Report and Accounts 2003/04
Back to Contents
Corporate Governance and Risk Factors_continued
The Group may suffer a loss of reputation if consumers of energy suffer a disruption to their supply even if this disruption is outside of its control.
The Group’s network businesses are responsible for transporting the available electricity and gas. Where there is insufficient electricity or gas, the Group’s role is to manage the systems safely, which in extreme circumstances may require the Group to disconnect customers. The Group may as a result suffer a negative impact to its reputation if consumers of electricity and/or gas suffer disruption to their supply.
The Group is subject to the risk that business development activity, such as a significant acquisition or disposal, will be based on incorrect assumptions or conclusions or that substantial liabilities will be overlooked.
In any acquisition or disposal process the Group evaluates its anticipated level of return; however, unforeseen circumstances or unreliable assumptions may adversely impact the level of return actually generated.
Development of alternative energy sources and new technologies may adversely affect the Group’s results of operations if it is unable to respond to any changes.
The Group’s businesses that are involved in the transmission and distribution of energy are vulnerable to certain types of technological changes. Examples of possible changes are the growth in distributed generation, renewable energy sources, fuel cells and the introduction of an alternative power carrier. Adapting to technological changes may be costly and there is no guarantee that the Group may foresee or be able to respond adequately to such changes.
Risk and compliance management process
The risk factors set out above were identified by the Group’s best practice risk management process which facilitates the identification, assessment, management and reporting of material risks in a visible, structured, consistent and continuous manner. Like the predecessor systems in place in National Grid and Lattice, the new process is compliant with the Turnbull working party guidance (published September 1999) and the ABI Disclosure Guidelines on Socially Responsible Investment (published October 2001) which focus on social, ethical and environmental risks. In addition, the process helps to address compliance obligations arising from the Sarbanes-Oxley Act, which requires the principal executive and principal financial officer of the Company to certify the accuracy and fair representation of the Annual Report on Form 20-F and the adequacy of the Group’s disclosure controls and internal control over financial reporting.
Consistent with last year, the risk management process adopted has promoted both a bottom-up and top-down assessment of key risks. The bottom-up assessment, undertaken in accordance with risk assessment and reporting guidance, has resulted in the detailed analysis of risks by the individual businesses and Corporate Centre functions captured in the form of risk registers. The top-down assessment has involved a number of senior managers from the businesses and Corporate Centre and has resulted in a balanced and robust identification and consideration of business-critical, including cross-organisation, risks. Subsequently, both elements have been pulled together through the production of two new streamlined Board-level risk reports/graphics.
The first report highlights the key changes to the Group’s risk profile and specifies actions designed to improve controls or alter the level of residual risk. The second report aligns those bottom-up risks that have the potential to impact significantly the Group’s reputation to the top-down risks, presenting the information in the form of an impact/probability graphic.
Both these reports are presented to the Executive Committee for its review and challenge. They enable the Executive Directors to assess, at the highest level, the completeness and quality of risk reporting and the appropriateness and timeliness of actions being taken to manage the key risks. Updated versions, incorporating all feedback received from the Executive Directors, are subsequently presented to and discussed with both the Audit Committee and the Risk & Responsibility Committee.
Any material changes to the risks and associated controls and actions contained in the Board-level risk reports/graphics and business risk registers are reported through the monthly operational business performance reports. In addition, the Executive Directors review and discuss key changes in risk profiles on a regular basis.
Last year, the Group reported that it had begun to introduce a compliance management process that seeks to raise awareness around its ever-expanding compliance obligations and helps to ensure that it takes all reasonable steps to comply with relevant obligations. The Executive Committee has now approved a new compliance management process. That process is consistent with and complementary to the risk management process. Through the compliance management process, the Group has identified those current and anticipated compliance obligations where the actual or perceived impact of non-compliance on the Group is considered greatest. Going forward, the businesses and Corporate Centre functions will provide assurance, where relevant, that robust compliance programmes are in place or are being developed for all key obligations.
National Grid Transco recognises that risk and compliance management is an iterative process and subject to continuing improvement. The Group is committed to building on the progress achieved this year. The businesses and Corporate Centre will further raise risk and compliance awareness, embed good practice and challenge the effectiveness of key control frameworks.
Annual Report and Accounts 2003/04_National Grid Transco 57
Back to Contents
Directors’ Report and Operating and Financial Review
Directors’ Remuneration Report
Remuneration Committee
Role of the Remuneration Committee and its Terms of Reference
The Remuneration Committee is responsible for developing Group policy on executive remuneration, and for determining the remuneration of Executive Directors and the executives below Board level who report directly to the Group Chief Executive. It also monitors the remuneration of other senior employees of the Group and has oversight of the operation of all the Group’s share and share option plans. The Committee operates within terms of reference agreed by the Board, which are available on the Group’s website or on request from the Group.
The Board has accepted all the recommendations made by the Committee during the year.
| Composition of the Remuneration Committee |
| The Remuneration Committee is made up entirely of independent Non-executive Directors. The members of the Committee have been as follows: |
| • | John Grant (Committee Chairman); |
| • | Ken Harvey; |
| • | Bonnie Hill (until 21 July 2003); |
| • | Stephen Pettit (from 18 November 2003); and |
| • | George Rose. |
The Group Chairman, Deputy Chairman, Group Chief Executive and Group Human Resources Director (Pat Fulker) are invited to attend meetings to provide advice on remuneration policies and practices. No Director participates in any discussion on his or her own remuneration.
The Committee appointed Ernst & Young LLP in February 2003 as independent remuneration advisors to the Committee. During the year, the Group appointed Linklaters, with the agreement of the Committee, to provide advice to the Committee on Directors’ service contracts.
| In the year to 31 March 2004, these advisors provided other services to the Group in the UK as follows: |
| • | Ernst & Young LLP: technical accounting advice and corporate finance services; and |
| • | Linklaters: general legal advice. |
| |
Remuneration policy
The Remuneration Committee determines remuneration policies and practices with the aim of attracting, motivating and retaining high calibre Directors who will deliver success for shareholders and high levels of customer service, safety and environmental performance. It is intended that remuneration policies and practices should conform to best practice standards in the markets in which the Group operates. The policies that applied in 2003/04 will also apply in 2004/05 and are currently intended to be applied in subsequent years. Remuneration policy is framed around the following key principles: |
| • | total rewards should be set at levels that are competitive in the relevant market; |
| • | a significant proportion of the Executive Directors’ total rewards will be performance-based. These will be earned through the achievement of demanding targets for short-term business performance and long-term shareholder value creation, consistent with the Group’s Framework for Responsible Business (available on the website); |
| • | for higher levels of performance, rewards should be substantial but not excessive; and |
| • | incentive plans, performance measures and targets should be structured to operate soundly throughout the business cycle. They should be prudent and not expose shareholders to unreasonable risk. |
| | |
| | |
Executive Directors’ remuneration
Remuneration packages for Executive Directors consist of the following elements: |
| • | salary; |
| • | annual bonus and Share Matching Plan; |
| • | Performance Share Plan; |
| • | all-employee share plans; |
| • | pension contributions; and |
| • | non-cash benefits. |
Excluding pensions and non-cash benefits, the remuneration package is structured such that for Executive Directors achieving ‘target performance’, performance-related remuneration represents an average of 51% of the total package, while at ‘stretch performance’, these elements represent approximately 69% of the total.
The policies relating to each element of remuneration are summarised below.
Salary
Salaries are reviewed annually and targeted at the median position against the relevant market. In determining the relevant market, the Remuneration Committee takes account of the regulated nature of the majority of the Group’s operating activities, along with the size, complexity and international scope of the business. For UK-based Executive Directors a UK market is used, while for US-based Executive Directors a US market is used. In setting individual salary levels the Committee takes into account business performance, the individual’s experience in the role and the employment and salary practices prevailing for other employees in the Group.
Annual bonus and Share Matching Plan
Annual bonuses are based on achievement of a combination of demanding Group, individual and, where applicable, divisional targets. The principal measures of Group performance are based on earnings per share (EPS) and cash flow; the main divisional measures are based on divisional operating profit and divisional cash flow. Individual targets are set in relation to key operating and strategic objectives and include overriding measures of safety and customer service performance. The Remuneration Committee reviews performance against targets at the end of the year and may use its discretion to adjust measures and payments in view of operating circumstances during the year. For the financial year 2004/05, the target and maximum bonus levels for UK-based Executive Directors are 50% and 75% of salary respectively.
US-based Executive Directors have lower target and maximum bonus levels of 41.7% and 62.5% respectively. US-based Executive Directors also participate in the USA Goals Program, an all-employee bonus plan that can pay up to 4.5% of salary on the achievement of certain earnings and performance targets. In line with US market practice, US-based Executive Directors’ cash bonuses are pensionable.
A predetermined part of each Director’s bonus entitlement is automatically deferred (net of tax) into National Grid Transco shares, and a matching award may be made under the Share Matching Plan. Currently, UK-based Executive Directors are required to defer one third of any cash bonus into shares. At the end of three
58 National Grid Transco_Annual Report and Accounts 2003/04
Back to Contents
Directors’ Remuneration Report_continued
years, provided the Director is still employed by the Group, additional matching shares equal in value at the date of deferral to the pre-tax value of the amount of bonus deferred are released to the individual. US-based Executive Directors do not participate in this plan. However, each year an award, calculated as a proportion (currently 60%) of their annual bonus, is paid in National Grid Transco shares or American Depositary Shares (ADSs) and is subject to a minimum three-year holding period. Alternatively, recipients may defer the 60% award as a monetary amount into a deferred compensation plan available after retirement. The value within this plan tracks the value of the Group’s ADSs. The total target and maximum values of the annual bonus plan, including deferral and share matching, are therefore 67% and 100% of salary respectively for all Executive Directors. The participant also receives a cash payment equal to the dividends that have been paid on the matching shares over the three-year holding period.
The Remuneration Committee believes that operation of the Share Matching Plan as part of the annual bonus plan allows National Grid Transco to maintain competitiveness in annual bonus levels, while ensuring that Executive Directors hold a significant proportion of their remuneration in shares. Requiring Executive Directors to invest in the Group increases the proportion of rewards linked to both short-term performance and longer-term total shareholder returns. The bonus deferral and share match also acts as a retention tool and ensures that Executive Directors share a significant level of personal risk with the Group’s shareholders.
Long-term incentives
The long-term incentive plans currently approved by shareholders, in addition to the Share Matching Plan described above, are the National Grid Transco Performance Share Plan (PSP) and the National Grid Executive Share Option Plan (ESOP). National Grid Transco has made a commitment to shareholders to make grants under no more than two discretionary share incentive plans to any one Director in any year. For the year to 31 March 2005, the Remuneration Committee has decided to make grants under the PSP and the Share Matching Plan, as in the previous year.
Under the PSP, Executive Directors and approximately 350 other senior employees who have significant influence over the Group’s ability to meet its strategic objectives receive notional allocations of shares worth up to a maximum of 125% of salary. Shares vest after three years, subject to the satisfaction of the relevant performance criterion, which is set by the Committee at the date of grant. Shares must then be held for a further year, after which they are released, subject to the Executive’s continuing employment with the Group or at the Committee’s discretion.
The performance criterion for grants in the year to 31 March 2005 is based on the Group’s Total Shareholder Return (TSR) performance over a three-year period, relative to the TSR performances of the following group of comparator companies:
Ameren Corporation
AWG plc
Centrica plc
Consolidated Edison, Inc.
Dominion Resources, Inc.
E.ON AG
Electrabel SA
Endesa SA
Enel SpA
Exelon Corporation
FirstEnergy Corporation
FPL Group, Inc.
Gas Natural SDG SA
Iberdrola SA
International Power plc
Kelda Group plc
Pennon Group plc
RWE AG
Scottish Power plc
Scottish & Southern Energy plc
Severn Trent plc
The Southern Company, Inc.
Suez SA
United Utilities plc
Viridian Group plc
This comparator group, which is unchanged from the year to 31 March 2004, has been selected to include companies in the energy distribution sector, against which National Grid Transco benchmarks its performance for business purposes, and other UK and international utilities. The Committee believes that this comparator group represents a relevant target for the long-term performance of the Group. The Committee may amend the list of comparator companies if circumstances make this necessary (eg as a result of takeovers or mergers of comparator companies). Under the terms of the PSP, the Committee may allow shares to vest early to departing executives to the extent that the performance condition has been met and pro-rating the number of shares that vest to reflect the proportion of the performance period that has elapsed at the executive’s date of departure.
TSR has been chosen as the performance criterion as it provides a direct measure of shareholder value creation. In calculating TSR, it is assumed that all dividends are reinvested. In assessing whether this performance condition has been met, data purchased from Alithos Limited is used. No shares will be released if the Group’s TSR over the three-year performance period, when ranked against that of each of the comparator companies, falls below the median. For TSR at the median, 30% of the shares awarded will be released. 100% of the shares awarded will be released for TSR ranking at the upper quartile or above. For performance between median and upper quartile against the comparator group, the number of shares released is calculated on a straight-line basis. No retesting of performance is permitted for any shares that do not vest after the initial three-year performance period and any such shares will lapse. The Committee believes that these criteria represent stretching performance targets for the release of shares.
There are no plans to make grants under the ESOP in 2004/05, unless required for recruitment purposes.
| All-employee share plans |
| • | Sharesave: Executive Directors resident in the UK are eligible to participate in UK Inland Revenue approved all-employee Sharesave schemes (subject to eligibility based on service). Under these schemes, participants may contribute between £5 and £250 in total each month for a fixed period of three years, five years or both. Contributions are taken from net salary, and at the end of the savings period these contributions can be used to buy ordinary shares in National Grid Transco at a discounted price, set when contributions began, with the discount capped at 20% of the market price at that time. |
Annual Report and Accounts 2003/04_National Grid Transco 59
Back to Contents
Directors’ Remuneration Report_continued
| • | US Incentive Thrift Plan: Employees resident in the US, including Executive Directors, are eligible to participate in the Thrift Plan, a tax-advantaged savings plan (commonly referred to as a 401(k) plan) provided for employees of National Grid USA companies. It is a defined contribution pension plan that gives participants the opportunity to invest a maximum of 50% of salary (pre-tax) and/or up to 15% of salary (post-tax) up to applicable Federal salary limits ($205,000 in the year in question). The company then matches 100% of the first 2% and 75% of the next 4% of salary contributed, resulting in a maximum matching contribution of 5% of salary up to the Federal salary cap. The employee may invest both the employee and company contributions in Group shares or various mutual fund options. |
| | |
| • | Share Incentive Plan (SIP): The Group implemented a UK Inland Revenue approved SIP during the year to 31 March 2004. Employees resident in the UK, including Executive Directors, are eligible to participate in the SIP (subject to eligibility based on service). Under the SIP, contributions of up to £125 are taken from participants’ gross salary and used to buy ordinary shares in National Grid Transco each month. The shares are placed in trust and if they are left in trust for at least five years they can be removed free of UK Income Tax and National Insurance contributions. |
Pensions
Following the Merger, legacy pension arrangements have remained in place for Executive Directors. Pension policy for UK-based Executive Directors is being reviewed following the recently announced UK Government reform of pensions.
UK-based Executive Directors who previously were directors or employees of National Grid are members of the National Grid Company Group of the Electricity Supply Pension Scheme, which is a tax-approved pension scheme. Only base salary is pensionable. The provisions for participating Executive Directors are designed to give a pension at normal retirement age (60) of two thirds of final salary subject to completion of 20 years’ service (although participating Executive Directors may retire early from age 55 with a reduction in pension). A spouse’s pension is payable on the death in service of a participating Executive Director equal to two thirds of that payable to the participating Executive Director based on potential service to normal retirement age. On death in retirement, a spouse’s pension is payable equal to two thirds of the participating Executive Director’s pension on death. Pensions in payment are increased by price inflation up to a maximum of 5% per annum. For participating Executive Directors affected by the ‘earnings cap’, a restriction on the amount of pay which can be used to calculate pensions due from a tax-approved pension scheme, the Company provides benefits on salary above the cap on a partially-funded basis.
US-based former National Grid Executive Directors participate in a qualified pension plan and an executive supplemental retirement plan provided through National Grid USA. These plans are non-contributory defined benefit arrangements. The qualified plan is directly funded, while the supplemental plan is indirectly funded through a ‘rabbi trust’. Participating Executive Directors’ benefits are calculated using a formula based on years of service and highest average compensation over five consecutive years. In line with many US plans, the calculation of benefits under the arrangements takes into account salary, bonuses and incentive share awards but not share options. Normal retirement age is 65. The executive supplemental plan, however, provides unreduced pension benefits from age 55. The plans also provide for a spouse’s pension of at least 50% of that accrued by the participating Executive Director. Benefits under these arrangements do not increase once in payment.
UK-based Executive Directors who previously were directors or employees of Lattice Group plc participate in the defined benefit section of the Lattice Group Pension Scheme, which is a tax-approved pension scheme. Only base salary is pensionable. The participating Executive Director (Steve Lucas) is subject to the earnings cap. He also participates in the Lattice Group Supplementary Benefits Scheme, an unfunded unapproved arrangement that increases retirement benefits to at least the level which would otherwise have been provided in the Lattice Group Pension Scheme, had he not been subject to the earnings cap. The provisions are designed to give two thirds of final salary (which may be restricted by remuneration averaged over three years) at normal retirement age (65), inclusive of any pension rights earned in previous employment. With the employer’s consent, provided 10 years’ service has been completed with National Grid Transco (which includes pensionable service transferred from previous employment), the accrued pension can be paid from age 55 with no actuarial reduction in benefit. A dependant’s pension is payable on death in service of a participating Executive Director based on potential service to normal retirement age. On death in retirement, a dependant’s pension is payable equal to two thirds of the participating Executive Director’s pension, prior to exchanging any of it for a cash lump sum. Pensions in payment are increased in line with price inflation.
Provision has been made in the accounts in respect of unfunded obligations for post-retirement benefits.
Non-cash benefits
The Group provides competitive benefits to Executive Directors, such as a fully expensed car or cash alternative in lieu of car and fuel, use of a driver when required, private medical insurance and life assurance. UK-based Executive Directors with less than five years continuous service, who were previously directors of National Grid, are provided with long-term ill health insurance. Business expenses incurred are reimbursed in such a way as to give rise to no material benefit to the Director.
Share ownership guidelines
Executive Directors are encouraged to build up and retain a shareholding of at least 100% of annual salary. As a minimum, this should be achieved by retaining 50% of the after-tax gain on any options exercised or shares received through the long-term incentive or all-employee share plans.
Share dilution through the operation of share-based incentive plans
Where shares may be issued or treasury shares reissued to satisfy incentives, the aggregate dilution resulting from executive incentives will not exceed 5% in any 10-year period, and dilution resulting from all incentives, including all-employee incentives, will not exceed 10% in any 10-year period. The Remuneration Committee reviews dilution against these limits regularly.
60 National Grid Transco_Annual Report and Accounts 2003/04
Back to Contents
Directors’ Remuneration Report_continued
Non-executive Directors’ remuneration
Non-executive Directors’ fees are determined by the Executive Directors, or by a Committee authorised by the Board, subject to the limits applied by National Grid Transco’s articles of association. Non-executive Directors’ remuneration comprises an annual fee and a fee for each Board meeting attended (with a higher fee for meetings held outside the Director’s country of residence), with an additional fee payable for chairmanship of a Board Committee. The Chairman’s letter of appointment allows his participation in the Company’s personal accident and private medical insurance schemes and states that the Company will provide life assurance cover, a car (with driver when appropriate) and fuel expenses.
Executive Directors’ service contracts
Service contracts for Executive Directors are set at one year’s notice. The application of longer contract periods at appointment, reducing after an initial period, may be used in exceptional circumstances if considered appropriate by the Remuneration Committee to recruit certain key executives. The Committee has introduced a policy on mitigation of losses in the event of an Executive Director’s employment being terminated by the Group. If this occurs, the departing Executive would be expected to mitigate any losses incurred as a result of the termination. Therefore, entitlement to the payment of 12 months’ remuneration on early termination will no longer be automatic but will instead be based on the circumstances of the termination. Steve Lucas’s contract provides for a liquidated damages payment of one year’s salary plus a credit of one year’s pensionable service if the contract is terminated within one year of a change of control of the Group.
The Committee, in determining any other such payments, will give due regard to the comments and recommendations of the UK Listing Authority’s Listing Rules (including the Combined Code) and associated guidance and other requirements of legislation, regulation and good governance.
| Directors’ contracts and letters of appointment | Date of contract | | Notice period (i) | |
|
| Executive Directors | | | | |
| Roger Urwin | 17 November 1995 | | 12 months | |
| Steve Lucas | 13 June 2002 | | 12 months | |
| Edward Astle | 27 July 2001 | | 12 months | |
| Steve Holliday | 6 March 2001 | | 12 months | |
| Rick Sergel | 22 March 2000 | | 12 months | (ii) |
| Nick Winser | 28 April 2003 | | 12 months | (iii) |
| John Wybrew (retired 30 November 2003) | | | | |
|
|
|
| |
| | | | Notice period/ | |
| Date of letter | end of period |
| of appointment | of appointment |
|
|
|
|
| Non-executive Directors | | | | |
| Sir John Parker (Chairman) | 12 January 2004 | | 6 months | (iv) |
| James Ross (Deputy Chairman) | 5 June 2003 | | 2004 AGM | |
| John Grant | 5 June 2003 | | 2004 AGM | |
| Ken Harvey | 5 June 2003 | | 2006 AGM | |
| Paul Joskow | 5 June 2003 | | 2005 AGM | |
| Stephen Pettit | 5 June 2003 | | 2006 AGM | |
| Maria Richter | 30 September 2003 | | 2007 AGM | (v) |
| George Rose | 5 June 2003 | | 2006 AGM | |
| Bonnie Hill (resigned 21 July 2003) | | | | |
|
|
|
| |
| (i) | The contracts for all current Executive Directors are for rolling 12-month periods. |
| (ii) | Rick Sergel’s retirement during the summer of 2004 was announced on 27 October 2003. |
| (iii) | Nick Winser’s appointment as a Director commenced with effect from 28 April 2003. |
| (iv) | During the year, the notice period for the Chairman, Sir John Parker, was reduced from a rolling 12-month period |
| | to a rolling 6-month period. |
| (v) | Subject to reappointment by shareholders at the 2004 AGM. |
The retirement of Rick Sergel in the summer of 2004 was announced in October 2003. Although Rick’s retirement decision coincided with a voluntary early retirement offer (VERO) made to the Group’s non-unionised US employees in the autumn of 2003, he will not be receiving additional pension value under the VERO. Also, under these circumstances, no severance payments will be triggered under Rick’s employment contract.
Non-executive Directors’ letters of appointment
The Chairman’s letter of appointment provides for a period of six months’ notice in order to give the Group reasonable security with regard to his service. The terms of engagement of Non-executive Directors other than the Chairman are also set out in letters of appointment; their initial appointment and any subsequent reappointment is subject to election or re-election by shareholders. The letters of appointment do not contain provision for termination payments.
External appointments and retention of fees
With the approval of the Board in each case, Executive Directors may normally accept an external appointment as a Non-executive Director of another company and retain any fees received.
Roger Urwin served as a Non-executive Director of the Special Utilities Investment Trust plc and retained fees of £9,442.31 paid to him for this service in the year ended 31 March 2004.
Edward Astle served as a Non-executive Director of Intec Telecom Systems plc and retained fees of £25,000 paid to him for these services in the year ended 31 March 2004.
Rick Sergel served as a Non-executive Director of State Street Corporation. He deferred the compensation to which he became entitled in respect of these services, which consisted of an annual retainer of $50,000 (deferred in shares), a deferred share award of $90,000 and meeting attendance fees of $19,500 ($1,500 each for 13 meetings attended, deferred in cash).
Annual Report and Accounts 2003/04_National Grid Transco 61
Back to Contents
Directors’ Remuneration Report_continued
National Grid Transco/National Grid TSR vs FTSE 100
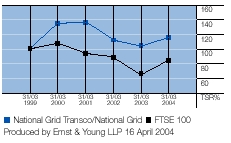
Performance graph
The graph above represents the comparative TSR performance of the Group from 31 March 1999 to 31 March 2004. For the period before the Merger the TSR shown is that of National Grid Group.
This graph shows the Group’s performance against the performance of the FTSE 100 index, which is considered suitable for this purpose as it is a broad equity market index of which National Grid Transco is a constituent. This graph has been produced in accordance with the requirements of Schedule 7A to the Companies Act 1985.
In drawing this graph it has been assumed that all dividends paid have been reinvested. The TSR level shown at 31 March each year is the average of the closing daily TSR levels for the 30-day period up to and including that date.
Remuneration outcomes during the year ended 31 March 2004
Tables 1A, 1B, 2, 3, 4 and 5 comprise the ‘auditable’ part of the Directors’ Remuneration Report, being the information required by part 3 of Schedule 7A to the Companies Act 1985.
1. Directors’ emoluments
The following tables set out an analysis of the pre-tax emoluments during the years ended 31 March 2004 and 2003, including bonuses but excluding pensions, for individual Directors who held office in National Grid Transco during the year ended 31 March 2004.
| | | | | | | | | | | | Year ended | |
| | | | | | | | | | | | 31 March | |
| Table 1A | | | Year ended 31 March 2004 | | | | 2003 | |
|
|
|
|
|
|
|
|
|
|
|
| |
| | | | Annual | | Expense | | Benefits | | | | | |
| | Salary | | bonus | | allowances | | in kind (i) | | Total | | Total | |
| | £000s | | £000s | | £000s | | £000s | | £000s | | £000s | |
|
|
|
|
|
|
|
|
|
|
|
| |
| Executive Directors | | | | | | | | | | | | |
| Roger Urwin (ii) | 635 | | 395 | | – | | 21 | | 1,051 | | 924 | |
| Steve Lucas (ii) | 375 | | 217 | | – | | 19 | | 611 | | 497 | |
| Edward Astle (iii) | 350 | | 202 | | 12 | | 4 | | 568 | | 606 | |
| Steve Holliday (ii) | 375 | | 240 | | – | | 18 | | 633 | | 517 | |
| Rick Sergel (iv) | 488 | | 228 | | – | | 19 | | 735 | | 755 | |
| Nick Winser (ii), (v) | 275 | | 172 | | 27 | | 128 | | 602 | | – | |
| John Wybrew (vi) | 278 | | 123 | | – | | 11 | | 412 | | 564 | |
|
|
|
|
|
|
|
|
|
|
|
| |
| Total | 2,776 | | 1,577 | | 39 | | 220 | | 4,612 | | 3,863 | |
|
|
|
|
|
|
|
|
|
|
|
| |
| (i) | Benefits in kind comprise benefits such as a fully expensed car, chauffeur, private medical insurance and life assurance. |
| (ii) | The bonus of each of these Directors has been reduced by an amount equal to 7.5% of salary (10% of salary including matching awards under the Share Matching Plan) to reflect the UK power outages described elsewhere in this report. |
| (iii) | Edward Astle’s expense allowances relate to cash received in lieu of car and fuel benefit entitlements. |
| (iv) | Rick Sergel’s bonus includes payments in the US worth £14,643 in respect of his participation in the USA Goals Program (described on page 58). |
| (v) | Nick Winser was appointed to the Board on 28 April 2003. Had he served on the Board for the whole of the year ended 31 March 2004, his salary and annual bonus would have been 12 /11 of the reported figures. Nick was on assignment in the US when he was appointed to the Board. His benefits include expatriate benefits provided while he remained in the US, in line with the Group’s standard expatriate assignment policy, and relocation benefits provided on his return to the UK. The expense allowances shown relate to relocation allowances paid to Nick on his repatriation back to the UK from the US and relocation in the UK. |
| (vi) | John Wybrew retired on 30 November 2003. |
| | | | | | | | Year ended | |
| | | | | | | | 31 March | |
| Table 1B | Year ended 31 March 2004 | | | | 2003 | |
|
|
|
|
|
| |
| | | | Other | | | | | |
| | Fees | | emoluments | | Total | | Total | |
| | £000s | | £000s | | £000s | | £000s | |
|
|
|
|
|
|
|
| |
| Non-executive Directors | | | | | | | | |
| Sir John Parker | 300 | | 26 | (i) | 326 | | 412 | |
| James Ross | 115 | | – | | 115 | | 175 (ii) | |
| John Grant | 59 | | – | | 59 | | 38 | |
| Ken Harvey | 44 | | – | | 44 | | 30 | |
| Paul Joskow | 67 | | – | | 67 | | 50 | |
| Stephen Pettit | 47 | | – | | 47 | | 25 | |
| Maria Richter (iii) | 29 | | – | | 29 | | – | |
| George Rose | 59 | | – | | 59 | | 30 | |
| Bonnie Hill (iv) | 19 | | – | | 19 | | 32 | |
|
|
|
|
|
|
|
| |
| Total | 739 | | 26 | | 765 | | 792 (ii) | |
|
|
|
|
|
|
|
| |
| (i) | Sir John Parker’s other emoluments comprise benefits in kind such as a fully expensed car and private medical insurance. |
| (ii) | In the previous year’s Directors’ Remuneration Report, the reported emoluments for James Ross included ‘Other emoluments’ of £22,000. This figure was overstated and should have been reported as £nil. The comparative figures provided above reflect the amended total for the year ended 31 March 2003. |
| (iii) | Maria Richter was appointed to the Board on 1 October 2003. |
| (iv) | Bonnie Hill resigned from the Board with effect from 21 July 2003. |
62 National Grid Transco_Annual Report and Accounts 2003/04
Back to Contents
Directors’ Remuneration Report_continued
2. Directors’ pensions
The table below gives details of the Executive Directors’ pension benefits in accordance with both Schedule 7A of the Companies Act and the Listing Rules.
| | | | | | | | | | | | | | Transfer value of | |
| | | | | | | | | | | | | | increase in | |
| | | | | | | | | | | | Additional | | accrued benefit | |
| | | | | | | | | | | | benefit earned | | in the year | |
| | | | | | | | | | | | in the year | | ended | |
| | Additional benefit | | Accrued | | Transfer value of | | | | ended | | 31 March 2004 | |
| | earned during | | entitlement | | accrued benefits | | Increase in | | 31 March 2004 | | (excluding | |
| | the year ended | | as at | | as at 31 March (i) | | transfer value | | (excluding | | Director’s | |
| | 31 March 2004 | | 31 March 2004 | |
|
|
| | less Director’s | | inflation) | | contributions | |
| | Pension | | Pension | | 2004 | | 2003 | | contributions | | Pension | | and inflation) | |
| Table 2 | £000s | | £000s | | £000s | | £000s | | £000s | | £000s | | £000s | |
|
|
|
|
|
|
|
|
|
|
|
|
|
| |
| Roger Urwin | 33 | | 403 | | 7,353 | | 6,291 | | 1,024 | | 22 | | 367 | |
| Steve Lucas | 27 | | 126 | | 1,566 | | 951 | | 604 | | 25 | | 303 | |
| Edward Astle | 13 | | 30 | | 366 | | 189 | | 155 | | 13 | | 131 | |
| Steve Holliday | 16 | | 38 | | 404 | | 214 | | 169 | | 15 | | 141 | |
| Rick Sergel (ii) | 3 | | 31 | | 2,527 | | 2,259 | | 268 | | 3 | | 285 | |
| Nick Winser (iii) | 32 | | 81 | | 821 | | 454 | | 351 | | 31 | | 294 | |
| John Wybrew (iv) | 12 | | 117 | | 2,230 | | 1,981 | | 242 | | 12 | | 228 | |
|
|
|
|
|
|
|
|
|
|
|
|
|
| |
| (i) | The transfer values shown at 31 March 2003 and 2004 represent the value of each Executive Director’s accrued benefits based on total service completed to the relevant date. The transfer values for the UK Executive Directors have been calculated in accordance with guidance note ‘GN11’ issued by the Institute of Actuaries and the Faculty of Actuaries. The transfer values for Rick Sergel have been calculated using discount rates based on high yield US corporate bonds and associated yields at the relevant dates. |
| (ii) | Through his participation in the Thrift Plan in the US, described on page 60, the Group also made contributions worth £6,101 to a defined contribution pension arrangement in respect of Rick Sergel. |
| (iii) | Nick Winser was appointed as an Executive Director with effect from 28 April 2003. The above information allows for the accrual of a pension benefit of two thirds of salary at age 60 taking into account standard benefits earned prior to 1 September 1998. This means that, as well as the pension stated above, Nick Winser has an accrued lump sum entitlement of £151,000 as at 31 March 2004. The increase to the accumulated lump sum including inflation was £53,000 in the year to 31 March 2004. The transfer value information above includes the value of the pension equivalent of the lump sum. |
| (iv) | No enhancements were made to John Wybrew’s pension benefits in respect of his retirement being earlier than his normal retirement age of 65. John’s pension benefits are a combination of Inland Revenue approved benefits under the Lattice Group Pension Scheme and unfunded unapproved benefits provided separately. He has elected to draw his approved benefits as a pension and has taken the unapproved benefits as a taxable commutation lump sum, thereby absolving the Group of any future liability with regard to this part of his pension benefits. The transfer value as at 31 March 2004 for John, who retired on 30 November 2003, has been calculated as at the date of retirement but is based on market conditions as at 31 March 2004. The transfer value of accrued benefits shown above includes the commutation lump sum of £1,979,525 in respect of his and his dependants’ unfunded benefits above those to be provided from the Lattice Group Pension Scheme. |
3. Directors’ interests in share options
The table below gives details of the Executive Directors’ holdings of share options awarded under the ESOP, the Share Matching Plan and Sharesave schemes.
| | Options held | | | | | | Options held | | | | | | |
| | at 1 April 2003 | | Options exercised | | | | at 31 March 2004 | | Exercise price | | | | |
| | or, if later, | | or lapsed | | Options granted | | or, if earlier, | | per share | | | | |
| Table 3 | on appointment | * | during the year | | during the year | | on retirement | † | (pence) | | Normal exercise period |
|
|
|
|
|
|
|
|
|
|
|
|
|
|
| Roger Urwin | | | | | | | | | | | | | |
| ESOP | 169,340 | | – | | – | | 169,340 | | 280.50 | | Sep 2000 | | Sep 2007 |
| | 91,656 | | – | | – | | 91,656 | | 375.75 | | June 2001 | | June 2008 |
| | 22,098 | | – | | – | | 22,098 | | 455.25 | | June 2002 | | June 2009 |
| | 33,867 | | – | | – | | 33,867 | | 531.50 | | June 2003 | | June 2010 |
| | 133,214 | | – | | – | | 133,214 | | 563.00 | | June 2004 | | June 2011 |
| | 186,915 | | – | | – | | 186,915 | | 481.50 | | June 2005 | | June 2012 |
| | | | | | | | | | | | | | |
| Share Match | 4,047 | | – | | – | | 4,047 | | 100 in total | | June 2001 | | June 2005 |
| | 3,884 | | – | | – | | 3,884 | | 100 in total | | Jan 2002 | | June 2006 |
| | 3,859 | | – | | – | | 3,859 | | 100 in total | | Jan 2002 | | June 2007 |
| | 5,635 | | – | | – | | 5,635 | | 100 in total | | June 2004 | | June 2008 |
| | 18,644 | | – | | – | | 18,644 | | 100 in total | | June 2005 | | June 2012 |
| | – | | – | | 25,000 | | 25,000 | | 100 in total | | June 2006 | | June 2013 |
| | | | | | | | | | | | | | |
| Sharesave | 3,692 | (i) | 3,692 | | 2,910 | (i) | 2,910 | | 317.00 | | Apr 2007 | | Sep 2007 |
|
|
|
|
|
|
|
|
|
|
|
|
|
|
| Total | 676,851 | | 3,692 | | 27,910 | | 701,069 | | | | | | |
| | |
| (i) | During the year, Roger Urwin elected to cancel his Sharesave option over 3,692 shares at an option price of 457p. He was granted a new Sharesave option over 2,910 shares. |
| | | | | | | | | | | | | | |
| Edward Astle | | | | | | | | | | | | | |
| ESOP | 193,952 | | – | | – | | 193,952 | | 479.50 | | Sep 2004 | | Sep 2011 |
| | 101,246 | | – | | – | | 101,246 | | 481.50 | | June 2005 | | June 2012 |
| | 112,262 | | – | | – | | 112,262 | | 434.25 | | Dec 2005 | | Dec 2012 |
| | – | | – | | 131,086 | (ii) | 131,086 | | 400.50 | | June 2006 | | June 2013 |
| | | | | | | | | | | | | | |
| Share Match | 6,553 | | – | | – | | 6,553 | | 100 in total | | June 2005 | | June 2012 |
| | – | | – | | 13,812 | | 13,812 | | 100 in total | | June 2006 | | June 2013 |
| | | | | | | | | | | | | | |
| Sharesave | 2,392 | | – | | – | | 2,392 | | 397.00 | | Sep 2005 | | Feb 2006 |
|
|
|
|
|
|
|
|
|
|
|
|
|
|
| Total | 416,405 | | – | | 144,898 | | 561,303 | | | | | | |
| | |
| (ii) | This grant of options satisfied an outstanding commitment to Edward Astle, as described in last year’s Directors’ Remuneration Report. |
Annual Report and Accounts 2003/04_National Grid Transco 63
Back to Contents
Directors’ Remuneration Report_continued
3. Directors’ interests in share options continued
| | Options held | | | | | | Options held | | | | | | |
| | at 1 April 2003 | | Options exercised | | | | at 31 March 2004 | | Exercise price | | | | |
| | or, if later, | | or lapsed | | Options granted | | or, if earlier, | | per share | | | | |
| | on appointment | * | during the year | | during the year | | on retirement | † | (pence) | | Normal exercise period |
|
|
|
|
|
|
|
|
|
|
|
|
|
|
| Steve Lucas | | | | | | | | | | | | | |
| ESOP | 54,404 | | – | | – | | 54,404 | | 434.25 | | Dec 2005 | | Dec 2012 |
| | | | | | | | | | | | | | |
| Sharesave | 2,700 | | – | | – | | 2,700 | | 350.00 | | Mar 2006 | | Aug 2006 |
|
|
|
|
|
|
|
|
|
|
|
|
|
|
| Total | 57,104 | | – | | – | | 57,104 | | | | | | |
| | | | | | | | | | | | | | |
| Steve Holliday | | | | | | | | | | | | | |
| ESOP | 150,000 | | – | | – | | 150,000 | | 540.00 | | Mar 2004 | | Mar 2011 |
| | 71,936 | | – | | – | | 71,936 | | 563.00 | | June 2004 | | June 2011 |
| | 101,246 | | – | | – | | 101,246 | | 481.50 | | June 2005 | | June 2012 |
| | | | | | | | | | | | | | |
| Share Match | 10,350 | | – | | – | | 10,350 | | 100 in total | | June 2005 | | June 2012 |
| | – | | – | | 14,083 | | 14,083 | | 100 in total | | June 2006 | | June 2013 |
| | | | | | | | | | | | | | |
| Sharesave | 4,692 | | – | | – | | 4,692 | | 350.00 | | Mar 2008 | | Aug 2008 |
|
|
|
|
|
|
|
|
|
|
|
|
|
|
| Total | 338,224 | | – | | 14,083 | | 352,307 | | | | | | |
| | | | | | | | | | | | | | |
| Rick Sergel | | | | | | | | | | | | | |
| ESOP | 201,845 | | – | | – | | 201,845 | | 566.50 | | Mar 2003 | | Mar 2010 |
| | 134,321 | | – | | – | | 134,321 | | 563.00 | | June 2004 | | June 2011 |
| | 172,836 | | – | | – | | 172,836 | | 481.50 | | June 2005 | | June 2012 |
|
|
|
|
|
|
|
|
|
|
|
|
|
|
| Total (shares) | 509,002 | | – | | – | | 509,002 | | | | | | |
| | | | | | | | | | | | | | |
| Phantom shares (iii) | 4,347 | | – | | – | | 4,347 | | – | | June 2004 | | |
| | 5,332 | | – | | – | | 5,332 | | – | | June 2005 | | |
| | – | | – | | 5,938 | | 5,938 | | – | | June 2006 | | |
|
|
|
|
|
|
|
|
|
|
|
|
|
|
| Total (phantom shares) | 9,679 | | – | | 5,938 | | 15,617 | | | | | | |
| | |
| (iii) | In place of participation in the Share Matching Plan, Rick Sergel elected to defer the ADS component of his bonus into a deferred compensation plan. He was awarded 5,938 phantom ADSs in June 2003 (at a base price of $32.32), 5,332 phantom ADSs in June 2002 and 4,347 phantom ADSs in June 2001. The value of ADSs at 31 March 2004 was $40.22. For a phantom award under a deferred compensation plan the ADS market value is tracked, additional value is accrued for dividends and the value is delivered, net of normal US deductions, after retirement. In the previous year’s Directors’ Remuneration Report, the phantom ADS award made in 2001 was disclosed in error as being over 4,240 ADSs. |
| | | | | | | | | | | | | | |
| Nick Winser | | | | | | | | | | | | | |
| (appointed to the Board on 28 April 2003) | | | | | | | | | | | | | |
| ESOP | 10,633 | * | – | | – | | 10,633 | | 375.75 | | June 2001 | | June 2008 |
| | 47,236 | * | – | | – | | 47,236 | | 455.25 | | June 2002 | | June 2009 |
| | 19,755 | * | – | | – | | 19,755 | | 531.50 | | June 2003 | | June 2010 |
| | 24,156 | * | – | | – | | 24,156 | | 563.00 | | June 2004 | | June 2011 |
| | 37,383 | * | – | | – | | 37,383 | | 481.50 | | June 2005 | | June 2012 |
| | | | | | | | | | | | | | |
| Share Match | 872 | * | – | | – | | 872 | | 100 in total | | Jan 2002 | | June 2006 |
| | 980 | * | – | | – | | 980 | | 100 in total | | Jan 2002 | | June 2007 |
| | 1,694 | * | – | | – | | 1,694 | | 100 in total | | June 2004 | | June 2008 |
| | 2,509 | * | – | | – | | 2,509 | | 100 in total | | June 2005 | | June 2012 |
| | – | | – | | 3,937 | | 3,937 | | 100 in total | | June 2006 | | June 2013 |
| | | | | | | | | | | | | | |
| Sharesave | 5,007 | * | – | | – | | 5,007 | | 337.00 | | Sep 2004 | | Feb 2005 |
|
|
|
|
|
|
|
|
|
|
|
|
|
|
| Total | 150,225 | * | – | | 3,937 | | 154,162 | | | | | | |
| | | | | | | | | | | | | | |
| John Wybrew | | | | | | | | | | | | | |
| (retired from the Board on 30 November 2003) | | | | | | | | | | | | |
| ESOP | 62,262 | | – | | – | | 62,262 | † | 434.25 | | Dec 2005 | | Dec 2012 |
| | | | | | | | | | | | | | |
| Sharesave | 3,078 | | – | | – | | 3,078 | † | 314.50 | | Mar 2004 | | Aug 2004 |
|
|
|
|
|
|
|
|
|
|
|
|
|
|
| Total | 65,340 | | – | | – | | 65,340 | † | | | | | |
64 National Grid Transco_Annual Report and Accounts 2003/04
Back to Contents
Directors’ Remuneration Report_continued
Executive Share Option Plan (ESOP)
Under the ESOP, awards of options were made over shares worth up to 300% of Executive Directors’ salaries. An option will normally be exercisable between the third and tenth anniversaries of its date of grant, subject to performance conditions. The performance conditions attaching to outstanding ESOP options are set out below. If the performance condition is not satisfied after the first three years then it will be re-tested as indicated.
Options granted to Directors in June 1999 and March 2000 became exercisable in full during the financial year as a result of the satisfaction of the performance condition, based on fully diluted earnings per share (EPS) growth (subject to adjustment to exclude exceptional items and other significant non-recurring items as the Remuneration Committee may consider appropriate), applying to those options. This condition required the EPS growth of the Group to exceed the growth in the UK Retail Price Index by at least 3% per annum over a three-year period. This was achieved over the three financial years 2001/02 to 2003/04. As a result of the Merger, the performance condition was tested by using National Grid Group plc EPS for the financial years 2000/01 to 2002/03 and National Grid Transco plc EPS for the financial year 2003/04. The EPS for National Grid Group plc for the financial year 2002/03 were reconstructed as though the Merger had not taken place. EPS growth was selected as an appropriate performance metric as it is a market-recognised measure of underlying financial performance.
For options granted from June 2000, options worth up to 100% of an optionholder’s base salary will become exercisable in full if Total Shareholder Return (TSR), measured over the period of three years beginning with the financial year in which the option is granted, is at least median compared with a comparator group of companies (such comparator group being in compliance with the performance condition). Grants in excess of 100% of salary vest on a sliding scale, becoming fully exercisable if the Group’s TSR is in the top quartile. The performance condition attaching to options granted in June 2000 is tested annually throughout the lifetime of the option. For options granted from March 2001, the same TSR test is used but the performance condition can only be re-tested in years four and five.
The comparator group was revised in June 2002 to reflect changes including consolidation in the marketplace, the acquisition of Niagara Mohawk and the proposed Merger. The revised comparator group was used for options granted in June and December 2002 and is set out below:
| Allegheny Energy, Inc. | Energy East Corporation | NSTAR Corporation | Scottish Power plc |
| BG Group plc | Exelon Corporation | Potomac Electric Power Company | The Southern Company, Inc. |
| British Energy plc | FirstEnergy Corporation | Powergen plc | TXU, Inc. |
| Centrica plc | FPL Group, Inc. | Progress Energy, Inc. | United Utilities plc |
| Consolidated Edison, Inc. | International Power plc | Public Service Enterprise Group, Inc. | Xcel Energy, Inc. |
| Duke Energy Corporation | Northeast Utilities Corporation | Scottish & Southern Energy plc | |
Details of the 1999 Lattice Long Term Incentive Scheme (LTIS) awards rolled over into options over or awards of National Grid Transco shares are set out in table 5 below. Details of the closing price of National Grid Transco shares as at 31 March 2004 and the high and low prices during the year are shown below table 6.
4. Directors’ interests in the Performance Share Plan
The table below gives details of the Executive Directors’ holdings of conditional shares awarded under the National Grid Transco Performance Share Plan (PSP).
| | Conditional | | | | | | | | | | | | Conditional | | |
| | shares at | | | | Market | | | | | | Lapsed | | shares at | | |
| | 1 April 2003 | | | | price at | | | | | | without | | 31 March 2004 | | |
| | or, if later, | | Awarded | | award | | Date | | Vested | | vesting | | or, if earlier, | | Release |
| Table 4 | on appointment | * | in year | (i) | (pence) | | of award | | in year | | in year | | on retirement | † | date |
|
|
|
|
|
|
|
|
|
|
|
|
|
|
|
|
| Roger Urwin | 0 | | 195,866 | | 405.25 | | June 2003 | | 0 | | 0 | | 195,866 | | June 2007 |
| Edward Astle | 0 | | 107,958 | | 405.25 | | June 2003 | | 0 | | 0 | | 107,958 | | June 2007 |
| Steve Holliday | 0 | | 115,669 | | 405.25 | | June 2003 | | 0 | | 0 | | 115,669 | | June 2007 |
| Steve Lucas | 0 | | 115,669 | | 405.25 | | June 2003 | | 0 | | 0 | | 115,669 | | June 2007 |
| Rick Sergel | 0 | | 152,063 | | 405.25 | | June 2003 | | 0 | | 0 | | 152,063 | | June 2007 |
| Nick Winser | 0 | * | 92,535 | | 405.25 | | June 2003 | | 0 | | 0 | | 92,535 | | June 2007 |
| John Wybrew | 0 | | 114,127 | | 405.25 | | June 2003 | | 0 | | 0 | | 114,127 | † | June 2007 |
|
|
|
|
|
|
|
|
|
|
|
|
|
|
|
|
| | |
| (i) | The performance criterion for PSP awards in the year to 31 March 2004 is based on the Group’s Total Shareholder Return (TSR) performance over a three-year period. Further details can be found on page 59. |
Annual Report and Accounts 2003/04_National Grid Transco 65
Back to Contents
Directors’ Remuneration Report_continued
5. Directors’ interests under the Lattice Long Term Incentive Scheme
The following table shows awards under the Lattice Long Term Incentive Scheme (LTIS) that were rolled over at the time of the Merger by John Wybrew and Steve Lucas and that were still held at 31 March 2003. The market value of National Grid Transco shares on Merger (21 October 2002) was 459.625p.
| Table 5 | | | Award held at | | | | Shares resulting | | Award | | Market price | | Award held | | Date award |
| Original | | 1 April 2003 | | Exercise price | | from dividend | | exercised/ | | at date of | | at 31 March | | released/option |
| award | | including dividend | | per share | | reinvestment | | lapsed | | exercise | | 2004 or on | | becomes |
| date | | reinvestment shares | | (pence) | | in year | | during year | | (pence) | | retirement† | | exercisable |
|
|
|
|
|
|
|
|
|
|
|
|
|
|
|
|
| John Wybrew | Oct 1999 | | 116,179 | | 100 in total | | 2,980 | | – | | – | | 119,159 | †(i) | Oct 2003 |
| | Nov 2000 | | 95,597 | | n/a | | – | | – | | – | | 95,597 | † | Nov 2004 |
| | Nov 2001 | | 112,687 | | n/a | | – | | – | | – | | 112,687 | † | Nov 2005 |
|
|
|
|
|
|
|
|
|
|
|
|
|
|
|
|
| Total | | | 324,463 | | | | 2,980 | | – | | | | 327,443 | † | |
| | | | | | | | | | | | | | | | |
| Steve Lucas | Oct 1999 | | 31,728 | | 100 in total | | 813 | | 32,541 | (ii) | 396.75 | | 0 | | Oct 2003 |
| | Nov 2000 | | 79,902 | | n/a | | 1,590 | | – | | – | | 81,492 | | Nov 2004 |
| | Nov 2001 | | 96,589 | | n/a | | – | | – | | – | | 96,589 | | Nov 2005 |
|
|
|
|
|
|
|
|
|
|
|
|
|
|
|
|
| Total | | | 208,219 | | | | 2,403 | | 32,541 | | | | 178,081 | | |
| | |
| (i) | The options comprising John Wybrew’s rolled-over 1999 LTIS award became exercisable at the normal date prior to his retirement and were exercised subsequent to his leaving the Group. |
| (ii) | The options comprising Steve Lucas’s rolled-over 1999 LTIS award became exercisable at the normal date and were exercised on 20 November 2003, realising a gain of £129,105. |
Lattice LTIS
Under the terms of the Lattice LTIS, notional allocations of shares were made to key individuals. The allocations were subject to a performance condition over three years as set out below and a further retention period of one year. The number of shares actually released to participants depends on the Group’s TSR compared with that of other regulated utility companies operating in a similar environment. Pursuant to the Merger process, John Wybrew and Steve Lucas agreed to roll over their existing LTIS awards, which were over Lattice Group shares, for LTIS awards or options over National Grid Transco shares.
For the roll-over of the 1999 LTIS award, John Wybrew and Steve Lucas were each granted a £1 option by the Trustee of the Lattice Group Employee Share Trust over the number of shares which would otherwise have been subject to their 1999 awards. From the date of roll-over, the arrangement was for the options to become exercisable on 1 October 2003, when the shares subject to the original 1999 awards would have been released to the holder of the LTIS interests.
The 2000 and 2001 LTIS awards held by John Wybrew and Steve Lucas continued over a number of National Grid Transco shares shown above and remain subject to the rules of the LTIS except that (i) since 21 October 2002, the performance target measures the Group’s TSR against the original comparator group of each award; and (ii) the awards will not be forfeit on ceasing employment unless the Committee decides otherwise.
The comparator group for the 2000 and 2001 LTIS awards is set out below:
| Powergen plc | Pennon Group plc | Centrica plc | British Energy plc |
| Kelda Group plc | United Utilities plc | Scottish Power plc | BT Group plc |
| Scottish & Southern Energy plc | Severn Trent plc | Viridian Group plc | Railtrack plc (2000 only) |
| BAA plc | AWG plc | International Power plc | Thames Water plc (2000 only) |
No awards will vest if the Group’s TSR over the performance period, when compared with that of the other companies in the comparator group, falls below median. For TSR between that of the median and upper quartile of comparator group constituent companies the proportion of shares that vests is calculated on a straight-line basis between 40% and 100%, and for TSR performance at or above upper quartile the awards vest in full.
66 National Grid Transco_Annual Report and Accounts 2003/04
Back to Contents
Directors’ Remuneration Report_continued
6. Directors’ beneficial interests
The Directors’ beneficial interests (which include those of their families) in the ordinary shares of National Grid Transco of 10p each are shown below.
| Table 6 | | | | | Options/awards over | | Options/awards over | |
| Ordinary shares at | | Ordinary shares at | | ordinary shares at | | ordinary shares at | |
| 31 March 2004 | (i) | 1 April 2003 | | 31 March 2004 | | 1 April 2003 | |
| or, if earlier, | | or, if later, | | or, if earlier, | | or, if later, | |
| on resignation† | | on appointment* | | on resignation† | | on appointment* | |
|
|
|
|
|
|
|
| |
| Sir John Parker | 40,229 | | 17,429 | | – | | – | |
| James Ross | 19,000 | | 19,000 | | – | | – | |
| Roger Urwin (ii), (iii), (iv) | 231,292 | | 159,518 | | 896,935 | | 676,851 | |
| Edward Astle (ii), (iii) | 11,973 | | 3,932 | | 669,261 | | 416,405 | |
| John Grant | 10,000 | | 10,000 | | – | | – | |
| Ken Harvey | 1,874 | | 1,874 | | – | | – | |
| Bonnie Hill | 2,930 | † | 2,930 | | – | | – | |
| Steve Holliday (ii), (iii), (iv) | 14,629 | | 6,210 | | 467,976 | | 338,224 | |
| Paul Joskow | 5,000 | | 5,000 | | – | | – | |
| Steve Lucas (iii), (v), (vi), (vii) | 42,961 | | 23,789 | | 350,854 | | 265,323 | |
| Stephen Pettit | 1,875 | | 1,875 | | – | | – | |
| Maria Richter | – | | –* | | – | | – | |
| George Rose | 5,025 | | 5,025 | | – | | – | |
| Rick Sergel (ii), (iii) | 3,058 | | 2,928 | | 661,065 | | 509,002 | |
| Nick Winser (ii), (iii) | 19,781 | | 17,489 | * | 246,697 | | 150,225 | * |
| John Wybrew (iii), (v), (vi), (vii) | 62,344 | † | 62,344 | | 506,910 | † | 389,803 | |
|
|
|
|
|
|
|
| |
| (i) | There has been no other change in the beneficial interests of the Directors in the ordinary shares of National Grid Transco between 1 April 2004 and 19 May 2004 except in respect of routine monthly purchases under the SIP (see note (iv) below). |
| (ii) | Each of the Executive Directors of National Grid Transco, with the exception of Steve Lucas and Rick Sergel, was, for Companies Act 1985 purposes, deemed to be a potential beneficiary under the National Grid Qualifying Employee Share Ownership Trust (QUEST) and, with the sole exception of Steve Lucas, in the National Grid 1996 Employee Benefit Trust and thereby to have an interest in the 7,759,944 National Grid Transco shares held by the QUEST and the 131,862 National Grid Transco shares held by the 1996 Employee Benefit Trust as at 31 March 2004. |
| (iii) | Including the PSP award detailed in Table 4 above. |
| (iv) | Beneficial interest includes shares purchased under the monthly operation of the SIP in the year to 31 March 2004. Further shares were purchased in April and May on behalf of Steve Holliday (59 shares) and Roger Urwin (59 shares). |
| (v) | The former Lattice Executive Director of National Grid Transco (Steve Lucas) was, for Companies Act 1985 purposes, deemed to be a potential beneficiary in the 395,402 National Grid Transco shares, held by Mourant and Co. Trustees as Trustee of the Lattice Group Employee Share Trust operated in conjunction with the Lattice LTIS, and the 17,647 National Grid Transco shares, held by Lattice Group Trustees Limited as Trustee of the Lattice Group Employee Share Ownership Trust, as at 31 March 2004. |
| (vi) | Beneficial interest includes shares acquired pursuant to the Lattice All Employee Share Ownership Plan and the BG Group Employee Profit Sharing Scheme. |
| (vii) | Including the Lattice LTIS awards detailed in Table 5 above. |
The closing price of a National Grid Transco share on 31 March 2004 was 430.00p. The range during the year was 438.00p (high) and 374.75p (low). Please note that the Register of Directors’ Interests contains full details of shareholdings and options/awards held by Directors as at 31 March 2004.
On behalf of the Board
Helen Mahy
Group Company Secretary and General Counsel
19 May 2004
Annual Report and Accounts 2003/04_National Grid Transco 67
Back to Contents
Directors’ Report and Operating and Financial Review
Directors’ Report
Incorporation
National Grid Transco plc is incorporated in England and Wales (No. 4031152) with its registered office at 1-3 Strand, London WC2N 5EH (telephone +44 (0)20 7004 3000). The Company was first incorporated on 11 July 2000.
Directors
Details of the Directors serving during the year and their interests in shares are on page 67.
Group activities
An outline of the Group’s businesses, their activities during the year and possible future developments are contained in the Chief Executive’s Review on pages 4 to 17 and on pages 21 to 51 of the Directors’ Report and Operating and Financial Review.
Post balance sheet events
There have been no material post balance sheet events.
Dividends
An interim dividend of 7.91 pence per share (US$0.6690 per ADS) was paid on 21 January 2004.
The Directors are recommending a final dividend of 11.87 pence per share (US$1.0500 per ADS) be paid on 23 August 2004. The payment of the final dividend is subject to shareholder approval at the Annual General Meeting. This would bring the total dividend for 2003/04 to 19.78 pence per share (US$1.7190 per ADS).
Research and development
Expenditure on research and development in 2003/04 was £10 million, compared with £18.2 million in 2002/03 and £16.0 million in 2001/02.
Share buy-back
National Grid Transco has authority from shareholders to repurchase up to 10% of its own shares. This authority was not used during 2003/04, nor in the period up to the publication of this report.
The Board intends to seek shareholder approval to renew this authority at the Annual General Meeting.
Companies are now permitted to hold repurchased shares as treasury shares rather than cancelling them.
The Board has no current intention to hold repurchased shares as treasury shares, other than as required for share schemes.
Political donations
The Group made no political donations in the UK or EU during the year (including donations as defined for the purposes of the Political Parties, Elections and Referendums Act 2000).
National Grid USA’s political action committees, funded entirely by voluntary employee contributions, gave US$71,000 (£42,262) to US state and national political and campaign committees in 2003/04. As of the date of this report, our US businesses contibuted a total of US$50,000 (£29,762) in connection with the Democratic and Republican national conventions being held this summer in Massachusetts and New York. All of these contributions are in compliance with US state and Federal law.
Charitable donations
During 2003/04 charitable donations of £1,227,877 were made in the UK (£1,209,500 in 2002/03).
During 2003/04, charitable donations of approximately US$3,139,000 (£1,868,452) million were made in the US (approximately US$3.0 million (£1.9 million) in 2002/03).
Policy on payment of creditors
National Grid Transco is a signatory to the Better Payment Practice Code, details of which can be found at www.payontime.co.uk.
The average creditor payment period at 31 March 2004 for the Group’s principal operations in the UK was 26 days.
Substantial shareholders
As at 19 May 2004, National Grid Transco had been notified of the following beneficial interests in 3% or more of its issued share capital:
| | % of |
| | issued |
| | share |
| | capital |
|
|
| The Capital Group Companies, Inc. | 10.0 |
| Legal and General Investment Management Ltd | 3.6 |
| Barclays plc | 3.1 |
| Franklin Resources, Inc. | 3.0 |
|
|
No further notifications have been received.
Employment policy
Information on National Grid Transco’s employee policies is included on pages 16 and 17 under the heading ‘Our People’.
Employee share ownership
The Group facilitates share ownership amongst its employees by the operation of both sharesave and share incentive plans in the UK.
In the US, employees are able to invest in the Group through employee incentive thrift plans.
Annual General Meeting
National Grid Transco’s Annual General Meeting will be held on Monday 26 July 2004. Details are set out in a separate Notice of Annual General Meeting.
On behalf of the Board
Helen Mahy
Group Company Secretary and General Counsel
19 May 2004
National Grid Transco plc
Registered office:
1-3 Strand, London WC2N 5EH
Registered in England and Wales: No. 4031152
68 National Grid Transco_Annual Report and Accounts 2003/04
Back to Contents
Statement of Directors’ Responsibilities for Preparing the Accounts
The Directors are required by the Companies Act 1985 to prepare accounts for each financial year which give a true and fair view of the state of affairs of the Company and of the Group as at the end of the financial year and of the profit or loss of the Group for the financial year.
The Directors consider that in preparing the accounts (detailed in the following sections: Principal Accounting Policies, Accounts and Notes to the Accounts) the Company has used appropriate accounting policies, consistently applied and supported by reasonable and prudent judgements and estimates and all applicable accounting standards have been followed.
The Directors have responsibility for ensuring that the Company keeps accounting records which disclose with reasonable accuracy the financial position of the Company and of the Group and which enable them to ensure that the accounts comply with the Companies Act 1985. The Directors have general responsibility for taking such steps as are reasonably open to them to safeguard the assets of the Group and to prevent and to detect fraud and other irregularities.
The Directors, having prepared the accounts, have requested the Auditors to take whatever steps and to undertake whatever inspections they consider to be appropriate for the purposes of enabling them to give their audit report.
The Directors confirm that the Audit Committee continues to review the adequacy of the system of internal financial controls adopted by the Group.
Annual Report and Accounts 2003/04_National Grid Transco 69
Back to Contents
Accounting Policies
a) Basis of preparation of accounts
The accounts are prepared under the historical cost convention and in accordance with applicable UK accounting and financial reporting standards.
The accounts have been prepared in accordance with UK GAAP, which differs in certain respects from US GAAP. A summary of the results under US GAAP is shown in note 31 to the accounts and an explanation of the main differences between UK and US GAAP is set out in note 32.
The preparation of accounts in conformity with generally accepted accounting principles requires management to make estimates and assumptions that affect the reported amounts of assets and liabilities, disclosures of contingent assets and liabilities and the reported amounts of revenue and expenses during the reporting period. Actual results could differ from these estimates.
The Group has adopted Urgent Issues Task Force (UITF) 38 ‘Accounting for ESOP trusts’ during the year. The impact of the adoption is shown in note 1.
The Group is following the transitional arrangements of Financial Reporting Standard (FRS) 17 ‘Retirement Benefits’. The required disclosures are shown in note 7.
b) Basis of consolidation
The Group accounts include the accounts of the Company and all its subsidiary undertakings (‘Group undertakings’), together with the Group’s share of the results and net assets of its associate and joint ventures (‘associated undertakings’), less any provision for impairment. An associated undertaking is an entity in which the Group has a participating interest and over which it exercises a significant influence. The accounts of Group and associated undertakings used for consolidation are generally made up to 31 March. However, where this has not been practical, the results of certain Group and associated undertakings have been based on their accounts to 31 December.
The results of newly acquired Group and associated undertakings are included in the Group accounts from the date the Group acquires control or, in respect of associated undertakings, an equity interest which enables it to exercise a significant influence. The results of Group and associated undertakings are included in the Group accounts up to the date that control or the exercise of significant influence, as appropriate, is relinquished.
In translating into sterling the Group’s share of the net assets and results of a joint venture operating in a hyper-inflationary economy for the years ended 31 March 2003 and 2004, adjustments have been made to reflect current price levels. Such adjustments have been reflected through the Group profit and loss account or statement of total recognised gains and losses as appropriate. The Group’s share of the gain on net monetary liabilities has been credited to the Group profit and loss account through ‘net interest’, and where the effect is material is shown as part of the Group’s exceptional financing costs (see note 4(c)).
The 21 October 2002 business combination of National Grid and Lattice met the merger accounting criteria under UK GAAP and the Companies Act 1985 and therefore the transaction was accounted for as a merger. The consolidated accounts have been prepared as if National Grid and Lattice had always comprised the Group. The combined accounts were adjusted for the issue on Merger of 1,323m shares with a nominal value of £132m and for the elimination of balances between the former groups.
c) Goodwill
Goodwill, representing the excess of the fair value of the consideration given over the fair value of the identifiable net assets acquired, is capitalised and amortised on a straight-line basis, through the profit and loss account over its estimated useful economic life, principally 20 years.
d) Foreign currencies
The results of the Group’s overseas operations are generally translated into sterling at weighted average rates of exchange for the period the overseas operations are included within the Group accounts. In certain limited circumstances, where the use of a weighted average rate would distort material transactions, those transactions are separately translated at the rates of exchange relevant to the dates on which the transactions occurred.
Exchange differences arising on the translation of the opening net assets of overseas operations, the re-translation of the retained earnings of overseas operations from average to closing rates of exchange and the translation of foreign currency borrowings or derivatives taken to hedge overseas assets are taken directly to reserves. Tax charges or credits arising on such items are also taken directly to reserves.
Assets and liabilities in foreign currencies are generally translated at the rates of exchange ruling at the balance sheet date. In respect of certain assets or liabilities that are matched by an exact and directly related forward exchange derivative, the relevant asset or liability is translated at the rate of exchange under the related derivative.
All other exchange differences and related tax charges or credits are taken to the profit and loss account and disclosed separately where deemed exceptional.
e) Tangible fixed assets and depreciation
Tangible fixed assets are included in the balance sheet at their cost less accumulated depreciation. Cost includes payroll and finance costs incurred which are directly attributable to the construction of tangible fixed assets.
Tangible fixed assets include assets in which the Group’s interest comprises legally protected statutory or contractual rights of use.
Depreciation periods for categories of tangible fixed assets | Years |
|
| Plant and machinery | |
| Electricity transmission plant | 15 to 60 |
| Electricity distribution plant | 15 to 60 |
| Interconnector plant | 15 to 60 |
| Gas plant – mains, services and regulating equipment | 30 to 65 |
| Gas plant – storage | 40 |
| Gas plant – meters | 10 to 33 |
| Freehold and leasehold buildings | up to 65 |
| Motor vehicles and office equipment | up to 10 |
|
72 National Grid Transco_Annual Report and Accounts 2003/04
Back to Contents
Accounting Policies_continued
Additions represent the purchase or construction of new assets and extensions to or significant increases in the capacity of tangible fixed assets. Contributions received towards the cost of tangible fixed assets are included in creditors as deferred income and credited on a straight-line basis to the profit and loss account over the estimated economic lives of the assets.
No depreciation is provided on freehold land and assets in the course of construction. Other tangible fixed assets are depreciated, principally on a straight-line basis, at rates estimated to write off their book values over their estimated useful economic lives. In assessing estimated useful economic lives, which are reviewed on a regular basis, consideration is given to any contractual arrangements and operational requirements relating to particular assets. Unless otherwise determined by operational requirements, the depreciation periods for the principal categories of tangible fixed assets are, in general, as shown on the previous page.
During 2004, the Group modified some depreciation periods to more accurately reflect the economic lives of the assets. There has not been any significant change to the depreciation charged in the year as a result of the modification.
f) Impairment of fixed assets
Impairments of fixed assets are calculated as the difference between the carrying values of the net assets of income generating units, including, where appropriate, investments and goodwill, and their recoverable amounts. Recoverable amount is defined as the higher of net realisable value or estimated value in use at the date the impairment review is undertaken. Net realisable value represents the net amount that can be generated through sale of the assets. Value in use represents the present value of expected future cash flows discounted on a pre-tax basis, using the estimated cost of capital of the income generating unit.
Impairment reviews are carried out if there is some indication that an impairment may have occurred, or where otherwise required, to ensure that fixed assets are not carried above their estimated recoverable amounts.
Impairments are recognised in the profit and loss account, and where material are disclosed as exceptional.
g) Replacement expenditure
Replacement expenditure represents the cost of planned maintenance of the UK’s gas mains and services assets by replacing or lining sections of pipe. This expenditure is principally undertaken to repair and to maintain the safety of the network and is written off as incurred. Expenditure that enhances the performance of the mains and services assets is treated as an addition to tangible fixed assets.
h) Deferred taxation and investment tax credits
Deferred taxation is provided in full on all material timing differences, with certain exceptions. No provision for deferred taxation is made for any timing differences on non-monetary assets arising from fair value adjustments, except where there is a binding agreement to sell the assets concerned. However, no provision is made where it is more likely than not that any taxable gain will be rolled over into replacement assets.
Deferred tax assets are only recognised to the extent that they are considered recoverable.
Deferred tax balances have not been discounted.
Investment tax credits are amortised over the economic life of the asset giving rise to the credits.
i) Stocks
Stocks are carried at cost less provision for deterioration and obsolescence.
j) Regulatory assets
The US Statement of Financial Accounting Standards 71 ‘Accounting for the Effects of Certain Types of Regulation’ (SFAS 71) establishes US GAAP for utilities whose regulators have the power to approve and/or regulate rates that may be charged to customers. Provided that through the regulatory process the utility is substantially assured of recovering its allowable costs by the collection of revenue from its customers, such costs not yet recovered are deferred as regulatory assets. Due to the different regulatory environment, no equivalent accounting standard applies in the UK.
Under UK GAAP, regulatory assets established in accordance with the principles of SFAS 71 are recognised in debtors where they comprise rights or other access to future economic benefits which arise as a result of past transactions or events which have created an obligation to transfer economic benefit to a third party. Measurement of the past transaction or event and hence of the regulatory asset is determined in accordance with UK GAAP.
k) Decommissioning and environmental costs
Decommissioning and environmental costs, based on discounted future estimated expenditures, are provided for in full and where appropriate a corresponding tangible fixed asset or regulatory asset is also recognised. The unwinding of the discount is included within the profit and loss account as a financing charge net of the unwinding of the discount on any related regulatory asset.
l) Turnover
Turnover primarily represents the amounts derived from the supply, transmission and distribution of energy and the provision of related services, including the recovery of stranded costs. Turnover includes an assessment of energy and transportation services supplied to customers between the date of the last meter reading and the year end, excludes inter-business and inter-company transactions, and is stated net of value added tax and similar sales-based taxes. Where revenues received or receivable exceed the maximum amount permitted by regulatory agreement and adjustments will be made to future prices to reflect this over-recovery, no liability is recognised.
m) Pensions and other post-retirement benefits
The cost of providing pensions and other post-retirement benefits is charged to the profit and loss account on a systematic basis over the service lives of the employees in the schemes. Variations from the regular pension cost are allocated over the estimated average remaining service lives of current employees, with the interest component of any variation being reflected in net interest and the other component reflected through staff costs.
n) Leases
Operating lease payments are charged to the profit and loss account on a straight-line basis over the term of the lease.
Annual Report and Accounts 2003/04_National Grid Transco 72
Back to Contents
Accounting Policies_continued
o) Financial instruments
Derivative financial instruments (‘derivatives’) are used by the Group mainly for the management of its interest rate and foreign currency exposures and commodity price risks in respect of expected energy usage. The principal derivatives used include interest rate swaps, currency swaps, forward foreign currency agreements, interest rate swaptions and indexed swap contracts relating to the purchase of energy.All transactions are undertaken with a view to, or maintained to, provide a commercial hedge of the interest, currency or commodity price risks associated with the Group’s underlying business activities and the financing of those activities. Amounts payable or receivable in respect of interest rate swaps are recognised in the profit and loss account over the economic lives of the agreements or underlying position being hedged, either within net interest or disclosed separately where deemed exceptional.
Termination payments made or received in respect of derivatives are spread over the shorter of the life of the original instrument or the life of the underlying exposure in cases where the underlying exposure continues to exist. Where the underlying exposure ceases to exist, any termination payments are taken to the profit and loss account.
Those derivatives, relating both to interest rates and/or currency exchange, that are directly associated with a specific transaction and exactly match the underlying cash flows relating to the transaction are accounted for on the basis of the combined economic result of the transaction including the related derivative.
All other currency swaps and forward currency agreements are translated at the rate of exchange prevailing at the balance sheet date with the corresponding exchange adjustment being dealt with in reserves or the profit and loss account as appropriate.
Liabilities recognised in respect of index-linked swap contracts relating to the purchase of energy are measured on the basis of their estimated market value. In addition, a corresponding movement in the value of a related regulatory asset is also recognised.
p)Restructuring costs
Costs arising from Group restructuring programmes primarily relate to redundancy costs. Redundancy costs are charged to the profit and loss account in the period in which the Group becomes irrevocably committed to incurring the costs and the main features of the restructuring plan have been announced to affected employees. Redundancy costs are classified as part of ‘other operating charges’ as these costs do not relate to services provided by employees for the year.73 National Grid Transco_Annual Report and Accounts 2003/04
Back to Contents
Group Profit and Loss Account for the years ended 31 March
| | | | 2004 | | | 2003 | | | 2002 | |
| | Notes | | £m | | | £m | | | £m | |
|
|
|
|
|
|
|
|
|
| |
| Turnover, including share of joint ventures’ | | | 9,104 | | | 9,566 | | | 7,821 | |
| Less: share of joint ventures’ turnover – continuing operations | | | (71 | ) | | (99 | ) | | (141 | ) |
| Less: share of joint ventures’ turnover – discontinued operations | | | – | | | (67 | ) | | (126 | ) |
|
|
|
|
|
|
|
|
|
| |
| Group turnover – continuing operations | | | 8,875 | | | 8,833 | | | 7,078 | |
| Group turnover – discontinued operations | | | 158 | | | 567 | | | 476 | |
| Group turnover | 2 | (a) | 9,033 | | | 9,400 | | | 7,554 | |
| | | | | | | | | | | |
| Operating costs | 3 | | (7,178 | ) | | (7,788 | ) | | (6,494 | ) |
|
|
|
|
|
|
|
|
|
| |
| Operating profit of Group undertakings – continuing operations | 2 | (b) | 1,855 | | | 1,806 | | | 1,558 | |
| Operating loss of Group undertakings – discontinued operations | 2 | (b) | – | | | (194 | ) | | (498 | ) |
| | | | 1,855 | | | 1,612 | | | 1,060 | |
| | | | | | | | | | | |
| Share of joint ventures’ operating profit/(loss) – continuing operations | 2 | (b) | 7 | | | 15 | | | (29 | ) |
| Share of joint ventures’ and associate’s operating profit/(loss) – discontinued operations | 2 | (b) | – | | | 109 | | | (672 | ) |
| | | | 7 | | | 124 | | | (701 | ) |
|
|
|
|
|
|
|
|
|
| |
| Operating profit | | | | | | | | | | |
| – Before exceptional items and goodwill amortisation | 2 | (b) | 2,238 | | | 2,185 | | | 1,783 | |
| – Exceptional items – continuing operations | 4 | (a) | (277 | ) | | (308 | ) | | (285 | ) |
| – Exceptional items – discontinued operations | 4 | (a) | – | | | (39 | ) | | (1,042 | ) |
| – Goodwill amortisation | | | (99 | ) | | (102 | ) | | (97 | ) |
| Total operating profit | 2 | (b) | 1,862 | | | 1,736 | | | 359 | |
| | | | | | | | | | | |
| Gain on assets held for exchange – discontinued operations | 4 | (b) | 226 | | | – | | | – | |
| Profit on disposal of tangible fixed assets – continuing operations | 4 | (b) | 96 | | | 48 | | | 94 | |
| Loss on sale or termination of operations – discontinued operations | 4 | (b) | – | | | (68 | ) | | – | |
| Merger costs – continuing operations | 4 | (b) | – | | | (79 | ) | | – | |
| Gain on sale of shares by employee share plan – continuing operations | 4 | (b) | – | | | – | | | 31 | |
| Profit on disposal of investments – discontinued operations | 4 | (b) | – | | | – | | | 31 | |
| Net interest | | | | | | | | | | |
| – Excluding exceptional items | 8 | | (822 | ) | | (939 | ) | | (657 | ) |
| – Exceptional items | 4 | (c),8 | – | | | (31 | ) | | (142 | ) |
| Total interest | 8 | | (822 | ) | | (970 | ) | | (799 | ) |
|
|
|
|
|
|
|
|
|
| |
| Profit/(loss) on ordinary activities before taxation | | | 1,362 | | | 667 | | | (284 | ) |
| Taxation | | | | | | | | | | |
| – Excluding exceptional items | 9 | | (350 | ) | | (373 | ) | | (251 | ) |
| – Exceptional items | 4 | (d),9 | 89 | | | 128 | | | 166 | |
| Total taxation | 9 | | (261 | ) | | (245 | ) | | (85 | ) |
|
|
|
|
|
|
|
|
|
| |
| Profit/(loss) on ordinary activities after taxation | | | 1,101 | | | 422 | | | (369 | ) |
| Minority interests | | | | | | | | | | |
| – Excluding exceptional items | | | (2 | ) | | (3 | ) | | (2 | ) |
| – Exceptional items | 4 | (e) | – | | | (28 | ) | | 50 | |
| Total minority interests | | | (2 | ) | | (31 | ) | | 48 | |
|
|
|
|
|
|
|
|
|
| |
| Profit/(loss) for the year | | | | | | | | | | |
| – Before exceptional items and goodwill amortisation | | | 1,064 | | | 870 | | | 873 | |
| – Exceptional items – operating | 4 | (a) | (277 | ) | | (347 | ) | | (1,327 | ) |
| – Exceptional items – non-operating | 4 | (b) | 322 | | | (99 | ) | | 156 | |
| – Exceptional items – financing | 4 | (c) | – | | | (31 | ) | | (142 | ) |
| – Exceptional items – taxation | 4 | (d) | 89 | | | 128 | | | 166 | |
| – Exceptional items – minority interests | 4 | (e) | – | | | (28 | ) | | 50 | |
| – Goodwill amortisation | | | (99 | ) | | (102 | ) | | (97 | ) |
| Profit/(loss) for the year | | | 1,099 | | | 391 | | | (321 | ) |
| Dividends | 10 | | (609 | ) | | (530 | ) | | (580 | ) |
|
|
|
|
|
|
|
|
|
| |
| Profit/(loss) transferred to/(from) profit and loss account reserve | 24 | | 490 | | | (139 | ) | | (901 | ) |
|
|
|
|
|
|
|
|
|
| |
| Earnings/(loss) per ordinary share | | | | | | | | | | |
| – Basic, including exceptional items and goodwill amortisation | 11 | | 35.8 | p | | 12.7 | p | | (11.3 | )p |
| – Adjusted basic, excluding exceptional items and goodwill amortisation | 11 | | 34.7 | p | | 28.3 | p | | 30.8 | p |
| – Diluted, including exceptional items and goodwill amortisation | 11 | | 35.7 | p | | 12.8 | p | | (10.1 | )p |
| – Adjusted diluted, excluding exceptional items and goodwill amortisation | 11 | | 34.6 | p | | 27.9 | p | | 30.2 | p |
|
|
|
|
|
|
|
|
|
| |
The notes on pages 77 to 128 form part of the Accounts.
Annual Report and Accounts 2003/04_National Grid Transco 74
Back to Contents
Balance Sheets at 31 March
| | | | Group | | | Company | |
| | | | 2004 | | | 2003 | | | 2004 | | | 2003 | |
| | | | | | | (restated) | | | | | | | |
| | Notes | | £m | | | £m | | | £m | | | £m | |
|
|
|
|
|
|
|
|
|
|
|
|
| |
| Fixed assets | | | | | | | | | | | | | |
| Intangible assets | 12 | | 1,537 | | | 1,893 | | | – | | | – | |
| Tangible assets | 13 | | 16,706 | | | 16,847 | | | – | | | – | |
| Investments in joint ventures | | | | | | | | | | | | | |
| – Share of gross assets | | | 395 | | | 542 | | | – | | | – | |
| – Share of gross liabilities | | | (376 | ) | | (498 | ) | | – | | | – | |
| – Share of net assets | | | 19 | | | 44 | | | – | | | – | |
| Other investments | | | 132 | | | 170 | | | 2,225 | | | 2,225 | |
| Total investments | 14 | | 151 | | | 214 | | | 2,225 | | | 2,225 | |
|
|
|
|
|
|
|
|
|
|
|
|
| |
| | | | 18,394 | | | 18,954 | | | 2,225 | | | 2,225 | |
|
|
|
|
|
|
|
|
|
|
|
|
| |
| Current assets | | | | | | | | | | | | | |
| Stocks | 15 | | 91 | | | 126 | | | – | | | – | |
| Debtors (amounts falling due within one year) | 16 | | 1,588 | | | 1,811 | | | 3,884 | | | 2,664 | |
| Debtors (amounts falling due after more than one year) | 16 | | 2,708 | | | 3,395 | | | – | | | – | |
| Assets held for exchange | 17 | | – | | | 17 | | | – | | | – | |
| Current asset investments | | | 520 | | | 482 | | | 6 | | | 123 | |
| Cash at bank and in hand | | | 96 | | | 119 | | | – | | | 1 | |
|
|
|
|
|
|
|
|
|
|
|
|
| |
| | | | 5,003 | | | 5,950 | | | 3,890 | | | 2,788 | |
| Creditors (amounts falling due within one year) | | | | | | | | | | | | | |
| Borrowings | | | (1,706 | ) | | (2,246 | ) | | (388 | ) | | (557 | ) |
| Other creditors | | | (2,807 | ) | | (2,800 | ) | | (2,056 | ) | | (1,764 | ) |
| | 18 | | (4,513 | ) | | (5,046 | ) | | (2,444 | ) | | (2,321 | ) |
|
|
|
|
|
|
|
|
|
|
|
|
| |
| Net current assets | | | 490 | | | 904 | | | 1,446 | | | 467 | |
|
|
|
|
|
|
|
|
|
|
|
|
| |
| Total assets less current liabilities | | | 18,884 | | | 19,858 | | | 3,671 | | | 2,692 | |
Creditors (amounts falling due after more than one year) | | | | | | | | | | | | | |
| Convertible bonds | | | – | | | (502 | ) | | – | | | – | |
| Other borrowings | | | (11,542 | ) | | (11,731 | ) | | (746 | ) | | – | |
| Other creditors | | | (1,922 | ) | | (2,022 | ) | | (13 | ) | | – | |
| | 19 | | (13,464 | ) | | (14,255 | ) | | (759 | ) | | – | |
| Provisions for liabilities and charges | 22 | | (4,157 | ) | | (4,406 | ) | | – | | | – | |
|
|
|
|
|
|
|
|
|
|
|
|
| |
| Net assets employed | | | 1,263 | | | 1,197 | | | 2,912 | | | 2,692 | |
|
|
|
|
|
|
|
|
|
|
|
|
| |
| Capital and reserves | | | | | | | | | | | | | |
| Called up share capital | 23 | | 309 | | | 308 | | | 309 | | | 308 | |
| Share premium account | 24 | | 1,280 | | | 1,247 | | | 1,280 | | | 1,247 | |
| Other reserves | 24 | | (5,131 | ) | | (5,131 | ) | | 2 | | | 2 | |
| Profit and loss account | 24 | | 4,755 | | | 4,689 | | | 1,321 | | | 1,135 | |
|
|
|
|
|
|
|
|
|
|
|
|
| |
| Equity shareholders’ funds | | | 1,213 | | | 1,113 | | | 2,912 | | | 2,692 | |
| Minority interests | | | | | | | | | | | | | |
| Equity | | | 12 | | | 15 | | | – | | | – | |
| Non-equity | 25 | | 38 | | | 69 | | | – | | | – | |
| | | | 50 | | | 84 | | | – | | | – | |
|
|
|
|
|
|
|
|
|
|
|
|
| |
| | | | 1,263 | | | 1,197 | | | 2,912 | | | 2,692 | |
|
|
|
|
|
|
|
|
|
|
|
|
| |
Commitments and contingencies are shown in note 29.
The notes on pages 77 to 128 inclusive form part of the accounts which were approved by the Board of Directors on 19 May 2004 and were signed on its behalf by:
Sir John Parker Chairman
Steve Lucas Group Finance Director
75 National Grid Transco_Annual Report and Accounts 2003/04
Back to Contents
Group Cash Flow Statement for the years ended 31 March
| | | | 2004 | | | 2003 | | | 2002 | |
| | Notes | | £m | | | £m | | | £m | |
|
|
|
|
|
|
|
|
|
| |
| Net cash inflow from operating activities before exceptional items | 27 | (a) | 3,058 | | | 3,154 | | | 2,394 | |
| Expenditure relating to exceptional items | | | (248 | ) | | (328 | ) | | (103 | ) |
| Net cash inflow from operating activities | | | 2,810 | | | 2,826 | | | 2,291 | |
| | | | | | | | | | | |
| Dividends from joint ventures | | | 8 | | | 11 | | | 13 | |
| | | | | | | | | | | |
| Returns on investments and servicing of finance | | | | | | | | | | |
| Interest received and similar income | | | 137 | | | 56 | | | 88 | |
| Interest paid and similar charges | | | (823 | ) | | (957 | ) | | (784 | ) |
| Dividends paid to minority interests | | | (6 | ) | | (11 | ) | | (9 | ) |
| Net cash outflow for returns on investments and servicing of finance | | | (692 | ) | | (912 | ) | | (705 | ) |
| | | | | | | | | | | |
| Taxation | | | | | | | | | | |
| Net corporate tax paid | | | (18 | ) | | (112 | ) | | (212 | ) |
| | | | | | | | | | | |
| Capital expenditure and financial investment | | | | | | | | | | |
| Net payments to acquire intangible and tangible fixed assets | | | (1,400 | ) | | (1,518 | ) | | (1,734 | ) |
| Receipts from disposals of tangible fixed assets | | | 146 | | | 111 | | | 191 | |
| Receipts from disposals of shares by an employee share plan | | | – | | | – | | | 50 | |
| Other | | | – | | | – | | | 10 | |
| Net cash outflow for capital expenditure and financial investment | | | (1,254 | ) | | (1,407 | ) | | (1,483 | ) |
| | | | | | | | | | | |
| Acquisitions and disposals | | | | | | | | | | |
| Payments to acquire investments | | | (26 | ) | | (165 | ) | | (56 | ) |
| Receipts from disposals of investments | 27 | (b) | 33 | | | 328 | | | 37 | |
| Acquisition of Group undertaking | 27 | (c) | – | | | – | | | (950 | ) |
Net cash inflow/(outflow) for acquisitions and disposals | | | 7 | | | 163 | | | (969 | ) |
| | | | | | | | | | | |
| Equity dividends paid | | | (560 | ) | | (571 | ) | | (478 | ) |
|
|
|
|
|
|
|
|
|
| |
Net cash inflow/(outflow) before the management of liquid resources and financing | | | 301 | | | (2 | ) | | (1,543 | ) |
| | | | | | | | | | | |
| Management of liquid resources | | | | | | | | | | |
| (Increase)/decrease in short-term deposits | | | (48 | ) | | (138 | ) | | 347 | |
Net cash (outflow)/inflow from the management of liquid resources | 27 | (d),(e) | (48 | ) | | (138 | ) | | 347 | |
| | | | | | | | | | | |
| Financing | | | | | | | | | | |
| Issue of ordinary shares | | | 38 | | | 4 | | | 12 | |
| Payments to repurchase ordinary shares | | | – | | | (97 | ) | | – | |
| Termination of cross currency swaps | 27 | (d) | 148 | | | – | | | – | |
| (Decrease)/increase in borrowings | 27 | (d),(e) | (426 | ) | | 267 | | | 1,206 | |
| Net cash (outflow)/inflow from financing | | | (240 | ) | | 174 | | | 1,218 | |
|
|
|
|
|
|
|
|
|
| |
| Movement in cash and overdrafts | 27 | (d),(e) | 13 | | | 34 | | | 22 | |
|
|
|
|
|
|
|
|
|
| |
| Included in the cash flows above are cash flows for discontinued operations as set out below: | | | | | | | | | | |
| | | | | | | | | | | |
| | | | 2004 | | | 2003 | | | 2002 | |
| | | | £m | | | £m | | | £m | |
|
|
|
|
|
|
|
|
|
| |
| Net cash inflow/(outflow) from operating activities | | | 5 | | | (70 | ) | | 53 | |
| Net cash outflow for returns on investments and servicing of finance | | | (2 | ) | | (14 | ) | | (3 | ) |
| Net cash (outflow)/inflow for taxation | | | – | | | (1 | ) | | 13 | |
| Net cash outflow for capital expenditure and financial investment | | | (1 | ) | | (123 | ) | | (344 | ) |
| Net cash outflow for acquisitions and disposals | | | – | | | (3 | ) | | (12 | ) |
|
|
|
|
|
|
|
|
|
| |
| Net cash inflow/(outflow) before the management of liquid resources and financing | | | 2 | | | (211 | ) | | (293 | ) |
|
|
|
|
|
|
|
|
|
| |
Liquid resources comprise money market deposits, equities and gilts.
Group Statement of Total Recognised Gains and Losses for the years ended 31 March
| | 2004 | | 2003 | | 2002 | |
| | £m | | £m | | £m | |
|
|
|
|
|
| |
| | | | | | | |
| Profit/(loss) for the year | 1,099 | | 391 | | (321 | ) |
| Exchange adjustments | (417 | ) | (322 | ) | (58 | ) |
| Tax on exchange adjustments | (12 | ) | 12 | | 21 | |
| Reduction in revaluation reserve on reclassification of investment properties | – | | – | | (50 | ) |
| Unrealised gain on transfer of fixed assets to a joint venture (net of tax) | – | | 6 | | 7 | |
|
|
|
|
|
| |
| | | | | | | |
| Total recognised gains and losses | 670 | | 87 | | (401 | ) |
|
|
|
|
|
| |
The notes on pages 77 to 128 form part of the Accounts.
Annual Report and Accounts 2003/04_National Grid Transco 76
Back to Contents
Notes to the Accounts
1. Adoption of UITF 38
During the year, the Group adopted UITF 38 ‘Accounting for ESOP trusts’. The adoption of this standard constitutes a change in accounting policy. Therefore, the impact has been reflected as a prior year adjustment in accordance with Financial Reporting Standard 3. At 31 March 2003, the Group reported £39m of own shares within fixed asset investments. On adoption of UITF 38, the own shares were reclassified from fixed asset investments and are now reflected within the profit and loss account reserve. The adoption of UITF 38 has resulted in a decrease in net assets of £34m at 31 March 2004 and £39m at 31 March 2003.2. Segmental analysisSegmental information is presented in accordance with the management responsibilities and economic characteristics of the Group’s business activities. Management responsibilities changed during the year ended 31 March 2004. Segmental reporting has been aligned to reflect the changes in responsibilities, resulting in a restatement of segmental results for the years ended 31 March 2003 and 31 March 2002. The principal effect of this is to reclassify the results of the UK Interconnectors and LNG Storage businesses from ‘UK electricity and gas transmission’ to ‘Other activities’.
The US electricity distribution segment shown below includes the recovery of stranded costs.
‘Continuing operations – Other activities’ primarily relates to: gas metering activities; liquefied natural gas storage activities; the UK electricity interconnector business; Advantica – the energy technology and systems solutions business; and Gridcom which provides telecommunications infrastructure to operators in the UK and the US.
Discontinued operations comprise activities formerly within Other activities. Discontinued operations primarily include EnMO for all years presented, The Leasing Group and 186k Limited for 2003 and 2002 in Group undertakings, and telecom joint ventures and an associate in 2003 and 2002.
In the 2002 segmental analysis of turnover and operating profit, the repayment of £267m of surplus entry capacity auction revenue, that was rebated to shippers through distribution tariffs, has been reported within the UK electricity and gas transmission segment.
a) Turnover
| | | | Sales | | Sales | | | | Sales | | Sales | | | | Sales | | Sales | |
| | Total | | between | | to third | | Total | | between | | to third | | Total | | between | | to third | |
| | sales | | businesses | | parties | | sales | | businesses | | parties | | sales | | businesses | | parties | |
| | 2004 | | 2004 | | 2004 | | 2003 | | 2003 | | 2003 | | 2002 | | 2002 | | 2002 | |
| | | | | | | | (restated) | | (restated) | | (restated) | | (restated) | | (restated) | | (restated) | |
| | £m | | £m | | £m | | £m | | £m | | £m | | £m | | £m | | £m | |
|
|
|
|
|
|
|
|
|
|
|
|
|
|
|
|
|
| |
| Turnover, including share of joint ventures’ | | | | | | | | | | | | | | | | | | |
| – continuing operations | 9,408 | | 462 | | 8,946 | | 9,302 | | 370 | | 8,932 | | 7,509 | | 290 | | 7,219 | |
| – discontinued operations | 158 | | – | | 158 | | 653 | | 19 | | 634 | | 639 | | 37 | | 602 | |
| Less: share of joint ventures’ turnover | | | | | | | | | | | | | | | | | | |
| – continuing operations | (71 | ) | – | | (71 | ) | (99 | ) | – | | (99 | )) | (141 | ) | – | | (141 | ) |
| – discontinued operations | – | | – | | – | | (67 | ) | – | | (67 | ) | (126 | ) | – | | (126 | ) |
|
|
|
|
|
|
|
|
|
|
|
|
|
|
|
|
|
| |
| Group turnover | 9,495 | | 462 | | 9,033 | | 9,789 | | 389 | | 9,400 | | 7,881 | | 327 | | 7,554 | |
|
|
|
|
|
|
|
|
|
|
|
|
|
|
|
|
|
| |
| Continuing operations | | | | | | | | | | | | | | | | | | |
| UK gas distribution | 2,245 | | 120 | | 2,125 | | 2,089 | | 47 | | 2,042 | | 2,013 | | – | | 2,013 | |
| UK electricity and gas transmission | 1,867 | | 35 | | 1,832 | | 1,893 | | 29 | | 1,864 | | 1,799 | | 45 | | 1,754 | |
| US electricity transmission | 318 | | 48 | | 270 | | 407 | | 5 | | 402 | | 278 | | 1 | | 277 | |
| US electricity distribution | 3,537 | | 1 | | 3,536 | | 3,446 | | 1 | | 3,445 | | 2,282 | | 5 | | 2,277 | |
| US gas distribution | 464 | | – | | 464 | | 446 | | – | | 446 | | 104 | | – | | 104 | |
| Other activities | 906 | | 258 | | 648 | | 922 | | 288 | | 634 | | 892 | | 239 | | 653 | |
|
|
|
|
|
|
|
|
|
|
|
|
|
|
|
|
|
| |
| | 9,337 | | 462 | | 8,875 | | 9,203 | | 370 | | 8,833 | | 7,368 | | 290 | | 7,078 | |
| Discontinued operations | 158 | | – | | 158 | | 586 | | 19 | | 567 | | 513 | | 37 | | 476 | |
|
|
|
|
|
|
|
|
|
|
|
|
|
|
|
|
|
| |
| Group turnover | 9,495 | | 462 | | 9,033 | | 9,789 | | 389 | | 9,400 | | 7,881 | | 327 | | 7,554 | |
|
|
|
|
|
|
|
|
|
|
|
|
|
|
|
|
|
| |
| UK | | | | | 4,736 | | | | | | 5,096 | | | | | | 4,865 | |
| US | | | | | 4,297 | | | | | | 4,304 | | | | | | 2,689 | |
|
|
|
|
|
|
|
|
|
|
|
|
|
|
|
|
|
| |
| | | | | | 9,033 | | | | | | 9,400 | | | | | | 7,554 | |
|
|
|
|
|
|
|
|
|
|
|
|
|
|
|
|
|
| |
The analysis of turnover by geographical area is on the basis of origin. Turnover on a destination basis would not be materially different. There is no turnover between the UK and US geographical areas.
Approximately 15% (2003: 16%) of the Group’s turnover for the year ended 31 March 2004 amounting to approximately £1.4bn (2003: £1.5bn) derives from a single customer, the Centrica Group. The majority of this turnover is in the UK gas distribution segment with lesser amounts in other activities and the UK electricity and gas transmission segment.
77 National Grid Transco_Annual Report and Accounts 2003/04
Back to Contents
Notes to the Accounts_continued
2. Segmental analysis (continued)
b) Operating profit
| | Operating profit | |
|
|
|
|
|
|
|
|
|
|
|
|
| |
| | Before exceptional items | | After exceptional items | |
| | and goodwill amortisation | | and goodwill amortisation | |
| |
|
|
|
|
| |
|
|
| |
| | | 2004 | | 2003 | | 2002 | | 2004 | | 2003 | | 2002 | |
| | | | | (restated) | | (restated) | | | | (restated) | | (restated) | |
| | | £m | | £m | | £m | | £m | | £m | | £m | |
|
|
|
|
|
|
|
|
|
|
|
|
| |
| Group undertakings – continuing operations | | | | | | | | | | | | | |
| UK gas distribution | | 729 | | 554 | | 548 | | 640 | | 443 | | 504 | |
| UK electricity and gas transmission | | 769 | | 820 | | 756 | | 755 | | 774 | | 713 | |
| US electricity transmission | | 133 | | 128 | | 87 | | 105 | | 103 | | 64 | |
| US electricity distribution | | 449 | | 513 | | 266 | | 294 | | 413 | | 149 | |
| US gas distribution | | 48 | | 58 | | 17 | | 37 | | 49 | | 8 | |
| Other activities | | 103 | | 143 | | 206 | | 24 | | 24 | | 120 | |
|
|
|
|
|
|
|
|
|
|
|
|
| |
| | | 2,231 | | 2,216 | | 1,880 | | 1,855 | | 1,806 | | 1,558 | |
| Group undertakings – discontinued operations | | – | | (26 | ) | (62 | ) | – | | (194 | ) | (498 | ) |
|
|
|
|
|
|
|
|
|
|
|
|
| |
| Operating profit of Group undertakings | | 2,231 | | 2,190 | | 1,818 | | 1,855 | | 1,612 | | 1,060 | |
|
|
|
|
|
|
|
|
|
|
|
|
| |
| Joint ventures and associate – continuing operations | | | | | | | | | | | | | |
| Electricity activities | | 7 | | 15 | | 36 | | 7 | | 15 | | 36 | |
| Other activities | | – | | – | | (17 | ) | – | | – | | (65 | ) |
|
|
|
|
|
|
|
|
|
|
|
|
| |
| | | 7 | | 15 | | 19 | | 7 | | 15 | | (29 | ) |
| Joint ventures and associate – discontinued operations | | – | | (20 | ) | (54 | ) | – | | 109 | | (672 | ) |
|
|
|
|
|
|
|
|
|
|
|
|
| |
| Operating profit/(loss) of joint ventures and associate | | 7 | | (5 | ) | (35 | ) | 7 | | 124 | | (701 | ) |
|
|
|
|
|
|
|
|
|
|
|
|
| |
| Total operating profit | | 2,238 | | 2,185 | | 1,783 | | 1,862 | | 1,736 | | 359 | |
|
|
|
|
|
|
|
|
|
|
|
|
| |
| UK | | 1,600 | | 1,481 | | 1,420 | | 1,440 | | 1,051 | | 440 | |
| US | | 632 | | 704 | | 377 | | 416 | | 549 | | 224 | |
| Latin America | | – | | (7 | ) | (19 | ) | – | | 128 | | (310 | ) |
| Rest of the World | | 6 | | 7 | | 5 | | 6 | | 8 | | 5 | |
|
|
|
|
|
|
|
|
|
|
|
|
| |
| | | 2,238 | | 2,185 | | 1,783 | | 1,862 | | 1,736 | | 359 | |
|
|
|
|
|
|
|
|
|
|
|
|
| |
c) Total and net assets
| | | Total assets | | Net assets | |
| |
|
|
| |
|
|
| |
| | | 2004 | | 2003 | | 2004 | | 2003 | |
| | | | | (restated) | | | | (restated) | |
| | | £m | | £m | | £m | | £m | |
|
|
|
|
|
|
|
|
| |
| Group undertakings – continuing operations | | | | | | | | | |
| UK gas distribution | | 4,928 | | 4,998 | | 3,403 | | 3,480 | |
| UK electricity and gas transmission | | 6,284 | | 5,737 | | 5,472 | | 4,994 | |
| US electricity transmission | | 1,539 | | 1,736 | | 1,465 | | 1,656 | |
| US electricity distribution | | 7,200 | | 8,507 | | 5,548 | | 6,405 | |
| US gas distribution | | 821 | | 930 | | 734 | | 778 | |
| Other activities | | 1,890 | | 2,189 | | 940 | | 1,359 | |
|
|
|
|
|
|
|
|
| |
| | | 22,662 | | 24,097 | | 17,562 | | 18,672 | |
| Group undertakings – discontinued operations | | – | | 109 | | (7 | ) | (2 | ) |
|
|
|
|
|
|
|
|
| |
| Group undertakings | | 22,662 | | 24,206 | | 17,555 | | 18,670 | |
|
|
|
|
|
|
|
|
| |
| Joint ventures – continuing operations | | | | | | | | | |
| Electricity activities | | 19 | | 42 | | 19 | | 42 | |
| Other activities | | – | | 2 | | – | | 2 | |
|
|
|
|
|
|
|
|
| |
| Joint ventures | | 19 | | 44 | | 19 | | 44 | |
| Unallocated | | 716 | | 654 | | (16,311 | ) | (17,517 | ) |
|
|
|
|
|
|
|
|
| |
| | | 23,397 | | 24,904 | | 1,263 | | 1,197 | |
|
|
|
|
|
|
|
|
| |
| UK | | 12,846 | | 12,974 | | 9,565 | | 9,774 | |
| US | | 9,679 | | 11,209 | | 7,854 | | 8,873 | |
| Rest of the World | | 156 | | 67 | | 155 | | 67 | |
| Unallocated | | 716 | | 654 | | (16,311 | ) | (17,517 | ) |
|
|
|
|
|
|
|
|
| |
| | | 23,397 | | 24,904 | | 1,263 | | 1,197 | |
|
|
|
|
|
|
|
|
| |
The analysis of total assets and net assets by business segment includes all attributable goodwill and excludes inter-business balances. Unallocated total assets include current asset investments, cash, taxation and taxation related regulatory assets. Unallocated net liabilities include net borrowings, taxation, interest, dividends and taxation related regulatory assets.
Annual Report and Accounts 2003/04_National Grid Transco 78
Back to Contents
Notes to the Accounts_continued
2. Segmental analysis (continued)
d) Other segmental information
| | | Capital expenditure | | Depreciation and amortisation | |
| |
|
|
|
|
| |
| |
| | | 2004 | | 2003 | | 2002 | | 2004 | | 2003 | | 2002 | |
| | | | | (restated) | | (restated) | | | | (restated) | | (restated) | |
| | | £m | | £m | | £m | | £m | | £m | | £m | |
|
|
|
|
|
|
|
|
|
|
|
|
| |
| Group undertakings – continuing operations | | | | | | | | | | | | | |
| UK gas distribution | | 293 | | 380 | | 455 | | 195 | | 185 | | 176 | |
| UK electricity and gas transmission | | 584 | | 567 | | 613 | | 276 | | 243 | | 233 | |
| US electricity transmission | | 53 | | 49 | | 38 | | 67 | | 71 | | 46 | |
| US electricity distribution | | 227 | | 209 | | 141 | | 365 | | 359 | | 192 | |
| US gas distribution | | 50 | | 40 | | 3 | | 32 | | 34 | | 6 | |
| Other activities | | 274 | | 180 | | 204 | | 182 | | 170 | | 173 | |
|
|
|
|
|
|
|
|
|
|
|
|
| |
| | | 1,481 | | 1,425 | | 1,454 | | 1,117 | | 1,062 | | 826 | |
| Group undertakings – discontinued operations | | – | | 95 | | 393 | | – | | 26 | | 50 | |
|
|
|
|
|
|
|
|
|
|
|
|
| |
| Group undertakings | | 1,481 | | 1,520 | | 1,847 | | 1,117 | | 1,088 | | 876 | |
|
|
|
|
|
|
|
|
|
|
|
|
| |
| UK | | 1,071 | | 1,172 | | 1,638 | | 644 | | 613 | | 619 | |
| US | | 332 | | 298 | | 203 | | 473 | | 475 | | 257 | |
| Rest of the World | | 78 | | 50 | | 6 | | – | | – | | – | |
|
|
|
|
|
|
|
|
|
|
|
|
| |
| | | 1,481 | | 1,520 | | 1,847 | | 1,117 | | 1,088 | | 876 | |
|
|
|
|
|
|
|
|
|
|
|
|
| |
Capital expenditure comprises additions to tangible and intangible fixed assets (excluding goodwill) amounting to £1,479m (2003: £1,519m; 2002: £1,840m) and £2m (2003: £1m; 2002: £7m) respectively.
Depreciation and amortisation includes depreciation of tangible fixed assets, amortisation of intangible fixed assets and amortisation of regulatory assets.
3. Operating costs
| | Continuing operations | | Discontinued operations | | Total | |
| |
|
|
|
|
| |
|
|
| |
|
|
|
|
| |
| | | 2004 | | 2003 | | 2002 | | 2004 | | 2003 | | 2002 | | 2004 | | 2003 | | 2002 | |
| | | £m | | £m | | £m | | £m | | £m | | £m | | £m | | £m | | £m | |
|
|
|
|
|
|
|
|
|
|
|
|
|
|
|
|
|
|
| |
| Total operating costs | | 7,020 | | 7,027 | | 5,521 | | 158 | | 780 | | 1,011 | | 7,178 | | 7,807 | | 6,532 | |
| Charged from: | | | | | | | | | | | | | | | | | | | |
| – continuing operations | | – | | – | | – | | – | | – | | (1 | ) | – | | – | | (1 | ) |
| – discontinued operations | | – | | (19 | ) | (37 | ) | – | | – | | – | | – | | (19 | ) | (37 | ) |
|
|
|
|
|
|
|
|
|
|
|
|
|
|
|
|
|
|
| |
| External operating costs | | 7,020 | | 7,008 | | 5,484 | | 158 | | 780 | | 1,010 | | 7,178 | | 7,788 | | 6,494 | |
|
|
|
|
|
|
|
|
|
|
|
|
|
|
|
|
|
|
| |
| Depreciation | | 866 | | 825 | | 700 | | – | | 26 | | 50 | | 866 | | 851 | | 750 | |
| Payroll costs (note 5(a)) | | 1,020 | | 1,093 | | 907 | | – | | 14 | | 39 | | 1,020 | | 1,107 | | 946 | |
| Other operating charges: | | | | | | | | | | | | | | | | | | | |
| – Purchases of electricity | | 1,998 | | 1,901 | | 1,410 | | – | | – | | – | | 1,998 | | 1,901 | | 1,410 | |
| – Purchases of gas | | 371 | | 357 | | 171 | | – | | – | | – | | 371 | | 357 | | 171 | |
| – Rates and property taxes | | 516 | | 537 | | 422 | | – | | – | | 2 | | 516 | | 537 | | 424 | |
| – Electricity transmission services scheme | | | | | | | | | | | | | | | | | | | |
| direct costs | | 277 | | 252 | | 204 | | – | | – | | – | | 277 | | 252 | | 204 | |
| – EnMO direct costs | | – | | – | | – | | 158 | | 530 | | 395 | | 158 | | 530 | | 395 | |
| – Replacement expenditure | | 388 | | 405 | | 368 | | – | | – | | – | | 388 | | 405 | | 368 | |
| – Exceptional operating items (note 4) | | 277 | | 308 | | 237 | | – | | 168 | | 436 | | 277 | | 476 | | 673 | |
| – Other non-exceptional operating charges | | 1,307 | | 1,330 | | 1,065 | | – | | 42 | | 88 | | 1,307 | | 1,372 | | 1,153 | |
| | | 5,134 | | 5,090 | | 3,877 | | 158 | | 740 | | 921 | | 5,292 | | 5,830 | | 4,798 | |
|
|
|
|
|
|
|
|
|
|
|
|
|
|
|
|
|
|
| |
| | | 7,020 | | 7,008 | | 5,484 | | 158 | | 780 | | 1,010 | | 7,178 | | 7,788 | | 6,494 | |
|
|
|
|
|
|
|
|
|
|
|
|
|
|
|
|
|
|
| |
| | | | | | | | | | | | | | | | | | | | |
| Operating costs (except where otherwise noted) include: | | | | | | | | | | | | | | | | | |
| Research and development costs | | | | | | | | | | | | | | 10 | | 18 | | 16 | |
| Operating lease rentals | | | | | | | | | | | | | | | | | | | |
| – Plant and machinery | | | | | | | | | | | | | | 27 | | 16 | | 8 | |
| – Other | | | | | | | | | | | | | | 45 | | 52 | | 22 | |
| Amortisation of intangible fixed assets (i) | | | | | | | | | | | | | | 101 | | 105 | | 91 | |
| Amortisation of regulatory assets | | | | | | | | | | | | | | 150 | | 132 | | 35 | |
| Auditors’ remuneration (ii) | | | | | | | | | | | | | | | | | | | |
| Statutory audit services | | | | | | | | | | | | | | | | | | | |
| – Annual audit (audit fee for the Company was £8,700 (2003: £8,500; 2002: £8,000)) | | | | | | 4 | | 3 | | 4 | |
| – Regulatory reporting | | | | | | | | | | | | | | 1 | | 1 | | 1 | |
| Further audit related services (iii) | | | | | | | | | | | | | | 2 | | 3 | | 2 | |
| Tax compliance and advisory services | | | | | | | | | | | | | | 1 | | 3 | | 1 | |
| Other non-audit services (iv) | | | | | | | | | | | | | | 2 | | 3 | | 6 | |
|
|
|
|
|
|
|
|
|
|
|
|
|
|
|
|
|
|
| |
| | | | | | | | | | | | | | | | | | | | |
| (i) | Includes the amortisation of goodwill amounting to £99m (2003: £102m; 2002: £85m) and negative goodwill of £nil (2003: £4m; 2002: £nil) but excludes the amortisation of goodwill of £nil (2003: £nil; 2002: £12m) related to joint ventures and associate. |
| (ii) | In addition to the fees included above, fees of £nil (2003: £nil; 2002: £2m) incurred in respect of acquisitions have been capitalised. |
| (iii) | £1.5m of assurance services were provided in respect of the separation of UK-based distribution networks. Also included are £nil (2003: £2m) of fees related to the Merger which were reflected within non-operating exceptional items. |
| (iv) | Other non-audit services, in the current year, related to vendor due diligence work associated with the potential gas distribution network sales. For the years ended 31 March 2003 and 2002, other non-audit services included £2m and £6m respectively in relation to services provided by the consulting business unit of PricewaterhouseCoopers which was sold to IBM United Kingdom Limited on 30 September 2002. |
79 National Grid Transco_Annual Report and Accounts 2003/04
Back to Contents
Notes to the Accounts_continued
4. Exceptional items
The Group has categorised the following items as exceptional items under UK GAAP because, by either their size, incidence or because they are specifically prescribed, they need to be separately disclosed for the accounts to show a true and fair view.
Paragraph 20 of FRS 3, requires that certain items should be disclosed after operating profit and are shown below as ‘non-operating exceptional items’. These items comprise: a) costs associated with a fundamental reorganisation which in the case of the Group relate to the transaction costs relating to the Merger; b) profit on disposal of fixed assets (including the gain on sale of shares by an employee share plan, gain on assets held for exchange and other fixed asset investments); and c) profit or loss on the sale or termination of operations.
Other exceptional items are shown below as ‘operating exceptional items’. The Directors believe these items require separate disclosure, as permitted by FRS 3, within operating profit to show a true and fair view. These items include: restructuring costs; costs arising from the recognition of employee and property costs arising as a direct result of the Merger; share of exceptional operating items of a joint venture; impairment of business; impairment of investments in joint ventures and associate; impairment of assets; and environmental provision which are all disclosed by virtue of their size.
a) Operating
| | | | | | | |
| | 2004 | | 2003 | | 2002 | |
| | £m | | £m | | £m | |
|
|
|
|
|
| |
| Continuing operations | | | | | | |
| Restructuring costs (i) | 249 | | 203 | | 187 | |
| Environmental provision (ii) | 28 | | – | | – | |
| Impairment of assets (iii) | – | | – | | 50 | |
| Merger costs (iv) | – | | 105 | | – | |
| Share of exceptional operating items of joint venture (v) | – | | – | | 48 | |
|
|
|
|
|
| |
| | 277 | | 308 | | 285 | |
|
|
|
|
|
| |
| Discontinued operations | | | | | | |
| Restructuring costs (i) | – | | 6 | | – | |
| Impairment of investments in joint ventures and associate (vi) | – | | (135 | ) | 792 | |
| Impairment of business (vii) | – | | 168 | | 250 | |
|
|
|
|
|
| |
| | – | | 39 | | 1,042 | |
|
|
|
|
|
| |
| Total operating exceptional items | 277 | | 347 | | 1,327 | |
|
|
|
|
|
| |
| | | | | | | |
| (i) | The 2004 restructuring costs consist of £24m of costs associated with the proposed disposal of UK-based distribution networks and other charges of £225m. The other charges primarily related to planned cost reduction programmes in the UK and US businesses. The 2003 and 2002 charges primarily related to costs incurred in reorganisations in the UK and US businesses (2004: £170m after tax; 2003: £165m after tax; 2002: £130m after tax). |
| (ii) | Following completion of site investigations in the UK, the environmental obligations in respect of those sites was adjusted resulting in the recognition of an additional charge of £28m (£28m after tax). |
| (iii) | The impairment charge for 2002 related to a review of the carrying value of LNG storage assets, which resulted in a charge to operating profit amounting to £50m (£35m after tax). In the LNG review, future cash flows were determined based on a five-year business plan projected out to 20 years and discounted at a pre-tax rate of 6.25%. |
| (iv) | Represented employee and property costs associated with the Merger (£76m after tax). |
| (v) | Share of exceptional operating items of a joint venture in 2002 represented the Group’s share of the write-off of an investment and the write-down of goodwill in a joint venture prior to it becoming a wholly-owned subsidiary of the Group (£48m after tax). The write-down of goodwill followed an impairment review which applied a discount rate of 15%. The review used growth rates over a plan period covering nine years. The assumptions of the plan were consistent with management’s views of the market and the joint venture’s performance therein. |
| (vi) | The 2003 credits related to Intelig and other telecoms joint ventures (£155m after tax). The exceptional credits arising in 2003 substantially represented the reversal of the Group’s share of retained losses incurred by these joint ventures during the period from 1 April 2002 to the date of disposal or the date that equity accounting ceased. £129m of the pre-tax exceptional credits were reflected in ‘Share of joint ventures’ and associate’s operating profit/(loss) – discontinued operations’ . The 2002 exceptional charge of £792m (£775m after tax) related to the write-down of the Group’s investment in its joint ventures and associate. This charge comprised a write-down of the carrying value of the investments of £606m (£589m after tax) to their estimated recoverable amounts, and the recognition of related liabilities of £186m (£186m after tax). |
| (vii) | In 2002 and 2003, following a review of the carrying value of certain of the Group’s telecoms assets, the Group incurred impairment charges that resulted in the write-down of those assets to their estimated recoverable amounts and the recognition of other related costs (2003: £143m after tax; 2002: £175m after tax). |
b) Non-operating
| | | | | | | |
| | 2004 | | 2003 | | 2002 | |
| | £m | | £m | | £m | |
|
|
|
|
|
| |
| Continuing operations | | | | | | |
| Profit on disposal of tangible fixed assets (viii) | (96 | ) | (48 | ) | (94 | ) |
| Merger costs (ix) | – | | 79 | | – | |
| Gain on sale of shares by an employee share plan (x) | – | | – | | (31 | ) |
|
|
|
|
|
| |
| | (96 | ) | 31 | | (125 | ) |
|
|
|
|
|
| |
| Discontinued operations | | | | | | |
| Gain on assets held for exchange (xi) | (226 | ) | – | | – | |
| Loss on sale or termination of operations (xii) | – | | 68 | | – | |
| Profit on disposal of investments (xiii) | – | | – | | (31 | ) |
|
|
|
|
|
| |
| | (226 | ) | 68 | | (31 | ) |
|
|
|
|
|
| |
| Total non-operating exceptional items | (322 | ) | 99 | | (156 | ) |
|
|
|
|
|
| |
| | | | | | | |
| (viii) | The after tax profit on disposal of tangible fixed assets was £96m (2003: £50m; 2002: £96m). |
| (ix) | The 2003 after tax transaction cost of the Merger was £71m. |
| (x) | The 2002 after tax gain on sale of shares by an employee share plan was £31m. |
| (xi) | The gain on assets held for exchange related to the profit recognised on Energis shares delivered to Equity Plus Income Convertible Securities (EPICs) bondholders on 6 May 2003 in settlement of all EPICs outstanding at that date that had a carrying value of £243m. This transaction represented the culmination of a deferred sale arrangement entered into in February 1999. The after tax gain on assets held for exchange was £226m. |
| (xii) | The charges for 2003 related to losses on the sale of The Leasing Group of £45m and loss on closure of 186k of £23m. The after tax loss relating to the 2003 sale and closure amounted to £68m. |
| (xiii) | The after tax profit on disposal of investments was £nil (2003: £nil; 2002: £31m). |
Annual Report and Accounts 2003/04_National Grid Transco 80
Back to Contents
Notes to the Accounts_continued
4. Exceptional items (continued)
c) Financing costs
For 2003 and 2002, the exceptional net interest cost (2003: £31m; 2002: £142m) (2003: £31m after tax; 2002: £142m after tax) related to the Group’s share of foreign exchange losses incurred on foreign currency borrowings by joint ventures (2003: £98m; 2002: £142m), partially offset by the Group’s share of a gain on net monetary liabilities (2003: £67m; 2002: £nil). The gain on the net monetary liabilities related to Citelec, a joint venture operating in Argentina, and reflected the net gain that arose on net monetary liabilities that were financing the operation in a hyper-inflationary economy.
d) Taxation
The exceptional tax credit for 2004 of £89m included a net credit amounting to £10m relating to investments disposed of in prior periods.
e) Minority interests
The 2003 exceptional minority interest charge of £28m related to the Group’s share of the minority interest in the after taxation exceptional items of Citelec, a joint venture, and primarily reflected the minority interest’s share of the gain on net monetary liabilities referred to in note 4(c).
The 2002 exceptional minority interest credit of £50m related to the Group’s share of the minority interest in the after taxation exceptional items of Citelec, a joint venture, and primarily related to foreign exchange losses incurred on foreign currency borrowings.
| 5. Payroll costs and employees | | | | | | |
| | 2004 | 2003 | 2002 |
| | £m | £m | £m |
|
|
|
|
|
| |
| a) Payroll costs | | | | | | |
| Wages and salaries | 1,025 | | 1,124 | | 940 | |
| Social security costs | 79 | | 84 | | 73 | |
| Other pension costs | 150 | | 117 | | 90 | |
|
|
|
|
|
| |
| | 1,254 | | 1,325 | | 1,103 | |
| Less: Amounts capitalised | (175 | ) | (158 | ) | (129 | ) |
| Payroll costs included in replacement expenditure | (59 | ) | (60 | ) | (28 | ) |
|
|
|
|
|
| |
| | 1,020 | | 1,107 | | 946 | |
|
|
|
|
|
| |
| | | | | | | | | |
| | 31 March | | Average | | Average | | Average | |
| 2004 | 2004 | 2003 | 2002 |
| Number | Number | Number | Number |
|
|
|
|
|
|
|
| |
| b) Number of employees | | | | | | | | |
| UK | 15,498 | | 16,241 | | 18,399 | | 19,227 | |
| US | 9,018 | | 9,402 | | 10,120 | | 5,094 | |
| Rest of the World | 11 | | 10 | | 14 | | 25 | |
|
|
|
|
|
|
|
| |
| Continuing operations | 24,527 | | 25,653 | | 28,533 | | 24,346 | |
| Discontinued operations | – | | 5 | | 407 | | 768 | |
|
|
|
|
|
|
|
| |
| | 24,527 | | 25,658 | | 28,940 | | 25,114 | |
|
|
|
|
|
|
|
| |
| The vast majority of employees in: |
| – | the UK are either directly or indirectly employed in the transmission and distribution of gas or the transmission of electricity. |
| – | the US are either directly or indirectly employed in the transmission and distribution of electricity or the distribution of gas. |
| |
| In addition to the payroll costs shown above, there were restructuring costs of £249m (2003: £209m; 2002: £187m), primarily in respect of severance costs, which have been included as part of restructuring costs within other operating charges – exceptional items. |
6. Directors’ emoluments
Details of Directors’ emoluments are contained in the auditable part of the Directors’ Remuneration Report on pages 58 to 67.
81 National Grid Transco_Annual Report and Accounts 2003/04
Back to Contents
Notes to the Accounts_continued
7. Pensions and post-retirement benefits
UK post-retirement schemes
Substantially all the Group’s UK employees are members of either the Electricity Supply Pension Scheme or the Lattice Group Pension Scheme.
Electricity Supply Pension Scheme
The Electricity Supply Pension Scheme provides final salary defined benefits on a funded basis. The assets of the scheme are held in a separate trustee administered fund. The scheme is divided into sections, one of which is the Group’s section. It is subject to independent valuations at least every three years, on the basis of which the qualified actuary certifies the rate of employers’ contributions which, together with the specified contributions payable by the employees and proceeds from the scheme’s assets, are expected to be sufficient to fund the benefits payable under the scheme. The latest full actuarial valuation of the Group’s section of the scheme was carried out by Bacon & Woodrow, Consulting Actuaries (now Hewitt, Bacon and Woodrow), at 31 March 2001.
The projected unit method was used for the last valuation of the pension scheme and for the purposes of accounting under Statement of Standard Accounting Practice (SSAP) 24 ‘Accounting for Pension Costs’ and the principal actuarial assumptions adopted were that the real annual rates of return on investments held in respect of pre-retirement members would average 4.5% and on investments held in respect of post-retirement members would average 3.5%; that the annual rate of inflation would average 2.3%; that the real annual increase in salary would average 1.0%; and that pensions would increase at a real annual rate of 0.2%. The market value of the assets relating to the Group’s section of the scheme at 31 March 2001 was £1,336m and the actuarial value of the assets represented approximately 118.3% of the actuarial value of the benefits that had accrued to members measured on a past service basis. The current agreed employers’ and employees’ contribution rates for the forthcoming year are 12% and 6% respectively. These contribution rates will be reviewed when the next independent actuarial valuation is completed based on the position at 31 March 2004. The valuation is in the process of being carried out and therefore the outcome is currently unknown.
Lattice Group Pension Scheme
The Lattice Group Pension Scheme provides final salary defined benefits for employees who joined the Lattice Group prior to 31 March 2002. A defined contribution section was added to the scheme from 1 April 2002 for employees joining Lattice Group from that date. The scheme is funded with assets held in a seperate trustee administered fund. It is subject to independent valuations at least every three years, on the basis of which the qualified actuary certifies the rate of employers’ contributions which, together with the specified contributions payable by the employees and proceeds from the scheme’s assets, are expected to be sufficient to fund the benefits payable under the scheme.
The latest full actuarial valuation of the scheme was carried out by Watson Wyatt LLP at 31 March 2003. The projected unit method was used and the principal actuarial assumptions adopted were that the annual rate of inflation would be 2.50% and that future real increases in pensionable earnings would be 1.5%. Investments held in respect of pensions before they become payable would average 4.9% real annual rate of return and investments held in respect of pensions after they become payable would average 2.6% real annual rate of return and that pensions would increase at a real annual rate of 0.05%. The aggregate market value of the scheme’s assets was £10,141m and the value of the assets represented approximately 92% of the actuarial value of benefits due to members calculated on the basis of pensionable earnings and service at 31 March 2003 on an ongoing basis and allowing for projected increases in pensionable earnings and pensions.
The results of the actuarial valuation carried out at 31 March 2003 showed that based on long-term financial assumptions the contribution rate required to meet the future benefit accrual was 23.7% of pensionable earnings (20.7% employers and 3% employees). Employers’ contributions were increased from 8.5% to 20.7% with effect from 1 April 2003. This contribution rate will be reviewed when the next independent actuarial valuation is carried out, which will be no later than 31 March 2006. The ongoing contribution rate does not include an allowance for administration expenses. These contributions are reviewed annually. From 1 April 2003 the rate used for the recovery of administration costs was 1.4% of salary, from 1 April 2004 the rate was 1.6% of salary. Employers are currently, therefore, paying a total contribution rate of 22.3%. The actuarial valuation revealed a deficit of £879m gross (£615m net of tax) in the defined benefit section on the basis of the assumptions adopted by the actuary. It has been agreed that no funding of the deficit identified in the 2003 actuarial valuation will need to be provided to the scheme until the outcome of the actuarial valuation at 31 March 2007 is known. At this point, the Group will pay the gross amount of any deficit up to a maximum amount of £520m (£364m net of tax) into the scheme. For the period prior to these lump sum deficiency contributions being paid, the Group has arranged for banks to provide the trustees of the Lattice Scheme with letters of credit. The main conditions under which these letters of credit could be drawn relate to events which would imperil the interests of the scheme, such as Transco plc becoming insolvent or the Group failing to make agreed payments into the fund.
A further valuation was carried out at 31 March 2003, to calculate the charge in accordance with SSAP 24. The principal assumptions adopted were: price inflation of 2.5%; pension increases in payment of 2.55%; general pensionable pay escalation of 3.5%; and a discount rate of 6%. The principal results of this valuation were the need to recognise a regular cost based on 21.4% of salary (excluding administration costs) and a deficit of £468m, which is being spread over the average expected future service lives of employees in the Lattice scheme amounting to 14.1 years.
US post-retirement schemes
Pension
Substantially all the Group’s US employees are members of defined benefit plans. The assets of the plans are held in separate trustee administered funds. The latest full actuarial valuations of these plans were carried out by Hewitt Associates LLC at 1 April 2003 and these valuations were used to calculate the pension cost for the year ended 31 March 2004 (in compliance with SSAP 24). These valuations have been updated using assumptions and market values at 31 March 2004. The projected unit method was used for the updated valuations and the principal actuarial assumptions adopted were: that the real annual rate of return on investments would average 4.25%; that real annual increases in salary would average nil for New York schemes and 1.45% for other US schemes; that inflation would average 3.25% for New York schemes and 3.5% for other US schemes; and that nominal increases in pensions would be nil. The market value of the assets relating to the Group’s US defined benefit plans at 31 March 2004 totalled US$1,945m and the actuarial value of the assets represented 75% of the actuarial value of the benefits that had accrued to members, after allowing for future salary increases. There are no formally agreed contribution rates for the US plans.
Healthcare and life insurance – retirees
In the US, the Group provides healthcare and life insurance to eligible retired US employees. Eligibility is based on certain age and length of service requirements and in some cases retirees must contribute to the cost of their coverage. The latest full actuarial valuations were carried out at 1 April 2003. These valuations have been updated using assumptions and market values at 31 March 2004. The principal assumptions adopted were a discount rate of 5.75% and that medical costs would increase by 10.0% per annum, decreasing to 5.0% by 2009 and remain at this rate thereafter.
The cost of providing healthcare and life insurance to retired US employees for the year ended 31 March 2004 amounted to £31m net of capitalised amounts (2003: £37m; 2002: £9m).
Annual Report and Accounts 2003/04_National Grid Transco 82
Back to Contents
Notes to the Accounts_continued
7. Pensions and post-retirement benefits (continued)
Pension cost, prepayment and provisions for liabilities and charges
The pension cost charged to operating profit for the year ended 31 March 2004 was £150m (2003: £117m; 2002: £90m). This represented defined contribution scheme costs of £2m (2003: £1m; 2002: £nil), defined benefit regular pension costs of £106m (2003: £136m; 2002: £127m) and a variation from the regular pension cost totalling £42m (2003: £20m credit; 2002: £37m credit), of which £2m (2003: £2m; 2002: £2m) related to the partial release of a pension provision. In addition, net interest included a charge of £56m (2003: £3m credit; 2002: £30m credit) in respect of the notional interest element of the variation from the regular pension cost.
Included in debtors at 31 March 2004 was a pension prepayment of £19m (2003: £37m).
Included within provisions for liabilities and charges at 31 March 2004 was a pension and other post-retirement benefits provision of £464m (2003: £551m) – see note 22.
FRS 17 Retirement Benefits
On 20 November 2000, the Accounting Standards Board introduced a new accounting standard, FRS 17 ‘Retirement Benefits’, replacing SSAP 24. FRS 17 is fully effective for periods beginning on or after 1 January 2005, though disclosures are required in the financial years prior to its full implementation. Disclosures showing the impact on the Group’s profit and loss account and balance sheet, together with other disclosures required by FRS 17, are set out below.
The disclosures have been prepared by updating the results of the aforementioned valuations by independent qualified actuaries using the projected unit method of valuation on the basis of the following assumptions:
| | 2004 | | 2003 | | 2002 | |
|
| |
| |
| |
| | | | | | | | | | | | | | | | | | | |
| | | US | | | US | | | US |
| | | Other post- | | | Other post- | | | Other post- |
| UK | US | retirement | UK | US | retirement | UK | US | retirement |
| Pensions | Pensions | benefits | Pensions | Pensions | benefits | Pensions | Pensions | benefits |
| % | % | % | % | % | % | % | % | % |
|
| |
| |
| |
| |
| |
| |
| |
| |
| |
| | | | | | | | | | | | | | | | | | | |
| Rate of increase in salaries (i) | 3.9 | | 3.8 | | – | | 3.5 | | 4.0 | | – | | 4.7 | | 4.0 | | – | |
| Rate of increase in pensions in payment | | | | | | | | | | | | | | | | | | |
| and deferred pensions | 3.0 | | – | | – | | 2.6 | | – | | – | | 2.8 | | – | | – | |
| Discount rate for liabilities | 5.5 | | 5.8 | | 5.8 | | 5.4 | | 6.3 | | 6.3 | | 5.8 | | 7.5 | | 7.5 | |
| Rate of increase in Retail Price Index or equivalent | 2.9 | | 3.3 | | – | | 2.5 | | 3.2 | | – | | 2.8 | | 3.5 | | – | |
| Initial healthcare cost trend rate | – | | – | | 10.0 | | – | | – | | 10.0 | | – | | – | | 10.0 | |
| Ultimate healthcare cost trend rate | – | | – | | 5.0 | | – | | – | | 5.0 | | – | | – | | 5.0 | |
|
|
|
|
|
|
|
|
|
|
|
|
|
|
|
|
|
| |
| (i) | A promotional age-related scale has also been used where appropriate. |
An analysis of the assets held in the various pension and other post-retirement benefit schemes and the expected rates of return at 31 March 2004, 31 March 2003 and 31 March 2002 were as follows:
| | | | | | | US Other post- | |
| | | UK Pensions | | US Pensions | | retirement benefits | |
| |
| |
| |
| |
| | | Long-term | | | | Long-term | | | | Long-term | | | |
| rate of return | | rate of return | | rate of return | |
| expected at | Value at | expected at | Value at | expected at | Value at |
| 31 March | 31 March | 31 March | 31 March | 31 March | 31 March |
| 2004 | 2004 | 2004 | 2004 | 2004 | 2004 |
| % | £m | % | £m | % | £m |
|
|
|
|
|
|
|
|
|
|
|
|
| |
| | | | | | | | | | | | | | |
| Equities | | 8.0 | | 5,260 | | 10.8 | | 685 | | 10.8 | | 309 | |
| Bonds | | 4.9 | | 5,896 | | 4.0 | | 360 | | 4.0 | | 180 | |
| Property | | 6.5 | | 913 | | 8.0 | | 6 | | – | | – | |
| Other | | 4.0 | | 300 | | 12.0 | | 12 | | 0.9 | | 7 | |
|
|
|
|
|
|
|
|
|
|
|
|
| |
| Total market value of assets | | | | 12,369 | | | | 1,063 | | | | 496 | |
| Present value of scheme liabilities | | | | (13,790 | ) | | | (1,488 | ) | | | (1,002 | ) |
|
|
|
|
|
|
|
|
|
|
|
|
| |
| Deficit in schemes | | | | (1,421 | ) | | | (425 | ) | | | (506 | ) |
| Related deferred tax asset | | | | 426 | | | | 166 | | | | 197 | |
|
|
|
|
|
|
|
|
|
|
|
|
| |
| Net liability | | | | (995 | ) | | | (259 | ) | | | (309 | ) |
|
|
|
|
|
|
|
|
|
|
|
|
| |
| | | | | | | | | | | | |
| | | | | | | | | | | US Other post- | |
| | | UK Pensions | | US Pensions | | retirement benefits | |
| |
| |
| |
| |
| | | Long-term | | | | Long-term | | | | Long-term | | | |
| rate of return | | rate of return | | rate of return | |
| expected at | Value at | expected at | Value at | expected at | Value at |
| 31 March | 31 March | 31 March | 31 March | 31 March | 31 March |
| 2003 | 2003 | 2003 | 2003 | 2003 | 2003 |
| % | £m | % | £m | % | £m |
|
|
|
|
|
|
|
|
|
|
|
|
| |
| | | | | | | | | | | | | | |
| Equities | | 8.5 | | 4,590 | | 11.0 | | 586 | | 11.0 | | 158 | |
| Bonds | | 4.6 | | 5,436 | | 5.1 | | 395 | | 5.0 | | 157 | |
| Property | | 6.5 | | 901 | | 9.0 | | 8 | | – | | – | |
| Other | | 4.0 | | 171 | | 6.8 | | 28 | | 3.5 | | 58 | |
|
|
|
|
|
|
|
|
|
|
|
|
| |
| Total market value of assets | | | | 11,098 | | | | 1,017 | | | | 373 | |
| Present value of scheme liabilities | | | | (13,269 | ) | | | (1,617 | ) | | | (1,003 | ) |
|
|
|
|
|
|
|
|
|
|
|
|
| |
| Deficit in schemes | | | | (2,171 | ) | | | (600 | ) | | | (630 | ) |
| Related deferred tax asset | | | | 651 | | | | 238 | | | | 250 | |
|
|
|
|
|
|
|
|
|
|
|
|
| |
| Net liability | | | | (1,520 | ) | | | (362 | ) | | | (380 | ) |
|
|
|
|
|
|
|
|
|
|
|
|
| |
83 National Grid Transco_Annual Report and Accounts 2003/04
Back to Contents
Notes to the Accounts_continued
7. Pensions and post-retirement benefits (continued)
| | | | | | | | | | | US – Other post- | |
| | | UK – Pensions | | US – Pensions | | retirement benefits | |
| |
|
|
| |
|
|
| |
|
|
| |
| | | Long-term | | | | Long-term | | | | Long-term | | | |
| | | rate of return | | | | rate of return | | | | rate of return | | | |
| | | expected at | | Value at | | expected at | | Value at | | expected at | | Value at | |
| | | 31 March | | 31 March | | 31 March | | 31 March | | 31 March | | 31 March | |
| | | 2002 | | 2002 | | 2002 | | 2002 | | 2002 | | 2002 | |
| | | % | | £m | | % | | £m | | % | | £m | |
|
|
|
|
|
|
|
|
|
|
|
|
| |
| Equities | | 7.5 | | 7,462 | | 10.2 | | 902 | | 10.3 | | 236 | |
| Bonds | | 5.4 | | 4,115 | | 6.4 | | 476 | | 5.0 | | 160 | |
| Property | | 6.5 | | 852 | | 8.0 | | 11 | | – | | – | |
| Other | | 4.4 | | 520 | | 5.6 | | 48 | | 5.9 | | 1 | |
|
|
|
|
|
|
|
|
|
|
|
|
| |
| Total market value of assets | | | | 12,949 | | | | 1,437 | | | | 397 | |
| Present value of scheme liabilities | | | | (12,642 | ) | | | (1,623 | ) | | | (884 | ) |
|
|
|
|
|
|
|
|
|
|
|
|
| |
| Asset/(deficit) in schemes | | | | 307 | | | | (186 | ) | | | (487 | ) |
| Related deferred tax asset | | | | (93 | ) | | | 74 | | | | 193 | |
|
|
|
|
|
|
|
|
|
|
|
|
| |
| Net asset/(liability) | | | | 214 | | | | (112 | ) | | | (294 | ) |
|
|
|
|
|
|
|
|
|
|
|
|
| |
The net liability for UK – Pensions comprises net pension liabilities relating to funded schemes in deficit of £976m (2003: £1,503m), and net pension liabilities relating to unfunded schemes of £19m (2003: £17m).
The net liability for US – Pensions comprises net pension liabilities relating to funded schemes in deficit of £221m (2003: £319m), and net pension liabilities relating to unfunded schemes of £38m (2003: £43m).
The net liability for US – Other post-retirement benefits relates to funded schemes for both years presented.
At 31 March 2004, an increase of 0.1% in the discount rate would decrease the present value of liabilities for all schemes by around £241m and decrease the liability net of deferred tax by £169m and vice versa.
If the FRS 17 position had been recognised in the Group’s accounts, the Group’s net assets employed at 31 March would have been as follows:
| | 2004 | | 2003 | |
| | | | (restated) | |
| | £m | | £m | |
|
|
|
| |
| Net assets employed excluding net SSAP 24 liabilities and related impact on regulatory assets | 1,482 | | 1,442 | |
| Net FRS 17 liabilities | (1,563 | ) | (2,262 | ) |
|
|
|
| |
| Net liabilities including net FRS 17 liabilities | (81 | ) | (820 | ) |
|
|
|
| |
The impact of the implementation of FRS 17 on net assets employed, as shown above, would be reflected within the profit and loss account reserve.
The pension and other post-retirement deficit has moved during the year ended 31 March 2003 and 31 March 2004 as set out below:
| | 2004 | | 2003 | |
| | £m | | £m | |
|
|
|
| |
| At 1 April | (3,401 | ) | (366 | ) |
| Current service cost | (215 | ) | (171 | ) |
| Past service cost | (3 | ) | (8 | ) |
| Net loss on settlements or curtailments | (61 | ) | (118 | ) |
| Contributions | 393 | | 317 | |
| Other financial income | (43 | ) | 89 | |
| Actuarial gains/(losses) | 822 | | (3,208 | ) |
| Exchange adjustments | 156 | | 64 | |
|
|
|
| |
| At 31 March | (2,352 | ) | (3,401 | ) |
|
|
|
| |
If FRS 17 had been implemented for the years ended 31 March 2003 or 31 March 2004, the following amounts would have been charged to the profit and loss account in respect of pensions and other post-retirement benefits for the year.
| | 2004 | | 2003 | |
| | £m | | £m | |
|
|
|
| |
| Operating charge | | | | |
| Current service cost | 146 | | 171 | |
| Past service cost | 3 | | 8 | |
| Net loss on settlements or curtailments | 130 | | 118 | |
|
|
|
| |
| Total charge to operating profit | 279 | | 297 | |
|
|
|
| |
| Other financial (income)/costs | | | | |
| Expected return on scheme assets | (806 | ) | (977 | ) |
| Interest on scheme liabilities | 849 | | 888 | |
|
|
|
| |
| Impact on financial income | 43 | | (89 | ) |
|
|
|
| |
| Net profit and loss charge before taxation | 322 | | 208 | |
|
|
|
| |
As the Lattice scheme is a closed scheme, under the projected unit method of valuation, the current service cost will increase as the members of the scheme approach retirement.
If the Group were to prepare its accounts under FRS 17, the net loss on settlements or curtailments above would be reported as part of exceptional items. The net FRS 17 profit and loss account impact before tax excluding these exceptional items amounted to £192m (2003: £90m) and compares with the current UK GAAP charge in respect of pensions and other post-retirement benefits amounting to £264m (2003: £151m). The FRS 17 pre-exceptional profit and loss account charge (pre-tax) would therefore be £72m lower (2003: £61m lower) than the SSAP 24 charge.
Annual Report and Accounts 2003/04_National Grid Transco 84
Back to Contents
Notes to the Accounts_continued
7. Pensions and post-retirement benefits (continued)
The following pre-tax amounts would have been recognised in the statement of total recognised gains and losses:
| | 2004 | | | 2003 | |
| | £m | | | £m | |
|
|
| |
| |
| Difference between actual and expected return on scheme assets | 1,310 | | | (2,529 | ) |
| Experience gains arising on scheme liabilities | 51 | | | 11 | |
| Changes in assumptions | (539 | ) | | (690 | ) |
|
|
| |
| |
| Actuarial gains/(losses) | 822 | | | (3,208 | ) |
| Exchange adjustments | (156 | ) | | 64 | |
|
|
| |
| |
| Net credit/(charge) to the statement of total recognised gains and losses | 666 | | | (3,144 | ) |
|
|
| |
| |
| History of experience gains and losses that would be recognised on an FRS 17 basis is set out below: | | | | | |
|
|
| |
| |
| Difference between actual and expected return on scheme assets (£m) | 1,310 | | | (2,529 | ) |
| – percentage of scheme assets | 9% | | | (20% | ) |
| Experience gains arising on scheme liabilities (£m) | 51 | | | 11 | |
| – percentage of present value of scheme liabilities | – | | | – | |
| Actuarial gains/(losses) (£m) | 822 | | | (3,208 | ) |
| – percentage of present value of scheme liabilities | 5% | | | (20% | ) |
|
|
| |
| |
| 8. Net interest | | | | | | | | |
| | 2004 | | | 2003 | | | 2002 | |
| | | | | (restated) | | | (restated) | |
| | £m | | | £m | | | £m | |
|
|
|
|
|
|
|
| |
| Bank loans and overdrafts | 51 | | | 36 | | | 63 | |
| Other | 869 | | | 945 | | | 692 | |
|
|
|
|
|
|
|
| |
| Interest payable and similar charges | 920 | | | 981 | | | 755 | |
| Unwinding of discount on provisions | 11 | | | 13 | | | 17 | |
| Interest capitalised | (55 | ) | | (28 | ) | | (38 | ) |
|
|
|
|
|
|
|
| |
| Interest payable and similar charges net of interest capitalised | 876 | | | 966 | | | 734 | |
| Interest receivable and similar income | (58 | ) | | (55 | ) | | (123 | ) |
|
|
|
|
|
|
|
| |
| | 818 | | | 911 | | | 611 | |
Joint ventures (including exceptional net interest of £nil (2003: £31m; 2002: £142m),
net of interest capitalised £nil (2003: £1m; 2002: £10m)) | 4 | | | 59 | | | 172 | |
| Associate | – | | | – | | | 16 | |
| | 4 | | | 59 | | | 188 | |
|
|
|
|
|
|
|
| |
| Net interest | 822 | | | 970 | | | 799 | |
|
|
|
|
|
|
|
| |
| Comprising: | | | | | | | | |
| Net interest, excluding exceptional net interest | 822 | | | 939 | | | 657 | |
| Exceptional net interest (note 4(c)) | – | | | 31 | | | 142 | |
|
|
|
|
|
|
|
| |
| Net interest, including exceptional net interest | 822 | | | 970 | | | 799 | |
|
|
|
|
|
|
|
| |
Interest on the funding attributable to assets in the course of construction was capitalised during the year at a rate of 5.7% (2003: 5.9%; 2002: 6.2% to 7.0%).
Interest payable and similar charges includes £4m (2003: £12m; 2002: £3m) relating to the loss incurred on the repurchase of debt during the year.
The comparatives for prior years have been restated resulting in a reclassification of interest from bank loans and overdrafts to other amounting to £221m and £80m for 2003 and 2002 respectively.
| 9. Taxation | | | | | | | | |
| | 2004 | | | 2003 | | | 2002 | |
| | £m | | | £m | | | £m | |
|
|
|
|
|
|
|
| |
| United Kingdom | | | | | | | | |
| Corporation tax at 30% | 193 | | | 12 | | | 153 | |
| Adjustment in respect of prior years (i) | (35 | ) | | – | | | (78 | ) |
| Deferred tax | (15 | ) | | 107 | | | (22 | ) |
|
|
|
|
|
|
|
| |
| | 143 | | | 119 | | | 53 | |
|
|
|
|
|
|
|
| |
| Overseas | | | | | | | | |
| Corporate tax | 16 | | | 27 | | | 73 | |
| Adjustment in respect of prior years | – | | | – | | | 1 | |
| Deferred tax | 99 | | | 94 | | | (48 | ) |
|
|
|
|
|
|
|
| |
| | 115 | | | 121 | | | 26 | |
|
|
|
|
|
|
|
| |
| | 258 | | | 240 | | | 79 | |
| Joint ventures | 3 | | | 5 | | | 6 | |
|
|
|
|
|
|
|
| |
| Taxation | 261 | | | 245 | | | 85 | |
|
|
|
|
|
|
|
| |
| Comprising: | | | | | | | | |
| Taxation – excluding exceptional items | 350 | | | 373 | | | 251 | |
| Taxation – exceptional items (note 4(d)) | (89 | ) | | (128 | ) | | (166 | ) |
|
|
|
|
|
|
|
| |
| | 261 | | | 245 | | | 85 | |
|
|
|
|
|
|
|
| |
| (i) | The UK corporation tax adjustment in respect of prior years includes £29m (2003: £nil; 2002: £75m) that relate to exceptional items. |
The comparatives have been re-presented to accord with the analysis of the current year tax charge.
85 National Grid Transco_Annual Report and Accounts 2003/04
Back to Contents
Notes to the Accounts_continued
9. Taxation (continued)
A reconciliation of the UK corporation tax rate to the effective tax rate of the Group is as follows:
| | % of profit before taxation | |
| | 2004 | | 2003 | | 2002 | |
|
|
|
|
|
| |
| UK corporation tax rate | 30.0 | | 30.0 | | 30.0 | |
| Effect on tax charge of: | | | | | | |
| – Origination and reversal of timing differences | (8.1 | ) | (12.3 | ) | (4.6 | ) |
| – Permanent differences | (7.5 | ) | 2.1 | | 1.2 | |
| – Overseas income taxed at other than UK statutory rate | 3.3 | | (2.5 | ) | (5.2 | ) |
| – Other | (0.1 | ) | 0.3 | | 2.6 | |
|
|
|
|
|
| |
| Current tax charge | 17.6 | | 17.6 | | 24.0 | |
| Deferred taxation | 7.5 | | 12.3 | | 5.0 | |
|
|
|
|
|
| |
Effective tax rate before goodwill amortisation, prior year adjustments in respect of current tax
and exceptional items | 25.1 | | 29.9 | | 29.0 | |
| Effect of goodwill amortisation | 1.9 | | 2.7 | | 2.7 | |
|
|
|
|
|
| |
| Effective tax rate before prior year adjustments in respect of current tax and exceptional items | 27.0 | | 32.6 | | 31.7 | |
| Current tax adjustment in respect of prior years | (0.5 | ) | – | | (7.3 | ) |
|
|
|
|
|
| |
| Effective tax rate after adjustments in respect of prior years and before exceptional items | 26.5 | | 32.6 | | 24.4 | |
| Exceptional items | (7.4 | ) | 4.1 | | (54.3 | ) |
|
|
|
|
|
| |
| Effective tax rate after exceptional items | 19.1 | | 36.7 | | (29.9 | ) |
|
|
|
|
|
| |
Factors that may affect future tax charges
The Group has brought forward non-trading debits of £75m (2003: £75m; 2002: £75m), which may reduce taxable profits in future years.
No provision has been made for deferred tax arising on gains recognised in respect of the sale of properties where potentially taxable gains have been rolled over into replacement assets. Such tax would become payable only if the replacement assets were sold without it being possible to claim roll-over relief. The total amount unprovided for at 31 March 2004 was £58m (2003: £58m; 2002: £56m). At present, it is not envisaged that any tax on amounts rolled over will become payable in the foreseeable future.
10. Dividends
The following table shows the dividends paid or proposed by National Grid Transco for the year ended 31 March 2004:
| | 2004 | | | | 2003 | | | |
| | pence | | | | pence | | | |
| | (per ordinary | | 2004 | | (per ordinary | | 2003 | |
| | share) | | £m | | share) | | £m | |
|
|
|
|
|
|
|
| |
| National Grid Transco | | | | | | | | |
| Ordinary dividends | | | | | | | | |
| Interim | 7.91 | | 243 | | 6.86 | | 213 | |
| Proposed final | 11.87 | | 366 | | 10.34 | | 317 | |
|
|
|
|
|
|
|
| |
| | 19.78 | | 609 | | 17.20 | | 530 | |
|
|
|
|
|
|
|
| |
| | | | | | | | | |
| The following disclosures relate to National Grid and Lattice prior to the Merger: | |
| | | | | | 2002 | | | |
| | | | | | pence | | | |
| | | | | | (per ordinary | | 2002 | |
| | | | | | share) | | £m | |
|
|
|
|
|
|
|
| |
| National Grid | | | | | | | | |
| Ordinary dividends | | | | | | | | |
| Interim | | | | | 6.46 | | 96 | |
| Final | | | | | 9.58 | | 169 | |
|
|
|
|
|
|
|
| |
| | | | | | 16.04 | | 265 | |
|
|
|
|
|
|
|
| |
| Lattice | | | | | | | | |
| Ordinary dividends | | | | | | | | |
| Interim | | | | | 3.60 | | 126 | |
| Second interim | | | | | 5.40 | | 189 | |
| Final | | | | | – | | – | |
|
|
|
|
|
|
|
| |
| | | | | | 9.00 | | 315 | |
|
|
|
|
|
|
|
| |
| Total pre-Merger dividends | | | | | n/a | | 580 | |
|
|
|
|
|
|
|
| |
Annual Report and Accounts 2003/04_National Grid Transco 86
Back to Contents
Notes to the Accounts_continued
11. Earnings per share and adjusted profit on ordinary activities before taxation
a) Earnings per share |
| | | | | | Weighted | | | | | | Weighted | | (Loss)/ | | (Loss)/ | | Weighted |
| | Earnings | | Profit | | average | | Earnings | | | | average | | earnings | | profit | | average |
| | per | | for the | | number | | per | | Profit for | | number | | per | | for the | | number |
| | share | | year | | shares | | share | | the year | | shares | | share | | year | | shares |
| | 2004 | | 2004 | | 2004 | | 2003 | | 2003 | | 2003 | | 2002 | | 2002 | | 2002 |
| | pence | | £m | | million | | pence | | £m | | million | | pence | | £m | | million |
|
|
|
|
|
|
|
|
|
|
|
|
|
|
|
|
|
|
| Basic, including exceptional items | | | | | | | | | | | | | | | | | |
| and goodwill amortisation | 35.8 | | 1,099 | | 3,070 | | 12.7 | | 391 | | 3,078 | | (11.3 | ) | (321 | ) | 2,832 |
| Exceptional operating items (note 4(a)) | 9.0 | | 277 | | – | | 11.3 | | 347 | | – | | 46.9 | | 1,327 | | – |
| Exceptional non-operating items (note 4(b)) | (10.4 | ) | (322 | ) | – | | 3.2 | | 99 | | – | | (5.5 | ) | (156 | ) | – |
| Exceptional financing charge (note 4(c)) | – | | – | | – | | 1.0 | | 31 | | – | | 5.0 | | 142 | | – |
| Exceptional tax credit (note 4(d)) | (2.9 | ) | (89 | ) | – | | (4.1 | ) | (128 | ) | – | | (5.9 | ) | (166 | ) | – |
| Exceptional minority interests (note 4(e)) | – | | – | | – | | 0.9 | | 28 | | – | | (1.8 | ) | (50 | ) | – |
| Goodwill amortisation | 3.2 | | 99 | | – | | 3.3 | | 102 | | – | | 3.4 | | 97 | | – |
|
|
|
|
|
|
|
|
|
|
|
|
|
|
|
|
|
|
| Adjusted basic, excluding exceptional | | | | | | | | | | | | | | | | | |
| items and goodwill amortisation | 34.7 | | 1,064 | | 3,070 | | 28.3 | | 870 | | 3,078 | | 30.8 | | 873 | | 2,832 |
| Dilutive impact of employee share options | (0.1 | ) | – | | 7 | | (0.1 | ) | – | | 10 | | (0.2 | ) | – | | 21 |
| Dilutive impact of 4.25% Exchangeable Bonds | n/a | | n/a | | n/a | | (0.3 | ) | 22 | | 110 | | (0.4 | ) | 22 | | 110 |
|
|
|
|
|
|
|
|
|
|
|
|
|
|
|
|
|
|
| Adjusted diluted, excluding exceptional | | | | | | | | | | | | | | | | | |
| items and goodwill amortisation | 34.6 | | 1,064 | | 3,077 | | 27.9 | | 892 | | 3,198 | | 30.2 | | 895 | | 2,963 |
| Exceptional operating items (note 4(a)) | (9.0 | ) | (277 | ) | – | | (10.9 | ) | (347 | ) | – | | (44.8 | ) | (1,327 | ) | – |
| Exceptional non-operating items (note 4(b)) | 10.4 | | 322 | | – | | (3.1 | ) | (99 | ) | – | | 5.3 | | 156 | | – |
| Exceptional financing charge (note 4(c)) | – | | – | | – | | (1.0 | ) | (31 | ) | – | | (4.8 | ) | (142 | ) | – |
| Exceptional tax credit (note 4(d)) | 2.9 | | 89 | | – | | 4.0 | | 128 | | – | | 5.6 | | 166 | | – |
| Exceptional minority interests (note 4(e)) | – | | – | | – | | (0.9 | ) | (28 | ) | – | | 1.7 | | 50 | | – |
| Goodwill amortisation | (3.2 | ) | (99 | ) | – | | (3.2 | ) | (102 | ) | – | | (3.3 | ) | (97 | ) | – |
|
|
|
|
|
|
|
|
|
|
|
|
|
|
|
|
|
|
| Diluted, including exceptional items | | | | | | | | | | | | | | | | | |
| and goodwill amortisation | 35.7 | | 1,099 | | 3,077 | | 12.8 | | 413 | | 3,198 | | (10.1 | ) | (299 | ) | 2,963 |
|
|
|
|
|
|
|
|
|
|
|
|
|
|
|
|
|
|
Earnings per ordinary share, excluding exceptional items and goodwill amortisation, are provided in order to reflect the underlying performance of the Group.
In respect of the years ended 31 March 2003 and 31 March 2002, the potential ordinary shares that related to the 4.25% Exchangeable Bonds were dilutive as they decreased earnings from continuing operations. Consequently, the diluted earnings per share were higher than basic earnings per share for these years because of the effect of losses that arose from discontinued operations.
b) Adjusted profit on ordinary activities before taxatio
The following table reconciles profit before taxation on ordinary activities to adjusted profit on ordinary activities before taxation. Adjusted profit on ordinary activities before taxation excludes exceptional items and goodwill amortisation and is provided to reflect the underlying pre-tax performance of the Group.
| | 2004 | | 2003 | | 2002 | |
| | £m | | £m | | £m | |
|
|
|
|
|
| |
| Profit/(loss) on ordinary activities before taxation | 1,362 | | 667 | | (284 | ) |
| Exceptional operating items (note 4(a)) | 277 | | 347 | | 1,327 | |
| Exceptional non-operating items (note 4(b)) | (322 | ) | 99 | | (156 | ) |
| Exceptional financing charge (note 4(c)) | – | | 31 | | 142 | |
| Goodwill amortisation | 99 | | 102 | | 97 | |
|
|
|
|
|
| |
| Adjusted profit on ordinary activities before taxation | 1,416 | | 1,246 | | 1,126 | |
|
|
|
|
|
| |
87 National Grid Transco_Annual Report and Accounts 2003/04
Back to Contents
Notes to the Accounts_continued
12. Intangible fixed assets
| Group | £m | |
|
| |
| Cost at 1 April 2003 | 2,146 | |
| Exchange adjustments | (292 | ) |
| Additions | 3 | |
|
| |
| Cost at 31 March 2004 | 1,857 | |
|
| |
| Amortisation at 1 April 2003 | 253 | |
| Exchange adjustments | (46 | ) |
| Charge for the year | 101 | |
| Impairment charge (i) | 12 | |
|
| |
| Amortisation at 31 March 2004 | 320 | |
|
| |
| Net book value at 31 March 2004 | 1,537 | |
|
| |
| Net book value at 31 March 2003 | 1,893 | |
|
| |
| (i) | Impairment charge related to business restructuring activities. |
Negative goodwill with a cost of £37m which was fully amortised at 31 March 2003, was written off during the year.
The net book value of intangible fixed assets at 31 March 2004 included £1m (2003: £3m) relating to telecoms licences and £nil (2003: £3m) relating to capitalised software. The remaining net book value of intangible fixed assets related entirely to goodwill. The charge for the year relating to goodwill amortisation amounted to £99m (2003: £102m).
13. Tangible fixed assets
| | | | | | Assets | | Motor | | | |
| | | | Plant | | in the | | vehicles | | | |
| | Land and | | and | | course of | | and office | | | |
| | buildings | | machinery | | construction | | equipment | | Total | |
| Group | £m | | £m | | £m | | £m | | £m | |
|
|
|
|
|
|
|
|
|
| |
| Cost at 1 April 2003 | 1,037 | | 22,665 | | 1,035 | | 870 | | 25,607 | |
| Exchange adjustments | (67 | ) | (965 | ) | (17 | ) | (6 | ) | (1,055 | ) |
| Additions | 13 | | 345 | | 1,020 | | 101 | | 1,479 | |
| Disposals | (128 | ) | (144 | ) | (2 | ) | (124 | ) | (398 | ) |
| Reclassifications | 3 | | 760 | | (907 | ) | 144 | | – | |
|
|
|
|
|
|
|
|
|
| |
| Cost at 31 March 2004 | 858 | | 22,661 | | 1,129 | | 985 | | 25,633 | |
|
|
|
|
|
|
|
|
|
| |
| Depreciation at 1 April 2003 | 343 | | 7,818 | | – | | 599 | | 8,760 | |
| Exchange adjustments | (12 | ) | (358 | ) | – | | (4 | ) | (374 | ) |
| Charge for the year | 19 | | 732 | | – | | 115 | | 866 | |
| Impairment charge (i) | – | | 5 | | – | | 3 | | 8 | |
| Disposals | (74 | ) | (140 | ) | – | | (119 | ) | (333 | ) |
|
|
|
|
|
|
|
|
|
| |
| Depreciation at 31 March 2004 | 276 | | 8,057 | | – | | 594 | | 8,927 | |
|
|
|
|
|
|
|
|
|
| |
| Net book value at 31 March 2004 | 582 | | 14,604 | | 1,129 | | 391 | | 16,706 | |
|
|
|
|
|
|
|
|
|
| |
| Net book value at 31 March 2003 | 694 | | 14,847 | | 1,035 | | 271 | | 16,847 | |
|
|
|
|
|
|
|
|
|
| |
| (i) | Impairment charge related to business restructuring activities. |
The net book value of land and buildings comprised:
| | 2004 | | 2003 | |
| | £m | | £m | |
|
|
|
| |
| Freehold | 564 | | 653 | |
| Long leasehold (over 50 years) | 4 | | 32 | |
| Short leasehold (under 50 years) | 14 | | 9 | |
|
|
|
| |
| | 582 | | 694 | |
|
|
|
| |
The cost of tangible fixed assets at 31 March 2004 included £402m (2003: £347m) relating to interest capitalised.
Included within creditors (amounts falling due within one year) and creditors (amounts falling due after more than one year) at 31 March 2004 are contributions to the cost of tangible fixed assets amounting to £46m (2003: £32m) and £1,130m (2003: £1,079m) respectively.
Annual Report and Accounts 2003/04_National Grid Transco 88
Back to Contents
Notes to the Accounts_continued
| 14. Fixed asset investments | | | | | |
| | | Group | | Company | |
| |
|
|
|
|
|
|
| |
| |
| | | Unlisted joint ventures | | | | | | | | | |
| | | share of net | | Own | | Other | | | | Group | |
| | | assets | | shares | | investments | | Total | | undertakings | |
| | | £m | | £m | | £m | | £m | | £m | |
|
|
|
|
|
|
|
|
|
|
| |
| At 1 April 2003 (as previously reported) | | 44 | | 39 | | 170 | | 253 | | 2,225 | |
| Prior year adjustment (note 1) | | – | | (39 | ) | – | | (39 | ) | – | |
|
|
|
|
|
|
|
|
|
|
| |
| At 1 April 2003 (restated) | | 44 | | – | | 170 | | 214 | | 2,225 | |
| Exchange adjustments | | (5 | ) | – | | (21 | ) | (26 | ) | – | |
| Additions | | 1 | | – | | 5 | | 6 | | – | |
| Disposals | | (17 | ) | – | | (22 | ) | (39 | ) | – | |
| Share of retained loss | | (4 | ) | – | | – | | (4 | ) | – | |
|
|
|
|
|
|
|
|
|
|
| |
| At 31 March 2004 | | 19 | | – | | 132 | | 151 | | 2,225 | |
|
|
|
|
|
|
|
|
|
|
| |
With the exception of investments in unlisted joint ventures, which are carried in the balance sheet at the Group’s share of their net assets, all investments are carried at cost.
The names of the principal Group undertakings and joint ventures are included in note 30.
| 15. Stocks | | |
| | Group | |
|
|
|
| |
| | 2004 | | 2003 | |
| | £m | | £m | |
|
|
|
| |
| Raw materials and consumables | 53 | | 60 | |
| Work in progress | 21 | | 53 | |
| Fuel stocks | 17 | | 13 | |
|
|
|
| |
| | 91 | | 126 | |
|
|
|
| |
| 16. Debtors | | | | |
| | Group | | Company | |
| |
|
|
| |
|
|
| |
| | | 2004 | | 2003 | | 2004 | | 2003 | |
| | | £m | | £m | | £m | | £m | |
|
|
|
|
|
|
|
|
| |
| Amounts falling due within one year: | | | | | | | | | |
| Trade debtors | | 496 | | 628 | | – | | – | |
| Amounts owed by Group undertakings | | – | | – | | 3,883 | | 2,652 | |
| Regulatory assets | | 472 | | 406 | | – | | – | |
| Other debtors | | 158 | | 381 | | – | | 12 | |
| Prepayments and accrued income | | 462 | | 396 | | 1 | | – | |
|
|
|
|
|
|
|
|
| |
| | | 1,588 | | 1,811 | | 3,884 | | 2,664 | |
|
|
|
|
|
|
|
|
| |
| Amounts falling due after more than one year: | | | | | | | | | |
| Regulatory assets | | 2,639 | | 3,337 | | – | | – | |
| Other debtors | | 69 | | 58 | | – | | – | |
|
|
|
|
|
|
|
|
| |
| | | 2,708 | | 3,395 | | – | | – | |
|
|
|
|
|
|
|
|
| |
| | | 4,296 | | 5,206 | | 3,884 | | 2,664 | |
|
|
|
|
|
|
|
|
| |
| | | |
| Provision for doubtful debts | Group | |
| £m | |
|
| |
| At 1 April 2003 | 116 | |
| Exchange adjustments | (13 | ) |
| Reinstatement of amounts previously written off | 14 | |
| Charge for the year | 50 | |
| Uncollectable amounts written off net of recoveries | (39 | ) |
|
| |
| At 31 March 2004 | 128 | |
|
| |
Other debtors falling due within one year included tax recoverable of £nil (2003: £62m).
89 National Grid Transco_Annual Report and Accounts 2003/04
Back to Contents
Notes to the Accounts_continued
17. Assets held for exchange
The assets held for exchange in 2003 of £17m represented the carrying value of 74m shares of Energis plc which were held to satisfy obligations under the 6% Mandatorily Exchangeable Bonds 2003, as explained in note 20. The voting rights in respect of 61m of these shares were vested in the bondholders.
| 18. Creditors (amounts falling due within one year) |
| | | | | Group | | | | Company | |
| |
|
|
| |
|
|
| |
| | | 2004 | | 2003 | | 2004 | | 2003 | |
| | £m | £m | £m | £m |
|
|
|
|
|
|
|
|
| |
| | | | | | | | | | |
| Borrowings (note 20) | | 1,706 | | 2,246 | | 388 | | 557 | |
| Trade creditors and accruals | | 1,031 | | 1,249 | | – | | – | |
| Amounts owed to Group undertakings | | – | | – | | 1,680 | | 1,439 | |
| Purchased power obligations | | 57 | | 68 | | – | | – | |
| Corporate tax | | 122 | | – | | – | | – | |
| Social security and other taxes | | 191 | | 203 | | – | | – | |
| Proposed dividend | | 366 | | 317 | | 366 | | 317 | |
| Liability for index-linked swap contracts | | 100 | | 121 | | – | | – | |
| Other creditors | | 606 | | 589 | | 6 | | 8 | |
| Deferred income | | 334 | | 253 | | 4 | | – | |
|
|
|
|
|
|
|
|
| |
| | | 4,513 | | 5,046 | | 2,444 | | 2,321 | |
|
|
|
|
|
|
|
|
| |
Other creditors included interest payable of £286m (2003: £269m).
| 19. Creditors (amounts falling due after more than one year) | | | | | | | | | |
| | | | | Group | | | | Company | |
| |
|
|
| |
|
|
| |
| | | 2004 | | 2003 | | 2004 | | 2003 | |
| | £m | £m | £m | £m |
|
|
|
|
|
|
|
|
| |
| Borrowings (note 20) | | 11,542 | | 12,233 | | 746 | | – | |
| Purchased power obligations | | 149 | | 253 | | – | | – | |
| Liability for index-linked swap contracts | | 291 | | 381 | | – | | – | |
| Other creditors | | 289 | | 309 | | – | | – | |
| Deferred income | | 1,193 | | 1,079 | | 13 | | – | |
|
|
|
|
|
|
|
|
| |
| | | 13,464 | | 14,255 | | 759 | | – | |
|
|
|
|
|
|
|
|
| |
Other creditors included £9m (2003: £nil) of corporate tax.
Purchased power obligations
As part of the sale of substantially all its non-nuclear generating business, National Grid USA entered into purchased power transfer agreements with the purchasers whereby the purchasers took over a number of long-term contracts between National Grid USA and owners of various generating units. In exchange, National Grid USA committed to make fixed monthly payments to the purchasers towards the above-market cost of the contracts. The creditor relating to purchased power obligations, which is also reflected in regulatory assets (note 16), represents the net present value of these monthly payments discounted at 3.3%. At 31 March 2004, amounts falling due after more than five years totalled £1m (2003: £15m).
Liability for index-linked swap contracts
National Grid USA has entered into indexed swap contracts that expire in 2008. A further three swap contracts expired in June and September 2003. National Grid USA has recorded a liability in respect of these contractual obligations and recorded a corresponding regulatory asset as losses on these instruments will be recovered from customers. The amount of the liability and regulatory asset will fluctuate over the remaining terms of the swaps as nominal energy quantities are settled and may be adjusted as periodic assessments are made of energy prices.
Annual Report and Accounts 2003/04_National Grid Transco 90
Back to Contents
Notes to the Accounts_continued
20. Borrowings
The following table analyses the Group’s total borrowings after taking account of currency and interest rate swaps:
| | | | | Group | | | | Company | |
| |
|
|
| |
|
|
| |
| | | 2004 | | 2003 | | 2004 | | 2003 | |
| | £m | £m | £m | £m |
|
|
|
|
|
|
|
|
| |
| Amounts falling due within one year: | | | | | | | | | |
| Bank loans and overdrafts | | 314 | | 484 | | 33 | | – | |
| Commercial paper | | 557 | | 557 | | 355 | | 557 | |
| 6% Mandatorily Exchangeable Bonds 2003 | | – | | 243 | | – | | – | |
| Other bonds | | 832 | | 730 | | – | | – | |
| Other loans | | 3 | | 232 | | – | | – | |
|
|
|
|
|
|
|
|
| |
| | | 1,706 | | 2,246 | | 388 | | 557 | |
|
|
|
|
|
|
|
|
| |
| Amounts falling due after more than one year: | | | | | | | | | |
| Bank loans | | 823 | | 613 | | – | | – | |
| 4.25% Exchangeable Bonds 2008 | | – | | 502 | | – | | – | |
| Other bonds | | 10,587 | | 10,881 | | 746 | | – | |
| Other loans | | 132 | | 237 | | – | | – | |
|
|
|
|
|
|
|
|
| |
| | | 11,542 | | 12,233 | | 746 | | – | |
|
|
|
|
|
|
|
|
| |
| Total borrowings | | 13,248 | | 14,479 | | 1,134 | | 557 | |
|
|
|
|
|
|
|
|
| |
| | | | | | | | | | |
| Total borrowings are repayable as follows: | | | | | | | | | |
| In one year or less | | 1,706 | | 2,246 | | 388 | | 557 | |
| In more than one year, but not more than two years | | 877 | | 1,031 | | 52 | | – | |
| In more than two years, but not more than three years | | 2,043 | | 834 | | – | | – | |
| In more than three years, but not more than four years | | 458 | | 1,924 | | – | | – | |
| In more than four years, but not more than five years | | 1,575 | | 882 | | 308 | | – | |
| In more than five years | | | | | | | | | |
| – by instalments | | 35 | | 46 | | – | | – | |
| – other than by instalments | | 6,554 | | 7,516 | | 386 | | – | |
|
|
|
|
|
|
|
|
| |
| | | 13,248 | | 14,479 | | 1,134 | | 557 | |
|
|
|
|
|
|
|
|
| |
Charges over property, plant and other assets of the Group were provided as collateral over borrowings totalling £925m at 31 March 2004 (2003: £1,415m).
In February 1999, National Grid Holdings One plc issued 14.7m Equity Plus Income Convertible Securities (‘EPICs’) in the form of 6% Mandatorily Exchangeable Bonds 2003 (‘exchangeable bonds’) in the aggregate principal amount of US$401m. The EPICs were exchangeable, subject to certain exceptions, on or prior to 26 April 2003 at the option of the holder of the bonds (‘bondholders’) into ordinary shares of Energis plc, a company which prior to 16 July 2002 was an associated undertaking. On 16 July 2002, trading in the shares of Energis plc was suspended and on 6 May 2003, five Energis shares for each EPICs were delivered by the Group to bondholders in satisfaction of the bonds outstanding at that date.
The notional amount at maturity of the Group’s debt portfolio at 31 March 2004 was £14,164m (2003: £15,621m).
91 National Grid Transco_Annual Report and Accounts 2003/04
Back to Contents
Notes to the Accounts_continued
20. Borrowings (continued)
The 4.25% Exchangeable Bonds 2008 (‘the Bonds’) were redeemed in whole at the option of the Group on 29 September 2003. The Bonds were redeemed at their principal amount, including the redemption premium, except where the holder elected to exchange their Bonds for ordinary shares in the Company. There was no gain or loss on redemption.
The principal items included within Other bonds are listed below. Unless otherwise indicated, these instruments were outstanding at both 31 March 2004 and 31 March 2003.
| Issuer | Description of instrument (notional amount) |
|
| British Transco Finance (No5) Limited | GBP 115 million Floating Rate Instruments due 2006 |
| British Transco Finance Inc. | USD 300 million 6.625% Fixed Rate Instruments due 2018 |
| British Transco International Finance BV (i) | USD 500 million 6.125% Fixed Rate Instruments due 2003 |
| British Transco International Finance BV (i) | ITL 150,000 million 10.75% Fixed Rate Instruments due 2003 |
| British Transco International Finance BV (i) | USD 250 million 6.25% Fixed Rate Instruments due 2003 |
| British Transco International Finance BV | USD 300 million 6.0% Fixed Rate Instruments due 2004 |
| British Transco International Finance BV | USD 350 million 6.625% Fixed Rate Instruments due 2004 |
| British Transco International Finance BV | ITL 250,000 million 5.25% Fixed Rate Instruments due 2005 |
| British Transco International Finance BV | USD 350 million 7.0% Fixed Rate Instruments due 2006 |
| British Transco International Finance BV | FRF 2,000 million 5.125% Fixed Rate Instruments due 2009 |
| British Transco International Finance BV | USD 1,500 million Zero Coupon Bond due 2021 |
| National Grid Company plc | GBP 240 million 8.0% Fixed Rate Instruments due 2006 |
| National Grid Company plc (ii) | EUR 600 million 4.125% Fixed Rate Instruments due 2008 |
| National Grid Company plc | GBP 250 million 4.75% Fixed Rate Instruments due 2010 |
| National Grid Company plc | GBP 300 million 2.983% Guaranteed Retail Price Index-Linked Instruments due 2018 |
| National Grid Company plc | GBP 220 million 3.806% Retail Price Index-Linked Instruments due 2020 |
| National Grid Company plc | GBP 450 million 5.875% Fixed Rate Instruments due 2024 |
| National Grid Company plc | GBP 360 million 6.5% Fixed Rate Instruments due 2028 |
| National Grid Company plc | GBP 70 million 3.589% Limited Retail Price Index-Linked Instruments due 2030 |
| National Grid Company plc | GBP 50 million 2.817% Guaranteed Limited Retail Price Index-Linked Instruments due 2032 |
| National Grid Transco plc (ii) | EUR 500 million 3.75% Fixed Rate Instruments due 2008 |
| National Grid Transco plc (ii) | EUR 600 million 5.0% Fixed Rate Instruments due 2018 |
| New England Power Company | USD 135.85 million Tax-Exempt Pollution Control Revenue Bonds, Variable Rate due 2020 |
| New England Power Company | USD 106.15 million Tax-Exempt Pollution Control Revenue Bonds, Variable Rate due 2022 |
| NGG Finance plc | EUR 1,250 million 5.25% Fixed Rate Instruments due 2006 |
| NGG Finance plc | EUR 750 million 6.125% Fixed Rate Instruments due 2011 |
| Niagara Mohawk Power Corporation (i) | USD 400 million 7.375% Senior Notes due 2003 |
| Niagara Mohawk Power Corporation (i) | USD 220 million 7.375% Taxable First Mortgage Bonds due 2003 |
| Niagara Mohawk Power Corporation | USD 300 million 8.0% Taxable First Mortgage Bonds due 2004 |
| Niagara Mohawk Power Corporation | USD 300 million 5.375% Senior Notes due 2004 |
| Niagara Mohawk Power Corporation | USD 110 million 6.625% Taxable First Mortgage Bonds due 2005 |
| Niagara Mohawk Power Corporation | USD 400 million 7.625% Senior Notes due 2005 |
| Niagara Mohawk Power Corporation | USD 150 million 9.75% Taxable First Mortgage Bonds due 2005 |
| Niagara Mohawk Power Corporation | USD 275 million 7.75% Taxable First Mortgage Bonds due 2006 |
| Niagara Mohawk Power Corporation | USD 200 million 8.875% Senior Notes due 2007 |
| Niagara Mohawk Power Corporation | USD 600 million 7.75% Senior Notes due 2008 |
| Niagara Mohawk Power Corporation (iii) | USD 500 million 8.5% Senior Notes due 2010 |
| Niagara Mohawk Power Corporation (iii) | USD 210 million 7.875% Taxable First Mortgage Bonds due 2024 |
| Niagara Mohawk Power Corporation | USD 115.71 million 7.2% Tax-Exempt First Mortgage Bonds due 2029 |
| Transco Holdings plc | GBP 503.078 million Floating Rate Instruments due 2009 |
| Transco Holdings plc | GBP 503.078 million 4.1875% Index-Linked Instruments due 2022 |
| Transco Holdings plc | GBP 503.078 million 7.0% Fixed Rate Instruments due 2024 |
| Transco plc | EUR 650 million 5.25% Fixed Rate Instruments due 2006 |
| Transco plc | GBP 250 million 6.125% Fixed Rate Instruments due 2006 |
| Transco plc (iv) | GBP 250 million 5.625% Fixed Rate Instruments due 2007 |
| Transco plc | GBP 250 million 8.875% Fixed Rate Instruments due 2008 |
| Transco plc | AUD 500 million 7.0% Fixed Rate Instruments due 2008 |
| Transco plc | GBP 300 million 5.375% Fixed Rate Instruments due 2009 |
| Transco plc (iv) | GBP 300 million 6.0% Fixed Rate Instruments due 2017 |
| Transco plc | GBP 275 million 8.75% Fixed Rate Instruments due 2025 |
| Transco plc | GBP 50 million 6.2% Fixed Rate Instruments due 2028 |
|
| (i) | Matured during the year ended 31 March 2004. |
| (ii) | Issued during the year ended 31 March 2004. |
| (iii) | Redeemed during the year ended 31 March 2004. |
| (iv) | Issue tapped during the year ended 31 March 2004. |
Annual Report and Accounts 2003/04_National Grid Transco 92
Back to Contents
Notes to the Accounts_continued
21. Financial instruments
The Group’s treasury policy, described on pages 43 to 46, includes details of the objectives, policies and strategies of the Group associated with financial instruments with off balance sheet risk.
The Group’s counterparty exposure under foreign currency swaps and foreign exchange contracts at 31 March 2004 was £442m (2003: £443m) and under interest rate swaps was £115m (2003: £170m).
The Group had no significant exposure to either individual counterparties or geographical groups of counterparties at 31 March 2004.
Where permitted by FRS 13 ‘Derivatives and other Financial Instruments: Disclosures’, short-term debtors and creditors have been excluded from the following disclosures. It is assumed that because of short maturities, the fair value of short-term debtors and creditors approximates to their book value.
Currency and interest rate composition of financial liabilities
The currency and interest rate composition of the Group’s financial liabilities are shown in the table below after taking into account currency and interest rate swaps:
| | | | | | Fixed rate liabilities | |
|
|
|
| |
| |
| | | | | | | | | | Weighted | |
| | | | | | | | | average |
| | | | | | | | Weighted | period |
| | | | | | | | average | for which |
| | Total | | Variable rate | | Fixed rate | | interest rate | rate is fixed |
| At 31 March 2004 | £m | | £m | | £m | | % | years |
|
|
|
|
|
|
|
|
|
| |
| Sterling | 8,988 | | 5,231 | | 3,757 | | 6.09 | | 8.7 | |
| US dollars | 4,260 | | 1,376 | | 2,884 | | 7.03 | | 4.9 | |
|
|
|
|
|
|
|
|
|
| |
| Borrowings | 13,248 | | 6,607 | | 6,641 | | 6.50 | | 7.1 | |
| Other financial liabilities (sterling) | 40 | | 40 | | – | | – | | – | |
| Other financial liabilities (US dollars) | 602 | | 564 | | 38 | | 5.07 | | – | (i) |
|
|
|
|
|
|
|
|
|
| |
| | 13,890 | | 7,211 | | 6,679 | | 6.49 | | 7.1 | |
|
|
|
|
|
|
|
|
|
| |
| At 31 March 2003 | | | | | | | | | | |
|
|
|
|
|
|
|
|
|
| |
| Sterling | 9,655 | | 4,157 | | 5,498 | | 6.29 | | 8.3 | |
| US dollars | 4,824 | | 965 | | 3,859 | | 7.09 | | 5.9 | |
|
|
|
|
|
|
|
|
|
| |
| Borrowings | 14,479 | | 5,122 | | 9,357 | | 6.62 | | 7.3 | |
| Other financial liabilities (sterling) | 76 | | 60 | | 16 | | 5.34 | | 2.7 | |
| Other financial liabilities (US dollars) | 824 | | 755 | | 69 | | 5.77 | | – | (i) |
|
|
|
|
|
|
|
|
|
| |
| | 15,379 | | 5,937 | | 9,442 | | 6.61 | | 7.2 | |
|
|
|
|
|
|
|
|
|
| |
| (i) | Excludes non-equity minority interests of £38m (2003: £69m) with no final repayment date. |
At 31 March 2004 the weighted average interest rate on short-term borrowings of £1,706m (2003: £2,246m) was 4.0% (2003: 5.8%).
Foreign exchange forward deals held to manage the currency mix of the Group’s borrowings portfolio comprising a £141m (2003: £165m) forward sale of US dollars have not been adjusted in the table above.
Other US dollar financial liabilities comprised indexed-linked energy swap contracts of £391m (2003: £502m), purchased power obligations due after more than one year of £149m (2003: £253m), non-equity minority interests of £38m (2003: £69m), and interest rate swaps of £24m (2003: £nil) which are shown at fair value as they are no longer considered a hedge.
Substantially all the variable rate borrowings are subject to interest rates which fluctuate with LIBOR for the appropriate currency at differing premiums or, in the case of certain US companies, are based on the market rate for tax-exempt commercial paper.
In calculating the weighted average number of years for which interest rates are fixed, swaps which are cancellable at the option of the swap provider are assumed to have a life based on the earliest date at which they can be cancelled.
93 National Grid Transco_Annual Report and Accounts 2003/04
Back to Contents
Notes to the Accounts_continued
21. Financial instruments (continued)
Currency and interest rate composition of financial assets
The currency and interest rate composition of the Group’s financial assets are shown in the table below after taking into account currency and interest rate swaps:
| | | | | | | | Fixed rate assets | | | |
|
|
|
|
|
| |
|
|
| |
| At 31 March 2004 | | | | | | | | | | | Weighted | |
| | | | | | average |
| | | | | Weighted | period |
| | Non-interest | | | average | for which |
| Total | bearing | Variable rate | Fixed rate | interest rate | rate is fixed |
| £m | £m | £m | £m | % | years |
|
|
|
|
|
|
|
|
|
|
|
| |
| Sterling | 428 | | – | | 428 | | – | | – | | – | |
| US dollars | 165 | | – | | 165 | | – | | – | | – | |
| Other currencies | 23 | | – | | 23 | | – | | – | | – | |
|
|
|
|
|
|
|
|
|
|
|
| |
| Cash and investments | 616 | | – | | 616 | | – | | – | | – | |
| Other financial assets (sterling) | 45 | | – | | – | | 45 | | 11.50 | | 5.1 | |
| Other financial assets (US dollars) | 34 | | – | | – | | 34 | | 5.08 | | 13.8 | |
|
|
|
|
|
|
|
|
|
|
|
| |
| | 695 | | – | | 616 | | 79 | | 8.74 | | 8.8 | |
|
|
|
|
|
|
|
|
|
|
|
| |
| At 31 March 2003 | | | | | | | | | | | | |
| Sterling | 423 | | – | | 423 | | – | | – | | – | |
| US dollars | 147 | | – | | 147 | | – | | – | | – | |
| Other currencies | 31 | | – | | 31 | | – | | – | | – | |
|
|
|
|
|
|
|
|
|
|
|
| |
| Cash and investments | 601 | | – | | 601 | | – | | – | | – | |
| Other financial assets (sterling) | 67 | | 17 | | – | | 50 | | 11.50 | | 4.5 | |
| Other financial assets (US dollars) | 34 | | – | | 1 | | 33 | | 4.77 | | 10.8 | |
|
|
|
|
|
|
|
|
|
|
|
| |
| | 702 | | 17 | | 602 | | 83 | | 8.85 | | 7.0 | |
|
|
|
|
|
|
|
|
|
|
|
| |
Cash and investments earned interest at local prevailing rates for maturity periods generally not exceeding 12 months, and included listed investments with a cost of £241m (2003: £226m) and market value of £241m (2003: £226m). Other financial assets at 31 March 2004 predominantly related to a net investment in a finance lease of £45m (2003: £50m), fixed asset investments of £34m (2003: £33m) and assets held for exchange of £nil (2003: £17m). The non-interest bearing assets held for exchange were realised in May 2003, on redemption of the 6% Mandatorily Exchangeable Bonds 2003, as described in notes 17 and 20.
The maturity profile of the Group’s financial liabilities and assets are shown in the tables below after taking into account currency and interest rate swaps:
| Maturity of financial liabilities at 31 March | 2004 | | 2003 | |
| £m | £m |
|
|
|
| |
| In one year or less | 1,848 | | 2,380 | |
| In more than one year, but not more than two years | 1,029 | | 1,192 | |
| In more than two years, but not more than three years | 2,189 | | 1,005 | |
| In more than three years, but not more than four years | 589 | | 2,090 | |
| In more than four years, but not more than five years | 1,598 | | 1,040 | |
| In more than five years | 6,637 | | 7,672 | |
|
|
|
| |
| | 13,890 | | 15,379 | |
|
|
|
| |
| Maturity of financial assets at 31 March | 2004 | | 2003 | |
| £m | £m |
|
|
|
| |
| In one year or less | 625 | | 611 | |
| In more than one year, but not more than two years | 11 | | 8 | |
| In more than two years, but not more than three years | 10 | | 25 | |
| In more than three years, but not more than four years | 11 | | 10 | |
| In more than four years, but not more than five years | 10 | | 11 | |
| In more than five years | 28 | | 37 | |
|
|
|
| |
| | 695 | | 702 | |
|
|
|
| |
Annual Report and Accounts 2003/04_National Grid Transco 94
Back to Contents
Notes to the Accounts_continued
21. Financial instruments (continued)
Fair values of financial instruments at 31 March
| | | 2004 | | 2003 | |
| |
| |
|
|
| |
| | | Book value | | Fair value | | Book value | | Fair value | |
| £m | £m | £m | £m |
|
|
|
|
|
|
|
|
| |
| 6% Mandatorily Exchangeable Bonds 2003 | | – | | – | | (243 | ) | (17 | ) |
| Other short-term debt | | (1,666 | ) | (1,678 | ) | (1,965 | ) | (1,973 | ) |
| 4.25% Exchangeable Bonds 2008 | | – | | – | | (502 | ) | (510 | ) |
| Other long-term debt | | (11,767 | ) | (12,800 | ) | (12,081 | ) | (13,042 | ) |
| Cash and investments | | 616 | | 616 | | 601 | | 601 | |
| Other financial liabilities | | (642 | ) | (641 | ) | (900 | ) | (871 | ) |
| Net investment in finance lease | | 45 | | 45 | | 50 | | 50 | |
| Assets held for exchange | | – | | – | | 17 | | 17 | |
| Other financial assets | | 34 | | 36 | | 34 | | 50 | |
|
|
|
|
|
|
|
|
| |
| Financial instruments held to manage interest rate and currency profiles: | | | | | | | | | |
| Interest rate swaps | | – | | (42 | ) | – | | 8 | |
| Forward foreign currency contracts and cross-currency swaps | | 185 | | 331 | | 312 | | 533 | |
|
|
|
|
|
|
|
|
| |
Market values, where available, have been used to determine fair values. Where market values are not available, fair values have been calculated by discounting cash flows at prevailing interest rates.
The notional principal amounts relating to financial instruments held to manage interest rate and currency profiles for interest rate swaps and forward rate agreements, foreign currency contracts and cross-currency swaps at 31 March 2004 amounted to £14,301m (2003: £6,363m) and £7,898m (2003: £5,017m) respectively.
| Gains and losses on hedges | | | | | | | | | | | | |
| | Unrecognised | | Unrecognised | | Unrecognised | | Deferred | | Deferred | | Deferred | |
| gains | losses | net gain | gains | losses | net (loss)/gain |
| £m | £m | £m | £m | £m | £m |
|
|
|
|
|
|
|
|
|
|
|
| |
| Gains/(losses) on hedges at 1 April 2003 | 458 | | (229 | ) | 229 | | 39 | | (88 | ) | (49 | ) |
| (Gains)/losses arising in previous years recognised in the year | (50 | ) | 18 | | (32 | ) | (12 | ) | 12 | | – | |
|
|
|
|
|
|
|
|
|
|
|
| |
| Gains/(losses) arising in previous years not recognised in the year | 408 | | (211 | ) | 197 | | 27 | | (76 | ) | (49 | ) |
| Gains/(losses) arising in the year | 22 | | (115 | ) | (93 | ) | 104 | | (6 | ) | 98 | |
|
|
|
|
|
|
|
|
|
|
|
| |
| Gains/(losses) on hedges at 31 March 2004 | 430 | | (326 | ) | 104 | | 131 | | (82 | ) | 49 | |
|
|
|
|
|
|
|
|
|
|
|
| |
| Of which: | | | | | | | | | | | | |
| Gains/(losses) expected to be recognised within one year | 5 | | (21 | ) | (16 | ) | 21 | | (13 | ) | 8 | |
| Gains/(losses) expected to be recognised after one year | 425 | | (305 | ) | 120 | | 110 | | (69 | ) | 41 | |
|
|
|
|
|
|
|
|
|
|
|
| |
Borrowing facilities
At 31 March 2004, the Group had bilateral committed credit facilities of £1,823m (2003: £1,221m), of which £1,808m (2003: £1,221m) were undrawn. The Group also had committed credit facilities from syndicates of banks of £1,313m at 31 March 2004 (2003: £1,880m), £1,201m (2003: £1,880m) of which were undrawn, and an analysis of the maturity of these undrawn committed facilities is shown below:
| Undrawn committed borrowing facilities | | | | |
| | 2004 | | 2003 | |
| £m | £m |
|
|
|
| |
| Expiring: | | | | |
| In one year or less | 2,269 | | 1,155 | |
| In more than one year, but not more than two years | 575 | | 966 | |
| In more than two years | 165 | | 980 | |
|
|
|
| |
| | 3,009 | | 3,101 | |
|
|
|
| |
Of the unused facilities at 31 March 2004 £2,604m (2003: £2,135m) was held as back-up to commercial paper and similar borrowings. The remainder was available as additional back-up to commercial paper and for other general corporate purposes.
95 National Grid Transco_Annual Report and Accounts 2003/04
Back to Contents
Notes to the Accounts_continued
| 22. Provisions for liabilities and charges | |
| | Group | |
|
|
|
|
|
|
|
|
|
|
|
|
|
| |
| | | | Post-retirement | | | | Deferred | | | | | | Total | |
| | Decommissioning | | benefits | | Environmental | | taxation | | Restructuring | | Other | | provisions | |
| | £m | | £m | | £m | | £m | | £m | | £m | | £m | |
|
|
|
|
|
|
|
|
|
|
|
|
|
| |
| | | | | | | | | | | | | | | |
| At 1 April 2003 | 143 | | 551 | | 442 | | 3,031 | | 156 | | 83 | | 4,406 | |
| Exchange adjustments | (21 | ) | (59 | ) | (25 | ) | (148 | ) | – | | – | | (253 | ) |
| Additions | 24 | | 260 | | 35 | | 84 | | 87 | | 13 | | 503 | |
| Unwinding of discount | 7 | | – | | 22 | | – | | – | | – | | 29 | |
| Unused amounts reversed | – | | – | | (10 | ) | – | | – | | – | | (10 | ) |
| Utilised | (22 | ) | (288 | ) | (36 | ) | – | | (154 | ) | (3 | ) | (503 | ) |
| Other | – | | – | | – | | (15 | ) | – | | – | | (15 | ) |
|
|
|
|
|
|
|
|
|
|
|
|
|
| |
| At 31 March 2004 | 131 | | 464 | | 428 | | 2,952 | | 89 | | 93 | | 4,157 | |
|
|
|
|
|
|
|
|
|
|
|
|
|
| |
The decommissioning provision of £131m at 31 March 2004 represented the net present value of the estimated expenditure (discounted at a nominal rate of 4.25%) expected to be incurred in respect of the decommissioning of certain nuclear generating units and other related provisions. Related regulatory assets were also recognised (note 16). Expenditure is expected to be incurred between 2005 and 2010. Additions in the year included £3m in respect of the change in the discount rate.
The post-retirement benefits provision was in respect of pensions £273m (2003: £253m) and other post-retirement benefits (health care and life insurance) £191m (2003: £298m).
The environmental provision represented the estimated environmental restoration and remediation costs relating to a number of sites owned and managed by the Group.
At 31 March 2004, £252m (2003: £244m) of the environmental provision represented the net present value of the estimated statutory decontamination costs of old gas manufacturing sites in the UK (discounted using a nominal rate of 5.25%). The anticipated timing of the cash flows for statutory decontamination cannot be predicted with certainty, but it is expected to be incurred over the period 2005 to 2057 with some 60% of the spend projected to be spent over the next five years. During the year ended 31 March 2004, a project to survey all old gas work contaminated sites was completed. With this new information, a re-evaluation of the provision was made which also took into account the impact of the recent changes to the regulations on waste disposal and resulted in an additional provision being made as an exceptional charge of £28m in the profit and loss account – see note 4a.
There are a number of uncertainties that affect the calculation of the provision for UK gas site decontamination, including the impact of regulation, the accuracy of the site surveys, unexpected contaminants, transportation costs, the impact of alternative technologies and changes in the discount rate. The Group has made its best estimate of the financial effect of these uncertainties in the calculation of the provision, but future material changes in any of the assumptions could materially impact on the calculation of the provision and hence the profit and loss account.
The undiscounted amount of the provision at 31 March 2004 relating to UK gas site decontamination was £341m, being the undiscounted best estimate of the liability having regard to the uncertainties referred to above (excluding the impact of changes in discount rate). The Group believes that the best estimate of this liability lies in a range of between £260m and £420m.
The environmental provision at 31 March 2004 also included £165m (2003: £186m) which represented the net present value of estimated remediation expenditure in the US which has been discounted at a nominal rate of 5.75%. This expenditure is expected to be incurred between 2005 and 2046. The uncertainties regarding the calculation of this provision are similar to those considered in respect of UK gas decontamination. However, unlike the UK, with the exception of immaterial amounts of such costs, this expenditure is recoverable from rate payers under the terms of the Group’s various rate agreements in the US. As a consequence, any movement in the calculation of the best estimate of the Group’s liability is matched by a corresponding movement in the value of regulatory assets (note 16). Therefore, there is no material impact on the Group’s profit and loss account arising from changes in the calculation of this liability.
The undiscounted amount of environmental provision relating to the Group’s US based sites amounted to £233m at 31 March 2004. The Group does not have sufficient information to calculate a range of outcomes, but it is expected that any outcome of the liability would be recovered from rate payers.
The remainder of the environmental provision of £11m related to the expected cost of remediation of certain other sites in the UK, is calculated on an undiscounted basis and is expected to be utilised within the next five years.
The undiscounted amount of the total Group environmental provision at 31 March 2004 was £585m.
At 31 March 2004, £42m of the total restructuring provision (2003: £50m) consisted of provisions for the disposal of surplus leasehold interests and rates payable on surplus properties. The expected payment dates for property restructuring costs remain uncertain. The remainder of the restructuring provision related to business reorganisation costs in the UK.
Other provisions at 31 March 2004 included £54m (2003: £49m) of estimated liabilities in respect of past events incurred by the Group’s insurance undertakings, including employer liability claims. In accordance with insurance industry practice, these estimates were based on experience from previous years and there was, therefore, no identifiable payment date. Other provisions at 31 March 2004 also included £12m (2003: £12m) in respect of obligations associated with the impairment of investments in joint ventures.
| Deferred taxation comprised: | | |
| | Provided | |
|
|
|
| |
| | 2004 | | 2003 | |
£m | £m |
|
|
|
| |
| | | | | |
| Accelerated capital allowances | 2,748 | | 2,997 | |
| Other timing differences | 204 | | 34 | |
|
|
|
| |
| | 2,952 | | 3,031 | |
|
|
|
| |
A deferred tax asset in respect of substantial capital losses has not been recognised because their future recovery was uncertain. Final agreement of certain of these losses is outstanding, however, losses in excess of £700m have been agreed with the relevant tax authorities as at 31 March 2004.
Annual Report and Accounts 2003/04_National Grid Transco 96
Back to Contents
Notes to the Accounts_continued
23. Share capital
| Group | Allotted, called up and fully paid | |
|
| |
| | millions | | £m | |
|
|
|
| |
| At 31 March 2001 (i) | 2,808 | | 281 | |
| Issued during the year | 292 | | 29 | |
|
|
|
| |
| At 31 March 2002 | 3,100 | | 310 | |
| Issued during the year | 1 | | – | |
| Redeemed during the year | (24 | ) | (2 | ) |
|
|
|
| |
| At 31 March 2003 | 3,077 | | 308 | |
| Issued during the year | 11 | | 1 | |
|
|
|
| |
| At 31 March 2004 | 3,088 | | 309 | |
|
|
|
| |
| | | | | |
| One £1 special rights non-voting redeemable preference share (2003 and 2002: one). | | | | |
|
|
|
| |
| (i) | In accordance with merger accounting principles, the shares issued in connection with the Merger have been treated as if those shares were in issue throughout the year ended 31 March 2003 and comparative periods. |
The total consideration received by the Group and Company in respect of ordinary shares issued during the year ended 31 March 2004 was £34m
| Company | Allotted and issued | | Called up and partly paid | | Called up and fully paid | |
| |
| |
|
|
| |
| |
| | number | | £ | | number | | £ | | millions | | £m | |
|
|
|
|
|
|
|
|
|
|
|
| |
| At 31 March 2001 | 500,000 | | 50,000 | | 500,000 | | 12,500 | | – | | – | |
| Cancelled during the year | (500,000 | ) | (50,000 | ) | (500,000 | ) | (12,500 | ) | – | | – | |
| Issued during the year | 1,776,932,870 | | 177,693,287 | | 23,450 | (i) | 2,345 | | 1,777 | | 178 | |
|
|
|
|
|
|
|
|
|
|
|
| |
| At 31 March 2002 | 1,776,932,870 | | 177,693,287 | | 23,450 | | 2,345 | | 1,777 | | 178 | |
| Issued during the year | 1,324,195,509 | | 132,419,551 | | – | | – | | 1,324 | | 132 | |
| Fully paid up during the year | – | | – | | (23,450 | ) | (2,345 | ) | – | | – | |
| Repurchased and cancelled during the year | (24,225,000 | ) | (2,422,500 | ) | – | | – | | (24 | ) | (2 | ) |
|
|
|
|
|
|
|
|
|
|
|
| |
| At 31 March 2003 | 3,076,903,379 | | 307,690,338 | | – | | – | | 3,077 | | 308 | |
| Issued during the year | 10,700,377 | | 1,070,038 | | – | | – | | 11 | | 1 | |
|
|
|
|
|
|
|
|
|
|
|
| |
| At 31 March 2004 | 3,087,603,756 | | 308,760,376 | | – | | – | | 3,088 | | 309 | |
|
|
|
|
|
|
|
|
|
|
|
| |
| | |
| One £1 special rights non-voting redeemable preference share (2003: one; 2002: nil). | |
| |
| (i) | These shares were nil paid at 31 March 2002. They represented shares issued to financial institutions in order to purchase Niagara Mohawk which were not required to form part of the final consideration and were sold on the open market during the year ended 31 March 2003. |
At 31 March 2001, the authorised share capital of the Company was £250m and the allotted and issued share capital of the Company was £50,000 (500,000 ordinary shares of 10 pence each), of which £12,500 had been called up and paid.
At 31 March 2002, the authorised share capital of the Company was £250m (2,500m ordinary shares of 10 pence each and one £1 special rights non-voting redeemable preference share).
On 21 October 2002, the authorised share capital of the Company was increased to £500m (5,000m ordinary shares of 10 pence each and one £1 special rights non-voting redeemable preference share). This remained unchanged at 31 March 2003 and 31 March 2004.
During the year ended 31 March 2003, the Group purchased for cancellation 24,225,000 of its ordinary shares at an average price per ordinary share of 401.59p.
The special rights non-voting redeemable preference share of £1 in National Grid Transco plc (‘the Special Share’), held on behalf of the Crown, was issued by National Grid to the Secretary of State for Trade and Industry on 31 January 2002 as part of a scheme of arrangement. It was redeemed at par on 5 May 2004. The Special Share did not carry any rights to vote at general meetings but entitled the holder to receive notice of and to attend and speak at such meetings. Certain matters, in particular the alteration of certain Articles of Association of the Company, required the prior written consent of the holder of the Special Share. The Special Share conferred no right to participate in the capital or profits of the Company, except that on a winding-up the holder of the Special Share was entitled to repayment of £1 in priority to other shareholders. Prior to 31 January 2002, the Secretary of State for Trade and Industry held a Special Share with equivalent rights in National Grid Holdings One plc. A similar special share in Lattice was held at 31 March 2002 by the Crown. This share was redeemed on 21 October 2002 as part of the Merger arrangements.
Share option schemes
The Group operates two principal forms of share option scheme. They are an employee sharesave scheme and an Executive Share Option Scheme (‘the Executive Scheme’). The details given below relate to the schemes operated by the Group and the sharesave scheme formerly operated by Lattice. Following the Merger, most Lattice scheme options were converted into 0.375 National Grid Transco plc options. The remaining Lattice scheme options lapsed on 29 April 2003.
In any 10-year period, the maximum number of shares that may be issued or issuable pursuant to the exercise of options under all of the Group’s share option schemes may not exceed the number of shares representing 10% of the issued ordinary share capital from time to time.
97 National Grid Transco_Annual Report and Accounts 2003/04
Back to Contents
Notes to the Accounts_continued
23. Share capital (continued)
Share option schemes (continued)
The sharesave scheme is savings related where, under normal circumstances, share options are exercisable on completion of a three or a five-year save-as-you-earn contract. The exercise price of options granted represents 80% of the market price at the date the option was granted.
The Executive Scheme applies to senior executives, including Executive Directors. Options granted for the 1999/2000 financial year are subject to the achievement of performance targets related to earnings per share growth over a three-year period and have now vested. Options granted for the 2000/01 financial year and thereafter are subject to the achievement of performance targets related to total shareholder returns over a three-year period and these have not yet vested. The share options are generally exercisable between the third and tenth anniversaries of the date of grant if the relevant performance target is achieved.
Movement in options to subscribe for ordinary shares under the Group’s various options schemes for the three years ended 31 March 2004 are shown below and include those options related to shares issued to employee benefit trusts:
| | | Sharesave scheme options | | Executive share scheme options | | Total options | |
| |
| |
| |
| |
| | | Weighted | | | | Weighted | | | | | |
| average price | average price |
| | | £ | | millions | | £ | | millions | | millions | |
|
|
|
|
|
|
|
|
|
|
| |
| At 31 March 2001 | | 2.54 | | 13.1 | | 4.31 | | 6.9 | | 20.0 | |
| Granted | | 4.57 | | 2.4 | | 5.50 | | 2.6 | | 5.0 | |
| Lapsed – forfeited | | 3.74 | | (0.7 | ) | – | | – | | (0.7 | ) |
| Lapsed – expired | | – | | – | | 4.17 | | (0.1 | ) | (0.1 | ) |
| Exercised | | 1.76 | | (5.0 | ) | 3.05 | | (0.9 | ) | (5.9 | ) |
|
|
|
|
|
|
|
|
|
|
| |
| At 31 March 2002 | | 3.33 | | 9.8 | | 4.81 | | 8.5 | | 18.3 | |
| Converted from Lattice sharesave scheme | | 3.18 | | 26.7 | | – | | – | | 26.7 | |
| Granted | | 3.62 | | 9.9 | | 4.78 | | 5.1 | | 15.0 | |
| Lapsed – forfeited | | 4.14 | | (3.7 | ) | 5.10 | | – | | (3.7 | ) |
| Lapsed – expired | | 3.68 | | (1.0 | ) | 2.85 | | (0.1 | ) | (1.1 | ) |
| Exercised | | 2.39 | | (3.7 | ) | 2.84 | | (0.4 | ) | (4.1 | ) |
|
|
|
|
|
|
|
|
|
|
| |
| At 31 March 2003 | | 3.31 | | 38.0 | | 4.86 | | 13.1 | | 51.1 | |
| Granted | | 3.17 | | 10.4 | | 4.05 | | 0.1 | | 10.5 | |
| Lapsed – expired | | 3.52 | | (5.1 | ) | 5.24 | | (0.9 | ) | (6.0 | ) |
| Exercised | | 3.16 | | (11.6 | ) | 2.90 | | (0.3 | ) | (11.9 | ) |
|
|
|
|
|
|
|
|
|
|
| |
| At 31 March 2004 | | 3.32 | | 31.7 | | 4.84 | | 12.0 | | 43.7 | |
|
|
|
|
|
|
|
|
|
|
| |
Included within options outstanding at 31 March 2004 and 31 March 2003 were the following options which were exercisable:
| At 31 March 2004 | 3.32 | | 0.8 | | 3.78 | | 2.4 | | 3.2 | |
|
|
|
|
|
|
|
|
|
| |
| At 31 March 2003 | 3.34 | | 1.7 | | 3.72 | | 2.4 | | 4.1 | |
|
|
|
|
|
|
|
|
|
| |
The weighted average remaining contractual life of options in the employee sharesave scheme at 31 March 2004 was 2 years and 6 months. These options have exercise prices between £3.12 and £4.57.
Lattice sharesave scheme
| | Weighted | | Sharesave | |
| average price | scheme |
| £ | millions |
|
|
|
| |
| At 31 March 2001 | 1.18 | | 71.0 | |
| Granted | 1.29 | | 11.0 | |
| Lapsed – forfeited | 1.18 | | (2.8 | ) |
|
|
|
| |
| At 31 March 2002 | 1.19 | | 79.2 | |
| Lapsed – forfeited | 1.21 | | (1.4 | ) |
| Lapsed – expired | 1.20 | | (3.4 | ) |
| Exercised | 1.19 | | (1.9 | ) |
| Converted to National Grid Transco options | 1.19 | | (71.2 | ) |
|
|
|
| |
| At 31 March 2003 | 1.20 | | 1.3 | |
| Lapsed – expired | 1.20 | | (1.3 | ) |
|
|
|
| |
| At 31 March 2004 | – | | – | |
|
|
|
| |
Following the merger of Lattice and National Grid, a number of employees did not convert their Lattice sharesave options into National Grid Transco options. These options lapsed on 29 April 2003 if they had not been exercised by that date.
The National Grid Transco employee sharesave scheme is Inland Revenue approved and hence, as permitted by UITF abstract 17 (revised 2000) ‘Employee share shemes’, no charge has been made to the profit and loss account.
Annual Report and Accounts 2003/04_National Grid Transco 98
Back to Contents
Notes to the Accounts_continued
23. Share capital (continued)
Share option schemes (continued)
Executive options outstanding and exercisable and their weighted average exercise prices for the respective ranges of exercise prices and years at 31 March 2004 are as follows:
|
|
|
|
|
|
|
|
|
|
|
|
| | Weighted average | | | | Weighted average | | | | | | |
| | exercise price of | | Number | | exercise price of | | Number | | Exercise price | | Normal dates |
| | exercisable options | | exercisable | | outstanding options | | outstanding | | per share | | of exercise |
| | £ | | millions | | £ | | millions | | pence | | Years |
|
|
|
|
|
|
|
|
|
|
|
|
| Executive scheme | 2.77 | | 0.7 | | 2.77 | | 0.7 | | 258.0 – 280.5 | | 2001 – 2008 |
| | 3.78 | | 0.7 | | 3.78 | | 0.7 | | 375.8 – 490.0 | | 2002 – 2009 |
| | 4.91 | | 0.2 | | 5.31 | | 1.9 | | 424.0 – 566.5 | | 2003 – 2010 |
| | 5.36 | | 0.2 | | 5.33 | | 1.4 | | 526.0 – 623.0 | | 2004 – 2011 |
| | 5.56 | | 0.2 | | 5.50 | | 2.3 | | 479.5 – 563.0 | | 2005 – 2012 |
| | 4.57 | | 0.3 | | 4.68 | | 4.9 | | 434.3 – 481.5 | | 2006 – 2013 |
| | 4.05 | | 0.1 | | 4.05 | | 0.1 | | 405.0 | | 2007 – 2014 |
|
|
|
|
|
|
|
|
|
|
|
|
| | 3.78 | | 2.4 | | 4.84 | | 12.0 | | | | |
|
|
|
|
|
|
|
|
|
|
|
|
24. Reserves
| | | Group | | Company | |
| |
| |
| |
| | | Share premium account | | Revaluation reserve | | Other reserves | | Profit and loss account | | Share premium account | | Other reserve | | Profit and loss account | |
| | | £m | | £m | | £m | | £m | | £m | | £m | | £m | |
|
|
|
|
|
|
|
|
|
|
|
|
|
|
| |
| At 31 March 2001 (as previously reported) | | – | | 50 | | (5,202 | ) | 6,225 | | – | | – | | – | |
| Prior year adjustment | | – | | – | | – | | (26 | ) | – | | – | | – | |
|
|
|
|
|
|
|
|
|
|
|
|
|
|
| |
| At 31 March 2001 (restated) | | – | | 50 | | (5,202 | ) | 6,199 | | – | | – | | – | |
| Exchange adjustments | | – | | – | | – | | (58 | ) | – | | – | | – | |
| Tax on exchange adjustments | | – | | – | | – | | 21 | | – | | – | | – | |
| Ordinary shares issued during the year | | | | | | | | | | | | | | | |
| – Share option scheme | | 46 | | – | | – | | – | | 1 | | – | | | |
| – Acquisition | | 1,242 | | – | | – | | – | | 1,242 | | – | | – | |
| Transfer on issue of certain shares under share option schemes | | 11 | | – | | – | | (11 | ) | – | | – | | – | |
| Unrealised gain on transfer of assets to a joint venture (net of tax) | | – | | – | | 7 | | – | | – | | – | | – | |
| Reduction in revaluation reserve | | – | | (50 | ) | – | | – | | – | | – | | – | |
| Movement in shares held by employee share trusts | | – | | – | | – | | (27 | ) | – | | – | | – | |
| Retained (loss)/profit for the year | | – | | – | | – | | (901 | ) | – | | – | | 498 | |
| Transfer | | (56 | ) | – | | 56 | | – | | – | | – | | – | |
|
|
|
|
|
|
|
|
|
|
|
|
|
|
| |
| At 31 March 2002 (restated) | | 1,243 | | – | | (5,139 | ) | 5,223 | | 1,243 | | – | | 498 | |
| Exchange adjustments | | – | | – | | – | | (322 | ) | – | | – | | – | |
| Tax on exchange adjustments | | – | | – | | – | | 12 | | – | | – | | – | |
| Ordinary shares issued during the year | | 2 | | – | | – | | – | | 4 | | – | | – | |
| Repurchase and cancellation of ordinary shares | | – | | – | | 2 | | (97 | ) | – | | 2 | | (97 | ) |
| Transfer on issue of certain shares under share option schemes | | 2 | | – | | – | | (2 | ) | – | | – | | – | |
| Unrealised gain on transfer of assets to a joint venture (net of tax) | | – | | – | | 6 | | – | | – | | – | | – | |
| Movement in shares held by employee share trusts | | – | | – | | – | | 14 | | – | | – | | – | |
| Retained (loss)/profit for the year | | – | | – | | – | | (139 | ) | – | | – | | 734 | |
|
|
|
|
|
|
|
|
|
|
|
|
|
|
| |
| At 31 March 2003 (restated) | | 1,247 | | – | | (5,131 | ) | 4,689 | | 1,247 | | 2 | | 1,135 | |
| Exchange adjustments | | – | | – | | – | | (417 | ) | – | | – | | – | |
| Tax on exchange adjustments | | – | | – | | – | | (12 | ) | – | | – | | – | |
| Ordinary shares issued during the year | | 33 | | – | | – | | – | | 33 | | – | | – | |
| Movement in shares held by employee share trusts | | – | | – | | – | | 5 | | – | | – | | – | |
| Retained profit for the year | | – | | – | | – | | 490 | | – | | – | | 186 | |
|
|
|
|
|
|
|
|
|
|
|
|
|
|
| |
| At 31 March 2004 | | 1,280 | | – | | (5,131 | ) | 4,755 | | 1,280 | | 2 | | 1,321 | |
|
|
|
|
|
|
|
|
|
|
|
|
|
|
| |
The Company has not presented its own profit and loss account as permitted by section 230 of the Companies Act 1985. The Company’s profit after taxation was £795m (2003: £1,264m; 2002: £667m).
Other reserves are non-distributable reserves. They primarily represent the difference between the carrying value of Group undertakings, investments and their respective capital structures following the Lattice Demerger from BG Group plc and the 1999 Lattice Refinancing of £(5,745)m. The reserve also included the merger differences described below of £221m and £359m together with unrealised gains of £32m on transfer of fixed assets to a former joint venture which subsequently became a Group undertaking.
The revaluation reserve brought forward as at 1 April 2001 related to investment properties. These properties were reclassified as other land and buildings in 2001 and are now reported at historical cost.
During the year ended 31 March 2002, the application of merger accounting principles to a group reconstruction which involved the creation of a new holding company gave rise to a difference of £359m. It was accounted for as a merger difference and included within other reserves. In accordance with merger accounting principles, the shares issued in connection with the scheme of arrangement to acquire the former holding company of the Group (National Grid Holdings One plc), as adjusted to reflect the issue of options were treated as if issued throughout the year ended 31 March 2002 and comparative period.
99 National Grid Transco_Annual Report and Accounts 2003/04
Back to Contents
Notes to the Accounts_continued
24. Reserves (continued)
During the year ended 31 March 2003, the application of merger accounting principles to the Merger gave rise to a difference of £221m. It was accounted for as a merger difference and included within other reserves. The difference represented the excess of nominal share capital in issue by Lattice at the date of the Merger over the National Grid Transco plc share capital issued to Lattice shareholders. In accordance with merger accounting principles, the shares issued in connection with the Merger were treated as if issued throughout the year ended 31 March 2003 and comparative periods.
Own shares are included in the profit and loss account reserve at 31 March 2004 and related to 9m 10p ordinary shares in National Grid Transco plc, held by employee share trusts for the purpose of satisfying certain obligations under various share option schemes operated by the Group. The carrying value of £34m (market value £43m) at 31 March 2004 represented the exercise amounts receivable in respect of those which were issued at market value by the Company and the cost in respect of those shares purchased in the open market. These own shares were, in prior years, held in fixed assets investments, the adoption of UITF 38 as indicated in note 1 has resulted in these shares now being held within the profit and loss account reserve, as a result the profit and loss account reserve for 31 March 2001, 31 March 2002 and 31 March 2003 were restated.
Funding is provided to the trusts by Group undertakings. The trusts have waived their rights to dividends on these shares.
Own shares at 31 March 2003 related to 10m 10p ordinary shares in National Grid Transco plc (book value £39m, market value £37m).
Own shares at 31 March 2002 related to 13m 10p ordinary shares in National Grid (book value £46m, market value £61m) and 33m 10p ordinary shares in Lattice (book value £7m, market value £57m), prior to the Merger.
25. Non-equity minority interests
The non-equity minority interests of £38m (2003: £69m) comprised cumulative preference stock issued by Group undertakings.
| 26. Reconciliation of movement in equity shareholders’ funds | | | | | | |
| | 2004 | | 2003 | | 2002 | |
| | | | (restated) | | (restated) | |
| | £m | | £m | | £m | |
|
|
|
|
|
| |
| Profit/(loss) for the year | 1,099 | | 391 | | (321 | ) |
| Dividends | (609 | ) | (530 | ) | (580 | ) |
|
|
|
|
|
| |
| | 490 | | (139 | ) | (901 | ) |
| Issue of ordinary shares | 34 | | 2 | | 1,317 | |
| Repurchase and cancellation of ordinary shares | – | | (97 | ) | – | |
| Exchange adjustments | (417 | ) | (322 | ) | (58 | ) |
| Tax on exchange adjustments | (12 | ) | 12 | | 21 | |
| Movement in shares held by employee share trust | 5 | | 14 | | (27 | ) |
| Unrealised gain on transfer of assets to a joint venture (net of tax) | – | | 6 | | 7 | |
| Reduction in revaluation reserve on reclassification of investment properties | – | | – | | (50 | ) |
|
|
|
|
|
| |
| Net increase/(decrease) in equity shareholders’ funds | 100 | | (524 | ) | 309 | |
| Equity shareholders’ funds at start of year | 1,113 | | 1,637 | | 1,328 | |
|
|
|
|
|
| |
| Equity shareholders’ funds at end of year | 1,213 | | 1,113 | | 1,637 | |
|
|
|
|
|
| |
Annual Report and Accounts 2003/04_National Grid Transco 100
Back to Contents
Notes to the Accounts_continued
27. Group cash flow statement
a) Reconciliation of operating profit to net cash inflow from operating activities before exceptional items | |
| | 2004 | | 2003 | | 2002 | |
| | £m | | £m | | £m | |
|
|
|
|
|
| |
| Operating profit of Group undertakings | 1,855 | | 1,612 | | 1,060 | |
| Group exceptional operating items | 277 | | 476 | | 673 | |
| Depreciation and amortisation | 1,117 | | 1,088 | | 876 | |
| Decrease/(increase) in stocks | 31 | | (16 | ) | 3 | |
| (Increase)/decrease in debtors | (121 | ) | (149 | ) | 222 | |
| (Decrease)/increase in creditors | (6 | ) | 159 | | (180 | ) |
| Decrease in provisions | (95 | ) | (16 | ) | (260 | ) |
|
|
|
|
|
| |
| Net cash inflow from operating activities before exceptional items | 3,058 | | 3,154 | | 2,394 | |
|
|
|
|
|
| |
| b) Disposal of investments | | | | | | |
| | 2004 | | 2003 | | 2002 | |
| | £m | | £m | | £m | |
|
|
|
|
|
| |
| Cash consideration received | 33 | | 328 | | 37 | |
|
|
|
|
|
| |
| Comprises: | | | | | | |
| Disposal of Group undertakings | – | | 92 | | 37 | |
| Disposal of other investments | 33 | | 236 | | – | |
|
|
|
|
|
| |
| | 33 | | 328 | | 37 | |
|
|
|
|
|
| |
| c) Acquisition of Group undertakings | |
| | 2004 | | 2003 | | 2002 | |
| | £m | | £m | | £m | |
|
|
|
|
|
| |
| Payments to acquire Group undertakings | – | | – | | (943 | ) |
| Overdraft of Group undertakings acquired | – | | – | | (7 | ) |
|
|
|
|
|
| |
| | – | | – | | (950 | ) |
|
|
|
|
|
| |
| d) Reconciliation of net cash flow to movement in net debt | |
| | 2004 | | 2003 | | 2002 | |
| | £m | | £m | | £m | |
|
|
|
|
|
| |
| Movement in cash and overdrafts | 13 | | 34 | | 22 | |
| Net cash outflow/(inflow) from the management of liquid resources | 48 | | 138 | | (347 | ) |
| Decrease/(increase) in borrowings | 426 | | (267 | ) | (1,206 | ) |
|
|
|
|
|
| |
| Change in net debt resulting from cash flows | 487 | | (95 | ) | (1,531 | ) |
| Acquisition of Group undertakings | – | | – | | (3,678 | ) |
| Disposal of Group undertaking | – | | (62 | ) | – | |
| Exchange adjustments | 534 | | 593 | | 20 | |
| Settlement of EPICs (see note 4(b)) | 243 | | – | | – | |
| Other non-cash movements | (18 | ) | (15 | ) | (5 | ) |
|
|
|
|
|
| |
| Movement in net debt in the year | 1,246 | | 421 | | (5,194 | ) |
| Net debt at start of year | (13,878 | ) | (14,299 | ) | (9,105 | ) |
|
|
|
|
|
| |
| Net debt at end of year | (12,632 | ) | (13,878 | ) | (14,299 | ) |
|
|
|
|
|
| |
During the year ended 31 March 2004 certain cross-currency swaps were terminated and £209m of cash was received. £61m of this cash flow was reported in the cash flow statement within the total of net cash outflow for returns on investments and servicing of finance amounting to £(692)m, and £148m was reported within net cash inflow from financing. Termination of these cross-currency swaps also necessitated a re-translation of Euro denominated debt at new swapped rates amounting to £(140)m, which was reported within the net exchange adjustments of £534m reported above.
101 National Grid Transco_Annual Report and Accounts 2003/04
Back to Contents
Notes to the Accounts_continued
27. Group cash flow statement (continued)
e) Analysis of changes in net debt | | | | | | | | | | | | |
| | | | | | |
| | | Acquisition | | Other | |
| At 1 April | Cash | of Group | Exchange | non-cash | At 31 March |
| 2001 | flow | undertakings | adjustments | movements | 2002 |
| £m | £m | £m | £m | £m | £m |
|
|
|
|
|
|
|
|
|
|
|
| �� |
| Cash at bank and in hand | 28 | | 82 | | – | | – | | – | | 110 | |
| Bank overdrafts | (24 | ) | (60 | ) | – | | – | | – | | (84 | ) |
| | | | 22 | | | | | | | | | |
| Current asset investments | 491 | | (347 | ) | 215 | | (5 | ) | – | | 354 | |
| | | | | | | | | | | | | |
| Borrowings due after one year | (8,254 | ) | (1,830 | ) | (3,189 | ) | 11 | | 549 | | (12,713 | ) |
| Borrowings due within one year | (1,346 | ) | 624 | | (704 | ) | 14 | | (554 | ) | (1,966 | ) |
| | | | (1,206 | ) | | | | | | | | |
|
|
|
|
|
|
|
|
|
|
|
| |
| | (9,105 | ) | (1,531 | ) | (3,678 | ) | 20 | | (5 | ) | (14,299 | ) |
|
|
|
|
|
|
|
|
|
|
|
| |
| | | | | | | | | | | | | |
| | | Disposal | | Other | |
| At 1 April | Cash | of Group | Exchange | non-cash | At 31 March |
| 2002 | flow | undertakings | adjustments | movements | 2003 |
| £m | £m | £m | £m | £m | £m |
|
|
|
|
|
|
|
|
|
|
|
| |
| Cash at bank and in hand | 110 | | 12 | | – | | (3 | ) | – | | 119 | |
| Bank overdrafts | (84 | ) | 22 | | – | | – | | – | | (62 | ) |
| | | | 34 | | | | | | | | | |
| Current asset investments | 354 | | 138 | | – | | (10 | ) | – | | 482 | |
| | | | | | | | | | | | | |
| Borrowings due after one year | (12,713 | ) | (1,226 | ) | (55 | ) | 497 | | 1,264 | | (12,233 | ) |
| Borrowings due within one year | (1,966 | ) | 959 | | (7 | ) | 109 | | (1,279 | ) | (2,184 | ) |
| | | | (267 | ) | | | | | | | | |
|
|
|
|
|
|
|
|
|
|
|
| |
| | (14,299 | ) | (95 | ) | (62 | ) | 593 | | (15 | ) | (13,878 | ) |
|
|
|
|
|
|
|
|
|
|
|
| |
| | | | | | | | | | | | | |
| | | | | | | | | | Other | | | |
| At 1 April | Cash | Exchange | Settlement | non-cash | At 31 March |
| 2003 | flow | adjustments | of EPICs | movements | 2004 |
| £m | £m | £m | £m | £m | £m |
|
|
|
|
|
|
|
|
|
|
|
| |
| | | | | | | | | | | | | |
| Cash at bank and in hand | 119 | | (21 | ) | (2 | ) | – | | – | | 96 | |
| Bank overdrafts | (62 | ) | 34 | | 2 | | – | | – | | (26 | ) |
| | | | 13 | | | | | | | | | |
| Current asset investments | 482 | | 48 | | (10 | ) | – | | – | | 520 | |
| | | | | | | | | | | | | |
| Borrowings due after one year | (12,233 | ) | (1,117 | ) | 448 | | – | | 1,360 | | (11,542 | ) |
| Borrowings due within one year | (2,184 | ) | 1,543 | | 96 | | 243 | | (1,378 | ) | (1,680 | ) |
| | | | 426 | | | | | | | | | |
|
|
|
|
|
|
|
|
|
|
|
| |
| | (13,878 | ) | 487 | | 534 | | 243 | | (18 | ) | (12,632 | ) |
|
|
|
|
|
|
|
|
|
|
|
| |
28. Related party transactions
Transactions with related parties were in the normal course of business and are summarised below. Transactions with subsidiaries or associated undertakings disposed of during the year are deemed to be related party transactions from the date of disposal and have been included within the following table:
| | 2004 | | 2003 | | 2002 | |
| £m | £m | £m |
|
|
|
|
|
| |
| Sales: | | | | | | |
| Services supplied | 6 | | 10 | | 33 | |
| Finance lease rentals | – | | 11 | | 9 | |
| Tangible fixed assets | – | | – | | 28 | |
| | | | | | | |
| Purchases: | | | | | | |
| Services received | 25 | | 59 | | 55 | |
| Finance lease rentals | – | | 1 | | – | |
| Tangible fixed assets | – | | 12 | | 3 | |
|
|
|
|
|
| |
At 31 March 2004, the Group had amounts receivable and payable amounting to £1m and £1m respectively with related parties.
During 2002/03, amounts were paid to or in respect of joint ventures, arising from the Group’s obligations from its decision to exit from these investments. The payments made during that year amounted to £153m, all of which had been provided for at 31 March 2002.
At 31 March 2003, amounts due to and from The Leasing Group plc, a former subsidiary undertaking, amounted to £73m and £79m respectively. In addition, at 31 March 2003 the Group had a net investment in a finance lease with a related party amounting to £50m, of which £5m fell due within one year. Rentals received and receivable relating to this lease in 2003 amounted to £11m.
Annual Report and Accounts 2003/04_National Grid Transco 102
Back to Contents
Notes to the Accounts_continued
29. Commitments and contingencies
a) Future capital expenditure | | | | | |
| | | | | Group | | | | Joint ventures | |
| |
|
|
| |
|
|
| |
| | | 2004 | | 2003 | | 2004 | | 2003 | |
| | | £m | £m | £m | £m |
|
|
|
|
|
|
|
|
| |
| Contracted for but not provided | | 448 | | 664 | | – | | 1 | |
|
|
|
|
|
|
|
|
| |
b) Lease commitments At 31 March 2004, the Group’s operating lease commitments for the financial year ending 31 March 2005 amounted to £59m (2003: £74m) and are analysed by lease expiry date as follows:
| | | | Land and buildings | | | | Other | | | | Total | |
| |
|
|
| |
|
|
| |
|
|
| |
| | | 2004 | | 2003 | | 2004 | | 2003 | | 2004 | | 2003 | |
| | £m | £m | £m | £m | £m | £m |
|
|
|
|
|
|
|
|
|
|
|
|
| |
| Within one year | | 2 | | 1 | | 4 | | 7 | | 6 | | 8 | |
| Between two and five years | | 5 | | 4 | | 15 | | 20 | | 20 | | 24 | |
| After five years | | 21 | | 26 | | 12 | | 16 | | 33 | | 42 | |
|
|
|
|
|
|
|
|
|
|
|
|
| |
| | | 28 | | 31 | | 31 | | 43 | | 59 | | 74 | |
|
|
|
|
|
|
|
|
|
|
|
|
| |
Total Group commitments under non-cancellable operating leases were as follows:
| | 2004 | | 2003 | |
| £m | £m |
|
|
|
| |
| In one year or less | 59 | | 74 | |
| In more than one year, but not more than two years | 45 | | 52 | |
| In more than two years, but not more than three years | 40 | | 41 | |
| In more than three years, but not more than four years | 32 | | 32 | |
| In more than four years, but not more than five years | 31 | | 30 | |
| In more than five years | 271 | | 247 | |
|
|
|
| |
| | 478 | | 476 | |
|
|
|
| |
c) Power commitments
At 31 March 2004, the Group had obligations to purchase energy under long-term contracts. The following table analyses these commitments, excluding those purchased power obligations, the net present value of which is already reflected in creditors (notes 18 and 19):
| | 2004 | | 2003 | |
| | (restated) |
| £m | £m |
|
|
|
| |
| In one year or less | 1,065 | | 1,320 | |
| In more than one year, but not more than two years | 629 | | 1,016 | |
| In more than two years, but not more than three years | 592 | | 679 | |
| In more than three years, but not more than four years | 575 | | 662 | |
| In more than four years, but not more than five years | 559 | | 624 | |
| In more than five years | 2,135 | | 2,374 | |
|
|
|
| |
| | 5,555 | | 6,675 | |
|
|
|
| |
At 31 March 2003, power commitments were shown net of agreed forward contractual sales of £346m. In the current year the commitments shown above are presented without the netting off of any related contractual sales. As a result, the comparatives have been restated.
103 National Grid Transco_Annual Report and Accounts 2003/04
Back to Contents
Notes to the Accounts_continued
29. Commitments and contingencies (continued)
d) Other commitments, contingencies and guarantees
The value of other Group commitments, contingencies and guarantees at 31 March 2004 amounted to £263m (2003: £221m), including guarantees amounting to £168m (2003: £134m). Included within these amounts are outstanding BG Group related commitments and contingencies amounting to £13m (2003: £13m), arising from the restructuring of BG Group in 1999.
| Details of the guarantees entered into by the Group at 31 March 2004 are shown below: |
| i) | performance guarantees of £24m relating to certain property obligations of a group undertaking; |
| ii) | £50m guarantee of the obligations of a Group undertaking to pay liabilities under a meter operating contract for a duration expected to be 20-30 years; |
| iii) | a performance guarantee during construction of the Victoria to Tasmania interconnector, that expires on commissioning, of £41m; |
| iv) | a four-year guarantee relating to an interconnector construction project amounting to £20m provided by the Company; |
| v) | guarantees in respect of a former associate amounting to £14m; and |
| vi) | other guarantees amounting to £19m arising in the normal course of business and entered into on normal commercial terms. |
The Company has also guaranteed the lease obligations of a former associate to a Group undertaking, amounting to £45m (2003: £50m).
e) Parent Company loan guarantees on behalf of Group undertakings
The Company has guaranteed the repayment of principal sums, any associated premium and interest on specific loans due from certain Group undertakings to third parties. At 31 March 2004, the sterling equivalent amounted to £1,892m (2003: £1,845m). The guarantees are for varying terms between four and 10 years.
f) Larkhall prosecution
Following a fatal accident in Larkhall, Lanarkshire in December 1999 in which four people died, Transco faces charges alleging breaches of sections 3 and 33 of the Health & Safety at Work Act 1974. The case is currently listed for trial in Edinburgh commencing on 27 September 2004. The maximum penalty for breach of either of the above sections is an unlimited fine.
g) Sale of Millstone 3
In November 1999, New England Power (NEP), a subsidiary of National Grid USA, entered into an agreement with Northeast Utilities (NU) to settle claims made by NEP in relation to the operation of the Millstone 3 nuclear unit. As part of this agreement, NU agreed to include NEP’s 16.2% share in an auction of NU’s share in that unit, at a guaranteed price, irrespective of the price actually received at auction. On 31 March 2001, the Millstone 3 sale was completed and proceeds of US$28m (£20m) were received by NEP. Millstone 3 was subsequently sold to Dominion Resources Inc. for a total of approximately US$855m (£602m).
Regulatory authorities from Rhode Island, New Hampshire and Massachusetts have expressed an intent to challenge the reasonableness of the settlement agreement as NEP would have received approximately US$140m of sale proceeds without the agreement. Any dispute will be resolved by the Federal Energy Regulatory Commission (FERC). The Group believes that it acted prudently since the amount received under the settlement agreement was the highest sale price for a nuclear unit at the time the agreement was reached.
h) Environmental related litigation
On 10 January 2002, New York State filed a civil action against Niagara Mohawk in US District Court in Buffalo, New York, for alleged violations of the federal Clean Air Act, related state environmental laws and the common law at the Huntley and Dunkirk power plants, which Niagara Mohawk sold in 1999 to affiliates of NRG Energy, Inc. (collectively with its affiliates, NRG). The State alleged, among other things, that between 1982 and 1999, Niagara Mohawk modified the two plants 55 times without obtaining proper preconstruction permits and implementing proper pollution equipment controls.
On 27 March 2003, the court issued an order granting in part Niagara Mohawk’s motion to dismiss, which had been filed in 2002. Based on applicable statutes of limitations, the court reduced the number of projects allegedly requiring preconstruction permits under the Clean Air Act from 55 to nine.
On 31 December 2003, the court granted the State’s motion to amend the complaint, allowing it to assert operating permit violations against Niagara Mohawk and NRG, though still barring monetary penalties for actions outside the statute of limitations period. Niagara Mohawk answered the amended complaint on 2 March 2004 and filed a counterclaim against the State in response to its common law public nuisance claim, seeking contribution for the company’s portion of any alleged harm caused by emissions from facilities that the State owns or to which it has given permits.
Prior to the commencement of the enforcement action, NRG took the position that Niagara Mohawk would be at least partly responsible for the costs of pollution control equipment and post-sale fines and penalties, notwithstanding contrary language in the agreement governing the sale of the plants to NRG. As a result, on 13 July 2001, Niagara Mohawk sued NRG in New York State Supreme Court (Onondaga County), seeking a declaratory ruling that under the agreement, NRG is responsible for the costs of pollution controls and mitigation, as well as post-sale fines and penalties, that may result from the State’s enforcement action. The parties are awaiting a decision on NRG’s partial summary judgment motion, which was argued on 15 January 2004. The court’s decision has been delayed pending the hearing judge’s determination of whether to recuse himself due to a perceived conflict of interest.
Annual Report and Accounts 2003/04_National Grid Transco 104
Back to Contents
Notes to the Accounts_continued
30. Group undertakings and joint ventures
Principal Group undertakings
The principal Group undertakings included in the Group accounts at 31 March 2004 are listed below. These undertakings are wholly-owned and, unless otherwise indicated, are incorporated in Great Britain.
| | Principal activity |
|
| Transco plc (i) | Gas transportation |
| National Grid Company plc (i) | Transmission of electricity in England and Wales |
| New England Power Company (Incorporated in the US) (i) | Transmission and generation of electricity |
| Massachusetts Electric Company (Incorporated in the US) (i) | Distribution of electricity |
| The Narragansett Electric Company (Incorporated in the US) (i) | Distribution of electricity |
| Niagara Mohawk Power Corporation (Incorporated in the US) (i) | Distribution and transmission of electricity and gas |
| GridAmerica LLC (formed in the US) (i) | Management of electricity transmission assets |
| Gridcom (UK) Limited (i) | Telecommunications infrastructure |
| NGG Finance plc (ii) | Financing |
| British Transco International Finance B.V. (Incorporated in The Netherlands) (i) | Financing |
| SecondSite Property Portfolio Limited (i) | Property |
| National Grid Holdings One plc (ii) | Holding company |
| Lattice Group plc (ii) | Holding company |
| National Grid USA (Incorporated in the US) (i) | Holding company |
| Niagara Mohawk Holdings Inc. (Incorporated in the US) (i) | Holding company |
| Lattice Group Holdings Limited (i) | Holding company |
| Transco Holdings plc (i) | Holding company |
| National Grid (US) Holdings Limited (ii) | Holding company |
| National Grid Holdings Limited (i) | Holding company |
|
| (i) | Issued ordinary share capital held by Group undertakings. |
| (ii) | Issued ordinary share capital held by National Grid Transco plc. |
| Principal joint ventures | | | | | |
| (at 31 March 2004) | | | | | |
| | | | Country of | | |
| | | | incorporation | | |
| | Group holding | | and operation | | Principal activity |
|
| Compañia Inversora En Transmicion | | | | | |
| Electrica CITELEC S.A. (i) | 42.5% ordinary shares | | Argentina | | Transmission of electricity |
| Copperbelt Energy Corporation Plc. (i) | 38.5% ordinary shares | | Zambia | | Transmission, distribution and supply of electricity |
|
The investments in joint ventures are held by Group undertakings.
A full list of all Group and associated undertakings is available from the Group Company Secretary.
31. Summary US GAAP income statement, balance sheet, notes and associated reconciliationsThe Group prepares its consolidated accounts in accordance with United Kingdom Generally Accepted Accounting Principles (UK GAAP), which differ in certain respects from United States Generally Accepted Accounting Principles (US GAAP).
The most significant difference between UK and US GAAP is that, under UK GAAP, the combination of National Grid and Lattice was accounted for as a merger (pooling of interests), while under US GAAP this transaction was accounted for as an acquisition (purchase accounting) of Lattice by National Grid. Consequently, under UK GAAP, the accounts represent the combined accounts of National Grid and Lattice on an historical cost basis for all periods presented. Under US GAAP, the accounts presented prior to the Merger are those of National Grid only.
The income statement and balance sheet shown on the following pages are presented in a US GAAP format. The balance sheets at 31 March 2003 and 31 March 2004 include the impact of the fair value of the acquired assets and liabilities of Lattice prepared under US GAAP at the date of acquisition. A summary of the principal differences between UK and US GAAP is shown in note 32.
The comparative figures for discontinued operations and continuing operations have been restated for 2001/02 for US GAAP reporting purposes. This restatement does not affect UK GAAP reported figures. This restatement arose because the results of operations relating to the joint ventures and the associate, from which the Group has now exited and were treated as discontinued operations under UK GAAP, were reported as part of discontinued operations under US GAAP. This treatment is not permitted under US GAAP as these results should have been reported as part of the interest in equity accounted affiliates. The net loss for the Group reported under US GAAP for 2001/02 is not affected by this restatement.
The effect of this restatement was to reclassify amounts of net loss amounting to £857m for 2001/02 from discontinued operations to continuing operations through a restatement of the interest in equity accounted affiliates. Earnings per share for continuing and discontinued operations has similarly been restated.
105 National Grid Transco_Annual Report and Accounts 2003/04
Back to Contents
Notes to the Accounts_continued
31. Summary US GAAP income statement, balance sheet, notes and associated reconciliations (continued)
Summary US GAAP income statement | |
| | 2004 | | | | | | 2004 | |
| | National | | | | | | National | |
| | Grid | | | 2004 | | | Grid | |
| | Transco | | | US GAAP | | | Transco | |
| | (UK GAAP) | | | adjustments | | | (US GAAP) | |
| | £m | | | £m | | | £m | |
|
|
|
|
|
|
|
| |
| Turnover | 9,033 | | | (167 | ) | | 8,866 | |
| Operating costs | | | | | | | | |
| Depreciation | (866 | ) | | (298 | ) | | (1,164 | ) |
| Payroll and severance costs | (1,020 | ) | | (277 | ) | | (1,297 | ) |
| Purchases of electricity | (1,998 | ) | | – | | | (1,998 | ) |
| Purchases of gas | (371 | ) | | – | | | (371 | ) |
| Rates and property taxes | (516 | ) | | – | | | (516 | ) |
| Electricity transmission services scheme direct costs | (277 | ) | | – | | | (277 | ) |
| EnMO direct costs | (158 | ) | | 158 | | | – | |
| Replacement expenditure | (388 | ) | | 388 | | | – | |
| Provision for doubtful debts | (50 | ) | | – | | | (50 | ) |
| Other operating charges | (1,534 | ) | | 263 | | | (1,271 | ) |
| | (7,178 | ) | | 234 | | | (6,944 | ) |
|
|
|
|
|
|
|
| |
| Operating profit | 1,855 | | | 67 | | | 1,922 | |
| Share of joint ventures’ operating profit | 7 | | | (7 | ) | | – | |
| Non-operating items | 322 | | | (290 | ) | | 32 | |
|
|
|
|
|
|
|
| |
| Profit before interest and taxation | 2,184 | | | (230 | ) | | 1,954 | |
| Net interest | (822 | ) | | 150 | | | (672 | ) |
|
|
|
|
|
|
|
| |
| Profit on ordinary activities before taxation | 1,362 | | | (80 | ) | | 1,282 | |
| Taxation | (261 | ) | | (21 | ) | | (282 | ) |
|
|
|
|
|
|
|
| |
| Profit on ordinary activities after taxation | 1,101 | | | (101 | ) | | 1,000 | |
| Minority interests | (2 | ) | | – | | | (2 | ) |
|
|
|
|
|
|
|
| |
| Net income from continuing operations | 1,099 | | | (101 | ) | | 998 | |
| Net loss from discontinued operations (net of taxation of £nil) | | | | – | | | – | |
|
|
|
|
|
|
|
| |
| Net income for the year | 1,099 | | | (101 | ) | | 998 | |
|
|
|
|
|
|
|
| |
| Basic earnings per share under US GAAP (pence) – continuing operations | | | | | | | 32.5 | p |
| Diluted earnings per share under US GAAP (pence) – continuing operations | | | | | | | 32.4 | p |
|
|
|
|
|
|
|
| |
| Basic earnings per ADS under US GAAP (pence) – continuing operations | | | | | | | 162.5 | p |
| Diluted earnings per ADS under US GAAP (pence) – continuing operations | | | | | | | 162.0 | p |
|
|
|
|
|
|
|
| |
| Basic earnings per share under US GAAP (pence) – total Group | | | | | | | 32.5 | p |
| Diluted earnings per share under US GAAP (pence) – total Group | | | | | | | 32.4 | p |
|
|
|
|
|
|
|
| |
| Basic earnings per ADS under US GAAP (pence) – total Group | | | | | | | 162.5 | p |
| Diluted earnings per ADS under US GAAP (pence) – total Group | | | | | | | 162.0 | p |
|
|
|
|
|
|
|
| |
| There was no dilution of net income under US GAAP. | | | | | | | | |
|
|
|
|
|
|
|
| |
| Weighted average number of shares in issue (million) – for basic EPS | | | | | | | 3,070 | |
|
|
|
|
|
|
|
| |
| Weighted average number of shares in issue (million) – for diluted EPS | | | | | | | 3,077 | |
|
|
|
|
|
|
|
| |
Basic and diluted earnings per share and per ADS for discontinued operations under US GAAP were 0.0p.
Consolidated statement of comprehensive income and changes in shareholders’ equity under US GAAP
| | 2004 | |
| | £m | |
|
| |
| Net income | 998 | |
| Additional minimum pension liability (net of tax of £188m) | 415 | |
| Exchange adjustments (including tax of £12m) | (438 | ) |
| Mark to market of financial instruments (net of tax credit of £26m) | (84 | ) |
|
| |
| Comprehensive net income | 891 | |
| Dividends | (560 | ) |
| Shares issued | 34 | |
| Share options granted | 25 | |
| Movement in treasury stock | 5 | |
| Shareholders’ equity at 1 April 2003 | 9,426 | |
|
| |
| Shareholders’ equity at 31 March 2004 | 9,821 | |
|
| |
Annual Report and Accounts 2003/04_National Grid Transco 106
Back to Contents
Notes to the Accounts_continued
31. Summary US GAAP income statement, balance sheet, notes and associated reconciliations (continued)
Summary US GAAP income statement (continued) | |
| | | | | US GAAP adjustments | | | | |
| | | | |
| | | | |
| | 2003 | | | | | | | | | 2003 | |
| | National | | | 2003 | | | 2003 | | | National | |
| | Grid | | | Lattice pre- | | | Other | | | Grid | |
| | Transco | | | acquisition | | | US GAAP | | | Transco | |
| | (UK GAAP) | | | (UK GAAP) | | | adjustments | | | (US GAAP) | |
| | £m | | | £m | | | £m | | | £m | |
|
|
| |
|
| |
|
| |
| |
| Turnover | 9,400 | | | (1,470 | ) | | (529 | ) | | 7,401 | |
| Operating costs | | | | | | | | | | | |
| Depreciation | (851 | ) | | 249 | | | (129 | ) | | (731 | ) |
| Payroll and severance costs | (1,107 | ) | | 308 | | | (305 | ) | | (1,104 | ) |
| Purchases of electricity | (1,901 | ) | | – | | | – | | | (1,901 | ) |
| Purchases of gas | (357 | ) | | 53 | | | – | | | (304 | ) |
| Rates and property taxes | (537 | ) | | 130 | | | – | | | (407 | ) |
| Electricity transmission services scheme direct costs | (252 | ) | | – | | | – | | | (252 | ) |
| EnMO direct costs | (530 | ) | | – | | | 530 | | | – | |
| Replacement expenditure | (405 | ) | | 239 | | | 166 | | | – | |
| Provision for doubtful debts | (24 | ) | | 1 | | | – | | | (23 | ) |
| Other operating charges | (1,824 | ) | | 542 | | | 320 | | | (962 | ) |
| | (7,788 | ) | | 1,522 | | | 582 | | | (5,684 | ) |
|
|
| |
|
| |
|
| |
| |
| Operating profit | 1,612 | | | 52 | | | 53 | | | 1,717 | |
| Share of joint ventures’ operating profit/(loss) | 124 | | | 1 | | | (125 | ) | | – | |
| Non-operating expenses | (99 | ) | | 67 | | | 27 | | | (5 | ) |
|
|
| |
|
| |
|
| |
| |
| Profit before interest and taxation | 1,637 | | | 120 | | | (45 | ) | | 1,712 | |
| Net interest | (970 | ) | | 203 | | | 103 | | | (664 | ) |
|
|
| |
|
| |
|
| |
| |
| Profit on ordinary activities before taxation | 667 | | | 323 | | | 58 | | | 1,048 | |
| Taxation | (245 | ) | | (29 | ) | | 16 | | | (258 | ) |
|
|
| |
|
| |
|
| |
| |
| Profit on ordinary activities after taxation | 422 | | | 294 | | | 74 | | | 790 | |
| Minority interests | (31 | ) | | (1 | ) | | 29 | | | (3 | ) |
| Interest in equity accounted affiliates (net of tax of £5m) | | | | | | | 3 | | | 3 | |
|
|
| |
|
| |
|
| |
| |
| Net income from continuing operations | 391 | | | 293 | | | 106 | | | 790 | |
| Net loss from discontinued operations (net of tax of £nil) | | | | | | | (39 | ) | | (39 | ) |
|
|
| |
|
| |
|
| |
| |
| Net income for the year | 391 | | | 293 | | | 67 | | | 751 | |
|
|
| |
|
| |
|
| |
| |
| Basic earnings per share under US GAAP (pence) – continuing operations | | | | | | | | | | 33.6 | p |
| Diluted earnings per share under US GAAP (pence) – continuing operations | | | | | | | | | | 32.9 | p |
|
|
| |
|
| |
|
| |
| |
| Basic earnings per ADS under US GAAP (pence) – continuing operations | | | | | | | | | | 168.0 | p |
| Diluted earnings per ADS under US GAAP (pence) – continuing operations | | | | | | | | | | 164.5 | p |
|
|
| |
|
| |
|
| |
| |
| Basic earnings per share under US GAAP (pence) – total Group | | | | | | | | | | 31.9 | p |
| Diluted earnings per share under US GAAP (pence) – total Group | | | | | | | | | | 31.3 | p |
|
|
| |
|
| |
|
| |
| |
| Basic earnings per ADS under US GAAP (pence) – total Group | | | | | | | | | | 159.5 | p |
| Diluted earnings per ADS under US GAAP (pence) – total Group | | | | | | | | | | 156.5 | p |
|
|
| |
|
| |
|
| |
| |
| | | | | | | | | | | £m | |
| Net income under US GAAP after £22m dilutive impact of 4.25% Exchangeable Bonds 2008 | | | | | | | | | | 773 | |
|
|
| |
|
| |
|
| |
| |
| Weighted average number of shares in issue (million) – for basic EPS | | | | | | | | | | 2,348 | |
| Weighted average number of shares in issue (million) – for diluted EPS | | | | | | | | | | 2,468 | |
|
|
| |
|
| |
|
| |
| |
Basic loss per share and per ADS for discontinued operations under US GAAP was (1.7)p and (8.5)p respectively. Diluted loss per share and per ADS for discontinued operations under US GAAP was (1.6)p and (8.0)p respectively.
Under UK GAAP, the weighted average number of shares in issue for basic EPS for the year ended 31 March 2003 was 3,078m compared with 2,348m under US GAAP. The difference related to shares issued on the combination of National Grid and Lattice. As this transaction was accounted for as a merger (pooling of interests) under UK GAAP, shares issued were included in the weighted average share capital as if they were in issue throughout the year. Under US GAAP, they are included from the date of issue (21 October 2002). This difference impacted 2003 and earlier periods but will not affect future accounting periods.
Consolidated statement of comprehensive income and changes in shareholders’ equity under US GAAP (continued)
| | 2003 | |
| | £m | |
|
| |
| Net income | 751 | |
| Additional minimum pension liability (net of tax credit of £417m) | (886 | ) |
| Exchange adjustments (net of tax credit of £12m) | (322 | ) |
| Share of joint ventures’ other comprehensive loss | (10 | ) |
| Other | 9 | |
|
| |
| Comprehensive loss | (458 | ) |
| Dividends | (382 | ) |
| Shares issued to purchase Lattice | 6,566 | |
| Other shares issued | 2 | |
| Share options granted | 29 | |
| Repurchase of shares | (97 | ) |
| Movement in treasury stock | 7 | |
| Shareholders’ equity at 1 April 2002 | 3,759 | |
|
| |
| Shareholders’ equity at 31 March 2003 | 9,426 | |
|
| |
107 National Grid Transco_Annual Report and Accounts 2003/04
Back to Contents
Notes to the Accounts_continued
31. Summary US GAAP income statement, balance sheet, notes and associated reconciliations (continued)
Summary US GAAP income statement (continued) | |
| | | | | US GAAP adjustments | | | | |
| | | | |
| | | | |
| | 2002 | | | | | | | | | 2002 | |
| National | 2002 | 2002 | National |
| Grid | Lattice pre- | Other | Grid |
| Transco | acquisition | US GAAP | Transco |
| (UK GAAP) | (UK GAAP) | adjustments | (US GAAP) |
| | | (restated) | (restated) |
| £m | £m | £m | £m |
|
|
|
|
|
|
|
|
|
|
| |
| | | | | | | | | | | | |
| Turnover | 7,554 | | | (3,153 | ) | | (397 | ) | | 4,004 | |
| Operating costs | | | | | | | | | | | |
| Depreciation | (750 | ) | | 431 | | | 3 | | | (316 | ) |
| Payroll and severance costs | (946 | ) | | 581 | | | (52 | ) | | (417 | ) |
| Purchases of electricity | (1,410 | ) | | – | | | – | | | (1,410 | ) |
| Purchases of gas | (171 | ) | | 113 | | | – | | | (58 | ) |
| Rates and property taxes | (424 | ) | | 227 | | | – | | | (197 | ) |
| Electricity transmission services scheme direct costs | (204 | ) | | – | | | – | | | (204 | ) |
| EnMO direct costs | (395 | ) | | – | | | 395 | | | – | |
| Replacement expenditure | (368 | ) | | 368 | | | – | | | – | |
| Provision for doubtful debts | (23 | ) | | (3 | ) | | – | | | (26 | ) |
| Other operating charges | (1,803 | ) | | 883 | | | 411 | | | (509 | ) |
| | (6,494 | ) | | 2,600 | | | 757 | | | (3,137 | ) |
|
|
|
|
|
|
|
|
|
|
| |
| Operating profit | 1,060 | | | (553 | ) | | 360 | | | 867 | |
| Share of joint ventures’ and associate’s operating profit/(loss) | (701 | ) | | 65 | | | 636 | | | – | |
| Non-operating income | 156 | | | (104 | ) | | (30 | ) | | 22 | |
|
|
|
|
|
|
|
|
|
|
| |
| Profit before interest and taxation | 515 | | | (592 | ) | | 966 | | | 889 | |
| Net interest | (799 | ) | | 364 | | | 309 | | | (126 | ) |
|
|
|
|
|
|
|
|
|
|
| |
| Profit on ordinary activities before taxation | (284 | ) | | (228 | ) | | 1,275 | | | 763 | |
| Taxation | (85 | ) | | 60 | | | 12 | | | (13 | ) |
|
|
|
|
|
|
|
|
|
|
| |
| Profit on ordinary activities after taxation | (369 | ) | | (168 | ) | | 1,287 | | | 750 | |
| Minority interests | 48 | | | (4 | ) | | (46 | ) | | (2 | ) |
| Interest in equity accounted affiliates (note 32) | | | | | | | (900 | ) | | (900 | ) |
|
|
|
|
|
|
|
|
|
|
| |
| Net loss from continuing operations | (321 | ) | | (172 | ) | | 341 | | | (152 | ) |
| Net loss from discontinued operations (net of tax credit of £1m) | | | | | | | (1 | ) | | (1 | ) |
|
|
|
|
|
|
|
|
|
|
| |
| Net loss before cumulative effects of changes in accounting principles | (321 | ) | | (172 | ) | | 340 | | | (153 | ) |
| Cumulative effects of changes in accounting principles (FAS 133 transitional adjustment) | | | | | | | (14 | ) | | (14 | ) |
|
|
|
|
|
|
|
|
|
|
| |
| Net loss for the year | (321 | ) | | (172 | ) | | 326 | | | (167 | ) |
|
|
|
|
|
|
|
|
|
|
| |
| Basic loss per share under US GAAP (pence) – continuing operations | | | | | | | | | | (10.0 | )p |
|
|
|
|
|
|
|
|
|
|
| |
| Basic loss per ADS under US GAAP (pence) – continuing operations | | | | | | | | | | (50.0 | )p |
|
|
|
|
|
|
|
|
|
|
| |
| Basic loss per share under US GAAP (pence) – total Group | | | | | | | | | | (10.9 | )p |
|
|
|
|
|
|
|
|
|
|
| |
| Basic loss per ADS under US GAAP (pence) – total Group | | | | | | | | | | (54.5 | )p |
|
|
|
|
|
|
|
|
|
|
| |
| Weighted average number of shares in issue (million) – for basic EPS | | | | | | | | | | 1,527 | |
|
|
|
|
|
|
|
|
|
|
| |
The Group’s 4.25% Exchangeable Bonds 2008 were antidilutive under US GAAP. Therefore no dilutive earnings per share information has been shown.
The cumulative effect of changes in accounting principles (FAS 133 transitional adjustment) increased basic loss per share and per ADS for the Group by 0.9p and 4.5p respectively.
Basic loss per share and per ADS for discontinued operations under US GAAP was 0.0p.
Consolidated statement of comprehensive income and changes in shareholders’ equity under US GAAP (continued)
| | 2002 | |
| £m |
|
| |
| Net loss | (167 | ) |
| Exchange adjustments (net of tax credit of £7m) | (2 | ) |
| Share of associate’s other comprehensive loss | (5 | ) |
| Other | (4 | ) |
|
| |
| Comprehensive loss | (178 | ) |
| Dividends | (229 | ) |
| Other shares issued | 1,305 | |
| Share options granted | 5 | |
| Movement in treasury stock | (36 | ) |
| Share of associate’s capital transactions | (33 | ) |
| Other | 5 | |
| Shareholders’ equity at 1 April 2001 | 2,920 | |
|
| |
| Shareholders’ equity at 31 March 2002 | 3,759 | |
|
| |
Annual Report and Accounts 2003/04_National Grid Transco 108
Back to Contents
Notes to the Accounts_continued
31. Summary US GAAP income statement, balance sheet, notes and associated reconciliations (continued)
Summary US GAAP balance sheet | |
| | 2004 | | | 2003 | (i) |
| £m | £m | |
|
|
|
|
| |
| Assets | | | | | |
| Current assets | | | | | |
| Cash and cash equivalents | 528 | | | 570 | |
| Marketable securities | 102 | | | 48 | |
| Accounts and notes receivable | 496 | | | 628 | |
| Inventories | 91 | | | 126 | |
| Regulatory assets | 512 | | | 461 | |
| Prepaid expenses and other current assets | 596 | | | 705 | |
|
|
|
|
| |
| Total current assets | 2,325 | | | 2,538 | |
| Property, plant and equipment – cost | 32,216 | | | 31,987 | |
| Property, plant and equipment – accumulated depreciation | (9,091 | ) | | (8,603 | ) |
| | 23,125 | | | 23,384 | |
| Goodwill – cost | 5,698 | | | 5,971 | |
| Goodwill – accumulated amortisation and impairments | (93 | ) | | (71 | ) |
| | 5,605 | | | 5,900 | |
| Intangible assets | 50 | | | 74 | |
| Investments | 155 | | | 210 | |
| Regulatory assets | 3,136 | | | 3,998 | |
| Other debtors | 951 | | | 843 | |
|
|
|
|
| |
| Total assets | 35,347 | | | 36,947 | |
|
|
|
|
| |
| Liabilities and shareholders’ equity | | | | | |
| Current liabilities | | | | | |
| Bank overdrafts | 26 | | | 62 | |
| Accounts payable | 1,036 | | | 1,266 | |
| Short-term borrowings | 1,644 | | | 1,973 | |
| Accrued income taxes | 122 | | | – | |
| Purchased power obligations | 57 | | | 68 | |
| Liability for index-linked swap contracts | 100 | | | 121 | |
| Other accrued liabilities | 1,402 | | | 1,121 | |
|
|
|
|
| |
| Total current liabilities | 4,387 | | | 4,611 | |
| Long-term borrowings | 12,256 | | | 13,058 | |
| Purchased power obligations | 149 | | | 253 | |
| Liability for index-linked swap contracts | 291 | | | 381 | |
| Post-retirement benefits | 1,681 | | | 2,283 | |
| Deferred income taxes | 4,867 | | | 4,687 | |
| Other liabilities | 1,841 | | | 2,159 | |
|
|
|
|
| |
| Total liabilities | 25,472 | | | 27,432 | |
|
|
|
|
| |
| Minority interest – equity | 12 | | | 15 | |
| Cumulative preference stock issued by Group undertakings | 42 | | | 74 | |
| | | | | | |
| Shareholders’ equity | | | | | |
| Common stock (par value £0.10 per share; shares authorised 5,000m; shares issued 2004: 3,088m; 2003: 3,077m) | 309 | | | 308 | |
| Additional paid in capital | 7,768 | | | 7,710 | |
| Other reserves | 359 | | | 359 | |
| Retained earnings | 2,701 | | | 2,263 | |
| Other comprehensive loss | (1,282 | ) | | (1,175 | ) |
| Treasury stock | (34 | ) | | (39 | ) |
|
|
|
|
| |
| Equity shareholders’ funds | 9,821 | | | 9,426 | |
|
|
|
|
| |
| Total liabilities and shareholders’ equity | 35,347 | | | 36,947 | |
|
|
|
|
| |
| (i) | Certain amounts have been reclassified for consistency with current year presentation. |
Other comprehensive loss can be analysed as follows:
| | 2004 | | 2003 | |
| | £m | | £m | |
|
|
|
| |
| Foreign exchange losses | (821 | ) | (365 | ) |
| Additional minimum pension liability | (672 | ) | (1,305 | ) |
| Mark to market of financial instruments | (88 | ) | 22 | |
| Taxation | 295 | | 469 | |
| Other | 4 | | 4 | |
|
|
|
| |
| | (1,282 | ) | (1,175 | ) |
|
|
|
| |
109 National Grid Transco_Annual Report and Accounts 2003/04
Back to Contents
Notes to the Accounts_continued
31. Summary US GAAP income statement, balance sheet, notes and associated reconciliations (continued)
Segmental information under US GAAP | |
| | 2004 | | 2003 | (i) | 2002 | (i) |
| £m | £m | | £m | |
|
|
|
|
|
| |
| Turnover by business segment | | | | | | |
| Continuing operations | | | | | | |
| UK gas distribution | 2,229 | | 1,239 | | – | |
| UK electricity and gas transmission | 1,875 | | 1,615 | | 1,283 | |
| US electricity transmission | 318 | | 400 | | 278 | |
| US electricity distribution | 3,536 | | 3,446 | | 2,278 | |
| US gas distribution | 464 | | 446 | | 104 | |
| Other | 906 | | 462 | | 113 | |
| Sales between businesses | (462 | ) | (207 | ) | (52 | ) |
|
|
|
|
|
| |
| Group turnover – continuing operations | 8,866 | | 7,401 | | 4,004 | |
|
|
|
|
|
| |
| Operating profit by business segment | | | | | | |
| Continuing operations | | | | | | |
| UK gas distribution | 758 | | 567 | | – | |
| UK electricity and gas transmission | 676 | | 573 | | 520 | |
| US electricity transmission | 124 | | 116 | | 95 | |
| US electricity distribution | 333 | | 446 | | 240 | |
| US gas distribution | 39 | | 52 | | 17 | |
| Other | (8 | ) | (37 | ) | (5 | ) |
|
|
|
|
|
| |
| Group undertakings – continuing operations | 1,922 | | 1,717 | | 867 | |
|
|
|
|
|
| |
Turnover and operating profit in the other segment relates primarily to the UK.
| (i) | Prior year comparatives have been amended to reflect changes in business segments (see note 2). |
| | Tangible fixed assets | |
|
| |
| | 2004 | | 2003 | (i) |
| £m | £m | |
|
|
|
| |
| Analysis by business segment | | | | |
| Continuing operations | | | | |
| UK gas distribution | 10,233 | | 10,153 | |
| UK electricity and gas transmission | 6,442 | | 6,135 | |
| US electricity transmission | 1,174 | | 1,348 | |
| US electricity distribution | 2,819 | | 3,167 | |
| US gas distribution | 615 | | 680 | |
| Other | 1,842 | | 1,898 | |
|
|
|
| |
| | 23,125 | | 23,381 | |
| Discontinued operations | – | | 3 | |
|
|
|
| |
| | 23,125 | | 23,384 | |
|
|
|
| |
| Analysis by geographical region | | | | |
| UK | 18,335 | | 18,131 | |
| US | 4,652 | | 5,194 | |
| Rest of the World | 138 | | 59 | |
|
|
|
| |
| | 23,125 | | 23,384 | |
|
|
|
| |
| (i) | Prior year comparatives have been amended to reflect changes in business segments (see note 2) and balance sheet reclassifications. |
| | | | | | | | | | | | | | | |
| Goodwill | | | | | | | | | | | | | | |
| | | | UK electricity | | | | | | | | | | | |
| UK gas | and gas | US electricity | US electricity | US gas | | |
| distribution | transmission | transmission | distribution | distribution | Other | Total |
| £m | £m | £m | £m | £m | £m | £m |
|
|
|
|
|
|
|
|
|
|
|
|
|
| |
| 1 April 2002 | – | | – | | 438 | | 1,558 | | 141 | | 86 | | 2,223 | |
| Exchange adjustments | – | | – | | (44 | ) | (161 | ) | (14 | ) | (9 | ) | (228 | ) |
| Additions | 3,040 | | 753 | | – | | – | | – | | 20 | | 3,813 | |
| Adjustments to provisional fair value | – | | – | | 9 | | 36 | | 8 | | 39 | | 92 | |
|
|
|
|
|
|
|
|
|
|
|
|
|
| |
| 1 April 2003 | 3,040 | | 753 | | 403 | | 1,433 | | 135 | | 136 | | 5,900 | |
| Exchange adjustments | – | | – | | (55 | ) | (195 | ) | (19 | ) | (18 | ) | (287 | ) |
| Additions | – | | – | | – | | – | | – | | 1 | | 1 | |
| Impairment | – | | – | | – | | – | | – | | (20 | ) | (20 | ) |
| Adjustments to provisional fair value | (50 | ) | 3 | | – | | – | | – | | 58 | | 11 | |
|
|
|
|
|
|
|
|
|
|
|
|
|
| |
| 31 March 2004 | 2,990 | | 756 | | 348 | | 1,238 | | 116 | | 157 | | 5,605 | |
|
|
|
|
|
|
|
|
|
|
|
|
|
| |
Annual Report and Accounts 2003/04_National Grid Transco 110
Back to Contents
Notes to the Accounts_continued
31. Summary US GAAP income statement, balance sheet, notes and associated reconciliations (continued)
Reconciliation of net income from UK to US GAAP
The following is a summary of the material adjustments to net income which would have been required if US GAAP had been applied instead of UK GAAP:
| | 2004 | | | 2003 | | | 2002 | |
| | £m | | | £m | | | £m | |
|
|
|
|
|
|
|
| |
| Net income/(loss) under UK GAAP | 1,099 | | | 391 | | | (321 | ) |
| Adjustments to conform with US GAAP | | | | | | | | |
| Elimination of Lattice pre-acquisition results, measured under UK GAAP | – | | | 293 | | | (172 | ) |
| Merger costs | – | | | 32 | | | – | |
| Deferred taxation | (24 | ) | | 7 | | | 7 | |
| Pensions | 7 | | | 35 | | | 29 | |
| Share option schemes | (25 | ) | | (29 | ) | | (5 | ) |
| Fixed assets – purchase of Lattice | (364 | ) | | (169 | ) | | – | |
| Impairment of Advantica – goodwill and other intangible assets | (31 | ) | | – | | | – | |
| Replacement expenditure (net of depreciation) | 383 | | | 166 | | | – | |
| Financial instruments | 82 | | | 40 | | | (69 | ) |
| Cumulative effect of changes in accounting principles (FAS 133 transitional adjustment) | – | | | – | | | (14 | ) |
| Carrying value of EPICs liability | (226 | ) | | 2 | | | 203 | |
| Severance and integration costs | – | | | (110 | ) | | 67 | |
| Recognition of income | (9 | ) | | 2 | | | (4 | ) |
| Goodwill | 99 | | | 70 | | | 78 | |
| Restructuring – purchase of Lattice | 2 | | | 46 | | | – | |
| Share of joint ventures’ and associate’s adjustments | – | | | (27 | ) | | 37 | |
| Other | 5 | | | 2 | | | (3 | ) |
| | (101 | ) | | 360 | | | 154 | |
|
|
|
|
|
|
|
| |
| Net income/(loss) under US GAAP | 998 | | | 751 | | | (167 | ) |
|
|
|
|
|
|
|
| |
Reconciliation of equity shareholders’ funds from UK to US GAAP
The following is a summary of the material adjustments to equity shareholders’ funds which would have been required if US GAAP had been applied instead of UK GAAP:
| | 2004 | | | 2003 | |
| | | | | (restated) | |
| | £m | | | £m | |
|
|
|
|
| |
| Equity shareholders’ funds under UK GAAP | 1,213 | | | 1,113 | |
| Adjustments to conform with US GAAP | | | | | |
| Deferred taxation | (1,868 | ) | | (1,593 | ) |
| Pensions | (1,069 | ) | | (1,800 | ) |
| Ordinary dividends | 366 | | | 317 | |
| Tangible fixed assets – reversal of partial release of impairment provision | (32 | ) | | (35 | ) |
| Fixed assets – impact of Lattice purchase accounting and replacement expenditure – gross | 7,776 | | | 7,385 | |
| Fixed assets – impact of Lattice purchase accounting and replacement expenditure – accumulated depreciation | (458 | ) | | (142 | ) |
| Financial instruments | (285 | ) | | (253 | ) |
| Carrying value of EPICs liability | – | | | 243 | |
| Severance liabilities | 3 | | | 3 | |
| Recognition of income | (35 | ) | | (27 | ) |
| Regulatory assets | 128 | | | 241 | |
| Goodwill – purchase of Lattice | 3,820 | | | 3,829 | |
| Goodwill – other acquisitions | 245 | | | 179 | �� |
| Restructuring – purchase of Lattice | (4 | ) | | (6 | ) |
| Share of joint ventures’ adjustments | – | | | (17 | ) |
| Other | 21 | | | (11 | ) |
| | 8,608 | | | 8,313 | |
|
|
|
|
| |
| Equity shareholders’ funds under US GAAP | 9,821 | | | 9,426 | |
|
|
|
|
| |
111 National Grid Transco_Annual Report and Accounts 2003/04
Back to Contents
Notes to the Accounts_continued
31. Summary US GAAP income statement, balance sheet, notes and associated reconciliations (continued)
Group cash flow statement
The Group accounts include a cash flow statement prepared in accordance with UK Financial Reporting Standard 1 (Revised 1996) ‘Cash Flow Statements’ (‘FRS 1 (revised)’), the objectives and principles of which are substantially the same as US Statement of Financial Accounting Standard 95 ‘Statement of Cash Flows’ (‘SFAS 95’) under US GAAP. The principal differences between FRS 1 (revised) and SFAS 95 relate to the classification of items within the cash flow statement and the definition of cash and cash equivalents. Under UK GAAP, cash flows are classified under nine standard headings whereas US GAAP only requires presentation of cash flows from three activities, being operating activities, investing activities and financing activities.
Under US GAAP, in contrast to UK GAAP, cash and cash equivalents do not include bank overdrafts but do include investments with original maturities of three months or less.
Set out below is a summary of the Group cash flow statement under US GAAP:
| | 2004 | | | 2003 | | | 2002 | |
| | £m | | | £m | | | £m | |
|
|
|
|
|
|
|
| |
| Net cash provided by operating activities (i) | 2,500 | | | 2,000 | | | 902 | |
| Investing activities | | | | | | | | |
| Payments to acquire tangible fixed assets | (1,788 | ) | | (1,170 | ) | | (500 | ) |
| Acquisition of Group undertakings (net of cash acquired) | – | | | 338 | | | (934 | ) |
| Payments to acquire investments | – | | | (163 | ) | | (50 | ) |
| Receipts from disposal of tangible fixed assets | 146 | | | 53 | | | 28 | |
| Receipts from disposal of investments | 7 | | | 328 | | | 37 | |
| Net movement in investments with an original maturity date of more than three months | (65 | ) | | – | | | 193 | |
| Other | – | | | (22 | ) | | 26 | |
| Net cash used in investing activities (ii) | (1,700 | ) | | (636 | ) | | (1,200 | ) |
| Net cash (used in)/provided by financing activities (iii) | (828 | ) | | (962 | ) | | 222 | |
|
|
|
|
|
|
|
| |
| Net (decrease)/increase in cash and cash equivalents | (28 | ) | | 402 | | | (76 | ) |
| Cash and cash equivalents at beginning of year | 570 | | | 178 | | | 259 | |
| Exchange adjustments | (14 | ) | | (10 | ) | | (5 | ) |
|
|
|
|
|
|
|
| |
| Cash and cash equivalents at end of year | 528 | | | 570 | | | 178 | |
|
|
|
|
|
|
|
| |
Set out below is an explanation of the reconciliation from US GAAP to UK GAAP cash flow headings:
| (i) | Net cash provided by operating activities comprised net cash inflow from operating activities (excluding payments in respect of replacement expenditure), dividends from joint ventures, returns on investments and servicing of finance, excluding costs relating to the issue of debt and taxation. |
| (ii) | Net cash used in investing activities comprised capital expenditure, payments in respect of replacement expenditure (included in operating activities under UK GAAP), acquisitions and disposals and the component of the management of liquid resources which comprised deposits with an original maturity of more than three months |
| (iii) | Net cash (used in)/provided by financing activities comprised equity dividends paid, financing, including costs relating to the issue of debt and movements in bank overdrafts. |
32. Principal differences between UK and US accounting principles
The principal differences between UK and US GAAP, as applied in preparing the Group accounts under US GAAP, are set out below:
Acquisition (purchase) accounting adjustments (including elimination of merger costs)
In order to determine the allocation of purchase price relating to the acquired assets and liabilities of Lattice under US GAAP purchase accounting, the cost of acquisition was calculated using the market value of the shares issued, the fair value of vested options exchanged and direct external acquisition costs and these amounts were allocated to the fair value of net assets acquired. As a result of the fair value exercise, increases in the value of Lattice’s tangible fixed assets, financial instruments, pension obligations and restructuring provisions were recognised and market values were attributed to its intangible fixed assets, mainly product licences, patents and trademarks, together with the recognition of appropriate deferred taxation effects. The difference between the cost of acquisition and the fair value of the separable assets and liabilities of Lattice was recorded as goodwill. Additional depreciation in respect of the fair value of tangible fixed assets will be recorded over their respective economic useful lives.
The adjustments to the assets and liabilities of Lattice to reflect the fair values and allocation of the excess purchase consideration over the fair values of net assets acquired, based on management’s best estimates of fair value, are discussed below. The fair value adjustments to UK gas transmission and distribution and other fixed assets, pensions, restructuring provision and the related deferred tax thereon were revised during the year ended 31 March 2004. The adjustments are detailed in the table on page 113.
| a) | The total purchase consideration was calculated by multiplying the number of National Grid shares issued to Lattice shareholders for all outstanding Lattice shares by the average fair value of National Grid shares. The average fair value of National Grid shares was calculated over a period of five business days, including two days prior to and two days subsequent to the announcement of the Merger on 22 April 2002. |
| | |
| | The total purchase consideration, which included merger costs of £32m that were expensed under UK GAAP, also included the fair value of Lattice vested options exchanged for vested options in National Grid Transco. |
| | |
| | The total number of Lattice vested options was multiplied by the respective fair value of each of the ordinary shares determined at 22 April 2002. |
| | |
| b) | The increase in the fair value of tangible fixed assets primarily related to UK gas transmission and distribution. This was determined by calculating the value in use of these businesses. Value in use represented the present value of expected future cash flows discounted on a pre-tax basis, using the estimated cost of capital. Future cash flows were based on a five-year plan projected out to perpetuity. The fair value of other tangible fixed assets, largely gas metering assets, was determined using their depreciated replacement costs, based on the current cost of replacing meters and expected remaining useful economic lives. |
| | |
| c) | The fair value attributed to pension obligations reflected the recognition of previously unrecognised actuarial gains and losses, prior service costs and transition amounts. The amounts recognised were based on actuarial assessments at the acquisition date. |
Annual Report and Accounts 2003/04_National Grid Transco 112
Back to Contents
Notes to the Accounts_continued
32. Principal differences between UK and US accounting principles (continued)
Acquisition (purchase) accounting adjustments (including elimination of merger costs) (continued) |
| d) | The fair value attributed to intangible fixed assets related to licences, patents and trade marks and was determined based on discounted future cash flows. |
| | |
| e) | Restructuring costs (£60m) represented the costs incurred in respect of the integration of activities within the newly merged Group and related primarily to redundancy and property relocation costs. |
| | |
| f) | Deferred taxes were computed on the excess of the fair value over book value, other than for goodwill, using the applicable statutory UK corporation tax rate. |
| | |
| g) | Goodwill represented the remainder of unallocated purchase consideration. |
The fair value of consideration, assets and liabilities and the resulting goodwill is set out in the table below:
Assets | Provisional | | Final | | | |
| fair value | fair value | Final |
| at acquisition | adjustments | fair value |
| £m | £m | £m |
|
|
|
|
|
| |
| Total current assets | 1,336 | | – | | 1,336 | |
| Property, plant and equipment | 14,148 | | 67 | (i) | 14,215 | |
| Intangible assets | 20 | | – | | 20 | |
| Other assets | 6 | | – | | 6 | |
|
|
|
|
|
| |
| Total assets | 15,510 | | 67 | | 15,577 | |
|
|
|
|
|
| |
| Liabilities | | | | | | |
| Total current liabilities | 2,656 | | – | | 2,656 | |
| Long-term borrowings | 5,935 | | – | | 5,935 | |
| Pensions | 535 | | – | | 535 | |
| Other liabilities | 470 | | – | | 470 | |
| Deferred income taxes | 3,129 | | 78 | (i)(ii) | 3,207 | |
|
|
|
|
|
| |
| Total liabilities | 12,725 | | 78 | | 12,803 | |
|
|
|
|
|
| |
| Net assets | 2,785 | | (11 | ) | 2,774 | |
|
|
|
|
|
| |
| Consideration | 6,598 | | – | | 6,598 | |
|
|
|
|
|
| |
| Goodwill | 3,813 | | 11 | | 3,824 | |
|
|
|
|
|
| |
| | |
| Final fair value adjustments related to: |
| (i) | A revision to the fair values attributed to UK gas transmission and distribution property, plant and equipment due to improved estimates of future cash flows following finalisation of the latest available business plans (£67m increase in property, plant and equipment carrying values; £20m deferred tax impact). |
| (ii) | The recognition of a deferred tax liability on gains relating to the sale of properties where taxable gains were rolled over into replacement assets (£58m). There is no deferred tax recognised for this under UK GAAP. |
Acquisitions – pro forma results
The following unaudited pro forma summary gives effect to the acquisitions of Lattice and Niagara Mohawk, as if the acquisitions had taken place on 1 April 2001. The pro forma summary combines the actual consolidated results of the Group (excluding the effect of the acquisitions in the actual period that they took place) and the results of Lattice and Niagara Mohawk after giving effect to certain adjustments. These adjustments include estimates of the effect of adopting the final fair value adjustments for both acquisitions, and the increased net interest expense, together with the associated tax effects, as a result of financing the acquisition of Niagara Mohawk. In addition, the earnings per share calculation has been adjusted as if the shares issued to acquire Lattice and Niagara Mohawk were issued on the assumed date of acquisition for the purposes of preparing the pro forma summary. The pro forma summary does not necessarily reflect the results of operations as they would have been if the Group (excluding the acquisitions) and the acquisitions had constituted a single entity during the periods presented.
Continuing operations
| | 2003 | | 2002 | |
| | £m | | £m | |
|
|
|
| |
| Turnover | 8,802 | | 7,486 | |
| Net income before cumulative effects of changes in accounting principles | 580 | | 115 | |
| Net income after cumulative effects of changes in accounting principles | 580 | | 101 | |
|
|
|
| |
| | pence | | pence | |
| Earnings per share | 18.9 | | 3.3 | |
| Earnings per ADS | 94.5 | | 16.5 | |
|
|
|
| |
Deferred taxation
Under UK GAAP, deferred taxation is provided in full on all material timing differences with certain exceptions, as outlined in ‘Accounting Policies –Deferred taxation and investment tax credits’. Under US GAAP, deferred tax is provided in full, using the liability method, and requires the recognition of deferred taxation on all timing differences except for non tax deductible goodwill.
The deferred taxation adjustment principally reflects the tax effect of the other differences between UK and US GAAP.
113 National Grid Transco_Annual Report and Accounts 2003/04
Back to Contents
Notes to the Accounts_continued
32. Principal differences between UK and US accounting principles (continued)
Deferred taxation (continued)
The deferred tax liability under US GAAP is analysed as follows:
| | 2004 | | 2003 | |
| | £m | | £m | |
|
|
|
| |
| Deferred taxation liabilities: | | | | |
| Excess of book value over taxation value of fixed assets | 4,943 | | 4,955 | |
| Other temporary differences | 1,169 | | 1,229 | |
|
|
|
| |
| | 6,112 | | 6,184 | |
| Deferred taxation assets: | | | | |
| Other temporary differences (i) | (1,245 | ) | (1,497 | ) |
|
|
|
| |
| | 4,867 | | 4,687 | |
|
|
|
| |
| Analysed as follows: | | | | |
| Current | 63 | | 31 | |
| Non-current | 4,804 | | 4,656 | |
|
|
|
| |
| | 4,867 | | 4,687 | |
|
|
|
| |
| | | | | |
| (i) | Deferred taxation assets at 31 March 2004 were stated net of a £210m valuation allowance adjustment associated with certain capital losses (31 March 2003: £nil). |
Pensions
Under UK GAAP, pension costs have been accounted for in accordance with UK Statement of Standard Accounting Practice (SSAP) 24 and disclosures have been provided in accordance with SSAP 24 and FRS 17.
Under US GAAP, pension costs are determined in accordance with the requirements of US Statements of Financial Accounting Standards (SFAS) 87 and 88 and pension disclosures are presented in accordance with SFAS 132. Differences between UK GAAP and US GAAP figures arise from the requirement to use different actuarial methods and assumptions and a different method of amortising certain surpluses and deficits. Under US GAAP, the Company has estimated the effect on net income and shareholders’ equity assuming the adoption and application of SFAS 87 ‘Employers’ Accounting for Pensions’ as of 1 April 1996, as the adoption of SFAS 87 on the actual effective date of 1 April 1989 was not feasible. The unrecognised transition asset at 1 April 1989, using the financial assumptions at 1 April 1996, amounted to £172m and is being amortised over 15 years commencing 1 April 1989.
Under UK GAAP, as explained in note 7, net interest includes a charge of £52m (2003: £3m credit; 2002: £30m credit) in respect of the notional interest element of the variation from the regular pension cost. Under US GAAP, this cost is not recognised.
The net periodic charge/(credit) for pensions and other post-retirement benefits is as follows:
| | Pensions | | Other post-retirement benefits | |
| |
|
|
|
|
| |
| |
| | | 2004 | | 2003 | | 2002 | | 2004 | | 2003 | | 2002 | |
| | | £m | | £m | | £m | | £m | | £m | | £m | |
|
|
|
|
|
|
|
|
|
|
|
|
| |
| Service cost | | 143 | | 78 | | 30 | | 10 | | 8 | | 5 | |
| Interest cost | | 799 | | 456 | | 125 | | 59 | | 59 | | 29 | |
| Settlements | | 14 | | 19 | | (12 | ) | 10 | | – | | – | |
| Expected return on assets | | (814 | ) | (490 | ) | (160 | ) | (36 | ) | (32 | ) | (21 | ) |
| Amortisation of prior service cost | | 5 | | 5 | | 4 | | – | | – | | – | |
| Amortisation of previously unrecognised losses | | 39 | | 4 | | – | | 21 | | 2 | | – | |
| Amortisation of transitional asset | | (11 | ) | (11 | ) | (11 | ) | – | | – | | – | |
|
|
|
|
|
|
|
|
|
|
|
|
| |
| | | 175 | | 61 | | (24 | ) | 64 | | 37 | | 13 | |
| Release of pension provision | | (2 | ) | (2 | ) | (2 | ) | – | | – | | – | |
|
|
|
|
|
|
|
|
|
|
|
|
| |
| | | 173 | | 59 | | (26 | ) | 64 | | 37 | | 13 | |
|
|
|
|
|
|
|
|
|
|
|
|
| |
The additional cost incurred in respect of severance cases computed in accordance with SFAS 88 ‘Employers’ Accounting for Settlements and Curtailments of Defined Benefit Pension Plans and for Termination Benefits’ is as follows:
| | 2004 | | 2003 | | 2002 | |
| | £m | | £m | | £m | |
|
|
|
|
|
| |
| Cost of termination benefits and curtailments | 129 | | 119 | | 46 | |
|
|
|
|
|
| |
The principal financial assumptions used for the SFAS 87 calculations of net periodic charge/(credit), based on a measurement date of 31 March 2003 in respect of the US and UK defined benefit schemes are shown below:
| | | US | | UK | |
| |
|
|
|
|
| |
|
|
|
|
| |
| | | 2004 | | 2003 | | 2002 | | 2004 | | 2003 | | 2002 | |
| | | % | | % | | % | | % | | % | | % | |
|
|
|
|
|
|
|
|
|
|
|
|
| |
| Discount rate | | 6.3 | | 7.5 | | 7.3 | | 5.4 | | 6.0 | | 5.5 | |
| Return on assets | | 8.5 | | 8.5 | | 7.5-9.0 | | 6.3-6.9 | | 6.3-7.1 | | 7.0 | |
| General salary increases | | 3.3-5.3 | | 3.3-4.5 | | 4.0 | | 3.5 | | 3.8 | | 3.3 | |
| Pension increases | | nil | | nil | | nil | | 2.6 | | 2.9 | | 2.5 | |
|
|
|
|
|
|
|
|
|
|
|
|
| |
In respect of US schemes, the estimated rate of return for various passive asset classes is based both on analysis of historical rates of return and forward-looking analysis of risk premiums and yields. Current market conditions, such as inflation and interest rates, are evaluated in connection with the setting of our long-term assumption. A small premium is added for active management of both equity and fixed income. The rates of return for each asset class are then weighted in accordance with our target asset allocation, and the resulting long-term return on asset rate is then applied to the market-related value of assets.
Annual Report and Accounts 2003/04_National Grid Transco 114
Back to Contents
Notes to the Accounts_continued
32. Principal differences between UK and US accounting principles (continued)
Pensions (continued)
In respect of UK schemes, the expected long-term rate of return on assets has been set reflecting the price inflation expectation, the expected real return on each major asset class and the long-term asset allocation strategy adopted for each plan. The expected real returns on specific asset classes reflect historical returns, investment yields on the measurement date and general future return expectations, and have been set after taking advice from the plans’ actuaries.
The assumptions used for other post-retirement costs relate solely to US schemes. These assumptions were that the discount rate used would be 5.75% (2003: 6.25%; 2002: 7.5%) and that medical costs would increase by 10% (2003: 10%; 2002: 10%), decreasing to 5% (2003: 5%; 2002: 5%) by 2009 and remain at 5% (2003: 5%; 2002: 5%) thereafter.
A reconciliation of the funded status of the Group pension and other post-retirement schemes to the net accrued benefit liability that were included in the Group’s balance sheet prepared under US GAAP is as follows:
| | | | | | | Other post-retirement | |
| | | Pensions | | benefits | |
| |
|
|
| |
| |
| | | 2004 | | 2003 | | 2004 | | 2003 | |
| | | £m | | £m | | £m | | £m | |
|
|
|
|
|
|
|
|
| |
| Projected benefit obligation | | (15,394 | ) | (15,030 | ) | (1,002 | ) | (1,004 | ) |
| Fair value of plan assets | | 13,432 | | 12,115 | | 496 | | 373 | |
|
|
|
|
|
|
|
|
| |
| Excess of projected benefit obligation over plan assets | | (1,962 | ) | (2,915 | ) | (506 | ) | (631 | ) |
| Unrecognised transition asset | | – | | (11 | ) | – | | – | |
| Unrecognised net loss | | 1,493 | | 2,508 | | 328 | | 336 | |
| Unrecognised prior service cost/(credit) | | 48 | | 57 | | (5 | ) | (1 | ) |
|
|
|
|
|
|
|
|
| |
| Net accrued benefit liability – before minimum liability adjustment | | (421 | ) | (361 | ) | (183 | ) | (296 | ) |
| Additional minimum liability adjustment | | (840 | ) | (1,583 | ) | – | | – | |
|
|
|
|
|
|
|
|
| |
| Net accrued benefit liability | | (1,261 | ) | (1,944 | ) | (183 | ) | (296 | ) |
|
|
|
|
|
|
|
|
| |
At 31 March 2004, as required under SFAS 87, an intangible asset of £48m (2003: £57m) was recognised in relation to the additional minimum liability, being equal to the unrecognised prior service cost. A regulatory asset of £120m (2003: £221m) was also created. The remaining additional minimum liability of £672m (2003: £1,303m) has been included in other comprehensive income.
The net accrued benefit liabiity above is shown net of a prepaid cost of £174m in respect of one group scheme.
The principal financial assumptions used for the SFAS 87 calculations of the projected benefit obligation, based on a measurement date of 31 March 2004, in respect of the US and UK defined benefit schemes are shown below:
| | | US | | UK | |
| |
|
|
|
|
| |
|
|
|
|
| |
| | | 2004 | | 2003 | | 2002 | | 2004 | | 2003 | | 2002 | |
| | | % | | % | | % | | % | | % | | % | |
|
|
|
|
|
|
|
|
|
|
|
|
| |
| Discount rate | | 5.8 | | 6.3 | | 7.5 | | 5.5 | | 5.4 | | 6.0 | |
| General salary increases | | 3.3-5.3 | | 3.3-5.3 | | 3.3-4.5 | | 3.9 | | 3.5 | | 3.8 | |
| Pension increases | | nil | | nil | | nil | | 3.0 | | 2.6 | | 2.9 | |
|
|
|
|
|
|
|
|
|
|
|
|
| |
All pension schemes had an additional minimum liability adjustment except the Lattice Group Pension Scheme. The accumulated benefit obligation for pensions was £14,507m at 31 March 2004 (2003: £14,059m). The Group has followed approach two of Emerging Issues Task Force (EITF) Abstract 88-1 in calculating the accumulated benefit obligation. Changes in the projected benefit obligation and changes in the fair value of plan assets are shown below:
| | | | | | | Other post-retirement | |
| | | Pensions | | benefits | |
| |
|
|
| |
| |
| | | 2004 | | 2003 | | 2004 | | 2003 | |
| | | £m | | £m | | £m | | £m | |
|
|
|
|
|
|
|
|
| |
| Projected benefit obligation at start of year | | 15,030 | | 2,953 | | 1,004 | | 884 | |
| Service cost | | 143 | | 78 | | 10 | | 8 | |
| Interest cost | | 799 | | 456 | | 59 | | 59 | |
| Plan participants’ contributions | | 18 | | 10 | | – | | – | |
| Plan amendment – prior service cost | | – | | 8 | | (5 | ) | – | |
| Terminations | | 129 | | 58 | | 5 | | – | |
| Curtailments | | (2 | ) | 42 | | 10 | | – | |
| Settlements | | (80 | ) | (109 | ) | – | | – | |
| Actuarial loss | | 322 | | 1,212 | | 119 | | 195 | |
| Benefits paid | | (736 | ) | (423 | ) | (51 | ) | (54 | ) |
| Acquisition of Group undertakings | | – | | 10,908 | | – | | – | |
| Transfers | | – | | (1 | ) | – | | – | |
| Exchange adjustments | | (229 | ) | (162 | ) | (149 | ) | (88 | ) |
|
|
|
|
|
|
|
|
| |
| Projected benefit obligation at end of year | | 15,394 | | 15,030 | | 1,002 | | 1,004 | |
|
|
|
|
|
|
|
|
| |
| Fair value of plan assets at start of year | | 12,115 | | 2,698 | | 373 | | 397 | |
| Actual return on assets | | 2,023 | | (437 | ) | 92 | | (35 | ) |
| Employer contributions | | 244 | | 150 | | 123 | | 68 | |
| Plan participants’ contributions | | 18 | | 10 | | – | | – | |
| Benefits paid | | (736 | ) | (423 | ) | (24 | ) | (18 | ) |
| Acquisition of Group undertakings | | – | | 10,373 | | – | | – | |
| Settlements | | (80 | ) | (109 | ) | – | | – | |
| Exchange adjustments | | (152 | ) | (147 | ) | (68 | ) | (39 | ) |
|
|
|
|
|
|
|
|
| |
| Fair value of plan assets at end of year | | 13,432 | | 12,115 | | 496 | | 373 | |
|
|
|
|
|
|
|
|
| |
It is estimated that a 1% change in the assumed healthcare cost trends would have increased or decreased the accumulated post-retirement benefit obligation at 31 March 2004 by £106m (2003: £106m; 2002: £91m) and £96m (2003: £96m; 2002: £82m) respectively. The net periodic cost for the year ended 31 March 2004 would have increased or decreased by £7m and £8m respectively (2003: £8m and £7m respectively).
Estimated contributions for the year ending 31 March 2005 are £164m.
115 National Grid Transco_Annual Report and Accounts 2003/04
Back to Contents
Notes to the Accounts_continued
32. Principal differences between UK and US accounting principles (continued)
Pensions (continued)
In the UK, the trustees for each plan are responsible for setting the long-term strategy after consultation with the Group and professional advisers. The trustees’ objectives are to invest in assets of appropriate liquidity, which together with future contributions from employers and members, will generate income and capital growth to meet the cost of benefits from the plans; to limit the risk and to minimise long-term cost. In the US, the Group manages its pension plan investments to minimise the long-term cost of operating the plan, with a reasonable level of risk.
Risk tolerance is determined as a result of periodic asset/liability studies which analyse plan liabilities and funded status and results in the determination of the allocation of assets.
Equity investments, fixed income and index-linked portfolios are broadly diversified. Investments are also held in property, private equity and timber with the objective of enhancing long-term returns whilst improving diversification. Investment risk and return are reviewed by investment committees on a quarterly basis.
Share option schemes
As permitted under UK GAAP, no cost is accrued for share options awarded under the sharesave scheme where the exercise price of the options is below the market value at the date of grant. In respect of the grant of options under the Executive scheme, no cost is accrued under UK GAAP as the exercise price is equivalent to the market value at the date of grant.
Under US GAAP, a charge is made against net income based on the fair value of grants in accordance with SFAS 123 ‘Accounting for Stock Based Compensation’. Disclosures are provided in accordance with SFAS 123 and SFAS 148 ‘Accounting for Stock Based Compensation – Transition and Disclosure – an amendment of FAS No. 123’.
The average exercise price of the options granted during each of the three financial years ended 31 March are as follows:
| | 2004 | | 2003 | | 2002 | |
|
|
|
|
|
| |
| Where the exercise price is less than the market price at the date of grant | 317.0p | | 362.0p | | 457.0p | |
| Where the exercise price is equal to the market price at the date of grant | 405.0p | | 478.0p | | 550.0p | |
|
|
|
|
|
| |
| | | | | | | |
| The average fair value of the options granted during each of the three financial years ended 31 March are estimated as follows: | | | | | |
| | | | | | | |
| | 2004 | | 2003 | | 2002 | |
|
|
|
|
|
| |
| Where the exercise price is less than the market price at the date of grant | 152.8p | | 123.0p | | 158.0p | |
| Where the exercise price is equal to the market price at the date of grant | 73.6p | | 50.0p | | 62.0p | |
|
|
|
|
|
| |
The fair value of the options granted are estimated using the Black-Scholes European option pricing model using the following principal assumptions:
| | 2004 | | 2003 | | 2002 | |
|
|
|
|
|
| |
| Dividend yield (%) | 7.0 | | 3.5 | | 3.5 | |
| Volatility (%) | 20.4 | | 35.0 | | 30.0 | |
| Risk-free investment rate (%) | 4.6 | | 4.4 | | 5.4 | |
| Average life (years) | 3.4 | | 4.0 | | 4.2 | |
|
|
|
|
|
| |
The compensation cost charged for the year ended 31 March 2004 amounted to £25m (2003: £29m; 2002: £5m).
Further details of the Group’s share-based plans are given in note 23, pages 97 to 99.
Ordinary dividends
Under UK GAAP, final ordinary dividends are provided for in the year in respect of which they are proposed by the Board of Directors for approval by the shareholders. Under US GAAP, dividends are not provided until declared.
Tangible fixed assets – reversal of partial release of impairment provision
During the financial year ended 31 March 1990, an impairment provision was recorded in respect of certain tangible fixed assets. Part of this impairment provision was subsequently released and shareholders’ equity credited. Under US GAAP, this partial release would not be permitted.
Fixed assets – impact of Lattice purchase accounting and replacement expenditure
Under UK GAAP, the combination of National Grid and Lattice was accounted for as a merger (pooling of interests), while under US GAAP this transaction was accounted for as an acquisition (purchase accounting) of Lattice by National Grid. Consequently, under US GAAP the tangible fixed assets of Lattice have been recorded at their fair value at the date of purchase, and depreciation subsequent to acquisition has been calculated on that fair value.
In addition, under UK GAAP the Group charges to the profit and loss account replacement expenditure on certain components of plant and equipment, which is principally undertaken to repair and to maintain the safety of the pipeline system. Under US GAAP, such expenditure is capitalised and depreciated over the assets’ expected useful economic lives.
Financial instruments
Under UK GAAP, derivative financial instruments that qualify for hedge accounting are recorded at their historical cost, if any, and are not remeasured. Any related monetary assets or liabilities, including foreign currency borrowings, are translated at the hedged rate. In addition, under UK GAAP, it is permissible to hedge account for the net assets of overseas operations with hedging instruments denominated in currencies other than the functional currencies of the overseas operations.
Under US GAAP, as required by SFAS 133 ‘Accounting for Derivative Instruments and Hedging Activities’, all derivative financial instruments, including derivatives embedded within other contracts, are required to be recognised in the balance sheet as either assets or liabilities and measured at fair value. SFAS 133 only permits hedge accounting in specific circumstances, where the hedge is identified as one of three types: fair value; cash flow; or foreign currency exposures of net investments in foreign operations. Provided that it can be demonstrated that the hedge is highly effective and the relevant hedging criteria have been met, then in respect of fair value hedges, both the change in fair value of the derivative and hedged item are reflected in net income in the period of the change. For cash flow hedges and hedges of foreign currency exposures of net investments in foreign operations, changes in fair value are reflected through other comprehensive income. In the event that the conditions for hedge accounting are not met, changes in the fair value of derivatives are reflected in net income.
Annual Report and Accounts 2003/04_National Grid Transco 116
Back to Contents
Notes to the Accounts_continued
32. Principal differences between UK and US accounting principles (continued)
Financial instruments (continued)
The primary differences that arise between UK GAAP and US GAAP result from the different criteria that are applied under UK GAAP and US GAAP to permit the use of hedge accounting, and the application of different measurement criteria.
Equity Plus Income Convertible Securities (EPICs)
Under UK GAAP, EPICs were carried in the balance sheet at the gross proceeds of the issue. This resulted in a gain being recognised on disposal during 2004. The related issue costs were written off in the year of issue. Under US GAAP, the issue costs were deferred and written off over the period to the date of redemption of the EPICs on 6 May 2003.
US GAAP required that the carrying value of the EPICs be adjusted to the settlement amount of the debt, which was linked to the Energis plc share price and therefore no gain was recorded on the disposal – see note 20.
Regulatory assets
SFAS 71 ‘Accounting for Certain Types of Regulation’ establishes US GAAP for utilities whose regulators have the power to approve and/or regulate rates that may be charged to customers. Provided that through the regulatory process the utility is substantially assured of recovering its allowable costs by the collection of revenue from its customers, such costs not yet recovered are deferred as regulatory assets. Due to the different regulatory environment, no equivalent accounting standard applies in the UK.
Under UK GAAP, regulatory assets established in accordance with the principles of SFAS 71 are recognised where they comprise rights or other access to future economic benefits which arise as a result of past transactions or events which have created an obligation to transfer economic benefit to a third party. Measurement of the past transaction or event and hence of the regulatory asset is determined in accordance with UK GAAP. Where the application of UK GAAP results in the non or partial recognition of an obligation compared with US GAAP, any related regulatory asset is either not or partially recognised. Under UK GAAP, in certain circumstances, regulatory assets may be reported net of related regulatory liabilities. Such amounts are shown gross in the US GAAP balance sheet.
Recognition of income
Under US GAAP, income is recognised in the period that the service is provided up to the maximum revenue allowed under the terms of the relevant regulatory regime. Under UK GAAP, any income received or receivable in excess of the maximum revenue allowed for the period, under the terms of the relevant regulatory regime, is recognised as income, even where prices will be reduced in a future period.
Severance and integration costs
Under UK GAAP, severance costs are provided for in the accounts if it is determined that a constructive or legal obligation has arisen from a restructuring programme where it is probable that it will result in the outflow of economic benefits and the costs involved can be estimated with reasonable accuracy. Under US GAAP, severance costs are recognised when the employees accept the severance offer. In addition, where the number of employees leaving results in a significant reduction in the accrual of pension benefits for employees’ future service (a curtailment under US GAAP), the effects are reflected as part of the cost of such termination benefits. Accordingly, timing differences between UK and US GAAP arise on the recognition of such costs.
Goodwill – purchase of Lattice
Under UK GAAP, the combination of National Grid and Lattice has been accounted for as a merger (pooling of interests) while under US GAAP this transaction was accounted for as an acquisition (purchase accounting) of Lattice by National Grid. In accordance with US GAAP, goodwill arising on the purchase has been capitalised, but is not amortised.
Goodwill – other
Under US GAAP, the fair value of net assets acquired is calculated in accordance with US GAAP principles which differ in certain respects from UK GAAP principles. As a result, the US GAAP fair value of net assets of Group undertakings acquired differs from the fair value of net assets as determined under UK GAAP principles.
Under UK GAAP, goodwill is amortised over its expected useful economic life, principally 20 years. Under US GAAP, goodwill is not amortised but is reviewed periodically for impairment. An impairment assessment has been carried out during 2004 and it resulted in an impairment of goodwill being recorded in respect of Advantica, which was acquired by the Group as part of the Lattice acquisition.
Restructuring – purchase of Lattice
Under US GAAP, certain reorganisation costs relating to an acquired entity are included in liabilities in determining the fair value of net assets acquired. Under UK GAAP, such costs are not recognised as liabilities of the acquired entity at the date of acquisition and are treated as post-acquisition costs.
Share of joint ventures’ and associate’s adjustments
The Group’s share of the associated undertaking’s results and net assets, which also impact on the exceptional profit on disposal of investments and assets held for exchange, have been adjusted to conform with US GAAP.
On 16 July 2002, Energis plc (‘Energis’) went into administration. As a direct result of this event, Energis ceased to be an associate of the Group from that date. The results for 2002/03 have not been affected by this change in status, because the Group investment in Energis had been fully written down during 2001/02 and Energis had not publicly declared any results since reporting its results for the six months ended 30 September 2001.
The Group ceased equity accounting for Intelig, its Brazilian telecoms joint venture, with effect from 30 September 2002. This arose as a result of the Group’s share of net assets falling to zero and the Group declaring its intention not to fund this business any further while pursuing a withdrawal strategy.
The Group’s interest in Manquehue net and Silica Networks were disposed of in October 2002 and September 2002 respectively. The Group ceased equity accounting for Manquehue net and Silica Networks from the date of disposal. In the case of Energis Polska, the interest reduced to a level where the Group has no significant influence on the activities of this business as of November 2002. As a result, these entities are no longer equity accounted for, and any losses arising from the disposal or reduction in interest have previously been reflected in the income statement.
The tables on pages 118 and 119 provide summarised information of the Group’s equity in the loss or income for 31 March 2001 and 2002 and also summarised balance sheet information as at 31 March 2002.
117 National Grid Transco_Annual Report and Accounts 2003/04
Back to Contents
Notes to the Accounts_continued
32. Principal differences between UK and US accounting principles (continued)
Summary financial information for equity investments
The following information is provided to enable the reader to see the impact on the US GAAP results of equity accounted affiliates for the years ended 31 March 2001 and 31 March 2002 and to allow further understanding of the impact of these investments on the financial condition of the Group at those dates.
The following table summarises the underlying results of all material equity accounted investments included within the Group accounts for the year ended 31 March 2002:
| | 2002 | |
|
|
|
|
|
|
|
|
|
|
|
| |
| | | (i) | | | Silica | (ii) | Manquehue | (ii) | Energis | (ii) | | (ii) |
| Energis | Intelig | Networks | net | Polska | Citelec |
| £m | | £m | £m | | £m | | £m | | £m | |
|
|
|
|
|
|
|
|
|
|
|
| |
| Net revenue | 482 | | 300 | | – | | 28 | | 1 | | 149 | |
| Total expenses | (582 | ) | (408 | ) | (13 | ) | (46 | ) | (8 | ) | (301 | ) |
|
|
|
|
|
|
|
|
|
|
|
| |
| Loss before income taxes and minority interests | (100 | ) | (108 | ) | (13 | ) | (18 | ) | (7 | ) | (152 | ) |
| Taxation | 2 | | – | | – | | 2 | | – | | (14 | ) |
| Minority interests | 1 | | – | | – | | – | | – | | 58 | |
|
|
|
|
|
|
|
|
|
|
|
| |
| Net loss | (97 | ) | (108 | ) | (13 | ) | (16 | ) | (7 | ) | (108 | ) |
| Group’s % ownership in investee | 36.9% | | 50.0% | | 50.0% | | 30.0% | | 48.8% | | 42.5% | |
| Group’s equity in net loss of investee under US GAAP | (36 | ) | (54 | ) | (6 | ) | (5 | ) | (3 | ) | (46 | ) |
|
|
|
|
|
|
|
|
|
|
|
| |
The following table reconciles the Group’s equity in the net (loss)/income of equity accounted investees to the Group’s reported interest in equity accounted affiliates as measured under US GAAP, including consolidation adjustments, for the year ended 31 March 2002:
| | 2002 | |
|
|
|
|
|
|
|
|
|
|
|
|
|
|
|
| |
| | | (i) | | | Silica | (ii) | Manquehue | (ii) | Energis | (ii) | | (ii) | | | | |
| Energis | Intelig | Networks | net | Polska | Citelec | Other | Total |
| £m | | £m | | £m | | £m | | £m | | £m | | £m | | £m | |
|
|
|
|
|
|
|
|
|
|
|
|
|
|
|
| |
| Group’s equity in net (loss)/income of investee under US GAAP | (36 | ) | (54 | ) | (6 | ) | (5 | ) | (3 | ) | (46 | ) | 7 | | (143 | ) |
| | | | | | | | | | | | | | | | | |
| Consolidation adjustments | | | | | | | | | | | | | | | | |
| Impairments – write down carrying value | (392 | ) | (116 | ) | (41 | ) | (37 | ) | (20 | ) | – | | – | | (606 | ) |
| Provisions for related liabilities | – | | (83 | ) | (11 | ) | (2 | ) | (90 | ) | – | | – | | (186 | ) |
| Other | 25 | (iii) | 2 | | – | | 2 | | (2 | ) | (3 | ) | 11 | | 35 | |
|
|
|
|
|
|
|
|
|
|
|
|
|
|
|
| |
| Group’s equity in net (loss)/income under US GAAP including consolidation adjustments | (403 | ) | (251 | ) | (58 | ) | (42 | ) | (115 | ) | (49 | ) | 18 | | (900 | ) |
|
|
|
|
|
|
|
|
|
|
|
|
|
|
|
| |
| (i) | Only includes six months’ results to September 2001. No results are available after this date, as a consequence of Energis being placed in administration. |
| (ii) | Results included in the Group accounts for Silica Networks, Manquehue net, Energis Polska and Citelec are based on their results reported for the year ended 31 December 2001. |
| (iii) | Represents a profit on a deemed disposal of Energis shares, arising from a dilution of the Group's equity interest. |
The following table summarises the balance sheet of all material equity accounted investments:
| | 2002 | |
|
|
|
|
|
|
|
|
|
| |
| | | | | | Silica | | Manquehue | | Energis | | | |
Energis
£m | Intelig
£m | Networks
£m | (i) | net
£m | (i) | Polska
£m | (i) | Citelec
£m | (i) |
|
|
|
|
|
|
|
|
|
|
|
| |
| Current assets | 342 | | 117 | | 11 | | 28 | | 47 | | 25 | |
| Non-current assets | 2,276 | | 525 | | 77 | | 156 | | 89 | | 366 | |
|
|
|
|
|
|
|
|
|
|
|
| |
| Total assets | 2,618 | | 642 | | 88 | | 184 | | 136 | | 391 | |
|
|
|
|
|
|
|
|
|
|
|
| |
| Current liabilities | 389 | | 551 | | 23 | | 24 | | 93 | | 151 | |
| Non-current liabilities | 1,151 | | 4 | | – | | 63 | | – | | 207 | |
| Minority interests | 3 | | – | | – | | – | | – | | 17 | |
| Shareholders’ equity | 1,075 | | 87 | | 65 | | 97 | | 43 | | 16 | |
|
|
|
|
|
|
|
|
|
|
|
| |
| Total liabilities and equity | 2,618 | | 642 | | 88 | | 184 | | 136 | | 391 | |
|
|
|
|
|
|
|
|
|
|
|
| |
The following table shows the Group’s investment in equity accounted affiliates, under US GAAP, as at 31 March 2002:
| | | | | | | | 2002 | | | | | | | | | |
|
|
|
|
|
|
|
|
|
|
|
|
|
|
|
| |
| | | | | | Silica | (i) | Manquehue | (i) | Energis | (i) | | (i) | | | | |
| Energis | Intelig | Networks | net | Polska | Citelec | Other | Total |
| £m | | £m | | £m | | £m | | £m | | £m | | £m | | £m | |
|
|
|
|
|
|
|
|
|
|
|
|
|
|
|
| |
| Group’s investment in and advances to equity investees plus equity in undistributed earnings since acquisition: | | | | | | | | | | | | | | | | |
| Before impairment | 392 | | 126 | | 43 | | 41 | | 20 | | 7 | | 57 | | 686 | ) |
| Impairment | (392 | ) | (126 | ) | (43 | ) | (41 | ) | (20 | ) | (7 | ) | - | | (629 | ) |
|
|
|
|
|
|
|
|
|
|
|
|
|
|
|
| |
| After impairment | – | | – | | – | | – | | – | | – | | 57 | | 57 | |
|
|
|
|
|
|
|
|
|
|
|
|
|
|
|
| |
| Group’s % ownership in investee at end of year | 36.8% | | 50.0% | | 50.0% | | 30.0% | | 48.8% | | 42.5% | | various | | | |
|
|
|
|
|
|
|
|
|
|
|
|
|
|
|
| |
| (i) | The balance sheets shown for Silica Networks, Manquehue net, Energis Polska and Citelec are as at 31 December 2001. The amounts included within the Group’s investment carrying value at 31 March 2002 are based on these balance sheets. |
Annual Report and Accounts 2003/04_National Grid Transco 118
Back to Contents
Notes to the Accounts_continued
32. Principal differences between UK and US accounting principles (continued)
Summary financial information for equity investments (continued)
The following table summarises the results of all material equity accounted investments included within the Group accounts for the year ended 31 March 2001:
| | | | | | 2001 | | | | | |
|
|
|
|
|
|
|
|
|
| |
| | | | | | Silica | (i) | Manquehue | (i) | Energis | (i) | | (i) |
| Energis | Intelig | Networks | net | Polska | Citelec |
| | £m | | £m | | £m | | £m | | £m | | £m | |
|
|
|
|
|
|
|
|
|
|
|
| |
| Net revenue | 812 | | 192 | | – | | 28 | | – | | 152 | |
| Total expenses | (936 | ) | (416 | ) | (3 | ) | (28 | ) | (4 | ) | (117 | ) |
|
|
|
|
|
|
|
|
|
|
|
| |
| (Loss)/income before income taxes and minority interests | (124 | ) | (224 | ) | (3 | ) | – | | (4 | ) | 35 | |
| Tax | (21 | ) | – | | – | | – | | – | | (11 | ) |
| Minority interests | 2 | | – | | – | | – | | – | | (9 | ) |
|
|
|
|
|
|
|
|
|
|
|
| |
| Net (loss)/income | (143 | ) | (224 | ) | (3 | ) | – | | (4 | ) | 15 | |
| Group’s % ownership in investee | 37.6% | | 50.0% | | 50.0% | | 30.0% | | 23.8% | | 42.5% | |
| Group’s equity in net (loss)/income of investee under US GAAP | (53 | ) | (112 | ) | (1 | ) | – | | (1 | ) | 6 | |
|
|
|
|
|
|
|
|
|
|
|
| |
The following table reconciles the Group’s equity in the net (loss)/income of equity accounted investees to the Group’s reported interest in equity accounted affiliates as measured under US GAAP, including consolidation adjustments, for the year ended 31 March 2001:
| | 2001 | |
|
|
|
|
|
|
|
|
|
|
|
|
|
|
|
| |
| | | | | | Silica | (i) | Manquehue | (i) | Energis | (i) | | (i) | | | | |
| Energis | Intelig | Networks | net | Polska | Citelec | Other | Total |
| | £m | | £m | | £m | | £m | | £m | | £m | | £m | | £m | |
|
|
|
|
|
|
|
|
|
|
|
|
|
|
|
| |
| | | | | | | | | | | | | | | | | |
| Group’s equity in net (loss)/income of investee under US GAAP | (53 | ) | (112 | ) | (1 | ) | – | | (1 | ) | 6 | | 9 | | (152 | ) |
| Consolidation adjustments | | | | | | | | | | | | | | | | |
| Goodwill amortisation | – | | – | | – | | (1 | ) | – | | – | | – | | (1 | ) |
| Other | 534 | (ii) | – | | – | | – | | – | | (1 | ) | – | | 533 | |
|
|
|
|
|
|
|
|
|
|
|
|
|
|
|
| |
| Group’s equity in net income/(loss) under US GAAP including consolidation adjustments | 481 | | (112 | ) | (1 | ) | (1 | ) | (1 | ) | 5 | | 9 | | 380 | |
|
|
|
|
|
|
|
|
|
|
|
|
|
|
|
| |
| (i) | Results for Silica Networks, Manquehue net, Energis Polska and Citelec are for the year ended 31 December 2000. |
| (ii) | The ‘Other’ consolidation adjustment comprises: |
| | – | a gain of £288m on a deemed disposal of Energis shares, caused by a dilution of the Group's interest as a result of Energis issuing additional shares to third party investors; |
| | – | a tax credit of £230m from the release of tax liabilities relating to profits on disposal of fixed assets in earlier years, as a result of the realisation in 2001 of capital losses arising from a group reorganisation; and |
| | – | sundry other consolidation adjustments amounting to £16m. |
Non-GAAP measures
In preparing the accounts in accordance with the Companies Act and UK GAAP, certain information is presented that would be viewed as ‘non-GAAP’ under regulations issued by the SEC. The Group has described such items and provided disclosure of the effects and reasons for presentation along with a condensed US GAAP income statement using the format prescribed by the SEC. The disclosure of each of the exceptional items would be prohibited within the Form 20-F if such exceptional items were not expressly permitted by FRS 3.
Management uses ‘adjusted’ profit measures in considering the performance of the Group’s operating segments and businesses. References to ‘adjusted operating profit’, ‘adjusted profit before taxation’, ‘adjusted earnings’ and ‘adjusted earnings per share’ are stated before exceptional items and goodwill amortisation.
The Directors believe that the use of these adjusted measures better indicates the underlying business performance of the Group than the unadjusted measures because the exclusion of these items provides a clearer comparison of results from year to year for each of the years presented. This is because this method of presentation removes the distorting impact of exceptional items and removes the impact of goodwill amortisation in order to enhance comparability with the reporting practices of other UK companies.
Exceptional items, which are adjusted for in the adjusted measures referred to above, are defined as material items that derive from events that fall within the ordinary activities of the Group, but that require separate disclosure on the grounds of size or incidence for the accounts to give a true and fair view. Such exceptional items include, for example, material restructuring costs and impairments. Note 4 on pages 80 and 81 contains a discussion of the nature of these exceptional items for each period.
Other differences between UK and US GAAP
UK GAAP requires the investors’ share of operating profit or loss, interest and taxation relating to associates and joint ventures to be accounted for and disclosed separately from those of Group undertakings. Under US GAAP, the investors’ share of the after tax profits and losses of joint ventures and associates is included within the income statement as a single line item. UK GAAP requires the investors’ share of gross assets and gross liabilities of joint ventures to be shown on the face of the balance sheet. Under US GAAP, the net investment in joint ventures is shown as a single line item.
Under UK GAAP, the impact of discontinued operations on turnover, operating costs and operating profit is required to be accounted for and disclosed separately from continuing operations. Under US GAAP, the net income/(loss) arising from discontinued operations of Group undertakings is required to be separately accounted for and disclosed as a single line item.
The Group reviews all long-lived assets for potential impairment whenever events or changes in circumstances indicate that the carrying amount of an asset may not be recoverable. Under UK GAAP, recognition and measurement of impairment is determined on the basis of discounted cash flows attributable to income generating units. Under US GAAP, impairments on long-lived assets are determined in accordance with SFAS 144 ‘Accounting for the Impairment or Disposal of Long-Lived Assets’ and are recognised on the basis of undiscounted future cash flows and measured on the basis of discounted future cash flows. For the year ended 31 March 2004, there was an additional £11m impairment of intangible fixed assets relating to Advantica under US GAAP over the impairment under UK GAAP. This difference has no effect on the Group accounts for the years ended 31 March 2003 and 31 March 2002.
Under UK GAAP, assets in the balance sheet are presented in ascending order of liquidity and the balance sheet is analysed between net assets and shareholders’ funds. Under US GAAP, assets are presented in descending order of liquidity and the balance sheet is analysed between total assets and liabilities and shareholders’ funds – see note 31.
119 National Grid Transco _Annual Report and Accounts 2003/04
Back to Contents
Notes to the Accounts_continued
32. Principal differences between UK and US accounting principles (continued)
New US Accounting Standards adopted during 2003/04
During 2003/04, the Group adopted the following US GAAP accounting standards to the extent necessary to comply with their reporting obligations in respect of these accounts: |
| SFAS 143 ‘Accounting for Asset Retirement Obligations’ (‘FAS 143’); |
| SFAS 132 ‘Employers’ Disclosures about Pensions and Other Post-Retirement Benefits – an amendment of FASB Statements No 87, 88 and 106’ (‘FAS 132’); |
| FIN 46 ‘Consolidation of Variable Interest Entities, an interpretation of Accounting Research Bulletin (ARB) 51’; and |
| SFAS 150 ‘Accounting for Certain Financial Instruments with Characteristics of both Liabilities and Equity’ (‘FAS 150’). |
FAS 143 prescribes the accounting for retirement obligations associated with tangible long-lived assets, including the timing of liability recognition and initial measurement of the liability. FAS 143 requires that an asset retirement cost should be capitalised as part of the cost of the related long-lived asset and subsequently allocated to expense using a systematic and rational method. The adoption of FAS 143 has had no material impact on the results or the financial position of the Group. However, in accordance with industry-wide guidance received from the Securities and Exchange Commission in February 2004, costs of removal totalling £266m at 31 March 2004, which were previously classified as accumulated depreciation, have been reclassified as liabilities. Prior period numbers have also been reclassified by £297m at 31 March 2003. There has been no impact on net assets.
FAS 132 (Revised 2003) requires entities to make additional disclosures about pensions and other post-retirement obligations. The Group has complied with these disclosure requirements to the extent necessary at 31 March 2004.
In January 2003, the Financial Accounting Standards Board (FASB) issued FIN 46 ‘Consolidation of Variable Interest Entities, an interpretation of Accounting Research Bulletin (ARB) 51’. FIN 46 addresses the consolidation of entities for which control is achieved through means other than through voting rights (‘variable interest entities’ or ‘VIE’) by clarifying the application of ARB 51 ‘Consolidated Financial Statements’ to certain entities in which equity investors do not have the characteristics of a controlling financial interest or do not have sufficient equity at risk for the entity to finance its own activities without additional subordinated financial support from other parties. FIN 46 provides guidance on how to determine when and which business enterprise (the ‘primary beneficiary’) should consolidate the VIE. In addition, FIN 46 requires that both the primary beneficiary and all other enterprises with a significant variable interest in a VIE make additional disclosures.
The disclosure provisions of FIN 46 are effective in all financial statements initially issued after 31 January 2003. FIN 46 is required to be immediately applied by all entities with a variable interest in a VIE created after 31 January 2003. A public foreign private issuer with a variable interest in a VIE created before 1 February 2003 is required to apply FIN 46 to that entity from 1 April 2004.
There have been no entities created since 31 January 2003 which fall within the scope of FIN 46 and therefore the application of FIN 46 has not had any material impact on the results or the financial condition of the Group. The impact of FIN 46 on future results is still being assessed in respect of the as yet unapplied provisions of the standard.
In May 2003, the FASB issued FAS 150. This statement establishes standards for how an issuer classifies and measures certain financial instruments with characteristics of both liabilities and equity. It requires that certain obligations that could be settled by issuance of an entity’s equity but lack other characteristics of equity be reported as liabilities. Some provisions of this statement are consistent with the FASB’s proposal to revise the definition of liabilities in FASB Concepts Statement 6 ‘Elements of Financial Statements’. This statement was effective beginning 1 July 2003. On 7 November 2003, FASB Staff Position (FSP) FAS 150-3 was issued deferring the effective date for the measurement provisions of paragraphs 9 and 10 of FAS 150, as they apply to mandatorily redeemable non-controlling interests (eg minority interest in finite-lived entities). The FSP indicated, however, that the disclosure requirements of FAS 150 continue to apply. The Group has adopted the effective provisions of FAS 150 in the current year without material impact on results of operations or financial position.
Recent US pronouncements
In January 2004, the FASB issued FSP FAS 106-1 ‘Accounting and Disclosure Requirements Related to Medicare Prescription Drug, Improvement and Modernization Act of 2003 (the ‘Act’)’. This FSP addresses the accounting implications of the newly issued Act to an entity that sponsors a post-retirement healthcare plan that provides prescription drug benefits. This Act, signed into law in December 2003 in the US, introduces a prescription drug benefit under Medicare as well as a Federal subsidy to sponsors of certain retiree healthcare benefit plans. The FSP includes an election to defer accounting for the implications of this new law until specific authoritative guidance to address the accounting treatment has been issued. As such, as a result of the lack of the existence of such guidance, any measures included in these accounts of the accumulated post-retirement benefit obligation (APBO) or net periodic post-retirement benefit cost in the accounts or accompanying notes do not reflect the effect of the Act on the plan. Authoritative guidance, when issued, could require a change in previously reported information.
33. Transco plc additional US GAAP disclosures
The following condensed consolidating financial information, comprising income statements, balance sheets and cash flow statements, is given in respect of Transco plc (‘Subsidiary Guarantor’), which became joint full and unconditional guarantor on 11 May 2004 with National Grid Transco plc (‘Parent Guarantor’) of the 6.625% Guaranteed Notes due 2018 issued in June 1998 by British Transco Finance Inc. (then known as British Gas Finance Inc.) (‘Issuer of notes’). Transco plc and British Transco Finance Inc. are wholly-owned subsidiaries of National Grid Transco Group.
The following financial information for National Grid Transco plc, Transco plc and British Transco Finance Inc. on a condensed consolidating basis is intended to provide investors with meaningful and comparable financial information and is provided pursuant to Rule 3-10 of Regulation S-X in lieu of the separate financial statements of each subsidiary issuer of public debt securities.
Summary income statements are presented, on a consolidating basis, for the three years ended 31 March 2004. Summary income statements of National Grid Transco plc and Transco plc are presented under UK and US GAAP measurement principles, as modified by the inclusion of the results of subsidiary undertakings on the basis of equity accounting principles.
The summary balance sheets of National Grid Transco plc and Transco plc include the investments in subsidiaries recorded under the equity method for the purposes of presenting condensed consolidating financial information under UK and US GAAP. The UK GAAP balance sheet presents these investments as ‘Net assets of subsidiaries (equity accounted)’. The US GAAP summary balance sheet presents these investments within ‘Investments’.
The consolidation adjustments column includes the necessary amounts to eliminate the inter-company balances and transactions between National Grid Transco plc, Transco plc, British Transco Finance Inc. and other subsidiaries.
Transco plc and British Transco Finance Inc. were treated as acquired (as part of the Lattice acquisition) under US GAAP. As a consequence, under US GAAP, their results only feature in the following tables for the period after acquisition on 21 October 2002. There are no results under US GAAP for these or other Lattice entities reflected in the following tables for the year ended 31 March 2002; where appropriate this is indicated by ‘n/a’. In contrast, under UK GAAP, results are presented for these entities for all periods as these entities have been accounted for under merger accounting principles.
Annual Report and Accounts 2003/04_National Grid Transco 120
Back to Contents
Notes to the Accounts_continued
33. Transco plc additional US GAAP disclosures (continued)
Summary income statement for the twelve months to 31 March 2004 – UK GAAP
| | Parent | | | Issuer of | | | Subsidiary | | | | | | | | | | |
| Guarantor | notes | Guarantor | | | |
| |
| | |
| | |
| | | | | | | | | | |
| | National | | | British | | | | | | | | | | | | National | |
| Grid | Transco | | Other | Consolidation | Grid Transco |
| Transco plc | Finance Inc. | Transco plc | subsidiaries | adjustments | Group |
| £m | £m | £m | £m | £m | £m |
|
|
|
|
|
|
|
|
|
|
|
|
|
|
|
|
| |
| Turnover | – | | | – | | | 3,194 | | | 6,310 | | | (471 | ) | | 9,033 | |
| Operating costs | | | | | | | | | | | | | | | | | |
| Depreciation | – | | | – | | | (423 | ) | | (443 | ) | | – | | | (866 | ) |
| Payroll costs | – | | | – | | | (392 | ) | | (628 | ) | | – | | | (1,020 | ) |
| Purchases of electricity | – | | | – | | | – | | | (1,998 | ) | | – | | | (1,998 | ) |
| Purchases of gas | – | | | – | | | (86 | ) | | (285 | ) | | – | | | (371 | ) |
| Rates and property taxes | – | | | – | | | (238 | ) | | (278 | ) | | – | | | (516 | ) |
| Electricity transmission services scheme direct costs | – | | | – | | | – | | | (277 | ) | | – | | | (277 | ) |
| EnMO direct costs | – | | | – | | | – | | | (158 | ) | | – | | | (158 | ) |
| Replacement expenditure | – | | | – | | | (388 | ) | | – | | | – | | | (388 | ) |
| Provisions for doubtful debts | – | | | – | | | 2 | | | (64 | ) | | – | | | (62 | ) |
| Other operating charges (including exceptional items) | (13 | ) | | – | | | (634 | ) | | (1,343 | ) | | 468 | | | (1,522 | ) |
| | (13 | ) | | – | | | (2,159 | ) | | (5,474 | ) | | 468 | | | (7,178 | ) |
|
|
|
|
|
|
|
|
|
|
|
|
|
|
|
|
| |
| Operating profit | (13 | ) | | – | | | 1,035 | | | 836 | | | (3 | ) | | 1,855 | |
| Share of joint ventures’ operating profit | – | | | – | | | – | | | 7 | | | – | | | 7 | |
| Non-operating exceptional items | – | | | – | | | – | | | 322 | | | – | | | 322 | |
|
|
|
|
|
|
|
|
|
|
|
|
|
|
|
|
| |
| Profit before interest and taxation | (13 | ) | | – | | | 1,035 | | | 1,165 | | | (3 | ) | | 2,184 | |
| Net interest | (17 | ) | | – | | | (304 | ) | | (501 | ) | | – | | | (822 | ) |
| Dividends receivable | – | | | – | | | – | | | 70 | | | (70 | ) | | – | |
|
|
|
|
|
|
|
|
|
|
|
|
|
|
|
|
| |
| Profit on ordinary activities before taxation | (30 | ) | | – | | | 731 | | | 734 | | | (73 | ) | | 1,362 | |
| Taxation | 13 | | | – | | | (184 | ) | | (90 | ) | | – | | | (261 | ) |
|
|
|
|
|
|
|
|
|
|
|
|
|
|
|
|
| |
| Profit on ordinary activities after taxation | (17 | ) | | – | | | 547 | | | 644 | | | (73 | ) | | 1,101 | |
| Minority interests | – | | | – | | | – | | | (2 | ) | | – | | | (2 | ) |
| Interest in group undertakings on an equity accounted basis | 1,116 | | | – | | | 11 | | | – | | | (1,127 | ) | | – | |
|
|
|
|
|
|
|
|
|
|
|
|
|
|
|
|
| |
| Net income for the year | 1,099 | | | – | (i) | | 558 | | | 642 | | | (1,200 | ) | | 1,099 | |
|
|
|
|
|
|
|
|
|
|
|
|
|
|
|
|
| |
Summary income statement for the twelve months to 31 March 2004 – US GAAP
| | Parent | | | Issuer of | | | Subsidiary | | | | | | | | | | |
| | Guarantor | | | notes | | | Guarantor | | | | | | | | | | |
| |
| | |
| | |
| | | | | | | | | | |
| | National | | | British | | | | | | | | | | | | National | |
| | Grid | | | Transco | | | | | | Other | | | Consolidation | | | Grid Transco | |
| | Transco plc | | | Finance Inc. | | | Transco plc | | | subsidiaries | | | adjustments | | | Group | |
| | £m | | | £m | | | £m | | | £m | | | £m | | | £m | |
|
|
|
|
|
|
|
|
|
|
|
|
|
|
|
|
| |
| Turnover | – | | | – | | | 3,186 | | | 6,151 | | | (471 | ) | | 8,866 | |
| Operating costs | | | | | | | | | | | | | | | | | |
| Depreciation | – | | | – | | | (726 | ) | | (438 | ) | | – | | | (1,164 | ) |
| Payroll and severance costs | – | | | – | | | (484 | ) | | (813 | ) | | – | | | (1,297 | ) |
| Purchases of electricity | – | | | – | | | – | | | (1,998 | ) | | – | | | (1,998 | ) |
| Purchases of gas | – | | | – | | | (86 | ) | | (285 | ) | | – | | | (371 | ) |
| Rates and property taxes | – | | | – | | | (238 | ) | | (278 | ) | | – | | | (516 | ) |
| Electricity transmission services scheme direct costs | – | | | – | | | – | | | (277 | ) | | – | | | (277 | ) |
| Provision for doubtful debts | – | | | – | | | 2 | | | (64 | ) | | – | | | (62 | ) |
| Other operating charges | (13 | ) | | – | | | (553 | ) | | (1,161 | ) | | 468 | | | (1,259 | ) |
| | (13 | ) | | – | | | (2,085 | ) | | (5,314 | ) | | 468 | | | (6,944 | ) |
|
|
|
|
|
|
|
|
|
|
|
|
|
|
|
|
| |
| Operating profit | (13 | ) | | – | | | 1,101 | | | 837 | | | (3 | ) | | 1,922 | |
| Non-operating expenses | – | | | – | | | – | | | 32 | | | – | | | 32 | |
|
|
|
|
|
|
|
|
|
|
|
|
|
|
|
|
| |
| Profit before interest and taxation | (13 | ) | | – | | | 1,101 | | | 869 | | | (3 | ) | | 1,954 | |
| Net interest | (34 | ) | | – | | | (365 | ) | | (273 | ) | | – | | | (672 | ) |
| Dividends receivable | – | | | – | | | – | | | 70 | | | (70 | ) | | – | |
|
|
|
|
|
|
|
|
|
|
|
|
|
|
|
|
| |
| Profit on ordinary activities before taxation | (47 | ) | | – | | | 736 | | | 666 | | | (73 | ) | | 1,282 | |
| Taxation | 18 | | | – | | | (189 | ) | | (111 | ) | | – | | | (282 | ) |
|
|
|
|
|
|
|
|
|
|
|
|
|
|
|
|
| |
| Profit on ordinary activities after taxation | (29 | ) | | – | | | 547 | | | 555 | | | (73 | ) | | 1,000 | |
| Minority interests | – | | | – | | | – | | | (2 | ) | | – | | | (2 | ) |
| Interest in equity accounted affiliates | 1,027 | | | – | | | 64 | | | – | | | (1,091 | ) | | – | |
|
|
|
|
|
|
|
|
|
|
|
|
|
|
|
|
| |
| Net income from continuing operations | 998 | | | – | | | 611 | | | 553 | | | (1,164 | ) | | 998 | |
| Net loss from discontinued operations | – | | | – | | | – | | | – | | | – | | | – | |
|
|
|
|
|
|
|
|
|
|
|
|
|
|
|
|
| |
| Net income for the year | 998 | | | – | (i) | | 611 | | | 553 | | | (1,164 | ) | | 998 | |
|
|
|
|
|
|
|
|
|
|
|
|
|
|
|
|
| |
| (i) | Net income for the year for British Gas Transco Finance Inc. is £nil as interest payable to external bondholders is offset by interest receivable on loans to Transco plc. |
121 National Grid Transco_Annual Report and Accounts 2003/04
Back to Contents
Notes to the Accounts_continued
33. Transco plc additional US GAAP disclosures (continued)
Summary income statement for the twelve months to 31 March 2003 – UK GAAP
| | Parent | | | Issuer of | | | Subsidiary | | | | | | | | | | |
| | Guarantor | | | notes | | | Guarantor | | | | | | | | | | |
| |
| | |
| | |
| | | | | | | | | | |
| | National | | | British | | | | | | | | | | | | National | |
| | Grid | | | Transco | | | | | | Other | | | Consolidation | | | Grid Transco | |
| | Transco plc | | | Finance Inc. | | | Transco plc | | | subsidiaries | | | adjustments | | | Group | |
| | £m | | | £m | | | £m | | | £m | | | £m | | | £m | |
|
|
|
|
|
|
|
|
|
|
|
|
|
|
|
|
| |
| Turnover | – | | | – | | | 3,083 | | | 6,764 | | | (447 | ) | | 9,400 | |
| Operating costs | | | | | | | | | | | | | | | | | |
| Depreciation | – | | | – | | | (385 | ) | | (466 | ) | | – | | | (851 | ) |
| Payroll costs | – | | | – | | | (432 | ) | | (675 | ) | | – | | | (1,107 | ) |
| Purchases of electricity | – | | | – | | | – | | | (1,901 | ) | | – | | | (1,901 | ) |
| Purchases of gas | – | | | – | | | (108 | ) | | (249 | ) | | – | | | (357 | ) |
| Rates and property taxes | – | | | – | | | (235 | ) | | (302 | ) | | – | | | (537 | ) |
| Electricity transmission services scheme direct costs | – | | | – | | | – | | | (252 | ) | | – | | | (252 | ) |
| EnMO direct costs | – | | | – | | | – | | | (530 | ) | | – | | | (530 | ) |
| Replacement expenditure | – | | | – | | | (405 | ) | | – | | | – | | | (405 | ) |
| Provision for doubtful debts | – | | | – | | | (4 | ) | | (20 | ) | | – | | | (24 | ) |
| Other operating charges (including exceptional items) | (21 | ) | | – | | | (735 | ) | | (1,518 | ) | | 450 | | | (1,824 | ) |
| | (21 | ) | | – | | | (2,304 | ) | | (5,913 | ) | | 450 | | | (7,788 | ) |
|
|
|
|
|
|
|
|
|
|
|
|
|
|
|
|
| |
| Operating profit | (21 | ) | | – | | | 779 | | | 851 | | | 3 | | | 1,612 | |
| Share of joint ventures’ operating profit | – | | | – | | | – | | | 124 | | | – | | | 124 | |
| Non-operating exceptional items | (32 | ) | | – | | | (12 | ) | | (51 | ) | | (4 | ) | | (99 | ) |
|
|
|
|
|
|
|
|
|
|
|
|
|
|
|
|
| |
| Profit before interest and taxation | (53 | ) | | – | | | 767 | | | 924 | | | (1 | ) | | 1,637 | |
| Net interest | 21 | | | – | | | (343 | ) | | (648 | ) | | – | | | (970 | ) |
| Dividends receivable | – | | | – | | | – | | | 244 | | | (244 | ) | | – | |
|
|
|
|
|
|
|
|
|
|
|
|
|
|
|
|
| |
| Profit on ordinary activities before taxation | (32 | ) | | – | | | 424 | | | 520 | | | (245 | ) | | 667 | |
| Taxation | (5 | ) | | – | | | (140 | ) | | (100 | ) | | – | | | (245 | ) |
|
|
|
|
|
|
|
|
|
|
|
|
|
|
|
|
| |
| Profit on ordinary activities after taxation | (37 | ) | | – | | | 284 | | | 420 | | | (245 | ) | | 422 | |
| Minority interests | – | | | – | | | – | | | (31 | ) | | – | | | (31 | ) |
| Interest in group undertakings on an equity accounted basis | 428 | | | – | | | 23 | | | – | | | (451 | ) | | – | |
|
|
|
|
|
|
|
|
|
|
|
|
|
|
|
|
| |
| Net income for the year | 391 | | | – | (i) | | 307 | | | 389 | | | (696 | ) | | 391 | |
|
|
|
|
|
|
|
|
|
|
|
|
|
|
|
|
| |
Summary income statement for the twelve months to 31 March 2003 – US GAAP
| | Parent | | | Issuer of | | | Subsidiary | | | | | | | | | | |
| | Guarantor | | | notes | | | Guarantor | | | | | | | | | | |
| |
| | |
| | |
| | | | | | | | | | |
| | National | | | British | | | | | | | | | | | | National | |
| | Grid | | | Transco | | | | | | Other | | | Consolidation | | | Grid Transco | |
| | Transco plc | | | Finance Inc. | | | Transco plc | | | subsidiaries | | | adjustments | | | Group | |
| | £m | | | £m | | | £m | | | £m | | | £m | | | £m | |
|
|
|
|
|
|
|
|
|
|
|
|
|
|
|
|
| |
| Turnover | – | | | – | | | 1,673 | | | 5,945 | | | (217 | ) | | 7,401 | |
| Operating costs | | | | | | | | | | | | | | | | | |
| Depreciation | – | | | – | | | (311 | ) | | (420 | ) | | – | | | (731 | ) |
| Payroll and severance costs | – | | | – | | | (191 | ) | | (913 | ) | | – | | | (1,104 | ) |
| Purchases of electricity | – | | | – | | | – | | | (1,901 | ) | | – | | | (1,901 | ) |
| Purchases of gas | – | | | – | | | (56 | ) | | (248 | ) | | – | | | (304 | ) |
| Rates and property taxes | – | | | – | | | (105 | ) | | (302 | ) | | – | | | (407 | ) |
| Electricity transmission services scheme direct costs | – | | | – | | | – | | | (252 | ) | | – | | | (252 | ) |
| Provision for doubtful debts | – | | | – | | | (3 | ) | | (20 | ) | | – | | | (23 | ) |
| Other operating charges | (21 | ) | | – | | | (298 | ) | | (864 | ) | | 221 | | | (962 | ) |
| | (21 | ) | | – | | | (964 | ) | | (4,920 | ) | | 221 | | | (5,684 | ) |
|
|
|
|
|
|
|
|
|
|
|
|
|
|
|
|
| |
| Operating profit | (21 | ) | | – | | | 709 | | | 1,025 | | | 4 | | | 1,717 | |
| Non-operating expenses | (32 | ) | | – | | | (10 | ) | | 37 | | | – | | | (5 | ) |
|
|
|
|
|
|
|
|
|
|
|
|
|
|
|
|
| |
| Profit before interest and taxation | (53 | ) | | – | | | 699 | | | 1,062 | | | 4 | | | 1,712 | |
| Net interest | 21 | | | – | | | (97 | ) | | (588 | ) | | – | | | (664 | ) |
| Dividends receivable | – | | | – | | | – | | | 120 | | | (120 | ) | | – | |
|
|
|
|
|
|
|
|
|
|
|
|
|
|
|
|
| |
| Profit on ordinary activities before taxation | (32 | ) | | – | | | 602 | | | 594 | | | (116 | ) | | 1,048 | |
| Taxation | (5 | ) | | – | | | (193 | ) | | (60 | ) | | – | | | (258 | ) |
|
|
|
|
|
|
|
|
|
|
|
|
|
|
|
|
| |
| Profit on ordinary activities after taxation | (37 | ) | | – | | | 409 | | | 534 | | | (116 | ) | | 790 | |
| Minority interests | – | | | – | | | – | | | (3 | ) | | – | | | (3 | ) |
| Interest in equity accounted affiliates | 788 | | | – | | | 17 | | | 3 | | | (805 | ) | | 3 | |
|
|
|
|
|
|
|
|
|
|
|
|
|
|
|
|
| |
| Net income from continuing operations | 751 | | | – | | | 426 | | | 534 | | | (921 | ) | | 790 | |
| Net loss from discontinued operations | – | | | – | | | – | | | (39 | ) | | – | | | (39 | ) |
|
|
|
|
|
|
|
|
|
|
|
|
|
|
|
|
| |
| Net income for the year | 751 | | | – | (i) | | 426 | | | 495 | | | (921 | ) | | 751 | |
|
|
|
|
|
|
|
|
|
|
|
|
|
|
|
|
| |
| (i) | Net income for the year for British Gas Transco Finance Inc. is £nil as interest payable to external bondholders is offset by interest receivable on loans to Transco plc. |
Annual Report and Accounts 2003/04_National Grid Transco 122
Back to Contents
Notes to the Accounts_continued
33. Transco plc additional US GAAP disclosures (continued)
Summary income statement for the twelve months to 31 March 2002 – UK GAAP
| | Parent | | | Issuer of | | | Subsidiary | | | | | | | | | | |
| | Guarantor | | | notes | | | Guarantor | | | | | | | | | | |
| |
| | |
| | |
| | | | | | | | | | |
| | National | | | British | | | | | | | | | | | | National | |
| | Grid | | | Transco | | | | | | Other | | | Consolidation | | | Grid Transco | |
| | Transco plc | | | Finance Inc. | | | Transco plc | | | subsidiaries | | | adjustments | | | Group | |
| | £m | | | £m | | | £m | | | £m | | | £m | | | £m | |
|
|
|
|
|
|
|
|
|
|
|
|
|
|
|
|
| |
| Turnover | – | | | – | | | 2,994 | | | 4,800 | | | (240 | ) | | 7,554 | |
| Operating costs | | | | | | | | | | | | | | | | | |
| Depreciation | – | | | – | | | (371 | ) | | (379 | ) | | – | | | (750 | ) |
| Payroll costs | – | | | – | | | (466 | ) | | (480 | ) | | – | | | (946 | ) |
| Purchases of electricity | – | | | – | | | – | | | (1,410 | ) | | – | | | (1,410 | ) |
| Purchases of gas | – | | | – | | | (112 | ) | | (59 | ) | | – | | | (171 | ) |
| Rates and property taxes | – | | | – | | | (231 | ) | | (193 | ) | | – | | | (424 | ) |
| Electricity transmission services scheme direct costs | – | | | – | | | – | | | (204 | ) | | – | | | (204 | ) |
| EnMO direct costs | – | | | – | | | – | | | (395 | ) | | – | | | (395 | ) |
| Replacement expenditure | – | | | – | | | (368 | ) | | – | | | – | | | (368 | ) |
| Provision for doubtful debts | – | | | – | | | 3 | | | (26 | ) | | – | | | (23 | ) |
| Other operating charges (including exceptional items) | (78 | ) | | – | | | (610 | ) | | (1,351 | ) | | 236 | | | (1,803 | ) |
| | (78 | ) | | – | | | (2,155 | ) | | (4,497 | ) | | 236 | | | (6,494 | ) |
|
|
|
|
|
|
|
|
|
|
|
|
|
|
|
|
| |
| Operating profit | (78 | ) | | – | | | 839 | | | 303 | | | (4 | ) | | 1,060 | |
| Share of joint ventures’ and associate’s operating profit/(loss) | – | | | – | | | – | | | (701 | ) | | – | | | (701 | ) |
| Non-operating exceptional items | – | | | – | | | 11 | | | 128 | | | 17 | | | 156 | |
|
|
|
|
|
|
|
|
|
|
|
|
|
|
|
|
| |
| Profit before interest and taxation | (78 | ) | | – | | | 850 | | | (270 | ) | | 13 | | | 515 | |
| Net interest | (8 | ) | | – | | | (355 | ) | | (436 | ) | | – | | | (799 | ) |
| Dividends receivable | – | | | – | | | – | | | 352 | | | (352 | ) | | – | |
|
|
|
|
|
|
|
|
|
|
|
|
|
|
|
|
| |
| Profit on ordinary activities before taxation | (86 | ) | | – | | | 495 | | | (354 | ) | | (339 | ) | | (284 | ) |
| Taxation | 3 | | | – | | | (149 | ) | | 61 | | | – | | | (85 | ) |
|
|
|
|
|
|
|
|
|
|
|
|
|
|
|
|
| |
| Profit on ordinary activities after taxation | (83 | ) | | – | | | 346 | | | (293 | ) | | (339 | ) | | (369 | ) |
| Minority interests | – | | | – | | | – | | | 48 | | | – | | | 48 | |
| Interest in group undertakings on an equity accounted basis | (238 | ) | | – | | | 15 | | | – | | | 223 | | | – | |
|
|
|
|
|
|
|
|
|
|
|
|
|
|
|
|
| |
| Net loss for the year | (321 | ) | | – | (i) | 361 | | | (245 | ) | | (116 | ) | | (321 | ) |
|
|
|
|
|
|
|
|
|
|
|
|
|
|
|
|
| |
| (i) | Net income for the year for British Gas Transco Finance Inc. is £nil as interest payable to external bondholders is offset by interest receivable on loans to Transco plc. |
Summary income statement for the twelve months to 31 March 2002 – US GAAP
| | Parent | | | Issuer of | | | Subsidiary | | | | | | | | | | |
| | Guarantor | | | notes | | | Guarantor | | | | | | | | | | |
| |
| | |
| | |
| | | | | | | | | | |
| | National | | | British | | | | | | | | | | | | National | |
| | Grid | | | Transco | | | | | | Other | | | Consolidation | | | Grid Transco | |
| | Transco plc | | | Finance Inc. | | | Transco plc | | | subsidiaries | | | adjustments | | | Group | |
| | £m | | | £m | | | £m | | | £m | | | £m | | | £m | |
|
|
|
|
|
|
|
|
|
|
|
|
|
|
|
|
| |
| Turnover | – | | | n/a | | | n/a | | | 4,004 | | | – | | | 4,004 | |
| Operating costs | | | | | | | | | | | | | | | | | |
| Depreciation | – | | | n/a | | | n/a | | | (316 | ) | | – | | | (316 | ) |
| Payroll and severance costs | – | | | n/a | | | n/a | | | (417 | ) | | – | | | (417 | ) |
| Purchases of electricity | – | | | n/a | | | n/a | | | (1,410 | ) | | – | | | (1,410 | ) |
| Purchases of gas | – | | | n/a | | | n/a | | | (58 | ) | | – | | | (58 | ) |
| Rates and property taxes | – | | | n/a | | | n/a | | | (197 | ) | | – | | | (197 | ) |
| Electricity transmission services scheme direct costs | – | | | n/a | | | n/a | | | (204 | ) | | – | | | (204 | ) |
| Provision for doubtful debts | – | | | n/a | | | n/a | | | (26 | ) | | – | | | (26 | ) |
| Other operating charges | (78 | ) | | n/a | | | n/a | | | (431 | ) | | – | | | (509 | ) |
| | (78 | ) | | n/a | | | n/a | | | (3,059 | ) | | – | | | (3,137 | ) |
|
|
|
|
|
|
|
|
|
|
|
|
|
|
|
|
| |
| Operating profit | (78 | ) | | n/a | | | n/a | | | 945 | | | – | | | 867 | |
| Non-operating expenses | – | | | n/a | | | n/a | | | 22 | | | – | | | 22 | |
|
|
|
|
|
|
|
|
|
|
|
|
|
|
|
|
| |
| Profit before interest and taxation | (78 | ) | | n/a | | | n/a | | | 967 | | | – | | | 889 | |
| Net interest | (8 | ) | | n/a | | | n/a | | | (118 | ) | | – | | | (126 | ) |
|
|
|
|
|
|
|
|
|
|
|
|
|
|
|
|
| |
| Profit on ordinary activities before taxation | (86 | ) | | n/a | | | n/a | | | 849 | | | – | | | 763 | |
| Taxation | 3 | | | n/a | | | n/a | | | (16 | ) | | – | | | (13 | ) |
|
|
|
|
|
|
|
|
|
|
|
|
|
|
|
|
| |
| Profit on ordinary activities after taxation | (83 | ) | | n/a | | | n/a | | | 833 | | | – | | | 750 | |
| Minority interests | – | | | n/a | | | n/a | | | (2 | ) | | – | | | (2 | ) |
| Interest in equity accounted affiliates | (84 | ) | | n/a | | | n/a | | | (900 | ) | | 84 | | | (900 | ) |
|
|
|
|
|
|
|
|
|
|
|
|
|
|
|
|
| |
| Net loss from continuing operations | (167 | ) | | n/a | | | n/a | | | (69 | ) | | 84 | | | (152 | ) |
| Net loss from discontinued operations | – | | | n/a | | | n/a | | | (1 | ) | | – | | | (1 | ) |
|
|
|
|
|
|
|
|
|
|
|
|
|
|
|
|
| |
| Net loss before cumulative effects of changes in accounting principles | (167 | ) | | n/a | | | n/a | | | (70 | ) | | 84 | | | (153 | ) |
Cumulative effects of changes in accounting principles (FAS 133
transitional adjustment) | – | | | n/a | | | n/a | | | (14 | ) | | – | | | (14 | ) |
|
|
|
|
|
|
|
|
|
|
|
|
|
|
|
|
| |
| Net loss for the year | (167 | ) | | n/a | | | n/a | | | (84 | ) | | 84 | | | (167 | ) |
|
|
|
|
|
|
|
|
|
|
|
|
|
|
|
|
| |
123 National Grid Transco_Annual Report and Accounts 2003/04
Back to Contents
Notes to the Accounts_continued
33. Transco plc additional US GAAP disclosures (continued)
Balance sheet as at 31 March 2004 – UK GAAP
| | Parent | | | Issuer of | | | Subsidiary | | | | | | | | | | |
| | Guarantor | | | notes | | | Guarantor | | | | | | | | | | |
| |
| | |
| | |
| | | | | | | | | | |
| | National | | | British | | | | | | | | | | | | National | |
| | Grid | | | Transco | | | | | | Other | | | Consolidation | | | Grid Transco | |
| | Transco plc | | | Finance Inc. | | | Transco plc | | | subsidiaries | | | adjustments | | | Group | |
| | £m | | | £m | | | £m | | | £m | | | £m | | | £m | |
|
|
|
|
|
|
|
|
|
|
|
|
|
|
|
|
| |
| Fixed assets | | | | | | | | | | | | | | | | | |
| Intangible assets | – | | | – | | | – | | | 1,537 | | | – | | | 1,537 | |
| Tangible assets | – | | | – | | | 7,880 | | | 8,829 | | | (3 | ) | | 16,706 | |
| Investments | – | | | – | | | – | | | 7,303 | | | (7,152 | ) | | 151 | |
| Net assets of subsidiaries (equity accounted) | 526 | | | – | | | 22 | | | – | | | (548 | ) | | – | |
|
|
|
|
|
|
|
|
|
|
|
|
|
|
|
|
| |
| | 526 | | | – | | | 7,902 | | | 17,669 | | | (7,703 | ) | | 18,394 | |
|
|
|
|
|
|
|
|
|
|
|
|
|
|
|
|
| |
| Current assets | | | | | | | | | | | | | | | | | |
| Stocks | – | | | – | | | 32 | | | 59 | | | – | | | 91 | |
| Debtors (amounts falling due within one year) | 3,884 | | | – | | | 292 | | | 4,291 | | | (6,879 | ) | | 1,588 | |
| Debtors (amounts falling due after one year) | – | | | 168 | | | 2,544 | | | 3,792 | | | (3,796 | ) | | 2,708 | |
| Current asset investments | 6 | | | – | | | 264 | | | 440 | | | (190 | ) | | 520 | |
| Cash at bank and in hand | – | | | 1 | | | – | | | 95 | | | – | | | 96 | |
|
|
|
|
|
|
|
|
|
|
|
|
|
|
|
|
| |
| | 3,890 | | | 169 | | | 3,132 | | | 8,677 | | | (10,865 | ) | | 5,003 | |
| Creditors (amounts falling due within one year) | | | | | | | | | | | | | | | | | |
| Borrowings | (388 | ) | | – | | | (861 | ) | | (947 | ) | | 490 | | | (1,706 | ) |
| Other creditors | (2,056 | ) | | (4 | ) | | (1,801 | ) | | (5,286 | ) | | 6,340 | | | (2,807 | ) |
| | (2,444 | ) | | (4 | ) | | (2,662 | ) | | (6,233 | ) | | 6,830 | | | (4,513 | ) |
|
|
|
|
|
|
|
|
|
|
|
|
|
|
|
|
| |
| Net current assets/(liabilities) | 1,446 | | | 165 | | | 470 | | | 2,444 | | | (4,035 | ) | | 490 | |
|
|
|
|
|
|
|
|
|
|
|
|
|
|
|
|
| |
| Total assets less current liabilities | 1,972 | | | 165 | | | 8,372 | | | 20,113 | | | (11,738 | ) | | 18,884 | |
| | | | | | | | | | | | | | | | | | |
| Creditors (amounts falling due after more than one year) | | | | | | | | | | | | | | | | | |
| Borrowings | (746 | ) | | (165 | ) | | (2,768 | ) | | (8,103 | ) | | 240 | | | (11,542 | ) |
| Other creditors | (13 | ) | | – | | | (2,111 | ) | | (3,593 | ) | | 3,795 | | | (1,922 | ) |
| | (759 | ) | | (165 | ) | | (4,879 | ) | | (11,696 | ) | | 4,035 | | | (13,464 | ) |
| Provisions for liabilities and charges | – | | | – | | | (1,356 | ) | | (2,801 | ) | | – | | | (4,157 | ) |
|
|
|
|
|
|
|
|
|
|
|
|
|
|
|
|
| |
| Net assets employed | 1,213 | | | – | | | 2,137 | | | 5,616 | | | (7,703 | ) | | 1,263 | |
|
|
|
|
|
|
|
|
|
|
|
|
|
|
|
|
| |
| Capital and reserves | | | | | | | | | | | | | | | | | |
| Called up share capital | 309 | | | – | | | 45 | | | 540 | | | (585 | ) | | 309 | |
| Share premium account | 1,280 | | | – | | | 204 | | | 1,557 | | | (1,761 | ) | | 1,280 | |
| Other reserves | (5,131 | ) | | – | | | 1,332 | | | (181 | ) | | (1,151 | ) | | (5,131 | ) |
| Profit and loss account | 4,755 | | | – | | | 556 | | | 3,650 | | | (4,206 | ) | | 4,755 | |
|
|
|
|
|
|
|
|
|
|
|
|
|
|
|
|
| |
| Equity shareholders’ funds | 1,213 | | | – | | | 2,137 | | | 5,566 | | | (7,703 | ) | | 1,213 | |
| Minority interests | | | | | | | | | | | | | | | | | |
| Equity | – | | | – | | | – | | | 12 | | | – | | | 12 | |
| Non–equity | – | | | – | | | – | | | 38 | | | – | | | 38 | |
| | – | | | – | | | – | | | 50 | | | – | | | 50 | |
|
|
|
|
|
|
|
|
|
|
|
|
|
|
|
|
| |
| | 1,213 | | | – | | | 2,137 | | | 5,616 | | | (7,703 | ) | | 1,263 | |
|
|
|
|
|
|
|
|
|
|
|
|
|
|
|
|
| |
Annual Report and Accounts 2003/04_National Grid Transco 124
Back to Contents
Notes to the Accounts_continued
33. Transco plc additional US GAAP disclosures (continued)
Balance sheet as at 31 March 2004 – US GAAP
| | Parent | | Issuer of | | Subsidiary | | | | | | | |
| | Guarantor | | notes | | Guarantor | | | | | | | |
| |
| |
| |
| | | | | | | |
| | National | | British | | | | | | | | National | |
| | Grid | | Transco | | | | Other | | Consolidation | | Grid Transco | |
| | Transco plc | | Finance Inc. | | Transco plc | | subsidiaries | | adjustments | | Group | |
| | £m | | £m | | £m | | £m | | £m | | £m | |
|
|
|
|
|
|
|
|
|
|
|
| |
| Assets | | | | | | | | | | | | |
| Current assets | | | | | | | | | | | | |
| Cash and cash equivalents | 6 | | 1 | | 264 | | 447 | | (190 | ) | 528 | |
| Marketable securities | – | | – | | – | | 102 | | – | | 102 | |
| Accounts and notes receivable | – | | – | | 16 | | 480 | | – | | 496 | |
| Inventories | – | | – | | 32 | | 59 | | – | | 91 | |
| Amounts owed by Group undertakings | 3,883 | | – | | 22 | | 2,430 | | (6,335 | ) | – | |
| Regulatory assets | – | | – | | – | | 512 | | – | | 512 | |
| Prepaid expenses and other current assets | 1 | | – | | 254 | | 395 | | (54 | ) | 596 | |
|
|
|
|
|
|
|
|
|
|
|
| |
| Total current assets | 3,890 | | 1 | | 588 | | 4,425 | | (6,579 | ) | 2,325 | |
| Property, plant and equipment | – | | – | | 13,785 | | 9,343 | | (3 | ) | 23,125 | |
| Goodwill | – | | – | | 3,746 | | 1,859 | | – | | 5,605 | |
| Intangible assets | – | | – | | – | | 50 | | – | | 50 | |
| Investments | 8,851 | | – | | (94 | ) | 9,881 | | (18,483 | ) | 155 | |
| Amounts owed by Group undertakings | – | | 161 | | 2,544 | | 1,084 | | (3,789 | ) | – | |
| Regulatory assets | – | | – | | – | | 3,136 | | – | | 3,136 | |
| Other debtors | 161 | | – | | 196 | | 629 | | (35 | ) | 951 | |
|
|
|
|
|
|
|
|
|
|
|
| |
| Total assets | 12,902 | | 162 | | 20,765 | | 30,407 | | (28,889 | ) | 35,347 | |
|
|
|
|
|
|
|
|
|
|
|
| |
| Liabilities and shareholders’ equity | | | | | | | | | | | | |
| Current liabilities | | | | | | | | | | | | |
| Bank overdrafts | – | | – | | 6 | | 20 | | – | | 26 | |
| Accounts payable | – | | – | | 406 | | 630 | | – | | 1,036 | |
| Short-term borrowings | 389 | | – | | 856 | | 399 | | – | | 1,644 | |
| Accrued income taxes | – | | – | | 176 | | – | | (54 | ) | 122 | |
| Purchased power obligations | – | | – | | – | | 57 | | – | | 57 | |
| Liability for index-linked swap contracts | – | | – | | – | | 100 | | – | | 100 | |
| Amounts owed to Group undertakings | 1,680 | | – | | 750 | | 3,856 | | (6,286 | ) | – | |
| Other accrued liabilities | 127 | | 4 | | 561 | | 787 | | (77 | ) | 1,402 | |
|
|
|
|
|
|
|
|
|
|
|
| |
| Total current liabilities | 2,196 | | 4 | | 2,755 | | 5,849 | | (6,417 | ) | 4,387 | |
| Long-term borrowings | 872 | | 158 | | 2,894 | | 8,572 | | (240 | ) | 12,256 | |
| Amounts owed to Group undertakings | – | | – | | 1,084 | | 2,705 | | (3,789 | ) | – | |
| Purchased power obligations | – | | – | | – | | 149 | | – | | 149 | |
| Liability for index-linked swap contracts | – | | – | | – | | 291 | | – | | 291 | |
| Post-retirement benefits | – | | – | | – | | 1,681 | | – | | 1,681 | |
| Deferred income taxes | – | | – | | 3,312 | | 1,590 | | (35 | ) | 4,867 | |
| Other liabilities | 13 | | – | | 148 | | 1,680 | | – | | 1,841 | |
|
|
|
|
|
|
|
|
|
|
|
| |
| Total liabilities | 3,081 | | 162 | | 10,193 | | 22,517 | | (10,481 | ) | 25,472 | |
|
|
|
|
|
|
|
|
|
|
|
| |
| Minority interest – equity | – | | – | | – | | 12 | | – | | 12 | |
| Cumulative preference stock issued by Group undertakings | – | | – | | – | | 42 | | – | | 42 | |
| | | | | | | | | | | | | |
| Shareholders’ equity | | | | | | | | | | | | |
| Common stock | 309 | | – | | 45 | | 540 | | (585 | ) | 309 | |
| Additional paid in capital | 7,768 | | – | | 9,680 | | 7,799 | | (17,479 | ) | 7,768 | |
| Other reserves | 359 | | – | | – | | – | | – | | 359 | |
| Retained earnings | 2,701 | | – | | 847 | | 712 | | (1,559 | ) | 2,701 | |
| Other comprehensive loss | (1,282 | ) | – | | – | | (1,181 | ) | 1,181 | | (1,282 | ) |
| Treasury stock | (34 | ) | – | | – | | (34 | ) | 34 | | (34 | ) |
|
|
|
|
|
|
|
|
|
|
|
| |
| Equity shareholders’ funds | 9,821 | | – | | 10,572 | | 7,836 | | (18,408 | ) | 9,821 | |
|
|
|
|
|
|
|
|
|
|
|
| |
| Total liabilities and shareholders’ equity | 12,902 | | 162 | | 20,765 | | 30,407 | | (28,889 | ) | 35,347 | |
|
|
|
|
|
|
|
|
|
|
|
| |
125 National Grid Transco_Annual Report and Accounts 2003/04
Back to Contents
Notes to the Accounts_continued
33. Transco plc additional US GAAP disclosures (continued)
Balance sheet as at 31 March 2003 – UK GAAP
| | Parent | | | Issuer of | | | Subsidiary | | | | | | | | | | |
| Guarantor | | notes | | Guarantor | | | | | | |
| |
| |
| | | | | | |
| National | | British | | | | | | | | National |
| Grid | | Transco | | | | Other | | Consolidation | | Grid Transco |
| Transco plc | | Finance Inc. | | Transco plc | | subsidiaries | | adjustments | | Group |
| £m | | £m | | £m | | £m | | £m | | £m |
|
|
|
|
|
|
|
|
|
|
|
|
|
|
|
|
| |
| Fixed assets | | | | | | | | | | | | | | | | | |
| Intangible assets | – | | | – | | | – | | | 1,893 | | | – | | | 1,893 | |
| Tangible assets | – | | | – | | | 7,785 | | | 9,062 | | | – | | | 16,847 | |
| Investments | – | | | – | | | – | | | 7,371 | | | (7,157 | ) | | 214 | |
| Net assets of subsidiaries (equity accounted) | 646 | | | – | | | 13 | | | – | | | (659 | ) | | – | |
|
|
|
|
|
|
|
|
|
|
|
|
|
|
|
|
| |
| | 646 | | | – | | | 7,798 | | | 18,326 | | | (7,816 | ) | | 18,954 | |
|
|
|
|
|
|
|
|
|
|
|
|
|
|
|
|
| |
| Current assets | | | | | | | | | | | | | | | | | |
| Stocks | – | | | – | | | 31 | | | 95 | | | – | | | 126 | |
| Debtors (amounts falling due within one year) | 2,664 | | | 4 | | | 298 | | | 4,089 | | | (5,244 | ) | | 1,811 | |
| Debtors (amounts falling due after one year) | – | | | 190 | | | 2,241 | | | 5,032 | | | (4,068 | ) | | 3,395 | |
| Assets held for exchange | – | | | – | | | – | | | 17 | | | – | | | 17 | |
| Current asset investments | 123 | | | – | | | 206 | | | 355 | | | (202 | ) | | 482 | |
| Cash at bank and in hand | 1 | | | – | | | – | | | 118 | | | – | | | 119 | |
|
|
|
|
|
|
|
|
|
|
|
|
|
|
|
|
| |
| | 2,788 | | | 194 | | | 2,776 | | | 9,706 | | | (9,514 | ) | | 5,950 | |
| Creditors (amounts falling due within one year) | | | | | | | | | | | | | | | | | |
| Borrowings | (557 | ) | | – | | | (580 | ) | | (1,458 | ) | | 349 | | | (2,246 | ) |
| Other creditors | (1,764 | ) | | (4 | ) | | (1,633 | ) | | (4,294 | ) | | 4,895 | | | (2,800 | ) |
| | (2,321 | ) | | (4 | ) | | (2,213 | ) | | (5,752 | ) | | 5,244 | | | (5,046 | ) |
|
|
|
|
|
|
|
|
|
|
|
|
|
|
|
|
| |
| Net current assets/(liabilities) | 467 | | | 190 | | | 563 | | | 3,954 | | | (4,270 | ) | | 904 | |
|
|
|
|
|
|
|
|
|
|
|
|
|
|
|
|
| |
| Total assets less current liabilities | 1,113 | | | 190 | | | 8,361 | | | 22,280 | | | (12,086 | ) | | 19,858 | |
| | | | | | | | | | | | | | | | | | |
| Creditors (amounts falling due after more than one year) | | | | | | | | | | | | | | | | | |
| Borrowings | – | | | (190 | ) | | (2,838 | ) | | (9,407 | ) | | 202 | | | (12,233 | ) |
| Other creditors | – | | | – | | | (2,424 | ) | | (3,666 | ) | | 4,068 | | | (2,022 | ) |
| | – | | | (190 | ) | | (5,262 | ) | | (13,073 | ) | | 4,270 | | | (14,255 | ) |
| Provisions for liabilities and charges | – | | | – | | | (1,450 | ) | | (2,956 | ) | | – | | | (4,406 | ) |
|
|
|
|
|
|
|
|
|
|
|
|
|
|
|
|
| |
| Net assets employed | 1,113 | | | – | | | 1,649 | | | 6,251 | | | (7,816 | ) | | 1,197 | |
|
|
|
|
|
|
|
|
|
|
|
|
|
|
|
|
| |
| Capital and reserves | | | | | | | | | | | | | | | | | |
| Called up share capital | 308 | | | – | | | 45 | | | 540 | | | (585 | ) | | 308 | |
| Share premium account | 1,247 | | | – | | | 204 | | | 1,557 | | | (1,761 | ) | | 1,247 | |
| Other reserves | (5,131 | ) | | – | | | 1,332 | | | (181 | ) | | (1,151 | ) | | (5,131 | ) |
| Profit and loss account | 4,689 | | | – | | | 68 | | | 4,251 | | | (4,319 | ) | | 4,689 | |
|
|
|
|
|
|
|
|
|
|
|
|
|
|
|
|
| |
| Equity shareholders’ funds | 1,113 | | | – | | | 1,649 | | | 6,167 | | | (7,816 | ) | | 1,113 | |
| Minority interests | | | | | | | | | | | | | | | | | |
| Equity | – | | | – | | | – | | | 15 | | | – | | | 15 | |
| Non-equity | – | | | – | | | – | | | 69 | | | – | | | 69 | |
| | – | | | – | | | – | | | 84 | | | – | | | 84 | |
|
|
|
|
|
|
|
|
|
|
|
|
|
|
|
|
| |
| | 1,113 | | | – | | | 1,649 | | | 6,251 | | | (7,816 | ) | | 1,197 | |
|
|
|
|
|
|
|
|
|
|
|
|
|
|
|
|
| |
Annual Report and Accounts 2003/04_National Grid Transco 126
Back to Contents
Notes to the Accounts_continued
33. Transco plc additional US GAAP disclosures (continued)
Balance sheet as at 31 March 2003 – US GAAP
| | Parent | | Issuer of | | Subsidiary | | | | | | | |
| Guarantor | notes | Guarantor | | | |
|
|
| | | |
| National | British | | | | National |
| Grid | Transco | | Other | Consolidation | Grid Transco |
| Transco plc | Finance Inc. | Transco plc | subsidiaries | adjustments | Group |
| £m | £m | £m | £m | £m | £m |
|
|
|
|
|
|
|
|
|
|
|
| |
| Assets | | | | | | | | | | | | |
| Current assets | | | | | | | | | | | | |
| Cash and cash equivalents | 124 | | – | | 206 | | 442 | | (202 | ) | 570 | |
| Marketable securities | – | | – | | – | | 48 | | – | | 48 | |
| Accounts and notes receivable | – | | – | | 27 | | 601 | | – | | 628 | |
| Inventories | – | | – | | 31 | | 95 | | – | | 126 | |
| Amounts owed by Group undertakings | 2,652 | | 4 | | 4 | | 2,584 | | (5,244 | ) | – | |
| Regulatory assets | – | | – | | – | | 461 | | – | | 461 | |
| Prepaid expenses and other current assets | 12 | | – | | 559 | | 134 | | – | | 705 | |
|
|
|
|
|
|
|
|
|
|
|
| |
| Total current assets | 2,788 | | 4 | | 827 | | 4,365 | | (5,446 | ) | 2,538 | |
| Property, plant and equipment | – | | – | | 13,584 | | 9,800 | | – | | 23,384 | |
| Goodwill | – | | – | | 3,793 | | 2,107 | | – | | 5,900 | |
| Intangible assets | – | | – | | – | | 74 | | – | | 74 | |
| Investments | 8,642 | | – | | (156 | ) | 9,935 | | (18,211 | ) | 210 | |
| Amounts owed by Group undertakings | – | | 182 | | 2,241 | | 1,645 | | (4,068 | ) | – | |
| Regulatory assets | – | | – | | – | | 3,998 | | – | | 3,998 | |
| Other debtors | – | | – | | – | | 843 | | – | | 843 | |
|
|
|
|
|
|
|
|
|
|
|
| |
| Total assets | 11,430 | | 186 | | 20,289 | | 32,767 | | (27,725 | ) | 36,947 | |
|
|
|
|
|
|
|
|
|
|
|
| |
| Liabilities and shareholders’ equity | | | | | | | | | | | | |
| Current liabilities | | | | | | | | | | | | |
| Bank overdrafts | – | | – | | 13 | | 49 | | – | | 62 | |
| Accounts payable | – | | – | | 341 | | 925 | | – | | 1,266 | |
| Short-term borrowings | 557 | | – | | 567 | | 1,198 | | (349 | ) | 1,973 | |
| Purchased power obligations | – | | – | | – | | 68 | | – | | 68 | |
| Liability for index-linked swap contracts | – | | – | | – | | 121 | | – | | 121 | |
| Amounts owed to Group undertakings | 1,439 | | – | | 796 | | 2,660 | | (4,895 | ) | – | |
| Other accrued liabilities | 8 | | 4 | | 626 | | 535 | | (52 | ) | 1,121 | |
|
|
|
|
|
|
|
|
|
|
|
| |
| Total current liabilities | 2,004 | | 4 | | 2,343 | | 5,556 | | (5,296 | ) | 4,611 | |
| Long-term borrowings | – | | 182 | | 3,004 | | 10,074 | | (202 | ) | 13,058 | |
| Amounts owed to Group undertakings | – | | – | | 1,447 | | 2,621 | | (4,068 | ) | – | |
| Purchased power obligations | – | | – | | – | | 253 | | – | | 253 | |
| Liability for index-linked swap contracts | – | | – | | – | | 381 | | – | | 381 | |
| Post-retirement benefits | – | | – | | – | | 2,283 | | – | | 2,283 | |
| Deferred income taxes | – | | – | | 3,329 | | 1,358 | | – | | 4,687 | |
| Other liabilities | – | | – | | 135 | | 2,024 | | – | | 2,159 | |
|
|
|
|
|
|
|
|
|
|
|
| |
| Total liabilities | 2,004 | | 186 | | 10,258 | | 24,550 | | (9,566 | ) | 27,432 | |
|
|
|
|
|
|
|
|
|
|
|
| |
| Minority interest – equity | – | | – | | – | | 15 | | – | | 15 | |
| Cumulative preference stock issued by Group undertakings | – | | – | | – | | 74 | | – | | 74 | |
| | | | | | | | | | | | | |
| Shareholders’ equity | | | | | | | | | | | | |
| Common stock | 308 | | – | | 45 | | 540 | | (585 | ) | 308 | |
| Additional paid in capital | 7,710 | | – | | 9,680 | | 7,799 | | (17,479 | ) | 7,710 | |
| Other reserves | 359 | | – | | – | | – | | – | | 359 | |
| Retained earnings | 2,263 | | – | | 306 | | 1,003 | | (1,309 | ) | 2,263 | |
| Other comprehensive loss | (1,175 | ) | – | | – | | (1,175 | ) | 1,175 | | (1,175 | ) |
| Treasury stock | (39 | ) | – | | – | | (39 | ) | 39 | | (39 | ) |
|
|
|
|
|
|
|
|
|
|
|
| |
| Equity shareholders’ funds | 9,426 | | – | | 10,031 | | 8,128 | | (18,159 | ) | 9,426 | |
|
|
|
|
|
|
|
|
|
|
|
| |
| Total liabilities and shareholders’ equity | 11,430 | | 186 | | 20,289 | | 32,767 | | (27,725 | ) | 36,947 | |
|
|
|
|
|
|
|
|
|
|
|
| |
127 National Grid Transco_Annual Report and Accounts 2003/04
Back to Contents
Notes to the Accounts_continued
33. Transco plc additional US GAAP disclosures (continued)
Cash flow statements
| | Parent | | Issuer of | | Subsidiary | | | | | | | |
| Guarantor | notes | Guarantor | | | |
|
|
| | | |
| National | British | | | | National |
| Grid | Transco | | Other | Consolidation | Grid Transco |
| Transco plc | Finance Inc. | Transco plc | subsidiaries | adjustments | Group |
| £m | £m | £m | £m | £m | £m |
|
|
|
|
|
|
|
|
|
|
|
| |
| UK GAAP cash flow statements | | | | | | | | | | | | |
| Twelve months to 31 March 2004 | | | | | | | | | | | | |
| Cash flow from operating activities | (7 | ) | – | | 1,397 | | 1,420 | | – | | 2,810 | |
| Dividends from subsidiary undertakings and joint ventures | 352 | | – | | 2 | | 78 | | (424 | ) | 8 | |
| Returns on investments and servicing of finance | 8 | | – | | (243 | ) | (457 | ) | – | | (692 | ) |
| Taxation | – | | – | | (61 | ) | 43 | | – | | (18 | ) |
| Capital expenditure and financial investment | – | | – | | (497 | ) | (757 | ) | – | | (1,254 | ) |
| Acquisitions and disposals | – | | – | | – | | 7 | | – | | 7 | |
| Equity dividends paid | (560 | ) | – | | (70 | ) | (354 | ) | 424 | | (560 | ) |
|
|
|
|
|
|
|
|
|
|
|
| |
| Net cash (outflow)/inflow before management of liquid resources | (207 | ) | – | | 528 | | (20 | ) | – | | 301 | |
| Management of liquid resources | 117 | | – | | (56 | ) | (109 | ) | – | | (48 | ) |
| Financing | 90 | | – | | (465 | ) | 135 | | – | | (240 | ) |
|
|
|
|
|
|
|
|
|
|
|
| |
| Increase in cash in the year | – | | – | | 7 | | 6 | | – | | 13 | |
|
|
|
|
|
|
|
|
|
|
|
| |
| Twelve months to 31 March 2003 | | | | | | | | | | | | |
| Cash flow from operating activities | (53 | ) | – | | 1,291 | | 1,588 | | – | | 2,826 | |
| Dividends from subsidiary undertakings and joint ventures | 1,301 | | – | | 28 | | 348 | | (1,666 | ) | 11 | |
| Returns on investments and servicing of finance | 14 | | – | | (335 | ) | (591 | ) | – | | (912 | ) |
| Taxation | – | | – | | (50 | ) | (62 | ) | – | | (112 | ) |
| Capital expenditure and financial investment | – | | – | | (605 | ) | (802 | ) | – | | (1,407 | ) |
| Acquisitions and disposals | (90 | ) | – | | 860 | | 240 | | (847 | ) | 163 | |
| Equity dividends paid | (382 | ) | – | | (337 | ) | (2,365 | ) | 2,513 | | (571 | ) |
|
|
|
|
|
|
|
|
|
|
|
| |
| Net cash inflow/(outflow) before management of liquid resources | 790 | | – | | 852 | | (1,644 | ) | – | | (2 | ) |
| Management of liquid resources | (123 | ) | – | | 2 | | (17 | ) | – | | (138 | ) |
| Financing | (670 | ) | – | | (833 | ) | 1,677 | | – | | 174 | |
|
|
|
|
|
|
|
|
|
|
|
| |
| (Decrease)/increase in cash in the year | (3 | ) | – | | 21 | | 16 | | – | | 34 | |
|
|
|
|
|
|
|
|
|
|
|
| |
| Twelve months to 31 March 2002 | | | | | | | | | | | | |
| Cash flow from operating activities | (1 | ) | – | | 1,253 | | 1,039 | | – | | 2,291 | |
| Dividends from subsidiary undertakings and joint ventures | 750 | | – | | 4 | | 374 | | (1,115 | ) | 13 | |
| Returns on investments and servicing of finance | (10 | ) | – | | (335 | ) | (360 | ) | – | | (705 | ) |
| Taxation | 3 | | – | | (204 | ) | (11 | ) | – | | (212 | ) |
| Capital expenditure and financial investment | – | | – | | (754 | ) | (729 | ) | – | | (1,483 | ) |
| Acquisitions and disposals | (660 | ) | – | | (860 | ) | (969 | ) | 1,520 | | (969 | ) |
| Equity dividends paid | – | | – | | (361 | ) | (1,232 | ) | 1,115 | | (478 | ) |
|
|
|
|
|
|
|
|
|
|
|
| |
| Net cash inflow/(outflow) before management of liquid resources | 82 | | – | | (1,257 | ) | (1,888 | ) | 1,520 | | (1,543 | ) |
| Management of liquid resources | – | | – | | 1 | | 346 | | – | | 347 | |
| Financing | (78 | ) | – | | 1,239 | | 1,577 | | (1,520 | ) | 1,218 | |
|
|
|
|
|
|
|
|
|
|
|
| |
| Increase/(decrease) in cash in the year | 4 | | – | | (17 | ) | 35 | | – | | 22 | |
|
|
|
|
|
|
|
|
|
|
|
| |
| | | | | | | | | | | | | |
| | Parent | | Issuer of | | Subsidiary | | | | | | | |
| Guarantor | notes | Guarantor | | | |
|
|
| | | |
| National | British | | | | National |
| Grid | Transco | | Other | Consolidation | Grid Transco |
| Transco plc | Finance Inc. | Transco plc | subsidiaries | adjustments | Group |
| £m | £m | £m | £m | £m | £m |
|
|
|
|
|
|
|
|
|
|
|
| |
| US GAAP cash flow statements | | | | | | | | | | | | |
| Twelve months to 31 March 2004 | | | | | | | | | | | | |
| Net cash provided by operating activities | 353 | | – | | 1,463 | | 1,106 | | (422 | ) | 2,500 | |
| Net cash used in investing activities | 117 | | – | | (921 | ) | (896 | ) | – | | (1,700 | ) |
| Net cash (used in)/provided by financing activities | (470 | ) | – | | (535 | ) | (245 | ) | 422 | | (828 | ) |
|
|
|
|
|
|
|
|
|
|
|
| |
| Net increase/(decrease) in cash and cash equivalents | – | | – | | 7 | | (35 | ) | – | | (28 | ) |
|
|
|
|
|
|
|
|
|
|
|
| |
| Twelve months to 31 March 2003 | | | | | | | | | | | | |
| Net cash provided by operating activities | 1,262 | | – | | 1,060 | | 979 | | (1,301 | ) | 2,000 | |
| Net cash used in investing activities | (90 | ) | – | | (438 | ) | (108 | ) | – | | (636 | ) |
| Net cash (used in)/provided by financing activities | (1,175 | ) | – | | (601 | ) | (487 | ) | 1,301 | | (962 | ) |
|
|
|
|
|
|
|
|
|
|
|
| |
| Net (decrease)/increase in cash and cash equivalents | (3 | ) | – | | 21 | | 384 | | – | | 402 | |
|
|
|
|
|
|
|
|
|
|
|
| |
| Twelve months to 31 March 2002 | | | | | | | | | | | | |
| Net cash provided by operating activities | 742 | | n/a | | n/a | | 910 | | (750 | ) | 902 | |
| Net cash used in investing activities | (660 | ) | n/a | | n/a | | (1,200 | ) | 660 | | (1,200 | ) |
| Net cash (used in)/provided by financing activities | (78 | ) | n/a | | n/a | | 210 | | 90 | | 222 | |
|
|
|
|
|
|
|
|
|
|
|
| |
| Net increase/(decrease) in cash and cash equivalents | 4 | | n/a | | n/a | | (80 | ) | – | | (76 | ) |
|
|
|
|
|
|
|
|
|
|
|
| |
Annual Report and Accounts 2003/04_National Grid Transco 128
Back to Contents
Summary Group Financial Information
Financial summary (unaudited)
The financial summary set out below has been derived from the audited consolidated accounts of National Grid Transco for the four financial years ended 31 March 2004. It should be read in conjunction with the Group accounts and related notes, together with the Operating and Financial Review. It is not practicable to derive the information for the year ended 31 March 2000 as the former Lattice Group had a different year end and Lattice Group was still part of BG Group plc at 31 March 2000. The balance sheets for 2001 to 2003 have been restated for the adoption of UITF 38. At 31 March 2002, net income for US GAAP includes the FAS 133 transitional adjustment of £14m.
| | 31 March | | | 31 March | | | 31 March | | | 31 March | |
| | 2004 | | | 2003 | | | 2002 | | | 2001 | |
| | | | | (restated) | | | (restated) | | | (restated) | |
| Summary profit and loss account | £m | | | £m | | | £m | | | £m | |
|
|
|
|
|
|
|
|
|
|
| |
| Group turnover | 9,033 | | | 9,400 | | | 7,554 | | | 6,891 | |
| Operating costs | (7,178 | ) | | (7,788 | ) | | (6,494 | ) | | (5,179 | ) |
|
|
|
|
|
|
|
|
|
|
| |
| Operating profit of Group undertakings | 1,855 | | | 1,612 | | | 1,060 | | | 1,712 | |
| Share of joint ventures’ and associate’s operating profit/(loss) | 7 | | | 124 | | | (701 | ) | | (105 | ) |
|
|
|
|
|
|
|
|
|
|
| |
| Operating profit | | | | | | | | | | | |
| – Before exceptional items and goodwill amortisation | 2,238 | | | 2,185 | | | 1,783 | | | 1,780 | |
| – Exceptional items | (277 | ) | | (347 | ) | | (1,327 | ) | | (88 | ) |
| – Goodwill amortisation | (99 | ) | | (102 | ) | | (97 | ) | | (85 | ) |
| | 1,862 | | | 1,736 | | | 359 | | | 1,607 | |
| Non-operating exceptional items | 322 | | | (99 | ) | | 156 | | | 306 | |
| Net interest | | | | | | | | | | | |
| – Excluding exceptional items | (822 | ) | | (939 | ) | | (657 | ) | | (635 | ) |
| – Exceptional items | – | | | (31 | ) | | (142 | ) | | – | |
|
|
|
|
|
|
|
|
|
|
| |
| Profit/(loss) on ordinary activities before taxation | 1,362 | | | 667 | | | (284 | ) | | 1,278 | |
| Tax on profit on ordinary activities – excluding exceptional items | (350 | ) | | (373 | ) | | (251 | ) | | (390 | ) |
| Tax on profit on ordinary activities – exceptional items | 89 | | | 128 | | | 166 | | | 243 | |
|
|
|
|
|
|
|
|
|
|
| |
| Profit/(loss) on ordinary activities after taxation | 1,101 | | | 422 | | | (369 | ) | | 1,131 | |
| Minority interests including exceptional items | (2 | ) | | (31 | ) | | 48 | | | (7 | ) |
|
|
|
|
|
|
|
|
|
|
| |
| Profit/(loss) for the year | 1,099 | | | 391 | | | (321 | ) | | 1,124 | |
|
|
|
|
|
|
|
|
|
|
| |
| Summary statement of net assets | | | | | | | | | | | |
| Fixed assets | 18,394 | | | 18,954 | | | 19,582 | | | 15,670 | |
|
|
|
|
|
|
|
|
|
|
| |
| Current assets | 5,003 | | | 5,950 | | | 6,568 | | | 2,960 | |
| Creditors: amounts falling due within one year | (4,513 | ) | | (5,046 | ) | | (4,888 | ) | | (4,034 | ) |
|
|
|
|
|
|
|
|
|
|
| |
| Net current assets/(liabilities) | 490 | | | 904 | | | 1,680 | | | (1,074 | ) |
|
|
|
|
|
|
|
|
|
|
| |
| Total assets less current liabilities | 18,884 | | | 19,858 | | | 21,262 | | | 14,596 | |
| Creditors: amounts falling due after more than one year | (13,464 | ) | | (14,255 | ) | | (14,868 | ) | | (9,793 | ) |
| Provisions for liabilities and charges | (4,157 | ) | | (4,406 | ) | | (4,663 | ) | | (3,434 | ) |
|
|
|
|
|
|
|
|
|
|
| |
| Net assets | 1,263 | | | 1,197 | | | 1,731 | | | 1,369 | |
|
|
|
|
|
|
|
|
|
|
| |
| Summary cash flow statement | | | | | | | | | | | |
| Net cash inflow from operating activities before exceptional items | 3,058 | | | 3,154 | | | 2,394 | | | 2,482 | |
| Expenditure relating to exceptional items | (248 | ) | | (328 | ) | | (103 | ) | | (129 | ) |
|
|
|
|
|
|
|
|
|
|
| |
| Net cash inflow from operating activities | 2,810 | | | 2,826 | | | 2,291 | | | 2,353 | |
| Dividends from joint ventures | 8 | | | 11 | | | 13 | | | 20 | |
| Net cash outflow for returns on investments and servicing of finance | (692 | ) | | (912 | ) | | (705 | ) | | (691 | ) |
| Net cash outflow for taxation | (18 | ) | | (112 | ) | | (212 | ) | | (350 | ) |
| Net cash outflow for capital expenditure and financial investment | (1,254 | ) | | (1,407 | ) | | (1,483 | ) | | (1,179 | ) |
| Net cash inflow/(outflow) for acquisitions and disposals | 7 | | | 163 | | | (969 | ) | | (587 | ) |
| Equity dividends paid | (560 | ) | | (571 | ) | | (478 | ) | | (336 | ) |
|
|
|
|
|
|
|
|
|
|
| |
| Net cash inflow/(outflow) before the management of liquid resources and financing activities | 301 | | | (2 | ) | | (1,543 | ) | | (770 | ) |
| Net cash (outflow)/inflow for the management of liquid resources | (48 | ) | | (138 | ) | | 347 | | | 696 | |
|
|
|
|
|
|
|
|
|
|
| |
| Net cash inflow/(outflow) before financing activities | 253 | | | (140 | ) | | (1,196 | ) | | (74 | ) |
| Net cash (outflow)/inflow from financing activities | (240 | ) | | 174 | | | 1,218 | | | 59 | |
|
|
|
|
|
|
|
|
|
|
| |
| Net increase/(decrease) in cash in the year | 13 | | | 34 | | | 22 | | | (15 | ) |
|
|
|
|
|
|
|
|
|
|
| |
| | | | | | | | | | | |
| | 31 March | | 31 March | | 31 March | | 31 March | | 31 March | |
| | 2004 | | 2003 | | 2002 | | 2001 | | 2000 | |
| Amounts in accordance with US GAAP | £m | | £m | | £m | | £m | | £m | |
|
|
|
|
|
|
|
|
|
| |
| Group turnover | 8,866 | | 7,401 | | 4,004 | | 3,583 | | 1,545 | |
| Net income/(loss) | 998 | | 751 | | (167 | ) | 810 | | 1,010 | |
| Earnings/(loss) per ADS | | | | | | | | | | |
| Basic | 162.5 | p | 159.5 | p | (54.5 | )p | 274.5 | p | 342.8 | p |
| Diluted | 162.0 | p | 156.5 | p | (44.0 | )p | 260.0 | p | 323.4 | p |
| Total assets | 35,347 | | 36,947 | | 17,727 | | 10,392 | | 9,106 | |
| Net assets employed/total shareholders’ funds | 9,875 | | 9,515 | | 3,862 | | 2,962 | | 2,381 | |
| Equity shareholders’ funds | 9,821 | | 9,426 | | 3,759 | | 2,920 | | 2,346 | |
|
|
|
|
|
|
|
|
|
| |
129 National Grid Transco_Annual Report and Accounts 2003/04
Back to Contents
Glossary of Terms
| Term used in Annual Report | US equivalent or brief description |
| Accounts | Financial statements |
| Acquisition accounting | Purchase accounting |
| Allotted | Issued |
| Associate | Equity investment |
| Borrowings | Debt |
| Called up share capital | Common stock issued and fully paid |
| Capital allowances | Tax term equivalent to US tax depreciation |
| | allowances |
| Creditors | Accounts payable (or payables) |
| Debtors | Accounts receivable (or receivables) |
| Equity shareholders’ funds | Shareholders’ equity |
| Finance lease | Capital lease |
| Financial year | Fiscal year |
| Fixed asset investments | Non-current investments |
| Freehold | Ownership with absolute rights in perpetuity |
| Freehold land | Land owned |
| Group accounts | Consolidated financial statements |
| Interest payable | Interest expense |
| Interest receivable | Interest income |
| Joint venture | Equity investment |
| Merger accounting | Pooling of interests |
| Net asset value | Book value |
| Operating profit | Net operating income |
| Pension scheme | Pension plan |
| Profit | Income (or earnings) |
| Profit and loss account | Income statement |
| Profit and loss account reserve | Retained earnings |
| Profit for the year | Net income |
| Provision for doubtful debts | Allowance for bad and doubtful accounts receivable |
| Provisions | Long-term liabilities other than debt and specific |
| | accounts payable |
| Reconciliation of movements in equity shareholders’ funds | Statement of changes in stockholders’ equity |
| Reserves | Stockholders’ equity other than common stock |
| Share capital | Ordinary shares, capital stock or common stock |
| | issued and fully paid |
| Share premium account | Additional paid-in capital relating to proceeds of |
| | sale of stock in excess of par value or paid-in |
| | surplus (not distributable) |
| Stocks | Inventories |
| Tangible fixed assets | Property, plant and equipment |
| Turnover | Revenues (or sales) |
Annual Report and Accounts 2003/04_National Grid Transco 130
Back to Contents
Definitions
ADRs
American Depositary Receipts, negotiable certificates representing holdings in ADSs.
ADSs
American Depositary Shares, each of which represents the right to receive five ordinary shares.
AGM
Annual General Meeting.
bcm
Billion cubic metres.
Company or National Grid Transco
National Grid Transco plc.
Corporate Centre
Core Group functions operating from the Group’s head office.
DC
Direct current.
Demerger
The demerger of Lattice from BG Group plc which became effective on 23 October 2000.
EMFs
The electric and magnetic fields produced by all electrical equipment and appliances.
FERC
Federal Energy Regulatory Commission.
GAAP
Generally accepted accounting principles.
GridAmerica
The Group’s business that manages electricity transmission operations for other utilities in the US.
Gridcom
The Group’s communications infrastructure business.
Group
National Grid Transco and/or its subsidiary undertakings or any of them as the context requires.
GW
Gigawatt, 109 watts.
GWh
Gigawatt hours.
HSE
Health and Safety Executive.
kV
Kilovolt, 103 volts.
kW
Kilowatt, 103 watts.
kWh
Kilowatt hours.
Lattice or Lattice Group
Lattice Group plc and/or its subsidiary undertakings or any of them as the context requires immediately prior to the completion of the Merger.
LNG
Liquefied natural gas.
LTI
Lost Time Injury. A work-related injury that caused the person to be away from work for at least one normal shift after the shift on which the injury occurred, because he/she is unfit to perform his/her duties.
mcm
Million cubic metres.
Merger
The merger of Lattice and National Grid which became effective on 21 October 2002.
MJ/cuM
Megajoules per cubic metre.
MW
Megawatt, 106 watts.
MWh
Megawatt hours.
National Grid or National Grid Group
National Grid Group plc and/or its subsidiary undertakings or any of them as the context requires immediately prior to the completion of the Merger.
National Grid Company or NGC
National Grid Company plc.
National Grid Transco or the Company
National Grid Transco plc.
National Grid USA
The holding company which owns the Group’s electricity, gas and other interests in the US.
Niagara Mohawk
Niagara Mohawk Holdings Inc., the US utility acquired by National Grid on 31 January 2002.
NTS or National Transmission System
The UK national gas transmission system owned and operated by Transco.
Ofgem
The Office of Gas and Electricity Markets which on 16 June 1999 became the new name for the combined Office of Electricity Regulation and Office of Gas Supply.
ordinary shares
Ordinary shares of 10 pence each in the capital of National Grid Transco.
pence or p
United Kingdom (UK) currency.
pound(s) sterling or £
United Kingdom (UK) currency.
PUHCA
Public Utility Holding Company Act of 1935.
SEC
United States Securities and Exchange Commission.
tonnes CO2 equivalent
Measure of greenhouse gas emissions in relation to the impact of carbon dioxide.
TW
Terawatt, 1012 watts.
TWh
Terawatt hours.
Transco
Transco plc.
US dollars, US$ or $
United States (US) currency.
131 National Grid Transco_Annual Report and Accounts 2003/04
Back to Contents
Certain Disclosures Required by Form 20-F and Related Information
Exchange rates
The following table sets out the $ to £ exchange rates as indicated:
| As at 19 May 2004 | | | | | |
| | | high | | low | |
|
|
|
|
| |
| May 2004* | | 1.79 | | 1.75 | |
|
|
|
|
| |
| April 2004 | | 1.86 | | 1.77 | |
|
|
|
|
| |
| March 2004 | | 1.87 | | 1.79 | |
|
|
|
|
| |
| February 2004 | | 1.90 | | 1.82 | |
|
|
|
|
| |
| January 2004 | | 1.85 | | 1.79 | |
|
|
|
|
| |
| December 2003 | | 1.78 | | 1.72 | |
|
|
|
|
| |
| November 2003 | | 1.72 | | 1.67 | |
|
|
|
|
| |
| | | | | | |
| | | average** | | | |
|
|
|
|
| |
| 2003/04 | | 1.70 | | | |
|
|
|
|
| |
| 2002/03 | | 1.55 | | | |
|
|
|
|
| |
| 2001/02 | | 1.44 | | | |
|
|
|
|
| |
| 2000/01 | | 1.47 | | | |
|
|
|
|
| |
| 1999/2000 | | 1.61 | | | |
|
|
|
|
| |
| * | for the period to 19 May 2004 |
| ** | the average for each period is calculated by using the average of the exchange rates on the last day of each month during the period |
Trading markets for ordinary shares
National Grid Transco’s ordinary shares have been listed on the London Stock Exchange since 11 December 1995. National Grid Transco’s ADRs have had a full listing on the New York Stock Exchange since 7 October 1999.
Documents on display
National Grid Transco is subject to the filing requirements of the US Securities Exchange Act of 1934. In accordance with these requirements, National Grid Transco files reports and other information with the US Securities and Exchange Commission (SEC). These materials, including this document, may be inspected during normal business hours at National Grid Transco’s registered office at 1-3 Strand, London WC2N 5EH or at the SEC’s Public Reference Room at 450 Fifth Street, NW, Washington, DC 20549. For further information about the Public Reference Room, please call the SEC on 1-800-SEC-0330. Some of National Grid Transco’s filings are also available on the SEC’s website at www.sec.gov.
Analysis of shareholdings
The following analysis of shareholdings is at 19 May 2004:
size of shareholding | | number of holders | | number of shares held | | % of issued share capital | |
|
|
|
|
|
|
| |
| 1-100 | | 667,142 | | 39,465,751 | | 1.28 | |
|
|
|
|
|
|
| |
| 101-500 | | 649,818 | | 135,119,732 | | 4.38 | |
|
|
|
|
|
|
| |
| 501-1,000 | | 65,696 | | 45,368,169 | | 1.47 | |
|
|
|
|
|
|
| |
| 1,001-5,000 | | 45,850 | | 90,821,622 | | 2.94 | |
|
|
|
|
|
|
| |
| 5,001-10,000 | | 3,276 | | 22,222,095 | | 0.72 | |
|
|
|
|
|
|
| |
| 10,001-50,000 | | 1,535 | | 30,436,324 | | 0.99 | |
|
|
|
|
|
|
| |
| 50,001-100,000 | | 285 | | 20,471,089 | | 0.66 | |
|
|
|
|
|
|
| |
| 100,001-500,000 | | 566 | | 133,753,489 | | 4.33 | |
|
|
|
|
|
|
| |
| 500,001-1,000,000 | | 175 | | 125,106,504 | | 4.05 | |
|
|
|
|
|
|
| |
| 1,000,001 and above | | 298 | | 2,445,112,781 | | 79.18 | |
|
|
|
|
|
|
| |
| Total | | 1,434,641 | | 3,087,877,556 | | 100.00 | |
|
|
|
|
|
|
| |
In addition to the number of ordinary shareholders shown, there are approximately 19,000 beneficial and 26,300 registered holders of ADSs. These ADSs represent approximately 2.92% of the issued ordinary share capital.
Market prices
The following table sets out the highest and lowest market prices for National Grid Transco ordinary shares and ADSs for the periods indicated:
| | | ordinary share (p) | | ADS ($) | |
|
|
|
|
|
|
|
|
| |
| | | high | | low | | high | | low | |
|
|
|
|
|
|
|
|
| |
| 2003/04 | | 438.00 | | 374.75 | | 41.450 | | 30.190 | |
|
|
|
|
|
|
|
|
| |
| 2002/03 | | 511.50 | | 365.75 | | 37.400 | | 26.690 | |
|
|
|
|
|
|
|
|
| |
| 2001/02 | | 581.00 | | 417.25 | | 41.750 | | 30.400 | |
|
|
|
|
|
|
|
|
| |
| 2000/01 | | 646.00 | | 479.50 | | 47.875 | | 37.000 | |
|
|
|
|
|
|
|
|
| |
| 1999/2000 | | 597.00 | | 388.50 | | 48.125 | | 31.875 | |
|
|
|
|
|
|
|
|
| |
| 2003/04 | | | | | | | | | |
| Q1 | | 421.00 | | 394.00 | | 34.980 | | 31.060 | |
| Q2 | | 406.75 | | 374.75 | | 34.120 | | 30.190 | |
| Q3 | | 406.25 | | 376.25 | | 36.250 | | 32.000 | |
| Q4 | | 438.00 | | 385.00 | | 41.450 | | 35.590 | |
|
|
|
|
|
|
|
|
| |
| 2002/03 | | | | | | | | | |
| Q1 | | 511.50 | | 459.00 | | 37.400 | | 32.870 | |
| Q2 | | 472.25 | | 402.25 | | 36.500 | | 31.400 | |
| Q3 | | 480.00 | | 418.00 | | 37.140 | | 32.800 | |
| Q4 | | 448.00 | | 365.75 | | 35.920 | | 29.690 | |
|
|
|
|
|
|
|
|
| |
| May 2004* | | 433.50 | | 421.25 | | 39.340 | | 37.590 | |
|
|
|
|
|
|
|
|
| |
| April 2004 | | 436.25 | | 422.50 | | 40.550 | | 38.390 | |
|
|
|
|
|
|
|
|
| |
| March 2004 | | 438.00 | | 418.00 | | 41.450 | | 38.000 | |
|
|
|
|
|
|
|
|
| |
| February 2004 | | 431.00 | | 397.00 | | 40.600 | | 36.830 | |
|
|
|
|
|
|
|
|
| |
| January 2004 | | 404.75 | | 385.00 | | 37.560 | | 35.590 | |
|
|
|
|
|
|
|
|
| |
| December 2003 | | 400.25 | | 379.25 | | 36.250 | | 33.750 | |
|
|
|
|
|
|
|
|
| |
| November 2003 | | 406.25 | | 377.25 | | 34.810 | | 32.100 | |
|
|
|
|
|
|
|
|
| |
| * | for the period to 19 May 2004 |
Annual Report and Accounts 2003/04_National Grid Transco 134