 Exelon and Constellation Energy Announce Merger April 28, 2011 Creating a Clean, Competitive Future EXHIBIT 99.2 |
 Cautionary Statements Regarding Forward-Looking Information 1 Except for the historical information contained herein, certain of the matters discussed in this communication constitute “forward-looking statements” within the meaning of the Securities Act of 1933 and the Securities Exchange Act of 1934, both as amended by the Private Securities Litigation Reform Act of 1995. Words such as “may,” “will,” “anticipate,” “estimate,” “expect,” “project,” “intend,” “plan,” “believe,” “target,” “forecast,” and words and terms of similar substance used in connection with any discussion of future plans, actions, or events identify forward-looking statements. These forward-looking statements include, but are not limited to, statements regarding benefits of the proposed merger, integration plans and expected synergies, the expected timing of completion of the transaction, anticipated future financial and operating performance and results, including estimates for growth. These statements are based on the current expectations of management of Exelon Corporation (Exelon) and Constellation Energy Group, Inc. (Constellation), as applicable. There are a number of risks and uncertainties that could cause actual results to differ materially from the forward-looking statements included in this communication. For example, (1) the companies may be unable to obtain shareholder approvals required for the merger; (2) the companies may be unable to obtain regulatory approvals required for the merger, or required regulatory approvals may delay the merger or result in the imposition of conditions that could have a material adverse effect on the combined company or cause the companies to abandon the merger; (3) conditions to the closing of the merger may not be satisfied; (4) an unsolicited offer of another company to acquire assets or capital stock of Exelon or Constellation could interfere with the merger; (5) problems may arise in successfully integrating the businesses of the companies, which may result in the combined company not operating as effectively and efficiently as expected; (6) the combined company may be unable to achieve cost-cutting synergies or it may take longer than expected to achieve those synergies; (7) the merger may involve unexpected costs, unexpected liabilities or unexpected delays, or the effects of purchase accounting may be different from the companies’ expectations; (8) the credit ratings of the combined company or its subsidiaries may be different from what the companies expect; (9) the businesses of the companies may suffer as a result of uncertainty surrounding the merger; |
 2 Cautionary Statements Regarding Forward-Looking Information (Continued) (10) the companies may not realize the values expected to be obtained for properties expected or required to be divested; (11) the industry may be subject to future regulatory or legislative actions that could adversely affect the companies; and (12) the companies may be adversely affected by other economic, business, and/or competitive factors. Other unknown or unpredictable factors could also have material adverse effects on future results, performance or achievements of the combined company. Discussions of some of these other important factors and assumptions are contained in Exelon’s and Constellation’s respective filings with the Securities and Exchange Commission (SEC), and available at the SEC’s website at www.sec.gov, including: (1) Exelon’s 2010 Annual Report on Form 10-K in (a) ITEM 1A. Risk Factors, (b) ITEM 7. Management’s Discussion and Analysis of Financial Condition and Results of Operations and (c) ITEM 8. Financial Statements and Supplementary Data: Note 18; (2) Exelon’s Quarterly Report on Form 10-Q for the quarterly period ended March 31, 2011 in (a) Part II, Other Information, ITEM 1A. Risk Factors, (b) Part 1, Financial Information, ITEM 2. Management’s Discussion and Analysis of Financial Condition and Results of Operations and (c) Part I, Financial Information, ITEM 1. Financial Statements: Note 12; and (3) Constellation’s 2010 Annual Report on Form 10-K in (a) ITEM 1A. Risk Factors, (b) ITEM 7. Management’s Discussion and Analysis of Financial Condition and Results of Operations and (c) ITEM 8. Financial Statements and Supplementary Data: Note 12. These risks, as well as other risks associated with the proposed merger, will be more fully discussed in the joint proxy statement/prospectus that will be included in the Registration Statement on Form S-4 that Exelon will file with the SEC in connection with the proposed merger. In light of these risks, uncertainties, assumptions and factors, the forward-looking events discussed in this communication may not occur. Readers are cautioned not to place undue reliance on these forward-looking statements, which speak only as of the date of this communication. Neither Exelon nor Constellation undertake any obligation to publicly release any revision to its forward-looking statements to reflect events or circumstances after the date of this communication. |
 Additional Information and Where to Find it 3 This communication does not constitute an offer to sell or the solicitation of an offer to buy any securities, or a solicitation of any vote or approval, nor shall there be any sale of securities in any jurisdiction in which such offer, solicitation or sale would be unlawful prior to registration or qualification under the securities laws of any such jurisdiction. Exelon intends to file with the SEC a registration statement on Form S-4 that will include a joint proxy statement/prospectus and other relevant documents to be mailed by Exelon and Constellation to their respective security holders in connection with the proposed merger of Exelon and Constellation. WE URGE INVESTORS AND SECURITY HOLDERS TO READ THE JOINT PROXY STATEMENT/PROSPECTUS AND ANY OTHER RELEVANT DOCUMENTS WHEN THEY BECOME AVAILABLE, BECAUSE THEY WILL CONTAIN IMPORTANT INFORMATION about Exelon, Constellation and the proposed merger. Investors and security holders will be able to obtain these materials (when they are available) and other documents filed with the SEC free of charge at the SEC's website, www.sec.gov. In addition, a copy of the joint proxy statement/prospectus (when it becomes available) may be obtained free of charge from Exelon Corporation, Investor Relations, 10 South Dearborn Street, P.O. Box 805398, Chicago, Illinois 60680-5398, or from Constellation Energy Group, Inc., Investor Relations, 100 Constellation Way, Suite 600C, Baltimore, MD 21202. Investors and security holders may also read and copy any reports, statements and other information filed by Exelon, or Constellation, with the SEC, at the SEC public reference room at 100 F Street, N.E., Washington, D.C. 20549. Please call the SEC at 1-800-SEC-0330 or visit the SEC’s website for further information on its public reference room. Participants in the Merger Solicitation Exelon, Constellation, and their respective directors, executive officers and certain other members of management and employees may be deemed to be participants in the solicitation of proxies in respect of the proposed transaction. Information regarding Exelon’s directors and executive officers is available in its proxy statement filed with the SEC by Exelon on March 24, 2011 in connection with its 2011 annual meeting of shareholders, and information regarding Constellation’s directors and executive officers is available in its proxy statement filed with the SEC by Constellation on April 15, 2011 in connection with its 2011 annual meeting of shareholders. Other information regarding the participants in the proxy solicitation and a description of their direct and indirect interests, by security holdings or otherwise, will be contained in the joint proxy statement/prospectus and other relevant materials to be filed with the SEC when they become available. |
 Agenda Transaction Overview and Exelon Strategic Rationale John Rowe Exelon Chairman and CEO Constellation Strategic Rationale and Execution Timeline Mayo Shattuck Constellation Chairman, President and CEO Combined Company Profile and Financial Summary Chris Crane Exelon President and COO Q&A Session 4 |
 Exelon’s Consistent View on M&A • “When we look, we look first at the financial returns; second at how we can do it consistent with maintaining our investment grade rating; third, whether it diversifies our own risks; and we're just very bloody careful, like we have been for a very long time.” – Exelon Third Quarter 2010 Earnings Conference call • “We remain very value-driven. We always look. We stay oriented toward cleaner fleets, rather than less clean fleets. But we believe that this is an industry where you need consolidation, but to make it make sense for investors, it has to be earnings accretive in relatively early time periods, and it has to be consistent with our need to maintain investment grade credit ratings.” – Exelon Second Quarter 2010 Earnings Conference call • “We place a very high value on who we are and what we have. And we don't want to give up too much of our upside…just to buy us a little more safety over the next year or two. So with us, it's all about numbers.” – John Rowe, June 2010 Bernstein Strategic Decisions Conference 5 |
 Creating Value Through a Strategic Merger • Delivers financial benefits to both sets of shareholders • Increases scale and scope of the business across the value chain • Matches the industry’s premier clean merchant generating fleet with the leading retail and wholesale customer platform • Diversifies the generation portfolio • Continued upside to power market recovery • Maintains a strong regulated earnings profile with large urban utilities Combining Exelon’s generation fleet and Constellation’s customer-facing businesses creates a strong platform for growth and delivers benefits to investors and customers 6 |
 • $7 billion • $11 billion • 11,430 (Total) • 1,921(Nuclear) • 1.2 mil. (MD) • 0.7 mil. (MD) • 38 states & D.C. (5) • ~106 TWh/yr • 15% Generation • 50% Utility • 35% NewEnergy Combination Will Result in Enhanced Scale, Scope, Flexibility and Financial Strength (1) Market Value as of 4/27/11. Enterprise Value represents Market Value plus Net Debt as of 3/31/11 for Exelon and 12/31/10 for Constellation. (2) Data as of 12/31/10. Constellation data includes 2,950 MW for Boston Generation assets and excludes 550 MW for Quail Run. (3) Net of market mitigation assumed to be 2,648 MW. (4) Represents 2011 booked electric sales. Exelon load includes ComEd swap. (5) Competitive and wholesale business also active in Alberta and Ontario, Canada. (6) Exelon EBITDA estimates per equity research. Constellation EBITDA estimates per company guidance. Market Value and Enterprise Value (1) Pro forma Standalone Owned Generation (in MW) (2) Regulated Utilities Competitive Retail & Wholesale (4) Business Mix (6) • $27 billion • $41 billion • 25,619 (Total) • 17,047(Nuclear) Electric customers • 5.4 mil. (IL, PA) Gas customers • 0.5 mil. (PA) • 4 states • ~59 TWh/yr 2012E EBITDA • 51% Generation • 49% Utilities • $34 billion • $52 billion • 38 states & D.C. (5) • ~165 TWh energy sales • Expect >50% pro forma EBITDA from competitive business • 34,401 (Total) (3) • 18,968 (Nuclear) • 6.6 million electric & gas customers in IL, PA and MD 7 |
 Transaction Overview • 100% stock – 0.930 shares of EXC for each share of CEG • Upfront transaction premium of 18.1% (1) • $2.10 per share Exelon dividend maintained • Expect to close in early 1Q 2012 • Exelon and Constellation shareholder approvals in 3Q 2011 • Regulatory approvals including FERC, DOJ, MD, NY, TX • Executive Chairman: Mayo Shattuck • President and CEO: Chris Crane • Board of Directors: 16 total (12 from Exelon, 4 from Constellation) • Exelon Corporation • 78% Exelon shareholders • 22% Constellation shareholders • Corporate headquarters: Chicago, IL • Constellation headquarters: Baltimore, MD • No change to utilities’ headquarters • Significant employee presence maintained in IL, PA and MD Company Name Consideration Pro Forma Ownership Headquarters Governance Approvals & Timing (1) Based on the 30-day average Exelon and Constellation closing stock prices as of April 27, 2011. 8 |
 Exelon Transaction Rationale • Increases geographic diversity of generation, load and customers in competitive markets This transaction meets all of our M&A criteria and can be executed Shared Commitment to Competitive Markets Enhances Scalable Growth Platform Creates Shareholder Value • Expands a valuable channel to market our generation • Enhances margins in the competitive portfolio • Diversifies portfolio across the value chain • EPS break-even in 2012 and accretive by +5% in 2013 • Maintains strong credit profile and financial discipline • Maintains earnings upside to future environmental regulations and power market recovery • Adds stability to earnings and cash flow 9 • Adds mix of clean generation to the portfolio Clean Generation Fleet |
 Constellation Transaction Rationale • Upfront premium of 18.1% (1) • Dividend accretion of 103% post-closing • Enhances upside to power market recovery and synergies The transaction creates financial and strategic value that is consistent with Constellation’s existing strategy Creates Shareholder Value • Creates balance sheet capacity to pursue growth opportunities throughout the competitive portfolio • Reduces cost of capital Balance Sheet Strength Complementary Portfolios • Advances strategy of matching load with physical generation in key competitive markets • Lowers collateral costs of competitive businesses 10 (1) Based on the 30-day average Exelon and Constellation closing stock prices as of April 27, 2011. |
 This Combination Is Good for Maryland • Maintains employee presence and platform for growth in Maryland – Exelon’s Power Team will be combined with Constellation’s wholesale and retail business under the Constellation brand and will be headquartered in Baltimore – Constellation and Exelon’s renewable energy business headquartered in Baltimore – BGE maintains independent operations headquartered in Baltimore – No involuntary merger-related job reductions at BGE for two years after close • Supports Maryland’s economic development and clean energy infrastructure – $10 million to spur development of electric vehicle infrastructure – $4 million to support EmPower Maryland Energy Efficiency Act – 25 MWs of renewable energy development in Maryland – Charitable contributions maintained for at least 10 years • Provides direct benefits to BGE customers – $5 million provided for Maryland’s Electric Universal Service Program (EUSP) – Over $110 million to BGE residential customers from $100 one-time rate credit We will bring direct benefits to the State of Maryland, the City of Baltimore and BGE customers. Total investment in excess of $250 million. 11 |
 Transaction Timetable 2Q 2011 3Q 2011 4Q 2011 1Q 2012 Merger Announcement Make Regulatory Filings Mail Proxy Materials Exelon and Constellation Shareholder Meetings Secure Regulatory Approvals (including FERC, DOJ, Maryland, NRC, New York and Texas) Transaction Close Divestiture Process 12 |
 Combined Company Profile |
 Scale, Scope and Flexibility Across the Value Chain Upstream Downstream Reserves (gas) 266 bcf Owned Generating Capacity 34 GWs (1) Electric Transmission 7,350 miles Electric & Gas Dist. 6.6 million customers Retail & Wholesale Volumes (2) (Electric & Gas) ~165 TWh, 405 bcf 13 Note: Data as of 12/31/10 unless stated otherwise. (1) Generation capacity net of market mitigation assumed to be 2,648 MW consisting of Brandon Shores (1,273 MW), H.A. Wagner (976 MW) and CP Crane (399 MW). (2) Electric load includes all booked 2011E competitive retail sales, wholesale sales, and sales to load serving entities including ComEd swap. Gas load includes all booked and forecasted 2011E competitive retail sales. |
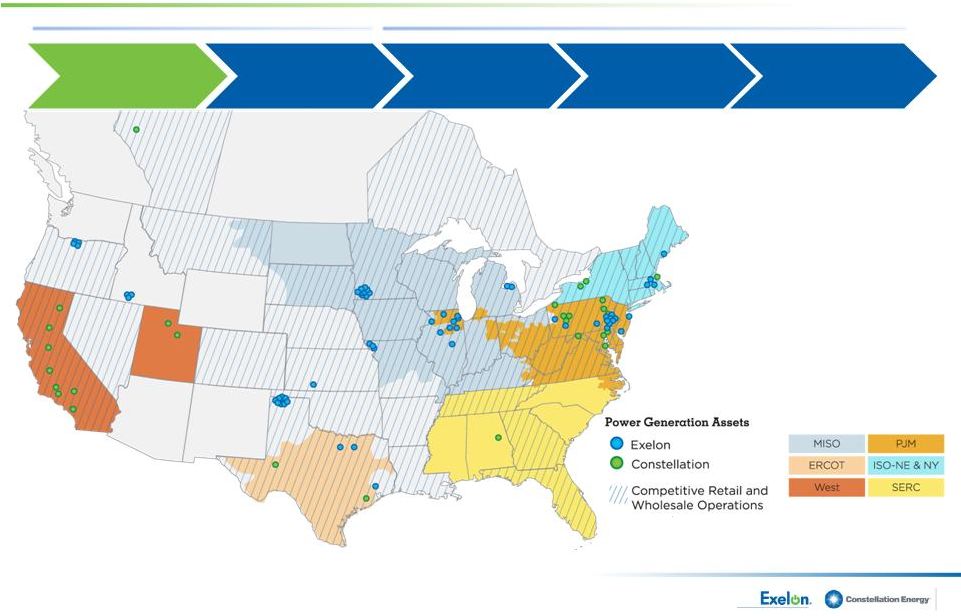
 Exelon Constellation MISO (TWh) PJM (TWh) South (1) (TWh) ISO-NE & NY ISO (2) (TWh) West (TWh) Load Generation Exelon Constellation Exelon Constellation Exelon Constellation Exelon Constellation Load Generation Generation Load Load Generation Load Generation 6.3 9.1 101.5 179.1 27.8 23.2 27.1 13.9 2.4 0.8 Portfolio Matches Generation with Load in Key Competitive Markets The combination establishes an industry-leading platform with regional diversification of the generation fleet (1) Represents load and generation in ERCOT, SERC and SPP. (2) Constellation load includes ~0.7TWh of load served in Ontario Note: Data for Exelon and Constellation represents expected generation and load for 2011 as of 12/31/10. Exelon load includes ComEd Swap, load sold through affiliates, fixed and indexed load sales and load sold through POLR auctions. Constellation load includes load sold through affiliates, fixed and indexed load sales and load sold through POLR auctions. 14 2.4 0.4 0.4 4.8 27.1 9.1 31.8 42.8 147.3 58.7 5.8 0.5 9.1 23.2 27.8 |
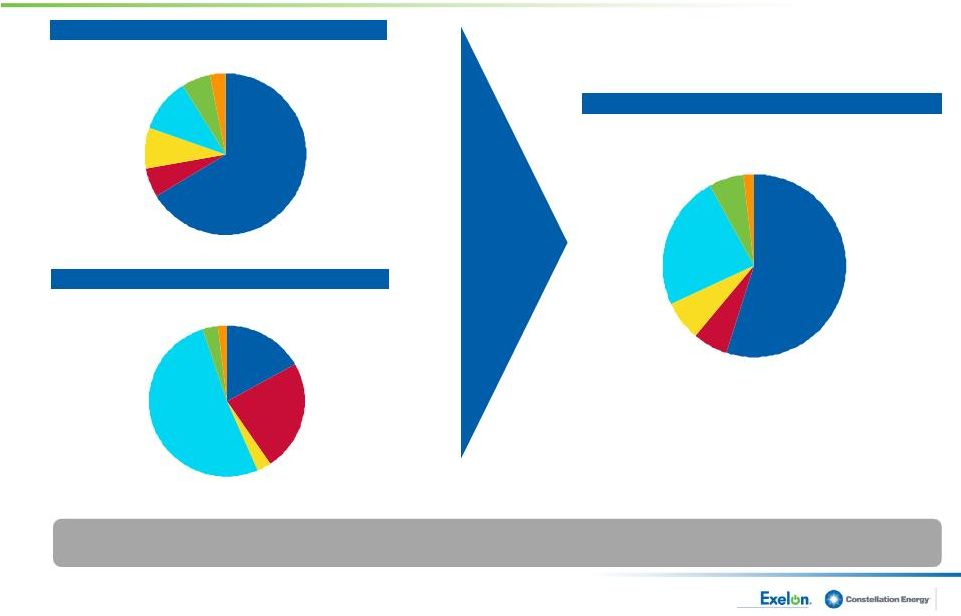 A Clean Generation Profile Creates Long-Term Value in Competitive Markets (1) Net of market mitigation assumed to be 2,648 MW. (2) Constellation generation includes Boston Generation acquisition (2,950 MW of natural gas) and excludes Quail Run (~550 MW of natural gas). Constellation nuclear reflects 50.01% interest in Constellation Energy Nuclear Group LLC. Exelon Standalone Total Generation: 25,619 MW Constellation Standalone (2) Total Generation: 11,430 MW Pro forma Company (Net of Mitigation) (1) Total Generation: 34,401 MW 15 Combined company remains the premier low-cost generator Coal 24% Nuclear 17% Gas 52% Wind/Solar/Other 2% Hydro 3% Oil 3% Coal 6% Oil 8% Gas 11% Hydro 6% Wind/Solar/Other 3% Nuclear 67% Nuclear 55% Coal 6% Oil 7% Gas 24% Hydro 6% Wind/Solar/ Other 2% |
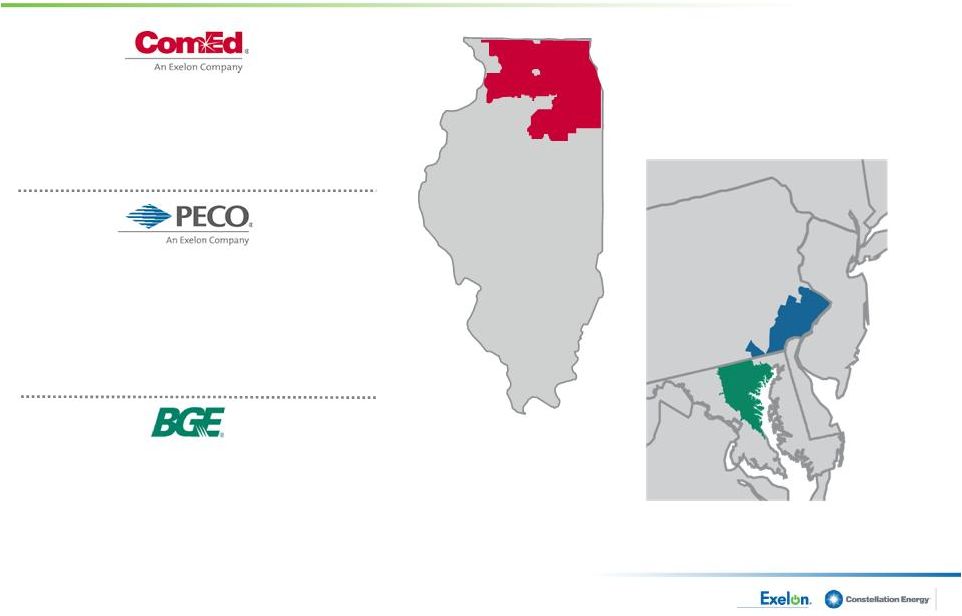 Expertise in Operating Regulated Utilities in Large Metropolitan Areas • 3.8 million electric customers • Service Territory: 11,300 square miles • Peak Load (1) : 23,613 MW • 2011 Rate Base (2) : $9.3 billion • 1.6 million electric customers • 0.5 million gas customers • Service Territory: 2,100 square miles • Peak Load (1) : 8,932 MW • 2011 Rate Base (2) : $5.0 billion • 1.2 million electric customers • 0.7 million gas customers • Service Territory: 2,300 square miles • Peak Load (1) : 7,198 MW • 2011 Rate Base (2) : $3.9 billion (1) Peak load represents all-time peak load. (2) Estimated rate base as of end of year. 16 |
 Financial Summary |
 Transaction Economics Are Attractive for Both Companies • EPS break-even in 2012 and accretive by +5% in 2013 • Free cash flow accretive beginning in 2012 • Run-rate synergies of ~$260 million – Total costs to achieve of ~$500 million – Synergies primarily from corporate consolidation and power marketing platform integration • Lower consolidated liquidity requirements, resulting in cost savings • Investment-grade ratings and credit metrics 17 |
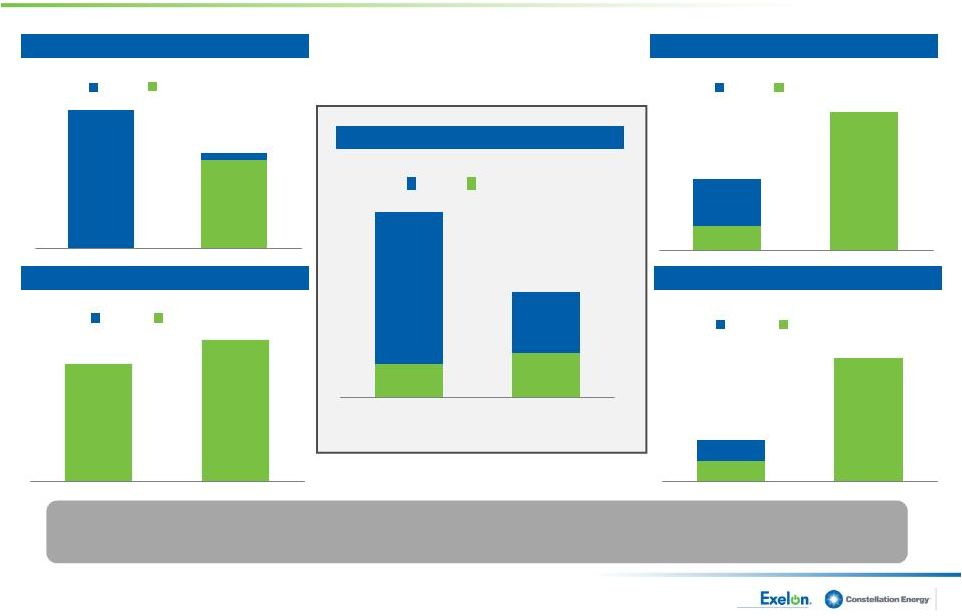
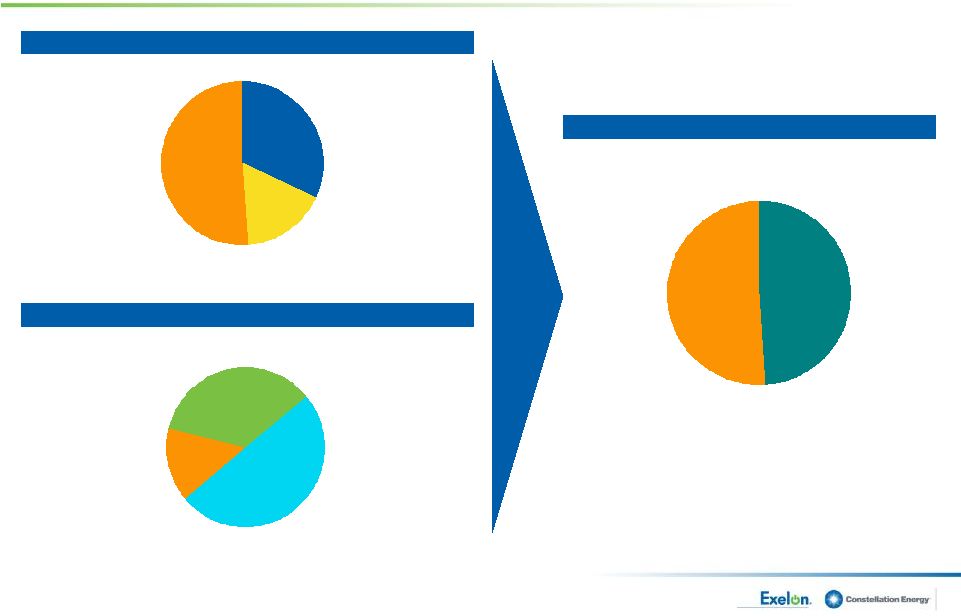 Balanced EBITDA Contribution from Competitive and Regulated Businesses 2012E Exelon Standalone 2012E Constellation Standalone Source: Exelon EBITDA estimates per equity research. Constellation EBITDA estimates per company guidance. Pro forma EBITDA contribution reflects EBITDA before asset divestitures. 2012E Pro forma Company Competitive Businesses 51% Regulated Utilities 49% 18 Generation 15% BGE 50% NewEnergy 35% Exelon Generation 51% PECO 17% ComEd 32% |
 Summary Highlights 19 • Delivers immediate financial benefits to both sets of shareholders • Increases scale and scope of the business across the value chain • Matches the industry’s premier clean merchant generating fleet with the leading retail and wholesale customer platform • Diversifies the generation portfolio • Continued upside to commodity price recovery • Maintains a strong regulated earnings profile with large urban utilities |
 Q&A |
 Appendix |
 Benefits to Constellation Shareholders • Upfront premium and pro forma ownership in a large growing company • Dividend uplift based on current Exelon dividend The dividend remains a core part of the company’s value return proposition Note: Ongoing dividends are subject to quarterly declarations by the Board of Directors. Per Share EXC Current Annual dividend $2.10 Transaction Exchange Ratio 0.930 = Implied CEG Exchange Ratio-Adjusted Dividend $1.95 Current CEG Annual Dividend $0.96 Dividend Uplift to CEG Shareholders 103% 20 |
 225 400 520 119 20 20 550 550 867 825 552 260 415 516 1,340 550 500 800 702 600 550 0 200 400 600 800 1,000 1,200 1,400 1,600 1,800 2012 2013 2014 2015 2016 2017 2018 2019 2020 (in $M) Constellation Regulated Constellation Unregulated Exelon Regulated Exelon Unregulated Ample Liquidity and Manageable Debt Maturities Sources of Liquidity Debt Maturity Profile (2012-2020) (2) • Exelon & Constellation (excluding utilities) currently have $10.3 billion of liquidity • Additional $2.2 billion of utility liquidity • Matching retail load and generation reduces liquidity requirements for combined company • $6.3B - $7.3 billion (1) of liquidity provides ample cushion Pro Forma 21 (in $B) (1) Based on preliminary analysis. (2) Debt maturity schedule as of 12/31/10, except for make whole of Constellation Energy 2012 notes in January, 2011. $6.1 $6.3 - $7.3 $3 - $4 $4.2 Existing liquidity (ex-utilities) Reduction in existing liquidity Pro forma liquidity Exelon Constellation (1) ~75% of 2012 – 2016 debt maturities consist of regulated utility debt Pro forma |
 Debt Structure at Closing BGE • BGE will exist as a separate subsidiary under Exelon with its current structure • BGE will continue as an SEC registrant and will continue to issue debt Constellation Energy Group, Inc. • Constellation (excluding BGE) will be a wholly-owned subsidiary of Exelon Generation • Constellation will remain a separate SEC registrant • All future debt for Exelon Generation and Constellation is expected to be issued at Exelon Generation 22 |
 16% 34% 41% 9% RTO EMAAC MAAC SWMAAC 8% 15% 15% 63% EMAAC MAAC RTO SWMAAC 42% 7% 51% RTO MAAC EMAAC Increased Regional Diversity in PJM: Capacity Eligible for 2014/15 RPM Auction (1) 2014/15 RPM auction results will be announced on May 13 th , 2011 Pro forma Company (2) 4,390 MW 2,535 MW 9,230 MW 11,345 MW Exelon Standalone Constellation Standalone (1) All generation values are approximate and not inclusive of wholesale transactions; all capacity values are in installed capacity terms (summer ratings) located in the areas and adjusted for mid-year PPA roll-offs. (2) Net of market mitigation assumed to be 2,648 MW. 8,700 MW 10,300 MW 1,500 MW 1,035 MW 4,390 MW 23 1,045 MW 530 MW |
 Combining Constellation’s leading competitive businesses and Exelon’s clean generation… Captures value across a range of market conditions Directly links consumers of electricity and generation assets Spreads credit risk across more parties Adds asset optimization opportunities Generation Load Optimizes cost structure by reducing 3 rd party transactions Reduces working capital requirements and liquidity needs …Creates a platform for future growth and optimization of earnings and cash flows 24 |
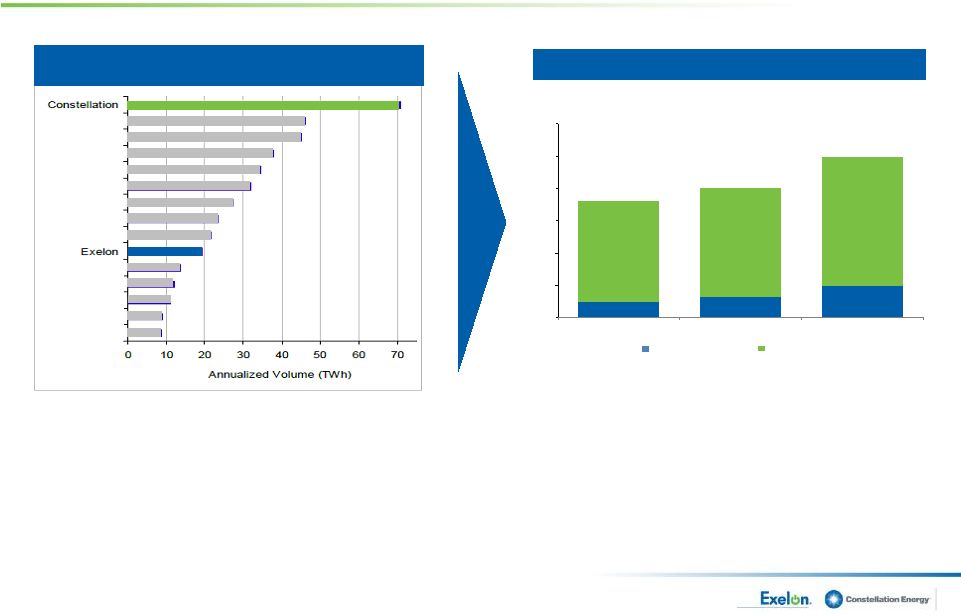 (1) Source: KEMA report as of February 2011. A Leader in the U.S. Commercial and Industrial Retailer Landscape Opportunities for Continued Growth • Increased customer shopping creates opportunities for capturing market share • Vehicle to offer value-added products and innovative customer solutions • Constellation remains the top supplier in the C&I market • Exelon Energy has become a top 10 supplier in the C&I market Top 15 Non-Residential Retailers based on Estimated Annualized Sales (TWh) (1) 25 0 20 40 60 80 100 120 2009 2010 2011E Exelon Constellation Electric Volumes MWh-Millions |
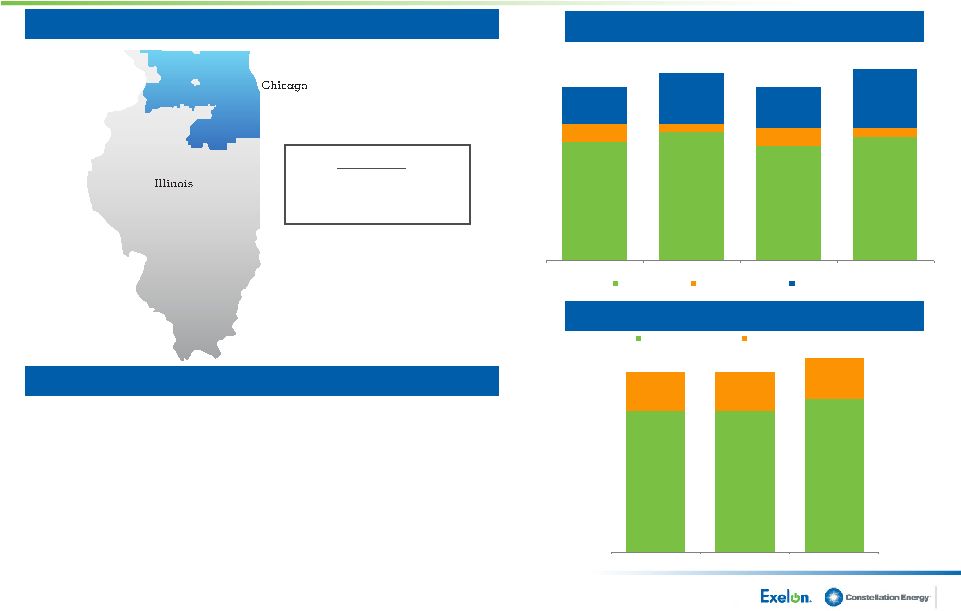 7.3 2.0 6.7 6.7 1.9 1.9 Distribution Transmission (1) Data as of 12/31/10. Peak load represents all-time peak load, which occurred on August 3, 2006. (2) ComEd does not plan to move forward with these Smart Grid/Meter investments unless appropriate cost recovery mechanisms are in place. (3) Includes transmission growth projects. (4) Rate base as of end of year. Commonwealth Edison Company 2009 2010 2011E $8.6 $8.6 $9.3 $950 $1,025 $950 $1,050 Service Territory Capital Expenditure Plan (in $M) Regulatory Update (2) (3) Key Data (1) Total # of Customers: 3.8M Area: 11,300 square miles Peak Load: 23,613 MW 26 Distribution Rate Case • ALJ Proposed Order of $152M vs. ComEd request of $343M • Final ICC decision expected by 5/31/11 • IL House Bill 14 (Formula Rate legislation) under review Transmission Rate Case • Rate adjustments filed annually with FERC under formula rate • Next scheduled rate adjustment in June 2011 Rate Base Growth (4) (in $B) 2011E 2012E 2013E 2010 650 625 675 700 100 100 50 50 325 225 275 200 Base CapEx Smart Grid/Meter New Business |
 475 325 50 50 50 75 375 325 50 25 75 50 Base CapEx Smart Grid/Meter New Business Rate Base Growth (4) (in $B) PECO Energy Company 2009 2010 2011E $550 $450 $425 $500 $5.6 $4.9 $5.0 Service Territory Capital Expenditure Plan (in $M) (1) Data as of 12/31/10. Peak load represents all-time peak load, which occurred on August 3, 2006. (2) Rate base as of end of year. Key Data (1) Total # of Customers: 1.6M (Electric); 0.5M (Gas) Area: 2,100 square miles Peak Load: 8,932 MW 27 2011E 2012E 2013E 2010 Regulatory Update Electric Distribution Rate Case • Rate case filed on 3/31/10 – Original request of $316M; ROE request of 11.75% – Final revenue increase of $225M per Dec. 2010 settlement Gas Delivery Rate Case • Rate case filed on 3/31/10 – Original request of $44M; ROE request of 11.75% – Final revenue increase of $20M per Dec. 2010 settlement 3.0 3.2 3.3 1.1 1.1 1.1 0.6 0.6 0.6 0.9 Electric Distribution Electric Transmission CTC Gas |
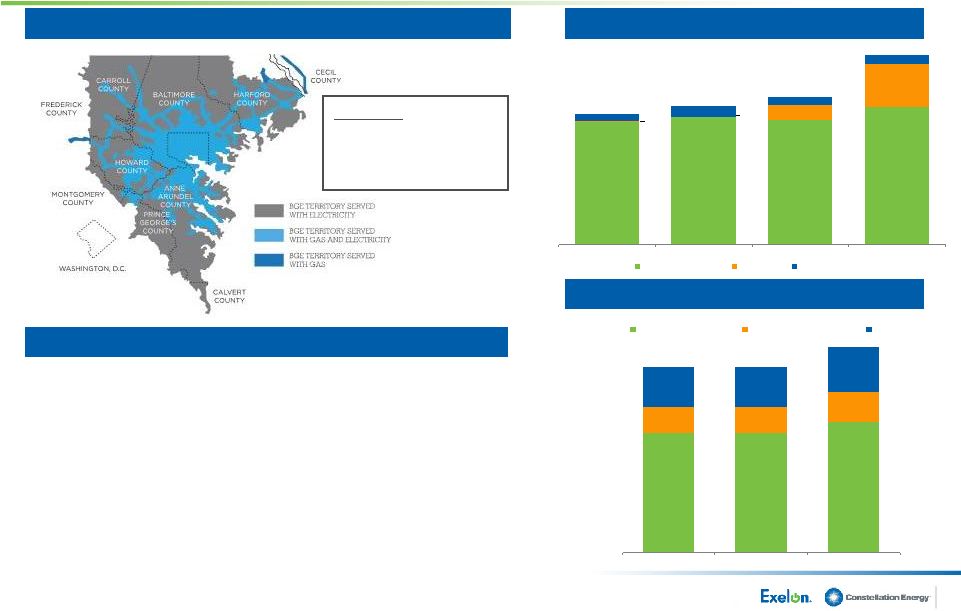 2.4 2.4 2.6 0.5 0.5 0.6 0.8 0.8 0.9 Electric Distribution Electric Transmission Gas 570 562 584 628 196 2 4 70 47 35 39 44 Base CapEx AMI New Business BGE Service Territory Capital Expenditure Plan (in $M) $601 $633 $678 $868 2010 2011E 2009 $3.7 $3.8 $3.9 Key Data (1) Total # of Customers: 1.2M (Electric); 0.7M (Gas) Area: 2,300 square miles Peak Load: 7,198 MW (1) Data as of 12/31/10. Peak load represents all-time peak load, which occurred on August 3, 2006. (2) Amounts shown net of DOE grant dollars. (3) Rate base as of end of year. 28 2011E 2012E 2013E 2010 Regulatory Update Electric Distribution Rate Case • Rate case filed on 5/7/10 – Original request of $47M; ROE range request of 10.65% to 12.65% – Final revenue increase of $31M with an ROE of 9.86% Gas Delivery Rate Case • Rate case filed on 5/7/10 – Original request of $30M; ROE range request of 10.65% to 12.65% – Final revenue increase of $10M with an ROE of 9.56% Rate Base Growth (3) (in $B) (2) |